How Innovative are UK Firms? Evidence from the Fourth UK Community Innovation Survey on Synergies...
20
How Innovative are UK Firms? Evidence from the Fourth UK Community Innovation Survey on Synergies between Technological and Organizational Innovations Giuliana Battisti 1 and Paul Stoneman 2 1 Nottingham University Business School, Nottingham NG8 1BB, UK, and 2 Warwick Business School, Coventry CV4 7AL, UK Corresponding author email: [email protected] Using data from the Fourth UK Community Innovation Survey this paper explores the diffusion of a range of innovative activities (encompassing process, product, machinery, marketing, organization, management and strategic innovations) across 16,383 British companies in 2004. Building upon a simple theoretical model it is shown that the use of each innovation is correlated with the use of all other innovations. It is shown that the range of innovations can be summarized by two multi-innovation factors, labelled here ‘organizational’ and ‘technological’, that are complements but not substitutes for each other. Three clusters of firms are identified where intensity of use of the two sets of innovations is below average (56.9% of the sample); intermediate but above average (23.7%); and highly above average (19.4%). Distinctive characteristics are found to be common to the companies in each cluster. Finally, it is shown that innovativeness tends to persist over time. Introduction Although much past research has focused on the productivity gap that exists at the macro level between the UK and its major international competitors, including Germany, France and especially the USA (O’Mahony and De Boer, 2002), it is clear that a productivity gap of some substantial size also exists at the sectoral level within the UK and even between firms in given sectors. It is to this latter, micro, literature that this paper contributes and to which an increasing interest is now being paid. Within the research on productivity there has always been an emphasis upon the role played by technological innovations. More recently re- search has increasingly emphasized that differ- ences at the firm level may also be a function of how companies are managed. This is in line with Porter and Ketels (2003) who, in their review of the state of UK competitiveness, suggest that one explanation for productivity gaps is the use and the effectiveness of modern management prac- tices in UK firms. Authors such as Berman, Bound and Griliches (1994), Berman, Bound and Machin (1997), Bloom and Van Reenen (2007), Cappelli and Neumark (2001), Edwards, Battisti and Neely (2004) and Wengel et al. (2000) have We are grateful to Amid Mourani for his assistance with some of the statistical material, and to the Department of Trade and Industry (now the Department for Business, Enterprise and Regulatory Reform, BERR) for access to the data and for funding within its study theme of Innovation in Organizational Structures and Management. We also thank EP5RC-AIM, two referees and the editors of this journal for comments on an earlier draft. All errors that remain, however, are the responsibilities of the authors alone. British Journal of Management, Vol. 21, 187–206 (2010) DOI: 10.1111/j.1467-8551.2009.00629.x r 2009 British Academy of Management. Published by Blackwell Publishing Ltd, 9600 Garsington Road, Oxford OX4 2DQ, UK and 350 Main Street, Malden, MA, 02148, USA.
-
Upload
independent -
Category
Documents
-
view
0 -
download
0
Transcript of How Innovative are UK Firms? Evidence from the Fourth UK Community Innovation Survey on Synergies...

How Innovative are UK Firms? Evidencefrom the Fourth UK Community InnovationSurvey on Synergies between Technological
and Organizational Innovations
Giuliana Battisti1 and Paul Stoneman21Nottingham University Business School, Nottingham NG8 1BB, UK, and 2Warwick Business School,
Coventry CV4 7AL, UKCorresponding author email: [email protected]
Using data from the Fourth UK Community Innovation Survey this paper explores thediffusion of a range of innovative activities (encompassing process, product, machinery,
marketing, organization, management and strategic innovations) across 16,383 British
companies in 2004. Building upon a simple theoretical model it is shown that the use of
each innovation is correlated with the use of all other innovations. It is shown that therange of innovations can be summarized by two multi-innovation factors, labelled here
‘organizational’ and ‘technological’, that are complements but not substitutes for each
other. Three clusters of firms are identified where intensity of use of the two sets ofinnovations is below average (56.9% of the sample); intermediate but above average
(23.7%); and highly above average (19.4%). Distinctive characteristics are found to be
common to the companies in each cluster. Finally, it is shown that innovativeness tends
to persist over time.
Introduction
Although much past research has focused on theproductivity gap that exists at the macro levelbetween the UK and its major internationalcompetitors, including Germany, France andespecially the USA (O’Mahony and De Boer,2002), it is clear that a productivity gap of somesubstantial size also exists at the sectoral level
within the UK and even between firms in givensectors. It is to this latter, micro, literature thatthis paper contributes and to which an increasinginterest is now being paid.Within the research on productivity there has
always been an emphasis upon the role played bytechnological innovations. More recently re-search has increasingly emphasized that differ-ences at the firm level may also be a function ofhow companies are managed. This is in line withPorter and Ketels (2003) who, in their review ofthe state of UK competitiveness, suggest that oneexplanation for productivity gaps is the use andthe effectiveness of modern management prac-tices in UK firms. Authors such as Berman,Bound and Griliches (1994), Berman, Bound andMachin (1997), Bloom and Van Reenen (2007),Cappelli and Neumark (2001), Edwards, Battistiand Neely (2004) and Wengel et al. (2000) have
We are grateful to Amid Mourani for his assistance withsome of the statistical material, and to the Departmentof Trade and Industry (now the Department forBusiness, Enterprise and Regulatory Reform, BERR)for access to the data and for funding within its studytheme of Innovation in Organizational Structures andManagement. We also thank EP5RC-AIM, two refereesand the editors of this journal for comments on anearlier draft. All errors that remain, however, are theresponsibilities of the authors alone.
British Journal of Management, Vol. 21, 187–206 (2010)DOI: 10.1111/j.1467-8551.2009.00629.x
r 2009 British Academy of Management. Published by Blackwell Publishing Ltd, 9600 Garsington Road, OxfordOX4 2DQ, UK and 350 Main Street, Malden, MA, 02148, USA.
also explored the role of new work and manage-ment practices in the performance of the firm.They have then argued that the simple adoptionof technological innovations alone is not suffi-cient to gain competitiveness; the full benefit ofthose technologies is only achieved if they areaccompanied by a cluster of related innovationsin production, organization, customer and sup-plier relationships and new product design. Thisis equivalent to stating that there are positivesynergistic gains to be realized from simultaneousinnovation on several fronts. Consequently, anystudy of the impact of the adoption and use of aninnovative practice should not be carried out inisolation from the adoption of other suchpractices, as this would neglect the potential forsynergies and extra gains derived from jointadoption of complementary innovations (seeRuigrok et al., 1999, or Whittington et al., 1999).An extensive literature has explored the diffu-
sion of technological and managerial innovationsin isolation. Most of this literature has alsoconcentrated on one innovation at a time.Robust empirical evidence on the existence ofcomplementarity across innovations is still quitescarce. As a result, our knowledge of thecombined use of, and synergies among, the rangeof strategic, organizational or managerial inno-vations is limited, let alone the relation of suchinnovations to the more traditionally consideredtechnological innovative activity.At least partly, the lack of prior research in this
field is due to poor data availability. Innovationthat has not involved changes in processes andproducts has traditionally merited little effort indata collection. In addition, the occasional ad hocsurveys that have been undertaken rarely incor-porated information on a full spectrum ofmanagement as well as technological innova-tions. In this paper, we overcome such limitationsby using the individual firm level returns data1
from the Fourth UK Community InnovationSurvey (CIS4)2 which provides information onthe use of a wide range of innovative activities
carried out by 16,383 British companies between2002 and 2004. This data set is quite unique inthat it contains information on strategic, manage-ment, organizational and marketing innovationsas well as on innovations of a more traditionaltechnological nature (such as new machinery,new processes and new products). We use thisinformation to explore the simultaneous use of awide set of innovations in an attempt to (i) mapout the patterns of use across firms; (ii) explorethe determinants of these patterns; (iii) isolate thesynergies; and (iv) explore the impacts of jointadoption on firm performance.The theoretical framework employed here is a
simple, decision theoretic, innovation adoptionmodel, based upon profitability considerations,which we extend to allow for synergistic gainsderived from the joint adoption of complemen-tary (or potentially substitute) innovations. Themodel conceptually belongs to a class of equili-brium models used in the literature on theeconomics of technological diffusion (see Stone-man, 2002, for a review). The resulting model isessentially distribution free, in line with the workof Perrow (1967) and Leseure et al. (2004), doesnot superimpose certain combinations of innova-tions as desirable so that ‘one fits all’, and doesnot assume that the optimal level of adoption isuniversally 100%. Rather, driven by profitabilityconsiderations, it allows that what is optimal forthe firm is firm specific and, as conditions internaland external to the firm change, so does profit-ability and the desired level and combination ofthe use of the innovations.When we apply this interpretative framework
to our data, we find that significant complemen-tarities arise from the joint use of the differentinnovations. These complementarities are re-flected in the identification of two main sets ofinnovative factors that we name ‘organizational’innovation and ‘technological’ innovation. Theformer encompasses innovation involving newmanagement practices, new organization, newmarketing concepts and new corporate strategies.The latter encompasses technological innovationsuch as the traditionally measured process andproduct innovations.Further to the mapping out of the patterns
of use across firms and to isolate the synergisticeffect, we are able to identify three clustersof adopting firms which we classify as inten-sive, medium and low users. We explore the
1For the provision of which we would like to thank theDepartment of Trade and Industry (DTI), recentlyrelabelled the Department for Business Enterprise andRegulatory Reform (BERR).2There is some confusion over nomenclature, in thatBERR now label the UK CIS4 as the 2006 UKInnovation Survey.
188 G. Battisti and P. Stoneman
r 2009 British Academy of Management.

characteristics of firms in each cluster and theimpact of their adoption decision upon theirperformance. We believe that in this way thisstudy makes a valuable contribution to theunderstanding of the complexity of the innova-tion path of UK firms and their performance.The paper is structured as follows. The next
section introduces the data set, the key variablesof interest and some initial indicators of newtechnology usage. The following sections providethe theoretical model and explore revealedsynergistic gains in the data. Then principalcomponents analysis is used to identify keyfactors, and the clustering of the use of thesefactors across the sample and the impact of firmcharacteristics on usage are explored. The impactof innovative activities upon firm performance isexamined, and persistence in innovation isinvestigated. A final section concludes.
The CIS4 data set and measures ofinnovative activity
The Community Innovation Survey (CIS) is apan-European survey carried out every fouryears3 by each EU member state and is designedto gather information on the extent of innovationin European firms across a range of industriesand business enterprises. CIS4 is the fourth roundof data collection, was carried out in 2005 andrelates to innovative activities carried out in thethree-year period from 2002 to 2004. In the UKthis survey was administered by the Office ofNational Statistics on behalf of the Departmentof Trade and Industry (DTI). The survey wasaddressed to enterprises (which we here call firms,although this is misleading for multiplant firms)with more than ten employees, in both manu-facturing and service industries, with responsebeing voluntary. We have been given privilegedaccess by the DTI to the individual returnsalthough we are unable to identify respondents.From an original sample of 170,735 companies
the questionnaire was sent to a stratified (byindustry, firm size and geographical region)
sample of 28,000 enterprises and 16,383 responses(about 50% response rate) were eventuallyregistered, which represent the sample for thework reported here.4 The salient point for ourpurpose is that the data set contains informationon a wide range of innovative activities carriedout by firms. In particular it contains informationon whether, between 2002 and 2004, the samplecompanies had introduced new product innova-tions (PRODINOV); new process innovations(PROCINOV); and any technological innovationsuch as new machinery, equipment and computerhardware or software to produce new or sig-nificantly improved goods, services, productionprocesses or delivery methods (MACHINE).Further to these traditional indicators of inno-vative activities, responses to CIS4 question 23contains information on whether the enterpriseshave made major changes in the areas of businessstructure and practices during the three-yearperiod 2002–2004 concerning the implementationof new or significantly changed corporate strat-egy (STRATEGY); implementation of advancedmanagement techniques (MANAGEMENT);implementation of major changes to the organi-zation structure (ORGANIZATION); and imple-mentation of changed marketing concepts orstrategies (MARKETING).Out of the 16,383 enterprises who responded to
the CIS4 questionnaire, about 20% have adoptedat least one of the innovations, the exceptionbeing MACHINE, which has been adopted byabout half of the sample. Table 1 reports thevariable definitions and the percentage of adopt-ing firms in the sample.In Table 2, using the CIS4 data summarized in
Table 1, we explore the extent to which firmsintroduced multiple innovations. We reportKendall’s tau-b correlation coefficient (a non-parametric measure of association based on thenumber of concordances and discordances inpaired observations) for the seven innovationvariables listed above in order to indicate theextent to which the sample firms between 2002and 2004 undertook simultaneous innovationpractices. For all the variables the pairwise degree
3In the UK another Innovation Survey (labelled the2007 UK Innovation Survey) with results expected mid-2008 has now been carried out, only two years after theCIS4 exercise, so the four-year timing is not adhered tostrictly.
4Further details on the UK CIS4 including the question-naire, the data collection process, sampling, the extraordi-narily high response rate etc. can be found elsewhere (seehttp://www.berr.gov.uk/innovation/innovation-statistics/cis/cis4-sample/page11777.html).
How Innovative are UK Firms? 189
r 2009 British Academy of Management.

of association is significantly different from zero,showing that adopting one innovative practice ortechnology is not independent of adoptinganother innovative practice or technology andthat the adoption of all practices is correlatedwith the adoption of all others. However, thedegree of association differs in intensity andvaries from innovation to innovation.
Theoretical groundings
The existence of significantly positive pairwisecorrelations between the adoption of differentinnovative practices is not necessarily proof ofcomplementarities and/or synergies. The correla-tions may in fact be the result of other back-ground factors. In this section we thereforeapproach the issue theoretically in order toprovide some grounding for our analysis. The
theory in this section is largely built uponapproaches standard in the economic analysis oftechnological diffusion (see Stoneman, 2002, for areview) that for the purpose of this study we extendto the diffusion of non-technological innovations(see, in addition, Battisti and Iona, 2007).Assume an industry (or sector) with N hetero-
geneous profit-maximizing firms, i5 1, . . . , N,each of which initially can adopt a new practiceor technology y in time t with the expectedpresent value of the gross profit gain fromadoption of innovation y being pit(y). Assumethat pit(y) is distributed across the N firmsaccording to F(pit(y)), the distribution beinginvariant with respect to time and the extent ofuse of the innovation (an assumption made forsimplicity but which could at the cost of greatercomplexity be relaxed).The cost to firm i of acquiring the innovation
in time t, cit(y), is assumed to have a component
Table 1. Definition of innovation variables and sample adoption (%)
Innovation
variable label
Definition Adopting
firms
PROCINOV Whether a product innovation (new to the enterprise or to the market or a significantly
improved good or service) has been introduced on the market between 2002 and 2004 (see
Q7–Q8)
20%
PRODINOV Whether a process innovation (new to the enterprise or to the market that significantly
improved methods for the production or supply of goods and services) has been introduced
between 2002 and 2004 (see Q11)
29%
MACHINE Whether advanced machinery, equipment and computer hardware or software to produce
new or significantly improved goods, services, production processes or delivery methods has
been acquired between 2002 and 2004 (see Q13)
47%
STRATEGY Whether a new or significantly changed corporate strategy has been implemented between
2002 and 2004 (see Q23.10)
19.9%
MANAGEMENT Whether advanced management techniques, e.g. knowledge management systems, Investors
in People etc., have been implemented between 2002 and 2004 (see Q23.20)
17.6%
ORGANIZATION Whether major changes to the organizational structure, e.g. introduction of cross-functional
teams, outsourcing of major business functions, have been implemented between 2002 and
2004 (see Q23.30)
22.6%
MARKETING Whether changes in marketing concepts or strategies, e.g. packaging or presentational
changes to a product to target new markets, new support services to open up new markets
etc., have been implemented between 2002 and 2004 (see Q23.40)
23%
Table 2. Correlation matrix Kendall’s tau_b correlation coefficient (N5 15657)
PRODINOV PROCINOV MACHINE STRATEGY MANAGE-
MENT
ORGANI-
ZATION
MARKET-
ING
PRODINOV 1.000
PROCINOV 0.429 1.000
MACHINE 0.319 0.360 1.000
STRATEGY 0.275 0.253 0.198 1.000
MANAGEMENT 0.214 0.238 0.220 0.407 1.000
ORGANIZATION 0.275 0.255 0.204 0.543 0.412 1.000
MARKETING 0.338 0.293 0.252 0.448 0.381 0.445 1.000
190 G. Battisti and P. Stoneman
r 2009 British Academy of Management.

common to all firms, ct(y), reflecting, say, thecharge for buying equipment, plus a firm-specificcomponent, eit, reflecting perhaps installationcosts, such that cit(y)5 ct(y)1eit(y).Assume also that firms are myopic in their
expectations formation processes and expectpit(y) and cit(y) to remain constant over time.Under such assumptions the profitability andarbitrage conditions for the adoption of aninnovation coincide. This assumption removesexpectations effects from the model but thesecould be included and have been in the literature(Ireland and Stoneman, 1986). Firm i will then beexpected to adopt innovation y at the first date atwhich pit(y)� cit(y) � 0. More formally, define adummy variable Dit(y) as equal to 1 if firm i hasadopted (only) innovation y in time t and zerootherwise; then Dit(y)5 1 if pit(y) � cit(y).The net gain from adoption, pit(y)� cit(y), may
increase over time due to either pit(y) increasingor cit(y) decreasing. The latter for example mayhappen if there are reductions in acquisition/adoption costs; the former may happen if, forexample, there are quality improvements ininnovations over time or externalities derivedfrom use by other companies. However, at apoint in time, as ct(y) is the same for all firms, thecross-section usage pattern5 will only reflectdifferences across firms in pit(y) and eit(y). Thusfor example, at time t, firms for whom pit(y) islarge will be more likely to introduce theinnovation than firms for whom pit(y) is small.This is particularly relevant as we only havecross-section and not time series data.Recent theoretical and empirical research has
increasingly recognized that to look at theadoption of stand-alone innovations may bemisleading since firms often tend to adoptclusters of innovations rather than individualpractices and innovations in isolation. Thesupposition is that joint adoption of complemen-tary innovations can significantly improve pro-ductivity, increase quality and often result inbetter corporate financial performance relative toisolated instances of innovation. Milgrom andRoberts (1990, 1995), indeed, explicitly claim thatbundling more innovative practices together is
not an accident. Rather, it is the result of theadoption by profit-maximizing firms of a coher-ent strategy that exploits complementarities.Similarly, Battisti, Colombo and Rabbiosi(2005), within a causality framework, find theexistence of extra profit gains from the jointrather than individual adoption of different workpractices. Complementary innovations are essen-tially innovations where the overall net gain fromjoint adoption is higher than the sum of the netgains from individual adoption (see for exampleBattisti and Iona (2007), Ichniowski, Shaw andPrennushi (1997) and Whittington et al. (1999)for examples of super-additivity and clusters ofinnovations, or the formalized models of Battisti,Colombo and Rabbiosi (2005) or Stoneman(2004) for substitute and complementary tech-nologies etc.).To consider such complementarities, assume
that there is a second innovation k that isavailable at the same time as technology y.6 Thisinnovation k may be adopted in time t by firm i ata cost cit(k), made up, as for y, by a general and afirm-specific effect such that cit(k)5 ct(k)1eit(k).If innovation k alone is adopted by firm i in time tthen the gross payoff is pit(k). If both innovationsy and k are introduced the payoff pit(y and k) isassumed to be pit(y)1pit(k)1myk, where mykreflects synergies between the two innovations.The firm has four possible strategies:
1. Adopt neither innovation in which case the netprofit gain is zero.
2. Adopt only innovation y with a gross presentvalue payoff of pit(y).
3. Adopt only innovation k with a gross presentvalue payoff of pit(k).
4. Adopt both innovations y and k with a grosspresent value payoff pit(y and k).
Of particular interest here is what will encou-rage firms to adopt several innovations jointlyrather than just single innovations, i.e. to pursuestrategy 4 as opposed to strategies 2 or 3 (or even 1).A profit-maximizing firm will adopt both innova-tions if joint adoption is profitable and if the netbenefit from adopting an extra innovation having
5In such a case the number of users of the technology y,M(t) at time t, will be given by M(t)5N{1�F[ct(y)1eit]}and will be related to the distribution of returns across theN firms, the firm-specific costs and the cost of acquisition.
6Once again the cross-sectional nature of our datamakes it unnecessary to ask what would happen if j andk became available at different times for our data do notreveal intertemporal differences between firms in thepattern of adoption.
How Innovative are UK Firms? 191
r 2009 British Academy of Management.

already adopted the other is positive. Thusjoint adoption will result if (i) it is profitable toown both innovations, i.e. pit(y)1pit(k)� cit(y)� cit(k)1myk � 0; (ii) having got innovations y itis profitable to also install k, i.e. pit(k)� cit(k)1myk � 0; and (iii) having got k it is profitable to alsoinstall y, i.e. pit(y)� cit(y)1myk � 0. Ceteris paribus,the greater is myk the greater is the chance of theseconditions being met and thus the probability ofjoint adoption increases with myk.One may interpret myk as reflecting the syner-
gies between the two innovations, and in parti-cular if the innovations are complements thenmyk � 0 and if they are substitutes then myk � 0. Ifthey are not connected then myk 5 0. The more itis the case that the payoff to one innovation isgreater when the other innovation is in use, themore one would expect both innovations to beused together (although the conditions show thatthe innovations do not have to be complementsto be jointly in use, as long as they are not toostrict substitutes).Defining the dummy variable Dit(k) in line with
Dit(y) as reflecting use of innovation k, and forsimplicity assuming that myk is not firm specific,we may now extend the above single innovationconditions for the use of an innovation to statethat firm i will be using innovation y in time t ifpit(y)1Dit(k)myk � cit(y) and be using innovationk in time t if pit(k)1Dit(y)myk � cit(k). If mjk ispositive then these conditions imply that com-plementary effects will increase the likelihood ofadoption of the second innovation.Individual innovative activities can be defined
to be complementary (exhibiting synergies) if theadoption of one raises the marginal payoff ofothers (see also Battisti and Iona, 2007; Battisti,Colombo and Rabbiosi, 2005; Ruigrok et al.,1999; Whittington et al., 1999). In this context,Arora and Gambardella (1990) and Arora (1996),following the revealed preference approach, showthat this is equivalent to saying that the second-order cross-derivative of the expected gainbetween innovation y and innovation k (myk asmodelled above) is positive. Such marginal payoffeffects will be shown when, in the econometricmodelling of the probability of adopting by firmsof any one innovation, the conditional covariancebetween the adoption of any two innovations yand k is positive, after controlling for the impactof a number of firm and environmental char-acteristics which might act as potential lurking
factors.7 In the next section we undertake such anexercise to isolate patterns of complementaritiesand synergies across the seven identified innova-tions in the database.The theory above suggests that the cross-
section pattern of usage at a moment in time willreflect (i) the stand-alone payoffs to individualfirms from adoption, which in turn will dependupon the firm-specific cost eit for the innovation;(ii) the stand-alone firm-specific gross profits tobe earned from the innovation pit; and (iii) anysynergies available from joint adoption (mky).The greater the synergies the more one mightexpect adoption of multiple rather than singleinnovations.
Complementarities in innovativeactivities
Having shown above that the CIS4 data revealsignificant pairwise correlations in the use of newtechnologies and practices, we now explorewhether, on the basis of the theory detailedearlier and the CIS data, we are able to make anyempirical inferences on synergies (by seeing, assuggested, whether the conditional covariancebetween the adoption of any two innovations ispositive in the econometric modelling of theprobability of adopting by firms of any oneinnovation).The key to operationalizing the model to explore
usage of innovative activities is in specifying thedeterminants of the differing returns to the use ofinnovative activities pit(.) and also the different firm-specific cost effects eit(.), i.e. the different net gains.The rationale behind our approach is that firms aredifferent and as a result get different returns fromthe use of innovations. These returns reflect differ-ent gross profit gains and different firm-specificcosts. As one cannot necessarily separate cost andrevenue effects we will discuss below just differentreturns without being specific as to whether theseresult from the cost or revenue side. We define thedeterminants of the different returns as a vector offirm-specific and environmental factors yi. It is
7A lurking factor is a factor highly correlated with eachinnovation so that an increase (decrease) in its levelincreases (decreases) the adoption of each of the twoinnovations without the two innovations being neces-sarily complementary.
192 G. Battisti and P. Stoneman
r 2009 British Academy of Management.

assumed that the characteristics that determine thedifferences in returns are not themselves affected bythe firm’s own innovation adoption.There is an extensive theoretical and empirical
literature that looks at what the relevant char-acteristics might be (see Geroski, 2000). The firmand environmental characteristics that we haveincluded have been dictated partly by theeconomic analysis of technology diffusion andpartly by data availability. They are listed belowand summarized in Table 3 (as we are hereprimarily interested in analysing cross-sectionaldata and thus differences across firms at a pointin time, from this point on we drop the t subscriptand, where not necessary, also the i subscript).
(i) Firm size (SIZE) measured by the number ofemployees. Size may pick up a number ofother firm characteristics such as efficiency,management abilities (see Astebro, 1995) andperhaps past innovations and may also reflectany scale economies that there might be in theuse of innovations. It may also pick upwhether the unit cost of innovation varieswith firm size. Firm size has a long history asa deterministic factor in diffusion studies (seefor example Astebro, 2002; Colombo andMosconi, 1995; Hannah and McDowell, 1984;Karshenas and Stoneman, 1993; Mansfield,1968; Saloner and Shephard, 1995), it gen-
erally being found that size of the establish-ment exerts a significant and positive impactupon innovation adoption.
(ii) R&D intensity (R&D), which takes the valueone if the firm reports R&D activity in theperiod 2002–2004 and zero otherwise. Thisvariable reflects the Schumpeterian hypoth-esis that formalized R&D exerts a positiveimpact upon the use of innovations, in linewith Cohen and Levinthal (1989).
(iii) The covariates SCdegree and OTHdegreemeasuring the percentage of employees witha degree in science or other degrees in 2004.The importance of skills has been empha-sized by, for example, the pioneer work ofFinegold and Soskice (1988) who firstdefined the concept of low skills/low qualityequilibrium or more specifically by the workon links between innovation and skills byBartel and Lichtenberg (1987), Bresnahan,Brynjolfsson and Hitt (2002), Caroli andVan Reenen (2001) etc.8
(iv) Whether the firm was established after 2000(AGE). The age of the establishment isincluded according to the view that olderplants generally have more experience thatallows them to assess costs and benefits ofany changes better than younger plants (seefor example Noteboom, 1993). Nevertheless,older plants might also be less flexible inintroducing innovations due to the natureand complexity of their organizationalstructure (see Battisti, Colombo and Rab-biosi, 2005; Little and Triest, 1996) or theresistance of employees to the introductionof innovations (see Ichniowski and Shaw,1995). In the CIS4 questionnaire there is aquestion on whether the company wasestablished after 1 January 2000. We use itas a proxy for young and old establishments.
(v) Three other dummy variables that have beenlinked to early adoption of innovations inprevious literature (see Battisti, Canepa andStoneman, 2009; Stoneman and Battisti,2008) capture whether the firm belongs to agroup (GROUP), whether the market for itsfinal product is international (INTERNAT)
Table 3. Control variables, conditional adoption probabilities
Label Definition
SIZE Number of employees
GROUP Whether part of a group (1) or independent
establishment (0)
INTERNAT Whether the market is international (15 yes;
05no)
AGE Whether established after 2000 (15 yes;
05no)
R&D Whether the enterprise engages in R&D
activities (15 yes; 05no)
SCdegree Percentage of the enterprise’s employees
educated to degree level or above in science
and engineering subjects
OTHdegree Percentage of the enterprise’s employees
educated to degree level or above in other
subjects
SUPPORTPU Whether received any public financial support
(15 yes; 05 no)
SICj Industry to which the establishment belongs:
j5 1 to 14, wide SIC 92 classification, dummy
variables
8We also experimented with other firm-specific variablespresent in the data set such as a dummy reflecting exportactivity and therefore competitive pressures but thisconsiderably reduced the sample size.
How Innovative are UK Firms? 193
r 2009 British Academy of Management.

and whether the company received any publicfinancial support (SUPPORTPU).
(vi) We also include a series of 12 industry dummyvariables to reflect different industry (widersubgroup) conditions, markets, and types ofinnovations and payoffs to firms in differentindustries. The industrial classification followsSIC 92 as defined in the Appendix.
To econometrically model the probability ofadoption by firms of single innovations weundertook seven probit model estimations, onefor each innovation, that relate adoption/non-adoption of the innovation by the firm to the firmcharacteristics in the vector yi. The estimatesyield the results presented in Table 4.The coefficient estimates are largely in line
with our prior expectations as far as sign andsignificance are concerned (but these are not ourmain interest). The main interest is in the resultson the significance and signs of the off-diagonalelements of the covariance matrix of thestandardized residuals of the probit specifica-tions (R_j, where j5 process, product, machin-ery, marketing, organization, management andstrategic innovations), and these are reported inTable 5. The degree of association, i.e. the extentof the complementarity effect myk, is significant
and positive for all pairwise comparisonsalthough it varies and differs in intensity frompair to pair of innovations (e.g. managementand strategy illustrate greater synergy thanproduct and strategy). This suggests that thereexist important synergies generated by jointadoption although some innovations are moreinfluential and versatile than others. The im-plication is that to concentrate on the analysis ofthe adoption of single innovations in isolationwould be misleading, and it is far preferable toconsider the joint adoption of complementaryinnovations.
The intensity and clustering ofinnovative activity
Thus far we have proceeded by analysing theseven different technologies as separate, butinvolving synergies. This is a cumbersome proce-dure and there are considerable analytical ad-vantages if the number of innovation variables tobe analysed can be reduced. Principal componentsanalysis is a commonly used tool for dimension-ality reduction in data sets while retaining thosecharacteristics of the data set that contribute mostto its variance by keeping lower-order principal
Table 4. Control factors and the probability of adoption, probit estimates
PROCINOV
coeff.
PRODINOV
coeff.
MACHINE
coeff.
STRATEGY
coeff.
MANAGE-
MENT coeff.
ORGANIZA-
TION coeff.
MARKET-
ING coeff.
ONE � 1.274 � 0.972 � 0.630 � 1.329 � 1.271 � 1.311 � 1.244
GROUP 0.208 0.236 0.042* 0.370 0.300 0.491 0.282
INTERNAT � 0.027 0.005 0.148 0.060 0.019 0.060 0.178
AGE2000 � 0.001 0.073 � 0.019 0.213 � 0.040 0.086 0.065
R&D 0.807 1.135 0.953 0.604 0.568 0.624 0.813
SCdegree 0.001 0.001 � 0.001 0.001 0.000 0.001 0.001
OTHdegree 0.001 0.002 0.001* 0.002 0.001 0.002 0.002
SUPPORTPU 0.522 0.616 0.396 0.387 0.384 0.310 0.404
EMPLOY. 0.000 0.000 0.000 0.000 0.000 0.000 0.000
D1 � 0.084 � 0.773 0.020 � 0.042 � 0.150 � 0.102 � 0.465
D2 0.170 � 0.110 0.323 � 0.151 � 0.235 � 0.133 � 0.122
D3 0.077 � 0.054 0.228 � 0.160 � 0.153 � 0.092 � 0.321
D4 0.060 0.192 0.154 � 0.085 � 0.219 0.064 � 0.227
D5 0.056 � 0.016 0.224 � 0.071 � 0.088 0.098 � 0.453
D6 0.010 � 0.017 0.227 � 0.185 � 0.284 � 0.126 � 0.234
D8 � 0.367 � 0.469 � 0.031 � 0.163 0.082 � 0.105 � 0.323
D10 � 0.272 � 0.417 � 0.231 � 0.272 � 0.328 � 0.317 � 0.276
D11 � 0.406 � 0.523 � 0.287 � 0.355 � 0.178 � 0.337 � 0.355
D12 � 0.078 � 0.186 0.190 � 0.121 � 0.124 � 0.092 � 0.219
D13 0.234 � 0.084 0.156 0.236 0.028 0.261 0.072
D14 0.184 � 0.109 0.013 0.075 0.056 0.122 � 0.087
*Coefficients significant at 5% in bold.
194 G. Battisti and P. Stoneman
r 2009 British Academy of Management.

components and ignoring higher-order ones. Herewe perform iterated principal factor analysis(IPFA) based upon the decomposition of thetetrachoric correlation matrix of the pairwiseadoption decision for the firms in the CIS4sample. This identifies the underlying pattern ofintensity of use of different innovative practices bythe sample of UK firms in 2004. We do not makeany presumptions as to what is the ‘best’combination of innovations (see, for example,Perrow, 1967). We instead let the data inform onthe variability and the intensity of use of thedifferent practices based upon the extent of theirnatural association.IPFA models the correlations amongst the
innovations adopted and linearly transformsthem to obtain a smaller set of variablesuncorrelated with (orthogonal to) each otherand defined so that the first factors are the vectorsof coefficients (loadings) of the linear combina-tion that explains the largest proportion ofvariance. In other terms, IPFA allows one tosummarize the heterogeneity of use of the set ofseven innovations via a reduced number of latentfactors capable of picking up the underlyingpattern of use that can explain the largestproportion of variability of the joint adoptionsand so identify the innovative practices that play
the major roles in the overall innovative activitiesof the firm.In Table 6 we report the tetrachoric correlation
matrix for the use of different innovations. Thehighest correlations are found between processand product innovation and among new strategy,management, organization and marketing prac-tices. The Kaiser–Meyer–Olkin measure of over-all sampling indicates whether the sum of partialcorrelations is large relative to the sum ofcorrelations. Its value of 0.8652, being close to1, indicates that patterns of partial correlationsare relatively compact; thus factor analysisshould yield distinct and reliable factors. TheBartlett measure of sphericity is significantlydifferent from zero at the 1% significance levelindicating that the original correlation matrix isnot an identity matrix and thus that factoranalysis is appropriate for these data.In Table 7 we report the rotated9 factor
loadings and their uniqueness. While the former
Table 5. Non-parametric Kendall’s tau_b correlations of the residualsa
R_Process R_Product R_Machine R_Strategy R_Management R_Organization R_Marketing
R_Process 1.000 0.161 0.131 0.212 0.178 0.192 0.253
R_Product 0.161 1.000 0.297 0.070 0.025 0.106 0.140
R_Machine 0.131 0.297 1.000 0.015* 0.027 0.055 0.070
R_Strategy 0.212 0.070 0.015 1.000 0.377 0.489 0.392
R_Management 0.178 0.025 0.027 0.377 1.000 0.329 0.296
R_Organization 0.192 0.106 0.055 0.489 0.329 1.000 0.422
R_Marketing 0.253 0.140 0.070 0.392 0.296 0.422 1.000
*Correlation is NOT significant at the 0.01 level (p5 0.0067).aListwise N5 15,082.
Table 6. Tetrachoric correlations (obs5 15,657)
PRODINOV PROCINOV MACHINERY STRATEGY MANAGE-
MENT
ORGANIZA-
TION
MARKET-
ING
PRODINOV 1.0000
PROCINOV 0.6643 1.0000
MACHINE 0.5033 0.6116 1.0000
STRATEGY 0.4617 0.4378 0.3497 1.0000
MANAGEMENT 0.3773 0.4212 0.4000 0.6503 1.0000
ORGANIZATION 0.4540 0.4359 0.3500 0.7864 0.6547 1.0000
MARKETING 0.5412 0.4896 0.4266 0.6886 0.6174 0.6792 1.0000
Note: All coefficients are significant at 5%.
9The extraction of principal components amounts to avariance maximizing (varimax) rotation of the originalvariable space. The rotated factor loadings, by stretch-ing the loadings to their extremes (11 or �1), improvethe interpretative capability of the factors, withoutchanging their nature or that of the model.
How Innovative are UK Firms? 195
r 2009 British Academy of Management.

are the coefficients of the linear combination ofthe original variables that decreasingly explainthe largest part of the variability, the lattermeasure the proportion of variance of thevariable that is not accounted for by all thefactors taken together.10 The first factor (Factor 1)accounts for 83.5% (57% if rotated) of the totalvariability in firms’s innovative activity and it isdriven by the extent of use of strategy, manage-ment, organizational and marketing innovations.These are labelled in CIS4 as wider innovations(defined as ‘new or significantly amended formsof organization, business structures or practices,aimed at step changes in internal efficiency ofeffectiveness or in approaching markets andcustomers’) but we prefer the label organizationalinnovations.The second factor (Factor 2) in Table 7
explains 16.5% (43% if rotated) of the remainingvariability in the heterogeneity of use of innova-tive activities by the firms in the sample and it isdriven by product, process and technologicalinnovations, which we generally label technolo-gical innovations. The overall pattern can bebetter seen in Figure 1 which reports the rotatedfactor loadings on the two axes. On the x axis theprincipal factor shows the importance of organi-zational innovations, while on the y axis thesecond factor shows the importance of technolo-gical innovations.For all the variables used in the IPFA analysis
the uniqueness statistic indicates that most of
their heterogeneity of use is largely related to theother extent of use variables. Interestingly,MACHINE is the innovation that has the leastshared variance and is the most adopted (in factabout 47% of the firms in the sample employ thisinnovation). As MACHINE incorporates soft-ware and PCs it may be that informationtechnology has become so widespread that it nolonger yields a competitive advantage to adop-ters. This is consistent with the observation thatMACHINE is the dominating factor load in thethird factor extracted by the IPFA analysis butthe percentage of variance explained is just 6.7%.The IPFA analysis in summary suggests that,
although the innovation literature has beenmainly concerned with ‘traditional’ or technolo-gical innovations, ‘wider’ or organizational in-novations play a predominant role in theinnovative activity of UK firms.Having identified the two factors, in order to
identify the existence of clusters of firms basedupon the intensity of use of the seven innovationswe have carried out a two-step cluster analysisover the projection of the firms standardizedfactor scores (the latter being the summaryinformation on the intensity of use of eachfactor). This has resulted in three clusters beingidentified containing 9317 (cluster 1), 3881(cluster 2) and 3185 (cluster 3) firms/enterprisesrespectively. In Figure 2 we report the calculated95% confidence intervals for the average intensityof use (i.e. the average standardized factor score)of Factor 1 and Factor 2 for each of the threeclusters.From Figure 2 one may observe that cluster 1
firms use organizational innovations at levelsbelow the sample average (the average standar-dized factor score) represented by the straight
Table 7. Rotated factor loadings
Variable Factor 1 Factor 2 Uniqueness
PRODINOV 0.3300 0.6778 0.4316
PROCINOV 0.2477 0.8514 0.2137
MACHINERY 0.2390 0.6439 0.5283
STRATEGY 0.8442 0.2577 0.2209
MANAGEMENT 0.6884 0.2950 0.4391
ORGANIZ 0.8422 0.2539 0.2262
MARKETING 0.6997 0.4044 0.3470
%var 83.5% 16.5%
(57% R) (43% R)
prodinov
procinov
machinery
strategymanagement
organiz
marketing
0.2
0.4
0.6
0.8
Fac
tor
2
0.2 0.4 0.6 0.8Factor 1
Rotation: orthogonal varimaxMethod: iterated principal factors
Factor loadings
Figure 1. Rotated factor loadings
10A very high uniqueness can indicate that a variablemay not belong with any of the factors. Uniqueness is 1– communality where communality reflects the commonvariance in the data structure, i.e. 56.8% of the varianceassociated with PRODINOV is common, or shared,variance.
196 G. Battisti and P. Stoneman
r 2009 British Academy of Management.

horizontal line. The other two clusters are firmsthat use organizational innovations progressivelymore intensively. The same can be said for thedifferences across the clusters in the second factorillustrating the intensity of use of technologicalinnovations (see Figure 2(b)) with usage increas-ing as one moves from cluster 1 through tocluster 3.Table 8 reports the percentage of the firms
within each cluster that have introduced each ofthe seven innovations. As predicted by the factoranalysis the intensity of use of the practices ishighest in cluster 3 where a majority of the firmshave adopted each of the seven innovations.Cluster 1 contains the least ‘innovative’ firms.Within this cluster less than 2% of the firmsreport having carried out organizational innova-tive activities, although about 22% have intro-duced technological innovations. Although notshown, 6% have developed new products butonly 2.3% of those products (against 42% incluster 3) were new to the market rather than justnew to the firm.Interestingly, the extent of technological in-
novation as measured by MACHINE is com-paratively high in each of the three clusters,although its intensity is less than proportional tothe extent of overall firm innovativeness. This
may confirm that technological innovations canmore easily be introduced and assimilated thanorganizational innovations or a product new tothe market, which require flexibility and cognitiveskills that not all firms might possess (see Battisti,Colombo and Rabbiosi, 2005; Black and Lynch,2004; Bresnahan, Brynjolfsson and Hitt, 2002;Brynjolfsson and Hitt, 1994, 2000; Colombo andDelmastro, 2002; etc.).Given that cluster 1 has the largest number of
firms and cluster 3 has the smallest, to the extentthat CIS4 is representative of the UK population,this suggests that about 19.4% of UK firmsoperate well above average in terms of innovativeactivity while 56.9% perform below the average.Interestingly, across the clusters we find that
Factor 1 innovation is positively associated withFactor 2 innovation, suggesting that organiza-tional innovations and technological innovationsdo not represent substitute, alternative or com-peting innovation strategies, but rather arecomplements with positive synergistic effects. Ifthe factors had been substitutes we would expectto have seen some firms using organizationalinnovations intensively but not technologicalinnovations and other firms using technologicalinnovations intensively but not organizationalinnovations. We do not observe such patterns
321
Cluster
–1.00
–0.50
0.00
0.50
1.00
1.50
2.00
StF
1
Reference Line is the Overall Mean = –0.0363
Simultaneous 95% Confidence Intervals for Means
321
Cluster
–1.00
–0.50
0.00
0.50
1.00
1.50
2.00
StF
2
Reference Line is the Overall Mean = –0.0426
Simultaneous 95% Confidence Intervals for Means
Figure 2. Confidence intervals for the mean of Factor 1 (on the left) and Factor 2 (on the right)
Table 8. Within-cluster percentage of firms who report having introduced the innovations
MANAGEMENT STRATEGY ORGANIZATION MARKETING PRODINOV PROCINOV MACHINE
Cluster 1 1.5 1.2 2.0 1.6 6.0 1.3 22.3
Cluster 2 18.7 20.7 25.8 27.8 48.2 32.4 71.5
Cluster 3 59.2 69.0 73.5 74.9 76.1 62.9 84.1
How Innovative are UK Firms? 197
r 2009 British Academy of Management.

and thus may reliably adduce that the organiza-tional and technological innovations are comple-ments.
Innovation and firm characteristics
The theoretical framework we have proposedsuggests that in addition to synergistic effects thatencourage simultaneous use of innovations, thereare many firm-specific and environmental effectsthat can explain differences in the use oftechnologies across firms in a cross-section. Wehave summarized them in the components of thevector yi. Having identified three clusters of firmsin the data, in this section we explore apparentassociations within the data to the elements ofthat vector. We are well aware that in a singlecross-section one cannot imply causality and thatthe methods that we rely upon thus only indicateassociation. Positive associations are necessarybut not sufficient to show that the characteristicsimpact upon use.The first column of Table 9 reports the average
size of the firm in each cluster, measured by thenumber of employees in 2004. The extent of firminnovativeness seems to increase with firmsize, with cluster 1 firms being mostly small
(trimmed mean5 76.84; median5 27), cluster 2being mainly medium sized firms (trimmedmean5 140.93; median5 52) and cluster 3 beingmedium to large firms (trimmed mean5 219.30,median5 81.5). However, the standard devia-tions are very large suggesting that the averagescan be highly misrepresentative. In order tovisualize the within-cluster distribution of firmsize, in Figure 3 we group the firms in each clusterinto three classes: small (10–49 employees),medium (50–249) and large (250 or more). Figure3 shows that cluster size compositions are quiteheterogeneous; the relative importance of largefirms is highest in the third cluster, and themajority of small firms tend to populate the firstcluster.We find that the proportion of establishments
that carry out in-house R&D11 is lowest in cluster1 and highest in cluster 3 reflecting the Schumpe-terian hypothesis that formalized R&D exerts apositive impact upon the use of an innovation.The proportion of employees with a degree inscience and engineering subjects or other subjects
Table 9. Firm characteristics by cluster: descriptive statistics
Size
(employees)
Age (whether
est. after
2000)
R&D Train-
ing
% with
science
degree
% with
other
degree
Part of
a group
Public
financial
support
International
market for
its product
Service
sector
Cluster 1
Mean 168.75* 0.15 0.12 0.21 2.88* 4.93* 0.26 0.04 0.98 0.62
5% trimmed mean 76.84 0.11 0.08 0.18 0.88 2.11 0.24 0 1 0.63
Median 27 0 0 0 0 0 0 0 1 1
SD 756.15 0.36 0.33 0.41 11.03 14.60 0.44 0.19 0.13 0.5
Min 9 0 0 0 0 0 0 0 0 0
Max 32655 1 1 1 100 100 1 1 1 1
Cluster 2
Mean 304.39* 0.14 0.46 0.58 7.34* 8.90* 0.41 0.14 0.98 0.55
5% trimmed mean 140.93 0.10 0.46 0.59 4.18 5.82 0.40 0.10 1 0.56
Median 52 0 0 1 0 2 0 0 1 1
SD 1281.23 0.35 0.50 0.49 17.06 17.78 0.49 0.35 0.15 0.50
Min 10 0 0 0 0 0 0 0 0 0
Max 48387 1 1 1 100 100 1 1 1 1
Cluster 3
Mean 470.68* 0.16 0.68 0.76 11.00* 11.46* 0.53 0.25 0.97 0.55
5% trimmed mean 219.30 0.12 0.70 0.79 7.71 8.28 0.53 0.22 1 0.56
Median 81.5 0 1 1 2 5 1 0 1 1
SD 2148.33 0.37 0.47 0.43 20.52 19.34 0.50 0.43 0.17 0.50
Min 10 0 0 0 0 0 0 0 0 0
Max 60498 1 1 1 100 100 1 1 1 1
11One might argue that R&D be included among theseven innovations under scrutiny. We decided not to godown that route as we wanted to concentrate oninnovation outputs and not on innovation inputs.
198 G. Battisti and P. Stoneman
r 2009 British Academy of Management.

both increase progressively from cluster 1 to 3confirming the importance of the link betweeninnovation and skills emphasized by, amongothers, Caroli and Van Reenen (2001) andBresnahan, Brynjolfsson and Hitt (2002). Thepercentage of firms that received public supportincreases with the extent of innovative activitycarried out by the firm, reaching a peak of 25% inthe highly innovative group (cluster 3). Theproportion of firms that are part of a group(versus independent establishments) is higher incluster 3 than in the other clusters. No significantdifferences across clusters have been found withrespect to (i) whether the market for the firm’sfinal product is international or (ii) the age ofestablishments.In Table 10 we report the distribution of firms
across industrial sectors by clusters. We observe
that in every sector cluster 1 contains the largestnumber of firms, suggesting that the distributionof firm innovativeness is skewed. Second, firmsoperating in the service sector are no more likelyto belong to cluster 3 than firms in other sectors.Third, within the production sector, perhapsunsurprisingly, firms in mining and quarrying,electricity, gas and water supply and construc-tion are the least intensive innovators. Bycontrast, firms in high technology sectors suchas manufacturing of electrical and optical equip-ment, manufacturing of transport equipment,followed by manufacturing of fuels, chemicals,plastic metals and minerals are more intensiveinnovators.The two sectors with the highest percentage of
low intensity users are in services. They are retailtrade and hotels and restaurants. These are twosectors previously noted in the literature asexhibiting a particularly wide productivity gaprelative to other sectors (see for example Griffithet al., 2003).These results are essentially a picture at a
moment in time of the innovative state of UKindustry where innovation is essentially repre-sented by two factors (one organizational and theother technological) enabling us to divide thepopulation of firms into three clusters, 1, 2 and 3,in which the intensity of use of both factorsincreases as one moves from cluster 1 through tocluster 3. The analysis suggests that the numberof firms in each cluster reduces as one goesthrough clusters 1 to 3 and that firms in the
1 2 3Cluster Number
0
1.000
2.000
3.000
4.000
5.000
6.000
Cou
nt
SIZEBANDSmallMediumLarge
Figure 3. Intra-cluster firm size composition
Table 10. Distribution of firms (%) across sectors by clusters
SIC classification Definition Cluster 1 Cluster 2 Cluster 3 Total (count)
Production
10–14 Mining and quarrying 60.9 24.4 14.7 (197)
15–22 Mfr of food, clothing, wood, paper, publish and print 48.6 28.8 22.6 (1432)
23–29 Mfr of fuels, chemicals, plastic metals and minerals 48.6 27.7 23.7 (1897
30–33 Mfr of electrical and optical equipment 34.8 31.7 33.5 (663)
34–35 Mfr of transport equipment 44.5 27.4 28.1 (402)
36–37 Mfr not elsewhere classified 47.4 30.3 22.3 (515)
40–41 Electricity, gas and water supply 68.6 20.0 11.4 (35)
45 Construction 72.9 17.0 10.1 (1603)
Services
50–51 Wholesale trade (including cars and bikes) 59.6 23.7 16.7 (1341)
52 Retail trade (excluding cars and bikes) 73.6 17.4 9.1 (1543)
55 Hotels and restaurants 74.9 15.7 9.5 (983)
60–64 Transport, storage and communication 63.3 21.2 15.5 (1386)
65–67 Financial intermediation 44.6 24.4 31.0 (668)
70–74 Real estate, renting and business activities 50.8 25.3 23.9 (3718)
Total 56.9 23.7 19.4 (16383)
How Innovative are UK Firms? 199
r 2009 British Academy of Management.
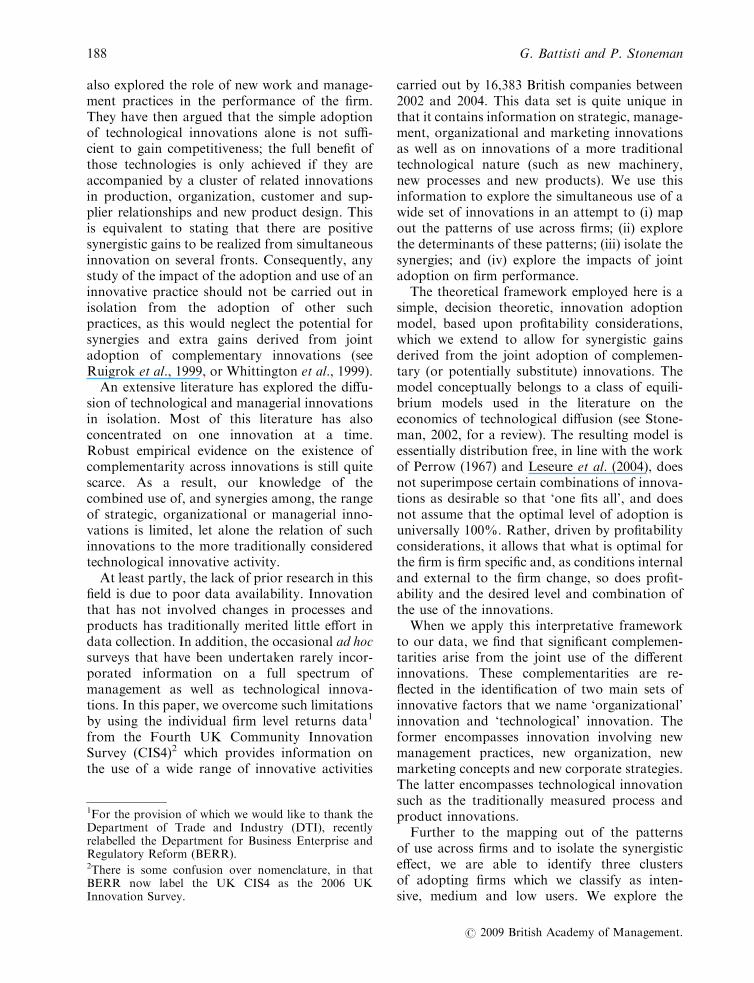
higher clusters do R&D, employ graduates,receive public support and are in higher techsectors.It is not possible with the data at our disposal
to consider cause and effect. Thus we are unableto say whether firms are large because they areinnovative or innovative because they are large.Similar statements can be made with respect tospending on R&D, employment of graduates andreceipt of public support. We are thus unable tosay whether only 19.4% of UK firms operate wellabove average in terms of innovative activitywhile 56.9% perform below the average becauseof their character or their characters are preciselybecause they do so perform. The real contribu-tion of this analysis is that the findings relate toboth technological and organizational innova-tions and their use in parallel. Past analysis hasconcentrated on technological innovation butthese results extend to both technological andorganizational innovations jointly.
Intensity of innovation and firmperformance
The impact of firm innovativeness upon firmperformance has been the concern of an extensiveliterature (see for example Hall, 2004). Inparticular, within the economics of innovationand technological change and within the endo-genous growth literature one can find severaltheoretical and empirical studies that havedemonstrated the role played by technologicalinnovations in promoting competitiveness atboth micro and macro levels. The evidence onthe impact of the adoption of organizationalinnovations, for a number of reasons, tends to beless consistent (see for example Battisti and Iona(2006) for a review of the literature on the impactof a range of such practices upon firm perfor-mance). In both cases, however, most of theexisting studies tend to analyse the impact ofindividual innovative practices in isolation. If, asclaimed in this paper, complementarity effectsexist, such an approach can be highly misleading,and only an integrated approach will be able tocapture synergistic effects and the (extra) profitgenerated by joint adoption.Due to the nature of the CIS4 data and the
strong potential endogeneity of several of thevariables, we have not been able (or willing) to
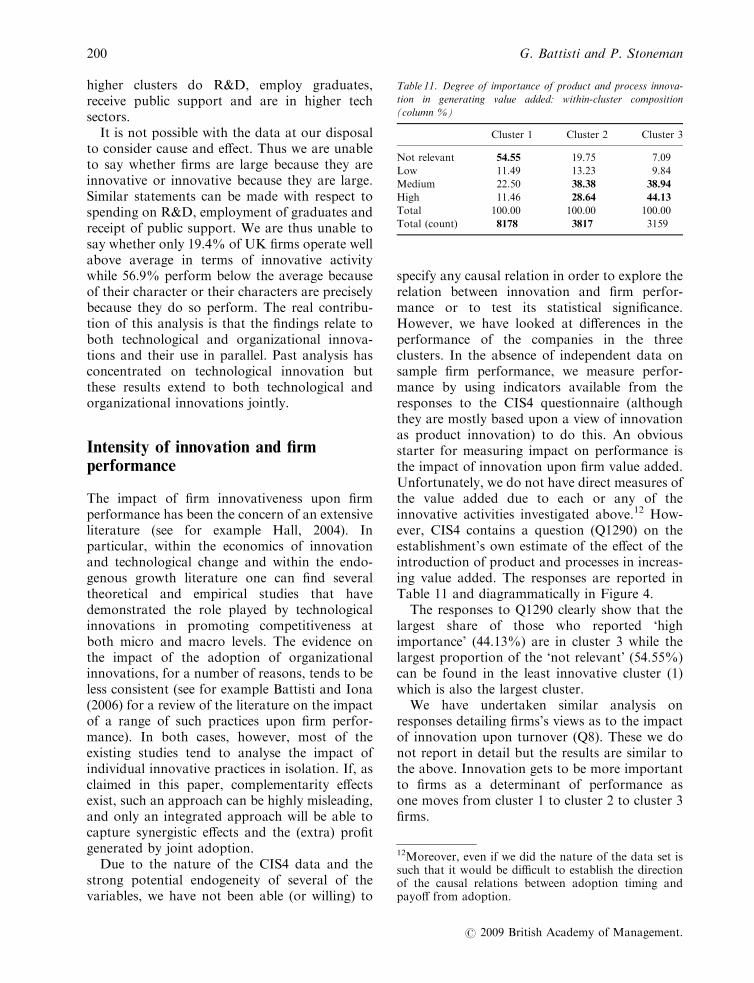
specify any causal relation in order to explore therelation between innovation and firm perfor-mance or to test its statistical significance.However, we have looked at differences in theperformance of the companies in the threeclusters. In the absence of independent data onsample firm performance, we measure perfor-mance by using indicators available from theresponses to the CIS4 questionnaire (althoughthey are mostly based upon a view of innovationas product innovation) to do this. An obviousstarter for measuring impact on performance isthe impact of innovation upon firm value added.Unfortunately, we do not have direct measures ofthe value added due to each or any of theinnovative activities investigated above.12 How-ever, CIS4 contains a question (Q1290) on theestablishment’s own estimate of the effect of theintroduction of product and processes in increas-ing value added. The responses are reported inTable 11 and diagrammatically in Figure 4.The responses to Q1290 clearly show that the
largest share of those who reported ‘highimportance’ (44.13%) are in cluster 3 while thelargest proportion of the ‘not relevant’ (54.55%)can be found in the least innovative cluster (1)which is also the largest cluster.We have undertaken similar analysis on
responses detailing firms’s views as to the impactof innovation upon turnover (Q8). These we donot report in detail but the results are similar tothe above. Innovation gets to be more importantto firms as a determinant of performance asone moves from cluster 1 to cluster 2 to cluster 3firms.
Table 11. Degree of importance of product and process innova-
tion in generating value added: within-cluster composition
(column %)
Cluster 1 Cluster 2 Cluster 3
Not relevant 54.55 19.75 7.09
Low 11.49 13.23 9.84
Medium 22.50 38.38 38.94
High 11.46 28.64 44.13
Total 100.00 100.00 100.00
Total (count) 8178 3817 3159
12Moreover, even if we did the nature of the data set issuch that it would be difficult to establish the directionof the causal relations between adoption timing andpayoff from adoption.
200 G. Battisti and P. Stoneman
r 2009 British Academy of Management.

These results indicate that firms’ own view ofthe importance of innovation as a determinant offirm performance increases as one moves fromclusters 1 to 3. However, in the absence ofappropriate data we cannot say whether firms arein cluster 3 because innovation is important orwhether innovation is important because the firmis in cluster 3. What we can say, however, is thatcluster membership depends on both technologi-cal and organizational innovative behaviour andthus any links are not restricted to technologicalinnovation alone – organizational innovationalso matters.
Innovation persistency: evidence fromCIS4 and CIS3
In this section we explore whether firms that areinnovative are also continuously innovative. Thishas two purposes. The first is to explore whether,just as performance may result from multipleinnovations rather than isolated individual inno-vations, so it may be the case that, intertempo-rally, continuous innovation is required toimprove performance rather than isolated in-stances of innovation. Second, our data onlyindicate whether firms introduced particularinnovations in the 2002–2004 period and do notdistinguish within the non-innovator group thosewho introduced innovations at other times fromthose who never innovate. Persistency analysismay overcome this problem.We compare the extent of innovative activity
reported by the cohort of firms in CIS4 (16,383establishments) and CIS3 (8172 establishments).While CIS4 covers innovative activity carried out
between 2002 and 2004, CIS3 covers innovativeactivity carried out between 1998 and 2000 (fordetails see www.berr.gov.uk/files/file9657.pdf).Due to the nature of the sample design of thetwo surveys there are only 959 establishments forwhich we have information in both surveys.13
In the first two columns of Table 12 we reportthe proportion of establishments that haveintroduced each of the studied innovations inthe two time periods (2002–2004 and 1998–2000).This provides us with an overview of theintertemporal dimension of the intensity of useof each of the seven innovations under scrutiny.Although the extent of product and processinnovation remains significantly unchanged inthe two time periods (test statistics for equality ofproportions: zPRODINOV 5 � 4.1394, p5 0.00,and zPROCINOV 5 � 2.1446, p5 0.016), the in-tensity of use of organizational innovations hasalmost doubled. Also the introduction of MA-CHINE has increased dramatically but this islikely to be due to the changed definition adoptedin CIS4 which included software and a widerdefinition of supporting innovative activitieswhich were not previously included in the CIS3version of the questionnaire.14
The third column of Table 12 reports the w2
test of association between the introduction of an
1 2 3Cluster
0.0%
20.0%
40.0%
60.0%
80.0%
100.0%P
erce
ntVA
not relevantLowMediumHigh
Figure 4. Inter-cluster distribution of the degree of importance of
product and process innovation in generating value added
13We have tried to build a panel merging the informa-tion in CIS2, CIS3 and CIS4. Unfortunately this reducesthe sample to 101 establishments making any statisticalanalysis totally unrepresentative of the UK establish-ment population.14In CIS4 the relevant question is question 13.30 onwhether in the three-year period 2002–2004 the enter-prise engaged in the following activity: ‘Acquisition ofadvanced machinery, equipment and computer hard-ware or software to produce new or significantlyimproved goods, services, production processes ordelivery methods’. In the CIS3 similar information wasasked in question 9.1 where it was asked whether in 2000the enterprise engaged in the following activity: ‘Acqui-sition of machinery and equipment (including computerhardware) in connection with process or productinnovation’. Also the response rates for the twoquestions were different. 939 responses were recordedin the CIS4 round while only 459 were recorded in theCIS3 round. Slightly different definitions were given inthe four questions concerning the introduction of widerinnovations (e.g. examples of practices especially inorganizational and management innovations) during thethree-year period preceding the survey. However, in thecontext of this study we do not see these changes asparticularly significant or impeding the comparison overtime.
How Innovative are UK Firms? 201
r 2009 British Academy of Management.

innovation in either, both or neither period. Forall the innovations under scrutiny the testindicates that introduction of an innovation isnot independent of introduction in the previousperiod. This can be better seen in the fourthcolumn which reports the proportion of theestablishments that introduced the same innova-tion in the period 2002–2004 as well as in theperiod 1998–2000. The degree of persistency ofinnovative activity is particularly high for orga-nizational innovations. The proportion of estab-lishments that introduced a product or processinnovation in both periods is lower.
Conclusions
Although there exists a large literature on theadoption and diffusion of innovations, only avery limited part considers the joint adoption of arange of innovations. In this study we have usedthe information contained in CIS4 to explore thepattern of use of innovations in UK industry andto test for the existence of complementaritiesamong seven types of innovations, i.e. process,product, machinery, marketing, organization,management and strategic innovations.Using a profitability based decision model, by
means of statistical and econometric tools wewere able to test the existence of complementaryeffects across the seven innovations. The resultssuggested widespread synergies among the iden-tified innovations. Decomposition of the payoffsfrom joint adoption has led us to identify twomajor sets of innovations. The most importantincludes the wide or organizational innovative
activities (marketing, organization, managementand strategic innovations); the second set com-prises more traditional or technological activities(machinery, process and product innovations).This finding is of particular importance in that,despite the extensive focus of the innovationliterature on technological innovations, ‘wide’ ororganizational innovations are found to play amajor role in the innovative activity of UK firms.This indicates that innovations based around thetechnical aspect of the delivery of the finalproduct (the process, the product per se or themachinery used), although important, tell onlypart of the story of the innovative effort of a firm.A two-step cluster analysis based upon the
intensity of organizational and technologicalinnovative activities was carried out leading tothe identification of three clusters of firms, eachreflecting the intensity of use of the two sets ofinnovations. One cluster was found where in-tensity of adoption of the two sets of innovationswas below average. This is the largest clustercontaining about 56.9% of the firms in thesample. A second cluster (about 23.7% of thesample) was found with intermediate but aboveaverage adoption of both innovative activities.Finally a third cluster (containing about 19.4%of the sample) was found, made up of highlyintensive adopters seemingly capable of fullyexploiting the synergistic effects generated byjoint adoption of organizational and technologi-cal innovations.This is a very new picture of the pattern
of innovative activity in the UK economy,simultaneously reflecting both technological andorganizational innovations and showing that
Table 12. Degree of persistency of innovative activity: CIS3–CIS4 panel (proportions)
(1) Proportion
of innovators
in CIS4
(2) Proportion
of innovators
in CIS3
(3) Test of
association
w2v5 1 (p value)
(4) Proportion of
CIS4 innovators that
introduced the same
innovation also in CIS3
(5) Establishments
that introduced no
innovation in either
CIS3 or CIS4
PRODINOV 0.30 0.39 80.24 (0.000) 0.46 0.50
PROCINOV 0.25 0.30 49.09 (0.000) 0.41 0.57
MACHINEa 0.72a 0.57a 4.68 (0.030) 0.75 0.12
STRATEGY 0.57 0.26 9.44 (0.002) 0.66 0.34
MANAGEMENT 0.47 0.25 20.57 (0.000) 0.61 0.42
ORGANIZATION 0.56 0.33 53.63 (0.000) 0.73 0.35
MARKETING 0.57 0.29 19.21 (0.000) 0.69 0.33
Note: aThe two proportions cannot be compared as the variable’s definition in CIS3 has been changed in the CIS4 survey.
202 G. Battisti and P. Stoneman
r 2009 British Academy of Management.

organizational innovations and technologicalinnovations are complements and not substitutesfor each other. The empirical evidence thussuggests that companies that are innovative inone dimension tend to be innovative, althoughwith different intensity, in all dimensions, irre-spective of the nature of the innovation.When looking at the characteristics of the firms
populating each cluster we found that themajority of small firms tend to populate thecluster of below average users. We found nosignificant differences across the three clusters inthe percentage of recently established firms, butthe proportion of establishments that carry outin-house R&D, the proportion of enterprises thatcarry out regular training, the percentage of firmsthat received public support, the proportion offirms that are part of a group and the proportionof employees with a degree all increase progres-sively going from cluster 1 to 3 (and thereforewith the intensity of use of the two majorinnovations). The data do not, however, enableconclusions on directions of causality.We found that establishments operating in the
service sector are no more or less intensive usersof innovations than firms in the productionsector. Within the production sector high tech-nology sectors such as manufacturing of electricaland optical equipment and manufacturing oftransport equipment are the sectors with thehighest relative number of intensive adopters ofnew technologies. By contrast, mining andquarrying, electricity, gas and water supply, andconstruction are the least intensive innovators.Overall the highest percentage of low intensityusers are in two service sectors, retail trade andhotels and restaurants. Interestingly these are thesame sectors that current literature has found toexhibit a wide productivity gap (see for exampleGriffith et al., 2003).In terms of the impact of innovation upon firm
performance, due to the lack of a time dimensionto the data and the strong potential endogeneityof several of the variables in the CIS4 ques-tionnaire, we cannot explore causality, nor do wehave objective data on firm performance indica-tors. We have thus looked at the establishments’sown estimates of the effect of the introduction ofproduct and processes in increasing value addedand restrict the analysis to association. Despitethis measure being biased toward the technicalaspects of innovation, the results clearly show
that the largest share of those who reported ‘highimportance’ for impact upon performance(44.13%) are in cluster 3 while the largestproportion of the ‘not relevant’ to companyperformance (54.55%) can be found in the leastinnovative cluster which is also the largest cluster.This does not allow us to say whether firms in thethird cluster rank innovation high or becausethey rank innovation highly they are in the thirdcluster. However, what we can say is that bothtechnological and organizational innovations areinterlinked and any links to performance are notrestricted to technological innovations alone:organizational innovation also matters.In order to investigate whether firms that are
innovative are also continuously innovative wehave compared the extent of innovative activityreported by the cohort of firms included in boththe CIS4 and the earlier CIS3 survey. The findingsreinforce a view that intertemporal persistence isimportant to performance. Although the extent ofproduct and process innovation remains largelyunchanged in the two time periods, the intensity ofuse of organizational innovations has almostdoubled.In terms of contribution, we believe, first, that
our results make a significant contribution to themapping of innovation in the UK, simulta-neously taking into account all types of innova-tion. The complementarity of innovations andthe simultaneous introduction of different inno-vations suggest that future mapping exercises willneed to pay much more attention to synergiesand complementarities than has been the case inthe past. Second, although our finding that56.9% of UK firms are in an underperforminglow innovation cluster is worrying, the character-istics of firms in that cluster (small, no in-houseR&D, no regular training, no public support, fewgraduate employees etc.) may indicate where, andon what, innovation policy should be targeted ifthe innovative performance of these firms is to beimproved. Third, the finding that organizationaland technological innovations are complementssuggests that the theoretical literature thatsuggests that technological innovation in theabsence of organizational innovation alone can-not drive competitiveness has empirical validityand implications for corporate behaviour. Finallythe findings suggest that future research on firminnovative behaviour and performance shouldgive greater emphasis to the integration of
How Innovative are UK Firms? 203
r 2009 British Academy of Management.

technological and organizational factors. In amore limited vision, it would also appear thatfollowing on from this paper there are opportu-nities to, for example, explore other diffusionmodels based upon information acquisitionand uncertainty as alternatives to the profitability
based models. More innovation survey datawill also soon be available that may well enablebetter testing of the causal relation between theextent of multi-innovation adoption and firmcharacteristics.
References
Arora, A. (1996). ‘Testing for complementarities in reduced-
form regressions: a note’, Economics Letters, 50, pp. 51–55.
Arora, A. and A. Gambardella (1990). ‘Complementarity and
external linkages: the strategies of the large firms in biotech-
nology’, Journal of Industrial Economics, 38, pp. 361–379.
Astebro, T. (1995). ‘The effect of management and social
interaction on the intra firm diffusion of electronic mail
systems’, IEEE Transactions on Engineering Management, 42,
pp. 319–331.
Astebro, T. (2002). ‘Non-capital investment costs and the
adoption of CAD and CNC in US metalworking industries’,
Rand Journal of Economics, 33, pp. 672–688.
Bartel, A. P. and F. R. Lichtenberg (1987). ‘The comparative
advantage of educated workers in implementing new
technology’, Review of Economics and Statistics, 69, pp. 1–11.
Battisti, G. and A. Iona (2006). ‘Can management practices
explain the UK productivity gap? A review of the evidence
from the adoption of management practices’. Aston Business
School Working Paper, RP0632.
Battisti, G. and A. Iona (2007). ‘On the adoption decision and
the intensity of use of complementary innovations: the intra
firm diffusion of management practices across UK establish-
ments’, Aston Business School Working Paper, RP0722, pp.
1–31.
Battisti, G., A. Canepa and P. Stoneman (2009). ‘The diffusion
of e-business activities in the UK: productivity, profitability,
externalities and policy’, Research Policy, 38, pp. 133–143.
Battisti, G., M. G. Colombo and L. Rabbiosi (2005).
‘Complementarity effects in the simultaneous diffusion of
technological and organizational innovations’. WP.05.03
Quaderni CIRET, CIRET – Dipartimento di Ingegneria
Gestionale, Universita’ Politecnico di Milano, pp. 1–32.
Berman, E., J. Bound and Z. Griliches (1994). ‘Changes in the
demand for skilled labor within U.S. manufacturing:
evidence from the annual survey of manufactures’, Quarterly
Journal of Economics, 109, pp. 367–397.
Appendix: 1992 SIC codes by wideindustry grouping
Code Industry
10 Mining of coal11 Extraction of oil and gas14 Other mining and quarrying
15 Food and beverages16 Tobacco17 Textiles18 Clothes19 Leather20 Wood21 Paper22 Publishing
23 Coke, petroleum and nuclear fuel24 Chemicals25 Rubber and plastic26 Other non-metallic mineral products27 Basic metals28 Fabricated metal products29 Machinery and equipment
30 Office machinery and computers31 Electrical machinery32 Radio, television and communication33 Medical/optical instruments34 Motor vehicles35 Other transport
36 Furniture37 Recycling
40 Electricity, gas and water supply41 Collection, purification and distribution of
water45 Construction
51 Wholesale60 Land transport61 Water transport62 Air transport64 Post and telecommunications
65 Financial intermediation66 Insurance and pensions67 Financial intermediation (activities auxiliary)
70 Real estate71 Renting of machinery and equipment72 Computer and related activities73 Research and development74 Business activities
204 G. Battisti and P. Stoneman
r 2009 British Academy of Management.

Berman, E., J. Bound and S. Machin (1997). ‘Implications of
skill-biased technological change: international evidence’.
Centre for Economic Performance Discussion Paper 24.
Black, S. E. and L. Lynch (2004). ‘What’s driving the new
economy? The benefits of workplace innovation’, Economic
Journal, 114, pp. 97–116.
Bloom, N. and J. Van Reenen (2007). ‘Measuring and
explaining management practices across firms and countries’,
Quarterly Journal of Economics, 122, pp. 1351–1408.
Bresnahan, T. F., E. Brynjolfsson and L. M. Hitt (2002).
‘Information technology, workplace organization, and the
demand for skilled labor: firm-level evidence’, Quarterly
Journal of Economics, 117, pp. 339–376.
Brynjolfsson, E. and L. M. Hitt (1994). ‘Paradox lost? Firm-
level evidence of high returns to information systems
spending’. MIT Discussion Paper.
Brynjolfsson, E. and L. M. Hitt (2000). ‘Beyond computation;
information technology, organizational transformation and
business performance’, Journal of Economic Perspectives, 14,
pp. 23–48.
Cappelli, P. and D. Neumark (2001). ‘Do ‘‘high-performance’’
work practices improve establishment-level outcomes?’,
Industrial and Labor Relations Review, 54, pp. 737–775.
Caroli, E. and J. Van Reenen (2001). ‘Skill-biased organiza-
tional change? Evidence from a panel of British and French
establishments’, Quarterly Journal of Economics, 116, pp.
1449–1492.
Cohen, W. and D. Levinthal (1989). ‘Innovation and learning:
the two faces of R&D’, Economic Journal, 99, pp. 569–596.
Colombo, M. G. and M. Delmastro (2002). ‘The determinants
of organizational change and structural inertia: technological
and organizational factors’, Journal of Economics and
Management Strategy, 11, pp. 595–635.
Colombo, M. G. and R. Mosconi (1995). ‘Complementarity
and cumulative learning effects in the early diffusion of
multiple technologies’, Journal of Industrial Economics, 63,
pp. 13–48.
Edwards, T., G. Battisti and A. Neely (2004). ‘Value creation
and the UK economy: a review of strategic options’, Inter-
national Journal of Management Reviews, 5–6, pp. 191–213.
Finegold, D. and D. Soskice (1988). ‘The failure of training in
Britain: analysis and prescription’, Oxford Review of Eco-
nomic Policy, 4, pp. 21–53.
Geroski, P. A. (2000). ‘Models of technology diffusion’,
Research Policy, 29, pp. 603–625.
Griffith, R., R. Harrison, J. Haskel and M. Sako (2003). ‘The
UK productivity gap and the importance of the service
sectors’. Advanced Institute of Management (AIM) Briefing
Note, December.
Hall, B. (2004). ‘Innovation and diffusion’. NBER Working
Paper 10212, NBER, Cambridge, MA.
Hannah, T. H. and J. M. McDowell (1984). ‘The determinants
of technology adoption: the case of the banking firm’, Rand
Journal of Economics, 15, pp. 328–335.
Ichniowski, C. and K. Shaw (1995). ‘Old dogs and new tricks:
determinants of the adoption of productivity-enhancing work
practices’, Brookings Papers on Economic Activity: Micro-
economics, Spring, pp. 1–65.
Ichniowski, C., K. Shaw and G. Prennushi (1997). ‘The effects
of human resource management practices on productivity: a
study of steel finishing lines’, American Economic Review, 87,
pp. 291–313.
Ireland, N. and P. Stoneman (1986). ‘Technological diffusion,
expectations and welfare’, Oxford Economic Papers, 38, pp.
283–304.
Karshenas, M. and P. Stoneman (1993). ‘Rank, stock, order
and epidemic effects in the diffusion of new process
technologies: an empirical model’, Rand Journal of Econom-
ics, 24, pp. 503–528.
Leseure, M. J., J. Bauer, K. Birdi, A. Neely and D. Denyer
(2004). ‘Adoption of promising practices: a systematic review
of the evidence’, International Journal of Management
Reviews, 5, pp. 169–190.
Little, J. S. and R. K. Triest (1996). ‘Technology diffusion in
U.S. manufacturing: the geographic dimension’. In J. C.
Fuhrer and J. S. Little (eds), Technology and Growth.
Conference Proceedings, Federal Reserve Bank of Boston.
Mansfield, E. (1968). Industrial Research and Technological
Innovation. New York: W. W. Norton.
Milgrom, P. and J. Roberts (1990). ‘The economics of modern
manufacturing: technology, strategy, and organization’,
American Economic Review, 80, pp. 511–528.
Milgrom, P. and J. Roberts (1995). ‘Complementarities and fit:
strategy, structure, and organizational change in manufactur-
ing’, Journal of Accounting and Economics, 19, pp. 179–208.
Noteboom, B. (1993). ‘Adoption, firm size and risk of imple-
mentation’, Economics of Innovation and New Technology, 2,
pp. 203–216.
O’Mahony, M and W. De Boer (2002). ‘Britain’s relative
productivity performance: has anything changed?’, National
Institute Economic Review, 179, pp. 38–43.
Perrow, C. (1967). ‘A frame work for the comparative analysis
of organizations’, American Sociological Review, 32, pp. 194–
208.
Porter, M. E. and C. H. M. Ketels (2003). ‘UK competitiveness:
moving to the next stage’. DTI Economics Paper 3, May.
Ruigrok, W., A. Pettigrew, S. Peck and R. Whittington (1999).
‘Corporate restructuring and new forms of organizing:
evidence from Europe’, Management International Review,
199, Special Issue, pp. 41–64.
Saloner, G. and A. Shephard (1995). ‘Adoption of technologies
with network effects: an empirical examination of the
adoption of automated teller machines’, Rand Journal of
Economics, 26, pp. 479–501.
Stoneman, P. (2002). The Economics of Technological Diffusion.
Oxford: Blackwell.
Stoneman, P. (2004). ‘Path dependency and reswitching in a
model of multi-technology adoption’. In T. Guinnane, W.
Sundstrom and W. Whatley (eds),History Matters: Essays on
Economic Growth, Technology and Demographic Change, pp.
36–62. Stanford, CA: Stanford University Press.
Stoneman, P. and G. Battisti (2008). ‘The diffusion of new
technology’. In B. H. Hall and N. Rosenberg (eds), Hand-
book of the Economics of Technical Change, Part IV, Ch. 3.
Amsterdam: North-Holland, forthcoming.
Wengel, J., A. Nylund, L. B. Sjogren, P. L. Stoneman, N.
Bellini, A. Bonaccorsi and P. Shapira (2000). Surveying
Organizational Innovation on a European Level – Challenges
and Options. A report to the CIS, DG XIII–C, of the
European Commission, April.
Whittington, R., A. Pettigrew, S. Peck, E. Fenton and M.
Conyon (1999). ‘Change and complementarities in the new
competitive landscape: a European panel study, 1992–1996’,
Organization Science, 10, pp. 583–600.
How Innovative are UK Firms? 205
r 2009 British Academy of Management.

Giuliana Battisti is an Associate Professor and Reader in Industrial Economics at NottinghamUniversity Business School. She is also an ESRC-AIM (Advanced Institute of Management) Fellowin Services, an AIM scholar and Principal Investigator on an EPSRC-AIM project (Ref. EP/D503965/1) on the role of management practices in closing the UK productivity gap. Her researchinterests are in applied statistics/econometrics and the diffusion of innovations. She has published inthe International Journal of Management Reviews, Research Policy, International Journal of IndustrialOrganization, Oxford Economic Papers etc.
Professor Paul Stoneman is Research Professor in the Marketing and Strategic Management Groupand Head of the Technological Innovations Research Unit in Warwick Business School. He has heldvisiting positions at Stanford and Nuffield College, Oxford. He has published widely on theeconomics of innovation especially as regards the diffusion of new technology and technologypolicy. He is author of one of the earliest studies of computerization in the UK as well as of texts ontechnological change and technology policy, with a latest volume on technological diffusion. Pastpapers have appeared in inter alia the Rand Journal of Economics, the Economic Journal and theJournal of Industrial Economics.
206 G. Battisti and P. Stoneman
r 2009 British Academy of Management.