
How Formal Control Influences Decision-Making Clarity and Innovation Performance
18
How Formal Control Influences Decision-Making Clarity and Innovation Performance Carsten Schultz, Søren Salomo, Ulrike de Brentani, and Elko J. Kleinschmidt Implementing formal planning instruments such as the stage-and-gate-type system (SGS) and project management (PM) have long been seen as the key to new product development (NPD) success. They create the structure needed for managing NPD activities, supporting coordination among functional groups, reducing uncertainty and error, and assuring time and cost efficiency. But recent research presents ambiguous results, suggesting that SGS and PM as formal controls can also have a negative effect. Integrating ideas from three literatures—i.e., NPD management, organization control theory, and technical control theory—the present study assesses NPD programs in terms of three perspectives: (1) the formal control mechanisms used for managing NPD programs—specifically SGS, which is mainly seen as a higher organizational level approach used for guiding and implementing a portfolio of NPD projects, and PM, which is a precise formal control mechanism relevant for managing specific problems at a single project level; (2) the immediate outcome of the application of formal controls, i.e. decision-making clarity (DMC); and (3) degree of NPD innovativeness, a key contingency hypothesized to impact the efficacy of formal controls. For the empirical analysis, data are collected through a survey of 162 corporate NPD programs (Austria and Denmark, manufactured goods and services) where a total of 1274 respondents provide information relevant to their position. Hierarchical regression analysis is used to test the relationships. Results indicate that the performance effect of NPD formal control is fully mediated by DMC. Further, of the six hypothesized outcome relationships, four are fully supported. Both SGS and PM are effective systems for managing NPD when degree of innovativeness is not taken into account. PM, however, loses its efficacy at higher degrees of NPD program innovativeness while SGS continues to work at achieving positive DMC at the radical end of the innovativeness spectrum. Analysis of interaction effects indicates that for more innovative NPD programs, best results are achieved when companies implement an interactive system of both SGS and PM, where the two systems complement each other. Introduction P rocess formalization is an established manage- ment approach in new product development (NPD) and has been shown to impact perfor- mance positively (Henard and Szymanski, 2001; Kahn, Barczak, and Moss, 2006; Kleinschmidt, de Brentani, and Salomo, 2007). Formal controls such as project manage- ment (PM) and stage-and-gate-type system (SGS) create the needed structure for managing projects, supporting coordination between different functional groups (Brown and Eisenhardt, 1995), and reducing uncertainty and error. PM is a relatively precise control mechanism rel- evant for managing specific problems at the single project level (Project Management Institute, 2000), while SGS is more flexible in that it provides guidelines in line with longer term strategic issues and is typically implemented for the entire NPD program of the firm (Cooper, 2008). Some studies question the positive effect of formal con- trols, showing that they may have a negative impact par- ticularly if they impose too much rigidity on the NPD program (Bonner, Ruekert, and Walker, 2002; Sethi and Iqbal, 2008). This creates an ambiguous picture about the performance impact of formalization in NPD, which is aggravated by too few studies taking into account the causal mechanism of formal control and the contingen- cies that may be linked to how such systems work (Christiansen and Varnes, 2009). Further, PM and SGS are likely to vary in terms of their effects in the NPD context, and this, to the best of our knowledge, has not been researched. There remains what could be termed a “black box” between NPD process formalization and NPD outcome, and to open this is the aim of this research, thereby contributing to our understanding of how and under what conditions different types of formal control influence NPD program performance. Address correspondence to: Carsten Schultz, Christian-Albrechts Uni- versity at Kiel, 24118 Kiel, Germany. E-mail: [email protected]. Tel: +49 431 880 1542. J PROD INNOV MANAG 2013;30(3):430–447 © 2013 Product Development & Management Association DOI: 10.1111/jpim.12009
-
Upload
independent -
Category
Documents
-
view
3 -
download
0
Transcript of How Formal Control Influences Decision-Making Clarity and Innovation Performance

How Formal Control Influences Decision-Making Clarity andInnovation PerformanceCarsten Schultz, Søren Salomo, Ulrike de Brentani, and Elko J. Kleinschmidt
Implementing formal planning instruments such as the stage-and-gate-type system (SGS) and project management(PM) have long been seen as the key to new product development (NPD) success. They create the structure needed formanaging NPD activities, supporting coordination among functional groups, reducing uncertainty and error, andassuring time and cost efficiency. But recent research presents ambiguous results, suggesting that SGS and PM asformal controls can also have a negative effect. Integrating ideas from three literatures—i.e., NPD management,organization control theory, and technical control theory—the present study assesses NPD programs in terms of threeperspectives: (1) the formal control mechanisms used for managing NPD programs—specifically SGS, which is mainlyseen as a higher organizational level approach used for guiding and implementing a portfolio of NPD projects, andPM, which is a precise formal control mechanism relevant for managing specific problems at a single project level;(2) the immediate outcome of the application of formal controls, i.e. decision-making clarity (DMC); and (3) degree ofNPD innovativeness, a key contingency hypothesized to impact the efficacy of formal controls. For the empiricalanalysis, data are collected through a survey of 162 corporate NPD programs (Austria and Denmark, manufacturedgoods and services) where a total of 1274 respondents provide information relevant to their position. Hierarchicalregression analysis is used to test the relationships. Results indicate that the performance effect of NPD formal controlis fully mediated by DMC. Further, of the six hypothesized outcome relationships, four are fully supported. Both SGSand PM are effective systems for managing NPD when degree of innovativeness is not taken into account. PM, however,loses its efficacy at higher degrees of NPD program innovativeness while SGS continues to work at achieving positiveDMC at the radical end of the innovativeness spectrum. Analysis of interaction effects indicates that for moreinnovative NPD programs, best results are achieved when companies implement an interactive system of both SGS andPM, where the two systems complement each other.
Introduction
P rocess formalization is an established manage-ment approach in new product development(NPD) and has been shown to impact perfor-
mance positively (Henard and Szymanski, 2001; Kahn,Barczak, and Moss, 2006; Kleinschmidt, de Brentani, andSalomo, 2007). Formal controls such as project manage-ment (PM) and stage-and-gate-type system (SGS) createthe needed structure for managing projects, supportingcoordination between different functional groups (Brownand Eisenhardt, 1995), and reducing uncertainty anderror. PM is a relatively precise control mechanism rel-evant for managing specific problems at the single projectlevel (Project Management Institute, 2000), while SGS ismore flexible in that it provides guidelines in line with
longer term strategic issues and is typically implementedfor the entire NPD program of the firm (Cooper, 2008).Some studies question the positive effect of formal con-trols, showing that they may have a negative impact par-ticularly if they impose too much rigidity on the NPDprogram (Bonner, Ruekert, and Walker, 2002; Sethi andIqbal, 2008). This creates an ambiguous picture about theperformance impact of formalization in NPD, which isaggravated by too few studies taking into account thecausal mechanism of formal control and the contingen-cies that may be linked to how such systems work(Christiansen and Varnes, 2009). Further, PM and SGSare likely to vary in terms of their effects in the NPDcontext, and this, to the best of our knowledge, has notbeen researched. There remains what could be termed a“black box” between NPD process formalization andNPD outcome, and to open this is the aim of this research,thereby contributing to our understanding of how andunder what conditions different types of formal controlinfluence NPD program performance.
Address correspondence to: Carsten Schultz, Christian-Albrechts Uni-versity at Kiel, 24118 Kiel, Germany. E-mail: [email protected]. Tel:+49 431 880 1542.
J PROD INNOV MANAG 2013;30(3):430–447© 2013 Product Development & Management AssociationDOI: 10.1111/jpim.12009

All innovation management instruments, includingformal control systems, have the ultimate goal ofimproved financial and/or market performance of thefirm. But, formal controls by themselves do not directlyimpact this type of NPD success. Instead, they introducediscipline and efficiency to the NPD managementapproach (Cooper, 2008), which lessens ambiguity and,in turn, reduces error and cost. In effect, a well-defined
NPD process provides NPD team members with a senseof structure and sequence to their work, enhancing clarityabout what, how, and when to work on different elementsof the NPD program (Tatikonda and Montoya-Weiss,2001). Drawing on research on teamwork quality andcoordination (Hoegl and Gemünden, 2001; Hoegl andParboteeah, 2006; Salomo, Weise, and Gemünden,2007), this study assesses the effect of formal control onthe transparency of NPD-related decisions. To this end,the construct decision-making clarity (DMC) is intro-duced, which is seen as functioning as an immediateoutcome of process formalization and, only ultimately, asa factor that improves NPD performance. This is based onan underlying theory—that is, “organizational controltheory”—that views DMC as a central consequence offormal control for both SGS and PM. In addition, aclosely related concept—“technical control theory”—emphasizes that formal control may be implemented atdifferent levels within the organization. Thus, a theoreti-cal model is proposed where different but interrelatedformal control systems are relevant for different organi-zational levels involved in NPD management. PM, withits primary focus on meeting cost, time, and qualityobjectives and on controlling specific activities of indi-vidual projects, is a formal control system more relevantfor managing specific issues or problems at the singleproject level. Moreover, although organizations usuallydevelop PM guidelines for the entire NPD landscape,specific PM instruments such as milestone or cost plan-ning are typically applied within a given project and thusat lower levels of the organization (Lindkvist, 2004). TheSGS, on the other hand, incorporates longer term organi-zational concerns and has its main focus on the prioriti-zation and selection of projects, and on controllingresources and goal interdependencies within the entireNPD program. As such, SGS is more driven by strategicobjectives, entails greater flexibility with regard to indi-vidual projects, and is typically implemented at higherorganizational levels (i.e., the NPD program level)(Cooper, 2008).
As noted, formal control has been perceived as a“mixed blessing,” improving NPD performance in somecases while reducing it in other. In two recent meta-analyses (Calantone, Harmancioglu, and Dröge, 2010;Pattikawa, Verwaal, and Commandeur, 2006), no cleareffect of formalization on NPD performance was found.This is similar to Henard and Szymanski’s (2001) meta-analysis, where using a structured approach to NPD wasalso shown to have no significant performance relation-ship, although this was considered potentially misleadingif applied to turbulent high-technology NPD settings. In
BIOGRAPHICAL SKETCHES
Dr. Carsten Schultz is Professor for Technology Management at theInstitute for Innovation Research (University at Kiel). He holds adiploma in business engineering and a doctorate and a habilitationdegree in business administration from Technical University Berlin. Hisresearch concentrates on service innovations and product servicesystems with a focus on innovation management in healthcare. Furtherresearch interests include the management of radical innovations anduniversity industry collaborations. His research has published in suchjournals as Journal of Product Innovation Management, IEEE Transac-tions on Engineering Management, Health Care Management Review,and Health Policy.
Dr. Søren Salomo is a Professor of Innovation Management at theTechnical University of Denmark, Copenhagen. He holds a diploma anda doctorate in business administration from Kiel University and a habili-tation degree from Technical University Berlin. His research interestsentail corporate innovation management with a special focus on processand organizational system mechanisms for supporting highly innovativeventures. He has published numerous journal and conference papers aswell as a number of books including a widely used textbook on inno-vation management with Jürgen Hauschildt (5th ed., 2011).
Dr. Ulrike de Brentani (Professor, Department of Marketing, ConcordiaUniversity Montreal, Canada) has research interests in new product/service development, new product evaluation, and product/service mar-keting in the business-to-business sector. Her current studies dealspecifically with global new product development and with marketvision for the development of new-to-the-world products in high-techindustries. She has been awarded several research grants and awards ofacademic excellence for her research and has published in such journalsas Journal of Product Innovation Management, Journal of the Academyof Marketing Science, International Journal of Research in Marketing,Journal of Business Research, Industrial Marketing Management, Euro-pean Journal of Marketing, Journal of Marketing Management, andInternational Journal of Bank Marketing.
Dr. Elko J. Kleinschmidt is professor (emeritus) of marketing and inter-national business at the DeGroote School of Business at McMasterUniversity. He holds a bachelor’s degree in mechanical engineering andan M.B.A. and a Ph.D. in business administration. Elko is a leadingexpert and recognized researcher in the fields of new product develop-ment, portfolio management for new products, success factors for newproduct programs, and the impact of the international dimension on newproducts. He has published extensively on these topics in Journal ofProduct Innovation Management and other journals and was given theThomas P. Hustad Best Paper Award for 1999 with Cooper and Edgettand for 2007 with U. de Brentani and S. Salomo. His current researchdeals with new product and service development for global markets,“green” new product development, and success factors in the front endof the innovation process.
DECISION-MAKING CLARITY AND INNOVATION PERFORMANCE J PROD INNOV MANAG 4312013;30(3):430–447

addition, the process management literature highlightsthat process control may cause organizational rigidity,indicating that in uncertain and complex NPD scenarios amore flexible approach may be required (Sethi and Iqbal,2008). In this study, therefore, the idea of NPD programinnovativeness is introduced as a key contingencyimpacting the efficacy of formal controls. It is suggestedthat in more innovative NPD situations, more flexiblestructures are needed and different types of controlsystems can be expected to interact (Bisbe and Otley,2004). In other words, PM and SGS controls are likely tobe used together to achieve a combined effect. Themodel describes the relationships among formal controlsystems, DMC, and performance, accounting both for theinteraction of PM and SGS as well as the influence ofNPD program innovativeness on the efficacy of formalcontrols.
Theoretical Background
Substantial literature in NPD deals with formal control.In line with the Weberian view of bureaucracy and formalauthority for coordinating activities and ensuring theexistence of organizations (for an overview, see Heugens,2005), researchers have begun to formulate theoreticalfoundations for the application of formal controls in theNPD context. For example, Sethi and Iqbal (2008)suggest “organizational control” theory as such a concep-tual perspective; this, because this theory motivates theuse of DMC as the central consequence of formal control.Because DMC reflects transparency in resource alloca-tion and in decision responsibilities and processes—andtherefore becomes the fundament for shared goals byNPD team members—it can be seen as a relevant inter-mediate outcome variable in a model that explains NPDperformance. Other researchers interpret control by relat-ing organizational planning/control problems to “techni-cal control” systems (Bart, 1991; Diefendorff andGosserand, 2003). Technical control theory highlights therelevance of “hierarchical” levels of control loops. In theNPD context, this translates into potential interactionsbetween SGS (on a “higher” organizational, or NPDprogram, level) and PM (on a “lower” organizational, orsingle project, level). Because the two interpretations ofcontrol theory can contribute to a better understanding ofthe consequences of formal controls, a broader concep-tual base is created that incorporates both perspectives(i.e., organizational control and technical control).Figure 1 presents the theoretical framework, which isdescribed below.
Organizational Control Theory
According to “organizational control” theory, formalcontrol systems take several forms such as PM and theSGS (Pons, 2008). SGS breaks the traditional NPDprocess into a set of discrete stages where each consists ofcertain predesigned activities. Decisions points separatethe stages, where activity results are evaluated andresource allocation decisions critical for the continuationof the development process are taken (Cooper, 2008). APM control system (Project Management Institute, 2000)is aimed at structuring and planning project activities inorder to meet specific objectives and at ensuring thatproject activities are carried out in line with the projectplan (Naveh, 2007; Tatikonda and Montoya-Weiss, 2001).
Organizational control theory also distinguishesbetween two formal control mechanisms: outcomecontrol and process control (Eisenhardt, 1985; Ouchi,1979; Turner and Makhija, 2006). Both mechanismsalign organizational members’ behavior with organiza-tional goals. Outcome control refers to the specificationof desired and interim outputs, while process controlspecifies the appropriate behaviors and processes inwhich team members must engage to achieve these ends.SGS and PM combine both types of mechanisms in theform of, for example, the deliverables that project teamsbring to each gate and the prescription of specific taskswithin stages, respectively (Kleinschmidt et al., 2007).
A crucial function of formal controls—both processand outcome—is to reduce the level of uneven distributionof information and knowledge across organizationalmembers (Jaworski and Macinnis, 1989) and thus tofacilitate the coordination of activities of different partiesand enhance the motivation of NPD team members(Hoegl and Parboteeah, 2006; Turner and Makhija, 2006).Formal controls tighten internal communication linkages(Henderson and Clark, 1990) and provide a sense ofstructure and sequence to NPD tasks (Tatikonda andMontoya-Weiss, 2001), achieving greater clarity aboutorganizational goals, actions, and results. Formalized
Theory
Organiza onal ControlTheory
Outcome and PropressControl
Technical ControlTheory
Lower and Higher LevelFeedback Loops
Stage-and-gate-type System
ProjectManagement
Decision-MakingClarity
NPDPerformance
Ac vity Outcome
Figure 1. Innovation Management Control: Theoretical Basisfor Research
432 J PROD INNOV MANAG C. SCHULTZ ET AL.2013;30(3):430–447

processes also stabilize resource allocation and decisionprocesses that determine which innovation projects aresupported (Benner and Tushman, 2003; Christensen andBower, 1996). As such, it is proposed in this paperthat the three key aspects—improved understandingof organizational goals and decision criteria, clearerdecision processes, and more transparent decisiondissemination—comprise the DMC construct, which ulti-mately improves NPD financial/market performance.
Technical Control Theory
“Technical control” theory implies the idea of feedbackor control loops, and a key principle of this theory is thatgoals are arranged in hierarchical order. At lower levels,individuals act on the basis of short-term behavioralgoals, which are linked to higher level organizationalobjectives. Long-term goals, on the other hand, are set athigher organizational levels. These establish the goals forlower order control loops, while lower level goals deter-mine the means by which higher level goals are achieved(Diefendorff and Gosserand, 2003). Relating these con-cepts to NPD management, a lower level control loopdescribes the feedback, for example, between an NPDproject team and the responsible project leader. Theproject-specific goals (e.g., to develop a specific technicalcomponent) are the result of a feedback loop from ahigher organizational level that deals with the entire NPDprogram and takes long-term objectives and interdepen-dencies with other projects into account.
The relevance of control loops at different organiza-tional levels depends on task complexity and duration.While simple and short-term tasks can be performed byprocessing a series of routine actions, the variety of theseincreases for more complex and long-term tasks. Whencomplexity is limited, therefore, NPD teams can actwithout additional formal control from a higher organi-zational level, relying on the overall strategic plan. If taskcomplexity is high, however, individuals are less able toidentify problems and their interrelations with the orga-nization as a whole, nor to design and implement solu-tions on their own (Fransoo and Wiers, 2006). As a result,lower level control loops have to be complemented byhigher level feedback loops, thus intertwining informa-tion originating at both the lower and the higher level. Ineffect, the output of higher order control (e.g., corporateinnovation strategy) determines the goals for lower ordercontrol (specific project objectives such as sales ormarket share) and higher level goals must be open toadaptation in response to feedback initiated at lowerlevels. From a technical control theory perspective, there-
fore, complex tasks such as radical innovation are likelyto be influenced by a combination of both lower andhigher order feedback to guide individual and organiza-tional activities. In other words, higher organizationallevel SGS and lower level PM have to be applied together.
Differences between PM and SGS
Although program-based SGS and project-based PM areformal control systems that are often used together(Cooper, 2008), two important aspects distinguish thesesystems: they have different aims and are carried out atdifferent hierarchical levels.
Aims of formal control systems. The primary aim ofSGS is to achieve the NPD strategic goals of the firm(e.g., future income, competitive position); second, toensure the overall efficacy of the NPD program (i.e.,spending scarce resources on projects with a high likeli-hood of success); and third, to cope with interdependen-cies among projects by defining a set of preassigned andcompatible NPD activities. SGS does not focus on ensur-ing project efficiency (e.g., meeting time and spendingtargets); instead, gates are used to determine whetherprojects should go or be killed in line with the objectivesand NPD standards of the firm. Through its go/kill crite-ria, SGS can be seen as a predefined metastructureguiding all NPD activities of the firm (Biazzo, 2009;Griffin, 1997). In contrast, the aim of PM is microcontrolof single projects, where requirements and activities areestablished at the individual project level. The object is toachieve microgoals including: efficiency, meeting time-lines, staying within budgets, using preidentified person-nel, and meeting planned cost levels (Pons, 2008;Wheelwright and Clark, 1992). In sum, while PM is acontrol mechanism applied to micromanage projects andto ensure the achievement of precise, short-term, project-specific goals, SGS provides for a more generic under-standing of what needs to be performed during the phasesof the NPD process in order to deal with latent interde-pendencies between various NPD activities, and ulti-mately to achieve the NPD strategies of the firm.
Hierarchical level of formal controls. When technicalcontrol theory is applied to NPD formal control, SGS andPM are seen as operating at different hierarchical levels.PM can be described as feedback loops operating at alower hierarchical level; this, because goals pertain toindividual projects (or parts thereof) and for limited timeframes. Even though PM standards relate to the entireorganization and may be relevant for all projects, the
DECISION-MAKING CLARITY AND INNOVATION PERFORMANCE J PROD INNOV MANAG 4332013;30(3):430–447

specific instruments used (e.g., work breakdown struc-tures, milestones, and cost planning) are determined andapplied for each individual project. In contrast, SGSincorporates longer term strategic goals, which aredefined for the collectivity of NPD projects and originateat higher organizational levels. SGS focuses on projectselection and project interdependencies. As such, SGSinstruments such as project assessment and prioritizing,gate meetings, and the establishment of an overall NPDprocess are generally applied at the NPD program level.
Development of Hypotheses
In this study, NPD process control is viewed in terms oftwo formal processes—PM and the SGS—which consti-tute the central forms of formal control in achievingDMC and ultimately NPD performance for the firm. Thisunderlying model is presented in Figure 2, and hypoth-eses are developed and discussed below.
Performance in NPD
Clear goals and transparent decision-making are amongmanagement’s primary tools for keeping NPD projects onschedule, within budget and aligned with strategic goals(Eisenhardt and Tabrizi, 1995; Thieme, Song, and Shin,2003). DMC ensures that involved parties understandcollectively both what they are required to do and whatthey are trying to achieve. This creates ownership andsupport, limits deviations from project goals (Salomoet al., 2007), and eases coordination of cross-functionalinput (Lynn, Reilly, and Akgun, 2000; Tessarolo, 2007;Turner and Makhija, 2006). Moreover, DMC enhancescoordination and reduces conflict within NPD teamsbecause of shared goals and common operating norms,
and this is positively related to efficiency and effective-ness (Hoegl and Gemünden, 2001; Hoegl and Parboteeah,2006). The more concrete and transparent the goals, cri-teria, decisions, timelines, hurdles, and responsibilities,the more motivated the NPD team members and the betterthe coordination of the multifunctional innovation process(Shenhar, Tishler, Dvir, Lipovetsky, and Lechler, 2002;Thieme et al., 2003). Based on this, it is hypothesized:
H1: DMC is positively related to NPD programperformance.
Impact of SGS and PM
Applying organizational control theory, a key outcome ofthe use of formal control is the reduction of informationasymmetries across organizational members (Jaworskiand Macinnis, 1989). Because formal control implies aplanned NPD process, including guidelines and reviews,this offers the project personnel a sense of the overallpicture, reducing ambiguity about required activities,timelines, and goals (Tatikonda and Montoya-Weiss,2001; Thieme et al., 2003). Such formalization reducesprocess variance (Benner and Tushman, 2003) and pro-vides managerial discipline and direction (Lewis, Welsh,and Dehler, 2002). More specifically, control systemssuch as PM and SGS make tacit organizational routinesmore explicit (Brown and Duguid, 2001) by generating acognitive model of organizational activities. A payoff,therefore, of applying PM and/or SGS is that theypromote DMC such that team members understand thedecision-making process and the criteria used duringproject selection, development, and completion.
H2a: PM is positively related to DMC.
H2b: An SGS is positively related to DMC.
ProgramInnova veness
PM: ProjectManagement
DMC: Decision-making Clarity
SGS: Stage-and-gate-type System
Control Variables
NPD Performance
H2a (+)
H2c (+)
H2b (+)
Rela onship of interest
Rela onship included for model completeness
H3a (–)
H3b (–)
H3c (+)
H1
Figure 2. Conceptual Model and Hypothesized Relationships
434 J PROD INNOV MANAG C. SCHULTZ ET AL.2013;30(3):430–447

Technical control theory highlights both the differencebetween lower/higher level control loops and their inter-action. Because lower level controls (i.e., PM) are viewedas complementing higher level SGS, PM can be seen asa means to achieving program-level goals. This notionof control system complementarity is supported byresearchers who note that different types and combina-tions of controls are frequently deployed together (Bisbeand Otley, 2004; Kirsch, 1996; Maruping, Venkatesh, andAgarwal, 2009). Indeed, during one or more phases of anSGS controlled innovation process, particularly when thisis lengthy and complex—e.g., new product design orglobal launch—PM techniques are usually also needed tomeet specific task-related objectives, budgets and time-lines, critical paths, and review points (Cooper, 2008). Assuch, PM can been seen as an essential complement toSGS, where the efficacy of the latter largely depends onthe proficiency of the lower level control system.
H2c: The impact of SGS and PM on DMC is stronger ifboth types of formal control systems are applied.
Impact of NPD Program Innovativeness
Although the previous three hypotheses suggest that for-malized NPD controls have a positive impact, researchsuggests that the degree of NPD innovativeness maymoderate the formalization–performance relationship.On the positive side, Shenhar et al. (2002) reveal thatdetailed project guidance is especially important forcomplex projects involving high degrees of uncertainty;Filippini, Salmaso, and Tessarolo (2004) see formaliza-tion as positively linked to NPD exploration, and Ettlieand Elsenbach (2007) find that firms using formalizedSGS have more aggressive NPD program. Tatikonda andMontoya-Weiss (2001) and de Brentani (2001) show thatprocess formality positively impacts project operationaloutcomes, irrespective of technical uncertainty; andGriffin (1997) finds no influence of product complexityon the relationship between process formality and timefrom idea to market launch.
Evidence of positive/neutral effects of formalizationnotwithstanding, routines and capabilities based on highlystructured control systems have also been described innegative terms as “core rigidities” (Leonard-Barton,1992) or “liabilities” (Jansen, van den Bosch, andVolberda, 2006; Sethi and Iqbal, 2008). Particularly forradical innovation, detailed project planning has beenfound to be counterproductive (Lewis et al., 2002; Songand Montoya-Weiss, 1998). This is because formalizationtends to eliminate variation, leading to a focus on incre-mental NPD (Hackman and Wageman, 1995). In other
words, when highly structured processes such as PM areused, NPD teams tend to develop skills that are relevantfor dealing with innovation problems that are closelylinked to existing organizational knowledge and capabili-ties. Radical innovations, however, usually depart fromthe status quo causing the exclusive application of suchskills to have a negative effect. Also, short-term perfor-mance criteria—for example, meeting the demands ofexisting customers and technologies—are less relevantfor radical innovations that target new markets and/orhave very different technological bases. Hence, while therepetitious application of streamlined organizational con-trols reduces development costs and time-to-market forincremental new products, they typically are ambiguousand often misleading when innovations are of a radicalnature with high levels of uncertainty and very divergentrequirements (Levinthal and March, 1993).
Based on the above, in this study, it is hypothesizedthat formal controls—both PM and SGS—are moreeffective when applied to relatively stable NPD settingswhere teams are operating under preestablished routinesand relatively low levels of uncertainty. This negativemoderation effect, however, is likely to be weaker forSGS; this, because SGS is a higher level approach toguiding NPD activities and achieving long-term goals,allowing for some flexibility when applied to radicalinnovations.
H3a: The positive relationship between PM and DMC isweakened when the NPD program has a higher degree ofinnovativeness.
H3b: The positive relationship between SGS and DMC isweakened (but less than for PM) when the NPD programhas a higher degree of innovativeness.
Technical control theory stresses the idea that whencomplexity and task duration are high, lower level controlloops should be complemented with formal controls on ahigher organizational level. Without higher level guid-ance, interdependencies among projects and organiza-tional requirements, as well as long-term strategic goals,are likely to be ignored. Moreover, it is essential to lever-age ideas across the organization in order to foster syn-ergies between NPD teams, and this requires additionalinformation channels and greater coordination of NPDtasks. Researchers provide evidence that an interactivecontrol system that enhances communication and col-laboration, as well as the formal control of NPD, is morerelevant (Bisbe and Otley, 2004) and leads to increasedperformance (Maruping et al., 2009) in situations of highcomplexity and newness. As such, project- and program-level controls should interact when NPD program inno-
DECISION-MAKING CLARITY AND INNOVATION PERFORMANCE J PROD INNOV MANAG 4352013;30(3):430–447

vativeness is high. In line with this, it is proposed that inhighly innovative NPD scenarios, SGS and PM instru-ments are less effective when used exclusively. Instead, acombined control system is called for in which lower andhigher level controls are interlinked and reinforce eachother.
H3c: The combined impact of PM and SGS on DMC ispositive when the NPD program has a higher degree ofinnovativeness.
Research Method
Data Collection and Sample
A cross-sectional sample assessing the issues of manag-ing NPD programs of technology-oriented firms inDenmark and Austria was used. Only firms active inmarkets for at least five years were targeted. Potentialparticipants were identified using industry directories,participant lists of industry conferences, and member-ships of professional organizations. Firms were contactedby direct mail to senior management, explaining theobjectives, respondent benefits, and procedures of thestudy. Interested firms were contacted by phone to verifythat they met the participation requirements. Firms nomi-nated an employee responsible for coordinating data col-lection within the firm. This coordinator identified keyinformants, including at least one senior manager and sixemployees actively involved in the NPD program. Fordata collection, three different groups of respondents pro-vided information about the NPD management aspectsand the control variables used for the study. By question-ing top management (chief executive officer [CEO])about NPD program performance; heads of research anddevelopment (R&D) or chief technology officers (CTOs)about SGS applications, PM, NPD program innovative-ness, and covariates; and NPD team members aboutDMC; common source bias was avoided. All preselectedrespondents were contacted by email and provided withan access code to an online questionnaire. The finalsample included 1274 respondents from 162 firms, whereeach firm had at least three different types of respondentswith no missing values with regard to the item list. Assuch, 162 respondents held senior management positions(CEO level), 162 were heads of R&D (or CTOs), and 950were involved at the NPD team level.
Data Analysis and Measures
To measure the constructs of interest, existing andalready validated scales were applied where possible;
while for DMC, original scales were developed for thisstudy. Furthermore, the research controlled for relevantcompany characteristics such as industry, firm size,technological/market turbulence, as well as the strategicorientation of the firm. All questions used a 5-pointLikert-type scale (1 = “strongly disagree” to 5 =“strongly agree”) and are summarized in Appendix A.The constructs comprising the theoretical model and thecontrol variables (covariates) are described below.
NPD performance. The study targets for-profit firms;hence, a construct describing financial and market perfor-mance was considered appropriate as an ultimatemeasure of NPD performance. Four items were used tomeasure the performance of the NPD program over thelast three years, capturing the effect of NPD efforts onprofitability, market share, sales, and net present value(Griffin and Page, 1993; Manion and Cherion, 2009).These items were assessed by senior management infor-mants (CEOs), who were considered to have the bestoverview of the innovation program with regard to overallNPD performance.
DMC. The literature review indicated that no com-monly accepted and validated scale exists for assessingtransparency of NPD-related decisions. This called forthe development of a new set of interrelated items. Theliteratures used for this purpose relate to teamworkquality and coordination effects in project teams. Thenew construct was built using scales developed by Hoegland Gemünden (2001) (coordination dimension of team-work quality), Hoegl and Parboteeah (2006) (goal settingwithin teams), as well as items from the process manage-ment construct developed by Salomo et al. (2007). Theset of items was subjected to recommended scale devel-opment procedures, including assessment of face validityby industry and academic experts. This resulted in aDMC scale of five items covering three main aspects:goal and decision criteria clarity, decision process clarity,and decision dissemination clarity. Team members wereconsidered to be the appropriate respondents for DMC.
SGS. In order to identify the intensity of SGS appli-cation within the firm, several well-established scaleswere used (Cooper, Edgett, and Kleinschmidt, 2003; deBrentani, 2001; Griffin, 1997; Kleinschmidt et al., 2007).To this end, information was obtained from the head ofR&D (or CTO) as these informants were considered tohave the best overview of the existence and functioningof well-defined SGS phases, criteria, and decision points.
436 J PROD INNOV MANAG C. SCHULTZ ET AL.2013;30(3):430–447
PM. In order to measure the proficiency of PM withinthe firm, the study used several well-established factorsrelated to project planning. Previously used measuressuch as activities related to milestone plans, and resourceand cost plans are applied (Shenhar et al., 2002). Further,the degree of integration of PM and tools for managinginnovation projects was assessed (Tatikonda andMontoya-Weiss, 2001). Here also, data were obtainedfrom heads of R&D (or CTOs).
NPD program innovativeness is concerned with theaverage innovativeness of the firm’s NPD effort duringthe three years prior to participating in the study. Sub-stantial work has already gone into scale development forthe product innovativeness construct. The literature sug-gests a multi-item and multidimensional conceptualiza-tion of degree of innovativeness (Calantone, Chan, andCui, 2006; Danneels and Kleinschmidt, 2001; Garcia andCalantone, 2002). Thus, a scale was developed composedof items covering four different facets of innovativeness:technology, market, firm-internal, and environment-related factors. Compared with previous studies, whichtypically cover only two, at most three, facets, the scaleused in this study is enriched with a fourth, environment-related, dimension, permitting a more comprehensiveassessment of degree of innovativeness—ranging fromincremental to radical—in the development of new prod-ucts. Overall, 12 items are used, with factor analysissuggesting a second-order solution for the measurementmodel and the regression analysis. Data for the innova-tiveness construct were provided by R&D leaders (CTOs)who were the most knowledgeable in this regard and hadthe expected oversight of the firm’s NPD activities.
Covariates (control variables). Given the focus of thestudy (i.e., efficacy of PM and SGS), from a contingencyperspective certain conditions outside the control of thefirm can be seen as impacting the relationship betweenformal control and DMC. To this end, five covariates areincluded in the model. First, to control for national originof the firm, a dummy variable is used to account forresponses from two different countries (firms may showdifferent innovation and/or response patterns because ofcultural or infrastructural differences). Second, firms indifferent industries may vary in terms of innovation per-formance as well as norms and professional standardswith respect to the degree of process formalization. Firmswere identified as part of machinery manufacturing,process, or knowledge-intensive service industry. In theregression analysis, the latter two are identified usingdummy variables leaving machinery manufacturing asthe reference group. The third covariate deals with the
environmental characteristics of market and technologyturbulence. Because turbulence restricts the ability ofmanagers to interpret market- and technology-relatedinformation, this increases the probability of unexpectedevents occurring and that NPD developments follow anonlinear, less predictable path. In other words, strongturbulence may limit the applicability of formal controls,and observed relationships between formalization andDMC may in reality be the result of environmental tur-bulence (Calantone and Garcia, 2003). The fourth cova-riate controls for the NPD strategic orientation of thefirm. A measure of proactiveness in terms of the firm’sextent and likelihood of being ahead of competitors in theexploration and implementation of new business oppor-tunities is introduced to the model. The study uses theproactiveness dimension of Venkatraman’s (1989) strate-gic orientation scale as an indicator of the “prospector”/“defender” strategy types developed by Miles and Snow(1978). These may differ with regard to NPD objectives,level of risk-taking, degree of innovativeness, and extentand breadth of market involvement (Lo and Wang, 2007).A fifth contingency that may be relevant in the context offormal control is firm size. Because larger companies tendto require more elaborate formal organizational struc-tures, this makes it more likely that they show strongerlevels of NPD process formalization than smaller firms(Damanpour, 1996). Number of employees is used as anindicator of firm size. To limit outlier effects of very smallor very large firms, respondent firms are categorized interms of six categories (1 � 10 to 6 > 1000 employees).
Analysis and Results
Psychometric Properties of the Scales
Five constructs within the model and three multivariatecontrol factors were assessed for reliability using Cron-bach’s alpha. All alpha scores are in line with therecommended cutoff values of .70 to .80 (Hair andAnderson, 1998). The scales were further subjected toprincipal components analyses in which only the firsteigenvalues were greater than one, indicating constructunidimensionality (Ahire and Devaraj, 2001). Theprogram innovativeness factor was designed as asecond-order construct—modeling market-, technology-,internal-, and environment-related facets separately—inorder to reflect its multidimensional nature. The fourinnovativeness dimensions were aggregated by calculat-ing the mean of all four scores. Exploratory factoranalysis (varimax rotation), which included all itemscomprising the measurement model, showed no cross
DECISION-MAKING CLARITY AND INNOVATION PERFORMANCE J PROD INNOV MANAG 4372013;30(3):430–447

loadings higher than .40 (except between the subdimen-sions of the innovativeness construct). Convergent valid-ity was demonstrated by a confirmatory factor analysisusing LISREL. First, the basic model containing PM,SGS, DMC, and NPD performance was tested. All stan-dardized factor loadings are highly significant and above.5. Values obtained for both the comparative fit index(CFI: .95) and the standardized root mean square residual(SRMR: .054) are well within the bounds recommendedby Hu and Bentler (1998) and is also supported by ac2/d.f. ratio of 1.48. In a second step, NPD programinnovativeness was added to the model. Although modelfit decreases slightly (CFI: .90; SRMR: .080; c2/d.f.:1.50), reflecting the multidimensional nature of innova-tiveness, the values support convergent validity across themeasurement model. To test for measurement equiva-lence between Austria and Denmark, a structural modelwas specified in which all relationships—factor loadings,error variances, and factor covariances—were con-strained to be equal in both samples (Myers, Calantone,Page, and Taylor, 2000). The constrained model fit wascompared with the fit of a model that allows for all therelationships to vary freely. This was carried out for allconstructs used in the study. None of the chi-square dif-ferences are significant at the p < .05 level (NPD perfor-mance: c2diff. = 4.57/d.f. = 3; PM: c2diff. = 5.8/d.f. = 3;SGS: c2diff. = 5.21/d.f. = 3; DMC: c2diff. = 4.93/d.f. =4; innovativeness: c2diff. = 18.52/d.f. = 12). Given theassumption that respondents from Denmark and Austriahave a similar understanding of NPD program process
control and performance measures, the tests show fullmeasurement invariance, allowing for the combination ofthe two subsamples of participating firms. Table 1 pro-vides the correlation matrix of all model constructs, theirmeans, and standard deviations, and Appendix A providesdetailed information on validity and reliability.
Model Analysis and Results
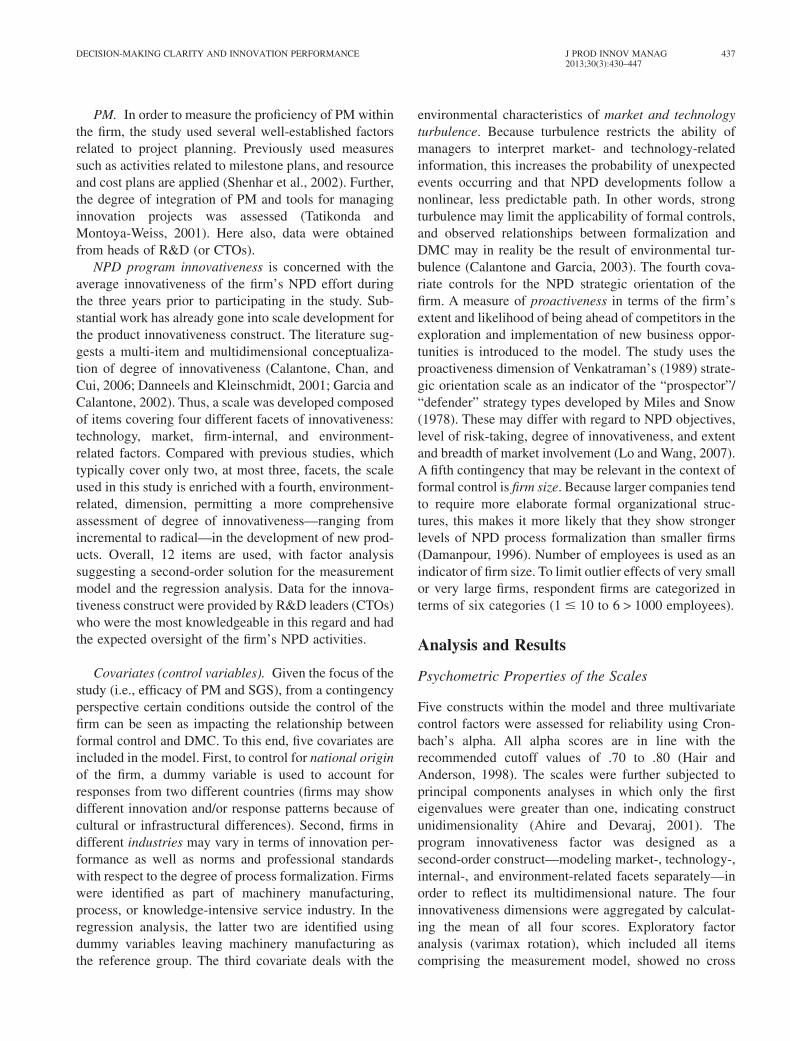
Hypotheses were tested with two hierarchical ordinaryleast squares regressions. The first set assesses thehypothesized effects on NPD program performance (seeTable 2), and the second set deals with the effects onDMC (see Table 3). In Table 3, model 1 shows the regres-sion of DMC on the control variables; model 2 includesthe direct hypothesized effects of PM and SGS; and inmodel 3, the moderation effect of program innovativenessis introduced. To test the moderator impact on the effectsof SGS and PM on DMC, the multiplication terms of thestandardized variables are used (Aiken and West, 1991).
Effects on NPD program performance. The first set ofregression analyses assesses the impact of the indepen-dent variables and the covariates on overall NPD programperformance. As the model fit is greatest for model 3, wereport these results. Table 2 reveals that three covariatessignificantly influence NPD outcome. Performanceincreases with higher levels of technological turbulence(b = .124, p < .05). This is in line with other findings(Calantone et al., 2010) and may be explained by: (1) the
Table 1. Correlations, Means, and Standard Deviations
1 2 3 4 5 6 7 8 9 10 11 12 13 Mean SD
1. NPD performance — 3.84 .632. Decision-making
clarity.38** — 3.64 .60
3. Project management .33** .46** — 3.41 1.014. Stage-and-gate-type
system.29** .47** .55** — 3.45 1.27
5. Programinnovativeness
.32** .20* .38** .17* — 2.54 .69
6. Country (1: Austria) -.30** .09 -.15 .08 -.29** — .61 .497. Process industry .07 .07 -.01 .06 .00 .02 — .25 .438. Service industry -.05 -.23** -.19* -.34** .03 -.14 -.46** — .39 .499. Machinery
manufacturing-.01 .17* .20* .29** -.03 .13 -.43** -.60** — .36 .48
10. Firm size .16* .28** .42** .34** .02 -.06 .04 -.24** .21** — 3.85 1.4511. Market turbulence .00 -.14 -.13 -.19* .25** -.12 .07 .10 -.16* -.20** — 2.59 .7912. Technology turbulence .21** .03 .13 -.07 .44** -.12 -.09 .05 .04 -.07 .25** — 2.95 .8413. Proactiveness .39** .24** .25** .30** .38** -.26** .06 .00 -.06 .00 .06 .11 — 3.58 .79
n = 162; * p � .05, two-tailed; ** p � .01, two-tailed.NPD, new product development.
438 J PROD INNOV MANAG C. SCHULTZ ET AL.2013;30(3):430–447
need for formal control systems to deal with the uncer-tainty and radical nature of technology innovation activi-ties in this type of NPD setting; and (2) the likelihood thatbeing part of an environment where there is active inno-vation pays off economically. Also, proactiveness, which
is used as a plausible indicator of prospector versusdefender status of the firm, positively impacts overallNPD program performance (b = .169, p < .01, constantover all three models). This suggests that a stronger, moreoutgoing, strategic orientation is associated with greater
Table 2. Effects on NPD Program Performance
Dependent: NPD Performance Model 1 Model 2 Model 3
Intercept 2.57 (.344)** 2.35 (.348)** 1.73 (.381)**Country (1: Austria) -.267 (.095)** -.280 (.095)** -.327 (.93)**Process industry .079 (.117) .115 (.115) .105 (.111)Service industry -.034 (.106) .047 (.109) .068 (.105)Machinery manufacturing (Ref.)
Market turbulence -.055 (.059) -.034 (.059) -.025 (.057)Technology turbulence .137 (.055)* .132 (.055)* .124 (.053)*Proactiveness .261 (.057)** .198 (.061)** .169 (.059)**Firm size .059 (.032) .025 (.034) .016 (.033)
Project management (PM) .063 (.058) .016 (.058)Stage-and-gate-type system (SGS) .082 (.046) .051 (.045)Decision-making clarity (DMC) .290 (.083)**F 7.59 6.96 7.93DF 7.59** 3.80* 12.08**R2 .257 .292 .344Adjusted R2 .223 .250 .301DR2 .223 .027 .051
Unstandardized beta coefficients; standard errors; n = 162 firms.* p � .05; ** p � .01 (two-tailed tests).NPD, new product development.
Table 3. Effects on Decision-making Clarity
Dependent: Decision Making Clarity (DMC) Model 1 Model 2 Model 3
Intercept 2.56 (.342)** 2.17 (.330)** 2.29 (.314)**Country (1: Austria) .165 (.094) .174 (.091) .204 (.087)*Process industry -.027 (.116) .028 (.109) .070 (.104)Service industry -.200 (.106) -.079 (.103) -.074 (.098)Machinery manufacturing (Ref.)
Market turbulence -.068 (.059) -.035 (.057) -.007 (.055)Technology turbulence .047 (.055) .011 (.056) -.004 (.053)Proactiveness .204 (.057)** .085 (.059) .066 (.057)Firm size .096 (.032)** .033 (.032) .035 (.031)
Project management (PM) .152 (.057)** .132 (.055)*Stage-and-gate-type system (SGS) .100 (.044)* .088 (.042)*PM ¥ SGS -.033 (.046) .055 (.051)Program innovativeness .061 (.078) .061 (.074)PM ¥ innovativeness -.135 (.044)**SGS ¥ Innovativeness .014 (.054)PM ¥ SGS ¥ innovativeness .092 (.036)*F 5.22 6.37 6.97DF 5.22** 6.97** 6.57**R2 .192 .318 .399Adjusted R2 .155 .269 .342DR2 .155 .114 .073
Unstandardized beta coefficients; standard errors; n = 162 firms.* p � .05; ** p � .01 (two-tailed tests).
DECISION-MAKING CLARITY AND INNOVATION PERFORMANCE J PROD INNOV MANAG 4392013;30(3):430–447

success in NPD. Further, the results show that firmslocated in Denmark have more successful NPD programsthan firms in Austria (b = -.327, p < .01). Reasons forthis result could be manifold. One might speculate thatAustrian managers are more conservative in theirresponse style. Hence, it is important to control forcountry difference, as is done in this study.
The results show that overall NPD performance is notdirectly influenced by the implementation of formalcontrol mechanisms. Instead, it is transparent decision-making (DMC) that has a significant effect (b = .290,p < .001). In total, model 3 explains 30.2% of the vari-ance of NPD performance, supporting H1 at the .001level. No significant direct effects of PM and SGS onNPD program performance were found. Thus, integratingthe effect of DMC significantly increases the fit of theregression model (by 5.1%), supporting the hypothesis(H1) that DMC is an immediate outcome of formalcontrols.
Because of the multifaceted nature of the NPD perfor-mance construct (sales, market share, profitability, andnet present value), tests for possible differences betweenthose four aspects were carried out. The results arerobust. For all four alternative dependent variables, DMCproved to be a significant driver of NPD performance,although its impact is slightly smaller (p < .05) for thefinancial performance elements (profitability, net presentvalue). The strongest effect is for an increase in marketshare (b = .348, p < .001). Moreover for market share,SGS has a direct NPD performance effect (b = .132,p < .05); this, however, disappears after incorporatingDMC into the regression model. As such, formal controls,and DMC as their immediate outcome, are of specificrelevance for market-related NPD objectives. A reasonfor this might be that cross-functional collaborationbetween marketing and technology is supported by trans-parent decision processes and shared NPD goals.
Effects on DMC. Table 3 presents the results ofthe second set of regression equations, with DMC as theimmediate outcome of the independent variables. Forthe full model (model 3), incorporating the effect of thetwo formal control systems (PM and SGS) and ofthe moderator (innovativeness) interaction effect, onlycountry-of-origin is significant as a control variable. Thus,for the full DMC model, except for country-of-origin, allother control variables are not significantly related, givingsupport to the underlying model of this study.
Further, the results show that applying SGS and PMhave significant positive effects on DMC (b = .088,p < .05; b = .132, p < .05), supporting H2a and H2b. But,
contrary to expectations, no interaction effect was foundbetween the two types of control mechanisms (H2c;b = .055, p = not significant). The significant increase(7.3%) of the F-statistic and the explained variance inmodel 3, however, highlights the importance of includingNPD program innovativeness in terms of its interactioneffect. While program innovativeness has no significantdirect effect on DMC, it negatively moderates the effectof PM (b = -.135, p < .01), supporting H3a (see model 3,Table 3). In other words, PM influences DMC only ifinnovativeness is low. In the case of SGS, there is nosignificant moderation effect. Therefore, contrary to H3b,SGS formal control continues to work for firms operatingat higher degrees of innovativeness. The flexible nature ofthe higher level SGS control loop may allow for an adap-tation of goals and activities relevant to more radicalinnovations. The results also provide support for H3c(b = .092, p < .05), highlighting the importance of inter-linked control systems, where lower organizational levelPM interacts with higher level SGS. In such scenarios,PM and SGS processes do not substitute for each otherbut function as reenforcing complements.
Supporting Analyses
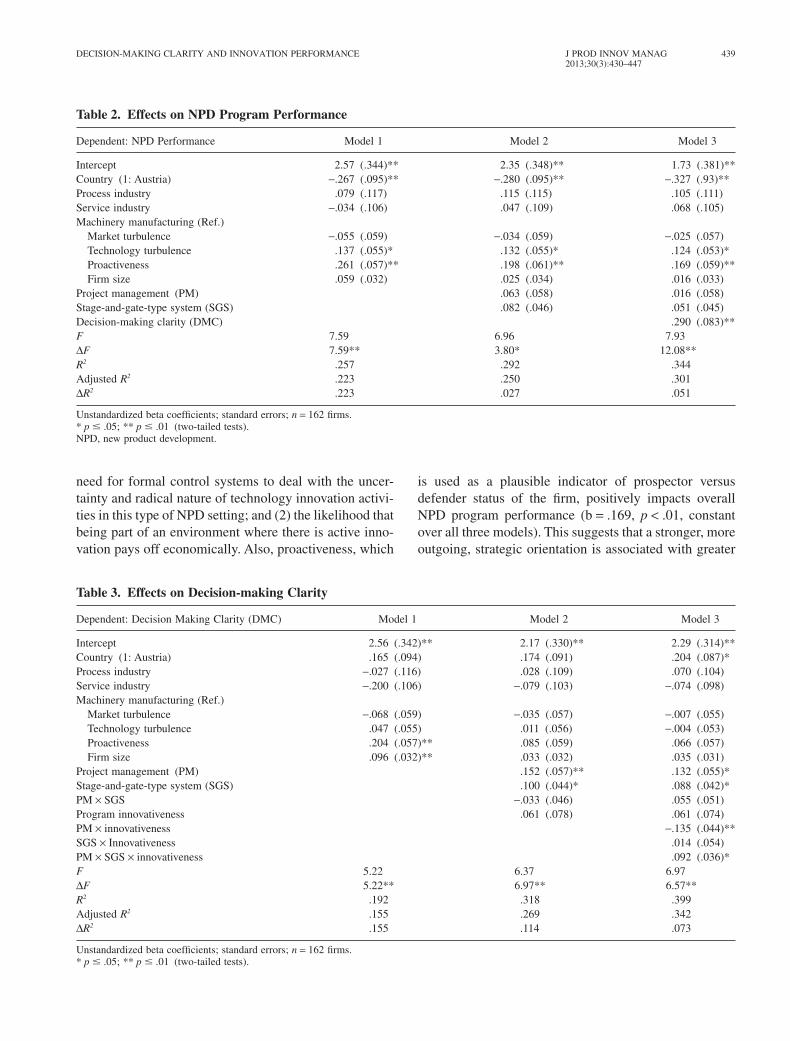
To bolster the results of the regression analyses regardingthe moderating effects of program innovativeness (H3aand H3c), the relationships are further analyzed usingpost hoc probing of the simple slopes (Aiken and West,1991) together with a graphic illustration of the impact ofinnovativeness on the marginal effect of formal controls(Brambor, Clark, and Golder, 2006). This offers supportand further clarification for the results of the previousanalysis.
Figure 3 displays the simple slopes for the three-wayinteraction effect between PM, SGS, and innovativenesson DMC, using only low and high values for the threeindependent variables. The left side shows the standard-ized DMC values for low innovativeness levels (one stan-dard deviation [.69] below the mean of 2.54 [i.e., 1.85])and the right hand side for high levels of innovativeness(one standard deviation above the mean, i.e., 3.23). Thediamonds (squares) indicate a high (low) level of PM, andwhite (black) filling indicates a high (low) level of SGSapplication.
If NPD program innovativeness is relatively low (leftside, Figure 3), DMC increases if either PM or SGS isused, with a somewhat higher impact for PM. Using acombination of both types of formal controls (whitediamond) does not significantly increase clarity. In con-trast, if innovativeness is high (right side), only the
440 J PROD INNOV MANAG C. SCHULTZ ET AL.2013;30(3):430–447

interlinked control system—PM and SGS combined—leads to enhanced DMC. All other formal control systemscenarios show notably lower effects, not significantlydifferent from each other. These results are in line withH3c.
Comparing the simple slopes for only two values ofinnovativeness contains limited information about themarginal effects of formal controls for the full continuumof innovativeness (Brambor et al., 2006). Specifically,data about the threshold values of program innovative-ness are missing that allow SGS and PM instruments tobe effective. To interpret the moderation effects for theentire innovativeness spectrum, however, might gobeyond the available data because it is unlikely that alllevels of innovativeness are equally represented in thesample, which would be reflected in differing standarderrors. To cope with this limitation, the moderationeffects are substantiated by illustrating the influence ofNPD program innovativeness on the marginal effects ofPM and of the two control systems combined (interactionterm), including the 95% confidence intervals. This ispresented in Figure 4.
Figure 4 also supports H3c—that is, PM and SGS arenot independent, but positively complement each other,for higher degrees of NPD program innovativeness. Inparticular, the (marginal) positive effect of PM on DMCis weakened at higher degrees of innovativeness (H3a).Its positive effect on outcome is limited to low levels ofinnovativeness and complexity. Beyond the threshold of2.7 (scale from one to five, see upper diagram), no sig-nificant positive effect can be detected. The lowerdiagram in Figure 4 strongly indicates that for higherdegrees of innovativeness, the interaction effect of PM
and SGS becomes increasingly significant. In otherwords, when firms are involved in more innovative NPDprograms, PM control systems should be combined withhigher organizational level SGS processes.
Summary of Results
Five of seven hypotheses are supported by the analysis;only two are rejected (see Table 4). As expected and insupport of organizational control theory, DMC is found tobe a significant and full mediator of the impact of NPDformal control systems on NPD program performance(H1, H2a, H2b). The data do not support a reinforcingeffect of SGS and PM when NPD program innovative-ness is not considered (H2c), and the effect of SGS onDMC is not found to be weakened by higher levels ofinnovativeness (H3b). In effect, the more flexible type ofcontrol applied through SGS appears to work at bothlower and higher levels of NPD program innovativeness.As shown further (H3c), it is the combined effect of SGSand PM when applied to NPD programs that are at theradical end of the innovativeness spectrum that accountfor the best results in terms of achieving DMC.
1
0,8
0,6
0,4
0,2
0
Dec
isio
n-m
akin
g Cl
arit
y
–0,2
–0,4
–0,6
–0,8
–1Low Innova veness
(1) High PM, High SGS(3) Low PM, High SGS
(2) High PM, Low SGS(4) Low PM, Low SGS
High Innova veness
Figure 3. Three-way Interaction Effect of Project Manage-ment (PM), Stage-and-gate-type System (SGS), andInnovativeness
95% Confidence Interval
Significant Effect
0,8
0,6
0,4
0,2
Mar
gina
l Eff
ect o
f Pro
ject
Man
agem
ent
on D
ecis
ion-
mak
ing
Clar
ity
Program Innova veness
0
–0,2
–0,4
–0,61,0 1,5 2,0 2,5 3,0 3,5 4,0 4,5 5,0
95% Confidence Interval
Significant Effect
0,8
0,6
0,4
0,2
Mar
gina
l Eff
ect o
f Int
erlin
ked
Cont
rol S
yste
ms
on D
ecis
ion-
mak
ing
Clar
ity
Program Innova veness
0
–0,2
–0,41,0 1,5 2,0 2,5 3,0 3,5 4,0 4,5 5,0
Figure 4. Marginal Effects of Formal Controls on Decision-making Clarity
DECISION-MAKING CLARITY AND INNOVATION PERFORMANCE J PROD INNOV MANAG 4412013;30(3):430–447

Discussion, Implications, and Limitations
The results of this research lend support to the theoreticalframework, allowing for the development of an interac-tive model that distinguishes between different types ofNPD control systems, the role of DMC and performance,and the moderating factor of NPD program innovative-ness. In this regard, the study makes a number of contri-butions. First, by combining concepts from differentfields of knowledge—i.e., NPD, organizational controltheory, and technical control theory—it provides newinsight to the question of formal control in the manage-ment of NPD programs. Second, using organizationalcontrol theory allows for the inclusion of a more relevant,intermediate, outcome variable—DMC—which mediatesthe impact of NPD control on NPD performance. Third,technical control theory introduces the idea of hierarchi-cal control loops involving different objectives, timelines,and personnel at higher and lower organizational levels.This offers a more detailed view of NPD program controlas well as relevant managerial implications. A furthercontribution derives from the inclusion of two distincttypes and levels of formal control—SGS and PM—whichin past research were either handled separately or notdifferentiated, leading to ambiguous results regardingtheir impact on NPD performance. Incorporating bothsystems in one model shows that each plays anessential, but different, role in NPD. Fourth, includinga key contingency—NPD program innovativeness—contributes to ensuring greater realism and also to pro-viding insight about the role of formal controls, takinginto account the degree of complexity and radicalness ofthe NPD program. Fifth, the research shows that DMCmediates the impact of formal control systems on NPDprogram performance, that PM and SGS each contributeto DMC, and that NPD program innovativeness moder-ates the impact of the control systems. In other words, incontrast to past studies that took a more generalized viewof both form of control and performance in NPD, the
model developed and tested in this study contributes toopening the “black box” by shedding more light on theframework in which a firm’s control systems lead tosuperior performance.
Impact of DMC on NPD Program Performance
The results support H1 that DMC has a significant impacton performance and that the impact of the two controlsystems on performance is mediated by this intermediateoutcome variable. Indeed, relying on a direct control–performance relationship may be what has led to incon-sistent results in past studies. From a theoreticalstandpoint, this means that in studies involving the effi-cacy of formal controls in NPD, research models shouldevaluate outcome by using DMC as the dependent vari-able. This offers a clearer, more easily determined, andless time-lagged measure of success for evaluating theefficacy of a firm’s NPD processes and ultimately NPDprogram outcome.
Impact of NPD Control Systems on DMC
The results lend support to H2a and H2b as each controlsystem identified in this study is significantly and posi-tively related to DMC. In other words, having differenttypes of control systems in place plays a positive role interms of achieving clarity regarding the NPD effort atdifferent organizational levels within the firm.
According to the results, H2c is not supported, indi-cating that there is no interaction effect between SGS andPM. In other words, when not accounting for innovative-ness, the two types of formal control work autonomouslyand may be seen as broad substitutes. In cases of exclu-sive application of PM, a tacit overall organizational planmay provide sufficient guidance to determine under whatcircumstances this lower level control system is relevant.NPD teams know how to deal with their tasks withouthigher level guidance from a formal control system such
Table 4. Summary—Results of Hypothesis Testing
Hypothesis Description Finding
H1 Decision-making clarity (DMC) increases NPD performance SupportedH2a Project management (PM) increases DMC SupportedH2b Stage-and-gate-type system (SGS) increases DMC SupportedH2c PM and SGS effects reinforce each other within a complementary control system Not supportedH3a NPD program innovativeness weakens the positive relationship between PM and DMC SupportedH3b NPD program innovativeness weakens the positive relationship between SGS and DMC Not supportedH3c NPD program innovativeness strengthens the complementary function of PM and SGS with regard to DMC Supported
NPD, new product development.
442 J PROD INNOV MANAG C. SCHULTZ ET AL.2013;30(3):430–447

as SGS. In other cases, SGS alone is applied. Given itshigher level nature, the strategic plan and the task-relatedphases and outcomes integral to the application of thistype of NPD process are more concrete and provide theneeded guidance. Thus, managers and NPD teams mayrely primarily on the SGS and implement PM-type con-trols on an informal basis when needed. This lack ofsupport for H2c may also be due to unobserved variablesnot included in the regression (e.g., the moderation effectof NPD program innovativeness). In addition, otherpotential moderators beyond the scope of this researchmay be relevant. For example, in cases where PM func-tions on the basis of tacit knowledge of the strategic andorganizational goals (i.e., no SGS), but where there isactive senior management involvement (SMI) in NPDprojects. This might interfere with the relevance of inter-linked control systems because higher level goals areautomatically considered, making explicit guidance fromSGS less necessary.
Moderating Impact of Innovativeness
According to the findings, degree of NPD program inno-vativeness has no direct impact on DMC, but its interac-tion effect with the two types of NPD control systems issignificant and revealing. As expected, PM is negativelyaffected by innovativeness (H3a), indicating that in morecomplex and uncertain innovation environments, PMloses its efficacy in terms of DMC. In effect, its positiveimpact is limited to programs entailing low degrees ofinnovativeness. Because of PM’s adherence to strict,objective, and frequent “output control” results/criteria, itperforms well when dealing with relatively straightfor-ward and structured problems such as those relevantfor incremental NPD. But, PM lacks the flexibility andhigher level overview that ensure the creativity, newlearning, and adaptation required for NPD programs thatdeal with breakthrough or explorative projects. As such,the study provides evidence that by concentrating only onPM-type of formal control mechanisms, learning is actu-ally reduced (Pons, 2008; Sethi and Iqbal, 2008). Thismeans that for scenarios involving a higher degree ofinnovativeness, a PM-only type of control system shouldnot be used.
The need for flexibility and adaptation is reflected inthe results pertaining to SGS, which is not significantlynegatively impacted by higher degrees of innovativeness.Although this is contrary to expectations (H3b), it clearlydemonstrates the less severe influence of innovativenesson the efficacy of SGS-type control. Not finding anysignificant negative impact provides support for studies
that link the use of stage-and-gate-type processes to thesuccess of more innovative projects. In other words, ahigher level formal control system, such as SGS, contin-ues to work when used for NPD programs that are of amore radical nature.
The combined significant and positive interactioneffect of degree of innovativeness with PM and SGSsupports expectations (H3c). Thus the above conclusionsnotwithstanding, this finding confirms the importance ofusing a system of interlinked control mechanisms whendealing with more innovative NPD programs, wherelower level PM controls are combined with higher levelSGS processes. In this more complex, multisystemapproach to NPD control, SGS ensures the overall vision,new learning, creativity, and entrepreneurial actionneeded for handling the radical aspects of NPD projects,while PM deals with efficiency, timeliness, and costcontrol, where needed. In other words, in highly innova-tive scenarios, the NPD program is likely to be dynamicand in line with strategy changes occurring within thefirm. Here, explicit guidance provided by SGS becomesmore relevant; this, because PM cannot function effec-tively on the basis of an implicit, but changing, strategicplan. From a contingency perspective, therefore, theresults highlight that the efficacy of NPD control systemsdepend on the organizational context. While the exclusiveapplication of the lower level PM process no longerworks in explorative, radical innovation environments, itmaintains its value as a complementary mechanism thatreinforces the efficacy of the more flexible and higherlevel SGS approach (Levardy and Browning, 2009).Thus, for a higher degrees of innovativeness, PM andSGS are not substitutes but function as reenforcingcomplements (Cooper, 2008).
Managerial Implications
What does this mean for managers concerned with imple-menting or improving their firm’s system of formal NPDcontrol? One implication is that managers must distin-guish and appreciate the difference between the two typesof formal control relevant for NPD. Second, focusingmore specifically on the more immediate outcome oftransparency in decision-making is essential. Managerscan use DMC and the specific measures as applied in thisstudy as a proxy for the longer term, more ambiguous andmultidetermined, variable of overall NPD performance.Further, a primary factor to consider when planning sucha system is the degree of innovativeness of the NPDprogram. In companies where NPD entails only incre-mental projects, either PM or SGS can be used. And, if
DECISION-MAKING CLARITY AND INNOVATION PERFORMANCE J PROD INNOV MANAG 4432013;30(3):430–447

managers believe that the program will remain at this endof the innovativeness spectrum for the foreseeable future,a PM-type system is preferred because of its greatersimplicity, wider acceptance, lower cost, and greaterease of implementation. On the other hand, if the NPDprogram entails a higher degree of innovativeness or isexpected to move in that direction, using an SGS formalcontrol makes more sense. This is because when PMalone is implemented in such a program, the positiveimpact of the system quickly disappears while SGS main-tains its positive effect. When it comes to more radicalNPD, the results in this study underline the importance ofviewing the two types of control systems as playingcomplementary and reenforcing roles. Top performers arecompanies that use an interactive system including bothSGS and PM. But such a system is not something that isintroduced and implemented quickly. As noted, SGSemanates from higher organizational levels, includes theinvolvement of several functional groups, and also ofsenior managers who not only make the decision to installsuch a system, but act as key role-players in the hierar-chical feedback loop (e.g., establishing objectives, evalu-ating program results, championing radical ventures,etc.). Thus, SGS typically requires several years tobecome a well-functioning system of formal control(Cooper, 2008; Kleinschmidt et al., 2007; Schmidt andCalantone, 2002). PM mechanisms, on the other hand,can be installed relatively quickly and on demandbecause they are well understood and function primarilyat lower levels in the organization.
Limitations and Directions for Future Research
In this study, formal control mechanisms rooted in orga-nizational and technical control theory are applied. Otherresearch shows, however, that company performance isalso often influenced by informal or social controlmechanisms. Kleinschmidt et al. (2007) show that thefirm’s internal behavioral environment—for example,shared entrepreneurial values and norms, SMI, etc.—helps in explaining NPD success. Such internal socialcontrol dimensions might also play a role in the function-ing of formal NPD control systems and in DMC. Futureresearch, therefore, using the model applied in this study,could be extended to include social conditions such asSMI or organizational culture as a third type of NPDcontrol system.
DMC is shown to be an important mediator of theimpact of formal control systems on overall NPDprogram performance. However, other possible mediatorsmight be explored in future studies, i.e., the maturity of
several different NPD process steps (Kleinschmidt et al.,2007). For example, specific process activities (e.g.,up-front homework [Cooper, 2008]) might be performedmore effectively when formal control systems directattention to specific “norm” activities. Further, it is likelythat a more complex relationship exists where otherdimensions intervene to explain DMC’s outcome effect.DMC may enhance positive aspects like team cohesion,shared leadership, or motivational aspects—but also pos-sible negative aspects such as ability to handle thedynamics of changing corporate objectives—which inturn are linked to NPD program performance. Futureresearch might focus specifically on dealing with theDMC–performance connection, allowing for moreinsight into the mechanisms that are at work in thisrelationship.
Only one moderator—degree of NPD programinnovativeness—is used. But, market- and technology-turbulence, which are used in this study as control vari-ables, have been found by other researchers (e.g.,Calantone et al., 2010) to be significant moderatorsimpacting NPD program outcome. Thus, other possiblemoderators such as environmental turbulence or firminternal behavioral environmental (e.g., resource commit-ment for the NPD program, strategic orientation)(Kleinschmidt et al., 2007) could be considered in futureanalyses.
References
Ahire, S. L., and S. Devaraj. 2001. An empirical comparison of statisticalconstruct validation approaches. IEEE Transactions on EngineeringManagement 48 (3): 319–29.
Aiken, L. S., and S. G. West. 1991. Multiple regression: Testing andinterpreting interactions. Thousand Oaks, CA: Sage Publications.
Bart, C. K. 1991. Controlling new products in large diversified firms: Apresidential perspective. Journal of Product Innovation Management 8(1): 4–17.
Benner, M. J., and M. L. Tushman. 2003. Exploitation, exploration, andprocess management: The productivity dilemma revisited. Academy ofManagement Review 28 (2): 238–56.
Biazzo, S. 2009. Flexibility, structuration, and simultaneity in new productdevelopment. Journal of Product Innovation Management 26 (3): 336–53.
Bisbe, J., and D. Otley. 2004. The effects of the interactive use of manage-ment control systems on product innovation. Accounting Organizationsand Society 29 (8): 709–37.
Bonner, J. M., R. W. Ruekert, and O. C. Walker, Jr. 2002. Upper manage-ment control of new product development projects and project perfor-mance. Journal of Product Innovation Management 19 (3): 233–45.
Brambor, T., W. R. Clark, and M. Golder. 2006. Understanding interactionmodels: Improving empirical analyses. Political Analysis 14 (1):63–82.
Brown, J. S., and P. Duguid. 2001. Knowledge and organization: A social-practice perspective. Organization Science 12 (2): 198–213.
Brown, S. L., and K. M. Eisenhardt. 1995. Product development: Pastresearch, present findings and future directions. Academy of Manage-ment Review 20 (2): 343–78.
444 J PROD INNOV MANAG C. SCHULTZ ET AL.2013;30(3):430–447

Calantone, R., and R. Garcia. 2003. The effects of environmental turbu-lence on new product development strategy planning. Journal ofProduct Innovation Management 20 (2): 90–103.
Calantone, R. J., K. Chan, and A. S. Cui. 2006. Decomposing productinnovativeness and its effects on new product success. Journal ofProduct Innovation Management 23 (5): 233–45.
Calantone, R. J., N. Harmancioglu, and C. Dröge. 2010. Inconclusiveinnovation “returns”: A meta-analysis of research on innovation in newproduct development. Journal of Product Innovation Management 27(7): 1065–81.
Christensen, C. M., and J. L. Bower. 1996. Customer power, strategicinvestment and the failure of leading firms. Strategic ManagementJournal 17 (3): 197–218.
Christiansen, J. K., and C. J. Varnes. 2009. Formal rules in product devel-opment: Sensemaking of structured approaches. Journal of ProductInnovation Management 26 (5): 502–19.
Cooper, R. G. 2008. Perspective: The Stage-Gate® idea-to-launch process-update, what’s new and NexGen systems. Journal of Product Innova-tion Management 25 (3): 213–32.
Cooper, R. G., S. J. Edgett, and E. J. Kleinschmidt. 2003. Best practices inproduct innovation: What distinguishes top performers. Ancaster, ON:Product Development Institute.
Damanpour, F. 1996. Organizational complexity and innovation: Develop-ing and testing multiple contingency models. Management Science 42(5): 693–716.
Danneels, E., and E. J. Kleinschmidt. 2001. Product innovativeness fromthe firm’s perspective: Its dimensions and their relation with projectselection and performance. Journal of Product Innovation Manage-ment 18 (6): 357–73.
de Brentani, U. 2001. Innovative versus incremental new business services:Different keys for achieving success. Journal of Product InnovationManagement 18 (3): 169–87.
Diefendorff, J. M., and R. H. Gosserand. 2003. Understanding the emo-tional labor process: A control theory perspective. Journal of Organi-zational Behavior 24 (8): 945–59.
Eisenhardt, K. M. 1985. Control: Organizational and economic approaches.Management Science 31 (2): 134–49.
Eisenhardt, K. M., and B. N. Tabrizi. 1995. Accelerating adaptive pro-cesses: Product innovation in the global computer industry. Adminis-trative Science Quarterly 40 (1): 84–110.
Ettlie, J. E., and J. M. Elsenbach. 2007. Modified Stage-Gate® regimes innew product development. Journal of Product Innovation Management24 (1): 20–33.
Filippini, R., L. Salmaso, and P. Tessarolo. 2004. Product development timeperformance: Investigating the effect of interactions between drivers.Journal of Product Innovation Management 21 (3): 199–214.
Fransoo, J. C., and V. C. S. Wiers. 2006. Action variety of planners:Cognitive load and requisite variety. Journal of Operations Manage-ment 24 (6): 813–21.
Garcia, R., and R. Calantone. 2002. A critical look at technological inno-vation typology and innovativeness terminology: A literature review.Journal of Product Innovation Management 19 (2): 110–32.
Griffin, A. 1997. PDMA research on new product development practices:Updating trends and benchmarking best practices. Journal of ProductInnovation Management 14 (6): 429–58.
Griffin, A., and A. L. Page. 1993. An interim report on measuring productdevelopment success and failure. Journal of Product Innovation Man-agement 10 (4): 291–308.
Hackman, J. R., and R. Wageman. 1995. Total quality management:Empirical, conceptual, and practical issues. Administrative ScienceQuarterly 40 (2): 309–42.
Hair, J. F., and R. E. Anderson. 1998. Multivariate data analysis. UpperSaddle River, NJ: Prentice Hall.
Henard, D. H., and D. M. Szymanski. 2001. Why some new products aremore successful than others. Journal of Marketing Research 38 (3):362–75.
Henderson, R. M., and K. B. Clark. 1990. Architectural innovation: Thereconfiguration of existing product technologies and the failure ofestablished firms. Administrative Science Quarterly 35 (1): 9–30.
Heugens, P. 2005. A neo-Weberian theory of the firm. Organization Studies26 (4): 547–67.
Hoegl, M., and H. G. Gemünden. 2001. Teamwork quality and the successof innovative projects: A theoretical concept and empirical evidence.Organization Science 12 (4): 435–49.
Hoegl, M., and K. P. Parboteeah. 2006. Team goal commitment in innova-tive projects. International Journal of Innovation Management 10 (3):67–79.
Hu, L., and P. M. Bentler. 1998. Fit indices in covariance structure model-ing: Sensitivity to underparameterized model misspecification. Psycho-logical Methods 3 (4): 424–53.
Jansen, J. J. P., F. A. J. van den Bosch, and H. W. Volberda. 2006. Explor-atory innovation, exploitative innovation and performance: Effects oforganizational antecedents and environmental moderators. Manage-ment Science 52 (11): 1661–74.
Jaworski, B. J., and D. J. Macinnis. 1989. Marketing jobs and managementcontrols: Toward a framework. Journal of Marketing Research 26 (4):406–19.
Kahn, K. B., G. Barczak, and R. Moss. 2006. Perspective: Establishing anNPD best practices framework. Journal of Product Innovation Man-agement 23 (2): 106–16.
Kirsch, L. J. 1996. The management of complex tasks in organizations:Controlling the systems development process. Organization Science 7(1): 1–21.
Kleinschmidt, E. J., U. de Brentani, and S. Salomo. 2007. Performance ofglobal new product development programs: A resource-based view.Journal of Product Innovation Management 24 (5): 419–41.
Leonard-Barton, D. 1992. Core capabilities and core rigidities: A paradoxin managing new product development. Strategic Management Journal13 (Summer): 111–25.
Levardy, V., and T. R. Browning. 2009. An adaptive process model tosupport product development project management. IEEE Transactionson Engineering Management 56 (4): 600–20.
Levinthal, D. A., and J. G. March. 1993. The myopia of learning. StrategicManagement Journal 14: 95–112.
Lewis, M. W., M. A. Welsh, and G. E. Dehler. 2002. Product developmenttensions: Exploring contrasting styles of project management.Academy of Management Journal 45 (3): 546–64.
Lindkvist, L. 2004. Governing project-based firms: Promoting market-likeprocesses within hierarchies. Journal of Management & Governance 8(1): 3–25.
Lo, C.-M., and J.-R. Wang. 2007. The relationships between defender andprospector business strategies and organizational performance in twodifferent industries. International Journal of Management 24 (1): 174–83.
Lynn, G. S., R. R. Reilly, and A. E. Akgun. 2000. Knowledge managementin new product teams: Practices and outcomes. IEEE Transactions onEngineering Management 47 (2): 221–31.
Manion, M. T., and J. Cherion. 2009. Impact of strategic type on successmeasures for product development projects. Journal of Product Inno-vation Management 26 (1): 71–85.
Maruping, L. M., V. Venkatesh, and R. Agarwal. 2009. A control theoryperspective on agile methodology use and changing user requirements.Information Systems Research 20 (3): 377–99.
Miles, R. E., and C. C. Snow. 1978. Organizational strategy, structure, andprocess. New York: McGraw-Hill.
Myers, M. B., R. J. Calantone, T. J., Jr., Page, and C. R. Taylor. 2000.Academic insights: An application of multi-group causal models inassessing cross-cultural measurement equivalence. Journal of Interna-tional Marketing 8 (4): 108–21.
Naveh, E. 2007. Formality and discretion in successful R&D projects.Journal of Operations Management 25 (1): 110–25.
DECISION-MAKING CLARITY AND INNOVATION PERFORMANCE J PROD INNOV MANAG 4452013;30(3):430–447

Ouchi, W. G. 1979. A conceptual framework for the design of organiza-tional control mechanisms. Management Science 52 (9): 833–48.
Pattikawa, L. H., E. Verwaal, and H. R. Commandeur. 2006. Understandingnew product project performance. European Journal of Marketing 40(11-12): 1178–93.
Pons, D. 2008. Project management for new product development. ProjectManagement Journal 39 (2): 82–97.
Project Management Institute. 2000. A guide to the Project ManagementBody of Knowledge (PMBOK). Newtown Square, PA: Project Manage-ment Institute.
Salomo, S., J. Weise, and H. G. Gemünden. 2007. NPD planning activitiesand innovation performance: The mediating role of process manage-ment and the moderating effect of product innovativeness. Journal ofProduct Innovation Management 24 (4): 285–302.
Schmidt, J. B., and R. J. Calantone. 2002. Escalation of commitment duringnew product development. Journal of the Academy of MarketingScience 30 (2): 103–18.
Sethi, R., and Z. Iqbal. 2008. Stage-gate controls, learning failure, andadverse effect on novel new products. Journal of Marketing 72: 118–34.
Shenhar, A. J., A. Tishler, D. Dvir, S. Lipovetsky, and T. Lechler. 2002.Refining the search for project success factors: A multivariate, typo-logical approach. R&D Management 32 (2): 111–26.
Song, X. M., and M. M. Montoya-Weiss. 1998. Critical development activi-ties for really new versus incremental products. Journal of ProductInnovation Management 15 (2): 124–35.
Tatikonda, M. V., and M. M. Montoya-Weiss. 2001. Integrating operationsand marketing perspectives of product innovation: The influence oforganizational process factors and capabilities on development perfor-mance. Management Science 47 (1): 151–72.
Tessarolo, P. 2007. Is integration enough for fast product development? Anempirical investigation of the contextual effects of product vision.Journal of Product Innovation Management 24 (1): 69–82.
Thieme, R. J., M. Song, and G. C. Shin. 2003. Project management char-acteristics and new product survival. Journal of Product InnovationManagement 20 (2): 104–19.
Turner, K. L., and M. V. Makhija. 2006. The role of organizational controlsin managing knowledge. Academy of Management Review 31 (1):197–217.
Venkatraman, N. 1989. Strategic orientation of business enterprises: Theconstruct, dimensionality, and measurement. Management Science 35(8): 942–62.
Wheelwright, S. C., and K. B. Clark. 1992. Creating project plans to focusproduct development. Harvard Business Review 70 (2): 70–82.
Appendix A
Measures, Corresponding Factor Loadings, and Psychometric Properties
Construct, Respondent, Source ItemsFactor
Loadings
Stage-and-gate-type system (SGS)Respondent: CTOSources: Cooper et al. (2003);
Griffin (1997)
(a = .92; AVE = .80)(1 = strongly disagree, 5 = strongly agree)1. Our firm uses a formal new development process—i.e., standardized stages, and Go/No
Go decisions guide all new innovation activities from idea to launch2. Our new product development process lists and defines specific activities for each stage of
the process (e.g., validation stage lists activities such as: in-house tests, customer fieldtrial, etc.)
3. Our new product development process has clearly defined Go/No Go decision points(“gates”) for each stage of the process (e.g., gate 1 = “Initial Screen”; gate 3 might be “Goto Development”)
4. Our new product development process has defined gatekeepers—review projects at each“gate” and make Go/No Go decisions
.92
.91
.94
.80
Project management (PM)Respondent: CTOBased on Shenhar et al. (2002);
others
(a = .87; AVE = .62)(1 = strongly disagree, 5 = strongly agree)1. A clear and systematic milestone plan is used2. A clear and systematic resource plan is used3. A clear and systematic cost plan is used4. Project management/control and project management tools are an integrated part in
managing innovation projects
.80
.77
.86
.81
Decision-making clarity (DMC)Respondents: Team membersNewly developed scale based on
Hoegl and Gemünden (2001);others
(a = .89; AVE = .70)(1 = strongly disagree, 5 = strongly agree)1. The individual goals of the innovation project are well understood by all team members2. We have clear and well communicated criteria for Go/No Go decisions and significant
resource adjustments3. The process of decision-making is transparent to all team members4. Important decisions are communicated in a timely and comprehensive manner to all team
members5. The team members have a clear understanding of who is taking important decisions
.81
.76
.89
.87
.84
446 J PROD INNOV MANAG C. SCHULTZ ET AL.2013;30(3):430–447

NPD program innovativenessRespondent: CTOSources: Calantone et al. (2006);
Danneels and Kleinschmidt(2001); Garcia and Calantone(2002)
(1 = strongly disagree, 5 = strongly agree)Market innovativeness (a = .73; AVE = .61)1. Our new products offer customers value not offered before by any other product2. Our new products create a totally new market3. Our new products change the way our market functionsTechnological innovativeness (a = .81; AVE = .69)
.62
.88
.84
4. Our new products are based on new technological principles5. The technology we use allows significant performance enhancements6. Our new products can be characterized as being based on very new technological
components
.83
.81
.85
Organizational innovativeness (a = .70; AVE = .61)7. In order to develop and introduce our new products/services, we had to significantly changeour organizational structure8. . . . our production processes9. . . . our organizational culture
.77
.80
.76Environmental innovativeness (a = .76; AVE = .67)10. In order to introduce our new products . . . changed industry norms have to be
established11. . . . regulations have to be changed12. . . . values and norms in the society in general need to be adapted
.73
.90
.81NPD program performanceRespondent: CEOSources: Griffin and Page (1993);
Manion and Cherion (2009)
(1 = strongly disagree, 5 = strongly agree)Our innovation activities (new products/services/processes) have contributed to the success of
our firm within the last three years in the following ways: (a = .83; AVE = .65)1. Profitability2. Revenue3. Market share4. Net present value of the firm
.81
.86
.78
.79Control variablesRespondent: CTOSource: Calantone et al. (2006);
Venkatraman (1989)
(1 = strongly disagree, 5 = strongly agree)Market turbulence (a = .81; AVE = .57)1. Competitor activities in the market are very uncertain2. Market competitive conditions are highly unpredictable3. Customer preferences change rapidly
.63
.85
.76Technology turbulence (a = .85; AVE = .69)1. Technologies applied in our industry offer large potentials for future technological
developments2. Our industry experiences frequent technological breakthroughs3. The technology in our industry is changing rapidly4. In our industry, technologies from different fields are frequently combined
.79
.91
.87
.76Proactiveness (a = .78; AVE = .61)1. We are constantly seeking new opportunities related to present operations2. We are usually the first ones to introduce new products or services in the market3. We are constantly on the lookout for opportunities to extend our target market4. We are always the first to act on emerging market trends
.62
.85
.79
.84
AVE, average variance extracted; CEO, chief executive officer; CTO, chief technology officer.
DECISION-MAKING CLARITY AND INNOVATION PERFORMANCE J PROD INNOV MANAG 4472013;30(3):430–447


![Clarity and Complexity in the Bias Rule [44] MULR](https://static.fdokumen.com/doc/165x107/63327df8b0a33e52010697a4/clarity-and-complexity-in-the-bias-rule-44-mulr.jpg)