How do Developers Price New Housing in a Highly ...
26
Price of New Housing and Market Power 307 INTERNATIONAL REAL ESTATE REVIEW 2019 Vol. 22 No. 3: pp. 307 – 331 How do Developers Price New Housing in a Highly Oligopolistic City? Siu Kei Wong * Department of Real Estate & Construction, University of Hong Kong. Email: [email protected] Ling Li Department of Real Estate & Construction, University of Hong Kong. Email: [email protected] Paavo Monkkonen Department of Urban Planning and Public Policy, UCLA Luskin School of Public Affairs. Email: [email protected] The profiteering developer is a common figure in debates over housing policy. Governments increasingly use developer profits to justify policies like inclusionary housing. Yet we actually understand little about the competitiveness of housing development. One unresolved question is whether developers use market power to profit when selling new units, especially in highly concentrated markets. We use the case of Hong Kong, where the five largest developers build almost two-thirds of new housing units, to address this question. Using a repeat-sales approach, we find that new condominiums sell at a discount, not a premium. We attribute this lack of market power to the resalable feature of durable goods – the discount is larger when more re-sellers are located nearby – as well as the need for liquidation – the discount is larger when developers have to sell more units simultaneously. Our results suggest that the first-hand market, even in a highly concentrated market, is competitive. They add to a growing body of research work on the role of new housing in affordability, and invite further study of competitiveness in different kinds of housing markets. Keywords Developers, Monopoly, Housing Price * Corresponding author
-
Upload
khangminh22 -
Category
Documents
-
view
3 -
download
0
Transcript of How do Developers Price New Housing in a Highly ...

Price of New Housing and Market Power 307
INTERNATIONAL REAL ESTATE REVIEW
2019 Vol. 22 No. 3: pp. 307 – 331
How do Developers Price New Housing in a
Highly Oligopolistic City?
Siu Kei Wong* Department of Real Estate & Construction, University of Hong Kong. Email: [email protected]
Ling Li Department of Real Estate & Construction, University of Hong Kong. Email: [email protected]
Paavo Monkkonen Department of Urban Planning and Public Policy, UCLA Luskin School of Public Affairs. Email: [email protected]
The profiteering developer is a common figure in debates over housing policy. Governments increasingly use developer profits to justify policies like inclusionary housing. Yet we actually understand little about the competitiveness of housing development. One unresolved question is whether developers use market power to profit when selling new units, especially in highly concentrated markets. We use the case of Hong Kong, where the five largest developers build almost two-thirds of new housing units, to address this question. Using a repeat-sales approach, we find that new condominiums sell at a discount, not a premium. We attribute this lack of market power to the resalable feature of durable goods – the discount is larger when more re-sellers are located nearby – as well as the need for liquidation – the discount is larger when developers have to sell more units simultaneously. Our results suggest that the first-hand market, even in a highly concentrated market, is competitive. They add to a growing body of research work on the role of new housing in affordability, and invite further study of competitiveness in different kinds of housing markets.
Keywords
Developers, Monopoly, Housing Price
* Corresponding author
308 Wong, Li and Monkkonen
1. Introduction
The profiteering real estate developer is a common figure in policy debates.
Animosity to developers and new developments has spurred moratoria on all
new construction (Manville and Osman, 2017), and governments use the
perception of developer profit to justify policies such as impact fees,
community benefits agreements, and inclusionary housing. A recent article in
the Shelterforce community development magazine on how all cities should
adopt inclusionary housing ordinances argues, “where housing development is
profitable, the added cost of an inclusionary housing program … can be fairly
easily borne.” (Reyes, 2018). Yet we actually understand little about the
competitiveness of housing development in a systematic manner. In her seminal
article, DiPasquale (1999) laments the dearth of knowledge in housing supply
and the development process. Many of the holes in our understanding persist
today (Been et al., 2017).
The market structure of the real estate industry is also one part of a popular
explanation for high housing costs, and advocates often blame new luxury
housing for high rents (Tenants Together, 2018). Casual observers might think
that potentially corrupt and clearly oligopolistic developers build only for the
very rich, and because of their market power, they are able to charge excessive
and exorbitant prices for new housing. But is this true? Do developers price
new housing units above their market value? We can answer this question, even
though it is only one component of developer profit and the market structure.
We use Hong Kong as a case of a highly oligopolistic city to explore this
question and provoke further research in other cities with different market
structures. The following are some stylized facts of Hong Kong. First, Hong
Kong has one of the most expensive property markets in the world. In 2017, the
average residential (condo) price reached a record high of US$1700/ft2 (Rating
and Valuation Department, 2018), well out of reach of the vast majority of the
population. Second, popular accounts in Hong Kong partly explain
unaffordability with the market power of developers:
“Hong Kong’s property market for new flats is rigged in favour of the
property tycoons who can withhold their massive landbanks, delay
development and slowly release completed flats into the market.” (Guy,
2016)
Third, casual evidence presented in the media seems to support this argument.
Property developers reportedly sold first-hand condo units at a 20-25% price
premium over units sold in the resale market.1 Fourth, the real estate industry is
highly concentrated. A government report in the early 1990s found that seven
developers supplied 70% of the new units (Consumer Council 1996), and the
1 Ming Pao, November 10, 2012.

Price of New Housing and Market Power 309
first-hand market became even more concentrated during 1995-2012. Fifth,
property tycoons in Hong Kong always top the list of the richest individuals in
the city2, which makes market power an apparently indisputable truth.
The market power explanation, however, suffers from at least two problems –
one empirical and the other theoretical. Empirically, even if the 20-25%
premium has been accurately estimated, it could be due to quality differences
between first-hand and second-hand units. If higher quality products sell at a
higher price, this is not market power. Theoretically, the literature shows that
durable-goods monopolists have difficulty in maintaining their market power,
partly because they cannot credibly commit to restricting future supply (Coase,
1972) and partly because they cannot control the second-hand market (Bulow,
1982). This is particularly true for real estate, which is more durable than most
other products like automobiles. In the case of a condo market where the
product is more homogeneous and comparable, developers are inevitably
competing with re-sellers in the second-hand market, including buyers who just
bought new units in the same building. Our empirical work can therefore shed
light on the difficulty in maintaining market power, with real estate as a prime
example of highly durable goods.
More generally, apart from market power, what other factors could affect the
average pricing of new housing development? Since developers are selling a
large number of units, they face a liquidation problem. Given demand
uncertainty, inter-temporal sale strategies (e.g. selling in phases) are often used.
Some developers might set a high price and wait for buyers to come. Others
might set a lower price and quickly transfer the pricing risk to buyers. This
means first-hand units can be sold at a premium or discount, depending on the
holding cost of developers. Other possible factors that could affect the
differential pricing of first and second-hand housing (e.g. presales of new
housing; renovation of old housing) will be controlled for, as far as we can, in
this study. This offers a more general perspective to understand the patterns of
over or underpricing, without confining to the market power argument.3
The identification of a discount or premium on new units is an empirical
challenge. A first-hand unit is normally higher in quality than a second-hand
one, so simple price comparison or even a hedonic approach is insufficient to
control for unobserved qualities (e.g. design and building quality). With a
highly liquid second-hand market in Hong Kong from 1995 to 2012, we
carefully select a sample of repeatedly sold properties for analysis, i.e.
properties first sold by a developer to the first owner (first-hand sale), and
subsequently sold again by the first owner to another buyer (second-hand sale
2 See, for example, https://www.forbes.com/hong-kong-billionaires/list/ (last accessed
7/6/2018). 3 Coulson et al. (2019) find that, based on a hedonic study of Las Vegas, new homes can
be sold at a premium or discount. This means overpricing should not be taken for
granted.
310 Wong, Li and Monkkonen
or resale).4 This repeat sales approach requires that the same property is priced
twice so that any change in unobserved qualities is minimized. General changes
in market price levels over time can be controlled by property price indices.
Our results show that, in contrast to anecdotal evidence, new housing units
actually sell at a discount with respect to otherwise identical resales. This first-
hand discount, moreover, is larger for the developers who have the highest
market share. These findings do not support the market power argument; rather,
they suggest that developers with a large inventory tend to reduce the holding
cost by selling more quickly and cheaply. Additionally, we find that developers
are more sensitive to substitutes than resellers, consistent with the liquidation
argument that developers have a much larger quantity to sell than individual
owners. This substitution effect stems not just from the units outside the new
development but also from within, thus implying that a developer who is selling
many units is indeed competing with itself. The inter-temporal sale strategies
of developers, apparently, do not completely offset the self-substitution effect.
We hope that this study provokes further research globally. Understanding how
the relative concentration of the real estate industry in a city as well as the
importance of new housing in its housing market shapes the discount/premium
on new units is important. Clearly, developers and new housing play a crucial
role in urban growth, and improving the empirical evidence on their role in the
housing market can inform policymaking. For example, since liquid second-
hand markets constrain the selling power of developers, governments should
promote them to the greatest extent possible, say by moving away from
transaction taxes and towards property taxes. Additionally, if a liquid second-
hand market is in place, any resources for anti-trust investigations in the real
estate sector should target the factors of production of developers (e.g. land
purchase), not their selling practices. Our study does not investigate the
potential market power of developers as buyers of land or development permits,
which may be a source of rents.
This paper is organized as follows. Section 2 reviews the literature on market
power and demand uncertainty. Section 3 provides an introduction on the Hong
Kong condominium market. Section 4 presents our hypotheses, and Section 5
describes the methodology and data that we use. Finally, Section 6 discusses
the results and Section 7 highlights their implications for further research on
this topic.
4 The Hong Kong government implemented a series of new tax and mortgage-related
measures in 2013 that targeted first-hand markets. To avoid any bias from these measures,
we did not consider transactions after 2012.

Price of New Housing and Market Power 311
2. Literature on Market Concentration and Pricing
A highly concentrated market is conducive to anti-competitive behavior, such
as collusion, to earn higher profits. The relationship between concentration and
profitability of firms has been long studied (Newmark 1990) but the empirical
work on this is plagued with measurement problems. For example, accounting
data is a noisy measure of economic variables (Schmalensee 1989). At the firm
level, accounting data does not provide adequate information on cost at the
product level. This is particularly problematic for conglomerates because the
allocation of firm-level costs to different business lines is inevitably arbitrary.
The interpretation of the co-existence of high profitability and high market
concentration is also unclear (Demsetz 1973). Is it a consequence of market
power or production efficiency? A highly productive firm would expand its
market share and make more profits, but this is a result of competitive efficiency,
not monopoly. For durable goods, the possibility of maintaining market power
is also widely debated. Coase (1972) conjectures that market concentration
cannot give rise to any market power, because buyers rationally expect that
durable-goods monopolists are unable to limit future supply. Similarly, Bulow
(1982) argues that durable-goods monopolists cannot control the second-hand
market unless they only rent their products. Maskin and Tirole (1988) and
Esteban and Shum (2008) have generalized these theoretical arguments to a
dynamic oligopoly setting, although empirical work is still scant.
To avoid the abovementioned measurement problems, a more recent approach
is to measure market power at the product level by using product prices. Prices
come directly from market transactions and are thus not subject to accounting
manipulation. They are also less vulnerable to interpretation problems because
the pure effect of production efficiency should drive prices down. Recent
studies have therefore shifted their focus to analyze the relationship between
prices and concentration, and examine industries like rental housing (Cronin
1983), banking (Cyrnak and Hannan 1999), airline (Haskel et al. 2013), food
retailing (MacDonald 2000), and natural gas (Morris 1988). The review by
Weiss (1989) finds a positive relationship between prices and concentration in
many industries. However, no studies have been conducted on the real estate
market (for sale, not rental) so far, which is arguably one of the most durable
goods.
Studies that use prices must also contend with measurement challenges. Most
products are not identical and thus sellers compete on dimensions beyond price
itself (Newmark 2004). Thus, using prices may still be misleading if there are
important uncontrolled or unobserved differences in products such as quality
(Pautler 2001). To use the price measure, scholars must carefully consider and
control for quality differences. The present study contributes to the empirical
literature in this sense, by using a repeat-sales approach that can effectively
separate quality from prices for durable goods.

312 Wong, Li and Monkkonen
As mentioned in the introduction, market power is not the only force at play in
pricing new products. Demand uncertainty is another important factor that
could affect the pricing decision of sellers. Starting with the assumption that
sellers do not know the exact market demand, how do firms set the quantity and
price of goods in advance?
Firms use two common inter-temporal pricing strategies to address demand
uncertainty. One is to charge a high price initially and then lower the price in a
sales period. Retailers that sell seasonal goods or theatre tickets often take this
approach (Nocke and Peitz 2007). The other is to set a low price initially to
attract early buyers and then raise the price for those who buy late, a common
strategy for airline tickets (Möller and Watanabe 2010). Developers use both
strategies, although they tend to favor the latter. Sirmans et al. (1997) show that
developers reduce the price in the earlier phase to ensure that there will be
sufficient demand and then increase the price sequentially as more demand
information is obtained.
Whichever strategy developers employ, the demand uncertainty theory does not
assert that sellers with a large market share should necessarily earn a price
premium. Instead, both holding (inventory) cost and product characteristics
matter.
On the one hand, sellers with a large inventory generally want to sell quickly.
Developers have a strong incentive to speed up sales in order to reduce holding
costs (Ott et al. 2011). To do so, however, they have to lower the price in order
to induce buyers to take the market risk (Lai et al. 2004). On the other hand,
sellers with a large inventory can also sell in phases in order to gather
information about market demand. Gradually selling units is a common strategy
and may help them to achieve higher overall revenues on a project (Wang and
Zhou 2006).
The effectiveness of phased sales depends on the similarity of products to other
substitutes on the market (Haurin 1988). Waiting may not benefit sellers if
holding costs are high and close substitutes are available. This means, for
durable goods, the substitutability between first and second-hand products
should also matter. We cannot find any articles that focus on this question as
we do, thus a further contribution of this study is the innovative measure of
product similarity inspired by the atypicality measure in Haurin (1988).
3. Condominium Market in Hong Kong
The property market in Hong Kong differs from other cities in at least four
important ways. First, the majority of housing units are condominiums in
medium to large buildings, typically between 20 and 40-storeys tall. Such
buildings are often developed into an estate that houses more than a thousand

Price of New Housing and Market Power 313
units. Second, the vast majority of new housing units sell as condominiums to
individuals. Rarely do Hong Kong developers maintain ownership of multi-
family housing and rent units out. Instead, the rental market primarily
comprises individual property owners who rent out their condominiums in
multi-owner buildings. Third, all land is technically owned by the government
and sold to developers as leasehold interest through annual land auctions and
land use conversions. Finally, roughly half of the population in Hong Kong
lives in publicly built housing (30% in public rental housing and 20% in
subsidized ownership housing), which means its social-spatial structure is as
different from US cities as its built environment (Monkkonen and Zhang, 2014).
In our analysis, we consider the first-hand and second-hand condominium
markets separately. They do not operate in isolation from one another, however.
Developers employ various strategies to sell their newly built units as they
cannot ignore the potential substitutes offered by nearby resellers. The nature
of durable goods dictates that in the long-run, second-hand goods will dominate
the supply. This is true for Hong Kong condominiums. The annual new supply
(first-hand units) constitutes less than 2% of the total stock on average5. First-
hand units were, on average, 18% of all transactions between 2002 and 2012.
On an unadjusted basis, first-hand units were sold at a 5% premium over
second-hand units in our sample.
One difference between markets is that property agents coordinate the sale and
purchase of second-hand units on behalf of individuals. They match individual
buyers with sellers and facilitate negotiation between them. Compared to the
first-hand market, the second-hand market is more competitive simply because
there are so many sellers with very few units. They therefore do not make use
of sale strategies that are otherwise available to developers.
In this study, the focus is on the first-hand units built and sold by real estate
developers. According to the Consumer Council (1996), the first-hand market
was highly concentrated with a small number of large developers. At that time,
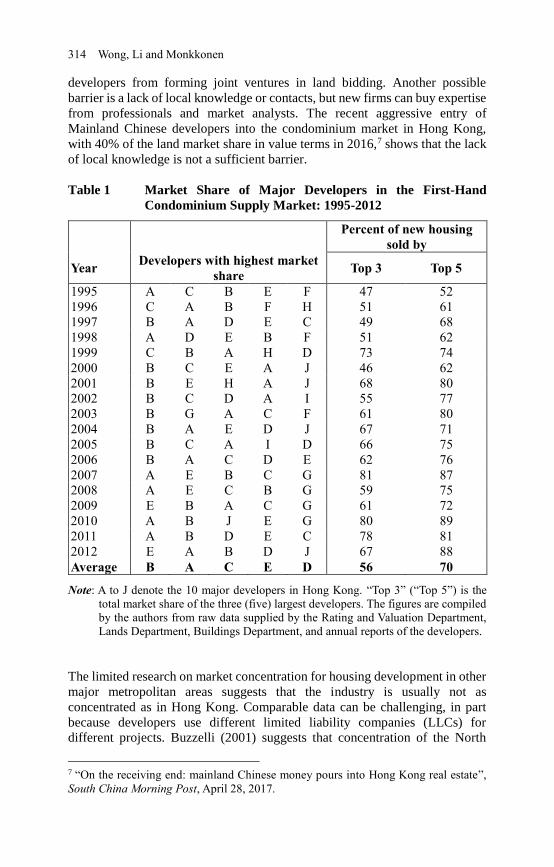
seven developers built and sold 70% of the new units. We produce an updated
picture for 1995 to 2012 in Table 1, which shows how the first-hand market
actually became more concentrated since that report. On average, three
developers built and sold 64% of new units and five developers supplied 77%.
Not only is the market concentrated in Hong Kong, few new players have
entered the condominium market until recently. The reason for this is not clear.
Hong Kong is one of the freest economies in the world6, thus barriers to entry
are low. Capital can easily move in and out, profits tax is low, and the
government uses the common law system. The high cost to development,
especially land acquisition, may be a barrier, but there is nothing to prevent
5 Raw data from the Rating and Valuation Department of Hong Kong. 6 See, for example, http://www.heritage.org/index/country/hongkong (last accessed
7/6/2018).
314 Wong, Li and Monkkonen
developers from forming joint ventures in land bidding. Another possible
barrier is a lack of local knowledge or contacts, but new firms can buy expertise
from professionals and market analysts. The recent aggressive entry of
Mainland Chinese developers into the condominium market in Hong Kong,
with 40% of the land market share in value terms in 2016,7 shows that the lack
of local knowledge is not a sufficient barrier.
Table 1 Market Share of Major Developers in the First-Hand
Condominium Supply Market: 1995-2012
Percent of new housing
sold by
Year Developers with highest market
share Top 3 Top 5
1995 A C B E F 47 52
1996 C A B F H 51 61
1997 B A D E C 49 68
1998 A D E B F 51 62
1999 C B A H D 73 74
2000 B C E A J 46 62
2001 B E H A J 68 80
2002 B C D A I 55 77
2003 B G A C F 61 80
2004 B A E D J 67 71
2005 B C A I D 66 75
2006 B A C D E 62 76
2007 A E B C G 81 87
2008 A E C B G 59 75
2009 E B A C G 61 72
2010 A B J E G 80 89
2011 A B D E C 78 81
2012 E A B D J 67 88
Average B A C E D 56 70
Note: A to J denote the 10 major developers in Hong Kong. “Top 3” (“Top 5”) is the
total market share of the three (five) largest developers. The figures are compiled
by the authors from raw data supplied by the Rating and Valuation Department,
Lands Department, Buildings Department, and annual reports of the developers.
The limited research on market concentration for housing development in other
major metropolitan areas suggests that the industry is usually not as
concentrated as in Hong Kong. Comparable data can be challenging, in part
because developers use different limited liability companies (LLCs) for
different projects. Buzzelli (2001) suggests that concentration of the North
7 “On the receiving end: mainland Chinese money pours into Hong Kong real estate”,
South China Morning Post, April 28, 2017.

Price of New Housing and Market Power 315
American house-building industry is low compared to other industries. In part,
this is because smaller buildings are much more prevalent. In the City of Los
Angeles, for example, over half of the 681 new development projects permitted
in 2016 were duplexes and only four had over 500 units (City of Los Angeles,
2017). This type of construction allows smaller and more developers to exist.
Using Los Angeles County as a comparison case, available data report the
largest five developers selling 43% of the roughly 3000 new units sold in 2017
(Los Angeles Business Journal, 2018). Many of these homes were in single-
family subdivisions, as developers of large multi-family residential projects
often hold them as rental properties. Also in contrast to the Hong Kong case,
the 3000 new units were less than 1% of the housing stock in the county, and
less than 4% of housing transactions that year8.
4. Development of Hypotheses
Our interest is the price of first-hand units relative to otherwise identical
second-hand units. The relative price can be first examined from the market
structure perspective. Consider a base-case scenario where first and second-
hand markets are segmented. First-hand units are supplied by real estate
developers. Abstracting from any strategic interactions in an oligopoly market,
we consider the simplest case of a first-hand market with a monopolist
developer who faces a downward sloping demand curve. As a profit maximizer,
the developer would use his/her market power to restrict supply or price-
discriminate buyers such that first-hand price will be set above the competitive
level. On the other hand, second-hand units are supplied by many individual
resellers who have no market power. These resellers would, on average, sell at
a competitive price in the second-hand market. Given these assumptions, a
hypothesis on the relative price is:
Hypothesis 1: Ceteris paribus, the price of first-hand units is higher than that of
second-hand units, especially when the seller of first-hand units is a developer
with a high market share.
The above base-case scenario is probably too simplistic. It ignores the
liquidation problem of the developer, who has to sell a much larger quantity
than individual resellers. Therefore, another perspective to look at the relative
price is that all sellers are price searchers who face demand uncertainty. In the
second-hand market, resellers do not know exactly what price to set, but each
of them only has one unit to sell and can discover market price through
negotiation. In the first-hand market, when the developer releases new products
8 Data from Census Quick Facts
www.census.gov/quickfacts/fact/table/losangelescountycalifornia/PST045217 (last
accessed 7/9/2018) and Zillow https://www.zillow.com/research/data/2016 (last
accessed 7/9/2018).

316 Wong, Li and Monkkonen
to the market, what price should s/he set and how fast will the units sell?
Consider two extreme scenarios. On the one hand, if the developer negotiates
the price of each unit like resellers, the first-hand price should, on average, be
the same as the second-hand price, although this would take a long time and
incur a high negotiation cost. On the other hand, if the developer sells all units
quickly in one go, this would be like a liquidation sale and the price would be
heavily discounted. In practice, developers adopt an intermediate solution by
selling in phases to discover demand, thus resulting in a modest liquidation
discount. Developers with a high holding cost (e.g. a large inventory) tend to
offer a higher discount for faster sales. This gives our second hypothesis on the
relative price:
Hypothesis 2: Ceteris paribus, the price of first-hand units is (on average) lower
than that of second-hand units. Moreover, the higher the holding cost of
developers, the lower the price of first-hand units relative to that of second-
hand units.
We can test the holding cost component of Hypothesis 2 in a number of ways.
First, developers with the highest market share hold a larger inventory and
should therefore sell at a larger discount, as opposed to a larger premium
predicted by Hypothesis 1. Similarly, developments with more units should sell
at a lower first-hand price. Holding cost also relates to market conditions.
When the market has higher liquidity or prices are rising, holding costs are
relatively lower and the liquidation discount will be smaller.
A further problem with the base-case scenario that underlies Hypothesis 1 is
that the first and second-hand markets are assumed to be completely segmented.
What if the two are actually substitutable? When setting the first-hand price,
developers would look around and check for similar products. In the case of
perfect substitutability, first and second-hand prices should be the same, as
developers lose all market power when competing directly with resellers.
However, if second-hand units are close but imperfect substitutes, developers
may still retain some market power under monopolistic competition. They have
more power to charge a first-hand premium if their new developments are more
dissimilar to nearby second-hand units. On the other hand, resellers also face
competition when new developments emerge. Since they do not have market
power whatsoever, there is no second-hand premium to charge, even if their
units are dissimilar to nearby new developments. This leads to our third
hypothesis on the relative price:
Hypothesis 3: Ceteris paribus, the presence of substitutes lowers the price of
first-hand units relative to that of second-hand units. Moreover, this negative
effect is stronger when closer substitutes are present.
From the point of view of the developers, competition not only comes from the
second-hand market, but also from the first-hand units of other developers as
well as the units just sold or to be sold. We therefore divide the substitutes into
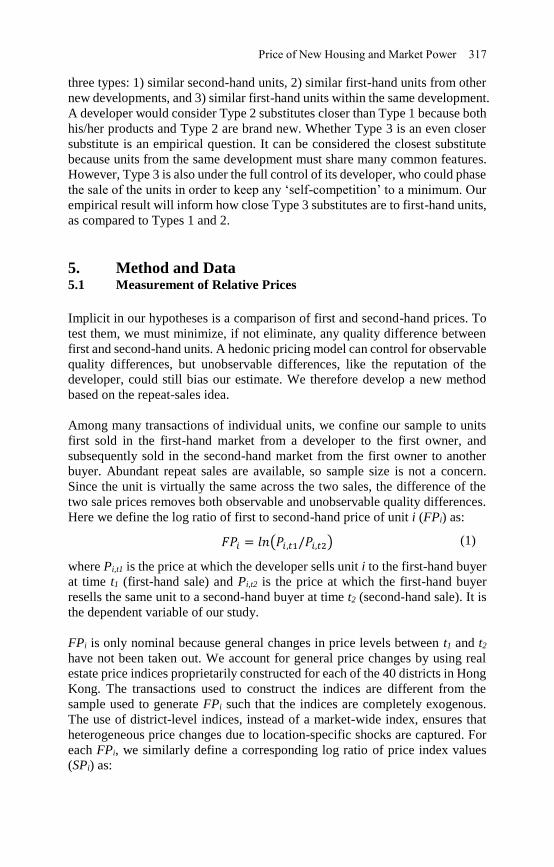
Price of New Housing and Market Power 317
three types: 1) similar second-hand units, 2) similar first-hand units from other
new developments, and 3) similar first-hand units within the same development.
A developer would consider Type 2 substitutes closer than Type 1 because both
his/her products and Type 2 are brand new. Whether Type 3 is an even closer
substitute is an empirical question. It can be considered the closest substitute
because units from the same development must share many common features.
However, Type 3 is also under the full control of its developer, who could phase
the sale of the units in order to keep any ‘self-competition’ to a minimum. Our
empirical result will inform how close Type 3 substitutes are to first-hand units,
as compared to Types 1 and 2.
5. Method and Data 5.1 Measurement of Relative Prices
Implicit in our hypotheses is a comparison of first and second-hand prices. To
test them, we must minimize, if not eliminate, any quality difference between
first and second-hand units. A hedonic pricing model can control for observable
quality differences, but unobservable differences, like the reputation of the
developer, could still bias our estimate. We therefore develop a new method
based on the repeat-sales idea.
Among many transactions of individual units, we confine our sample to units
first sold in the first-hand market from a developer to the first owner, and
subsequently sold in the second-hand market from the first owner to another
buyer. Abundant repeat sales are available, so sample size is not a concern.
Since the unit is virtually the same across the two sales, the difference of the
two sale prices removes both observable and unobservable quality differences.
Here we define the log ratio of first to second-hand price of unit i (FPi) as:
𝐹𝑃𝑖 = 𝑙𝑛(𝑃𝑖,𝑡1/𝑃𝑖,𝑡2) (1)
where Pi,t1 is the price at which the developer sells unit i to the first-hand buyer
at time t1 (first-hand sale) and Pi,t2 is the price at which the first-hand buyer
resells the same unit to a second-hand buyer at time t2 (second-hand sale). It is
the dependent variable of our study.
FPi is only nominal because general changes in price levels between t1 and t2
have not been taken out. We account for general price changes by using real
estate price indices proprietarily constructed for each of the 40 districts in Hong
Kong. The transactions used to construct the indices are different from the
sample used to generate FPi such that the indices are completely exogenous.
The use of district-level indices, instead of a market-wide index, ensures that
heterogeneous price changes due to location-specific shocks are captured. For
each FPi, we similarly define a corresponding log ratio of price index values
(SPi) as:

318 Wong, Li and Monkkonen
𝑆𝑃𝑖 = 𝑙𝑛(𝑃𝐼𝑡1/𝑃𝐼𝑡2) (2)
where PIt1 is the district price index at t1, and PIt2 is the district price index at
t2. For interpretation, one could regard the difference between FPi and SPi as
the relative price embedded in our hypotheses – the real price of first-hand units
relative to the real price of second-hand units. For empirical analysis, however,
we will treat SPi as an independent variable because this allows a more flexible
specification. Since both FPi and SPi are estimated by using the repeat-sales
method (with different samples), any sample selection bias in FPi is arguably
captured by the same bias in SPi.
What about price changes due to physical depreciation? This would give FPi
an upward bias. We address this problem in two ways. One is that the age
difference (DAGEi) between the first and second sale of unit I will be added as
a control variable. The other is to restrict our repeat-sales sample to units sold
within five years after completion.9 Condominiums within five years are still
relatively young and it is unlikely that changing ownership will induce
significant depreciation or renovation during this time.
Finally, we also have to consider if the first-hand sale takes place before or after
building completion. It is quite common for developers in Hong Kong to sell
their units before completion (presales). Chau et al. (2003) show that the loss
in rental income for presales induces a price discount; Lai et al. (2004) further
show that presales can reduce the bankruptcy and marketing risks of developers.
It is therefore important to control for the presales factor whenever first-hand
price is compared to second-hand price. As such, we add a dummy variable
PRE, which has a value of 1 if the first-hand sale is a presale and 0 otherwise,
as another control variable.10 As far as we know, taxes are similar across the
two sub-markets, while it is common for developers to pay the agency fee for
buyers in the first-hand market (by marking up the price). If there is any bias, it
would be towards a first-hand premium rather than a discount. More
importantly, our empirical model in the next section will not solely rely on the
intercept (average relative price), which could be distorted by the presales factor
or agency fee, to test the hypotheses on market power and liquidation problems.
Other variables that should not be correlated with presales (e.g. market share of
developers; scale of a development) are also used to check consistency and
robustness.
9 We acknowledge that this restrictive sampling method might exaggerate the sample
selection bias of the repeat sales method (Gatzlaff and Haurin, 1997), even though our
sample period covers a full economic cycle. We tried to extend the repeat-sale restriction
from five to ten years, and the results remain similar. 10 We also follow the cost-of-carry model in Chau et al. (2003) to adjust for the discount
of presales. The results after the adjustment are similar to the results based on a PRE
dummy and not reported here.

Price of New Housing and Market Power 319
5.2 Empirical Model
Using the first-hand price premium and other control variables described above,
our empirical model is:
𝐹𝑃 = 𝑎0 + 𝑎1𝑆𝑃 + 𝑎2𝑆𝑃2 + 𝑎3𝐷𝐴𝐺𝐸 + 𝑎4𝐷𝐴𝐺𝐸2 +𝑎5𝑃𝑅𝐸 + a6𝐵𝐼𝐺5 + 𝑫𝑼 + 𝑺𝑰𝑴 + 𝜀
(3)
where a0-a6 are coefficients to be estimated; BIG5 is a dummy variable which
equals 1 if the unit is sold by the five developers with the highest market share11
(see Table 1) and 0 otherwise; DU is a vector of variables that captures the
problem of liquidation; SIM is a vector of variables that measures similarity in
different ways; and ε is an error term. We suppress the subscript i to simplify
presentation. We add squared terms of SP and DAGE to allow for non-linearity.
Table 2 presents the definition of each variable.
Table 2 Description of Variables
Variable Description
FP Log of the ratio of first-hand price at t1 to second-hand price at t2 for the same unit
SP Log of the ratio of the district price index at t1 to the district price index at t2
SP2 Square of SP (to capture any non-linear effects) DAGE Building age at t1 minus building age at t2 for the same unit DAGE2 Square of DAGE (to capture any non-linear effects)
PRE A dummy variable that equals 1 if a unit is sold by the developer before building completion (i.e. a presale) and 0 otherwise
BIG5 A dummy variable that equals 1 if a unit is developed by the five developers with the highest market share and 0 otherwise
Variables related to demand uncertainty (DU) DEVS Development scale, in total number of units within a development
MKTS Market sentiment, measured by the past 12-month change in market price in log scale before the first-hand sale takes place
VOL Trading volume in the second-hand market at the time the first-hand sale takes place
Variables related to similarity (SIM) S Number of units within a catchment zone (radius=1 km or 1.5 km)
S3 Number of units within the catchment zone that meet these three criteria: 1) building age is within 5 years, 2) unit size is within ±100 square feet, and 3) floor level is within ±10 storeys
S3s Number of second-hand units in S3 S3f Number of first-hand units in S3 from other developments S3w Number of first-hand units in S3 within the same development
11 We have tried top three developers and the results (not reported) remain similar. Joint-
venture projects were not common except for very large sites, which are captured by
another variable on development scale (DEVS).
320 Wong, Li and Monkkonen
We demean all right-hand-side continuous variables so that we can interpret the
intercept, a0. a0 is the key parameter to test Hypothesis 1 (market power) against
Hypothesis 2 (liquidation). The former predicts that a0 is positive and the latter
predicts that it is negative.
Another parameter that can differentiate the two hypotheses is a6, the
coefficient of BIG5. If market power exists, it is most likely associated with
developers with a high market share. Hypothesis 1 predicts that a6 is positive.
In contrast, if the liquidation problem prevails, developers with a high market
share are likely to suffer most due to their high holding cost; they typically have
many projects in the pipeline and are under pressure to sell their units out in a
timely manner. If Hypothesis 2 is true, a6 should be negative.
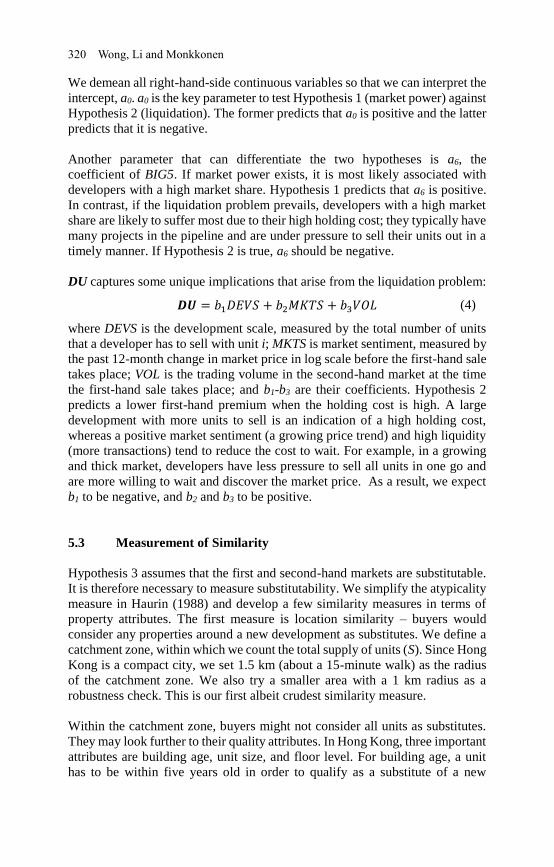
DU captures some unique implications that arise from the liquidation problem:
𝑫𝑼 = 𝑏1𝐷𝐸𝑉𝑆 + 𝑏2𝑀𝐾𝑇𝑆 + 𝑏3𝑉𝑂𝐿 (4)
where DEVS is the development scale, measured by the total number of units
that a developer has to sell with unit i; MKTS is market sentiment, measured by
the past 12-month change in market price in log scale before the first-hand sale
takes place; VOL is the trading volume in the second-hand market at the time
the first-hand sale takes place; and b1-b3 are their coefficients. Hypothesis 2
predicts a lower first-hand premium when the holding cost is high. A large
development with more units to sell is an indication of a high holding cost,
whereas a positive market sentiment (a growing price trend) and high liquidity
(more transactions) tend to reduce the cost to wait. For example, in a growing
and thick market, developers have less pressure to sell all units in one go and
are more willing to wait and discover the market price. As a result, we expect
b1 to be negative, and b2 and b3 to be positive.
5.3 Measurement of Similarity
Hypothesis 3 assumes that the first and second-hand markets are substitutable.
It is therefore necessary to measure substitutability. We simplify the atypicality
measure in Haurin (1988) and develop a few similarity measures in terms of
property attributes. The first measure is location similarity – buyers would
consider any properties around a new development as substitutes. We define a
catchment zone, within which we count the total supply of units (S). Since Hong
Kong is a compact city, we set 1.5 km (about a 15-minute walk) as the radius
of the catchment zone. We also try a smaller area with a 1 km radius as a
robustness check. This is our first albeit crudest similarity measure.
Within the catchment zone, buyers might not consider all units as substitutes.
They may look further to their quality attributes. In Hong Kong, three important
attributes are building age, unit size, and floor level. For building age, a unit
has to be within five years old in order to qualify as a substitute of a new

Price of New Housing and Market Power 321
development.12 For unit size, units are considered substitutable if their size
difference is less than 100 square feet. For high-rise condominiums, the vertical
location of a unit is often an important consideration as it affects the view and
environmental quality (Wong et al. 2011). Units are considered substitutable
only if their floor level difference is less than 10 stories. Our second similarity
measure is the number of units that jointly satisfy the above three criteria (S3).
We further divide S3 into market segments. Buyers who have targeted a first-
hand unit may consider other first-hand units as closer substitutes than second-
hand units. Other first-hand units may come from other developments or within
the same development, and these will have different degrees of substitutability.
We thus divide S3 into the three components: 1) the number of second-hand
units (S3s), 2) the number of first-hand units from other developments (S3f), and
3) the number of first-hand units within the same development (S3w). They form
our third similarity measure.
Now we can define the SIM variable in Eq (3) in three ways:
𝑺𝑰𝑴 = 𝑐1𝑆 (5a)
𝑺𝑰𝑴 = 𝑐1𝑆 + 𝑐2(𝑆3/𝑆) (5b)
𝑺𝑰𝑴 = 𝑐1𝑆 + 𝑐3(𝑆3𝑠/𝑆) + 𝑐4(𝑆3𝑓/𝑆) + 𝑐5(𝑆3𝑤/𝑆) (5c)
where c1-c5 are coefficients to be estimated. In Eqs (5b) and (5c), S3, S3s, S3f,
and S3w are entered as a ratio to S because they are a subset of S. Hypothesis 3
predicts that all the cs are negative. In particular, a first-hand unit should face a
stronger substitution effect from other first-hand units than second-hand units,
so c4 should be more negative than c3. Whether c4 should be more negative than
c5 is an empirical question. First-hand units from the same development should
be a closer substitute than those in other buildings (i.e. c4>c5), but a developer
could use sale strategies to reduce the effect of self-competition (i.e. c4<c5).
5.4 Data
We use a database of all condominium sales in Hong Kong from the Economic
Property Research Centre (EPRC). The data include price, sale date, building
age, floor level, and unit size. We cleaned or removed transactions that are
duplicate, incomplete, or erroneous. 13 To measure FPi, we focus on new
properties completed between 1995 and 2012. The first transaction of a unit is
classified as a first-hand sale and the rest as second-hand sales. We cut off in
12 As of 2012, about 50% of the condominium units in Hong Kong are younger than 25
years old (Rating and Valuation Department). 13 The raw data could contain transactions recorded 1) twice, 2) with an incomplete
address, or 3) with an overly low price (including zeros). We removed these before our
analysis.
322 Wong, Li and Monkkonen
2012 to allow sufficient time (five years) for repeat sales to occur. This results
in 88,983 pairs of repeat sales that involve a developer in the first sale and a
reseller in the second sale within five years of completion to minimize the
effects of depreciation.
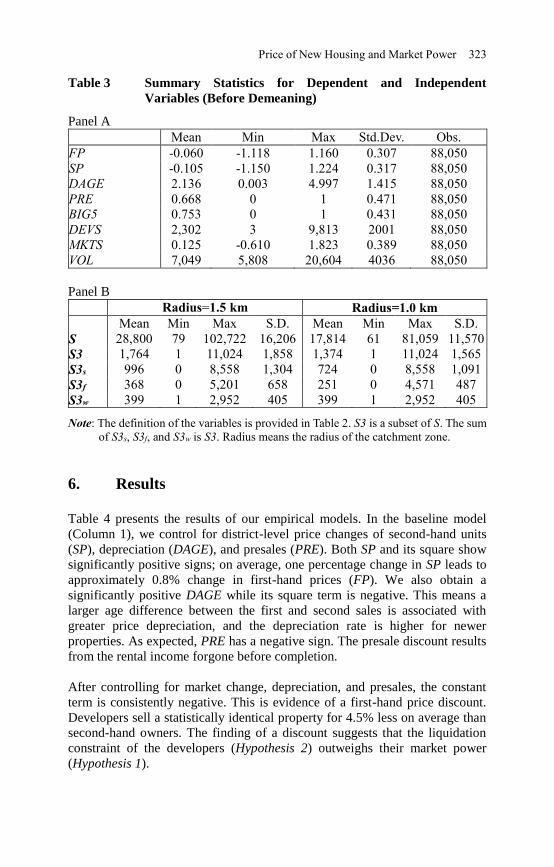
Table 3 summarizes the characteristics of the units in our sample statistics. As
shown in Panel A, the first-hand price is lower than the second-hand price of
the same unit by 6% (FP), simply because market prices have been rising (with
average SP being negative). The BIG5 variable requires data on the market
share of developers. We manually compile this with raw data from the Rating
and Valuation Department, Lands Department and Buildings Department of
The Government of the Hong Kong Special Administrative Region, and annual
reports of developers. We find that 75% repeat sales pairs in the sample come
from the five largest developers.
We collect the total number of units in each development (DEVS) from the
monthly reports of the Buildings Department. The average development has
2302 units, which suggests high holding costs. This partly explains why
presales have been a dominant sale strategy in Hong Kong (67% of the repeat
sales involve presales). Developers try to sell before completion in order to
reduce inventory costs on the one hand and exposure to market risk on the other
hand.
To calculate the similarity measures, we created a residential stock database for
all of Hong Kong by using data from EPRC and Centamap (an online service
that shows maps of Hong Kong based on data obtained from the Survey and
Mapping Office of The Government of the Hong Kong Special Administrative
Region). We collected the coordinates, building age, floor level, and size of
each unit in the district, regardless whether the unit was sold or not.
Panel B in Table 3 presents the summary statistics of our similarity measures.
We vary the radius of the catchment zone from 1.5 km to 1 km for robustness
check. On average, there are 28,800 units within 1.5 km of a subject first-hand
unit; within them, 1764 meet the three criteria based on building age, unit size,
and floor level. More than half the potential substitutes come from the second-
hand market, another 23% from the first-hand development itself, and the rest
from other first-hand developments. S3w remains the same regardless of the
change of the catchment zone area because it captures only the units within the
subject development.
Price of New Housing and Market Power 323
Table 3 Summary Statistics for Dependent and Independent
Variables (Before Demeaning)
Panel A
Mean Min Max Std.Dev. Obs.
FP -0.060 -1.118 1.160 0.307 88,050
SP -0.105 -1.150 1.224 0.317 88,050
DAGE 2.136 0.003 4.997 1.415 88,050
PRE 0.668 0 1 0.471 88,050
BIG5 0.753 0 1 0.431 88,050
DEVS 2,302 3 9,813 2001 88,050
MKTS 0.125 -0.610 1.823 0.389 88,050
VOL 7,049 5,808 20,604 4036 88,050
Panel B
Radius=1.5 km Radius=1.0 km
Mean Min Max S.D. Mean Min Max S.D.
S 28,800 79 102,722 16,206 17,814 61 81,059 11,570
S3 1,764 1 11,024 1,858 1,374 1 11,024 1,565
S3s 996 0 8,558 1,304 724 0 8,558 1,091
S3f 368 0 5,201 658 251 0 4,571 487
S3w 399 1 2,952 405 399 1 2,952 405
Note: The definition of the variables is provided in Table 2. S3 is a subset of S. The sum
of S3s, S3f, and S3w is S3. Radius means the radius of the catchment zone.
6. Results
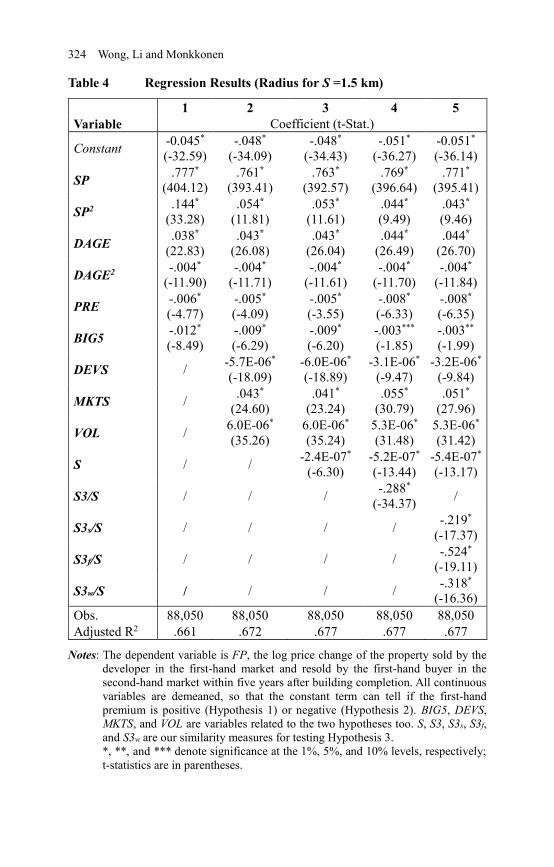
Table 4 presents the results of our empirical models. In the baseline model
(Column 1), we control for district-level price changes of second-hand units
(SP), depreciation (DAGE), and presales (PRE). Both SP and its square show
significantly positive signs; on average, one percentage change in SP leads to
approximately 0.8% change in first-hand prices (FP). We also obtain a
significantly positive DAGE while its square term is negative. This means a
larger age difference between the first and second sales is associated with
greater price depreciation, and the depreciation rate is higher for newer
properties. As expected, PRE has a negative sign. The presale discount results
from the rental income forgone before completion.
After controlling for market change, depreciation, and presales, the constant
term is consistently negative. This is evidence of a first-hand price discount.
Developers sell a statistically identical property for 4.5% less on average than
second-hand owners. The finding of a discount suggests that the liquidation
constraint of the developers (Hypothesis 2) outweighs their market power
(Hypothesis 1).
324 Wong, Li and Monkkonen
Table 4 Regression Results (Radius for S =1.5 km)
1 2 3 4 5
Variable Coefficient (t-Stat.)
Constant -0.045*
(-32.59)
-.048*
(-34.09)
-.048*
(-34.43)
-.051*
(-36.27)
-0.051*
(-36.14)
SP .777*
(404.12)
.761*
(393.41)
.763*
(392.57)
.769*
(396.64)
.771*
(395.41)
SP2 .144*
(33.28)
.054*
(11.81)
.053*
(11.61)
.044*
(9.49)
.043*
(9.46)
DAGE .038*
(22.83)
.043*
(26.08)
.043*
(26.04)
.044*
(26.49)
.044*
(26.70)
DAGE2 -.004*
(-11.90)
-.004*
(-11.71)
-.004*
(-11.61)
-.004*
(-11.70)
-.004*
(-11.84)
PRE -.006*
(-4.77)
-.005*
(-4.09)
-.005*
(-3.55)
-.008*
(-6.33)
-.008*
(-6.35)
BIG5 -.012*
(-8.49)
-.009*
(-6.29)
-.009*
(-6.20)
-.003***
(-1.85)
-.003**
(-1.99)
DEVS / -5.7E-06*
(-18.09)
-6.0E-06*
(-18.89)
-3.1E-06*
(-9.47)
-3.2E-06*
(-9.84)
MKTS / .043*
(24.60)
.041*
(23.24)
.055*
(30.79)
.051*
(27.96)
VOL / 6.0E-06*
(35.26)
6.0E-06*
(35.24)
5.3E-06*
(31.48)
5.3E-06*
(31.42)
S / / -2.4E-07*
(-6.30)
-5.2E-07*
(-13.44)
-5.4E-07*
(-13.17)
S3/S / / / -.288*
(-34.37) /
S3s/S / / / / -.219*
(-17.37)
S3f/S / / / / -.524*
(-19.11)
S3w/S / / / / -.318*
(-16.36)
Obs. 88,050 88,050 88,050 88,050 88,050
Adjusted R2 .661 .672 .677 .677 .677
Notes: The dependent variable is FP, the log price change of the property sold by the
developer in the first-hand market and resold by the first-hand buyer in the
second-hand market within five years after building completion. All continuous
variables are demeaned, so that the constant term can tell if the first-hand
premium is positive (Hypothesis 1) or negative (Hypothesis 2). BIG5, DEVS,
MKTS, and VOL are variables related to the two hypotheses too. S, S3, S3s, S3f,
and S3w are our similarity measures for testing Hypothesis 3.
*, **, and *** denote significance at the 1%, 5%, and 10% levels, respectively;
t-statistics are in parentheses.
Price of New Housing and Market Power 325
Moreover, the top five developers who occupy most of the market share sell at
an added 1% discount compared to other smaller developers. This finding again
rejects market power (Hypothesis 1) in favor of the liquidation argument
(Hypothesis 2) that developers who are holding hundreds or even thousands of
units should sell at a lower price to reduce holding costs. Any sale delay in one
project could have brought huge adverse impact to the big developers who have
many other units to sell in the pipeline.
In Column 2, we include another three variables to further test the liquidation
argument through variations in holding cost. Suggested by the negative sign of
DEVS, a larger development scale is associated with a lower first-hand price
relative to second-hand price (i.e. a larger first-hand discount). The high holding
cost caused by having more units in a development forces developers to lower
the price for a faster sale, rather than strengthening their market power due to
greater uniqueness of the product or tendency to form joint ventures between
developers.14 Both market sentiment (MKTS) and trading volume (VOL) exert
strong positive impact on first-hand price relative to second-hand price. With
the signal of rapid historical price increase and high liquidity in the second-
hand market, the holding cost of developers is reduced and they do not have to
cut their prices that much.
The other columns report the results that include our similarity measures. They
all support Hypothesis 3. The number of units within the catchment zone (S)
has a significantly negative coefficient, which means that the presence of more
units nearby gives developers pressure to lower first-hand prices (Column 3).
The degree of similarity also matters, as S3/S, which measures the portion of
close substitutes, further exerts a significantly negative impact on the first-hand
price relative to second-hand price (Column 4).
We further compare the negative effect from different types of substitutes in
Column 5. S3s represents Type 1 substitutes from the second-hand market and
has a negative coefficient. S3f and S3w measure Types 2 and 3 substitutes from
the first-hand market, respectively. Both have a more negative coefficient than
Type 1 substitutes, which means that first-hand substitutes have a stronger
impact on the first-hand price than second-hand substitutes.
Quality-wise, Type 3 should be the closest substitute since they are produced
by the same developer at the same time and should exert the strongest negative
impact on the first-hand price. However, S3w has a smaller negative coefficient
than S3f. This suggests that a developer may be able to use some sale strategies,
such as phased sales, to reduce the impact of self-competition. Nevertheless,
they do not eliminate the discount.
14 DEVS could also proxy for cost efficiency. However, this is not a sufficient condition
for developers to sell at lower prices because if they knew that prices would be adjusted
to the market level upon resale, they would not have offered a discount in the first place.
326 Wong, Li and Monkkonen
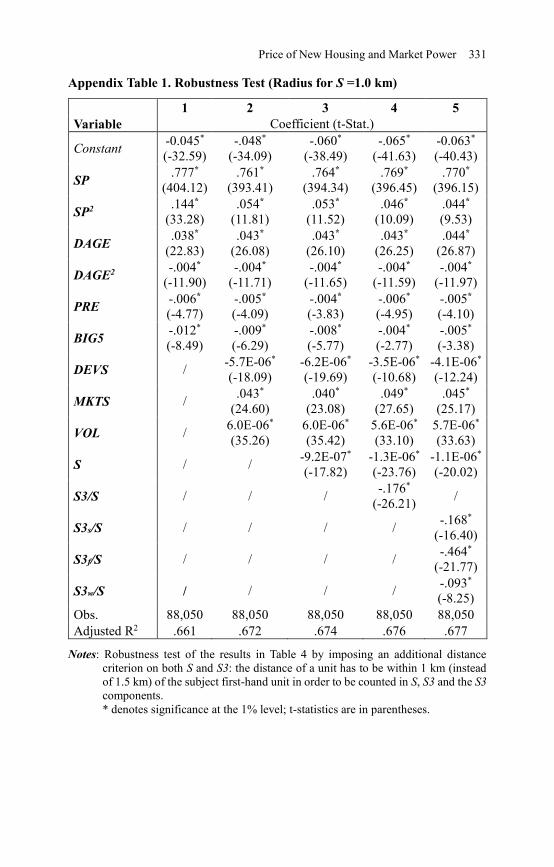
Appendix Table 1 presents the results of the robustness checks by using a
different distance criterion to construct our similarity measures. The results do
not differ substantially from the previous results.
7. Conclusion
Housing policies that place burdens for community benefits or affordable
housing on developers are increasingly common in the United States. Animus
towards developers and development and the perception of ill-gotten gains
likely animate the popularity of this approach (Monkkonen and Manville, 2018).
The relative dearth of research on the real estate industry, especially in regards
to market concentration and market power, limits the debate over this type of
policy and other efforts to improve efficiency in housing production and reduce
corruption at the local level.
This paper tackles one aspect of market power in housing production. We
address the question of how developers price new housing, and whether their
market power allows them to set prices above that of a competitive market. In
comparing the first and second-hand condominium markets in Hong Kong, we
systematically examine two inter-related issues. First, since market
concentration and high prices characterize the first hand housing market, it
seems that first-hand sellers have market power. This, however, ignores the
quality differences between the two markets, as well as the theoretical
proposition that market power over durable goods is difficult to attain.
Second, the market power explanation ignores the liquidation constraints faced
by sellers. However concentrated a market, first-hand sellers do not know the
highest price they can obtain for their goods. This demand uncertainty affects
first-hand sellers most because they have a larger quantity of goods to sell.
Developers must charge less to maintain the same speed of sales and reduce
their market risk.
Abundant data from the condominium market in Hong Kong enable us to
examine these issues by using a repeat-sales approach. We track the first and
second-hand prices of the same condominium unit over time and compare them
with corresponding sales in the second-hand market. We therefore control for
unobservable qualities of the units such as the reputation of the developers. We
find that the first-hand market is highly concentrated, but that first-hand unit
prices are lower than second-hand prices after controlling for quality
differences.
More importantly, we also find that the first-hand discount is higher for larger
developments and lower when market liquidity is high. These findings
collectively support the liquidation argument more than market power.
Moreover, we find that developers are more sensitive to substitutes than

Price of New Housing and Market Power 327
resellers. We define substitutes as the number of units with similar attributes
within a catchment zone. In particular, we show that developers are competing
with their own product once they have sold some of their units. Developers
cannot fully offset this self-competition effect with the use of sale strategies
such as phased sales.
From a policy perspective, our findings show how the second-hand market can
serve as a self-regulating instrument to constrain the market power of
developers. Whenever developers overprice their first-hand units, buyers have
the choice to turn to the second-hand market. The presence of such a ‘threat’
automatically forces developers to set a more competitive price, without the
need for government intervention. This implies that governments should
promote transparency (e.g. by making sales data more available) and liquidity
(e.g. by shifting away from transaction taxes towards property taxes) in the
second-hand market to maintain a competitive check on the price of new units.
Although we do not find evidence of market power when developers sell their
units in the product market, they might still have market power in other stages
of the development process. In the market for land, major infrastructure services,
or permits required to build large buildings, there might be a quasi-monopsony.
This is an important question for future anti-trust research in Hong Kong and
abroad. Additionally, this paper suggests an important path for further research
on how market conditions – especially the concentration of housing
development and the relative importance of new housing in the overall market
– shape the impact of market power and demand uncertainty on the pricing of
new housing.
Acknowledgement
This project is financially supported by the RGC General Research Fund (GRF
17201515).

328 Wong, Li and Monkkonen
References
Been, V., Ellen, I.G. and O’Regan, K. (2017). Supply Skepticism: Housing
Supply and Affordability. Mimeo, New York University.
Bulow, J.I. (1982). Durable-Goods Monopolists. Journal of Political Economy,
90(2), 314-332.
Buzzelli, M. (2001). Firm Size Structure in North American Housebuilding:
Persistent Deconcentration, 1945 -1998. Environment and Planning A, 33, 533-
550.
Chau, K.W., Wong, S.K. and Yiu, C.Y. (2003). Price Discovery Function of
Forward Contracts in Real Estate Markets: An Empirical Test. Journal of
Financial Management of Property and Construction, 8(3), 129-137.
City of Los Angeles (2017). Building Permit Data.
Coase, R.H. (1972) Durability and Monopoly. Journal of Law and Economics,
15(1), 143-149.
Consumer Council. (1996). How Competitive Is the Private Residential
Property Market? Hong Kong.
Coulson, N.E., Morris, A.C. and Neill, H.R. (2019) Are New Homes Special?
Real Estate Economics, 47(3), 784-806.
Cronin, F.J. (1983). Market Structure and The Price of Housing Services.
Urban Studies, 20(3), 365-375.
Cyrnak, A.W. and Hannan, T.H. (1999). Is the Cluster Still Valid in Defining
Banking Markets? Evidence from A New Data Source. Antitrust Bull., 44, 313.
Demsetz, H. (1973). Industry Structure, Market Rivalry, and Public Policy.
Journal of Law and Economics, 16(1), 1-9.
Dipasquale, D. (1999). Why don’t We Know More About Housing Supply?
Journal of Real Estate Finance and Economics, 18(1): 9-23.
Esteban, S. and Shum, M. (2008). Durable-Goods Oligopoly with Secondary
Markets: The Case of Automobiles. RAND Journal of Economics, 38(2), 332-
354.
Gatzlaff, D.H. and Haurin, D.R. (1997) Sample Selection Bias and Repeat-
Sales Index Estimates. Journal of Real Estate Finance and Economics, 14, 33-
50.
Price of New Housing and Market Power 329
Guy, P. (2016). Hong Kong’s Real Estate Market Is Rigged in FavouroOf
Property Tycoons. South China Morning Post, May 15.
Haskel, J., Iozzi, A. and Valletti, T. (2013). Market Structure, Countervailing
Power and Price Discrimination: The Case of Airports. Journal of Urban
Economics, 74, 12-26.
Haurin, D. (1988). The Duration of Marketing Time of Residential Housing.
Real Estate Economics, 16(4), 396-410.
Lai, R.N., Wang, K. and Zhou, Y. (2004). Sale Before Completion of
Development: Pricing and Strategy. Real Estate Economics, 32(2), 329-357.
Los Angeles Business Journal. (2018). The List: Residential Developers. April
16.
MacDonald, J.M. (2000). Demand, Information, and Competition: Why do
Food Prices Fall at Seasonal Demand Peaks? The Journal of Industrial
Economics, 48(1), 27-45.
Manville, M. and Osman, T, 2017). Motivations for Growth Revolts: Discretion
and Pretext as Sources of Development Conflict. City & Community, 16(1), 66-
85.
Maskin, E. and Tirole, J. (1988). A Theory of Dynamic Oligopoly, I: Overview
and Quantity Competition with Large Fixed Costs. Econometrica, 56(3), 549-
569.
Möller, M. and Watanabe, M. (2010). Advance Purchase Discounts Versus
Clearance Sales. The Economic Journal, 120(547), 1125-1148.
Monkkonen, P. and Manville, M. (2018). Opposition to Development or
Opposition to Developers? Survey Evidence from Los Angeles County on
Attitudes towards New Housing. UCLA Ziman Center Working Paper 2018-
04.
Monkkonen, P. and Zhang, X. (2014). Innovative Measurement of Spatial
Segregation: Comparative Evidence from Hong Kong and San Francisco.
Regional Science and Urban Economics, 47(3): 99-11.
Morris, J.R. (1988). The Relationship between Industrial Sales Prices and
Concentration of Natural Gas Pipelines. FTC.
Newmark, C.M. (1990). A New Test of The Price-Concentration Relationship
in Grocery Retailing. Economics Letters, 33(4), 369-373.
Newmark, C.M. (2004). Price-Concentration Studies: There You Go Again.
330 Wong, Li and Monkkonen
Nocke, V., and Peitz, M. (2007). A Theory of Clearance Sales. The Economic
Journal, 117(522), 964-990.
Ott, S.H., Hughen, W.K. and Read, D.C. (2012). Optimal Phasing and
Inventory Decisions for Large-Scale Residential Development Projects.
Journal of Real Estate Finance and Economics, 45(4), 888-918.
Pautler, P.A. (2003). Evidence on Mergers and Acquisitions. Antitrust Bull., 48,
119.
Rating and Valuation Department (2018). Hong Kong Property Review. The
Government of Hong Kong Special Administrative Region.
Reyes, S. (2018). Inclusionary Housing in Soft or Mixed Markets. Shelterforce,
May 7.
Schmalensee, R. (1989). Inter-Industry Studies of Structure and Performance.
Handbook of Industrial Organization, 2, 951-1009.
Sirmans, C.F., Turnbull, G.K. and Dombrow, J. (1997). Residential
Development, Risk, and Land Prices. Journal of Regional Science, 37(4), 613-
628.
Tenants Together (2018). Making the Case for Rent Control. Available at:
medium.com/@tenantstogether/making-the-case-for-rent-control-
c598740f5ce8 (last accessed 7/9/2018).
Wang, K. and Zhou, Y. (2006). Equilibrium Real Options Exercise Strategies
with Multiple Players: The Case of Real Estate Markets. Real Estate Economics,
34(1), 1-49.
Weiss, L.W. (1989). Concentration and Price. MIT Press.
Wong, S.K., Chau, K.W., Yau, Y. and Cheung, A.K.C. (2011). Property Price
Gradients: The Vertical Dimension. Journal of Housing and the Built
Environment, 26, 33-45.
Price of New Housing and Market Power 331
Appendix Table 1. Robustness Test (Radius for S =1.0 km)
1 2 3 4 5
Variable Coefficient (t-Stat.)
Constant -0.045*
(-32.59)
-.048*
(-34.09)
-.060*
(-38.49)
-.065*
(-41.63)
-0.063*
(-40.43)
SP .777*
(404.12)
.761*
(393.41)
.764*
(394.34)
.769*
(396.45)
.770*
(396.15)
SP2 .144*
(33.28)
.054*
(11.81)
.053*
(11.52)
.046*
(10.09)
.044*
(9.53)
DAGE .038*
(22.83)
.043*
(26.08)
.043*
(26.10)
.043*
(26.25)
.044*
(26.87)
DAGE2 -.004*
(-11.90)
-.004*
(-11.71)
-.004*
(-11.65)
-.004*
(-11.59)
-.004*
(-11.97)
PRE -.006*
(-4.77)
-.005*
(-4.09)
-.004*
(-3.83)
-.006*
(-4.95)
-.005*
(-4.10)
BIG5 -.012*
(-8.49)
-.009*
(-6.29)
-.008*
(-5.77)
-.004*
(-2.77)
-.005*
(-3.38)
DEVS / -5.7E-06*
(-18.09)
-6.2E-06*
(-19.69)
-3.5E-06*
(-10.68)
-4.1E-06*
(-12.24)
MKTS / .043*
(24.60)
.040*
(23.08)
.049*
(27.65)
.045*
(25.17)
VOL / 6.0E-06*
(35.26)
6.0E-06*
(35.42)
5.6E-06*
(33.10)
5.7E-06*
(33.63)
S / / -9.2E-07*
(-17.82)
-1.3E-06*
(-23.76)
-1.1E-06*
(-20.02)
S3/S / / / -.176*
(-26.21) /
S3s/S / / / / -.168*
(-16.40)
S3f/S / / / / -.464*
(-21.77)
S3w/S / / / / -.093*
(-8.25)
Obs. 88,050 88,050 88,050 88,050 88,050
Adjusted R2 .661 .672 .674 .676 .677
Notes: Robustness test of the results in Table 4 by imposing an additional distance
criterion on both S and S3: the distance of a unit has to be within 1 km (instead
of 1.5 km) of the subject first-hand unit in order to be counted in S, S3 and the S3
components.
* denotes significance at the 1% level; t-statistics are in parentheses.

332 Wong, Li and Monkkonen