How digital tools and solutions can improve Subsea Integrity ...
89
INTEGRITY MANAGEMENT AND CONDITION MONITORING OF PIPELINES AND SUBSEA EQUIPMENT (2020/1022) 2020/1022: How digital tools and solutions can improve Subsea Integrity Management Petroleumstilsynet Report No.: 2020-1137, Rev. 0 Document No.: 872868 Date: 2020-12-03
-
Upload
khangminh22 -
Category
Documents
-
view
0 -
download
0
Transcript of How digital tools and solutions can improve Subsea Integrity ...

INTEGRITY MANAGEMENT AND CONDITION MONITORING OF PIPELINES AND SUBSEA EQUIPMENT (2020/1022)
2020/1022: How digital tools and solutions can improve Subsea Integrity Management Petroleumstilsynet Report No.: 2020-1137, Rev. 0 Document No.: 872868 Date: 2020-12-03
DNV GL – Report No. 2020-1137, Rev. 0 – www.dnvgl.com Page i
Project name: Integrity management and condition monitoring of
pipelines and subsea equipment (2020/1022) DNV GL AS Oil & Gas Pipeline Operations & Flow Veritasveien 1 1363 Høvik Norway NO945748931
Report title: 2020/1022: How digital tools and solutions can improve Subsea Integrity Management
Customer: Petroleumstilsynet, Professor Olav Hanssens vei 10 4021 STAVANGER Norway
Customer contact: Trond Sundby Date of issue: 2020-12-03 Project No.: 10247828 Organization unit: Pipeline Operations & Flow Report No.: 2020-1137, Rev. 0 Document No.: 872868 Applicable contract(s) governing the provision of this Report: Contract no. 06712 Objective:
To establish a status of available information, knowledge and tools that can provide better integrity management of pipelines and underwater installations. Such tools can give a better overview of the state of the system, reduce the risk of incidents and provide a more predictable operation of the facilities.
Highlight areas where knowledge and information are not fully systematized and utilized for continuous improvement and risk reduction.
Prepared by: Verified by: Approved by:
Hans Petter Ellingsen Principal Consultant – Asset Risk Management
Christian Markussen Senior Principal Engineer - Subsea
Anne Britt Høydal Head of Section, Pipeline Operations and Flow
Øystein Bjaanes Principal Engineer - Materials
Ketil Firing Hanssen Principal Engineer – Subsea Technology
Bente H. Leinum Senior Principal Engineer – Pipelines Operations
DNV GL – Report No. 2020-1137, Rev. 0 – www.dnvgl.com Page ii
Copyright © DNV GL 2020. All rights reserved. Unless otherwise agreed in writing: (i) This publication or parts thereof may not be copied, reproduced or transmitted in any form, or by any means, whether digitally or otherwise; (ii) The content of this publication shall be kept confidential by the customer; (iii) No third party may rely on its contents; and (iv) DNV GL undertakes no duty of care toward any third party. Reference to part of this publication which may lead to misinterpretation is prohibited. DNV GL and the Horizon Graphic are trademarks of DNV GL AS. DNV GL Distribution: Keywords: ☒ OPEN. Unrestricted distribution, internal and external. Digitalization, Data, Tools, Integrity
Management, Containment, Pipelines, Risers, Subsea Production System, SPS
☐ INTERNAL use only. Internal DNV GL document. ☐ CONFIDENTIAL. Distribution within DNV GL according to
applicable contract.*
☐ SECRET. Authorized access only. *Specify distribution: Rev. No. Date Reason for Issue Prepared by Verified by Approved by
0 2020.12.03 Final version OBJA, ELLING, KFH, BLEI CMAR ANBRI
A 2020.11.13 First issue – issued for comments OBJA, ELLING, KFH, BLEI CMAR ANBRI

DNV GL – Report No. 2020-1137, Rev. 0 – www.dnvgl.com Page iii
Table of contents
1 EXECUTIVE SUMMARY ..................................................................................................... 1
2 INTRODUCTION .............................................................................................................. 4 2.1 Background 4 2.2 Scope of Work 4 2.3 Methodology 5 2.4 Industry stakeholders 6 2.5 Definitions and abbreviations 7
3 INTEGRITY MANAGEMENT – SUBSEA INSTALLATIONS ....................................................... 10 3.1 General description of subsea installations 10 3.2 Integrity Management 11 3.3 Integrity Management System 12 3.4 Typical degradation mechanisms for subsea installations 13 3.5 Condition monitoring of subsea systems 14 3.6 Petroleum Safety Authority Regulations 17
4 STATUS OF EMERGING METHODS, TOOLS AND TECHNOLOGIES FOR DATA COLLECTION AND ANALYTICS ........................................................................................ 19
4.1 Autonomous underwater vehicles to conduct subsea surveys 20 4.2 The use of sensor technology 23 4.3 Monitoring of ship traffic to identify areas exposed to trawl risks 23 4.4 The use of digital twins, platforms and ecosystems 25 4.5 Use of Machine Learning and Artificial Intelligence in integrity management 28 4.6 Standardisation of data exchange 30 4.7 Ongoing NRC funded programs and projects 32
5 CURRENT PRACTICES AND SOLUTIONS ........................................................................... 34 5.1 Technologies to facilitate effective use of data 34 5.2 Work processes / operational aspects 35 5.3 Roles and responsibilities – organisational aspects 37 5.4 Use of data to improve the risk understanding 38 5.5 Integrity management of subsea assets 49
6 CHALLENGES AND OPPORTUNITIES ................................................................................ 57 6.1 Challenges 57 6.2 Opportunities 58
7 REFERENCES ................................................................................................................ 61 Appendix A Questionnaire with graphical results Appendix B Data collection and purpose Appendix C Typical threats and failure modes for subsea systems
DNV GL – Report No. 2020-1137, Rev. 0 – www.dnvgl.com Page 1
1 EXECUTIVE SUMMARY Data management and use of data, facilitated by digital tools and solutions, can bring various benefits to day-to-day operations, such as increased efficiency, optimization, cost reduction and safety. For integrity management specifically, industry data, historical data and real-time data allow operators to improve maintenance and inspection regimes if implemented and utilized appropriately. In the operation of oil and gas assets, there are various types of data being collected and information being produced. For pipeline, riser and subsea systems, these may include sensor data, measurements, test results, inspection results, integrity analyses and assessments. Typically, this information is made available in various formats and platforms. Getting an overview of the system, as well as access to the details for the purpose of assessing and managing integrity, is often challenging.
The drivers for data management and digitalization are to a large extent cost reduction, better control and efficiency of work, and thus also an increased level of safety. There is a demand for new technology and associated processes to provide increased safety and a better overview of the status and condition of the assets, hence the risk.
For the reasons mentioned above, the Petroleum Safety Authority (PSA) commissioned DNV GL to perform a study on how digital tools and solutions may improve the integrity management of subsea systems. The work is based on publicly available information and information gathered from various stakeholders in the Norwegian subsea market, including operators, engineering companies and service providers, to describe the current situation and opportunities for subsea integrity management. The stakeholders’ involvement has mainly been through interviews and response to a questionnaire.
This document gives a general introduction to integrity management of subsea installations (Section 3). It describes the status of emerging methods, tools and technologies for data collections and analytics considered to be important enablers for improved integrity management in both short and medium term (Section 4). This is put in context with the current practices and solutions for use of data to ensure integrity of subsea systems, considering the various authority regulations (Section 5). The work is summarised by identifying challenges and improvement opportunities supporting the industry to further increase efficiency, reduce cost, improve safety and comply with the intentions of the PSA regulations (Section 6).
The subsea industry is investing in methods for improved data collection including significant investments into more autonomous underwater vehicles (AUVs). This to enable more frequent surveys and gather inspection data with better data quality that contributes to improved integrity understanding. However, when it comes to use of the data there has been limited investments into automated anomaly detection and data integration to enable data driven condition models and risk models. Subsea integrity management is still to a large extent a manual process relying on finding the relevant data from a number of sources and for the subject matter expert to analyse large amounts of data to assess the technical condition, the associated risk, and plan the integrity management activities. New enabling technologies such as cloud storage and computing as well as increased computational power has not yet triggered a significant change in how the subsea integrity is managed.
Data is to a large extent perceived to represent a cost and should to a larger extent be transformed to information in order to represent value. More open sharing of data, methods and models may enable the subsea industry to move faster forward through learning and innovation. Business cases to drive further development to create value from data should be developed through cross collaboration amongst engineering companies, service providers and oil & gas Operators.
DNV GL – Report No. 2020-1137, Rev. 0 – www.dnvgl.com Page 2
Data driven condition and risk models will not reduce the need for subject matter experts within subsea systems and integrity management but will require new competences and new ways of working to effectively utilise the new enabling technologies. The development, which will require further investments to solve complex tasks, will require managers to understand the business value and set ambitious goals. The subsea industry should take more benefit from having become part of an IT industry and capitalize on the value of the vast amount of data available for use.
The development into more data driven subsea integrity management will further support the intentions of the PSA regulations and enable both cost reduction and safety improvements in the industry. At the same time, it is vital that PSA continues its role to enforce requirements related to data analysis and continuous improvement through its supervision activities.
The main identified challenges and opportunities are briefly summarised below. Challenges:
Availability of information: Updated information to show the current technical condition and associated risk is only intermittently available to stakeholders (e.g. management, partners) and regulators:
• The data is typically collected, assessed and presented/reported at certain milestones.
• Data to inform about technical condition and associated risk are typically stored in several different systems, and partly in files on servers with limited access (i.e. lack of integrated systems).
• Integration and interpretation of data is highly dependent on manual assessments from dedicated subject matter experts.
Unclear business case: It is a challenge to develop and demonstrate a sound business case for extensive initiatives to improve data collection and integration:
• Technology development and qualification have a high cost. Ref. e.g. AUV and Machine Vision initiatives, as well as purpose made integrity management software tools or digital twins accessing all relevant and contextualised data through data integration platforms and using algorithms for diagnostics and predictions.
• Economic benefits from improved integrity and barrier management is difficult to quantify, and the value of having subsea engineers and subject matter experts collecting and assessing the data is – by some - perceived to be difficult to replace.
• Even though monitoring data are trusted, these are – to a great extent - not used to adjust inspection intervals, hence, not used to potentially reduce cost associated with offshore operations.
Leak detection: Data to inform about small or diffuse hydrocarbon leaks, and strategies for leak detection, are considered to be areas of potential improvement:
• Monitoring technologies for detection of small or diffuse leaks, typically from subsea connectors and bolted connections, need to be better understood and qualified to provide reliable detection data.
• Leak detection strategies and criteria need to be improved to provide reliable detection and response to small or diffuse subsea leaks.
Integrity management of flexible risers: Data to inform about the development of credible failure modes in flexible risers and jumpers should be improved:

DNV GL – Report No. 2020-1137, Rev. 0 – www.dnvgl.com Page 3
Inspection and monitoring technologies to reliably confirm the condition and predict the degradation of the metallic and non-metallic layers in flexible pipes still need to be improved in order to increase the understanding and reduce the uncertainty.
Opportunities:
Data contextualisation: There are no technical showstoppers for combining data into integrated systems to enable dynamic integrity management and risk management. Enablers include cloud-based storage, increased computational power, data platforms, digital twins and ecosystems, as well as standardisation. It is, however, costly and time consuming, and takes management dedication and stamina to achieve.
Standardisation: Standard ontologies for semantic asset information models and standardised data formats for easier exchange, integration and comparison / trending of data are considered significant enablers for developing models and automation, as well as to enable sharing of data.
Automated anomaly detection: Machine Learning is unbiased and is more capable of continuous monitoring for, and identification of, anomalies and patterns compared to humans, provided it has been trained with unbiased representative data sets for the task it has been set up to perform. AUVs with Machine Vision capabilities, and new sensor technologies in combination with Machine Learning, represent a unique opportunity for more advanced monitoring and inspection. Integrity related acceptance criteria and performance standards for subsea systems can be built into automated anomaly detection algorithms triggering the first steps of the integrity assessment process.
Learning through sharing: Subsea integrity management is characterized by vast amount of data collected and available for use. There is a big value in all these data sources if made freely available, accessible and searchable for all players. Operators do not compete on subsea integrity management and collaboration to share data may therefore be possible.
Work processes and systems to facilitate sharing of data and knowledge may be an enabler for learning and improved integrity management; in own organisation, in the supply chains and across the industry. Systematic collection, analysis and sharing of data and information about degradation, damage and failure, as well as information of what robust integrity looks like, may support improvement to technology, equipment, systems, operation and integrity management of subsea systems.
DNV GL – Report No. 2020-1137, Rev. 0 – www.dnvgl.com Page 4
2 INTRODUCTION
2.1 Background The Petroleum Safety Authority (PSA) has commissioned DNV GL to perform a study on how digital tools and solutions may improve integrity management of subsea systems. Figure 2-1 shows examples of various main systems in a subsea field. PSA has formulated two objectives of the study:
• To establish a status of available information, knowledge and tools that can provide better integrity management of subsea systems. Such tools can give a better overview of the state of the system, reduce the risk of incidents and provide a more predictable operation of the facilities.
• Highlight areas where knowledge and information are not fully systematized and utilized for continuous improvement and risk reduction.
Understanding the condition of all elements of a subsea system is vital to ensuring safe operations and production. This is achieved by managing the integrity of the subsea assets. There is a large number of data systems and sources that can be utilized to reach this goal. Current technologies allow the industry to link different data sources together to increase accessibility to the data. The challenge is however multiple, such as to which level the integration of such sources is implemented in the operator’s organisations and how to manage the single source of truth (SSOT) over the entire life span. The life span can exceed 50 years for a subsea installation. Which data is important to retain and how to manage these needs to be defined, taking into consideration how they may change as an asset moves throughout the lifecycle. Change of ownership of subsea installations from one operator to another, followed by lack of detailed documentation of the system, loss of data and functionality in the transition process has also shown to pose a challenge.
Project data documents the original design and the associated acceptance criteria. Once the asset becomes operational, the need to know whether the system has been operated within these design limits and what frequency and accuracy of operational data that are needed, arise. Getting closer to the original design life, the operator needs to know what the remaining useful life is, calling for a re-qualification of the original design based on actual conditions allowing further operation of the system followed by e.g. upgrades, refurbishments or replacement of critical components.
The study described in this report is looking at the effect digital tool and solutions have on work related to integrity management, maintenance and safe operation of pipelines, risers and subsea facilities. It considers how integrity management work processes and roles may change as a result of digitalization, as well as the opportunities in prediction, optimized operations, planning and risk management. It will describe the current status of integrity management of pipeline and subsea systems today, as well as challenges and opportunities going forward.
2.2 Scope of Work The work has covered:
- how opportunities that currently lie in digital solutions as e.g. autonomous underwater drones, image processing and interpretation, machine learning and digital twins are utilized in order to ensure integrity. In this study, ‘integrity’ means the ‘containment function’ as defined in /1/.
- identification of opportunities that are not usually being exploited today in relation to analysis of data, whether it comes from sensors, production data, inspection or monitoring data etc.

DNV GL – Report No. 2020-1137, Rev. 0 – www.dnvgl.com Page 5
The main study outcomes related to data, tools and methods for subsea integrity management summarized in this report are as follows:
• Current status in the industry
• Challenges slowing down or preventing the use of data to further improve integrity management
• Key opportunities not sufficiently explored or used by the industry
Battery limits covered by the report is the hydrocarbon chain from (but not including) the wellhead to (but not including) topside / shore including rigid and flexible pipelines (infield and transport) and risers, X-mas tree, manifolds. The study does not cover the integrity of the control system, however, monitoring of parameters performed outside the battery limits and which are important for the integrity of equipment within battery limits, e.g. control system, is included.
The study covers the Norwegian continental shelf (NCS) under the Norwegian petroleum regulations and is limited to the containment function.
Figure 2-1 Examples of various main systems in a subsea field /5/
2.3 Methodology To ensure that the provided results represent a broader view of the status of the industry, DNV GL has conducted a series of meetings with operators, engineering companies and service providers based on a pre-defined question scheme in order to establish the current status and opportunities for subsea integrity management.
Other sources of information include public sources and DNV GL’s inhouse experience and competence.
DNV GL – Report No. 2020-1137, Rev. 0 – www.dnvgl.com Page 6
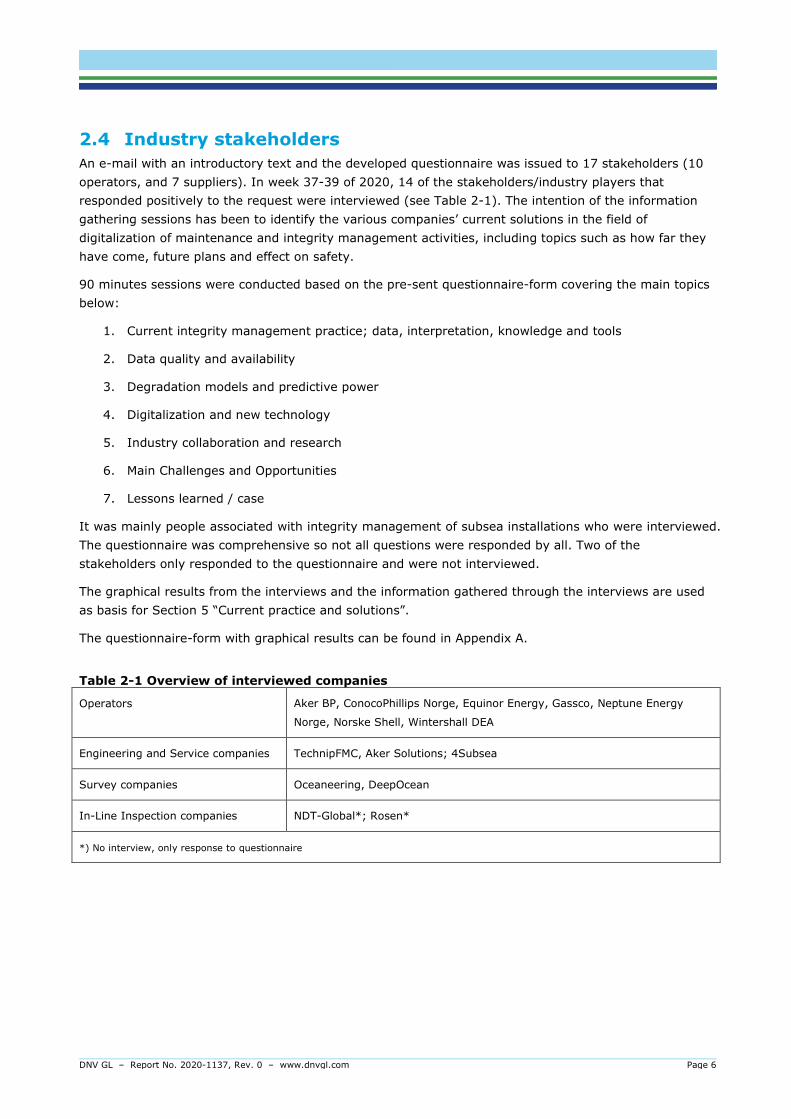
2.4 Industry stakeholders An e-mail with an introductory text and the developed questionnaire was issued to 17 stakeholders (10 operators, and 7 suppliers). In week 37-39 of 2020, 14 of the stakeholders/industry players that responded positively to the request were interviewed (see Table 2-1). The intention of the information gathering sessions has been to identify the various companies’ current solutions in the field of digitalization of maintenance and integrity management activities, including topics such as how far they have come, future plans and effect on safety.
90 minutes sessions were conducted based on the pre-sent questionnaire-form covering the main topics below:
1. Current integrity management practice; data, interpretation, knowledge and tools
2. Data quality and availability
3. Degradation models and predictive power
4. Digitalization and new technology
5. Industry collaboration and research
6. Main Challenges and Opportunities
7. Lessons learned / case
It was mainly people associated with integrity management of subsea installations who were interviewed. The questionnaire was comprehensive so not all questions were responded by all. Two of the stakeholders only responded to the questionnaire and were not interviewed.
The graphical results from the interviews and the information gathered through the interviews are used as basis for Section 5 “Current practice and solutions”.
The questionnaire-form with graphical results can be found in Appendix A.
Table 2-1 Overview of interviewed companies
Operators Aker BP, ConocoPhillips Norge, Equinor Energy, Gassco, Neptune Energy
Norge, Norske Shell, Wintershall DEA
Engineering and Service companies TechnipFMC, Aker Solutions; 4Subsea
Survey companies Oceaneering, DeepOcean
In-Line Inspection companies NDT-Global*; Rosen*
*) No interview, only response to questionnaire

DNV GL – Report No. 2020-1137, Rev. 0 – www.dnvgl.com Page 7
2.5 Definitions and abbreviations Abbreviations
Abbreviation Description
AI Artificial Intelligence
AIM Asset Information Model
AUV Autonomous Underwater Vehicle
CBM Choke Bridge Module
CDF Computational fluid dynamics
CMMS Computerized Maintenance Management System
CP Cathodic Protection
DFI Design Fabrication Installation (resume)
DOB Depth of Burial
DT Digital Twin
FE Functional Element
FIV Flow Induced Vibration
FLIP Flow Induced Pulsation
FMECA Failure mode effects and criticality analysis
HAZID Hazard Identification Studies
HCLD Hydrocarbon Leak Detector
ILI In Line Inspection
IMS Integrity Management System
MAR Major Accident Risk
MIC Microbiologically Influenced Corrosion
MFL Magnetic Flux Leakage
ML Machine Learning
NCS Norwegian Continental Shelf
NDT Non-Destructive Testing
NLP Natural Language Processing
OEM Original Equipment Manufacturer
DNV GL – Report No. 2020-1137, Rev. 0 – www.dnvgl.com Page 8
PSA Petroleum Safety Authority (Norwegian: PTIL)
PTIL Petroleumstilsynet (English: PSA)
RBI Risk Based Inspection
RNNP Trends in risk level in the Norwegian petroleum activities (Risikonivå i norsk petroleumsvirksomhet)
ROV Remote Operated Vehicle
RP Recommended Practice
SCM Subsea Control Module
SIGMA Subsea Integrity Graph Management Application
SIM Subsea Integrity Management
SPS Subsea Production System
SSOT Single Source of Truth
VIV Vortex Induced Vibrations
XT Christmas Tree (also described as Xmas Tree)
Definitions
Term Description
Acceptance criteria
(i.e. design limits)
specified indicators or measures providing an acceptable safety level used for assessing the
ability of a component, structure, or system to perform its intended function. The acceptance
criteria should be quantifiable.
Containment Containment is the action of keeping harmful substances under control or within limits. Loss
of containment is defined as external leakage or full-bore rupture (ref. DNVGL RP-F116 or
Norsok N008)
Design life the design life is the period for which the integrity of the system is documented in the
original design. It is the period for which a facility or structure is to be used for its intended
purpose with anticipated maintenance, but without requiring substantial repair.
Integrity the ability of the system to operate safely and to withstand the loads imposed during the
system life cycle (DNVGL RP-F116)
Major Accident A major accident means an acute incident such as a major spill, fire or explosion which
immediately or subsequently entails multiple serious personal injuries and/or loss of human
lives, serious harm to the environment and/or loss of major financial assets (PSA The
Management Regulations § 9)
Maintenance combination of all technical and administrative actions, including supervisory actions,
intended to retain an item in, or restore it to, a state in which it can perform a required
function (ISO 14224)

DNV GL – Report No. 2020-1137, Rev. 0 – www.dnvgl.com Page 9
Monitoring regular recording of operational data and other relevant data in order to establish the current
condition of a piece of equipment and analyse its rate of degradation (DNVGL-RP-0002).
Operator party responsible for operating an asset or a field
Subsea Production
System
the complete subsea production system comprises several subsystems necessary to produce
hydrocarbons from one or more subsea wells and transfer them to a given processing facility
located offshore (fixed, floating or subsea) or onshore, or to inject water/gas through subsea
wells. (ISO 13628-1)
Threat an indication of an impending danger or harm to the system, which may have an adverse
influence on the integrity of the system (DNVGL RP-F116)
DNV GL – Report No. 2020-1137, Rev. 0 – www.dnvgl.com Page 10
3 INTEGRITY MANAGEMENT – SUBSEA INSTALLATIONS
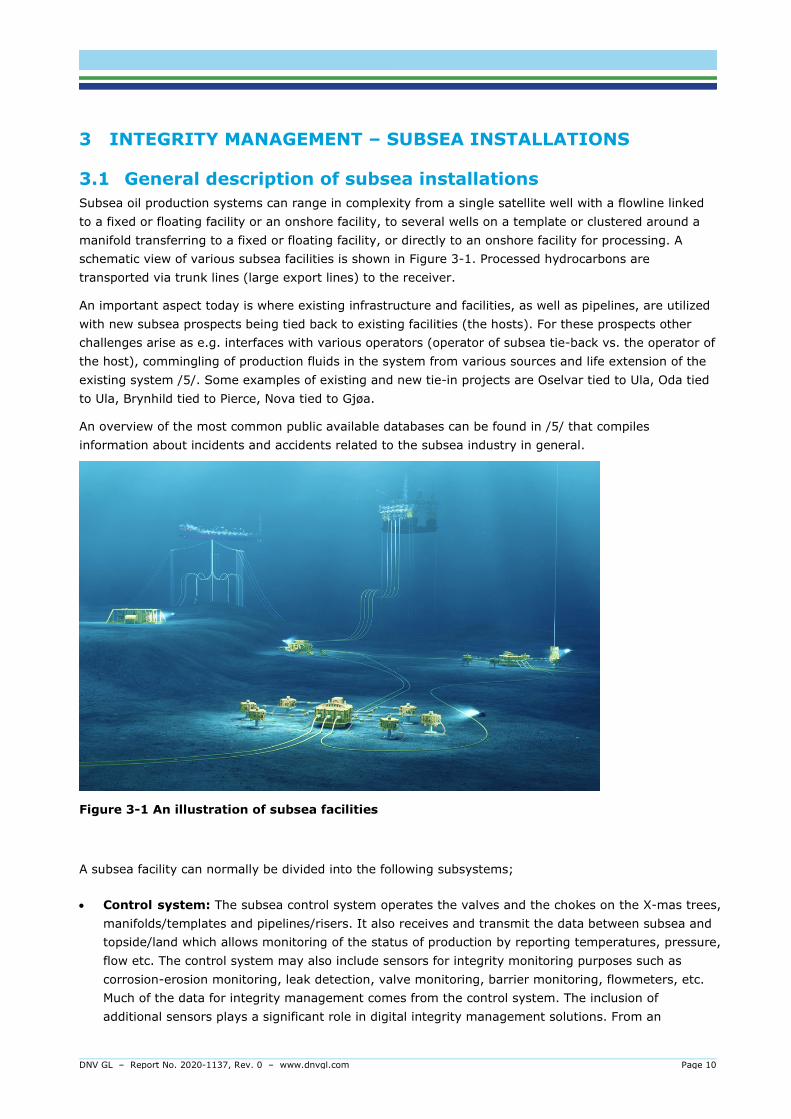
3.1 General description of subsea installations Subsea oil production systems can range in complexity from a single satellite well with a flowline linked to a fixed or floating facility or an onshore facility, to several wells on a template or clustered around a manifold transferring to a fixed or floating facility, or directly to an onshore facility for processing. A schematic view of various subsea facilities is shown in Figure 3-1. Processed hydrocarbons are transported via trunk lines (large export lines) to the receiver.
An important aspect today is where existing infrastructure and facilities, as well as pipelines, are utilized with new subsea prospects being tied back to existing facilities (the hosts). For these prospects other challenges arise as e.g. interfaces with various operators (operator of subsea tie-back vs. the operator of the host), commingling of production fluids in the system from various sources and life extension of the existing system /5/. Some examples of existing and new tie-in projects are Oselvar tied to Ula, Oda tied to Ula, Brynhild tied to Pierce, Nova tied to Gjøa.
An overview of the most common public available databases can be found in /5/ that compiles information about incidents and accidents related to the subsea industry in general.
Figure 3-1 An illustration of subsea facilities
A subsea facility can normally be divided into the following subsystems;
• Control system: The subsea control system operates the valves and the chokes on the X-mas trees, manifolds/templates and pipelines/risers. It also receives and transmit the data between subsea and topside/land which allows monitoring of the status of production by reporting temperatures, pressure, flow etc. The control system may also include sensors for integrity monitoring purposes such as corrosion-erosion monitoring, leak detection, valve monitoring, barrier monitoring, flowmeters, etc. Much of the data for integrity management comes from the control system. The inclusion of additional sensors plays a significant role in digital integrity management solutions. From an

DNV GL – Report No. 2020-1137, Rev. 0 – www.dnvgl.com Page 11
architecture perspective, the control system is often segregated into the production control system (safety) and the monitoring system, but they are contained in the same Subsea Control Module (SCM).
• Subsea pipelines: Flowlines (or infield lines) are the pipelines used to connect a subsea wellhead to a manifold or a surface facility (platform, vessel or onshore installation). The flowlines may be flexible or rigid and they may transport a range of fluids such as hydrocarbons, petrochemicals, lift gas, injection water, etc. Normally, if the system should be fit for in-line inspection, flowlines are connected by crossover spools and valves configured to allow in-line inspection tools to be circulated. Export lines (or trunk lines) are the pipeline associated with long-distance transport of processed hydrocarbon to the market for consumption. According to the Norwegian Petroleum’s webside (https://www.norskpetroleum.no/en/), a very important consideration is to ensure that the Norwegian gas transport system operates efficiently, and that the system is developed to meet future needs. This will include the capability to transport e.g. hydrogen and carbon dioxide (CO2) in future scenarios.
• Production risers: The primary function of offshore riser systems is to facilitate the safe transportation of fluids between the seafloor and the host facility (which can be a fixed or a floating facility). The riser is the portion of the flowline that resides between the host facility and the seabed adjacent to a host facility. It can be rigid or flexible. The length of the riser is defined by the riser configuration (which can range from straight sections to various wave forms) and the water depth. It carries the same range of product as the pipeline it is connected to.
• Subsea manifolds and templates: Subsea manifolds have been used in the development of oil and gas fields to simplify the subsea system, minimize the use of subsea pipelines and risers, and optimize the production flow. A manifold is an arrangement of piping and/or valves designed to combine, distribute, control, and often monitor the flow. Subsea manifolds are installed on the seabed within an array of wells to gather production or to inject water or gas into wells. Production through manifolds also enables operators to perform shutdown on parts of the subsea system for intervention or repair without disrupting overall production.
• X-mas trees/wellhead: The subsea trees are an arrangement of valves, pipes, fitting and connections placed on top of a wellhead. The functional requirements of a subsea tree are broadly similar to those of a land or platform tree. It is a vital component in the well barrier envelope. It attaches to the wellhead and directs flow through a series of valves to the flowline. It is used to isolate flow from the well. Flow is regulated at the choke that is normally attached to the tree downstream of the wing valves. It provides an interface and functionality for well intervention operations.
3.2 Integrity Management 3.2.1 System integrity System integrity is defined as both the containment of fluids, and the reliable operation of safety- and production-equipment (valves, etc.). The objective is to ensure the safety and function of the installation. In this study, only the containment function is covered, ref. Section 2.2.
System integrity is established during the concept, design, fabrication, installation and pre-commissioning phases (project phase) and maintained in the operation phase.

DNV GL – Report No. 2020-1137, Rev. 0 – www.dnvgl.com Page 12
3.2.2 Subsea Integrity Management Understanding the condition of all elements of a subsea system is essential to ensuring safe operations and reliable production. This is achieved by managing the integrity of the subsea assets.
Subsea Integrity Management (SIM) can be defined as the management of a subsea production system to ensure that it delivers according to the design requirements, company specifications, standards and legislations, and does not harm life, health or the environment, throughout the entire service life.
This implies that the operator needs to establish, implement and maintain a management system that ensures the integrity of the system during its service life /1,2,3/.
Further, integrity management of subsea assets require understanding regarding:
• the integrity threats and how they may lead to loss of containment (contribution from relevant “influence factors”; the parameters that influence on the degradation rate or likelihood of failure and the trigger levels which make the threat active)
• the current technical condition and how the assets are likely to degrade over time
• the risk, i.e. the likelihood and the consequence of loss of containment
• how to reduce the probability for loss of containment through;
o design ("robustness") including fabrication and installation aspects
o operational / process controls ("integrity window")
o integrity control ("actual condition")
o integrity improvement ("intervention")
• how to reduce the consequence if a leak occurs through;
o detection,
o prevention of escalation
o remediation
• the knowledge/uncertainties and the manageability of the risk.
3.3 Integrity Management System Integrity management is not only a matter of operational control on a daily basis. Integrity management should start already during the early design phase, since choices made at that stage may have impact on the operation of the system. Thus, there are three important stages related to ensuring the integrity management during the entire lifecycle /1/;
• Establish integrity during the concept, design, fabrication, installation and pre-commissioning phases (project phase). Choices made in the design, like selection of the type of equipment, materials, monitoring systems, new or proven technology, robustness of design, redundancy, and fabrication and installation methods, will be decisive for the integrity of the system. This includes identification of the main threats to the system and their associated risks, and subsequently developing strategies to manage these risks during the operating phase.
DNV GL – Report No. 2020-1137, Rev. 0 – www.dnvgl.com Page 13
• Transfer integrity from the project phase to the operations phase involves transfer of all relevant data and information required for the safe operation of the subsea production system from the project phase to operation. It could also include transfer from one operator to another if an asset is sold.
• Maintain integrity during the operating phase (commissioning, operation, de-commissioning, re-commissioning, re-qualification and lifetime extension) and abandonment phase
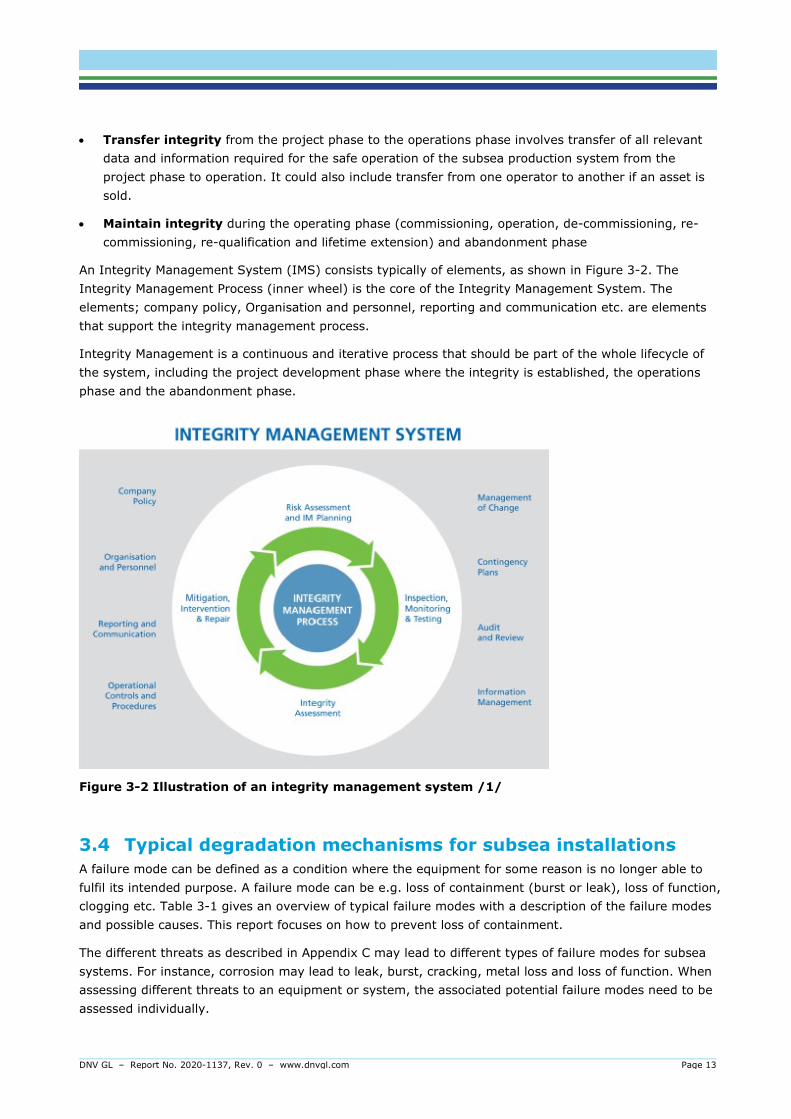
An Integrity Management System (IMS) consists typically of elements, as shown in Figure 3-2. The Integrity Management Process (inner wheel) is the core of the Integrity Management System. The elements; company policy, Organisation and personnel, reporting and communication etc. are elements that support the integrity management process.
Integrity Management is a continuous and iterative process that should be part of the whole lifecycle of the system, including the project development phase where the integrity is established, the operations phase and the abandonment phase.
Figure 3-2 Illustration of an integrity management system /1/
3.4 Typical degradation mechanisms for subsea installations A failure mode can be defined as a condition where the equipment for some reason is no longer able to fulfil its intended purpose. A failure mode can be e.g. loss of containment (burst or leak), loss of function, clogging etc. Table 3-1 gives an overview of typical failure modes with a description of the failure modes and possible causes. This report focuses on how to prevent loss of containment.
The different threats as described in Appendix C may lead to different types of failure modes for subsea systems. For instance, corrosion may lead to leak, burst, cracking, metal loss and loss of function. When assessing different threats to an equipment or system, the associated potential failure modes need to be assessed individually.

DNV GL – Report No. 2020-1137, Rev. 0 – www.dnvgl.com Page 14
Table 3-1 Typical failure modes for subsea systems Failure mode Description Cause (Damage/
Abnormality) Consequence Degradation
Mechanisms Burst Failure due to loss of
pressure containment Wall thinning, crack propagation, overload, metal loss, sand
Large spill Corrosion, erosion, fatigue
External leak Failure jeopardizing system pressure containment
Localized corrosion attack, small crack, damaged seal, loss of external corrosion protection
Small spill Material ageing, corrosion, erosion, fatigue
Metal loss Reduction of system pressure containing capacity
Coating damage, wall thinning
Wall thinning, reduced load bearing capacity
Corrosion, erosion
Cracking Fracture capacity exceeded Overload, vibrations Large spill HISC, environmental cracking, fatigue
Yielding Too high utilization of the material due to overload
Dent, overload, displacement
Loss of function, loss of functionality
Corrosion, erosion
Collapse (buckling)
Deformation of the cross section or full collapse
External overload, deformation
Loss of or reduced function
Corrosion, erosion
Loss of function Loss of or reduced function; Control system failure or component failure preventing equipment to operate as intended
Ovalisation, deformation, control system failure due to internal or external leak, diffusion
Loss of functionality, loss of power (electrical/ hydraulic), loss of function, overheating
Material ageing, corrosion, HISC, environmental, cracking
Material ageing Delamination of polymeric materials reducing e.g. strength or protective capability. Ageing of elastomeric material due to chemical and thermal exposure
Material degradation due to exposure to conditions outside of qualified range e.g. UV, temperature, chemicals
Loss of function, internal and external leak
Ageing
Internal leak Isolated components not able to fulfil its function
Material ageing, ovalisation, deformation
Loss of function, loss of sealing capability, contamination, hydrate formation
Corrosion, material ageing, wear
Clogging Clogging of piping or equipment preventing fluid flow
Wax or hydrate formation due to incorrect operation
Loss of function, loss of functionality
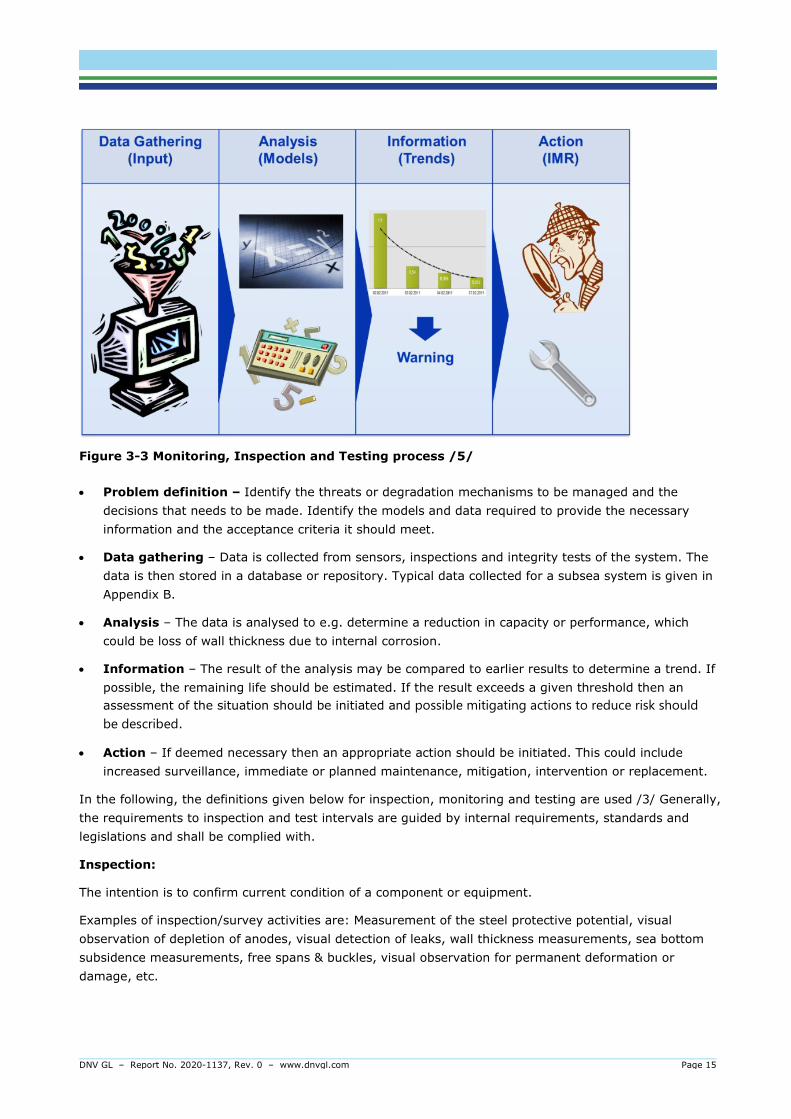
3.5 Condition monitoring of subsea systems The purpose of monitoring, inspection/maintenance and testing is to detect existing or developing threats and failure modes (ref. Appendix C) that can result in a leakage or burst and to validate the integrity or function of barriers and equipment. All the monitoring, inspection and testing activities generate a large volume of data that needs to be analysed in order to determine if the integrity of the system is jeopardised and what potential actions that should be carried out. Figure 3-3 illustrates the process.
DNV GL – Report No. 2020-1137, Rev. 0 – www.dnvgl.com Page 15
Figure 3-3 Monitoring, Inspection and Testing process /5/
• Problem definition – Identify the threats or degradation mechanisms to be managed and the decisions that needs to be made. Identify the models and data required to provide the necessary information and the acceptance criteria it should meet.
• Data gathering – Data is collected from sensors, inspections and integrity tests of the system. The data is then stored in a database or repository. Typical data collected for a subsea system is given in Appendix B.
• Analysis – The data is analysed to e.g. determine a reduction in capacity or performance, which could be loss of wall thickness due to internal corrosion.
• Information – The result of the analysis may be compared to earlier results to determine a trend. If possible, the remaining life should be estimated. If the result exceeds a given threshold then an assessment of the situation should be initiated and possible mitigating actions to reduce risk should be described.
• Action – If deemed necessary then an appropriate action should be initiated. This could include increased surveillance, immediate or planned maintenance, mitigation, intervention or replacement.
In the following, the definitions given below for inspection, monitoring and testing are used /3/ Generally, the requirements to inspection and test intervals are guided by internal requirements, standards and legislations and shall be complied with.
Inspection:
The intention is to confirm current condition of a component or equipment.
Examples of inspection/survey activities are: Measurement of the steel protective potential, visual observation of depletion of anodes, visual detection of leaks, wall thickness measurements, sea bottom subsidence measurements, free spans & buckles, visual observation for permanent deformation or damage, etc.
DNV GL – Report No. 2020-1137, Rev. 0 – www.dnvgl.com Page 16
Maintenance:
For the subsea equipment, the general approach has been, and still is, to install equipment that is planned retrieved and brought to shore when maintenance/refurbishment is needed or is designed to be in operation throughout the entire design life without being retrieved. However, subsea equipment (such as X-mas trees and manifolds) tends to be more and more instrumented by sensors that are placed there to allow production and flow control, but less focus is given to monitor the technical condition of the equipment itself.
Testing:
Applying a load to confirm a measurable property or function of a component or a system.
Examples of testing activities are: insulation resistance test, valve barrier test, system pressure testing, testing of safety systems, pressure control equipment, over-pressure protection equipment, emergency shutdown systems, automatic showdown valves, and safety equipment in connecting piping systems.
For testing of safety equipment, appropriate standards and codes (used as basis for design) should be utilized. Many designs are based on the functional safety standards IEC 61508 and IEC 61511. ISO/TR 12489 can be referred to regarding testing in relation to probability estimation needed for safety.
Monitoring:
While inspections physically confirms the state of a component directly (e.g. wall thickness, damage to the pipeline, coating defect, pipeline displacement), monitoring is the regular recording of operational data and other relevant data that indirectly can give information regarding the current condition of a component and/or be utilized to analyse the state of degradation. Examples of typical monitoring activities are:
- chemical composition (e.g. CO2, H2S, water)
- process parameters (e.g. P, T, flow, dewpoint)
- currents and waves
- movement measurements (risers)
- vibrations and oscillations (due to e.g. slugging)
- strains and pipe displacements
- third party activity as ship traffic and fishing activity
- land movement and embedment
- annulus monitoring for flexible risers
- leak detection (e.g. mass-balance, sensors)
More detailed tables with regards to typical inspection, monitoring and testing parameters can be found in /2,3,4/. Also, see /9/.

DNV GL – Report No. 2020-1137, Rev. 0 – www.dnvgl.com Page 17
3.6 Petroleum Safety Authority Regulations Through the Petroleum Safety Authority’s (PSA) various regulations there is a requirement that conditions that are important for a sound and safety-wise execution of the activities are monitored and kept under control at any time (ref. the management regulations § 10).
The main principle of PSA’s requirements is that the companies involved shall know the condition of their equipment both individually and collectively and work continuously to reduce risk. In addition, one must work continuously to identify the processes, activities, etc. where improvements are needed and implement necessary improvement measures. Personnel shall be aware of what barriers have been established and which function they are intended to fulfil.
The Management Regulations:
§ 5 ‘Barriers’
Barriers shall be established that at all times can
a) identify conditions that can lead to failures, hazard and accident situations,
b) reduce the possibility of failures, hazard and accident situations occurring and developing,
c) limit possible harm and inconveniences.
Personnel shall be aware of what barriers have been established and which function they are intended to fulfil, as well as what performance requirements have been defined in respect of the concrete technical, operational or Organisational barrier elements necessary for the individual barrier to be effective.
For subsea integrity management the containment function is a vital technical barrier to prevent hazards and accident situations. PSA’s note on barrier management /11/ defines technical, operational and organisational barriers. For the most part the primary role of the control room function is related to process control with associated safety control systems. Although subsea integrity is mostly focused on long tern degradation mechanisms, the control room function should have adequate organisational and operational barriers in place to manage sudden integrity incidents, e.g. flooding of annulus in flexible risers.
§ 19 ‘Collection, processing and use of data’
The responsible party shall ensure that data of significance to health, safety and the environment are collected, processed and used for;
1. monitoring and checking technical, operational and Organisational factors,
2. preparing measurement parameters, indicators and statistics,
3. carrying out and following up analyses during various phases of the activities,
4. building generic databases,
5. implementing remedial and preventive measures, including improvement of systems and equipment.
Requirements shall be set as regards the quality and validity of the data, based on the relevant need.

DNV GL – Report No. 2020-1137, Rev. 0 – www.dnvgl.com Page 18
The Facilities Regulations
§ 8 ‘Safety functions’
Facilities shall be equipped with necessary safety functions that can at all times
1. detect abnormal conditions,
2. prevent abnormal conditions from developing into hazard and accident situations,
3. limit the damage caused by accidents.
Requirements shall be stipulated for the performance of safety functions. The status of active safety functions shall be available in the central control room.
§ 17 ‘Instrumentation for monitoring and recording’
Facilities shall be outfitted with instrumentation for monitoring and recording conditions and parameters that can be significant in verifying the results from analyses, as well as parameters of significance to the facility's further use.
The instrumentation should be designed so that it can monitor and record:
1. structural integrity for load-bearing structures and pipeline systems: Monitoring of structural integrity includes recording parameters that result in significant tension or compression stress, or large movements as a result of waves and currents.
2. critical degradation of materials: Critical degradation may include corrosion and erosion. In order to monitor corrosion, multiple independent corrosion monitoring systems may be relevant if maintenance, including inspection, is difficult to perform.
3. critical operational parameters: Critical operational parameters can include the drilling fluid's properties, pressure and particle content in the production stream, pressure in seal oils in swivels and gas composition and pressure in facilities for manned underwater operations.
The Activity Regulations:
§ 31 ‘Monitoring and control’
The responsible party shall ensure that matters of significance for prudent execution of the activities as regards health and safety, are monitored and kept under control at all times. § 47 ‘Maintenance programme’
Failure modes that may constitute a health, safety or environment risk shall be systematically prevented through a maintenance programme. This programme shall include activities for monitoring performance and technical condition, which ensure identification and correction of failure modes that are under development or have occurred.
The programme shall also contain activities for monitoring and control of failure mechanisms that can lead to such failure modes

DNV GL – Report No. 2020-1137, Rev. 0 – www.dnvgl.com Page 19
4 STATUS OF EMERGING METHODS, TOOLS AND TECHNOLOGIES FOR DATA COLLECTION AND ANALYTICS
This section describes emerging methods, tools and technologies for data collection and analytics considered to be important enablers for improved integrity management in both short and medium term. More specifically it covers:
1) Autonomous Underwater Vehicles (AUVs) to conduct subsea surveys
2) Sensor technology
3) Monitoring ship traffic to identify areas exposed to trawl risk
4) The use of digital twins, platforms and ecosystems
5) The use of Artificial Intelligence (AI) / Machine Learning (ML)
6) Standardisation of data exchange
Key enablers for the recent digitalization trends are reduced cost of computational power, cloud storage and computing, reduced cost and capacity of sensor technology. Digitalization for subsea integrity management evolves around the following three areas as illustrated in Figure 4-1.
1) Digital worker and support
2) Inspection and data collection
3) Analysis
The main benefit from digital workers and support is the increased use of digital collaboration tools enabling a better utilization of subject domain experts. Technologies and enablers for the digital workers include cloud-based storage, augmented reality and increased computational power.
Emerging technologies using drones for data collection and inspections will become increasingly intelligent and autonomous like the trend seen for the development of autonomous self-driving cars. For subsea integrity this will provide an opportunity to conduct more frequent subsea surveys with shorter mobilization times. Additional enablers include improved battery technology with increased capacity at reduced cost.
More advanced analytics includes use of artificial intelligence enabling faster processing of data and better analytics of big data and cross learning as well as digital twins and data platforms including functionalities for data contextualisation and advanced analytics. For this area, cloud-based storage and computational power are key enabling technologies.
Search engines and the use of Natural Language Processing (NLP) can be applied for screening of large amount of text and data. Search engines can be useful in the context of subsea integrity management when searching in videos, past failure cases or generally when searching information from multiple systems and data sources, e.g. to identify lessons learned and reference cases.
Common critical success factors for all technologies include
• Adequate data quality
• Adequate controls for cyber security
• Sufficient computational power and network capacity
• Competence and organisational requirements for adopting the new technologies

DNV GL – Report No. 2020-1137, Rev. 0 – www.dnvgl.com Page 20
There are overlaps in the described three (3) main technologies and enablers for digitalization. Subsea drones are both robotics as well as tools for data collection. Digital twins are both collaboration tools as well as tools for analytics. Together, the impact of these emerging technologies are disruptive in its nature and will most likely, if implemented in large scale, also lead to significant changes to work processes and organisation described in Section 5.2 and 5.3. Reference to how these technologies are and can be used in continuous improvement and maintenance for improved safety is described in /7/.
DIGITAL WORKER + SUPPORT
Augmented reality
Digital worker
Expert centers / integrated operations
INSPECTION AND DATA COLLECTION
Mini-ROV
Drones
Sensors
ANALYSIS
Barrier panels, On-line risk
Pattern recognition
Data driven predictive maintenance
Data quality, cyber security, computational power, network capacity, competence and organizational requirements
Figure 4-1 The three (3) main technologies and enablers for digitalization in industrial applications
4.1 Autonomous underwater vehicles to conduct subsea surveys Underwater drones or Autonomous Underwater Vehicles (AUV) are a new trend in the Oil and Gas industry. AUVs are an evolution from Remote Operated Vehicles (ROV) that are piloted by an operator on board a surface vessel. Power and communication to a traditional ROV is supplied from the surface support vessel through an umbilical. The development of AUVs started with torpedo shaped vehicles that could perform autonomous underwater survey of the seabed, including pipelines. The early AUVs had limited communication capability while submerged and they did not have the ability to hover or perform close inspection.
From there the industry has been developing more capable vehicles that can perform a wide variety of tasks. Generally, there are three types of AUVs:
• Inspection AUV – these have video and an array of sensors to inspect subsea stations, pipelines, risers, etc.
• Intervention AUV – these also have manipulator arms that can be used to perform tasks such as opening or closing of valves. They can also carry tool skids to perform specialized inspection and maintenance tasks.
DNV GL – Report No. 2020-1137, Rev. 0 – www.dnvgl.com Page 21
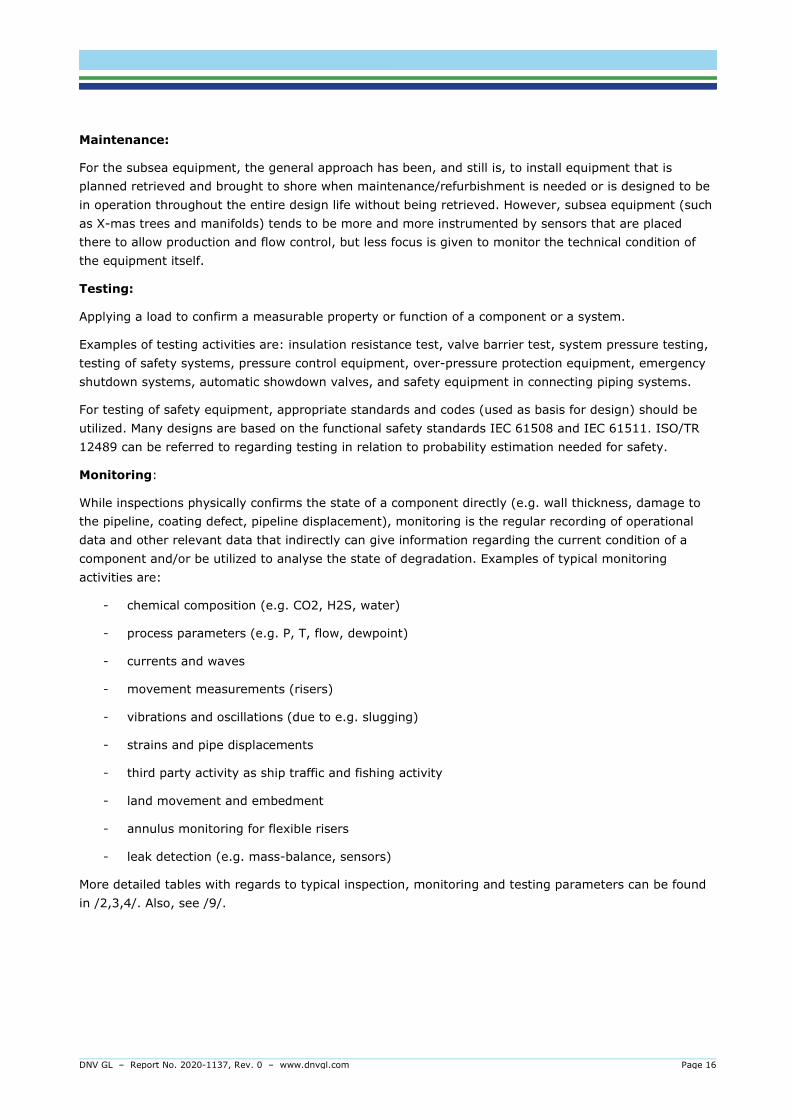
• Resident AUV – these are designed to stay submerged for an extended period (months to years). They are available as either inspection or intervention AUVs but require a subsea docking station for parking, charging and communication services.
High bandwidth communication is a challenge under water, so a combination of communication technologies is typically used for AUVs:
• Umbilical – very high bandwidth but with range of 100-200 meters. The system needs to be able to disconnect the umbilical for extended range. The umbilical also allows for charging of the AUV.
• Optical modems – high bandwidth but range of 100-300 meters depending on visibility.
• Acoustic modems – limited bandwidth but long range (up to ~10 km). The limited bandwidth of this technology generally does not allow for a real-time video link.
The competitive advantage for a resident AUV is that it does not need an expensive surface vessel and is available on short notice. This allows it to stay on location for long periods with minimal operating expenses. However, a resident AUV requires a docking station where it can park between missions, charge, upload survey data and download new mission details. The docking station typically needs to be installed by an offshore construction vessel and needs to be supplied with a communication link and power. This can be provided through a dedicated cable back to a host facility which can add significantly to the cost. Alternatively, a power and communication buoy may be employed for a stand-alone solution. There is also a universal Subsea Docking Station (SDS) being developed and qualified that can support AUV from different vendors with power and communication.
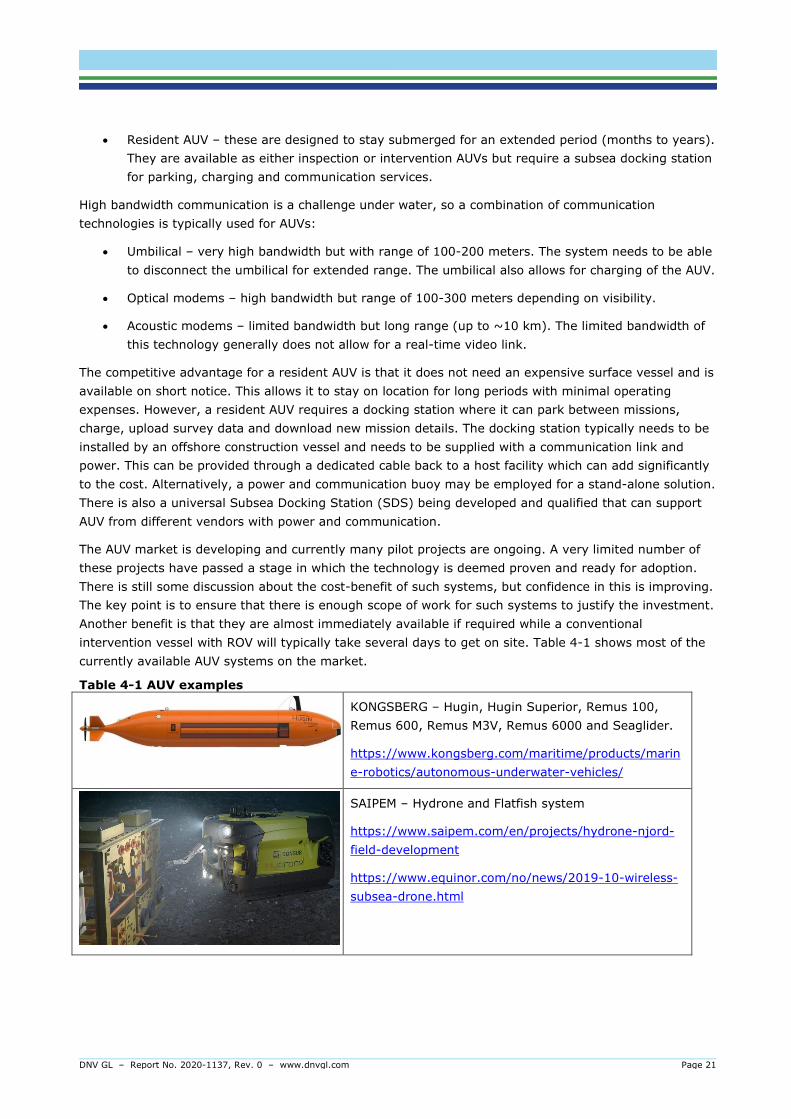
The AUV market is developing and currently many pilot projects are ongoing. A very limited number of these projects have passed a stage in which the technology is deemed proven and ready for adoption. There is still some discussion about the cost-benefit of such systems, but confidence in this is improving. The key point is to ensure that there is enough scope of work for such systems to justify the investment. Another benefit is that they are almost immediately available if required while a conventional intervention vessel with ROV will typically take several days to get on site. Table 4-1 shows most of the currently available AUV systems on the market.
Table 4-1 AUV examples
KONGSBERG – Hugin, Hugin Superior, Remus 100, Remus 600, Remus M3V, Remus 6000 and Seaglider.
https://www.kongsberg.com/maritime/products/marine-robotics/autonomous-underwater-vehicles/
SAIPEM – Hydrone and Flatfish system
https://www.saipem.com/en/projects/hydrone-njord-field-development
https://www.equinor.com/no/news/2019-10-wireless-subsea-drone.html

DNV GL – Report No. 2020-1137, Rev. 0 – www.dnvgl.com Page 22
Eelume (owned by Kongsberg Maritime and Equinor)
https://eelume.com/
https://www.equinor.com/en/how-and-why/etv-news/eelume-to-be-piloted-at-aasgard.html
KAWASAKI – SPICE AUV
https://global.kawasaki.com/en/corp/newsroom/news/detail/?f=20200715_8265
OCEANEERING – Liberty E-ROV and Freedom E-ROV
https://www.oceaneering.com/rov-services/next-generation-subsea-vehicles/liberty-e-rov/
https://www.oceaneering.com/rov-services/next-generation-subsea-vehicles/freedom/
Stinger - Autonomous Inspection Vehicle
https://www.i-tech7.com/capabilities/autonomy/autonomous-inspection
SAAB – Sabertooth
https://www.saabseaeye.com/solutions/underwater-vehicles/sabertooth-double-hull
Modus HAUV
https://www.modus-ltd.com/services/auv-services/
DNV GL – Report No. 2020-1137, Rev. 0 – www.dnvgl.com Page 23
4.2 The use of sensor technology A general trend in the subsea industry is an increase in the number of subsea sensors as well as more advanced sensors performing sophisticated on-board signal processing. The primary purpose of most sensors is production control but increasingly more sensors are added for condition and integrity monitoring purposes. The increase in sensor usage is driven by reduced cost, increase in available communication bandwidth and the potential for reduced operating costs. Sensors in themselves do not provide a digitalization solution but is an enabler for analytics for condition and integrity management.
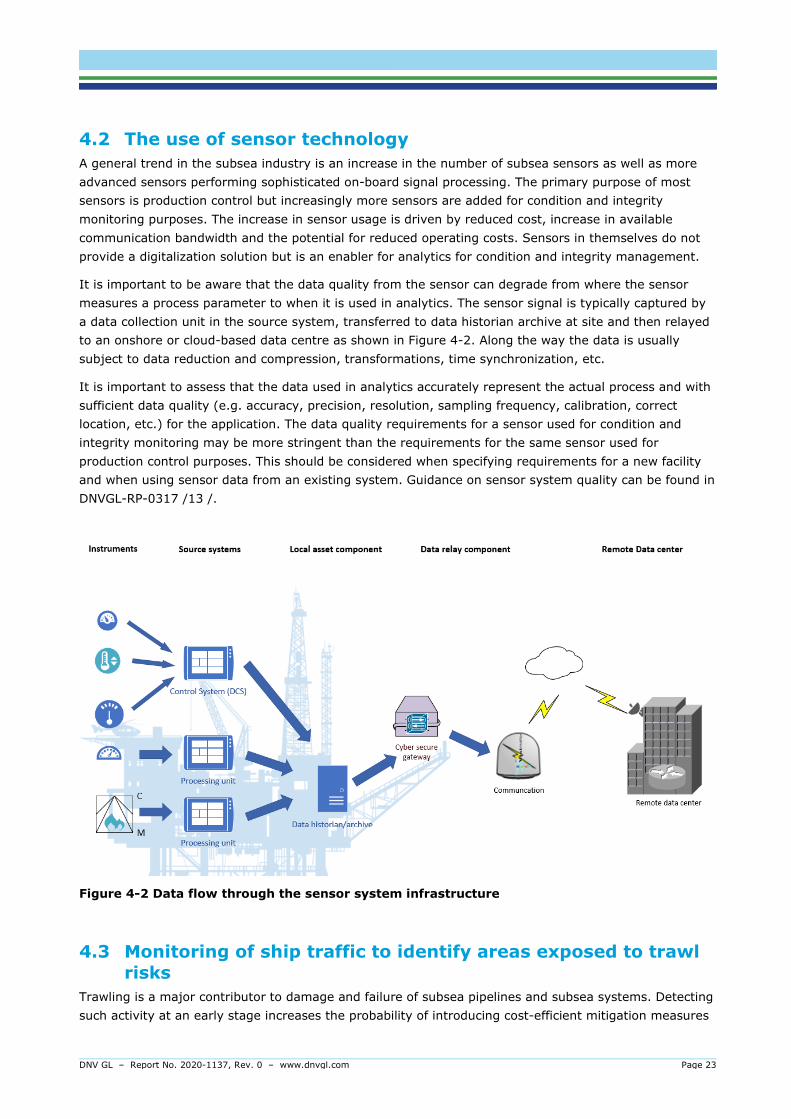
It is important to be aware that the data quality from the sensor can degrade from where the sensor measures a process parameter to when it is used in analytics. The sensor signal is typically captured by a data collection unit in the source system, transferred to data historian archive at site and then relayed to an onshore or cloud-based data centre as shown in Figure 4-2. Along the way the data is usually subject to data reduction and compression, transformations, time synchronization, etc.
It is important to assess that the data used in analytics accurately represent the actual process and with sufficient data quality (e.g. accuracy, precision, resolution, sampling frequency, calibration, correct location, etc.) for the application. The data quality requirements for a sensor used for condition and integrity monitoring may be more stringent than the requirements for the same sensor used for production control purposes. This should be considered when specifying requirements for a new facility and when using sensor data from an existing system. Guidance on sensor system quality can be found in DNVGL-RP-0317 /13 /.
Figure 4-2 Data flow through the sensor system infrastructure
4.3 Monitoring of ship traffic to identify areas exposed to trawl risks
Trawling is a major contributor to damage and failure of subsea pipelines and subsea systems. Detecting such activity at an early stage increases the probability of introducing cost-efficient mitigation measures
DNV GL – Report No. 2020-1137, Rev. 0 – www.dnvgl.com Page 24
before expensive repairs are necessary. Two examples of initiatives where large amounts of ship traffic data are collected and combined with vessel specific data and knowledge about trawl equipment is mentioned below.
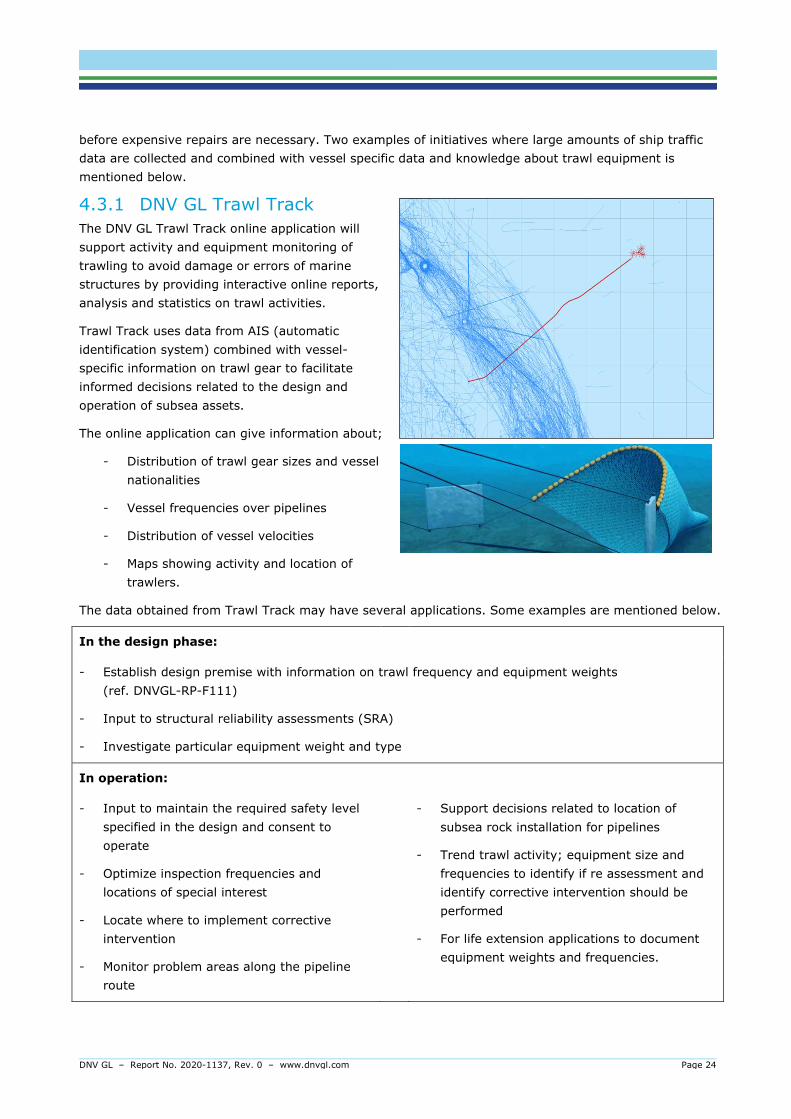
4.3.1 DNV GL Trawl Track The DNV GL Trawl Track online application will support activity and equipment monitoring of trawling to avoid damage or errors of marine structures by providing interactive online reports, analysis and statistics on trawl activities.
Trawl Track uses data from AIS (automatic identification system) combined with vessel-specific information on trawl gear to facilitate informed decisions related to the design and operation of subsea assets.
The online application can give information about;
- Distribution of trawl gear sizes and vessel nationalities
- Vessel frequencies over pipelines
- Distribution of vessel velocities
- Maps showing activity and location of trawlers.
The data obtained from Trawl Track may have several applications. Some examples are mentioned below.
In the design phase:
- Establish design premise with information on trawl frequency and equipment weights (ref. DNVGL-RP-F111)
- Input to structural reliability assessments (SRA)
- Investigate particular equipment weight and type
In operation:
- Input to maintain the required safety level specified in the design and consent to operate
- Optimize inspection frequencies and locations of special interest
- Locate where to implement corrective intervention
- Monitor problem areas along the pipeline route
- Support decisions related to location of subsea rock installation for pipelines
- Trend trawl activity; equipment size and frequencies to identify if re assessment and identify corrective intervention should be performed
- For life extension applications to document equipment weights and frequencies.
DNV GL – Report No. 2020-1137, Rev. 0 – www.dnvgl.com Page 25
4.3.2 NCS Trawl Development Study IKM Ocean Design (IKM) performed on behalf of PSA a study in 2019 to evaluate the development trends in the trawling industry, particularly with regards to the trend that indicate an increase in trawl gear size and mass /6/.
The effects of increasing trawl gear, how these trends are captured in the relevant subsea design standards and guidelines and where the damage potential is largest w.r.t. subsea installations were evaluated as part of the work.
In addition, data for Norwegian and international trawl vessels has been collected over the past 5-6 years in order to gradually build a complete database for trawlers that may operate on NCS from time to time, but also for international waters.
4.4 The use of digital twins, platforms and ecosystems Digital twins, platforms and ecosystems described in the following sections all have a role to
o contextualize and visualize assets and data
o provide functionality for assessment and analysis
o provide support in decision making related to subsea integrity
A digital twin can be defined as a virtual representation of a system or asset that calculates system states and makes system information available, through integrated models and data, with the purpose of providing decision support over its life cycle (ref. /12/). The concept of digital twins was first described by David Gelernter's 1991 book Mirror Worlds.
A digital platform extracts and integrates different data sources and systems into one interface or system with the aim to contextualize data and information in a way to better understand relationships and features in data ultimately providing a better basis for decision support. The main difference between a data platform and a digital twin is that a data platform provides a system to integrate information and data across assets and the digital twin provides the computation models and analytics.
An ecosystem represents a digital platform, but typically managed or organized through an external set up in which multiple companies can both use and provide services within the ecosystem. The ecosystem can typically provide data and algorithms available for use on a subscription basis.
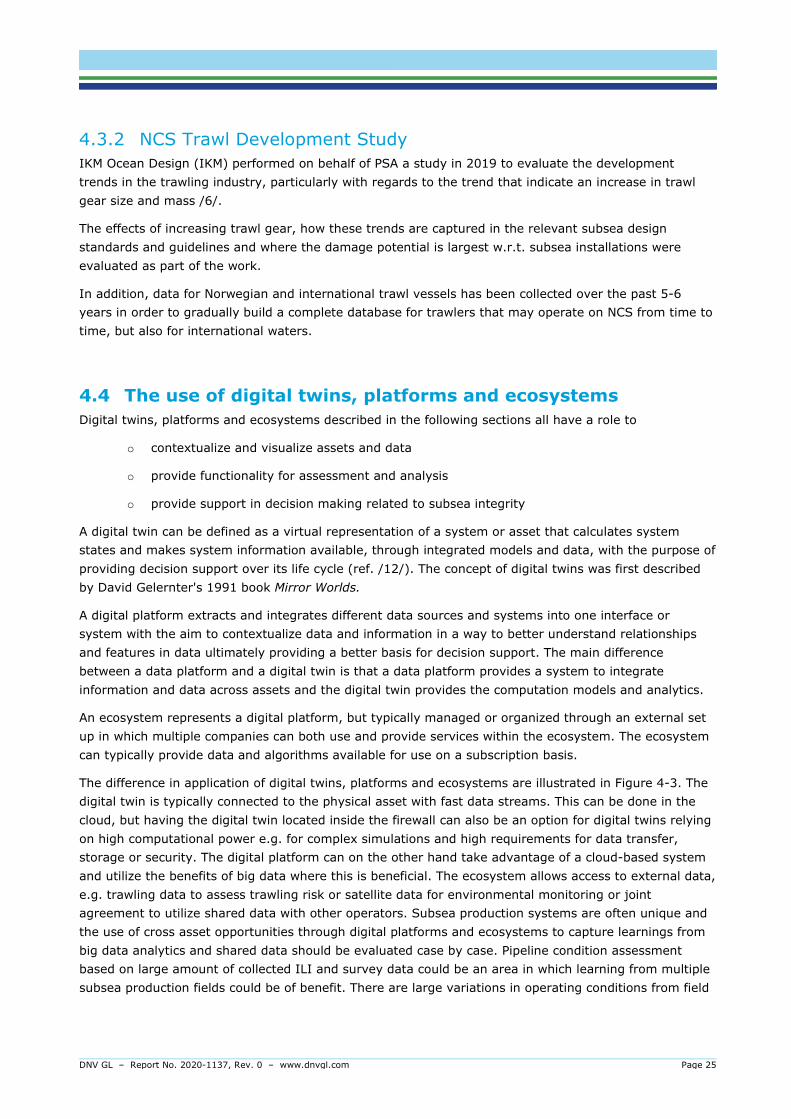
The difference in application of digital twins, platforms and ecosystems are illustrated in Figure 4-3. The digital twin is typically connected to the physical asset with fast data streams. This can be done in the cloud, but having the digital twin located inside the firewall can also be an option for digital twins relying on high computational power e.g. for complex simulations and high requirements for data transfer, storage or security. The digital platform can on the other hand take advantage of a cloud-based system and utilize the benefits of big data where this is beneficial. The ecosystem allows access to external data, e.g. trawling data to assess trawling risk or satellite data for environmental monitoring or joint agreement to utilize shared data with other operators. Subsea production systems are often unique and the use of cross asset opportunities through digital platforms and ecosystems to capture learnings from big data analytics and shared data should be evaluated case by case. Pipeline condition assessment based on large amount of collected ILI and survey data could be an area in which learning from multiple subsea production fields could be of benefit. There are large variations in operating conditions from field
DNV GL – Report No. 2020-1137, Rev. 0 – www.dnvgl.com Page 26
to field and operators will therefore rely on data sharing to be able to use learnings between pipelines with similar operating conditions.
For new subsea development projects, the value of digitalization such as digital twins may be easier to justify due to the combined benefits both for engineering and operations. A digital data platform would normally require less effort to develop compared to a digital twin.
Digital twin Digital platform Ecosystem
Str
en
gth
s
+ Fast access and processing of data (edge computing)
+ Visualization feature through 3D model
+ Integrates multiple data sources
+ Robust and stable
+ Contextualization of multiple data sources
+ Enables cloud computing with access to big data
+ Enables benchmarking
+ Access to subscription data (e.g. satellite data)
+ Access to tools and algorithms from multiple service providers
+ Meeting place for trading of data
+ Enables benchmarking
Weakn
ess
es ÷ Cloud computing and access to
big data more difficult if high requirement to computational power and cyber security.
÷ Vulnerable to loss of connection / internet
÷ Commercial agreements required to access and use data
÷ Requires application programming interface (API) for data exchange
Local data use Global data use
Figure 4-3 The difference in application of digital twins, platforms and ecosystems
An example of a digital twin for subsea integrity management could be a virtual representation of a flexible riser where sensors measuring movement and acceleration of the flexible riser is feeding directly into the digital twin that calculates the current damage rate and the remaining fatigue life. A strength of the digital twin is that it can easily be used for visualizing the objects, e.g. to facilitate planning in assessing accessibility for inspections at riser hang off.
The digital twin concept consists of three distinct parts: the asset, the virtual representation, and the connection between the two. This connection amounts to the information transferred (automatic or manual) from the asset to the digital twin and information that is available from the digital twin to the asset and the operator. A key principle is that the development of a digital twin should serve a clear business purpose in order to provide value.
An Asset Information Model (AIM) must be the basis for both digital platforms and digital twins. The AIM is a collated set of information gathered from multiple sources that describe the asset, supports the management of the asset and serves as a single source of validated and approved information. The AIM provides structure, context and navigation capabilities for the data.
The AIM may present information in different ways, also called views, based on the defined structures, components, functionalities and logic in the asset. The purpose of the AIM is to enable search, navigation and merging of datasets. The AIM can provide structure and context to the data and it may contain or reference metadata, relationships between data, spatial data and computation models. It may also contain links to documentation, data and data streams.
DNV GL – Report No. 2020-1137, Rev. 0 – www.dnvgl.com Page 27
Metadata is data describing data and is needed for contextualisation, integration and for creating data structures. Metadata describes technical and format properties of data elements, and relationships between data elements and valid values.
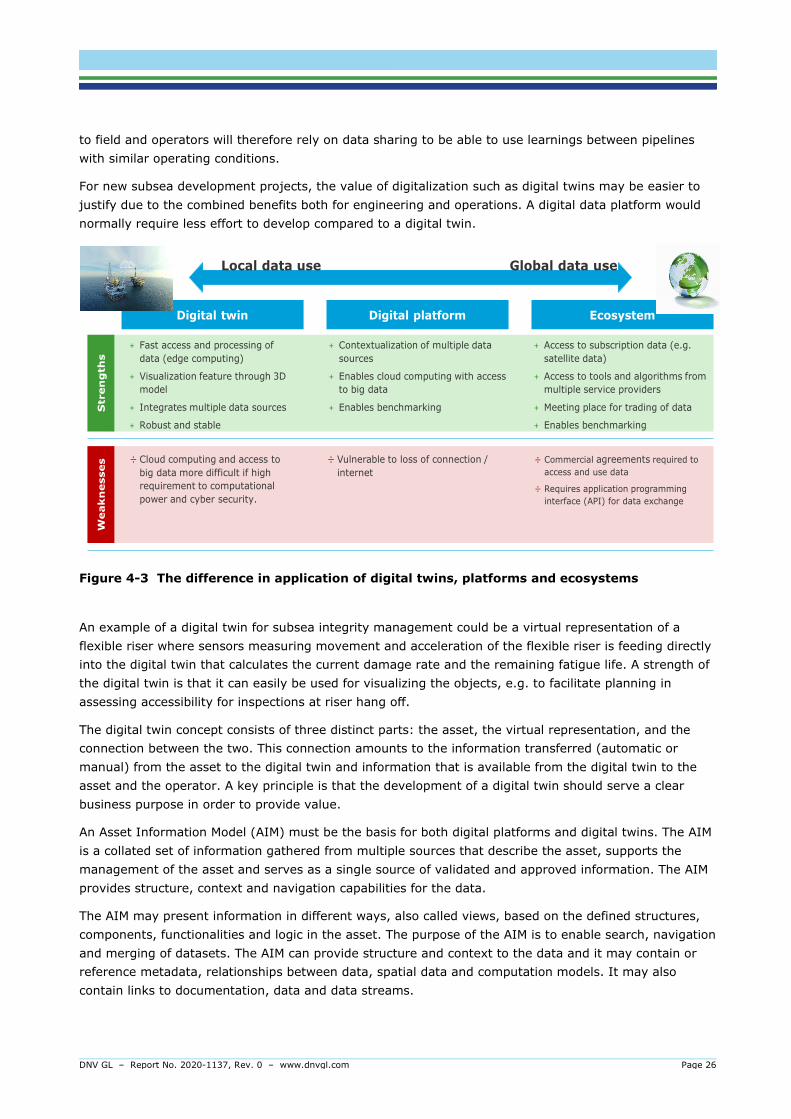
DNVGL-RP-A204 defines the evolution stages or capability levels of digital twins as shown in Figure 4-4, and definitions of the capability levels are presented in Table 4-2.
Figure 4-4 Evolution stages or capability levels of a digital twin as presented in DNVGL-RP-A204 /12/.
Table 4-2 Capability levels for digital twins as defined in DNVGL-RP-A204 /12/
Level Description
0 - standalone • The physical asset may not exist yet, no data streams are available from the asset
• The FE can describe and predict system behaviour based on manually entered data
• The asset information model is developed and matured with the ability to provide a detailed
description of the asset. It may contain contextualized and structured information such as
master data, graphical models, bill of materials, multidomain modelling (system of systems),
etc.
1 - descriptive • The FE can describe the current state of the system or asset
• Real-time data streams are available from the asset
• Describes the real system and provide status, alarms and events
• Ability to interrogate and provide information about the current and historical states
2 - diagnostic • The FE can present diagnostic information such as health or condition indicators
• Support the user with condition monitoring, fault finding and troubleshooting
3 - predictive • The FE can predict future states or performance of the system as well as remaining useful life
• Health and condition indicators are further enriched to support prognostic capabilities
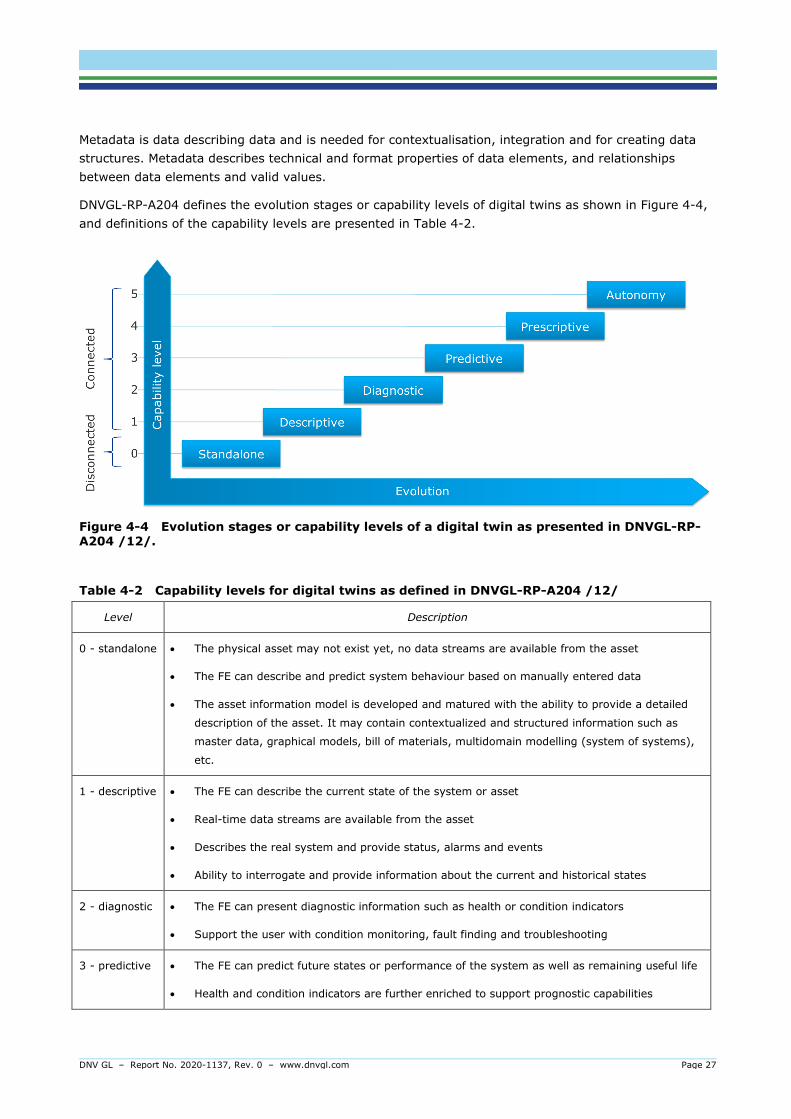
DNV GL – Report No. 2020-1137, Rev. 0 – www.dnvgl.com Page 28
Level Description
4 -
prescriptive
• The FE can provide prescriptive or recommended actions based on the available predictions
• Evaluates the implications of each option and how to optimize the future actions without
compromising other priorities
5 -
autonomous
• The FE can replace the user by closing the control loop to make decisions and execute control
actions on the system autonomously
• The user may have a supervisory role over the FE to ensure that it performs as intended
4.5 Use of Machine Learning and Artificial Intelligence in integrity management
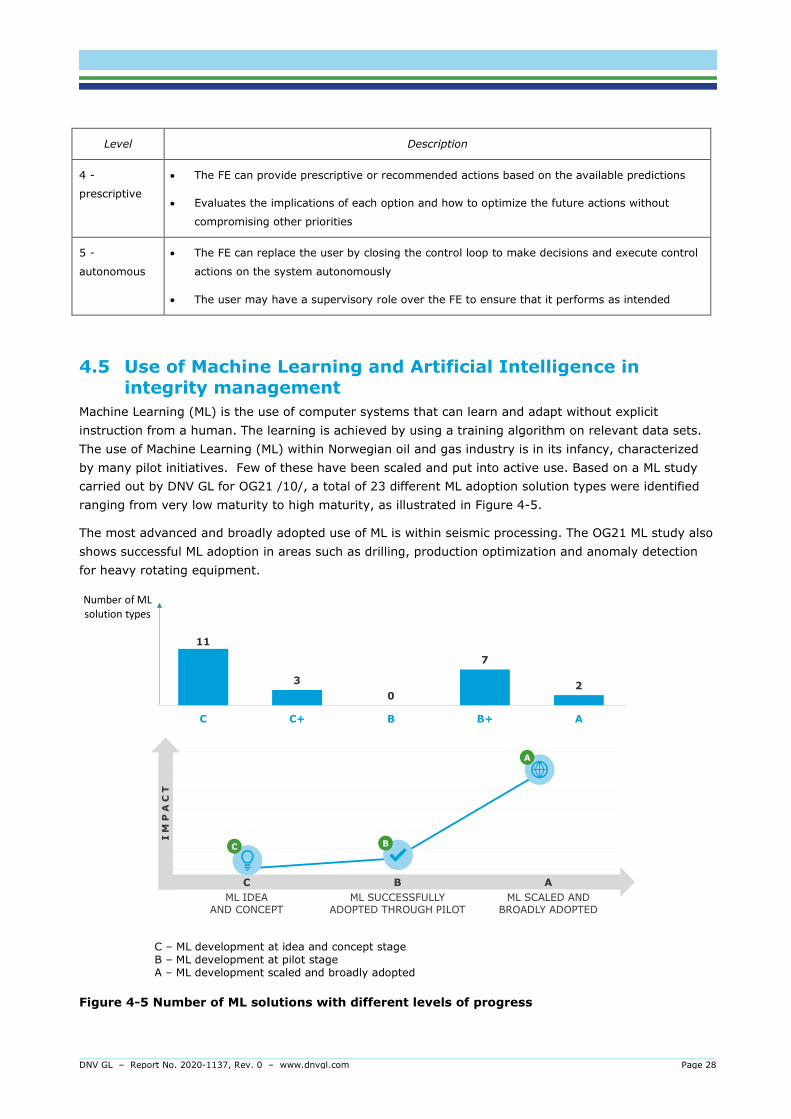
Machine Learning (ML) is the use of computer systems that can learn and adapt without explicit instruction from a human. The learning is achieved by using a training algorithm on relevant data sets. The use of Machine Learning (ML) within Norwegian oil and gas industry is in its infancy, characterized by many pilot initiatives. Few of these have been scaled and put into active use. Based on a ML study carried out by DNV GL for OG21 /10/, a total of 23 different ML adoption solution types were identified ranging from very low maturity to high maturity, as illustrated in Figure 4-5.
The most advanced and broadly adopted use of ML is within seismic processing. The OG21 ML study also shows successful ML adoption in areas such as drilling, production optimization and anomaly detection for heavy rotating equipment.
11
30
7
2
C C+ B B+ A
CML IDEA
AND CONCEPT
BML SUCCESSFULLY
ADOPTED THROUGH PILOT
AML SCALED AND
BROADLY ADOPTED
IM
PA
CT
C B
A
Number of ML solution types
C – ML development at idea and concept stage B – ML development at pilot stage A – ML development scaled and broadly adopted
Figure 4-5 Number of ML solutions with different levels of progress
DNV GL – Report No. 2020-1137, Rev. 0 – www.dnvgl.com Page 29
ML is a specialization in Artificial Intelligence (AI) where statistical methods are used to let computers find patterns in large amounts of data without being given explicit rules. One of the advantages of ML is that it can process and identify key features in large amount of data in a small fraction of the time it takes for a person to do the same task.
There is a lot of existing infrastructure on the NCS where the integrity will be managed with ever fewer people so there is a strong need to become more effective in identifying which parts of the system requires attention and reduce the amount of time and resources used on parts that do not have an issue. Also, ML is unbiased and is more capable of identification and detection of anomalies and patterns, provided it has been trained with representative data sets for the task it has been set up to perform. A ML algorithm could as an example excel humans in processing data to identify equipment degradation and subsea leaks. ML can be applied with data sets consisting of for instance visual or noise measurement on the subsea template, mass balance production data and satellite data for ocean surface monitoring. Small leaks may only create small changes in a single dataset (e.g. mass balance).
Adopting different datasets and sources for monitoring the integrity of subsea systems is critical to identify and combine multiple symptoms of the same problem. Adopting ML on these datasets could represent a very robust solution for monitoring and detection of subsea leaks as it will not depend on human factors, fatigue and subjectivity.
One of the challenges with ML is that subsea leaks are rare events and ML needs big data sets with leak as outcome to be trained to predict leaks. Data created in a lab or through simulations are often used to create synthetic data sets to compensate for the lack of datasets with rare events. Furthermore, the ML cognitive abilities are inferior to that of the biological brain. ML is therefore normally applied in combination with the assessment of a subject matter expert. The main role of ML is to monitor and provide an alert if deviations are detected, whereas the main role of the subject matter expert is to use the alert provided by the ML algorithm to conduct an assessment and validation of the alert to conclude and take actions if required. ML algorithms should be retrained once more data sets are generated in order to reduce false predictions and ultimately leading to increased trust in its output.
Search engines can range from simple queries extracting relevant data and reports on defined intervals from systems containing relevant data (e.g. PI or SAP) to more advanced search engines using algorithms and machine learning searching in all type of data independent from data format including pictures and scanned documents to come up with a search results adapted to the requested search enquiry.
Computer Vision is a scientific field that deals with how computers can gain high-level understanding from digital images or videos. From the perspective of engineering, it seeks to understand and automate tasks that the human visual system can do. Computer vision tasks include methods for collecting, processing, analysing and understanding digital images in order to produce information, e.g. about an anomaly. Machine Vision (MV) is the technology and methods used to provide imaging-based automatic inspection and analysis, as basis for creating a response to the information.
In summary, the two main application areas of ML in subsea integrity management is related to automatic anomaly detection and failure prediction. Examples are shown in Table 4-3.

DNV GL – Report No. 2020-1137, Rev. 0 – www.dnvgl.com Page 30
Table 4-3 The two main application areas of ML in subsea integrity management
Possible ML applications Examples
Automatic anomaly detection • ILI inspections
• subsea surveys
• flexible riser annulus monitoring
• leak detection
Prediction • condition assessment / corrosion failures in pipelines /17/
• fatigue failures in flexible risers /21/
The application of ML is generally easier and more straight forward for automatic anomaly detection. This is because large data sets can be used to define what is normal and ML can then provide an alert as soon as a deviation from the normal is detected. The application of ML for prediction is more complicated for the following two reasons
a) very few failure cases to learn from exist
b) when good physics-based models (e.g. corrosion models and fatigue models) exist, these will be trusted more than the outcome of an ML algorithm.
Building the trust in ML requires close collaboration between subject matter experts and data scientists with extensive time and effort to be put into training the ML model on training data, validating the ML model and testing the ML model on real cases and data. DNVGL-RP-0510 ‘Framework for assurance of data-driven algorithms and models’ /20/ is an example of a recommended practice to assure data driven models.
4.6 Standardisation of data exchange Data standardisation is a data processing workflow that converts the structure of various datasets into a common data format. Data standardisation enables the data consumer to track, analyse and use data in a consistent manner in addition to enable trending of various historical datasets. Data exchange standards create also opportunities to improve interoperability and sharing of data between different stakeholders as operators, engineering companies and survey/inspection companies. This is because they allow the data to be added in a common environment that facilitates its transfer between different software tools.
Many initiatives around the world make efforts to standardize the exchange of data in the Oil & Gas industry. Two ongoing initiative relevant for NCS is the READI JIP and the PDEF-JIP.
4.6.1 READI JIP Today owners, operators, EPCI contractors and suppliers in the oil and gas industry spend massive amounts of expert man hours to specify, implement and verify requirements versus design, yet repeatedly resulting in quality deviations in project execution and operation.
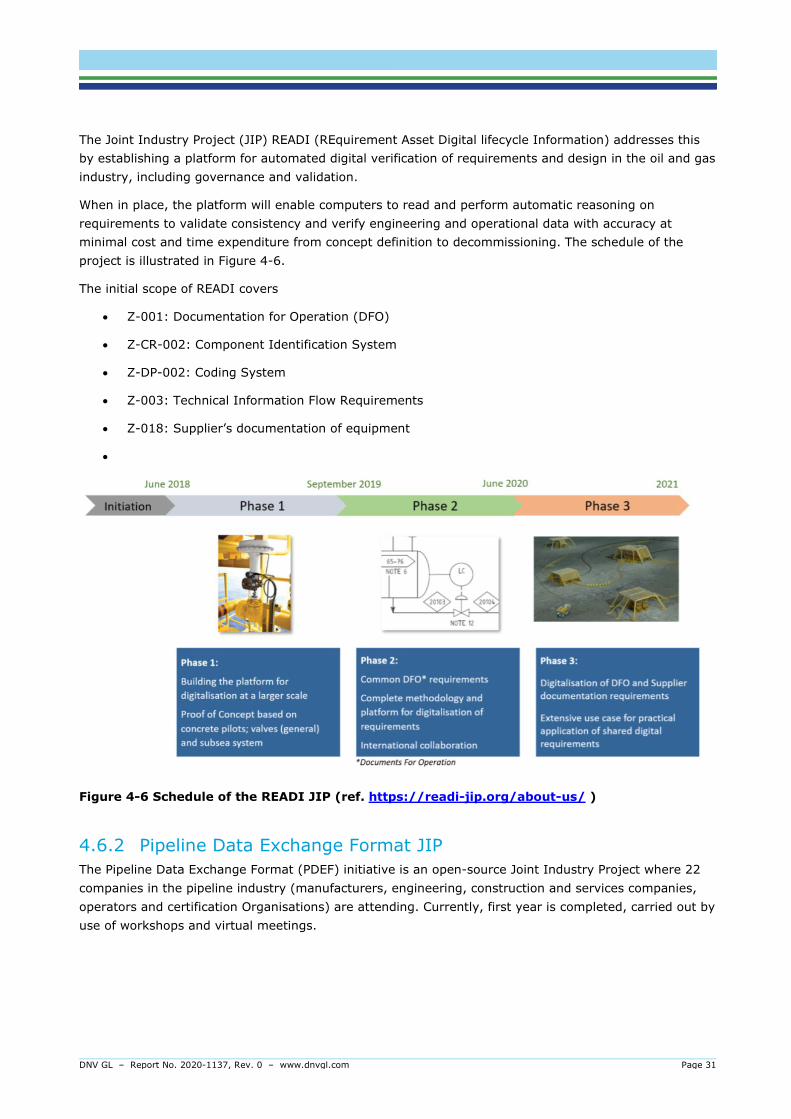
DNV GL – Report No. 2020-1137, Rev. 0 – www.dnvgl.com Page 31
The Joint Industry Project (JIP) READI (REquirement Asset Digital lifecycle Information) addresses this by establishing a platform for automated digital verification of requirements and design in the oil and gas industry, including governance and validation.
When in place, the platform will enable computers to read and perform automatic reasoning on requirements to validate consistency and verify engineering and operational data with accuracy at minimal cost and time expenditure from concept definition to decommissioning. The schedule of the project is illustrated in Figure 4-6.
The initial scope of READI covers
• Z-001: Documentation for Operation (DFO)
• Z-CR-002: Component Identification System
• Z-DP-002: Coding System
• Z-003: Technical Information Flow Requirements
• Z-018: Supplier’s documentation of equipment
•
Figure 4-6 Schedule of the READI JIP (ref. https://readi-jip.org/about-us/ )
4.6.2 Pipeline Data Exchange Format JIP The Pipeline Data Exchange Format (PDEF) initiative is an open-source Joint Industry Project where 22 companies in the pipeline industry (manufacturers, engineering, construction and services companies, operators and certification Organisations) are attending. Currently, first year is completed, carried out by use of workshops and virtual meetings.
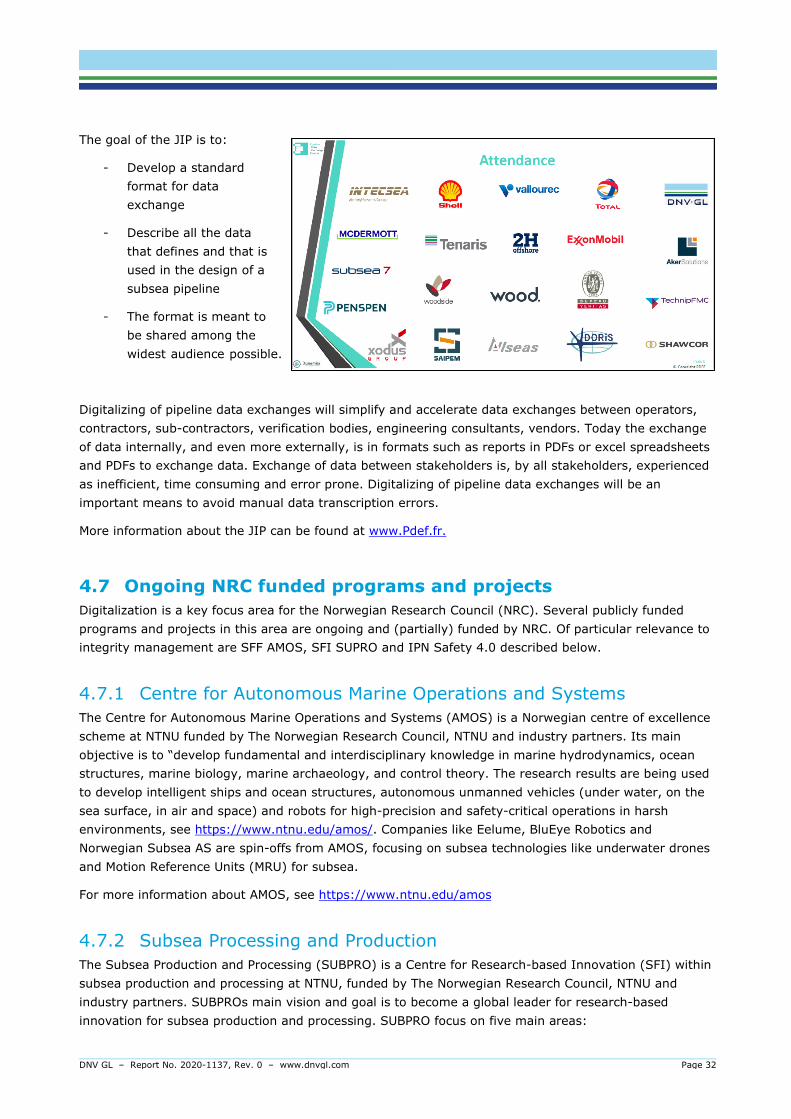
DNV GL – Report No. 2020-1137, Rev. 0 – www.dnvgl.com Page 32
The goal of the JIP is to:
- Develop a standard format for data exchange
- Describe all the data that defines and that is used in the design of a subsea pipeline
- The format is meant to be shared among the widest audience possible.
Digitalizing of pipeline data exchanges will simplify and accelerate data exchanges between operators, contractors, sub-contractors, verification bodies, engineering consultants, vendors. Today the exchange of data internally, and even more externally, is in formats such as reports in PDFs or excel spreadsheets and PDFs to exchange data. Exchange of data between stakeholders is, by all stakeholders, experienced as inefficient, time consuming and error prone. Digitalizing of pipeline data exchanges will be an important means to avoid manual data transcription errors.
More information about the JIP can be found at www.Pdef.fr.
4.7 Ongoing NRC funded programs and projects Digitalization is a key focus area for the Norwegian Research Council (NRC). Several publicly funded programs and projects in this area are ongoing and (partially) funded by NRC. Of particular relevance to integrity management are SFF AMOS, SFI SUPRO and IPN Safety 4.0 described below.
4.7.1 Centre for Autonomous Marine Operations and Systems The Centre for Autonomous Marine Operations and Systems (AMOS) is a Norwegian centre of excellence scheme at NTNU funded by The Norwegian Research Council, NTNU and industry partners. Its main objective is to “develop fundamental and interdisciplinary knowledge in marine hydrodynamics, ocean structures, marine biology, marine archaeology, and control theory. The research results are being used to develop intelligent ships and ocean structures, autonomous unmanned vehicles (under water, on the sea surface, in air and space) and robots for high-precision and safety-critical operations in harsh environments, see https://www.ntnu.edu/amos/. Companies like Eelume, BluEye Robotics and Norwegian Subsea AS are spin-offs from AMOS, focusing on subsea technologies like underwater drones and Motion Reference Units (MRU) for subsea.
For more information about AMOS, see https://www.ntnu.edu/amos
4.7.2 Subsea Processing and Production The Subsea Production and Processing (SUBPRO) is a Centre for Research-based Innovation (SFI) within subsea production and processing at NTNU, funded by The Norwegian Research Council, NTNU and industry partners. SUBPROs main vision and goal is to become a global leader for research-based innovation for subsea production and processing. SUBPRO focus on five main areas:
DNV GL – Report No. 2020-1137, Rev. 0 – www.dnvgl.com Page 33
• Field architecture
• Reliability, availability maintenance and safety
• Fluid characterization and flow assurance
• Separation process concepts
• System control
An important part of SUBPRO is to explore and develop digital tools for production insights (e.g. virtual flow meters), integrity assessment (e.g. remaining useful life) and monitoring (e.g. using sensor data and digital twins) on subsea equipment such as seabed separators, all-electric x-mas trees, choke valves, etc.
For more information about SUBPRO, see https://www.ntnu.edu/subpro
4.7.3 Safety 4.0 Safety 4.0 is a joint-industry project run by DNV GL funded by the Norwegian Research Council and partners. The main objective of Safety 4.0 is to enable and accelerate up-take of novel subsea solutions by developing a framework for standardized demonstration of safety, including examples of common acceptable design solutions. The framework is developed from relevant use-cases (e.g. all-electric x-mas trees) and will support introduction of new safety philosophies, more integrated solutions, and advanced use of sensor data and data analytics, to demonstrate a sufficient level of safety.
For more information about Safety 4.0, see https://www.dnvgl.com/research/oil-gas/safety40/project-description.html
4.7.4 Reciprocal Physics and Data-driven models The RaPiD-models (Reciprocal Physics and Data-driven models) project aims to provide more specific, accurate and timely decision support in operation of safety-critical systems, by combining physics-based modelling with data-driven machine learning and probabilistic uncertainty assessment. The underlying idea is to combine well-established and robust physics-based full order models (FOM), that are made effective by reduced order modelling (ROM), and use of probabilistic data-driven models to both increase the accuracy as well as focus simulation efforts where the information gained produce the most value with respect to the relevant decision context. The project aims to develop:
• New methods for better computational efficiency (such as reduced order modelling)
• New approaches for fast approximations and confident predictions away from simulated scenarios that include relevant uncertainties.
• A novel approach for UQ (uncertainty quantification) by integrating uncertainty propagated through physical models with uncertainty represented by probabilistic machine learning (Gaussian Processes) from sensor data.
• A new way of applying Design of Experiments (DoE) for effective selection of relevant simulation scenarios that reduces uncertainty where it matters the most and thus reduce overall simulation efforts and time.
For more information about the RaPiD-models project, see https://rapid-models.dnvgl.com/
DNV GL – Report No. 2020-1137, Rev. 0 – www.dnvgl.com Page 34
5 CURRENT PRACTICES AND SOLUTIONS
A review of openly available information sources and information gathering from operators, service providers and Original Equipment Manufacturer (OEMs) in the Norwegian subsea market forms the basis for describing current practices and solutions for use of data to inform subsea integrity management. Section 5.1 to 5.3 describes aspects related to technology, work processes and organisation respectively. Section 5.4 describes how use of data may impact the risk understanding and integrity management practices, and Section 5.5 describes characteristics related to specific subsea equipment and systems, and how holistic approach to integrity and barrier management across the system interfaces is achieved.
5.1 Technologies to facilitate effective use of data This section will not go into details on technologies related to e.g. inspection and monitoring but aims to describe technologies which are enablers for effective use of data, their status and how they are being applied. Some of these technologies are as follows:
Communication technology to enable effective transfer of data from point of collection to user. Data collected from subsea are either sent through cable or is batch loaded by e.g. use of ROV/AUV. Communication to shore, which was historically a challenge due to low bandwidth, is currently not considered a bottleneck at most locations. Data intensive applications, e.g. video streaming is also possible from most assets, although not from all vessels.
Asset Information Model (AIM) to enable integration and contextualisation of data. Some operators have adopted an AIM which provides structure, context and navigation capabilities for data. To what extent the AIM has been developed to contextualize data to inform subsea integrity management, however, varies significantly. Typically, a significant amount of monitoring data streams is not linked to the AIM, hence relations between data have not been established, and data are monitored and assessed in isolation.
Data integration platforms to enable sharing and use of data. Some operators have adopted a data integration platform which may be used to liberate data of different formats and from various sources and systems. The AIM may be hosted on the data integration platform. Integrity management applications, e.g. degradation algorithms and 3rd party models and engineering services, can connect to the data integration platform to use the data and the AIM. See Figure 5-4 for illustration.
Technologies for automatic detection and categorization of anomalies. Detection of anomalous condition based on single parameter acceptance criteria or integrity window is to a great extent implemented. More advanced detection, e.g. based on multi-parameter algorithms or based on visual (photo / video) information, however, has very limited application within subsea integrity management. Terms like Machine Learning and Machine Vision and their application is further explained and discussed in Sections 4.4 and 5.4.
Integrity management tools, potentially with digital twin capabilities incorporating the following functions:
• Map relations between equipment, threats, risks, barriers and activities. The relations are currently often presented in reports or analysis, and not integrated in one system. Further elaboration can be found in Section 5.4.
• Link integrity management activity status and results with risk level. The link is currently typically made in assessment reports, and the assessments are sometimes difficult to trace.
DNV GL – Report No. 2020-1137, Rev. 0 – www.dnvgl.com Page 35
• Algorithms for screening of integrity threats and for automatic diagnostics and prediction. These types of algorithms have limited application, but some typical examples which are implemented to a certain extent are:
o CO2 corrosion models for pipelines and risers, e.g. based on Norsok M-506, CO2 corrosion rate calculation model /23/.
o Erosion models for critical geometries and flow conditions, e.g. based on DNVGL-RP-O501, Managing sand production and erosion.
o Fatigue models for risers, e.g. based on DNVGL-RP-C203, Fatigue design of offshore steel structures, and DNVGL-RP-F204, Riser Fatigue.
o Machine Vision to automatically detect potential integrity threats as part of AUV survey is currently being developed and piloted.
• Provide workflow management application to ensure adequate technical condition is maintained and communicated. This includes to document engineering assessments and agreed actions in response to e.g. anomalous condition or degradation, and how this impacts the risk. There is often limited linking between data, assessments, actions and risk.
• Integrate with operator major accident risk overview and governing systems for risk management. The integrity management system gives input to the operator’s major risk overview and governing system for risk management. The link, however, typically requires manual transfer of information between different systems.
Further elaboration of how these technologies are being implemented are found in Section 5.4 and 5.5.
5.2 Work processes / operational aspects Increased use of data, digital tools and new technologies may impact how we work as part of the integrity management process. Some of the hypotheses set forth, and the observations and evaluations made based on the performed review and information gathering, are described below:
1. Increased use of autonomy during inspection and survey work may reduce or change the need for surface vessels and personnel offshore and may prevent having to revert to site for detailed follow-up inspections.
a. Finding/evaluation: Currently autonomy has limited application beyond use of traditional survey AUVs and has so far to a limited extent reduced the need for surface vessels. However, next generation autonomy, e.g. with ability to automatically detect and respond to anomalies by slowing down and performing a more thorough close inspection, is under development and being piloted. Resident AUVs have been deployed, and how to further develop their area of operation is being explored.
2. Increased use of near real time data streaming from inspections and surveys may enable expert support and assessment from an onshore support centre.
a. Finding/evaluation: There is a tendency that less personnel go offshore to support offshore inspection and survey campaigns. This has to a large extent been driven by the restrictions imposed due to the Covid-19 pandemic. It is however believed that the learnings related to supporting offshore operations with expertise from shore will continue, and that this will enable the best expertise to support required assessments and decisions without being limited by where the expertise is located and when the support is needed.

DNV GL – Report No. 2020-1137, Rev. 0 – www.dnvgl.com Page 36
3. Inspection and survey data may be associated with the asset information models, hence be integrate into 3D models and geographical location, functional locations and physical components, etc. This can again be utilized in digital twins to provide decision support.
a. Finding/evaluation: Inspection and surveys are currently mainly reported in pdf reports supported by video files and high-resolution photos, as well as anomaly listings in inspection management tools or spreadsheets. Integration with asset location and visualization of inspection results in layout or 3D model has currently very limited application. The same applies for the utilization of digital twins that have also very limited application within subsea integrity management pr. today but is believed to have a significant potential. Ref. Section 5.4.4.
4. More reliable monitoring data and better prediction models may reduce the need for inspection, or enable a condition-based approach to inspection, maintenance and testing.
a. Finding/evaluation: Even though monitoring data are considered reliable by the industry, models for diagnostics and prediction are considered to be associated with significant uncertainties. Incorporation of monitoring data in the models, as opposed to using design assumptions, however, may lead to less conservative and more accurate diagnostics and predictions. Implementation of live data streams in model algorithms is to a certain extent implemented (e.g. for modelling of CO2 corrosion, erosion and fatigue), and there are indications that this is found particularly relevant where predicted degradation or predicted design life is limiting the remaining useful life of the assets.
b. Finding/evaluation: The monitoring data, although considered to be reliable, are to a limited extent used to adjust inspection intervals or to completely replace inspection with diagnostic or predictive models. This is considered to be related to the uncertainty in the models as described in 4 a). Supported by industry feedback, DNV GL considers it likely that the development to connect data and interpret data in context may lead to more reliable diagnostic and prediction going forward.
5. Automated collection and contextualisation of data may reduce manual work to collect data from different locations, sources and systems.
a. Finding/evaluation: Data liberated to a data integration platform and contextualized in the Asset Information Model may be readily at hand to the integrity engineer. Currently, such liberation and contextualisation do not have extensive application, and the more normal approach is still to talk to relevant personnel; laboratory technicians, process engineers, materials engineers etc. to obtain data and context. An activity which may be time consuming is to identify all data points which are outside established threshold values (e.g. spike values) and understand the context of these events, which may be related to maintenance of equipment, adjustments to an instrument, changes in the production, injection of chemicals etc.
6. Automated integration and assessment of data may reduce manual work and provide near real time condition and risk indications.
a. Finding/evaluations: There are examples of operators implementing tools with digital twin functionality related to diagnostics related to the containment function. These systems are typically currently under development or have limitations in which data are connected and used. There are indications that these developments, when being implemented, may significantly reduce the manual work to integrate and assess the data, as these will be
DNV GL – Report No. 2020-1137, Rev. 0 – www.dnvgl.com Page 37
presented in the right context. Comparison, trending and assessment of data in context is currently typically a manual and time-consuming activity.
7. Presentation of technical condition and risk related to loss of containment in integrated systems or dashboards may replace the need for establishing regular reports as the information is continuously available to relevant stakeholders, alternatively reports can be automated.
a. Findings/evaluations: There are examples of operators who use e.g. dashboards to follow condition status. When dashboards or other tools reliably present current condition and future risk, these can be used towards the various Stakeholders to show current status and associated risk, alternatively to print a report or a snapshot of the risk at a given point in time. Some operators plan to do this going forward. Other operators, however, plan to continue writing regular reports presenting condition and associated risk.
8. Sharing of data within a field; between operators and licenses (e.g. tie-in field to host installation) and between disciplines and traditional “silos”, may improve the understanding of the technical condition and contribute to safe operations, and reduce cost through operational improvements.
a. Finding/evaluation: Data on the status of the containment function, degradation and risk is collected or connected to certain equipment but may also be relevant for the rest of the system. Hence, data should be available across equipment and system interfaces to give a more holistic view. It is an observation that data is often not shared across organisational interfaces which are equivalent to the system interfaces. There seems to be potential in further sharing of data, but work processes and systems to facilitate sharing of data are not always in place.
9. Sharing of data may enable increased learning across organisations and the industry, and may accelerate technology development, e.g. machine learning.
a. Finding/evaluation: Information gathered to support this report indicate that lack of sharing prevents learning and development and confirm that sharing is an important enabler for learning, improvement and efficiency. Currently, sharing of data between Companies seem to be limited mainly by restrictions due to data ownership and contractual limitations.
5.3 Roles and responsibilities – organisational aspects Increased use of data, digital tools and new technologies may impact how we organize to effectively perform the integrity management. Some of the hypotheses set forth, and the observations and evaluations made based on the performed review and information gathering, are described below:
1. OEMs and service providers may take a more integrated role in the subsea integrity management:
• With better inspection and survey data, the inspection provider may better assess whether findings are outside acceptance criteria, hence perform or actively contribute to the evaluation of the results.
• The inspection and survey provider may be able to update the operator’s source systems with the results.
• The best competence and expertise across service providers, OEMs and the operators may be involved in condition- and risk assessments.
• OEMs and expert service providers may be given the role to monitor the condition of subsea assets.
DNV GL – Report No. 2020-1137, Rev. 0 – www.dnvgl.com Page 38
a. Finding/evaluation: Response from operators, OEMs and service providers indicate that the traditional roles are being maintained. Some operators, however, are working more integrated with some of their suppliers to better utilize the best expertise from each of the Organisations as part of the integrity management work.
2. Different disciplines within an operator’s organisation may find benefits in breaking down traditional silos between different parts of the system and areas of expertise (e.g. risers, flowlines, SPS; and corrosion engineer, chemical engineer, integrity engineer…) and between different fields, and having a more holistic view on technical condition monitoring and integrity management across the organisation.
a. Finding/evaluation: There are large variations between different operators. Some operator organisations are set up so that work can be perceived as being performed in “silos” while others work more integrated over the system interfaces. Sharing of data systems and tools are considered to be an enabler for a more holistic approach to the integrity management across the system interfaces and between different fields.
3. Increased use of data, digital tools and new technologies may lead to need for different competence in different parts of the organisation.
a. Finding/evaluation: Response from dialogue with the industry indicates that there is more need for competence to support smarter use of data going forward. The subject matter experts within subsea systems and integrity management need to team up with digital competence to reap the benefits enabled by better use of data.
5.4 Use of data to improve the risk understanding In the context of subsea integrity management and associated risk, it is discussed how to go from data to making informed decisions to ensure that loss of containment does not occur. The following main topics are highlighted in the following sections:
• what data are relevant and how to collect them
• how to integrate the data and why
• how to interpret the data to understand degradation, condition and risk
• how to present technical condition and risk
5.4.1 Data collection, integration and interpretation Data describes characteristics that are collected through some type of observation. Data can be either qualitative or quantitative. In the context of integrity management and condition monitoring, data gives an indication of the technical condition or the state of an influence factor which may contribute to change the technical condition, and eventually loss of containment. Data may be collected through different processes. Data collection is further discussed in Section 5.4.1.1.
Raw data ("unprocessed data") is a collection of data points before it has been "cleaned"; filtered or corrected. There will be uncertainty related to collected data. Issues related to the quality of data are discussed in Section 5.4.1.2.
Although the terms "data" and "information" are often used interchangeably, these terms should be used consistently to prevent confusion. Different types of data typically need to be analysed combined, and in

DNV GL – Report No. 2020-1137, Rev. 0 – www.dnvgl.com Page 39
context, in order to be transformed into information. Data integration and data interpretation is further discussed in Sections 5.4.1.3 and 5.4.1.4 respectively.
Data are measured, collected and reported, and analysed, whereupon it can be visualized using graphs, images or other analysis tools. Presentation of data and information to provide value to the subsea integrity management is further discussed in Section 5.4.1.5.
5.4.1.1 Data collection The tables in Appendix B provides listing of types of data which are relevant to collect as part of subsea integrity management for the respective equipment types as SPS, risers and pipelines. Typical data collection methods are also described.
The data can be grouped into one of the following mitigation categories (purpose of data collection):
• Design "robustness": data collected to verify that the robustness in the system, as per design, is maintained, e.g. to confirm a functional CP system or to confirm that a pipeline is buried to an acceptable depth.
• Operational / process controls ("integrity window"): data collected to verify that the system is operated within acceptable limits, e.g. High and High-High settings on a variety of parameters, dew point temperature in gas transport system to ensure dry gas or maximum depressurization rate over a certain pressure range of a flexible riser to prevent carcass collapse or polymer sheath blistering. It may also include operational limitations, e.g. related to lifting operations over production risers.
• Integrity control ("actual condition"): data collected to verify the actual condition of the equipment or system, e.g. survey, visual inspection and NDT.
• Leak “detection”: data collected to verify that there are no external leaks in the system, e.g. hydrocarbon leak detectors and mass-balance monitoring.
Further, the data collection activities may be categorized as one of the following types:
• Online monitoring: data from instruments installed to continuously or periodically collect data.
• Offline data (inspection, survey or testing): data from activities performed periodically or on demand to collect data.
Other examples of data which are input to the integrity management may come from Design, Fabrication and Installation (DFI) documents, operational procedures, events, engineering assessments, maintenance history etc, ref. 3.3. These are more static data sources but will likely be revisited at several points in time over the lifetime of the subsea asset to inform integrity assessments.
The amount of data collected as basis for subsea integrity management is significant. It should be stressed that the purpose of the majority of installed monitoring instrumentation is process control (system performance) and process safety rather than integrity control (loss of containment). A significant amount of the data collected from installed instrumentation can however be used to assess condition and risk associated with the containment function. A number of surveys, inspection and test activities are being performed with the main purpose of collecting data to support the integrity management process.
During the dialogue with the industry the response was that required data for integrity management are collected and available for assessment to a fairly large or great extent, ref. Figure 5-1. Examples of data

DNV GL – Report No. 2020-1137, Rev. 0 – www.dnvgl.com Page 40
which are typically collected are presented in Appendix B. Some data which are currently considered to be associated with significant uncertainty, and with a potential to further benefit integrity management are:
• Data to better assess risk associated with Microbiologically Influenced Corrosion (MIC) in pipelines.
• Data to better assess accumulated fatigue damage in flexible risers.
• Data to better assess diffuse or small external hydrocarbon leaks.
• Data to assess excessive chemical injection in order to be able to reduce chemical injection (e.g. corrosion inhibitor).
Most data collected from subsea online instrumentation is continuously streamed and available topsides and in the onshore support centre. There are however differences between fields on the ability to send data to topsides. The main impression, however, is that limitations on for instance bandwidth is generally not limiting the collection of the required data.
There are examples of monitoring data which are periodically collected or downloaded, e.g. by use of ROV/AUV. One example is temporary or retrofitted motion monitoring sensors which may collect motion data with a set frequency for a period of time (e.g. three to six months), whereupon the data is transferred to an ROV which returns the data topsides.
There are also examples of data which are available, but which are typically not collected. One example is data about the health condition of the sensors itself (e.g. sensor temperature). OEMs typically consider these data to be of value, while operators typically do not collect these data. These are data which may inform about the condition of the instrument, hence the accuracy of the instrument reading.
Figure 5-1 Question 2b: To what extent are the required data for integrity management readily available / collected?
5.4.1.2 Data quality Any data will be associated with some uncertainty and potentially some unavailability (data may not be available at any point in time). An important factor for data is whether it has the required quality. Hence, whether it is accurate enough and available enough to fulfil its purpose.
Data supporting evaluation of the technical condition of subsea assets are generally considered to have sufficient quality. Reference is made to response from the industry, see Figure 5-2, to support this. There are however some data which have limited accuracy (hence, significant uncertainty) due to
0
1
2
3
4
5
6
No extent Some extent Fairly largeextent
Great extent

DNV GL – Report No. 2020-1137, Rev. 0 – www.dnvgl.com Page 41
limitation in the technology applied compared to the complexity of accurately measuring the data. Examples identified with a potential to further benefit integrity management were:
• NDT inspection (corrosion and crack detection) of armour layers in flexible risers and jumpers.
• Depth of Burial (DOB) and field gradient measurements for pipelines.
• Hydrocarbon leak detection technologies.
A point to make is that there seem to be limited awareness or focus on the data quality when it comes to data readings from instrumentation, ref. Section 4.2. Requirements to data quality for the purpose of technical integrity management has very limited application, and measurements are typically not registered with an uncertainty range. The uncertainty related to data quality does not seem to be systematically assessed and documented. For a qualified NDT method, measurement limitations and uncertainties are to a large extent managed through the qualification and through procedures. For visual inspection and survey, data quality may be limited by several factors as requirements to resolution, light, travel speed and may be difficult to quantify. The competence of the inspector is of high importance to manage the quality of any type of inspection.
Figure 5-2 Question 2a: To what extent are the data collected of sufficient quality to assess the technical integrity reliably?
5.4.1.3 Data integration Different types of data typically need to be analysed combined and in context in order to be transformed into information about technical condition. Some observations from the dialogue with the various operators are:
• The collected data are being stored in several different source systems:
o Process data and process alarms are typically found in a process information or control system.
o Test data from manual test activities, e.g. chemical compositions and corrosion coupons, are typically stored in separate systems or purpose made spreadsheets.
o Inspection and survey data are typically stored as video files and anomaly listings.
o Anomaly information is typically stored in an inspection management tool and critical anomalies are stored in the asset inventory system and/or risk register.
o NDT results are typically reported in and stored as pdf files.
0
1
2
3
4
5
6
No extent Some extent Fairly largeextent
Great extent
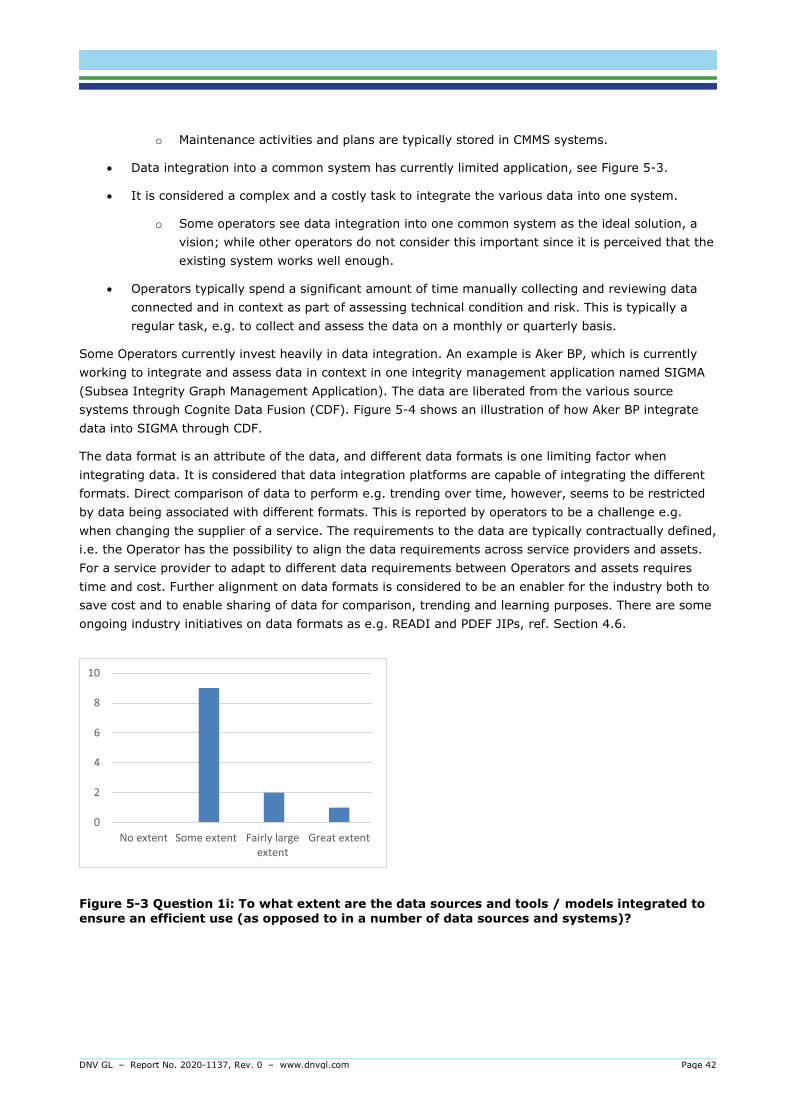
DNV GL – Report No. 2020-1137, Rev. 0 – www.dnvgl.com Page 42
o Maintenance activities and plans are typically stored in CMMS systems.
• Data integration into a common system has currently limited application, see Figure 5-3.
• It is considered a complex and a costly task to integrate the various data into one system.
o Some operators see data integration into one common system as the ideal solution, a vision; while other operators do not consider this important since it is perceived that the existing system works well enough.
• Operators typically spend a significant amount of time manually collecting and reviewing data connected and in context as part of assessing technical condition and risk. This is typically a regular task, e.g. to collect and assess the data on a monthly or quarterly basis.
Some Operators currently invest heavily in data integration. An example is Aker BP, which is currently working to integrate and assess data in context in one integrity management application named SIGMA (Subsea Integrity Graph Management Application). The data are liberated from the various source systems through Cognite Data Fusion (CDF). Figure 5-4 shows an illustration of how Aker BP integrate data into SIGMA through CDF.
The data format is an attribute of the data, and different data formats is one limiting factor when integrating data. It is considered that data integration platforms are capable of integrating the different formats. Direct comparison of data to perform e.g. trending over time, however, seems to be restricted by data being associated with different formats. This is reported by operators to be a challenge e.g. when changing the supplier of a service. The requirements to the data are typically contractually defined, i.e. the Operator has the possibility to align the data requirements across service providers and assets. For a service provider to adapt to different data requirements between Operators and assets requires time and cost. Further alignment on data formats is considered to be an enabler for the industry both to save cost and to enable sharing of data for comparison, trending and learning purposes. There are some ongoing industry initiatives on data formats as e.g. READI and PDEF JIPs, ref. Section 4.6.
Figure 5-3 Question 1i: To what extent are the data sources and tools / models integrated to ensure an efficient use (as opposed to in a number of data sources and systems)?
0
2
4
6
8
10
No extent Some extent Fairly largeextent
Great extent

DNV GL – Report No. 2020-1137, Rev. 0 – www.dnvgl.com Page 43
Figure 5-4 Illustration of how Aker BP presents architecture and data flow enabling assessment of data in context in SIGMA to present technical condition and risk /16/.
5.4.1.4 Data interpretation In order to understand the technical condition and the associated risk, the collected data typically need to be analysed both combined and in context. Some observations from the dialogue with the various operators are:
• The collected data are considered to represent a good basis for understanding the technical condition and detection of degradation, ref. Figure 5-5. This is supported by the fact that the majority of relevant data are being collected (ref. Section 5.4.1.1) and that the data has sufficient quality (ref. Section 5.4.1.2).
• Data interpretation is to a large extent a manual process which has to be performed on a regular basis or on demand, ref. Figure 5-6. Hence, the competence of the engineer or subject matter expert performing the integrity assessment is very important in order to reliably describe the technical condition and the associated risk.
• Trigger levels, alarms and acceptance criteria on single data points are typically implemented. However, degradation models, algorithms and automatic assessment tools have very limited application, ref. Figure 5-7
• The manual part of the data collection, data integration and data interpretation are time consuming. Some operators report this as a challenge, while other operators see this as well invested time for the integrity engineers to fully understand the assets, their condition and the risk.
DNV GL – Report No. 2020-1137, Rev. 0 – www.dnvgl.com Page 44
Threats to a subsea system can be categorized as either rate (or time) based (e.g. corrosion, erosion) or event based (e.g. trawl impact, dropped object). For rate-based threats there are in general empirical models for degradation rates or damage accumulation which are normally documented as part of the design (e.g. CO2 corrosion model, erosion model, fatigue analysis). One could expect that the same degradation or damage accumulation models form basis for potential algorithms and automatic assessment tools in the operational phase. There are examples for such automatic assessment tools which have been implemented, but as stated above; these have limited application within subsea integrity management. Instead, typically trigger levels or alarms on single parameters are implemented to verify operation within design assumptions. The reason for this is generally considered to be due to the uncertainty and assumed conservatism in the models, as well as the complexity of setting up the automatic tool. However, there seem to be an increasing interest in setting up automatic assessment tools based on degradation and damage accumulation models, where the service life is challenged by operation near the design assumptions / limitations. Further equipment specific details are provided in Section. 5.5.
For event-based threats, automatic assessment tools based on complex models, are considered less relevant, and monitoring of single parameters to inform the likelihood is considered a more feasible approach. Examples related to trawl impact and dropped object in this regard are bottom trawling activity and the weight of trawl boards and clump weights, and vessel and lifting activities, respectively, ref. Section 4.3. It should be noted that inspection to verify actual condition should not be taken credit for as a preventive mitigation for event-based threats. Inspection may however reduce uncertainty about the current condition as result of potential earlier events.
During normal operation, and the regular subsea integrity management process, it may be acceptable that the data collection, integration and interpretation is a periodic, manual and time-consuming process. It is considered likely, however, that this may lead to:
• Slower detection of a situation which may negatively impact the containment function.
• Slower response to a finding, anomaly or leak, as relevant data to ensure correct understanding and a complete picture must be obtained and assessed in order to respond responsibly and correctly.
• Less time spent on validating information and making the right decisions as time need to be spent on collecting, integrating and interpreting data as basis for providing sufficient information for the decision to be made.
It should be mentioned though that some Operators value the benefits of manual interpretation of data, hence consider software and system to support data interpretation to not be necessary as – in the end -it comes down to the experience and the competence of the integrity engineers.
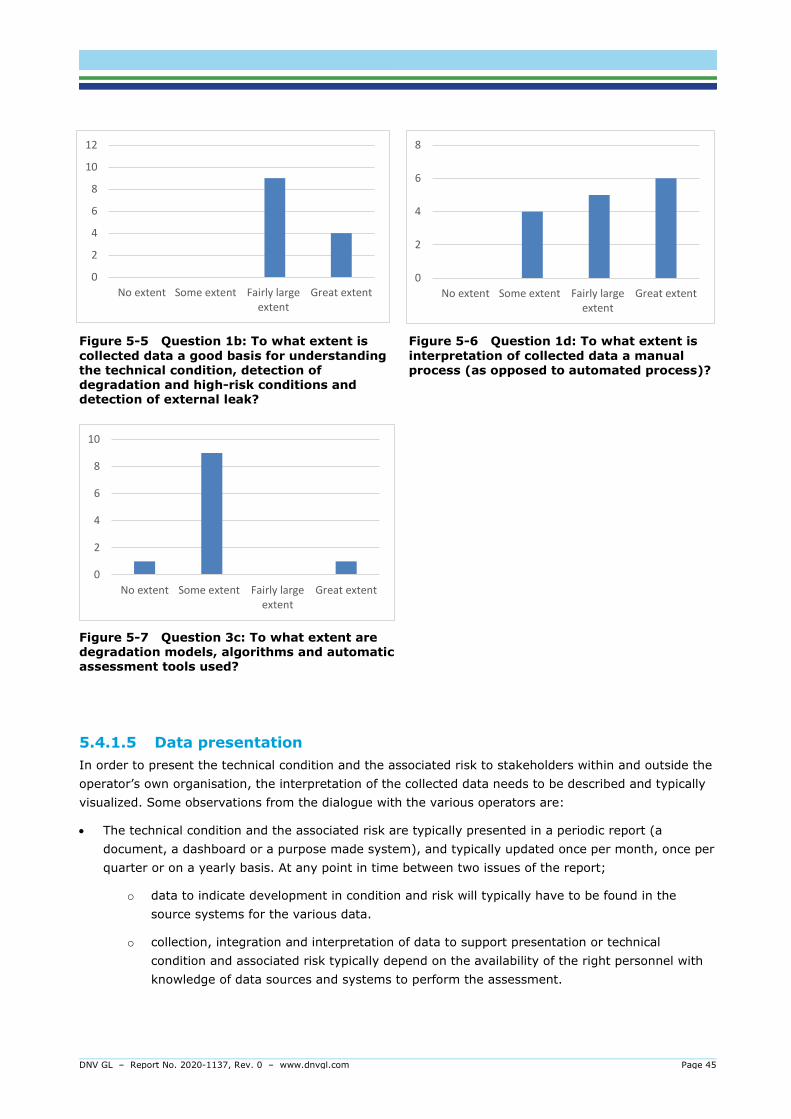
DNV GL – Report No. 2020-1137, Rev. 0 – www.dnvgl.com Page 45
Figure 5-5 Question 1b: To what extent is collected data a good basis for understanding the technical condition, detection of degradation and high-risk conditions and detection of external leak?
Figure 5-6 Question 1d: To what extent is interpretation of collected data a manual process (as opposed to automated process)?
Figure 5-7 Question 3c: To what extent are degradation models, algorithms and automatic assessment tools used?
5.4.1.5 Data presentation In order to present the technical condition and the associated risk to stakeholders within and outside the operator’s own organisation, the interpretation of the collected data needs to be described and typically visualized. Some observations from the dialogue with the various operators are:
• The technical condition and the associated risk are typically presented in a periodic report (a document, a dashboard or a purpose made system), and typically updated once per month, once per quarter or on a yearly basis. At any point in time between two issues of the report;
o data to indicate development in condition and risk will typically have to be found in the source systems for the various data.
o collection, integration and interpretation of data to support presentation or technical condition and associated risk typically depend on the availability of the right personnel with knowledge of data sources and systems to perform the assessment.
0
2
4
6
8
10
12
No extent Some extent Fairly largeextent
Great extent0
2
4
6
8
No extent Some extent Fairly largeextent
Great extent
0
2
4
6
8
10
No extent Some extent Fairly largeextent
Great extent

DNV GL – Report No. 2020-1137, Rev. 0 – www.dnvgl.com Page 46
• The condition and risk are typically not reported or visualized in context of the asset / tag hierarchy or a visual representation of the layout/3D model.
• The technical condition and risk reporting should be, but is not always, presented in context of relevant performance standards and requirements (performance requirements shall be established for the identified barrier elements. This includes performance requirements to technical, operational and organisational barrier elements. These requirements shall ensure compliance with the Operator’s objectives, as well as rules and regulations).
• The Major Accident Risks (MAR) are typically manually transferred to and maintained in the Operator risk register (the definition of MAR will be associated with the operator’s risk matrix).
• The condition and associated risk which are being presented are considered reliable information, ref. Figure 5-8, but represent a “snap-shot” from a given point in time. Hence, changes between two reports are not necessarily picked up and reflected in the current presentation of technical condition and associated risk, ref. Figure 5-9.
Some subsea OEMs deliver systems which to some extent present data in context such as in purpose made dashboards / user interface, with associated trigger levels and alarms. These systems are typically primarily reflecting production and performance management, but also partly technical condition and the containment function. Current functionality, however, seem to be limited to monitored parameters. Hence, survey, inspection and test data are currently not reflected in these systems.
One operator informed that they are currently working to develop one integrated system for data collection, data integration and data interpretation, as well as presentation of current technical condition and the associated risk. This is further discussed in Section 5.4.4.
One operator has chosen to cover flexible riser integrity management from an onshore condition monitoring centre due to the risk associated with flexible risers specifically (see further information in Section 5.5.3).
Figure 5-8 Question 1g: To what extent is current condition and associated risk accurate / reliable information?
Figure 5-9 Question 1f: To what extent is current condition and associated risk available information?
5.4.2 Live streaming, autonomy and automated detection With current bandwidth and data transfer capacity, live streaming or near live transfer of data from subsea activities to shore is possible in many locations; via offshore assets and or via inspection-,
0
2
4
6
8
No extent Some extent Fairly largeextent
Great extent0
2
4
6
8
No extent Some extent Fairly largeextent
Great extent
DNV GL – Report No. 2020-1137, Rev. 0 – www.dnvgl.com Page 47
survey- and intervention vessels. Traditionally, inspectors and asset expertise have been offshore to attend and support offshore campaigns, inspections and surveys. This is still the situation, based on feedback from operators and service companies. However, the restrictions implemented due to the Covid-19 pandemic during 2020, have triggered increased use of live streaming of data, and support from relevant expertise from the onshore support centres and from the home office. This is believed to become a more normal way of organizing expert support going forward. This development will reduce need for personnel offshore and may improve the access to the right expertise to support e.g. anomaly assessments during inspection and surveys, hence also contribute to reduce the CO2 footprint from the offshore operations.
Visual inspections and surveys result in vast amounts of data in form of hours of videos. The videos are normally delivered to the operator together with a list of anomalies to be further assessed by the asset expertise in the operator organisation. For a pipeline, anomalies will normally be associated with a location on the pipeline, defined as a KP location. For other subsea assets, anomalies may be associated with functional location or components. The video may be coded to tie an anomaly to a certain physical location and associated point in time in the video. Without such linking, the value of the video as data is significantly reduced.
Some of the important technologies being explored within subsea visual inspection are related to improvement of the video or high-resolution photo, as well as automatic detection of anomalies. During subsea inspection and survey, a good reproduction of the actual condition is an important prerequisite for a reliable result. Good reproduction depends on factors such as light, resolution and correct geometric representation (may be impacted by the camera lens). Work is also being performed to enable to automatically detect anomalies. When it comes to automatic detection of anomalies, and even automatic response to a detected anomaly, initiatives are typically in the development and piloting phase.
Some service providers are exploring Computer Vision (ref. description in Section 4.5) to detect and characterize anomalies. A limiting factor in training an application to detect and characterize an anomaly is reported to be access to data sets for training of the application. Data sets from previous inspections are typically the ownership of the Operator, and it has been reported as being very challenging to get access to sufficient amounts of consistent data (i.e. video, high resolution photo, and associated anomaly assessments) to effectively train such applications.
Machine Vision (MV) is the technology and methods used to provide imaging-based automatic inspection and analysis, as basis for creating a response to the information. As an example, survey providers are working to develop the capability of an AUV to trigger a close visual inspection upon the detection of an anomaly. This would include slowing down the travelling speed – or stopping if required - and making a close-up inspection with sufficient lighting and resolution to allow sufficiently detailed inspection to reliably characterize an anomaly in order to prevent having to revert for a second inspection at a later point in time.
AUVs (see description in Section 4.1) have been operated for nearly 20 years, however, recent developments are increasing the potential for using AUV to benefit subsea integrity management going forward. Current developments include Machine Vision capabilities as described above. An AUV will typically store data until it reverts back to the “docking station” for a subsea resident AUV, or the surface vessel, where data transfer is performed. AUV development for future subsea inspection and survey is an area where there is fierce competition between different service and technology providers, and where several companies are investing heavily. An illustration of AUV technologies, as presented by Oceaneering, is shown in Figure 5-10.
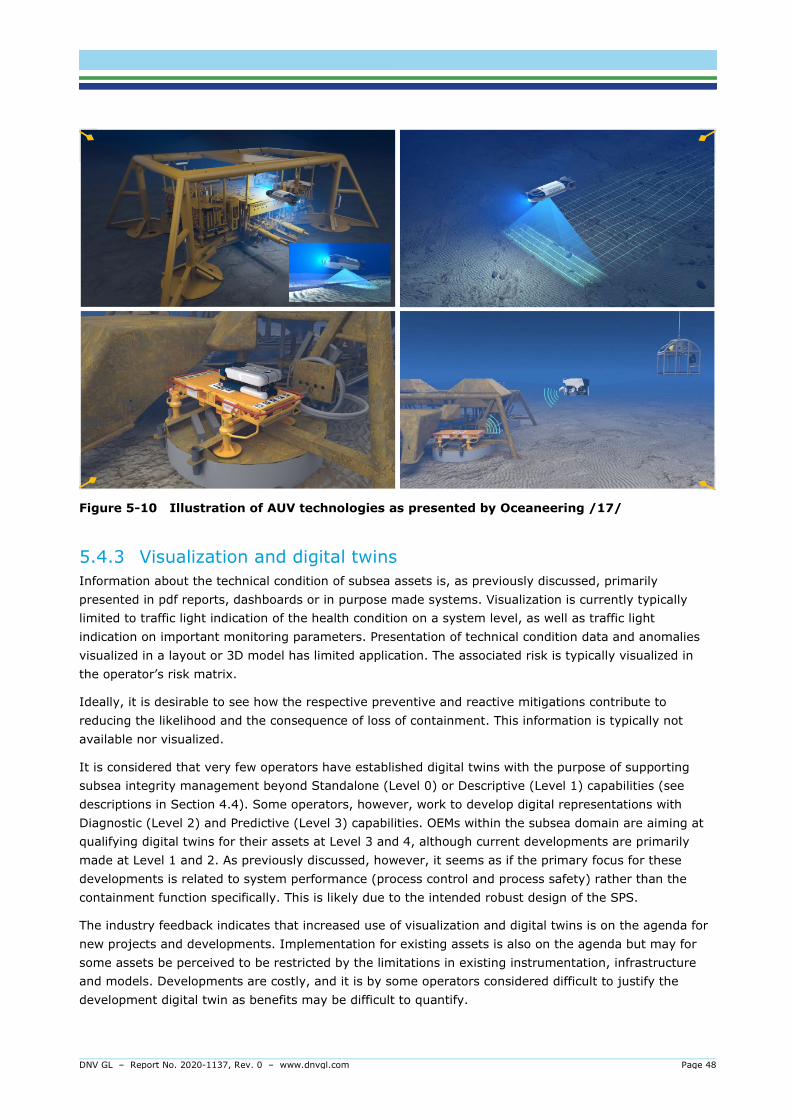
DNV GL – Report No. 2020-1137, Rev. 0 – www.dnvgl.com Page 48
Figure 5-10 Illustration of AUV technologies as presented by Oceaneering /17/
5.4.3 Visualization and digital twins Information about the technical condition of subsea assets is, as previously discussed, primarily presented in pdf reports, dashboards or in purpose made systems. Visualization is currently typically limited to traffic light indication of the health condition on a system level, as well as traffic light indication on important monitoring parameters. Presentation of technical condition data and anomalies visualized in a layout or 3D model has limited application. The associated risk is typically visualized in the operator’s risk matrix.
Ideally, it is desirable to see how the respective preventive and reactive mitigations contribute to reducing the likelihood and the consequence of loss of containment. This information is typically not available nor visualized.
It is considered that very few operators have established digital twins with the purpose of supporting subsea integrity management beyond Standalone (Level 0) or Descriptive (Level 1) capabilities (see descriptions in Section 4.4). Some operators, however, work to develop digital representations with Diagnostic (Level 2) and Predictive (Level 3) capabilities. OEMs within the subsea domain are aiming at qualifying digital twins for their assets at Level 3 and 4, although current developments are primarily made at Level 1 and 2. As previously discussed, however, it seems as if the primary focus for these developments is related to system performance (process control and process safety) rather than the containment function specifically. This is likely due to the intended robust design of the SPS.
The industry feedback indicates that increased use of visualization and digital twins is on the agenda for new projects and developments. Implementation for existing assets is also on the agenda but may for some assets be perceived to be restricted by the limitations in existing instrumentation, infrastructure and models. Developments are costly, and it is by some operators considered difficult to justify the development digital twin as benefits may be difficult to quantify.

DNV GL – Report No. 2020-1137, Rev. 0 – www.dnvgl.com Page 49
5.4.4 Dynamic risk management and response to anomalies and events The risk assessment related to loss of containment and the subsea integrity management process has historically been – and still is - a relatively static process. The integrity management “wheel” as illustrated in Figure 3-2 was typically a yearly process. A few examples to justify this statement:
• The risk assessment, integrity review and activity planning were typically performed:
o initially – e.g. HAZID and FMECA during the design or project phase, or;
o regularly - e.g. RBI every 5-10 years, long term activity plans, or;
o yearly - e.g. integrity review, activity plan for next year.
• The risk assessment, integrity review and activity plans were typically pdf reports or excel sheets, hence, relatively static deliveries which were updated to reflect new revisions as indicated above.
Inspections and surveys to confirm the actual condition were typically considered the most important activity, while monitoring of parameters influencing degradation rate or damage was primarily performed to verify the assumption in for instance the RBI.
With the improved understanding and capabilities related to integrating and interpreting data, it is now possible to develop more dynamic risk management and improved ability to detected anomalies and events. A few examples to justify this statement:
• The risk assessment can be dynamically updated to reflect actual configuration, operation and threats by linking to asset hierarchy and 3D model, live operational data and alarms, as well as monitoring of parameters directly influencing the likelihood of threats to occur.
• The integrity management activities, which may be either preventive (hence, reduce the likelihood of a threat to lead to loss of containment) or reactive (hence, reduce the consequence of loss of containment through detection, prevent escalation or remediation), and their effectiveness in reducing the risk, may be reflected in a risk model.
• The current technical condition and associated risk may be viewed and presented at any point in time, and at any level in the asset hierarchy, on demand.
• Mitigations taken account for in the risk assessment which fail to be performed or which report anomalous condition may be reacted upon to consider need for updating the risk assessment, alternatively the need for immediate response.
It should be stressed that dynamic risk assessment through integrated tools has very limited application within subsea integrity management, with a few exceptions. There are examples of operators which work actively to develop capabilities and tool to support dynamic risk management and which have defined visions and strategies aiming to automate subsea IMR and to develop integrated digital working environments.
5.5 Integrity management of subsea assets The purpose of this section is to describe and reflect on how data collection, integration and interpretation is currently applied within the different types of subsea assets, and how this is typically integrated across the subsea assets to support a holistic view on subsea integrity management. The subsea assets are split in Risers, Pipelines and Subsea Production Systems. In this section, these are described as disciplines.

DNV GL – Report No. 2020-1137, Rev. 0 – www.dnvgl.com Page 50
5.5.1 A holistic view of integrity management of subsea assets The hydrocarbon production from reservoir to host or to shore depends heavily on the containment function and associated safety systems to ensure safe and reliable production over the lifetime. Design standards and required asset expertise varies along the production path from well through XT and manifold, flowlines and spools, risers and jumpers and through the receiving and processing facility. Design requirements and the implicit safety philosophies varies accordingly, and the system interfaces often introduces some uncertainties. Despite this, or we could say due to this, it is important to have a holistic approach to the integrity management and containment as barrier function across the equipment and system interfaces.
Different operators set up and organise the integrity management across different disciplines, equipment and systems, in different ways. Some operators have dedicated teams supporting integrity management for each area of expertise, typically SPS, flowlines / pipelines and risers. This facilitates the need for equipment expertise when planning and assessing data. Potential negative effects, however, are that data and information are stored in different systems, and that use of data and information across the equipment and systems may not be shared across the different personnel and teams involved. A potential effect may also be that different criteria and strategies may be applied, which may lead to inconsistency.
Other operators, typically operators with a smaller amount of assets to manage, hence, a smaller integrity management organisation, set up more integrated teams to facilitate the integrity management from XT to riser hang-off in a more holistic view. One of the challenges in smaller teams is typically to include sufficient technical depth of expertise on all equipment and expertise, and such teams are typically more dependent on competent suppliers or partners.
It is believed that integrated data systems, enabling use of same data and information and more transparent acceptance criteria, risk assessments and integrity management process, may support the development towards more holistic integrity management and one common approach to managing the containment barrier along the hydrocarbon path from well to receiving facility.
5.5.2 Leak detection Leak detection is one of the topics which has been given significant focus in PSA Norway surveillance over the recent years. It is also an area where non-conformities and improvement needs have been identified, ref. 5.5.6. Typical activities performed to detect significant leaks include:
• Hydrocarbon leak detectors, ref. /22/, installed near the XT.
• Pressure instrumentation with low alarm and trip function to detect pressure drop due to leak.
• Oil spill detection radar to detect hydrocarbons to surface.
• Satellite surveillance to detect hydrocarbons to surface.
• Periodic inspection and survey to visually detect leak and leak point.
• Visual observation from personnel on facilities, seagoing vessels and aircraft to detect hydrocarbons to surface.
Subsea hydrocarbon leak detection systems are installed on a number of subsea templates (but not all) to detect leaks from wells and production system on the template. Different types of detection technologies have their limitations, and have some places proven to be unreliable /4/.

DNV GL – Report No. 2020-1137, Rev. 0 – www.dnvgl.com Page 51
Major leaks may be detected with current arrangements, while minor or diffuse hydrocarbon leaks may not be detected by current arrangements. The consequence of minor or diffuse leaks are primarily affecting the environment (depending on rate and time), reputation and economy, and will typically lead to production shut down when detected and include cost to allow remediation (production loss and repair cost). Subsea inspection and pipeline survey may be the source of detecting minor or diffuse leaks.
Several operators are actively working to upgrade both detection capabilities through retrofitting more reliable technologies and through clarifying performance requirements and how to verify compliance with performance requirements to ensure more reliable detection.
5.5.3 Risers Flexible risers should be given high focus as they are safety critical components. This is due their structural complexity and difficulty in detecting several of the failure modes combined with the event frequency related to flexible risers which is high compared to other subsea equipment.
The riser connects the subsea production system to the topside facility. Where the topside facility is floating, hence moves with weather and waves, the risers are normally designed as flexible risers. Loss of containment of a production riser will likely lead to hydrocarbon release to sea under the platform, and potentially flammable gas cloud reaching the topside. Hence, loss of containment of a production riser is considered a Major Accident Risk (MAR).
A flexible riser has a complex cross section, and its structural integrity depends on the interaction between armour layers and non-metallic sheaths. It has proven difficult to reliably detect all failure mechanisms and failure modes that may develop in a flexible riser. This is due to significant uncertainty in the inspection of the annulus, including at hot spots such as hang-off / termination, bend stiffener, bend restrictor / sag / hog and touch-down point.
Steel risers, typically applied for fixed platforms, have a less complex set of failure modes, and it is typically easier to assess its condition compared with a flexible riser.
Data typically collected as part of integrity management of risers is described in Appendix B.
Several Operators confirm that the flexible risers are given particular focus due to the associated risk. Annulus monitoring and testing, as well as fatigue considerations are typically given high focus. It varies, however, significantly to what extent the data are manually or automatically collected, integrated and interpreted. There are examples of operators which, together with competent suppliers, have set up models / algorithms, dashboards and alarms for follow-up of threats. An example to illustrate the set-up of flexible risers fatigue monitoring is shown schematically in Figure 5-11.

DNV GL – Report No. 2020-1137, Rev. 0 – www.dnvgl.com Page 52
Figure 5-11 Schematic illustrating of flexible riser “Fatigue counter” as presented by 4Subsea /16/, /21/
Figure 5-12 Illustration of NDT of flexible riser cross section as presented by Oceaneering /18/
5.5.4 Pipelines Threats and integrity management activities for various transport pipelines and in-field flowlines varies significantly depending on configuration, material of construction and the production fluid. The part of
DNV GL – Report No. 2020-1137, Rev. 0 – www.dnvgl.com Page 53
the pipelines located outside the installation safety zone, and with sufficient distance to shore or other vessel, are mainly not related to Major Accident Risk. The consequences of loss of containment will mainly be related to the environment, reputation and financial, and to lesser extent to the safety of personnel. Parts of the pipelines (within the safety zone and landfall) may however expose personnel to hydrocarbons, hence, represent significant safety risk.
Most pipelines are rigid steel pipelines, with associated rigid spools. Flexible jumpers, where applied, are associated with the same complexity and the same data as presented in Section 5.5.3.
Data typically collected as part of integrity management of pipelines is described in Appendix B. See also /8/.
For pipelines, operators report that the rate-based degradation mechanisms are mostly possible to reliably assess, while event-based threats are not so easy to assess and manage. A few examples to substantiate this:
• External corrosion is highly understood and highly manageable through verifying the functionality of the CP system.
• Internal corrosion is associated with uncertainty (medium understanding, ref. uncertainties in corrosion models and detection of microbiological activity; and medium manageability, ref. need for cleaning and chemical treatment to reduce corrosiveness). Hence, ILI of carbon steel pipelines is performed for most pipelines to reduce the uncertainty and actively confirm the technical condition. It should be noted that there are examples of carbon steel hydrocarbon pipelines which have so far not been inspected.
• Current and future trawl board and clump weights may be higher than design limitation on exposed pipelines /5/. Inspection to look for signs of bottom trawling and impacts will not prevent future impacts (pull-over, impact or hooking), and monitoring of trawling activity, e.g. on a quarterly basis, e.g. using maps from the Norwegian Directorate of Fisheries, may indicate trends, but cannot guaranty that there will be no future bottom trawling event.
As described in Section 5.4.2, current development to improve AUVs and unmanned vessels, as well as automatic detection and response to anomalies is being conducted to improve data collection and interpretation (at least as a screening tool), to reduce the need for personnel offshore, and to reduce the CO2 footprint of the offshore operations.
As for other equipment types, it varies significantly to what extent the data for pipeline integrity management are manually or automatically collected, integrated and interpreted.
5.5.5 Subsea Production Systems Subsea production systems (SPS), including XT, CBM and manifold, are often considered robust in design to enable maintenance free operation. Loss of containment is typically considered to be associated with connections. Hence, visual inspection and leak monitoring is typically considered to be the most important activities, in addition to process parameters to verify compliance with design assumptions as described in Appendix B.
As described in Section 5.5.2, current development to improve the reliability of leak detection systems is being conducted. As for other equipment types, it varies significantly to what extent the data for SPS integrity management are manually or automatically collected, integrated and interpreted.

DNV GL – Report No. 2020-1137, Rev. 0 – www.dnvgl.com Page 54
SPS OEMs have developed different systems for monitoring and management of the condition of their deliveries. These systems are to a certain degree developed as digital twins as described in Section 5.4.3. Adoption of these digital twins has currently limited application, but OEMs report that there is increasing interest from operators in adopting these new systems. Some resistance has historically been experienced from the operators. This may be related to the robust design of the SPS as well as the data being closely related to production sensitive information.
Figure 5-13 SPS illustration. Source: DNV GL
5.5.6 Compliance with PSA regulations PSA Norway supervision reports in the time period from January 2018 to October 2020 have been reviewed in order to summarise reported non-conformities and improvement points for use of data related to improved integrity management. The following were some of the main findings:
Leak detection
Non-conformities:
• Acceptance criteria and performance requirements for leak detection: Inadequate monitoring / indicators and acceptance criteria for external leak (2020).
Improvement points:
• System for leak detection not having been sufficiently operationalized in order to detect and quantify leaks. The operator had not sufficiently described how to collect, interpret and use the data (2020).
• The combined information from leak detection system and subsea visual inspection. The inspection interval had been extended from one to four years while the leak detection systems were reported to have challenges (2019).
• Inadequate specification of performance requirements for leak detection (2018).

DNV GL – Report No. 2020-1137, Rev. 0 – www.dnvgl.com Page 55
Integrity management
Improvement points:
• Performance standard for the containment function and lack of holistic strategy for verifying containment as barrier function. This included aspects related to different responsible parties operating different connected and dependent assets (2020).
• Considering instrumentation to inform about ageing effects (2020).
• Limited use of data to identify degradation or defects (2019).
• How to use data for the purpose of subsea integrity management (inadequate strategy) (2018).
• Having a holistic approach to integrity management and barrier management for the containment barrier across the different systems and interfaces (2018).
Flexible risers (and jumpers)
Non-conformities:
• Operation of flexible risers. Unclear operating limits related to pressure and depressurization rates, and how to ensure compliance with these limits (2020).
• Maintenance management of system for annulus monitoring. Unclear maintenance requirements and routines to ensure reliable annulus monitoring (2020).
• Operating parameters for flexible risers and jumpers. Operating parameters and limitations in procedures and in control room not in accordance with parameters used for integrity management (2018).
• Integrity management of flexible risers and jumpers; different aspects including NDT, monitoring and testing (2018).
Improvement point (flexible jumpers):
• The maintenance program was insufficient to detect degradation or defects under development in order to timely intervene (activities included visual inspection, review of operational data, operational limits) (2018).
Pipelines
Improvement points:
• Uncertainty in corrosion model for internal corrosion in pipeline which has not been internally inspected. It was pointed out that leak has previously occurred in water injection line due to corrosion, and the corrosion model was considered non-conservative (2020).
• Verification of dry gas in gas transport pipelines through follow up of measurement and equipment for water dew point (2019).
The PSA reported non-conformances and improvement points in the time period from January 2018 to date, are generally in line with focus areas in the industry as presented in this report. No PSA Norway incident investigation reports related to external leak from subsea assets, and considered relevant for
DNV GL – Report No. 2020-1137, Rev. 0 – www.dnvgl.com Page 56
the study described herein, were identified in the reviewed time period from January 2018 to October 2020. The RNNP report for 2019 summarises that there were three incidents, categorised as major, related to flexible risers in 2019 /14/. None of these resulted in hydrocarbon leak, but the failure modes indicate that equivalent failures may occur on hydrocarbon flexible risers if the failure development is not detected and may potentially lead to loss of containment. Hence, data collection to detect similar failure development should be given high focus, as further discussed in Section 5.5.3.
Section 3.6 of this report refers to regulations where use of data in the context of integrity management are described. Some reflections related to compliance with these regulations and how they are complied with, are presented below:
• The maintenance program (…) shall include activities for monitoring performance and technical condition, which ensure identification and correction of failure modes that are under development or have occurred. The programme shall also contain activities for monitoring and control of failure mechanisms that can lead to such failure modes, ref. Activities Regulations, §47. It is observed that the industry has high focus on identifying threats, failure modes and degradation mechanisms, and collect data to manage failure modes that are under development. There are however some degradations / failure mode developments which are currently difficult to detect. These are to a large extent associated with flexible risers. There are also improvement opportunities when it comes to detection of diffuse / small hydrocarbon leaks. Focus should be given both to improving technology to collect reliable data and to the work processes and the strategy for how to assess the data and evaluate the risk, and how to implement operational controls.
• The responsible party shall ensure that data of significance to health, safety and the environment are collected, processed and used (…), ref. Management Regulations, §19. It is observed that data is being used, and that the industry considers that the right data are being collected. There are improvement opportunities related to how effectively the data are being used, and what value and understanding is created from the data.
• Facilities shall be equipped with necessary safety functions that at all times can (1.) detect abnormal conditions, (2) prevent abnormal conditions from developing into hazard and accident situations, (3) limit the damage caused by accidents, ref. Facilities Regulations, §8. It is observed that safety functions / barriers are defined and that requirements are defined through performance standards. There seems to be improvement opportunities in linking the collected data to the integrity management process and further make assessments within the right context to improve detection of and response to abnormal conditions.
• Facilities shall be outfitted with instrumentation for monitoring and recording conditions and parameters that can be significant in verifying the results from analyses, as well as parameters of significance to the facility's further use (…), ref. Facilities Regulations, §17. The industry considers that most of the relevant data, including instrumented data, are being collected. There seems to be improvement opportunities on some areas. Motion / stress monitoring of flexible risers has been mentioned as a significant opportunity. Other areas, which may be more difficult to achieve, is instrumentation to better monitor MIC in pipelines and corrosion and fatigue of armour layers in flexible risers.
The regulations, in several places, uses the term (…) at all times (…), see Section 3.6. There seems to be potential in going from (to a large extent) manual, regular review of data, to a more automatic, continuous processing of data, to present better information about technical condition and associated risk at all times.

DNV GL – Report No. 2020-1137, Rev. 0 – www.dnvgl.com Page 57
6 CHALLENGES AND OPPORTUNITIES
6.1 Challenges The review and information gathering performed as basis for this report has shown that there are some technical, operational and organisational aspects which slow down or prevent use of data to further improve integrity management and risk assessment for subsea assets. The following main challenges have been identified:
• Availability of information: Updated information to show the current technical condition and associated risk is only intermittently available to stakeholders (e.g. management, partners) and regulators:
o The data is typically collected, assessed and presented/reported at certain milestones.
o Data to inform about technical condition and associated risks are typically stored in a number of different systems, and partly on servers with limited access (i.e. lack of integrated systems).
o Integration and interpretation of data is highly dependent on manual assessments from dedicated subject matter experts.
• Unclear business case: The business case for extensive initiatives to improve data collection, data integration and data interpretation is unclear:
o Technology development and qualification have a high cost (ref. e.g. AUV and Machine Vision initiatives, as well as purpose made integrity management software tools or digital twins accessing all relevant and contextualised data through data integration platforms and using algorithms for diagnostics and predictions).
o Economic benefits from improved integrity management and barrier management is difficult to quantify, and the value of having subsea engineers and subject matter experts collecting and assessing the data is by some, perceived to be difficult to replace.
o Even though monitoring data are trusted, they are, to a great extent, not used to adjust inspection intervals, hence, not used to potentially reduce cost associated with offshore operations.
• Leak detection: Sensors and data related to small or diffuse hydrocarbon leaks, and strategies for leak detection, are an area of potential improvement:
o Monitoring technologies for detection of small or diffuse leaks, typically from subsea connectors and bolted connections, need to be better understood and qualified to provide reliable detection data.
o Leak detection strategies and criteria need to be improved to provide reliable detection and response to small or diffuse subsea leaks.
• Integrity management of flexible risers: Data to inform about the development of credible failure modes in flexible risers and jumpers should be improved:
o Inspection and monitoring technologies to reliably confirm the condition and predict the degradation of the metallic and non-metallic layers in flexible pipes, and particularly at hot spots (terminations, bend restrictor, bend stiffener/sag/hog, touch-down point) still needs to be improved in order to increase the understanding and reduce the uncertainty.
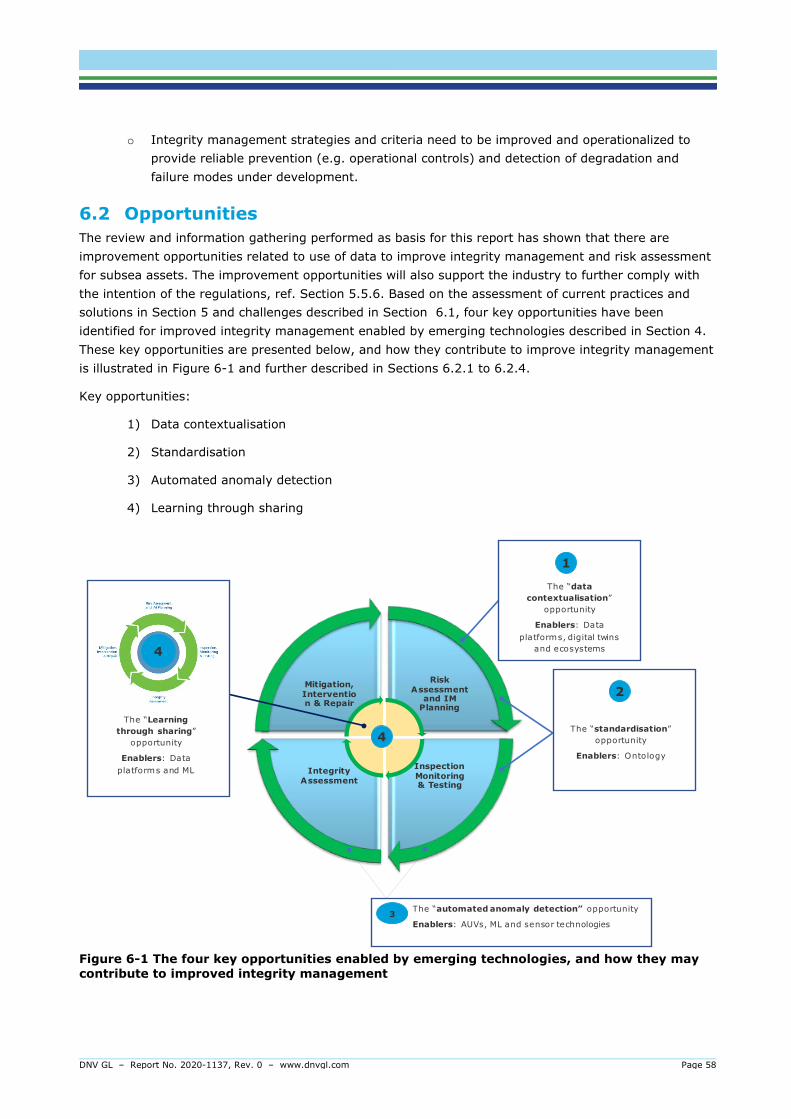
DNV GL – Report No. 2020-1137, Rev. 0 – www.dnvgl.com Page 58
o Integrity management strategies and criteria need to be improved and operationalized to provide reliable prevention (e.g. operational controls) and detection of degradation and failure modes under development.
6.2 Opportunities The review and information gathering performed as basis for this report has shown that there are improvement opportunities related to use of data to improve integrity management and risk assessment for subsea assets. The improvement opportunities will also support the industry to further comply with the intention of the regulations, ref. Section 5.5.6. Based on the assessment of current practices and solutions in Section 5 and challenges described in Section 6.1, four key opportunities have been identified for improved integrity management enabled by emerging technologies described in Section 4. These key opportunities are presented below, and how they contribute to improve integrity management is illustrated in Figure 6-1 and further described in Sections 6.2.1 to 6.2.4.
Key opportunities:
1) Data contextualisation
2) Standardisation
3) Automated anomaly detection
4) Learning through sharing
Risk Assessment
and IM Planning
Inspection Monitoring & Testing
Integrity Assessment
Mitigation, Intervention & Repair
The “automated anomaly detection” opportunity
Enablers: AUVs, ML and sensor technologies3
The “datacontextualisation”
opportunity
Enablers: Data platforms, digital twins
and ecosystems
1
The “standardisation” opportunity
Enablers: Ontology
2
4
4
The “Learning through sharing”
opportunity
Enablers: Data platforms and ML
Figure 6-1 The four key opportunities enabled by emerging technologies, and how they may contribute to improved integrity management

DNV GL – Report No. 2020-1137, Rev. 0 – www.dnvgl.com Page 59
6.2.1 Data contextualisation There are no technical showstoppers for combining data into integrated systems to enable dynamic integrity management and risk management. Enablers include cloud-based storage, increased computational power, data platforms, digital twins and ecosystems, as well as standardisation (see 6.2.2). It is, however, costly and time consuming, and takes management dedication and stamina to achieve. For new subsea development projects, the value of digitalization such as digital twins may be easier to justify due to the combined benefits applying the digital twin both for engineering and operations. For brownfield / existing subsea fields there may be some limitations in data collection capabilities, but it is considered that this should not restrict work to contextualise the data which is being collected.
Communication capacity / bandwidth, data integration platforms and firewalls / security measures can be set up to reliably manage collection, integration and sharing of data. A purpose made integrity management digital environment with diagnostics and predictive capabilities can be set up. Technical condition and associated risk can hence be presented to relevant stakeholders on equipment, system or asset level at “any point in time”, visualised on layout or 3D model (if found beneficial), and integrated with the Operator’s major risk register.
Better understanding of the contribution of each data point to indicate condition or degradation, alternatively to prevent or mitigate the risk, may help prioritise which activities to perform based on a cost benefit assessment, and may justify stopping to perform activities which do not contribute significantly to reducing the risk.
6.2.2 Standardisation Standard ontologies for semantic asset information models and standardised data formats for easier exchange, integration and comparison / trending of data are considered significant enablers for developing models and automation, as well as to enable sharing of data. Two ongoing initiatives in the Norwegian petroleum industry is mentioned in Section 4.6.
Industrial standardisation is normally complex as most companies will insist on protecting its own interest when trying to find common denominators. It may also be a challenge to establish a sound business case for standardisation. In the long run standardisation will bring big benefits, in the short term it might be perceived to represent a cost. A small well-defined scope could reduce the complexity of the standardisation task for subsea integrity data.
The most prevalent standardisation need identified in this study is to standardize on in-line inspection (ILI) and subsea survey data formats.
6.2.3 Automated anomaly detection As described in Section 4.5, Machine Learning is unbiased and is more capable of continuous monitoring for, and identification of, anomalies and patterns compared to humans, provided it has been trained with unbiased representative data sets for the task it has been set up to perform. AUVs with Machine Vision capabilities, and new sensor technologies in combination with Machine Learning, represent a unique opportunity for more advanced monitoring and inspection. Increasingly advanced AUVs have reached a high level of technology maturity and are in the process of being piloted and deployed on the NCS. Integrity related acceptance criteria and performance standards for subsea systems can be built into automated anomaly detection algorithms triggering the first steps of the integrity assessment process.
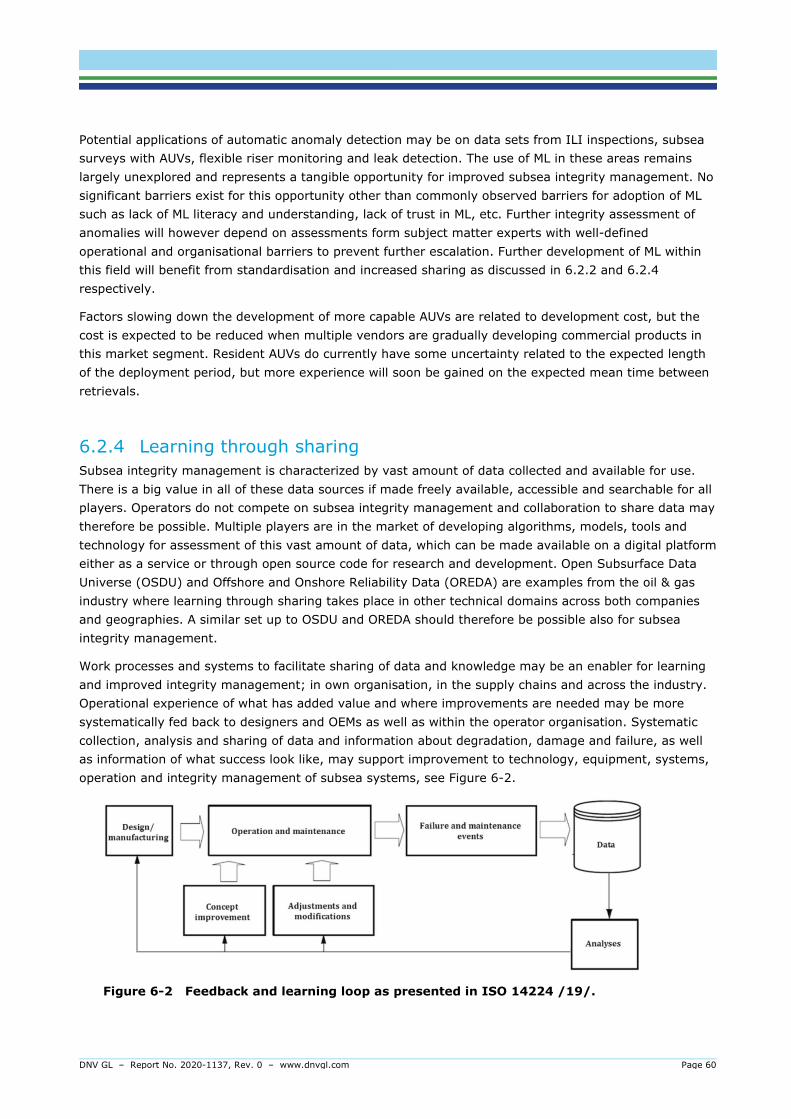
DNV GL – Report No. 2020-1137, Rev. 0 – www.dnvgl.com Page 60
Potential applications of automatic anomaly detection may be on data sets from ILI inspections, subsea surveys with AUVs, flexible riser monitoring and leak detection. The use of ML in these areas remains largely unexplored and represents a tangible opportunity for improved subsea integrity management. No significant barriers exist for this opportunity other than commonly observed barriers for adoption of ML such as lack of ML literacy and understanding, lack of trust in ML, etc. Further integrity assessment of anomalies will however depend on assessments form subject matter experts with well-defined operational and organisational barriers to prevent further escalation. Further development of ML within this field will benefit from standardisation and increased sharing as discussed in 6.2.2 and 6.2.4 respectively.
Factors slowing down the development of more capable AUVs are related to development cost, but the cost is expected to be reduced when multiple vendors are gradually developing commercial products in this market segment. Resident AUVs do currently have some uncertainty related to the expected length of the deployment period, but more experience will soon be gained on the expected mean time between retrievals.
6.2.4 Learning through sharing Subsea integrity management is characterized by vast amount of data collected and available for use. There is a big value in all of these data sources if made freely available, accessible and searchable for all players. Operators do not compete on subsea integrity management and collaboration to share data may therefore be possible. Multiple players are in the market of developing algorithms, models, tools and technology for assessment of this vast amount of data, which can be made available on a digital platform either as a service or through open source code for research and development. Open Subsurface Data Universe (OSDU) and Offshore and Onshore Reliability Data (OREDA) are examples from the oil & gas industry where learning through sharing takes place in other technical domains across both companies and geographies. A similar set up to OSDU and OREDA should therefore be possible also for subsea integrity management.
Work processes and systems to facilitate sharing of data and knowledge may be an enabler for learning and improved integrity management; in own organisation, in the supply chains and across the industry. Operational experience of what has added value and where improvements are needed may be more systematically fed back to designers and OEMs as well as within the operator organisation. Systematic collection, analysis and sharing of data and information about degradation, damage and failure, as well as information of what success look like, may support improvement to technology, equipment, systems, operation and integrity management of subsea systems, see Figure 6-2.
Figure 6-2 Feedback and learning loop as presented in ISO 14224 /19/.

DNV GL – Report No. 2020-1137, Rev. 0 – www.dnvgl.com Page 61
7 REFERENCES /1/ DNVGL RP-F116 Integrity Management of Submarine Pipeline Systems, September 2019
/2/ DNVGL-RP-0002 Integrity Management of Subsea systems, September 2019
/3/ DNVGL-RP-F206 Riser Integrity Management, September 2019
/4/ DNV GL report 2018-1197, rev.0 ‘Use of Risk Assessments and performance requirements for selection of offshore subsea leak detection systems’
/5/ DNV GL report no 2014-0113, rev.03 ‘ Subsea Facilities – Technology Developments, Incidents and Future Trends’
/6/ IKM Doc. No.: 1611101-IKM-Y-RA-0001 - Rev: 03 - 29.01.2019’ 1611101 - Petroleum Safety Authority Study NCS Trawl Development Study’
/7/ DNV GL report 2018-1250 ‘Digitalisering i vedlikeholdsstyringen og bruken i analysearbeidet’ 11-04-2019
/8/ Marintek report no 260057.00.02, 2010, ‘Steel pipelines – state of the art for internal condition monitoring and inspection technologies’
/9/ Marintek report no. 26002600.01, 2007 ‘Condition monitoring on subsea installations’
/10/ DNV GL report no 2020-0825 ‘OG21 study on machine learning in the Norwegian petroleum industry’, 24.09.2020 – Revision 0
/11/ Prinsipper for barrierestyring i petroleumsvirksomheten BARRIERENOTAT 2017
/12/ DNVGL-RP-A204 Qualification and assurance of digital twins, October 2020
/13/ DNVGL-RP-0317 Assurance of sensor systems, December 2020
/14/ RNNP (Risk level in Norwegian petroleum activity) 2019 -Summary report ‘Trends in risk level in the Norwegian Petroleum Activity’, April 2020, PSA
/15/ Big data analytics for rapid assessment of pipeline condition, by M. Capewell, K. Pesinis, and M. Smith, Rosen Group, 2019, EID Energie Ingormationsdienst GmbH.
/16/ Aker BP/4Subsea presentation: Leveraging data and digital insight to reduce risk and automate operations, October 2020
/17/ Oceaneering, Freedom Autonomous Vehicle Development Overview
/18/ Oceaneering CTIT: Computer Tomography Inspection Tool, 2018
/19/ ISO 14224, Collection and exchange of reliability and maintenance data for equipment
/20/ DNVGL-RP-0510 Framework for assurance of data-driven algorithms and models, April 2020

DNV GL – Report No. 2020-1137, Rev. 0 – www.dnvgl.com Page 62
/21/ Flexible riser fatigue counter developed from field measurements and Machine Learning techniques, OTC-29531-MS, Christoffer Nilsen-Aas (4Subsea AS) | Jan Muren (4Subsea AS) | Håvard Skjerve (4Subsea AS) | Jacob Qvist (4Subsea AS) | Rasmus Engebretsen (4Subsea AS) | Helio Alves (4Subsea AS) | Melqui Santos (4Subsea AS) | Sandro Pereira (Shell Brazil) | Leury Pereira (Shell Brazil), 2019
/22/ DNVGL-RP-F302 ‘Offshore Leak Detection’
/23/ Norsok M-506, CO2 corrosion rate calculation model

DNV GL – Report No. 2020-1137, Rev. 0 – www.dnvgl.com A-1
APPENDIX A Questionnaire with graphical results
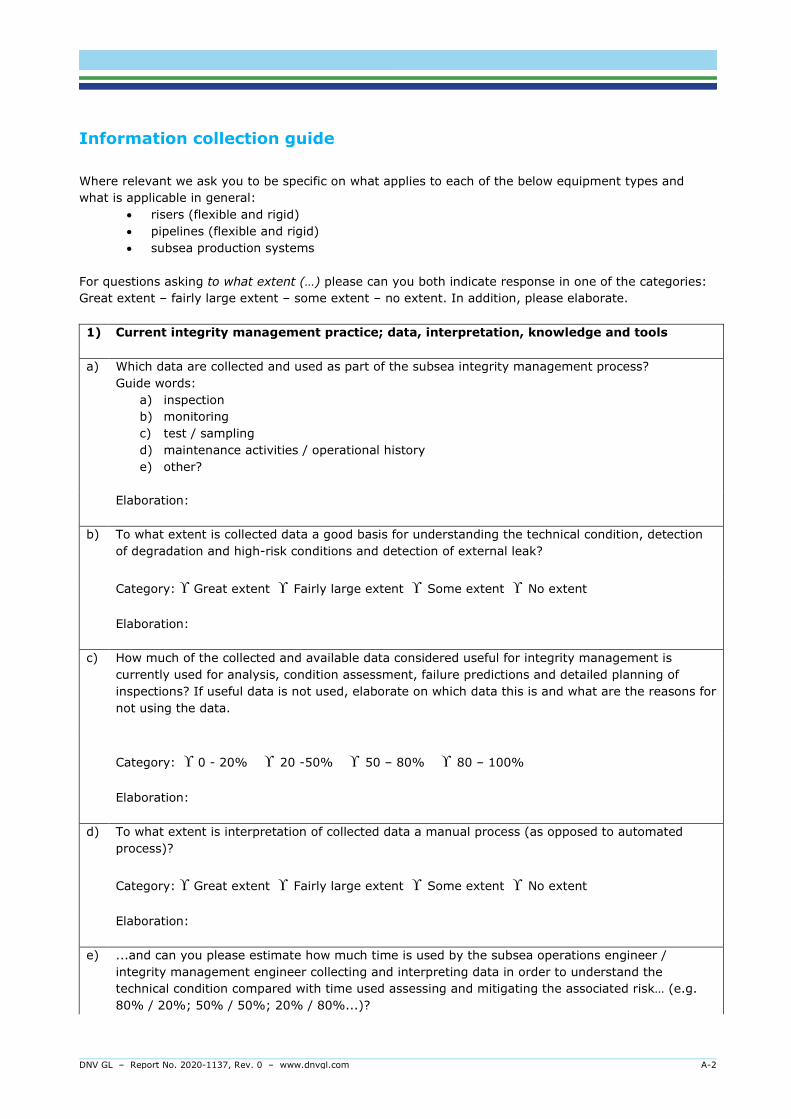
DNV GL – Report No. 2020-1137, Rev. 0 – www.dnvgl.com A-2
Information collection guide Where relevant we ask you to be specific on what applies to each of the below equipment types and what is applicable in general:
• risers (flexible and rigid) • pipelines (flexible and rigid) • subsea production systems
For questions asking to what extent (…) please can you both indicate response in one of the categories: Great extent – fairly large extent – some extent – no extent. In addition, please elaborate.
1) Current integrity management practice; data, interpretation, knowledge and tools
a) Which data are collected and used as part of the subsea integrity management process?
Guide words: a) inspection b) monitoring c) test / sampling d) maintenance activities / operational history e) other?
Elaboration:
b) To what extent is collected data a good basis for understanding the technical condition, detection
of degradation and high-risk conditions and detection of external leak?
Category: ϒ Great extent ϒ Fairly large extent ϒ Some extent ϒ No extent
Elaboration:
c) How much of the collected and available data considered useful for integrity management is currently used for analysis, condition assessment, failure predictions and detailed planning of inspections? If useful data is not used, elaborate on which data this is and what are the reasons for not using the data.
Category: ϒ 0 - 20% ϒ 20 -50% ϒ 50 – 80% ϒ 80 – 100%
Elaboration:
d) To what extent is interpretation of collected data a manual process (as opposed to automated process)?
Category: ϒ Great extent ϒ Fairly large extent ϒ Some extent ϒ No extent
Elaboration:
e) ...and can you please estimate how much time is used by the subsea operations engineer / integrity management engineer collecting and interpreting data in order to understand the technical condition compared with time used assessing and mitigating the associated risk… (e.g. 80% / 20%; 50% / 50%; 20% / 80%...)?
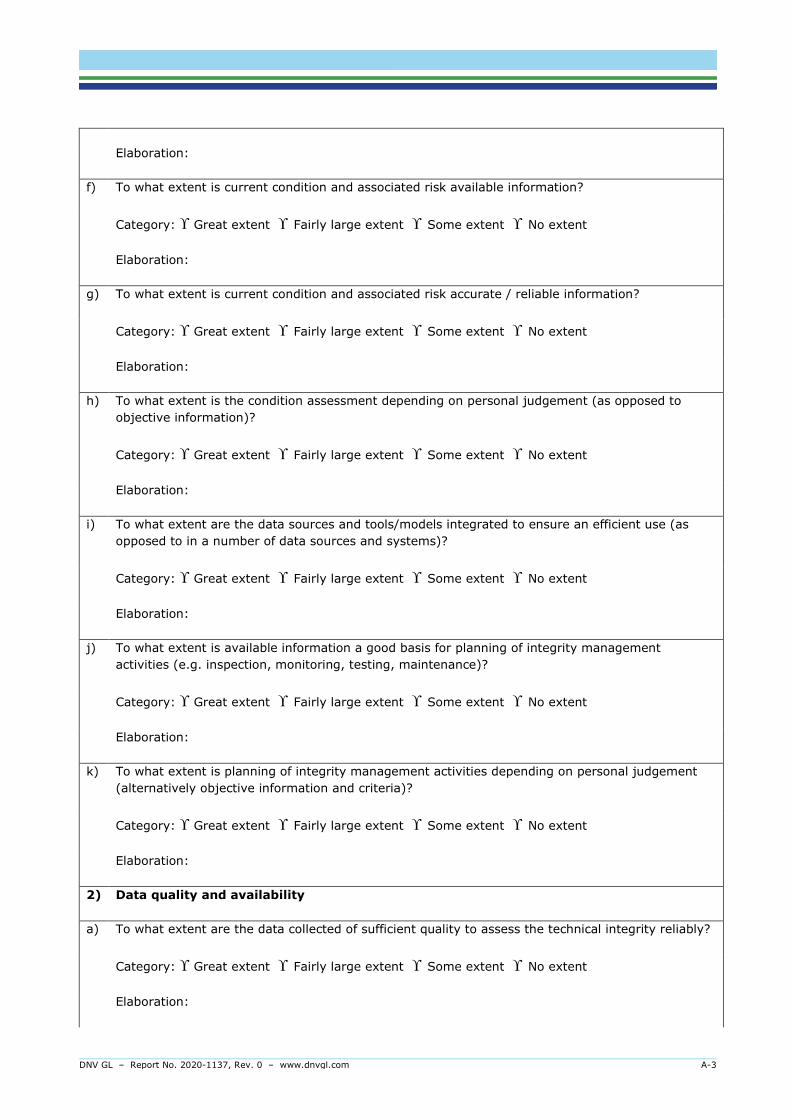
DNV GL – Report No. 2020-1137, Rev. 0 – www.dnvgl.com A-3
Elaboration:
f) To what extent is current condition and associated risk available information?
Category: ϒ Great extent ϒ Fairly large extent ϒ Some extent ϒ No extent
Elaboration:
g) To what extent is current condition and associated risk accurate / reliable information?
Category: ϒ Great extent ϒ Fairly large extent ϒ Some extent ϒ No extent
Elaboration:
h) To what extent is the condition assessment depending on personal judgement (as opposed to
objective information)?
Category: ϒ Great extent ϒ Fairly large extent ϒ Some extent ϒ No extent
Elaboration:
i) To what extent are the data sources and tools/models integrated to ensure an efficient use (as opposed to in a number of data sources and systems)?
Category: ϒ Great extent ϒ Fairly large extent ϒ Some extent ϒ No extent
Elaboration:
j) To what extent is available information a good basis for planning of integrity management activities (e.g. inspection, monitoring, testing, maintenance)?
Category: ϒ Great extent ϒ Fairly large extent ϒ Some extent ϒ No extent
Elaboration:
k) To what extent is planning of integrity management activities depending on personal judgement (alternatively objective information and criteria)?
Category: ϒ Great extent ϒ Fairly large extent ϒ Some extent ϒ No extent
Elaboration:
2) Data quality and availability
a) To what extent are the data collected of sufficient quality to assess the technical integrity reliably?
Category: ϒ Great extent ϒ Fairly large extent ϒ Some extent ϒ No extent
Elaboration:
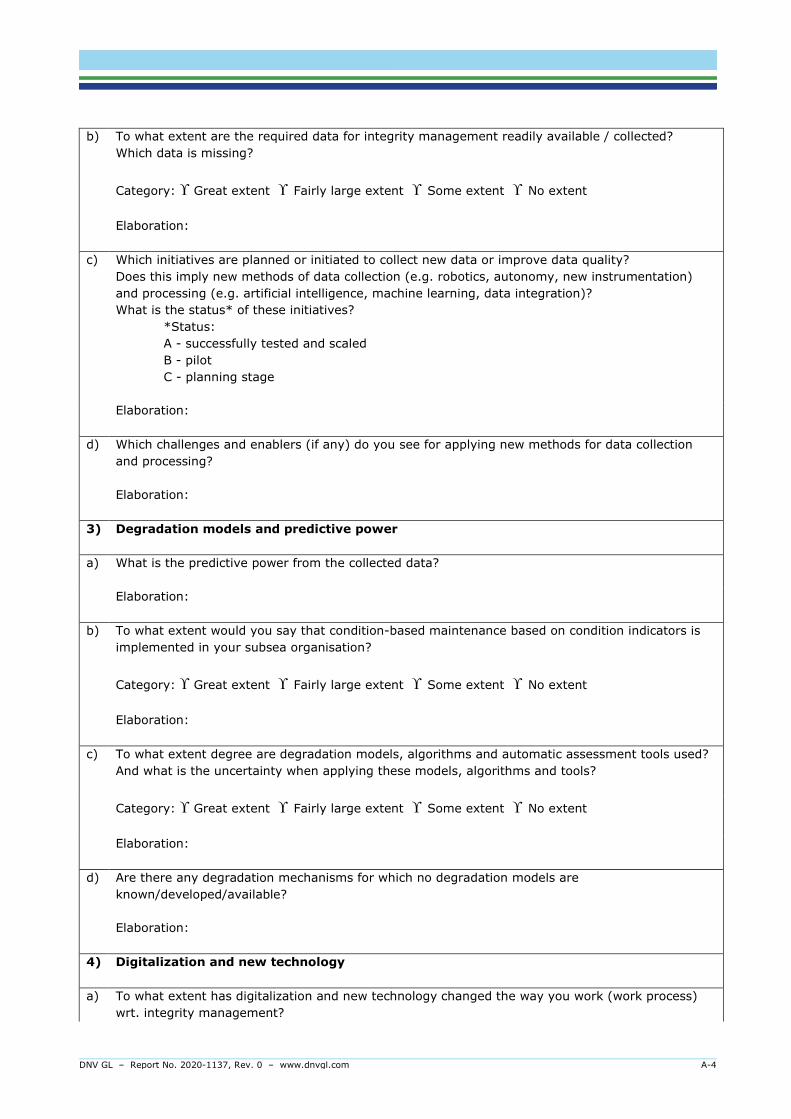
DNV GL – Report No. 2020-1137, Rev. 0 – www.dnvgl.com A-4
b) To what extent are the required data for integrity management readily available / collected? Which data is missing?
Category: ϒ Great extent ϒ Fairly large extent ϒ Some extent ϒ No extent
Elaboration:
c) Which initiatives are planned or initiated to collect new data or improve data quality? Does this imply new methods of data collection (e.g. robotics, autonomy, new instrumentation) and processing (e.g. artificial intelligence, machine learning, data integration)? What is the status* of these initiatives?
*Status: A - successfully tested and scaled B - pilot C - planning stage
Elaboration:
d) Which challenges and enablers (if any) do you see for applying new methods for data collection
and processing?
Elaboration:
3) Degradation models and predictive power
a) What is the predictive power from the collected data?
Elaboration:
b) To what extent would you say that condition-based maintenance based on condition indicators is implemented in your subsea organisation?
Category: ϒ Great extent ϒ Fairly large extent ϒ Some extent ϒ No extent
Elaboration:
c) To what extent degree are degradation models, algorithms and automatic assessment tools used? And what is the uncertainty when applying these models, algorithms and tools?
Category: ϒ Great extent ϒ Fairly large extent ϒ Some extent ϒ No extent
Elaboration:
d) Are there any degradation mechanisms for which no degradation models are known/developed/available?
Elaboration:
4) Digitalization and new technology
a) To what extent has digitalization and new technology changed the way you work (work process) wrt. integrity management?
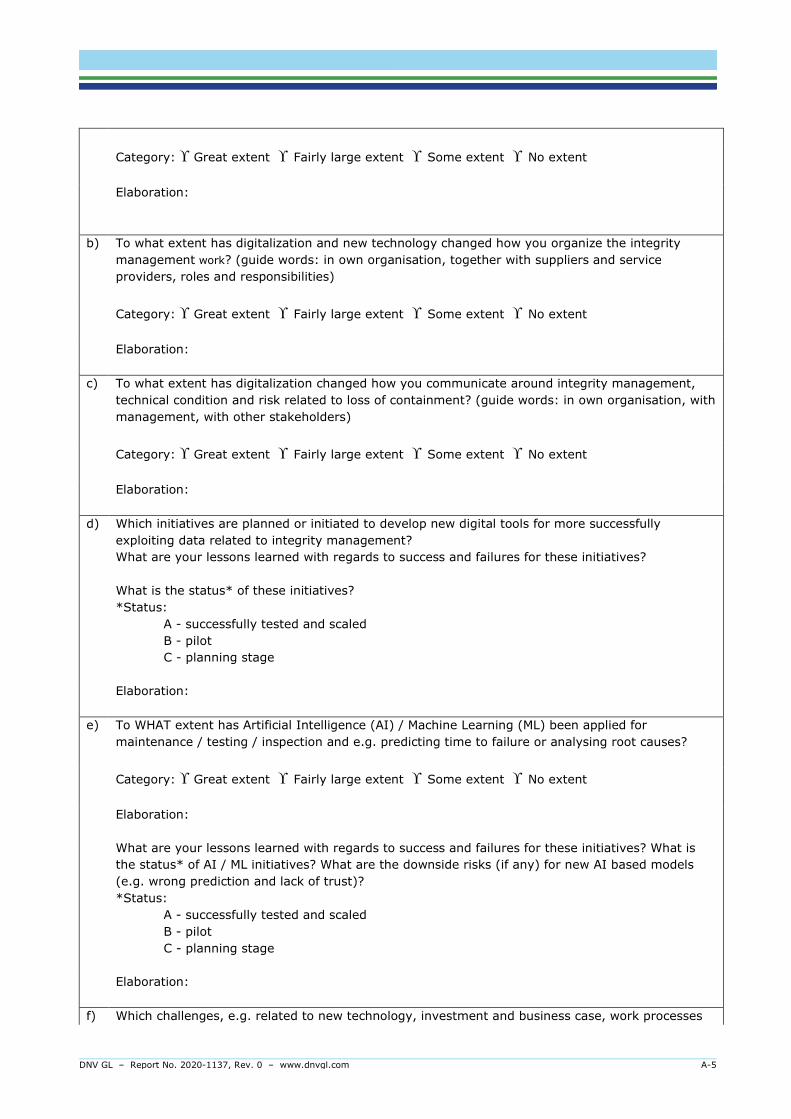
DNV GL – Report No. 2020-1137, Rev. 0 – www.dnvgl.com A-5
Category: ϒ Great extent ϒ Fairly large extent ϒ Some extent ϒ No extent
Elaboration:
b) To what extent has digitalization and new technology changed how you organize the integrity management work? (guide words: in own organisation, together with suppliers and service providers, roles and responsibilities)
Category: ϒ Great extent ϒ Fairly large extent ϒ Some extent ϒ No extent
Elaboration:
c) To what extent has digitalization changed how you communicate around integrity management, technical condition and risk related to loss of containment? (guide words: in own organisation, with management, with other stakeholders)
Category: ϒ Great extent ϒ Fairly large extent ϒ Some extent ϒ No extent
Elaboration:
d) Which initiatives are planned or initiated to develop new digital tools for more successfully exploiting data related to integrity management? What are your lessons learned with regards to success and failures for these initiatives? What is the status* of these initiatives? *Status:
A - successfully tested and scaled B - pilot C - planning stage
Elaboration:
e) To WHAT extent has Artificial Intelligence (AI) / Machine Learning (ML) been applied for
maintenance / testing / inspection and e.g. predicting time to failure or analysing root causes?
Category: ϒ Great extent ϒ Fairly large extent ϒ Some extent ϒ No extent
Elaboration:
What are your lessons learned with regards to success and failures for these initiatives? What is the status* of AI / ML initiatives? What are the downside risks (if any) for new AI based models (e.g. wrong prediction and lack of trust)? *Status:
A - successfully tested and scaled B - pilot C - planning stage
Elaboration:
f) Which challenges, e.g. related to new technology, investment and business case, work processes

DNV GL – Report No. 2020-1137, Rev. 0 – www.dnvgl.com A-6
and competencies, do you see for applying new digital tools for integrity management? Are these challenges of technical, operational or organizational nature? * Status:
A – technical (e.g. inspection tools and automatic identification of anomalies through recognition and machine learning, monitoring methods, data processing, data flow and data integration, dynamic analysis- and risk management tools, visualization and digital twins); B - operational (e.g. use of autonomous vehicles, live streaming of inspections and data to expertise onshore and to a laptop in the home office, near real time risk understanding and response to anomalies and high-risk conditions / events); or C – organizational (e.g. sharing of information, understanding and expertise in the operating organization across organizational boundaries including the value chain; original equipment manufacturers, expert groups and service provider, new roles and responsibilities and new ways of cooperation
Elaboration:
g) Which enablers (e.g. big data, cloud computing, new technologies, competence, cooperation) do you see for applying new digital tools for integrity management?
Elaboration:
h) Have you identified or mapped new topics / challenges related to compliance with rules and regulations when working with digitalization and new technology? If so; which?
Elaboration:
5) Industry collaboration and research
a) Which joint industry initiatives / R&D collaboration efforts do you have in Norway and / or internationally related to new technology and digitalization in integrity management?
Elaboration:
b) Do you see need for new initiatives to support further development, and if so, on which topic?
Elaboration:
6) Main Challenge and Opportunity
a) What is the main challenge and opportunity related to integrity management short term?
Elaboration:
b) What do you see as the major challenges (if any) for successful adoption of integrity management? *Are these challenges mainly;
A – technical (e.g. inspection tools and automatic identification of anomalies through recognition and machine learning, monitoring methods, data processing, data flow and data integration, dynamic analysis- and risk management tools, visualization and digital twins); B - operational (e.g. use of autonomous vehicles, live streaming of inspections and data to expertise onshore and to a laptop in the home office, near real time risk understanding and response to anomalies and events); or

DNV GL – Report No. 2020-1137, Rev. 0 – www.dnvgl.com A-7
C – organizational (e.g. sharing of information, understanding and expertise in the operating organization across organizational boundaries including the value chain; original equipment manufacturers, expert groups and service provider, roles and responsibilities and new ways of cooperation)
Elaboration:
7) Lessons learned / case
a) Do you have examples of incidents or situations where better availability of data or more correct
interpretation of data could have prevented the incident? – And if so; are you willing to share the learnings or the case?
b) Elaboration:

DNV GL – Report No. 2020-1137, Rev. 0 – www.dnvgl.com A-8
Question 1b: To what extent is collected data a good basis for understanding the technical condition, detection of degradation and high-risk conditions and detection of external leak?
Question 1c: How much of the collected and available data considered useful for integrity management is currently used for analysis, condition assessment, failure predictions and detailed planning of inspections?
Question 1d: To what extent is interpretation of collected data a manual process (as opposed to automated process)?
Question 1f. To what extent is current condition and associated risk available information?
0
2
4
6
8
10
12
No extent Some extent Fairly largeextent
Great extent0
2
4
6
8
10
12
No extent Some extent Fairly largeextent
Great extent
0
2
4
6
8
No extent Some extent Fairly largeextent
Great extent0
2
4
6
8
No extent Some extent Fairly largeextent
Great extent
0
2
4
6
8
No extent Some extent Fairly largeextent
Great extent0
2
4
6
8
No extent Some extent Fairly largeextent
Great extent

DNV GL – Report No. 2020-1137, Rev. 0 – www.dnvgl.com A-9
Question 1g: To what extent is current condition and associated risk accurate / reliable information?
Question 1h: To what extent is the condition assessment depending on personal judgement (as opposed to objective information)?
Question 1i: To what extent are the data sources and tools/models integrated to ensure an efficient use (as opposed to in a number of data sources and systems)?
Question 1j: To what extent is available information a good basis for planning of integrity management activities (e.g. inspection, monitoring, testing, maintenance)?
Question 1k: To what extent is planning of integrity management activities depending on personal judgement (alternatively objective information and criteria)?
0
2
4
6
8
10
No extent Some extent Fairly largeextent
Great extent0
2
4
6
8
No extent Some extent Fairly largeextent
Great extent
0
2
4
6
8
No extent Some extent Fairly largeextent
Great extent

DNV GL – Report No. 2020-1137, Rev. 0 – www.dnvgl.com A-10
Question 2a: To what extent are the data collected of sufficient quality to assess the technical integrity reliably?
Question 2b: To what extent are the required data for integrity management readily available / collected?
Question 3b: To what extent would you say that condition-based maintenance based on condition indicators is implemented in your subsea Organisation?
Question 3c: To what extent degree are degradation models, algorithms and automatic assessment tools used?
0
1
2
3
4
5
6
No extent Some extent Fairly largeextent
Great extent0
1
2
3
4
5
6
No extent Some extent Fairly largeextent
Great extent
0
1
2
3
4
5
6
No extent Some extent Fairly largeextent
Great extent0
2
4
6
8
10
No extent Some extent Fairly largeextent
Great extent
0
1
2
3
4
5
6
No extent Some extent Fairly largeextent
Great extent0
2
4
6
8
No extent Some extent Fairly largeextent
Great extent

DNV GL – Report No. 2020-1137, Rev. 0 – www.dnvgl.com A-11
Question 4a: To what extent has digitalization and new technology changed the way you work (work process) wrt. integrity management?
Question 4b: To what extent has digitalization and new technology changed how you organize the integrity management work?
Question 4c: To what extent has digitalization changed how you communicate around integrity management, technical condition and risk related to loss of containment?
Question 4e: To what extent has Artificial Intelligence (AI) / Machine Learning (ML) been applied for maintenance / testing / inspection and e.g. predicting time to failure or analysing root causes?
0
1
2
3
4
5
6
No extent Some extent Fairly largeextent
Great extent0
2
4
6
8
No extent Some extent Fairly largeextent
Great extent

DNV GL – Report No. 2020-1137, Rev. 0 – www.dnvgl.com B
APPENDIX B Data collection and purpose
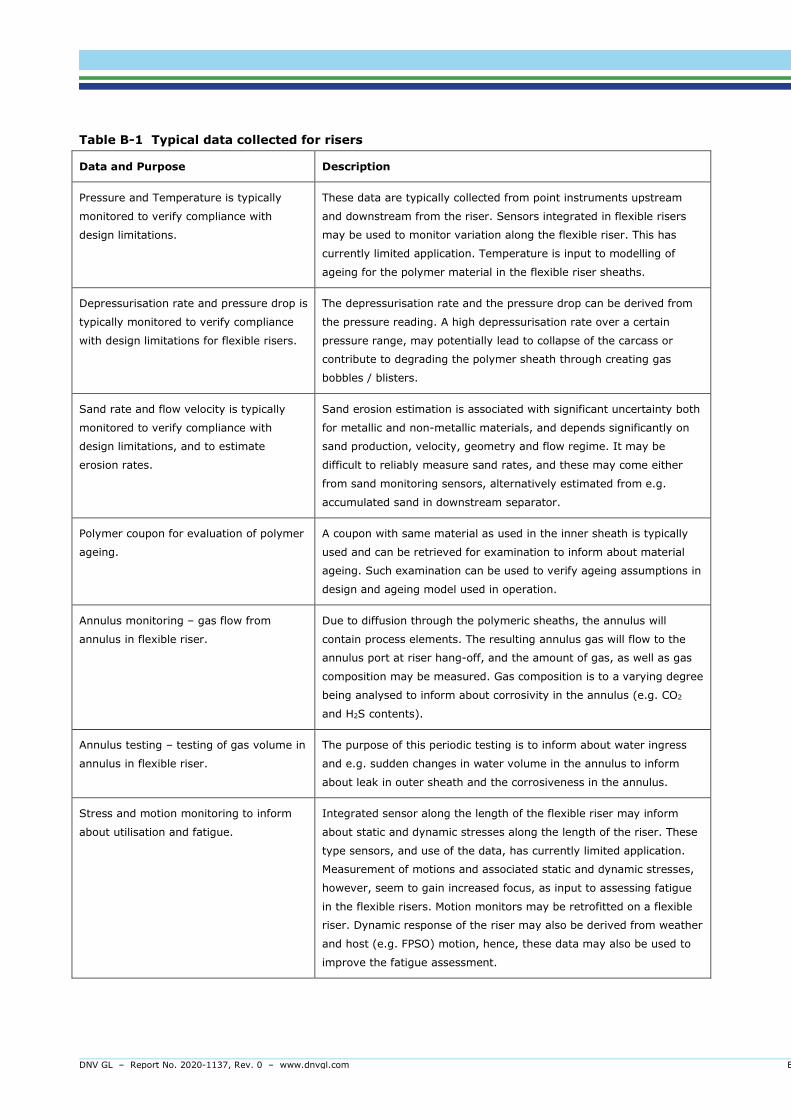
DNV GL – Report No. 2020-1137, Rev. 0 – www.dnvgl.com B
Table B-1 Typical data collected for risers
Data and Purpose Description
Pressure and Temperature is typically
monitored to verify compliance with
design limitations.
These data are typically collected from point instruments upstream
and downstream from the riser. Sensors integrated in flexible risers
may be used to monitor variation along the flexible riser. This has
currently limited application. Temperature is input to modelling of
ageing for the polymer material in the flexible riser sheaths.
Depressurisation rate and pressure drop is
typically monitored to verify compliance
with design limitations for flexible risers.
The depressurisation rate and the pressure drop can be derived from
the pressure reading. A high depressurisation rate over a certain
pressure range, may potentially lead to collapse of the carcass or
contribute to degrading the polymer sheath through creating gas
bobbles / blisters.
Sand rate and flow velocity is typically
monitored to verify compliance with
design limitations, and to estimate
erosion rates.
Sand erosion estimation is associated with significant uncertainty both
for metallic and non-metallic materials, and depends significantly on
sand production, velocity, geometry and flow regime. It may be
difficult to reliably measure sand rates, and these may come either
from sand monitoring sensors, alternatively estimated from e.g.
accumulated sand in downstream separator.
Polymer coupon for evaluation of polymer
ageing.
A coupon with same material as used in the inner sheath is typically
used and can be retrieved for examination to inform about material
ageing. Such examination can be used to verify ageing assumptions in
design and ageing model used in operation.
Annulus monitoring – gas flow from
annulus in flexible riser.
Due to diffusion through the polymeric sheaths, the annulus will
contain process elements. The resulting annulus gas will flow to the
annulus port at riser hang-off, and the amount of gas, as well as gas
composition may be measured. Gas composition is to a varying degree
being analysed to inform about corrosivity in the annulus (e.g. CO2
and H2S contents).
Annulus testing – testing of gas volume in
annulus in flexible riser.
The purpose of this periodic testing is to inform about water ingress
and e.g. sudden changes in water volume in the annulus to inform
about leak in outer sheath and the corrosiveness in the annulus.
Stress and motion monitoring to inform
about utilisation and fatigue.
Integrated sensor along the length of the flexible riser may inform
about static and dynamic stresses along the length of the riser. These
type sensors, and use of the data, has currently limited application.
Measurement of motions and associated static and dynamic stresses,
however, seem to gain increased focus, as input to assessing fatigue
in the flexible risers. Motion monitors may be retrofitted on a flexible
riser. Dynamic response of the riser may also be derived from weather
and host (e.g. FPSO) motion, hence, these data may also be used to
improve the fatigue assessment.

DNV GL – Report No. 2020-1137, Rev. 0 – www.dnvgl.com B
Data and Purpose Description
Acoustic and vibration monitoring to
inform about FLIP in gas flexible riser.
The purpose of this monitoring is to detect FLIP (“singing riser”) which
may lead to fatigue in connected piping.
Visual inspection to confirm external
condition of flexible and rigid riser.
Inspection is typically performed by use of ROV for the submerged
part of the riser. Inspection results focus on describing amount of
marine growth (which impact the static and dynamic loads and
response), the condition of supports (rigid riser) and floating elements
(for flexible riser), touch-down point (for flexible riser), condition of
bend stiffener and -restrictor and minimum bending radius (flexible
risers). Further, the inspection focuses on visible degradation or
damage to coating (rigid riser) and outer sheath (flexible riser) and
any signs of deformation, as well as anode consumption on submerged
metallic structures. Inspection above sea level is typically performed
visually by inspectors.
Internal inspection to confirm internal
condition.
Internal inspection of a rigid riser may be performed as part of the
flowline ILI. The main purpose is to detect corrosion, defects and
deformations. Internal inspection of a flexible riser is typically not
performed.
NDT inspection to confirm wall thickness
in steel riser and armour condition in
flexible risers.
There are various available technologies for measuring wall thickness
in a steel pipe. For flexible risers, technologies including UT and RT are
being applied and explored. It is difficult to reliably detect the
condition of the armour layers, including in the hot spot areas; hang-
off / termination, at bend stiffener, at bend restrictor / sag / hog and
at touch-down.
CP stab to verify electrochemical potential
to ensure corrosion protection of metallic
structures.
Both rigid risers and metallic parts of the flexible riser (e.g.
connectors, float structure) are typically corrosion protected using
sacrificial anodes. These data are typically reported in an inspection
report.
Table B-2 Typical data collected for pipelines
Data and Purpose Description
Pressure and Temperature is typically
monitored to verify compliance with
design limitations, and to assess internal
corrosion.
These data are typically collected from point instruments upstream
and downstream the pipeline. Some pipelines have integrated
temperature measurements. Actual operating temperature is
compared with water dew point temperature to verify dry gas. Both
pressure and temperature is input to estimating CO2 corrosion rate in
wet pipelines.
Water dew point monitoring is performed
to verify dry gas in gas transport systems.
As long as the operating temperature is stable above the dew point
temperature, no corrosion is expected in a gas system. Potential cold
points in a system, e.g. due to defects in isolation, must be taken into
account.

DNV GL – Report No. 2020-1137, Rev. 0 – www.dnvgl.com B
Data and Purpose Description
Water in oil and iron ions measurements
are performed to evaluate likelihood of
separate water phase in line, as well as to
indicate corrosion activity in the line.
A separate water phase may trigger corrosion in the line. Iron ions is a
corrosion product which may be measured and indicate corrosion
activity in the line.
CO2 and H2S is monitored to verify
compliance with design assumptions, and
to estimate corrosion development.
The corrosion rate can be estimated based on a number of different
models and software. Corrosion models are associated with
uncertainties and are normally considered to be conservative.
O2 is monitored to verify compliance with
design assumptions and to prevent
excessive corrosion due to oxygen
contamination; typically in gas export and
gas lift.
Oxygen contamination may lead to excessive corrosion where water is
present, e.g. when lift gas mixes with hydrocarbons from the
reservoir.
Corrosion coupons Corrosion coupons, e.g. downstream the pipeline, may be used to
validate the corrosion model. Weight loss coupons, alternatively,
electrically resistance type coupons, may be applied to indicate
corrosion activity and corrosion rate.
Microbiological activity coupons Presence of microbes, quantity and types, may be used to assess the
likelihood for Microbiologically Induced Corrosion, MIC. Predicting MIC
is a difficult task, and cleaning and biocide injection are important
measures to prevent MIC. Measured bacterial activity may be used to
trigger increased biocide injection for a period of time.
Corrosion inhibitor The injection of an effective corrosion inhibitor is an important
measure when the pipeline is fabricated in carbon steel. The injection
volumes and the inhibitor availability (i.e. whether injection is not
performed over a period of time) are typical monitoring parameters to
justify acceptable corrosion protection.
Biocide inhibitor The injection of an effective biocide is an important measure when the
pipeline is fabricated in carbon steel. The injection volumes and the
frequency of injection are typical monitoring parameters to justify
acceptable corrosion protection. Biocide injection may be adjusted
based on detected levels of microbes.
Bottom trawling activity monitoring to
verify design limitations.
Bottom trawling activity may represent a threat to exposed pipelines.
Monitoring should verify that bottom trawling with clump weight and
trawl boards heavier than the design limitation is not performed. The
Norwegian Directorate of Fisheries make available maps of historic
trawling activity and some suppliers substantiate the maps with
information about trawl types and loads to inform the risk related to
trawling.

DNV GL – Report No. 2020-1137, Rev. 0 – www.dnvgl.com B
Data and Purpose Description
Depth of Burial, DOB, inspection Pipelines design to be buried, e.g. related to threat of trawling,
buckling and free spans, should be verified to be buried to a certain
depth, typically > 0.5-0.6 meters. It should be mentioned that DOB
measurements may be associated with significant uncertainty. DOB
data is typically reported in an inspection report.
CP stab or field gradient measurement to
verify design assumptions.
The pipeline is designed with a CP system to ensure corrosion
protection over the operating life. Verification of electrochemical
protection level should verify protection within acceptable levels. CP
data are typically reported in inspection report.
Visual inspection to verify design
assumptions and confirm external
condition.
Inspection is typically performed by use of ROV or AUV. Inspection
results focus on describing aspects like burial / exposure, condition of
covers and rock dump where applicable, signs of impacts in form of
anchors, trawl or dropped objects, subsidence and scouring, buckling
and movement of pipeline, as well as quantification of free spans,
condition of supports. Further, the inspection focuses on visible
degradation or damage to coating / isolation and anode consumption.
Most of this will be reported qualitatively, while free span length will
be reported with a length and height to enable comparison with
acceptance criteria. Visual inspection is normally reported with video
and site anomaly listing. Point cloud representation can also be
provided. Baseline as-built survey should be available for comparison.
Internal inspection to confirm internal
condition.
Pipelines will normally be piggable, but there is not always a baseline
as-built inspection performed as baseline. Inspection results may be
available as video and anomaly listing.
NDT inspection to confirm wall thickness. There are various available technologies for measuring wall thickness
in a steel pipeline, and the most frequently applied technologies are
MFL and ART. Wall thickness / corrosion inspection is normally
reported with visualisation colour coding and anomaly listing.
Pitting to clean the pipeline internally The pigging will inform about the amount of deposits in the pipe, and
deposits may be further analysed to inform about e.g. corrosion in the
pipe. Cleaning may also be an important pre-requisite for good quality
in-line inspection.

DNV GL – Report No. 2020-1137, Rev. 0 – www.dnvgl.com B
Table B-3 Typical data collected for SPS
Data and Purpose Description
Pressure and Temperature is typically
monitored to verify compliance with
design limitations.
These data are typically collected from point instruments at XT and
manifold. Hydrocarbon wetted surfaces are typically designed to be
stainless (e.g. 25% Cr Super Duplex or Inconel 625), hence corrosion is
not considered a significant threat. Effects of reservoir stimulation
chemicals must be considered where applicable.
Sand rate and flow velocity is typically
monitored to verify compliance with
design limitations, and to estimate
erosion rates.
Sand erosion estimation is associated with significant uncertainty, and
depends significantly on sand production, velocity, geometry and flow
regime (e.g. downstream choke). It may be difficult to reliably measure
sand rates, and these may come either from sand monitoring sensors,
alternatively estimated from e.g. accumulated sand in downstream
separator.
Corrosion Protection (CP) stab to verify
design assumptions.
The SPS (XT and structures) are designed with a CP system to ensure
corrosion protection over the operating life. Verification of
electrochemical protection level should verify protection within
acceptable levels. CP data are typically reported in inspection report.
Visual inspection to verify design
assumptions, confirm external condition
and leak free operation.
Inspection is typically performed by use of ROV. Inspection results focus
on deformations or signs of impact, coating degradation and anode
consumption, subsidence, and external leak. Subsidence and other
aspects which may lead to increased stresses on parts of the structure,
may impact risk associated with HISC. Visual inspection is normally
reported with video and site anomaly listing. Baseline as-built survey
should be available for comparison
Erosion measurement by use of wall
thickness measurement may be used in
erosion prone geometries, e.g.
downstream production choke.
May be included in the design but should ideally be designed to not be a
problem provided sufficient information about the production fluids are
available during the design phase. May also be retrofitted.
Vibration measurement to inform risk
associated with FIV.
Vibration monitoring be included in the design, but the system should
ideally be designed to minimise problems associated with vibration.
Instrumentation may be retrofitted. Alternative methods for managing
flow induced vibrations based on vibration monitoring and the ability to
change the system response (tune it) if vibrations become excessive is
described in the upcoming version of Norsok U-001.
Hydrocarbon leak detection, HCLD. HCLD is often installed near the XT to detect leak from well / XT.
References is made to DNVGL-RP-F302 Offshore Leak Detection.
Fluid analysis (H2S, CO2, water content,
fluid composition, corrosion by-products,
etc.)
Fluid data for corrosion management and compliance with design
limitations are collected to the extent this is considered relevant to the
SPS.

DNV GL – Report No. 2020-1137, Rev. 0 – www.dnvgl.com C-7
APPENDIX C Typical threats and failure modes for subsea systems
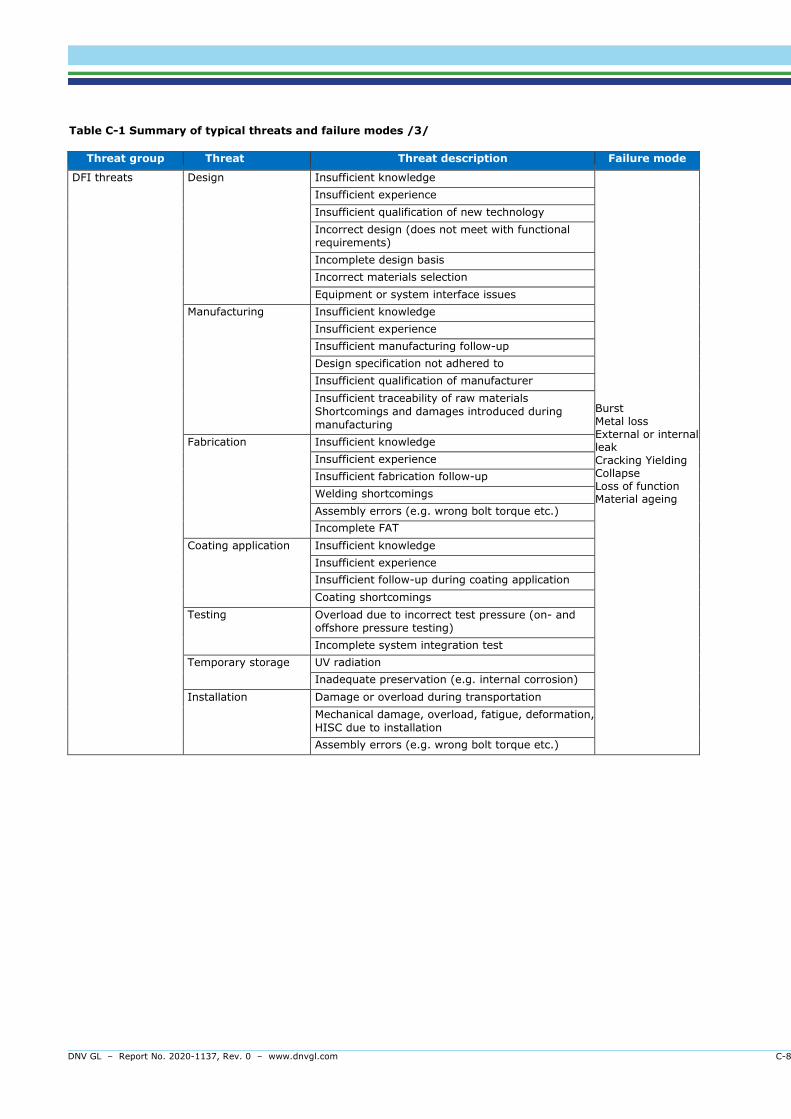
DNV GL – Report No. 2020-1137, Rev. 0 – www.dnvgl.com C-8
Table C-1 Summary of typical threats and failure modes /3/
Threat group Threat Threat description Failure mode
DFI threats Design Insufficient knowledge Burst Metal loss External or internal leak Cracking Yielding Collapse Loss of function Material ageing
Insufficient experience Insufficient qualification of new technology Incorrect design (does not meet with functional requirements) Incomplete design basis Incorrect materials selection Equipment or system interface issues
Manufacturing Insufficient knowledge Insufficient experience Insufficient manufacturing follow-up Design specification not adhered to Insufficient qualification of manufacturer Insufficient traceability of raw materials Shortcomings and damages introduced during manufacturing
Fabrication Insufficient knowledge Insufficient experience Insufficient fabrication follow-up Welding shortcomings Assembly errors (e.g. wrong bolt torque etc.) Incomplete FAT
Coating application Insufficient knowledge Insufficient experience Insufficient follow-up during coating application Coating shortcomings
Testing Overload due to incorrect test pressure (on- and offshore pressure testing) Incomplete system integration test
Temporary storage UV radiation Inadequate preservation (e.g. internal corrosion)
Installation Damage or overload during transportation Mechanical damage, overload, fatigue, deformation, HISC due to installation Assembly errors (e.g. wrong bolt torque etc.)
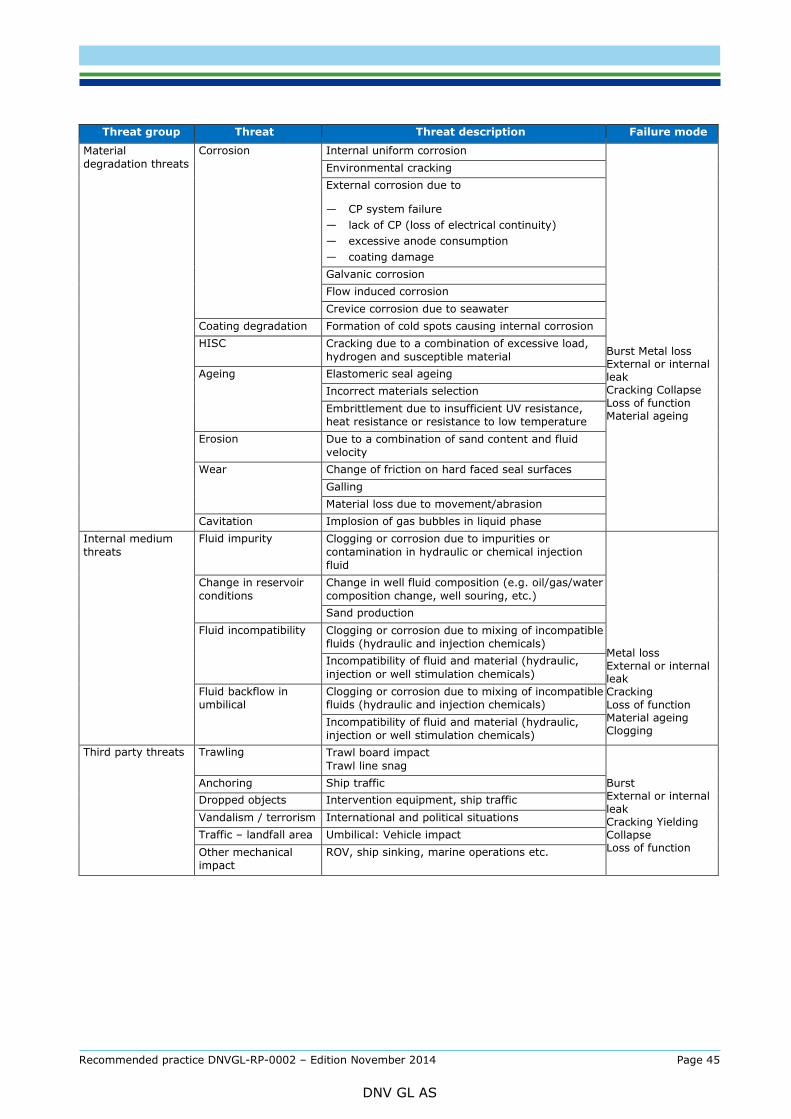
Recommended practice DNVGL-RP-0002 – Edition November 2014 Page 45
DNV GL AS
Threat group Threat Threat description Failure mode
Material degradation threats
Corrosion Internal uniform corrosion
Burst Metal loss External or internal leak Cracking Collapse Loss of function Material ageing
Environmental cracking External corrosion due to
— CP system failure — lack of CP (loss of electrical continuity) — excessive anode consumption — coating damage Galvanic corrosion Flow induced corrosion Crevice corrosion due to seawater
Coating degradation Formation of cold spots causing internal corrosion HISC Cracking due to a combination of excessive load,
hydrogen and susceptible material Ageing Elastomeric seal ageing
Incorrect materials selection Embrittlement due to insufficient UV resistance, heat resistance or resistance to low temperature
Erosion Due to a combination of sand content and fluid velocity
Wear Change of friction on hard faced seal surfaces Galling Material loss due to movement/abrasion
Cavitation Implosion of gas bubbles in liquid phase Internal medium threats
Fluid impurity Clogging or corrosion due to impurities or contamination in hydraulic or chemical injection fluid
Metal loss External or internal leak Cracking Loss of function Material ageing Clogging
Change in reservoir conditions
Change in well fluid composition (e.g. oil/gas/water composition change, well souring, etc.) Sand production
Fluid incompatibility Clogging or corrosion due to mixing of incompatible fluids (hydraulic and injection chemicals) Incompatibility of fluid and material (hydraulic, injection or well stimulation chemicals)
Fluid backflow in umbilical
Clogging or corrosion due to mixing of incompatible fluids (hydraulic and injection chemicals) Incompatibility of fluid and material (hydraulic, injection or well stimulation chemicals)
Third party threats Trawling Trawl board impact Trawl line snag
Burst External or internal leak Cracking Yielding Collapse Loss of function
Anchoring Ship traffic Dropped objects Intervention equipment, ship traffic Vandalism / terrorism International and political situations Traffic – landfall area Umbilical: Vehicle impact Other mechanical impact
ROV, ship sinking, marine operations etc.
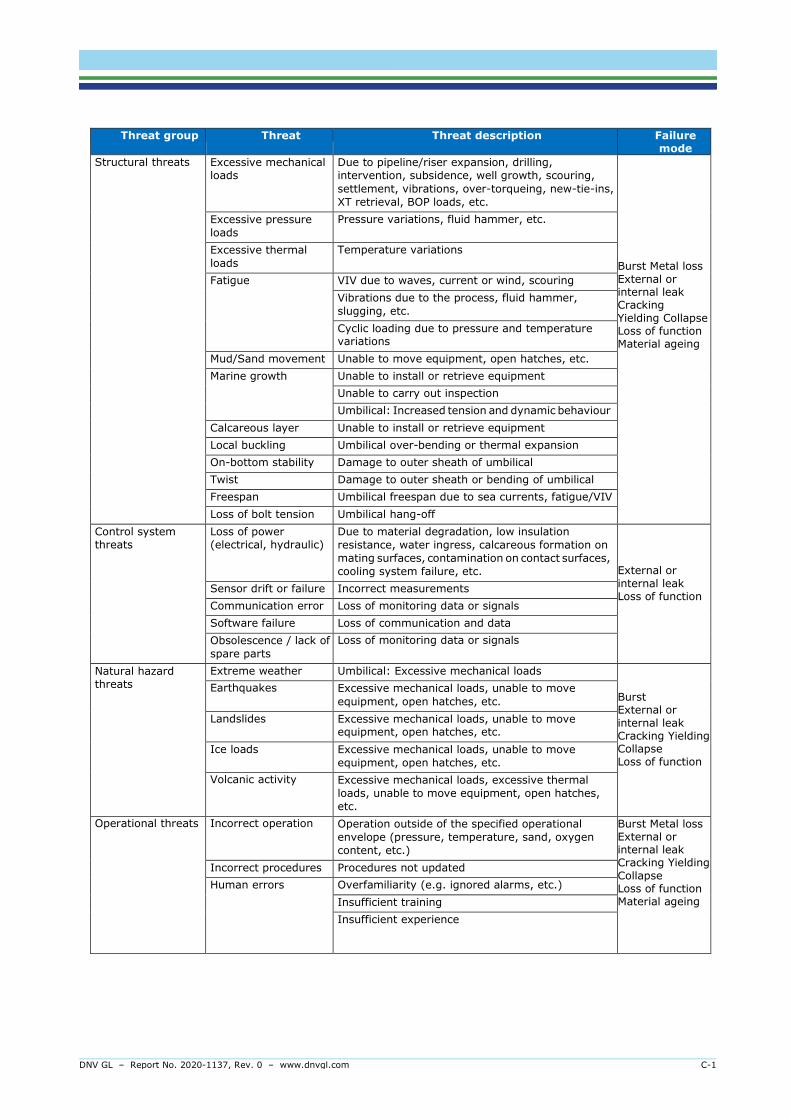
DNV GL – Report No. 2020-1137, Rev. 0 – www.dnvgl.com C-1
Threat group Threat Threat description Failure mode
Structural threats Excessive mechanical loads
Due to pipeline/riser expansion, drilling, intervention, subsidence, well growth, scouring, settlement, vibrations, over-torqueing, new-tie-ins, XT retrieval, BOP loads, etc.
Burst Metal loss External or internal leak Cracking Yielding Collapse Loss of function Material ageing
Excessive pressure loads
Pressure variations, fluid hammer, etc.
Excessive thermal loads
Temperature variations
Fatigue VIV due to waves, current or wind, scouring Vibrations due to the process, fluid hammer, slugging, etc. Cyclic loading due to pressure and temperature variations
Mud/Sand movement Unable to move equipment, open hatches, etc. Marine growth Unable to install or retrieve equipment
Unable to carry out inspection Umbilical: Increased tension and dynamic behaviour
Calcareous layer Unable to install or retrieve equipment Local buckling Umbilical over-bending or thermal expansion On-bottom stability Damage to outer sheath of umbilical Twist Damage to outer sheath or bending of umbilical Freespan Umbilical freespan due to sea currents, fatigue/VIV Loss of bolt tension Umbilical hang-off
Control system threats
Loss of power (electrical, hydraulic)
Due to material degradation, low insulation resistance, water ingress, calcareous formation on mating surfaces, contamination on contact surfaces, cooling system failure, etc.
External or internal leak Loss of function
Sensor drift or failure Incorrect measurements Communication error Loss of monitoring data or signals Software failure Loss of communication and data Obsolescence / lack of spare parts
Loss of monitoring data or signals
Natural hazard threats
Extreme weather Umbilical: Excessive mechanical loads Burst External or internal leak Cracking Yielding Collapse Loss of function
Earthquakes Excessive mechanical loads, unable to move equipment, open hatches, etc.
Landslides Excessive mechanical loads, unable to move equipment, open hatches, etc.
Ice loads Excessive mechanical loads, unable to move equipment, open hatches, etc.
Volcanic activity Excessive mechanical loads, excessive thermal loads, unable to move equipment, open hatches, etc.
Operational threats Incorrect operation Operation outside of the specified operational envelope (pressure, temperature, sand, oxygen content, etc.)
Burst Metal loss External or internal leak Cracking Yielding Collapse Loss of function Material ageing
Incorrect procedures Procedures not updated Human errors Overfamiliarity (e.g. ignored alarms, etc.)
Insufficient training Insufficient experience


About DNV GL DNV GL is a global quality assurance and risk management company. Driven by our purpose of safeguarding life, property and the environment, we enable our customers to advance the safety and sustainability of their business. We provide classification, technical assurance, software and independent expert advisory services to the maritime, oil & gas, power and renewables industries. We also provide certification, supply chain and data management services to customers across a wide range of industries. Operating in more than 100 countries, our experts are dedicated to helping customers make the world safer, smarter and greener.