How Can Big Data Complement Expert Analysis? A Value ...
21
sustainability Article How Can Big Data Complement Expert Analysis? A Value Chain Case Study Kyungtae Kim 1 and Sungjoo Lee 2, * 1 Department of Electrical and Computer Engineering, Sungkyunkwan University, 164 Suwon, Korea; [email protected] 2 Department of Industrial Engineering, Ajou University, 164 Suwon, Korea * Correspondence: [email protected]; Tel.: +82-31-219-2419 Received: 2 January 2018; Accepted: 23 February 2018; Published: 6 March 2018 Abstract: In the world of big data, there is a need to investigate how data-driven approaches can support expert-based analyses during a technology planning process. To meet this goal, we examined opportunities and challenges for big data analytics in the social sciences, particularly with respect to value chain analysis. To accomplish this, we designed a value chain mapping experiment that aimed to compare the results of expert-based and data-based mappings. In the expert-based approach, we asked an industry expert to visually depict an industry value chain based on insights and collected data. We also reviewed a previously published value chain developed by a panel of industry experts during a national technology planning process. In the data-driven analysis, we used a massive number of business transaction records between companies under the assumption that the data would be useful in identifying relationships between items in a value chain. The case study results demonstrated that data-driven analysis can help researchers understand the current status of industry structures, enabling them to develop more realistic, although less flexible value chain maps. This approach is expected to provide more value when used in combination with other databases. It is important to note that significant effort is required to develop an elaborate analysis algorithm, and data preprocessing is essential for obtaining meaningful results, both of which make this approach challenging. Experts’ insights are still helpful for validating the analytic results in value chain mapping. Keywords: big data; expert-driven; data-driven; value chain; technology planning; photovoltaic systems 1. Introduction Big data is a term that refers to an enormous volume of structured and unstructured digital data extracted from various sources [1]. According to IBM, approximately 2.5 quintillion bytes of data are generated every day [2]. Moreover, 90% of the data we have today were created in the past two years, indicating the tremendous recent growth in data collection and storage [3]. This growth has been observed for diverse entities, including individuals, businesses, and the private and public sectors. Effectively using these data is now regarded as a key component of successful management. The private sector uses big data to predict customer requirements and behaviors, develop core competencies, and create novel products and services. On the other hand, the public sector uses big data to increase transparency, facilitate civic participation in public life, prevent crimes, improve national security, and support social welfare through education and health care management [4–8]. Indeed, big data are being used in diverse disciplines for various purposes that add value to our society. Data-driven efforts have also been made in the field of innovation management. One of the most representative approaches in this field is patent analysis, as patent documents contain a significant amount of technology development information and are easy to access [9]. Data-driven studies, whether the data be patents, customer complaints, or App store data, commonly show that big data Sustainability 2018, 10, 709; doi:10.3390/su10030709 www.mdpi.com/journal/sustainability
-
Upload
khangminh22 -
Category
Documents
-
view
5 -
download
0
Transcript of How Can Big Data Complement Expert Analysis? A Value ...

sustainability
Article
How Can Big Data Complement Expert Analysis?A Value Chain Case Study
Kyungtae Kim 1 and Sungjoo Lee 2,*1 Department of Electrical and Computer Engineering, Sungkyunkwan University, 164 Suwon, Korea;
[email protected] Department of Industrial Engineering, Ajou University, 164 Suwon, Korea* Correspondence: [email protected]; Tel.: +82-31-219-2419
Received: 2 January 2018; Accepted: 23 February 2018; Published: 6 March 2018
Abstract: In the world of big data, there is a need to investigate how data-driven approaches cansupport expert-based analyses during a technology planning process. To meet this goal, we examinedopportunities and challenges for big data analytics in the social sciences, particularly with respect tovalue chain analysis. To accomplish this, we designed a value chain mapping experiment that aimedto compare the results of expert-based and data-based mappings. In the expert-based approach,we asked an industry expert to visually depict an industry value chain based on insights andcollected data. We also reviewed a previously published value chain developed by a panel of industryexperts during a national technology planning process. In the data-driven analysis, we used amassive number of business transaction records between companies under the assumption thatthe data would be useful in identifying relationships between items in a value chain. The casestudy results demonstrated that data-driven analysis can help researchers understand the currentstatus of industry structures, enabling them to develop more realistic, although less flexible valuechain maps. This approach is expected to provide more value when used in combination with otherdatabases. It is important to note that significant effort is required to develop an elaborate analysisalgorithm, and data preprocessing is essential for obtaining meaningful results, both of which makethis approach challenging. Experts’ insights are still helpful for validating the analytic results in valuechain mapping.
Keywords: big data; expert-driven; data-driven; value chain; technology planning; photovoltaic systems
1. Introduction
Big data is a term that refers to an enormous volume of structured and unstructured digital dataextracted from various sources [1]. According to IBM, approximately 2.5 quintillion bytes of data aregenerated every day [2]. Moreover, 90% of the data we have today were created in the past two years,indicating the tremendous recent growth in data collection and storage [3]. This growth has beenobserved for diverse entities, including individuals, businesses, and the private and public sectors.Effectively using these data is now regarded as a key component of successful management. The privatesector uses big data to predict customer requirements and behaviors, develop core competencies, andcreate novel products and services. On the other hand, the public sector uses big data to increasetransparency, facilitate civic participation in public life, prevent crimes, improve national security, andsupport social welfare through education and health care management [4–8]. Indeed, big data arebeing used in diverse disciplines for various purposes that add value to our society.
Data-driven efforts have also been made in the field of innovation management. One of the mostrepresentative approaches in this field is patent analysis, as patent documents contain a significantamount of technology development information and are easy to access [9]. Data-driven studies,whether the data be patents, customer complaints, or App store data, commonly show that big data
Sustainability 2018, 10, 709; doi:10.3390/su10030709 www.mdpi.com/journal/sustainability

Sustainability 2018, 10, 709 2 of 21
can deliver insights that would otherwise be impossible to obtain. At the same time, however, becausethese data are derived from past records, data-driven analytic results may not be useful for predictinga future characterized by great uncertainties. That is, for very complex problems, experts’ insights mayprovide more helpful results than big data analysis.
To maximize the value of data-driven approaches in the world of big data, it is essential to understandtheir possibilities as well as limitations, compared to expert-based approaches. That is, it is necessaryto investigate how a data-driven approach can support an expert-based analysis, and to assess whethersuch an approach can provide more knowledge than expert insights. However, efforts made to addressthis issue have been limited. To satisfy such a need, this study aimed to examine opportunities andchallenges for big data analysis in the social sciences, particularly with respect to industry analysis, asan attempt to answer the following research question: how can big data complement expert analysis fortechnology analysis and strategic planning, supporting to navigate the increasingly complex industrydynamics? Here, it should be noted that we restricted our focus to social sciences because differentopportunities and challenges for big data analytics can be expected in different areas. The social sciencewas chosen as a research target; the social science phenomena are so complex that it is sometimes difficultto find meaningful implications only from big data analysis. Thus, on one hand, it may be good to relyon experts’ insights on understanding such phenomena. However, on the other hand, data analysiscan offer unexpected surprising findings due to such complexity. Moreover, expert insights may havelimitations in capturing all the rapidly changing social phenomena. The existence of both opportunitiesand challenges is evident in the social science and so identifying them is essential to overcome challengesand seize opportunities from big data analytics. Among various areas for experiments, we focused only ontechnology planning. Systematic decision-makings based on expert- or data-driven analyses are requiredfor technology planning and thus opportunities are easy to be found.
To accomplish this, we designed a simple experiment for comparing the results of an expert-basedapproach and a data-driven approach. In our experiment, we focused on analyzing an industry valuechain for a photovoltaic system in Korea. The value chain is a diagram that explains the chainedlinkage of activities, i.e., buyer-seller relationships, in the physical world. Both its concept and toolhave been widely used in the last 30 years for analyzing industries [10,11]. It was initially developedto help understand the value creation activities at the firm level and then started to be applied atthe industry level to model the activities at the aggregate level. Figure 1 presents an industry valuechain for semiconductor. According to the figure, the semiconductor products, having two types ofusers—[end user] and [systems user], are produced by [assembly and test] followed by [fabrication].Then, for fabrication, the components need to be designed [design] and the [equipment and materials]required for the fabrication need to be acquired. The value chain was proven to be a useful tool toportray a process of value creation in industries [12] and further understand the industry structure.
Sustainability 2018, 10, x FOR PEER REVIEW 2 of 21
whether the data be patents, customer complaints, or App store data, commonly show that big data can deliver insights that would otherwise be impossible to obtain. At the same time, however, because these data are derived from past records, data-driven analytic results may not be useful for predicting a future characterized by great uncertainties. That is, for very complex problems, experts’ insights may provide more helpful results than big data analysis.
To maximize the value of data-driven approaches in the world of big data, it is essential to understand their possibilities as well as limitations, compared to expert-based approaches. That is, it is necessary to investigate how a data-driven approach can support an expert-based analysis, and to assess whether such an approach can provide more knowledge than expert insights. However, efforts made to address this issue have been limited. To satisfy such a need, this study aimed to examine opportunities and challenges for big data analysis in the social sciences, particularly with respect to industry analysis, as an attempt to answer the following research question: how can big data complement expert analysis for technology analysis and strategic planning, supporting to navigate the increasingly complex industry dynamics? Here, it should be noted that we restricted our focus to social sciences because different opportunities and challenges for big data analytics can be expected in different areas. The social science was chosen as a research target; the social science phenomena are so complex that it is sometimes difficult to find meaningful implications only from big data analysis. Thus, on one hand, it may be good to rely on experts’ insights on understanding such phenomena. However, on the other hand, data analysis can offer unexpected surprising findings due to such complexity. Moreover, expert insights may have limitations in capturing all the rapidly changing social phenomena. The existence of both opportunities and challenges is evident in the social science and so identifying them is essential to overcome challenges and seize opportunities from big data analytics. Among various areas for experiments, we focused only on technology planning. Systematic decision-makings based on expert- or data-driven analyses are required for technology planning and thus opportunities are easy to be found.
To accomplish this, we designed a simple experiment for comparing the results of an expert-based approach and a data-driven approach. In our experiment, we focused on analyzing an industry value chain for a photovoltaic system in Korea. The value chain is a diagram that explains the chained linkage of activities, i.e., buyer-seller relationships, in the physical world. Both its concept and tool have been widely used in the last 30 years for analyzing industries [10,11]. It was initially developed to help understand the value creation activities at the firm level and then started to be applied at the industry level to model the activities at the aggregate level. Figure 1 presents an industry value chain for semiconductor. According to the figure, the semiconductor products, having two types of users—[end user] and [systems user], are produced by [assembly and test] followed by [fabrication]. Then, for fabrication, the components need to be designed [design] and the [equipment and materials] required for the fabrication need to be acquired. The value chain was proven to be a useful tool to portray a process of value creation in industries [12] and further understand the industry structure.
Figure 1. Semiconductor industry value chain [13].
Analyzing a value chain is closely related to technological forecasting and planning. Technology roadmapping, which is a process of looking forward, requires a value chain diagram to make a valid decision. Moreover, developing a value chain diagram is regarded as a difficult job because it requires a comprehensive understanding of the industry. When it is developed by a single person, the diagram may depend on a restricted view. When more experts are involved in the process of creating the diagram, it would be difficult to obtain a consensus. For the expert-based approach, we asked an industry expert to visually represent an industry value chain based on insights and data collection.
Figure 1. Semiconductor industry value chain [13].
Analyzing a value chain is closely related to technological forecasting and planning. Technologyroadmapping, which is a process of looking forward, requires a value chain diagram to make avalid decision. Moreover, developing a value chain diagram is regarded as a difficult job because itrequires a comprehensive understanding of the industry. When it is developed by a single person,the diagram may depend on a restricted view. When more experts are involved in the process ofcreating the diagram, it would be difficult to obtain a consensus. For the expert-based approach, weasked an industry expert to visually represent an industry value chain based on insights and data

Sustainability 2018, 10, 709 3 of 21
collection. We also reviewed a previously published value chain developed by a panel of industryexperts during a national technology planning process. For the data-driven analysis, we used a massivenumber of business transaction records between companies, which we expected to reveal a network ofbusiness interrelationships.
Our experimental results show that the data-driven analysis enabled even a non-industry expertto identify basic industry structures. The analysis occasionally proposed a value chain item that hadnot been discovered by our industry expert, where the item is defined as a product or service thatbelongs to the value chain; this was particularly common for emerging items. Moreover, the unitof the value chain items could be identified based on the actual business transaction, which is morerealistic but less flexible as the value chain items are determined by the transaction data. Finally, wewere able to identify core companies for each of the value chain items and promote a company-levelanalysis by examining the characteristics of such items. While a data-driven approach is advantageousin many respects, considerable effort is required to develop an elaborate analysis algorithm, anddata preprocessing is essential for obtaining meaningful results. Experts’ insights are still helpful forvalidating the analytic results. This study is one of the earliest attempts to compare the data-drivenapproach with the expert-driven approach during industry analysis and technology planning, and todiscuss how the two approaches can complement one another. It is important to take a balanced viewon the use of data-driven approach, especially in the social sciences.
This paper consists of six sections. Section 2 provides a basic overview of big data analysis and valuechain analysis. The overall research process is described in Section 3, and the analytic processes andresults from data-driven and expert-driven value chains are explained in Sections 4 and 5, respectively.The pros and cons of the two approaches are compared in Section 6 to show how a data-driven industryanalysis approach can be complemented by an expert-driven approach. Finally, the contributions andlimitations of this study are discussed in Section 7, along with future research directions.
2. Literature Review
This section reviews previous studies on big data analysis in technology planning and valuechain analysis.
2.1. Big Data Analysis in Technology Planning
Big data refers to any data set that is extremely large and complex that it cannot be easily managedby current software and data management techniques [14]. According to [15], a big data set hasthree characteristics that make it more difficult to analyze than conventional data. The first is variety,that is, the complexity and diversity of the data. Big data are assembled from a wide range of sourcesand take three different forms: structured, semi-structured, and unstructured. Big data’s secondmain characteristic is volume, or the overall size of the data. The current volume of big data typicallyexceeds terabytes or even petabytes; such data volumes surpass modern data storage capabilities andanalysis technologies. The final key characteristic of big data is velocity, that is, the speed at whichdata is generated. To maximize the value of big data, we must be able to process those data at anadequate speed.
Because a big data set is so voluminous and tends to rapidly change in complex ways, thereare several analysis techniques essential for obtaining meaningful knowledge from it [3]. Numerousapproaches, such as machine learning, text mining, data mining, and crowdsourcing, have been appliedto big data analysis. Relevant tools for coping with data volume and complexity have developedrapidly over the past several years [16]. Now, senior managers across industries and regions wonderhow to get full value from the massive amount of data they collect every day as well as the alreadyhave within their organizations [17]. Using the data, those managers need to know what actionsshould be taken to cope with the changes expected in the future. Despite this development, big dataanalysis is facing other challenges, including the integration of internal and external data sources, aswell as privacy and security issues. For example, customer data can be collected for purposes that add

Sustainability 2018, 10, 709 4 of 21
value to customers. At the same time, however, companies that possess these data should be able toguarantee their customers that such data are securely protected and cannot be used for other purposes.
These opportunities and challenges are present in big data analysis used for technology planning,which commonly includes value chain analysis. Big data sources in this field include patents,trademarks, company profiles and transaction data, and social network service data, although most ofexisting studies have focused on the analysis of patent data. Thus, far, patent information has beenconsidered as the most valuable source of technology intelligence [18]. Different types of patent data,such as bibliometric, descriptive, and citation information, have been analyzed for a broad range ofpurposes, including trend analysis [19], competitor analysis [19,20], and opportunity analysis [21–24].Focusing on the semi-structured and unstructured patent data, which are gaining an increasing interest,a patent analysis system that enables to analyze such a large size of data in an efficient manner wasproposed as well [25]. More recent attempts at big data analysis for technology planning have includedthe introduction of other available technology planning data. These databases include trademarks,where product information extracted from trademarks is analyzed and linked to patent informationas a means for identifying new technology opportunities [26], online customer complaints, wherecustomer requirements are identified and considered as part of a new product development [27],mobile service applications, where online user behavior patterns are observed in order to suggest newbusiness opportunities [28–30], and other data collected from various channels (e.g., wireless sensornetworks) to be used for business operations and risk management [31].
These analytic results can provide managers significant knowledge for use in technologyplanning, although data integration, privacy, and data security must also be considered. For example,an automotive technology mining method was proposed to identify prospective technologies inthe automobile industries based on the demands of automakers [32]. Technology planning is afuture-oriented process of decision-making, which is required to establish a vision of the future,explore various options to achieve such vision, and choose the best option among them. On onehand, the quality of decision-making may improve with the amount of available data. On the otherhand, the fact that this process is future-oriented may decrease the value of a data-driven approachbecause of the uncertainties associated with the future. Technology planning is not only concernedwith describing the current technology landscape, but also with predicting the technological future.Data-driven approaches often assume that past trends will continue in the future, which may not betrue for technology planning and for other fields (e.g., pattern recognition in speech and languageprocessing). It might be dangerous to make decisions based solely on data; experts’ insights should beused to complement findings derived from data.
In this study, we examined the possible use of business transaction data for developing a valuechain that meets the three conditions of big data, namely variety, volume, and velocity because:(1) the transaction data include both structured (e.g., the amount of transaction in a monetaryvalue) and unstructured data (e.g., company name, transaction items), meeting the requirement ofvariety; (2) the size of transaction data is large enough, meeting the requirement of volume; and(3) the transaction data are updated for every new transaction, meeting the requirement of velocity.Although the data set used for this study was limited to 17,068,062 due to the data accessibility, itssize can be increased dramatically because the set contains transaction data as well as patent data,trademark data, and company profiles. Accordingly, each data record has numerous fields and sothe data size is quite large for a data set with 17,068,062 records. In those data fields, unstructureddata (e.g., patent title, patent abstract, product/service titles) as well as structured data are observed;a variety of data types are given in the database. Finally, the data set used in this study can changeevery moment according to the entry and exit of companies, corporate patenting and trademarkingactivities, and new business transactions between companies. If data are cumulated over time, datasize can increase dramatically, enabling time-series analysis. Furthermore, we adopted only a subset ofall Korean companies, but a larger number of companies can be used. Similarly, we considered patentspublished only in Korea, but patents published in other countries can be involved in the analysis.

Sustainability 2018, 10, 709 5 of 21
Hence, the data used for this analysis had limitations, but its basic attributes can meet the condition ofbig data.
Considering that big data analytics is the process of collecting, organizing, and analyzing a largeset of data (big data) to discover useful information, the question on whether a set of transaction datacan replace the work by experts in developing a value chain is worth investigating. Nevertheless,our analysis will be based only on a simple approach, as the purpose of this study is not to suggest anovel data-driven algorithm to construct a valid value chain but to show the potential of the existingdatabases as solutions to replace or support the analysis by experts. If a simple approach can evenproduce reasonable results, a greater impact can be expected from big data analytics, where moreadvanced approaches are used.
2.2. Value Chain Analysis
A value chain is the series of activities, functions, and processes that are directly and indirectlyrelated to a product or service during the process of delivering value to a customer [33]. This conceptwas developed by Porter in 1985 as a strategic tool for internal corporate analysis. Porter claimedthat value chain activities are the foundation of corporate competitive advantages, and that theseactivities are not just a collection of independent activities, but also a systematic structure of interrelatedactivities. From this perspective, he tried to explain the sources of cost and distinct advantages byinvestigating all activities in a company and their interrelationships.
More recently, value chain analysis has been applied to assess inter-enterprise competitivenessand promote inter-industry or international competitiveness [34]. The use of value chain analysis hasexpanded to industry analysis. Value chain analysis at the industry level allows for a comprehensive lookat industries and can be used for strategic technology planning or industry policy-making. Accordingly,there have been previous attempts to identify an industry value chain. Yan and Wang analyzed thevalue flow of iron resources from China by using material flow and value chain analyses [34]. El-Sayedet al. analyzed the value chain of the aquafeed sector in Egypt, which includes feed input suppliers,aquafeed producers and marketers, and fish farmers [35]. A value chain analysis applied to the scraptire reverse logistics chain (STRLC) was shown to verify whether STRLC can become sustainablefrom an environmental, economic, and social perspective [36]. Irvine demonstrated that value chainanalysis provides a robust, systems-based approach that can be used as a systematic framework forevaluating a livestock health surveillance system [37]. He further demonstrated the context in whichdisease information and associated surveillance data are placed in a surveillance system value chainby the people, businesses, and organizations involved. Jussani et al. developed a global value chainfor urban light electric vehicle in Korea and Japan, aiming to identify the main features of the valuechain [38]. Analyzing an industry value chain is regarded as an essential step for technology planning,policy-making support, and strategic planning. At the firm level, the value chain analysis resultsallow a firm to comprehend its position in the industrial ecosystem and identify its direct and indirectcompetitors as well as its clients and suppliers. At the national (industry) level, the value chainanalysis results can help in revealing a country’s strengths and weaknesses. As described above, bothdata-driven and expert-driven approaches have been adopted for analyzing an industry value chain.
3. Research Process
The overall research process consists of four steps, as shown in Figure 2. First, a target industryfor analysis was identified. We selected a photovoltaic system as the target industry, but the sameanalysis was conducted on light-emitting diodes (LED) for the validity test (see Appendix A). Becauseof their extensive potential applications and increasing efficiency, photovoltaic systems are regardedas a promising power generation technology [39]. Both theoretical and practical contributions areexpected from analyzing a photovoltaic system value chain.
Our second step was to develop an expert-driven value chain map for the photovoltaic system.Two approaches were adopted. The first was to search for a relevant value chain map that already

Sustainability 2018, 10, 709 6 of 21
existed in the public domain (having already been developed by a panel of industry experts).The second was to ask an industry expert to analyze a value chain specifically for this experiment.In this step, we also developed a value chain map by using a data-driven approach. Data collectedfrom Korea Enterprise Data (KED) (http://www.kedkorea.com) were selected as the main sourcefor analysis. KED is one of the primary companies that provide credit data on Korean businesses.It is an affiliate of the Korea Credit Guarantee Fund, a government subsidiary; therefore, its dataare massive, reliable, and up-to-date. KED collects data ranging from company profiles to financialstatements. This study used two of KED’s data sources: company profiles and business transaction data.In particular, KED maintains a self-reported data set of each company’s main clients and correspondingbusiness items, which are its main product and service categories for transactions with those clients.If analyzed well, the combination of business transaction data and company profiles can be a strongfoundation for value chain analysis. After merging the two data sets, we obtained 17,068,062 records.As part of data preprocessing, we performed data cleansing on those records. The basic steps forconstructing a value chain are as follows: (1) the companies offering the end products of a valuechain are identified; (2) supplier companies that have provided products or services to the companiesidentified in the first step are extracted from the transaction data; (3) the supplier companies identifiedin step 2 are grouped by standard industry classification (SIC) codes; (4) the group name is decidedbased on the SIC codes, main business items, and main transaction items of the group members; and(5) the same procedure is followed for other groups.
Finally, the value chain constructed using this data-driven approach is compared with the valuechain created via the expert-driven approach. A discussion on the pros and cons of these approachescan help us determine the ways in which data-driven approaches can be used in combination withexpert-driven approaches.
Sustainability 2018, 10, x FOR PEER REVIEW 6 of 21
step, we also developed a value chain map by using a data-driven approach. Data collected from Korea Enterprise Data (KED) (http://www.kedkorea.com) were selected as the main source for analysis. KED is one of the primary companies that provide credit data on Korean businesses. It is an affiliate of the Korea Credit Guarantee Fund, a government subsidiary; therefore, its data are massive, reliable, and up-to-date. KED collects data ranging from company profiles to financial statements. This study used two of KED’s data sources: company profiles and business transaction data. In particular, KED maintains a self-reported data set of each company’s main clients and corresponding business items, which are its main product and service categories for transactions with those clients. If analyzed well, the combination of business transaction data and company profiles can be a strong foundation for value chain analysis. After merging the two data sets, we obtained 17,068,062 records. As part of data preprocessing, we performed data cleansing on those records. The basic steps for constructing a value chain are as follows: (1) the companies offering the end products of a value chain are identified; (2) supplier companies that have provided products or services to the companies identified in the first step are extracted from the transaction data; (3) the supplier companies identified in step 2 are grouped by standard industry classification (SIC) codes; (4) the group name is decided based on the SIC codes, main business items, and main transaction items of the group members; and (5) the same procedure is followed for other groups.
Finally, the value chain constructed using this data-driven approach is compared with the value chain created via the expert-driven approach. A discussion on the pros and cons of these approaches can help us determine the ways in which data-driven approaches can be used in combination with expert-driven approaches.
Figure 2. Overall research process.
4. Expert-Driven Value Chain Development
This section explains the data collection process and the results for expert-drive value chain development.
4.1. Data Collection
An expert-based value chain was constructed in two ways. First, we obtained photovoltaic value chain maps that had previously been analyzed and published. Most of these maps were developed by a panel of experts involved in the Korean government’s long-term technology planning. We were able to obtain a value chain from an industrial technology roadmap report published in 2012 by the Korea Institute for Advancement of Technology (KIAT). The report is the outcome of an effort to develop special R&D strategies for helping industrial technologies to cope with industrial technology policies and environmental changes. During the roadmapping process, a value chain was investigated as a means for understanding the industry structure. Five to seven industry experts
Figure 2. Overall research process.
4. Expert-Driven Value Chain Development
This section explains the data collection process and the results for expert-drive value chaindevelopment.
4.1. Data Collection
An expert-based value chain was constructed in two ways. First, we obtained photovoltaic valuechain maps that had previously been analyzed and published. Most of these maps were developed bya panel of experts involved in the Korean government’s long-term technology planning. We were ableto obtain a value chain from an industrial technology roadmap report published in 2012 by the KoreaInstitute for Advancement of Technology (KIAT). The report is the outcome of an effort to developspecial R&D strategies for helping industrial technologies to cope with industrial technology policies
Sustainability 2018, 10, 709 7 of 21
and environmental changes. During the roadmapping process, a value chain was investigated as ameans for understanding the industry structure. Five to seven industry experts provided the relevantknowledge and background information required to construct the value chain. We were concernedthat this previously existing, public-domain value chain might be outdated at the time of our study,and that it may have been affected by the underlying purpose of its research; that is, we are aware thatdifferent perspectives behind a value chain analysis may lead to different results. Therefore, we alsoasked an industry expert to construct an original photovoltaic value chain for our study. We recruitedindustry experts capable of overviewing the photovoltaic industry in June 2015. Three candidateswere identified as appropriate experts, and one was selected as the most suitable. He was given twoweeks to construct a value chain, and we received his results in July 2015.
4.2. Value-Chain Development Results
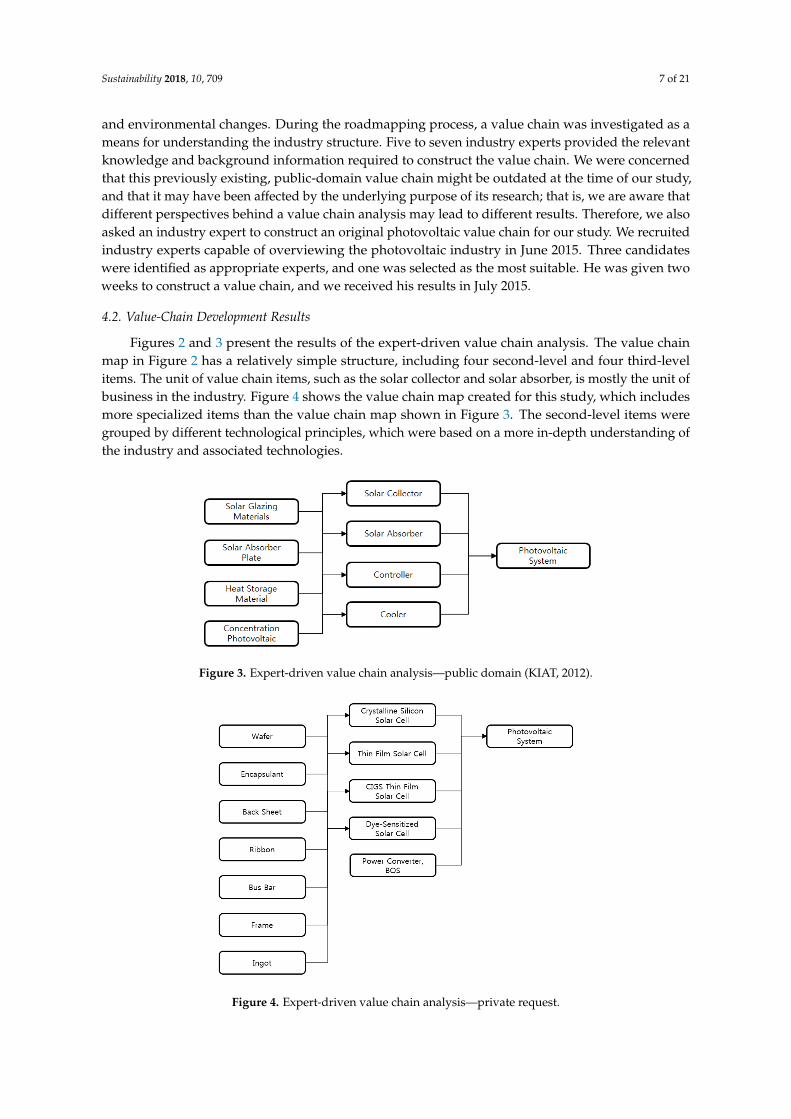
Figures 2 and 3 present the results of the expert-driven value chain analysis. The value chainmap in Figure 2 has a relatively simple structure, including four second-level and four third-levelitems. The unit of value chain items, such as the solar collector and solar absorber, is mostly the unit ofbusiness in the industry. Figure 4 shows the value chain map created for this study, which includesmore specialized items than the value chain map shown in Figure 3. The second-level items weregrouped by different technological principles, which were based on a more in-depth understanding ofthe industry and associated technologies.
Sustainability 2018, 10, x FOR PEER REVIEW 7 of 21
provided the relevant knowledge and background information required to construct the value chain. We were concerned that this previously existing, public-domain value chain might be outdated at the time of our study, and that it may have been affected by the underlying purpose of its research; that is, we are aware that different perspectives behind a value chain analysis may lead to different results. Therefore, we also asked an industry expert to construct an original photovoltaic value chain for our study. We recruited industry experts capable of overviewing the photovoltaic industry in June 2015. Three candidates were identified as appropriate experts, and one was selected as the most suitable. He was given two weeks to construct a value chain, and we received his results in July 2015.
4.2. Value-Chain Development Results
Figures 2 and 3 present the results of the expert-driven value chain analysis. The value chain map in Figure 2 has a relatively simple structure, including four second-level and four third-level items. The unit of value chain items, such as the solar collector and solar absorber, is mostly the unit of business in the industry. Figure 4 shows the value chain map created for this study, which includes more specialized items than the value chain map shown in Figure 3. The second-level items were grouped by different technological principles, which were based on a more in-depth understanding of the industry and associated technologies.
Figure 3. Expert-driven value chain analysis—public domain (KIAT, 2012).
Figure 4. Expert-driven value chain analysis—private request.
Figure 3. Expert-driven value chain analysis—public domain (KIAT, 2012).
Sustainability 2018, 10, x FOR PEER REVIEW 7 of 21
provided the relevant knowledge and background information required to construct the value chain. We were concerned that this previously existing, public-domain value chain might be outdated at the time of our study, and that it may have been affected by the underlying purpose of its research; that is, we are aware that different perspectives behind a value chain analysis may lead to different results. Therefore, we also asked an industry expert to construct an original photovoltaic value chain for our study. We recruited industry experts capable of overviewing the photovoltaic industry in June 2015. Three candidates were identified as appropriate experts, and one was selected as the most suitable. He was given two weeks to construct a value chain, and we received his results in July 2015.
4.2. Value-Chain Development Results
Figures 2 and 3 present the results of the expert-driven value chain analysis. The value chain map in Figure 2 has a relatively simple structure, including four second-level and four third-level items. The unit of value chain items, such as the solar collector and solar absorber, is mostly the unit of business in the industry. Figure 4 shows the value chain map created for this study, which includes more specialized items than the value chain map shown in Figure 3. The second-level items were grouped by different technological principles, which were based on a more in-depth understanding of the industry and associated technologies.
Figure 3. Expert-driven value chain analysis—public domain (KIAT, 2012).
Figure 4. Expert-driven value chain analysis—private request. Figure 4. Expert-driven value chain analysis—private request.
Sustainability 2018, 10, 709 8 of 21
5. Data-Driven Value Chain Development
This section describes the data collection and preprocessing process for data-driven value chaindevelopment, followed by the data analysis methods and results for its development.
5.1. Data Collection and Preprocessing
A company profile data set consisting of 3,107,069 records and a business transaction data setconsisting of 17,068,062 records were collected from KED and were then merged into a single dataset with 17,068,062 records. To do this, the company ID (business registration certificate) was usedas a key field to link company profile data set with business transaction data set. A company nametogether with company address and representative name was used to link company profile data setto patents and trademarks. This integrated database, which was built on the basis of transactiondata, is composed of three parts: (1) supplier data (identity code, registration number, companyname, main products, and SIC code); (2) customer data (identity code, registration number, companyname, main products, and SIC code); and (3) transaction data (transaction value in Korean won andtransaction items). A data cleansing process was then undertaken to delete missing and erroneousdata. Specifically, data for companies bankrupted or unrecognizable company names were eliminated,which corresponds to less than 1% of total data.
5.2. Data Analysis Methods and Results
First, we identified the end-product manufacturers of photovoltaic systems in Korea, as first-levelcompanies. This was performed with a keyword search by using the term “photovoltaic system” fromthe main products field of the database used for analysis. Here, synonyms (e.g., solar power systemfor photovoltaic system), or terms for equivalent products (e.g., solar collector and solar panel forsolar cell, or LCD for liquefied crystal display) need to be considered for the best use of the database.Thus, such were defined in advance for each product, although the terms in the value chain consist ofthe most representative terms. More specifically, we used Boolean searching to combine search termsusing the three operators, AND, OR, and NOT.
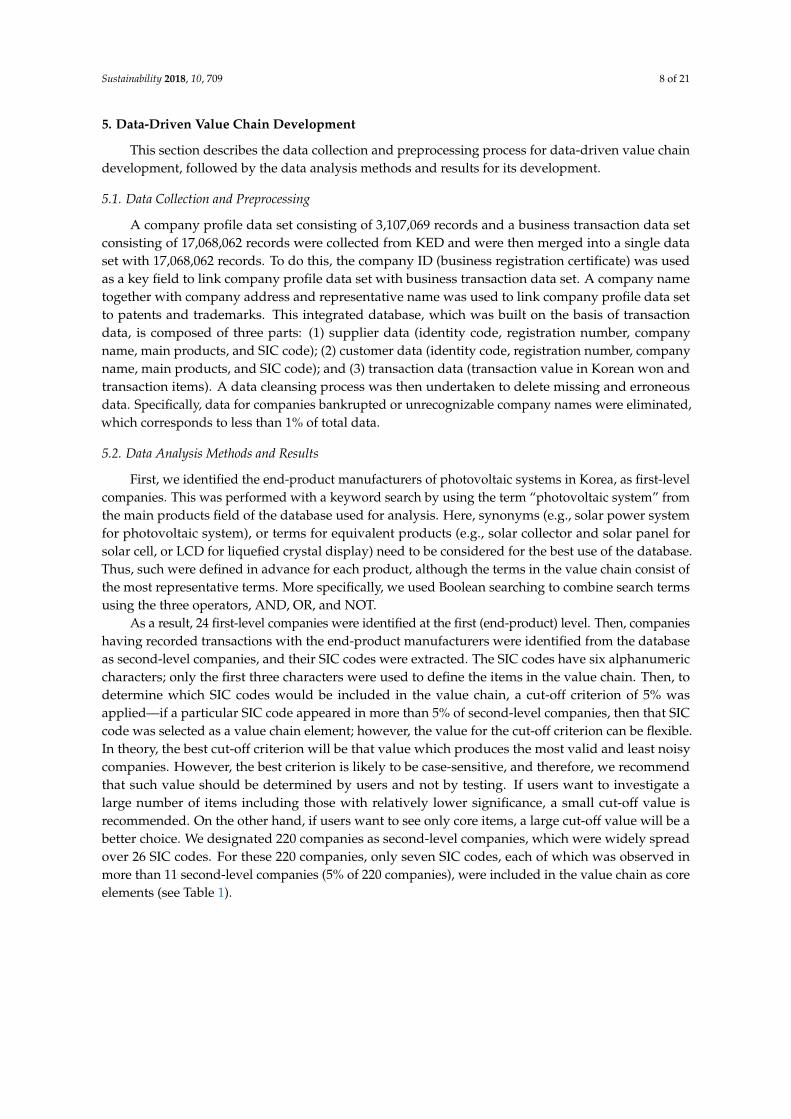
As a result, 24 first-level companies were identified at the first (end-product) level. Then, companieshaving recorded transactions with the end-product manufacturers were identified from the databaseas second-level companies, and their SIC codes were extracted. The SIC codes have six alphanumericcharacters; only the first three characters were used to define the items in the value chain. Then, todetermine which SIC codes would be included in the value chain, a cut-off criterion of 5% wasapplied—if a particular SIC code appeared in more than 5% of second-level companies, then that SICcode was selected as a value chain element; however, the value for the cut-off criterion can be flexible.In theory, the best cut-off criterion will be that value which produces the most valid and least noisycompanies. However, the best criterion is likely to be case-sensitive, and therefore, we recommendthat such value should be determined by users and not by testing. If users want to investigate alarge number of items including those with relatively lower significance, a small cut-off value isrecommended. On the other hand, if users want to see only core items, a large cut-off value will be abetter choice. We designated 220 companies as second-level companies, which were widely spreadover 26 SIC codes. For these 220 companies, only seven SIC codes, each of which was observed inmore than 11 second-level companies (5% of 220 companies), were included in the value chain as coreelements (see Table 1).
Sustainability 2018, 10, 709 9 of 21
Table 1. Value chain analysis results: second-level SIC codes.
SICCodes Industry Title Frequency
C28 Manufacture of electrical equipment 49G46 Wholesale trade and commission trade, except of motor vehicles and motorcycles 35F42 Special trade construction 23C29 Manufacture of other machinery and equipment 21C26 Manufacture of electronic components, computer, radio, television and communication equipment and apparatuses 16C25 Manufacture of fabricated metal products, except machinery and furniture 14C32 Manufacture of furniture 12C16 Manufacture of wood and of products of wood and cork; except furniture 6C27 Manufacture of medical, precision, and optical instruments, watches and clocks 6C10 Manufacture of food products 4C18 Printing and reproduction of recorded media 4C23 Manufacture of other non-metallic mineral products 4C30 Manufacture of motor vehicles, trailers, and semitrailers 4J58 Publishing activities 4C20 Manufacture of chemicals and chemical products; except pharmaceuticals and medicinal chemicals 2C22 Manufacture of rubber and plastic products 2C24 Manufacture of basic metal products 2C33 Other manufacturing 2M72 Architectural, engineering, and other scientific technical services 2C13 Manufacture of textiles; except apparel 2C14 Manufacture of wearing apparel, clothing accessories and fur articles 1C17 Manufacture of pulp, paper, and paper products 1F41 General construction 1G47 Retail trade; except motor vehicles and motorcycles 1J62 Computer programming, consultancy, and related activities 1
M71 Professional services 1
Note 1. The texts in bold indicate the items to be included in the value chain. Note 2. The frequency indicates thenumber of firms for each SIC code.
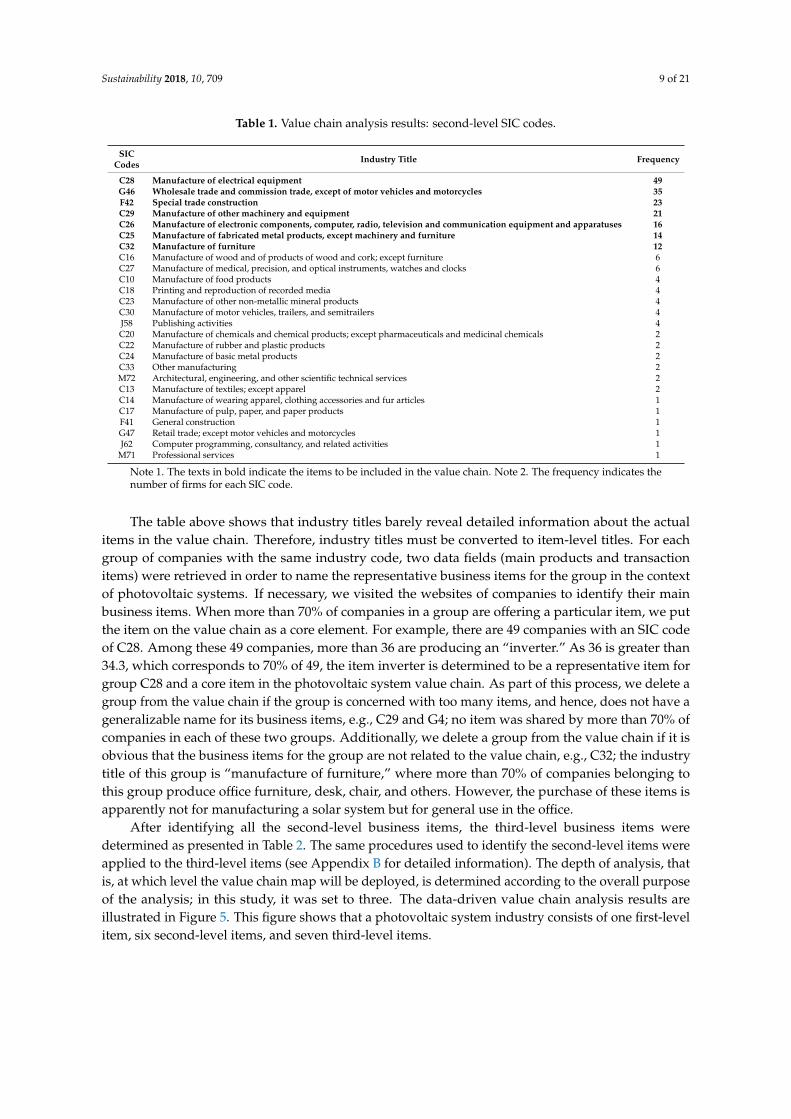
The table above shows that industry titles barely reveal detailed information about the actualitems in the value chain. Therefore, industry titles must be converted to item-level titles. For eachgroup of companies with the same industry code, two data fields (main products and transactionitems) were retrieved in order to name the representative business items for the group in the contextof photovoltaic systems. If necessary, we visited the websites of companies to identify their mainbusiness items. When more than 70% of companies in a group are offering a particular item, we putthe item on the value chain as a core element. For example, there are 49 companies with an SIC codeof C28. Among these 49 companies, more than 36 are producing an “inverter.” As 36 is greater than34.3, which corresponds to 70% of 49, the item inverter is determined to be a representative item forgroup C28 and a core item in the photovoltaic system value chain. As part of this process, we delete agroup from the value chain if the group is concerned with too many items, and hence, does not have ageneralizable name for its business items, e.g., C29 and G4; no item was shared by more than 70% ofcompanies in each of these two groups. Additionally, we delete a group from the value chain if it isobvious that the business items for the group are not related to the value chain, e.g., C32; the industrytitle of this group is “manufacture of furniture,” where more than 70% of companies belonging tothis group produce office furniture, desk, chair, and others. However, the purchase of these items isapparently not for manufacturing a solar system but for general use in the office.
After identifying all the second-level business items, the third-level business items weredetermined as presented in Table 2. The same procedures used to identify the second-level items wereapplied to the third-level items (see Appendix B for detailed information). The depth of analysis, thatis, at which level the value chain map will be deployed, is determined according to the overall purposeof the analysis; in this study, it was set to three. The data-driven value chain analysis results areillustrated in Figure 5. This figure shows that a photovoltaic system industry consists of one first-levelitem, six second-level items, and seven third-level items.

Sustainability 2018, 10, 709 10 of 21
Table 2. Value chain analysis results: third-level items.
SIC Codes Industry Title Main Product and Service Items Percentage
C28 Manufacture of electrical equipmentInverter 85%Battery 80%Main junction box 72%
G46 Wholesale trade and commission trade, except ofmotor vehicles and motorcycles
Various items including thermometer,flooring, LCD, livestock, and iron -
F42 Special trade construction Monitoring system 76%
C29 Manufacture of other machinery and equipmentVarious items including environmentalpollution measuring devices, noise blanker,and shopping cart
-
C26Manufacture of electronic components, computer,radio, television and communication equipmentand apparatuses
Solar cell (monocrystalline/polycrystalline) 89%
C25 Manufacture of fabricated metal products, exceptmachinery and furniture Frame 74%
C32 Manufacture of furniture Office furniture, desk, chair, and others -
Sustainability 2018, 10, x FOR PEER REVIEW 10 of 21
Table 2. Value chain analysis results: third-level items.
SIC Codes Industry Title Main Product and Service Items Percentage
C28 Manufacture of electrical equipment Inverter 85% Battery 80% Main junction box 72%
G46 Wholesale trade and commission trade, except of motor vehicles and motorcycles
Various items including thermometer, flooring, LCD, livestock, and iron
-
F42 Special trade construction Monitoring system 76%
C29 Manufacture of other machinery and equipment
Various items including environmental pollution measuring devices, noise blanker, and shopping cart
-
C26 Manufacture of electronic components, computer, radio, television and communication equipment and apparatuses
Solar cell (monocrystalline/polycrystalline) 89%
C25 Manufacture of fabricated metal products, except machinery and furniture Frame 74%
C32 Manufacture of furniture Office furniture, desk, chair, and others -
Figure 5. Data-driven value chain analysis.
6. Big Data Analytics vs. Expert Insights
The value chain results based on big data analytics and expert insights are compared in this section to identify the strengths and weaknesses of each approach and further to understand the opportunities of big data analytics.
6.1. Comparative Analysis of the Two Approaches
The experiment in this study demonstrates how big data analytics can contribute to technology planning. As the purpose of technology intelligence, which is the key role of both data and experts in technology planning, is to offer the right information to the right person at the right time, these three conditions were used as the three criteria to compare the characteristics of data-driven and expert-driven approaches. First, as to “right information,” the quality and reliability of the analysis results were considered. The data-driven analytic results show that the value chain was developed based on the terms and business items that are actually used in the real world. In addition, we were
Figure 5. Data-driven value chain analysis.
6. Big Data Analytics vs. Expert Insights
The value chain results based on big data analytics and expert insights are compared in thissection to identify the strengths and weaknesses of each approach and further to understand theopportunities of big data analytics.
6.1. Comparative Analysis of the Two Approaches
The experiment in this study demonstrates how big data analytics can contribute to technologyplanning. As the purpose of technology intelligence, which is the key role of both data and expertsin technology planning, is to offer the right information to the right person at the right time, thesethree conditions were used as the three criteria to compare the characteristics of data-driven andexpert-driven approaches. First, as to “right information”, the quality and reliability of the analysisresults were considered. The data-driven analytic results show that the value chain was developedbased on the terms and business items that are actually used in the real world. In addition, we were

Sustainability 2018, 10, 709 11 of 21
able to find some items that were not identified in the expert-driven analysis, including networkinfrastructure equipment, LEDs, semiconductor molding and automation equipment, transformers,monitoring systems, main junction boxes, and batteries (orange color in Figure 6). Our expert-drivenanalysis categorized “frames” as a third-level item, whereas it was a second-level item in thedata-driven analysis (blue color in Figure 6). This discrepancy indicates that end-user productmanufacturers in this industry have worked directly with frame suppliers, which more closely matchesbusiness realities. We presented the results of two approaches to two experts that have been involvedin various industry value chain mapping and let them discuss the discrepancies between the twoapproaches. The experts argued that both approaches have their own pros and cons in terms ofinformation accuracy. The data-driven approach is beneficial in situations where little information isavailable for developing an industry value chain and thus it can be a good baseline from which expertanalysis could start, particularly for investigating emerging industries. Furthermore, there exist severalitems observed only in the data-driven analysis results. These missing items seemed to be regarded asof little importance by those who deployed the value chain and the perceived importance of item mayvary depending on the criteria to be used for evaluating such importance; the data-driven approachcan provide standard criteria to determine whether an item should be included in the value chain ornot. At the same time, both of the experts concerned about the difficulties in collecting the right datafor analysis. In our experiment of data-driven approach, the items imported could not be considereddue to the lack of available data, which may distort the true global value chain of photovoltaic industry.Therefore, an expert-driven approach can still be useful to supplement the data-driven analysis results.Considering the shortcomings of both approaches, we constructed an ideal value chain by using theresults from both approaches; this ideal value chain is shown in Figure 6.
Sustainability 2018, 10, x FOR PEER REVIEW 11 of 21
able to find some items that were not identified in the expert-driven analysis, including network infrastructure equipment, LEDs, semiconductor molding and automation equipment, transformers, monitoring systems, main junction boxes, and batteries (orange color in Figure 6). Our expert-driven analysis categorized “frames” as a third-level item, whereas it was a second-level item in the data-driven analysis (blue color in Figure 6). This discrepancy indicates that end-user product manufacturers in this industry have worked directly with frame suppliers, which more closely matches business realities. We presented the results of two approaches to two experts that have been involved in various industry value chain mapping and let them discuss the discrepancies between the two approaches. The experts argued that both approaches have their own pros and cons in terms of information accuracy. The data-driven approach is beneficial in situations where little information is available for developing an industry value chain and thus it can be a good baseline from which expert analysis could start, particularly for investigating emerging industries. Furthermore, there exist several items observed only in the data-driven analysis results. These missing items seemed to be regarded as of little importance by those who deployed the value chain and the perceived importance of item may vary depending on the criteria to be used for evaluating such importance; the data-driven approach can provide standard criteria to determine whether an item should be included in the value chain or not. At the same time, both of the experts concerned about the difficulties in collecting the right data for analysis. In our experiment of data-driven approach, the items imported could not be considered due to the lack of available data, which may distort the true global value chain of photovoltaic industry. Therefore, an expert-driven approach can still be useful to supplement the data-driven analysis results. Considering the shortcomings of both approaches, we constructed an ideal value chain by using the results from both approaches; this ideal value chain is shown in Figure 6.
Figure 6. Integrated value chain analysis.
Second, with respect to “right person,” the flexibility of analysis in terms of its granularity and approaches was evaluated. We found that the expert-based approach could provide a relatively flexible solution to intelligence users as the granularity, as well as the approaches to analysis, is easily customizable to analysis purposes. For example, in our experiment, the expert-driven analysis produced more technical and specialized results than the data-driven analysis. Both micro-level (identifying technical and specialized items) as well as macro-level (identifying business items)
Figure 6. Integrated value chain analysis.
Second, with respect to “right person,” the flexibility of analysis in terms of its granularity andapproaches was evaluated. We found that the expert-based approach could provide a relativelyflexible solution to intelligence users as the granularity, as well as the approaches to analysis, is easilycustomizable to analysis purposes. For example, in our experiment, the expert-driven analysisproduced more technical and specialized results than the data-driven analysis. Both micro-level(identifying technical and specialized items) as well as macro-level (identifying business items) analyseswere feasible on request with the expert-based approach, while the level of analysis was relatively

Sustainability 2018, 10, 709 12 of 21
fixed at macro-level with the data-driven analysis in our experiments. Furthermore, the expert-drivenanalysis results reflected information that could not be extracted from the data used in this study;the business transaction data used in this study only reflect transactions between Korean companies,offering a value chain within Korea rather than from a global perspective. Products that are primarilyimported cannot be identified from this data set, even if they are essential to the value chain. Acquiringall databases required for analysis purposes is the foremost process of obtaining the right insights forthe right person, which may decrease the flexibility of the data-driven approach.
Finally, concerning “right time”, the time and cost required to conduct each analysis wereexamined, because they affect the possibility of providing necessary information with a minimumdelivery time. A data-driven approach enables an easy analysis and update of analysis results. It maycost a lot to acquire a database of interest and to develop an algorithm for its analysis. In our experiment,it took almost a year to work on the project. However, once they are developed, having up-to-dateanalysis results based on real-time data becomes feasible only with a small maintenance cost, which isexpected to significantly increase the value of analysis. On the contrary, expert-based analysis mayrequire less cost in its first application but the same amount of production costs will be incurred forthe subsequent applications.
6.2. Strengths and Weaknesses of Big Data Analytics
Our experiments showed that big data analytics may have both strengths and weaknesses,compared to expert-based approaches. First, with respect to data collection, the most significant step inbig data analytics is to collect the right data for analysis. The data need to be representative, accurate,and aligned with the analysis purpose, as the quality of the results is likely to be greatly affected bythe quality of data. For example, the data set obtained from KED is undoubtedly useful for analyzinga value chain for domestic firms but is limited in its capacity for analyzing a global value chain (whichwould need to consider international business transactions). A precondition of benefiting from bigdata analytics is the ability to obtain a proper set of data. Because of these limitations, we should becautious of relying too heavily on data-driven analysis results.
Second, with respect to data analysis, given the appropriate data, big data analytics can helpuncover findings that would not have been revealed by experts. Furthermore, data sets can be keptup-to-date relatively easily, which increases the reliability of data analysis. Although we failed tobuild real-time and time-series data in this study, business transaction data are basically real-time andtime-series by nature. As a result, it is possible to develop a system that can monitor the evolution ofindustry value chains and can detect early signals of changes. The challenge here is developing analgorithm sophisticated enough to construct a trustworthy value chain. Once such an algorithm isin place, a value chain for another industry can be developed relatively easily, requiring little or noadditional effort. However, it is still extremely difficult to explain complex social phenomena withan analysis model and relevant algorithms. Even in our data-driven approach, some manual taskswere required to ensure the quality of analysis results. For example, a set of keywords on end-userproducts, which will affect the list of companies producing such products and further those at thesecond- and third-levels, need to be identified by the users. Identifying wrong keywords for end-userproducts may result in an incomplete or even wrong value chain. Similarly, a cut-off value needs to bedetermined by the users. As there is no one-size-fits-all solution for every value chain, the appropriatecriteria rely on the users according to the purpose of analysis.
Furthermore, the title of the main product and service items needs to be determined manually asthe information obtained from the data is the list of SIC codes and corresponding companies, not thetitle of the items. In addition, there were some industry sectors whose value chains could not beanalyzed with the algorithm used in this study. The approach used in this study has an intrinsiclimitation in that it is more applicable to companies producing only a few items. The transaction data fora company characterized by a small-quantity batch production may have included a significant amountof noisy data. Moreover, the data for a single company covered several value chains, and therefore,

Sustainability 2018, 10, 709 13 of 21
choosing a subset of data that corresponded only to a particular industry of interest was a challengethat we failed to overcome in this study.
Finally, with respect to data usage, the data used in this study could be linked to other data,opening up a number of new possibilities. The potential of a data set is not limited to the informationthat can be directly obtained from it, but also extends to the information that could be obtained bycombining it with other databases. For example, transaction data can be merged with company profiles,patent data, trademark data, or international trade data. If these databases are linked via companycodes, various other meaningful analyses can be designed to identify the characteristics of a valuechain in terms of its strengths, weaknesses, degrees of innovation, etc. However, it is important tonote that linking data in this way would require considerable effort and would raise relevant issuesregarding data security.
6.3. Opportunities of Big Data Analytics
Analyzing a value chain has been regarded by experts as one of the most difficult tasks involvedin technology planning for the following reasons. First, experts may face difficulties in presentingan industry overview, as they are likely to be an expert only in a particular area. Second, publishedreports on value chains are not always reliable or applicable—they might be outdated, or the valuechain analysis results might be significantly influenced by the purpose of the analysis. Third, evenafter a value chain map has been successfully developed, continuous updating is necessary to maintainit and to ensure that it reflects the changes in industrial environments.
Big data analytics can help overcome the above difficulties. It enables users to grasp the overallstructure of an industry, supporting strategic technology planning and policy-making. When multipledatabases are combined, more insightful analyses become feasible. Table 3 summarizes the analyticresults of value chain items in terms of the characteristics of the companies that supply each of the items.To prepare this information, three databases were combined: the KED database, Association of Scienceand Technology Information (ASTI) database, and Korea Intellectual Property Rights InformationService (KIPRIS) database. We collected business transaction data and company profiles from theKED database, company lists (as of 2015) from the ASTI database, and patent data for the past threeyears (as of 2015) from the KIPRIS database. Table 3 indicates that in a value chain of photovoltaicsystems, most companies are working on wafer and frame items; it is highly likely that these two itemshave been the focus of Korean companies. The transformer item shows the greatest increase in salesbetween 2014 and 2015, though the size of the market (inferred from the average income and sales ofrelevant companies) is small. The most active innovation activities are observed in the photovoltaicsystem item, which is an end-user product with an average of 4.9 patent publications per company.
There seem to be enormous opportunities for big data analytics in technology planningbecause understanding of the current situation is essential to obtain successful planning results.Such knowledge can be gained from both human resources and real-time data generated by variousactors that are directly or indirectly related to a company in its innovation network. A company canensure that its plan stays on track to success by closely monitoring up-to-date trends and thus can copewith today’s complex industry dynamics. However, these opportunities lie more in big data’s capacityto support expert decision-making, and less in big data’s ability to solve future-oriented problems.Solving such problems requires a look-ahead strategy, envisioning the desired future. However, bigdata analysis usually focuses on forecasting (a prediction based on past data), while future-orientedproblems require foresight (a target for the desired future) as well as forecasting. In other words,data analysis results can create a diagram that describes an industry’s value chain, but it is still anexpert’s role to verify and finalize such diagram: (1) a different data set may produce different results;(2) the way to present outputs is less flexible when using a data-based approach; and (3) by usingsecondary data, which is common in big data analysis, analysis results may contain noise even afterdata preprocessing or may lack some contents. In our analysis, we use a data set only from domesticfirms, which limited the view to a domestic rather than a global value chain.

Sustainability 2018, 10, 709 14 of 21
Table 3. Characteristics of companies in a value chain by items.
Level Value Chain Items Number ofCompanies
Average Assets(2015)
(Million won)
Average Sales(2015)
(Million won)
Average Income(2015)
(Million won)
Average Sales Increase(2014–2015)
(%)
Average Number of Patents *(29 August 2013–29 August 2016)
3
Network infrastructure equipment 18 4653 2586 127 −35.33 0.0LED 23 159,042 143,808 4737 −5.68 2.0Semiconductor molding and automation equipment 24 35,412 26,947 2988 9.72 0.0Transformer 37 7856 12,646 141 42.33 0.0Wafer 54 255,566 84,456 134,108 −43.66 1.5Back sheet 47 332,307 195,177 19,292 −6.67 2.5Ribbon 43 69,218 51,027 1341 −7.96 1.0
2
Monitoring system 34 3143 5309 230 28.76 2.0Power converter (inverter) 42 92,749 141,653 2239 −11.11 3.0Solar cell (monocrystalline/polycrystalline) 48 194,643 53,908 −9573 0.49 1.7Main junction box 32 5048 5439 337 −32.77 3.7Frame 57 286,102 350,318 14,882 2.64 0.0Battery 48 504,945 483,299 40,060 −4.41 3.0
1 Photovoltaic system 24 33,857 45,262 699 −8.37 4.9
Note * Average number of patents granted.

Sustainability 2018, 10, 709 15 of 21
The types of planning suitable for data-driven analysis include fact-based planning. In our case,the data-driven value chain analysis enabled us to understand the overall relationships between firmsin the value chain. From the analysis, it is possible to identify the strengths and weaknesses of thevalue chain at the industry level, based on which an industrial policy can be designed in a way toimprove the strengths while overcoming the weaknesses. At the firm level, by looking at what othercompetitors are doing, a firm can make a better decision on its strategies on future businesses. On theother hand, the types of industries where our approach can have a significant potential to contributeare newly emerging and/or converging industries. In these industries, experts’ knowledge of industrystructure is so limited or scatter across so many sources that it will not be easy to develop a value chainbased on experts’ knowledge. The data-driven approach could help identify hidden and unexpectedrelationships between firms in a value chain.
7. Conclusions
This study aims to compare data-driven and expert-driven analytics in the field of technologyplanning. To accomplish this, we first obtained a value chain mapping case study for the photovoltaicindustry, which is an industry that might benefit greatly from a data-driven approach, and one thatpresents challenges to experts involved in the value chain mapping. We designed a simple experimentto compare a data-driven approach with an expert-driven approach. An appropriate database wasidentified, and analysis algorithms were developed. Finally, the pros and cons of each approach wereinvestigated in order to draw conclusions regarding opportunities for applying big data analytics totechnology planning. This study is one of the earliest attempts to compare the data-driven approachwith the expert-driven approach and to discuss how the two approaches can complement one another.
Our case study results demonstrated that big data analytics has obvious advantages over expertinsights in that (1) the value chain unit could appropriately reflect real business environments; (2) theanalytic results could identify value chain elements that had not been identified by experts; (3) updatingvalue chain maps was relatively easy, a feature that is expected to provide interested parties withan early signal for industry changes; and (4) several databases could be interconnected to producemeaningful implications. However, there are still several challenges: (1) high quality results couldnot be achieved without both high quality data and sophisticated algorithms for transforming thosedata into information; and (2) owing to data limitations, the flexibility of the analysis in terms of thecontents of value chain items was restricted. That is, how to interpret an industry with respect to itsvalue chain may vary by experts; accordingly, different value chains can be developed by differentexperts, allowing the creativity and flexibility of analysis, which is not feasible in a data-driven analysis.Data-driven approaches provide a greater opportunity to support expert decision-making, but cannotbe a sole solution for technology planning.
Despite these significant findings, this study has several limitations. First, it was exploratory innature and thus, was not based on a rigorous experimental design. For example, the analytic results(that is, the value of each approach) may change depending on the data we obtain and the algorithmswe develop. Thus, in the future experiment, more than one industry expert needs to be involved toachieve reliable and valid results. In addition, we set the depth of value chain to three, because thetwo value chains developed by experts used for comparative analysis in this study have adopted athree-level structure. However, for a data-driven approach, it would be interesting to have a highernumber, which is required as future research.
Second, additional experiments on other industries will be required—different industries maybenefit to different degrees from data-driven approaches. The more complex and rapidly changing anindustry structure is, the more necessity there is to use the data-driven approaches. Future researchneed to identify the characteristics of industry necessitating the data-driven approaches.
Third, the approaches to analyze the value chain data can be improved. Only a simple approachwas adopted in this study because its purpose was not to design a novel approach to investigating bigdata for value chain analysis but to show the value and limitations of data-based approaches, compared

Sustainability 2018, 10, 709 16 of 21
to expert-based approaches. Nonetheless, the value of big data analytics can increase dramaticallyby adding more data sources and applying more advanced data-mining algorithms. For example,this study used only a national database owing to the data accessibility, whereas a combination ofnational and international databases (i.e., the use of overseas transactions) will improve the resultssignificantly. Similarly, an algorithm can be elaborated. The SIC codes play an important role inidentifying items of a value chain. However, a single company may have several business areas andcorrespondingly several SIC codes. In our database, each company has only one SIC code, which bestdescribes its main business area. This information is provided by a company, updated every year, andthus, is relatively accurate. Nevertheless, an algorithm to consider companies in several areas is worthdeveloping by assigning several SICs to one company.
Indeed, the final goal for data-driven approaches should be to develop an algorithm that can createthe best value chain without expert intervention. This can be a challenge of data-driven approach;for a more truly data-driven approach, several parameters that were given by experts in this studyshould be determined by learning from the data; acquiring the right set of data to be trained isprerequisite for a more truly data-driven approach. Thanks to the rapid advances in data analysistechniques, the algorithm for developing a value chain is expected to be elaborated by applying moreautomatic approaches (e.g., abnormality detection) or conducting a bigger experiment; groups that arecommon to all businesses (e.g., furniture, or office supplies) are captured to be excluded from the mainvalue chain. Future research will address these issues.
Acknowledgments: This work was supported by the Ajou University research fund. We appreciate KED andKISTI (Korea Institute of Science and Technology Information) for their support in our data collection.
Author Contributions: Kyungtae Kim and Sungjoo Lee conceived and designed the experiments; Kyungtae Kimanalyzed the data; Sungjoo Lee contributed analysis tools and wrote the paper.
Conflicts of Interest: The authors declare no conflict of interest.
Appendix A. Value Chain Analysis for LED
Appendix A.1. Expert-Driven Value Chain Development
Similar to the case of photovoltaic systems, two types of expert-driven value chain maps wereacquired for LED: one from the “2012 knowledge map on green technology” published by the Ministryof Education, Science and Technology (MEST) in Korea to support small- and medium-sized enterprises(see Figure A1), and the other map from an expert who was requested to construct it (see Figure A2).
Sustainability 2018, 10, x FOR PEER REVIEW 16 of 21
dramatically by adding more data sources and applying more advanced data-mining algorithms. For example, this study used only a national database owing to the data accessibility, whereas a combination of national and international databases (i.e., the use of overseas transactions) will improve the results significantly. Similarly, an algorithm can be elaborated. The SIC codes play an important role in identifying items of a value chain. However, a single company may have several business areas and correspondingly several SIC codes. In our database, each company has only one SIC code, which best describes its main business area. This information is provided by a company, updated every year, and thus, is relatively accurate. Nevertheless, an algorithm to consider companies in several areas is worth developing by assigning several SICs to one company.
Indeed, the final goal for data-driven approaches should be to develop an algorithm that can create the best value chain without expert intervention. This can be a challenge of data-driven approach; for a more truly data-driven approach, several parameters that were given by experts in this study should be determined by learning from the data; acquiring the right set of data to be trained is prerequisite for a more truly data-driven approach. Thanks to the rapid advances in data analysis techniques, the algorithm for developing a value chain is expected to be elaborated by applying more automatic approaches (e.g., abnormality detection) or conducting a bigger experiment; groups that are common to all businesses (e.g., furniture, or office supplies) are captured to be excluded from the main value chain. Future research will address these issues.
Acknowledgments: This work was supported by the Ajou University research fund. We appreciate KED and KISTI (Korea Institute of Science and Technology Information) for their support in our data collection.
Author Contributions: Kyungtae Kim and Sungjoo Lee conceived and designed the experiments; Kyungtae Kim analyzed the data; Sungjoo Lee contributed analysis tools and wrote the paper.
Conflicts of Interest: The authors declare no conflict of interest.
Appendix A. Value Chain Analysis for LED
Appendix A.1. Expert-Driven Value Chain Development
Similar to the case of photovoltaic systems, two types of expert-driven value chain maps were acquired for LED: one from the “2012 knowledge map on green technology” published by the Ministry of Education, Science and Technology (MEST) in Korea to support small- and medium-sized enterprises (see Figure A1), and the other map from an expert who was requested to construct it (see Figure A2).
Figure A1. Expert-driven value chain analysis—public domain (MEST, 2012).
Figure A2. Expert-driven value chain analysis—private request.
Appendix A.2. Data-Driven Value Chain Development
Setting two representative LED applications, namely LED lighting and Back Light Unit, as first-level items, the companies producing these two applications were identified. Then the companies
Figure A1. Expert-driven value chain analysis—public domain (MEST, 2012).
Sustainability 2018, 10, x FOR PEER REVIEW 16 of 21
dramatically by adding more data sources and applying more advanced data-mining algorithms. For example, this study used only a national database owing to the data accessibility, whereas a combination of national and international databases (i.e., the use of overseas transactions) will improve the results significantly. Similarly, an algorithm can be elaborated. The SIC codes play an important role in identifying items of a value chain. However, a single company may have several business areas and correspondingly several SIC codes. In our database, each company has only one SIC code, which best describes its main business area. This information is provided by a company, updated every year, and thus, is relatively accurate. Nevertheless, an algorithm to consider companies in several areas is worth developing by assigning several SICs to one company.
Indeed, the final goal for data-driven approaches should be to develop an algorithm that can create the best value chain without expert intervention. This can be a challenge of data-driven approach; for a more truly data-driven approach, several parameters that were given by experts in this study should be determined by learning from the data; acquiring the right set of data to be trained is prerequisite for a more truly data-driven approach. Thanks to the rapid advances in data analysis techniques, the algorithm for developing a value chain is expected to be elaborated by applying more automatic approaches (e.g., abnormality detection) or conducting a bigger experiment; groups that are common to all businesses (e.g., furniture, or office supplies) are captured to be excluded from the main value chain. Future research will address these issues.
Acknowledgments: This work was supported by the Ajou University research fund. We appreciate KED and KISTI (Korea Institute of Science and Technology Information) for their support in our data collection.
Author Contributions: Kyungtae Kim and Sungjoo Lee conceived and designed the experiments; Kyungtae Kim analyzed the data; Sungjoo Lee contributed analysis tools and wrote the paper.
Conflicts of Interest: The authors declare no conflict of interest.
Appendix A. Value Chain Analysis for LED
Appendix A.1. Expert-Driven Value Chain Development
Similar to the case of photovoltaic systems, two types of expert-driven value chain maps were acquired for LED: one from the “2012 knowledge map on green technology” published by the Ministry of Education, Science and Technology (MEST) in Korea to support small- and medium-sized enterprises (see Figure A1), and the other map from an expert who was requested to construct it (see Figure A2).
Figure A1. Expert-driven value chain analysis—public domain (MEST, 2012).
Figure A2. Expert-driven value chain analysis—private request.
Appendix A.2. Data-Driven Value Chain Development
Setting two representative LED applications, namely LED lighting and Back Light Unit, as first-level items, the companies producing these two applications were identified. Then the companies
Figure A2. Expert-driven value chain analysis—private request.
Appendix A.2. Data-Driven Value Chain Development
Setting two representative LED applications, namely LED lighting and Back Light Unit, asfirst-level items, the companies producing these two applications were identified. Then the companies

Sustainability 2018, 10, 709 17 of 21
selling products or services to the first-level companies were retrieved to define the second-level items.A total of 12 SIC codes (3 alphanumeric characters) were found as indicated in Table A1. The cut-offvalue was 7.5 (5% of total frequency of 150); thus, six codes (C26, C29, C23, C30, C27, and J58) wereregarded as key items, among which, the main product and service items could be identified as“Package” only for two codes (C26 with a ratio of 82% and C29 with a ratio of 77%).
Table A1. Value chain analysis results: second-level SIC codes for LED.
SIC Codes Industry Title Frequency
C26 Manufacture of electronic components, computer, radio, television andcommunication equipment and apparatuses 30
C29 Manufacture of other machinery and equipment 27C23 Manufacture of non-metallic mineral products 25C30 Manufacture of motor vehicles, trailers, and semitrailers 18C27 Manufacture of medical, precision, and optical instruments, watches and clocks 13J58 Publishing activities 12C24 Manufacture of basic metal products 7C22 Manufacture of rubber and plastic products 6J62 Computer programming, consultancy, and related activities 5C33 Other manufacturing 3
C20 Manufacture of chemicals and chemical products except pharmaceuticals andmedicinal chemicals 2
F41 General construction 2
In the same way, the third-level SIC codes were extracted (see Table A2). The top seven items (C26,C28, C46, C30, C20, C27, and C29) had frequencies greater than the cut-off value, while Epitaxial wafer,LED chip, and Phosphor were found to be the main items produced by the third-level companies.
Table A2. Value chain analysis results: third-level SIC codes for LED.
SIC Codes Industry Title Frequency
C26 Manufacture of electronic components, computer, radio, television andcommunication equipment and apparatuses 35
C28 Manufacture of electrical equipment 31G46 Wholesale trade and commission trade, except of motor vehicles and motorcycles 26C30 Manufacture of Motor Vehicles, Trailers and Semitrailers 25
C20 Manufacture of chemicals and chemical products except pharmaceuticals andmedicinal chemicals 25
C27 Manufacture of Medical, Precision and Optical Instruments, Watches and Clocks 18C29 Manufacture of Other Machinery and Equipment 15C24 Manufacture of Basic Metal Products 10C25 Manufacture of Fabricated Metal Products, Except Machinery and Furniture 8C22 Manufacture of Rubber and Plastic Products 4M72 Architectural, Engineering and Other Scientific Technical Services 4G45 Sales of automobiles and parts 3C18 Printing and Reproduction of Recorded Media 3C32 Manufacture of Furniture 2C33 Manufacture of other products 2C31 Manufacture of other transportation equipment 2
The analysis results at the fourth level indicated that nine codes (C26, C20, C22, C24, G46, C25,C23, J62, and C29) were found to be the main ones (see Table A3) corresponding to six items includingSapphire, Silicon Carbide (SiC) substrate, Gallium nitride (GaN) ingot, Aluminum nitride (AIN) ingot,Wafer mounter, Indium gallium nitride (InGan) ingot, and Dispenser machine.
The final value chain map based on the data-driven approach is presented in Figure A3.

Sustainability 2018, 10, 709 18 of 21
Table A3. Value chain analysis results: fourth-level SIC codes for LED.
SIC Codes Industry Title (Three Digits) Frequency
C26 Manufacture of electronic components, computer, radio, television andcommunication equipment and apparatuses 45
C20 Manufacture of chemicals and chemical products except pharmaceuticals andmedicinal chemicals 37
C22 Manufacture of rubber and plastic products 30C24 Manufacture of basic metal products 30G46 Wholesale trade and commission trade, except of motor vehicles and motorcycles 26C25 Manufacture of fabricated metal products, except machinery and furniture 25C23 Manufacture of other non-metallic mineral products 24J62 Computer programming, consultancy, and related activities 20C29 Manufacture of other machinery and equipment 18F42 Special trade construction 10C28 Manufacture of electrical equipment 5C25 Manufacture of fabricated metal products, except machinery and furniture 5G45 Sales of automobiles and parts 4C15 Manufacture of leather, bags, and footwear 3C32 Manufacture of furniture 3
Sustainability 2018, 10, x FOR PEER REVIEW 18 of 21
Table A3. Value chain analysis results: fourth-level SIC codes for LED.
SIC Codes Industry Title (Three Digits) Frequency
C26 Manufacture of electronic components, computer, radio, television and communication equipment and apparatuses
45
C20 Manufacture of chemicals and chemical products except pharmaceuticals and medicinal chemicals
37
C22 Manufacture of rubber and plastic products 30 C24 Manufacture of basic metal products 30 G46 Wholesale trade and commission trade, except of motor vehicles and motorcycles 26 C25 Manufacture of fabricated metal products, except machinery and furniture 25 C23 Manufacture of other non-metallic mineral products 24 J62 Computer programming, consultancy, and related activities 20 C29 Manufacture of other machinery and equipment 18 F42 Special trade construction 10 C28 Manufacture of electrical equipment 5 C25 Manufacture of fabricated metal products, except machinery and furniture 5 G45 Sales of automobiles and parts 4 C15 Manufacture of leather, bags, and footwear 3 C32 Manufacture of furniture 3
Figure A3. Data-driven value chain analysis.
Appendix A.3. Big Data Analytics vs. Expert Insights
The items that were not found from the expert-based approach were generated from the data-driven approach, such as Dispenser machine, Wafer mounter, InGan ingot, and Phosphor. The data-driven approach seemed to reflect the real business transactions but still required some manual works. On the other hand, the expert-driven approach is more customizable and less time-consuming, similar to the observations from the case of photovoltaic systems.
Figure A3. Data-driven value chain analysis.
Appendix A.3. Big Data Analytics vs. Expert Insights
The items that were not found from the expert-based approach were generated from thedata-driven approach, such as Dispenser machine, Wafer mounter, InGan ingot, and Phosphor.The data-driven approach seemed to reflect the real business transactions but still required somemanual works. On the other hand, the expert-driven approach is more customizable and lesstime-consuming, similar to the observations from the case of photovoltaic systems.

Sustainability 2018, 10, 709 19 of 21Sustainability 2018, 10, x FOR PEER REVIEW 19 of 21
Figure A4. Integrated value chain analysis.
Appendix B
Table A4. Value chain analysis result: third-level SIC codes.
SIC Codes Industry Title FrequencyG46 Wholesale trade and commission trade, except of motor vehicles and motorcycles 51 F42 Special trade construction 21
C26 Manufacture of electronic components, computer, radio, television and communication equipment and apparatuses
15
C22 Manufacture of rubber and plastic products 14 C28 Manufacture of electrical equipment 13 G47 Retail trade, except motor vehicles and motorcycles 13 C29 Manufacture of other machinery and equipment 12 F41 General construction 11 C25 Manufacture of fabricated metal products, except machinery and furniture 11 C27 Manufacture of medical, precision, and optical Instruments, watches and clocks 5 M72 Architectural, engineering, and other scientific technical services 5
C20 Manufacture of chemicals and chemical products except pharmaceuticals and medicinal chemicals
4
C23 Manufacture of other non-metallic mineral products 4 E38 Waste collection, disposal, and materials recovery 4 C10 Manufacture of food products 3 C14 Manufacture of wearing apparel, clothing accessories and fur articles 3 C16 Manufacture of wood and of products of wood and cork; except furniture 3 C31 Manufacture of other transport equipment 3 J58 Publishing activities 3 C13 Manufacture of textiles, except apparel 2 C30 Manufacture of motor vehicles, trailers, and semitrailers 2 C33 Other manufacturing 2 A02 Forestry 1 C18 Printing and reproduction of recorded media 1 C24 Manufacture of basic metal products 1 D35 Electricity, gas, steam, and air conditioning supply 1 N74 Business facilities management and landscape services 1
Figure A4. Integrated value chain analysis.
Appendix B
Table A4. Value chain analysis result: third-level SIC codes.
SIC Codes Industry Title Frequency
G46 Wholesale trade and commission trade, except of motor vehicles and motorcycles 51F42 Special trade construction 21
C26 Manufacture of electronic components, computer, radio, television andcommunication equipment and apparatuses 15
C22 Manufacture of rubber and plastic products 14C28 Manufacture of electrical equipment 13G47 Retail trade, except motor vehicles and motorcycles 13C29 Manufacture of other machinery and equipment 12F41 General construction 11C25 Manufacture of fabricated metal products, except machinery and furniture 11C27 Manufacture of medical, precision, and optical Instruments, watches and clocks 5M72 Architectural, engineering, and other scientific technical services 5
C20 Manufacture of chemicals and chemical products except pharmaceuticals andmedicinal chemicals 4
C23 Manufacture of other non-metallic mineral products 4E38 Waste collection, disposal, and materials recovery 4C10 Manufacture of food products 3C14 Manufacture of wearing apparel, clothing accessories and fur articles 3C16 Manufacture of wood and of products of wood and cork; except furniture 3C31 Manufacture of other transport equipment 3J58 Publishing activities 3C13 Manufacture of textiles, except apparel 2C30 Manufacture of motor vehicles, trailers, and semitrailers 2C33 Other manufacturing 2A02 Forestry 1C18 Printing and reproduction of recorded media 1C24 Manufacture of basic metal products 1D35 Electricity, gas, steam, and air conditioning supply 1N74 Business facilities management and landscape services 1

Sustainability 2018, 10, 709 20 of 21
Table A5. Value chain analysis result: third-level items.
SIC Codes Industry Title Main Product and Service Items Ratio
G46 Wholesale trade and commission trade, exceptof motor vehicles and motorcycles
Various items including monitor,printer, furniture, and others -
F42 Special trade construction Various service items including electricwork, painting, and others -
C26Manufacture of electronic components,computer, radio, television and communicationequipment and apparatuses
Transformer 82
LED 79
C22 Manufacture of rubber and plastic products Back sheet 81
C28 Manufacture of electrical equipment Semiconductor/automation equipment 70
C25Manufacture of fabricated metal products,except machinery and furniture
Wafer 78
Ribbon 71
G47 Retail trade, except motor vehiclesand motorcycles
Various items including pen, stapler,portable storage device, and others -
C29 Manufacture of other machineryand equipment Network infrastructure equipment 76
F41 General construction Construction service -
References
1. Provost, F.; Fawcett, T. Data science and its relationship to big data and data-driven decision making. Big Data2013, 1, 51–59. [CrossRef] [PubMed]
2. Data, I.B. IBM-Bringing Big Data to the Enterprise. 2015. Available online: http://www-01.ibm.com/software/data/bigdata (accessed on 26 February 2018).
3. Maltby, D. Big data analytics. In Proceedings of the 74th Annual Meeting of the Association for InformationScience and Technology (ASIST), New Orleans, LA, USA, 9–12 October 2011; pp. 1–6.
4. Cardenas, A.A.; Manadhata, P.K.; Rajan, S.P. Big data analytics for security. IEEE Secur. Priv. 2013, 11, 74–76.[CrossRef]
5. Liu, W.K.; Yen, C.C. Optimizing Bus Passenger Complaint Service through Big Data Analysis: SystematizedAnalysis for Improved Public Sector Management. Sustainability 2016, 8, 1319. [CrossRef]
6. Chui, K.T.; Alhalabi, W.; Pang, S.S.H.; Pablos, P.O.D.; Liu, R.W.; Zhao, M. Disease Diagnosis in SmartHealthcare: Innovation, Technologies and Applications. Sustainability 2017, 9, 2309. [CrossRef]
7. Kim, G.H.; Trimi, S.; Chung, J.H. Big-data applications in the government sector. Commun. ACM 2014,57, 78–85. [CrossRef]
8. Jee, K.; Kim, G.H. Potentiality of big data in the medical sector: Focus on how to reshape the healthcaresystem. Healthc. Inform. Res. 2013, 19, 79–85. [CrossRef] [PubMed]
9. Ernst, H. Patent information for strategic technology management. World Patent Inf. 2003, 25, 233–242. [CrossRef]10. Porter, M.E. Competitive Strategy: Techniques for Analyzing Industries and Competitors; Simon and Schuster:
New York, NY, USA, 2008.11. Porter, M.E. Competitive Advantage: Creating and Sustaining Superior Performance; Free Press: New York, NY,
USA, 1985.12. Peppard, J.; Rylander, A. From value chain to value network: Insights for mobile operators. Eur. Manag. J.
2006, 24, 128–141. [CrossRef]13. Mowery, D.C.; Macher, J.T. E-Business and the Semiconductor Industry Value Chain: Implications for Vertical
Specialization and Integrated Semiconductor Manufacturers; East West Center Working Paper: Economic Series;East-West Center: Honolulu, HI, USA, 2001; Volume 17.
14. Fan, W.; Bifet, A. Mining big data: Current status, and forecast to the future. ACM sIGKDD Explor. Newsl.2013, 14, 1–5. [CrossRef]
15. Sagiroglu, S.; Sinanc, D. Big data: A review. In Proceedings of the 2013 International Conference onCollaboration Technologies and Systems (CTS), San Diego, CA, USA, 20–24 May 2013; pp. 42–47.

Sustainability 2018, 10, 709 21 of 21
16. Zakir, J.; Seymour, T.; Berg, K. Big data analytics. Issues Inform. Syst. 2015, 16, 81–90.17. LaValle, S.; Lesser, E.; Shockley, R.; Hopkins, M.S.; Kruschwitz, N. Big data, analytics and the path from
insights to value. MIT Sloan Manag. Rev. 2011, 52, 21.18. Kim, J.; Lee, S. Patent databases for innovation studies: A comparative analysis of USPTO, EPO, JPO and
KIPO. Technol. Forecast. Soc. Chang. 2015, 92, 332–345. [CrossRef]19. Daim, T.U.; Rueda, G.; Martin, H.; Gerdsri, P. Forecasting emerging technologies: Use of bibliometrics and
patent analysis. Technol. Forecast. Soc. Chang. 2006, 73, 981–1012. [CrossRef]20. Lee, S.; Yoon, B.; Lee, C.; Park, J. Business planning based on technological capabilities: Patent analysis for
technology-driven roadmapping. Technol. Forecast. Soc. Chang. 2009, 76, 769–786. [CrossRef]21. Lee, S.; Lee, S.; Seol, H.; Park, Y. Using patent information for designing new product and technology:
Keyword based technology roadmapping. R&D Manag. 2008, 38, 169–188.22. Lee, S.; Yoon, B.; Park, Y. An approach to discovering new technology opportunities: Keyword-based patent
map approach. Technovation 2009, 29, 481–497. [CrossRef]23. Park, Y.; Lee, S.; Lee, S. Patent analysis for promoting technology transfer in multi-technology industries:
The Korean aerospace industry case. J. Technol. Transf. 2012, 37, 355–374. [CrossRef]24. Seol, H.; Lee, S.; Kim, C. Identifying new business areas using patent information: A DEA and text mining
approach. Expert Syst. Appl. 2011, 38, 2933–2941. [CrossRef]25. Shin, J.; Lee, S.; Wang, T. Semantic Patent Analysis System Based on Big Data. In Proceedings of the 2017
IEEE 11th International Conference on Semantic Computing (ICSC), San Diego, CA, USA, 30 January–1 February 2017; pp. 284–285.
26. Lee, M.; Lee, S. Identifying new business opportunities from competitor intelligence: An integrated use ofpatent and trademark databases. Technol. Forecast. Soc. Chang. 2017, 119, 170–183. [CrossRef]
27. Park, Y.; Lee, S. How to design and utilize online customer center to support new product concept generation.Expert Syst. Appl. 2011, 38, 10638–10647. [CrossRef]
28. Kim, J.; Lee, S.; Geum, Y.; Park, Y. Patterns of innovation in digital content services: The case of App Storeapplications. Innovation 2012, 14, 540–556. [CrossRef]
29. Kim, J.; Lee, S.; Park, Y. User-centric service map for identifying new service opportunities from potentialneeds: A case of App Store applications. Creat. Innov. Manag. 2013, 22, 241–264.
30. Kim, J.; Lee, S.; Park, Y. A visual context-based market analysis of mobile application services. Manag. Decis.2016, 54, 2106–2132. [CrossRef]
31. Choi, T.M.; Chan, H.K.; Yue, X. Recent development in big data analytics for business operations and riskmanagement. IEEE Trans. Cybern. 2017, 47, 81–92. [CrossRef] [PubMed]
32. Liu, G.R.; Mao, L.X.; Wang, L.L.; Zou, S. Automotive prospective technology mining method based on bigdata content analysis. In Proceedings of the 2017 IEEE 2nd International Conference on Cloud Computingand Big Data Analysis (ICCCBDA), Chengdu, China, 28–30 April 2017; pp. 171–174.
33. Sturgeon, T.J. How do we define value chains and production networks? IDS Bull. 2001, 32, 9–18. [CrossRef]34. Yan, L.; Wang, A. Based on material flow analysis: Value chain analysis of China iron resources. Renew. Sustain.
Energy Rev. 2014, 91, 52–61. [CrossRef]35. El-Sayed, A.F.M.; Dickson, M.W.; El-Naggar, G.O. Value chain analysis of the aquaculture feed sector in
Egypt. Aquaculture 2015, 437, 92–101.36. De Souza, C.D.R.; Márcio de Almeida, D.A. Value chain analysis applied to the scrap tire reverse logistics
chain: An applied study of co-processing in the cement industry. Renew. Sustain. Energy Rev. 2013, 78, 15–25.[CrossRef]
37. Irvine, R.M. A conceptual study of value chain analysis as a tool for assessing a veterinary surveillancesystem for poultry in Great Britain. Agric. Syst. 2015, 135, 143–158. [CrossRef]
38. Jussani, A.C.; Wright, J.T.C.; Ibusuki, U. Battery global value chain and its technological challenges forelectric vehicle mobility. Rev. Adm. Inov. 2017, 14, 333–338.
39. Devabhaktuni, V.; Alam, M.; Depuru, S.S.S.R.; Green, R.C.; Nims, D.; Near, C. Solar energy: Trends andenabling technologies. Renew. Sustain. Energy Rev. 2013, 19, 555–564. [CrossRef]
© 2018 by the authors. Licensee MDPI, Basel, Switzerland. This article is an open accessarticle distributed under the terms and conditions of the Creative Commons Attribution(CC BY) license (http://creativecommons.org/licenses/by/4.0/).