Household characteristics for older adults and study background from SAGE Ghana Wave 1
13
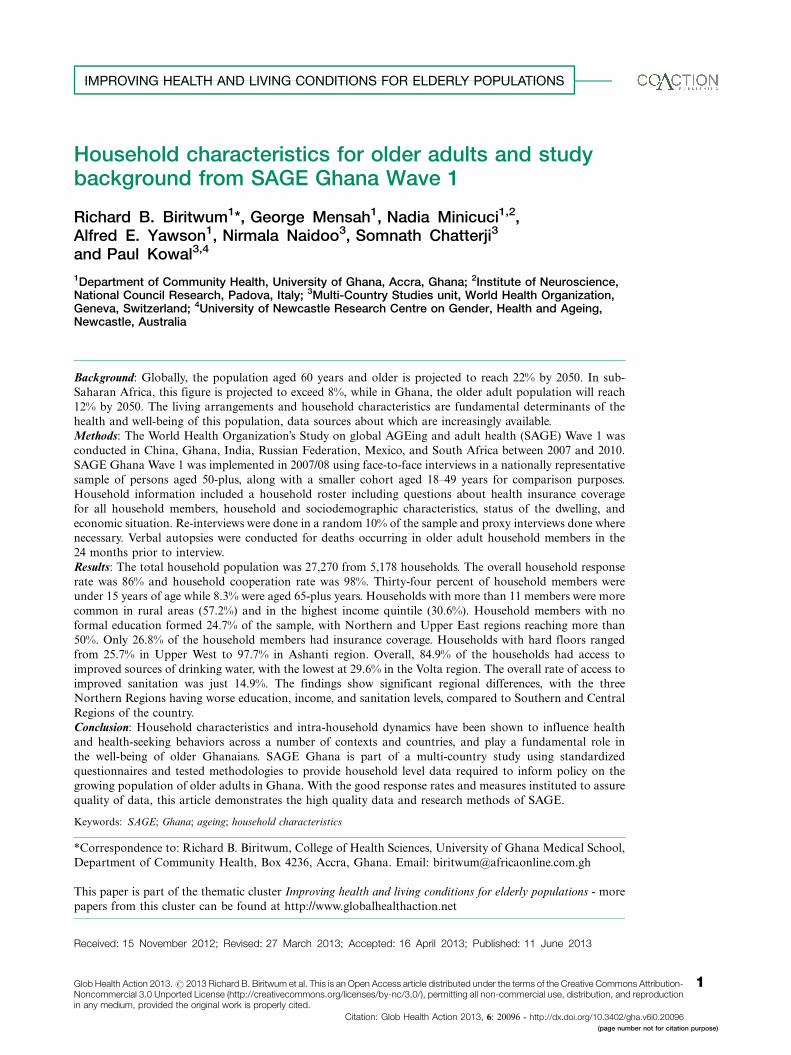
Household characteristics for older adults and study background from SAGE Ghana Wave 1 Richard B. Biritwum 1 *, George Mensah 1 , Nadia Minicuci 1,2 , Alfred E. Yawson 1 , Nirmala Naidoo 3 , Somnath Chatterji 3 and Paul Kowal 3,4 1 Department of Community Health, University of Ghana, Accra, Ghana; 2 Institute of Neuroscience, National Council Research, Padova, Italy; 3 Multi-Country Studies unit, World Health Organization, Geneva, Switzerland; 4 University of Newcastle Research Centre on Gender, Health and Ageing, Newcastle, Australia Background: Globally, the population aged 60 years and older is projected to reach 22% by 2050. In sub- Saharan Africa, this figure is projected to exceed 8%, while in Ghana, the older adult population will reach 12% by 2050. The living arrangements and household characteristics are fundamental determinants of the health andwell-being of this population, data sources about which are increasingly available. Methods: The World Health Organization’s Study on global AGEing and adult health (SAGE) Wave 1 was conducted in China, Ghana, India, Russian Federation, Mexico, and South Africa between 2007 and 2010. SAGE Ghana Wave 1 wasimplemented in 2007/08 using face-to-face interviews in a nationally representative sample of persons aged 50-plus, along with a smaller cohort aged 1849 years for comparison purposes. Household information included a household roster including questions about health insurance coverage for all household members, household and sociodemographic characteristics, status of the dwelling, and economic situation. Re-interviews were done in a random 10% of the sample and proxy interviews done where necessary. Verbal autopsies were conducted for deaths occurring in older adult household members in the 24 months prior to interview. Results: The total household population was 27,270 from 5,178 households. The overall household response rate was 86% and household cooperation rate was 98%. Thirty-four percent of household members were under 15 years of age while 8.3% were aged 65-plus years. Households with more than 11 members were more common in rural areas (57.2%) and in the highest income quintile (30.6%). Household members with no formal education formed 24.7% of the sample, with Northern and Upper East regions reaching more than 50%. Only 26.8% of the household members had insurance coverage. Households with hard floors ranged from 25.7% in Upper West to 97.7% in Ashanti region. Overall, 84.9% of the households had access to improved sources of drinking water, with the lowest at 29.6% in the Volta region. The overall rate of access to improved sanitation was just 14.9%. The findings show significant regional differences, with the three Northern Regions having worse education, income, and sanitation levels, compared to Southern and Central Regions of the country. Conclusion: Household characteristics and intra-household dynamics have been shown to influence health and health-seeking behaviors across a number of contexts and countries, and play a fundamental role in the well-being of older Ghanaians. SAGE Ghana is part of a multi-country study using standardized questionnaires and tested methodologies to provide household level data required to inform policy on the growing population of older adults in Ghana. With the good response rates and measures instituted to assure quality of data, this article demonstrates the high quality data and research methods of SAGE. Keywords: SAGE; Ghana; ageing; household characteristics *Correspondence to: Richard B. Biritwum, College of Health Sciences, University of Ghana Medical School, Department of Community Health, Box 4236, Accra, Ghana. Email: [email protected] This paper is part of the thematic cluster Improving health and living conditions for elderly populations - more papers from this cluster can be found at http://www.globalhealthaction.net Received: 15 November 2012; Revised: 27 March 2013; Accepted: 16 April 2013; Published: 11 June 2013 (page number not for citation purpose) æ IMPROVING HEALTH AND LIVING CONDITIONS FOR ELDERLY POPULATIONS Glob Health Action 2013. # 2013 Richard B. Biritwum et al. This is an Open Access article distributed under the terms of the Creative Commons Attribution- Noncommercial 3.0 Unported License (http://creativecommons.org/licenses/by-nc/3.0/), permitting all non-commercial use, distribution, and reproduction in any medium, provided the original work is properly cited. 1 Citation: Glob Health Action 2013, 6: 20096 - http://dx.doi.org/10.3402/gha.v6i0.20096
-
Upload
newcastle-au -
Category
Documents
-
view
1 -
download
0
Transcript of Household characteristics for older adults and study background from SAGE Ghana Wave 1
Household characteristics for older adults and studybackground from SAGE Ghana Wave 1
Richard B. Biritwum1*, George Mensah1, Nadia Minicuci1,2,Alfred E. Yawson1, Nirmala Naidoo3, Somnath Chatterji3
and Paul Kowal3,4
1Department of Community Health, University of Ghana, Accra, Ghana; 2Institute of Neuroscience,National Council Research, Padova, Italy; 3Multi-Country Studies unit, World Health Organization,Geneva, Switzerland; 4University of Newcastle Research Centre on Gender, Health and Ageing,Newcastle, Australia
Background: Globally, the population aged 60 years and older is projected to reach 22% by 2050. In sub-
Saharan Africa, this figure is projected to exceed 8%, while in Ghana, the older adult population will reach
12% by 2050. The living arrangements and household characteristics are fundamental determinants of the
health and well-being of this population, data sources about which are increasingly available.
Methods: The World Health Organization’s Study on global AGEing and adult health (SAGE) Wave 1 was
conducted in China, Ghana, India, Russian Federation, Mexico, and South Africa between 2007 and 2010.
SAGE Ghana Wave 1 was implemented in 2007/08 using face-to-face interviews in a nationally representative
sample of persons aged 50-plus, along with a smaller cohort aged 18�49 years for comparison purposes.
Household information included a household roster including questions about health insurance coverage
for all household members, household and sociodemographic characteristics, status of the dwelling, and
economic situation. Re-interviews were done in a random 10% of the sample and proxy interviews done where
necessary. Verbal autopsies were conducted for deaths occurring in older adult household members in the
24 months prior to interview.
Results: The total household population was 27,270 from 5,178 households. The overall household response
rate was 86% and household cooperation rate was 98%. Thirty-four percent of household members were
under 15 years of age while 8.3% were aged 65-plus years. Households with more than 11 members were more
common in rural areas (57.2%) and in the highest income quintile (30.6%). Household members with no
formal education formed 24.7% of the sample, with Northern and Upper East regions reaching more than
50%. Only 26.8% of the household members had insurance coverage. Households with hard floors ranged
from 25.7% in Upper West to 97.7% in Ashanti region. Overall, 84.9% of the households had access to
improved sources of drinking water, with the lowest at 29.6% in the Volta region. The overall rate of access to
improved sanitation was just 14.9%. The findings show significant regional differences, with the three
Northern Regions having worse education, income, and sanitation levels, compared to Southern and Central
Regions of the country.
Conclusion: Household characteristics and intra-household dynamics have been shown to influence health
and health-seeking behaviors across a number of contexts and countries, and play a fundamental role in
the well-being of older Ghanaians. SAGE Ghana is part of a multi-country study using standardized
questionnaires and tested methodologies to provide household level data required to inform policy on the
growing population of older adults in Ghana. With the good response rates and measures instituted to assure
quality of data, this article demonstrates the high quality data and research methods of SAGE.
Keywords: SAGE; Ghana; ageing; household characteristics
*Correspondence to: Richard B. Biritwum, College of Health Sciences, University of Ghana Medical School,
Department of Community Health, Box 4236, Accra, Ghana. Email: [email protected]
This paper is part of the thematic cluster Improving health and living conditions for elderly populations - more
papers from this cluster can be found at http://www.globalhealthaction.net
Received: 15 November 2012; Revised: 27 March 2013; Accepted: 16 April 2013; Published: 11 June 2013
(page number not for citation purpose)
�IMPROVING HEALTH AND LIVING CONDITIONS FOR ELDERLY POPULATIONS
Glob Health Action 2013. # 2013 Richard B. Biritwum et al. This is an Open Access article distributed under the terms of the Creative Commons Attribution-Noncommercial 3.0 Unported License (http://creativecommons.org/licenses/by-nc/3.0/), permitting all non-commercial use, distribution, and reproductionin any medium, provided the original work is properly cited.
1
Citation: Glob Health Action 2013, 6: 20096 - http://dx.doi.org/10.3402/gha.v6i0.20096
Globally, declining fertility and mortality rates are
contributing to a more rapid increase in older
populations both in relative and absolute terms.
The older adult population has increased steadily since
1950 in all the regions of the world, including Ghana
where the population aged 60 years and older (60-plus) in
1950 was 4%, is currently about 6% and will reach 12%
by 2050 (1). The 2010 Global Burden of Disease provides
evidence of the changing trends in disease patterns
with significant increases in non-communicable disease
conditions amongst the general population and the older
population in Ghana, where a leading health risk is
household air pollution (2). Consequently, health policies
and health systems need information about the emerging
epidemiologic transition and its determinants in older
adults to inform strategies for responding to the needs
of this growing segment of the population. Households
comprised solely of older persons, or multigenerational
households including older household members, will
rely on timely responses by social, financial and health
systems to ensure the continued contributions made by
older persons to families and communities (3�5).
Little information exists in Ghana regarding the
situation of older people. The lack of data means that
ageing is poorly understood and as a result, resources are
not allocated to meet the needs of the older population.
The 2000 National Population Census in Ghana and
2008 Ghana Demographic and Health Survey projected
estimates of around 7% for the national proportion of the
population aged 60-plus years in 2010 � as compared
to 7.4% calculated from the 2010 National Population
Census (6�8). In all 10 Administrative regions of Ghana,
the trends in the proportion of the older population since
the 2000 National Population Census have been increas-
ing, with minor regional differences (8). Older Ghanaian
women continue to face challenges with respect to abuse
of property rights, while older Ghanaian men without a
family are often more vulnerable than women.
The issue of lack of data about the growing popula-
tion of older adults has been identified by several
countries, including Ghana (9). In collaboration with
the World Health Organization and support from the
United States National Institute on Aging, Ghana has
begun to strengthen its evidence base to inform policy
through the Study on global AGEing and adult health
(SAGE) (10). The national policy goal is to provide a
framework that is capable of transforming and improv-
ing the lives of older persons in Ghanaian society (11).
The vision is to achieve the overall social, economic,
and cultural re-integration of older persons into main-
stream society, and to enable them to participate fully
in the national development process and to promote
active ageing with adequate security and dignity. All
these areas form the basis for the present study.
Materials and methodsThe 2007/08 SAGE Wave 1 in Ghana built on the 2003/04
World Health Survey (WHS), referred to as SAGE
Wave 0 (12). The SAGE Wave 1 included follow-up
respondents taken from Wave 0, and added new respon-
dents to increase the cohort size for future waves. SAGE
Wave 1 collected household data primarily on persons
aged 50-plus years, plus a smaller cohort of adults aged
18 to 49 years for comparison purposes.
Sampling designGhana used a stratified, multistage cluster design to select
251 EAs. The sample was stratified by administrative
region (Ashanti, Brong Ahafo, Central, Eastern, Greater
Accra, Northern, Upper East, Upper West, Volta, and
Western) and type of locality (urban/rural) resulting in
20 strata and is nationally representative. The Census
Enumerated Areas (CEA) of the 2000 Population and
Housing Census was used as the sampling frame, and
updated in 2007 through household listings/enumerations
prior to interview. A sample of 251 EAs was selected as
the primary sampling units (PSU). The PSUs correspond
to the Ghana census enumeration areas (EAs) with well-
defined boundaries, identified on maps, relatively small
sized clusters that facilitated manageable interviewer
workload. The number of EAs to be selected from each
strata was based on proportional allocation (determined
by the number of EAs in each strata specified on the
census frame). EAs were then selected from each stratum
with probability proportional to size; the measure of size
being the number of individuals aged 50-plus years in
the EA.
In each selected EA, a listing of the households was
conducted to classify each household into the following
mutually exclusive categories:
(1) SAGE Wave 0 follow-up households with one or
more members aged 50-plus years;
(2) New households with one or more members aged
50-plus years;
(3) SAGE Wave 0 follow-up households which did
not include any members aged 50-plus years, but
included residents aged 18�49; and
(4) New households which did not include any mem-
bers aged 50-plus years, but included residents aged
18�49.
Twenty-four households were targeted from each selected
EA. All SAGE Wave 0 follow-up 50-plus households were
eligible for the household interview. Twenty such house-
holds were needed and if this target number was not
reached, then the balance was selected using systematic
sampling from the new 50-plus households. All 50-plus
members of the household were eligible for the individual
Richard B. Biritwum et al.
2(page number not for citation purpose)
Citation: Glob Health Action 2013, 6: 20096 - http://dx.doi.org/10.3402/gha.v6i0.20096

interview (multiple individual interviews possible in
these households).
For SAGE Wave 1, target sample sizes were 5,000
respondents aged 50-plus and 1,000 respondents aged
18�49 years old; since within each PSUs 20 households
with one or more individual aged 50-plus and four
households with members aged 18�49 to be selected,
250 PSUs were used.
Geodata
The GPS data were taken in front of respondents’
houses and a minimum of five satellites were required
for readings to be accepted as accurate. It is planned
that the GPS data will be used for future analysis (for
example, mapping distance to health care facilities,
finding respondents for the next rounds of data collec-
tion, and/or finding respondents for validation studies/
sub-studies) (Fig. 1).
QuestionnairesSix types of questionnaires were used in the SAGE
study. One household informant was identified to
complete the household questionnaire, and could
also be selected as the individual respondent for inter-
view using the individual questionnaire. All persons
aged 50-plus in older households were invited to par-
ticipate, whereas only one person was randomly selected
in younger households for the individual interview.
Where there was a death recorded within the 2 years
prior to interview for a follow-up household, a verbal
autopsy questionnaire was completed. If a selected res-
pondent was found to be incapable of answering the
individual questionnaire, a proxy respondent was identi-
fied and a proxy questionnaire completed. As part of
the quality control measures, two respondents within
each PSU were to be randomly selected for re-test and
one for proxy validation � as part of the quality control
process. In all, each PSU was to have 20 completed
interviews for 50-plus respondents (household and indi-
vidual), four interviews for the 18�49 year old respon-
dents, two re-test questionnaires, one proxy validation
questionnaire and verbal autopsy questionnaires where
applicable.
Fig. 1. Distribution of Eas for SAGE Ghana Wave 1.
Household characteristics for older adults in Ghana
Citation: Glob Health Action 2013, 6: 20096 - http://dx.doi.org/10.3402/gha.v6i0.20096 3(page number not for citation purpose)

The domains covered in the questionnaires are as
follows (see also, Appendix 1):
Household questionnaire: 1) Contact record, sam-
pling, GPS, re-contact information; 2) household
roster including health insurance coverage of house-
hold members; 3) housing; 4) household and family
support/transfers; 5) assets and household income;
and 6) overall consumption and health expenditures.
Individual questionnaire: 1) Sociodemographic char-
acteristics; 2) work history and benefits; 3) health
state descriptions and disability; 4) anthropometrics,
biomarkers, and performance tests; 5) risk factors
and preventive health behaviors; 6) chronic condi-
tions and health services coverage; 7) health care
utilization and health system responsiveness; 8)
social cohesion; 9) subjective well-being and quality
of life; and 10) impact of caregiving.
Verbal autopsy: 1) Health and well-being of the
deceased person(s); and 2) events leading to death.
Re-test (Household): 1) Household and family net-
works and transfers; 2) assets and household
income; and 3) household expenditure.
Re-test (Individual): 1) Health state descriptions;
2) anthropometrics, performance tests and biomar-
kers; and 3) health care utilization.
Proxy and validation: 1) Respondent characteristics;
2) health state descriptions; 3) chronic conditions
and health service coverage; and 4) health care
utilization.
ImplementationA total of 30 interviewers (experienced census officers
from Ghana Statistical Service) and supervisors (princi-
pal and senior research assistants from the Department
of Community Health, University of Ghana Medical
School) were trained in two phases. Initially, the full
survey team was trained for 10 days with support from
WHO Geneva in Accra, then were divided into three
teams and assigned to three survey sites (one for the three
northern Regions, another for Regions in the middle
belt and the other for the Regions in the south). Further
training and refreshing of these interviewers was done
before the start of field work. The interviews were
conducted using interviewer administered questionnaire
by face to face contact. Three re-contact visits were to be
made before respondents were classified as unable to
locate.
Variables for analysisHousehold and individual response rates were generated
using by assessing adding the total completed and
partially completed interviews and dividing by the
number of eligible households or individuals. Informa-
tion about household members (relationship to house-
hold head, age, sex, education, marital status, and health
insurance coverage) and composition, dwelling charac-
teristics (type of floors, walls and cooking stove; access
to water, sanitation and cooking fuel), income and
consumption were used for analyses. Improved water
and sanitation provide a crucial health function. Im-
proved water is defined as water piped into the household
or yard/plot, a public standpipe, borehole, protected
dug well, protected spring, rainwater collection, and
bottled water. Unimproved sources include an unpro-
tected dug well, unprotected spring, surface water and
tanker truck supplies. Improved sanitation includes
connection to septic system, pour-flush latrine, and
private covered dry latrine. Unimproved sanitation facil-
ities include uncovered dry latrine (without privacy),
bucket latrine and no facilities (open defecation). Single
and multiple generations within households were based
on relationship to the household head.
Wealth or income quintiles were derived from the
household ownership of durable goods, dwelling char-
acteristics and access to services (improved water, sanita-
tion, and cooking fuel) for a total of 21 assets (12).
A two-step random effect probit model was used to
generate the quintiles. An asset ladder was first generated
based on the endorsement rate of the different assets.
This ladder was then used to arrange household on the
same scale, based on their asset ownership. The result is
a continuous income score, from which quintiles are
created.
Statistical analysisThe comparison between categorical variables was per-
formed through the Chi-square test, while for the mean
comparison across groups the General Linear Model
procedure was used, prior checking the homoscedasticity
assumption. All analyses were performed using SAS
version 9.2.
Weights
Data on strata sizes and household sizes for selected
enumeration areas were obtained and used to calculate
weights for the selected households and individual respon-
dents. Household weights were based on the selection
probability at each stage of selection, and were post-
stratified by region and locality according to the 2010
household projections provided by Ghana Statistical
Service (8). Post-stratification weights were based on the
2010 National Population and Housing Census. All results
in this article are weighted. A link to additional informa-
tion about SAGE is at www.who.int/healthinfo/sage/en.
Results
Response rateThe response rate in general was very high. The range
for the households was between 97.1 and 100% (Table 1).
For the individual, the response rates ranged between
92.1% for women and 97.0% for men. The overall
response rate for households was 97.7%, slightly lower
Richard B. Biritwum et al.
4(page number not for citation purpose)
Citation: Glob Health Action 2013, 6: 20096 - http://dx.doi.org/10.3402/gha.v6i0.20096
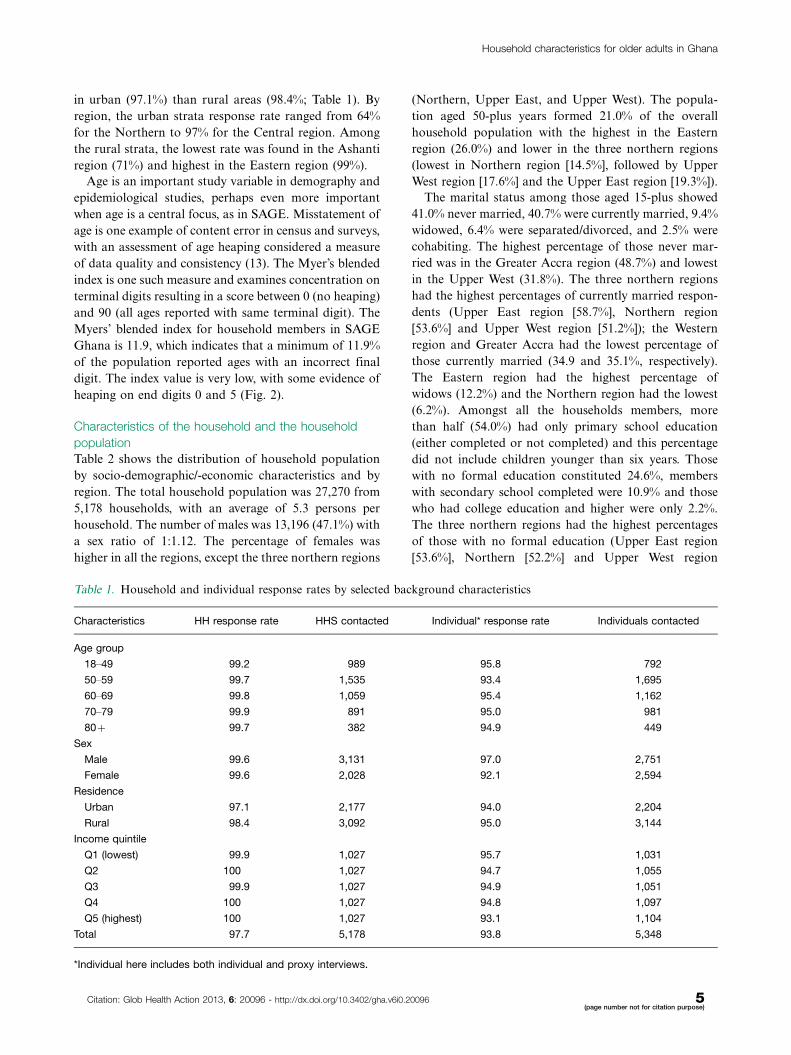
in urban (97.1%) than rural areas (98.4%; Table 1). By
region, the urban strata response rate ranged from 64%
for the Northern to 97% for the Central region. Among
the rural strata, the lowest rate was found in the Ashanti
region (71%) and highest in the Eastern region (99%).
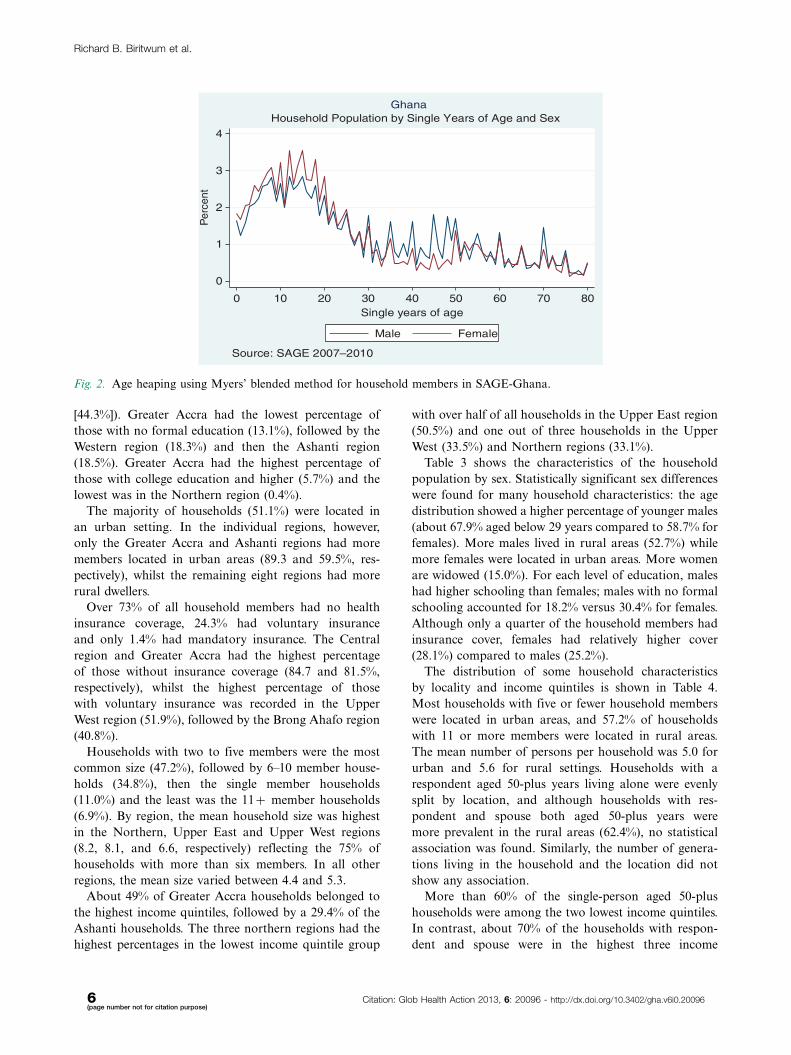
Age is an important study variable in demography and
epidemiological studies, perhaps even more important
when age is a central focus, as in SAGE. Misstatement of
age is one example of content error in census and surveys,
with an assessment of age heaping considered a measure
of data quality and consistency (13). The Myer’s blended
index is one such measure and examines concentration on
terminal digits resulting in a score between 0 (no heaping)
and 90 (all ages reported with same terminal digit). The
Myers’ blended index for household members in SAGE
Ghana is 11.9, which indicates that a minimum of 11.9%
of the population reported ages with an incorrect final
digit. The index value is very low, with some evidence of
heaping on end digits 0 and 5 (Fig. 2).
Characteristics of the household and the household
population
Table 2 shows the distribution of household population
by socio-demographic/-economic characteristics and by
region. The total household population was 27,270 from
5,178 households, with an average of 5.3 persons per
household. The number of males was 13,196 (47.1%) with
a sex ratio of 1:1.12. The percentage of females was
higher in all the regions, except the three northern regions
(Northern, Upper East, and Upper West). The popula-
tion aged 50-plus years formed 21.0% of the overall
household population with the highest in the Eastern
region (26.0%) and lower in the three northern regions
(lowest in Northern region [14.5%], followed by Upper
West region [17.6%] and the Upper East region [19.3%]).
The marital status among those aged 15-plus showed
41.0% never married, 40.7% were currently married, 9.4%
widowed, 6.4% were separated/divorced, and 2.5% were
cohabiting. The highest percentage of those never mar-
ried was in the Greater Accra region (48.7%) and lowest
in the Upper West (31.8%). The three northern regions
had the highest percentages of currently married respon-
dents (Upper East region [58.7%], Northern region
[53.6%] and Upper West region [51.2%]); the Western
region and Greater Accra had the lowest percentage of
those currently married (34.9 and 35.1%, respectively).
The Eastern region had the highest percentage of
widows (12.2%) and the Northern region had the lowest
(6.2%). Amongst all the households members, more
than half (54.0%) had only primary school education
(either completed or not completed) and this percentage
did not include children younger than six years. Those
with no formal education constituted 24.6%, members
with secondary school completed were 10.9% and those
who had college education and higher were only 2.2%.
The three northern regions had the highest percentages
of those with no formal education (Upper East region
[53.6%], Northern [52.2%] and Upper West region
Table 1. Household and individual response rates by selected background characteristics
Characteristics HH response rate HHS contacted Individual* response rate Individuals contacted
Age group
18�49 99.2 989 95.8 792
50�59 99.7 1,535 93.4 1,695
60�69 99.8 1,059 95.4 1,162
70�79 99.9 891 95.0 981
80� 99.7 382 94.9 449
Sex
Male 99.6 3,131 97.0 2,751
Female 99.6 2,028 92.1 2,594
Residence
Urban 97.1 2,177 94.0 2,204
Rural 98.4 3,092 95.0 3,144
Income quintile
Q1 (lowest) 99.9 1,027 95.7 1,031
Q2 100 1,027 94.7 1,055
Q3 99.9 1,027 94.9 1,051
Q4 100 1,027 94.8 1,097
Q5 (highest) 100 1,027 93.1 1,104
Total 97.7 5,178 93.8 5,348
*Individual here includes both individual and proxy interviews.
Household characteristics for older adults in Ghana
Citation: Glob Health Action 2013, 6: 20096 - http://dx.doi.org/10.3402/gha.v6i0.20096 5(page number not for citation purpose)
[44.3%]). Greater Accra had the lowest percentage of
those with no formal education (13.1%), followed by the
Western region (18.3%) and then the Ashanti region
(18.5%). Greater Accra had the highest percentage of
those with college education and higher (5.7%) and the
lowest was in the Northern region (0.4%).
The majority of households (51.1%) were located in
an urban setting. In the individual regions, however,
only the Greater Accra and Ashanti regions had more
members located in urban areas (89.3 and 59.5%, res-
pectively), whilst the remaining eight regions had more
rural dwellers.
Over 73% of all household members had no health
insurance coverage, 24.3% had voluntary insurance
and only 1.4% had mandatory insurance. The Central
region and Greater Accra had the highest percentage
of those without insurance coverage (84.7 and 81.5%,
respectively), whilst the highest percentage of those
with voluntary insurance was recorded in the Upper
West region (51.9%), followed by the Brong Ahafo region
(40.8%).
Households with two to five members were the most
common size (47.2%), followed by 6�10 member house-
holds (34.8%), then the single member households
(11.0%) and the least was the 11� member households
(6.9%). By region, the mean household size was highest
in the Northern, Upper East and Upper West regions
(8.2, 8.1, and 6.6, respectively) reflecting the 75% of
households with more than six members. In all other
regions, the mean size varied between 4.4 and 5.3.
About 49% of Greater Accra households belonged to
the highest income quintiles, followed by a 29.4% of the
Ashanti households. The three northern regions had the
highest percentages in the lowest income quintile group
with over half of all households in the Upper East region
(50.5%) and one out of three households in the Upper
West (33.5%) and Northern regions (33.1%).
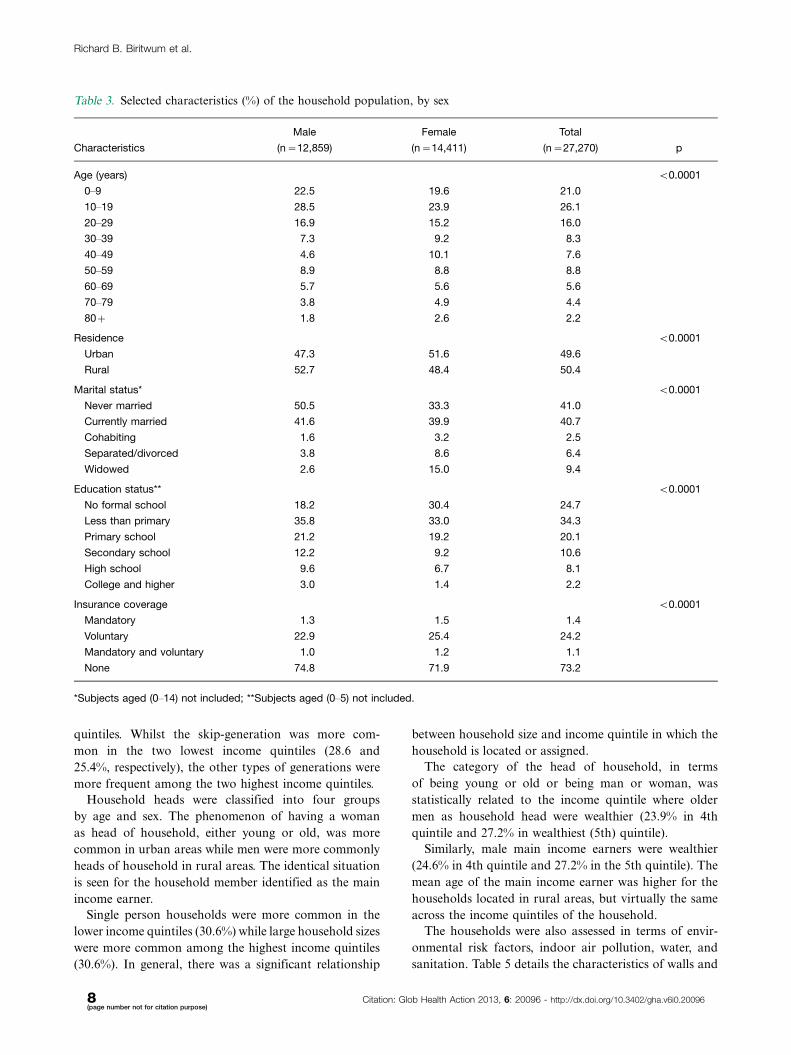
Table 3 shows the characteristics of the household
population by sex. Statistically significant sex differences
were found for many household characteristics: the age
distribution showed a higher percentage of younger males
(about 67.9% aged below 29 years compared to 58.7% for
females). More males lived in rural areas (52.7%) while
more females were located in urban areas. More women
are widowed (15.0%). For each level of education, males
had higher schooling than females; males with no formal
schooling accounted for 18.2% versus 30.4% for females.
Although only a quarter of the household members had
insurance cover, females had relatively higher cover
(28.1%) compared to males (25.2%).
The distribution of some household characteristics
by locality and income quintiles is shown in Table 4.
Most households with five or fewer household members
were located in urban areas, and 57.2% of households
with 11 or more members were located in rural areas.
The mean number of persons per household was 5.0 for
urban and 5.6 for rural settings. Households with a
respondent aged 50-plus years living alone were evenly
split by location, and although households with res-
pondent and spouse both aged 50-plus years were
more prevalent in the rural areas (62.4%), no statistical
association was found. Similarly, the number of genera-
tions living in the household and the location did not
show any association.
More than 60% of the single-person aged 50-plus
households were among the two lowest income quintiles.
In contrast, about 70% of the households with respon-
dent and spouse were in the highest three income
0
1
2
3
4
0 10 20 30 40 50 60 70 80Single years of age
Male Female
Source: SAGE 2007–2010
Household Population by Single Years of Age and SexGhana
Per
cent
Fig. 2. Age heaping using Myers’ blended method for household members in SAGE-Ghana.
Richard B. Biritwum et al.
6(page number not for citation purpose)
Citation: Glob Health Action 2013, 6: 20096 - http://dx.doi.org/10.3402/gha.v6i0.20096
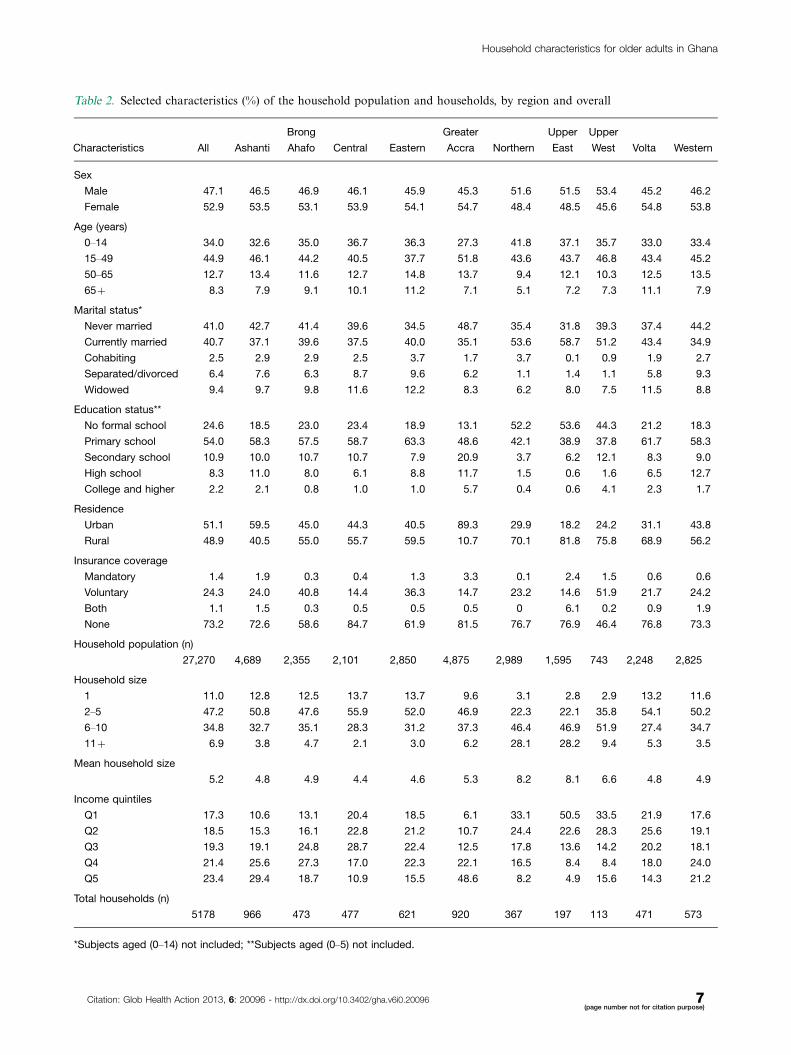
Table 2. Selected characteristics (%) of the household population and households, by region and overall
Characteristics All Ashanti
Brong
Ahafo Central Eastern
Greater
Accra Northern
Upper
East
Upper
West Volta Western
Sex
Male 47.1 46.5 46.9 46.1 45.9 45.3 51.6 51.5 53.4 45.2 46.2
Female 52.9 53.5 53.1 53.9 54.1 54.7 48.4 48.5 45.6 54.8 53.8
Age (years)
0�14 34.0 32.6 35.0 36.7 36.3 27.3 41.8 37.1 35.7 33.0 33.4
15�49 44.9 46.1 44.2 40.5 37.7 51.8 43.6 43.7 46.8 43.4 45.2
50�65 12.7 13.4 11.6 12.7 14.8 13.7 9.4 12.1 10.3 12.5 13.5
65� 8.3 7.9 9.1 10.1 11.2 7.1 5.1 7.2 7.3 11.1 7.9
Marital status*
Never married 41.0 42.7 41.4 39.6 34.5 48.7 35.4 31.8 39.3 37.4 44.2
Currently married 40.7 37.1 39.6 37.5 40.0 35.1 53.6 58.7 51.2 43.4 34.9
Cohabiting 2.5 2.9 2.9 2.5 3.7 1.7 3.7 0.1 0.9 1.9 2.7
Separated/divorced 6.4 7.6 6.3 8.7 9.6 6.2 1.1 1.4 1.1 5.8 9.3
Widowed 9.4 9.7 9.8 11.6 12.2 8.3 6.2 8.0 7.5 11.5 8.8
Education status**
No formal school 24.6 18.5 23.0 23.4 18.9 13.1 52.2 53.6 44.3 21.2 18.3
Primary school 54.0 58.3 57.5 58.7 63.3 48.6 42.1 38.9 37.8 61.7 58.3
Secondary school 10.9 10.0 10.7 10.7 7.9 20.9 3.7 6.2 12.1 8.3 9.0
High school 8.3 11.0 8.0 6.1 8.8 11.7 1.5 0.6 1.6 6.5 12.7
College and higher 2.2 2.1 0.8 1.0 1.0 5.7 0.4 0.6 4.1 2.3 1.7
Residence
Urban 51.1 59.5 45.0 44.3 40.5 89.3 29.9 18.2 24.2 31.1 43.8
Rural 48.9 40.5 55.0 55.7 59.5 10.7 70.1 81.8 75.8 68.9 56.2
Insurance coverage
Mandatory 1.4 1.9 0.3 0.4 1.3 3.3 0.1 2.4 1.5 0.6 0.6
Voluntary 24.3 24.0 40.8 14.4 36.3 14.7 23.2 14.6 51.9 21.7 24.2
Both 1.1 1.5 0.3 0.5 0.5 0.5 0 6.1 0.2 0.9 1.9
None 73.2 72.6 58.6 84.7 61.9 81.5 76.7 76.9 46.4 76.8 73.3
Household population (n)
27,270 4,689 2,355 2,101 2,850 4,875 2,989 1,595 743 2,248 2,825
Household size
1 11.0 12.8 12.5 13.7 13.7 9.6 3.1 2.8 2.9 13.2 11.6
2�5 47.2 50.8 47.6 55.9 52.0 46.9 22.3 22.1 35.8 54.1 50.2
6�10 34.8 32.7 35.1 28.3 31.2 37.3 46.4 46.9 51.9 27.4 34.7
11� 6.9 3.8 4.7 2.1 3.0 6.2 28.1 28.2 9.4 5.3 3.5
Mean household size
5.2 4.8 4.9 4.4 4.6 5.3 8.2 8.1 6.6 4.8 4.9
Income quintiles
Q1 17.3 10.6 13.1 20.4 18.5 6.1 33.1 50.5 33.5 21.9 17.6
Q2 18.5 15.3 16.1 22.8 21.2 10.7 24.4 22.6 28.3 25.6 19.1
Q3 19.3 19.1 24.8 28.7 22.4 12.5 17.8 13.6 14.2 20.2 18.1
Q4 21.4 25.6 27.3 17.0 22.3 22.1 16.5 8.4 8.4 18.0 24.0
Q5 23.4 29.4 18.7 10.9 15.5 48.6 8.2 4.9 15.6 14.3 21.2
Total households (n)
5178 966 473 477 621 920 367 197 113 471 573
*Subjects aged (0�14) not included; **Subjects aged (0�5) not included.
Household characteristics for older adults in Ghana
Citation: Glob Health Action 2013, 6: 20096 - http://dx.doi.org/10.3402/gha.v6i0.20096 7(page number not for citation purpose)
quintiles. Whilst the skip-generation was more com-
mon in the two lowest income quintiles (28.6 and
25.4%, respectively), the other types of generations were
more frequent among the two highest income quintiles.
Household heads were classified into four groups
by age and sex. The phenomenon of having a woman
as head of household, either young or old, was more
common in urban areas while men were more commonly
heads of household in rural areas. The identical situation
is seen for the household member identified as the main
income earner.
Single person households were more common in the
lower income quintiles (30.6%) while large household sizes
were more common among the highest income quintiles
(30.6%). In general, there was a significant relationship
between household size and income quintile in which the
household is located or assigned.
The category of the head of household, in terms
of being young or old or being man or woman, was
statistically related to the income quintile where older
men as household head were wealthier (23.9% in 4th
quintile and 27.2% in wealthiest (5th) quintile).
Similarly, male main income earners were wealthier
(24.6% in 4th quintile and 27.2% in the 5th quintile). The
mean age of the main income earner was higher for the
households located in rural areas, but virtually the same
across the income quintiles of the household.
The households were also assessed in terms of envir-
onmental risk factors, indoor air pollution, water, and
sanitation. Table 5 details the characteristics of walls and
Table 3. Selected characteristics (%) of the household population, by sex
Characteristics
Male
(n�12,859)
Female
(n�14,411)
Total
(n�27,270) p
Age (years) B0.0001
0�9 22.5 19.6 21.0
10�19 28.5 23.9 26.1
20�29 16.9 15.2 16.0
30�39 7.3 9.2 8.3
40�49 4.6 10.1 7.6
50�59 8.9 8.8 8.8
60�69 5.7 5.6 5.6
70�79 3.8 4.9 4.4
80� 1.8 2.6 2.2
Residence B0.0001
Urban 47.3 51.6 49.6
Rural 52.7 48.4 50.4
Marital status* B0.0001
Never married 50.5 33.3 41.0
Currently married 41.6 39.9 40.7
Cohabiting 1.6 3.2 2.5
Separated/divorced 3.8 8.6 6.4
Widowed 2.6 15.0 9.4
Education status** B0.0001
No formal school 18.2 30.4 24.7
Less than primary 35.8 33.0 34.3
Primary school 21.2 19.2 20.1
Secondary school 12.2 9.2 10.6
High school 9.6 6.7 8.1
College and higher 3.0 1.4 2.2
Insurance coverage B0.0001
Mandatory 1.3 1.5 1.4
Voluntary 22.9 25.4 24.2
Mandatory and voluntary 1.0 1.2 1.1
None 74.8 71.9 73.2
*Subjects aged (0�14) not included; **Subjects aged (0�5) not included.
Richard B. Biritwum et al.
8(page number not for citation purpose)
Citation: Glob Health Action 2013, 6: 20096 - http://dx.doi.org/10.3402/gha.v6i0.20096

floors, water, and sanitation. Overall, 89.1% of house-
holds had hard floors and the rest had earthen floors. In
all the regions, hard floors were more common than the
earthen ones except the Upper East and Upper West
regions where earthen floors constituted 54.5 and 74.3%,
respectively.
In all, 57.7% of households had cement walls, 41.0%
had mud walls, and 0.9% had thatched walls. All the
regions had cement walls as the most common feature of
the dwellings of the households, except the three northern
regions, where most of the walls of the households were
of mud: 95.2% in Northern region, 94.0% in the Upper
East region, and 79.4% in the Upper West region.
Eighty-five percent of households had improved
sources of drinking water. All the regions had a higher
percentage of households with improved sources of
drinking water except the Volta region, where 70.4%
of households had unimproved drinking water sources.
The regions with the highest percentage of improved
water source were the Upper West (98.2%), Greater
Accra (93.7%), and Ashanti (93.1%).
Just 14.9% of households had improved sanitation,
meaning 85.1% of all the households had unimproved
sanitation. This picture was similar across all the regions,
where unimproved sanitation ranged from a very high of
98.5% in the Upper East region to 58.1% in the Greater
Table 4. Selected characteristics (%) of the households, by location and income quintiles
Characteristics
Urban
(n�2619)
Rural
(n�2537) p-value
Q1
(n�885)
Q2
(n�950)
Q3
(n�991)
Q4
(n�1100)
Q5
(n�1202) p
Household size 0.012 B0.0001
1 51.5 48.5 30.6 27.5 21.8 14.1 6.0
2�5 52.1 47.9 17.9 18.6 18.9 22.2 22.3
6�10 50.4 49.6 13.4 15.7 19.0 23.0 28.9
11� 42.8 57.2 11.5 18.0 20.2 19.6 30.6
Mean household size 5.0 5.6 0.038 4.4 4.9 5.2 5.4 6.0 0.031
Living arrangements n.s. 0.029
Single-person household,
with person aged 50�
49.6 50.4 33.3 27.3 20.5 13.6 5.4
50� household, with only
respondent and spouse
48.7 51.3 15.1 11.9 31.5 22.4 19.1
50� household with
respondent and spouse
both aged 50�
37.6 62.4 17.4 14.0 22.1 23.9 22.6
Multigenerational household§ n.s. B0.0001
One-generation 46.5 53.5 15.7 14.0 23.7 25.3 21.4
Two-generation 50.5 49.5 15.8 17.6 18.3 21.5 26.8
Skip-generation 48.9 51.1 28.6 25.4 20.0 16.7 9.2
Three-generation 50.3 49.7 12.9 16.2 20.1 24.5 26.2
Household head B0.0001 B0.0001
Younger woman (aged 18�49) 64.3 35.7 15.6 21.2 21.6 22.3 19.4
Older woman (aged 50�) 55.3 44.7 20.4 20.7 19.2 21.0 18.8
Younger man (aged 18�49) 42.5 57.5 15.5 19.0 20.4 21.3 23.9
Older man (aged 50�) 47.6 52.4 15.7 16.5 18.8 21.8 27.2
Mean age of household head 58.4 59.4 n.s. 60.8 59.3 58.7 58.3 58.6 0.005
Main income earner B0.0001 B0.0001
Younger woman (aged 18�49) 67.4 32.6 15.0 18.2 19.9 24.9 22.0
Older woman (aged 50�) 54.7 45.3 19.6 21.5 18.8 20.6 19.5
Younger man (aged 18�49) 41.9 58.1 16.6 18.7 20.1 19.9 24.6
Older man (aged 50�) 46.8 53.2 15.0 16.5 19.0 22.3 27.2
Mean age of main income
earner
55.4 56.9 0.011 57.2 57.0 56.1 55.4 56.0 n.s.
§Generations are calculated from the household roster: one�e.g. a married couple without children; two�e.g. parent/child or
grandparent/child, etc.; three�e.g. grandparent/parent/child, etc.; skip-generation�e.g. grandparent/grandchild.
Household characteristics for older adults in Ghana
Citation: Glob Health Action 2013, 6: 20096 - http://dx.doi.org/10.3402/gha.v6i0.20096 9(page number not for citation purpose)
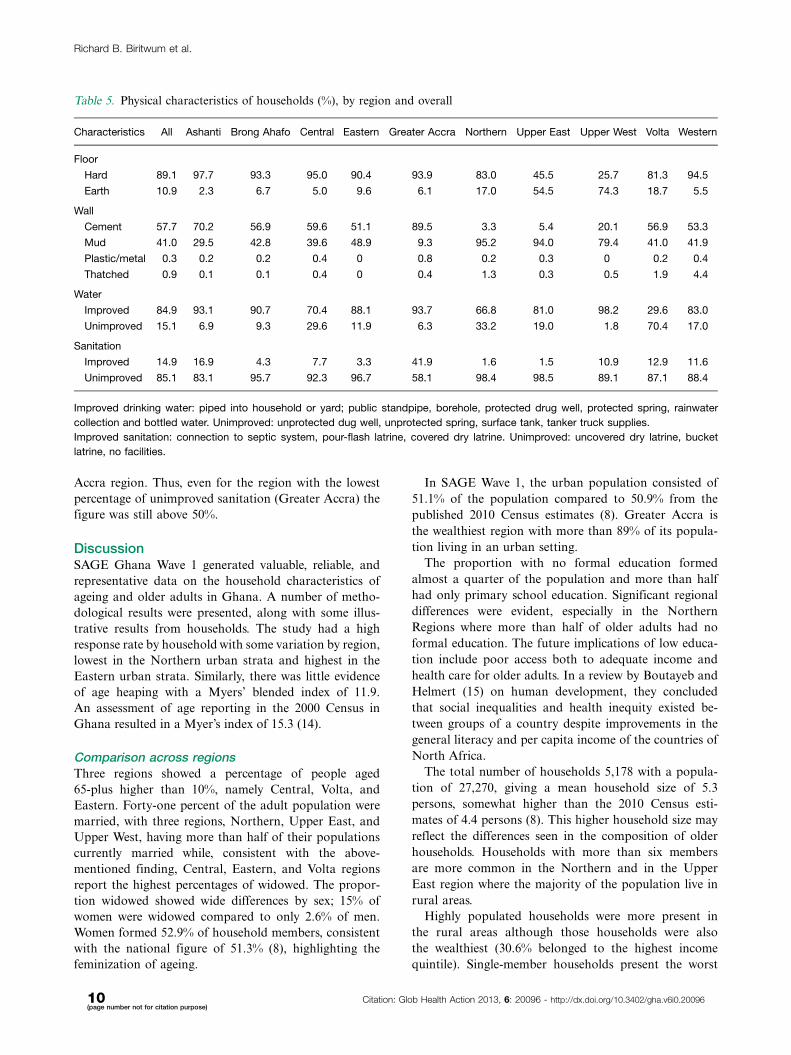
Accra region. Thus, even for the region with the lowest
percentage of unimproved sanitation (Greater Accra) the
figure was still above 50%.
DiscussionSAGE Ghana Wave 1 generated valuable, reliable, and
representative data on the household characteristics of
ageing and older adults in Ghana. A number of metho-
dological results were presented, along with some illus-
trative results from households. The study had a high
response rate by household with some variation by region,
lowest in the Northern urban strata and highest in the
Eastern urban strata. Similarly, there was little evidence
of age heaping with a Myers’ blended index of 11.9.
An assessment of age reporting in the 2000 Census in
Ghana resulted in a Myer’s index of 15.3 (14).
Comparison across regionsThree regions showed a percentage of people aged
65-plus higher than 10%, namely Central, Volta, and
Eastern. Forty-one percent of the adult population were
married, with three regions, Northern, Upper East, and
Upper West, having more than half of their populations
currently married while, consistent with the above-
mentioned finding, Central, Eastern, and Volta regions
report the highest percentages of widowed. The propor-
tion widowed showed wide differences by sex; 15% of
women were widowed compared to only 2.6% of men.
Women formed 52.9% of household members, consistent
with the national figure of 51.3% (8), highlighting the
feminization of ageing.
In SAGE Wave 1, the urban population consisted of
51.1% of the population compared to 50.9% from the
published 2010 Census estimates (8). Greater Accra is
the wealthiest region with more than 89% of its popula-
tion living in an urban setting.
The proportion with no formal education formed
almost a quarter of the population and more than half
had only primary school education. Significant regional
differences were evident, especially in the Northern
Regions where more than half of older adults had no
formal education. The future implications of low educa-
tion include poor access both to adequate income and
health care for older adults. In a review by Boutayeb and
Helmert (15) on human development, they concluded
that social inequalities and health inequity existed be-
tween groups of a country despite improvements in the
general literacy and per capita income of the countries of
North Africa.
The total number of households 5,178 with a popula-
tion of 27,270, giving a mean household size of 5.3
persons, somewhat higher than the 2010 Census esti-
mates of 4.4 persons (8). This higher household size may
reflect the differences seen in the composition of older
households. Households with more than six members
are more common in the Northern and in the Upper
East region where the majority of the population live in
rural areas.
Highly populated households were more present in
the rural areas although those households were also
the wealthiest (30.6% belonged to the highest income
quintile). Single-member households present the worst
Table 5. Physical characteristics of households (%), by region and overall
Characteristics All Ashanti Brong Ahafo Central Eastern Greater Accra Northern Upper East Upper West Volta Western
Floor
Hard 89.1 97.7 93.3 95.0 90.4 93.9 83.0 45.5 25.7 81.3 94.5
Earth 10.9 2.3 6.7 5.0 9.6 6.1 17.0 54.5 74.3 18.7 5.5
Wall
Cement 57.7 70.2 56.9 59.6 51.1 89.5 3.3 5.4 20.1 56.9 53.3
Mud 41.0 29.5 42.8 39.6 48.9 9.3 95.2 94.0 79.4 41.0 41.9
Plastic/metal 0.3 0.2 0.2 0.4 0 0.8 0.2 0.3 0 0.2 0.4
Thatched 0.9 0.1 0.1 0.4 0 0.4 1.3 0.3 0.5 1.9 4.4
Water
Improved 84.9 93.1 90.7 70.4 88.1 93.7 66.8 81.0 98.2 29.6 83.0
Unimproved 15.1 6.9 9.3 29.6 11.9 6.3 33.2 19.0 1.8 70.4 17.0
Sanitation
Improved 14.9 16.9 4.3 7.7 3.3 41.9 1.6 1.5 10.9 12.9 11.6
Unimproved 85.1 83.1 95.7 92.3 96.7 58.1 98.4 98.5 89.1 87.1 88.4
Improved drinking water: piped into household or yard; public standpipe, borehole, protected drug well, protected spring, rainwater
collection and bottled water. Unimproved: unprotected dug well, unprotected spring, surface tank, tanker truck supplies.
Improved sanitation: connection to septic system, pour-flash latrine, covered dry latrine. Unimproved: uncovered dry latrine, bucket
latrine, no facilities.
Richard B. Biritwum et al.
10(page number not for citation purpose)
Citation: Glob Health Action 2013, 6: 20096 - http://dx.doi.org/10.3402/gha.v6i0.20096
situation, being poorer and older. In terms of single and
multigenerational living arrangements, 174 households
consisted of a married couple without children (one
generation). The most common living arrangement,
occurring in 2,290 households, was two-generation
households consisting of parent/child or grandparent/
grandchild. As Ghana’s population continues to age, the
expectation is that three-generational living arrange-
ments, that is, older adults living with their children
who have their own families, may become more common
than it is currently. For older persons, this type of
arrangement may provide social protection and enable
them to bequeath their rich experience to their children
and grandchildren; on the other hand the presence
of older adults may impose extra financial and social
cost on the family (4, 5). The social opportunities
and challenges of the evolving living arrangements in
Ghana will be worthy of consideration in national policy
discussions.
Characteristics of the household across regionsThe wealthiest Greater Accra region is also reflected by
household characteristics like very high percentages of
hard floor, cement wall, and improved drinking source.
The Upper East, Upper West, and Northern regions
illustrate variations in dwelling characteristics in the
three poorest regions. Only 3.3% of the Northern region
households had cement walls versus 20.1% among the
Upper West region dwellings. Improved sanitation ranges
between 1.5% in the Upper East region and 10.9% in the
Upper West region.
Despite Greater Accra being comparatively wealthier,
just 42% of households in this region had improved
sanitation. The Ashanti region, the second wealthiest
region, provides improved sanitation to only a 17% of its
population. Ten percent of households in GLSS 5 and
15.4% in the 2010 Census had access to a flush toilet.
The pan/bucket latrine, which is actively being discour-
aged and phased out because of its minimum sanitary
standards, forms the smallest proportion (20%), and
about 19% of the population has no toilet facility in
their homes, while in the three northern regions, up to
72% of households have no access to any form of toilet
facility according to the 2010 Census (8). High rates of
unimproved sanitation were found throughout the coun-
try in SAGE. This poses a serious threat to healthy living
as the traditional type of sanitary facilities mostly con-
tributes to unhygienic environment and facilitates easy
transmission of diseases (16).
Risk pooling for financial accessibility to health ser-
vices was low among older household members in
SAGE Ghana (2007/08), almost three quarters did not
have insurance coverage, despite Ghana introducing the
National Health Insurance Scheme (NHIS) by an Act of
Parliament Act 650 in August 2003 (17). As of December
2010, over 18 million Ghanaians (over 70% of entire
national population) had subscribed to the scheme, out
of which over 8 million, representing 34% of the popula-
tion, were active card bearers. The high patronage attests
to the fact that Ghanaians have embraced the NHIS as
the preferred health care financing mechanism (18). The
challenge for the older population in Ghana is that
the retirement age for public sector workers is 60 years;
while the NHIS provide free care to those aged 70-plus
years (17). A policy to provide health insurance for
those adults aged 61�69 years is worth pursuing and
may need to be incorporated in the Draft National Policy
on Ageing.
While the results of this study are subject to the
limitations of self-report, much of the subject matter
presented in this article was also largely observable by the
survey team. Interviewers were given the opportunity to
rate the reliability of the household respondents, and note
any corrections based on objective observations. As well,
the focus of SAGE being older households, the compar-
isons to other published results are similar, but not
strictly comparable without access to the microdata.
ConclusionSAGE Wave 1 provides data to describe the house-
hold characteristics of older adults in Ghana using
approaches similar to other large data collection efforts.
SAGE uses sound research methodology in a nationally
representative sample to inform policy and planning for
the older population in Ghana. In this study, significant
differences were observed in households across regions,
especially regions in the Northern part of the country.
A comprehensive national policy on ageing is crucially
important to ensure healthy living arrangements and
households as elements to maintain health and well-
being in ageing populations across all parts of Ghana �SAGE can provide the data needed to inform this
policy.
Acknowledgements
Financial support was provided by the US National Institute on
Aging through Interagency Agreements (OGHA 04034785;
YA1323-08-CN-0020; Y1-AG-1005-01) with the World Health
Organization and a Research Project Grant (R01 AG034479-
01A1). WHO contributed financial and human resources to
SAGE. The Ministry of Health, Ghana, is supportive of SAGE.
The University of Ghana’s Department of Community Health
contributed training facilities, data entry support, and storage of
materials. The Ghana Statistical Office provided the sampling
information for the sampling frame and updates.
Conflicting interest and funding
The authors have not received any funding or benefits
from industry or elsewhere to conduct this study.
Household characteristics for older adults in Ghana
Citation: Glob Health Action 2013, 6: 20096 - http://dx.doi.org/10.3402/gha.v6i0.20096 11(page number not for citation purpose)

References
1. United Nations Population Division, UNPD. World population
prospects: the 2010 revision. New York: United Nations; 2011.
2. Institute for Health Metrics and Evaluation. GBD profile:
Ghana. Global burden of diseases, injuries, and risk factors
study 2010. Seattle: IHME; 2013. Available from: www.
healthmetricsandevaluation.org/sites/default/files/country-
profiles/GBD%20Country%20Report%20-%20Ghana.pdf.
3. Mba CJ. Gender disparities in living arrangements of older
people in Ghana: evidence from the 2003 Ghana demographic
and health survey. J Int Women’s Stud 2007; 9: 153�66.
4. National Academy of Sciences. (2006). Executive summary.
In: Cohen B, Menken J, eds. Aging in sub-Saharan Africa:
recommendations for furthering research. Washington, DC:
National Academies Press; pp. 20�22, 26�39. Available from:
www.ncbi.nlm.nih.gov/books/NBK20306/pdf/TOC.pdf.
5. Aboderin I. ‘Modernization’ and economic strain. The impact
of social change on material family support for older people
in Ghana. In: Bengston VL, Lowenstein A, eds. Global aging
and challenges to families. New York: Walter de Gruyter, Inc.;
2003. pp. 284�302. Available from: http://books.google.ch/books
?id�Hz5utzgTbXoC&pg�PA285&lpg�PA285&dq�Global�Aging�and�Challenges�to�Families�Aboderin�Ghana&
source�bl&ots�xYijtU5dkq&sig�NiYojDKNPZ7jOAlh2ccam
0NVDIE&hl�en&sa�X&ei�v1RSUbzgKMjsOpbCgOgO&redir_
esc�y#v�onepage&q�Global%20Aging%20and%20Challenges%
20to%20Families%20Aboderin%20Ghana&f�false.
6. GSS (Ghana Statistical Service) (2000). National population
and housing census, year 2000 report. Accra: Ghana Statistical
Service.
7. GSS (Ghana Statistical Service), Ghana Health Service (GHS),
and ICF Macro. Ghana demographic and health survey 2008.
Accra, Ghana: GSS, GHS, and ICF Macro; 2009.
8. GSS (Ghana Statistical Service) (2010). Provisional national
population and housing census, year 2010 report. Accra: Ghana
Statistical Service.
9. Aboderin I. Understanding and advancing the health of older
populations in sub-Saharan Africa: policy perspectives and
evidence needs. Pub Health Rev 2010; 32: 357�76.
10. SAGE Ghana. Ghana national draft report on World Health
Organization’s study on global AGEing and adult health
(SAGE). Geneva: World Health Organization; 2012.
11. MESW (2008). Ghana national ageing policy. ‘Ageing with
security and dignity’ draft document of the ministry of employ-
ment and social welfare. Accra: Ministry of Employment and
Social Welfare.
12. Kowal P, Chatterji S, Naidoo N, Biritwum R, Wu Fan, Lopez
Ridaura R, et al. Data resource profile: the World Health
Organization study on global AGEing and adult health (SAGE).
Int J Epidemiol 2012; 41: 1639�49. doi:10.1093/ije/dys210.
13. Pardeshi GS. Age heaping and accuracy of age data col-
lected during a community survey in the Yavatmal district,
Maharashtra. Indian J Community Med 2010; 35: 391�5.
14. Kennedy S, McCaa R, Sobek M, Cleveland L. The quality of
constructed family and household relationships in African
Census Samples. Minneapolis: Minnesota Population Center;
2011. Available from: www.hist.umn.edu/~rmccaa/ipums-africa/
ipumsi_data_quality_6th_apc.pdf.
15. Boutayeb A, Helmert U. Social inequalities, regional disparities
and health inequity in North African countries. Int J Equity
Health 2011; 10: 23.
16. GLSS 5 (2008). Ghana Living Standards Survey Report of
the fifth round. Accra: Ghana Statistical Service. [September
2005�September 2006]
17. NHIS. National Health Insurance Act 650 of the republic of
Ghana. Accra: Ghana Assembly Press; 2003.
18. NHIS. Annual report on the National Health Insurance
Scheme. Accra: National Health Insurance Authority; 2010.
Richard B. Biritwum et al.
12(page number not for citation purpose)
Citation: Glob Health Action 2013, 6: 20096 - http://dx.doi.org/10.3402/gha.v6i0.20096

.Questionnaire types and description of contents, SAGE Wave 1
Questionnaire type Domain Wave 1 measures
Household Household identification, contact
and sampling details
Identification and contact details; structure of household; dwelling
characteristics; improved water, sanitation and cooking facilities
Transfers and support networks Family, community and government assistance into and out of the
household; informal personal care provision/receipt
Assets, income and expenditure List of household assets; sources and amount of household income;
improved household expenditure on food, goods and services, health care
Household care and health insurance Persons in household needing care; mandatory and voluntary health
insurance coverage
Individual Sociodemographic characteristics Sex; age; marital status; education; ethnicity/background; religion; language
spoken; area of residence; employment and education of parents; childhood
residence, migration
Work history and benefits Length of time worked; reasons for not working; type of employment; mode
of payment; hours worked; retirement
Health states and descriptions Overall self-rated health; eight self-rated health domains (affect, mobility,
sleep/energy, cognition, interpersonal activities, vision, self-care and pain);
12-item WHO Disability Assessment Schedule, Version 2 (WHODAS-II);
activities of daily living (ADLs); instrumental activities of daily living (IADLs);
vignettes on health state descriptionsAnthropometrics, performance tests
and biomarkers
Measured blood pressure; self-report and measured height and weight;
measured waist and hip circumference; timed walk; near- and distant vision
tests; grip strength, executive functioning (verbal recall, digit span forwards
and backwards, verbal fluency); spirometry; non-fasting fingerprick blood
sample (stored at -20C) as dried blood spots
Risk factors and preventive health
behaviours
Smoking; alcohol consumption; fruit and vegetable intake; physical activity
(GPAQ)
Chronic conditions and health
services coverage
Self-reported and symptomatic reporting of arthritis; stroke; angina (Rose
Questionnaire); asthma; and, depression (ICD-10, DSM-IV). Self-reporting of
diabetes; chronic lung disease; hypertension; cataracts; oral health
(edentulism); injuries; cervical and breast cancer screening
Health care utilization Past need for health care; reasons for health care or for not receiving health
care; inpatient and outpatient health care: number of admissions/visits within
the past 3 years (inpatient) or 1 year (outpatient); reasons for admission/visit;
details of hospital or provider; costs of hospitalization or health care visit;
satisfaction with treatment; health system responsiveness; vignettes for
responsiveness of health services
Social cohesion Community involvement and social networks; perceptions of other people
and institutions; safety in local area; stress; interest in politics and
perceptions of government
Subjective well-being and quality of
life
Perceptions about quality of life and well-being; 8-item WHO Quality of Life
measure (WHOQoL); Day Reconstruction Method (DRM)
Impact of caregiving Household members needing care; type of care required; length of time
spent on care; costs of care; impact of providing care on career well-beingProxy IQ Code IQ Code;
Health state descriptions All measures described above for individual data
Chronic conditions All measures described above for individual data
Health care utilization All measures described above for individual data
Proxy validation Quality control measure Supervisor checks that proxy interview warranted and completed
Retest Quality control measure Selected key variables for household and individual questionnaires repeated
up to one week after initial interview.Mortality (verbal
autopsy)
Deaths and cause of death Verbal Autopsy for all deaths within past 24 months in households
Note: Section 9000 of the individual questionnaire allowed the interviewer to document observations during the interviews.
Appendix 1
Household characteristics for older adults in Ghana
Citation: Glob Health Action 2013, 6: 20096 - http://dx.doi.org/10.3402/gha.v6i0.20096 13(page number not for citation purpose)