
Hospital Financial Conditions and the Provision of Unprofitable Services
19
Hospital Financial Conditions and the Provision of Unprofitable Services Hsueh-Fen Chen & Gloria J. Bazzoli & Hui-Min Hsieh # International Atlantic Economic Society 2009 Abstract Increases in hospital financial pressure resulting from public and private payment policy may substantially reduce a hospital’ s ability to provide certain services that are not well compensated or are frequently used by the uninsured. The objective of this study is to examine the impact of hospital financial condition on the provision of these unprofitable services for the insured and uninsured. Economic theory provides the conceptual underpinnings for the analysis, and a longitudinal empirical analysis is conducted for an eight-year study period. The results indicate that not-for-profit hospitals with strong financial performance provide more unprofitable services for the insured and uninsured than do not-for-profit hospitals with weaker condition. For- profit hospital provision of these services is not influenced by their financial condition and instead may reflect actions to meet community expectations or to offer a sufficiently broad service array to maintain the business of insured patients. Keywords Hospital financial condition . Unprofitable services . Insured patients . Uninsured patients JEL I00 Background Community hospitals in the US typically provide a broad array of health care services. It is generally well recognized that some of these services, especially Atl Econ J DOI 10.1007/s11293-009-9183-9 Research for this study was supported by a grant from the National Heart, Lung, and Blood Institute: 5R01HL082707-02. Department of Health Management and Policy, University of North Texas Health Science Center, 3500 Camp Bowie Blvd., Fort Worth, TX 76107, USA e-mail: [email protected] : Department of Health Administration, Virginia Commonwealth University, 1008 East Clay Street, P.O. Box 980203, Richmond, VA 23298-0203, USA H. F. Chen (*) G. J. Bazzoli : H. M. Hsieh
Transcript of Hospital Financial Conditions and the Provision of Unprofitable Services

Hospital Financial Conditions and the Provisionof Unprofitable Services
Hsueh-Fen Chen & Gloria J. Bazzoli & Hui-Min Hsieh
# International Atlantic Economic Society 2009
Abstract Increases in hospital financial pressure resulting from public and privatepayment policy may substantially reduce a hospital’s ability to provide certain servicesthat are not well compensated or are frequently used by the uninsured. The objective ofthis study is to examine the impact of hospital financial condition on the provision ofthese unprofitable services for the insured and uninsured. Economic theory providesthe conceptual underpinnings for the analysis, and a longitudinal empirical analysis isconducted for an eight-year study period. The results indicate that not-for-profithospitals with strong financial performance provide more unprofitable services for theinsured and uninsured than do not-for-profit hospitals with weaker condition. For-profit hospital provision of these services is not influenced by their financial conditionand instead may reflect actions to meet community expectations or to offer asufficiently broad service array to maintain the business of insured patients.
Keywords Hospital financial condition . Unprofitable services . Insured patients .
Uninsured patients
JEL I00
Background
Community hospitals in the US typically provide a broad array of health careservices. It is generally well recognized that some of these services, especially
Atl Econ JDOI 10.1007/s11293-009-9183-9
Research for this study was supported by a grant from the National Heart, Lung, and Blood Institute:5R01HL082707-02.
H.-F. Chen (*)Department of Health Management and Policy, University of North Texas Health Science Center,3500 Camp Bowie Blvd., Fort Worth, TX 76107, USAe-mail: [email protected]
G. J. Bazzoli : H.-M. HsiehDepartment of Health Administration, Virginia Commonwealth University, 1008 East Clay Street,P.O. Box 980203, Richmond, VA 23298-0203, USA
H. F. Chen (*)
G. J. Bazzoli : H. M. Hsieh

certain surgical procedures, are well compensated relative to costs of care,whereas other services are unprofitable. The profitability of particular services iscertainly influenced by hospital production decisions, but also by distortionsembedded in existing payment systems, such as the Medicare inpatientprospective payment system (Ginsburg and Grossman 2005; Horwitz 2005).Existing literature has identified certain services that are not profitable. Theseservices include burn care, inpatient psychiatric care, psychiatric emergencyservices, maternity care, AIDS services, substance abuse services, and trauma care(Bazzoli et al. 2005; Gaskin 1999; Horwitz 2005; Zuckerman et al. 2001). Inaddition to the services noted above, the services provided to the uninsured arenot profitable. Based on national data, uninsured patients disproportionately havelow income and are from minority racial or ethnic groups, such as Hispanic orAfrican American (Department of Health and Human Services 2005). Thesepatients usually are not able to pay or only pay a small proportion of hospital cost fortheir services. Provision of the unprofitable services identified above and theservices for the uninsured increase operating costs and financial burden for ahospital, which may threaten their ability to compete with other hospitals in themarket, and even future survival.
Although hospitals are not fully reimbursed for the costs of unprofitable services,several still offer them. Horwitz (2005) found that public hospitals offered the largestnumber of these services, not-for-profit (NFP) hospitals offered several of them, andfor-profit (FP) hospitals offered the least. Public hospitals are often viewed asinstitutions of last resort, with an open door policy for all patients. Thus, it is nosurprise that they provide many unprofitable services. NFP hospitals may bemotivated to provide these services by several different factors. First, they maybelieve that provision of these services is consistent with their community servicemission, especially if few other facilities offer the services in their communities.Second, NFP hospitals frequently receive tax exemptions from state and federalgovernment and are increasingly being pushed to demonstrate that they areproviding community benefit, including care of uninsured patients and provisionof subsidized health services (Schlesinger and Gray 2006). FP hospitals do not facethese pressures, but likely confront community expectations about the role hospitalsshould play in the community, including provision of certain services and treatmentof the uninsured (Banks et al. 1997).
Traditionally, hospitals have used profits obtained from certain services and payergroups to subsidize the provision of unprofitable services and care of the uninsured.Over the last decade, however, financial constraints from public and private payersincreased. Medicare payment constraints implemented in the late 1990s limited thegrowth of Medicare payments. In particular, MedPAC (2008) reported that totalMedicare margins declined from 11.8% in 1997 to−4.8% in 2006. Additionally,MedPAC reported that the proportion of hospitals with negative total margins was25% in 2006. As a result, the ability of hospitals to cross-subsidize the costs ofunprofitable services and patient groups has declined over time.
Previous studies have shown that financial pressure leads to lower uncompensatedcare provision in NFP hospitals (Bazzoli et al. 2006; Cunningham et al. 2008).However, recent studies have found that safety net hospitals, which are primarilyNFP and public hospitals, did not drop unprofitable services during a period when
H.F. Chen et al.

Medicare and Medicaid payments were substantially constrained (Bazzoli et al.2005). On the face of it, these two sets of findings seem inconsistent. However, itcould be that hospitals are making marginal adjustments to service capacity ratherthan eliminating services altogether when faced with financial pressures. Existingresearch has not examined this issue specifically. Instead, most studies examiningunprofitable services assess whether hospitals offer a particular service or whetherthey dropped this service over time. In addition, studies have not considered whetherhospitals may be taking actions that limit access to certain services by the uninsuredwhile still maintaining access to these services by insured individuals. Strategically,this could make sense for hospitals because they could build long-term relations andloyalty among insured individuals, and thus, even though insured individuals mightrequire unprofitable services at one point, they may return to use more profitableservices in the future. Both service elimination and service reductions for differentpatient groups can have adverse effects on communities, especially if patient needsgo unmet or alternatively become more concentrated in public hospitals.
The purpose of this study is to fill the gaps identified above. We examineHealthcare Cost and Utilization Project State Inpatient Data (HCUP-SID), whichprovides patient discharge data, allowing us to identify the types of services receivedby patients and their payer status. By examining these data over time, we canexamine changes in the volume of specific hospital services for insured anduninsured patients and how these are affected by changing hospital financialcondition. Our study examines the period 1996 to 2003, which includes theimplementation of the Balanced Budget Act of 1997. This policy had substantialimpact on hospital financial condition, and thus, this represents a good period toexamine the effects of changing financial condition on changes in unprofitablehospital service provision.
Conceptual Framework
Economic theory provides the conceptual framework for our study and allows us toassess how changing financial condition might affect the behaviors of hospitals. Theeconomic theory of Weisbrod (1980) envisioned that NFP hospitals filled animportant role within the community by providing public goods. This theorysuggested that FP firms avoid providing public goods because a market for themcannot be sustained. On the other hand, government agencies provide these goods,but at a lower level than many in the community would like because governmentofficials must cater to a diverse electorate with varying preferences for the amount ofpublic good production to support. In this case, NFPs step in to satisfy the desire ofthose in the community who want to see additional public good provision. Withinthe hospital sector, public goods, which provide more than just direct benefit toconsumers of the good, are typically referred to as “community benefits.” Forexample, charity care and participation in public programs for low-incomeindividuals benefit many individuals in a community when illnesses are treatedearly and are thus less likely to spread.
The economic theory of Newhouse (1970) further suggests that NFP hospitalsmaximize their utility by expanding the quantity and quality of goods produced until
Hospital Financial Conditions and Provision of Unprofitable Services

the hospital exhausted a budget constraint where total revenues equaled total costs.To maximize utility, hospitals would use the profits of certain well-compensatedservices to expand the provision of other services and treatment of certain patientsfor which profits are not achieved.
As financial pressures increase, the resources of NFP hospitals are constrainedand this may reduce their ability to provide unprofitable services. In particular,Hoerger (1991, p. 261) commented that:
. . . in periods of good times an NFP enjoys a fat ‘cushion’ of potential profitwhich it eschews in favor of increased output. As [the situation] becomes moreunfavorable, the NFP cushions the impact on profits by reducing output andacting more like a profit-maximizing hospital.
This could be achieved by NFP hospitals if they reduce their capacity to provideunprofitable services or make it more difficult for the uninsured to access care.
FP hospitals, on the other hand, are profit-maximizers. Hoerger (1991) suggestedthat in this case FPs are unlikely to change their output levels or mix in the face ofgeneral payment pressures because these are already set at cost minimizing levels.Banks et al. (1997) further argued that FP hospitals treat costs of indigent care as oneof their business costs, namely as the expense associated with meeting communityexpectations. If these expectations are unaffected by hospital financial condition, wedo not expect FP hospitals to reduce their provision of unprofitable services or careof unprofitable patients as financial conditions worsen.
Overall, our study has two hypotheses drawn from the above discussion:
H1 NFP hospitals with poor financial condition will provide fewer unprofitableservices than those with stronger financial position, ceteris paribus.
H2 There will be no difference in unprofitable service provision across FPhospitals with stronger and weaker financial condition, ceteris paribus.
In addition to ownership, institutional, market, and health policy factors willlikely influence the amount of unprofitable services hospitals deliver. Hospitalcharacteristics, including hospital bed size, teaching status, and system affiliation,can influence decisions about what services to offer and how much capacity toprovide for various service lines. Market factors, such as the percent of thepopulation who are in poverty and the availability of public hospital and teachinghospital beds in the community, can influence the demand or supply of unprofitableservices. Finally, health policy, especially Medicaid program characteristics, mayaffect local need for services and the financial resources available to hospitals tosupport them.
Methods and Measures
To examine our study questions and hypotheses, several data sources were mergedfor the period 1996 to 2003. HCUP-SID provided patient discharge data to examineservice provision and patient payer source. Hospital cost reports filed with theCenters for Medicare and Medicaid (CMS) were used to measure hospital financialcondition. The American Hospital Association annual survey was used to measure
H.F. Chen et al.

hospital structural characteristics. InterStudy provided data on HMO penetration, andthe Area Resource File was used to construct community demographic measures. Wealso obtained data on the number of individuals living in poverty from the USCensus Bureau. Finally, measures reflecting state health policies were constructedfrom the Medicaid Statistical Information System.
The unit of analysis for the study was the hospital. The study sample was drawnfrom nine states – specifically Arizona, California, Colorado, Florida, Iowa, NewJersey, New York, Washington, and Wisconsin – all of which participated in theAgency for Healthcare Research and Quality’s HCUP-SID for the entire eight-yearstudy period. We selected these nine states because each required all general medical/surgical hospitals to supply patient discharge data, and thus, we avoided potentialselection issues that might arise due to voluntary reporting. We excluded hospitals inthese states with less than 30 staffed beds because small hospitals do not typicallyprovide the unprofitable specialty services that we examined, such as psychiatric orburn care. Further, we limited the sample to hospitals that did not experienceownership changes. This allowed us to examine how hospitals with differentownership types responded to changing financial condition with respect to adjustingtheir unprofitable services, without the potential confounding effects of hospitalownership changes. Looking across the study years, we had a total of 5,032 hospital-year observations for NFPs, 1,360 for public hospitals, and 1,160 for FP hospitals.
Dependent Variables
The main dependent variable for the study was the volume of unprofitable services,measured separately for insured and uninsured patients. Following Horwitz (2005),we defined unprofitable services to be: maternity care and newborns withcomplications,1 psychiatric and substance abuse cases admitted through theemergency department; trauma care; and burn services.2 We used diagnosis-relatedgroup (DRG) codes as reported in the discharge data to identify patients receivingthese services. Patients who were transferred out to other acute care hospitals wereexcluded. We aggregated patient-level data to the hospital-level to measure the totalvolume of unprofitable services for the two payer groups noted above.
In addition, we examined the total volume of trauma care to demonstrate howhospital financial condition may affect an individual service area. Trauma servicesare interesting to study because patient treatment ranges from those with low tomoderately severe injury (e.g., fractured limbs, mild concussion) to highly severecases (e.g., multiple trauma resulting from automobile accidents or gunshot victims).Institutions that treat the most severe cases must have certain resources immediatelyavailable, such as particular surgeons on-site and ready access to operating rooms.These institutional capabilities are well known by local ambulance service agencies(MacKenzie et al. 2006; Branas et al. 2005; Nathens et al. 2004). Thus, there are
1 Maternity cases that did not involve complications became an attractive business for hospitals, especiallygiven enhancements in Medicaid payment and eligibility (Gaskin et al. 2001). Thus, we excluded thesecases from our analysis.2 Horwitz (2005) and others have also identified AIDS services as unprofitable. However, these serviceswere increasingly provided on an outpatient basis during the study period. Our data focuses strictly oninpatient care; thus, we excluded AIDS hospitalizations from our study.
Hospital Financial Conditions and Provision of Unprofitable Services

opportunities to reduce the amount of trauma care provided by eliminating certainneeded resources and focusing only on less severe injury cases. For both traumavolume and total unprofitable services volume, we measured values in logs giventheir non-normal distribution across hospitals in the sample.
Measures of Hospital Financial Condition
The primary explanatory variable in our study was hospital financial condition. Weassessed two different financial performance measures that captured different aspectsof hospital financial health. First, we examined hospital operating margin, whichfocused on hospital profitability from patient care business. Operating margin equalsthe difference between net patient revenue and operating expense, divided by netpatient revenue. Hospitals can also receive net revenues through other activities notdirectly related to patient care, such as investment income, tax appropriations,donations, physician practice management services, and activities such as gift shops,food services, and parking. Our second measure for financial performance accountsfor these additional revenues and expenses. Specifically, we constructed the ratio ofcash flow to total revenue, which equals net revenues from all sources plus annualdepreciation expense,3 divided by total hospital revenues. Hospital cost report datafrom CMS were used to construct these measures.4
We classified hospitals into three groups based on the distribution of data for the twofinancial performance measures. These three groups were: the 75 percentile or above;the median to the 75th percentile; and below the median, which was used as a referencegroup.5 By grouping hospitals this way, we were able to examine how hospitals withstrong and moderately strong financial performance varied in their unprofitable serviceprovision relative to hospitals with financial performance below the median.
Control Variables
As noted in our conceptual discussion, other variables related to the hospital, market,and health policy are likely to influence the amount of unprofitable servicesprovided, and thus, must be controlled in the analysis. Hospital characteristicsincluded hospital bed size, system affiliation, and teaching status. Bed size wasmeasured by the log of staffed beds due to the non-normal distribution of thisvariable. System was coded as one if a hospital was affiliated with a multi-hospitalsystem, and teaching status was coded as one if a hospital was a member of theAssociation of American Medical College’s Council on Teaching Hospital.
3 About 50% of hospitals were missing annual depreciation expense data in 2003. We decided to use 2002reported depreciation expense when 2003 data were missing. This strategy made sense given examinationof annual depreciation expense for the adjacent years between 1996 and 2002. Specifically, we found thatthe year-to-year correlations in this variable was .95 or higher.4 Reporting errors in the CMS financial data are well recognized (Kane and Magnus 2001). To deal withpotential measurement error that may bias our results, we examined year-to-year changes in the financialdata to see if unusually large changes (e.g., big increases or declines) occurred. Based on our analysis, wedecided to set annual values of measures to missing if extreme fluctuations occurred (defined as the meanannual change plus or minus 3 standard deviations). Overall, this affected 11.6% of our observations.5 These percentiles were based on the pooled financial data from 1996 to 2003.
H.F. Chen et al.

Relevant market factors were measured mostly at the county level and wereintended to capture both supply and demand factors relevant for unprofitableservices in the market. The percentages of hospital beds in the county that werepublicly owned or that were in teaching hospitals were measured. Public hospitalshave obligations locally to provide a broad range of care for all types of patients.Teaching hospitals may need to provide a full range of services to train newphysicians. Thus, hospitals located in a community with relatively more publichospital or teaching hospital beds may have less need to provide unprofitableservices. The percentage of county residents who were in poverty also may affect theamount of unprofitable services demanded in the community. The variables HMOpenetration, hospital competition, and the interaction of the two were also included.Previous studies have found that hospitals in markets with high HMO penetrationand high hospital competition faced greater price competition (Dranove et al. 1993),suggesting that they are likely to have fewer resources to provide unprofitableservices. HMO penetration is measured by the number of people enrolled in HMOs,as allocated to counties based on the HMO’s reported service area, divided by totalpopulation in the associated counties.6 Because the HMO data we had were onlyconsistently available at the MSA-level for our study period, we assumed that HMOenrollment for rural communities was zero. Hospital competition was measured bythe Herfindal-Hirschman Index, using hospital inpatient days at the county level.Within counties, we combined market shares for hospitals that belonged to the samemulti-hospital system.
Finally, health policy factors were measured at the state level and focused onMedicaid program characteristics. We included the ratio of Medicaid beneficiaries tothe number of individuals in poverty within the state.7 This variable provides aproxy for Medicaid program generosity. Also, we measured the percentage ofMedicaid beneficiaries enrolled in Medicaid managed care plans. The models alsoincluded an interaction term for the state of California and the year 1999 given somespecific policy changes that affected pregnant women and their eligibility forMedicaid in that year.8
Empirical Model and Methods
We examined public, NFP, and FP hospital provision of unprofitable servicesseparately, estimating models for insured and uninsured patients. Specifically, ourempirical model was
UPFit ¼ b0 þ b1Finit�1 þ b2Hit þ b3Mit þ b4Pit þ b5Yt þ gi þ "it ð1Þ
6 The historical data files we had lacked HMO penetration data for Washington and Wisconsin in the years1996 and 1997. Given this, we used data on HMO penetration in 1998 for 1996 and 1997 in these twostates.7 Data for the ratio of Medicaid beneficiaries to the poor population in a state were only availablebeginning in 1999. Thus, we used the 1999 values of these variables for earlier years in the study states.8 California implemented the Family Planning, Access, Care, and Treatment program in the fiscal year1997-1998, which substantially reduced the unintended pregnancy rate and the number of uninsuredpregnant women after 1999 (Foster et al. 2004).
Hospital Financial Conditions and Provision of Unprofitable Services

where UPFit represents the log of volume of unprofitable services, with i indexing ahospital and t indexing time. Finit−1 is the one-year lagged value of the financialmeasures. Hit and Mit represent vectors of hospital and market factors, respectively.Pit are the variables for health policy at the state level. The Yt control for time trends,and are measured as dummy variables from 1997 to 2003 with 1996 as a referencegroup. γt is a hospital-specific error component, which is assumed to be timeinvariant, and εit represents a random error term.
The standard approach for estimating a longitudinal model is fixed-effects or firstdifferences, which in essence eliminates γt from (1). However, it is important torecognize that our model violates the assumption of strict exogeneity, which underliesthese estimation methods. Specifically, the financial performance measures in ourmodel are not strictly exogenous, even though lagged, given potential feedback effectsthat result between unprofitable service provision and financial performance.Specifically, financial performance in a year t−1 (Finit−1) affects the volume ofunprofitable services in the subsequent year (UPFit), which in turn affects financialperformance in year t (Finit). Given this, an instrumental variable approach toestimation is needed (Wooldridge 2003). Following Mark et al. (2005), we used thelagged two-year values for the financial variables as an instrument for the one-yearlagged financial variables. 9
Empirical Results
We begin our discussion of results by examining the demographic characteristics of theuninsured in each state. In general, approximately 50% of uninsured patients in ourstudy sample are white across all study states, with the remainder being mainly eitherblack or Hispanic. Some states such as Arizona have a higher percentage of Hispanicthan black; however, other states, such as New York have a higher percentage of blackthan Hispanic.10 The uninsured were equally split among males and females, and themajority of uninsured patients are between the ages of 18 and 45. Figure 1 reportstrends in total volume of uninsured patients per staffed hospital bed for NFP, FP, andpublic hospitals, respectively. We report these descriptive data on a per bed basis toaccount for variations in hospital bed size that exist across ownership categories. Asexpected, public hospitals provide the highest volume of services for the uninsuredand NFP and FP hospitals provide similar volume for uninsured patients. Table 1identifies the fifteen most common DRGs for the uninsured in our study sample in2003.11 More than half of these DRGs were identified as unprofitable services in the
9 We estimated reduced form models to assess the validity of the instruments. These models wereestimated separately for public, NFP, and FP hospitals. Different versions of models were estimated usingcontinuous financial measures and categorical versions of these measures. Overall, we estimated 18different versions of these models across the 3 ownership categories. All but three indicated that the two-year lagged financial variable was highly correlated to the one-year lagged value in the reduced formmodel (p<.05). Thus, we judged the two-year lagged financial variables to be generally good instrumentsfor the one-year lagged values.10 The states of California, Colorado, and Iowa have more than 20 percentage of missing value on the racevariable after 2000 and Washington does not provide race data at all.11 The top fifteen DRG codes in our study states are similar across study years. Therefore, we only presentthe results in 2003.
H.F. Chen et al.

literature, as noted earlier (Bazzoli et al. 2005; Gaskin 1999; Horwitz 2005;Zuckerman et al. 2001). Although trauma and burn care are not included in Table 1,these events are likely to be rare relative to more common afflictions, such as chestpain and appendectomy.
Figures 2 and 3 report trends in total volume of unprofitable services per staffedhospital bed for insured and uninsured patients, respectively, as provided by threedifferent hospital ownerships noted above. Similar to the Fig. 1, public hospitalsprovide the highest volume of unprofitable services per bed, but NFP hospitals, in
Fig. 1 Trend in total volume for uninsured patients per staffed hospital bed
Table 1 Top fifteen DRGs in study states in 2003
DRG Code DRG Title
89 Simple pneumonia and pleurisy age > 17 with CCa
127 Heart failure and Shock
143 Chest pain
167 Appendectomy without complicated principle diagnosis without CC
182 Esophagitis, gastroent & MISC digest disorders age > 17 with CC
183 Esophagitis, gastroent & MISC digest disorders age > 17 without CC
371 Cesarean section without CC
373 Virginal delivery without complicating diagnoses
390 Neonate with other significant problems
391 Normal newborn
426 Depressive neuroses
430 Psychoses
449 Poisoning and toxic effects of drugs age > 17 with CC
521 Alcohol/drug abuse or dependence with CC
523 Alcohol/drug abuse or dependence without rehabilitation therapy without CC
aCC comorbidity and complication
Hospital Financial Conditions and Provision of Unprofitable Services
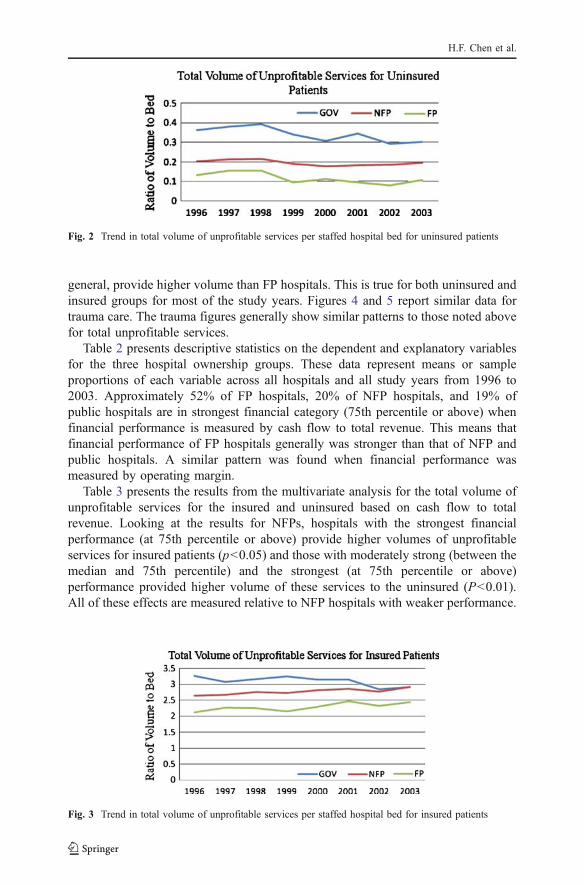
general, provide higher volume than FP hospitals. This is true for both uninsured andinsured groups for most of the study years. Figures 4 and 5 report similar data fortrauma care. The trauma figures generally show similar patterns to those noted abovefor total unprofitable services.
Table 2 presents descriptive statistics on the dependent and explanatory variablesfor the three hospital ownership groups. These data represent means or sampleproportions of each variable across all hospitals and all study years from 1996 to2003. Approximately 52% of FP hospitals, 20% of NFP hospitals, and 19% ofpublic hospitals are in strongest financial category (75th percentile or above) whenfinancial performance is measured by cash flow to total revenue. This means thatfinancial performance of FP hospitals generally was stronger than that of NFP andpublic hospitals. A similar pattern was found when financial performance wasmeasured by operating margin.
Table 3 presents the results from the multivariate analysis for the total volume ofunprofitable services for the insured and uninsured based on cash flow to totalrevenue. Looking at the results for NFPs, hospitals with the strongest financialperformance (at 75th percentile or above) provide higher volumes of unprofitableservices for insured patients (p<0.05) and those with moderately strong (between themedian and 75th percentile) and the strongest (at 75th percentile or above)performance provided higher volume of these services to the uninsured (P<0.01).All of these effects are measured relative to NFP hospitals with weaker performance.
Fig. 2 Trend in total volume of unprofitable services per staffed hospital bed for uninsured patients
Fig. 3 Trend in total volume of unprofitable services per staffed hospital bed for insured patients
H.F. Chen et al.

These findings support the hypothesis that NFP hospitals use their financialresources to expand the provision of unprofitable services. For the public andFP hospitals, the results for cash flow to total revenue are insignificant in boththe insured and uninsured models.
Among the hospital and market control variables, none were significant in themodels for insured and uninsured patients with one exception: increases in thepercentage of public beds in the county lead to higher volume of unprofitableservices provided by NFP hospitals for uninsured patients, which is opposite toour expectation. We believed this variable would capture available supply ofunprofitable services provided by other hospitals in the county, but instead, itmay be capturing unmeasured demand for these services. For the controlvariables related to health policy, increases in the ratio of Medicaid beneficiariesto the poor population were negatively related to the volume of unprofitableservices for uninsured patients across the three ownership groups (p<0.01 forNFP and FP hospitals, and p<0.05 for public hospitals), which is consistent with ourexpectation. Additionally, the interaction between the year 1999 and the state ofCalifornia is significant and negative for insured and uninsured patients in NFPhospitals (p<0.01), but is only negatively significant for uninsured patients in FPhospitals (p<0.01).
As discussed above, cash flow to total revenue measures the financialperformance resulting from all patient care and non-patient care activities, while
Fig. 4 Trend in total volume of trauma services per staffed hospital bed for uninsured patients
Fig. 5 Trend in total volume of trauma services per staffed hospital bed for insured patients
Hospital Financial Conditions and Provision of Unprofitable Services

operating margin measures the financial performance from patient business only. Wereplicated the same analysis replacing the cash flow to total revenue measure withthe operating margin measure. Table 4 summarizes the results for the operatingmargin variables by ownership type only, because results for the other variables aresimilar to those reported in Table 3.12 The results in Table 4 indicate that none of thecoefficients for the operating margin measures were significant for any of theownership categories. These results, in conjunction with those in Table 3, suggestthat hospitals use overall financial resources from all business activities, rather thanthose generated strictly from patient care, to support unprofitable services.
Finally, Table 5 reports the results for trauma care. The only significant (p<0.01)result was found for insured patients in the NFP hospital sample with the strongest
12 Results for the full models are available from the lead author upon request.
Table 2 Means and standard deviations of study variables
FPa NFPb Public
Hospital Financial Performance Category
Cash flow to total revenues
Below the median (omitted category) 32.87% (47.00) 52.67% (49.93) 54.57% (49.81)
Median to 75th percentile 15.59% (36.30) 26.92% (44.36) 26.06% (43.92)
75th percentile or above 51.54% (50.00) 20.41% (40.31) 19.38% (39.54)
Operating margin
Below the median (omitted category) 21.81% (41.32) 51.26% (49.99) 68.84% (46.34)
Median to 75th percentile 11.91% (32.40) 29.38% (45.56) 19.37% (39.53)
75th percentile or above 66.28% (47.30) 19.36% (39.51) 11.80% (32.27)
Hospital Characteristics
Number of staffed beds 179.48 (107.94) 236.89 (183.05) 192.13 (212.85)
Teaching hospital 9.97% (11.50) 7.97% (27.08) 12.69% (33.30)
Multi-hospital system member 82.60% (37.93) 54.12% (49.83) 34.41% (47.53)
Health Policy Measures
Ratio of Medicaid beneficiaries to thenumber of individuals living in poverty
1.04 (0.32) 1.05 (0.27) 1.09 (0.29)
Medicaid managed care penetration 0.55 (0.10) 0.61 (0.16) 0.55 (0.12)
Market Characteristics
Private HMO market share 0.34 (0.18) 0.28 (0.20) 0.19 (0.21)
HHIc-inpatient days 0.30 (0.26) 0.44 (0.30) 0.52 (0.35)
Proportion of population living in poverty 0.13 (0.02) 0.12 (0.03) 0.12 (0.03)
Proportion of hospital beds in county thatare publicly owned
0.12 (0.15) 0.09 (0.13) 0.58 (0.39)
Proportion of hospital beds in county thatare in teaching hospitals
0.10 (0.11) 0.13 (0.21) 0.09 (0.19)
Number of observations 1,160 5,032 1,360
a FP for-profit hospitals, bNFP not-for-profit hospitals, c Hirschman-Herfindahl Index
H.F. Chen et al.

Tab
le3
Resultsfrom
firstdifferencedinstrumentalvariablesanalysisof
unprofitableservices:cash
flow
tototalrevenue
NFP
Pub
licFP
Explanatory
Variables
Insured
Uninsured
Insured
Uninsured
Insured
Uninsured
Laggedcash
flow
tototalrevenu
e
75th
percentileor
abov
e0.840*
(0.339
)1.629*
*(0.537
)−0
.167
(0.603
)−0
.098
(1.200
)−0
.848
(1.240
)−1
.282
(1.505
)
Medianto
75th
percentile
0.360(0.210
)1.219*
*(0.333
)−0
.261
(0.379
)−0
.570
(0.754
)−1
.027
(0.937
)−1
.747
(1.137
)
HospitalCharacteristics
Num
berof
staffedbeds
(log)
−0.454
(0.371
)0.287(0.587
)0.737(0.792
)0.770(1.576
)−0
.615
(1.072
)2.509(1.301
)
Teaching
hospital
−0.077
(0.960
)0.006(1.521
)−0
.256
(0.996
)0.755(1.981
)0.399(4.349
)−0
.840
(5.279
)
Multi-hospitalsystem
mem
ber
−0.339
(0.220
)−0
.628
(0.349
)−0
.050
(0.469
)−0
.239
(0.934
)−1
.403
(1.512
)−1
.676
(1.835
)
MarketCharacteristics
Private
HMO
marketshare
1.357(0.987
)−2
.067
(1.564
)−1
.771
(2.000
)0.026(3.979
)−0
.172
(3.395
)−6
.324
(4.121
)
HHI-inpatient
days
1.404(0.952)
0.324(1.509)
−0.168
(1.825
)−6
.657
(3.632
)2.050(6.279
)5.248(7.622
)
HMO
penetration*HHI
−1.592
(2.084
)5.975(3.302
)3.974(6.291
)5.385(12.51
8)−4
.508
(9.069
)4.212(11.009)
Propo
rtionof
popu
latio
nliv
ingin
poverty
−1.388
(14.51
3)7.350(22.99
2)15
.760
(30.74
6)−4
0.39
1(61.18
1)−5
8.111(80.76
0)10
.276
(98.03
3)
MarketCharacteristics
Propo
rtionof
hospitalbeds
incounty
that
arepu
blicly
owned
1.719(0.888
)3.140*
(1.406
)−2
.102
(2.240
)1.566(4.457
)3.279(4.126
)0.796(5.008
)
Propo
rtionof
hospitalbeds
incounty
that
arein
teaching
hospitals
0.130(0.804
)0.026(1.275
)0.147(3.954
)−4
.301
(7.868
)−6
.594
(5.429
)−7
.681
(6.591
)
Health
Policy
Ratio
ofMedicaidbeneficiariesto
the
numberof
individu
alsliv
ingin
poverty
−0.292
(0.679
)−3
.006**
(1.076
)−0
.347
(1.534
)−6
.047*(3.052
)−1
.056
(3.305
)−1
0.352*
*(4.012
)
Medicaidmanaged
care
penetration
−0.036
(0.644
)−0
.609
(1.020
)−0
.509
(1.486
)−0
.698
(2.957
)−8
.435
(6.310
)−7
.287
(7.659
)
California*1999
−1.049**
(0.237
)−2
.233**
(0.375
)0.366(0.476
)−1
.822
(0.946
)−1
.585
(0.889
)−4
.232**
(1.079
)
Hospital Financial Conditions and Provision of Unprofitable Services

Tab
le3
(con
tinued)
NFP
Public
FP
Explanatory
Variables
Insured
Uninsured
Insured
Uninsured
Insured
Uninsured
YearVariables
1998
0.129(0.129
)−0
.128
(0.204
)0.103(0.287
)−0
.321
(0.571
)−0
.702
(0.864
)−0
.447
(1.048
)
1999
0.164(0.273
)−0
.012
(0.433
)−0
.005
(0.555
)−1
.888
(1.105
)−1
.286
(1.812
)−0
.213
(2.199
)
2000
0.170(0.331
)0.299(0.524
)0.264(0.660
)−1
.263
(1.314
)−1
.735
(2.316
)0.73
3(2.811)
2001
0.362(0.320
)0.431(0.507
)0.302(0.648
)−0
.724
(1.290
)−1
.364
(1.962
)0.52
4(2.382
)
2002
0.248(0.325
)0.578(0.514
)0.081(0.643
)−0
.568
(1.280
)−2
.326
(1.837
)0.01
9(2.230
)
2003
0.432(0.351
)1.020(0.556
)0.352(0.703
)0.175(1.399
)−1
.082
(1.788
)1.83
3(2.171
)
Num
berof
hospitals
3,070
855
712
*P<0.05,**P<0.01
H.F. Chen et al.

cash flow to total revenue category. All results for the operating margin modelsremain insignificant. These findings were unexpected because we believed that NFPhospitals would have the ability to adjust trauma volume more readily than otherkinds of hospital services. They appear to do so, but only in order to expand volumefor insured patients when they have strong cash flow relative to total revenues.
Discussion and Conclusion
This study provides important insights on hospital decision-making in relationto service capacity, focusing on services for which reimbursements fall short ofassociated costs. Earlier safety net institutions (mainly public or NFP hospitals)studies found that these hospitals did not eliminate certain services altogetherwhen payment pressures were present (Bazzoli et al. 2005; Zuckerman et al.2001). However, we found that NFP hospitals are likely to marginally adjusttheir volume of unprofitable services depending on their financial circum-stances. Those NFPs with stronger financial performance provide more of theseservices than those with weaker condition, ceteris paribus, especially foruninsured patients. Conversely, this implies that as financial resources becomestrained, hospitals may limit service capacity and access to care for theseservices.
Additionally, our findings when taken with other studies provide strongsupport for the Newhouse (1970) economic model of NFP hospital behavior.His model suggested that NFPs seek to maximize a utility function based onquality and quantity, increasing both to the point where total revenues equaltotal cost. This implies that NFPs with more financial resources will providehigher quality and greater quantities of subsidized health services, ceterisparibus. Prior studies have found that NFPs with better financial performanceprovide higher quality of care (Encinosa and Bernard 2005; Bazzoli et al. 2008).Our study complements this earlier work by showing that stronger NFP financialperformance may lead to more unprofitable service provision as well.
Table 4 Results from first differenced instrumental variables analysis of unprofitable services: operatingmargin
NFP Public FP
Insured Uninsured Insured Uninsured Insured Uninsured
Lagged operating margin
75thpercentileor above
−0.078 (0.400) 1.020 (0.689) −1.787 (1.659) 3.763 (3.669) 0.915 (1.545) 1.470 (1.970)
Median to75thpercentile
−0.041 (0.215) 0.456 (0.370) −0.141 (0.599) 0.685 (1.324) 1.561 (1.187) 0.579 (1.514)
*P<0.05, **P<0.01
Hospital Financial Conditions and Provision of Unprofitable Services

Tab
le5
Resultsfrom
firstdifferencedinstrumentalvariablesanalysisof
traumaservices:cash
flow
tototalrevenueandoperatingmargin
NFP
Pub
licFP
Insured
Uninsured
Insured
Uninsured
Insured
Uninsured
Laggedcash
flow
tototalrevenue
75th
percentileor
abov
e0.947*
*(0.330
)1.137(0.864
)−0
.675
(0.646
)1.707(1.409
)−0
.202
(1.113
)2.721(1.752
)
Medianto
75th
percentile
0.253(0.205
)0.931(0.535
)−0
.238
(0.406
)1.531(0.885
)−0
.511
(0.841
)2.043(1.324
)
Laggedoperatingmargin
75th
percentileor
abov
e0.387(0.406
)0.159(1.164
)−1
.289
(1.717
)−1
.077
(4.282
)0.828(1.404
)4.319(2.337
)
Medianto
75th
percentile
0.079(0.218
)−0
.325
(0.626
)−0
.212
(0.620
)1.496(1.545
)1.298(1.079
)0.088(1.796
)
*P<0.05
,**P<0.01
H.F. Chen et al.

The results for the two different financial performance measures also provideimportant insights. We found that NFP provision of unprofitable services wassignificantly related to the ratio of cash flow to total revenues but not to operatingmargin. This finding suggests that NFP hospitals do not simply use net incomederived from patient care to cross-subsidize health services that have poorreimbursement or that are commonly used by the uninsured. Instead, they focus onthe complete financial picture for an institution. Low operating margins can be offsetby other sources of hospital financial support and these seem to be important forproviding unprofitable services, especially for the uninsured.
The demographics of the uninsured in our study sample are consistent withnational data, indicating that the majority of the uninsured are white and that there isa disproportionate share of the uninsured population that are Hispanic or Black(Department of Health and Human Services 2005), However, our study has severalimportant limitations to note. First, we focus on only nine states and thus, thefindings may not generalize to hospitals overall in the US. Second, our models didnot yield many significant findings, which was a surprise given that many of thecontrol variables examined were used in earlier studies of uncompensated care (c.f.,Davidoff et al. 2000). We believed that they would thus be relevant in our models,especially for unprofitable service provision for the uninsured. More focused studyand model development for the specific services studied may be needed throughfuture research. Third, we recognize that our approaches for dealing with theviolation of strict exogeneity in the empirical models, namely the use of firstdifference models with instrumental variables, have limitations. Ideally, one wouldwant to study the effects of exogenous shocks that affect hospital decision-makingand behavior. Although payment policy changes in 1997 through the BalancedBudget Act may have initially represented such an exogenous shock, examination ofhospital response to their changing financial condition through subsequent years,such as through 2003 in this study, lacks such an exogenous change to isolateresulting effects.
Although this study has limitations, our findings have important implications forhealth care policy. First, there has been substantial debate about NFPs and thecommunity benefit they provide. In large measure, this debate has focused onwhether NFP tax exemptions are justified, namely are NFPs creating sufficientcommunity benefit to warrant these exemptions. Our findings provide evidence thatNFPs with strong financial performance are using their profits to provide moreunprofitable services, especially for the uninsured. Thus, these more profitable NFPsthat would have had to pay more taxes than NFPs with weaker financial status (ifNFPs were taxed) do appear to be providing greater amounts of community benefitin terms of care for the uninsured and provision of subsidized services. Of course,more research is needed to determine whether resulting levels of care are sufficientto justify tax exemptions, and whether the financial burden of unprofitable servicesshould be compensated through favorable tax status or through cross-subsidizationin some other way.
A second policy implication of the study relates to hospital payment policy. Asnoted in the introduction of the paper, it is widely recognized that some hospitalservices are paid at rates that exceed associated costs and others have payments lessthan costs. Researchers have commented on how these payment policies can create
Hospital Financial Conditions and Provision of Unprofitable Services

disincentives and distortions in health care delivery (Ginsburg and Grossman 2005).Our study documents one such distortion, namely that NFP hospitals may change thelevel of unprofitable services offered depending on their overall financial condition.This could leave patients, whether insured or uninsured, without ready access toneeded services. It is worthwhile to conduct additional research to identify the typesof delivery distortions that occur given the incentives present in payment policy.Such evidence might help convince policy makers to increase the pace at which theyreevaluate and address existing distortions in payment policies.
References
Banks, D. A., Paterson, M., & Wendel, J. (1997). Uncompensated hospital care: Charitable mission orprofitable business decision. Health Economics, 6, 133–143. doi:10.1002/(SICI)1099-1050(199703)6:2<133::AID-HEC252>3.0.CO;2-X.
Bazzoli, G. J., Chen, H. F., Zhao, M., & Lindrooth, R. C. (2008). Hospital financial condition and qualityof care. Health Economics, 17, 977–995. doi:10.1002/hec.1311.
Bazzoli, G. J., Kang, R., Hasnain-Wynia, R., & Lindrooth, R. C. (2005). An update on safety-nethospitals: Coping with the late 1990s and early 2000s. Health Affairs, 24(4), 1047–1056. doi:10.1377/hlthaff.24.4.1047.
Bazzoli, G. J., Lindrooth, R. C., Kang, R., & Hasnain-Wynia, R. (2006). The influence of health policyand market factors on the hospital safety net. Health Services Research, 41(4 Part 1), 1150–1180.
Branas, C. C., MacKenzie, E. J., Williams, J. C., Schwab, C. W., Teter, H. M., Flanigan, M. C., et al.(2005). Access to trauma centers in the United States. Journal of the American Medical Association,293(21), 2626–2633. doi:10.1001/jama.293.21.2626.
Cunningham, P. J., Bazzoli, G. J., & Katz, A. (2008). Caught in the competitive crossfire: Safety-netproviders balance margin and mission in a profit-driven health care market. Health Affairs-WebExclusive, 27(5), w374–w382. doi:10.1377/hlthaff.27.5.w374.
Davidoff, A., LoSasso, A. T., Bazzoli, G. J., & Zuckerman, S. M. (2000). The effects of changing statehealth policy on hospital uncompensated care. Inquiry, 37(3), 253–267.
Department of Health and Human Services. (2005). Overview of the uninsured in the United States: Ananalysis of 2005 Current Population Survey. ASPE Issue Brief. http://aspe.hhs.gov/health/reports/05/uninsured-cps/ib.pdf. Accessed 2/22/09.
Dranove, D., Shanley, M., & White, W. D. (1993). Price and concentration in hospital markets: The switchfrom patient-driven to payor-driven competition. The Journal of Law & Economics, 36(1 part 1),179–204. doi:10.1086/467270.
Encinosa, W. E., & Bernard, D. M. (2005). Hospital finances and patient safety outcomes. Inquiry, 42(1),60–72.
Foster, D. G., Klaisie, C., Blum, M., Bradsberry, M., Barindis, C. D., & Stewart, F. H. (2004). Extendedstate-funded family planning service: Estimating pregnancies averted by the family PACT program inCalifornia, 1997–1998. American Journal of Public Health, 94(8), 1341–1346. doi:10.2105/AJPH.94.8.1341.
Gaskin, D. (1999). Safety net hospitals: Essential providers of public health and specialty services. NewYork: Commonwealth Fund.
Gaskin, D. J., Hadley, J., & Freeman, V. G. (2001). Are urban safety-net hospitals losing low-riskMedicaid maternity patients? Health Services Research, 36(1), 25–51.
Ginsburg, P. B., & Grossman, J. M. (2005). When the price isn’t right: How inadvertent paymentincentives drive medical care. Health Affairs- Web Exclusive, 10, w5-376 -84.
Hoerger, T. (1991). “Profit” variability in for-profit and not-for-profit hospitals. Journal of HealthEconomics, 10(3), 259–289. doi:10.1016/0167-6296(91)90030-Q.
Horwitz, J. R. (2005). Making profits and providing care: Comparing nonprofit, for-profit, andgovernment hospitals. Health Affairs, 24(3), 790–796. doi:10.1377/hlthaff.24.3.790.
Kane, N. M., & Magnus, S. A. (2001). The Medicare Cost Report and the limits of hospital accountability:Improving financial data. Journal of Health Politics, Policy and Law, 26(1), 81–105. doi:10.1215/03616878-26-1-81.
H.F. Chen et al.

MacKenzie, E. J., Rivara, F. P., Jurkovich, G. J., Nathens, A. B., Frey, K. P., Egleston, B. L., et al. (2006).A national evaluation of the effect of trauma center care on mortality. New England Journal ofMedicine, 354(4), 366–378. doi:10.1056/NEJMsa052049.
Mark, B. A., Harless, D. W., & McCue, M. (2005). The impact of HMO penetration on the relationshipbetween nurse staffing and quality. Health Economics, 14, 737–753. doi:10.1002/hec.988.
Medicare Payment Advisory Commission (MedPAC). (2008). A data book: Healthcare spending and theMedicare program, June. Washington, DC. http://www.medpac.gov/documents/Jun08DataBook_Entire_report.pdf accessed 11/08/08.
Newhouse, J. P. (1970). Toward a theory of nonprofit institutions: An economic model of a hospital. TheAmerican Economic Review, 60(1), 64–74.
Nathens, A. B., Jurkovich, G. J., MacKenzie, E. J., & Rivara, F. P. (2004). A resource-based assessment oftrauma care in the United States. Journal of Trauma, 56(1), 173–178. doi:10.1097/01.TA.0000056159.65396.7C.
Schlesinger, M., & Gray, B. H. (2006). How nonprofits matter in American medicine, and what to doabout it. Health Affairs, 25(4), w287–w303. doi:10.1377/hlthaff.25.w287.
Weisbrod, B. A. (1980). Private goods, collective goods: The role of the nonprofit sector. In K. Clarkson& D. Martin (Eds.), The Economics of Nonpropriety Organizations, research in law and economics,Supplement 1 (pp. 139–177). Greenwich: JAI Press, Inc.
Wooldridge, J. M. (2003). Introductory econometrics: A modern approach (2nd ed.). Mason, Ohio,South-Western.
Zuckerman, S., Bazzoli, G. J., Davidoff, A., & LoSasso, A. (2001). How did safety-net hospitals cope inthe 1990s? Health Affairs, 20(4), 159–167. doi:10.1377/hlthaff.20.4.159.
Hospital Financial Conditions and Provision of Unprofitable Services