
Honourary Scientific Committee - ABAF Brno
406
-
Upload
khangminh22 -
Category
Documents
-
view
4 -
download
0
Transcript of Honourary Scientific Committee - ABAF Brno

Book of Proceedings August 26th - August 30th 2012
Organised by:
Department of Electrical and Electronic Technology,Faculty of Electrical Engineering and Communication,
Brno University of Technology
Organizing committee:Jiří Vondrák
Marie SedlaříkováMarie Sedlaříková
This meeting will be co-sponsored by The Electrochemical Society

Honourary Scientific Committee: Arnaldo Visitin Jaromír Kadlec Petr Vanýsek Bruno Scrosati Doron Aurbach Maciej Kopczyk Vito di Noto Jiří Kazelle Jiří Vondrák Marie Sedlaříková Organisation Committee: Jiří Vondrák Marie Sedlaříková Vítězslav Novák Jiří Wagner Miroslav Zatloukal Tomáš Kazda Zuzana Štichová Jiří Libich Program Committee: Jiří Vondrák Marie Sedlaříková Arnaldo Visitin Germano Ferrara Vítězslav Novák Petr Bača Tomáš Kazda Jiří Špinka Helena Polsterová Martin Frk Edita Hejátková Miroslav Zatloukal
ISBN 978-80-214-4610-6

Conference is sponsored by:
This meeting will be co-sponsored by The Electrochemical Society
We would like to express our thanks to the Brno University of Technology, Faculty of Electrical Engineering and Communication and to the Institute of Inorganic Chemistry AS CR for support and help with organising 13th ABAF conference.

Partners:
Media partners:

Contents Inorganic Materials for Power Sources
Lota, G., Sierczynska, A., Lota, K. AB5-TYPE HYDROGEN STORAGE ALLOY MODIFIED WITH CARBON USED AS ANODIC MATERIALS IN BOROHYDRIDE FUEL CELL .............................................................................. 10 Danilov M.O., Kolbasov G.Ya., Rusetskii I.A., Slobodyanyuk I.A. ELECTROCATALYTIC PROPERTIES OF REDUCED GRAPHENE OXIDE IN OXYGEN ELECTRODE ................................................................................................................................ 17 Fuel cells and methods
Okada, T., Takahashi, T., Ono, Ch., Kyotani, M., Kimura, S., Matsushita, S., Akagi, K. LOW-COST FUEL CELL MATERIALS MADE FROM NEW SOURCES ........................................ 23
Vanýsek, P. ELECTROCHEMICAL IMPEDANCE SPECTROSCOPY – JUST ONE OF MANY TOOLS TO STUDY BATTERIES AND POWER SOURCES ...................................................................... 33
Alrahmani, M., Chen, R., Ibrahim, S. A NUMERICAL STUDY ON THE EFFECTS OF GAS CHANNEL WETTABILITY IN PEM FUEL CELLS: STRAIGHT CHANNEL ........................................................................................... 43 Cruz-Manzo, S., Chen, R. ANALYSIS OF THE PERFORMANCE OF A POLYMER ELECTROLYTE FUEL CELL STACK USING SIMULTANEOUS ELECTROCHEMICAL IMPEDANCE SPECTROSCOPY MEASUREMENTS ........................................................................................................................ 54 Jinuntuya, F., Chen, R., Ostadi, H., Jiang, K., Gao, Y., Zhang, X. THE IMPACTS OF IMAGE RESOLUTION ON PERMEABILITY SIMULATION OF GAS DIFFUSION LAYER USING LATTICE BOLTZMANN METHOD .................................................... 66 Xu, W., Danilov, D., Gao, L., Oudenhoven, J. F. M., Pop, V., Notten, P. H. L. Theoretical Modeling of (electro) CHEMICAL kinetics of Homogeneously Mediated Anode Reactions in Glucose-based Bio-Fuel Cells ................................................................................... 75 McCarthy, N., El-Kharouf, A., Chen, R., Bujalski, W. THE IMPACT OF CATHODE GAS DIFFUSION LAYER STRUCTURE ON FUEL CELL PERFORMANCE .......................................................................................................................... 85 Vesely, I., Zezulka, F., Sembera, J., Sajdl, O. PROBLEMS OF ENERGY SAVING IN ELECTRICAL EXPERIMENTAL SMART GRID MODEL (E.E.S.) ............................................................................................................................ 93

Lithium-ions accumulators
Thomas, J. E., Castro, E.B., Milocco, R.H., Visintin, A. PERFORMANCE OF LiFePO4/C AND CARBON FIBERS COMPOSITE AS CATHODES IN LITHIUM-ION BATTERIES AND BATTERY MODELING ............................................................ 101 Amalraj, S. F., Markovsky, B., Talianker, M., Sclar, H., Sharon, D., Burlaka, L., Zinigrad, E., Haik, O., Martha, S. K., Aurbach, D. STUDY OF THE LAYERED COMPOUNDS Li[LiMnNiCo]2 AS POSITIVE ELECTRODES IN LITHIUM CELLS: SYNTHESIS, ELECTROCHEMICAL BEHAVIOR, AND SURFACE CHEMISTRY ............................................................................................................................... 106 Półrolniczak, P., Walkowiak, M., Wrona, A., Martyła, A., Kopczyk, M. SYNTHESIS AND ELECTROCHEMICAL LITHIUM INSERTION INTO SKUTTERUDITE-TYPE CoSb3 ................................................................................................................................ 116 Sedlaříková, M., Vondrák, J., Dvořák, O., Buřičová,H., Libich, J. SAFETY OF LITHIUM BATTERIES ............................................................................................. 125 Cech, O., Kovar, P., Sedlarikova, M., Vondrak, J. BROOKITE TiO2 NANORODS FOR LITHIUM-ION ANODES ...................................................... 134 Červinka, D., Vorel, P. IMPACT OF FAST-CHARGERS FOR TRACTION BATTERIES ON DISTRIBUTION NETWORK .................................................................................................................................. 138
Kaválek, O., Vondrák, J., Sedlaříková, M. ELECTROCHEMICAL DEPOSITION OF TIN AND SILICON STUDIED BY EQCM..................... 146
Sedlaříková, M., Kazda, T., Vondrák, J. EFFECT OF POTASSIUM ON THE STABILITY OF THE STRUCTURE OF LiCoO2 ............................... 152
Sedlaříková, M., Vondrák, J., Libich, J., Dvořák, O., Buřičová, H. ENHANCE CAPACITY AND SAFETY OF LITHIUM-ION ACCUMULATORS .............................. 163
Vyroubal, P., Maxa, J., Kazda, T., Vondrák, J. MODELING AND NUMERICAL SIMULATION OF LITHIUM ION BATTERY ............................... 169 Ferrara, G., Arbizzani, C., Damen, L., Guidotti, M., Lazzari, M., Vergottini, F. G., Inguanta, R., Piazza, S., Sunseri, C., Mastragostino, M. MONODIMENSIONAL AMORPHOUS SnCo ARRAYS AS HIGH PERFORMING ANODES FOR LITHIUM ION BATTERIES.................................................................................................. 176 Supercapacitors Lota, K., Lota, G., Sierczynska, A., Kopczyk, M., Acznik, I. ASYMMETRIC CAPACITORS BASED ON CONDUCTING POLYMERS AND METAL OXIDE/CARBON COMPOSITES AS ELECTRODES .................................................................. 185

Lota, K., Lota, G., Sierczynska, A. CARBON NANOTUBES AS A SUPPORT OF ELECTRODE ACTIVE MATERIAL FOR ELECTROCHEMICAL CAPACITORS ......................................................................................... 194 Alkaline accumulators Sierczynska, A., Swoboda, P., Lota, K., Lota, G., Kopczyk, M. INVESTIGATION OF ELECTROCHEMICAL PROPERTIES OF AB2/AB5-TYPE HYDROGEN STORAGE ALLOYS AS ANODIC MATERIALS FOR HIGH ENERGY Ni-MH CELLS ................. 201 Máca, T., Nezgoda, L., Vondrák, J., Sedlaříková, M. EFFECT OF COBALT ADDITION ON STRUCTURE AND ELECTROCHEMICAL BEHAVIOUR OF NICKEL HYDROXIDE SYNTHESIZED BY CHEMICAL PRECIPITATION METHOD UNDER DIFFERENT CONDITIONS ........................................................................... 208 Sierczynska A., Kopczyk M., Woch M., Swoboda P., Lota K., Lota G. THE EFFECT OF NICKEL CONTENT IN NEGATIVE MASS ON ELECTRODE CAPABILITY IN Ni-MH SYSTÉM ...................................................................................................................... 217
Kunovjánek, M., Vondrák, J. PVA/KOH MEMBRANE FOR ELECTROLYSIS WITH HIGH CONDUCTIVITY FOR ELECTROLYSIS ......................................................................................................................... 224
Sierczynska, A., Wrona, A., Lota, K., Lota, G., Swoboda, P., Kopczyk, M. CARBON MODIFICATIONS OF AB5-TYPE HYDROGEN STORAGE ALLOY USED AS ANODE MATERIALS IN Ni-MH CELLS ....................................................................................... 229
Chladil, L., Dvořák, P. MEASUREMENT OF IMPEDANCE CHANGES OF POROUS Ni(OH)2 POSITIVE ELECTRODES AT DIFFERENT STATE OF CHARGE ............................................................... 236 Lead-acid batteries Vyroubal, P., Maxa, J., Tichý, J., Bača, P., Křivík, P. SIMULATION AND MATHEMATICAL DESCRIPTION OF CHARGING AND DISCHARGING OF THE LEAD ACID ACCUMULATOR ....................................................................................... 240 Abraham, P., Bača, P., Vaculík. S. ACTIVE MASS AND COLLECTOR RESISTIVITY AND IMPEDANCE CHANGES OF PULSE CHARGED LEAD-ACID ACCUMULATOR .................................................................................. 247 Abraham, P., Bača, P., Vaculík. S. INFLUENCE OF VARIOUS AMOUNTS OF TITANIUM DIOXIDE IN NEGATIVE PLATE TO IMPEDANCE PROPERTIES OF LEAD-ACID ACCUMULATOR ........................................... 253 Křivík, P. HEAT CHANGES IN THE LEAD ACID BATTERY CELL ............................................................. 258

Křivík, P., Bača, P., Tošer, P. CONDUCTIVE CERAMIC AS AN ADDITIVE OF NEGATIVE ACTIVE MASS OF LEAD ACID BATTERY .................................................................................................................................... 263 Wesołowski J., Lula M. INFLUENCE OF CHEMICAL COMPOSITION OF LEAD ALLOYS USED IN LEAD-ACID BATTERIES ON THEIR ELECTRICAL PERFORMANCE ........................................................... 268 Electrolytes Barbashov, V., Nesova, E., Pismenova, N. LAPLACE’S PRESSURE INDUCED RHOMBOHEDRAL PHASE IN THE SCANDIA-STABILIZED ZIRCONIA CERAMICS ......................................................................... 275 Frk, M., Máca, J., Rozsívalová, Z. DYNAMIC VISCOSITY OF SOLVENTS FOR ELECTROLYTES OF LITHIUM-ION ACCUMULATORS ...................................................................................................................... 279 Máca, J., Vondrák, J., Sedlaříková, M. USE OF DIMETHYL SULFONE IN APROTIC ELECTROLYTES ................................................ 286 Musil, M., Kunovjanek, M., Cech, O., Pleha, D. MEMBRANES FOR ALKALINE ACCUMULATORS .................................................................... 291 Prokhorov, I. Yu., Radionova, O. I., Akimov, G. Ya. MECHANISMS OF IONIC CONDUCTION IN PVA BASED NANOCOMPOSITES ...................... 296 Subarda, J., Kunovjanek, M., Musil, M., Novak, V. PVA MEMBRANES FOR THE PEM FUEL CELLS ...................................................................... 302 General material research Binar, T., Dvořák, I., Kadlec, J., Joska, Z., Korecki, Z., Kvapilová, P. CRITICAL CRACK LENGTH FOR THE INITIATION OF UNSTABLE PROPAGATION IN RELATION TO FRACTURE TOUGHNESS AND THE EVALUATION OF STRESS AND DEFORMATION CHARACTERISTICS OBTAINED FROM TENSILE TESTING ......................... 309 Kadlec, J., Joska, Z., Kadlec, J., jr. STUDY OF BIOCOMPATIBLE ZrN AND ZrN/DLC COATING DEPOSITED ON MEDICAL TOOLS ........................................................................................................................................ 317 Máca, J., Abraham, P., Bača, P. APPLICATION OF WIND TURBINE TO TEACHING ................................................................... 322 Electric vehicles Morte, M., Doucek, A., Kyncl, J. THE HYDROGEN BUS AS A MATHEMATICAL MODEL IN MATLAB© – ITS ACTUAL OPERATION ............................................................................................................................... 329

Červinka, D., Vorel, P. HIGH-POWER CHARGER FOR SUPER-EL ELECTRIC PASSENGER CAR ............................. 337 Kuzdas, J., Vorel, P. PARASITIC EFFECTS IN POWER CIRCUITS OF HIGH POWER BATTERY CHARGERS ........ 345 Prochazka, P., Pazdera, I., Bencalik, K. USAGE OF THE FUEL CELL-POWERED ELECTRIC DRIVE IN AVIATION .............................. 351 Photovoltaics Šimonová, L., Vaněk, J., Demchikhin, S. RECYCLING OF PHOTOVOLTAIC CELLS WITH THE POSSIBILITY OF RE-USE SOME COMPONENTS........................................................................................................................... 359 Tošer, P., Bača, P., Neoral, J. THE WAYS HOW TO MEASURE THE CHARACTERISTICS OF THE SOLAR CELL ................. 364 Vanek, J., Strnadel, J. LONG TIME MONITORING OF HEAT DISTRIBUTION IN PHOTOVOLTAIC MODULE BY THE THERMOVISION ........................................................................................................... 369 Vanek, J., Kaderka, T. V-I CHARACTERISTIC MEASUREMENT OF SOLAR CELL ...................................................... 377 Maxa, J., Vyroubal, P., Vaněk, J., Solčanský, M. DESIGN AND OPTIMALIZATION OF CONCENTRATOR SOLAR PANELS COOLING SYSTEM USING COMPUTER SIMULATION ............................................................................. 385 Styczyński S., Missol W., Rydzyńska B., Szal D., Kopczyk M. PERFORMANCE OF THERMAL CELLS, BASED ON Mg-PbSO4 ELECTROCHEMICAL SYSTEM, MADE FROM POWDER MATERIÁL .......................................................................... 393
Cipin, R., Kadlec, J., Klima, B., Hutak, P. BATTERY SYSTEM FOR THE AIRPLANE VUT 051 RAY .......................................................... 400

13th Advanced Batteries, Accumulators and Fuel Cells Inorganic Materials for Power Sources
AB5-TYPE HYDROGEN STORAGE ALLOY MODIFIED WITH CARBON USED AS ANODIC MATERIALS IN BOROHYDRIDE
FUEL CELL
Lota, G.1,2, Sierczynska, A.1, Lota, K.1
1 Institute of Non-Ferrous Metals Division in Poznan, Central Laboratory of Batteries and Cells, Forteczna 12, 61-362 Poznan, Poland
2 Institute of Chemistry and Technical Electrochemistry, Poznan University of Technology, 60-965 Poznan, Piotrowo 3, Poland
Corresponding author: Grzegorz Lota ([email protected]) Phone: + 48 61 2797808 Fax: + 48 61 2797897
Abstract
Direct fuel cell utilizing borohydrides as a fuel (DBFC) is a device which converts chemical energy stored in borohydride ion and an oxidant directly into electricity. In this work the electrochemical properties of multi-component hydrogen storage alloy of the AB5-type: LaMmNi3,55Al0,30Mn0,40Co0,75 modified with carbon and used as anodic materials in borohydride fuel cell (BFC) are discussed. Composites with a small amount of carbon were obtained by direct pyrolysis on hydrogen storage alloy or carbonization of conducting polymers, done in order to improve the hydrogen electrosorption properties. The electrochemical properties were examined in 6 M KOH solution with the addition of different amount of KBH4 using cyclic voltammetry and galvanostatic methods.
Introduction
Borohydrides of Na, K or Li are attractive as a hydrogen sources or as a fuel for DBFC. In such fuel cell, H− in BH4
− is oxidized into H+ directly on the anode; generally, the process provides eight electrons. The fuel cell has been developed, based on the following equation [1,2]:
BH4- + 8 OH- BO2
- + 6 H2O + 8 e- E0 = -1.24 V [1]
Additional advantage of such systems is that Ni-based catalysts can be used to replace noble metals. Multi-component alloys of the AB5-type are characterized by high electrochemical catalytic activity to the oxidation of hydrogen, therefore, they can be used as an anode materials in borohydride fuel cell [1,3]. Different kinds of modification were done in order to improve process of fuel utilization, e.g. doping by Au or Si to AB5-type hydrogen storage alloy [4,5].
In this work the electrochemical properties of hydrogen storage alloy: LaMmNi3,55Al0,30Mn0,40Co0,75 modified with carbon used as anodic material in DBFC for improvement of the hydrogen electrosorption properties were examined.
10

13th Advanced Batteries, Accumulators and Fuel Cells Inorganic Materials for Power Sources
Experimental
The AB5-type alloy of formulas LaMmNi3.55Al0.30Mn0.40Co0.75 with the average diameter of 57.06 μm was modified. The chemical composition of this alloy was: Mm=La-rich mischmetal: 33.1 wt.%, La: 53.3 wt.%; Ce: 33.7 wt.%; Nd: 9.8 wt.%; Pr: 3.2 wt.%; other rare earths: 66.9 wt.%, Ni: 47.8 wt.%; Co: 10.12 wt.%; Mn: 5.10 wt.%; Al: 1.86 wt.%. Composites AB5-type alloy with a small amount of carbon were obtained by two methods. First type of composites were obtained by catalytic vapour deposition (CVD method) of acetylene directly on grains of alloy (700 °C, 5 minutes). The second type of composites was prepared by chemically precipitating of polyaniline (PANI), polypyrrole (PPy), and polyfurfuryl alcohol (80oC) on the alloy material. Then, composites were heated in the nitrogen at 500oC-700oC. The carbon content was estimated using elemental analyzer VARIO MICRO CUBE (Elementar Analysensysteme GmbH). A scanning electron microscope (SEM EVO®40 ZEISS) was used to investigate the structure of the composite materials. Specific surface area measurements were performed using ASAP 2010 M (Micromeritics) instrument. To prepare the testing electrode, the composite material with AB5 type alloy and carbon nanomaterial was mixed with a 3 wt.% poly(vinyl alcohol) (PVA) solution as a binder. The mixture was then blended to obtain the paste and subjected
slurry was then pasted into nickel foam (porosity 95%) to form a 1cm x1cm electrode. After drying at 50°C, the pasted electrode was pressed at 10 MPa. A three- electrode measurement system was composed of the testing electrode, the counter - nickel foam electrode and an Hg/HgO electrode as the reference electrode. Before electrochemical testing, the electrodes were chemically preactivated by boiling in 6 M KOH solution. The electrochemical properties were examined in 6 M KOH solution (vs. Hg/HgO) with the addition of different amount of KBH4. The electrochemical measurements have been
carried out using cyclic voltammetry (OCP -0,4V -1,2V) and galvanostatic methods using potentiostat - galvanostat VMP2/Z (Biologic, France).
Results and discussion
Table 1 presents sample names with physicochemical data. AU is abbreviation for AB5-type alloy and C means after carbonization process. Composites contain a small amount of carbon between 0.38 to 1.32 wt.%. Process of precipitating and carbonization of conducting polymers leads to increase of BET surface area.
Table 1: Elemental analysis and surface area data for metal/carbon composites.
Sample Carbon precursor Content of carbon BET surface area,
m2
g-1
AU-PANI-C Polyaniline 0.56 0.11 2.68 0.01
AU-PPy-C Polypyrrole 0.38 0.07 2.33 0.01
GLA2 Acetylene 1.32 0.16 0.34 0.01
AU - - 0.29 0.01
11

13th Advanced Batteries, Accumulators and Fuel Cells Inorganic Materials for Power Sources
a b
c d
Fig. 1: SEM images of: (a) LaMmNi3.55Al0.30Mn0.40Co0.75 (AB5) after reduction H2 and (b-d) after deposition of nano-carbon by acetylene.
The SEM images of the composites with different kinds of carbon deposits were divided into two figures. Fig. 1 presents SEM images of the AB5-type alloy after reduction H2 and composites obtained by catalytic vapour deposition (CVD) of acetylene directly on grains of alloy. During vapour deposition carbon forms nanofibrous structures. Fig. 2 presents SEM of the carbon composites which were obtain by polymerization of polyaniline (PANI), polypyrrole (PPy) and polyfurfuryl alcohol on the alloy material. After polymerization composites were carbonized in nitrogen atmosphere. The composites which were obtained by carbonization of conducting polymers (PANI, PPy) and have demonstrated homogenous carbon layers with visible pores, whereas in the images of composite with polyfurfuryl alcohol some fibrous structures are well visible.
Fig. 2: SEM images of: (a) AU-PANI-C, (b) AU-PPy-C and (c-d) composites with polyfurfuryl alcohol.
12

13th Advanced Batteries, Accumulators and Fuel Cells Inorganic Materials for Power Sources
In the first step, the electrochemical properties of LaMmNi3.55Al0.30Mn0.40Co0.75 were examined in 6 M KOH solution with the addition of different amount of KBH4. Fig. 3. shows I-E curves of parent alloy using different concentration of KBH4. The highest value of potential of electrode versus Hg/HgO was obtained for 0.5 M KBH4. The most visible decrease of potential electrode with the increase of current load is for 0.05 and 0.1 M concentration of KBH4. The electrochemical performance of electrode based on AB5 alloy for BH4
- oxidation in different KBH4 concentration is characterized by cyclic votammograms
tests at 5 mV/s within the potential window: Er -0,4V -1,2V Er. Fig. 4. presents CV curves measured for different concentration of the fuel. As shown in figure, with the positive scan process, the oxidation current increases, indication the presence of electrochemical reaction. The highest increase of anodic current is visible for 0.5 M KBH4 concentration.
-1.2
-1
-0.8
-0.6
-0.4
-0.2
0
0 50 100 150 200
E /
V v
s H
g/H
gO
I / mA g-1
0.05 M 0.10 M 0.25 M 0.50 M
Fig 3: Polarization characteristics for different concentration of KBH4.
-800
-600
-400
-200
0
200
400
600
800
-1,2 -1,1 -1 -0,9 -0,8 -0,7 -0,6 -0,5 -0,4
I /
mA
g-1
E / V vs Hg/HgO
0.05 M 0.10 M 0.25 M 0.50 M
Fig. 4: Cyclic voltammetry characteristics (5mV/s, Er -0,4V -1,2V Er) for different concentration of KBH4.
13

13th Advanced Batteries, Accumulators and Fuel Cells Inorganic Materials for Power Sources
After selection of the optimal KBH4 concentration, polarization characteristics were performed for composite materials. Fig. 5, Fig. 6 and Fig. 7 show polarization characteristics: for composites with polyfurfuryl alcohol and carbon from CVD method, for composites with PANI and for composites with PPy, respectively. The most promising characteristic has been recorded for composite materials with polyfurfuryl alcohol after carbonization and nanocarbon obtained by CVD method. The lowest efficiency of oxidation was observed for AU-PANI composite, which might be attributed to low activity of polymer in alkaline solution. In all cases the addition 10% of Ni improves BH4
- oxidation process.
-1.2
-1
-0.8
-0.6
-0.4
-0.2
0
0 50 100 150 200 250 300
E /
V v
s H
g/H
gO
I / mA g-1
GLA2 GLA2+10%Ni AuRAF1 AuRAF1+10%Ni AuRAF2
Fig. 5: Polarization characteristics for composites with polyfurfuryl alcohol and carbon from CVD method.
-1.2
-1
-0.8
-0.6
-0.4
-0.2
0
0 50 100 150 200 250 300
E /
V v
s H
g/H
gO
I / mA g-1
AU-PANI AU-PANI+10%Ni AU-PANI-C AU-PANI-C+10%Ni
Fig. 6: Polarization characteristics for composites with PANI.
14

13th Advanced Batteries, Accumulators and Fuel Cells Inorganic Materials for Power Sources
-1.2
-1
-0.8
-0.6
-0.4
-0.2
0
0 50 100 150 200 250 300
E /
V v
s H
g/H
gO
I / mA g-1
AU-PPy AU-PPy+10%Ni AU-PPy-C AU-PPy-C+10%Ni
Fig. 7: Polarization characteristics for composites with PPy.
Fig. 8 presents the discharge curves of AU-PANI-C composite under different current load. With the increase current load fade of electrode potential is observed.
-1.2
-1
-0.8
-0.6
-0.4
-0.2
0
0 1000 2000 3000 4000 5000 6000 7000 8000
E / V
vs
Hg
/Hg
O
t / s
10 mA/g 20 mA/g 50 mA/g 100 mA/g 150 mA/g
Fig. 8: The discharge curves of AU-PANI-C composite.
Fig. 9 presents the discharge curves of GLA2 composite under different current load. With the increase current load negligible fade of electrode potential is observed. In the first minutes, the electrode potential decreases due to the decrease of fuel concentration on the surface of the composite, and then, a dynamic equilibrium is reached.
15

13th Advanced Batteries, Accumulators and Fuel Cells Inorganic Materials for Power Sources
-1.2
-1
-0.8
-0.6
-0.4
-0.2
0
0 1000 2000 3000 4000 5000 6000 7000 8000
E / V
vs
Hg
/Hg
O
t / s
10 mA/g 20 mA/g 50 mA/g 100 mA/g 150 mA/g 200 mA/g 250 mA/g
Fig. 9: The discharge curves of GLA2 composite.
Conclusion
Potassium borohydride is an attractive fuel for DBFC. The highest values of electrode polarization potentials were obtained for 0.5 M KBH4 in 6 M KOH electrolyte. Composites with a small amount of carbon (0.4 – 1.3 %) were obtained by direct pyrolysis on hydrogen storage alloy or carbonization of conducting polymers. Process of carbonization (temperature treatment) destroys the structure LaNi5 of alloys and aggravates its electrochemical behaviour. The most promising characteristic has been recorded for composite materials with polyfurfuryl alcohol after carbonization and nanocarbon obtained by CVD method. Addition 10% of Ni improves BH4
- oxidation process. The lowest efficiency of oxidation was observed for AU-PANI composite, which might be attributed to low activity of polymer in alkaline solution.
Acknowledgements
The authors acknowledge the financial support from the European Fund of Regional Development within the frameworks of the operating program –"Innovative Economy 2007–2013", under Project No. POIG.01.03.01-00-086/09.
References
[1] L. Wang, Ch. Ma, X. Mao, J. Sheng, F. Bai, F. Tang; Electrochem. Commun. 7 1477 (2005)
[2] L. Wang, Ch. Ma, X. Y. Sun, S. Suda; J. Alloys Compd. 391 318 (2005) [3] B. Liu, S. Suda, J. Alloys Compd. 454 280 (2008) [4] Z. Yang, L. Wang, Y. Gao, X. Mao, Ch. Ma, J Power Sources, 184, 260 (2008) [5] L. Wang, Ch. Ma, X. Mao, J. Alloys Compd., 397, 313 (2005)
16

13th Advanced Batteries, Accumulators and Fuel Cells Inorganic Materials for Power Sources
ELECTROCATALYTIC PROPERTIES OF REDUCED GRAPHENE OXIDE IN OXYGEN ELECTRODE
Danilov M.O.*, Kolbasov G.Ya., Rusetskii I.A., Slobodyanyuk I.A.
V.I. Vernadskii Institute of General and Inorganic Chemistry of the Ukrainian NAS, prospekt Palladina 32-34, 03680 Kyiv 142, Ukraine
Corresponding author: M.O. Danilov. ([email protected])
Abstract
Reduced graphene oxide obtained by oxidation of multiwalled carbon nanotubes followed by reduction with sodium hypophosphite and sodium sulfite. X-ray diffraction and electron microscopy showed that the resulting product is reduced graphene oxide. Reduced graphene oxide has been investigated as an electrode material for oxygen electrodes of fuel cells. It has been shown that reduced graphene oxide obtained by the oxidation of multiwalled carbon nanotubes with subsequent reduction with sodium hypophosphite is a promising material for fuel cell oxygen electrodes and does not require the use of highly toxic reagents.
Key words: graphene, electrocatalysis, oxygen electrode, electrochemical power sources.
Introduction
The use of air or oxygen electrode in devices generating electrical energy is very promising since it does not give rise to environmental problems and makes it possible to save natural resources, such as oil and gas. Air and oxygen electrodes in current sources are a three-phase electrode-electrolyte-gas system, where the electric current generation processes are localized at the interface between these phases. The current magnitude generated at such a gas-diffusion electrode depends on the size of the zone of the triple contact of these three phases. The electrode consists of a catalyst and a support. Platinum is at present the most efficient oxygen reduction catalyst, but it has a considerable demerit, high price. There are a large number of papers dealing with the investigation of other efficient catalysts. Another important problem is catalytically active and stable support. References (1-4) showed the advantage of carbon nanotubes as catalyst support. At the present time, in view of the advent of a new carbon nanomaterial such as graphene, a number of papers have appeared which deal with its investigation as an electrode material for lithium ion batteries (5) and as a support for catalysts in fuel cells (6,7). Graphene is an atom thick carbon layer, which consists of condensed six-membered rings.
17

13th Advanced Batteries, Accumulators and Fuel Cells Inorganic Materials for Power Sources
Fig. 1: The schematic structure of graphene: (a) top view, (b) side view.
The carbon atoms in graphene are bonded by sp2 bonds into a hexagonal two-dimensional (2 D) lattice. Ideal graphene consists solely of six-membered rings; the appearance of defects leads to the formation of a number of five- or seven-membered rings in the graphene structure and hence to the curving of flat surface. At the same time, the extended π-system of conjugated aromatic rings makes graphene fairly stable in comparison with other nanosized objects. The structure peculiarities of graphene sheet are such that the charge carriers, having unlimited freedom to move in plane, are confined in a narrow space between “walls” (Fig. 1), which are the shortest atomic distance of ~0.3 nm apart, which gives rise to unique electrophysical characteristics and other extraordinary properties of graphene. In view of this, the study of the dependence of electrochemical properties on the method for the preparation of reduced graphene oxide (RGO), which is used as a catalyst support for fuel cell oxygen electrodes, is of great interest.
Experimental
Multiwalled carbon nanotubes (MWCNTs) were chosen as a precursor, for they resemble in structure several graphene layers rolled into a tube; therefore, using a strong oxidant, one can “break” nanotubes to form oxidized graphene nanostrips (8). To this end, a procedure for the oxidation of MWCNTs with heptavalent manganese (8) with subsequent reduction was chosen. We used alkaline solutions of sodium hypophosphite and sodium sulfite as oxidized- graphene reductants. MWCNTs with a bulk density of 25-30 g/dm3, purified of catalyst impurities by treatment in a hydrofluoric acid solution, were used for the synthesis. The outside diameter of nanotubes was about 10-30 nm, the specific surface area was 230 m2/g.
Two-layer oxygen electrodes were prepared by pressing. The hydrophobic layer contained 0.07 g/cm2 acetylene black with 25% polytetrafluoroethylene, and the active layer contained 0.02 g/cm2 graphene oxide, reduced with different reductants, with 5% polytetrafluoroethylene. The investigations were carried out on a fuel cell mockup, a zinc electrode being used as the anode. The mockup for the testing of gas-diffusion electrodes is shown in Fig 2.
18

13th Advanced Batteries, Accumulators and Fuel Cells Inorganic Materials for Power Sources
Fig. 2: Scheme of the cell: (1) cell body, (2) clamping coupling, (3) metallic current tap and oxygen supply tube, (4) metallic net of the oxygen electrode, (5) hydrophobic layer of the oxygen electrode, (6) active layer of the oxygen electrode, (7) polytetrafluoroethylene gasket, (8) reference electrode, (9) zinc anode.
The electrolyte was a solution of 5 M KOH with 1 M LiOH. A silver-chloride electrode connected through a salt bridge was used as a reference electrode. The electrochemical characteristics were recorded under galvanostatic conditions. The oxygen source was a U-shaped electrolyzer with alkaline electrolyte. Oxygen was supplied to the gas electrodes under an excess pressure of 0.01 MPa. Before measurements, the oxygen electrode was blown through with oxygen for an hour. The electron micrographs have been obtained with the aid of a JEM-100 CXII electron microscope. The X-ray phase analysis was performed with the aid of a DRON-4 X-ray diffractometer with CuKα radiation.
Results and discussion
One gram of MWCNTs was dispersed in 300 mL of concentrated sulfuric acid under stirring for an hour. Then 5 g of KMnO4 was added, and the mixture was stirred on an oil bath for an hour at a temperature that was not over 17 0C. After that, the mixture was heated on an oil bath to 55 0C within 30 min. Then the solution was brought up to 65 0C, held for 20 min and cooled to room temperature. To remove possible by-product (manganese dioxide), the resulting mixture was poured into 400 mL of bidistilled water with ice, which contained 5 mL of H2O2. Then filtration was performed using a dense, fine-pored paper filter. The filtered off precipitate was transferred into a colloidal solution in bidistilled water. To reduce the product, two samples were prepared by the above procedure. One sample of oxidized product was reduced with an alkaline solution of sodium hypophosphite (pH = 11) and the other with an alkaline solution of sodium sulfite (pH = 11). The reduced substance was filtered off using a dense, fine-pored paper filter; after this, it was separated from the filter and dried in a desiccator at 140 0C for three hours. The product obtained was investigated by electron microscopy and X-ray phase analysis. Figure 3 shows X-ray diagrams of products obtained by reduction with sodium hypophosphite (Fig. 3 (b)) and sodium sulfite (Fig. 3 (a)). In the XRD pattern of RGO (which is exfoliated into individual platelets and then agglomerated into a powder form), the major peak is observed at about 23 – 24°. This gives an interlayer spacing of approximately 3.7 – 3.8 Å (8-11).
19

13th Advanced Batteries, Accumulators and Fuel Cells Inorganic Materials for Power Sources
0 10 20 30 40 500
150
300
450
0
150
300
450
0
100
200
300
0 10 20 30 40 50
0
100
200
300
Inte
nsit
y (
a.u
.)
2 (degree)
b
Inte
nsit
y (
a.u
.)
a
Fig. 3: X ray phase analysis of samples based on RGO obtained by reduction with sodium hypophosphite (b), RGO obtained by reduction with sodium sulfite (a).
Figures 4 and 5 show micrographs of RGO, which was obtained using different reductants. Thus, it can be concluded from the analysis of electron micrographs and comparison of the peaks in the X-ray diagrams with literature data that the above procedure gives nanosized FGO strips.
Fig. 4: Micrograph of RGO obtained with the use of sodium hypophosphite as a reductant.
20

13th Advanced Batteries, Accumulators and Fuel Cells Inorganic Materials for Power Sources
Fig. 5: Micrograph of RGO obtained with the use of sodium sulfite as a reductant.
Oxygen electrodes have been made by pressing, RGO being used as an active layer. The electrodes obtained were investigated on a mockup of oxygen fuel cell with alkaline electrolyte. Electrodes with active layer of starting MWCNTs have been made for comparison.
Electrocatalytic characteristics were investigated on the oxygen electrodes obtained. Figure 6 shows plots of potential against current density for oxygen electrodes based on graphene oxide reduced with sodium hypophosphite (curve 1, Fig 6) and RGO obtained by reduction with sodium sulfite (curve 2, Fig 6). This figure (curve 3) shows for comparison the characteristics of electrodes with starting MWCNTs, from which RGO samples have been synthesized.
Fig. 6: Dependence of potential on current density for oxygen electrodes with active layer (0.02 g/cm2) based on RGO obtained with the use of sodium hypophosphite as a reductant (1), RGO obtained with the use of sodium sulfite as a reductant (2), initial multiwalled carbon nanotubes (3).
-0,9
-0,7
-0,5
-0,3
-0,1
0 100 200 300 400 500
I/mA/cm2
1 2 3
Pote
nti
al/V
21

13th Advanced Batteries, Accumulators and Fuel Cells Inorganic Materials for Power Sources
As is seen from Fig 6, the oxygen electrodes containing graphene oxide reduced with sodium hypophosphite have the best electrocatalytic characteristics. The electrodes containing graphene oxide reduced with sodium sulfite are inferior in characteristics to the electrodes containing graphene oxide reduced with sodium hypophosphite. The results obtained may be attributed to the fact that the active mass contains unreacted or not completely “broken” carbon nanotubes as impurities. It has been found that electrode made of graphene oxide reduced with sodium hypophosphate is greatly superior to that made of starting carbon nanotubes in electrochemical characteristics in oxygen reduction reaction. RGO has better characteristics than nanocomposite based on manganese dioxide deposited on multiwalled carbon nanotubes, which follows from comparison with the data presented in Ref (2). The results of an investigation of the characteristics of RGO-based electrodes in time showed their values to remain invariable during six-month tests.
Conclusions
Thus, it can be concluded that reduced graphene oxide obtained by the oxidation of multilayer carbon nanotubes with subsequent reduction with sodium hypophosphite is a promising material for fuel cell oxygen electrodes and does not require the use of highly toxic reagents.
References
[1] M. Soehn, M. Lebert, T. Wirth, S. Hofmann, N. Nicoloso, J. Power Sources, 176, 494 (2008).
[2] M.O. Danilov, A.V. Melezhyk, J. Power Sources, 163, 376 (2006). [3] C-T. Hsieh, J-Yi. Lin, J.-L. Wei, Int. J. Hydrogen Energy, 34, 685 (2009). [4] X. Wang, M. Waje, Y. Yan, Electrochem. Solid-State Lett., 8, A42 (2005). [5] G. Wang, X. Shen, J. Yao, J. Park, Сarbon, 47, 2049 (2009). [6] Y. Xin, J. Liu, X. Jie, W. Liu, F. Liu, Y. Yin, J. Gu, Z. Zou, Electrochimica Acta, 60,
354 (2012). [7] Y. Shao, S. Zhang, C. Wang, Z. Nie, J. Liu, Y. Wang, Y. Lin, J. Power Sources, 195,
4600 (2010). [8] D.V. Kosynkin, A.L. Higginbotham, A. Sinitskii, J.R. Lomeda, A. Dimiev, B.K. Price,
J.M. Tour, Nat. Lett., 458, 872 (2009). [9] S. Park, J. An, J.R. Potts, A. Velamakanni, S. Murali, R.S. Ruoff, Carbon, 49, 3019
(2011). [10] S. Dubin, S. Gilje, K. Wang, V.C. Tung, K. Cha, A.S. Hall, J. Farrar, R. Varshneya, Y.
Yang, R.B. Kaner, ACS Nano, 4, 3845 (2010). [11] I.K. Moon, J. Lee, R.S. Ruoff, H. Lee, Nat. Commun., 1:73 |DOI:
10.1038/ncomms1067 (2010).
22

13th Advanced Batteries, Accumulators and Fuel Cells Fuel cells and methods
LOW-COST FUEL CELL MATERIALS MADE FROM NEW SOURCES
Okada, T.1, Takahashi, T.1, Ono, Ch.1, Kyotani, M.2, Kimura, S.3, Matsushita, S.4, Akagi, K.4
1 Tsukuba Fuel Cell Lab., Tsukuba, Ibaraki 305-8565, Japan, 2 TIMS, University of Tsukuba, Tsukuba, Ibaraki 305-8571, Japan,
3 Tottori Institute of IT, Tottori 689-1112, Japan, 4 Dept. Polym. Chem., Kyoto University, Nishikyou-ku, Kyoto 615-8510, Japan
Corresponding author: Tatsuhiro Okada ([email protected])
Abstract
In this report, some examples of alternatives to high-cost materials in fuel cells are proposed based on new preparation methods. Non-precious cathode electro-catalysts were pursued by synthesizing organic metal complexes on carbon powder substrate, and then heat-treating in Ar gas. Transition metal complexes of N,N’-mono-8-quinolylphenylenediamine were newly synthesized, and tested as oxygen reduction reaction (ORR) electro-catalysts in acid media. As the metal center, Mn, Fe, Co, Zn proved to be promising candidates which, especially in combined states, showed good synergistic effect (ladder-step effect) due to electron hopping via shifted redox potentials. The second is carbon paper gas diffusion layer (GDL) made from Japanese paper (Washi). The morphology-retaining carbonization process was developed to prepare porous carbon materials with good electric conductivity. Fuel cell operation tests revealed good performances in polarization curves and power density that are comparable with a commercial GDL.
Introduction
Polymer electrolyte fuel cells (PEFCs) are expected as an important solution for energy and environment issues, but still cost reduction is a big problem [1]. There are several components in PEFC, and these are all expensive: electro-catalysts, polymer electrolyte membranes, gas diffusion layer (GDL), separator, and so on. Replacing high-cost materials with widely acceptable alternatives is an ultimate research objective at the stage of commercialization of PEFC for stationary as well as transport applications.
Non-precious electro-catalysts, especially in acidic media, are very difficult target. This is also an urgent topic in the PEFC industry because of the high cost and scarcity of platinum. Several alternatives of platinum as oxygen reduction reaction (ORR) electro-catalysts have been proposed since 1960s, e.g., transition metal macrocycles [2-4], heat-treated macrocycles on carbon substrate [5-7], metal chalcogenides [8], graphene carbon modifiers [9-11], iron-carbon-nitrogen mixtures [12-14], etc.
In this report, new class of organic metal complexes, which could potentially solve the above problems, are proposed for ORR electro-catalysts. In ORR, O-O bond splitting is a crucial step for efficient 4-electron reduction [15]. Good ORR catalysts should be featured
23

13th Advanced Batteries, Accumulators and Fuel Cells Fuel cells and methods
from two aspects [16]: first, electron structure modification of the metal (d-band vacancy) which enables O2 adsorption and O-O bond weakening, and second, smooth electron transfer from the metal center to O2 molecule. In order to attain these points, a new concept is proposed in which 2 or 3 kinds of complexes cooperate in the electron transfer steps so that a high energy barrier of ORR is mitigated.
As a second example of high cost materials, replacement of carbon paper gas diffusion layer (GDL) is considered, because very few works have been reported so far on this material with success. Commercial GDLs are unwoven carbon fibers or woven carbon cloths [17], produced by carbonization of synthesized polymer materials and cost about
$20 for 10 10 cm size.
As a new process, Japanese paper (washi) is proposed and this precursor material is carbonized in a specific method. The inherent porous structure of washi would fit the specification of GDL, if other parameters such as electric conductivity and mechanical properties are optimized. Natural abundance and wide market of washi may also contribute to reduce the synthesis cost of GDL. Morphology-retaining carbonization is attempted for the first time to produce porous carbon materials with high carbon yield from cellulose [18]. The performances of washi GDL will be tested, and some advantages of washi GDL as compared with commercially distributed GDL will also be discussed.
Experimental
ORR Electro-Catalysts
N,N’-mono-8-quinolylphenylenediamine (mqph) was synthesized as yellowish powder in a procedure reported elsewhere [19]. Transition metal acetates were purchased and used without further purification. Chromium(III) acetate, manganese(II) acetate tetrahydrate, iron(II) acetate, cobalt(II) acetate tetrahydrate, nickel acetate tetrahydrate, copper acetate and zinc acetate dehydrate were obtained from Wako Pure Chemical Industries, and molybdenum(II) acetate dimer was obtained from Aldrich.
Equi-molar amount of mqph and transition metal acetate were dissolved in methanol and
mixed on a hot stirrer (40 C). Complex formation was confirmed by the change of colors of the solution. Solid precipitates were used to as catalyst material. The catalyst (20 wt%) was mixed with carbon in ethanol in a mortar, mixed and dried in air. As carbon substrate, Vulcan XC-72R (abbreviated as VXC) and Ketjen Black EC300J (abbreviated as KB) were used. In some cases two or three kinds of catalysts were mixed with carbon (in total 20 wt%), and prepared in the same way. The powder was put in a tube furnace, and heat-
treated in Ar gas at 300 through 500 C for 2 hours.
Evaluation of the catalysts for ORR was made using a rotating ring disk electrode (RRDE).
Catalysts were loaded on a glassy carbon disk (6mm ) with the amount 0.071 mgcm-2 of the electrode area. Three-electrode glass cell was filled with 0.05M H2SO4, bubbled with N2 or O2 gas. Working electrode was catalyst loaded RRDE, counter electrode was Au
wire and reference electrode was RHE. Measurements were made at 25 C, typically at a rotation speed of 500rpm. After cycling the potential between 0.05 V and 1.0 V for 30 minutes, cyclic voltammograms and current-potential curves were recorded at 50mVs-1 and 5mVs-1, respectively. Four-electron reduction efficiency (%H2O) of ORR was calculated from the ring and the disk current.
24

13th Advanced Batteries, Accumulators and Fuel Cells Fuel cells and methods
Washi Carbon Paper
Washi was treated with I2 vapor in a sealed glass vessel for about 10 days, then
carbonized for 1 hour at 800 C in an electric furnace in the atmosphere of Ar gas [20]. I2 treatment was essential in order to prevent cellulose from thermal decomposition in carbonization at high temperatures. After carbonization, some samples were subjected to
further heat-treatment in Ar for 30 min at 1400-2600 C. This latter process increased crystallization of carbon paper and electric conductivity.
Membrane electrode assembly (MEA) was made from Nafion 115 membrane and washi carbon paper. After hydrophobic treatment with PTFE, washi carbon paper was loaded with 20wt% Pt/C catalyst (ElectroChem EC-20-PTC) with 0.6 mg(Pt) cm-2 amount, then cut
into a 2 2 cm2 piece both for the anode and the cathode. MEA was prepared by hot-
pressing the anode, cathode and the membrane at 135 C, 100 kg cm-2 for 3 min. As a reference, commercial carbon paper was also used.
A single fuel cell installed with MEA was operated with H2/O2 or H2/Air modes at 70 C using a fuel cell test stand. Anode gas (H2) flow rate was 50 ml min-1, and cathode gas
flow rate was 100 ml min-1 O2 or 400 ml min-1 air, both humidified at 60 C. Polarization curves were obtained by scanning the potential at 0.12 V min-1, and Ohmic resistance was measured by a current interrupter.
Results and Discussion
Fig. 1: (A) Polarization curves (5mVs-1) of ORR for Mn(mqph), Co(mqph) and Zn(mqph) on VXC and (B) cyclic voltammograms (50mVs-1) measured on RRDE.
25

13th Advanced Batteries, Accumulators and Fuel Cells Fuel cells and methods
ORR Electro-Catalyst
Polarization curves of Mn(mqph), Co(mqph) and Zn(mqph) supported on Vulcan XC-72R revealed only small activity when used individually as shown in Fig. 1. Cyclic voltammograms show specific curves for each catalyst, depending on the central metal. For Mn(mqph), redox potential is apparent at 0.3V (note the peak above 0.6V is due to the functional groups on carbon), and for Co(mqph), in addition to 0.3V peak, a new peak appears around 0.5V, while for Zn(mqph) a new peak appears around 0.6V.
Fig. 2: Polarization curves of ORR for (A) Mn(mqph)+Co(mqph) and (B) Mn(mqph)+Co(mqph)+Zn(mqph) on VXC.
When Mn(mqph) and Co(mqph) are mixed and supported on VXC, a good synergistic effect occurs and ORR is enhanced as shown in Fig. 2A. Similarly, when Mn(mqph), Co(mqph) and Zn(mqph) are mixed together and supported on VXC, ORR is enhanced as
shown in Fig. 2B. The heat-treatment temperature was optimized at 400 C. It is to be noted that ORR efficiency, %H2O is also improved when the catalysts are mixed. For example, %H2O for single components Mn(mqph), Co(mqph) and Zn(mqph) on VXC were 32%, 47% and 78%, respectively, and for mixed components Mn(mqph)+Co(mqph) and Mn(mqph)+Co(mqph)+Zn(mqph) on VXC were 53% and 95%, respectively.
Carbon substrate affects the ORR behavior, and KB made much more enhanced ORR as compared with VXC as shown in Fig. 3A and Fid. 3B. This might be due to the difference in specific surface are of carbon substrates, where VXC has 212 m2g-1 and KB has 780 m2g-1, resulting in better dispersion of the metal complex on carbon surface for KB than for VXC. %H2O for mixed components Mn(mqph)+Co(mqph) and Mn(mqph)+Co(mqph)+Zn(mqph) on KB were 84% and 93%, respectively. Another example was Fe(mqph)+Co(mqph)+Zn(mqph) on KB, but %H2O was lower (73%).
Fig. 3: Polarization curves of ORR for (A) Mn(mqph)+Co(mqph) and (B) Mn(mqph)+Co(mqph)+Zn(mqph) on KB.
26

13th Advanced Batteries, Accumulators and Fuel Cells Fuel cells and methods
Fig. 4: ORR performances for several combination of mqph catalysts. In each box, top symbol shows VXC and bottom symbol shows KB as carbon substrates. : very good, : good, : fair, ×: poor. Hydrogen oxidation activity is also shown.
Figure 4 depicts the matrix where ORR performances of several kinds of metal mqph, either in single or mixed states, were summarized. There is observed a tendency that Fe, Co and Zn would make good ORR electro-catalysts.
Ladder-Step Effect in Mixed Catalysts for ORR – a New Concept
For transition metals, there is a relationship between the electron spin (i.e., magnetic moment) and ORR activity, and it can be assumed that unpaired d electrons of metals can interact with unpaired electron of O2 molecules which resides in the anti-bonding orbital of O2. In this respect, Fe and Co made good metal centers of the complex. Mn(mqph) and Zn(mqph) might have taken a role of electron transfer sites in the mixed catalysts, in combination with reaction centers Fe(mqph) and Co(mqph).
Macrocycles have long been investigated as ORR electro-catalysts, and a mechanism was proposed that O-O bond weakening occurs after an electron is added to the anti-bonding orbital of O2, which forms reaction intermediates [21]. The redox potential of the central metal of macrocycles was correlated to the ORR activity [22], and it was found that the structure of macrocycles as well as the central metal modify the redox potential and therefore, ORR activity. By utilizing this idea, it is anticipated that smooth electron transfer may occur if several kinds of ORR active centers of different redox potentials coexists in a catalyst system. ORR may proceed through step-by-step electron transfer processes, and by allocating different metal complex to different electron transfer steps, smooth ORR may be realized. This is called “ladder-step effect”, which enables a high energy barrier to be mitigated by a system of catalysts.
The role of N ligands in the complex should also be mentioned. In the periodic table, the electrons are filled from lower energy levels and in this line N takes 3 unpaired electrons. As ligands of the complex, this would make strong interactions with the central metal, and
27

13th Advanced Batteries, Accumulators and Fuel Cells Fuel cells and methods
modify its d-electron structure, which favored the adsorption of O2 molecule on the metal center. The planar configuration of N ligands on the metal center would facilitate the high-spin state of the metal [23], and this factor also assisted to result in strong metal-O2 interactions.
Properties of Washi Carbon Papers and Fuel Cell Performances
Table I. Properties of Carbon Papers after Heat-Treatment.
Washi
samples
H.T.
temp.
Original
thickness/mm
CP
thickness/mm
Conductivity
S cm-1
App. density
/g cm-3
Sisal
-
1400 C
2200 C
2600 C
0.61
0.38
0.35
0.6
0.39
0.38
0.35
0.34
-
18
23
22
0.3
0.28
0.31
0.33
Gasen
-
1400 C
1800 C
2200 C
2600 C
0.53
0.3
0.29
0.29
0.53
0.29
0.28
0.28
0.27
0.28
7
42.5
45
49
43
0.61
0.52
0.52
0.56
0.53
Gampi
-
1400 C
1800 C
2200 C
2600 C
0.43
0.22
0.23
0.23
0.43
0.23
0.22
0.22
0.21
0.20
-
26
30
34
37
0.4
0.39
0.36
0.38
0.35
Commercial PAN 0.28 100 0.45
Carbonization of washi brought about the shrinkage of size about 20%, but the original fibril structure of washi was retained. Various sources of washi were tested, which are listed in Table 1 together with some physical parameters. The electric conductivity (in-plane) of carbonized washi was less than 10 Scm-1, but it increased to 20-50 Scm-1 after the heat-treatment. Gasen showed the highest conductivity and Sisal showed the lowest value. The porosity of washi carbon paper ranged between 60 and 80%, while that for commercial carbon paper was 78%.
Figure 5 summarizes the peak power density obtained with washi carbon papers of various sources and various heat-treatment temperatures. The cell performance increased with increasing heat-treatment temperature, and for some materials the performance became comparable to or better than that of the commercial carbon paper. Sisal made the best performance, although its electric conductivity was lowest among washi carbon papers tested (Table 1). Washi carbon paper outperformed the commercial carbon paper
at heat-treatment temperatures higher than 1400 C for Sisal, >1800 C for Gasen,
>2200 C for Gampi, >2200 C for filter paper, but Kouzo was inferior to commercial carbon paper at all heat-treatment temperatures.
28

13th Advanced Batteries, Accumulators and Fuel Cells Fuel cells and methods
Fig. 5: Peak power density obtained for MEA with washi carbon paper plotted against heat-treatment temperature.
Specific Characters of Washi Carbon Paper
Fig. 6: Pore size distribution of washi before and after carbonization at 800 C. Data for commercial carbon paper is shown for comparison.
After investigating the bulk properties in Table I and fuel cell performances in Fig. 5, it is expected that bulk properties merely cannot explain the fuel cell performances. One such point would be the gas permeability of GDL, and another point would be the interface (contact) properties between GDL and polymer electrolyte membrane or the catalyst layer.
Pore size distribution was measured for two types of washi carbon papers before and after
carbonization at 800 C, using a N2 gas transmission method. Data on Sisal and Gampi are depicted in Fig. 6, together with that of commercial carbon paper. It is found that after carbonization Sisal shows pore size distribution very similar to that of commercial carbon
paper, but for Gampi pore size distribution shifted to smaller pore size of < 10 m. It is
anticipated that pores of about 20 m size would fit the requirement for good gas permeability of GDL.
The surface morphology of commercial carbon paper observed using a laser microscope is shown in Fig. 7A. It consists of straight carbon fibers, and show large opening but large
29

13th Advanced Batteries, Accumulators and Fuel Cells Fuel cells and methods
surface roughness. This morphology would be good for gas transport, but in terms of the three-phase boundary with gas, electron and H+ accessibility, large surface waving means poor adhesiveness with the catalyst layer and the membrane.
As a good example of washi carbon papers, surface morphology of Sisal heat-treated at
2600 C after carbonization, is shown in Fig. 7B. Compared with commercial carbon papers, washi carbon paper shows fine fibril structure. Sisal revealed large opening structure and smooth surface, which might be a positive feature of this material to exhibit a high power density of fuel cells.
Fig. 7: Laser microscope images of (A) commercial and (B) Sisal carbon papers. Top: surface morphology, bottom: 3-dimensional image.
Conclusions and Future Prospects
Non-precious ORR electro-catalysts are desired in the present stage of PEFC commercialization. In this respect, simple-structured, easy-to-synthesize and low cost metal complexes are good options, due to design flexibility and a wide tailoring possibility. A new concept, “ladder-step effect” turns out to be an effective solution in designing ORR electro-catalysts. In this concept the organic metal complexes of different redox potentials are combined and make a system of catalyst, in which smooth electron transfer is realized step-by-step through a high energy barrier of ORR.
A good synergistic effect was found if Mn(mqph), Fe(mqph), Co(mqph) and Zn(mqph)
were combined and supported on carbon substrate, then heat-treated at 400 C. After screening by RRDE experiments of mixed catalysts, Mn(mqph)+Co(mqph), Mn(mqph)+Co(mqph)+Zn(mqph) and Fe(mqph)+Co(mqph)+Zn(mqph) on KB were obtained as good candidates of ORR catalysts. Future work should aim at more active reaction sites, with higher dispersion of the organic metal complexes on carbon substrates. Selection of complexes and carbon materials, and optimization of heat-treatment would solve this problem.
30

13th Advanced Batteries, Accumulators and Fuel Cells Fuel cells and methods
Japanese paper (washi) was utilized as a new material for the gas diffusion layer (GDL) of fuel cells, because of its long fibril structure and medium inherent porosity ranging
between m to tens of m. After chemical treatment with I2, washi was carbonized at
800 C in inert atmosphere. This morphology retaining process, especially after further
heat-treatment at higher temperatures (1000 to 2600 C), resulted in GDL with increased graphitic structure and electric conductivity.
Washi derived carbon papers were tested for fuel cell applications, with promising results as compared with commercial carbon papers. It was suggested that specific fibril structure of washi exhibited advantages over artificial carbon papers, especially smooth surface and good interface contact with catalyst layer and polymer electrolyte membrane. The process of carbonization and heat-treatment, which are the major cost factors, should be optimized in order to further reduce the cost.
In this report two examples of low-cost alternatives were proposed, but other materials are also of interest, such as hydrocarbon polymer electrolyte membranes and low-cost separator materials. In such alternatives not only the cost, but also durability of materials should be overcome. It is expected that by further efforts low-cost alternatives would be realized in 10 years, and this would lead to true commercialization of fuel cell technology.
Acknowledgments
KEYENCE is greatly acknowledged for measuring laser microscope of washi carbon papers with VK9700.
References
[1] U.S. Department of Energy, Fuel Cell Technologies Program http://www1.eere.energy.gov/hydrogenandfuelcells/accomplishments.html
[2] R. Jasinski, Nature 201, 1212 (1964). [3] J.P. Collman, P. Denisevich, Y. Konai, M. Marrocco, C. Koval, and F.C. Anson, J.
Am. Chem. Soc., 102, 6027 (1980). [4] C.K. Chang, H.Y. Liu, and I. Abdalmuhdi, J. Am. Chem. Soc., 106, 2725 (1984). [5] J.A.R. van Veen, J.F. van Baar, and K.J. Kroese, J. Chem. Soc., Faraday Trans. 1,
77, 2827 (1981). [6] D.A. Scherson, S.L. Gupta, C. Fierro, E.B. Yeager, M.E. Kordesch, J. Eldridge, R.W.
Hoffman, and J. Blue, Electrochim. Acta, 28, 1205 (1983). [7] G. Faubert, G. Lalande, R. Côté, D. Guay, J.P. Dodelet, L.T. Weng, P. Bertrand, and
G. Dénès, Electrochim. Acta, 41, 1689 (1996). [8] N. Alonso-Vante, H. Tributsch, Nature, 323, 431 (1986). [9] J. Ozaki, N. Kimura, T. Anahara, and A. Oya, Carbon, 45, 1847 (2007). [10] S. Wang, D. Yu, and L. Dai, J. Am. Chem. Soc., 133, 5182 (2011). [11] Y. Li, W. Zhou, H. Wang, L. Xie, Y. Liang, F. Wei, J.C. Idrovo, S.J. Pennycook, and
H. Dai, Nature Nanotec., 7, 394 (2012). [12] M. Lefèvre, E. Proietti, F. Jaouen, and J.-P. Dodelet, Science, 324, 71 (2009). [13] G. Wu, K.L. More, C.M. Johnston, and P. Zelenay, Science, 332, 443 (2011). [14] E. Proietti, F. Jaouen, M. Lefèvre, N. Larouche, J. Tian, J. Herranz, and J.P. Dodelet,
Nature Commun, 2, 416 (2011).
31

13th Advanced Batteries, Accumulators and Fuel Cells Fuel cells and methods
[15] M. Gattrell and B. MacDougall, in Handbook of Fuel Cells, W. Vielstich, A. Lamm, and H.A. Gasteiger, Editors, Chap. 31, John Wiley & Sons, Chichester, (2003).
[16] T. Toda, H. Igarashi, H. Uchida, and M. Watanabe, J. Electrochem. Soc., 146, 3750 (1999).
[17] M.J. Martínez-Rodríguez, C. Tong, S. Shimpalee, and J.W. Van Zee, ECS Transactions, 33(1), 1133 (2010).
[18] M. Kyotani, S. Matsushita, S. Kimura, K. Akagi, J. Anal. Appl. Pyrol., 95, 14 (2012). [19] H. Yano, C. Ono, H. Shiroishi, T. Okada, Chem. Commun. 2005, 1212 (2005) [20] M. Kyotani, S. Matsushita, T. Nagai, Y. Matsui, T. Shimomura, A. Kaito, and K. Akagi,
J. \Am. Chem. Soc., 130, 10880 (2008). [21] J.H. Zagal, Coordination Chem. Rev., 119, 89 (1992). [22] J.H. Zagal, M. Gulppi, M. Isaacs, G. Cárdenas-Jirón, M.J. Aguirre, Electrochim. Acta,
44, 1349 (1998). [23] E. Yeager, Electrochim. Acta, 29, 1527 (1984).
32

13th Advanced Batteries, Accumulators and Fuel Cells Fuel cells and methods
ELECTROCHEMICAL IMPEDANCE SPECTROSCOPY – JUST ONE OF MANY TOOLS TO STUDY BATTERIES AND POWER
SOURCES
Vanýsek, P.
Northern Illinois University, Department of Chemistry and Biochemistry, DeKalb, IL 60115, USA.
Corresponding author: Petr Vanýsek ([email protected])
Abstract
Electrochemical Impedance Spectroscopy (EIS) is one of the many methods available to the researcher in electrochemistry. It can be a powerful method, but to take advantage of its capabilities, one should understand the method and the underlying principles. In this work voltammetry on a stationary electrode, as well as with a rotated disk electrode (RDE) are presented together with EIS results. The examples that are given are on reduction and oxidation of vanadium salts in 3 mol/l sulfuric acid, work motivated by the energy storage community in redox flow cells. This contribution summarizes highlights, but also pitfalls of impedance measurements and their interpretation, as they are relevant to the practice and theory of electrochemical work. The most significant component in the equivalent circuit is the change transfer resistance, which matches well the voltammetric curves of the RDE experiment. A high-frequency artifact can be eliminated by formally fitting it to an inductor and resistor of series; both of these components have, however, negative value.
The oxidation states of vanadium
Vanadium has extremely rich chemistry and from electrochemical point of view it is interesting because it exists in a number of different oxidation states. Most of the soluble species exist in acidic solutions so the work is usually done in sulfuric acid.
The reduction from dioxovanadium(V) to vanadyl cation
VO2+ + 2 H+ + e- → VO2+ + H2O
E = + 1.0 V
Reduction of vanadyl to vanadium +3
VO2+ + 2 H+ + e- → V+3 + H2O E = + 0.34 V
and reduction of vanadium +3 to +2
V+3 + e- → V+2 E = - 0.26 V
The colors are also interesting and can guide during the experiment: VO2+ yellow, VO2+
blue, V+3 green, V+2 purple.
Following the standard potential values, one might predict existence of three consecutive peaks on a cyclic voltammogram, as demonstrated in this simulation (Fig. 1).
33

13th Advanced Batteries, Accumulators and Fuel Cells Fuel cells and methods
Fig. 1: Three consecutive peaks for vanadium species. The cyclic voltammogram is simulated using Digisim®.
The diagram follows the standard potentials from Pourbaix (1). However, as is often the case, activation energy can suppress transition between some states and the reactions are dependent on the electrode material as well. Thus, for example, Rahman (2) demonstrated on glassy carbon transitions from V(II) to V(III) and back and transitions from V(IV) to V(V), but the reaction V(III)/V(IIII) was absent.
Graphite electrodes for vanadium redox flow cells are preferred for many reasons, including cost, but they also have the advantage when used as a negative electrode, since the hydrogen evolution reaction there is sluggish (3). Contrary to the prediction of the Pourbaix diagram (1), Skyllas-Kazacos and collaborators (4) demonstrated that 2 mol/l V(V) in concentrated sulfuric acid will not precipitate over reasonable temperature range.
The cell utilizing the vanadium redox states is based on two redox processes occurring on separate electrodes. The process on the positive electrode will be
2+ + +
2 2VO + H O e VO + 2 H
whereas the process on the negative electrode will be
3+ 2+V + e V
The third reaction, reduction of vanadyl to vanadium(III) is not used in the working system. Fig. 2 shows the general diagram of the operation.
34

13th Advanced Batteries, Accumulators and Fuel Cells Fuel cells and methods
Fig. 2: Diagram of the vanadium redox cell.
Typical parameters for a projected industrial vanadium redox battery are:
Vanadium salts 1 mol/l, sulfuric acid 5 mol/l
Average cell potential 1.26 V
ca. 5 kg of vanadium needed per 1 kW-hr, that is ca. 100 liters of solutions
(note that 1 liter of gasoline has energy of 9 kW-hr)
cost of vanadium ranges from $21/kg to $2100/kg (lab grade)
Cycle time 12 hours (for power generation balancing)
Advantage: “mechanically” rechargeable system
Possibly low annualized capital cost
Drawback - low energy density
The system is relatively safe, if we discount the concentrated sulfuric acid. Accidental mixing of the 1 mol/l cathode and anode solutions will not result in overly dangerous reaction. It will be an exothermic process, of course. A 1 mole of (i.e., one liter each) oxidant and reducing agent will generate approximately 120 kJ of energy. With estimated heat capacity of 5 mol/l sulfuric acid and its density 1.3 g/l, the temperature of the mixture will increase by 30 oC, appreciable amount, but not leading to a spectacular conclusion.
Redox vanadium electrochemical cell is an interesting concept, which dates back to NASA patents (5) and early work by Skyllas-Kazacos and Grossmith (6, 7). The work has recently received renewed interest and studies were made not only to the chemistry, but also to economical feasibility of this scheme (8-12). To study the impedance response on the vanadium system was inspired by a recent thesis I had an opportunity to review (3).
35

13th Advanced Batteries, Accumulators and Fuel Cells Fuel cells and methods
-2500 0 2500 5000
-7500
-5000
-2500
0
Z'
Z''
V(III-IV) at 1480 mV vs. SCE
100 101 102 103 104 105100
101
102
103
104
Frequency (Hz)
|Z|
100 101 102 103 104 105
-150
-125
-100
-75
-50
Frequency (Hz)
the
ta
Fig. 3: (a) A Rotated Disk Electrode experiment on the vanadium redox system. (b) Nyquist and (c) Bode plot of impedance taken at the point highlighted in (a).
The above three figures are an example of a voltammogram taken during a rotated disk electrode (RDE) experiment and the resulting impedance (the Bode and Nyqyist plots) taken at a point shown. There is certain correlation between voltammetry at a given point and impedance data set at the same potential point. Impedance, in some sense, is a derivative of the voltammetric curve. Although this explanation holds to some extent, the deviations will be discussed later. Impedance methods are fairly common in investigation of components for the vanadium flow cells (13-17) or for the cell longevity (18).
In order to demonstrate feasibility of voltammetric studies, and subsequent impedance runs, to study separately the catholyte and the anolyte, we generated appropriate electrolyte solutions for each half of the cell electrolytically by passing current through a simple H-cell, containing solution of 2 mol/l vanadyl sulfate in 5 mol/l H2SO4. The electrodes were platinum, the electrolysis was in a constant current mode at extended (12 hours) period and gas evolution on both sides was allowed to occur. Fig. 4 shows cyclic voltammetry performed on the two solutions obtained after extend electrolysis in the H-cell (Fig. 5).
Fig. 4: Voltammogram on a platinum electrode for the catholyte and anolyte, prepared previously in the H-cell.
36

13th Advanced Batteries, Accumulators and Fuel Cells Fuel cells and methods
Fig. 5: Detail of the H-cell after extended electrolysis of a vanadium salt in 5 mol/l sulfuric acid (right side the reduced form, left the oxidized.
Impedance studies that use the rotated disk electrodes have the advantage that the experiment can proceed at relatively constant conditions of a steady state system, as opposed to experiments in unstirred solutions where diffusion over time makes the system unsuitable for impedance data interpretation.
Fig. 6 shows a simulated RDE voltammetric sweep with all four components (the four oxidation states of vanadium) present in the solution throughout the experiment. Note that the components are not present concurrently. Rather, they are generated as the potential of the working electrode changes.
Fig. 6: Rotated disk electrode potential sweep experiment. (a) redox mixture, (b) only a single oxidation state present at the experiment onset.
The only difference, depending on which of the forms of vanadium is added as the analyte, is at shown in Fig. 6b, which shows displacement of the curves along the Y-axis, depending on the initial composition of the solution..
It was observed, however, that even in the RDE experiment, although a steady state is in principle achieved on the Pt electrode, a hysteresis is observed, as demonstrated in Fig. 7.
37

13th Advanced Batteries, Accumulators and Fuel Cells Fuel cells and methods
Fig. 7: RDE voltammetry experiment on vanadyl sulfate (2 mol/l in 5 mol/l sulfuric acid) at the different RPM on smooth platinum. Note the hysteresis of the response at both of the hydrodynamic values.
A systematic study of impedance at various potentials on the RDE curve (Fig. 7 or Fig. 3a) wee carried out. Fig. 8 illustrates the Nyquist and the Bode plots as measured at 1.48 V vs. SCE.
-2500 0 2500 5000
-7500
-5000
-2500
0
Z'
Z''
V(III-IV) at 1480 mV vs. SCE
100 101 102 103 104 105100
101
102
103
104
Frequency (Hz)
|Z|
100 101 102 103 104 105
-150
-125
-100
-75
-50
Frequency (Hz)
the
ta
Fig. 8: Impedance response at 1.480 V vs. SCE in 2 mol/l V(III)/V(IV) in 5 mol/l H2SO4 on Pt RDE at 1000 RPM.
38

13th Advanced Batteries, Accumulators and Fuel Cells Fuel cells and methods
Fig. 9: Nyquist plot of a series of impedance responses taken at different potentials during RDE experiment in 2 mol/l V(III)/V(IV) in 5 mol/l H2SO4 on Pt RDE at 1000 RPM.
Desirable interpretation of the impedance data would involve on “universal equivalent circuit” that could be used for all the potential applied. Whereas a simple parallel RC circuit, with small constant solution resistance in series would be sufficient at higher potentials (e.g., 100 mV vs. SCE, as shown in Fig. 10a, it was not sufficient at lower potentials, e.g., 600 mV, Fig. 10b, where an evidence of the Warburg impedance was apparent.
Fig. 10: Nyquist plot of the vanadium system on Pt RDE (1000 RPM) at (a) 1000 mV and (b) 600 mV vs. SCE.
An equivalent circuit that was useful for fitting of the impedance data at all potentials is in
Fig. 11. It is a rather complicated diagram. The Warburg impedance (W) on the right hand
side is used only at lower potentials; otherwise it is excluded. The constant phase element (CPE) with a series resistance R3 is the typical combination used to couple double layer capacitance with parallel charge transfer resistance. The factor n of the CPE was close t0
39

13th Advanced Batteries, Accumulators and Fuel Cells Fuel cells and methods
0.9 and thus can be considered capacitance in the first approximation. R1 is the usual solution resistance, a parameter that indeed was invariable throughout the measurement.
Fig. 11: An equivalent circuit used for the impedance evaluation.
A curiosity on in the circuit is the inductance L with a parallel resistor R2, because typically inductance is not encountered in electrochemical systems. To understand it inclusion, one needs to take a more detailed look at the high frequencies in Fig. 10a, which is shown in Fig. 12.
Fig. 12: Impedance data detail for Fig. 10, Nyquist plot of the vanadium system on Pt RDE (1000 RPM) at 1000 mV.
At higher frequencies, there is small semicircle, which extends into the second quadrant of the Nyquist plot. Fig. 12 shows in detail both the data point and the nonlinear least square fit, which as demonstrated matches the experimental data very well. This additional fit was achieved by adding the inductor and the series resistor R2. It should be noted that both of these components have however negative values, with L approximately - 20 μH and R2 approximately - 13 Ω. This impedance behavior at the higher frequencies is caused by the time constants of the reference electrode inputs on the Solartron potentiostat. They are experimental artifacts. The inclusion of the components simplifies fitting of the whole suite of the data; however, the values of these two components have no relevance to the electrochemistry on hand.
40

13th Advanced Batteries, Accumulators and Fuel Cells Fuel cells and methods
Fig. 13: Value of the charge transfer resistance R3 (line with dots, scale on left, green in on-line version), matched along the voltammetric curve of the RDE experiment (solid curve, scale on right, red in on-line version).
The most significant dependence on applied potential had the R3 value of the equivalent circuit, already described as the charge transfer resistance. This value relates to the electrochemical processes occurring on the platinum electrode of the RDE system. As seen in Fig. 13, this resistance reaches maximum at the potential values, where the current flowing through the working electrode is near or at zero, indicating lack of any electrochemical process. Therefore, at those conditions the charge transfer resistance follows, reaching high values, with identical implication; a lack of a redox process.
Acknowledgements
Travel support from the ABAF Organizers and their Sponsors is greatly appreciated.
References
[1] M. Pourbaix, "Atlas of electrochemical equilibria in aqueous solutions," p. 644. National Association of Corrosion Engineers, Houston, 1974.
[2] F. Rahman and M. Skyllas-Kazacos, Journal of Power Sources 189, 1212 (2009). [3] X. Gao, in "Physics". University of Limerick, Limerick, Ireland, 2012. [4] M. Skyllas-Kazacos, M. Rychcik, and R. G. Robins. Unisearch Ltd., Australia, 1986. [5] L. H. Thaller. National Aeronautics and Space Administration, U. S. Department of
Energy, 1974. [6] M. Skyllas-Kazacos and F. Grossmith, Journal of The Electrochemical Society 134,
2950 (1987). [7] M. Skyllas-Kazacos, M. Rychcik, R. G. Robins, A. G. Fane, and M. A. Green, Journal
of The Electrochemical Society 133, 1057 (1986). [8] C.-N. Sun, D. S. Aaron, A. Papandrew, and T. A. Zawodzinski, Meeting Abstracts
MA2012-02 399 (2012 ). [9] Z. Tang, D. S. Aaron, A. B. Papandrew, and T. A. Zawodzinski, ECS Transactions 41
1 (2012 ). [10] M. Skyllas-Kazacos, M. H. Chakrabarti, S. A. Hajimolana, F. S. Mjalli, and M.
Saleem, Journal of The Electrochemical Society 158 R55 (2011 ).
41

13th Advanced Batteries, Accumulators and Fuel Cells Fuel cells and methods
[11] M. Schreiber, M. Harrer, A. Whitehead, H. Bucsich, M. Dragschitz, E. Seifert, and P. Tymciw, Journal of Power Sources 206, 483 (2012).
[12] M. Zhang, M. Moore, J. S. Watson, T. A. Zawodzinski, and R. M. Counce, Journal of The Electrochemical Society 159 A1183 (2012 ).
[13] C. Yang, S. Wang, X. Xie, J. Wang, and Z. Mao, Huagong Xuebao (Chinese Edition) 63, 188 (2012).
[14] W. Li, J. Liu, and C. Yan, Electrochimica Acta 79, 102 (2012). [15] Z. Jia, B. Wang, S. Song, and X. Chen, Journal of the Electrochemical Society 159,
A843 (2012). [16] T. Wu, K. Huang, S. Liu, S. Zhuang, D. Fang, S. Li, D. Lu, and A. Su, Journal of Solid
State Electrochemistry 16, 579 (2012). [17] C. Yang, J. Wang, X. Xie, Y. Shang, S. Wang, and Z. Mao, Huagong Xuebao
(Chinese Edition) 62, 163 (2011). [18] J. Noack, L. Vorhauser, K. Pinkwart, and J. Tuebke, ECS Transactions 33, 3 (2011).
42

13th Advanced Batteries, Accumulators and Fuel Cells Fuel cells and methods
A NUMERICAL STUDY ON THE EFFECTS OF GAS CHANNEL WETTABILITY IN PEM FUEL CELLS: STRAIGHT CHANNEL
Alrahmani, M., Chen, R., Ibrahim, S.
Department of Aeronautical and Automotive Engineering, Loughborough University, Loughborough, LE11 3TU, UK
Corresponding author: Rui Chen ([email protected])
Abstract
The wettability of channel walls and gas diffusion layer has a great influence on the water management of fuel cells. In this paper, a numerical study has been carried out to examine the effect of the wall and gas diffusion layer wettability on gas channels. The investigation employed a three dimensional numerical simulation using the volume-of-fluid (VOF) method to simulate the air-water flow in a straight micro-channel representing a gas channel in a PEM fuel cell. Nine combinations of wall and GDL wettabilities were investigated. Different wettability combinations were found to give different water behaviour. For fixed wall wettability, the pattern of the analysed parameters was changing between uniform cyclic, random cyclic and continuous. In addition, it was found that changing the GDL wettability has a greater impact on the analysed parameter compared to changing the wall wettability.
Introduction
Achieving and maintaining a high performance proton exchange membrane (PEM) fuel cell can be done by a proper water management (a sufficient membrane hydration and effective liquid droplet removal from catalyst layers, gas diffusion layers, and flow channels). Since liquid water is formed frequently on the gas diffusion layer (GDL) surface in the flow channels, liquid water is an important area of research in the PEM fuel cells (1-3). Water can be observed in the channels from two sources: 1) condensed water vapour from the inlet gas flow, and 2) water formed from the fuel cell chemical reaction in the reactions sites and transported from the cathode catalyst layer to the gas channels. The behaviour of water droplet in the PEM fuel cell gas channels has been studied through numerical simulation and experimental studies.
A number of experimental studies in the literature (4-6) showed the impact of material characterization on the liquid transport and flooding mechanism inside PEM fuel cells. Two studies (4,5) investigated the liquid water behaviour in an actual operating fuel cell as a function of channel wall wettability. Different PTFE coatings were applied on the channel wall surface to change its wettability to get a better understanding on the flooding mechanism and through-plane liquid transport. In these studies, a liquid droplet formation was observed on the side walls in a hydrophobic coated channel, while a liquid film layer was formed by water stretch to the entire wall of the surface in a hydrophilic channel. Zhu et al. (6) used a high resolution X-ray imaging system to study the water movement in operating fuel cells with two types of graphite channels, hydrophobic and hydrophilic. After
43

13th Advanced Batteries, Accumulators and Fuel Cells Fuel cells and methods
operating the cell for a period of time, different water behaviours were noticed. The surface properties of the channel walls and diffusion layer found to have significant impact on fuel cells water management through their experimental analysis. However, the manufacturing and processing cost can be reduced by using mathematical modelling to investigate the different phenomena in the fuel cell.
The volume-of-fluid (VOF) is a mathematical model used to understand the two-phase flow in gas channels because it is unique in the way it tracks the interface between the two phases. This method was developed in the early 1980s [7]) and in the past decade it was a leading method in understanding the behaviour of water droplets in PEM fuel cells gas channels (8-12). The wettability effect on liquid droplet behaviour in micro-channels was studied qualitatively by Cai at el. (9). They found that the hydrophobicity is advantageous in moving the water droplets faster along a surface. However, a hydrophilic side walls are more beneficial to gas transportation from the channel into the MEA for both wettability scenarios, hydrophobic and hydrophilic, of the MEA from a qualitative point of view.
On the other hand, Zhu et al. (13-15) tracked the gas-liquid interface in a three-dimensional flow that included the water emergence into the channel. In their simulation, the MEA layer was neglected and they focused on a straight gas channel with a single pore in the bottom surface to inject liquid water and represent a GDL. In order to reduce computational cost, a small sized domain but representative of the real gas channels in a PEM fuel cell was used. They focused on the geometrical structure effect through a variety of parametric studies to analyse the liquid water behaviour. An analytical study was conducted on water droplet detachment diameter and time, and water coverage ratio with different channel cross-section geometries (13). Additionally, an analysis was conducted on a simple domain with various GDL contact angles to study its impact on water droplet detachment (14). Since the water was injected via a single pore, the droplet didn’t reach the side wall and the side wall wettability effect was not included in the study. Recently, Zhu et al. (15) carried out more work to study the effect of the side wall wettability on the water droplet behaviour by shifting the pore to the side. They found that the behaviour of the water droplet only depends on the GDL wettability when it is located at the centreline, in addition to achieving the highest pressure drop. On the other hand, shifting the emergence location to the side wall showed more significant effect of the side wall wettability because of the unavoidable water droplet attached to it.
In this paper, a quantitative comparison is conducted on different wall and GDL wettability combinations for a flooded straight channel. Nine combinations of wettability have been mathematically solved and analysed. The analysis and comparison have been based on various aspects: 1) the total pressure difference between the inlet and outlet, 2) the amount of water contained in the channel, 3) the amount of water covering the GDL surface.
Numerical Method
Governing Equations
The simulated flow is assumed to be laminar, isothermal for the two phases in the micro-channel, air and liquid water, because the range of operating fuel cell current densities correspond to a range of Reynolds number of 0 – 2077 (16). Heat generation and heat transfer are neglected to simplify the problem. Since the water dynamic behaviour is to be
44

13th Advanced Batteries, Accumulators and Fuel Cells Fuel cells and methods
studied, the flow is transient. The governing conservation equations for mass and momentum are as follows:
[1]
[2]
where is the velocity vector, is the density of the fluid, is the pressure, and is the external force.
Both equations are used to govern both the motion of air and liquid water in the flow channel. A three dimensional numerical model is implemented using the commercial CFD package, FLUENT 13.0.0 (17) with the volume-of-fluid (VOF) method, described in the following section, was used to determine the motion and deformation of liquid water in the channel.
Volume-of-fluid (VOF) method
The VOF method uses a single set of momentum equations that is shared by the two phases. A volume fraction equation is added to track the interface between the phases. A volume fraction coefficient determines if a cell is occupied by a certain fluid (17)
[3]
Ck is the volume fraction coefficient at the kth fluid, and the sum of the volume fraction coefficient is equal to 1.
[4]
The volume fraction equation needs to be solved at all cells in the computational domain
[5]
The velocity field for the two-phase mixture in the channel is governed by the momentum equation presented earlier. Only one set of momentum equations are solved with the density and dynamic viscosity being averaged. They are computed, as follows, to account for the variable volume fractions of the two-phase air-water system considered here.
[6]
[7]
where subscripts 1 and 2 represent the two phases, air and water, respectively.
Surface tension is accounted for and expressed in terms of the pressure difference across the interface. It is dependent on the surface tension coefficient, and implemented in the momentum equation as a body force:
[8]
[9]
45

13th Advanced Batteries, Accumulators and Fuel Cells Fuel cells and methods
where ∆P is the pressure jump across the surface, σ is the surface tension coefficient, and R is the radius of the surface curvature.
The curvature is computed from local gradients in the surface normal at the interface :
[10]
where is the unit vector normal to the interface between two phases near wall, is the
unit vector normal to the walls, is the unit vector tangential to the walls, and is the static contact angle at the wall where the contact angle is the angle at which a liquid/vapour interface meets a solid surface. If it is small, the liquid drop will spread on the surface; if it is large, a liquid drop will bead up.
The importance of the surface tension and gravitational force can be determined using dimensionless quantities, the Capillary number, the Weber number, and the Bond number.
The capillary number, Ca, represents the relative effect of viscous forces to surface tension
[11]
Weber number, We, represent the relative importance of the fluid’s relative inertia, or kinetic energy, to the surface tension and may be written as follows:
[12]
Bond number, Bo, represents the relative importance of surface tension compared to body forces, as follows:
[13]
The water injection diameter D is used as the characteristic length with the density, viscosity, and surface tension coefficient of water. In the current simulations of the micro-channel conditions, the values for the above dimensionless numbers are Ca = 1.4 x 10⁻², We = 0.7, and Bo = 3.4 x 10⁻⁴. The low values of Ca and We numbers indicate that the surface tension dominate over viscous force and relative inertia which impose its importance. The low Bo indicates that the gravitational force is negligible.
The computational mesh and domain
The commonly used shape of fuel cell gas channels is rectangular. The bottom wall represent a GDL while the other sides’ represent the walls of a fuel cell gas channel. The computational domain used in this study is shown in Figure 1. The domain is 0.25 mm x 0.25 mm in cross section with a length of 1.50 mm (18). With water emerging via three pores from the GDL, air flow into the channel from one end to another. The pores are 0.05 mm in diameter, which is an accepted average of different GDL pore sizes (18,19).
46

13th Advanced Batteries, Accumulators and Fuel Cells Fuel cells and methods
Fig. 1: The computational domain used for all calculations.
The computational mesh used in all simulations is orthogonal with a total number of 97,812 cells in all cases. A grid dependence analysis was conducted on the mesh by changing the number of cells by 25% and 40% on the case of 45˚ wall contact angle and 135˚ GDL contact angle as well as changing the time step and they all showed a similar water droplet behaviour.
Boundary and Initial Conditions
All calculations have been conducted here have the same boundary and initial conditions. Both the channel air and water pore inlet conditions have uniform velocity profiles. An outflow boundary condition was chosen for the channel outlet as the details of velocity and pressure were unknown at that location. The no-slip boundary condition (20) was imposed along the walls of the channel with specified surface tension and contact angle. For different wettabilities, different contact angles were assigned. Different contact angles result in different surface tension forces influencing the behaviour of water transport. The surface tension of water in contact with air is 0.0725 N/m (21) while the contact angles were varied according to Table 1.
Table 1. The calculated wettability combinations
Wall
GDL
Hydrophilic
45°
Moderate
90°
Hydrophobic
135°
Hydrophilic
45°
Wall Ө=45°
GDL Ө=45°
Wall Ө=90°
GDL Ө=45°
Wall Ө=135°
GDL Ө=45°
Moderate
90°
Wall Ө=45°
GDL Ө=90°
Wall Ө=90°
GDL Ө=90°
Wall Ө=135°
GDL Ө=90°
Hydrophobic
135°
Wall Ө=45°
GDL Ө=135°
Wall Ө=90°
GDL Ө=135°
Wall Ө=135°
GDL Ө=135°
The calculated inlet values are 10 m/s of air flowing with a uniform velocity from the channel inlet and 1 m/s of water injected with a uniform velocity from each pore on the GDL surface. The velocities correspond to Reynolds numbers of 160 and 50, respectively. The order of magnitude of air velocity is of the same order as flows encountered in automotive fuel cells stacks (22). The order of magnitude of water injection is of the same order used in ex-situ fuel cell experiments and corresponds to operation under high current density and water production rates (23,24).
47

13th Advanced Batteries, Accumulators and Fuel Cells Fuel cells and methods
Result and analysis
The calculations are performed until the water starts to exit the computational domain for all wettability combinations. This is made in order to show any cyclic or continuous behaviour of the water dynamic motion and determine the duration that the water takes to exit the domain. The simulation was performed for an integration time of 3.5 ms. The results from all calculations are compared based on three criteria that may affect the humidity of the air flowing in the channel and the speed of water movement along the channel for their importance on fuel cell performance, although heat transfer and humidity phenomena are not included in the simulations.
Pressure drop
The pressure drop is the difference of the average-area total-pressure of air between the channel inlet and outlet. The total-pressure is calculated for each cell at both inlet and outlet boundaries. The pressure is averaged for all the cells at a surface to get the final pressure. The pressure drop is then calculated by finding the difference between the inlet and the outlet values.
Figure 2a gives a comparison of pressure drop of air flow between the inlet and outlet of the micro-channel for the general cases with different GDL wettability. For the hydrophobic case the air flow pressure drop is the highest among three cases because water volume forms droplets and blocks the air flow due to the surfaces high contact angle. It drops back after the detached coalesced droplet moves out of the channel. Afterward, another coalesced droplet is formed making a cyclic behaviour. For the moderate case the air flow pressure drop is significantly lower than the hydrophobic case however it still gives a cyclic behaviour because water volume forms wavy droplets that block less of the air flow. For the hydrophilic case the air flow pressure drop is the lowest because water volume forms a slug on the GDL due to the surface low contact angle and it has continuous pressure drop behaviour.
Figure 2b,c,d shows the effect of wall wettability on the pressure drop between the inlet and the outlet of the micro-channel for different GDL wettabilities (i.e. hydrophilic, moderate, and hydrophobic). Figure 2b shows that for a hydrophilic GDL the change in wall wettability is insignificant as the pressure increases continuously as time progresses until a water film layer is formed on the GDL surface where the average pressure drop is ~500 Pa. Figure 2c shows a random cyclic pressure drop behaviour for a moderate GDL with all wall wettabilities. The formation and continuous movement of wavy droplets causes the random cyclic behaviour of the pressure drop where the average peak pressure drop is ~700 Pa. Figure 2d shows a cyclic behaviour of pressure drop in a micro-channel with a hydrophobic GDL, in addition to a more significant role to wall wettability compared to the other GDL wettabilities. The pressure drop increases when the micro-channel is blocked due to water droplets coalescence and since the GDL is hydrophobic the droplets are moved easily by the gas flow. The first coalesced water droplet for a hydrophilic wall experience the highest pressure drop because of the wall attraction to water that makes it to spread on the micro-channel cross-section. The second coalesced water droplet for a hydrophilic wall doesn’t experience as high pressure drop because of water hysteresis that causes it to spread along the walls as soon as the droplet is coalesced. On the other hand, for a hydrophobic wall the second coalesced water droplet causes a higher pressure drop than the first coalesced water droplet because of more
48

13th Advanced Batteries, Accumulators and Fuel Cells Fuel cells and methods
water content from the first water inlet due to an early previous droplet detachment. The figure (cf. Figure 2c) shows an average peak pressure drop of ~2000 Pa.
a) b)
c) d)
Fig. 2: Pressure drop in the channel, a) different contact angles for all surfaces, b) different wall contact angles for hydrophilic GDL, c) different wall contact angle for moderate GDL,and d) different wall contact angle for hydrophobic GDL.
Water in the channel
Water in the channel is the amount of water contained in the domain at a specific time. It is calculated by dividing the number of cells containing water at a specific time by the total number of cells in the domain. The amount of water in the channel represents the amount of water trapped in the channel due to the surfaces’ wettability which may affect the humidity level in the gas channel. It is also necessary to work out any relation to the water discharge time.
Figure 3a gives comparison of water in the channel for the general cases of different GDL wettability. The hydrophobic and moderate scenarios are almost the same with the moderate scenario occupying more volume of the channel due to the slower movement of the wavy droplets and the neutral contact angle of both the GDL and wall. For the hydrophilic case water occupies the most among three cases because water spread out on all surfaces due to the low contact angle, moreover, It has been noticed that the time of the drop in water content is also the time when water move out of the channel.
Figures 3b,c,d show the effect of wall wettability on the amount of water in the micro-channel for different GDL wettabilities (i.e. hydrophilic, moderate, and hydrophobic). Figure 3b shows for a hydrophilic GDL the change of wall wettability from hydrophobic to hydrophilic increases the water in the channel from 16% to 18% which is the highest among the three scenarios; furthermore the water takes longer to leave the channel as the wall wettability is changed from hydrophobic to hydrophilic. Figure 3c shows for a moderate GDL the water still takes longer to leave the channel as the wall wettability is
49

13th Advanced Batteries, Accumulators and Fuel Cells Fuel cells and methods
changed from hydrophobic to hydrophilic, however water occupy less of the channel compared to the hydrophilic GDL scenario (i.e. 10.5% to 12%). Water occupies more of the channel in the second coalesced droplet for a hydrophilic wall because of water remaining on the wall from the previous droplet. For a hydrophobic GDL (cf. Figure 3d) it takes the same duration for the water to start moving out of the channel and the wall wettability doesn’t the highest water occupancy especially for the first coalesced droplet (i.e. 11%).
a) b)
c) d)
Fig. 3: Water fraction in the channel, a) different contact angles for all surfaces, b) different wall contact angles for hydrophilic GDL, c) different wall contact angle for moderate GDL,and d) different wall contact angle for hydrophobic GDL.
Water on the GDL
Water coverage of the GDL is the area of the GDL that is covered by water. It is calculated by dividing the number of cells containing water on the GDL surface by the total number of cells forming the GDL surface. Even though the GDL was treated as a solid surface in the simulation, the water coverage could be used to understand the amount of water covering the GDL and might diffuse back into the MEA.
Figure 4a gives comparison of water on the GDL for the general cases of different GDL wettability. For the hydrophobic case water cover the least among three cases because of droplet formation due to high surfaces contact angle. Cyclic behaviour is observed where the coalesced droplets move out of the channel when the water volume fraction drops. A random continuous behaviour is observed for the moderate case with water volume fraction in between the other two cases. For the hydrophilic case the water on the GDL, which is the highest among three cases, increases as time progresses due to low GDL contact angle and a continuous behaviour is observed.
Figure 4b,c,d shows the effect of wall wettability on the amount of water on the GDL for different GDL wettabilities (i.e. hydrophilic, moderate, and hydrophobic). Figure 4b shows
50

13th Advanced Batteries, Accumulators and Fuel Cells Fuel cells and methods
the water on the GDL for the hydrophilic GDL where the hydrophobic wall scenario has the highest water coverage due to the water being rejected from the wall for its high contact angle, furthermore, since a film layer is formed due to the low contact angle of the GDL the water covers the highest among the three scenarios. Figure 4c shows a random behaviour of the water on the GDL for a moderate GDL where the hydrophilic wall has the least variation water covering the surface and the moderate and hydrophobic wall have a similar behaviour. The water on the GDL for a hydrophobic GDL (cf. Figure 4d) has a cyclic behaviour with the moderate wall having the highest water content due to the wall contact angle that doesn’t move the water away from the GDL toward the wall nor toward the centre of the channel. The hydrophilic wall has the lowest water covering the GDL because the low wall contact angle move the water toward the wall corners as soon as it reaches the wall surface.
a) b)
c) d)
Fig. 4: Water fraction on the GDL surface, a) different contact angles for all surfaces, b) different wall contact angles for hydrophilic GDL, c) different wall contact angle for moderate GDL,and d) different wall contact angle for hydrophobic GDL.
Conclusion
A numerical study has been conducted to examine the effect of different sidewall wettability combinations on the dynamic behaviour of water droplets in an air micro-channel with water injections representing a PEM fuel cell gas channel. Three-dimensional CFD modelling was used for the study incorporating the volume-of-fluid method to track the two-phase interface. Three pores on one surface were used to inject water into the micro-channel. Three contact angles were chosen to represent different wettabilities for the wall and GDL. A total of nine simulations were conducted and compared. The main findings from this study are:
Different combinations of contact angles show different patterns for the pressure drop, water occupancy in the channel, and water coverage on the gas diffusion layer.
51

13th Advanced Batteries, Accumulators and Fuel Cells Fuel cells and methods
Three main patterns of pressure drop and water volume fraction covering the GDL were observed in the results, continuous, random cyclic and uniform cyclic. The uniform cyclic pattern, which was noticed in the hydrophobic GDL scenario, is more useful for a periodic purge to remove water from the gas channel than the other observed patterns.
The GDL wettability has a greater impact on the water droplet speed and distribution on the different channel surfaces than the wall wettability.
In terms of pressure drop, the increase in GDL contact angle leads to beaded water droplet formation that blocks air flow through the micro-channel. The blockage causes an increase in the pressure drop along the micro-channel.
In terms of water occupancy in the channel, the hydrophobic and the moderate GDL scenarios showed a similar pattern and similar water occupancy ratio; however, the hydrophilic GDL had a noticeable different pattern and higher water occupancy. Furthermore, when the wall wettability effect was investigated for each GDL wettability, the hydrophilic wall always showed the highest water occupancy.
In terms of water coverage on the GDL, the hydrophobic GDL had the least water coverage. When the wall wettability effect was investigated for each GDL wettability, the hydrophilic wall scenarios always have the least fluctuation for the cyclic patterns.
Acknowledgement
The Author gratefully acknowledges the support of ANASYS, Inc. of UK and the financial support of PAAET of Kuwait.
References
[1] Y. Wang, K. S. Chen, J. Mishler, S. C. Cho, and X. C. Adroher. Applied Energy, 88 (4) (2011) 981-1007.
[2] C.Y. Wang. Chemical reviews, 104 (10) (2004) 4727-4765. [3] K. Jiao and X. Li. Progress in Energy Combustion Science, 37 (3) (2011) 221–291. [4] A. Turhan, S. Kim, M. Hatzell, and M. M. Mench. Electrochimica Acta, 55 (8) (2010)
2734-2745. [5] J. Owejan, T. Trabold, D. Jacobson, M. Arif, and S. Kandlikar. International Journal of
Hydrogen Energy, 32 (17) (2007) 4489-4502. [6] W. Zhu, Z. W. Dunbar and R. I. Masel. Society, 16 (2) (2008) 995-1000. [7] C. W. Hirt and B. D. Nichols. Journal of Computational Physics, 39 (1) (1981) 201-
225. [8] A. Theodorakakos, T. Ous, M. Gavaises, J. M. Nouri, N. Nikolopoulos, and H.
Yanagihara. Journal of colloid and interface science, 300 (2) (2006) 673-87. [9] Y. Cai, J. Hu, H. Ma, B. Yi, and H. Zhang. J. Power Sources, 161 (2) (2006) 843-848. [10] A. D. Le and B. Zhou. J. Power Sources, 182 (2008) 197-222. [11] X. Zhu, Q. Liao, P.C. Sui, and N. Djilali. J. Power Sources, 195 (3) (2010) 801-812. [12] A. Theodorakakos and G. Bergeles. International Journal for Numerical Methods in
Fluids, 45 (4) (2004) 421-439. [13] X. Zhu, Q. Liao, P.C. Sui, and N. Djilali. J. Power Sources, 195 (3) (2010) 801-812. [14] X. Zhu, P.C. Sui, and N. Djilali. J. Power Sources, 181 (1) (2008) 101-115. [15] X. Zhu, P.C. Sui, N. Djilali, and Q. Liao. Fuel Cells, 11 (3) (2011) 404-412.
52

13th Advanced Batteries, Accumulators and Fuel Cells Fuel cells and methods
[16] J. Martin, P. Oshkai, and N. Djilali. Journal of Fuel Cell Science and Technology, 2 (1) (2005) 70-80.
[17] Fluent, Fluent 13.0.0 User’s Guide, Fluent Inc., 2010. [18] S. Litster, D. Sinton, and N. Djilali. J. Power Sources, 154 (1) (2006) 95-105. [19] S. Litster, J.G. Pharoah, G. Mclean, and N. Djilali. J. Power Sources, 156 (2006) 334-
344. [20] X. Zhu, P.C. Sui, and N. Djilali. J. Power Sources, 172 (1) (2007) 287-295. [21] J. Franzini and E. Finnemore, Fluid mechanics with engineering applications. 10th
edition. McGraw-Hill. Boston, MA (2001). [22] P.C. Sui and N. Djilali. ASME J. of Fuel Cell Science & Technology, 2 (3) (2005) 149-
155. [23] A. Bazylak, D. Sinton, Z. Liu, and N. Djilali. J. Power Sources, 163 (2) (2007) 784-
792. [24] E. C. Kumbur, K. V. Sharp, and M. M. Mench. J. Power Sources, 161 (1) (2006) 333-
345.
53

13th Advanced Batteries, Accumulators and Fuel Cells Fuel cells and methods
ANALYSIS OF THE PERFORMANCE OF AN OPEN-CATHODE POLYMER ELECTROLYTE FUEL CELL STACK USING SIMULTANEOUS ELECTROCHEMICAL IMPEDANCE
SPECTROSCOPY MEASUREMENTS
Cruz-Manzo, S., Chen, R., Greenwood, P.
Department of Aeronautical and Automotive Engineering, Loughborough University, Leicestershire, LE11 3TU, UK
Abstract
In this study, an analysis of the performance in a commercial Open-Cathode Polymer Electrolyte Fuel Cell (PEFC) stack is conducted using simultaneous Electrochemical Impedance Spectroscopy (EIS) measurements. The factors that limit the performance of the PEFC stack were evaluated with EIS measurements and the impedance model developed in the authors’ previous study. The results showed that adsorbed intermediate species during the oxygen reduction reaction (ORR) limit the PEFC stack performance. The activation overpotential in the stack was dominated by low electrocatalytic activity from one of the cells. The inhomogeneity of air flow rate for this particular PEFC stack played an important role in oxygen transport limitations and ohmic resistance. This study has demonstrated that simultaneous EIS is a powerful tool for in-situ diagnosis of a PEFC stack. This EIS understanding has enabled an assessment of the state of health and performance of the fuel cell stack.
Introduction
Polymer Electrolyte Fuel Cells (PEFCs) generate electrical and thermal energy by combining hydrogen and oxygen. Open-Cathode PEFCs have to survive under a range of operational environments varying from, for example, a winter low of sub-zero air temperatures to a summer high relative humidity. They also have to survive under a range of atmospheric compositions which can include sulphur dioxide, nitrogen oxides and ionic contamination, as well as fuel impurities that can all potentially cause irreversible damage to the PEFC (1). The list of critical contaminants is much longer if we also consider the effects of battlefield gases for military applications (2). Electrochemical impedance spectroscopy (EIS) is a powerful technique that can be applied in-situ for diagnosis of the PEFC performance. The resulting impedance is commonly shown in a complex plane and represents the electrochemical and diffusion mechanisms in the frequency domain. In this study an analysis of the performance of an Open-Cathode PEFC stack using simultaneous EIS measurements has been carried out. The objective of this study is to provide an insight into the change in impedance of individual cells within a commercial Open-Cathode 4-cell stack. The electrochemical and diffusion mechanisms in each cell are calculated through the theoretical treatment developed in previous studies (3,4); therefore it is possible to have an insight into the factors that limit the performance of the PEFC stack.
54

13th Advanced Batteries, Accumulators and Fuel Cells Fuel cells and methods
Experimental EIS Measurements
A commercial Open-Cathode 4-cell stack with a 16 cm2 area was used for the experimental tests. The membrane electrode assemblies (MEAs) were made of Nafion 211 with platinum loadings of 0.4mg/cm2 and carbon black for the electrodes. The gas diffusion layers (GDLs) were made of carbon felt with 200µm width. The 4-cell stack consists of open cathodes with two 5V DC fans for oxidant supply (as air) and cooling, as shown in Fig. 1a. The stack consists of bipolar plates made of FU4369 HT material with a thickness of 5 mm.
Fig. 1: a) Open-Cathode Fuel Cell Stack for EIS measurements, 1b) Polarisation curve
High purity hydrogen (99.999 %) was used during the tests. The fuel cell stack was run in a through flow mode at the anode. Flow rate of hydrogen in the anode was kept constant during all the experiments with a stoichiometry of 2. The hydrogen supplied was dry. The PEFC stack was operated at ambient temperature 22 °C and the hydrogen back pressure was held at 0.4 bar(g). Polarisation curves were recorded prior to impedance measurements, as shown in Fig. 1b. EIS measurements were carried out through a multichannel frequency response analyzer FRA (Z#106 WonATech Co). The multichannel FRA consists of five channels and simultaneously measures five impedance spectra through a single induced DC current value. The multichannel system is connected with a RBL488 Dynaload. The EIS measurements were carried out in a galvanostatic mode with a 5% AC amplitude of the DC current to obtain a linear response from the system at frequencies from 10 kHz to 0.1Hz. Five channels from the Z#106 FRA were used to simultaneously measure the impedance of the PEFC stack and the impedance solely for each cell. EIS measurements were carried out at three different current densities 0.1875, 0.3125, and 0.4375 A/cm2 of the polarisation curve shown in Fig. 1b. The PEFC stack was run over 60 minutes at the required current with no variation in the voltage to ensure a steady state for EIS measurements. EIS measurements for current densities < 0.1875A/cm2 were not possible, as the low AC amplitude superimposed onto the DC current made it difficult for the FRA to distinguish between noise and response. At high current densities >0.4365 A/cm2 the stack was not steady for a long period of time due to the high water concentration produced by the oxygen reduction reaction (ORR).
55

13th Advanced Batteries, Accumulators and Fuel Cells Fuel cells and methods
Stack Measurements The resulting stack impedance is shown in a complex plane and represents the electrochemical and diffusion mechanisms in the frequency domain. The diameter of the spectrum decreases from a current density of 0.1875 A/cm2 to 0.3125 A/cm2 and increases from a current density of 0.3125 A/cm2 to 0.4375 A/cm2, as shown in Fig. 2.
Fig. 2: PEFC stack measured data at 0.1875, 0.3125 and 0.4375 A/cm2
EIS measurements have limitations and present disadvantages as the low impedance values are obscured for low frequencies and some effects are not visible due to a masking effect in the impedance plot (5). Therefore the impedance results of Fig. 2 reflect the overlapping of two semicircles. One at high-medium frequencies is related to the charge transfer resistance during the ORR and decreases with increasing current density, and the other at low frequencies is related to oxygen transport limitations and increases with increasing current density (6). At high frequencies there is no inductive effect (EIS measurements with positive imaginary components Z’’) of the measurement cables which deforms the high frequency region of the impedance spectra (7). The sensing cables of the FRA were directly connected to the bipolar plates of the PEFC stack. This allowed the reduction of inductive effects on the EIS measurements at high frequencies by placing the sensing cables from the FRA as far apart as possible from the inductive source. At high frequencies, Fig. 2, it is clearly shown that the 45° straight line represents the ionic resistance of the catalyst layer as discussed in a previous study (7). At low frequencies inductive effects on the EIS results were apparent for the three current densities. Makharia et al. (8) suggested that the possible reason for this inductive effect at low frequencies are the side reaction and intermediates involved in fuel cell reactions. Roy et al. (9) developed an impedance model to account for the reaction mechanisms that may be responsible for the inductive response at low frequencies, the model proposes the formation of hydrogen peroxide (H2O2) as an intermediate in a two step ORR. It has been reported (10) that crossover of hydrogen to the cathode facilitates the reaction of oxygen and hydrogen at the cathode, generating hydroxyl and hydroperoxyl radicals which react further to produce H2O2 at the cathode. The hypothesis that H2O2 may be formed at the cathode of a fuel cell is supported by the results of Inaba et al. (11). Individual Cell Measurements. The use of the multichannel FRA allows the measurement of the impedance response of each cell of the PEFC stack simultaneously. The cells were numbered from the hydrogen inlet side starting from 1, as shown in Fig.1a. Fig. 3 shows the impedance response for the four cells at 0.1875 A/cm2. The four cells show the inductive effect at low frequencies.
56

13th Advanced Batteries, Accumulators and Fuel Cells Fuel cells and methods
There is little difference observed in this inductive effect at low frequencies for the cells at different positions in the stack. The cell located closer to the hydrogen inlet (cell 1) results in a smaller impedance spectrum than the other cells, as shown in Fig. 3. The second cell shows the biggest impedance spectrum which could be related to the structural features of the MEA. The measured data from 10 kHz to 100 Hz are similar for cells 1, 3 and 4. The difference in impedance response at low frequencies in cells 1, 3 and 4 could be related to limitations in oxygen transport through the cathode.
Fig. 3: Measured data for different cells of the stack at 0.1875 A/cm2
Fig. 4 shows the impedance results of the four cells at a current density of 0.3125 A/cm2. The diameters of the spectra decrease with increasing current density from 0.1875 A/cm2 to 0.3125 A/cm2. When the kinetics of the ORR dominate the cell performance such as in the low current density range of the polarisation curve, the impedance spectrum mainly represents the charge transfer resistance during the ORR and its diameter decreases with increasing current density (5). At a current density of 0.3125 A/cm2 there is an increase in the driving force for the interfacial oxygen reduction process. The impedance spectrum of cell 3 at low frequencies is bigger than cells 1 and 4. Cell 2 shows the biggest impedance spectrum.
Fig. 4: Measured data for different cells of the stack at 0.3125 A/cm2
Fig. 5 shows the impedance results at a current density of 0.4375 A/cm2. One of the disadvantages of the EIS technique is that multiple energy controlled processes during the electrochemical reaction can be masked in the impedance plot. Therefore in Fig. 5 the semicircles that represent the charge transfer of the ORR and mass transport effects are overlapped in the experimental impedance spectra. Similar results were reported by Yuan
57

13th Advanced Batteries, Accumulators and Fuel Cells Fuel cells and methods
et al. (12) when EIS measurements were carried out in a H2/air PEFC stack. Their results show that EIS measured data feature a single semicircle at high current densities. The increase in diameter of the spectra with increasing current density from 0.3125 A/cm2 to 0.4375 A/cm2 as shown in Fig. 5 is attributed to an increase in oxygen transport limitations (6).
Fig. 5: Measured data for different cells of the stack at 0.4375 A/cm2
Results
In this study the factors that limit the performance in the Open-Cathode PEFC stack are assessed through EIS measurements and the details of the impedance model published elsewhere (3,4). It is possible to generate a deeper understanding of the internal phenomenological processes by coupling the experimental EIS technique to the fundamental electrochemical and diffusion theories. The use of equivalent circuits with the experimental EIS technique is a well-established methodology to characterise processes in the PEFC. The electrical circuit that models the PEFC spectrum neglecting anode contribution contains a resistance that accounts for the polymer electrolyte membrane (PEM), GDL and bipolar plate connected in series with a circuit accounting for the cathode catalyst layer (CCL), in which for this specific case is the CCL impedance equation reported in the previous work (4), as such:
( ) ( )( ) ( )WC
PWC
eFC ZRiYxZRRZ
+++
+=ω
γγ1
coth [1]
where
( ) ⎥
⎦
⎤⎢⎣
⎡+
+= P
WCp iY
ZRR ωγ 1
[2] RP is the resistance to the flow of ions in the electrolytic phase of the CCL; RC represents the charge transfer resistance presented in the ORR and is defined as )/exp(/ 0 bjbR SC η= , where b is the Tafel slope, ηS represents a value of voltage in activation overpotential, and j0 is the exchange current; ( ) ( ) 5.05.0 /tanh WWWW TiTiRZ ωω= is defined as the Warburg impedance and describes diffusion across a finite dimension in the frequency domain (13), with
( )DcFzRTR oW*22/δ= defined as resistance for the diffusion process and DTW /2δ= defined as the
time constant to diffuse oxygen through the CCL; Y represents a parameter related to constant phase element (CPE), superscript P represents a parameter to correct the
58

13th Advanced Batteries, Accumulators and Fuel Cells Fuel cells and methods
inhomogeneity in the distribution of charge between the electrode-electrolyte inteface; ω is the angular frequency; i is the imaginary component in impedance; Re represents the total ohmic resistance to flow electrons and ions in the bipolar plate, GDL and PEM. In the authors’ previous study (6) a reference electrode inserted in a PEFC operated with 100% relative humidity in the anode and a multichannel FRA allowed the separation of the impedance response of the cell and cathode. The results showed that the difference between cell and cathode impedance responses accounted to anode contribution (hydrogen oxidation reaction) becomes negligible at medium and high currents. In this study anode contribution can be considered as negligible for the EIS measurements at medium and high currents. The simulated data from Eq. 1 were compared with the measured EIS data using a Graphic User Interface (GUI) developed in Matlab®. The use of the GUI with Eq. 1 for EIS analysis has already been demonstrated in the authors’ previous study (6,7). The GUI allows the fitting of the parameters from Eq. 1 to achieve a good agreement between the experimental and simulated data. The least squares fitting method was used in order to find the best-fit between the model and the measured data. A good quality fit is obtained when the sum of the deviations squared (least square error) between the simulated and measured impedance data has a minimum value, for instance < 0.1. The results show that Eq. 1 cannot reproduce EIS measurements in the positive imaginary part of the complex impedance plane at low frequencies as shown in Fig. 6.
Fig. 6: Comparison between measured data and simulated data from Eq.1
Adsorbed Intermediate Species EIS measurements in the positive imaginary part of the complex impedance plane at low frequencies are commonly recognised as an inductive loop. This inductive loop has been considered a characteristic of systems containing consecutive heterogeneous reactions with potential-dependent adsorbed intermediate species (14). Ambrosi and Sarli (15) reported that electrochemical reactions that take place within the electrolyte can be governed by both the rate constants and the intermediate species adsorbed on the electrode. The authors reported an electrical circuit representing a faradaic process with adsorption, as shown in Fig. 7.
Fig. 7: Equivalent electrical circuit representing a faradaic process with adsorption
59

13th Advanced Batteries, Accumulators and Fuel Cells Fuel cells and methods
Fig. 7 shows that if intermediate species are involved in the ORR, an additional equivalent network formed by a pseudo-capacitance CPEAd in parallel with a pseudo-resistance RAd should be added in series with the former RC in the RC-CPE combination that represents simple reaction kinetics. As the adsorption only covers a fraction of the total electrode area, such a fraction fluctuates at the same frequency of the potential but differs in phase with it. Ciureanu and Wang (16) reported the same electrical circuit shown in Fig. 7 to account for an electrode with adsorbed intermediate species at the interface between dissimilar materials i.e. nafion-carbon. The second term on the right-hand side of Eq.1 was derived in previous studies (3,4) by considering simple reaction kinetics Re
KeOx ↔+ − and does not consider adsorbed
intermediate species during the ORR which can limit the performance of the PEFC. In Eq. 1 the term expressed as (RC + ZW) represents the total process resistance during the ORR, charge transfer resistance RC in series with mass transport resistance ZW due to oxygen transport limitations. Bard and Faulkner (17) reported that the overpotential during an electrochemical reaction can be considered as a sum of terms associated with the different reaction steps: mass transport overpotential, charge transfer overpotential and overpotential associated with a preceding reaction. Therefore the electrode reaction can be represented by a resistance composed of a series of resistances representing the various steps during the electrochemical reaction. If the term representing the process associated with the adsorbed intermediate species during the ORR ( )( )Ad
PAAdAd RiYRZ Ad
dω+= 1/
derived from the circuit in Fig. 7 is put in series with (RC + ZW) in Eq. 1 to consider the total process resistance during the ORR as reported by Bard and Faulkner (17). An approximate representation for the impedance response of the PEFC considering adsorbed intermediate species can be expressed as:
( ) ( )
( ) ( )AdWCP
AdWCeFC ZZRiY
xZZRRZ+++
+++=
ωγγ
1coth
[3] where
( ) ⎥
⎦
⎤⎢⎣
⎡+
++= P
AdWCp iY
ZZRR ωγ 1
[4] If the parameters represented in Eq. 3 are fitted to the measured EIS data using the GUI in Matlab® and considering the least square error < 0.1, it is possible to reproduce the inductive loop at low frequencies as shown in Fig. 8.
Fig. 8: Comparison between measured data and simulated data from Eq. 3
The results show that Eq. 3 is able to reproduce the low frequency loop which is related to adsorbed intermediate species in the ORR. The electrochemical and diffusion
60

13th Advanced Batteries, Accumulators and Fuel Cells Fuel cells and methods
mechanisms of the measured data were calculated through Eq. 3 and the results are shown in Tab. I. The parameter RAd that accounts for the adsorbed intermediate species during the ORR resulted in a negative number and became more negative with increasing current density for all cells, as shown in Tab. I. Bai and Conway (18) demonstrated in their work that the inductive loop at low frequencies in electrochemical systems with adsorbed intermediate species is related to a negative value of adsorbed species coverage φ depending on potential (dφ/dE). Ciureanu and Wang (16) reported EIS measurements in a H2/ H2+CO PEFC. EIS measurements showed the inductive loop at low frequencies with increasing bias potential. In their study the electrical circuit shown in Fig. 7 was applied with EIS measurements and this resulted in negative values for RAd. They concluded that the negative values in RAd are a result of the decrease of CO coverage on the electrode with increasing bias potential due to oxidation of CO by oxygenated species on the electrode-electrolyte interface. The process responsible for the inductive characteristic at low frequencies shown in Fig. 8 could be attributed to hydrogen crossover through the PEM or bipolar plates to form H2O2 during the ORR as reported by Roy et al. (9). A further study to consider crossover of hydrogen through bipolar plates made of FU4369 HT material should be investigated. Charge Transfer Resistance. The measured data from 10 kHz to 100 Hz are similar for cells 1, 3 and 4, as shown in Figs. 3, 4 and 5. The temperature distribution through this particular stack is not very significant in the kinetics of the electrochemical reaction as the measured data in the frequency range of 10 kHz - 100 Hz presented the same trend at the same current density with an exception for cell 2. The parameter charge transfer resistance RC calculated from EIS measurements and Eq. 3 is shown in Tab. I. The charge transfer resistance RC, whose dependence on electrode potential is given by the Tafel equation and reflects the increase in the driving force during the ORR, remains constant for cells 1, 3 and 4 at the same current density. RC is a function of the exchange current density j0, as such )/exp(/ 0 bjbR SC η= . A decrease in j0 results in an increase of RC and thus a decrease in the activity of the electrode surface is produced. Cell 2 shows a higher RC than the rest of the cells at the same current density which can be attributed to low electrocatalytic activity in cell 2. Therefore the activation overpotential in the PEFC stack is dominated by the charge transfer resistance of cell 2. As expected RC decreases in the four cells with increasing current density.
61

13th Advanced Batteries, Accumulators and Fuel Cells Fuel cells and methods
Table I. Charge transfer resistance RC, mass transport resistance RW and adsorption resistance RAd calculated from Eq. 3
Rc Ω.cm2 RwΩ.cm2 RAd Ω.cm2
0.1875A/cm2 Cell1 0.7712 0.0128 -0.128 Cell2 0.9312 0.1216 -0.192 Cell3 0.7712 0.1584 -0.176 Cell4 0.7712 0.0736 -0.16 0.3125 A/cm2 Cell1 0.6544 0.064 -0.136 Cell2 0.8144 0.176 -0.184 Cell3 0.6544 0.2304 -0.2 Cell4 0.6544 0.152 -0.184 0.4375 A/cm2 Cell1 0.6336 0.1952 -0.184 Cell2 0.7568 0.4272 -0.232 Cell3 0.6336 0.504 -0.328 Cell4 0.6336 0.3552 -0.248
Ohmic Resistance. Fig. 9 shows the high frequency region of the EIS measurements at the three different current densities. The measured data of cell 2 are not shown in Fig. 9 as the data of this cell from 10 kHz to 100 Hz showed a different trend compared to the rest of the cells as shown in Figs. 3, 4 and 5. Cell 3 shows a slightly higher ohmic resistance than cell 1 and 4 at the three current densities, this effect can be noticeable in the real part Z’ at 10 kHz of the measured data, as shown in Fig. 9. The increase in ohmic resistance could be attributed to dehydration in the PEM which may have been caused by an increase in reaction generated heat in cell 3. Ohmic resistance seems to be more sensitive than charge transfer resistance to the temperature distribution through the stack.
Fig. 9: High frequency EIS measurements for cell 1 ◊, cell 3 ∆ and cell 4 ; a) 0.1875A/cm2, b) 0.3125 A/cm2, c) 0.4375 A/cm2
Oxygen Transport Limitations. The mass transport resistance RW, due to gaseous oxygen transport limitations and as a function of the gaseous oxygen equilibrium concentration in the CCL-GDL interface, increases with increasing current density for all cells, as shown in Tab. I. Cells 2 and 3 show higher mass transport resistance than cells 1 and 4. Cell 3 shows the highest mass transport resistance as shown in Fig. 10. The increase in mass transport resistance of cell 3 could be attributed to high water concentration produced by the ORR which affects the
62

13th Advanced Batteries, Accumulators and Fuel Cells Fuel cells and methods
transport of oxygen to reach the reaction sites in the CCL; however the increase in ohmic resistance (PEM dehydration) in cell 3, shown in Fig. 9, demonstrates a contrasting case.
Fig. 10: Estimation of mass transport resistance in each individual cell
Santa Rosa et al. (19) studied the effect of critical conditions on an Open-Cathode 8-cell stack operated at ambient temperature and pressure. Three different fans for oxidant supply and cooling were used to investigate how the air flow rate affects the stack performance. A 5 V DC fan was found to be the best option because it ensures enough stack cooling and oxidant supply. The authors concluded that a fan with lower voltage affects the stack performance at medium-high currents because lower air fan flow rate cannot expel excessive reaction generated heat which in turns leads to dehydration in the PEM (high ohmic resistance). In this study, simultaneous EIS measurements demonstrate that inhomogeneity of air flow rate in an Open-Cathode PEFC stack not only leads to an increase in ohmic resistance but also leads to an increase in oxygen transport limitations in the cells. Limitations in air flow rate decrease the gaseous oxygen equilibrium concentration in the GDL-CCL interface and increase mass transport resistance. The position and distance of the fans with respect to the open cathodes in this particular stack played an important role for oxygen transport limitations. Two 5V DC axial fans were centred 1cm over the open cathode of cell 3 as shown in Fig. 1a. Air enters the fan evenly as it follows the physics of moving from a high pressure area into a low pressure area. The air then spreads outwards as it leaves the fan due to a centrifugal force. This results in a vacuum area absent of air flow in the centre of the fan and therefore the majority of the airflow is around the sides of the fan. A fan characteristic curve (FCC) presents three typical regions for axial fans: a stalling, an unstable and an optimal operating region (20). Sasmito et al. (20) reported that the interception between the operating point of an Open-Cathode fuel cell stack and a FCC should be located in the optimal operating region and be sufficiently far away from any unstable and stalling region. With most fans there is no air flow right in the centre of a fan. The majority of the airflow is around the sides of the fan; this effect limits the pressure within the open cathode in cell 3 and thus the operating point of cell 3 corresponds to the stalling point in the FCC. This effect could explain the increase in oxygen transport limitations and the increase in reaction generated heat in cell 3 which increases the ohmic resistance.
Discussion
The inhomogeneous performance along a PEFC stack can be monitored with the use of simultaneous EIS measurements. One of the disadvantages of the EIS technique is that
63

13th Advanced Batteries, Accumulators and Fuel Cells Fuel cells and methods
multiple energy controlled processes during the electrochemical reaction can be masked in the impedance measurements. The interpretation of the electrochemical and diffusion mechanisms which are truly happening in a PEFC stack can be unveiled by relating the electrochemical impedance data to the fundamental theory of PEFCs. It is possible to diagnose degradation in MEAs which yield low electrochemical activity in the electrodes through experimental EIS and modelling. Oxygen transport limitations due to flooding can be diagnosed at low frequencies of EIS measurements. EIS measurements can also provide a direct correlation about variations in air flow through the open cathodes in an Open-Cathode PEFC. Finally another common effect limiting the stack performance is the presence of adsorbed intermediate species during the ORR. This effect has been identified in EIS measurements as an inductive loop at low frequencies. Open-Cathode PEFC stacks are exposed to a range of atmospheric compositions which can include sulphur dioxide, nitrogen oxides, ionic contamination, carbon monoxide, etc. This level of understanding is critical to industry to drive the development, optimisation and running of PEFCs as reliable commercial products. A further investigation to include poisoning effect on Open-Cathode PEFCs which is normally represented in the positive imaginary part of the complex impedance plane at low frequencies will be researched in future work.
Conclusions
This study has demonstrated that simultaneous EIS is a powerful tool for in-situ diagnosis of a PEFC stack. EIS measurements that account for each cell in an Open-Cathode PEFC stack were compared with simulated data from the model reported in the authors’ previous study (3,4). The model was modified to include adsorbed intermediate species mechanisms during the ORR and the results showed a good agreement between measured data and simulated data. Electrochemical and diffusion mechanisms for each cell in the PEFC stack were calculated through EIS measurements and the model. The results showed that the activation overpotential in the whole PEFC stack is dominated by low electrocatalytic activity in one of the cells. The results also showed that oxygen transport limitations and ohmic resistance are attributed to variations in flow of the air through the open cathodes in the stack. The results also revealed that adsorbed species during the ORR limit the performance of the PEFC stack. Further experiments to account for the exact intermediate species should be carried out. This newly established EIS knowledge will enable an assessment of the state of health of operational fuel cell stacks.
Acknowledgements
The authors thank the Mexican National Council for Science and Technology (CONACYT) for the sponsorship of the Ph.D research study of S. Cruz-Manzo (Grant no. 183195).
References
[1] R. Mohtadi, W. K. Lee, and J. W. V. Zee, J. Power Sources, 138, 216 (2004). [2] J. M. Moore, P. L. Adcock, J. B. Lakeman, and G. O. Mopsted, J. Power Sources, 85,
254 (2000). [3] S. Cruz-Manzo, P. Rama, and R. Chen, J. Electrochem. Soc., 157, B400 (2010). [4] S. Cruz-Manzo, P. Rama, and R. Chen, J. Electrochem. Soc., 157, B1865 (2010).
64

13th Advanced Batteries, Accumulators and Fuel Cells Fuel cells and methods
[5] V. A. Paganin, C. L. F. Oliveira, E. A. Ticianelli, T. E. Springer and E. R. Gonzalez, Electrochim. Acta, 43, 3761 (1998).
[6] S. Cruz-Manzo, R. Chen and P. Rama, Int. J. Hydrogen Energy, (2012), http://dx.doi.org/10.1016/j.ijhydene.2012.08.141
[7] S. Cruz-Manzo, R. Chen and P. Rama, J. Fuel Cell Science Technology, 9, 051002 (2012).
[8] R. Makharia, M. F. Mathias and D. R. Baker, J. Electrochem. Soc., 152, A970 (2005). [9] S. K. Roy, M. E. Orazem and B. Tribollet, J. Electrochem. Soc., 154, B1378 (2007). [10] J. Xie, D. L. Wood III, K. L. More, P. Atanassov, and R. L. Borup, J. Electrochem.
Soc., 152, A1011 (2005). [11] M. Inaba, H. Yamada, J. Tokunaga, and A. Tasaka, Electrochem. Solid-State Lett., 7,
A474 (2004). [12] X. Yuan, J. C. Sun, H. Wang and J. Zhang, J. Power Sources, 161, 929 (2006). [13] N. Fouquet, C. Doulet, C. Nouillant, G. Dauphin-Tanguy and B. Ould-Bouamama, J.
Power Sources, 159, 905 (2006). [14] M. Keddam, O. R. Mottos, and H. Takenouti, J. Electrochem. Soc., 128, 257 (1981). [15] V. Ambrosi and A. Di Sarli, Anti-Corrosion, 40, 4 (1993). [16] M. Ciureanu and H. Wang, J. Electrochem. Soc., 146, 4031 (1999). [17] A. J. Bard and L. R. Faulkner, Electrochemical Methods, p. 24, John Wiley & Sons
Inc., New York (2001). [18] L. Bai and B. E. Conway, J. Electrochem. Soc., 137, 3737 (1990). [19] D.T. Santa Rosa, D.G. Pinto, V.S. Silva, R.A. Silva, and C.M. Rangel, Int. J.
Hydrogen Energy, 32, 4350 (2007). [20] P. Sasmito, E. Birgersson, K. W. Lum, A. S. Mujumdar, Renewable Energy, 37, 325
(2012).
65

13th Advanced Batteries, Accumulators and Fuel Cells Fuel cells and methods
THE IMPACTS OF IMAGE RESOLUTION ON PERMEABILITY SIMULATION OF GAS DIFFUSION LAYER USING LATTICE
BOLTZMANN METHOD
Jinuntuya, F.1, Chen, R.1, Ostadi, H.2, Jiang, K.2, Gao, Y.3, Zhang, X.3
a Department of Aeronautical and Automotive Engineering, Loughborough University, Leicestershire LE11 3TU, UK
b Centre for Bio-medical and Micro Engineering, School of Mechanical Engineering, University of Birmingham, Birmingham B15 2TT, UK
c Department of Engineering, University of Liverpool, Liverpool L69 3GH, UK
Corresponding author: Rui Chen ([email protected])
Abstract
The effect of image resolution on gas permeability through the x-ray reconstructed carbon paper gas diffusion layer (GDL) of a polymer electrolyte fuel cell (PEFC) is examined in this paper. The 3D models of the GDL at 6 different resolutions are obtained by the x-ray tomography imaging technique. Each GDL image is then characterized its gas permeability through the lattice Boltzmann (LB) numerical method. The results suggest that the image resolution has a great impact on gas permeability in both principal and off-principal flow directions. The coarser resolutions can contribute to significant changes in the resulting permeability. However, it can reduce computational time to a great extent.
The results also indicate that the GDL image at the resolution of 2.72 m provides a good compromise between computational time and accuracy.
Introduction
Gas diffusion layer plays an important role in the overall performance and durability of a PEFC by serving several functions including providing pathways for reactant gases to access the reaction sites; product water removal; heat and electronic transport and also serving as a mechanical support for the membrane. The GDL is a heterogeneous porous carbon-based material typically made of woven carbon cloth or non-woven carbon paper
with a thickness in the order of 100 m (1). To date, experimental measurements of fluid flows and related parameters in the diminutive structure of the GDL remain difficult. Therefore, several numerical models have been extensively developed and applied to examine fluid transport through the GDL.
Among various approaches, the particle-based LB method has been increasingly utilized to investigate fluid transport in porous GDL structures. This is because it has the capability to implement boundary conditions in such complex geometries by imposing the bounce-back scheme where it is assumed that any particle that hit the solid boundaries simply bounce back to its original position (2). With such treatment, the LB method is technically superior to the conventional CFD method where the incorporation of boundary-fitted grid in a complicated boundary is extremely difficult.
66

13th Advanced Batteries, Accumulators and Fuel Cells Fuel cells and methods
Recently, in order to accurately reflect the actual GDL as manufactured, the x-ray computed tomography reconstruction technique has been employed to generate 3D representative structures of GDL samples. The combination of the two advanced techniques has also been successfully applied to study fluid movement through PEFC GDLs in recent publications (2-8). However, the high computational demand of the LB method together with a tendency to use the highest available resolution of the x-ray images has limited its application to analyze only a very small volume of the GDL. With such high resolutions, the LB flow simulation is also extremely time-consuming.
In this work, the effect of image resolution on gas permeability through the x-ray reconstructed GDL is examined by using the LB method. The binary 3D models of the GDL at 6 different resolutions are acquired by using the x-ray imaging technique. Each image is then integrated into a single-phase LB numerical solver to characterize its gas permeability. The resulting permeability, its sensitivity to the resolution variation and the computational time are analyzed to identify the optimum resolution for the representative model of the GDL.
Methodology, Results and Discussion
Lattice Boltzmann method
In this study, the three-dimensional single-time relaxation LB model is used to simulate gas flow through the GDL. Principally, the LB method tracks the movement and collisions of a number of fictitious fluid particles in a lattice domain. The movement of each fictitious
particle is described by the particle distribution function ,if x t which defines the mass
of a particle at location x and time t moving with the velocity i along the direction i
1
, , , ,eq
i i i i if x ξ t t t f x t f x t f x t [1]
where ,eq
if x t is the value of ,if x t at an equilibrium state and is the dimensionless
relaxation parameter that control the rate at which ,if x t approaches ,eq
if x t . For
incompressible flow, the ,eq
if x t is calculated from
2
0 2 2 2
1,
2 2
eq i ii i
s s s
ξ u ξ u u uf x t w
c c c [2]
where iw is a weighting factor depending on the magnitude of the velocity i , cs is the
speed of sound. The fluid density and fluid velocity u are obtained by summing the
corresponding moments of all incoming particles at each node in the lattice domain as follows
eq
i i
i i
f f
[3]
0
eq
i i i i
i i
u f ξ f ξ
[4]
67

13th Advanced Batteries, Accumulators and Fuel Cells Fuel cells and methods
The D3Q19 LB scheme is employed in this work where fluid particles in each lattice node are able to move in 19 directions from the origin in the 3-dimensional regime as shown in Figure 1.
Fig. 1: The 19 velocity directions in the D3Q19 LB scheme.
The LB implementation involves a collision step and a streaming step. In a collision step, the term on the right-hand side of Eq.[1] is calculated as
* , , ( , ) ,eq
i i i if x t f x t f u f x t . The streaming step moves the outcomes of
collisions * ,if x t from the location x to the nearest location ix t along their direction
of motion at time t t to become *, ,i i if x tξ t t f x t . After the streaming step has
been completed, the gas density and velocity u for each node in the lattice domain is
then updated through , ,i
x t t f x t t and 0 ,iiu f x t t , respectively (2).
Permeability calculation
In this work, the permeability of the GDL is calculated from the detailed gas velocity distribution across the domain at the microscopic scale obtained by the LB simulation. The absolute permeability of the GDL at macroscopic scale is defined by Darcy’s law as
/
qk
P L [5]
where is the gas density, q is the average gas velocity through the GDL in the direction
of the pressure gradient, P is the applied pressure gradient across the GDL image, L is the size of the domain and is the dynamic viscosity. The dynamic viscosity is related to
the dimensionless relaxation time as follows
1 2
15
3
5
4
14 6
8
7 10
9
11 12
13
17
18
0
16
x
y
z
68

13th Advanced Batteries, Accumulators and Fuel Cells Fuel cells and methods
2 0.5 / 3x t [6]
By applying a pressure difference in the through-plane direction, gas can also flow in the in-plane direction. The three components of permeability tensor in principal and off-principal flow directions can be calculated as
/
zzz
z
qk
P L [7a]
/
y
yz
y
qk
P L [7b]
/
xxz
x
qk
P L [7c]
where xq , yq , zq are the average velocities and xL ,
yL , zL are the sizes of the domain in
x-, y- and z-directions, respectively. The average velocities in the three directions are
x i
ix
x y z
u x
qL L L
[8a]
y i
iy
x y z
u x
qL L L
[8b]
Digital 3D model
In this study, the digital image of a carbon paper GDL sample is originally generated at the
resolution of 0.68 m/pixel through the x-ray tomography imaging technique. In general, there are three key steps to generate the 3D images including progressive 2D imaging via x-ray tomography, image processing, and digital 3D reconstruction. The details of image acquisition and reconstruction of the GDL were reported in (2, 3).
In order to examine the pixel size effect on the absolute permeability, a number of 3D images are then further generated based on the original resolution starting with 2 times up to 6 times larger than the original pixel size. Therefore, the GDL images with the
resolution of 0.68, 1.36, 2.04, 2.72, 3.40, and 4.08 m/pixel, respectively are employed to study the impact on the resulting permeability.
The reconstructed GDL sample with the size of 211 m 204 m 224 m and the domain division into 4 regions is illustrated in Figure 2 and 3 while Figure 4 compares the images of the 6 different resolutions of region 1 used in this study. The size of each region in voxels and physical dimensions for each resolution are shown in Table I.
69

13th Advanced Batteries, Accumulators and Fuel Cells Fuel cells and methods
Fig. 2: 3D image of the GDL sample with domain division into 4 regions.
Fig. 3: 2D image of the GDL sample with 4 regions of interest.
Table I. Image size for each region of the 3D GDL image with 6 different resolutions.
Resolutions
( m/pixel)
Image size in voxels Image size in m
x y z x y z
0.68 155 150 329 105.40 102.00 223.72
1.36 78 75 164 106.08 102.00 223.04
2.04 52 50 109 106.08 102.00 222.36
2.72 39 38 82 106.08 103.36 223.04
3.40 31 30 65 105.40 102.00 221.00
4.08 26 25 54 106.08 102.00 220.32
70

13th Advanced Batteries, Accumulators and Fuel Cells Fuel cells and methods
Fig. 4: 3D images of region 1 with 6 different resolutions including 0.68, 1.36, 2.04, 2.72, 3.40 and 4.08 m/pixel, respectively.
Simulated permeability
The single-phase LB model with the D3Q19 scheme is applied to each of the 4 regions of the GDL images reconstructed with the 6 different resolutions including 0.68, 1.36, 2.04,
2.72, 3.40 and 4.08 m/pixel. To simulate the gas flow through the GDL, the pressure difference of 10 Pa is applied to each region and the entire void space is assumed to be filled with air. The principal flow direction is set in the through-plane direction along the GDL thickness. The detailed gas velocity field obtained from the LB simulation is then used to predict the gas permeability through the simulated GDL domain by using Darcy’s law. All simulations are carried out on a quad-core 2.33 GHz workstation with 3.25 GB RAM.
Figure 5(a)-(c) illustrate the simulated permeability when the pressure gradient is imposed in the principal through-plane flow direction (z-direction) and the simultaneous permeability in the off-principal in-plane flow directions (y- and x-directions). According to Figure 5(a)-(c), the gas permeability in all flow directions varies locally among each simulated region thus the means are properly considered as the representative values for all regions. The mean simulated values of the gas permeability both in principal through-plane and off-principal in-plane flow directions, and the average calculation time for each of 6 resolutions are given in Table II.
The results indicate that the variation of the image resolution contributes to a great difference on the predicting permeability in all flow directions. Assuming that the GDL
image reconstructed by the original resolution of 0.68 m provides the most accurate set of permeability values, all sets of results over the range of resolutions show that the differences are up to 30%, 32% and 26% for the resulting through-plane permeability and in-plane permeability in y- and x-directions, respectively as illustrated in Figure 6. For the
71

13th Advanced Batteries, Accumulators and Fuel Cells Fuel cells and methods
through-plane direction, the lowest resolution of 4.08 m gives a largest difference in the
resulting permeability as in the x-direction while the 3.40 m resolution causes the greatest increase in permeability in the y-direction. On the other hand, these two coarsest resolutions lead to a massive reduction in terms of computational time from approximately 1620 minutes per each region of the original resolution to just about 1 minute as shown in Table II.
Fig. 5: Simulated absolute permeability in (a) through-plane direction (z-direction); (b) in-plane y-direction; (c) in-plane x-direction; for the 4 regions with 6 different resolutions including the mean values.
0
5
10
15
20
25
30
35
R1 R2 R3 R4 Mean
Per
mea
bil
ity
, m
m2
Region
0.68 um/pixel
1.36 um/pixel
2.04 um/pixel
2.72 um/pixel
3.40 um/pixel
4.08 um/pixel
0
0,5
1
1,5
2
2,5
3
3,5
4
R1 R2 R3 R4 Mean
Perm
ea
bil
ity
, m
m2
Region
0.68 um/pixel
1.36 um/pixel
2.04 um/pixel
2.72 um/pixel
3.40 um/pixel
4.08 um/pixel
0
0,5
1
1,5
2
2,5
3
3,5
4
R1 R2 R3 R4 Mean
Per
mea
bil
ity
, m
m2
Region
0.68 um/pixel
1.36 um/pixel
2.04 um/pixel
2.72 um/pixel
3.40 um/pixel
4.08 um/pixel
(a)
(b)
(c)
72

13th Advanced Batteries, Accumulators and Fuel Cells Fuel cells and methods
Figure 6 also illustrates that the 1.36 m image resolution produces the least difference of 7.1% from the original resolution for the through-plane permeability as expected. However,
the image resolution of 2.04 and 2.72 m offer the more accurate results with only 2.8% and 0.3% difference for the in-plane y- and x-direction, respectively while the differences
are more than 13% and 8%, respectively for the case of 1.36 m resolution. This therefore demonstrates that the higher resolution does not always provide the more accurate results than the lower resolutions.
The results also indicate that the GDL image at the resolution of 2.72 m provides a good compromise between accuracy and simulation time. The resulting permeability values are less than 8%, 5% and 0.3% difference for the through-plane direction and in-plane in y- and x-direction, respectively while the calculation time reduces greatly to just 4 minutes
which is approximately 400 times less than the original resolution. By utilizing the 2.72 m resolution, simulations are also able to analyze the gas flow characteristics in a 64 times larger in terms of domain size.
Table II. Mean simulated through-plane, in-plane permeability in y- and x-direction and calculation time in each region of 6 different resolutions.
Resolutions
( m/pixel)
Mean through-plane
permeability
(mm2)
Mean in-plane
permeability
y-direction
(mm2)
Mean in-plane
permeability
x-direction
(mm2)
Mean Calculation
time
(min)
0.68 15.7332 1.2022 1.0981 1620
1.36 14.6168 1.3642 1.1893 63
2.04 12.5515 1.2353 1.1845 10
2.72 14.3591 1.2612 1.1006 4
3.40 17.2916 1.5874 1.2636 1
4.08 20.2754 1.4397 1.3783 <1
Fig. 6: Percentage difference on the mean permeability in the through-plane direction and in-plane in y- and x-direction of the GDL images at resolutions of interest, comparing with the 0.68 m resolution image.
0
5
10
15
20
25
30
35
1,36 2,04 2,72 3,4 4,08
Per
mea
bil
ity
Dif
feren
ce,
%
Resolution, m/pixel
Through-plane In-plane y-direction In-plane x-direction
73

13th Advanced Batteries, Accumulators and Fuel Cells Fuel cells and methods
Conclusions
This study was conducted using the LB method and the x-ray computed tomography technique. The 3D models of the GDL at 6 different resolutions were generated via the x-ray reconstruction technique. Each of the images was then incorporated into the LB solver to predict its permeability. The effect of image resolution on gas permeability through the representative models of the actual GDL was studied. It was found that the resolution variation has a great impact on the resulting permeability in both principal and off-principal flow directions. The coarser resolutions contribute to significant changes in resulting mean permeability up to 30% and 32% for the principal and off-principal flow directions, respectively. Conversely, the average calculation time reduces greatly from 27 hours to less than 1 minute over the range of resolutions. The results also suggest that the GDL
image at the resolution of 2.72 m, a 4 times larger than the original resolution, gives a good compromise for permeability simulation. In addition, with this resolution it is possible to investigate gas flows in a 64 times larger domain.
In conclusion, it is worth considering the effect of image resolution to identify an optimum resolution for the representative GDL model which potentially improve computational efficiency in terms of simulation time reduction then substantially lowering computational costs or even allow simulation in a greater GDL volume while the accuracy is still satisfactory.
References
[1] M. F. Mathias, J. Roth, J. Fleming and W. Lehnert, in Handbook of Fuel Cells – Fundamentals, Technology and Applications, vol.3, W. Vielstich, H. A. Gasteiger and A. Lamm, Editors, p. 517–538, John Wiley & Sons, New York (2003).
[2] P. Rama, Y. Liu, R. Chen, H. Ostadi, K. Jiang, X. Zhang, R. Fisher and M. Jeschke, J. Fuel Cell Sci. Technol., 7, 3 (2010).
[3] H. Ostadi, P. Rama, Y. Liu, R. Chen, X. Zhang and K. Jiang, Microelectron. Eng., 87, 5-8 (2010).
[4] P. Rama, Y. Liu, R. Chen, H. Ostadi, K. Jiang, X. Zhang, Y. Gao, P. Grassini and D. Brivio, Int. J. Numer. Meth. Fluids, 67, 4 (2010).
[5] P. Rama, Y. Liu, R. Chen, H. Ostadi, K. Jiang, X. Zhang, Y. Gao, D. Brivio and P. Grassini, Fuel Cells, 11, 2 (2011).
[6] H. Ostadi, P. Rama, Y. Liu, R. Chen, X. Zhang and K. Jiang, J. Membr. Sci., 351, 1 (2010).
[7] H. Ostadi, P. Rama, Y. Liu, R. Chen, X. Zhang and K. Jiang, Chem. Eng. Sci., 65, 6 (2010).
[8] Y. Gao, X. Zhang, P. Rama, Y. Liu, R. Chen, H. Ostadi and K. Jiang, Trans. Porous Media, 92, 2 (2012).
74

13th Advanced Batteries, Accumulators and Fuel Cells Fuel cells and methods
THEORETICAL MODELING OF (ELECTRO) CHEMICAL KINETICS OF HOMOGENEOUSLY MEDIATED ANODE REACTIONS IN GLUCOSE-BASED BIO-FUEL CELLS
Xu1,3, W., Danilov2, D., Gao1, L., Oudenhoven3, J. F. M., Pop3, V., Notten1,2, P. H. L.
1 Department of Chemical Engineering and Chemistry, Eindhoven University of Technology, 5600MB Eindhoven, the Netherlands
2Department of Electrical Engineering, Eindhoven University of Technology, 5600MB Eindhoven, the Netherlands
3imec/Holst Centre, High Tech Campus 31, 5656 AE Eindhoven, the Netherlands
Corresponding author: Wei Xu ([email protected])
Abstract
The use of biofuel cells (BFC) is a promising approach to generate electricity. Among different kinds of BFC glucose-based enzymatic BFC is a good option to power implantable devices due to the high availability of the fuel (glucose) in body fluids. Moreover, it shows excellent catalytic selectivity and good chemical safety. In this paper, the kinetics of the detailed energy conversion processes especially for anode, occurring inside the BFC system, have been investigated from both an experimental and theoretical point of view. The proposed model describes the glucose oxidation at the anode of a BFC and includes the diffusion for all (electro-) chemically active species. The modeling results considering the reaction orders are qualitatively and quantitatively in good agreement with the experimental results.
Introduction
The challenges in the area of developing power sources for implantable devices have motivated the industry and research institutes to work on various advanced energy systems (ES) and low-power electronics. As a result, various types energy harvesting, electricity storage systems, and low-power electronics technologies are under investigation or penetrating the market (1). Among these, biofuel cells (BFC) are promising to generate electricity, enabling long-term autonomous operation and miniaturization of medical implants. In combination with energy storage and appropriate energy/power management as schematically indicated in Fig. 1 (2, 3), BFC are an essential power source for future miniaturized implantable applications.
75

13th Advanced Batteries, Accumulators and Fuel Cells Fuel cells and methods
Fig. 1: Block scheme of a fuel cell device integrating the Bio-Fuel Cell, power management, and energy storage.
The glucose-based enzymatic biofuel cells seem to be the most promising candidate for the applications in implantable devices due to the highly specific and active enzymes and the fuel abundance in body fluids (3). The working principle of such BFC is schematically shown in Fig. 2. Glucose oxidase (Gox) and Laccase (Lac) are examples of biocatalysts for the anode and cathode, respectively. FAD is the active centre of Gox. Glucose and oxygen are used as fuel and oxidant, respectively. The cell voltage (∆E) is determined by the formal potential of the two redox mediator molecules (M and M’) reacting at the surface of the anode and cathode separately.
Fig. 2: Working principle of glucose-based enzymatic fuel cells. The voltage is defined vs. the Ag/AgCl reference.
The electronic coupling between the enzyme active centers and electrodes is the key factor influencing the performance of a BFC (4). As the active centers of most redox enzymes are buried deep inside the isolated protein matrices it is, however, very hard to achieve direct electron transfer between the enzymes and electrodes. A way to overcome
this problem is to employ 2( ) ( )Glucose Gox FAD Gluconolactone Gox FADH a mediator, a
small organic molecule or metal complex, to assist electron transfer. Ferrocene-carboxylic
76

13th Advanced Batteries, Accumulators and Fuel Cells Fuel cells and methods
acid (Fc) is a stable one-electron exchanging mediator for Gox (5). The detailed anode reactions involving Fc as mediator are shown in Eq.1-3. Glucose is homogeneously oxidized in the electrolyte by glucose oxidase (Gox(FAD)) to become gluconolactone. FAD will obtain two protons and two electrons to become FADH2 during the catalytic reaction (Eq.1). The reduced form of glucose oxidase (Gox(FADH2)) will chemically transfer two electrons to two oxidized ferrocene-carboxylic acid molecules (Fc+) and release two protons (Eq.2) that will be transferred through a membrane to the cathode. The reduced form of ferrocene-carboxylic acid (Fc) finally reacts at the electrode surface to form its oxidized state again, releasing electrons through which the current is generated (Eq.3).
2( ) ( )Glucose Gox FAD Gluconolactone Gox FADH [1]
2( ) 2 ( ) 2 2Gox FADH Fc Gox FAD Fc H [2]
2 2 2Fc Fc e (at electrode surface) [3]
Regarding (electro) chemical kinetic studies and theoretical modeling of such BFC reactions only a few reports can be found in the literature. For instance, in the theoretical work by Kjeang et al. a conceptual model for an enzymatic fuel cell was shown, without presenting experimental details (6). They tried to optimize the structure of a microfluidic enzymatic fuel cell, involving three-step-catalyzed methanol oxidation. Delle Noci et al. used a one-dimensional numeric model to obtain kinetic information from cyclic voltammetry experiments (7). Ohgaru et al. adopted some empirical relationships to estimate the kinetic parameters of the enzymatic driven reactions (8).
The optimization of the BFC performance requires a deeper understanding of the energy conversion processes. This can be achieved by developing models describing the BFC thermodynamics and kinetics. For this purpose a detailed kinetic study and a systematic model description of the homogeneously mediated BFC anode reactions has been set up in this paper.
Experimental
Gox (160 kDa) was selected as catalyst for anode. And Ferrocene-carboxylic acid was used as mediator. The solution was bubbled with argon or nitrogen to eliminate dissolved oxygen. Both enzyme and mediator were dissolved in 20 mL electrolyte, consisting of a 0.067 M Phosphate Buffer Solution (PBS) of pH=7.2. During this experiment, a glassy carbon disk electrode was used as working electrode, Ag/AgCl as reference electrode and a porous, high surface area, Pt electrode as counter electrode. Before the electrochemical measurements, the glassy carbon disk electrode was polished to a mirror-like surface using 0.3 µm Al2O3 powder followed by a 0.05 µm Al2O3 polishing step. Then the polished electrode was ultrasonically cleaned in distilled water and ethanol, successively, to remove the adsorbed alumina particles. Finally, the electrode was dried in air. The geometric surface area of the glassy carbon electrode is 0.18 cm2.
77

13th Advanced Batteries, Accumulators and Fuel Cells Fuel cells and methods
Fig. 3: Block scheme of the BFC test set-up.
The experimental set-up shown in Fig. 3 consisted of a potentiostat (PGSTAT30 from Metrohm-Autolab, the Netherlands), an in-house developed glass electrochemical 3-electrode cell with a gas supplying system and a personal computer (PC).
Different electrochemical methods, i.e. Cyclic Voltammetry (CV), and Chronoamperometry, were employed to measure the anode performance in a half-cell configuration under a wide range of experimental conditions. All electrochemical measurements were performed at room temperature and all potentials in the half cell experiments are given with respect to the Ag/AgCl reference electrode (0.198 V vs. NHE).
The most relevant experimental data will be shown in the comparison with following results of the theoretical studies.
Mathematic modeling and simulation
The kinetics of enzymatic-driven reactions have, in general terms, been studied by Bisswanger et al. (9). To improve the performance of BFC further, the reaction kinetics of the glucose oxidation reaction have been investigated in more detail. The mathematic description of the complex reaction sequence, given by Eqs. 1-3, has been set up and will be presented in this section.
The glucose oxidation is based on a shuttle mechanism for homogeneously mediated reactions, which is appropriate for the current BFC system with Fc as mediator and Gox as enzyme. Our mathematical model includes Nernst-Planck diffusion and migration for all (electro) chemically active species involved and allows us to mathematically derive the as-denoted Michaelis-Menten equation. The most relevant simulations performed with this model will be described in this section. The simulations will be validated with experimental results.
The simplest description of the enzyme-driven reaction kinetics under steady-state conditions is based on the work of Michaelis and Menten (10) and considers just one catalyzed reaction. For the presently described BFC system, a mediator is used to couple the homogeneous reaction, occurring at the active sites of the enzyme, to the charge
78

13th Advanced Batteries, Accumulators and Fuel Cells Fuel cells and methods
transfer reaction at the electrode, making this reaction sequence much more complex. The mathematical description of Michaelis-Menten has therefore to be expanded significantly. Eq.4-6 show the (electro) chemistry of the enzyme- and mediated-catalyzed glucose oxidation reaction (see also Eq.1-3)
12
1
k k
ox redkE G EG E P
[4]
34
322 2 2
k k
red ox ox redkE M EM E M H
[5]
5
5
k
red oxkM M e
[6]
in which glucose is denoted by G, the reaction product gluconolactone by P, the oxidized and reduced form of the enzyme (E) by Eox and Ered, respectively and the oxidized and reduced form of the mediator (M) by Mox and Mred, respectively. EG and EM2 are the intermediate reaction products.
The concentration of the species j in this reaction mechanism will be denoted by Cj. Each
concentration depends on time and distance to the electrode surface, i.e. C C ( , )j j tr . The
position r operates within 3-dimensional space as =(x, y,z)r and hence 3Rr . The gradient
operator is, ,
x y z and, consequently, . For each reacting species
the Nernst-Planck fluxes [mol m-2 s-1] can be defined, assuming that polarization effects can be neglected.
j j j jD C C uJ [7]
where ( , )j j tJ J r is the flux of species j [mol m−2 s−1] at position r at any moment of
time t, jD is the diffusion coefficient of j [m2 s−1], jC is the concentration gradient [mol
m−4] and ( , )tu u r is the velocity of the solvent [m s-1] at position r at any moment of time
t. Herewith it is assumed that no convection takes place in the electrolyte and u is, therefore, considered zero. The development of the concentration profiles can then be described by the following dynamic Partial Differential Equations (PDEs) in Eq.8-16.
ox
GG 1 G E 1 EG
Ck C C k C
tJ
[8]
ox
ox ox 2
EE 1 G E 1 EG 4 EM
Ck C C k C k C
tJ
[9]
ox
EGEG 1 G E 1 EG 2 EG
Ck C C k C k C
tJ
[10]
PP 2 EG
Ck C
tJ
[11]
red
red red ox 2
2EE 2 EG 3 E M 3 EM
Ck C k C C k C
tJ
[12]
, ,C C C
Cx y z
79

13th Advanced Batteries, Accumulators and Fuel Cells Fuel cells and methods
ox
ox red ox 2
2MM 3 E M 3 EM2 2
Ck C C k C
tJ
[13]
2
red ox2 2 2
2EM
EM 3 E M 3 EM 4 EM
Ck C C k C k C
tJ
[14]
+
+2
H4 EMH
2C
k Ct
J [15]
red
red 2
MM 4 EM2
Ck C
tJ
[16]
Conservation laws (mass balances) for both the mediator and the enzyme require that:
red ox 2M M EM( , ) ( , ) ( , )C t C t C t dr r r r [17]
and
red ox 2E E EG EM( , ) ( , ) ( , ) ( , )C t C t C t C t dr r r r r [18]
are constant. Under steady-state conditions the concentration gradients are fixed which
implies thatoxEC
t , EGC
t , redEC
t and 2EMC
t are zero. Equations 8, 9, 11, 13 can then be
rewritten as:
2Eox 1 G Eox 1 EG 4 EM0 k C C k C k CJ [19]
EG 1 G Eox 1 EG 2 EG0 k C C k C k CJ [20]
2
2
Ered 2 EG 3 Ered Mox 3 EM0 k C k C C k CJ [21]
2 2 2
2
EM 3 Ered Mox 3 EM 4 EM0 k C C k C k CJ [22]
When furthermore changes in concentrations of the intermediate species ( EGC , 2EMC ,
oxEC and redEC ) across the bulk of solution are neglected and the conservation law for the
amount of enzyme in various forms ( EC ) is considered, this leads to:
ox 21 G E 1 EG 4 EM0 k C C k C k C [23]
ox1 G E 1 EG 2 EG0 k C C k C k C [24]
red ox 2
2
2 EG 3 E M 3 EM0 k C k C C k C [25]
red ox 2 2
2
3 E M 3 EM 4 EM0 k C C k C k C [26]
ox red2E EG EM E EC C C C C [27]
80

13th Advanced Batteries, Accumulators and Fuel Cells Fuel cells and methods
The overall reaction rate r of the anode reaction can be expressed by the conversion rate of
2EM in Eq. 28.
24 EMr k C [28]
The system of Eq.23-27 can now be solved with respect to 2EMC in order to find r. The
solution for 2EMC is as following after derivations:
ox
2
GM
1
cat E
GM
K Cr
KK
CC [29]
in which the combined rate constants are defined as 2 4
2 4
cat
k kK
k k , 2 3 4
3 2 4
( )
( )M
k k kK
k k k and
4 1 2
1 2 4
( )
( )G
k k kK
k k k .
Equation 29 is very similar to the Michaelis–Menten equation for BFC where catK , MK , GK
have been denoted as the enzyme catalytic constant and the Michaelis constants for Mox and Glucose, respectively. However, in line with Eq.5, the derived Eq.29 takes into account the 2nd order reaction kinetics for enzyme oxidation. This therefore differs from the classical Michaelis–Menten equation which is based on a first order reaction (10).
In order to model the current generated at the anode, the charge transfer reaction of the mediator Eq.6 should be considered together with the derived enzyme kinetics. In equation
6, 5k and 5k are denoted as forward (oxidation) and backward (reduction) reaction rate
constants. As 5k and 5k are functions of the electrode voltage, the partial anodic and
cathodic currents can be described by
red
0
M 5
FE
s RTaI FAa k e
and ox
(1 )0
M 5
FE
s RTcI FAa k e [30]
where s
ja is the (surface) activity of species j [mol∙m-3], A the electrode surface area [m2], F
the Faraday constant (96485 [C∙mol-1]), R the gas constant (8.314 [J∙mol-1∙K-1]), T the absolute temperature [K] and is the charge transfer coefficient for the charge transfer
reaction of the mediator at electrode surface shown in Eq.6.
In the equilibrium state, obviously, no concentration profiles are established, implying that
the surface activities are equal to their corresponding bulk activities, i.e. s
j ja a . Moreover,
in equilibrium 0
c aI I I where 0I represents the exchange current. From Eq.30 it follows
that under these conditions the equilibrium potential eqE can be represented by
ox ox
red red
0 0
5 M 5 M
0 0
5 M 5 M
ln ln lneq k a k aRT RT RTE
F k a F k F a [31]
which can be recognized as the Nernst equation for the electrode potential. The first term on the right-hand side represents the standard redox potential and the second term takes into account the concentration dependence.
81

13th Advanced Batteries, Accumulators and Fuel Cells Fuel cells and methods
An expression for the overall current ( a cI I I ) can be derived directly using the previous
equations. This will finally result in complete voltage-current relationship.
red ox
red ox
(1 )0 M M
M M
F Fs s
RT RTa a
I I e ea a
[32]
in which eqE E is the overpotential. Note that Eq.32 can be further simplified to the
Butler-Volmer equation as Eq.33 when ox oxM M/ 1sa a and
red redM M/ 1sa a .
(1 )0
F F
RT RTI I e e
[33]
The voltage-current relationship Eq.32, the Nernst equation Eq.31 and the bulk concentration Eq.8-16 equations have been solved in Matlab coupling with Comsol. The kinetic data of Fc and Gox have been taken from literature [7, 11] and the parameter values used in the present simulations are DM=8∙10-6 cm2 s-1, DE=5∙10-6 cm2 s-1, DG=DP=6∙10-6 cm2 s-1, DH
+=9.31∙10-5 cm2 s-1, KM=0.13 (mM)2, Kcat=350 s-1, KG=4.16 mM. Fig. 4 illustrates, as an example, the simulated steady-state oxidation current as a function of the overpotential. The simulations (lines) are in good agreement with the experimental results (symbols) and clearly reveal the kinetic- and diffusion-controlled regions.
Fig 4: Measured (symbols) and simulated (lines) current-overpotential curves (vs. Ag/AgCl) of a BFC anode in a buffered electrolyte (PBS pH=7.2), containing 1 mM Fc as mediator, 3µM Gox and 1 mM Glucose (a), 10 mM Glucose (b) and 20 mM Glucose (c).
The development of the concentration profiles for Mox and P as a function of time are shown in Fig. 5a and b, respectively. It clearly shows that the concentration of Mox at the electrode surface is increasing quickly and that the concentration gradient is very strong at the electrode surface (close to distance 0). The same holds for the reaction product gluconolactone although it should be noted that the concentrations are much lower in this case and that the built-up of the Product (P)-gradient seems to be delayed with respect to that of Mox.
82

13th Advanced Batteries, Accumulators and Fuel Cells Fuel cells and methods
Fig. 5: Development of the concentration profiles of (a - left) oxidized form mediator (Mox) and (b-right) Gluconoactone product (P) as a function of time and distance to the electrode surface.
Conclusion and perspectives
The anode reactions of Bio-Fuel Cell are described experimentally and theoretically using glucose oxidase as biocatalyst and ferrocene-carboxylic acid as mediator. To further optimize the performance of the mediated BFC in a homogenously diffusive system, the kinetics for anode, including the homogeneous chemical reactions in the bulk of the electrolyte and the electrochemical charge transfer reaction at the electrode surface are discussed in detail.
Based on the experimental kinetic studies, a systematic mathematic model describing the homogeneously mediated anode reactions has been designed. From the mathematic description, a second order Michaelis–Menten equation has been derived. The simulations are both qualitatively and quantitatively in good agreement with the experimental results. The concentration profiles of reactive species have been calculated as a function of time and distance from the electrode surface.
In the near future, this study will be expanded, focusing on three main areas: Firstly, the model will be extended to cathode part. Then a complete model will be composed describing the three-dimensional cell, including anode, cathode, and proton-exchange membrane, which will be used to simulate the operation of a practical BFC. This model will also demonstrate the influence of working conditions on the kinetic behaviors. The new model will be closer to practical fuel-cells and will help to improve the development of BFC for miniaturized implantable applications. Secondly, miniaturization of BFC is essential. Micro-fabrication of BFC will be studied in connection to relevant modeling. Finally, the kinetic studies and mathematic modeling will be extended to the immobilization of the reactive species (enzyme and/or mediator), which is crucial for the development of more stable and miniaturized BFC.
Acknowledgments
We gratefully thank the financial support from IMEC. Also, we would like to thank our colleagues in IMEC and Energy Materials and Devices group of TU/e who provide valuable advice and assistance during this work.
83

13th Advanced Batteries, Accumulators and Fuel Cells Fuel cells and methods
References
[1] T. E. Starner, IEEE Pervasive computing, 2, 86 (2003). [2] P.H.L. Notten, F. Roozeboom, et al. Adv. Mater., 19, 4564 (2007). [3] W. Xu, L. Gao, et al., Proceedings of PowerMEMS, 1, 1 (2010). [4] J. A. Cracknell, K. A. Vincent, et al., Chem. Rev., 108, 2439 (2008). [5] A. E. G. Cass, G. Davis, et al., Anal. Chem., 56, 667 (1984). [6] E. Kjeang, D. Sinton, D. A. Harrington, J. Power Sources, 158 , 1 (2006). [7] S. delle Noci, M. Frasconi, et al., Electroanal., 20, 163 (2008). [8] T. Ohgaru, H. Tatsumi, et al., J. Electroanal. Chem., 496, 37 (2001). [9] H. Bisswanger, DOI: 10.1002/3527601759 (2005). [10] L. Menten, M. I. Michaelis, Biochem., 49, 333 (1913). [11] P.N. Bartlett, K.F.E. Pratt, J. Electroanal. Chem., 397, 53 (1995).
84

13th Advanced Batteries, Accumulators and Fuel Cells Fuel cells and methods
THE IMPACT OF CATHODE GAS DIFFUSION LAYER STRUCTURE ON FUEL CELL PERFORMANCE
McCarthy, N.*, El-Kharouf, A.**, Chen, R.*, Bujalski, W.**
* Dept. Aeronautical and Automotive Engineering, Loughborough University, LE11 3TU, U.K.
** PEM Fuel Cell Research Group, Centre for Hydrogen and Fuel Cell Research, School of Chemical Engineering, The University of Birmingham, Edgbaston, Birmingham B15 2TT,
UK
Abstract
Four gas Diffusion Layer (GDL) materials have been investigated. Each Membrane Electrode Assembly (MEA) was manufactured with identical catalyst and binder loadings. MEAs were tested in-situ using a ‘Fuel Cell Component Analyser’ and polarisation curves produced and compared. GDL properties obtained in a previous work were considered for the analysis of the results. Results show differences in the polarisation response for different GDL structures; indicating changes in resistance loss, mass transport loss, and the flooding effects on fuel cells due to GDL structure.
Introduction
Polymer Electrolyte Membrane Fuel Cells (PEMFCs) offer the potential of efficient, sustainable power solutions for the future. A key element in these devices is the Gas Diffusion Layer (GDL). It is critical for the transport of reactants to the catalyst active sites, the transport of charge into and out of the cell, and water management in the MEA. The variation in performance for different GDLs has been reported in the literature (1, 2). The difference is explained by the variation in the characteristics of the samples tested, however, due to the many variables in the GDL materials properties, explaining the variation in GDL performance can prove to be challenging. Some studies have focused on testing GDL properties in order to achieve a better understanding of GDLs behaviour and the relationship between the different properties (3) (4) (5). Usually, a GDL consists of a carbon fibre substrate that is carbonised and teflonated. Commonly GDLs have a Micro-Porous Layer (MPL) painted on one side of the substrate to enhance water transport away from the catalyst layer, and provide a smooth surface with lower contact resistance for the catalyst layer. Different fibre structures are used for GDLs, namely; woven cloths, non-woven straight fibres paper, and non-woven felt paper. The fibre structure of the substrate in the GDL plays an important role in its function and therefore affects the performance of the cell. Previous work has indicated that woven carbon GDLs have higher power densities (6), (7) and are more efficient at higher humidity (8). In comparison non-woven carbon fibres, ‘Papers’ and ‘Felts’, are competitive on price, easier to work with, and mechanically stiffer. This paper discusses preliminary results to date of in-situ testing for MEAs of different GDLs with the variation of structure and bulk density.
85

13th Advanced Batteries, Accumulators and Fuel Cells Fuel cells and methods
Method
Two, Intelligent Energy Ltd (I.E. Ltd), Fuel Cell Component Analysers (FCCA) were used to establish baseline measurements on a wide variety of commercially available GDLs. Both consist of four test chambers, each with independent anode and cathode gas flow and pressure control. Cell humidification is achieved through a humidification membrane supplied by the exhaust gases form the cell reaction, achieving 100% relative humidity once a steady state is established(9). The fabricated MEAs active surface area is 11.34 cm2.The mono-polar plates used are graphite, with a circular, single serpentine, flow field. The Gas Diffusion Electrode (GDE) anode material was held constant. Commercial JM electrode ELE00165 is used with a catalyst loading of 0.4 mg.cm-2. A variety of other GDLs were tested on the cathode side. TKK Pt/C catalyst based ink was hand painted on the GDLs to achieve a loading of 0.4 ±0.05 mg.cm-2. Nafion 212 Polymer Electrolyte Membranes (PEM) are used. The electrodes and the membrane are hot pressed at 125 °C and 1800kg. The following cathode materials are presented in this paper. All cathode GDLs had a Micro Porous Layer (MPL) on one side of the GDL.
E-TEK LT1200N (Non-woven carbon paper) E-TEK LT1200W (Woven carbon cloth) Sigracet SGL 24 BC (Non-woven carbon paper) Sigracet SGL 25 BC (Non-woven carbon paper) Sigracet SGL 34 BC (Non-woven carbon paper) Sigracet SGL 35 BC (Non-woven carbon paper)
Three MEAs of each cell type were fabricated to limit any errors resulting from MEA fabrication and during testing. Table 1: Selected materials data for GDLs (3)
The study will focus on the samples LT1200W and LT1200N to study the effect of structure, and SGL 24BC and SGL 25BC to study the effect of substrate bulk density. Samples SGL 34BC and SGL 35BC are also analysed in this paper. The MEAs were soaked in deionised water (resistivity = 18MΩ.cm) overnight to accelerate the membrane activation process. The MEAs were then randomly assigned to one of seven test chambers for in-situ testing, under the following operating, set point, conditions:
H2 flow rate: 80 sccm Air flow rate: 200 sccm Back pressure: 2 Bar Cell temperature: 70 °C Data logging rate: 1 Hertz Relative humidity: 100%
86
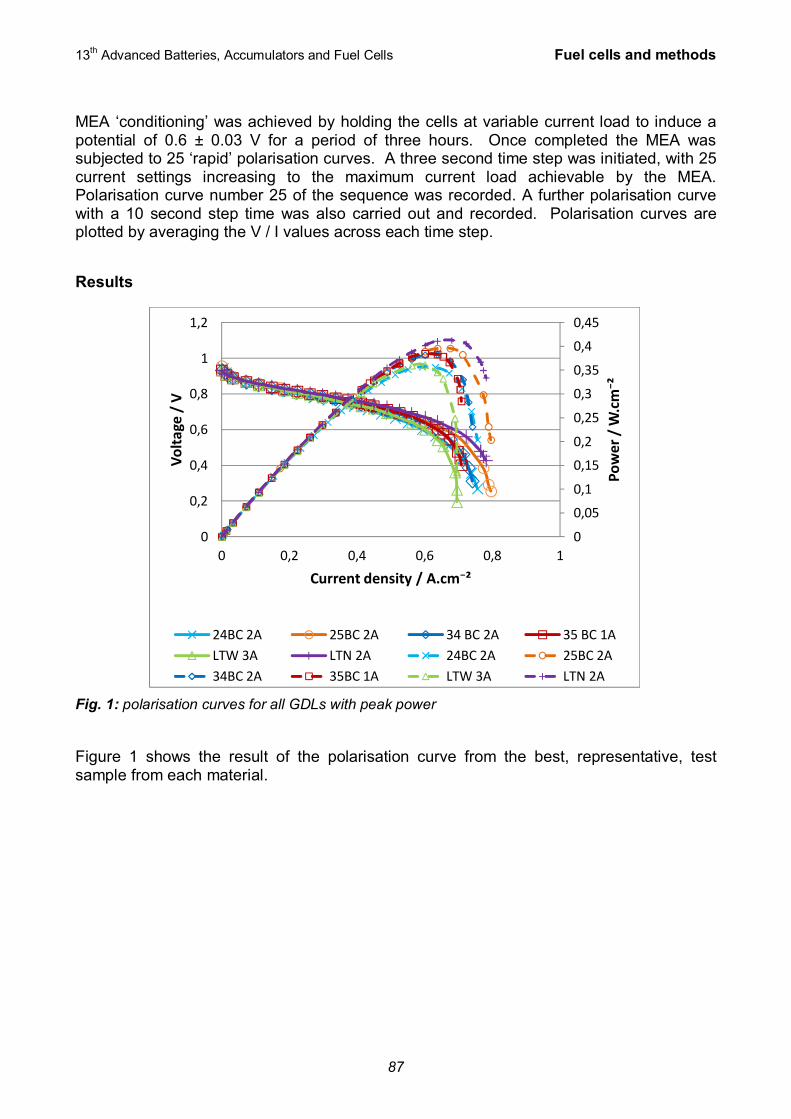
13th Advanced Batteries, Accumulators and Fuel Cells Fuel cells and methods
MEA ‘conditioning’ was achieved by holding the cells at variable current load to induce a potential of 0.6 ± 0.03 V for a period of three hours. Once completed the MEA was subjected to 25 ‘rapid’ polarisation curves. A three second time step was initiated, with 25 current settings increasing to the maximum current load achievable by the MEA. Polarisation curve number 25 of the sequence was recorded. A further polarisation curve with a 10 second step time was also carried out and recorded. Polarisation curves are plotted by averaging the V / I values across each time step.
Results
Fig. 1: polarisation curves for all GDLs with peak power
Figure 1 shows the result of the polarisation curve from the best, representative, test sample from each material.
0
0,05
0,1
0,15
0,2
0,25
0,3
0,35
0,4
0,45
0
0,2
0,4
0,6
0,8
1
1,2
0 0,2 0,4 0,6 0,8 1
Pow
er /
W.c
m⁻²
Volt
age
/ V
Current density / A.cm⁻²
24BC 2A 25BC 2A 34 BC 2A 35 BC 1ALTW 3A LTN 2A 24BC 2A 25BC 2A34BC 2A 35BC 1A LTW 3A LTN 2A
87

13th Advanced Batteries, Accumulators and Fuel Cells Fuel cells and methods
Fig. 2: Comparison of LT1200W and LT1200N samples
Fig. 2 shows a higher performance for the non woven LT1200N compared to the woven LT1200W. Comparison of the nonwoven (LTN 2A) variant to the woven (LTW 3A) shows that the non-woven GDL outperforms the woven sample in rate of Ohmic loss in the polarisation curve, the onset of mass transportation losses in the final third of the curve, in the rate of mas transport loss and also in the peak current drawn. Fig. 1 also reveals that peak power is superior for the non-woven LTN 2A test piece. Closer examination of the temperature during testing shows that the non-woven GDL was actually tested at a significantly lower temperature (65.9oC for LTN 2A, compared to 70.2oC for the LTW 3A test sample). This leads to the conclusion that the improved performance of the LTN sample has actually been suppressed by the test conditions. Comparison to Table 1 shows that hydrophobicity (indicated by water contact angle), resistivity and permeability values are similar. Density, thickness, porosity and mean pore diameter are all significantly different. It should be kept in mind that the test cells have undergone uniform clamping pressures, and gasket heights have not been optimised for each GDL. The increased thickness for the woven sample (LTW) could limit the effective porosity of the material still further through excessive clamping force. The non-woven material is superior in this instance, and the reduced mean pore size, combined with the increased total porosity, offers a possible mechanism to explain this. The increased total pore volume requires a greater volume of liquid water to fill before significant limits to the flow of reactants around and through the GDL are detected. The reduced mean pore size may also play a role in accelerating liquid water away from the reaction surfaces.
0
0,2
0,4
0,6
0,8
1
1,2
0 0,1 0,2 0,3 0,4 0,5 0,6 0,7 0,8 0,9
V
A.cm-2
LTN 2A LTW 3A
88

13th Advanced Batteries, Accumulators and Fuel Cells Fuel cells and methods
Fig. 3: Comparison of 24BC and 25BC samples
In Fig. 3 we see a reduced performance for the 25BC variant of GDL The 24 and 25 BC GDLs are examined in Fig. 3 and in this case there is a similarity in the GDL thickness, however porosity, density mean pore diameter and water contact angle differ. In the BC tests, both samples have been tested in a narrower temperature range (68.7 oC and 72.1oC respectively). If we refer to the previous results for the LT woven and non-woven materials; we see that smaller mean pore diameter and a greater porosity volume are linked to improved performance, as discussed previously. Examination of the material properties for the 24BC 2A and 25BC 2A test pieces reveals a similar relationship. The most significant difference in properties between the two samples is mean pore size: The 24BC GDL materials have a measured mean porosity 2.450 µm, and the 25BC have a mean pore diameter 0.842µm. 25BC 2A outperforms 24BC 2A in rate of Ohmic loss in the polarisation curve, the onset of mass transportation losses in the final third of the curve, and also in the peak current drawn. Fig. 1 also reveals that peak power is marginally superior for the 25BC 2A test piece. The fact that the rate of mass transport loss is slightly inferior (i.e. steeper) in the 25BC variant is interesting, and suggests that mean pore diameter is not dominant in this section of the curve, though more testing is required to confirm this to a reasonable degree of certainty. Once again we suggest that the reduced mean pore size, combined with the increased total porosity, of 25 BC 2A when compared to 24BC 2A, offers an explanation for the improved performance of 25BC 2A, through the same mechanisms discussed earlier.
0
0,2
0,4
0,6
0,8
1
1,2
0 0,2 0,4 0,6 0,8 1
V
A.cm-2
24BC 2A 25BC 2A
89

13th Advanced Batteries, Accumulators and Fuel Cells Fuel cells and methods
Fig. 4: Comparison of 34BC and 35BC samples
Fig. 4 shows a more uniform performance from the two GDLs, with 34BC being marginally better, especially in the mass transport section of the curve
Fig. 5: Peak power 34 BC and 35 BC
In the 34 BC and 35 BC GDLs we can examine the mean pore diameter and total porosity. Table 1 reveals a smaller mean pore diameter and a larger total pore volume in 35 BC. From our recent discussion we would expect to see 35 BC outperforming the 34BC GDL. However comparison to Fig. 4 at first glance indicates that 34 BC is marginally superior. The test temperature for the two samples was extremely uniform, with 70.3 °C for the
0
0,2
0,4
0,6
0,8
1
1,2
-0,1 0,1 0,3 0,5 0,7 0,9
V
A.cm-2
34 BC 2A 35 BC 1A
0
0,05
0,1
0,15
0,2
0,25
0,3
0,35
0,4
0,45
0
0,1
0,2
0,3
0,4
0,5
0,6
0,7
0,8
0,9
1
0 0,1 0,2 0,3 0,4 0,5 0,6 0,7 0,8
Pow
er /
W.c
m⁻²
Vol
tage
/ V
Current density / A.cm⁻²
34 BC 2A 35 BC 1A 34BC 2A 35BC 1A
90

13th Advanced Batteries, Accumulators and Fuel Cells Fuel cells and methods
34 BC and 69.9 °C. This narrow temperature range should not have a significant impact based on our previous observations. The thickness of the sample is also at the higher end of the ranges tested, with 35 BC being the thickest of all the GDLs tested. The compression force experienced in the test cell will be greatest for this material. Plotting the peak power for these two samples, shows a very close match between the two, and the highest recorded peak power in this set is 0.3847W.cm-2 for sample 35 BC, exactly as predicted. We suggest that the effect could be even more pronounced if the gasket height were optimised for both of these samples (thereby eliminating excessive compression forces from ‘closing off’ the porous structure).
Initial Observations:
Based on the tests to date (55 of 90 test specimens completed):
Woven structures do not out-perform non-woven materials in these tests o This may be due to the lack of cell optimisation for the increased through
plane thickness of the woven sample used Reduced mean pore size and increased total porosity dominate in determining
peak power output for MEA assemblies Table 2: Key material properties and measured outputs
24BC 2A 25BC 2A temperature during test 68.7 72.1 °C mean pore D 2.45 0.84 microns % porosity 40.0 36.5 % Ohmic Loss -0.4456 -0.4109 Ohms Rate of Mass transport Loss -2.2769 -2.305 Ohms maximum current 0.7561 0.7961 A.cm-2 Peak power 0.3570 0.3958 W.cm-2
LTW 3A LTN 2A temperature during test 70.2 65.9 °C mean pore size 1.06 0.77 microns % porosity 34.0 65.0 % Ohmic Loss -0.4046 -0.353 Ohms Rate of Mass transport Loss -3.9527 -1.7455 Ohms maximum current 0.6955 0.7817 A.cm-2 Peak power 0.3613 0.4128 W.cm-2
34 BC 2A 35 BC 1A temperature during test 70.3 69.9 °C mean pore size 2.20 1.47 microns % porosity 47.5 52.6 % Ohmic Loss -0.4017 -0.4084 Ohms Rate of Mass transport Loss -2.1787 -3.659 Ohms maximum current 0.7411 0.7088 A.cm-2 Peak power 0.3835 0.3847 W.cm-2
91

13th Advanced Batteries, Accumulators and Fuel Cells Fuel cells and methods
Acknowledgements
Without the aid of the following organisations, this work would not have been possible: Doctorial Training Centre in Applied Hydrogen and Fuel cell Technologies, Midland Energy Consortium, Engineering and Physical Sciences Research Council, and Intelligent Energy Ltd
References
[1] B. Millington, S. Du and B. G. Pollet, J. Power Sources, 196, 9013-9017, (2011). [2] M. Prasanna, H. Y. Ha, E. A. Cho, S. -. Hong and I. -. Oh, J. Power Sources, 131,
147-154, (2004). [3] A. El-kharouf, T. J. Mason, D. J. L. Brett and B. G. Pollet, J. Power Sources, 218,
393-404, (2012). [4] M. V. Williams, E. Begg, L. Bonville, H. R. Kunz and J. M. Fenton, Journal of The
Electrochemical Society, 151, A1173-A1180, (2004). [5] S. Escribano, J. Blachot, J. Ethève, A. Morin and R. Mosdale, J. Power Sources, 156,
8-13, (2006). [6] S. Litster and G. McLean, J. Power Sources, 130, 61-76, (2004). [7] C. Lim and C. Y. Wang, Electrochim. Acta, 49, 4149-4156, (2004). [8] Y. Wang, C. Wang and K. S. Chen, Electrochim. Acta, 52, 3965-3975, (2007). [9] Intelligent Energy Ltd, Fuel Cell Component Analyser: Version 3 DRAFT Sept 2007,
Intelligent Energy Ltd, Loughborough, (2007).
92

13th Advanced Batteries, Accumulators and Fuel Cells Fuel cells and methods
PROBLEMS OF ENERGY SAVING IN ELECTRICAL EXPERIMENTAL SMART GRID MODEL (E.E.S.)
Vesely1, I., Zezulka1, F., Sembera1, J., Sajdl1, O.
1Faculty of Electrical Engineering and Communication, Brno University of Technology, Center for Research and Utilization of Renewable Energy Sources, Kolejní 4, Brno, 61200
Czech republic
Abstract
This contribution deals with an idea of smart grids, a physical realization of a DC smart grid laboratory model (E.E.S.) and a strategy of its control. An author’s idea is to utilize a maximum of renewable energy which is available in an every moment. It would be a logical and the most economical principle, but it is in a contradiction with physical principles of electrical energy, with requirements coming from consumers and with possibilities of an electrical distribution system and information and control systems. A saving electrical energy is a difficult problem. In the contribution authors specify most of existing possibilities of the electrical energy saving. In a chapter DC laboratory smart grid authors describe and design a physical realization of the DC smart grid with saving into different technologies. And one of these ways is hydrogen.
Introduction
A principle of a hydrogen management is usage of hydrogen as an energy carrier and storage. The hydrogen is used to power automobiles, aircrafts, heating, but also for a preservation of electricity in the fuel cell, etc. For hydrogen sources utilized in the hydrogen management, there are several basic solutions. One of them is to use energy excesses from the largest hydroelectric power plants such as in Canada. Another option is to use photovoltaic cells placed in large areas such as the Sahara that convert solar energy into electrical. The actual technology of hydrogen electricity has several variants. The most modern way is the electrolysis of hot steam (at 900 to 1000 ° C), with the expected efficiency over 85%. The classical approach is the electrolysis of water - acidic or alkaline aqueous solution, by an electric current, but it has a low efficiency (about 70%).
Storing large quantities of hydrogen is also solved. For example, for the U.S. space program large quantities of liquid hydrogen are stored in vacuum freezing tanks, where one tank holds up to 3400 m3 of hydrogen. The liquid hydrogen can also be transported across sea and by road or path in tanks with a capacity of 75.7 m3. Underground tanks can also be used for storage. They are usually used now for the storage of mixtures of a methane and hydrogen. In the USA and South Africa hydrogen is transferred using pipeline to a distance of 80 km and in Europe to distance of 200 km. The storage of smaller amounts (e.g. for households and automobiles) trays containing alloys were designed. For example LaNi5 may absorb up to 7 moles of hydrogen per 1 mole of LaNi5 at normal temperature and pressure of 253 kPa (1 kg can absorb 32.6 grams - 362 liters of gaseous hydrogen). Density of dissolved hydrogen is doubled in compare with the
93

13th Advanced Batteries, Accumulators and Fuel Cells Fuel cells and methods
liquefied gas and stored energy density is about 35 times larger than in conventional lead-acid batteries.
In our case, for our experiments we use a small hydrogen power plant with a metal hydride canister for Smart grid. These plants for Smart grid can be divided into three parts. The first is electrolyzer (hydrogen generator) with a purifier, the second part is the storage, in our case the storage is a metal hydride canister with a valve system to switch between a charge operation and consumption, and the third one is a fuel cell. (1)
Electrolyzer/ Hydrogen generator
A hydrogen generator is based on an innovative alkaline membrane technology and produces 100 sl of hydrogen per hour. The generator produces hydrogen on demand from water, directly compressed, dry and pure using a patented electrolytic process. It contains 5 l water tank. With an output pressure up to 30 bar the generator can be used to refill compressed gas cylinders. But the supplied hydrogen purity of 99.94% is not suitable to refill metal hydride canisters. Therefore the purifier is added to generator and it purifies hydrogen to the desired value.
Ovonic™ Solid Hydrogen Storage Canisters
OvonicTM Sofld Hydrogen Storage Canisters are used to store pure gaseous hydrogen in a solid form and under a low pressure level. The stored hydrogen can be use by a fuel cell system or by other hydrogen consuming systems.
The Ovonic Solid Hydrogen Storage canisters utilize a proprietary metal hydride technology to safely store hydrogen in a compact manner at a low pressure. The metal alloy powder contained in the canister absorbs and release hydrogen – it’s a similar process like when a sponge absorbs water. The absorption of hydrogen is an exothermic process; the releasing hydrogen is an endothermic process. The canisters are designed to operate at ambient temperatures with no requirement for added heat and they can store several times more hydrogen than similarly sized high-pressure compressed hydrogen cylinders.
The hydrogen pressure in the storage canister mainly depends on the temperature of the metal alloy (Fig. 1). A gas pressure in the storage canister rises with an increasing canister temperature. Depending upon filling level, various pressures can be achieved. The following diagram shows approximate values for a typical pressure-temperature behavior of the used storage alloy. To avoid a sudden increase of pressure, a fully filled canister should never be heated without simultaneously releasing hydrogen. (2)
94

13th Advanced Batteries, Accumulators and Fuel Cells Fuel cells and methods
Fig. 1: Charging of canister (2)
In case of leakage or canister damage, hydrogen may be released. Due to the nature of metal hydrides, only a small portion of the stored hydrogen will be released spontaneously. The canister temperature will decrease and subsequent hydrogen production will occur at a fairly low rate (2). The metal hydride canister with size 760 sl will be incorporated in our plant. Important information is related to charging pressures of the canister. The nominal pressure is 10 bar at 20 °C and maximum 17 bar. This value must not be exceeded
Fuel cell
Fuel cells with a polymer electrolyte membrane are characterized by a high current density, which allows the construction of a low weight and small dimensions. The solid electrolyte membrane simplifies sealing in a chemical process, reduces corrosion and increases the life of the cell. PEMFC works at low temperatures, which allows faster start-up time and immediate reaction when desired power changes.
Low operating temperature also means that the fuel cell does not produce the heat required for the endothermic reforming reaction of the fuel. Contemporary PEMFC use a hydrated membrane as electrolyte.
Due to the low operating temperature a platinum is required as a catalyst. The platinum is suitable because it is sufficiently reactive for binding to H and O intermediates, and it is also capable to effectively release intermediates during the formation of the final compound. Molecular hydrogen binds H atoms at the anode Pt and then they are released as H + and e-:
H2 + 2Pt → 2 Pt-H [1]
2 Pt-H → 2 Pt + 2 H+ + 2e- [2]
95

13th Advanced Batteries, Accumulators and Fuel Cells Fuel cells and methods
The electrode contains a porous carbon with small particles of Pt. CO is strongly bound to the platinum at temperatures lower than 150 ° C. Therefore, only a few ppm of CO are tolerated in the fuel. Because reformed hydrocarbon fuel contains approximately 1% of CO, it is required to include devices for its removal in front of entry into the cell.
In the PEMFC water is not produced in the form of steam, but as a liquid. An important requirement of these types of cells is to secure high water content in the electrolyte due to ionic conductivity. The ionic conductivity of the electrolyte is higher, when the membrane is fully saturated, which means lower electrical resistance and a higher efficiency.
Another important part is how to supply hydrogen to a cell. A plate is pressed on the outer surface of the diffusion layer. This board has two purposes: a gas distribution and a current outlet. The plates are made of a lightweight, strong, impenetrable to gas and electrically conductive material, usually metal, graphite or a composite material. Distribution channels are created for the purpose of gas distribution on the side adjacent to the cover layer. Their structure has an impact on the efficient supply of reactants to the active surface of the electrode and the drain water. The set of all the above components forms one elementary fuel cell. The cells are connected into larger units, in order to increase a nominal output voltage and a power. A cathode and an anode current collector would be side by side in the classic series connected. To reduce the overall weight and size it is used only one bipolar plate, which separates the adjacent cells. On the one site, the system has distribution channels for hydrogen and on the other side it has distribution channels for oxygen. (3) In our case it is the type H200. An inlet pressure must be 0.4-0.55 bar and it can give power 200 W (Fig 2.). For this purpose is used 48 cell, which require high purity hydrogen 99.995%.
Fig. 2: Power characteristic of the fuel cell (4)
Model of a DC smart grid
The authors believe that the first steps towards a methodology of smart grid is a representative modeling of electrical grid with connected most suitable existing renewable as well as classic electric energy sources. One of the options is a purely mathematical model. In order to get more practical results, a real model of the energy network has been assembled. This network has been for simplification chosen as a DC network with safe voltage 24 V. This solution is sufficient for energy flow modeling. The system is not
96

13th Advanced Batteries, Accumulators and Fuel Cells Fuel cells and methods
concerned with other problems connected to AC networks. In the Fig.1 there is an electrical and technology block diagram of a DC smart grid laboratory with a title Experimental Energy Network E.E.S.
Fig. 3: Block diagram of Experimental Energy Network E.E.S.
Many small electrical power sources a category of renewable energy ones are connected to the grid. Some of these power sources are placed within reach of the Laboratory Automation, where the E.E.S. is located. It is at first a solar power and an air turbine, which is situated on a roof of the building. Other plants must be placed in the other locations from practical reasons. A connection to the grid of such power source is implemented using a wireless data transmission with information about current power. Using these data, each remote power source is modeled by controlled source of electrical energy (output power) which is realized like a controlled power from a battery or from electrical network (230V, 50 Hz) in the laboratory. Each source is connected to the network via a module which enables an energy flow control. The energy flow in the network is controlled by a computer, which has got information about the status of all the accumulators and about the energy supplies from the particular sources. For the network control also other information sources have to be used. For example, it is possible to use a weather forecast for a prediction of the energy production in the solar power station, wind power station, or even hydroelectric power station. The sources are equipped with local accumulators which can serve also as local distributed energy storages. However, the main energy storage, which is designed to cover the instability of the renewable sources, is the hydrogen storage.
97

13th Advanced Batteries, Accumulators and Fuel Cells Fuel cells and methods
Hydrogen power plant
The whole power plant from the perspective of the E.E.S. is treated as a single entity with certain dynamism. The aim of our work is to set parameters and control of the entire plant so that it is easy to handle and the same time it operates at the maximum efficiency.
The power plant can operate in four modes:
1. Standstill mode Neither electrolyzer nor fuel cell do not work
2. Charge mode Stores excessed energy into hydrogen. Electrolyzer fills the metal hydride canister.
3. Discharge mode Discharge hydrogen from storage container and generates electricity using the fuel cell
4. Run-to-run mode Electrolyzer creates hydrogen which is immediately transferred into the fuel cell where is used. This mode is unusable and therefore it is not used for anything in control.
Switching modes are secured by two electronic valves on/off and direct control electrolyzer and fuel cell (Fig 4.). A CompactRIO system made by National Instruments ensures a complete control. It is a powerful platform with a processor and a field-programmable gate array (FPGA), which contains several input and output modules. These modules are used mainly to detect the actual pressure and flow rate of hydrogen in pipelines using various sensors. Furthermore the platform contains output modules which control the above mentioned valves on/off and a RS232 which is used to control the electrolyzer and the fuel cell.
Several tasks must be secured for a correct operation of power plants:
1)
Switching on and off elements must be precisely adjusted for efficient work of power plant. Switching mainly depends on the various time constants of electrolyzer and a fuel cell . Under normal conditions this adjustment is hardly ever needed. But it is useful to quickly switch between charging and discharging of the container.
2)
A further task for testing is an appropriate selection of a pressure in the pipelines during charging of the canister. Because the canister and the electrolyzer have different nominal working pressures, it is needed to find the optimal pressure for sufficiently fast filling of canister and for electrolyzer work without problems
3)
The major task for an investigation is the suitability of using metal hydride canister in Smart grid. The canister is not directly pressurized but the pressure depends on the temperature of the canister, therefore we cannot know the power that will be in the future. In our case this fact is not so critical, because our fuel cell needs pressure 0.4 bar. But if the canister would be connected to other fuel cell, this problem must be solved. One option
98

13th Advanced Batteries, Accumulators and Fuel Cells Fuel cells and methods
is to maintain a constant temperature of the container. This condition may not always be met and, therefore, there is another option. Canister temperature and other variables can be measured and approximate temperature, which is needed, is calculated by the model.
4)
The last task is the possibility of using a metal hydride canister for balancing rapid small fluctuations of electric power due to e.g. photovoltaic power plants.
Fig. 4: Hydrogen power station
Conclusions
The presented Experimental Energy system ( E.E.S.), which is under construction in our laboratory as a physical model, aims to simulate a real power network with a large share of renewable sources. It will serve mainly for a development and a validation of predictive control algorithms of power system utilizing the most comprehensive information on the temporal power distribution of different types of renewable resources in a region, a farm or a village.
The paper deals particularly with the hydrogenous subsystem of the E.E.S. - one effective and possible used power subsystem of island smart grids. Research will be particularly focused on a measurement and an evaluation of effectiveness of the hydrogenous subsystem. In the paper, there are therefore described in details the principles of single components of the hydrogenous subsystem, hence the electrolyzer, fuel cell, hydrogenous storage containers. The main research and remaining investigation tasks on the hydrogenous sub-system are specified at the end of the contribution.
Acknowledgment
Authors gratefully acknowledge financial support from European Regional Development Fund under project No. CZ.1.05/2.1.00/01.0014.
99

13th Advanced Batteries, Accumulators and Fuel Cells Fuel cells and methods
References
[1] Vodíkové hospodářství - nadějná koncepce budoucí globální energetiky Země [online]. [cit. 2012-09-12]. Available: http://www.gorvin.mysteria.cz/hospodar.htm (2004)
[2] Heliocentris. Operation Guide: Ovonic™ Solid Hydrogen Storage Canisters 60 / 250 / 760 standard liters. Heliocentris Energiesysleme GmbH, 15 p. 3rd Edition.(2011)
[3] Z. Porš, Zdeněk. Palivové články. Ústav Jaderného Výzkumu Řež, a.s. Divize jaderné bezpečnosti a energetiky, 78 p. Available: http://www.cez.cz/edee/content/file/vzdelavani/palivove-clanky.pdf (2002)
[4] Horizon fuel cell technologies, H-200 Fuel Cell Stack: User Manual. 35 p.(2011) [5] P. Bača, Posibilities of electric power storage from renewable sources. Acta
Montanistica Slovaca, 100-104. ISSN: 1335- 1788 (2011). [6] L. Hedström, C. Wallmark, P. Alvfors, M. Rissanen, B. Stridh, J. Ekmanc, Description
and modelling of the solar-hydrogen-biogas-fuel cell system in GlashusEtt, Journal of Power Sources 131 2004 340-350
100

13th Advanced Batteries, Accumulators and Fuel Cells Lithium-ions accumulators
PERFORMANCE OF LiFePO4/C AND CARBON FIBERS COMPOSITE AS CATHODES IN LITHIUM-ION BATTERIES AND
BATTERY MODELING
Thomas a, J. E., Castro a, E.B., Milocco b, R.H., Visintin a, A.
a Instituto de Investigaciones Fisicoquímicas Teóricas y Aplicadas (INIFTA), UNLP, CCT La Plata-CONICET, CC 16, Suc. 4, CP 1900, La Plata, Argentina.
b Grupo Control Automático y Sistemas (GCAyS), Depto. Electrotecnia, Facultad de Ingeniería, Universidad Nacional del Comahue, Buenos Aires 1400, 8300 Neuquén,
Argentina.
Abstract
Currently, the cathode material, LiFePO4/C, is the most promising active material for high-power lithium-ion batteries for electric vehicles applications and it has been observed that its response is also dependent on the nature of the carbon used as support. This paper presents the preliminary results from the synthesis of LiFePO4 supported on carbon fibers where phosphate and fibers are synthesized together at a single stage. The electrodes built with this material have a good electrochemical response with the typical behavior of LiFePO4. In addition, the behavior of these materials has been characterized from the viewpoint of the electrochemistry of charge/discharge processes in order to provide knowledge for the global modeling of batteries.
A Battery Management System (BMS) is also currently being developed, in order to control the operating condition and the state of charge of the Li ion batteries. The development of a BMS requires an adequate modeling of the dynamic accumulation processes taking place in the battery. A general model has been derived and validated in terms of the experimental performance of a Li ion battery, some results are presented below.
Introduction
The LiFePO4/C composite is currently the most promising active material for cathodes of lithium ion batteries for high power, mainly because its composition (non-toxic), low price and good stability (chemical and thermal) during cycling. But it has been observed that the response of these materials is also dependent on the nature of the carbon used as support (1). In this paper we present the results of the preliminary synthesis of LiFePO4 supported on carbon fibers wherein the phosphate and the carbon fibers are synthesized simultaneously in a single step. This is carried out by combining two synthesis techniques. One is the glycine-assisted combustion (2) and the other is the decomposition of porous polymers (3). Here cotton fibers were used as porous polymer which carbonizes during the LiFePO4 sintering at 750 °C under argon atmosphere. The material obtained was physically characterized (SEM, EDS, TEM) and electrochemically characterized by the usual techniques for lithium ion batteries electrodes (charge-discharge cycling, cyclic voltammetry and EIS). Electrodes show a good response and the typical electrochemical behavior of these materials.
101

13th Advanced Batteries, Accumulators and Fuel Cells Lithium-ions accumulators
Experimental
Sample Preparation The samples were prepared by solid-state glycine assisted synthesis under Argone flowing atmosphere, but the reagents were solved in water. An [0.5 M] aqueous solution of LiNO3, NH4PO4H2, FeC6H6O7 and glycine was totally absorbed in cotton fibers. This was moved to the tube furnace, dried at 300°C for 5 hours under Ar atmosphere and sintered at 750°C for 6 hours. The sample was grinded in a ball mil for 1 hour afterwards. The samples were physically characterized by XRD, TEM, SEM.
Electrochemical characterization The electrodes for electrochemical measurements were prepared by mixing the prepared LiFePO4/C composite with Super C carbon and PVDF binder in weight ratio 80:10:10 together with N-Mehyl-Pyrolidinone solvent. Thin layer of mixture was coated on aluminum foil by doctor blade, dried and pressed. The experiments was performed in a metal three electrode El-Cell® testing cell assembled in Ar atmosphere glovebox with O2 and H2O concentration < 1ppm, using metallic lithium like counter and reference electrodes. The voltammograms were recorded at 0.1mV/s, 1 mV/s and 10 mV/s between 2.7V and 4.2V. For charge/discharge cycles a current of 1 C was used, with cutoff potentials of 2.7V and 4.2V. The rate capability experiments were recorded whit the same charge rate and cutoff potential with discharge rates C/5, C/2, C, 2C, 5C and 10C. Electrochemical impedance spectroscopy was made using amplitude 5mV of excitation sinus voltage in frequency range 10kHz to 5mHz. Measurements were made at various states of charge at OCV.
Results and discussion
As shown in Figure 1(a) the obtained material from the combination of both synthesis procedures maintain the fibrillar structure from the chose polymer (cotton fibers). This is composed basically of carbon fibers which are decorated with LiFePO4 particles as shown in more detail in Figure 2(a). From the EDS spectra, can be obtained an atomic ratio P:Fe close to 1:1, indicating that the stoichiometric ratio approaches the expected for LiFePO4 Figures 1(b) and 2(b). Looking in detail Figure 1(b) corresponding to the EDS spectrum of a broad field, the carbon content it would be quite high compared with the optimum for this type of electrodes. From the calcination of the samples, was determined a carbon content higher than 50%. Initially would imply that the electrodes prepared with these samples should provide a response with lower capacities than those expected for LiFePO4/C electrodes.
Fig. 1: (a-left) SEM images of the obtained samples and (b-right) EDS spectra from image
102

13th Advanced Batteries, Accumulators and Fuel Cells Lithium-ions accumulators
Fig. 2: (a-left) SEM image whit higher magnification and (b-right) EDS spectra from image
The electrodes show a plateau potential at 3.4V whit a good cyclability (Figure 3) but the capacity was lower than estimated for LiFePO4. This response was presumed taking in account the amount of carbon on the samples.
2.7
3.2
3.7
4.2
0 5000 10000 15000 20000
Time / s
Po
ten
tia
l / V
0
10
20
30
40
0 10 20 30 40 50
Cycles
Ca
pa
city / m
Ah
/g
Fig. 3: (a-left) Galvanostatic discharge at C/5 and (b-right) discharge capacity Vs. cycles at 1C.
The reversibility and the kinetic behavior of these materials was the typical response of the LiFePO4/C, for the reason that this experiments are not serious influenced by the concentration of active material on the electrodes (Figure 4).
5mHz
0
1000
2000
3000
4000
5000
6000
7000
8000
0 2000 4000 6000 8000
Z' (Ω/mg)
-Z''
(Ω/m
g)
300Hz
10kHz
10Hz
0
50
100
0 50 100
Fig. 4: (a-left) Cyclic Voltamograms at 0,1and 1 mV/s at 25°C. (b-right) Nyquist EIS diagrams at high frequencies and entire range of frequencies
103

13th Advanced Batteries, Accumulators and Fuel Cells Lithium-ions accumulators
Battery Model Formulation for BMS:
A general model has been derived, which describes the accumulation process, in the electrodes of a Li ion battery, as a series combination of a pure integrator and a high pass filter coupled to a static nonlinearity function, If (Butler Volmer type equation). In the model only the dynamics of the controlling electrode is taken into account. This model has been validated in terms of the experimental performance of a Li ion battery.
Figure 5 depicts a scheme of the complete battery model. In the figure the term r, accounts for the ohmic resistance between electrodes, G(s), corresponds to the Laplace transform of the high pass filter and 1/(Qmaxs), is the Laplace transform of the integrator
Fig. 5: Battery Model
Figure 6 and 7 show a validation of the proposed model, in terms of the simulation of the potential response to a given current perturbation signal using a commercial Li-ion battery.
Fig. 6: Commercial Li ion Battery: (a-left) Applied current and (b-right) Measured and predicted potential response.
Conclusions
This paper presents the preliminary results from the synthesis of LiFePO4 supported on carbon fibers where phosphate and fibers are synthesized together at a single stage. Cotton fibers were used as porous polymer which carbonizes during the LiFePO4 sintering at 750 °C under argon atmosphere. The electrodes built with this material have a good electrochemical response with the typical behavior of LiFePO4. Results have demonstrated that these materials have electrochemical properties comparable to those
104

13th Advanced Batteries, Accumulators and Fuel Cells Lithium-ions accumulators
typically produced by commercial method. A general model has been derived and validated in terms of the experimental performance of a Li ion battery, some results are presented.
Acknowledgments
This work was supported by the Consejo Nacional de Investigaciones Científicas y Técnicas of Argentina, the Agencia Nacional de Promoción Científica y Tecnológica and the Comisión de Investigaciones Científica de la Provincia de Buenos Aires. The authors thank the Innovation and Technology Transfer Project in Priority and Areas of the UNLP and the bilateral cooperation with the Faculty of Electrical Engineering and Communications, Brno University, Czech Republic.
References
[1] O. Cech, J.E. Thomas, A. Visintin, M. Sedlarikova, J. Vondrak, S. Moreno, ECS Trans., 40 (1), 93 (2012).
[2] N. Kalaisevi and A. Manthiram, Journal of Power Sources, 195, p.2894 (2010) [3] H.D. Deshazer, [4] F. La Mantia, C. Wessells, R.A. Huggins and Y. Cui, J. Electrochem. Soc., 158 (10)
A1079 (2011)
105

13th Advanced Batteries, Accumulators and Fuel Cells Lithium-ions accumulators
STUDY OF THE LAYERED COMPOUNDS Li[LiMnNiCo]2 AS POSITIVE ELECTRODES IN LITHIUM CELLS: SYNTHESIS,
ELECTROCHEMICAL BEHAVIOR, AND SURFACE CHEMISTRY
Amalraja, S. F., Markovskya, B., Taliankerb, M., Sclara, H., Sharona, D., Burlakaa, L., Zinigrada, E., Haika, O., Marthaa, S. K., Aurbacha, D.
aDepartment of Chemistry, Bar-Ilan University, Ramat-Gan 52900, Israel bDepartment of Materials Engineering, Ben-Gurion University of the Negev, Beer-Sheva
84105, Israel
Abstract
Layered structure materials of the general formulae of LiMO2 (M is Mn, Ni, Co) and lithium-rich integrated Li[LiMnNiCo]2 compounds for positive electrodes in Li-cells have attracted much attention of the researchers in the field of advanced Li-ion batteries. The integrated materials represent a type of layered LiMO2 compounds that can be partially substituted by a structurally compatible [Li1/3Mn2/3] unit. Electrodes based on the xLi2MnO3
.(1-x)LiMO2 integrated materials can operate up to 4.6 – 4.8 V and provide reversible capacities >200 mAh/g. The main goal of the present work was studying the electrochemistry of LiMO2 and Li[LiMnNiCo]O2 electrodes at 30 and 600C in relationship with the structural changes of the active material due to the lithium extraction at high anodic potentials. The LiMO2 and Li[LiMnNiCo]O2 materials were synthesized by the self-combustion reaction using Li, Ni, Mn, and Co nitrates, and sucrose. Transmission electron microscopy (TEM) study of the integrated materials demonstrated that they are comprised of nano-domains of both rhombohedral LiNiO2-like and monoclinic Li2MnO3 structures, which are integrated and interconnected with one another at the atomic level. It was shown that electrodes comprising the Li[LiMnNiCo]O2 submicron particles demonstrated reasonable cycling behavior at various charge/discharge rates at 30 and 600C. They can be cycled successfully at a moderate rate of C/5 at the elevated temperature. At higher rates of charge-discharge at the elevated temperature, these electrodes show reversible cycling
performance and capacity 250 mAh/g in the earlier cycles while capacity fades upon prolonged cycling. It was found that the aging of LiMn1/3
Ni1/3Co1/3
O2 nanoparticles, even at
60 C, do not result in pronounced changes of their bulk structure.
Introduction
Among several challenges in the field of Li-ion batteries, one of the most important is the replacement of the commonly-used LiCoO2 cathode with more advanced materials of a higher voltage and capacity, better safety features and lower prices. Natural substitutes are LixMnO2
(1) and LixNiO2 (2) materials, which however are problematic in regard of the structural and surface stability. The most stable form of LixMnO2 is LiMn2O4 spinel whose capacity and high temperature performance are limited (3). It was found that Li[NiCo]O2 is a better cathode material than both LiNiO2 and LiCoO2, and recently, a further modification produced LiNi0.8Co0.15Al0.05O2 (LiNCA) as an excellent cathode material for Li-ion batteries, with reasonable stability, cycleability, safety features and an initial capacity > 190 mAh/g
106

13th Advanced Batteries, Accumulators and Fuel Cells Lithium-ions accumulators
(4, 5). In parallel, extensive work on manganese compounds resulted in a description of LiNi1/2Mn1/2O2 with a layered structure as a promising high-capacity cathode in which the red-ox activity of Ni
2+ Ni3+ Ni4+ may provide capacities up to 200 mAh/g (6, 7). This material develops a unique surface chemistry that allows the good passivation of the active mass, enabling its prolonged cycling at elevated temperatures (8). However, from most of the publications devoted to this compound, one can conclude that the material is slow in Li charge-discharge reactions, mostly due to the mismatch of ions in the lattice (Li+ vs. Ni2+ and Mn4+ ions), which impedes the fast bulk transport of Li ions in LixNi1/2Mn1/2O2
particles (9). As a further improvement, LiMn1/3Ni1/3
Co1/3O2 (LiMNC) was suggested as a
promising cathode material for Li-ion batteries (10-13). The replacement of part of the Mn and Ni by Co in the layered structure seems to have a stabilizing effect, which prevents mixing between Li and transition metal ions in the lattice, thus allowing a smooth and fast Li ions bulk transport in this material (14, 15). Important progress in the field was demonstrated by the recent works on Li[Li-Mn-Ni-Co]O2 "integrated" lithium-rich compounds. Some of these systems provide a very high reversible capacity, up to 250 mAh/g in the potential range of 4.8 - 3 V (16 – 19).
Apparently, the use of nanomaterials as cathode materials for Li batteries in general should be considered as favorable for achieving high rate capability, since solid-state Li-ion transport in the bulk materials may be the rate-determining step for the entire cathodic processes. Hence, the use of nanoparticles means reducing to minimum the diffusion length for Li-ion transport. Indeed, it was clearly demonstrated that the cathodes comprising nanoparticles of LiNi1/2Mn1/2O2
(8) and LiMn1.5Ni0.5O4 (20) demonstrate faster kinetics than electrodes based on micrometric-size particles. However, the use of nanoparticles in these composite electrodes may interfere badly with their electrical integrity and the inter-particle electrical contact. Moreover, electrode materials such as LiMO2 may be reactive with components of the standard electrolyte solutions based on alkyl carbonate solvents and LiPF6 (which unavoidably contain detrimental contaminants such as HF, trace water, PF5 and POF3) (21). In this paper, we synthesized submicronic and nanoparticles of LiMO2 and Li[LiMnNiCo]2 and studied them as cathode materials for Li-ion batteries.
Experimental
Nanocrystalline LiNi1/2Mn1/2O2, LiMn1/3Ni1/3Co1/3O2 and LiNi2/5Mn2/5Co1/5O2 layered and integrated layered-layered xLi2MnO3
.(1-x)LiMn1/3Ni1/3Co1/3O2 materials were synthesized by a self-combustion method. We used the stoichiometric amounts of lithium, nickel, manganese and cobalt nitrates, which act as the oxidants, and sucrose as the fuel. Typically, the reaction can be described as follows:
LiNO3 + 0.5 Ni(NO3)2.6H2O + 0.5 Mn(NO3)2.4H2O + 0.3125 C12H22O11 + 0.25 O2 LiNi0.5Mn0.5O2 + 3.75 CO2 + 8.4375 H2O + 1.5 N2
The amount of sucrose used was chosen for the oxidant/fuel ratio = 1:1 (8). In order to improve the crystallinity and to increase the crystallite size of as prepared samples they were calcined (annealed) at 700ºC for 22 hours and at 9000C for 22 hours, in the air atmosphere. From the elemental chemical analysis (by ICP technique) and energy dispersive spectroscopy studies, atomic ratio 1:1 was measured for Mn and Ni of the LiNi1/2Mn1/2O2 compound and 1:1:1 and 1:1:0.5 (accuracy is 99 %) for Mn, Ni, Co of the LiMn1/3Ni1/3Co1/3O2 and LiNi2/5Mn2/5Co1/5O2 compounds, respectively. The active surface
107

13th Advanced Batteries, Accumulators and Fuel Cells Lithium-ions accumulators
areas of the above materials were measured by Brunauer, Emmet and Teller (BET) method with Gemini 2375, Micromeritics (multipoint mode). Their particle size was estimated from HRSEM images and particle size distribution was measured using Mastersizer-2000 (Malvern Instruments Ltd.). X-ray diffraction (XRD) measurements were
performed using an AXS D8 Advance diffractometer (reflection - geometry, Cu K radiation, receiving slit 0.2 mm, scintillation counter, 40 mA, 40 kV) from Bruker, Inc. X-ray photoelectron spectroscopy (XPS) and Raman spectroscopy measurements were carried out as described in (22). Aging of the materials was performed in an EC-DMC 1:2/LiPF6
1.5 M solution in dynamic conditions (magnetic stirring) at 30 and 60 C. Chemical analysis of the solutions remaining after aging of LiMn1/3Ni1/3Co1/3O2 samples was carried out using ICP spectrometer Ultima-2 (Jobin Yvon Horiba). Electrochemical measurements were conducted in two- and three-electrode cells of a coin-type 2325 configuration or in tea-bag cells with a polypropylene membrane separator (Celgard, Inc.). The working electrodes were compositions (by weight %) of the active lithiated oxide material - 80, a super P carbon additive - 10, and a PVdF binder – 10, prepared from a slurry in N-methyl-pyrollidone, pasted on both sides of the Al-foil (> 99.9 %, Strem Chemicals Inc., USA) current collector. All the potentials in this work are given vs. Li/Li+ reference electrode. The electrolyte solution of Li battery grade comprising dimethyl carbonate (DMC) and ethylene carbonate (EC) (2:1, by weight) and 1.5 M LiPF6 (from Tomiyama) was used as received. The content of HF and H2O in solution was around 100 ppm and 20 ppm, respectively. The electrochemical measurements were carried out using a multichannel battery test unit from Maccor, Inc., model 2000.
Results and discussion
(a) (b)
Fig. 1: XRD patterns of the LiNi1/2Mn1/2O2, LiMn1/3Ni1/3Co1/3O2 and LiNi2/5Mn2/5Co1/5O2 particles obtained by the SCR and annealed further in air at 9000C for 22 h (a) and of the xLi2MnO3
.(1-x)LiMn1/3Ni1/3Co1/3O2 produced by the SCR and further annealed in air at 900 0C for 22 h (b). The inserts show weak reflections (020)M and (110)M of the monoclinic Li2MnO3 phase within 2 range 20 - 24 .
From the XRD patterns of the LiNi1/2Mn1/2O2, LiMn1/3Ni1/3Co1/3O2 and LiNi2/5Mn2/5Co1/5O2 layered materials produced by SCR and further annealed at 9000C for 22 h in air we conclude that the diffraction lines (Figure 1a) can be indexed on the basis of a hexagonal
lattice structure of -NaFeO2, space group 166, R-3m. Highly resolved splitting of the
108

13th Advanced Batteries, Accumulators and Fuel Cells Lithium-ions accumulators
006/012 and 018/110 peaks of the LiNi0.33Mn0.33Co0.33O2 and LiNi2/5Mn2/5Co1/5O2 materials and ratio of the lattice parameters c/a =4.96 – 4.98 provide evidence of a characteristic well-ordered layered structure of these compounds. Moreover, ratios of the integrated intensities of 003 and 104 peaks of the XRD patterns were found to be around 1.2 and >1, respectively for the above materials. This may indicate therefore no cation mixing (17, 20) and high electrochemical activity of the cathodes materials in lithium cells (23). Low values of the R-factor R=(I102 + I006)/I101, around 0.41 – 0.44, which relates to the integrated intensities of the corresponding well-resolved peaks of the LiMn1/3Ni1/3Co1/3O2 and LiNi2/5Mn2/5Co1/5O2 materials also confirm their high hexagonal ordering (24).
HRSEM images of the LiNi1/2Mn1/2O2, LiMn1/3Ni1/3Co1/3O2 and LiNi2/5Mn2/5Co1/5O2 particles annealed at 9000C for 22 demonstrate that these particles are of submicron size ranged
from 0.1 to 0.5 . Individual LiNi1/2Mn1/2O2 particles obtained by calcination at 7000C for 22 h have nano-sized dimensions of 60 – 75 nm.
Figure 1b shows XRD patterns of the synthesized material xLi2MnO3.(1-
x)LiMn1/3Ni1/3Co1/3O2 (x=0.3, 0.5 and 0.7) annealed at 900 0C/22 h. Each of these patterns can be interpreted as corresponding to the integrated structure comprising two components: the rhombohedral phase possessing the structure of LiNiO2 (space group R-3m) and the monoclinic phase Li2MnO3 described by space group C2/m. Accordingly, strong peaks in the diffraction profile were considered as a superposition of reflections related to both phases and could be indexed in terms of the hexagonal unit cell representing the rhombohedral structure (a=2.852Å, c=14.229 Å) and on the basis of the
monoclinic unit cell with the parameters a=4.940 Å, b=8.555 Å, c=5.021 Å and =108.98 . In Figure 1b the indices related to the monoclinic Li2MnO3 phase are marked with subscript M. The monoclinic component of the xLi2MnO3
.(1-x)LiMn1/3Ni1/3Co1/3O2 material manifests
itself in appearance of two characteristic weak peaks (020)M and (110)M within 2 range
20-24 (see inserts) that are due to the existence of Li+ ions from the Li2MnO3 component in the transition metal layers. As expected, the integral intensity of these peaks increases with increasing the Li2MnO3 content in the series of the synthesized of xLi2MnO3
.(1-x)LiMn1/3Ni1/3Co1/3O2 materials. Measurements of the peak intensity ratio R=(I012 + I006)/I101 (the indices are related to rhombohedral phase) have shown that it is about 0.31. This fact, along with the value c/a=4.99 obtained for the unit cell of rhombohedral phase, provide additional evidence that all synthesized xLi2MnO3
.(1-x)LiMn1/3Ni1/3Co1/3O2 compounds comprise integrated Li2MnO3/LiNiO2-like components with characteristic layered structure. Further structural characterization of the xLi2MnO3
.(1-x)LiMn1/3Ni1/3Co1/3O2 material was performed employing the Rietveld refinement method. X-ray diffraction profile obtained from the material produced at 9000C during 22 h (x=0.5) was chosen for analysis. The model used for the refinement was based on two-phase system with rhombohedral LiNiO2 and monoclinic Li2MnO3 components. A good fit was obtained and the Bragg factors characterizing the agreement between the observed and calculated intensities for rhombohedral and monoclinic phases were 7.0 % and 9.7 %, respectively.
Figure 2a represents behavior at different rates of discharge of the electrodes comprising nano-LiNi1/2Mn1/2O2 particles (70 nm, calcination at 7000C/22 h), whereas Figure 2b demonstrates plots of the capacity vs. discharge rate of the LiNi1/2Mn1/2O2electrodes, made from submicron particles (around 0.2 μ, calcination at 9000/22 h). Typically, nano-LiNi1/2Mn1/2O2 electrodes exhibit initial discharge capacity of 160 mAh/g at C/15 rate, high capacity retention (98 %) after testing these electrodes at various rates up to 3C, and stable prolonged cycling behavior at C/5 (Figure 2a).
109

13th Advanced Batteries, Accumulators and Fuel Cells Lithium-ions accumulators
Fig. 2: Cycling behavior at various rates of discharge (as indicated) of the composite electrode comprising (a) submicron LiNi1/2Mn1/2O2 and LiMn1/3Ni1/3Co1/3O2 particles produced by SCR and further annealed in air at 9000C/22 h. T=300C, potential range was 2.5 – 4.5 V, and (b) nano-sized LiNi1/2Mn1/2O2 particles produced by SCR and further annealed in air at 7000C for 22 h. T=300C, potential range was 2.5 – 4.5 V. Cycling protocol was constant current – constant voltage providing potentiostatic steps at 4.5 V during 5 h for C/15 rate, 1 h for C/5 rate, 30 min for C/2 rate and 10 min for 1C and at 3C rate.
As expected, nano-LiNi1/2Mn1/2O2 electrodes develop faster electrochemical kinetics due to smaller path for Li insertion/deinsertion and higher reversibility. By comparing the results represented in Figures 2a and b, it was established that electrodes comprising submicron particles of LiNi1/2Mn1/2O2 (annealed at 9000C/22 h) behave similarly to their nano-counterparts while they demonstrate higher discharge capacities at C/5 to 3C rates (Figure 2b). This may relate to higher crystallinity of the submicron particles due to the elevated temperature of their annealing. In addition, nano-particles of this material are characterized by higher value of cation mixing and they have lower degree of hexagonal ordering. Although the electrodes comprising nano-LiNi1/2Mn1/2O2 particles demonstrate faster electrochemical kinetics in comparison to those prepared from submicron or micronic particles (8), it seems that the calcination conditions influence strongly the cation ordering/disordering, and therefore, the electrochemical activity of the material. Annealing at 7000C for 22 h may be considered as inappropriate for obtaining LiNi1/2Mn1/2O2 cathode material with desirable cycling properties. We have established that LiNi1/2Mn1/2O2 cathodes comprising submicron particles display very stable cycling at 1C rate during more than 350 charge/discharge cycles. Capacity fading was found to be around 0.1 mAh/g per cycle in this case. As regarding LiMn1/3Ni1/3Co1/3O2 and LiNi2/5Mn2/5Co1/5O2 electrodes made from submicron particles, it is expected that these electrodes would be electrochemically active in terms of cycling and high rate capabilities due to high hexagonal ordering (c/a values of 4.96 – 4.97), lesser exchange of Ni2+ and Li+ cations from their (3a) and (3b) sites, respectively, as well as small values of the R-factor R=(I012 + I006)/I101. Indeed, LiMn1/3Ni1/3Co1/3O2 electrodes show remarkable highly stable performance at 3C rate during more than 450 cycles at 300C. Importantly that an intermediate cycling of these electrodes at 8C rate and aging every 100 cycles for 1 week at a discharge state only slightly influence their capacity fading (23). This may be attributed, to some extent, to small enough specific surface area (2.6 m2/g) of the LiMn1/3Ni1/3Co1/3O2 submicron particles.
110

13th Advanced Batteries, Accumulators and Fuel Cells Lithium-ions accumulators
Fig. 3: Cycling behavior of electrodes prepared from the xLi2MnO3.(1-x)LiMn1/3Ni1/3Co1/3O2
materials annealed at 900 C for 22 h. Galvanostatic charge-discharge was performed at 30 0C first at a C/20 rate for several initial cycles and then at C/10 in the potential range of 2.0 – 4.8 V. EC – DMC (1:1)/1 M LiPF6 solutions.
The electrodes comprising integrated layered-layered lithium-rich materials demonstrate stable cycling behavior at 30 0C (Figure 3), and a steady discharge capacity around 175 mAh/g can be obtained from xLi2MnO3
.(1-x)LiMn1/3Ni1/3Co1/3O2 electrodes (x=0.3; x=0.7)
after 20 cycles. Much higher reversible capacity ( 220 mAh/g), is delivered by the 0.5Li2MnO3
.0.5LiMn1/3Ni1/3Co1/3O2 electrodes (x=0.5). The latter also demonstrate superior cycling behavior at various charge/discharge rates (25). It was also found that electrodes corresponding to x=0.7 demonstrate inferior performance at high rates but reasonable capacity retention. The latter can be attributed, to some extent, to low cobalt content at x=0.5 and x=0.7 in the integrated materials. The high reversible capacities and cycling stability of electrodes comprising integrated xLi2MnO3
.(1-x)LiMO2 materials can be ascribed to the high content of active Mn4+/Mn3+ redox sites.
By studying the surface chemistry of lithiated transition metal oxides used as cathode materials for Li-ion batteries we could identify several possible surface reactions of LixMOy cathode material in electrolyte solutions based on alkyl carbonate solutions. The surface oxygen of these oxides can attack nucleophilically alkyl carbonate molecules, thus forming surface ROCO2Li, (ROCO2)yM, ROLi and (RO)xM species. The basic oxygen reacts with acidic species such as HF, thus forming surface fluorides (LiF, MFx). Transition metals at high oxidation states can oxidize alkyl carbonates, thus forming CO2 and transition metal ions at lower oxidation states. Such ions can dissolve in solutions more easily than transition metal ions at high oxidation states. Finally, alkyl carbonates, especially EC, can be polymerized on the LixMOy particles' surfaces, probably by cationic mechanisms, to form polycarbonate species. The order of reactivity of LixMOy compounds in standard solutions based on alkyl carbonate solvents and LiPF6 was found to be LiNiO2 > LiCoO2 > LixMnO2 (layered structure) and LiMn2O4 spinel structure (21). LiMn1.5Ni0.5O4 spinel and LiNi1/2Mn1/2O2materials were also found to be very reactive towards solution species in standard electrolyte solution based on alkyl carbonates and LiPF6 (8, 21). These materials seem to develop surface films comprised of Li and transition metal fluorides, alkoxides and metal alkyl carbonate species, and polycarbonates. We found evidence that upon aging in solutions, the particles of these Li[MnNi]O2 materials develop a core-shell structure. The shell is formed by the surface reactions and the reversible dissolution of transition metals
111

13th Advanced Batteries, Accumulators and Fuel Cells Lithium-ions accumulators
that leads to changes in the stoichiometry of the material near the surface, and hence, to the formation of new phases.
In the present work, the surface chemical studies concentrated on LiNi1/2Mn1/2O2 and LiMn1/3Ni1/3Co1/3O2 nanoparticles and electrodes. The following information was obtained from the FTIR spectra measured by the diffuse reflectance from pristine and aged powders (Figure 4).
Fig. 4: FTIR spectrum of ethylene carbonate (EC) and spectra measured from pristine and aged nano-LiNi1/2Mn1/2O2 powders. Ageing was carried out in DMC-EC (2:1)/1.5 M LiPF6 solution in a sealed polyethylene vial (argon atmosphere) at T=600C for 20 days. Possible surface species formed are indicated.
The spectrum related to the pristine powder is nearly featureless in most of the relevant range. The main IR peaks are of the surface –OH groups (3360 cm-1), residual atmospheric CO2 (indicated) and peaks at low wavenumbers (400 – 600 cm-1) that probably belong to M-O vibrations. The IR spectrum of the aged powder is rich in peaks, around 3000 cm-1 (related to C-H bonds), around 1800-1600 cm-1 (carbonyl C=O peaks), and many peaks below 1450 cm-1, which belong to the fingerprint region of organic species. The comparison with the spectrum of EC shows that the spectra of the aged electrode material do not reflect the presence of residual EC. Hence, the carbonyl peaks in the 1800-1600 cm-1 range in the spectrum of the aged LiMn1/3Ni1/3Co1/3O2 powder indeed reflect the formation of polycarbonate and ROCO2M species.
112

13th Advanced Batteries, Accumulators and Fuel Cells Lithium-ions accumulators
Fig. 5: XPS spectra (O1s, F1s and P2p) of pristine LiMn1/3Ni1/3Co1/3O2 nano-particles (calcination at 7000C/1 h after SCR) and spectra of nano-particles aged in an EC-DMC/LiPF6 solution, at 600C for 2 weeks.
Figure 5 compares X-ray photoelectron spectra of O1s, F1s and P2p measured from pristine
and aged LiMn1/3Ni1/3Co1/3O2 powders. Aging included storage at 60 C in an EC-DMC 1:2/1.5 M LiPF6 solution. These surface studies demonstrate pronounced changes in the surface composition of this material upon contact with the electrolyte solutions. New fluorine and phosphorous surface species are formed. The oxygen spectra also reflect pronounced surface changes. The new broad oxygen peak at high binding energies (up to 535 eV) reflects the formation of surface oxygen compounds. This is in line with the FTIR spectrum (not shown) of the aged material that reflects the formation of surface carbonate and polycarbonate species.
Fig. 6: Raman spectra of the pristine LiMn1/3Ni1/3Co1/3O2 nanoparticles (annealed at 700 C/1 h) and particles aged in EC – DMC (1:2)/1.5 M LiPF6 solutions at 30 C during 8 weeks and at 60 C during 6 weeks.
LiMn1/3Ni1/3
Co1/3O2 has typical Raman spectra, which are demonstrated in Figure 6 (peak
assignment therein). The Raman peaks at 595 and 480 cm-1 are attributed to the active A1g and the Eg modes, respectively, and they correspond mainly to vibrations of oxygen atoms of LiMO2 compounds (27). As seen in this figure, the ageing of LiMn1/3
Ni1/3Co1/3
O2
113

13th Advanced Batteries, Accumulators and Fuel Cells Lithium-ions accumulators
nanoparticles, even at 60 C, does not seem to change their bulk response. It should be also noted that aged particles retain their structure as was confirmed by comparative XRD measurements (patterns are not shown).
Conclusions
Using the self-combustion reactions based on transition metal nitrates, Li nitrate and sucrose we produced layered Li[NiMn]O2, Li[NiMnCo]O2 and the layered-layered integrated xLi2MnO3
.(1-x)LiMn1/3Ni1/3Co1/3O2 materials (x=0.3; x=0.5; x=0.7) with adjustable particle size. Following by calcination in air, nano-, submicronic and micron size particles can be produced as a function of the temperature and duration of the final calcination process. LiNi1/2Mn1/2O2 can be considered as a high capacity cathode material (up to 200 mAh/g at C/10 rate), but slow in the Li-intercalation/deintercalation reactions. LiMn1/3Ni1/3Co1/3O2 can provide a lower capacity (up to 170 mAh/g), but it is a very fast electrode material, i.e., the capacity retention is more than 50% at 8C rate, while for LiNi1/2Mn1/2O2 a 50% decrease in capacity was already measured at 1C rate. The LiNi2/5Mn2/5Co1/5O2 electrodes demonstrate intermediate values between the above two materials in terms of both maximal capacity and rate capability. All of these materials develop a similar surface chemistry in EC-DMC/LiPF6 electrolyte solutions. When using FTIR and photoelectron spectroscopies we detected polycarbonates, Li or transition metal alkyl carbonates, and perhaps alkoxides and metal fluorides, as surface species. XPS also detected surface species containing phosphorous. It is interesting that the aged LiMn1/3Ni1/3Co1/3O2 nano-particles show, by XPS measurements, much higher Ni/M (M=Co, Mn) ratios close to the surface, compared to the bulk (pristine) ratios. This finding may reflect the pronounced reactivity of the oxygen bound to Ni, and thus its reactions with acidic or electrophilic solutions species leave the Ni ions in the surface species.
It was concluded from HR-TEM studies that nano-particles of xLi2MnO3.(1-
x)LiMn1/3Ni1/3Co1/3O2 are comprised of nano-domains of both rhombohedral LiNiO2-like and monoclinic Li2MnO3 structures, which are closely integrated and interconnected with one another at the atomic level. It was shown that reversible capacities around 220 mAh/g can be delivered by the 0.5Li2MnO3
.0.5LiMn1/3Ni1/3Co1/3O2 electrodes containing integrated materials annealed at 9000 C for 22 h (submicron particles). It was found that the electrode impedance associated with the resistance of the electrode's surface films remains almost constant after the electrochemical activation of the Li2MnO3 component and subsequent cycling, possibly due to the passivating effect of the MnO2 species which are formed during activation and incorporated into the electrode surface films (17).
References
[1] Lithium Batteries: Science and Ttechnology, G. Nazri and G. Pistoia (Eds.), Springer, 2004, 708p.
[2] M.G.S.R. Thomas, W.I.F. David, J.B. Goodenough, P. Groves, Mater. Res. Bull., 20, 1137 (1985).
[3] G. Amatucci, A. Dupasquier, A. Blyr, T. Zheng, J.-M. Tarascon, Electrochim. Acta, 45, 255 (1999).
[4] D.P. Abraham, E.M. Reynolds, E. Samman, A.N. Jansen, D.W. Dees, Electrochim. Acta, 51, 502 (2005).
114

13th Advanced Batteries, Accumulators and Fuel Cells Lithium-ions accumulators
[5] Y. Wang, J. Jiang, J.R. Dahn, Electrochem. Commun., 9, 2534 (2007). [6] Y. Makimura, T. Ohzuku, J. Power Sources, 119-121, 156 (2003). [7] W.-S. Yoon, M. Balasubramanian, X.Q. Yang, Z. Fu, D.A. Fisher, J. McBreen, J.
Electrochem. Soc., 151, A246 (2004). [8] J. D. Aurbach, Y. Talyosef, B. Markovsky, D. Kovacheva, Electrochem. Solid-State
Lett., 9, A449 (2006). [9] K. Kang, Y.S. Meng, J. Breger, C.P. Grey, G. Ceder, Science, 311, 977 (2006). [10] L. Zhang, H. Noguchi, and M. Yoshio, J. Power Sources, 110, 57 (2002). [11] H. Kobayashi, H. Sakaebe, H. Kageyama, K. Tatsumi, Y. Arachi, T. Kamiyama, J.
Mater. Chem., 13, 590 (2003). [12] D.-C. Li, T. Muta, L.-Q. Zhang, M. Yoshio, and H. Noguchi, J. Power Sources, 132,
150 (2004). [13] B.J. Hwang, Y.W. Tsai, D. Carlier, and G. Ceder, Chem. Mater., 15, 3676 (2003). [14] C. Julien, M.A. Camacho-Lopez, T. Mohan, S. Chitra, P. Kalyani, S. Gopukumar,
Solid State Ionics, 135, 241 (2000). [15] T.H. Cho, S.M. Park, M. Yoshio, T. Hirai, Y. Hideshima, J. Power Sources, 142, 306
(2005). [16] D. Li, Z. Peng, H. Ren, W. Guo, Y. Zhou, Materials Chemistry and Physics, 107, 171
(2008). [17] J.-S. Kim, C.S. Johnson, J.T. Vaughey, M.M. Thackeray, Chem. Mater., 16, 1996
(2004). [18] M.M. Thackeray, C.S. Johnson, J.T. Vaughey, N. Li, S.A. Hackney, J. Mater. Chem.,
15, 2257 (2005). [19] M.M. Thackeray, S.-H. Kang, C.S. Johnson, J.T. Vaughey, R. Benedek and S.A.
Hackney, J. Mater. Chem., 15, 3112 (2007). [20] C. Delmas, M. Maccario, L. Croguennec, F. Le Cras, and F. Weill, Nature Materials,
7, 665 (2008). [21] Y. Talyosef, B. Markovsky, R. Lavi, D. Kovacheva, G. Salitra, M. Gorova, E.
Zhecheva, R. Stoyanova, and D. Aurbach, J. Electrochem. Soc., 154, A682 (2007). [22] D.Aurbach, K. Gamolsky, B. Markovsky, G. Salitra and Y. Gofer. J. Electrochem.
Soc., 147, 1322 (2000). [23] H. Sclar, D. Kovacheva, E. Zhecheva, R. Stoyanova, R. Lavi, G. Kimmel, J. Grinblat,
O. Girshevitz, F. Amalraj, O. Haik, E. Zinigrad, B. Markovsky, D. Aurbach, J. Electrochem. Soc., 156, A938 (2009).
[24] S.K. Martha, H. Sclar, Z. Szmuk Framowitz, D. Kovacheva, N. Saliyski, Y. Gofer, P. Sharon, E. Golik, B. Markovsky, D. Aurbach, J. Power Sources, 189, 248 (2009).
[25] Y. Makimura, T. Ohzuku, J. Power Sources, 119-121, 156 (2003). [26] Francis Amalraj, D. Kovacheva, M. Talianker, L.Zeiri, J. Grinblat, N. Leifer, G.
Goobes, B. Markovsky, D. Aurbach, J. Electrochem. Soc., 157, A1121 (2010). [27] E. Markevich, G. Salitra, D. Aurbach, Electrochem. Comm., 7 , 1298 (2005). [28] A. Abdel-Ghany, K. Zaghib, C.M. Julien in: Portable and Emergency Energy Sources,
Stoynov and D. Vladikova (Eds.), pp. 1 – 33, Prof. Marin Drinov Publishing House, Sofia, 2006.
115

13th Advanced Batteries, Accumulators and Fuel Cells Lithium-ions accumulators
SYNTHESIS AND ELECTROCHEMICAL LITHIUM INSERTION INTO SKUTTERUDITE-TYPE CoSb3
Półrolniczaka*, P., Walkowiaka, M., Martyłaa, A., Wronab, A., Kopczyka, M.
aInstitute of Non-Ferrous Metals, Branch in Poznan, Central Laboratory of Batteries and Cells, Forteczna 12, 61-362 Poznan, Poland
bInstitute of Non-Ferrous Metals, Sowinskiego 5, 44-100 Gliwice, Poland Corresponding author: Paulina Półrolniczak ([email protected])
Abstract
Skutterudite-type CoSb3 has been synthesized with the application of mechanochemical and wet chemical methods. Analysis of structural data reveals that unlike in the case of mechanochemical method, solvothermal and polyol synthetic routes lead to materials with admixture of phases other than CoSb3. On the other hand, wet chemical methods allow for obtaining nanometric grains. The materials have been electrochemically tested as possible anode materials for Li-ion cells, demonstrating in some cases capacities exceeding those known for graphitic materials, although at the same time suffering from very poor cyclic stability. Impact of phase composition as well as charge/discharge regime on the electrochemical parameters has been discussed.
Introduction
Lithium-ion batteries are a group of chemical power sources, which have attracted the worldwide attention after the first commercialization by Sony in the early 90’s. When compared with other rechargeable batteries such as lead-acid, nickel cadmium and nickel metal hydride, lithium ion batteries have noticeable advantages of high cell voltage, high energy density, no memory effect and low self-discharge rate. Currently, they are the most common power sources for portable electronic devices such as laptops, cell phones, cameras, etc. It is believed that this type of battery will soon be applied to power electric vehicles and medical equipment. Lithium ion batteries are today produced billions of units per year and they account for almost 80% of the worldwide battery sale [1-3]. Rapid progress in portable electronic devices demands increasing performance in battery energy density and cycle life. These parameters strongly depend on the selection of the anode materials [4, 5]. Commercially used graphite anodes have good electrochemical properties but their capacity is insufficient to satisfy the market requirements. Numerous insertion materials have been reported as electrode materials, for example lithium titanate, tin oxide or silicon [6]. The main drawback of non-graphite electrodes is the rapid capacity fade upon repeated cycling resulting from the large volume changes during the lithium insertion/deinsertion process. Nanostructuring of anode materials can be an effective strategy to alleviate the volume change effect due to the small particle size and large specific surface area [7].
116

13th Advanced Batteries, Accumulators and Fuel Cells Lithium-ions accumulators
Skutterudite-type CoSb3 is a promising thermoelectric material owing to high electrical conductivity and large Seebeck coefficient. Skutterudite is a cage type structure with large voids where different atoms can be inserted. It is also good candidate for anode material because of antimony which reversibly connect with lithium. CoSb3 compounds are usually synthesized using mechanical alloying, ball milling or hot pressing methods but these mechanical methods lead to obtain materials with large grain size. Wet chemical methods such as solvothermal or polyol have the advantage of obtaining nanostructured material with grain size below 50 nm. Chemical methods also don’t require the use of high temperatures and allow to achieve high reproducibility and large scale production. The disadvantage of chemical methods is difficulty with obtaining pure phase CoSb3 [8, 9].
The aim of presented study was the synthesis and physicochemical characterization of skutterudite type CoSb3. Synthesized materials were electrochemically tested in terms of reversible lithium cations insertion.
Experimental
Skutterudite CoSb3 was prepared by three different synthesis methods according to literature, it was mechanical hot pressing, solvothermal synthesis using stainless steel high pressure reactor [8] and polyol method in tetraethylene glycol [10]. Analytically pure CoCl2 ∙ 6H2O and SbCl3 were used as metal precursors and NaBH4 was the reducing agent.
In the beginning of the reaction process the strong reducing agent rapidly and completely reduces cobalt and antimony cations to metallic elements and after thermal activation they react with each other to form CoSb2, which further reacts with antimony atoms to finally form CoSb3 phase [11].
The phase structure of the obtained powders were investigated by X-ray diffraction (XRD) using Philips PW 1130/90 diffractometer.
The texture and morphology of the CoSb3 material was observed by scanning and transmission electron microscopy on Zeiss EVO 40 (SEM) and JOEL JEM 1200 EX (TEM) instruments.
The electrodes for the electrochemical tests have been prepared by casting the slurry with active material onto the copper current collectors. The slurry consists of 75 wt.% CoSb3 powder, 15 wt.% carbon nanotubes as conducting agent and 10 wt.% PVdF (polyvinylidene fluoride) as binder. The electrodes have been tested in Swagelok-type cells with metallic lithium as counter and reference electrode and a conventional lithium-conducting electrolyte.
The cells were galvanostatically charged/discharged at a current density 10 mA g-1 between 0 – 2 V versus Li+/Li. Typically five complete galvanostatic cycles were performed. Potentiodynamic tests were performed with a scanning rate 0.05 mV s-1 between 0 and 2 V. All electrochemical measurements were carried out using VMP3 Bio Logic instrument.
Results and discussion
Fig. 1 shows XRD patterns of powders prepared by polyol synthesis route at different reaction temperatures. Our experiments confirm that temperature and duration of the
117

13th Advanced Batteries, Accumulators and Fuel Cells Lithium-ions accumulators
reaction are key parameters determining the phase composition of the final product. At 180°C only antimony oxide phase was obtained. When the reaction temperature was increased to 200°C peaks from CoSb2 phase were the most intensive and after elevating temperature to 240°C skutterudite CoSb3 phase became the dominant phase. Fig. 2 presents XRD patterns of powders obtained by polyol method at 240°C in different reaction time. After 15 minutes of reaction peaks from CoSb3 and metallic antimony are slightly visible. Prolonging time to 1 hour results in obtaining material with dominant CoSb3 skutterudite phase.
Fig. 3 presents the XRD patterns of materials prepared by solvothermal synthesis route at different reaction time and temperature. For sample synthesized at 240°C for 72 h antimony is the dominating phase and the triantimonide CoSb3 can hardly be found in the XRD pattern. When two step heating was applied with first temperature 190°C for 24 h followed by 240°C for 48 h the peaks of CoSb3 can be visible. Prolonging the second step reaction to 96 h increases intensity of the skutterudite phase peaks.
Autoclave filling percentage is also parameter determining phase composition. Our results reveal that 70% filling of the high pressure reactor give the most intensive peaks of the skutterudite phase.
Fig. 1: XRD patterns of samples prepared by polyol method at different reaction temperature.
10 20 30 40 50 60 70 80
In
ten
sit
y [
a.u
.]
2 Theta [deg]
° Sb2O3
* CoSb3
◊ CoSb2
• Sb
180°C 1 h
200°C 1 h * **
*
*
***
*
◊◊
°
°°°
240°C 1 h•
**•◊
118

13th Advanced Batteries, Accumulators and Fuel Cells Lithium-ions accumulators
Fig. 2: XRD patterns of samples prepared by polyol method in different reaction duration.
Fig. 3: XRD patterns of solvothermally synthesized CoSb3 powders at different time and temperature.
The pure phase skutterudite CoSb3 was not obtained by wet chemical methods, it was only possible using hot pressing mechanical synthesis method. Table 1 presents results of Rietveld refinement phase analysis.
10 20 30 40 50 60 70 80
In
ten
sit
y [
a.u
.]
2 Theta [deg]
* CoSb3
◊ CoSb2
• Sb
240°C 15 min.
240°C 30 min.
*
** *
*
**
**
◊
240°C 60 min. •
* *•◊
•
•*
10 20 30 40 50 60 70 80
In
ten
sit
y [
a.u
.]
2 Theta [deg]
* CoSb3
◊ CoSb2
• Sb
* *
•
* * *•••240°C 72 h
190°C 24 h + 240°C 48 h
190°C 24 h + 240°C 96 h
•
•
*
*
** *
*
** ****
** * * *•
•
•
•
◊◊
◊
119

13th Advanced Batteries, Accumulators and Fuel Cells Lithium-ions accumulators
Table 1: Rietveld refinement phase analysis of samples prepared by different synthesis routes.
Phase Hot pressed Solvothermal Polyol
CoSb3 100 56.2±0.38 49.6±0.56
CoSb2 - 18.6±0.39 19.0±0.59
Sb - 25.2±0.36 17.8±0.58
Sb2O3 - - 13.6±0.39
Scanning and transmission electron microscopy images of synthesized products show that CoSb3 particles are composed of small, irregular granules with particle size about 20 nm which are connected to each other and form a network structure. Some particles form bigger aggregates, as can be seen especially in material obtained by hot pressing method (Fig. 4).
SEM - hot pressed CoSb3 SEM – solvothermal CoSb3
TEM - hot pressed CoSb3 TEM – solvothermal CoSb3
Fig. 4: SEM and TEM images of synthesized skutterudites.
Synthesized materials were tested towards reversible electrochemical lithium cations insertion.
120

13th Advanced Batteries, Accumulators and Fuel Cells Lithium-ions accumulators
We examined the influence of the solvothermal CoSb3 end-of-charge potential (EOCP) on its basic electrochemical parameters. Fig. 5 shows galvanostatic charge/discharge curves in the first cycles at variable EOCP. Fig. 6 presents the potentiodynamic characteristics in the first three cycles at different EOCP and Table 1 collects basic electrochemical parameters determined on the basis of galvanostatic experiments. From the collected data it is evident that cutting the EOCP results in drastic reduction of discharge (reversible) capacity, which is quite obvious. Less obvious is the finding that together with cutting the EOCP the efficiency of charging is very significantly improved and reaches maximum for EOCP=0.4 V (83%). This suggests that by stopping the first charging earlier one gets rid of large portion of useless irreversible capacity. These lost fractions of irreversible capacities can clearly be seen on potentiodynamic curves. On the CV curves we can also see that the charging process in the first cycle is quite complex and involves probably several different reactions. The charging process changes significantly at the second and third cycle, which suggests that material undergoes some kind of structural transformations after the first charging cycle.
Fig. 5: Galvanostatic charge/discharge characteristics at variable EOCP for solvothermal CoSb3.
Table 2: Electrochemical parameters of solvothermal CoSb3 at various end-of-charge potentials.
0.0
0.5
1.0
1.5
2.0
2.5
0 500 1000 1500
E /
V
Q / mAh g-1
0.6 - 2 V 0 - 2 V
0.5 - 2 V
0.4 - 2 V
End of
charge
potential
[V]
Q1ch
[mAh
g-1
]
Q1disch
[mAh
g-1
]
Qirr
[mAh
g-1
]
Eff1
[%]
0.0 1097 604 493 55
0.4 480 399 81 83
0.5 429 287 142 67
0.6 330 203 127 61
121

13th Advanced Batteries, Accumulators and Fuel Cells Lithium-ions accumulators
Fig. 6: Comparison of potentiodynamic characteristics recorded at different EOCP for solvothermal CoSb3.
Cycling stability is a severe problem in CoSb3 type materials. The capacity in the 15th cycle is only 30% of that observed in the first cycle. Rapid capacity fade upon cycling is mainly due to large volume changes to which the active materials are exposed as lithium cations are repeatedly inserted and deinserted into and from their crystal lattices.
Scanning electron microscopy images of the electrode before and after lithium insertion process show how the material morphology has changed. Before electrode reaction we can see nanostructured CoSb3 with carbon nanotubes as conducting agent. After the reaction the material obviously changes its original morphology (Fig. 7).
before GC after GC
Fig. 7 SEM images of CoSB3 electrode before and after galvanostatic cycling.
122

13th Advanced Batteries, Accumulators and Fuel Cells Lithium-ions accumulators
Fig. 8 shows comparison of galvanostatic characteristic for CoSb3 materials synthesized using three different synthesis methods. For solvothermal and polyol CoSb3 two plateaus during the first charge can be observed. Taking into account that it’s not pure phase CoSb3, first plateau may be ascribed to the reaction of lithium with metallic antimony (reaction 1) and the second plateau may be due to the process of decomposition of CoSb3 and subsequent formation of lithium antimonide (reaction 2). In the second cycle only one plateau is observed at about 0.8 V and this is value at which pure antimony alloys with lithium (reaction 1). It is believed that only antimony provides the anode capacity, while cobalt acts as an electronic conducting matrix. Furthermore, cobalt matrix prevents antimony from congregating and can buffer some volume changes during cycling. In the case of hot pressed CoSb3 which is pure phase CoSb3, we observe only one charge plateau in the first cycle at about 0.4 V which is due to CoSb3 decomposition process and in the second and other cycles the charge plateau is positioned at 0.8 V as in the case in other materials. This is the reaction of antimony with lithium. Our experiments are in accordance to some other reports [12].
Fig. 8: Galvanostatic charge/discharge characteristics (0.4 – 1.5 V) for CoSb3 synthesized using three different synthesis methods.
Conclusions
Skutterudite CoSb3 was synthesized by polyol, solvothermal and mechanical synthesis methods and evaluated in terms of reversible electrochemical insertion of lithium.
Materials synthesized by wet chemical methods contain certain amount of other phases (Sb, CoSb2). Their relative content is sensitive to synthesis conditions.
The materials are capable of storing significant amount of lithium, mostly at ca. 1 V vs. Li/Li+ , and can be promising as anode material. Cycling stability can be a major problem
123

13th Advanced Batteries, Accumulators and Fuel Cells Lithium-ions accumulators
to solve. Reversible capacity and charging efficiency strongly depends on the end-of charge-potential.
Our results, in accordance to some other reports, suggest that the material undergoes a dramatic structural transformation after the first insertion cycle. Further electrochemical process involve alloying-type reaction of lithium with antimony.
Acknowledgments
The work has been financially supported by the European Regional Development Fund in the frameworks of the Innovative Economy Programme 2007-2013, project No. POIG.01.03.01-00-086/09.
References
[1] Arico, A. S., Bruce, P., Scrosati, B., Tarascon, J. M. and Van Schalkwijk, W., Nature Mater, 4 (2005) 366
[2] Bruce, P. G., Scrosati, B. and Tarascon, J. M., Angew. Chem. Int. Ed., 47 (2008) 2930
[3] Tarascon, J. M. and Armand, M., Nature, 414 (2001) 359 [4] Scrosati, B. and Garche, J., J. Power Sources, 195 (2010) 2419 [5] Zhang, W.-J., J. Power Sources, 196 (2011) 13 [6] Shukla, A. K., Kumar, T. P., Current Sci., 94 (2008) 314 [7] Li, H., Wang, Z., Chen, L., Huang, X., Adv. Mater., 21 (2009) 4593 [8] Xie, J., Zhao, X. B., Cao, G. S., Zhao, M. J., Su, S. F., J. Power Sources, 140 (2005)
350 [9] Kumari, L., Li W., Huang, J. Y., Provencio P. P., Nanoscale Res. Lett., 5 (2010) 1698 [10] Yang, L., Hang, H.H., Cheng, H., Sun, T., Ma, J., Matt. Lett., 62 (2008) 2483
[11] Mi, J. L., Zhu, T. J., Zhao, X. B., Ma, J., J. Appl. Phys., 101 (2007) 054314
[12] Xie, J., Xinbing, Z., Cao, G., Zhong, Y., Zhao, M., J. Mater. Sci. Lett., 22 (2003) 221
124

13th Advanced Batteries, Accumulators and Fuel Cells Lithium-ions accumulators
SAFETY OF LITHIUM BATTERIES
Sedlaříková1, M., Vondrák1, J., Dvořák2, O., Buřičová2,H., Libich1, J.
1Department of Electrical and Electronic Technology, Brno University of Technology, Faculty of Electrical Engineering and Communication, Technická 3058/10 616 00 Brno,
Czech Republic. 2Technical Institute of Fire Protection, Ministry of the interior of the Czech republic,
Písková 42 143 00 Praha 4 – Modřany, Czech Republic.
Abstract
Charge managing device is important for safety of lithium batteries. It means an electronic monitoring of each cell in the battery from viewpoints of overcharging, overload, overdischarging and occasional increase of temperature inside any cell. Another approach is based on the selection of functional materials, which can maintain the capacity of the cells and ensure higher fire resistance of them. Lithium cell contains positive electrode, negative electrode and electrolyte. Improvement of LiCoO2 stability by doping with potassium ions and modification of spinel – like LiFePO4 were tested as materials for anodes, while electrodeposition od silicon was verified for production anode materials with enhanced safety and capacity. Both the solvents and polymers were investigated as components of electrolyte. High thermal stability of sulfolane seems to be useful. Some aspects of treating and possible recycling of used batteries are discussed.
Risk of lithium batteries
Lithium batteries accumulate amount of energy close to several hundreds of kWh per 1 kg. Any occasional discharge can have disastrous consequences. Two main sources of heat must be kept in mind:
Regular, originating in the discharge of a cell
Irregular, coming from further unwonted reactions such as burning
The risky energy evolution can cause fire or even an explosion of the cell, the extinguishing of which can be difficult or impossible. Safety issue is described in standard No. IEC – EN 600686-4. The protection against the first group is based mostly on the prevention. This is based on battery management units, the aim of which is controlling the depth of charging and discharging and monitoring the values. In a large battery, a series of cells must be used and monitored; they should be disconnected from the system in important values have passed over critical limits. This can be seen in rather small cells such as those used in “cellular phones”. An example of the circuitry is shown in the figure 1.
125

13th Advanced Batteries, Accumulators and Fuel Cells Lithium-ions accumulators
Fig. 1: Conventional type of Li-ion battery with safety circuit.
Irregular generation of heat
Irregular bursts of heat can originate from components not involved in the basic electrochemical process of a battery. We have to keep in mind following:
Anode materiel is either graphite, petroleum coke or any kind of carbonaceous material. Therefore, it is always combustible and the heat of combustion exceeds the reversible heat of the cell.
Cathode material is a transition metal oxide and even in fully discharged state, still possesses some energy able to oxidize flammable materials.
Electrolyte is a solution of lithium salt in organic aprotic electrolyte. It must be considered to be a flammable material.
In gel polymer batteries, the electrolyte contains considerable amount of macromolecular substance, which should be subject of burning as well.
The composition of lithium ion and lithium polymer battery resembles somehow a black gun powder mixed from charcoal, sulfur and potassium nitrate. It is known generally that its main property is to burn even in the absence of oxygen and this process may be very fast.
The means used for fire prevention or protection can be divided in few groups:
1. Selection of components used in the electrolyte with lower ease of incineration, higher flash point and which leave an inert unburnable ashes slowing the rate of burning
2. The use of anode materials with slower or lower reduction activity 3. Cooling of the system - not quite practical for a 10 kW battery 4. Addition of fire retardants such as triphenyl phosphates, phosphazines or
similar substances will slow the process of fire initiation and propagation
126

13th Advanced Batteries, Accumulators and Fuel Cells Lithium-ions accumulators
5. Developing of automated fire extinguishers flooding the battery case and quenching occidental incineration
6. Verification of substances suitable for extinguishing fire or preventing an incineration as a whole
Methods
We select solvents and gel polymers and test their properties. For solvents, we concentrated our interest on sulfolane. As for polymers, we tested methacrylate polymers, their networking binders and metal-silicon monomers with the aim of lower the flammability.
Solvents
First, we measure the flash point either of pure solvents or of their mixtures.
Sulfolane seems to be a good candidate. It increases the flash point of other solvents considerably as it is shown on following figure 2 and figure 3 below.
Fig. 2: Flash point of sulfolane mictures with other solvents. Curve 1 represents the propylene carbonate + sulfolane mixture, curve 2 – propylene carbonate + sulfolane, curve 3 – dimethylsulfoxide + sulfolane and curve 4 –dimethyl carbonate + sulfolane.
As a benefit from the use of mixed solvents we can suppress the freezing point fairly below 0oC. From these measurements, we have estimated the cryoscopic constant to an unordinary value close to 86 K/Mole.
127

13th Advanced Batteries, Accumulators and Fuel Cells Lithium-ions accumulators
Fig. 3: Melting point dependance on sulfolane concentration in dimethyl carbonate.
Experimental cells were assembled from lithium perchlorate dissolved in sulfolane as electrolyte, and a pair of graphite and LiCoO2 for electrodes.
An example of two subsequent galvanostatic cycles of charge / discharge is described in following figure 4.
Fig. 4: The first two charge – discharge cycles of lithium-ion positive electrode, material LiCoO2.
Current 0.6 mA and mass of negative electrode 3.5mg were used.
Electrodeposited highly porous silicon was suggested for the negative electrodes; only informative preliminary results are available yet.
128

13th Advanced Batteries, Accumulators and Fuel Cells Lithium-ions accumulators
Properties of polymeric gel systems
Gel polymers are prepared from a blend of a lithium solution in aprotic solvent and suitable monomer.
Gel polymer electrolytes
Methylmethacrylate MMA, ethoxymethylmethacrylate EOMA and trimethoxy-3-propylmethacrylate TSMPMA were used together with ethylendimethacrylate EDMA as a networking agent. These monomers were mixed with lithium salt dissolved in propylene carbonate (PC), sulfolane and their blends. Finally, benzoin ethyl ether BEE was added and the polymerization was performed by UV illumination.
The easiest way to study the properties of gels at elevated temperatures is the differential thermal analysis DTA/GTA, DTA/STA or other modifications of this method.
Essentially the test is based on observation changes if the sample is heated by linearly increasing temperature. We can detect heat flow from and back of the sample (DTA), mass changes (GTA) or gases which are formed by the heat.
The decomposition of one sample is shown in a figure 5 (a fascimille of the instrument output):
Fig. 5: Thermogravimetry and Simultaneous Thermal Analysis of gel specimen. Green curve: loss of mass, blue curve: derivative of the former. Left peak is supposed to be evaporation of solvent, the other two : two stages of decomposition of the polymeric network
Three processes are indicated there. First from left should be evaporation of residual solvent, followed by depolymerization and burning of the residual substances. Apparently, the burning is not 100% and some not burnt solid substance remained even at highest temperature used.
129

13th Advanced Batteries, Accumulators and Fuel Cells Lithium-ions accumulators
Fig. 6: Composition of gaseous products of gel decomposition by linearly increasing temperature in a DTA device. Right axis: time proportional to temperature, left axis: wavenumber of IR absorption of products. Flat peak No. 1 ascribed to evaporation of solvent. Other peak correspond to products of polymer thermal decomposition. They correspond mostly to compounds containing group C=O generated by decomposition of polymer.
Figure 6 shows the results of a DTA analysis associated with the analysis of the decomposition products by IR spectroscopy. We can follow easily the initial evaporation of solvent (peak No.1), which is endothermic on contrary to the others which are exothermic.
Another example shows the influence of surrounding gas on decomposition of the gel:
Fig. 7: Thermal analysis of a gel containing TMSPMA + LiClO4 in nitrogen. Red curve: loss of mass, blue curve L evolution of head.
130

13th Advanced Batteries, Accumulators and Fuel Cells Lithium-ions accumulators
Fig. 8: Thermal analysis of a gel containing TMSPMA + LiClO4 in air Meaning of colors the same.
In Figures. 7 and 8, the difference between gel decomposition in nitrogen and in is shown. First, the endothermic process is assigned to evaporation of solvent. As we see, there is no considerable heat emission over 400 oC in nitrogen. Contrary to it, at 460 oC in air an abrupt loss of mass appears if heated in air. It is connected with an outburst of heat at the same temperature. No explosion appeared in nitrogen atmosphere. Apparently, the reaction of perchlorate wit organic substances proceed rather slowly, but in can initiate an avalanche like explosive reaction with the components of gel with oxygen.Apparently, the abrupt decomposition has an appearance of an explosion (see Figure 9).
Fig. 9: Explosion of a LiClO4containing gel in air at 450oC.
For comparison, lithium fluoroborate did never show any explosive decomposition like the perchlorates did.
131

13th Advanced Batteries, Accumulators and Fuel Cells Lithium-ions accumulators
Conclusion
Perchlorates and other salts having properties of oxidant should be avoided.
The first slowly reactions in the gels at elevated temperature can transform into an explosion if air is present.
The cathode should possess high apparent surface area so that there is no possibility of decomposition of lithium in the form of metallic whiskers or other nanoform.
The polymeric backbone as well as organic solvent should be selected from the viewpoint of a compromise between flash point, good conductivity and low temperature mechanic properties.
The ratio between polymeric backbone and organic solvent must be balanced carefully to obtain a good conductivity and free volume of solvent between the macromolecular chains. Outline on figure 10 shown the coexistence of polymer and solvent.
Fig. 10: The movement of ions in liquid part of the gel. We suppose that the ions “flow” in the free fraction of the liquid electrolyte without any hindrances by the polymeric chains.
Selection of substances suitable to extinguish fire in lithium batteries must be investigated thoroughly. For example, the usage of solid sodium carbonate or dihydrogenphospate must be checked. Also it is not clear yet if the lithiated graphite can be dangerous in contact with water.
Appendix
To our best opinion, not enough interest is paid to the problem of waste batteries and possibility to recycle them. If a battery with nominal capacity 500 Wh (in one single cell) is discharged, still as much as 10 Wh remains if the battery had been discharged just to 2_ of nominal charge. Such a residual chain may cause unpleasant effect, for example, if short-circuited occasionally during disassembling. Also the effect of recycling them would be not much profitable. Cells as show do not contain more than 10% of copper and about the same amount of transition metal oxides. Therefore, the question of economic disassembling and recycling always would arise.
132

13th Advanced Batteries, Accumulators and Fuel Cells Lithium-ions accumulators
Acknowledgement
This work was supported by Grant Agency of Czech Republic, Project P102/10/2091 (Increase the safety of lithium-ion batteries) and specific research FEKT-S-11-7 (Materials and technologies for electronics).
References
[1] J.Máca, M. Sedlariková, J. Vondrák, K Bartusek, Physical Properties of Sulfolane – Dimethyl carbonate Mixture for Using in Electrolytes for Lithium-Ion Batteries. ECS Transactions 2012, Volume 40, Issue 1, Pages 53-57.
[2] Marcus, Y. The properties of solvents. John Wiley & Sons Ltd, p. 399 (1998). [3] J. Barek, F. Opekar, K Štulik, Electroanalytical chemistry. Karolinum, p.188 (2005) [4] A. Abouimrane, I. Belharouak, K. Amine, Sulfone-based electrolytes for high-voltage
Li-ion batteries. Electrochemistry Communications, Volume 11, Issue 5, May 2009, Pages 1073-1076
[5] J. Máca, M. Sedlaříková, J. Vondrák, K. Bartušek, Phase Diagram For Mixtures Of Sulfolane - Dimethylcarbonate For Using In Electrolytes For Lithium - Ion Batteries. In Advanced Batteries Accumulators and Fuel Cells 12th ABAF Proceeding of the ABAF- 12 Meeting. 1. Brno: Brno University of Technology, p. 65-68. ISBN: 978-80-214-4357- 0 (2011).
[6] R. Yazami, New chemical reduction of transition metal chloride-GICs with n-butyllithium, Synthetic Metals, Volume 20, Issue 3, July 1987, Pages 383-386.
[7] Martin B. Dines, Lithium intercalation via n-Butyllithium of the layered transition metal dichalcogenides, Materials Research Bulletin, Volume 10, Issue 4, April 1975, Pages 287-291.
[8] B. Pecquenard, D. Gourier, N. Baffier, EPR identification of LixV2O5 phases generated by chemical and electrochemical lithium intercalation in V2O5, Solid State Ionics, Volume 78, Issues 3–4, June 1995, Pages 287-303.
[9] Christina Lampe-Önnerud, Per Nordblad, John O. Thomas, Chemical intercalation of lithium into a V6O13 host, Solid State Ionics, Volume 81, Issues 3–4, 1 November 1995, Pages 189-199.
133

13th Advanced Batteries, Accumulators and Fuel Cells Lithium-ions accumulators
BROOKITE TIO2 NANORODS FOR LITHIUM-ION ANODES
Cech1, O., Kovar2, P., Sedlarikova1, M., Vondrak1, J.
1Faculty of Electrical Engineering and Communication, Department of Electrical and Electronic Technology, Brno University of Technology, Czech Republic
2CTC AP a.s., Nabrezi Dr. E. Benese 24, 751 62 Prerov, Czech Republic
Abstract
This work deals with TiO2 based anode material for lithium-ion secondary batteries. The aims of this study is to synthetize and characterize TiO2 - nanorod based active anode material using up scalable process with just slightly modified synthesis method commonly used for production of this type material. Low temperature treatment of raw samples was made and structural and electrochemical properties in correlation with treatment temperature were investigated. Using of these substances as promising li-ion anode materials was successfully tested by charge-discharge cycling and structural characterization by XRD and SEM was made.
Introduction
Lithium ion batteries are very interesting energy storage systems characterized by very high energy and power density in comparison with other batteries. Modern lithium ion accumulation systems are considered very promising power tools for electric or hybrid vehicles with performance comparable to that of oil-fuelled cars. Particular attention is presently devoted to the increase of the safety level of the battery in order to make it really suitable to be used in the electric vehicles. This important task can be reached by modifying the electrode and the electrolyte components[1]. The present configuration lithium ion battery involves a graphite anode, a lithium cobalt oxide cathode, and a liquid organic-solution electrolyte.
Especially stable and high-capacity anode material for li-ion battery anode is still a big challenge in the world of electromobility and high power applications and it is a “bottle neck” in the way to high charge rate lithium-ion batteries. Nowadays, the most often anode material used in lithium-ion cells is graphite. These electrodes are characterized by a very low working voltage vs. lithium, which is out of the electrochemical stability windows of the organic electrolyte. Graphite also suffers from number of other problems, i.e. possibility of lithium plating during charge and hence significant safety issues and SEI layer formation during the first charge cycle. As a result, many new anode materials were reported in literature, included layered structure, olivine and li-alloying conversion materials. Titanium oxide based materials in its various polymorphs, i.e. rutile, anatase and brookite attracted large attention of many researchers. Also spinel Li4Ti5O12 is widely discussed and well characterized anode active material.
134

13th Advanced Batteries, Accumulators and Fuel Cells Lithium-ions accumulators
Experimental
In all samples, anatase form of TiO2 was used as a precursor. Mixture of TiO2 and 15M NaOH aqueous solution was made and after stirring moved in a Teflon-lined autoclave where the suspension was heated to 170°C for 6h. The product was acid-washed and neutralized by 0.05M HCl, washed with distilled water and dried. Final material was obtained by heating the nanowired titanate precursor for 4h in air at 300°C, 400°C and 500°C respectively.
Electrochemical characterization was made on slurry-casted electrodes coated on copper foil. The slurry was prepared by mixing PVDF, Super P and obtained TiO2 in w/w ratio 10:10:80 together with the NMP used as a solvent. Electrochemical measurements were made in the coin-type two electrode El-Cell® electrode system with lithium foil used as counter electrode and 1M LiPF6 in ethylene carbonate:dimethyl carbonate 1:1 as an electrolyte. All cells were assembled in Ar filled glovebox made by MBraun, Germany with O2 and H2O content less than 0.1 ppm. Powder X-Ray diffraction was performed on PANanalytical Xpert PRO goniometric difractometer with Cu Kα1 radiation.
Results and discussion
SEM pictures shown at Fig. 1.indicates nanostructured rods and short wires with quite wide diameter distribution varying from 10 nm to 200 nm which can extend up to several micrometers in length. The SEM pictures confirm high yield of nanowires within micro structured conglomerates.
Fig. 1: SEM images of nanostructured TiO2 anode material at different magnifffication.
135

13th Advanced Batteries, Accumulators and Fuel Cells Lithium-ions accumulators
A powder XRD diffraction patterns for materials obtained by different treatment temperatures are shown on Fig. 2. It is possible to see that we gathered poorly crystalline material at the lowest treatment temperature and that the 300°C is not enough for formation of crystalline phase. The structural measurement of materials treated at 400°C and 500°C shows that they are almost identical. It is a mixture of anatase and brookite phase with obvious peak broadening probably due to low crystallinity or very small particles.
Fig. 2: Powder XRD patterns of TiO2 material treated at different temperatures
First charge-discharge cycle performed by low rate of 0.1C is shown at Fig. 3. The sample treated by temperature 400°C shows better voltage stability and has short plateau at 1.8 volts during discharge. Sample treated with 300°C has no stable precise reaction potential of lithium intercalation and no flat plateau is visible but whole discharge proscess occures between 1.8 and 1.3 volts. Both samples exhibit no first cycle irreversible capacity associated with SEI layer formation known from graphite anodes.
Fig. 4. shows associated charge and discharge characteristics taken also from the first cycle. Despite of lower crystalinity of the sample treated by 300°C it reported slightly higher discharge capacity in first cycle than the one treated by 400°C and also has better coulombic efficiency.
Fig. 3: (left) First charge-discharge cycle Fig. 4: (right) Charge-discharge characteristics from first cycle
136

13th Advanced Batteries, Accumulators and Fuel Cells Lithium-ions accumulators
The sample treated by 300°C exhibits discharge capacity 250 mAh·g-1and sample treated by 400°C shows capacity 220 mAh·g-1 which are very promissing results in comparison for example with capacity of often used and conventional Li4Ti5O12 ( 170 mAh·g-1 theoretical capacity).
Discharge rate capability as a plot of variation of the active material capacity during discharge on a discharge rate changes is shown on Fig. 5. Starting from the discharge rate equal to 5C the materials have almost equal behavior. The capacity fading between 0.1 and 10C is rapid which can be probably caused by low intrinsic electronic conductivity of the material.
Fig. 5: Discharge rate capability of TiO2 anode materials treated by different temperature
Conclusion
Promising anode material consisting of TiO2 nanorods was prepared by a simple method easily scalable to a mass production process. Two variants of this material with different treatment temperature were prepared. Both material works well as an intercalation host for lithium ions with capacity of 220 mAh·g-1 and 250 mAh·g-1 respectively.
Acknowledgements
This work was supported by Czech Science Foundation, No. P102/10/, support of Center of Research and Utilization of Renewable Energy Sources CZ.1.05/2.1.00/01.0014 and grant FEKT-S-11-7.
References
[1] ARMSTRONG, A.R., ARMSTRONG, G., CANALES, J. AND BRUCE, P.G. TiO2–B nanowires as negative electrodes for rechargeable lithium batteries. Journal of Power Sources, 2005, vol. 146, no. 1-2, p. 501-506.
137

13th Advanced Batteries, Accumulators and Fuel Cells Lithium-ions accumulators
IMPACT OF FAST-CHARGERS FOR TRACTION BATTERIES ON DISTRIBUTION NETWORK
Červinka, D., Vorel, P.
Brno University of Technology, Faculty of Electrical Engineering and Communication, Department of Power Electrical and Electronic Engineering, Technicka 3058/10,
616 00 Brno, Czech Republic, www.uvee.feec.vutbr.cz.
Corresponding author: Dalibor Červinka ([email protected])
Abstract
High-power converters with high frequency pulse transformers are used in fast-chargers for electric vehicles to decrease their size and price. These converters and their input rectifiers have significant impact on distribution network. Distribution net impact can be split into 3 basic domains: EMC issues, unusually high local concentration of consumed power and presence of higher harmonics in input current. The third domain is the main objective of the article. An advantageous solution of input rectifier was proposed. A conception with a passive diode input rectifier and a DC-link with an extremely low capacity is used in this conception. Dimensioning of this DC-link capacitor to ensure mentioned low impact on distribution net is presented. The final part of the paper demonstrates overall applicability of RN14-140 fast-charger pattern via presentation of high harmonics of phase current measurements.
Introduction
The power rate of the fast-chargers for traction battery in electric vehicles is increased rapidly nowadays. High-power converters with high frequency pulse transformers are used in these devices to decrease their size and price. These converters and their input rectifiers have significant impact on distribution network. This factor must be taken into consideration in the case of mass stationing of electric vehicles.
Distribution net impact can be split into these several basic domains:
1) EMC issues, caused especially by high du/dt produced by fast switching power transistors used in converters. Problems are solved successfully by:
o passive input EMC low-pass filters, they are able to reduce emissions to net, their usage is necessary for every power-electronic equipment.
o Soft-switching, special technique to decrease power losses and EMC interference, its usage brings some technical difficulties.
o shielding techniques – simple steel cover of inverters can terminate radio-emissions to air.
138

13th Advanced Batteries, Accumulators and Fuel Cells Lithium-ions accumulators
2) Unusual and high local concentration of consumed power o Unpredictable power peaks are present in the distribution net when
the fast-chargers are connected. Their typical behavior is characterized by very high power for few minutes.
o Sufficient short-circuit power of distribution net in connection point has to correspond to consumed power.
These problems will be solved with a complex control of chargers using a global master structure called “Smart grids” technologies, where power of every charger will be centrally controlled in relation to actual state of distribution net.
3) Presence of higher harmonics in input current - If an ordinary passive input rectifier with a large DC-link capacitor is used then problems with power factor λ will appear due to the shape of the phase current caused by narrow pulses with high peak value and high RMS value. Voltage drop on internal impedance of network causes deformation of sinusoidal shape of net voltage. This is why active filters, generally known as the power factor correctors PFCs, are used for large power applications. This solution can be separated into two possibilities:
o Active rectifier with transistors – expensive solution o Passive rectifier with PFC – simple schematic, lower efficiency
These both variants are generally well-known, but their implementation for such high-power switched sources brings unpleasant increasing of system price and volume. Power circuitry is more complicated what decreases the efficiency of chargers. An input rectifier with a small DC-link capacitor represents a surprisingly simple solution what is introduced in this contribution.
Conception of the converter
There are Infineon CoolMOS transistors used in the converter. DC-link is split into two sections to enable using of MOS-FETs with lower breakdown voltage.
Fig. 1: Principle schematics of the charger power part
2
DCU
2
DCU
i2A
i2B ILB
ILA
139

13th Advanced Batteries, Accumulators and Fuel Cells Lithium-ions accumulators
Fig. 2: Input phase current
Main characteristic attribute of the proposed input rectifier topology is the so called “tracking effect”, where output voltage of inverter in every 1/6 of net period follows sinusoidal shape of input voltage. Hence DC link capacitor compensates only HF voltage ripple, 300Hz ripple from 6-pulse passive rectifier is still present. The measured shape of input phase current is in Fig. 2. This guarantees low impact on distribution net. Calculated power factor is about 0.96.
Dimensioning of this DC-link capacitor
DC-link capacitor has to be relatively small to ensure mentioned tracking effect.
Table 1: Input parameters for capacitor dimensioning
Peak value of DC-link voltage Um 560V
Main value of DC-link current ID 29A
Height of DC-link current pulses ICpeak 188A
Operating frequency of inverter f 100kHz
Maximum duty-cycle smax 0,45
Period of input net voltage T 0.02s
Maximum value of capacitance to ensure tracking effect:
FU
ITC
m
D
330560
2902.0max
[1]
Capacitance 13.2uF was chosen.
Voltage ripple at full duty-cycle and full DC-link current:
V
Cf
sIU
Cpeak31
102.1310100
45.09263
max
[2]
140

13th Advanced Batteries, Accumulators and Fuel Cells Lithium-ions accumulators
RMS value of capacitor current:
AssIdtti
TI Cpeakcondcondrms 5.3545.045.04.71
1 222 [3]
t
t
id
icond
Id
ICpeak
-Id
-Id
Fig. 3: Theoretical shape of DC link current (id) and capacitor current (icond)
28 pcs of polypropylene capacitors 470nF/630V by EPCOS was used. Capacitance is
13.2µF for one-half of DC-link, total capacitance is 6.6µF. Loss number tg of used capacitor is 0.015 at 100kHz.
Serial resistance of one capacitor is:
3
93
3
104910470101002
1015
2
fC
tgRs
[4]
Nominal power loses of one capacitor is Pztr=0.3W
Maximum RMS current of one capacitor is:
AR
PI
s
ztr
rms 5.21049
3.03
[5]
Total RMS current of capacitor battery is:
AI 705.228 [6]
141

13th Advanced Batteries, Accumulators and Fuel Cells Lithium-ions accumulators
Fast charger RN14-140
Fig. 4: First sample of developed fast-charger
Table 2: Main technical data of fast charger RN14-140
Output current 100A
Output voltage 140V
Nominal power 14kW
Input voltage 3x400V/50Hz
Frequency of PWM 100kHz
Mass 25kg
Dimensions 37x26x35cm
Measurements on RN14-140
Fig. 5: Connection of the charger to the vehicle Peugeot 106 electric
142

13th Advanced Batteries, Accumulators and Fuel Cells Lithium-ions accumulators
Fig. 6: Connection of input voltage and current sensor
Fig. 7: Data record of input voltages and currents
There was original NiCd accumulator in the electric car Peugeot. In first half of charging cycle the charger works at current limit. Various values of current visible in data record were caused by user manipulation. In second half the charger works at voltage limit due to high internal resistance of battery. The operating mode with maximal current will be much longer when LiFePO battery will be used. It significantly decreases the charging time.
143

13th Advanced Batteries, Accumulators and Fuel Cells Lithium-ions accumulators
Fig. 8: Data record of input power and power factor
Fig. 8 shows that the measurement of power factor corresponds to the calculated value 0.96.
Fig. 10: Harmonic analysis of input current
0
5
10
15
20
0 500 1000 1500 2000
Ih [%
]
f [Hz]
144

13th Advanced Batteries, Accumulators and Fuel Cells Lithium-ions accumulators
5th, 7th, 11th, 13th, 17th, 19th, 23th, 25th, 29th, 31th, 35th and 37th harmonic are present. All harmonics are under limits except of the 5th harmonic which is 13.5% of 1st harmonic. Czech electro-technic standard ČSN EN 61000-3-12 defines limits of 5th harmonic of the current for a 3-phase symmetrical load in relation to value of Rsce by Tab. 3:
Table 3: Maximum allowed values of the phase current 5th harmonic
Rsce 33 66 120 250 >350
I5/I1[%
]
10,7 14 19 31 40
where
equ
scsce
S
SR
[7]
Ssc is the short-circuit power of net and Sequ is the apparent power of connected equipment.
Conclusion
This paper demonstrates overall applicability of RN14-140 fast-charger pattern. The measured percentage value of the 5th harmonic has to be lower only if the charger should be connected to a net with Rsce value lower than 66. Otherwise the charger can be plugged-in to the net in the present state. The Rsce value of a standard household installation is about 100. This is why the charger can be mostly used without problems.
Acknowledgements
This work has been prepared under the support provided by research projects FEKT-S-11-14, FR-TI1/061 of Ministry of Industry and Trade of the Czech Republic and further by Centre for Research and Utilization of Renewable Energy no. CZ.1.05/2.1.00/01.0014.
References
[1] J. Kuzdas; P. Vorel, High- Power Converter Operating at Switching Frequency 100kHz. In XI. International Conference on Low Voltage Electrical Machines LVEM2011. 2011. p. 1-3. ISBN: 978-80-214-4362- 4.
[2] P. Vorel; P. Procházka; V. Minárik, Powerfull Fast Charger 16kW for Electric Vehicle. In 12th Advanced Batteries, Accumulators and Fuel Cells ABAF2011. p. 52. ISBN: 978-80-214-4310-5
145

13th Advanced Batteries, Accumulators and Fuel Cells Lithium-ions accumulators
ELECTROCHEMICAL DEPOSITION OF TIN AND SILICON STUDIED BY EQCM
Kaválek, O., Vondrák, J., Sedlaříková, M.
Department of Electrical and Electronic Technology, Faculty of Electrical Engineering and Communication, BUT, Technická 10, 616 00 Brno, ČR
Corresponding author: Ondřej Kaválek ([email protected])
Introduction
There is interest in developing rechargeable lithium batteries with higher energy capacity and longer cycle life for applications in electronic devices, electric vehicles and implantable medical devices. [1] Silicon and tin are attractive anode material for lithium batteries. [2-6] It has a low discharge potential and the highest known theoretical charge capacity. Currently are common used anodes made from graphite. For production low cost solar cells in the future, it is important to produce Si thin film with large are too.
Experimental
Silicon and tin were deposited in electrolyte which contained PC or DMC with EC, and tetraethylammonium tetrafluoroborat on copper and nickel substrates. Substrate was cleared by NH3 and IPA. Experiment were performed in the Atmosbag, which is inflatable
polyethylene chamber with built-in gloves that lets man work in a totally isolated and controlled
environment. As inert gas, nitrogen was used. Attempts of electrodeposition of tin from SnCl4 were used initially for verification of experimental techniques. Electrochemical acitivity is subscribed by cyclic voltammetry. EQCM describes increase in weight during deposition. Deposited layers were studied by optic microscopy, electron microscopy and X-ray diffraction. Scheme of the measurement system we can see on fig. 1.
146

13th Advanced Batteries, Accumulators and Fuel Cells Lithium-ions accumulators
Fig. 1: Scheme of the measurement system
Results and discussion
Table 1: Measurement parameters
Electrode (-) Ni
Electrode (+) Pt
Molarity 1 mol/dm3
Electrolyte
SiCl4 5 ml
DMC 2,5 ml
EC 2,5 ml
(C2H5)4NBF4 1,08 g
E max [V] 0,5
E min [V] -2,5
n 6
dE/dt [mV/s] 10
147

13th Advanced Batteries, Accumulators and Fuel Cells Lithium-ions accumulators
Fig. 2: Values from cyclic voltammetry (cycle 7)
On fig. 2 we can see electrodeposition of silicon in two waves (-0,8 V a 0,14V), where Si becomes bivalent and trivalent. In cyclic voltammetry from electrolyte without SiCl4 is no electrochemical activity.
Tabble 3: Measurement parameters
Electrode (-) EQCM WE
Electrode (+) Sn REF
Electrode Sn CE
Electrolyte
NH4F 1, 37 g
C4H6O3 74 ml
CH4OH 2 ml
SnCl4 4 ml
U (Ref) [V] -4
dI [μA] 5
dt [s] 0,1
Ew e /V
0-1-2
<I>
/mA
4
3
2
1
0
-1
-2
-3
-4
-5
x: -0,881257 V
y: 0,444308 mA
Point 40660, Cycle 7
x: 0,137987 V
y: 0,979351 mA
Point 41761, Cycle 7
148

13th Advanced Batteries, Accumulators and Fuel Cells Lithium-ions accumulators
Fig. 3: EQCM results: current (blue) and weight (red) in dependence on time
On figure 3, we can see EQCM results. It has been deposited layer 2 cm2 (both sides of the electrode) with weight 16 mg during 2 hours deposition.
Table 4: Measurement parameters
Electrode (-) EQCM WE
Electrode(+) Sn REF
Electrode Sn CE
Electrolyte
1 M (C2H5)4NBF4 4,016 g
C4H6O3 37 ml
CH4OH 1 ml
SnCl4 2 ml
U (Ref) [V] -4
dI [μA] 5
dt [s] 0,1
Fig. 4: Deposited layer on cooper
VZ05B_3_01.mpr
I vs. time f(Delta(Freq)) vs. time #
t im e /s
6 0004 0002 0000
I/m
A
0
-0,001
-0,002
-0,003
-0,004
-0,005
-0,006
-0,007
-0,008
-0,009
-0,01
-0,011
-0,012
-0,013
-0,014
f(Delta(F
req)/H
z)
155
154
153
152
151
150
149
148
147
146
145
144
143
142
141
140
139
138
137
136
m (
mg
)
Cu Deposited layer
149

13th Advanced Batteries, Accumulators and Fuel Cells Lithium-ions accumulators
Table 5: Measurement parameters
Elektroda (-) Cu Pracovní el.
Elektroda (+) Sn Referenční el.
Elektroda Sn Proti el.
Elektrolyt
C4H8O2S +
C4H10O2 7 ml
SnCl4 300 µl
U (Ref) [V] -4
dI [μA] 5
dt [s] 0,1
Fig. 5: AFM microscopy (1x1 µm)
150

13th Advanced Batteries, Accumulators and Fuel Cells Lithium-ions accumulators
Conclusions
The main theme of this work is electrodeposition of Sn and Si from aqueus solvents containing inert conductive salt and chloride. All of these results are first attempts, at which were first complications removed. We can see, that electrochemical preparation of layers is possible, but XRD results shows, that deposited layers are mostly made up from SiO (95%), than clear Si (5%).
This choice is predominately evoked by some potential interest in these elements as semiconductors, and by the hope of their cheap and easy production for a variety of purposes. All these electrodeposited layers could be used for negative electrodes in li-ion cells.
Acknowledgements
This work was supported by the Czech Science Foundation No P102/10/2091
References
[1] Chan, C.K., et al., High-performance lithium battery anodes using silicon nanowires. Nature Nanotechnology, 2008. 3(1): p. 31-35.
[2] Huggins, R.A., Lithium alloy negative electrodes formed from convertible oxides. Solid State Ionics, 1998. 113: p. 57-67.
[3] Li, H., et al., High capacity nano-Si composite anode material for lithium rechargeable batteries. Electrochemical and Solid-State Letters, 1999. 2(11): p. 547-549.
[4] Takamura, T., et al., A vacuum deposited Si film having a Li extraction capacity over 2000 mAh/g with a long cycle life. Journal of Power Sources, 2004. 129(1): p. 96-100.
[5] Wu, H., et al., Engineering Empty Space between Si Nanoparticles for Lithium-Ion Battery Anodes. Nano Letters, 2012. 12(2): p. 904-909.
[6] Kang, K., et al., Kinetics-driven high power Li-ion battery with a-Si/NiSi(x) core-shell nanowire anodes. Chemical Science, 2011. 2(6): p. 1090-1093.
151

13th Advanced Batteries, Accumulators and Fuel Cells Lithium-ions accumulators
EFFECT OF POTASSIUM ON THE STABILITY OF THE STRUCTURE OF LiCoO2
Sedlaříková, M., Kazda, T., Vondrák, J.
Department of Electrical and Electronic Technology, Faculty of Electrical Engineering and Communication, BUT, Technická 10, 616 00 Brno, Czech Republic
Abstract
The aim of this study was to improve the properties of cathode material for lithium-ion
batteries based on . As a method of manufacturing of the doped base material was chosen the solid phase reaction method, which has been already tested for the production of the basic material. The main goals were reducing the capacity loss during cycling of the material, maintaining the same or achieving higher capacity or increasing the current
carrying capacity of the material by doping the base material with varying amounts of potassium ions or by substitution of lithium by potassium.
Introduction
In 1991 the first commercial lithium-ion batteries made by Sony came on the market, in
this battery was used as a cathode material. Graphite with higher energy density than 500Wh/dm3 is used as the anode material. is currently the most used positive electrode material for lithium-ion cells.[4] The theoretical capacity of this material is 155 mAh / g, voltage against lithium is 3.9V. This material is characterized by layered structure, and thus the cobalt atoms are contained in the oxygen interlayers and lithium atoms are in the space between the layers of oxygen. This structure leads to easy release of lithium ions, but it also causes collapse of the structure and reduction of capacity during repeated de-intercalation and intercalation. Another problem of this material is temperature instability, at higher temperatures it leads to the release of oxygen from the structure. This oxygen reacts with organic solvents (EC, DEC, EMC, DMC) contained in the electrolyte
and generates heat. Thermal stability of is affected by the type, particle size and concentration of electrolithium salts, which strongly depends on the content of the electrolyte.[1] For this reason brand new cathode materials are searched, or doping the
base material ( ) by other elements is made in an effort to stabilize the structure of this material. An example of such material can be - , in this material is Co
partially replaced by Ni and this results in increasing of the capacity to 190-220 mAh/g but the voltage drop against lithium to 3.7-3.77 V depending on the content of Ni. Another
such material is , this material has again a lower voltage against lithium (3.6 V), but higher capacity (160 mAh/g) and is more stable during cycling than pure
. Another utilized but structurally different material is . This material has a spinel structure, thanks to it it gains greater stability. Using manganese is more
economical and more environmentally friendly than . The disadvantage of this material is lower capacity (120 mAh/g) but the voltage against lithium is 4V. [2][3]
152

13th Advanced Batteries, Accumulators and Fuel Cells Lithium-ions accumulators
Experimental
The reason why potassium was chosen for doping and as a substitution material was based on the assumption that the potassium atoms would be incorporated between layers of oxygen and during intercalation and de-intercalation process of lithium ions they would prevent the collapse of the layered structure. For the production of this material the method of reaction in solid state was chosen. Basic materials used for the production
were: (lithium carbonate), (cobalt (II) carbonate) and (potassium carbonate). These three materials were mixed in a stoichiometric ratio, while there was a substitution of lithium by potassium and volume of Co was always the same. Lithium was replaced by potassium in amounts of 1%, 2%, 2.5%, 3% 5% and 10%. Therefore six samples of materials were created in which Li was replaced by specified percentage of K. In the next step, these three materials are mixed again, this time volume of Co and Li was always the same and base material was doped by potassium in amounts of 1%, 2.5%, 3%, 5%, 6% and 10%. Mixing was done in a mixture of distilled water and ethyl alcohol in the ratio 2:1 and was followed by drying at 90° C for 12 hr. The dried mixture was milled in the ball mill, poured into a ceramic bowl and annealed for 30 hr at 400 °C. The annealed material was subsequently grinded and pelleted; the resulting pellet was again annealed at 650° C for 8 hr. In the next step of the process grinding pelleting and annealing were repeated, this time at 950 ° C for 8 hr. [5] The mill was thoroughly washed out with water followed by alcohol and dried after each grinding. The mill was filled with argon during grinding. The resulting material was grinded in the ball mill and then the mixture consisting of NMP (N-Methyl-2-pyrrolidon) (solvent), PVDF (Polyvinylidenfluorid) (binder) and carbon Super P was created. The weight ratio of materials was: 80%, Super P 10%, PVDF 10%. The resulting mixture was subsequently spread on an Al foil, dried and pressed by the pressure of 3200 kg/cm2. A disk with a diameter of 18 mm was cut out of the coated aluminium foil and inserted into the electrochemical test cell El-Cell© ECC-STD. The whole assembly was done in glove box filled with argon atmosphere. As a counter electrode metal lithium was used and as an electrolyte 1M impregnated in the glass fibre separator, ratio was: EC:DMC 1:1 w/w.
Galvanostatic cycling was used for measuring; the potential window was set from 2.5 to 4.2 V versus lithium. Two cycles of charging and discharging have always been carried out during which the used charging and discharging currents were 0.5C (calculated from the weight of the deposited material provided that the capacity of the material is 120 mAh/g). From these two cycles the real value of capacity of the sample has been deducted and then the sample was cycled ten times by 0.5C current. Rate Capability was measured on one selected sample - the sample was always charged by 0.1C current and the discharge was carried out seven consecutive times by the currents 0.1C, 0.2C, 0.5C, 1C, 2C, 5C and 10C. XRD analyses with the CoKα specific radiation were performed on selected samples after these measurements.
All produced samples of - and were compared with pure samples of
produced in a similar way in three annealing bowls labelled I-III.
153

13th Advanced Batteries, Accumulators and Fuel Cells Lithium-ions accumulators
Table I: The capacity of the samples I - III in the first two discharging cycles
Name of the material Capacity in 1st cycle [mAh/g] Capacity in 2nd cycle [mAh/g]
LiCoO2 I 121.03 mAh/g 128.9 mAh/g
LiCoO2 II 130.1 mAh/g 128.9 mAh/g
LiCoO2 III 119.2 mAh/g 116.8 mAh/g
Table II: The capacity of the - samples (x = 0.01; 0.02; 0.025; 0.03; 0.05; 0.1) in the first two discharging cycles
Name of the material Capacity in 1st cycle [mAh/g] Capacity in 2nd cycle [mAh/g]
Li0.99K0.01CoO2 113.9 110.0
Li0.99K0.01CoO2 no.2 118.9 116.3
Li0.98K0.02CoO2 115.5 113.5
Li0.975K0.025CoO2 119.0 117.0
Li0.975K0.025CoO2 no.2 117.6 114.9
Li0.97K0.03CoO2 104.2 102.4
Li0.97K0.03CoO2 no.2 106.8 104.8
Li0.95K0.05CoO2 105.9 102.8
Li0.9K0.1CoO2 111.4 110.6
Table III: The capacity of the samples (x = 1; 2.5; 4, 5; 6; 10) in the first two discharging cycles
Name of the material Capacity in 1st cycle [mAh/g] Capacity in 2nd cycle [mAh/g]
LiCoO2 +1%K 124,0 117,2
LiCoO2 +1%K no.II 116,0 111,4
LiCoO2 +2.5%K 131,5 127,1
LiCoO2 +2.5%K no.II 134,7 129,8
LiCoO2 +4%K 126,7 124,2
LiCoO2 +5%K 128,8 127,2
LiCoO2 +5%K no.II 134,4 131,2
LiCoO2 +6%K 128,3 125,9
LiCoO2 +10%K 129,5 120,3
LiCoO2 +10%K no.II 131,6 128,2
154

13th Advanced Batteries, Accumulators and Fuel Cells Lithium-ions accumulators
Fig. 1: Comparisons of capacity in the first two cycles of the samples of II, III , and +5%K
The materials and (from the group of materials - ) are
closest to the capacity of the material III in first two cycles. Other materials where Li is replaced by K showed a lower capacity.
In the group of materials almost all samples capacities were comparable to all samples of . +5%K material was used for comparison. Comparison of selected materials can be seen in Fig.1.
155

13th Advanced Batteries, Accumulators and Fuel Cells Lithium-ions accumulators
Fig. 2: Decrease capacity during ten cycles of sample III
Fig. 3: Decrease of the capacity during ten cycles - sample
156

13th Advanced Batteries, Accumulators and Fuel Cells Lithium-ions accumulators
Fig. 4: Decrease of the capacity during ten cycles - sample +5%K
Fig. 5: Comparisons of capacity in the first of the ten cycles of the samples of I, III , and +5%K
157

13th Advanced Batteries, Accumulators and Fuel Cells Lithium-ions accumulators
Fig. 6: Comparisons of capacity in the last of ten cycles of the samples of I, III, and +5%K
During the measuring of ten charging / discharging cycles by the 0.5C current it was found that from the - group the closest to the rate of decline in the capacity of the base
material is the sample . Material demonstrated a greater decline than the base material similarly as the remaining materials, which is evident from the comparison in Fig.7 and Table 4. This measurement was performed for
the group of materials In this group, material +5%K showed the best results, which achieved the same or a slightly lower decrease in capacity than samples of
the base material which is again evident from the comparison in Fig.7 and Table 4.
158

13th Advanced Batteries, Accumulators and Fuel Cells Lithium-ions accumulators
Fig. 7: Decrease in capacity depending on the potassium content on materials the - and during cycling (using charge and discharge current 0.5 C)
Table IV: Decrease of capacity in 10 cycles for samples compared with and +5%K
Name of the material Capacity in 1st cycle
[mAh/g]
Capacity in 10th cycle
[mAh/g] Capacity loss [%]
LiCoO2 I 129.3 108.7 -15.9
LiCoO2 II 127.8 113.8 -11.0
LiCoO2 III 113.6 95.3 -16.1
Li0.975K0.025CoO2 114.9 95.8 -16.6
Li0.975K0.025CoO no.2 107.5 93.4 -13.1
LiCoO2 +5%K 125,3 107,9 -13,9
LiCoO2 +5%K č.II 126,7 105,8 -16,5
Then the measurement of Rate Capability was done and during this measurement it was
found that at higher discharge currents the material maintains a similar or higher capacity than the base material . This improvement did not appear by the material +5%K, in contrary the loss of capacity occurred in comparison with the base material.
159

13th Advanced Batteries, Accumulators and Fuel Cells Lithium-ions accumulators
Fig. 8: Decrease of the capacity depending on the discharge current
Fig. 9: The capacity of materials LiCoO2 II, Li0,975K0,025CoO2 and +5%K at the 2C discharge during the Rate capability measurement
160

13th Advanced Batteries, Accumulators and Fuel Cells Lithium-ions accumulators
Fig. 10: XRD differences of , and +5%K
Discussion of Fig. 10
According to the theory of intercalation electrode materials, the electrochemical potential of the intercalation system is influenced by the ratio between volumetric compressibility and lattice expansion influenced by the insertion of ions [6]. The ions of potassium may act as “pillars” between layers of cobalt oxide in the van der Waals gap. Such “pillaring effect” is known in the family of layered compounds. Therefore, the lattice is more resistant to volume changes than it is in the case of pure LiCoO2. The insertion or extraction of lithium ions is not associated with additional henthalpy change, and the discharging / charging curve would be closer to that described just by Nernst formula. However, the presence of named :pillars: in van der Waals gap would decrease the amount of sites able to accomodate lithium ions. The total charge is lower than that found for LiCoO2 for that reason.
Conclusions
From the results of the measurements it was found that the two materials with the most
similar properties to the base material are Li0,975K0,025CoO2 and +5%K. The other materials showed either a lower capacity or a large decline in subsequent cycles. In the Fig.1 we can see that materials Li0,975K0,025CoO2 and LiCoO2+5%K show similar characteristics during discharging as the base material, while the material LiCoO2+5%K is able to remain longer in a similar capacity at a higher voltage. This is evident in the first of the ten cycles at 0.5 C in the Fig.5, next Fig.6 shows the last of the ten cycles - in this graph it is clear that there was a decrease in capacity during cycling in all of the samples, but in the material LiCoO2+5%K we can clearly see the longer time spent at the higher voltage. When measuring with increasing load, it was found that the material Li0,975K0,025CoO2 shows smaller decrease in capacity at higher loads than the other samples and maintains a higher voltage plateau for an extended period of time, which is
161

13th Advanced Batteries, Accumulators and Fuel Cells Lithium-ions accumulators
evident from Fig.9. Increasing stability of this material is most likely achieved by preventing complete deintercalation during discharging due to lower mobility of potassium ions in the Van der Waals space.
Acknowledgments
This work was supported by Czech Science Foundation, grant No. P102/10/2091, FEKT-S-11-7 and Project Center of Research and Utilization of Renewable Energy Sources CVVOZE No. CZ.1.05/2.1.00/01.0014.
References
[1] D. Linden and T. B. Reddy, Handbook of Batteries, McGraw-Hill (2002). [2] W. A. Van Schalkwijk and B. Scrosati, Advances in Lithium-Ion Batteries, Kluwer
Academic/Plenum Publishers (2002). [3] T. Ohzuku and R. J. Brodd, Journal of Power Sources, 174, 449 (2007). [4] K. Kezuka, T. Hatazawa and K. Nakajima, Journal of Power Sources, 97-98, 755
(2001). [5] J. Bludská, J. Vondrák, P. Stopka and I. Jakubec, Journal of Power Sources, 39, 313
(1992). [6] J. Vondrák, J. Reiter, J. Velická, B. Klápště, M. Sedlaříková, V. Novák: J. Solid State
Electrochem. 7, 361 (2003)
162

13th Advanced Batteries, Accumulators and Fuel Cells Lithium-ions accumulators
ENHANCE CAPACITY AND SAFETY OF LITHIUM-ION ACCUMULATORS
Sedlaříková, M.1, Vondrák, J.1, Libich, J.1, Dvořák, O.2, Buřičová, H.2
1Department of Electrical and Electronic Technology, Faculty of Electrical Engineering and Communication, BUT, Technická 10, 616 00 Brno, Czech Republic
2Technical Institute of Fire Protection, Ministry of the interior of the Czech Republic, Písková 42, 143 00 Praha 4 – Modřany, Czech Republic.
Abstract
This paper is based on a research of negative materials for Lithium-ion accumulators. In the research are considered the methods, which would lead to enhance capacity of Lithium-ion accumulators along with improving their safety. In the first part of our research we prepared specific materials for negative electrode. These materials should be able to reduce or completely remove the irreversible capacity of Lithium-ion accumulators. Electrode materials were made by lithiation process with help of n-Butyllithium reagent. In this way prepared materials already contain the lithium ions (cations), where the Li+ intercalated to materials. For experimental purposes were chosen commonly uses graphite materials for negative electrodes of Lithium-ion accumulators as natural graphite or expanded graphite. The second part of this study is focused on safety testing of various mixtures (materials). These tests were performed on STA i1500 device, this device offers two analyses TG and DCS which are based on temperature changes of specimen.
Introduction
In this research we dealt with a problem of irreversible capacity, the irreversible capacity represents the losses which are a result from SEI layer formatting process. The losses arise on the negative electrode, between first and second charge – discharge cycle in Lithium-ions batteries. The Batteries’ capacity is in the next cycles broadly stable, i.e. no ions are already used to Solid Electrolyte Interface (SEI) layer. The SEI layer is made up decomposition products of the electrolyte and lithium ions. Li-ion batteries use usually a mixture of solvents, ethylene carbonate (EC) and diethyl carbonate (DC).
In the first cycle is accumulator charged, during the charging process arising on the interface between electrode surface and electrolyte SEI layer. The SEI layer contains decomposition products from both solvents for example: Li2CO3, LiO2, C2H4, CO3
2- and next kinds of carbonaceous molecules which origin from electrolyte. Among important SEI layer characteristics belongs (SEI layer is necessary for properly function of battery) ion conductivity (Li+) and electron non-conductivity.
The widely used type of Li-ion accumulators has negative electrode made from carbonaceous materials exactly from crystalline graphite. Is already good known that an irreversible capacity of graphite reduces potential capacity of accumulator approximately from from 15 % to 45 %. We attempted to decrease or fully eliminate an irreversible capacity of graphite electrode.
163

13th Advanced Batteries, Accumulators and Fuel Cells Lithium-ions accumulators
Were prepared several kinds of graphite specimens which are based on two widely used type of graphite, see Table 1 below. These graphites were electrochemically lithiated with reduction agent. In our research we uses n-Butyllithium, next Bu-Li, agent (C4H9Li), see as reduction agent for graphite and the butyllithium itself simultaneously oxidizes. Bu-Li is organolithium reagent that is prepared from 1-bromobutane or 1-chlorobutane, see Equation 1. In this case, we mean by ’reduction’ and ’oxidation’ a transfer of lithium cations (Li+), between graphite and Bu-Li. This transfer process lead to intercalation lithium cations among graphite sheets, this process we call chemical lithiation.
Table 1: Properties of the specimens.
Graphite type Particle diameter [μm] Specific surface [m2.g
-1] Bulk density [g .l
-1]
CR 5995 < 11 10 < 560
Expanded graphite < 150 68 < 180
Fig. 1: The constitutional formula of butyllithium.
2 Li + C4H9Cl → C4H9Li + LiCl (1) Equation 1: Reaction describes the formatting of n-butyllithium and lithium chloride from 1-chlorobutane and lithium metal.
At the second part of our research were tested the lithiated graphite materials for fire safety characteristics. Safety of Lithium-ions batteries is often discussed topic and its significance grows up from the view of using batteries in electrical vehicles. Were performed analyses, which study the behaviour of materials during heating. We use the STA (Simultaneous Thermal Analysis) which include TG (thermogravimetry) analysis and DCS (Differential Scanning Calorimetry) analysis. TG analysis follows the changes of sample weight as a function of temperature and the DSC analysis that measuring the reaction enthalpy i.e. the amount of energy released from material during heating.
Experiments
Preparing materials and characteristic measuring
In the first part we prepared materials for negative electrode, which were based on two types of graphite. These materials were measured in two electrodes configurations, where in the half-cell we used metal lithium like counter and reference electrode and LiPF6 electrolyte. At all experiments we use 2.5 M Bu-Li solution in n-Hexane.
The preparation process can be divided to several steps.
dry out all graphite samples
calculating the volume of Bu-Li relatively to graphite weight (ratio one Li+ ion on six atoms of carbon – LiC6 )
stirring (Bu-Li + Graphite) for 24 hours at room temperature
filtering → lithiated grpahite
stirring of lithiated graphite in n-hexane for 24 hours at room temperature
164

13th Advanced Batteries, Accumulators and Fuel Cells Lithium-ions accumulators
filtering → lithiated graphite called „PURE“
making of electrode and measurements
The second stirring/filtering process (cleaning) is required, it serves to remove the Bu-Li residues which not intercalated to graphite. We chose n-hexane because its reaction with Bu-Li is stable. All process steps were performed under inert argon atmosphere in glue-box. Material samples prepared in this way were afterward coated on copper foil. These electrodes were dried at 50°C for 12 hours and subsequently they were pressed by exactly defined load.
With these electrodes were completed half-cells with metal lithium. After assembly of the cell were performed potentiostat/galvanostat measurements of charge – discharge characteristic. For us was important first and second charge – discharge cycle, because between first and second cycles is formed SEI layer on electrode interface. After first two charge – discharge cycles is the layer already fully created, in the next cycles the layer grows very slowly and is considered as stable.
On the Fig. 2 are showed expanded graphite characteristic. It is seen that lithiated graphite has higher capacity in the first cycle, this is caused with Li+ ions, which were in material before first cycle. Fig. 3 shows similar effect on natural graphite.
Fig. 2: Difference in Capacity between the lithiated graphite and non-lithiated graphite.
165

13th Advanced Batteries, Accumulators and Fuel Cells Lithium-ions accumulators
Fig. 3: Lithiated graphite has a higher capacity in first cycle.
Fig. 4: Enormous difference in capacity between natural and expanded graphite.
166

13th Advanced Batteries, Accumulators and Fuel Cells Lithium-ions accumulators
Fig. 4 above shows the enormous difference in capacity for the graphite types which we used in experiments. Is possible, the expanded graphite needs to its proper work a special conductive additives or the CVD modification.
TG/DSC analysis of electrode materials
At the second part of our study were carried out thermal analyses on STA i1500 device. We tested our specimens of lithiated materials against charged commercial materials for negative electrode of Li-ion batteries. The STA i1500 device is able to perform two analyses methods (TG and DCS). On Fig. 5 is shown the difference between materials, commercial material has a marked pike that represent releasing amount energy, this reaction is called exothermic. Against the lithiated natural graphite, that we prepared, has not this pike, however its characteristic is very similar to commercial matter.
When we evaluate the specimen weight changes, it is obvious difference in the rate of losing weight during heating. This difference could be caused with special additives or modifications by which the manufacturers reach better graphite properties.
Fig. 5: Simultaneous Thermal Analysis (STA), this analysis follows a material behaviour like enthalpy and changes in of the material weight, which are a function of temperature.
Conclusion
First part of research was focused to dope graphite materials with lithium ions, as you can see on Fig. 2 and Fig. 3. The lithiated specimens have a smaller capacity then non-lithiated specimens along with approximately identical irreversible capacity in case of natural graphite. The non-lithiated natural graphite had the irreversible capacity around 24
167

13th Advanced Batteries, Accumulators and Fuel Cells Lithium-ions accumulators
% and lithiated graphite had 23 %. More difference was observed in case of expanded graphite, see Fig. 2, non-lithiated specimen had the irreversible capacity around 82 % and in another case 77 %. Weak characteristic of expanded graphite can be caused by the kind of specimen that not undergoes CVD (Chemical Vapour Deposition) modification. The n-butyllithium shows like too feeble reduction agent for graphite. The Li+ cations do not able to intercalate among graphite sheets, in case of expanded graphite we reached small improving, that can be caused by its bigger specific surface.
In the second party we dealt with battery safety, we tested our samples in comparison with commercial materials which were charged by common mode (electrochemically). On Fig. 5 is shown the difference between materials based on natural graphite, the characteristic are very alike expect the pike on temperature 240 °C on sustained violet line. This reaction is caused by intercalated lithium. The graphite lithiation with help of n-butyllithium can be probably more successful by using graphite additives like FeCl3 and similar ferric compounds.
Acknowledgement
This work was supported by Grant Agency of Czech Republic, Project P102/10/2091 (Increase the safety of lithium-ion batteries) and specific research FEKT-S-11-7 (Materials and technologies for electronics).
References
[1] R. Yazami, New chemical reduction of transition metal chloride-GICs with n-butyllithium, Synthetic Metals, Volume 20, Issue 3, July 1987, Pages 383-386.
[2] Martin B. Dines, Lithium intercalation via n-Butyllithium of the layered transition metal dichalcogenides, Materials Research Bulletin, Volume 10, Issue 4, April 1975, Pages 287-291.
[3] B. Pecquenard, D. Gourier, N. Baffier, EPR identification of LixV2O5 phases generated by chemical and electrochemical lithium intercalation in V2O5, Solid State Ionics, Volume 78, Issues 3–4, June 1995, Pages 287-303.
[4] Christina Lampe-Önnerud, Per Nordblad, John O. Thomas, Chemical intercalation of lithium into a V6O13 host, Solid State Ionics, Volume 81, Issues 3–4, 1 November 1995, Pages 189-199.
[5] Makovicka, J. Záporná elektroda lithných sekundárních clánku – Doktorská práce. Brno 2008. FEKT VUT v Brně.
[6] L.B. Ebert, L. Matty Jr., Intercalation compounds of graphite: Chemical identity and reactivity, Synthetic Metals, Volume 4, Issue 4, May 1982, Pages 345-361.
[7] H. Schranzhofer, J. Bugajski, H.J. Santner, C. Korepp, K.-C. Möller, J.O. Besenhard, M. Winter, W. Sitte, Electrochemical impedance spectroscopy study of the SEI formation on graphite and metal electrodes, Journal of Power Sources, Volume 153, Issue 2, 28 February 2006, Pages 391-395.
[8] Liwei Zhao, Izumi Watanabe, Takayuki Doi, Shigeto Okada, Jun-ichi Yamaki, [9] TG-MS analysis of solid electrolyte interphase (SEI) on graphite negative-electrode in
lithium-ion batteries, Journal of Power Sources, Volume 161, Issue 2, 27 October 2006, Pages 1275-1280.
168

13th Advanced Batteries, Accumulators and Fuel Cells Lithium-ions accumulators
MODELING AND NUMERICAL SIMULATION OF LITHIUM ION BATTERY
Vyroubal, P.1, Maxa, J.1, Kazda, T.1, Vondrák, J.1
1Department of Electrical and Electronic Technology, Faculty of Electrical Engineering and Communication, BUT, Technická 10, 616 00 Brno, ČR
Corresponding author: Petr Vyroubal ([email protected]) Phone: +420 541 146 154
Abstract
Lithium-ion batteries are incredibly popular these days. You can find them in laptops, PDAs, cell phones, iPods and so on.
The energy density of lithium-ion is typically twice as high as of the standard nickel-cadmium cell. Most of today's mobile phones run on a single cell. A nickel-based pack would require three 1.2 volt cells connected in series [1].
Despite its overall advantages, lithium-ion has its drawbacks. It is fragile and requires a protection circuit to maintain safe operation. Built into each pack, the protection circuit limits the peak voltage of each cell during charge and prevents the cell voltage from dropping too low on discharge. In addition, the cell temperature is monitored to prevent temperature extremes. The maximum charge and discharge current on most packs is limited to between 1C and 2C [2].
Introduction
The basic elements of Li-Ion batteries are cathode, anode and electrolyte. The anode and cathode are formed by intercalations substances, these substances are characterized by the ability to release and then incorporating lithium ions in its structure, thereby these batteries differ from conventional, in which there is chemical conversion of anode and cathode material. As cathode materials are used metal oxides of the spinel and olivine layered structure as the anode material used carbonaceous materials.
Reaction at the positive electrode Li-Ion cells:
Reaction at the negative electrode Li-Ion cells:
Summary reaction:
In these equations metal oxides is used as a cathode material such . From these equations is due to the electrolyte has only a function of ionic carriers, and does not
169

13th Advanced Batteries, Accumulators and Fuel Cells Lithium-ions accumulators
enter into the reaction, making it just a small amount of which is one of the advantages of Li-Ion batteries.
Currently the most used by positive electrode material for lithium-ion cells is , this material is characterized a layered structure, voltage against to lithium in the size of 3.9V and capacity 155mAh/g. This material is characterized by its structure less stable during thermal cycling and load. As his possible replacement materials have been created
and . is formed spinel structure making it more stable and has a higher voltage around 4V on lithium, however the capacity of 120mAh/g. Material is the latest of a group of materials for lithium-ion cells is characterized olivine structure, high stability and shelf life is composed of ecologic and cheap materials show voltage 3.5V versus lithium and capacity 160mAh/g.
Mathematical model
Computer simulation is a very popular engineering tool for describing and modelling phenomena occurring in real life and allows us to quickly obtain the basic characteristics of the studied system.
Modern simulation programs (e.g. COMSOL, MatLab), have found a place in electrochemistry. It is important to describe correctly mathematically chemical processes. The output can be the charging and discharging curves, the concentration profiles of electrolyte during charging and discharging, state of charge characteristic, or in more complex simulations such as heat loss caused by the charging and discharging cycle. These programs allow simulating chemical reactions and provide a direct computational modules dealing with specific types of batteries. Below, we discuss computational module for li-ion battery, which offers a COMSOL Multiphysics.
COMSOL Multiphysics is package for modelling and simulation of physical phenomena using Partial Differential Equations (PDE) and then solve particular model by FEM analysis. Geometric model is possible to create in COMSOL environment or import them from other CAD packages. It is possible to simply combine several physical applications (PDEs) in one model by contribution several optional add-ons modules from different professional areas. [7].
The interface solves for five dependent variables [6]:
The electric potential
The electrolyte potential
The potential losses due to a resistive film on the electrode particles in the
porous electrodes, also called solid-electrolyte interface (SEI)
The concentration of lithium ( ) in the electrode particles
The electrolyte salt concentration
The electrolyte in the modeled batteries has to be a quiescent binary 1:1 electrolyte,
containing lithium cations ( ) and anions ( ) [6]. In the electrolyte and pore electrolyte,
two variables are defined, and . Assuming electroneutrality, denotes both the concentration and the concentration. Charge-conservation equations are solved for the electric potentials of the electrode and electrolyte phases throughout the cell. The
170

13th Advanced Batteries, Accumulators and Fuel Cells Lithium-ions accumulators
domain equations in the electrolyte are the conservation of charge and the mass balance for the salt according to the following [6]:
(1)
And
(2)
Where denotes the electrolyte conductivity, the activity coefficient for the salt, the transport number for (also called transference number), the sum of all electrochemical current sources, and denotes an arbitrary electrolyte current source. In the mass balance for the salt, denotes the electrolyte volume fraction, the electrolyte
salt diffusivity, and the total source term in the electrolyte [6].
Equations (1) and (2) are spatially second order and thus each require boundary conditions. Fig. 2 summarizes the conservation equations and the boundary conditions,
illustrated in a one-dimensional configuration [5], where the normal vector points into the electrolyte domain.
Fig. 1: Boundary conditions illustrated in a one-dimensional configuration [5].
In the porous electrodes, denotes the sum of all charge transfer current density contributions according to [5], [6]:
(3)
Where, represents the surface area of active electrode particles per unit volume of
composite electrode. In the electrode, the current density, is defined as [6]:
(4)
Where is the electrical conductivity. The domain equation for the electrode is the conservation of charge expressed as [6]:
(5)
171

13th Advanced Batteries, Accumulators and Fuel Cells Lithium-ions accumulators
Where Qs is an arbitrary current source term. The first term in Eq. (5) represents charge transport via electronic conduction. The second term represents a source of charge associated with electrons entering (leaving) the solid electrode phase via charge-transfer reactions [5].
The electrochemical reactions in the physics interface are assumed to be insertion reactions occurring at the surface of small solid spherical particles of radius in the
electrodes. The insertion reaction is described as [6]:
(6)
Where denotes a free reaction site and an occupied reaction site at the solid particle surface. The concentration of does not have to be solved for since the total concentration of reaction sites, , is assumed to be constant, implying that [6]:
(7)
An important parameter for lithium insertion electrodes is the state-of-charge variable for
the solid particles, denoted . This is defined as [6]:
(8)
The equilibrium potentials E0 of lithium insertion electrode reactions are typically functions
of . The electrode reaction occurs on the particle surface and lithium diffuses to and from the surface in the particles. The mass balance of Li in the particles is described as [6]:
(9)
Where is the concentration of in the solid phase. This equation is solved locally by this physics interface in a 1D pseudo dimension, with the solid phase concentrations at the nodal points for the element discretization of the particle as the independent variables. The gradient is calculated in cartesian, cylindrical or spherical coordinates, depending on if the particles are assumed to be best described as flakes, rods or spheres, respectively.
A resistive film (also called solid-electrolyte interface, SEI) might form on the solid particles resulting in additional potential losses in the electrodes. To model a film resistance, an extra solution variable for the potential variation over the film, is introduced in the
physics interface. The governing equation is then according to [6]:
(10)
Where ( ) denotes a generalized film resistance. The activation overpotentials,
, for all electrode reactions in the electrode then receives an extra potential contribution [6]:
(11)
The rate of a charge-transfer process is usually modeled with a Butler–Volmer equation, which can apply to an elementary or a global reaction. In Butler–Volmer form, the current density is evaluated as [5]:
(12)
172

13th Advanced Batteries, Accumulators and Fuel Cells Lithium-ions accumulators
The finite element method
The finite element method (FEM) (its practical application often known as finite element analysis (FEA)) is a numerical technique for finding approximate solutions to partial differential equations (PDE) and their systems, as well as (less often) integral equations. In simple terms, FEM is method for dividing up a very complicated problem into small elements that can be solved in relation to each other [8].
Examples of (a) linear and (b) quadratic elements are shown in Figure 2. The computation is carried out at the nodal points of the element. Through these nodes is the computation transmitted to the edge of the model.
Fig. 2: Different 1D, 2D and 3D basic elements a) linear elements b) quadratic elements.
Linear elements (Fig. 2a) have nodes in its vertexes. If we want to calculate the higher order, we used quadratic elements (Fig. 2b). Quadratic elements have nodal point at the center edge of the used element. However, this is associated with increased computing time.
Convergence is an essential requirement for all numerical methods. Numerical solution must be close to a solution that corresponds to continuous problem at the finite element mesh thickening. Calculation error can be reduced by scaling the number of elements, which results in longer computation time.
Process of creating the computational model:
Creating of model geometry
The definition of boundary conditions and material properties
Generating computational mesh (automatic or user controlled)
Computation
Processing of results
For the example the battery from a mobile phone was modelled (Fig. 3a, b). The battery has a capacity of 900mA/h and voltage of 3.6 V. This battery is currently being investigated. For creating the geometry (Fig. 3c, d) was used SolidWorks software which includes tools for 3D modelling, assemblies, drawings, etc. On Fig. 3e is an example of calculation mesh, the model is considered as 2D and mesh has triangular shape.
173

13th Advanced Batteries, Accumulators and Fuel Cells Lithium-ions accumulators
Fig. 3: a) used battery, b) the structure of the battery inside, c) the overall model in SolidWorks, d) the structure of the battery modeled in SolidWorks, e) generated computational grid.
Table I: Dimensions of the electrode system:
Battery part Dimension [mm]
Anode 0.08
Cathode 0.06
Al current collector 0.015
Cu current collector 0.015
Separator 0.01
Conclusion
For the modelling of chemical processes is necessary to know their mathematical interpretation and how the simulation software proceeds in solution. It’s important to respect the model geometry and generated computational mesh. Computational mesh has the greatest influence on the actual computational time. The simulation will be more accurate if the computational mesh is finer and better quality.
Acknowledgment
This work was supported by the grant CVVOZE CZ.1.05/2.1.00/01.0014 and by the specific graduate research of the Brno University of Technology No. FEKT-S-11-7.
174

13th Advanced Batteries, Accumulators and Fuel Cells Lithium-ions accumulators
References
[1] LINDEN, D., REDDY, T.B., Handbook of Batteries. McGraw-Hill Prof Med/Tech, 2002 ISBN 0-07-135978-8.
[2] VAN SCHALKWIJK, W.A., SCROSATI, B., Advances in Li-ion Batteries. Kluwer Academic, Plenum Publishers, NY, London, Moscow, 2002, ISBN 0-306-47356-9.
[3] http://batteryuniversity.com/learn/article/is_lithium_ion_the_ideal_battery [4] SPOTNITZ, R., FRANKLIN, J., Abuse behavior of high-power, lithium-ion cells.
Journal of Power Sources, 2003. 113(1): p. 81-100. [5] COLCLASURE, M.A., KEE, R.J., Thermodynamically consistent modeling of
elementary electrochemistry in lithium-ion batteries, Electro-chemica Acta, Volume 55, Issue 28, 1 December 2010, Pages 8960–8973.
[6] http://www.comsol.com/products/batteries-fuel-cells/ [7] http://www.humusoft.cz/produkty/comsol/ [8] Cai, L.; White, R.E. Mathematical modeling of a lithium ion battery with thermal
effects in COMSOL Inc. Multiphysics (MP) software. Journal of Power Sources. 2011, Volume 196.
[9] http://www.comsol.com/products/multiphysics/
175

13th Advanced Batteries, Accumulators and Fuel Cells Lithium-ions accumulators
MONODIMENSIONAL AMORPHOUS SnCo ARRAYS AS HIGH PERFORMING ANODES FOR LITHIUM ION BATTERIES
Ferrara1, G., Arbizzani2, C., Damen2, L., Guidotti2, M., Lazzari2, M., Vergottini3, F. G., Inguanta3, R., Piazza3, S., Sunseri3, C., Mastragostino2, M.
1 CR Mobility Solution Systems S.r.l. – Via Torrearsa, 24, Palermo, Italy
2 Dipartimento di Scienza dei Metalli, Elettrochimica e Tecniche Chimiche
Università di Bologna, Via San Donato, 15 – Bologna, Italy 3 Dipartimento di Ingegneria Chimica, Gestionale, Informatica, Meccanica
Università di Palermo, Viale delle Scienze Ed. 6 – Palermo, Italy
Corresponding author: Germano Ferrara ([email protected])
Abstract
In this paper a high capacity tin-based anode is proposed, whose cycling stability was improved by material design. Good mechanical stability, up to 200 cycles, and high specific capacity at different temperature and C-rates are reported. Further improvements are required in order to increase coulombic efficiency and to limit irreversibility during the first cycle.
Introduction
Lithium ion batteries (LIBs) represent a challenge for researchers and producers. LIBs are under the magnifier of scientific community due to properties like high energy density, and cycle stability as well as for their economical outcome. Since LIBs first practical applications in the early 1990s, they have been investigated to increase electrochemical performances and safety and to reduce their cost. Hence, with the aim of optimizing the whole battery, researchers have focused attention on their main components (cathodes, electrolytes and anodes). For these reasons, nowadays several kinds of chemicals are used in the fabrication of LIBs, producing a variety of batteries with different performances and possible applications.
In order to increase electrochemical performances of LIBs, efforts have been put on new anodes development. The most used anodes for LIBs are made of carbonaceous materials because of their ability to insert step by step lithium ion between planes of graphitic lattice up to form a stable phase LiC6. As a consequence a theoretical specific capacity of 372 mAh/g is calculated, whereas the intercalation voltage starts at 0.2 V vs. Li+/Li and ends at values close to those of metal lithium electrodeposition; this last process can give rise to dendritic formation with safety issues for possible short circuits during battery charging.
In 2005 Sony (1) announced commercialization of a new high capacity LIB with a tin-based amorphous alloy anode, and this event marked a turning point for the research on these anodes.
176

13th Advanced Batteries, Accumulators and Fuel Cells Lithium-ions accumulators
Tin can alloy with lithium step by step, starting at a potential value of 0.4 V vs. Li+/Li, up to Li22Sn5 with a total theoretical specific capacity of 994 mAh/g. The higher specific mass of tin with respect to graphite is a favorable condition for achieving smaller batteries, goal pursued both by producers and users of light and portable electronic devices. As a drawback, tin suffers of high volume exchange during lithium repeated alloying/dealloying which produces tin crumbling with loss of electric contact between the active metal and the current collector, causing very poor cycle life for a battery with such an anode.
Table 1: Comparison between properties of graphite and tin as anodes for lithium-ion batteries (2, 3)
C Sn
Fully lithiated phase LiC6 Li22Sn5
Theoretical specific capacity [mAh/g] 372 994
Density [g/cm3] 2.25 7.29
Theoretical charge density [mAh/cm3] 837 7246
Onset of lithium insertion voltage vs. Li+/Li [V] 0.2 0.4
Volume change % 12 260
As shown in Table 1, tin is a promising high capacity anode for LIBs, even because it is quite cheap, environmentally friendly, while tin and tin-alloy plating is a well established practice, e.g. in cans protection for food processing industries.
In this paper, nanostructured tin-cobalt amorphous alloys are proposed as alternative anodes to graphite and other carbonaceous materials. In order to produce useful anodes for LIBs, and to increase tin mechanical stability, we have chosen to grow electrochemically SnCo alloys inside pores of suitable commercial membranes. Cobalt is the Sony’s non-active material which helps tin to absorb volume exchanges during lithium (de)alloying processes. Membranes act as template and allow to obtain nanometric mono-dimensional structures of active material which can swell and shrink mainly lengthwise, reducing crack formation probability because of facile strain relaxation (4, 5). Furthermore, amorphous alloys improved cycle life with respect to the crystalline ones (6, 7). It will be shown that the proposed fabrication method allows an easy control of the active material.
Experimental
Preparation of tin-cobalt nanowires
Arrays of monodimensional amorphous tin-cobalt alloys were grown by electrochemical deposition inside pores of suitable membranes. Membranes used in this work were commercially available Whatman brand, and particularly they were anodic aluminum oxide (AAO, Anodisc™) and polycarbonate (PC, Cyclopore™) membranes. The former have a thickness of about 60 μm and a pore density of about 1013 pores/m2, the latter are 16-20 μm thick with 1012 pores/m2. All the membranes used have a nominal pore diameter of 200 nm.
One side of the non-conductive membrane was covered with a thin layer of gold by sputtering, for making electrical continuity onto the surface. After lateral insulation, membrane was placed in an electrochemical three-electrode cell and connected to a potentiostat/galvanostat EG&G mod. 273A. A copper film and an array of SnCo nanowires (NWs) were deposited electrochemically. Subsequently, templates were dissolved (AAO in
177

13th Advanced Batteries, Accumulators and Fuel Cells Lithium-ions accumulators
1 M NaOH, and PC in pure CHCl3 or CH2Cl2) obtaining a ready-to-use electrode with nanostructured tin-based anode over a copper current collector (see Fig. 1).
Copper film was plated galvanostatically at room temperature in 0.2 M CuSO4 and 0.1 M H3BO3, with pH adjusted to 3.0. Electroplating of SnCo alloys were conducted in potentiostatic mode from very diluted aqueous solutions of 0.01 M SnSO4 and CoSO4, whose concentration was varied in the range 5 10-3 ÷ 20 10-3 M. Electrolytic bath were added with 0.2 M Na2SO4 as support electrolyte and 0.2 M NaC6H11O7 (sodium gluconate) as a chelating agent, with pH adjusted to 4.6, and 60 °C. It was possible to control crystallographic features of SnCo alloys and their composition changing solution composition and electroplating voltage.
Structural and morphological characterization of tin-cobalt nanowires
Structural characterization of SnCo NWs was performed by X-ray diffraction (XRD) using a Philips generator (mod. PW 1130) working with the Cu Kα radiation (λ = 1.54 Å), equipped with a PW 1050 goniometry.
Samples morphology was observed using a Field Emission Gun – Environmental Scanning Electron Microscope (FEG-ESEM, FEI Quanta 200F) equipped with an X-ray energy dispersive spectrometer (EDS).
Electrochemical characterization of tin-cobalt nanowires
Arrays of nanostructured electrodes, cut in 0.9 cm diameter disks, were tested in a Swagelok T-type electrochemical cell assembled in an argon-filled MBraun Labmaster 130 dry-box, whose controlled environment was set at H2O and O2 < 1 ppm.
SnCo NWs were tested in half cells: lithium foils were used as both reference and counter electrodes and they were separated from the working electrode by a glass separator (Whatman GF/D 400m thick) soaked in the same electrolyte of the electrochemical cell, i.e. ethylene carbonate (EC): dimethylcarbonate (DMC) 1:1–1M LiPF6 (Ferro Corp.).
Fig. 1: Elementary scheme of the nanostructured electrode with current collector (Au + Cu) and the active material (SnCo NWs)
Electrochemical characterizations were performed by a Perkin-Elmer VMP multichannel potentiostat/galvanostat at 10° and 30 °C. The specific capacity values of the electrodes were referred to their geometrical area. In order to investigate the behavior of SnCo NW in
178

13th Advanced Batteries, Accumulators and Fuel Cells Lithium-ions accumulators
the worst conditions for mechanical stress, deep electrochemical characterizations were conducted between the cut-off potentials of 0.02 and 2.00 V vs. Li+/Li.
Results and discussions
The proposed electrode for LIBs has been prepared through electrochemical depositions in a two steps process. A scheme of the electrode after template removal is shown in Fig. 1: a copper film was deposited galvanostatically onto the gold sputtered layer, in order to enhance electric conductivity of membrane surface, after that SnCo NWs were grown potentiostatically inside pores of the membrane, producing an array of mono-dimensional structures firmly connected to the current collector.
According to the selected membrane, it was possible to produce SnCo alloys with different morphologies. AAO membranes are characterized by cylindrical and parallel pores, whereas PC membranes have randomly interconnected pores. After electrodeposition and template removal, the active materials have the morphological features displayed in Fig. 2a and 2b respectively, presenting also different wire density.
Fig. 2: SEM images of SnCo nanowires grown on a copper-gold current collector using AAO (a) and PC (b) templates
Because of the higher pore density of AAO membranes, the active material obtained with this template (SnCo-AM) presents compact structure with very small elbowroom to be permeated by the electrolyte or better accommodate volume change during Li22Sn5 formation. On the contrary, SnCo NWs obtained in PC membranes (SnCo-PM) show larger free-space among NWs (Fig. 2b). As explained later, this second arrangement allows obtaining improved electrochemical performances.
Through the electrochemical method it is possible to control SnCo alloy composition changing the Sn/Co ratio in the electrolyte or electrodeposition time. More details are available in (8) for cathodic deposition at -1.00 V vs. Saturated Calomel Electrode (SCE). Further investigation allowed to control composition and crystallographic structure acting on deposition potential. More cathodic polarizations at settled Sn/Co ratio in solution affect the SnCo alloys deposition rate, reducing it due to the faster concurrent hydrogen evolution; however, deposits with higher cobalt content and lower grains are obtained, in agreement with (9),. Thus, a careful control of the different variables allows to obtain the desired features of alloy for LIB’s anodes.
179

13th Advanced Batteries, Accumulators and Fuel Cells Lithium-ions accumulators
Fig. 3: Discharge capacity vs. cycle number at C/10 for SnCo-AM
Electrochemical characterization of SnCo-AM
Electrochemical characterization of SnCo-AM at C/10 and 30 °C showed a specific capacity at more than 0.5 mAh /cm2 for 12 cycles, then suddenly it fell in few cycles to very low values (Fig. 3), because the electric contact was lost in many areas of the electrode, as revealed by SEM analysis of the samples after cycling (Fig. 4). After about 20 cycles at C/10 the SnCo-AM of Fig. 2a changed their shape into the 8 ÷ 9 μm nanostructures represented in Fig. 4. Nanostructures were stretched and detached from current collector (Fig. 4a and 4b) as a consequence of compression strains induced by tin-lithium alloying. Figures 4c and 4d show better the effect of lamellar extrusion onto the pristine cylindrical NWs in the middle and the top regions of SnCo-AM, respectively.
Electrochemical characterization of SnCo-PM
SnCo-PM NWs of Fig. 2b with Sn content of about 59 wt.% were obtained according to the method described in (10). XRD patterns (Fig. 5) show intense peaks due to copper current collector, whilst no diffraction peak could be assigned to Sn or to any SnCo alloy. This circumstance, together with the smooth voltage profile during the first Sn-Li alloying (image not reported here), confirmed the lack of long distance order; this means that SnCo-PM NWs are amorphous.
Electrodes were tested galvanostatically at a higher C-rate (C/2) than SnCo-AM and showed higher stability, without significant capacity loss for about 100 cycles and a capacity retention of 80 % after 200 cycles (Fig. 6). Coulombic efficiency was about 75 % during the first cycle, then it increased up to a value of about 97 % after the 40th cycle. It is worthwhile to underline that differently from the abrupt fall of SnCo-AM capacity, in Figure 5 a slow fade was detected.
180

13th Advanced Batteries, Accumulators and Fuel Cells Lithium-ions accumulators
Fig. 4: Views of SnCo-AM alloy NWs after electrochemical cycling and washing with water. (a) Overall view; (b) bottom, (c) middle and (d) top regions
With SnCo-PM a progressive accumulation of material, usually named solid electrolyte interface (SEI), could be invoked to explain the loss of capacity. During cycle-life of the electrode and the repeated (de)alloying, tin is subjected to volume expansions and contractions that expose fresh tin surface to the electrolyte. The redox side reactions between tin and electrolyte produce electrolyte degradation with formation of undesired products typical of SEI layer, consuming electrons and keeping the coulombic efficiency at value too low for a practical application in LIBs.
181

13th Advanced Batteries, Accumulators and Fuel Cells Lithium-ions accumulators
Fig. 5: XRD spectrum of the electrode after polycarbonate template dissolution
Ex situ SEM analysis after 170 cycles disclosed that a non-conductive mass covers SnCo-PM. In Fig. 7a, a back scattered image shows that SnCo-PM NWs are still evident but immersed in a homogeneous mass. EDS spectrum of the composite material in Fig. 7b reveals the presence of elements like carbon, oxygen, fluorine, and phosphorous, not detected in SnCo-PM before the electrochemical test (see ref. 10, Figure 3).
Fig. 6: Discharge capacity and coulombic efficiency vs. cycle number for a SnCo-PM NW electrode at C/2 and 30 °C
182

13th Advanced Batteries, Accumulators and Fuel Cells Lithium-ions accumulators
Fig. 7: SEM image of a SnCo-PM NW electrode after 170 cycles at C/2 (a) and EDS spectrum of the same sample (b)
Importance of a SEI stabilizer
As reported above, material engineering (alloy composition, crystallographic structure and morphology) had beneficial effects onto mechanical stability during anode cycle-life; anyway, in order to increase coulombic efficiency, a SEI stabilizer could be helpful.
SnCo-PM with a tin load of about 0.6 mg/cm2 was tested in EC:DMC with 5 wt. % of vinylene carbonate (VC), whose beneficial effect on graphite electrodes are well known (11). Fig. 8 shows electrode specific capacity and coulombic efficiency vs. cycle number. A very stable capacity at about 0.6 mAh/cm2 was delivered for 100 cycles. During the first cycle coulombic efficiency was 75 %, a value close to that measured without VC addition, but it raised faster to 98 % in about 20 cycles. VC seemed not to be the best additive for tin-based anodes, but the observed improvements indicate that a tailored additive capable to increase SEI mechanical properties could have positive effects on cycling efficiency.
Fig. 8: Discharge capacity and coulombic efficiency vs. cycle number of SnCo-PM NW electrode in added with 5% VC at C/2 and 30 °C
Conclusions
183

13th Advanced Batteries, Accumulators and Fuel Cells Lithium-ions accumulators
Electrodeposition inside pores of commercial membranes is a feasible method for controlling composition, crystallinity and shape of nanostructured SnCo alloys. Depending on alloy characteristics, it is possible to obtain improved mechanical stability for tin-based anodes, even at high C-rate and different temperatures. In order to employ these anodes it is mandatory to improve coulombic efficiency for a long life of a well balanced LIB. VC was tested as additive in the electrolyte: while no advantages were detected to reduce irreversibility during the first cycle, it allows to reach faster a coulombic efficiency of about 98 %. Although this value is not enough for a practical application as anode in LIB, the search for a tailored additive seems to be the promising way for reaching the goal.
Acknowledgments
Authors thank CR Mobility Solution System S.r.l. for the financial support.
G. F. wishes to thank the organization committee of ABAF conference for kind invitation and support.
References
[1] 1 Sony news releases available at http://www.sony.net/SonyInfo/News/Press/200502/05-006E/ Retrieved 05 September 2012
[2] 2 M. Winter, J. O. Besenhard, M. E. Spahr, P. Novak, Adv. Mater., 10, 725 (1998) [3] 3 W-J. Zhang, J. Power Sources, 196, 13 (2011) [4] 4 C. K. Chan, H. Peng, G. Liu, K. McIlwrath, X. F. Zhang, R. A. Huggins, Y. Cui,
Nature Nanotechnol., 3, 31 (2008) [5] 5 J. Y. Huang, L. Zhong, C. M. Wang, J. P. Sullivan, W. Xu, L. Q. Zhang, S. X. Mao,
N. S. Hudak, X. H. Liu, A. Subramanian, H. Fan, L. Qi, A. Kushima, J. Li, Science, 330, 1515 (2010)
[6] 6 A. D. W. Todd, R. E. Mar, J. R. Dahn, J. Electrochem. Soc., 153, A1998 (2006) [7] 7 R. Alcántara, G. Ortiz, I. Rodríguez, J. L. Tirado, J. Power Sources, 189, 309
(2009) [8] 8 G. Ferrara, R. Inguanta, S. Piazza, C. Sunseri, J. Nanosci. Nanotechnol., 10, 8328
(2010) [9] 9 Y. Zhang, J. A. Abys, in Modern Electroplating, 4th Ed., M. Schlesinger and M.
Paunovic, Editors, p. 269, John Wiley & Sons, Inc., New York (2010) [10] 10 G. Ferrara, C. Arbizzani, L. Damen, M. Guidotti, M. Lazzari, F. G. Vergottini, R.
Inguanta, S. Piazza, C. Sunseri, M. Mastragostino, J. Power Sources, 211, 103 (2012)
[11] 11 S. S. Zhang, J. Power Sources, 162, 1379 (2006)
184

13th Advanced Batteries, Accumulators and Fuel Cells Supercapacitors
ASYMMETRIC CAPACITORS BASED ON CONDUCTING POLYMERS AND METAL OXIDE/CARBON COMPOSITES AS
ELECTRODES
Lota, K.1, Lota, G.1,2, Sierczynska, A.1, Kopczyk, M.1, Acznik, I.1
1 Institute of Non-Ferrous Metals Division in Poznan, Central Laboratory of Batteries and Cells, Forteczna 12, 61-362 Poznan, Poland
2 Institute of Chemistry and Technical Electrochemistry, Poznan University of Technology, 60-965 Poznan, Piotrowo 3, Poland
Corresponding author: Katarzyna Lota ([email protected]) Phone: + 48 61 2797808, Fax: + 48 61 2797897
Abstract
The electrochemical properties of asymmetric supercapacitors based on polyaniline/active carbon or polypyrrole and poly(3,4-ethylenedioxythophene) as well as manganese oxide composite/active carbon are discussed. The morphology of the materials was observed by SEM and TEM. The electrochemical measurements have been carried out using cyclic voltammetry (CV), galvanostatic charge/discharge and electrochemical impedance spectroscopy, performed in symmetric and asymmetric cells with 1 M H2SO4 and 1 M Na2SO4 as electrolytes. Asymmetric configuration with materials of different nature as positive (composite with MnO2, PANI) and negative electrode (activated carbon, PPy, PEDOT) gave a significant increase of operating voltage, affecting the power and energy density of the supercapacitor.
Introduction
Electrochemical capacitors (ECs) are energy storage devices with specific energy lower than batteries, while their specific power capabilities are higher than in case of batteries. There is a wide range of application of ECs such as electric vehicles, uninterruptible power supplies (UPS) or mobile devices. New trends for supercapacitor development are devoted to the application of materials with pseudocapacitance properties which store energy by fast and reversible faradaic reactions using, e.g., transition metal oxides, conducting polymers, carbons enriched by heteroatoms [1-3]. It was shown that a successful application of conducting polymers (ECPs) in supercapacitors technologies is possible in asymmetric configurations, i.e. with different materials of the electrodes [4]. MnO2 as a one of transition metal oxides, was also used as the positive electrode material, coupled with carbon material as the negative one [5]. In our work, materials with various electrochemical character were used as negative electrodes in asymmetric configuration, while PANI (polyaniline) and composite of carbon nanotubes and manganese oxide were chosen as positive electrode, mainly to overcome the problems with low voltage range in aqueous medium.
185

13th Advanced Batteries, Accumulators and Fuel Cells Supercapacitors
Experimental
The electrically conducting polymers such as polyaniline (PANI), polypyrrole (PPy) and poly(3,4-ethylenedioxythiophene) (PEDOT) were prepared by chemical method, i.e., oxidative polymerization of appropriate monomers. K2CrO4, FeCl3, and Fe(ClO4)3 were used as oxidizing agents. Because of limited solubility of EDOT, the process was performed in acetonitryle; for other polymers the process was carried out in aqueous, acidic medium. MnO2 was prepared using chemical method of synthesis from 0.1 M KMNO4 by very slow addition of C2H5OH to the solution. As a support for conducting polymers and metal oxide, commercial activated carbon Norit GSX (Alfa Aesar) and
carbon nanotubes Nts 7-15(O.D. 7-15 nm, I.D. 3-6 nm, length 0,5-200 µm, 95%, from Aldrich) were used. Composites were prepared by immersion of the activated carbon and carbon nanotubes into solutions of monomer and by addition of oxidant to subjected solution under intensive stirring. The proportion of components was estimated by weighing composite material in the dried state. Activated carbon, labeled KKLA was prepared by carbonization of commercial lignine (Aldrich) and then activated in KOH with a C:KOH ratio of 1:4. The morphology of the materials was characterized by scanning and transmission electron microscopy (SEM EVO®40 ZEISS and JEM 1200 EXII). Specific surface area measurements were performed using ASAP 2010 M instrument (Micromeritics). The electrochemical performance of obtained materials in symmetric and asymmetric capacitors were studied in two and three electrode Swagelok® systems using 1 M H2SO4 and 1M Na2SO4 solutions as electrolytes. The capacitor electrodes were formed as pellets with 85% of active material, 10% of binder (PVDF, Kynar Flex 2801) and 5% of acetylene black (to ensure good conductivity). Average mass of the electrodes in the form of pressed pellets was in range 12-15 mg. The specific capacitance of electrode materials was investigated by three electrochemical techniques: cyclic voltammetry (1-100 mVs-1), galvanostatic charging/discharging (100 mAg-1 - 50 Ag-1) and electrochemical impedance spectroscopy (100 kHz-1mHz) using potentiostat - galvanostat VMP2/Z (Biologic, France). The capacitance values were expressed per active mass of one electrode in case of symmetric and per average mass of both electrodes in asymmetric devices, respectively.
Results and discussion
Fig. 1 presents the nitrogen adsorption-desorption isotherms of two activated carbons and commercial carbon nanotubes. The adsorption isotherms of activated carbons represents type I isotherm in BDDT classification and indicate mainly microporous character of carbons. Isotherm recorded for carbon nanotubes is typical for mesoporous materials. The activated carbons are microporous (pore size < 2 nm) and have well developed surface area. The BET surface area ranges from 305 m2g-1 for Nts 7-15, to 836 m2g-1 for Norit and 2904 m2g-1 for KKLA.
186

13th Advanced Batteries, Accumulators and Fuel Cells Supercapacitors
0
100
200
300
400
500
600
700
800
0 0.2 0.4 0.6 0.8 1
V [
cm
3S
TP
/g]
P/Po
KKLA Norit Nts 7-15
Fig. 1: Nitrogen adsorption isotherms (77 K) of KKLA, Norit and Nts 7-15.
Fig. 2 presents SEM of the carbon materials: KKLA (a), NORIT GSX (b) and NTs 7-15(c).
The activated carbons prepared by carbonization of commercial lignine demonstrated the ball-shaped morphology with visible pores, while in Norit GSX image some traces of precursor are well visible. Distribution of the conducting polymer and metal oxide in the composites was also evaluated by SEM observation and in case of composites with carbon nanotubes by transmission electron microscopy as well. Fig. 3 presents SEM image of following composite materials: MnO2/Norit GSX (a) and SEM and TEM images of MnO2/NTs 7-15 (b) and PEDOT/NTs 7-15 (c), respectively. Composite with PEDOT is more homogenous than in case of manganese dioxide, which is synthesized rather as agglomerates.
Fig. 2: SEM images of: a) KKLA b) NORIT GSX c) NTs 7-15.
187

13th Advanced Batteries, Accumulators and Fuel Cells Supercapacitors
Fig. 3: SEM images of composite: MnO2/Norit GSX (a), and SEM and TEM images of composites: MnO2/NTs 7-15 (b) and PEDOT/NTs 7-15 (c).
The composite materials were thoroughly investigated by three electrochemical techniques in symmetric and asymmetric systems and a good correlation between measurements was found. An example of initial analysis of prepared electrode materials as electrochemical supercapacitors is shown in Fig. 4 (CV curves of MnO2/NTs 7-15). The electrochemical measurements by voltammetry technique in two electrode cell (10 mV/s) and three-electrode cell (5 mV/s) were made. Manganese dioxide was chosen as a cheap and environment friendly component of electrode material. Briefly, hydrated manganese dioxide is a promising material due to its pseudocapacitive behavior according to the following reaction:
MnOx(OH)y + e- + H
+ ↔ MnOx-δ (OH) y-δ
It has been already proved that this material due to its electrochemical stability in the positive range of potentials plays a perfect role as positive electrode in supercapacitor.
188

13th Advanced Batteries, Accumulators and Fuel Cells Supercapacitors
-0.1 0 0.1 0.2 0.3 0.4 0.5 0.6 0.7 0.8 0.9
-200
-150
-100
-50
0
50
100
150
-0.6 -0.5 -0.4 -0.3 -0.2 -0.1 0 0.1 0.2 0.3 0.4
U / V
C / F
g-1
E / V vs Hg/Hg2SO4
Fig. 4: Voltammetry characteristics of MnO2/NTs 7-15 composite in two-electrode system (10 mV/s) and in three-electrode system (5 mV/s).
Additionally, conducting polymers used in supercapacitor application utilize their reversible redox states to charge storage. In case of conducting polymers, capacitor assembly with the same material for both electrodes causes some limits in voltage range. In order to increase operating voltage with improvement of the capacitance values, different combinations of polymers and activated carbon working in various potential ranges were also tested.
PANI was chosen as material of positive electrode due to its electrochemical behavior connected with rapid loss capacity in the negative range of potential, whereas the other polymers and carbons are better candidates as materials for negative electrodes due to their electrochemical properties. Table 1 shows capacitance values for selected conducting polymers and activated carbons.
Table 1: Capacitance values evaluated in two and three electrode systems.
PANI PPY PEDOT KKLA NORIT GSX
Ctwo el. cell
[F/g] 203 214 93 174 79
Cel.
positive
[F/g]
422 199 80 160 80
Cel.
negative
[F/g]
85 253 105 194 89
Few systems were chosen for further measurements, performed in asymmetric cells. PANI or NTs7-15/MnO2 played a role of positive electrode. Fig. 5 presents the voltammetry characteristics of asymmetric capacitor combining NTs 7-15 MnO2/KKLA, recorded in two electrode cell. An asymmetric configuration with materials of different nature gave a significant increase of operating voltage. The values of capacitance for the NTs 7-MnO2//KKLA configuration in the range of potential 2.1 V is 180 F/g for 10 mV/s.
189

13th Advanced Batteries, Accumulators and Fuel Cells Supercapacitors
-300
-200
-100
0
100
200
300
400
0.0 0.5 1.0 1.5 2.0 2.5
C / F
g-1
U / V
0,9 V 1,1 V 1,3 V 1,5 V 1,7 V 1,9 V 2,1 V
Fig. 5: Voltammetry characteristics of asymmetric capacitor combining NTs 7-15 MnO2/KKLA.
The results showed that the highest value of capacitance in asymmetric device was obtained for PANI/KKLA configuration, with wide voltage window of 1.3 V. Voltammetry characteristics of considered electrodes in asymmetric capacitor built from PANI/KKLA with simultaneous increase operating voltage range are shown in Fig. 6. The CV curves are recorded for 3-electrode cell at 5 mV s-1 scan rate. The considerable growth of energy is connected with asymmetric type of capacitor. For the PANI/PEDOT configuration the voltage window of 1.2 V was obtained; unfortunately, for PANI/PPy arrangement has the voltage window was only 0.8 V (Fig. 7).
-700
-500
-300
-100
100
300
500
700
-1 -0.8 -0.6 -0.4 -0.2 0 0.2 0.4
C / F
g-1
E / V
0,8 V (+) 0,9 V (+) 1,0 V (+) 1,1 V (+) 1,2 V (+) 1,3 V (+)
0,8 V (-) 0,9 V (-) 1,0 V (-) 1,1 V (-) 1,2 V (-) 1,3 V (-)
Fig. 6: Voltammetry characteristics of asymmetric capacitor built from PANI/KKLA.
190

13th Advanced Batteries, Accumulators and Fuel Cells Supercapacitors
-500
-400
-300
-200
-100
0
100
200
300
400
500
0 0.2 0.4 0.6 0.8 1 1.2
C /
F g
-1
U / V
Fig. 7: Voltammetry characteristics of asymmetric capacitor built from PANI/PPy. The CV curves are made for 2-electrode cell at 10 mV s-1 scan rate.
The considerable growth of energy is connected with asymmetric configuration. Fig. 8 presents a Ragone plot for asymmetric capacitors operating in 1M Na2SO4 solution, assembled in NTs 7- MNO2/ KKLA configuration and for PANI/KKLA operating in 1 M H2SO4, respectively. The specific energy (E) and power (P) were calculated by following equations from galvanostatic measurements:
E=1/2C*U2 (Whkg-1) [1]
P=1/2I*U (Wkg-1) [2]
where C is specific capacitance of asymmetric capacitor, U is the operating voltage and I is applied current density.
0.1
1
10
1 10 100 1000 10000
E / W
h k
g-1
P / W kg-1
NTs 7-15 MnO2 / KKLA PANI / KKLA
Fig. 8: Ragone plot for asymmetric capacitors: NTs 7- MNO2/KKLA and PANI/KKLA configurations.
191

13th Advanced Batteries, Accumulators and Fuel Cells Supercapacitors
The cycling stability upon charge/discharge current load of 2 A/g for asymmetric arrangements were performed and are presented in Fig. 9. The results showed that configuration PANI/KKLA provided high value of capacitance (comparing to the pristine materials) and the drop of capacitance after 5000 cycles is ca. 16%, in voltage range 1 V. In case of asymmetric capacitor, NTs 7- MNO2/KKLA, the drop of capacitance after 5000 cycles is only 8% and stable value of capacitances ca. 120 F/g in voltage range of 1.1 V was observed.
0
50
100
150
200
250
300
350
0 1000 2000 3000 4000 5000
C / F
g-1
cycle
NTs 7-15 MnO2 / KKLA (1.1 V) PANI / KKLA (1.0 V) NTs 7-15 MnO2
PANI KKLA 1 M Na2SO4 KKLA 1 M H2SO4
Fig. 9: Cyclability for different asymmetric configuration and pristine materials.
The cycling performances of asymmetric capacitor PANI/KKLA were confirmed by the electrochemical impedance spectroscopy measurements for positive and negative electrodes. Fig. 10 shows dependences of capacitance versus frequency, before and after 5000 cycles of charge/discharge.
0
50
100
150
200
250
300
350
400
450
0.001 0.01 0.1 1 10 100 1000 10000 100000 1000000
C / F
g-1
f / Hz
(-) before cycling (+) before cycling (-) after cycling (+) after cycling
Fig. 10: Capacitance versus frequency dependence, recorded before and after cycling (5000 cycles – I = 2 A/g) for asymmetric capacitor PANI/KKLA.
192

13th Advanced Batteries, Accumulators and Fuel Cells Supercapacitors
The capacitance value of positive electrode increases after cycling value of negative electrode decreases negligibly.
Conclusion
The results showed that PANI and NTs 7-MnO2 composite provided the highest value of capacitance as positive electrode whereas the other polymers and activated carbons should be used as negative electrodes, rather due to their electrochemical properties. The highest value of capacitance in asymmetric device was obtained for PANI/KKLA configuration, giving also wide voltage window of 1.3 V. The considerable growth of energy is closely related with asymmetric system of capacitor. The results of cyclability showed that such configuration provided high value of capacitance (comparing to the pristine materials) and the drop of capacity after 5000 cycles with high current regime 2 A/g (in voltage window 1 V) is 18%. For the PANI/PEDOT configuration, the voltage window of 1.2 V was obtained, unfortunately, accompanied by the lowest values of capacitance. The results of cyclability showed that configuration PANI-PPy provided very high values of capacitance but optimal voltage is relatively low, i.e., 0.8 V. The values of capacitance for the manganese dioxide/carbon nanotubes composite and activated carbon in asymmetric system are 180 F/g in the quite wide voltage range of 2.1 V.
Acknowledgements
The authors acknowledge the financial support from the European Fund of Regional Development within the frameworks of the operating program –"Innovative Economy 2007–2013", under Project No. POIG.01.01.02-00-015/09.
References
[1] G.A. Snook,P. Kao, A.S. Best, J Power Sources, 196,1 (2011) [2] E. Frackowiak, V. Khomenko, K. Jurewicz, K. Lota, F. Beguin J. Power Sources, 153,
413 (2006) [3] T. Tomko, R. Rajagopalan, P. Aksoy, H. C. Foley, Electrochim. Acta, 56, 5369 (2011) [4] J.H. Park,O.O. Park, J. Power Sources, 111, 185 (2002) [5] L. Demarconnay, E. Raymundo-Pinero, F. Beguin J. Power Sources, 196, 580 (2011)
193

13th Advanced Batteries, Accumulators and Fuel Cells Supercapacitors
CARBON NANOTUBES AS A SUPPORT OF ELECTRODE ACTIVE MATERIAL FOR ELECTROCHEMICAL CAPACITORS
Lota, K.1, Lota, G.1,2, Sierczynska, A.1
1 Institute of Non-Ferrous Metals Division in Poznan, Central Laboratory of Batteries and Cells, Forteczna 12, 61-362 Poznan, Poland
2 Institute of Chemistry and Technical Electrochemistry, Poznan University of Technology, 60-965 Poznan, Piotrowo 3, Poland
Corresponding author: Katarzyna Lota ([email protected]) Phone: + 48 61 2797808, Fax: + 48 61 2797897
Abstract
The composites consisting of carbon nanotubes with conducting polymers, i.g., polypyrrole (PPy), polyaniline (PANI) and metal oxide (NiO) have been tested as electrode materials for electrochemical capacitors. Different kinds of carbon nanotubes played a role of conducting support for homogenous distribution of pseudocapacitive components in the composite. Additionally, carbon nanotubes can protect conducting polymers from mechanical changes during cyclic charging/discharging. The highest value of capacitances were obtained for conducting polymers without additives of carbon nanotubes, but on the other hand, carbon nanotubes network allows applying such high current regime as 50 A/g, confirmed by cyclability measurements.
Introduction
Electrochemical capacitors ECs called sometimes supercapacitors have generated great interest because of their unusual capacitances, high power densities and long cycle life. There are a number of electrode materials being developed for electrochemical capacitors. Various carbon materials have been considered for electrode material, mainly with well developed surface area. Carbon nanotubes – both single and multi-walled – were used as electrode materials [1-4]. New trends for materials applied in supercapacitors are connected with application of pseudocapacitance properties associated with fast and reversible surface redox-type reactions, using transition metal oxides or conducting polymers; materials such as carbon nanotubes or graphenes could provide good charge propagation and can be used as a support and additive for different composite electrode materials [5-7]. In this work the capacitance properties of carbon nanotubes (CNTs) and their composites with conducting polymers and metal oxides as electrode materials for electrochemical capacitors are discussed.
Experimental
Commercial MWNTs (multi wall nanotubes) O.D. 10-15 nm (Aldrich)- purity > 90%, MWNT O.D. 110-170 nm (Aldrich)- purity > 90% were used as carbon nanotubes support. MWNTs Ni-Al were obtained by catalytic decomposition of acetylene at 6000C on
194

13th Advanced Batteries, Accumulators and Fuel Cells Supercapacitors
NiO/Al2O3 solid solution catalyst. The process allows MWNTs to be produced with small amount of disordered carbon at a quite large scale (the notification of the Polish patent P.394741). The electrically conducting polymers such as polyaniline (PANI), polypyrrole (PPy) and poly(3,4-ethylenedioxythiophene) (PEDOT) were prepared using chemical method of oxidative polymerization of the suitable monomers on different carbon nanotubes. Nickel oxide/carbon composite was prepared by direct chemical precipitation of nickel hydroxide on carbon nanotubes from the 0,5 M Ni(NO3)2 solution and then composites were calcinated (heated at 300°C in the air for 2 hours). The proportion of components was estimated by weighing composite material in the dried state. The morphology of the materials was characterized by scanning and transmission electron microscopy (SEM EVO®40 ZEISS and JEM 1200 EXII). Specific surface area measurements were performed using ASAP 2010 M (Micromeritics) instrument. The electrochemical performance of obtained materials in symmetric capacitors was studied in two and three electrode Swagelok® systems using 1 M H2SO4 or 6 M KOH as an electrolytes. The specific capacitance of electrode materials have been obtained using three electrochemical techniques: cyclic voltammetry (1-200 mVs-1), galvanostatic charging/discharging (50 mAg-1 - 10 Ag-1) and electrochemical impedance spectroscopy (100 kHz-1mHz) using potentiostat-galvanostat VMP2/Z (Biologic, France). The capacitance values were calculated per active mass of one electrode.
Results and discussion
Fig. 1 presents the nitrogen adsorption-desorption isotherms of different kinds of carbon nanotubes. All samples show an adsorption isotherm classified as type IV, according to BDDT classification, typical for mesoporous materials. The hysteresis loop of NTs Ni-Al and NTs 10-15 could be ascribed to type A, according to de Boer classification, which indicates mainly tubular capillaries in a mesoporous material. The BET surface area ranges from 18 m2g-1 for Nts 110-170 to 107 m2g-1 for NTs Ni-Al and 137 m2g-1 for Nts 10-15, respectively.
0
50
100
150
200
250
300
350
400
450
0 0.2 0.4 0.6 0.8 1
V [
cm
3 S
TP
/g
]
P/Po
NTs 110-170 NTs Ni-Al NTs 10-15
Fig. 1: Nitrogen adsorption isotherms (77 K) of NTs 110-170, NTs Ni-Al and Nts 10-15.
195

13th Advanced Batteries, Accumulators and Fuel Cells Supercapacitors
The SEM images of composites with different kinds of carbon nanotubes were divided into three figures. Fig. 2 presents SEM images of NTs 10-15 and composites with different amount of polypyrrole. During polymerization particles of PPy on carbon nanotubes form fibrous structures. Together with increase of polymer’s amount in composite, the structure of polypyrrole becomes more agglomerative. Distribution of the conducting polymers (PANI and PEDOT) in the composites with NTs Ni-Al was also evaluated by SEM and TEM observation - Fig. 3. Composites with polymers are more homogenous than in case of nickel oxide, which is synthesized rather as agglomerates. It could be well observed in Fig. 4, which presents SEM images of NTs 110-170 and their composite with NiO.
Fig. 2: SEM images of MWNT10-15 (a) and composites with different amount of PPy: 67% as (b), 81% as (c) and 86% (d).
Fig. 3: SEM and TEM images of composites MWNT Ni-Al with PANI (a) and PEDOT (b).
196

13th Advanced Batteries, Accumulators and Fuel Cells Supercapacitors
Fig. 4: SEM images of: a) MWNTs 110-170 nm; b) MWNTs 110-170/NiO composite.
The carbon nanotubes and composite materials were thoroughly investigated by three electrochemical techniques in symmetric systems and a good correlation between measurements was found. Galvanostatic charging/discharging (50 mA/g - 10 A/g) measurements for symmetric capacitor with electrodes from carbon nanotubes and conducting polymers were made. Fig. 5 shows capacitance values versus current load dependence. The highest values of capacitance upon current load 50 to 100 mA/g were obtained for PANI, whereas high current regimes causes dramatic capacitance fade. However, all samples of carbon nanotubes are characterized by stable but very small values of capacitances.
0
50
100
150
200
250
300
350
0 2 4 6 8 10 12
C / F
g-1
I /Ag-1
Nts 10-15 Nts 110-170 NTs Ni-Al PANI PPy PEDOT
Fig. 5: Capacitance values versus current load for carbon nanotubes and conducting polymers.
Carbon nanotubes as a supported network, provide good charge propagation and can be used as an additive for different composite electrode materials. The cycling stability upon charge/discharge current load of 2 A/g for composites polypyrrole with different amount of carbon nanotubes were performed and are presented in Fig. 6. The results indicate that configuration PPy/14% NTs 10-15 provided high value of capacitance (comparing to the pristine materials) and the drop of capacity after 5000 cycles is ca. 22%, in voltage range of 0.8 V. The smallest drop of capacitance value after 5000 cycles was observed for composite with the highest amount of carbon nanotubes – only 15%. Nevertheless, the capacitance values were less significant, due to the smaller amount of polypyrolle, which is responsible for high capacitances related with pseudocapacitive effects.
197

13th Advanced Batteries, Accumulators and Fuel Cells Supercapacitors
0
20
40
60
80
100
120
140
0 1000 2000 3000 4000 5000 6000
C/F
g-1
cycle
14% NTs 10-15 19% NTs 10-15 33% NTs 10-15 1
Fig. 6: Cyclability of PPy composite with NTs 10-15 with current regime 2 A/g.
The electrochemical performances of obtained composites were studied using cyclic voltammetry technique with different scan rates (1-200 mVs-1) in two electrode
cell and three-electrode cell. An example of CV analysis of prepared electrode materials as electrochemical supercapacitors is shown in Fig. 7 (CV curves of NiO/MWNTs 110-170).
-150
-100
-50
0
50
100
150
-0.6 -0.4 -0.2 0 0.2 0.4
C / F
g-1
E / V vs Hg/HgO
negative electrode positive electrode
Fig. 7: Voltammetry characteristics of composite NiO/MWNTs 110-170 in three-electrode system (5 mV/s) operating in 6 M KOH electrolyte solution.
In case of composite NiO/MWNTs 110-17 the higher values of capacitance were obtained for negative electrode, whereas positive electrode works in wider potential range. The example of capacitances recorded for polyaniline and composites with different amount of carbon nanotubes are shown in Table 1. The highest value of capacitances were obtained for conducting polymer without additives of carbon nanotubes. However, addition of
198

13th Advanced Batteries, Accumulators and Fuel Cells Supercapacitors
carbon nanotubes allows to use fast scan rates and does not lead to destroy of electrode materials using such high regimes.
Table 1: Capacitance values evaluated in two electrode systems for PANI and PANI/different carbon nanotubes composites from cyclic voltammetry in 1 M H2SO4.
CV PANI
[Fg-1
]
PANI-
NTs Ni-Al
[Fg-1
]
PANI-
NTs 10-15
[Fg-1
]
PANI-
NTs 110-170
[Fg-1
]
1 mV/s 333 285 236 165
2 mV/s 258 255 198 145
5 mV/s 181 216 163 115
10 mV/s 126 180 142 92
20 mV/s 81 143 126 71
50 mV/s 39 93 106 74
100 mV/s 21 60 91 51
200 mV/s - 39 77 32
The electrochemical performances of composite materials were confirmed by the electrochemical impedance spectroscopy measurements. Fig. 8 shows dependence of capacitance versus frequency for polypyrrole composites.
0
20
40
60
80
100
120
140
160
180
200
0.001 0.01 0.1 1 10 100 1000 10000 100000
C / F
g-1
f / Hz
33% Nts 10-15 19 % NTs 10-15 14% NTs 10-15
Fig. 8: Capacitance versus frequency dependence for PPy composites with NTs 10-15.
The results showed that configuration of PPy/14% NTs 10-15 provided high value of capacitance, however, for frequencies 1 -10 Hz the highest value of capacitances are obtained for composite with 33% of carbon nanotubes.
199

13th Advanced Batteries, Accumulators and Fuel Cells Supercapacitors
Conclusion
Carbon nanotubes show moderate values of capacitance (for current regime 50 mA/g : 0,3 F/g for NTs 110-170, 2 F/g for NTs Ni-Al and 12 F/g for NTs 10-15). In the form of a network, the material provides good charge propagation and can be used as a good support and additive for different composite electrode materials. The highest value of capacitances were obtained for conducting polymers without additives of carbon nanotubes. Nevertheless, carbon nanotubes network allows using such high current regime as 50 A/g, what was additionally confirmed by cyclability measurements (5000 cycles with current regime of 2 A/g). Carbon nanotubes in each composites play a role as conducting matrix.
Acknowledgements
The authors acknowledge the financial support from the European Fund of Regional Development within the frameworks of the operating program –"Innovative Economy 2007–2013", under Project No. POIG.01.01.02-00-015/09.
References
[1] J.H. Chen, W.Z. Li, D.Z.Wang, S.X. Yang, J.G. Wen, Z.F. Ren, Carbon, 40, 1193 (2002)
[2] Ch. G. Liu, H.T. Fang, F. Li, M. Liu, H. M. Cheng, J. Power Sources, 160, 758 (2006) [3] R. Z. Ma, J. Liang, B.Q. Wei, B. Zhang, C.L. Xu, D.H. Wu, J. Power Sources, 84, 126
(1999) [4] Ch. Hu, J. Su, T. Wen J. Phys. Chem. Solids, 68, 2353 (2007) [5] T. Bordjiba, D. Belanger, Electrochim. Acta, 55, 3428 (2010) [6] Ch. Hsieh, Y. Chou, W. Chen, J Solid State Electrochem., 12, 663 (2008) [7] B. Yi, X. Chen, B. Zeng, K. Guo, Z. Wan, Q. Qian, H. Yan, J. Chen, J Porous Mater.,
19, 37 (2012)
200

13th Advanced Batteries, Accumulators and Fuel Cells Alkaline accumulators
INVESTIGATION OF ELECTROCHEMICAL PROPERTIES OF AB2/AB5-TYPE HYDROGEN STORAGE ALLOYS AS ANODIC
MATERIALS FOR HIGH ENERGY Ni-MH CELLS
Sierczynska, A.1, Swoboda, P.1, Lota, K.1, Lota, G.1,2, Kopczyk, M.1
1 Institute of Non-Ferrous Metals Division in Poznan, Central Laboratory of Batteries and Cells, Forteczna 12, 61-362 Poznan, Poland
2 Institute of Chemistry and Technical Electrochemistry, Poznan University of Technology, 60-965 Poznan, Piotrowo 3, Poland
Corresponding author: Pawel Swoboda ([email protected]) Phone: +48 61 2797800 Fax: +48 61 2797897
Abstract
Multicomponent alloys used as electrode material in NiMH cells should reversibly absorb hydrogen and be characterized with low self-discharge. The major criteria for application of those alloys as M/MH electrode material for recharge NiMH batteries are as follows: the capacity of the alloy in hydrogen absorption-desorption process, chemical stability in concentrated alkaline solutions, electrode reaction kinetics and fast activation time of the alloy. Those parameters are strongly dependent on the method used to acquire the alloy and its chemical composition.
In the conducted research the electrochemical parameters of 10 multicomponent AB2 and AB5 type alloys, obtained by arc melting, were examined. The tests were conducted to determine the specific capacity of hydrogen absorption desorption process, the reversibility of the electrode reactions and the reaction kinetics. The electrochemical measurements have been carried out using galvanostatic charge/discharge method with different current densities and cycling voltammetry.
Introduction
Multicomponent alloy, due to their ability to reversibly absorb hydrogen are used as M/MH electrodes in Ni-MH batteries. The charge/discharge reaction for those batteries should be highly reversible, therefore the hydrogen bond between hydrogen and the alloy should be moderately strong. In Ni-MH batteries produced today, two major groups of multicomponent alloys are used: AB5 and AB2 type. In practical use of the batteries, high current densities are used both for charge and discharge process, therefore the speed of electrochemical reaction of adsorption/desorption of the hydrogen and the diffusion speed from electrode/electrolyte should be high. Evaluation of the alloy materials usefulness, includes determination of: real capacity of the alloy in hydrogen absorption/desorption process in pressure range from 0.001MPa to 0.5MPa, phase composition and change in lattice parameters caused by hydrogen absorption process, chemical stability of the alloy in concentrated electrolyte solution, proper electrode reaction kinetic, and fast activation ability for the alloy. In this work the electrochemical parameters of 10 multicomponent AB5 and AB2 type alloys, obtained by arc melting, were examined.
201

13th Advanced Batteries, Accumulators and Fuel Cells Alkaline accumulators
Experimental
Multicomponent alloys of mentioned formulas in the Table 1 were prepared in arc furnace in argon atmosphere using the mixture of pure metals in proper atomic proportions. The casting was carried out in the Bühler arc furnace using a water-cooled copper crucible. The electrode material was produced by mechanical grinding in a hydraulic press followed by proper crushing to fine powder via cyclic hydrogen absorption/desorption from gaseous phase. The electrodes with hydrogen reversibly absorbing alloys were prepared by mixing the alloy powder (0.04 - 0.08 mm grain size) with 10 wt.% addition of carbonyl nickel. The electrode support was nickel foam, 500 g/m2 density and 1.6 mm thickness. The binder was a 3% water solution of polyvinyl alcohol. The anodic mass was mixed and pasted on both sides of the electrode support. The support's surface was 1cm2 and before the pasting it had been degreased. Pasted electrodes were dried in 70o C to stable mass and then pressed under 40 MPa.
Table 1: Chemical compositions of the investigated alloys
Chemical formulas Designation Type
Haucke phase
MmNi4.5Al0.5 1-A AB5
LmNi4.78Mn0.22 1-B AB5
MmNi3.55Al0.3Mn0.4Co0.75 1-C AB5
MmNi3.6Al0.4Mn0.3Co0.7 1-D AB5
MmNi3.35Al0.3Mn0.4Co0.75 1-E AB4.8
MmNi3.2Al0.2Mn0.6Co1.0 1-F AB5
Laves phase
ZrCr0.8Ni1.2 1-G AB2
Zr0.9Ti0.1Mn0.6V0.2Co0.1Ni1.1 1-H AB2
Zr0.9Ti0.1Mn0.6V0.2Cr0.05Co0.05Ni1.2 1-I AB2.1
Zr0.5Ti0.5V0.68Mn0.68Cr0.34Ni0.7 1-J AB2.4
The electrochemical properties, such as a specific capacity, charge efficiency, and cycleability were characterized by the galvanostatic charge/discharge cycling and cyclic voltammetry in the half-cells. The experimental cell for electrochemical measurements consisted of the working M/MH electrode, an excess Ni(OH)2/NiOOH electrode as the counter electrode and the reference Hg/HgO/6M KOH electrode. The electrolyte was 6M KOH solution, and measurements were performed at room temperature. Before proper electrochemical testing working electrodes composed of metal hydride electrode (MH) were chemically pre-activated by boiling in 6MKOH solution and then the constant current charge/discharge measurements were performed at current density i = 40 mAg−1. The charge process was conducted till the beginning of the hydrogen evolution on electrode. After 1 h of a rest pause to potential equilibrium, the electrode was discharged to the −0.7 V potential.
The galvanostatic charge/discharge measurements and the cyclic voltammetry (CV) tests were performed using an VMP3 BioLogic Science Instruments system.
202

13th Advanced Batteries, Accumulators and Fuel Cells Alkaline accumulators
Results and discussion
Cycling stability of the tested electrodes made with AB5 type alloy calculated on mass of alloy are shown in Fig. 1. The highest discharge capacity (265 mAhg-1 of alloy) were obtained for electrode prepared with 1C alloy (MmNi3.55Al0.3M.0.4 Co0.75). Discharge capacity of electrodes made with other alloys did not exceed 150 mAhg-1 of alloy (Fig. 1).
0
50
100
150
200
250
0 2 4 6 8 10 12 14 16 18 20
Cycle number
Dis
char
ge c
apac
ity
/ m
Ah
g-1
allo
y
1-A 1-B 1-C 1-D 1-E 1-F
Fig. 1: Discharge capacity for tested electrodes made with AB5 type alloy
On the Figure 2 typical discharge curves for tested electrodes made with AB5 type alloy estimated at 10th cycle are presented. The most stable work potential with the plateau of proper shape was obtained by the electrode prepared with 1C alloy. Also those electrodes presented the longest discharge time (almost 6 hours which gives the efficiency of the electrode about ~ 98%).
Cyclic voltammograms for the electrodes made with AB5 type alloys are shown in Fig. 3. For each electrode oxidation/reduction cycles were made in the potential range Es→-0.4V→-1.0V→Es vs. Hg/HgO/6MKOH (Es – the rest potential) at a scan rate of 0.1 mVs−1.
203

13th Advanced Batteries, Accumulators and Fuel Cells Alkaline accumulators
-1.0
-0.9
-0.8
-0.7
0 1 2 3 4 5 6
Time / h
Po
ten
tial
vs.
Hg/
HgO
/ V
1-A 1-B 1-C 1-D 1-E 1-F
Fig. 2: Typical discharge characteristic for tested electrodes made with AB5 type alloy at 10th cycle
-250
-200
-150
-100
-50
0
50
100
150
200
-1 -0.9 -0.8 -0.7 -0.6 -0.5 -0.4
Potential vs .Hg/HgO / V
Cu
rre
nt
de
nsi
ty /
mA
g-1
1-A 1-B 1-C 1-D 1-E 1-F
Fig. 3: Voltammetric curves of the tested electrodes made with AB5 type alloy (Es→ -0.4V→ -1.0V→Es; dV/dt = 0.1 mV/s)
On the voltammetric graph for the electrodes made with tested AB5 type materials (Fig. 3) the peaks for metal-hydride creation are not visible because of the simultaneously occurring hydrogen evolution which generates strong current. Sharp desorption peaks indicate for proper stability of the occurring metal-hydride.
204

13th Advanced Batteries, Accumulators and Fuel Cells Alkaline accumulators
0
50
100
150
200
250
0 2 4 6 8 10 12 14 16 18 20
Cycle number
Dis
char
ge c
apac
ity
/ m
Ah
g-1
allo
y
1-G 1-H 1-I 1-J
Fig. 4: Discharge capacity for tested electrodes made with AB2 type alloy
Cycling stability of the tested electrodes made with AB2 type alloy calculated on mass of alloy are shown on Fig. 4. All electrodes prepared from AB2 type alloys were presenting similar maximum discharge capacity at level 200-230 mAhg-1 of alloy material. The highest capacity was obtained by electrodes with 1H alloy of formula (Zr0.9Ti0.1Mn0.6V0.2Co0.1Ni1.1). The capacity of electrode from 1H alloy was stabilizing for a long time, until 10th cycle it was rising. Discharge capacity of electrodes made with 1G and 1I alloys started to drop after 10th cycle.
As can observe in Fig. 5, the electrodes with AB2 type alloys were in general presenting better potential plateau then electrodes with AB5. Electrodes prepared with 1H alloy presented high and stable work potential, also they reached the longest discharge time from all AB2 alloys electrodes (above 5 hours which gives the efficiency of the electrode about ~ 87%).
205

13th Advanced Batteries, Accumulators and Fuel Cells Alkaline accumulators
-1.0
-0.9
-0.8
-0.7
0 1 2 3 4 5 6
Time/ h
Po
ten
tial
vs.
Hg/
HgO
/ V
1-G 1-H 1-I 1-J
Fig. 5: Typical discharge characteristic for tested electrodes made with AB2 type alloy at 10th cycle
-400
-300
-200
-100
0
100
200
300
-1 -0.9 -0.8 -0.7 -0.6 -0.5 -0.4
Potential vs. Hg/HgO /V
Cu
rre
nt
de
nsi
ty /
mA
g-1
1-G 1-H 1-I 1-J
Fig. 6: Voltammetric curves of the tested electrodes made with AB2 type alloy (Es→ -0.4V→ -1.0V→Es; dV/dt = 0.1 mV/s)
As can see in Fig. 6, the peak of metal-hydride development is not visible, similarly with electrodes with AB5 alloys. Sharp desorption peak for the electrode with 1H alloy, indicate for proper stability of the metal-hydride, the other electrodes presented blurred and flat peaks;
206

13th Advanced Batteries, Accumulators and Fuel Cells Alkaline accumulators
For comparison, in the Figure 8 presents a summary the specific capacity of all tested alloy materials. Presented relationship confirms earlier observations.
2111
265
10193
68
199
229
200213
0
50
100
150
200
250
300
1-A 1-B 1-C 1-D 1-E 1-F 1-G 1-H 1-I 1-J
Dis
char
ge c
apac
ity
/ m
Ah
g-1
Fig. 7: Comparison of maximum values of discharge capacity for all of the tested electrodes
Conclusions
From all of the AB5 type alloys the highest capacity (265 mAh/g of alloy) was obtained for electrode with 1C alloy (MmNi3.55Al0.3Mn0.4Co0.75);
Activation time of this 1C electrode was short, after 3rd charge/discharge cycle the electrode had presented its maximum capacity and the discharge characteristic showed the best formed plateau for this electrode;
The CV tests showed proper reversible Me-H bond stability for 1C alloy, and the cycling charge/discharge tests showed good stability in a concentrated electrolyte;
The discharge capacity of electrodes with AB2 type alloy were close to each other, at values from 200 to 230 mAh/g of alloy;
The highest capacity (230mAh/g of alloy) for AB2 electrodes was obtained for the electrodes with 1H alloy (Zr0.9Ti0.1Mn0.6V0.2Co0.1Ni1.1), the maximum capacity of this electrode was reached after 10th cycle, which indicates slow activation of this material;
Acknowledgements
The authors acknowledge the financial support from the European Fund of Regional Development within the frameworks of the operating program –"Innovative Economy 2007–2013", under Project No. POIG.01.03.01-00-086/09.
207

13th Advanced Batteries, Accumulators and Fuel Cells Alkaline accumulators
EFFECT OF COBALT ADDITION ON STRUCTURE AND ELECTROCHEMICAL BEHAVIOUR OF NICKEL HYDROXIDE
SYNTHESIZED BY CHEMICAL PRECIPITATION METHOD UNDER DIFFERENT CONDITIONS
Máca1,2, T., Nezgoda1, L., Vondrák2, J., Sedlaříková2, M.
1 Bochemie Inc., RD Department, Lidická 326, 735 95 Bohumín 2 Department of Electrical and Electronic Technology, Brno University of Tecnology,
Technická 10, 616 00 Brno, Czech Republic
Corresponding author: Tomáš Máca ([email protected]) Phone: +420 596 09 147
Abstract
This paper relates to research work focused on utilization of nickel hydroxide with improved electrochemical properties in rechargeable alkaline batteries where it is used as a positive material.
A treatment of chemical composition, i.e. cobalt amount, and synthesis conditions of nickel hydroxide were carried out for purposes of the product optimizing ensuring excellent electrochemical parameters and their durability in long-term cycling process. Set of several samples with variously modified molar ratios of cobalt to nickel as well as precipitated from mixed nickelous and cobaltous salt solutions in different concentrations of alkaline hydroxide solutions was prepared. We applied cobalt as two species, primarily incorporated through co-precipitation and secondary as surface modification/coating of particles Ni(OH)2. In this way prepared samples have been electrochemically tested.
Introduction
Nickel hydroxide is used as an electrochemically active component of accumulator masses for positive electrode of Ni-Cd, Ni-MH and Ni-Zn alkaline accumulators.
From morphological point of view there are two basic versions of nickel hydroxide known as crystallographic modifications, alpha phase and beta phase. The latter having regularly arranged structure of brucite type (with basal lattice parameter c = 4.6 Å and density 3.85 g.cm-3) is in a substance of pure simple Ni(OH)2. The compactness of perfectly crystallized pure beta Ni(OH)2 interferes its electrochemical activity. Hence, the lattice must always involve a failure rate. Strongly defective crystals formed from faulty nucleus growth will induce significantly facilitated H+ protons diffusion during the cycling process. Such particles are signed as badly crystallized beta hydroxide. In accordance with depicted Bode´s diagram below, intensive overcharging of beta systems leads to „low-density“ gamma phase which includes even hydrated oxides of tetravalent nickel. However, the presence of such compounds is very temporal because of their enormous instability and easy decomposition tendency accompanied by oxygen evolution. This issue is
208

13th Advanced Batteries, Accumulators and Fuel Cells Alkaline accumulators
reflected in discharge curves as a rapid initial cell voltage falling after finished charging without any capacity contribution.
Alpha nickel hydroxide attains a superior performance compared to commonly produced beta hydroxides in consequence of its transition ability to nickel in tetravalent state (although partially) in stabilized forms and thereby they gain higher capacity from the same nickel content.
Alpha nickel hydroxide is rather more complicated intercalate compound comprising of variable stages of hydration. Compound with idealized composition and simplified formula 3Ni(OH)2 .2H2O (specific weight is about 2.5 g.cm-3) is quite unstable in alkaline medium
and easily transforms to -Ni(OH)2. Therefore, it is necessary to find the solution of structure stabilization.
Therefore a wide group of layered double hydroxides (LDH) with partially substituted nickelous ions by suitable trivalent stabilizing cations (most often Al3+) is considered to be alpha nickel hydroxide. An addition of aluminium just seems to be just the most frequent doping according to the most of published reports. Chemical composition of LDH can be expressed by the summary formula NiII1-xM
IIIx(OH)2A
n-x/n.yH2O , where „MIII“ is generally
trivalent metal cation and „An-“ is n-valent anion. The LDH structure is again derived from layered lattice of brucite type with the same hexagonal configuration as a beta phase but having different.lattice constant „c“ equal 8-10 Å, i.e. about twice as β-Ni(OH)2. Moreover, alfa structure exhibits turbostratic feature with the randomly oriented sheets of each other in one of the main directions while a constant intersheet distance is kept. A replacement of nickelous ions Ni2+ by trivalent metal cations Me3+ imparts excess of positive charge to primarily electroneutral layers is mentioned. The positive charge excess is directly proportional to range of cation substitution and it is compensated by the charge of hydrated anions being placed in an intersheet region. There is an electrostatic attraction (coulombic forces) between alternating hydroxide sheets [Ni1-xMx
III (OH)2]x+ and interlayer
space of hydrated anions [An-x/n.yH2O]x-. Better intersheet region´s permeability improves
mobility of ions there, especially H+ protons. Consequently, over one-electron exchange can be expected since the number of exchanged electrons during the charge/discharge process is equivalent to the number of H+ protons which are removed from hydroxide sheets or inserted into them, respectively. The overall electrochemical reaction can be understood as proton deintercalation and intercalation reactions.
The gamma phase formed by charging of alpha nickel hydroxide represents a mixture of trivalent and tetravalent nickel as hydrated oxides where contained tetravalent nickel is stabilized by corresponding amount of intercalated anions (including OH- anions from the electrolyte) to ensure charge equilibrium. For that reason, an electrochemical reactivity of
alpha nickel hydroxide should overcome that of -Ni(OH)2.
The unquestionable advantage of the „/“systems is that material can be electrochemically cycled without having perceptible volumetric changes. The outstanding feature is the effectual overcharging tolerance as well. It is caused by very close lattice constants for both of the redox couple components. On the other hand the overcharging of
β(II)/β(III) systems turns βNiO.OH into „low-density“ γNiOx.nH2O (where x 1.5 ; 1.8
). This conversion is joined by crystal lattice expansion along „c-axis“ , which brings about strong strain inside the lattice as much as irreversible damage of the lattice at the periodic overcharging . As a result of this behaviour we observe a bigger electrode thickness (it swells), rapid capacity falling and considerable cycle life reducing.
209
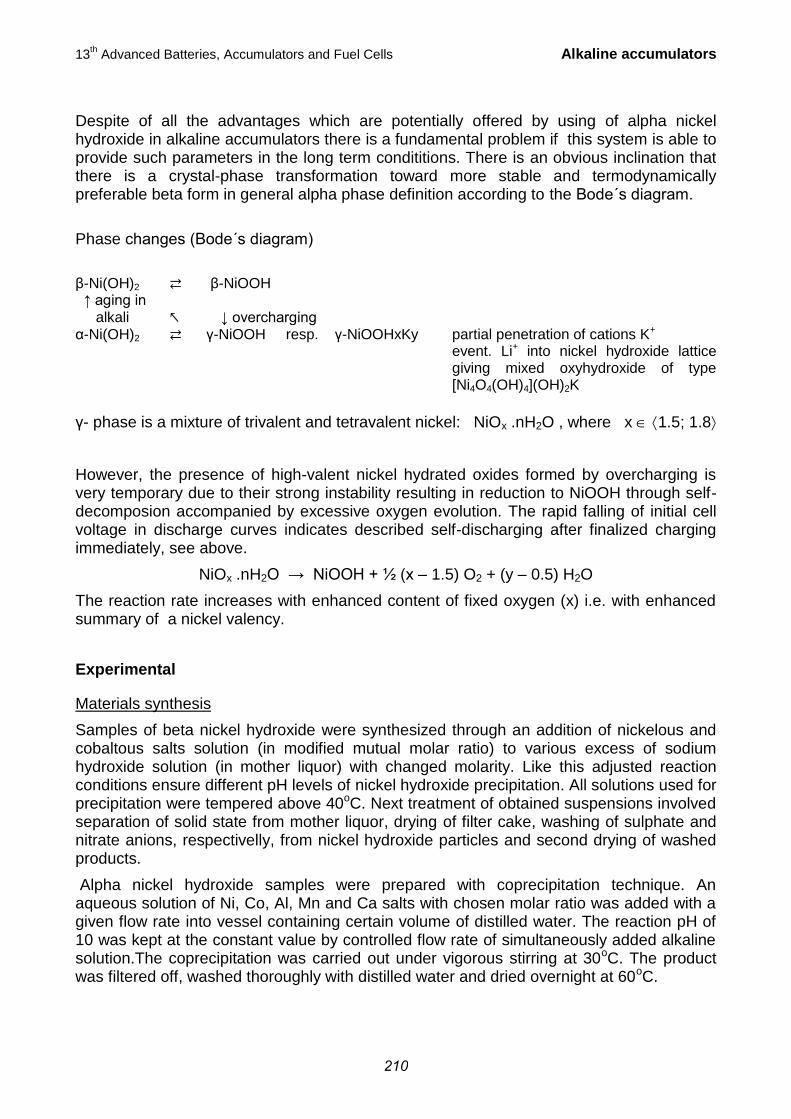
13th Advanced Batteries, Accumulators and Fuel Cells Alkaline accumulators
Despite of all the advantages which are potentially offered by using of alpha nickel hydroxide in alkaline accumulators there is a fundamental problem if this system is able to provide such parameters in the long term condititions. There is an obvious inclination that there is a crystal-phase transformation toward more stable and termodynamically preferable beta form in general alpha phase definition according to the Bode´s diagram.
Phase changes (Bode´s diagram)
β-Ni(OH)2 β-NiOOH ↑ aging in
alkali ↓ overcharging α-Ni(OH)2 γ-NiOOH resp. γ-NiOOHxKy partial penetration of cations K+
event. Li+ into nickel hydroxide lattice giving mixed oxyhydroxide of type [Ni4O4(OH)4](OH)2K
γ- phase is a mixture of trivalent and tetravalent nickel: NiOx .nH2O , where x 1.5; 1.8
However, the presence of high-valent nickel hydrated oxides formed by overcharging is very temporary due to their strong instability resulting in reduction to NiOOH through self-decomposion accompanied by excessive oxygen evolution. The rapid falling of initial cell voltage in discharge curves indicates described self-discharging after finalized charging immediately, see above.
NiOx .nH2O → NiOOH + ½ (x – 1.5) O2 + (y – 0.5) H2O
The reaction rate increases with enhanced content of fixed oxygen (x) i.e. with enhanced summary of a nickel valency.
Experimental
Materials synthesis
Samples of beta nickel hydroxide were synthesized through an addition of nickelous and cobaltous salts solution (in modified mutual molar ratio) to various excess of sodium hydroxide solution (in mother liquor) with changed molarity. Like this adjusted reaction conditions ensure different pH levels of nickel hydroxide precipitation. All solutions used for precipitation were tempered above 40oC. Next treatment of obtained suspensions involved separation of solid state from mother liquor, drying of filter cake, washing of sulphate and nitrate anions, respectivelly, from nickel hydroxide particles and second drying of washed products.
Alpha nickel hydroxide samples were prepared with coprecipitation technique. An aqueous solution of Ni, Co, Al, Mn and Ca salts with chosen molar ratio was added with a given flow rate into vessel containing certain volume of distilled water. The reaction pH of 10 was kept at the constant value by controlled flow rate of simultaneously added alkaline solution.The coprecipitation was carried out under vigorous stirring at 30oC. The product was filtered off, washed thoroughly with distilled water and dried overnight at 60oC.
210

13th Advanced Batteries, Accumulators and Fuel Cells Alkaline accumulators
Measuring conditions
The electrochemical studies of prepared beta and alpha nickel hydroxide samples were accomplished in Ni-Cd cells with 6M KOH as an electrolyte. There was used a pocket construction of electrodes for the investigations on all of nickel hydroxide samples. The electrodes were constituted of pressed activated mixture of nickel hydroxide and graphite which gives an improved electronic conductivity. The active material based on βbc-Ni(OH)2 has been used as a reference sample in carried out tests.
Galvanostatic measurement of discharge capacity
The cycling process at the 0.17 C rate is typically used in our laboratory for testing of the commercial positive accumulator mass of Bochemie Inc., named NICOL G. The test consists of the continuous, galvanostatically led charging and discharging of measured cell with a short relaxation between the various steps. The procedure involves four "forming" cycles performed at the same rate (0.17 C) at the very beginning of the cycling, including strong overcharging of the cell in the first cycle (20 h successfully). The overcharging corresponds to 200% of the theoretical capacity for common accumulator mass based on beta nickel hydroxide. All galvanostatic measurements were performed using non-commercial equipment of Bochemie Inc.
XRD analysis
Phase identification of prepared samples by means evaluation of crystal lattice parameters.
EQCM/CV evaluation of reversibility
Reversibility of redox reactions taking place in cycled materials based on variously doped alpha nickel hydroxide and amount of participated active mass were investigated by cyclic voltametry (CV) method combined with an electrochemical quartz crystal microbalance (EQCM) study, i.e. registration of mass changes during potential scans.
211

13th Advanced Batteries, Accumulators and Fuel Cells Alkaline accumulators
Results and Discussion
Galvanostatic charge – discharge tests (Measurement of discharge capacity)
Fig. 1: Cyclic life of beta Ni(OH)2 in dependence on both final excess of NaOH in mother liquor at terminated precipitation and range of cobalt addition
Fig. 2: The performance of multidoped alpha nickel hydroxide related to nickel content
A treatment of chemical composition were carried out for purposes of optimizing product formula ensuring excellent electrochemical parameters and their durability in cycling process. Set of several samples with variously modified molar ratios of doping elements to
212

13th Advanced Batteries, Accumulators and Fuel Cells Alkaline accumulators
nickel was prepared. All these propositions were based on our former experience with an individual-element´s doping and consequent conclusions
Efficiency of sulphate washing
Fig. 3: Efficiency of sulphate washing from precipitated β-Ni(OH)2 in dependence on final excess of NaOH in mother liquor at terminated precipitation under unitary level of cobalt content
Fig. 4: Efficiency of sulphate washing from β-Ni(OH)2 precipitated up to the same final excess of NaOH in mother liquor at terminated precipitation in dependence on cobalt content
213

13th Advanced Batteries, Accumulators and Fuel Cells Alkaline accumulators
Influence of reaction conditions on surface morphology of β-Ni(OH)2
Fig. 5: Surface area of precipitated β-Ni(OH)2 in dependence on final excess of NaOH in mother liquor at terminated precipitation under unitary level of cobalt content
Fig. 6: Surface area of β-Ni(OH)2 precipitated up to the same final excess of NaOH in mother liquor at terminated precipitation in dependence on cobalt content
214

13th Advanced Batteries, Accumulators and Fuel Cells Alkaline accumulators
CV and EQCM measurements of oxygen evolution and chargeabilty of NHE
Multidoped alpha nickel hydroxide
0.0 0.1 0.2 0.3 0.4 0.5 0.6
-0.0010
-0.0008
-0.0006
-0.0004
-0.0002
0.0000
0.0002
0.0004
0.0006
0.0008
0.0010
0.0012
0.0014
I / A
E / V vs Hg/HgO
NiCoMnAl hydroxid
NiCoCaMnAl hydroxid
0.0 0.1 0.2 0.3 0.4 0.5 0.6-0.0008
-0.0006
-0.0004
-0.0002
0.0000
0.0002
0.0004
0.0006
0.0008
0.0010
0.0012
NiCoCaMnAl hydroxid
6M KOH
2
1
I / A
E / V vs Hg/HgO
1
5
10
50
100
Fig. 7: Influence of Co and Ca addition on oxygen evolution at NHE during charging
Cobalt and calcium addition should ensure an increasing of the difference between oxygen evolution potential EO2 and anodic oxidation potential Ea of nickelhydroxide electrode (NHE) by enhancing of an oxygen overvoltage ηO2 on charged NHE with better charge acceptance and thereby lower Ea and consequently an improvement of the charge efficiency. Although EO2 was really elevated after Ca incorporation, the distance between EO2 and Ea positions on potential axe was maintained almost unchanged due to unfavourable raising of Ea. The position of anodic peak shifts to more positive values, from initial 0.33 V, during cycling. Fig.11 gives a nice overview of the gradual shifting.
Beta nickel hydroxide
Fig. 8: Chargeability evaluation of NHE containing different cobalt amount
215

13th Advanced Batteries, Accumulators and Fuel Cells Alkaline accumulators
Conclusion
We have prepared set of several samples of nickel hydroxide by chemical precipitation method at variously modified reaction conditions. All synthesized samples have been subjected to electrochemical tests in this work. Significant part of our assumptions resulting to proposed treatment of precipitation process parameters for purposes of modified product composition, particle texture and surface morphology were confirmed by disclosed conclusions:
Cobalt introduced into lattice of nickel hydroxide improves reversibility of redox reactions on cycled nickel hydroxide electrode (NHE) as well as charge acceptance of the active material via lowered anodic oxidation potential and increased oxygen overvoltage ηO2 on charged NHE at the same time. Consequently, it means that an improvement of the charge efficiency occurs. Cobalt addition also suppresses presence of “low-density” gamma phase formed during overcharging of β-NiO.OH and thereby increase resistance to undesirable volume changes in cycled active material. We applied cobalt as two species, primarily incorporated through co-precipitation and secondary as surface modification/coating of particles Ni(OH)2.
The pH value has been found to be crucial factor that affected the crystal structure characteristics, such as surface area, degree of crystallinity, crystallite size, lattice disorder and crystal growth orientation. Residual amounts of undesirable sulphates (nitrates) and carbonates captured in crystallites also significantly depend on the pH value of the chemical precipitation reaction.
Acknowledgement
This article was supported by Internal grant FEKT S 11 7.
References
[1] C. Faure, C. Delmas, Journal of Power Sources 36 (1991) 497–506 [2] Ding Yunchang, Li Hui, Yuan Jionliang, Chang Zhaorong, Journal of Power Sources
56 (1995) 115–119 [3] Ken-ichi Watanabe, Mitsuru Koseki, Naoaki Kumagai, Journal of Power Sources 58
(1996) 23–28 [4] A. Van der Ven, D. Morgan, Y. S. Meng, and G. Ceder, J. Electrochem. Soc., 153 (2)
A210-A215 (2006) [5] Deepika Singh, J. Electrochem. Soc., Vol. 145, No. 1, January 1998 [6] V. Ganesh Kumar, N. Munichandraiah, P. Vishnu Kamath, A.K. Shukla, J. Power
Sources 56. (1995) 1 I l-l 14
216

13th Advanced Batteries, Accumulators and Fuel Cells Alkaline accumulators
THE EFFECT OF NICKEL CONTENT IN NEGATIVE MASS ON ELECTRODE CAPABILITY IN Ni-MH SYSTEM
Sierczynska A.1, Kopczyk M.1, Woch M.2, Swoboda P.1, Lota K.1, Lota G.1,3
1 Institute of Non-Ferrous Metals Division in Poznan, Central Laboratory of Batteries and Cells, Forteczna 12, 61-362 Poznan, Poland
2 Institute of Non-Ferrous Metals, Sowińskiego 5, 44-100 Gliwice, Poland 3 Institute of Chemistry and Technical Electrochemistry, Poznan University of Technology,
60-965 Poznan, Piotrowo 3, Poland
Corresponding author: Maciej Kopczyk ([email protected]) Phone: +48 61 2797800 Fax: +48 61 2797897
Abstract
The electrochemical properties of alloys reversibly absorbing hydrogen, used as negative electrode material in Ni-MH batteries, are strongly influenced by nickel presence. In the reversibly absorbing hydrogen alloys of AB5 type, nickel is one of the elements of the B group. The kinetics of electrode reaction, average charge/discharge potential and discharge capacity depend on the amount of nickel in the alloy.
In the composition of intermetallic compounds nickel affects the creation of specific crystalline structure while simultaneously decreasing the energy of Me-H bond to a value suitable for the application of the electrode in a Ni-MH-type cell. Moreover, nickel presence in the electrode in metallic form increases the electrical conductivity, catalyzes electrode reactions and the surface hydrogen dissociation.
In the presented study the influence of different amounts of metallic nickel (from 0 to 30 wt.% Ni) on the reaction kinetics, and the MH electrode performance was observed. A research into electrochemical performance of electrodes with those additions was conducted to determine the best composition for the negative active mass of nickel-metal hydride batteries (Ni-MH). The electrochemical properties such as specific capacity, charge efficiency, percent of utilization and cycleability were defined in a half-cell system by cyclic galvanostatic charge/discharge and cyclic voltammetry.
Introduction
Hydrogen storage alloys are used as the negative electrodes of nickel–metal hydride (Ni–MH) batteries. Multicomponent alloys of the AB5 type offer great possibilities of changing their chemical composition and thereby physicochemical properties. The suitability of alloy for an electrode material is closely connected with nickel content acting as catalyst in an electrode reaction. In this work the influence of different amounts of metallic nickel (from 0 to 30 wt.% ) on the reaction kinetics, and the MH electrode performance was observed. When using nickel powder additives to fabricate MH electrodes, a conductive network structure is formed, so that conductivity is improved. A research into electrochemical
217

13th Advanced Batteries, Accumulators and Fuel Cells Alkaline accumulators
performance of electrodes with those additions was conducted to determine the best composition for the negative active mass of nickel-metal hydride batteries (Ni-MH).
Experimental
The active material of the anode (MH) was a mixture of an alloy with a general formula MmNi3.55Al0.3Mn0.4Co0.75 and carbonyl nickel powder 255 (Inco) in amount from 0% to 30% of the active mass weight (Table 1).
The electrode support was nickel foam, 500 g/m2 density and 1.6 mm thickness. The binder was a 3% water solution of polyvinyl alcohol. The anodic mass was mixed and pasted on both sides of the electrode support. The support's surface was 1cm2 and before the pasting it had been degreased. Pasted electrodes were dried in 70°C to stable mass and then pressed under 40 MPa. Three electrodes were prepared for each active mass composition. Those electrodes were initially activated by placing them for 24h in 6M KOH water solution. The testing system was built from the prepared M/MH electrode, an excess Ni(OH)2/NiOOH electrode as the counter electrode and with an Hg/HgO/6M KOH. reference electrode.
Half-cells were tested by cyclic electrochemical trials based on galvanostatic charge/discharge with a constant current with the density i=40mA per 1g of active mass (0.2C, where C is the theoretical capacity). To determine the capacity of tested electrodes 10 full charge/discharge cycles were conducted. The charge process was determined by time, lasting for 6 hours. After 1 hour relaxation the electrode was discharged to -0.7V vs Hg/HgO/ 6M KOH.
Results and discussion
Example charge and discharge characteristics after the 3rd cycle for the electrodes with different nickel content are presented on the Fig. 1-2.
The values of discharge capacity for the electrodes with different nickel content tested in a half cell system for 10 charge/discharge cycles are showed on Fig. 3.
Based on the data collected from three tested electrodes for each active mass composition after their 5th cycle, an average value of electrical performance was calculated and presented in Table 1.
218

13th Advanced Batteries, Accumulators and Fuel Cells Alkaline accumulators
Table 1: The composition of the anodic active mass
AB5-type alloy material
(wt.%)
Inco nickel powder 255-
type (wt.%)
Electrical efficiency
γ = Qdischa/Qcha (%)
100 0 99.53 %
95 5 98.37 %
90 10 99.81 %
85 15 98.21 %
80 20 89.88 %
75 25 81.15 %
70 30 79.94 %
-1.10
-1.05
-1.00
-0.95
-0.90
-0.85
-0.80
0 1 2 3 4 5 6
Time /h
Po
ten
tial
vs.
Hg/
HgO
/ V
0 wt.%
5 wt.%
10 wt.%
15 wt.%
20 wt.%
25 wt.%
30 wt.%
Fig. 1: Charge characteristics of the tested electrodes in their 3rd cycle
219

13th Advanced Batteries, Accumulators and Fuel Cells Alkaline accumulators
-1.00
-0.95
-0.90
-0.85
-0.80
-0.75
-0.70
-0.65
-0.60
0 1 2 3 4 5 6
Time / h
Po
ten
tial
vs.
Hg/
HgO
/ V
0 wt.% Ni
5 wt.% Ni
10 wt.% Ni
15 wt.% Ni
20 wt.% Ni
25 wt.% Ni
30 wt.% Ni
Fig. 2: Discharge characteristics of tested electrodes during their 3rd cycle
150
160
170
180
190
200
210
220
230
240
250
1 2 3 4 5 6 7 8 9 10
Cycle number
Dis
char
ge c
apac
ity
/ m
Ah
g-1
0 wt.% Ni
5 wt.% Ni
10 wt.% Ni
15 wt.% Ni
20 wt.% Ni
25 wt.% Ni
30 wt.% Ni
Fig. 3: Discharge capacity as a function of cycle numbers after 10 work cycles
From all the tested electrodes containing different amounts of nickel in the active mass composition, the highest discharge capacity (approximately 240mAh on 1g of active mass) was obtained for the electrodes prepared with the addition of 0% to 10% of nickel carbonyl powder. Lower capacity was observed for the electrodes with 15% of the nickel addition.
220

13th Advanced Batteries, Accumulators and Fuel Cells Alkaline accumulators
The electrodes with more than 15% of nickel amount, presented a significant drop in capacity.
The best electric performance was observed for the electrodes with 10% of nickel content in active mass. For the half-cell systems built with electrodes with 20% to 30% of nickel content the electrical performance decreased by over 10%.
After the 3rd cycle of charge/discharge, electrodes with different nickel content were submitted to cyclic voltammetry tests to determine the kinetics of electrode reaction and the mechanics of the hydrogen sorption-desorption process. In the cyclic voltammetry the signal is stimulated by a linear triple pulse to equilibrium potential (Es) to cationic side until -1.0V is reached, and then back to anodic side to the potential of -0.4V. The polarization was shifted automatically by a pulse generator. Each following cycle was running from -1.0 → -0.4V → -1.0V. The tests were conducted in three-cycle programs, with the scanning potential speed set to dV/dt = 0.1 mV/s. The voltammetry curves of the tested electrodes are presented on Fig. 4. As it can be observed on the voltammetry curves, the peaks of metal hydride are not visible due to a simultaneously occurring (with this speed of potential scanning) hydrogen evolution.
The observed desorption peaks could suggest that the forming metal hydride is presenting proper stability. The highest desorption capacity was reached by the electrodes with 15% of mass Ni > 5% of mass Ni > 10% of mass Ni, while the electrodes with no Ni additions and electrodes with 20% to 30% nickel content presented much lower capacity in the desorption peak.
-400
-300
-200
-100
0
100
200
300
400
-1.1 -1.0 -0.9 -0.8 -0.7 -0.6 -0.5 -0.4 -0.3
Potential / V vs. Hg/HgO
Cu
rre
nt
de
sity
/ m
A g
-1
0 wt.% Ni
5 wt.% Ni
10 wt.% Ni
15 wt.% Ni
20 wt.% Ni
25 wt.% Ni
30 wt.% Ni
Fig. 4: Voltammetric curves of the tested electrodes (Es→ -0.4V→ -1.0V→Es; dV/dt = 0.1 mV/s)
For each electrode with different active mass composition impedance spectroscopy was conducted. Those tests were done at the equilibrium potential within frequency range of
221

13th Advanced Batteries, Accumulators and Fuel Cells Alkaline accumulators
10 kHz to 1 mHz with alternating current signal of 10mV amplitude. Electrochemical impedance spectrum obtained for the tested electrodes after 3rd charge/discharge cycle is presented on Fig. 5.
Registered in the full frequency range, the impedance spectrum consist of three semicircles. For the MH electrode the semicircle of high frequency corresponds to the impedance caused by the contact between the alloy particles and the energy collector. The second one, in the low frequency range, corresponds to the charge transfer on the surface of the electrode; the shape of the slope is effected by the hydrogen diffusion into the bulk of the alloy [1-3]. The lowest resistance value - effecting the contact between the alloy particles and the nickel collector - was observed for the electrodes with 10% of nickel addition to the active mass.
0.0
0.5
1.0
1.5
2.0
0.0 0.5 1.0 1.5 2.0
Z' /Ohm
-Z''
/ O
hm
0 wt.% Ni
5 wt.% Ni
10 wt.% Ni
15 wt.% Ni
20 wt.% Ni
25 wt.% Ni
30 wt.% Ni
Fig. 5: Electrochemical impedance spectrum for the tested electrodes, after 3rd charge/discharge cycle
222

13th Advanced Batteries, Accumulators and Fuel Cells Alkaline accumulators
Conclusions
Conducted research has shown a significant correlation between the amount of metallic nickel in the anodic active mass and the average charge/discharge potential, reaction kinetics and electrical performance of MH electrodes.
The highest values of discharge capacity - around 240 mAh per 1g of active mass - were obtained for the electrodes made with 0% to 10% of metallic carbonyl nickel additives;
The best electrical performance counting 99.81% was shown by the electrodes with 10% of nickel addition in the active mass;
The highest capacity of desorption observed for the proper potential of the anodic peak were obtained by the electrodes with: 15% Ni > 5% Ni > 10% Ni;
The lowest value of resistance caused by the contact between the alloy grain and the energy collector was observed for the electrodes with 10% of the metallic carbonyl nickel additions.
Acknowledgements
The authors acknowledge the financial support from the European Fund of Regional Development within the frameworks of the operating program –"Innovative Economy 2007–2013", under Project No. POIG.01.01.02-00-015/09.
References
[1] W. Chen, J. Power Sources 90 (2000) 201-205. [2] H. Yang, Y. Chen, M. Tao, C. Wu, J. Shao, G. Deng, Electrochim. Acta 55 (2010)
648-655. [3] X. Li, L. Wang, H. Gong, Y. Song, H. Shang, J. Alloys Compd. 510 (2012) 114–118.
223

13th Advanced Batteries, Accumulators and Fuel Cells Alkaline accumulators
PVA/KOH MEMBRANE FOR ELECTROLYSIS WITH HIGH CONDUCTIVITY FOR ELECTROLYSIS
Kunovjánek, M., Vondrák, J.
Department of Electrical and Electronic Technology, Faculty of Electrical Engineering and Communication, BUT, Technická 10, 616 00 Brno, Czech Republic
Corresponding author: Miroslav Kunovjánek ([email protected]) Phone: +420 541146109
Abstract
The authors report on the coating of a crosslinked, high conductivity PVA/KOH membrane with nonwoven polypropylene fabrics to sustain good mechanical properties of the membrane. The article also contains a comparison of the PVA/KOH membrane with a commercial product; the comparison is based on conductivity measurements and real electrolyser performance.
Introduction
World reserves of fossil fuel are not inexhaustible, and the search for alternative resources has already attracted the interest of researchers across scientific disciplines. This is also the reason why hydrogen is spoken of as the fuel of the future. Recently, mankind has arrived close to the general point of peak oil, which is characterized by a high degree of fossil fuel depletion. At this stage, the prices of fossil fuel will rise excessively, while the related demand will decrease together with the volume of fuel extraction. Even though total exhaustion of fossil fuels is a likely scenario, it is also necessary to note that this type of fuel may be replaced by other sources of energy. In this respect, the use of hydrogen constitutes a viable option. Yet there also exists a precondition: the production of hydrogen must be supported by a cheap power source. The power source for electrolysis is electricity, whose current production is largely based on the dwindling fossil fuel supplies. This restricting factor may be obviated by the focus on renewable power sources. Moreover, the production of hydrogen through electrolysis is also better in terms of hydrogen purity.
The advantages of hydrogen consist in that, during the burning phase, no toxic or greenhouse gases are created. The disadvantages are the high price, demanding storage, and high explosibility of the substance when mixed with air.
Hydrogen production is enabled by a device called electrolyser. This device contains electrodes, a cathode and an anode, which are immersed in acid or alkaline electrolyte. Acid electrolyte exhibits better conductivity, but its application is very costly due to the necessity to use electrodes made of precious metals. In our case, alkaline electrolyte and nickel electrodes (stable in the electrolyte) were applied. In relation to the electrolyser, the problem with the separation of accumulated gases had to be solved. A method to perform this step consists in the use of a special membrane. Basic requirements for membranes are as follows: high ionic conductivity, impermeability for emerging products, and long-term
224

13th Advanced Batteries, Accumulators and Fuel Cells Alkaline accumulators
durability in the electrolyte. These requirements are met by a membrane based on cross-linked PVA. In this article, the PVA membrane will be compared with a Fumapem commercial membrane produced by the Fumatech Company.
Experimental section
Two membranes were selected for the electrolyser-based measurement. The first measured item was a Fumapem commercial membrane produced by the Fumatech Company. This membrane is recommended for electrolysis, but the price is very high in comparison with other components of the electrolyser. The second membrane applied was a laboratory item made from PVA (Mowiol 15-99), which was dissolved in hot water and subsequently mixed with a little amount of KOH electrolyte and glycerin. This mixture requires long processing time: the mixing period necessary for successful bonding and utilization of all the components is approximately 24 hours. This mixture was crosslinked by borax, deposited to nonwoven polypropylene fabric NT-SB-50 supplied by the BTP Company, and left to dry at room temperatures for 3 days. Both membranes were immersed in 5,6 mol/l KOH electrolyte for soaking.
A small laboratory electrolyser having two nickel electrodes (E) was produced to ensure the testing of the membrane. The apparatus and the experiment: A membrane (M) is placed in the central part of the electrolyser and creates two separated cells - cathodic and anodic. Basic plates (B) having 1 cm in thickness, are made from transparent PMMA. Thanks to the transparency, it is possible to monitor reactions inside the electrolyser. Two peripheral plates (P) made of iron hold the electrolyser together. Holes are bored into the plates to facilitate the filling of the electrolyser with electrolyte and to secure the exhaustion of accumulated gases. The electrolyser is filled with 5,6 mol/l KOH electrolyte up to 80 % of its capacity.
Fig. 1: Structure of the electrolyser
225

13th Advanced Batteries, Accumulators and Fuel Cells Alkaline accumulators
Fig. 2: Laboratory electrolyser used for the membrane testing
Testing the immunity of membranes in electrolyte
Long-time resistance of the membranes was tested by immersing a membrane into the electrolyte. Then, the membrane was left immersed at 50°C for several weeks. Subsequently, the membrane was removed from the electrolyte and tested for change of properties.
Measurement of the resistivity of membranes
For the purposes of the membrane resistivity measurement, a four- electrode cell was designed and developed. The cell contains two Pt electrodes and two reference Hg/HgO electrodes, which measure voltage differences on the membrane. The membrane is placed in the middle of the cell. The cell is filled with 5,6 mol/l KOH electrolyte.
Fig. 3: Cell for the membrane resistivity measurement
Resistivity of the membrane was measured by impedance spectroscopy using a VSP Biologic apparatus. First, resistivity of the empty cell was measured. Then, we measured
226

13th Advanced Batteries, Accumulators and Fuel Cells Alkaline accumulators
resistivity of the cell with a membrane, and the empty cell resistivity was subtracted from the obtained value. Resistivity of the membranes is shown in Table 1.
Table 1: Resistivity of the measured membranes
Sample l [mm] R [mΩ.cm-2]
NT-SB-50 + PVA + KOH + G + B 0,437 63,06
Fumatech Fumapem 0,050 88,50
As can be seen in the table, the laboratory-produced membrane exhibits a little better resistivity than the commercial produced membrane (Fumapem).
Measurement of the membranes in a real electrolyser
Then, both membranes were measured in a real electrolyser. Electric current in the electrolyser was 100 mA for the period of 24 hours. Results of the measurement are presented in figure 4. It is obvious that the Fumapem commercial membrane provided better results; however, with this membrane, the electrolyser voltage exhibited very fast increase in time. The PVA membrane exhibits a little higher voltage value, but it is more stable in the electrolyser.
Fig. 4: Measurement in a real electrolyser in time for both membranes
227

13th Advanced Batteries, Accumulators and Fuel Cells Alkaline accumulators
Conclusions
The study contains a comparison of two membranes: A Fumapem commercial product supplied by the Fumatech Company and a laboratory-produced NT-SB-50 membrane with a polymer PVA membrane. The measurement of resistivity in the membranes showed that the Fumapem sample exhibits a little higher resistivity than the PVA membrane. In a real electrolyser, the Fumapem membrane provided better results; however, the electrolyser voltage increased very fast when this membrane was used. Measurement in the real electrolyser with the polymer PVA membrane exhibited worse results than the Fumapem membrane, but the electrolyser voltage was more stable.
Acknowledgements
The research study was supported by the grant FEKT-S-11-7 and project CVVOZE CZ.1.05/2.1.00/01.0014.
References
[1] A.A. Mohamad , N. S. M., M.Z.A. Yahya , R. Othman , and Y. A. S. Ramesh , A.K. Arof (2003). "Ionic conductivity studies of poly(vinyl alcohol) alkaline solid polymer electrolyte and its use in nickel–zinc cells." Solid State Ionics 156: 171-177.
[2] M. Krumova, D. Lopez, R. Benavente, C. Mijangos, J.M. Perena, Effect of crosslinking on the mechanical and thermal properties of poly(vinyl alcohol), Polymer 41 (2000) 9265–9272
228

13th Advanced Batteries, Accumulators and Fuel Cells Alkaline accumulators
CARBON MODIFICATIONS OF AB5-TYPE HYDROGEN STORAGE ALLOY USED AS ANODE MATERIALS IN Ni-MH
CELLS
Sierczynska, A.1, Wrona, A.2, Lota, K.1, Lota, G.1,3, Swoboda, P.1, Kopczyk, M.1
1 Institute of Non-Ferrous Metals Division in Poznan, Central Laboratory of Batteries and Cells, Forteczna 12, 61-362 Poznan, Poland
2 Institute of Non-Ferrous Metals, Sowińskiego 5, 44-100 Gliwice, Poland 3 Institute of Chemistry and Technical Electrochemistry, Poznan University of Technology,
60-965 Poznan, Piotrowo 3, Poland
Corresponding author: Agnieszka Sierczynska ([email protected]) Phone: +48 61 2797800, Fax: +48 61 2797897
Abstract
The conducted research describes the influence of different additions – enhancing the electrical conductivity in electrosorption of hydrogen – on the performance of negative electrode used in Ni-MH cells. Two commercial materials were used as the aforementioned additions: carbonyl nickel powder 255 type (Inco) and multiwall carbon nanotubes with outer diameter 110-170 nm (Sigma-Aldrich), and also three carbon materials obtained by carbonization of conducting polymers: polyaniline (PANI), poly3,4-ehtylenedioxythiophene (PEDOT) and polypyrrole (PPy). The surface morphology of the examined materials was observed using scanning electron microscope SEM EVO® 40 ZEISS. Galvanostatic charge/discharge method with different current densities was used to determine the electrical capacity of tested electrodes. The reaction kinetics was defined with the cyclic voltammetry.
Introduction
Nickel-metal hydride (Ni-MH) batteries based on hydrogen storage alloy electrodes have some advantages over nickel-cadmium (Ni-Cd) batteries, such as high energy density, long cycle life, and environmental compatibility. Research on AB5 alloys has led to the wide commercialization of Ni-MH batteries. However, AB5 alloys exhibit limited capacity due to the single CaCu5-type hexagonal structure. Therefore, it is essential to search for new type alloys with higher discharge capacities and better overall properties. One of the simple and low production cost method is adding new materials or composites to the alloy electrodes active mass.
The conducted research describes the influence of different additions – enhancing the electrical conductivity in electrosorption of hydrogen – on the performance of negative electrode used in Ni-MH cells.
229

13th Advanced Batteries, Accumulators and Fuel Cells Alkaline accumulators
Experimental
The conducting polymers were obtained from a chemical polymerization process of monomers such as aniline, pyrrole and 3,4-ehtylenedioxythiophene (EDOT). The synthesis conditions were shown in Table 1. After the polymerization process polyaniline (PANI), poly3,4-ehtylenedioxythiophene (PEDOT) and polypyrrole (PPy) were carbonized. The carbonization process was conducted in a tube furnace for 10 min under the flow of N2 in temperature of 500°C.
The obtained carbon materials were used as an additive to the MH electrode. For comparison, two commercial materials were also used: Ni-255 which is the type 255 carbonyl nickel (Inco) and MWNT - multi-walled carbon nanotubes with 110 -170 nm outer diameter (Sigma-Aldrich). The active mass of the tested negative electrodes was composed of: 10% (mass) of conductivity addition and 90% (mass) of multicomponent metal alloy of AB5 type (MmNi3.55Al0.3Mn0.4Co0.75) where Mm stands for mixture of: La – 29.7%, Ce – 49.9 %, Nd – 15.4 %, Pr – 5.0 %. The support of the electrode was nickel foam with density of 500g/m2 and 1.6 mm thickness. As a binding component a 3% water solution of polyvinyl alcohol (PVA) was used.
Table 1: The polymer synthesis conditions
Designation Monomer Oxidant Conditions of synthesis
PANI Aniline (NH4)2S2O8
Polymerization:
Medium: acidic 1 M HCl
Temperature: water bath 15-17°C
Carbonization: temp. 500°C / 10 min
/ Nitrogen
PPy Pyrrole FeCl3 · 6 H2O
Polymerization:
Medium: acidic 1 M HCl
Temperature: water bath with ice
Carbonization: temp. 500°C / 10 min
/ Nitrogen
PEDOT
3,4-
ehtylenedioxythiophene
(EDOT)
Fe(ClO4)3
Polymerization:
Medium: aprotic - acetonitrile
Carbonization: temp. 500°C / 10 min
/ Nitrogen
Result and disscusion
Surface morphology of the commercial additives and the obtained carbon materials was observed with a scanning electron microscope (SEM). The conducted tests presented significant differences in the surface morphology of the materials examined. The shape of the quasicrystals of a nickel sample (Ni-255) seems close to flower buds. The carbon nanotubes (MWNT) created a tangle net with a “spaghetti” form. Samples PANI and PPy present a sphere-like structure while PEDOT forms a spider net structure (Fig. 1).
230

13th Advanced Batteries, Accumulators and Fuel Cells Alkaline accumulators
Fig. 1: SEM images of the additives used to create the tested MH electrodes.
As it can be observed on Fig. 2 and Table 2 the highest discharge capacity was achieved by the electrodes with additives of MWNT, PANI and Ni-255. Similar correlation can be observed in the charge-discharge characteristics presented on Fig. 3.
Ni-255
PEDOT PPy
MWNT 110 - 170 nm PANI
1µm
231

13th Advanced Batteries, Accumulators and Fuel Cells Alkaline accumulators
Table 2: Comparison of the maximal discharge capacity from negative electrodes with different additives
Designation of
additive
Discharge capacity
mAh g-1
of active mass
Discharge capacity
mAh g-1
of alloy
Ni-255 215.85 239.83
MWNT 233.73 259.70
PANI 231.19 256.87
PPy 200.51 222.79
PEDOT 139.50 155.00
0
50
100
150
200
250
1 2 3 4 5 6 7 8 9 10
Cycle number
Dis
char
ge c
apac
ity
/ m
Ah
g-1
of
acti
ve m
ass
Ni-255 MWNT PANI PPy PEDOT
Fig. 2: Discharge capacity for 1g of active mass for the tested electrodes obtained with different additives, as a function of cycle number.
232

13th Advanced Batteries, Accumulators and Fuel Cells Alkaline accumulators
-1.05
-1.00
-0.95
-0.90
-0.85
-0.80
-0.75
-0.70
-0.65
0 1 2 3 4 5 6 7
Time / h
Po
ten
tial
vs.
Hg/
HgO
/ V
Ni-255 MWNT PANI PPy PEDOT
Fig. 3: Typical of charge-discharge characteristics of electrodes with different additives, after 7th cycle.
On the voltammetric graph for the electrodes made with tested addition materials (Fig. 4) the peaks for metal-hydride creation are not visible because of the simultaneously occurring hydrogen evolution which generates strong current. The desorption peaks are on the other hand clearly visible (especially for the electrodes with Ni-255 and MWNT additions), which can prove proper stability of the hydride and good reaction kinetics. A different mechanism can be described for the electrodes made with other additions (PANI, PPy, PEDOT) for which the recorded hydrogen desorption peaks have a flat and diffused shape. Also, for those electrodes the maximum anodic current presents relatively low values with a corresponding maximum potential of desorption peak.
233

13th Advanced Batteries, Accumulators and Fuel Cells Alkaline accumulators
-80
-60
-40
-20
0
20
40
60
80
-1.1 -1.0 -0.9 -0.8 -0.7 -0.6 -0.5 -0.4 -0.3
Potential vs. Hg/HgO / V
Cu
rre
nt
de
nsi
ty /
mA
g-1
Ni-255 MWNT PANI PPy PEDOT
Fig. 4: Voltammetric curves of the tested electrodes made with different additions (Es→ -0.4V→ -1.0V→Es; dV/dt = 0.1 mV/s).
The performance of the electrodes with different current densities (from 0.2C to 2C) discharge was also compared. With discharge under a 0.2C constant current, the best performance was presented by electrodes with additions of: MWNT > PANI > Ni-255 > PPy > PEDOT. Therefore good results were obtained for the electrodes with addition of PANI in comparison with the electrodes with commercial additives. However, with higher discharge densities the performance of electrodes with PANI addition was dropping while the performance of electrodes with PPy was rising. The electrode with the addition of carbon material obtained from carbonization of polypyrrol showed the smallest drop in the discharge capacity, as compared to the other carbon materials acquired from carbonization of polyaniline or poly3,4-ehtylenedioxythiophene (Table 3).
Table 3: Comparison of the discharge capacity with different current conditions
Discharge
rate
Discharge capacity / mAh g-1
of active mass
Ni-255 MWNT PANI PPy PEDOT
0.2 C 223.37 234.05 229.83 209.16 170.17
0.5 C 210.56 216.57 114.67 142.81 31.94
1 C 173.42 184.78 57.88 135.39 33.41
2 C 0.01 86.88 0.13 75.85 0.45
234

13th Advanced Batteries, Accumulators and Fuel Cells Alkaline accumulators
Conclusion
The conducted research described the influence of different additions – enhancing the electrical conductivity in electrosorption of hydrogen – on the performance of negative electrode used in Ni-MH cells. What can be observed is that only the carbon materials obtained from polyaniline has shown parameters similar to commercial materials. Other additions did not have a positive influence on the electrical parameters of the tested MH electrodes.
Acknowledgements
The authors acknowledge the financial support from the European Fund of Regional Development within the frameworks of the operating program –"Innovative Economy 2007–2013", under Project No. POIG.01.01.02-00-015/09.
235

13th Advanced Batteries, Accumulators and Fuel Cells Alkaline accumulators
MEASUREMENT OF IMPEDANCE CHANGES OF POROUS Ni(OH)2 POSITIVE ELECTRODES AT DIFFERENT STATE
OF CHARGE
Chladil1, L., Dvořák 1, P.
1 Department of Electrical and Electronic Technology, Faculty of Electrical Engineering and Communication, BUT, Technická 10, 616 00 Brno, Czech Republic
2 Centre for Research and Utilization of Renewable Energy, Faculty of Electrical Engineering and Communication, BUT, Technická 10, 616 00 Brno, Czech Republic
Abstract
Nickel hydroxide is the typical material for positive electrodes of alkali accumulators. This material is known for its big changes of electron conductivity in different state of charge. The article is focused on measurement impedance of Ni(OH)2 pocket electrode in different state od charge by using electrochemical impedance spectroscopy (EIS) technique.
Introduction
2 g electrodes were prepared for each measurement. Each electrode consist of 1.5 g nickel hydroxide, 100 mg cobalt hydroxide, lithium hydroxide and nickel powder additives and 400 mg graphite powder (Graphit kropfmühl AG). Electrode material was mixed in cylinder rotation homogenizer for 24 hours and then pressed by 3.6 kN/cm2 into pocket shape electrode. The diameter of electrode was 29 mm and thick 3 mm. As counter electrode was used commercial low-impurity cadmium material (Kans GN by Bochemie).
Positive electrode was inserted between two negative electrodes (negative materials were in two-fold excess). Nonwoven polypropylene fabric was used as separator. Assembled electrodes were put into the PTFE cell that allows measurements with Zn/ZnO reference electrode. 6 ml of 6M KOH electrolyte was added and measurements were performed.
Experiment
Preparation of measurement
For measurement 2g weight electrodes were prepared. Each electrode contain 1.5 g of nickel hydroxide, 100 mg of cobalt hydroxide, lithium hydroxide and nickel powder additives and 400 mg of graphite powder from company Graphit kropfmühl AG. Electrode material were 24 hour mixed using cylinder rotation homogenizer and then pressed by 3,6 kN/cm2 into pocket shape electrode. The diameter of electrode is 29 mm and thick is 3 mm. As counter electrode were used commercial low-impurity cadmium material Kans GN by Bochemie.
Positive electrode was inserted between two negative electrodes (negative materials were in two-fold excess). Nonwoven polypropylene fabric was used as separator. Assembled
236

13th Advanced Batteries, Accumulators and Fuel Cells Alkaline accumulators
electrodes were put into the PTFE cell that allows measurements with Zn/ZnO reference electrode. 6 ml of 6M KOH electrolyte were added and measurements were performed.
Result and discussion
After forming of electrodes, discharge characteristic at 0.2 C discharge rate were measured. (Figure 1). Discharge characteristic contain two voltage plateau. The first plateau is in related with standard electrochemical reaction:
[1]
The second one (at approximately 1 V vs. Zn/ZnO) is caused by discharging of inner parts of active material grains. These parts are isolated due to creation of outer discharged layer, which prevents to ion diffusion to unreacted mass. The first and second voltage plateau can be seen on figure 1. Chart contains also the discharge levels, in where impedance spectroscopy measurements were performed.
Fig. 1: Discharge characteristics of positive electrode with discharge levels for taking of impedance measurements
Figure 2 contain the Nyquist plot of positive electrode after discharging of 80% of charge. Impedance at high frequency (about 10 kHz) is composed of leads resistance and electrolyte resistance in separator. Oxidation/reduction reactions take place gradually as the measurement frequency go down. Reaction parameters can be deduced from semicircle in nyquist plot. On figure 3 is the typical equivalent circuit which represents the ideal kinetic-controlled reaction without any diffusion processes. Origin of Cdl (double-layer capacitance or faradaic capacity) is in electrode polarization and Rct represented the charge transfer resistance.
In practical impedance measurement of porous electrode much many phenomenon have an influence on shape of semicircle. For example semi-linear section at high frequencies is the typical deformation of nyquist diagrams for the case of using graphite as conductive additive in electrode. If semi-linear region are observed, the current density distribution in
237

13th Advanced Batteries, Accumulators and Fuel Cells Alkaline accumulators
inner surface pores isn’t evenly distributed [4]. On the other side stretching of semicircle along Re(Z) axis can by causes by wide distribution of pores lengths and pores sizes in the electrode. This elongation we can see on figure 4 especially at low levels of electrode reduction. From figure 4 is also obvious that charge transfer resistance increased rapidly if reduction of electrode is between 55 to 87 %. This is caused mainly by extension of ionic way to non-reduced active material placed in poorly accessible parts of electrode pores. Growth of charge transfer resistance stops when the first voltage plateau is finished. In this reduction level only slope of low-frequency part of characteristic is decreased. This may be in agreement with the theory that in this point all ion-accessible surface of active material is reduced, and now the limiting process is the diffusion of H+ trough increasing layer of already reduced mass. Another increase of charge-transfer resistance is because it occurs to increase of thickness of this layer.
Fig. 2: Nyquist diagram of positive electrode at 80% discharge state
Fig. 1: Equivalent circuit of ideal electrode reaction without any diffusion phenomenon [3]
238

13th Advanced Batteries, Accumulators and Fuel Cells Alkaline accumulators
Fig. 2: Nyquist diagrams of porous positive electrodes in different discharge (reduction) states
Conclusion
Impedance spectroscopy allows precise monitoring of impedance changing during discharging of electrode. Significant increase of impedance was observed when electrode is in 55% state of discharge. This method also can tell more about limiting processes and their changes during cycling.
Acknowledgements
This contribution was supported by grant FEKT-S-11-7 and CZ.1.05/2.1.00/01.0014
References
[1] A.K. SHUKLA ET AL.: Nickel-based recharchable batteries, Journal of Power Sources 100 (2001) 125-148
[2] H. BARDÉ ET AL.: Evidence for electronic and ionic limitations at the origin of the second voltage plateau in nickel electrodes, as deduced from impedance spectroscopy measurements, Journal of Power Sources 19 (2008) 830–836
[3] J. BAREK ET AL.: Elektroanalytická chemie, 1. vyd. Praha: Karolinum, 2005 188 s. ISBN 80-246-1146-5
[4] A. LASIA.: Impedance of porous electrodes, Journal of electroanalytical chemistry 397 (1995) 27-33
239

13th Advanced Batteries, Accumulators and Fuel Cells Lead-acid batteries
SIMULATION AND MATHEMATICAL DESCRIPTION OF CHARGING AND DISCHARGING OF THE LEAD ACID
ACCUMULATOR
Vyroubal, P.1, Maxa, J.1, Tichý, J.1, Bača, P.1, Křivík, P.1
1Department of Electrical and Electronic Technology, Faculty of Electrical Engineering and Communication, BUT, Technická 10, 616 00 Brno
Corresponding author: Petr Vyroubal ([email protected]) Phone: +420 541 146 154
Abstract
In a lead-acid cell the active materials there are lead dioxide ( ) in the positive plate, sponge lead ( ) in the negative plate, and a solution of sulphuric acid ( ) in water as the electrolyte.
A chemical reaction proceeds place between lead plates and sulphuric acid, producing electric current. When the charge is depleted, the battery can be recharged many times.
When the battery is electrically charged, the sulphate ions in the sulphuric acid react with the positive and negative plates, forming lead sulphate. Electrons from the reaction flow out from the negative terminal to the circuit and then back into the positive side.
When the battery is charging, the lead sulphate leaves the electrodes and transforms into the sulphuric acid again. The discharge-charge cycle can be repeated thousands of times [3].
Introduction
At this time many researches aim on investigating the characteristics of batteries and accumulators. They investigate their lifetime and cycle-ability (how many charge/discharge cycles can the accumulator obtain). Measuring of charging and discharging can be done by the potentiostates. Another possible method to get the desired data is using computer simulation. For this we need mathematical description of the processes which take place in the accumulator. And of course we need appropriate simulation software.
Majority of simulation programmes with graphical interface used for simulations is based on the finite element method (e. g. COMSOL, ANSYS).
Sequence for solving the task is the following:
Creating geometry of the model
Definition of boundary conditions and properties of the environment
Generating of the computational mesh (automatic or user-controlled)
The computation itself
Processing of results
240

13th Advanced Batteries, Accumulators and Fuel Cells Lead-acid batteries
COMSOL Multiphysics software was used for simulation of a charging / discharging cycle of lead-acid cell. This software allows simulating tasks described by partial differential equations (PDE). It is possible to incorporate more physical influences and therefore do more complex analysis (multiphysics task). COMSOL is directly connected with MatLab, so it is possible to perform another mathematical analysis [8].
Physical changes in lead-acid accumulators
During discharge the electrodes are mechanically strained because the volume of lead sulphate is bigger than the volume of active materials in charged state. When the accumulator is more and more discharged, the porosity of electrodes decreases. This means that diffusion of sulphuric acid into electrodes is slower. Density of sulphuric acid in electrodes is therefore lower than in the electrolyte. This difference is bigger if the discharging current is bigger and/or the electrodes are thicker and/or with the increasing state of discharge [1].
Ions of sulphuric acid react with active mass of electrodes during discharge and therefore the density of electrolyte decreases. This change of density is directly proportional to the state of discharge (charge). That means that the state of charge can be determined by measuring the density of electrolyte [2].
Reactions taking place on positive electrode ( ) during discharging:
Gassing on positive electrode in the end of charging cycle results in oxygen production:
Reaction taking place on negative electrode ( ) during discharging:
Gassing on negative electrode in the end of charging cycle results in hydrogen production:
Mathematical model
The mathematical model was created to simulate the behaviour of lead-acid battery cell. Lead-acid battery typically consists of current collectors contacted on the positive and negative porous electrode, electrolyte and separator (Fig. 1).
Fig. 1: Model of the lead-acid battery cell.
241

13th Advanced Batteries, Accumulators and Fuel Cells Lead-acid batteries
The notations for these dependent variables are the following [4], [6]:
electric potential in the electrodes electrolyte potential dissociated salt concentration of electrolyte, here porosity (volume fraction of liquid electrolyte) of the porous electrodes
The electrode kinetics, described using the Butler-Volmer expression, electrode reaction rate, depending on the concentration of electrolyte expressed by the value of current
density on the electrode ) is the exponential function of overpotential [7]:
(1)
Where denotes the exchange current density and indicates the current that is
constant at the equilibrium electrode in both directions, reference concentration of the
electrolyte ( ), γ the reaction order ( ), the molar gas constant ( ), the temperature ( ), Faradays constant 96.487 ( , the anodic charge transfer
coefficient ( ), the cathodic charge transfer coefficient ( ),The overpotential η ( ) is according to the following equation [6]:
(2)
Where electric potential in the electrode ( ), , electrolyte potential ( ), electrode
equilibrium potential ( ).
During a discharge, the active surface area (area where take place the mutual reaction
between the electrode and electrolyte) ( ), is calculated using the equation below [6]:
(3)
Where ζ is a morphology correction parameter ( ), is porosity at full battery charge
( ) and is porosity in a discharged battery ( ).This surface area may also be used for side-reactions such as oxygen evolution and oxygen reduction and the non-faradaic double layer currents.
In the charging reactions, is a reactant but also an insulator, reducing the available active surface area. To account for this effect, the following expression may be used for the active surface area for the charging reactions [6]:
(4)
When the current passes through ion conductor occurs to the transport (disequilibrium) phenomena. Electrical conductivity in porous current collectors and nonporous battery parts are governed by Ohm's law [6]:
(5)
Where is electrode (solid) current density , the electrolyte (liquid) current
density , denotes the electrode (solid) conductivity, denotes the electrolyte
242

13th Advanced Batteries, Accumulators and Fuel Cells Lead-acid batteries
conductivity ( ), the transport number ( ) a the electrolyte concentration
( ).
The equation describing the charge transfer in porous parts of the battery is also governed
by Ohms law, complemented by porosity parameter [6]:
(6)
where is an empirical parameter that describes the correction factor for the effective transport properties for electrolyte and s an empirical parameter that describes the
correction factor for the effective transport properties at the electrodes ( ).In the separator the porosity is constant.
The dissociated salt ions may be transported due to convection, migration and diffusion. The number of molecules which pass through unit area per unit time, denoted as the molar
flux vector ( ) [6]:
(7)
Where is the binary diffusion coefficient into which the migration effects are incorporated
( ), is the average velocity of ions in the electrolyte ( ).
For a boundary, the flux of electrolyte species due to the electrochemical reactions is calculated according to [6]:
(8)
is the number of electrons involved in reaction, the stoichiometric coefficient for
the hydrogen ion, , the stoichiometric coefficient for ion.
For post-processing purposes the following state of charge expression, SOC, for the electrodes, is also defined [6]:
(9)
The porosity change of the electrodes at the time, the following equation describes [6]:
(10)
the stoichiometric coefficients of lead, the stoichiometric coefficient of lead
oxide, the stoichiometric coefficient for lead sulphate. , , are the
molar volumes of lead, lead oxide and lead sulphate.
The electrolyte is located inside the pores (electrode, separator), its generation and transport is described by the following equation [6]:
(11)
Where is volumetric rate of acid generation ( ), resulting from the electrochemical reactions (the mean, which occur the reaction at the electrodes and the
side, where occur at oxygen evolution) is according to the equation below [5], [6]:
243

13th Advanced Batteries, Accumulators and Fuel Cells Lead-acid batteries
(12)
denotes the number of electrons involved in reaction, the partial molar volume of
the solvent ( ), the partial molar volume of the electrolyte, the stoichiometric
coefficient for the hydrogen ion, , the stoichiometric coefficient for ion,
the stoichiometric coefficient for water.
Assuming that the main and reactions are the main contributions to the currents in each electrode, the average superficial velocity in each electrode compartment may be calculated as [6]:
(13)
And
(14)
Simulation and results
Mathematical model for lead-acid accumulators was used for simulation of discharging curves. Model is represented by 1D geometry (Fig. 1). The line, which represents the layers in one cell, is divided into sections representing parts of the cell – positive electrode, electrolyte, separator, negative electrode. There is no need to simulate current collectors in our case. Capacity of the cell is 60Ah.
Table 1: Dimensions of the cell
Cell part Dimension [mm]
Positive electrode 0.7
Reservoir 1.8
Separator 0.05
Negative electrode 0.7
The cell was discharged by the currents 1/5 C, 1/10 C and 1/20 C. Curves showing voltage versus time during different discharging currents are shown in Fig. 2.
It is clear that with greater discharging current the capacity of lead-acid cell goes down and therefore the voltage at the end of discharging cycle is lower than by lower discharging current.
244

13th Advanced Batteries, Accumulators and Fuel Cells Lead-acid batteries
Fig. 2: Discharging curves of the lead-acid cell for different discharging currents.
Postprocesor automatically calculates the concentration of electrolyte inside the cell, in our case from positive electrode to the border with electrolyte and separator.
Fig. 3: Electrolyte concentration profile depending on the depth of penetration in the electrode at the end of discharging.
245

13th Advanced Batteries, Accumulators and Fuel Cells Lead-acid batteries
As the electrolyte difuses into the porous electrode the contact between electrolyte and electrode is getting better which betters the efficiency of the electrochemical reaction
during which is consumed on the surface of porous positive electrode and it is changed to . Concentration of the electrolyte in the pores of positive electrode decreases depending on the increasing number of pores which are in contact with the electrolyte.
Conclusion
For simulating chemical processes the knowledge of their mathematical interpretation is essential and we should also know how the simulation software works when it solves the tasks. In this article it was described how the mathematical model of lead acid cell is implemented in COMSOL software which solves systems of partial differential equations (PDE) by the finite element method. There is no need to create a 3D model when we know constants and dimensions of the system. 1D model is sufficient for interpretation. After completing the mathematical model the simulation of discharging of lead-acid accumulator was done and its results correspond to the expected values.
Acknowledgment
This work was supported by the grant CVVOZE CZ.1.05/2.1.00/01.0014 and by the specific graduate research of the Brno University of Technology No. FEKT-S-11-7
References
[1] ARENDÁŠ, M., RUČKA, M., Nabíječe a nabíjení. 1987. Praque, 1987, 216 s. DT 621.355.16.
[2] CENEK, M., et al. Akumulátory: Od principu k praxi. 2003. Praque: FCC Public, 2003. ISBN 80-86534-03-0.
[3] ESFAHANIAN V., TORABI, F., An innovative computational algorithm for simulation of lead acid batteries, Journal of Power Sources, Volume 176, Issue 1, 21 January 2008, Pages 373-380.
[4] http://www.comsol.com/ [5] http://www.ehow.com/facts_5846153_lead-acid-battery-theory.html [6] http://www.mathworks.com/products/matlab/ [7] M. CUGNET, S. LARUELLE, at al., A Mathematical Model for the Simulation of New
and Aged Automotive Lead-Acid Batteries, J. Electrochemical Soc., vol. 156, pp. A974–A985, 2009.
[8] T.V. NGUYEN, R.E. White A mathematical model of a hermetically sealed lead-acid cell Electrochemical Act, 38 (7) (1993), pp. 935–945.
246

13th Advanced Batteries, Accumulators and Fuel Cells Lead-acid batteries
ACTIVE MASS AND COLLECTOR RESISTIVITY AND IMPEDANCE CHANGES OF PULSE CHARGED LEAD-ACID
ACCUMULATOR
Abraham, P.*, Bača, P., Vaculík. S.
Department of Electrotechnology, FEEC, Brno University of Technology, Technická 10, 616 00 Brno, Czech Republic
Abstract
This paper describes active mass and collector resistivity and impedance changes of lead-acid accumulator electrodes. Data was obtained during experiment with pulse charging cycling of old lead-acid accumulator. Resistivity changes of active mass and collector were measured using four-point direct current method. Impedance changes were observed by electrochemical impedance spectroscopy. Old lead-acid accumulator previously not used for almost half of a year was used in the experiment. Reasons why pulse charging was used follows: increased efficiency of charging, gas generation reduction, corrosion speed reduction, sulfation reversion of old cells (1).
Introduction
Measurement method used was slightly modified electrochemical impedance spectroscopy. New method evolved from older one developed at our department of electrotechnology twenty years ago. This method required us to create our own electrodes with non-continuous system of parallel ribs, because to each rib two (voltage and current) wires are connected. So we can select ribs of electrode we wanted to measure. We can also distinguish collector/active mass interphase from active mass resistivity.
Four-point measurement method
All measurement takes place at our experimental cell. Electrodes with system of non-continuous ribs shown at fig 1 were used. Ribs holding active mass were made out of led alloys and were fixed between two strips of epoxy resin. To each rib one voltage and one current leading wire was connected to make possible to measure by four-point method. Rp in equivalent diagram at fig. 2 means wire resistance that was measured before experiment begins, Zk means corrosion impedance of interphase electrode/electrolyte, Zm means impedance of electrolyte and active mass.
247

13th Advanced Batteries, Accumulators and Fuel Cells Lead-acid batteries
Fig. 1: Experimental electrode without active mass
Measurement proceeds in two steps, frequency dependency of voltage is measured between ribs 5-6. During first step current flows between ribs 4-7 and in second step the current flows between ribs 5-7. In first step we theoretically measure only impedance of electrolyte Zm and in second step we measure compounded impedance Zm+Zk. When we substract these two values we get impedance of corrosion layer.
Fig. 2: Equivalent diagram
Electrochemical impedance spectroscopy
Electrochemical impedance spectroscopy (EIS) was the second method that was used to measure impedance of the cell. In EIS measurements the response to small AC signal is measured in wide range of frequencies. Results obtained with this method can be then used with equivalent diagrams and can provide information about processes taking place in observed cell.
Potentiostat VSP was used as a device for making of all our measurements. Mercuro-sulfate comparative electrode was used to make measuring of positive and negative electrode potentials possible. Table 1 shows potentiostat settings used in all cases.
Rp1
Zk1
Zm1-2
Rp2
Zk2
Zm2-3
Rp3
Zk3
Zm3-4
Rp4
Zk4
Zm9-10
Rp10
Zk10
1 2 3 4 10
248

13th Advanced Batteries, Accumulators and Fuel Cells Lead-acid batteries
Table 1: Potentiostat settings
Regime Galvanostatic
Singlesine/Multisine Singlesine
Frequency range 100kHz - 1 mHz
Points per decade 6
Signal amplitude 30 mA
Time before measuring 2 periods
Average of 2 measurements
Range 100 mA
Reaction range 5 (medium)
Experimental
Old experimental cell that was not used for several months was used in this experiment. At first the experimental cell was charged in conventional way, than pulse charging was applied at it and then conventional charging was applied again as it is shown in fig. 3.
Fig. 3: Capacity of experimental cell during experiment
Pulse charging regime contained charge pulse, depolarization pulse and a period of time without charging as it is shown at fig. 4. During the experiment Impedance spectroscopy and resistivity measurement were done as it is shown at figs 5 to 10. Resistivity measurements were performed after cycle nr. 0, 14, 15, 17. 18, 22. EIS measurements were performed after cycles nr. 0, 14, 17,22.
249

13th Advanced Batteries, Accumulators and Fuel Cells Lead-acid batteries
Fig. 4: Pulse charging regime
Fig. 5: EIS before the experiment started
Fig. 6: EIS during the experiment
2,1
2,2
2,3
2,4
2,5
2,6
0 1 2 3 4 5 6 7 8 9 10 11 12 13 14 15 16 17 18 19 20 21 22 23
U(V
)
t(s)
Pulse charging regime
-10
0
10
20
30
40
0 20 40 60
-Im
Z(W
)
RealZ(W)
Impedance
Measurement nr. 1
-1,5
-1
-0,5
0
0,5
1
0 20 40 60
-Im
Z(W
)
RealZ(W)
Impedance
Measurement nr. 2
Measurement nr. 3
Measurement nr. 4
250

13th Advanced Batteries, Accumulators and Fuel Cells Lead-acid batteries
Fig. 7: Rk of positive electrode during the experiment
Fig. 8: Rm of positive electrode during the experiment
Fig. 9: Rk of negative electrode during the experiment
-1E-02
0E+00
1E-02
2E-02
3E-02
4E-02
5E-02
6E-02
7E-02
Rkx
[W]
Rk of positive electrode
Rk1
Rk2
Rk3
Rk4
Rk5
Rk6
Rk7
Rk8
1E-08
1E-07
1E-06
1E-05
1E-04
1E-03
1E-02
1E-01
1E+00
logR
mx[W
]
Rm of positive electrode
Rm1
Rm2
Rm3
Rm4
Rm5
Rm6
Rm7
1E-07
1E-05
1E-03
1E-01
1E+01
1E+03
1E+05
Rkx
(W)
Rk of negative electrode
Rk1
Rk2
Rk3
Rk4
Rk5
Rk6
Rk7
251

13th Advanced Batteries, Accumulators and Fuel Cells Lead-acid batteries
Fig. 10: Rm of positive electrode during the experiment
After application of pulse charging regime on old experimental lead-acid accumulator much of original capacity was restored. Increase of capacity continued even after conventional cycling was applied. EIS of the cell shows that initial state of experimental cell shown huge capacitance probably caused by pronounced sulphation. Resistivities of interphase collector/active mass and of active mass of negative electrode shown rapid decrease tendency during whole experiment.
Acknowledgements
This work was supported by the EU CZ.1.05/2.1.00/01.0014 and by the specific graduate research of the Brno University of Technology No. FEKT–S–11–7.
References
[1] Melvyn James, Jock Grummett, Martin Rowan and Jeremy Newman, “Application of pulse charging techniques to submarine lead-acid batteries,” Journal of Power Sources, Volume 162, Issue 2, (22 November 2006), pp 878-883.
1E-04
1E-03
1E-02
1E-01
1E+00
1E+01
1E+02
1E+03
1E+04
1E+05
1E+06
Rm
x(W
)
Rm of negative electrode
Rm1
Rm2
Rm3
Rm4
Rm5
Rm6
Rm7
RmAvrg
252

13th Advanced Batteries, Accumulators and Fuel Cells Lead-acid batteries
INFLUENCE OF VARIOUS AMOUNTS OF TITANIUM DIOXIDE IN NEGATIVE ELECTRODE TO IMPEDANCE PROPERTIES OF
LEAD-ACID ACCUMULATOR
Abraham, P.*, Bača, P., Vaculík. S.
Department of Electrical and Electronic Technology, Faculty of Electrical Engineering and Communication, Brno University of Technology, Technická 10, 616 00 Brno, Czech
Republic
Abstract
It has been established that addition of carbon additives to the negative active material of lead-acid batteries increases battery charge acceptance in hybrid electric vehicle mode of operation (3). But the latest findings show that the titanium dioxide has similar effect (4). Hence this paper deals with impedance characteristics of experimental lead-acid accumulators with various amounts of titanium dioxide in active mass of negative electrodes. Electrochemical impedance spectroscopy was used for all measurements. Obtained data was subsequently fitted by equivalent circuits. It was investigated that ohmical resistivity of lead-acid cell increases with higher amounts of titanium dioxide in active mass of negative electrodes.
Introduction
Battery intended to be used in hybrid electric vehicles (HEV) has to effectively receive an electrical charge even at high charging currents (e.g. during regenerative braking), that is possible when battery is in PSoC (Partial State of Charge) mode in which the battery is charged about 50% of its capacity.
Fig. 1: Working range of accumulators in HEV.
OVERCHARGING
DEEP DISCHARGE
SCOPE OF WORK OF HEV
253
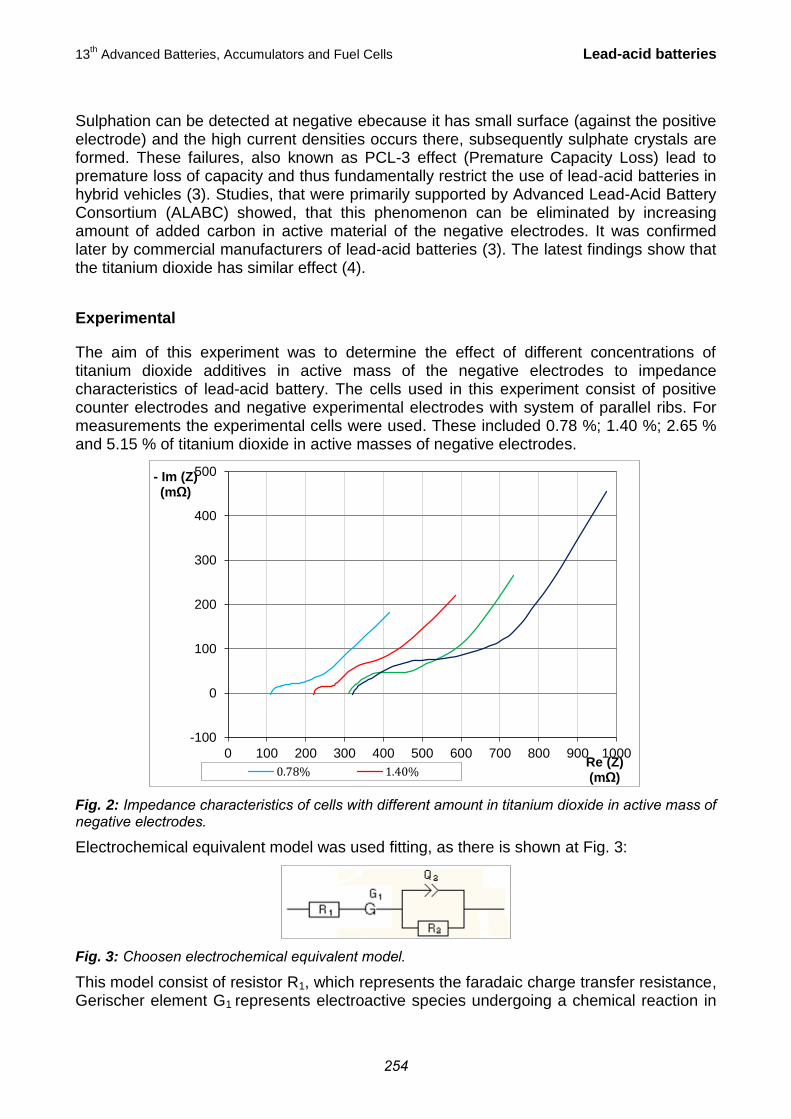
13th Advanced Batteries, Accumulators and Fuel Cells Lead-acid batteries
Sulphation can be detected at negative ebecause it has small surface (against the positive electrode) and the high current densities occurs there, subsequently sulphate crystals are formed. These failures, also known as PCL-3 effect (Premature Capacity Loss) lead to premature loss of capacity and thus fundamentally restrict the use of lead-acid batteries in hybrid vehicles (3). Studies, that were primarily supported by Advanced Lead-Acid Battery Consortium (ALABC) showed, that this phenomenon can be eliminated by increasing amount of added carbon in active material of the negative electrodes. It was confirmed later by commercial manufacturers of lead-acid batteries (3). The latest findings show that the titanium dioxide has similar effect (4).
Experimental
The aim of this experiment was to determine the effect of different concentrations of titanium dioxide additives in active mass of the negative electrodes to impedance characteristics of lead-acid battery. The cells used in this experiment consist of positive counter electrodes and negative experimental electrodes with system of parallel ribs. For measurements the experimental cells were used. These included 0.78 %; 1.40 %; 2.65 % and 5.15 % of titanium dioxide in active masses of negative electrodes.
Fig. 2: Impedance characteristics of cells with different amount in titanium dioxide in active mass of negative electrodes.
Electrochemical equivalent model was used fitting, as there is shown at Fig. 3:
Fig. 3: Choosen electrochemical equivalent model.
This model consist of resistor R1, which represents the faradaic charge transfer resistance, Gerischer element G1 represents electroactive species undergoing a chemical reaction in
-100
0
100
200
300
400
500
0 100 200 300 400 500 600 700 800 900 1000
- Im (Z) (mΩ)
Re (Z) (mΩ) 0.78% 1.40%
254

13th Advanced Batteries, Accumulators and Fuel Cells Lead-acid batteries
the bulk (1) and parallel combination of Q2 and R2 represents inhomogeneous double layer.
Notice that any of constant phase element (in scheme is it Q2) parameters does not represent double-layer capacitance. So we have to characterize the inhomogeneous double layer by characteristic capacitance C0 or by pseudo-capacitance C.
Characteristic capacitance C0 was proposed by Bug et al (2). They enhanced theory about the double-layer capacity distribution along the interface caused by inhomogenities of surface. So they suggest to use the characteristic double-layer capacitance C0 to represent double-layer capacitance CDL. For systems with faradaic reactions it is (2):
[1]
where Re is the electrolyte resistance, Rct is the charge-transfer resistance and α is empirical constant of constant phase element (CPE).
Following equation was used for data evaluation in this paper (2):
[2]
where R1 and R2 are value of resistors R1 and R2 on Fig. 3
Pseudo-capacitance can also be used to represent CPE. EC-Lab software was used to calculate it. EC-Lab was also used for fitting. Pseudo-capacitance can be calculated only for equivalent circuit that consists of serial combination of resistor and parallel combination of resistor and constant phase element. This calculation corresponds to the determination of a capacitance value C at a frequency f0 corresponding to the maximum imaginary part on the Nyquist plot obtained by fitting of the equivalent circuit, that was described above. Result of the following equation represents pseudo-capacitance C (1):
[3]
where Q and α are parameters of constant phase element R is the value of resistor, that is parallel with constant phase element.
Fig. 4: Fitted impedance characteristic of cells with different amount of dioxide titanium in active mass of negative electrodes.
0
100
200
0 200 400 600 800
- Im (Z) (mΩ)
Re (Z) (mΩ)
0.78% 0.78% - fit 1.40% 1.40% - fit2.65% 2.65% - fit 5.15% 5.15% - fit
255

13th Advanced Batteries, Accumulators and Fuel Cells Lead-acid batteries
Table 1: Values of equivalent circuit with pseudo-capacitance C2.
Amount of TiO2 (%) 0.78 1.40 2.65 5.15
Evaluation frequency (Hz)
1342 to 0.050
906 to 0.050
906 to 0.050
1983 to 0.050
R1 (Ω) 0.109 0.220 0.310 0.320
τG1 (s) 6.542 9.891 35.38 6.44E+07
C2 (F) 0.142 0.096 0.227 0.148
R2 (mΩ) 75.32 40.37 150.9 296.4
where R1 and R2 are values of resistors R1 and R2 (see Fig 3), τG1 is time constant of Gerischer element G1 and C2 is value of pseudo-capacitance.
Table 2: Values of characteristic capacitance C02.
Amount of TiO2 (%) 0.78 1.40 2.65 5.15
C02 (F) 11.3 1.24 2.99 3.48
Results
Fig. 2 represents experimental data that show that internal resistance depends on increasing amount of titanium dioxide. Saturation was probably achieved at a concentration of 2.65% and subsequent increase to 5.11% has no significant change of this resistor value.
From the table nr.2 it is clear that with increasing amount of titanium dioxide also increased capacity of characteristic double-layer C02 in the model. But why did the cell with 0.78% titanium dioxide addition have the biggest capacity? We will try to answer this question by further investigation.
All measured cells were fitted by equivalent circuit with Gerischer element, which arises when an electroactive species undergoes a chemical reaction in the bulk. The higher the concentration of TiO2, the higher was the value of this impedance.
Due to the fact that measured cells were differed only by amount of titanium dioxide, we can say, that the higher amount of TiO2, the higher value of resistance, until saturations occurs. Capacity of cells also increases at the same time. Gerischer element was observed only in case of cells with additives.
Acknowledgements
This work was supported by the EU CZ.1.05/2.1.00/01.0014 and by the specific graduate research of the Brno University of Technology No. FEKT–S–11–7.
256

13th Advanced Batteries, Accumulators and Fuel Cells Lead-acid batteries
References
[1] BIOLOGIC. EC-Lab software user's manual. Version 10.x. April 2010. [2] CÓRDOBA-TORRES, P.;MESQUITA, T. J.; DEVOS, O. TRIBOLLET, B.; ROCHE,
V.; NOGUEIRA, R. P. On the intrinsic coupling between constant-phase element parameters, and Q in electrochemical impedance spectroscopy. In Journal of Power Sources. 2012
[3] PAVLOV, D., P. NIKOLOV, P., ROGACHEV, T. Influence of carbons on the structure of the negative active material of lead-acid batteries and on battery performance. In Journal of Power Sources, Volume 196, Issue 11, (1 June 2011), pp 5155 - 5167
[4] TOŠER, P.; BAČA, P.; TONAR, K.; MICKA, K. Investigation of the effect of titanium dioxide and carbon particles in partial state of charge regime. In ALER 2011. Liptovksý Ján: EDIS Žilina, 2011. pp 164-168. ISBN: 978-80-554-0427- 1.
257

13th Advanced Batteries, Accumulators and Fuel Cells Lead-acid batteries
HEAT CHANGES IN THE LEAD ACID BATTERY CELL
Křivík, P.
Department of Electrical and Electronic Technology, Faculty of Electrical Engineering and Communication, BUT, Technická 10, 616 00 Brno, Czech Republic
Abstract
Heat changes in the lead acid battery cell during charging and discharging are affected by the construction of the cell and by method of cycling. They affect the use properties of the electrodes and they can change the capacity and cycle life of the cell. The issue of heat changes in the lead acid cell was studied by several authors (1-4). For correct determination of heat changes it is necessary to calculate the contributions of all types of heat. It is the heat generated or lost due to the electrochemical reactions, heat generated due to the ohmic and polarization losses (Joule heat) and heat lost by contact with the environment.
Experiment
The issue of changes in the heat changes in the lead acid battery cell was dealt with a number of authors (1-4), but only in theory. Therefore, these theoretical calculations had to be supplemented by practical measurements with temperature sensors placed in the experimental lead acid battery cell. Pt100 temperature sensors are protected by epoxy resin against the effects of sulphuric acid. There are six sensors inside the cell located in electrolyte near the positive electrode (1 mm from the active mass outside of the electrode separated by AGM separator) electrolyte near the negative electrode, between positive and negative electrode (separated from the electrodes by AGM separator), at the positive active mass (inside the cell), at the negative active mass and outside the cell (sensing of ambient temperature). Experimental cell with temperature sensors (Fig. 1) after formation was subjected to several experiments investigating temperature changes during discharging, charging and standing.
Fig. 1: Scheme of the experimental cell with Pt100 sensors
258

13th Advanced Batteries, Accumulators and Fuel Cells Lead-acid batteries
In the first experiment the cell was discharged by 0.4 A to 1.6 V, then charged with the same current with voltage limitation 2.45 V. In this experiment it was suck off the electrolyte from the cell and only a small amount of electrolyte remained saturated inside the separator and active electrode masses. The resulting voltage and temperature dependence in different parts of the cell is in Fig. 2.
Temperature dependencies of individual parts of the cell are not very different from each other, because inside the cell due to large thermal conductivity of individual parts of the cell (both electrode and electrolyte) there is high temperature equalization. During the discharge temperature to rise at all sensors located inside the cell due to the Joule heat. It depends on the internal resistance, discharge current size and duration of discharge. Joule heat exceeds over cooling from the surrounding environment and cooling from the reversible endothermic heat of the total discharge reaction. During the discharge the internal resistance grows through to the creation of lead sulphate in active masses and thus it is also growing Joule heat, which contributes to global heating of the cell.
29
29.5
30
30.5
31
31.5
32
32.5
33
0
0.5
1
1.5
2
2.5
3
0 5 10 15 20 25
J [°C]U [V], I [A]
t [ h ]U I tellyt+ tneg tpos tellyt- tsurr
Fig. 2: Dependence of voltage and temperature of the cell in different parts of the cell during discharging and charging at constant current I = 0.4 A with voltage limitation 2.45 V.
At the end of the discharging and at the beginning of the charging the positive electrode sensor shows a decrease of the measured values of temperatures in comparison with the sensors positioned in other parts of the of the cell. This is caused by creation of a layer of lead sulphate during discharge between the sensor and a positive active mass. The lead sulphate layer thermally insulates the sensor, because lead sulphate is a good electrical and thermal insulator. At the beginning of the charging period starts re-dissolution of sulphates in the active mass and the measured value of temperature sensor in the positive electrode active mass come close to the temperatures measured at other sensors. During charging, the temperature drops on all sensors, which is related both to decrease the internal resistance, both with a decrease in charging current. Joule heat decreases and now prevails cooling from the environment, mainly through the vessel walls and current connection wires. This cooling also exceeds over reversible heat of the total charging
259

13th Advanced Batteries, Accumulators and Fuel Cells Lead-acid batteries
exothermic reaction that is decreasing with decreasing current. In addition, polarization resistance, which is applied during charging, it is limited by the maximum voltage 2.45 V, thus also gassing of the cell is reduced. Most of the charging current is utilized by the charging reaction.
At the end of the charging the cell was subjected the short-term (approx. 20 minutes) charging and discharging with current 0.4 A and there were again observed changes in temperature of individual parts of the cell. It is obvious that if the cell is fully charged, then during charging its temperature is increasing much faster than during discharging. This is related to a much larger value of polarization resistance of the cell during charging, that significantly contributes to Joule losses, against lower value of the internal resistance that contributes to Joule losses during discharging. We must also add to account the contribution of the reversible electrochemical reaction heat released (during charging) or consumed (during discharging).
In the next standing cell is cooling from the ambient environment. Cooling occurs primarily through the vessel walls and connecting wires, to a lesser extent through the ambient air convection and also through radiation.
The increase in of ambient temperature from about the 20th hour was caused by solar radiation falling to the temperature sensor, distorting the true value of the ambient air.
In the second experiment the cell was discharged by 0.2 A to 1.6 V, then charged with the same current without voltage limitation. In this experiment it was suck off the electrolyte from the cell and only a small amount of electrolyte remained saturated inside the separator and active electrode masses. The resulting voltage and temperature dependence in different parts of the cell is in Fig. 3.
24
26
28
30
32
34
36
1.5
1.7
1.9
2.1
2.3
2.5
2.7
2.9
0 10 20 30 40 50 60 70 80
J [°C]U [V]
t [ h ]U tellyt+ tneg tpos tsurr tellyt-
Fig. 3: Dependence of voltage and temperature of the cell in different parts of the cell during discharging and charging at constant current I = 0.2 A without voltage limitation.
Temperature curves during discharging and on the beginning of charging curves follow the temperature curves in the previous experiment. In other part of the charging with voltage
260

13th Advanced Batteries, Accumulators and Fuel Cells Lead-acid batteries
increase then there is a rapid temperature rise due to increase of polarization resistance (gassing of the cell begins to take place at the expense of the charging reaction). At the end of the charging due to the increase of ambient temperature (elevated ambient temperature reduces the cooling rate and accelerates the evaporation of water in the electrolyte) and the saturation of the AGM separator with gases generated by electrolysis of water it was started the oxygen and hydrogen cycle. It also sharply increased the temperature of the cell. In subsequent cycles was not started the oxygen and hydrogen cycle due to low ambient temperature and increased cooling rate of the cell and reduced speed of water evaporation in the electrolyte. In the following discharging a sharp temperature drop appeared in the cell. This drop continued at the beginning of charging and it is associated with increased cooling rate due to high temperature difference between the cell and its surroundings. This cooling exceeds the heating by the Joule heat.
Fig. 4 describes the dependence of voltage potentials and internal resistance of the cell. At the end of the first charging as a result of oxygen and hydrogen cycle both of the electrode potentials approaching to each other and it causes a decrease of overall cell voltage, as the negative electrode potential is growing due to the oxygen cycle and the potential of the positive electrode decreases due to the hydrogen cycle. From the dependence of the internal resistance it is clear that during discharging there is sharp increase of internal resistance, the dependence is exponential, the value of internal resistance at the end of discharge is about double compared with the beginning of discharge. This is related with the creation of lead sulphate during discharging inside the both electrodes. At the beginning of charging the internal resistance drops sharply, that is associated with the dissolution of lead sulphate on both electrodes and after exceeding of gassing voltage (2.45 V) a slight increase of internal resistance appears, that is probably caused by gases accumulated in the AGM separator during the electrolysis of water.
0.2
0.4
0.6
0.8
1
1.2
1.4
-1.5
-1
-0.5
0
0.5
1
1.5
2
2.5
3
0 10 20 30 40 50 60 70 80
R [W ]U [V], E+ [V], E- [V]
t [ h ]U E+ E- Ri
Fig. 4: Dependence of voltage, potentials and the internal resistance of the cell during discharging and charging at constant current I = 0.2 A without voltage limitation.
261

13th Advanced Batteries, Accumulators and Fuel Cells Lead-acid batteries
Conclusions
It were realized practical measurements of temperature changes in the experimental cell equipped with temperature sensors Pt100 in different modes of discharging and charging. Theoretical calculations of heat changes in the lead acid cell were confirmed by practical experimental measurements inside the cell. Optimum appears to be modification of charging mode, instead of charging with constant current it is better to use charging with voltage limitation around voltage 2.45 V, reducing both gassing of the cell and rise of the temperature. In constant current charging under unfavourable conditions (elevated ambient temperature and long overcharging) it can be started oxygen and hydrogen cycle, further increasing the cell temperature and it can lead to the collapse of the cell (thermal runaway).
Acknowledgements
This work was sponsored by the Internal grant No. FEKT–S–11–7 and by the EU project CZ.1.05/2.1.00/01.0014.
References
[1] D. Pavlov, Energy balance of the closed oxygen cycle and processes causing thermal runaway in valve-regulated lead/ acid batteries, Journal of Power Sources 64 (1997), p. 131-137, ISSN 0378-7753
[2] T. R. Crompton, MSc, BSc, Battery Reference Book, Third Edition, 2000, ISBN 0-7506-4625-X
[3] D.Berndt, Valve regulated lead-acid batteries, Journal of Power Sources 100 (2001), p. 29-46, ISSN 0378-7753
[4] H. A. Kiehne, Battery Technology Handbook, second edition, 2003, ISBN: 0-8247-4249-4
262

13th Advanced Batteries, Accumulators and Fuel Cells Lead-acid batteries
CONDUCTIVE CERAMIC AS AN ADDITIVE OF NEGATIVE ACTIVE MASS OF LEAD ACID BATTERY
Křivík, P., Bača, P., Tošer, P.
Department of Electrical and Electronic Technology, Faculty of Electrical Engineering and Communication, BUT, Technická 10, 616 00 Brno, Czech Republic
Abstract
There were performed experiments with a conductive additive Ti4O7 in negative active mass of lead acid battery. First results indicate that the additive throughout the tested range of weight percent does not improve the cycle life of the negative active mass in the partial state of charge (PSoC) cycling.
Introduction
When using lead-acid batteries under PSoC regime there are new mechanisms of failures appear known as PCL3. These failures are associated with progressive sulphation of the negative active material and they are caused by insufficient charging of the negative active mass and by intensive oxygen cycle. Possibility to eliminate PCL3 proved to be to use carbon as an additive in the negative active mass (1, 2). The original concept of the mechanism of carbon function in the negative active mass was based on the high conductivity of carbon, that can to improve conductance of the active mass especially in the last stages of the discharge (1, 3). In our previous experiments we studied the influence of carbon on the cycle life of the negative active mass in the PSoC cycling (4). The current experiment was focused on the ceramic material Ti4O7 produced by the English company Atraverda Ltd. under the registered trademark EBONEX. Ebonex ceramic is a conductor of metal type with conductivity about 300 Scm-1 comparable to that of carbon, but with excellent resistance to oxidation.
Experimental
We employed six experimental electrodes of dimensions 55 mm × 20 mm × 7 mm with disconnected parallel ribs pasted with negative active mass prepared according to an industrial recipe with the exception that no carbon additive was used. As an additive there was used a conductive ceramic Ti4O7 (EBONEX) at concentrations of 0.15, 0.46, 0.78, 1.4, 2.65 and 5.15 wt%. Each negative electrode was combined with two positive electrodes (with an excess of active mass) and two 1.7 mm thick AGM separators of the type BG260 EB170 (H&V). The electrode packs were inserted into cells that could be hermetically closed, and finally filled with sulphuric acid of the density of 1.28 gcm−3. The electrode potential was measured against the cadmium reference electrode.
Fig. 1 shows the structure of the Ebonex additive. The images were taken with help of a scanning electron microscope (SEM). There is evident a porous structure of
interconnected particles of size 5-10 m.
263

13th Advanced Batteries, Accumulators and Fuel Cells Lead-acid batteries
Fig. 1: Scanning electron microscope pictures of Ebonex structure
Formation
Formation was done in the flooded state with excess of electrolyte. Formation contains 4 hours of charging with current 0.2 A and 2 hour of standing. Number of formation cycles was 18, i.e. 72 hours of charging and 36 hours of standing (Fig. 2).
From the beginning of the formation is evident that the time of complete formation of the cells, when the cell voltage during charging exceeds the value of 2.6 V, and also the final charging voltage differs at individual concentrations of additive. It is summarized in Table 1, the final voltages of experimental electrodes were read in the 12th formation cycle.
Table 1: Evaluation of the formation rate
Concentration of Ti4O7 [wt%] 0.15 0.46 0.78 1.4 2.65 5.15
Time of complete formation [h] 28.1 21.6 28.1 26.8 23.9 31.9
U [V] 2.739 2.792 2.763 2.757 2.662 2.722
Cell voltage ranges from 2.66 to 2.79 V. The time of formation, needed to increase the voltage of the cell above 2.6 V for all electrodes were within 22-32 hours. Formation process of the electrode with the highest content of Ebonex (5.15%) lasted the longest time. We assume that this concentration of additive was too high and it caused a worsening of the electrolyte ions transport into the deeper structures of the electrode.
The highest voltage and the shortest time of complete formation has electrode with additive concentration 0.46%, with the final voltage 2.79 V and time of complete formation 21.6 h. The internal resistance of this cell was the highest, the final voltage was the highest from the beginning of formation procedures and subsequent experiments confirmed the higher internal resistance of this cell.
Unlike the previous experiments with carbon with the grain size from 3.5 to 5.5 m (4), which showed correlation between the quantity of additive and duration of complete
264

13th Advanced Batteries, Accumulators and Fuel Cells Lead-acid batteries
formation, there is no apparent correlation. We assume that the structure of Ebonex does not allow occupancy of internal pores of NAM (Ebonex particles are larger than the pores of NAM) and therefore increase the amount of Ebonex in NAM does not cause a significant blocking of pores of lead sponge and thereby slowing the transport of electrolyte. This is indirectly confirmed by our other work (5), where the formation time of the electrode without additive was approximately half than that of electrodes with micro milled additives.
2.00
2.10
2.20
2.30
2.40
2.50
2.60
2.70
2.80
2.90
0 5 10 15 20 25 30 35 40 45 50 55 60
U [V]
t [h]
Ti4O7 0,15%
Ti4O7 0,46%
Ti4O7 0,78%
Ti4O7 1,4%
Ti4O7 2,65%
Ti4O7 5,15%
Fig. 2: Formation of cells with Ebonex additive in negative active mass (NAM)
Conditioning cycling
During conditioning cycling there was performed in the flooded state 14 cycles. Cells were first discharged at constant current 0.7 A to the final voltage of 1.6 V and then charged at constant current of 0.7 A with voltage limitation of 2.45 V. The total discharge / charge process takes 24 hours.
Fig. 3 shows the dependence of capacity on number of conditioning cycles. Capacities of all electrodes during cycling decline, with the exception of the electrodes with the smallest time of complete formation (with 0.46 and 2.65% of Ti4O7). Capacity of these two electrodes increases with a maximum at 7th cycle. Shorter formation time is indicates the worse formation process.
Tab. 2 shows the ability of the charge acceptance during charging in the second and thirteenth conditioning cycle. Both cycles show that the best charge acceptance was achieved at the electrodes with the minimum and maximum concentration of additives. The lowest charge acceptance at the beginning of conditioning cycles showed cells with concentrations of 0.46 and 2.65% of Ti4O7, which also had the shortest time of complete formation. During conditioning cycling the charge acceptance at all electrodes slightly
265

13th Advanced Batteries, Accumulators and Fuel Cells Lead-acid batteries
improve by 3 to 8 percent. At the end of conditioning cycling the lowest charge acceptance has the cell with concentration of 2.65% of Ti4O7.
2.0
2.2
2.4
2.6
2.8
3.0
3.2
3.4
0 2 4 6 8 10 12 14 16
C [Ah]
Cycle No. [-]
Ti4O7 0,15%
Ti4O7 0,46%
Ti4O7 0,78%
Ti4O7 1,4%
Ti4O7 2,65%
Ti4O7 5,15%
Fig. 3: Dependence of capacity on number of conditioning cycles
Table 2: The ability of the charge acceptance during conditioning cycles
Concentration of Ti4O7 [wt%]
0.15 0.46 0.78 1.4 2.65 5.15
Q [%] 2nd cycle 71.9 62.0 70.1 66.3 61.2 72.8
Q [%] 13th cycle 79.6 70.5 77.5 70.1 64.6 77.7
Fast PSoC cycling – 1st run
The first of all free electrolyte was extracted from the cell vessels. Subsequently, the cell was sealed, discharged to 50% of capacity and the first PSoC run was started. PSoC cycle is composed of 4 parts:
Charging for 25 seconds, current 2.5 A Standing for 3 seconds Discharging for 25 seconds, current 2.495 A Standing for 3 seconds
Every hundredth PSoC cycle at the end of the charging and discharging the cell voltages and the negative electrode potentials were measured. PSoC run is terminated when the voltage of the cell falls below 1.5 V.
Voltage dependencies measured during discharging at the first PSoC run are in Fig. 4. The initial cell voltage during discharge ranged from 1.95 to 1.90 V. The shortest cycle life has an electrode containing 2.65% of Ebonex followed by electrode with 5.15% of Ebonex. Best results achieved with the lowest amount of additives, namely 0.15, 0.46 and 0.78% of Ebonex.
266

13th Advanced Batteries, Accumulators and Fuel Cells Lead-acid batteries
The experiment is still in progress and overall results will be known after finishing the experiments.
1.45
1.50
1.55
1.60
1.65
1.70
1.75
1.80
1.85
1.90
1.95
2.00
0 2000 4000 6000 8000 10000 12000 14000 16000 18000 20000 22000 24000
U [V]
cycle No.
Ti4O7 0,15%
Ti4O7 0,46%
Ti4O7 0,78%
Ti4O7 1,4%
Ti4O7 2,65%
Ti4O7 5,15%
Fig. 4: 1st PSoC run, discharging half cycle
Acknowledgements
This work was supported by the EU CZ.1.05/2.1.00/01.0014 and by the specific graduate research of the Brno University of Technology No. FEKT–S–11–7.
References
[1] Nakamura, M. Shiomi, K. Takahashi, M. Tsubota, J. Power Sources 59 (1996) 153. [2] M. Shiomi, T. Funato, K. Nakamura, K. Takahashi, M. Tsubota, J. Power Sources 64
(1997) 147 [3] A.F. Hollenkamp, W.G.A. Baldsing, S. Lau, O.V. Lim, R.H. Newnham, D.A.J. Rand,
J.M. Rosalie, D.G. Vella, L.H. Vu, ALABC Project N1.2, Final Report 2002, Advanced Lead-Acid Battery Consortium, Research Triangle Park, NC, USA, 2002
[4] P. Bača, K. Micka, P. Křivík, K. Tonar, P. Tošer, J. Power Sources 196 (2011) 3988 [5] P. Křivík, K. Micka, P. Bača, K. Tonar, P. Tošer, J. Power Sources 209 (2012) 15
267

13th Advanced Batteries, Accumulators and Fuel Cells Lead-acid batteries
INFLUENCE OF CHEMICAL COMPOSITION OF LEAD ALLOYS USED IN LEAD-ACID BATTERIES ON THEIR ELECTRICAL
PERFORMANCE
Wesołowski J.1, Lula M.2
1 Institute of Non-Ferrous Metals, Sowińskiego 5, 44-100 Gliwice, Poland 2 Institute of Non-Ferrous Metals Division in Poznan, Central Laboratory of Batteries and
Cells, Forteczna 12, 61-362 Poznan, Poland Corresponding author: Maciej Lula([email protected]) Phone Number: +48 61 27 97 882 Fax Number: + 48 61 27 97 897
Abstract
The grid in lead-acid batteries has a dual task. It serves as support for the active mass and conducts the electricity. For their production to use in advanced batteries, many different alloys are used. The type of applied alloy affects the battery performance very significantly. In this work the impact of the grid alloy on the battery electrical properties was investigated.
Laboratory performed capacity and cold crank CCA tests. Cyclic resistance, corrosion and mechanical tests are in progress. After conducting those tests and post-mortem studies the results can be used to determine the usefulness of the newly used alloys for the production process of the grid.
Introduction
The lead acid batteries are the most used batters in the world. The most commonly they are used in motor vehicles for engine starting, however it is just one of many other applications (such as communications devices, emergency lighting systems and power tools) due to its low costs and good performance.
The grid is one of the most curtail elements in the battery. In lead-acid batteries the grid has a dual task. It serves as support for the active masses and conducts electricity. Pure lead as a material is too soft and far too weak to be used as the grids. Therefore the grid is prepared from much more robust lead alloys. In the production of advanced batteries, many different alloys are used. The type of alloy applied, affects the battery performance very significantly. The influence of the type of the grid alloy on the battery electrical properties was investigated in this work. In the first stage, classical batteries were studied, composed of casted on the Wirtz machines grids, produced by the company LOXA BATTERIEN Ltd. (Żarki) with the formula composition of two commonly applied alloys: PbSb1,7Sn0,1As0,2Se and PbCa0,1AlSn1. Two types of batteries have been assembled, having capacities of 74 and 180 Ah. Also batteries with similar capacities designed for vehicles, were made:
74 Ah version for passenger cars with antimony alloy, calcium alloy and antimony-calcium alloy, 15 batteries each, 45 batteries in total.
268

13th Advanced Batteries, Accumulators and Fuel Cells Lead-acid batteries
180 Ah version for trucks with antimony alloy and antimony-calcium alloy, 15 batteries each, 30 batteries in total.
For the grid preparation two alloy formulations were used (in mass percentages):
• PbSb1Sn0, 2As0, 3SE (melting 284; Sb 1.06 Sn 0.18 As 0.25 Se 0.035, Bi 0.016)
• PbCa0, 1AlSn0, 5AG (melting 307; Ca 0.05 0.013 Al, Sn 0.5 Ag 0.04 Bi 0.014).
The performed tests of the batteries with the classic and modified grid were conducted according to PN-EN 50342-1:2007/A1: 2012
Fig. 1: Classic batteries - LOXA BATTERIEN Ltd.
Experimental
According to PN-EN 50342-1 at the batteries are subjected to the following series of tests:
• first capacity check • first CCA (Cold Cranking Amp) • second capacity check • second CCA (Cold Cranking Amp) • Third capacity check • third CCA (Cold Cranking Amp)
According to the standard, for both sample and Ce as the initial power value is required to achieve at least it one of the above three tests.
The battery capacity can be identified by the manufacturer as the rated capacity Cn (Ah) or reserve capacity Cr, n (min).20 hour rated capacity, is the amount of electrical charge expressed in [Ah] which a fully charged battery can give to reach its normal discharge for 20 hours at 25 ° C.The battery is discharged with constant current In until the voltage will drop to 10.5 V.
Initial current Icc specified by the manufacturer for the battery should provide power at a temperature of -180C for minimum 10 seconds with the minimal voltage of U = 7.50 V.The battery is placed in the cooling chamber until the temperature in the bulk of the battery reaches the -18 ° C. Time of this process takes about 24 h.Then discharge process begins, the voltage is noted and the battery is discharged with current Icc, after 10 seconds of discharge the voltage is checked again. The voltage value should not be lower than 7.50 V. The batteries discharge is stopped after 10 seconds, and discharged with Icc 0.6 to 6V voltage.
269

13th Advanced Batteries, Accumulators and Fuel Cells Lead-acid batteries
Result and discussion
Table 1: Classic batteries: 74 (AO 127) Ah and 180 Ah (AO 128) capacity tests.
identification
number
Current
[A]
Capacity [Ah] requirement
I II III
AO 127-1 3,7 73,45 72,42 70,85 74
AO 127-2 3,7 68,13 64,29 62,17 74
AO 127-3 3,7 75,17 74,53 73,01 74
AO 127-4 3,7 69,14 65,48 64,87 74
AO 127-5 3,7 70,85 69,27 69,41 74
AO 127-6 3,7 67,47 64,19 63,77 74
AO 127-7 3,7 74,34 73,60 71,12 74
AO 128-1 9,0 165,51 155,45 159,55 180
AO 128-2 9,0 172,04 161,71 166,66 180
AO 128-3 9,0 170,53 164,57 168,00 180
AO 128-4 9,0 171,87 162,90 163,20 180
AO 128-5 9,0 169,13 159,83 159,82 180
AO 128-6 9,0 173,62 163,48 163,32 180
AO 128-7 9,0 182,62 171,26 160,10 180
The table presents only chosen part of the tested batteries samples. Most of the batteries did not meet the requirements set by the EN 50342-1 standard. Only six batteries presented the declared by the producer capacities.
Fig. 2: Current discharge of sample AO 127-1(left) and AO 128-2 (right)
270
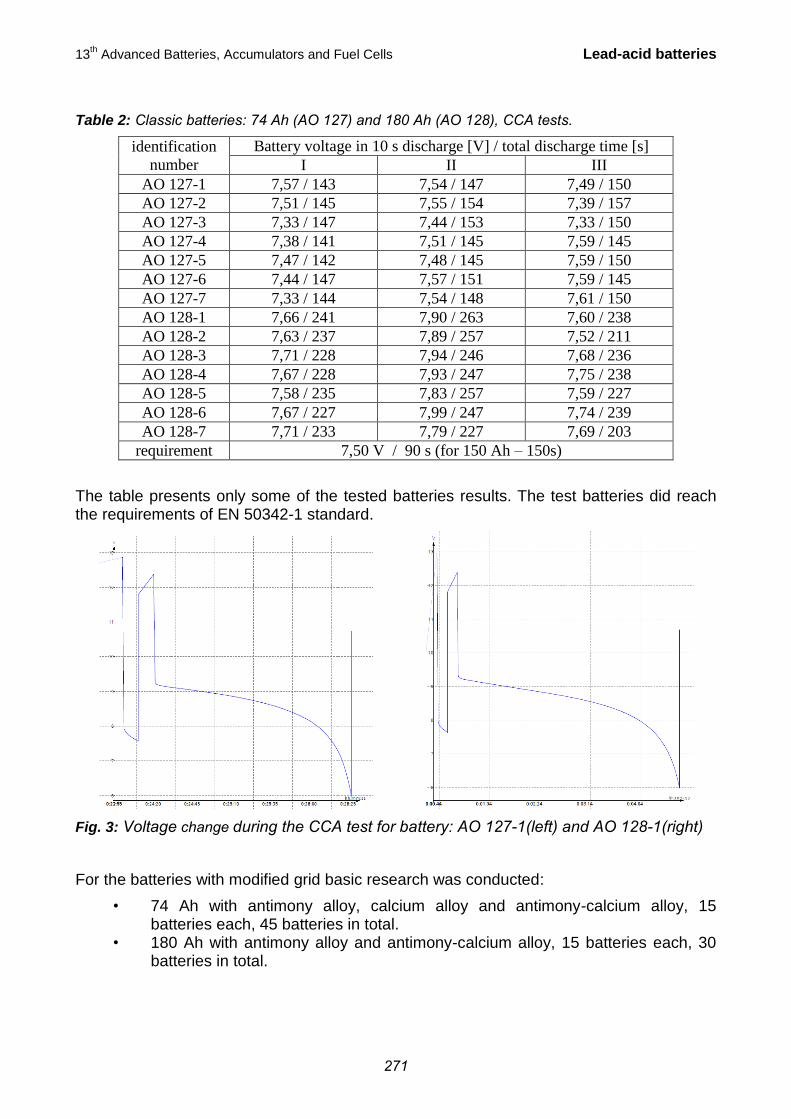
13th Advanced Batteries, Accumulators and Fuel Cells Lead-acid batteries
Table 2: Classic batteries: 74 Ah (AO 127) and 180 Ah (AO 128), CCA tests.
identification
number
Battery voltage in 10 s discharge [V] / total discharge time [s]
I II III
AO 127-1 7,57 / 143 7,54 / 147 7,49 / 150
AO 127-2 7,51 / 145 7,55 / 154 7,39 / 157
AO 127-3 7,33 / 147 7,44 / 153 7,33 / 150
AO 127-4 7,38 / 141 7,51 / 145 7,59 / 145
AO 127-5 7,47 / 142 7,48 / 145 7,59 / 150
AO 127-6 7,44 / 147 7,57 / 151 7,59 / 145
AO 127-7 7,33 / 144 7,54 / 148 7,61 / 150
AO 128-1 7,66 / 241 7,90 / 263 7,60 / 238
AO 128-2 7,63 / 237 7,89 / 257 7,52 / 211
AO 128-3 7,71 / 228 7,94 / 246 7,68 / 236
AO 128-4 7,67 / 228 7,93 / 247 7,75 / 238
AO 128-5 7,58 / 235 7,83 / 257 7,59 / 227
AO 128-6 7,67 / 227 7,99 / 247 7,74 / 239
AO 128-7 7,71 / 233 7,79 / 227 7,69 / 203
requirement 7,50 V / 90 s (for 150 Ah – 150s)
The table presents only some of the tested batteries results. The test batteries did reach the requirements of EN 50342-1 standard.
Fig. 3: Voltage change during the CCA test for battery: AO 127-1(left) and AO 128-1(right)
For the batteries with modified grid basic research was conducted:
• 74 Ah with antimony alloy, calcium alloy and antimony-calcium alloy, 15 batteries each, 45 batteries in total.
• 180 Ah with antimony alloy and antimony-calcium alloy, 15 batteries each, 30 batteries in total.
271

13th Advanced Batteries, Accumulators and Fuel Cells Lead-acid batteries
Table 3: Capacity of the batteries with modified grid 74 (AO 127) Ah and 180 Ah (AO 128)
identification
number
Current
[A]
Capacity [Ah] requirement
I II III
AO 127-16 3,7 63,15 88,80 60,80 74
AO 127-17 3,7 44,45 66,95 42,15 74
AO 127-18 3,7 53,90 72,73 50,70 74
AO 127-19 3,7 65,26 88,67 59,44 74
AO 127-20 3,7 48,25 45,29 43,75 74
AO 127-21 3,7 64,34 62,29 60,74 74
AO 127-22 3,7 48,45 68,92 44,51 74
AO 128- 16 9,0 162,17 157,50 151,31 180
AO 128-17 9,0 175,09 170,00 162,99 180
AO 128-18 9,0 147,82 145,06 140,31 180
AO 128-19 9,0 162,59 159,48 152,52 180
AO 128-20 9,0 151,98 145,26 136,23 180
AO 128-21 9,0 182,46 171,26 160,82 180
AO 128-22 9,0 151,78 148,66 135,81 180
The table presents only chosen results from all of the tested batteries. Most of the batteries did not match the requirements of EN 50342-1 standard.
Table 4: CCA Capacity of the batteries with modified grid 74 (AO 127) Ah and 180 Ah (AO 128)
identification
number
Battery voltage in 10 s discharge [V] / total discharge time [s]
I II III
AO 127-16 7,69 / 128 7,53 / 114 7,71 / 113
AO 127-17 7,80 / 139 7,68 / 128 7,80 / 129
AO 127-18 7,71 / 146 7,57 / 133 7,71 / 134
AO 127-19 7,77 / 142 7,64 / 124 7,81 / 122
AO 127-20 7,73 / 140 7,61 / 128 7,74 / 128
AO 127-21 7,79 / 142 7,64 / 122 7,82 / 121
AO 127-22 7,78 / 139 7,65 / 128 7,78 / 132
AO 128- 16 7,66 / 238 7,48 / 201 7,34 / 180
AO 128-17 7,66 / 230 7,48 / 205 7,49 / 188
AO 128-18 7,71 / 227 7,57 / 201 7,51 / 183
AO 128-19 7,71 / 235 7,49 / 215 7,47 / 198
AO 128-20 7,79 / 234 7,96 / 219 8,00 / 203
AO 128-21 7,41 / 154 7,70 / 143 7,84 / 148
AO 128-22 7,55 / 149 7,67 / 134 7,81 / 133
requirement 7,50 V / 90 s (for 150 Ah – 150s)
The table presents only part of the tested batteries. All batteries reached the requirements of EN 50342-1standard.
272

13th Advanced Batteries, Accumulators and Fuel Cells Lead-acid batteries
Fig. 4: Discharge curves for batteries with classic and modified grids.
10
10,5
11
11,5
12
12,5
13
13,5
0 2 4 6 8 10 12 14 16 18 20 22 24
Vo
lta
ge
[V
]
Time [h]
Batteries with classic grid
AO 127-1
AO 127-2
AO 127-3
AO 127-4
AO 127-5
AO 127-6
10
10,5
11
11,5
12
12,5
13
13,5
0 2 4 6 8 10 12 14 16 18 20
Vo
lta
ge
[V
]
Time [h]
Batteries with modified grid
AO 127-16
AO 127-17
AO 127-18
AO 127-19
AO 127-20
AO 127-21
273

13th Advanced Batteries, Accumulators and Fuel Cells Lead-acid batteries
Conclusion
Capacity and cold crank CCA tests were performed for the batteries with both classical and modified grids. Both types of batteries with the classic and a modified grid did not reach the capacity specified by the producer.
All batteries have passed the Cold Cranking Amp (CCA) tests.
Cyclic resistance, corrosion and mechanical tests are still in progress. After conducting these tests and the post-mortem studies of the batteries, there will be possible to determine the influence of those new alloys as material for the grids manufacture.
Acknowledgements
The authors acknowledge the financial support from the European Fund of Regional Development within the frameworks of the operating program –"Innovative Economy 2007–2013", under Project No. POIG.01.03.01-00-086/09.
274

13th Advanced Batteries, Accumulators and Fuel Cells Electrolytes
LAPLACE’S PRESSURE INDUCED RHOMBOHEDRAL PHASE IN THE SCANDIA-STABILIZED ZIRCONIA CERAMICS
Barbashov, V., Nesova, E., Pismenova, N.
Donetsk Phys. Tech. Institute, National Academy of Science of Ukraine, R. Luxemburg St. 72, 83114 Donetsk, Ukraine
Abstract
Grain-size effect on the conductivity and phase composition of scandia stabilized zirconia ceramics produced from DKKK (Japan) powder with composition 89 mol.% ZrO2 + 10 mol. % Sc2O3 + 1 mol. % CeO2 was established. It was shown using X-ray phase analysis
that decreasing the grain size of ceramics from 16 to 0.6 m leads in formation of rhombohedral phase. For fine-grained material, anisotropic properties of material are fixed clearly
in Arrhenius plots of ionic conductivity.
Introduction
Solid electrolytes based on solid solutions of zirconium oxide with aliovalent cation oxides (Y2O3, MgO, CaO, Sc2O3) have been developed for applications in electrochemical devices such as solid oxide fuel cells (SOFCs), oxygen sensors and catalytic membrane reactors due to their electrical properties (1). Among these compounds, scandia-stabilized zirconia (ZrO2:Sc2O3 – ScSZ) shows the highest value of electrical conductivity in the electrolytic temperature region 973-1073 K (2-4).
The present study is devoted to the grain-size effect on the conductivity and phase composition of scandia stabilized zirconia ceramics.
Experimental Procedure
Ceramic powder with exact chemical composition 89 mol.% ZrO2 + 10 mol. % Sc2O3 + 1 mol. % CeO2 was manufactured by Daiichi Kigenso Kagaku Kogyo (DKKK), Japan. The density and the average grain size of all studied ceramic specimens are shown in Table I.
Table I: Density, average grain size of all studied ceramic specimens
Composition ,
g/cm3
d,
mkm
89 mol.% ZrO2 + 10 mol. % Sc
2O
3 + 1 mol. % CeO
2 (DKKK) 5.4 16
89 mol.% ZrO2 + 10 mol. % Sc
2O
3 + 1 mol. % CeO
2 (DKKK) 5.77 8
89 mol.% ZrO2 + 10 mol. % Sc
2O
3 + 1 mol. % CeO
2 (DKKK) 5.86 0.6
275

13th Advanced Batteries, Accumulators and Fuel Cells Electrolytes
Variation of grain size in ceramics was obtained using the control of such parameters like temperature, sintering duration and powder pressing conditions.
Scanning Electron Microscopy (SEM) equipments were used to investigate the morphology of the sintered ceramics. Figure 1 shows SEM views of intergranular fracture of our ceramic specimens.
a) b) c)
Fig. 1: SEM views of fracture of DKKK ceramics a) 16 m; b) 8 m; c) 0.6 m.
Ionic conductivity was measured simultaneously with X-ray diffraction studies in Cu K radiation. Heating and cooling rates were below 2 K/min.
Results and Discussion
Arrhenius plots of ionic conductivity for DKKK ceramics 89 mol. % ZrO2 + 10 mol. % Sc2O3
+ 0.01 mol. % CeO2 (16; 8; 0.6 m) during first thermal cycles are presented in Figs. 1 and
3. Decreasing the grain size of ceramics from 16 to 0.6 m qualitatively changes the form
of lg(σ) – 1/T dependence. For ceramics with large grain size (16 m), curve of ionic conductivity demonstrate the anhysteretic kink at 713 K caused by presence of tetragonal phase (fig.2).
1,2 1,3 1,4 1,5 1,6
-2
-1
0
1
heating
cooling
lg(
T),
Oh
m-1
cm
-1K
103/T, K-1
d=16 mkm
Fig. 2: Arrhenius plots of ionic conductivity in DKKK ceramics 89 mol. % ZrO2 + 10 mol. % Sc2O3 + 0.01 mol. % CeO2 (16 m)
276

13th Advanced Batteries, Accumulators and Fuel Cells Electrolytes
For material with the twice smaller grain size (8 m), this curve obtains the sigmoid form (fig. 3).
1,2 1,4 1,6 1,8-4
-2
0
lg(
T), O
hm
-1 c
m-1
K
1/T,10-3K-1
heating
cooling
d = 8 m
Fig. 3: Arrhenius plots of ionic conductivity in DKKK ceramics 89 mol. % ZrO2 + 10 mol. % Sc2O3 + 0.01 mol. % CeO2 (8 m)
For fine-grained ceramics (0.6 m), lg(σ) – 1/T curves demonstrate the hysteretic kink (fig. 4) caused by the presence of rhombohedral phase.
1.1 1.2 1.3 1.4 1.5 1.6 1.7 1.8 1.9 2.0
-4
-3
-2
-1
0
1
lg(
T),
Oh
m-1c
m-1K
1/T(10-3 K-1)
heating
cooling
d =0.6 m
Fig. 4: Arrhenius plots of ionic conductivity in DKKK ceramics 89 mol. % ZrO2 + 10 mol. % Sc2O3 + 0.01 mol. % CeO2 (0.6 m)
277

13th Advanced Batteries, Accumulators and Fuel Cells Electrolytes
20 40 60 80
Inte
nsit
y (
a.u
)
2 deg
c
c cc
Fig. 5: Phase composition in DKKK ceramics 89 mol. % ZrO2 + 10 mol. % Sc2O3 + 0.01 mol. % CeO2 (0.6 m)
Laplace’s pressure grows with decreasing the grain size, and for the grains with a
diameter 0.6 m it reaches a value 0.33 GPa. This value is enough to transfer the material from the tetragonal phase to rhombohedral phase which has the significantly lower conductivity. This conclusion fully corroborates with our results of X-ray phase analysis (fig. 5).
All specimens sintered from DKKK powder don’t show the previously studied (5-6) low-temperature kinks on Arrhenius plots of ionic conductivity. However, the ionic conductivity value is reduced to a second for the specimen orthogonal directions within temperature range 640 to 740 K, and anisotropic properties of the specimen are the controlled parameter.
Acknowledgments
The authors would like to thank Dr. G. Ya. Akimov and Yu. A. Komysa for help in experimental procedures.
References
[1] M. Liu, C. He, J. Wang, W. G. Wang, and Z. Wang, J. Alloys and Compounds, 502, 319–323 (2010).
[2] M. Hirano, T. Oda, K. Ukai, and Y. Mizutani, J. Amer. Ceram. Soc., 85, 1336 (2002). [3] A. J. Feighery and J. T. S. Irvine, Solid State Ionics, 121, 209 (1999). [4] R. Chiba, F. Yoshimura, J. Yamaki, T. Ishii, T. Yonezawa, and K. Endou, Solid State
Ionics, 104, 259 (1997). [5] V. Barbashov, N. Pismenova and O. Radionova, Physica status solidi A, 209,
727(2012). [6] V. I. Barbashov, V. M. Timchenko, E. V. Nesova, ECS Transactions, 40, 197 (2012).
278

13th Advanced Batteries, Accumulators and Fuel Cells Electrolytes
DYNAMIC VISCOSITY OF SOLVENTS FOR ELECTROLYTES OF LITHIUM-ION ACCUMULATORS
Frk, M., Máca, J., Rozsívalová, Z.
Department of Electrical and Electronic Technology, Faculty of Electrical Engineering and Communication, BUT, Technická 10, 616 00 Brno, ČR
Corresponding author: Martin Frk ([email protected]) Phone: +420 541 146 127
Abstract
The article deals with description of rheological properties of solvents for electrolytes of lithium-ion accumulators. Solvents mixture of dimethyl sulfone and sulfolane at different volume ratios and with a lithium salt (LiClO4) appear as potentially suitable electrolyte. The aim of this experiment is to investigate the rheological properties, particularly density and dynamic viscosity, of solvents with lithium salt in temperature dependence and to find the optimal composition of the electrolyte from the perspective of achieving the lowest dynamic viscosity and better electrical conductivity because both quantities are closely related in accordance with Walden’s rule. The vibration method is used to determine the values of dynamic viscosity.
Introduction
Lithium-ion accumulators are among the power sources suitable, especially for the mobile applications, medical devices and electric vehicles. Rheological properties description of the electrolytes is one of the most important non-electrical physical quantities. These properties, in particular the value of dynamic viscosity, are decisive for the selection of suitable electrolyte solvents usable in lithium-ion accumulators. Solvents mixture of dimethylsulfone and sulfolane with a lithium salt (in particular case LiClO4) appear as potentially suitable electrolyte. The resulting ratio of the components depends on the desired properties to be achieved.
Used solvents
Sulfolane from structure are to sulfur atom with a double bond bounded two atoms of oxygen and a carbon ring composed from four carbon atoms. The sulfur – oxygen bond is polar which enables a good dissolving in water (is completely miscible with water). The carbon ring is nonpolar so it is possible blend with water and hydrocarbons. Sulfolane is used as an industry solvent and for purification of natural gas and the most used solvent for aromatics purification [2]. Dimethyl sulfone aka. methylsulfonylmethane (MSM), is an organic sulfur compound, it is a white crystalline solid at room conditions. Dimethyl sulfone is used in high temperature industry for organic and inorganic as extraction and reaction solvent, metal and fungicide treatment. Selected properties of used solvents are shown in Table 1.
279
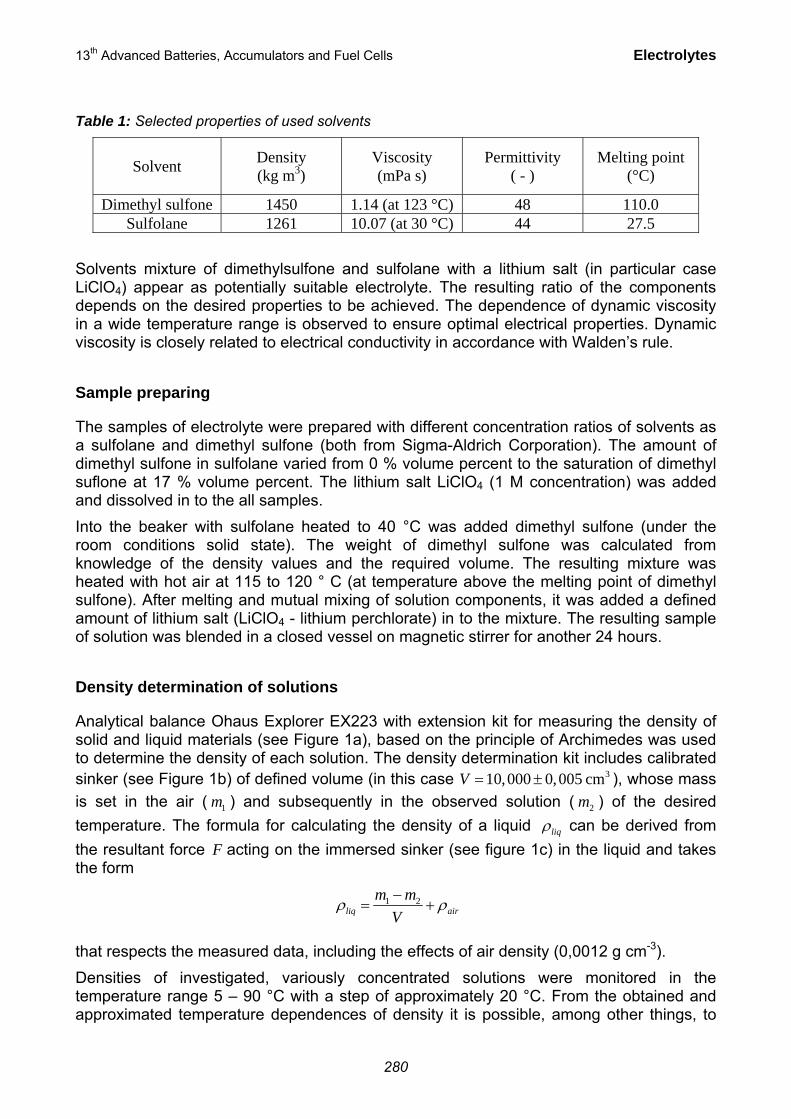
13th Advanced Batteries, Accumulators and Fuel Cells Electrolytes
Table 1: Selected properties of used solvents
Solvent Density (kg m3)
Viscosity (mPa s)
Permittivity ( - )
Melting point (°C)
Dimethyl sulfone 1450 1.14 (at 123 °C) 48 110.0 Sulfolane 1261 10.07 (at 30 °C) 44 27.5
Solvents mixture of dimethylsulfone and sulfolane with a lithium salt (in particular case LiClO4) appear as potentially suitable electrolyte. The resulting ratio of the components depends on the desired properties to be achieved. The dependence of dynamic viscosity in a wide temperature range is observed to ensure optimal electrical properties. Dynamic viscosity is closely related to electrical conductivity in accordance with Walden’s rule.
Sample preparing
The samples of electrolyte were prepared with different concentration ratios of solvents as a sulfolane and dimethyl sulfone (both from Sigma-Aldrich Corporation). The amount of dimethyl sulfone in sulfolane varied from 0 % volume percent to the saturation of dimethyl suflone at 17 % volume percent. The lithium salt LiClO4 (1 M concentration) was added and dissolved in to the all samples. Into the beaker with sulfolane heated to 40 °C was added dimethyl sulfone (under the room conditions solid state). The weight of dimethyl sulfone was calculated from knowledge of the density values and the required volume. The resulting mixture was heated with hot air at 115 to 120 ° C (at temperature above the melting point of dimethyl sulfone). After melting and mutual mixing of solution components, it was added a defined amount of lithium salt (LiClO4 - lithium perchlorate) in to the mixture. The resulting sample of solution was blended in a closed vessel on magnetic stirrer for another 24 hours.
Density determination of solutions
Analytical balance Ohaus Explorer EX223 with extension kit for measuring the density of solid and liquid materials (see Figure 1a), based on the principle of Archimedes was used to determine the density of each solution. The density determination kit includes calibrated sinker (see Figure 1b) of defined volume (in this case 310,000 0,005 cmV = ± ), whose mass is set in the air ( 1m ) and subsequently in the observed solution ( 2m ) of the desired temperature. The formula for calculating the density of a liquid liqρ can be derived from the resultant force F acting on the immersed sinker (see figure 1c) in the liquid and takes the form
1 2 liq airm m
Vρ ρ−
= +
that respects the measured data, including the effects of air density (0,0012 g cm-3). Densities of investigated, variously concentrated solutions were monitored in the temperature range 5 – 90 °C with a step of approximately 20 °C. From the obtained and approximated temperature dependences of density it is possible, among other things, to
280

13th Advanced Batteries, Accumulators and Fuel Cells Electrolytes
determine the coefficients of volume expansion of solutions which in liquid materials are not generally negligible. To achieve the lower temperature range, respectively higher temperature range than the ambient temperature, the temperature chamber CLIMACEL 111 was used, in which the temperature stabilization of all solutions samples proceed. The beaker with solution was immersed in the vessel with synthetic organic ester fluid to ensure sufficient thermal stability in the course of density measurement. The digital thermometer GREISINGER 3710 with a probe Pt100 Class A was used to determine the actual temperature of solutions (see Figure 1c).
Fig. 1: a) Instrumentation Ohaus including density determination kit, b) detail of glass sinker, c) the physical principle and the thermal stabilization of the solution in the course of experiment
The volumetric changes of the solution, respectively calculated density values in the temperature dependence were approximated by the mathematical function in the form,
( ) ( )20
20 1 , resp. 1
V V ρβ ϑ ρβ ϑ
= + ∆ =+ ∆
which takes into account only the linear coefficient of volume expansion β . Quadratic term which is very small is applied in the case of higher temperature differences ϑ∆ and therefore is neglected here. Temperature dependencies of the density of the solutions with limit DMSO2 concentrations (0 and 17 % volume percent) are shown in Figure 2. The displayed curves create a sector. Within this area, the dependencies are situated for solutions with other concentrations, but for greater lucidity, are not shown graphically. The calculated values of the coefficient of volume expansion β and density of the solutions 20ρ at 20 ° C are listed in Table 2 with the volume percentage DMSO2 as a parameter. Table 2: Selected physical properties of the investigated solutions at various concentrations
vol% DMSO2 0 % 3 % 6 % 9 % 12 % 15 % 17 %
ρ20 (g.cm-3) 1,315 1,315 1,313 1,310 1,310 1,309 1,307 β (10-4 K-1) 6,93 6,86 6,86 6,89 7,17 6,58 6,51
b)
G VZF F F= −
ambϑϑ
ϑ
+
a) c)
281

13th Advanced Batteries, Accumulators and Fuel Cells Electrolytes
1,24
1,25
1,26
1,27
1,28
1,29
1,30
1,31
1,32
1,33
0,0 10,0 20,0 30,0 40,0 50,0 60,0 70,0 80,0 90,0 100,0
ρ(gcm
‐3)
ϑ (°C)
0% DMSO2
17% DMSO2
Fig. 2: The temperature dependencies of the density of solution
Dynamic viscosity measurement of solutions
Viscosity (dynamic or kinematic) is a characteristic property of liquid and it expresses the rate of internal fluid friction that occurs at mutual motion of parallel to each other adjacent layers. It is closely linked with the internal structure of liquids. The course of viscosity varies considerably with temperature. The temperature dependence has always decreasing character which is possible in most cases to express by the empirical Arrhenius mathematical function in the form
bTA eη = ⋅
where A is a characteristic material constant dependent on the frequency of thermal vibration and on distance of individual liquid molecules (sometimes referred to as the viscosity η∞ at high temperature T →∞ ) and physical quantity b is equal /Ab E R= ( AE is the flow activation energy and R is universal gas constant). This relation also often used to represent experimental viscosity data for pure fluid and fluid mixtures solutions [3], [4]. The vibration method was used to determine the values of dynamic viscosity. The general principle of viscosity measurement method consists in the transfer of current, required for keeping constant frequency and amplitude of the vibrations of the sensor plates immersed in the observed liquid, on the apparent viscosity. Viscometer A&D SV series composed of two thin sensor plates with gold surface treatment that are driven with electromagnetic force at the same frequency by vibrating at constant sine-wave vibration in reverse phase like a tuning-fork. The electromagnetic drive controls the vibration of the sensor plates to keep in constant amplitude (see Figure 3a). The driving electric current, which is exciting force, will be detected as the magnitude of viscosity produced between the sensor plates
( ) ( )4
1,315 1 6,93 10
ρ ϑϑ−
=+ ⋅ ∆
( ) ( )4
1,307 1 6,51 10
ρ ϑϑ−
=+ ⋅ ∆
282

13th Advanced Batteries, Accumulators and Fuel Cells Electrolytes
and the sample fluid. The coefficient of viscosity is obtained by the correlation between the driving electric current and the magnitude of viscosity. Conversion of apparent viscosity
apη on dynamic η is conditioned by knowledge of the sample density.
Fig. 3: a) Scheme and the physical principle of vibration viscometer A&D SV10 [2] b) connection of the viscometer to the Internet
The automated laboratory workplace was assembled to measure rheological properties of fluids in temperature range. Also, Agilent graphical language environment VEE Pro was used for the communication between computer and viscometer A&D SV 10 and analytical balance Ohaus Explorer Ex223. Serial communication interfaces of viscometer and bath thermostat were connected to the USB/RS232 Interface Agilent E5805A whose USB output was directly interconnected to the Networked LAN/USB Hub Agilent E5813A that provides access to the Internet (see Figure 3b). In this way, it is possible to remotely control the instruments which are equipped with serial interface RS232 only over Internet.
The measured apparent viscosity values apη were converted to dynamic viscosity for all measured temperature according to the relationship
( ) ( )ap
rel
TT
ηη
ρ=
where relρ is the relative density of the sample, i.e. the value of the density related to the unit density to which the instrument is calibrated. Temperature dependencies of the dynamic viscosity of the solutions with limit DMSO2 concentrations (0 and 17 % volume percent) again are shown in Figure 4 (discreet points). As one can see from this figure, the viscosity of solutions monotonically decreases with increasing temperature. Temperature dependencies of viscosity were approximated by the Arrhenius function using the least squares method and the resultant courses are plotted graphically in Figure 4 (solid line) including relevant equations.
RS232/LAN USB/LAN interface Agilent
a) b)
f
Liquid level
283

13th Advanced Batteries, Accumulators and Fuel Cells Electrolytes
0,0
10,0
20,0
30,0
40,0
50,0
60,0
270 290 310 330 350 370 390
η(m
Pa s)
T (K)
DMSO2 0%
DMSO2 17%
Fig. 4: The temperature dependencies of the dynamic viscosity
Conclusion
Theoretical information about vibration method of viscosity measurement was summarized and initial results were published in the article. Dynamic viscosity of seven solutions of dimethyl sulfone and sulfolane at different volume ratios (0, 3, 6, 9, 12, 15 and 17 vol % DMSO2) and with a lithium salt (LiClO4) have been measured with vibration techniques in temperature range from 275 to 375 K. All of these solutions have approximately the same value of the coefficient of volume expansion β which takes the value around 6,90.10-4 K-1. Solution (17 vol % DMSO2) exhibited the lowest value of the dynamic viscosity in whole temperature range and appears as potentially more suitable for electrolyte from the perspective of rheological properties. The values of flow activation energy will be calculated from the temperature dependencies of dynamic viscosity in the course of other experimental activities. Subsequently it will be examined the behaviour of solutions in DC and AC electric field to obtain the frequency dependencies of relative permittivity and electrical conductivity which is closely related to dynamic viscosity in accordance with Walden’s rule.
( )2602
3 3,91 10 TT eη⎛ ⎞⎜ ⎟− ⎝ ⎠= ⋅ ⋅
( )2425
3 5,76 10 TT eη⎛ ⎞⎜ ⎟− ⎝ ⎠= ⋅ ⋅
284

13th Advanced Batteries, Accumulators and Fuel Cells Electrolytes
Acknowledgements
This work was supported by the grant FEKT-S-11-7 "Materiály a technologie pro elektrotechniku", FRVŠ 451/2012/F1/a „Rozšíření laboratorních úloh s materiálovou tématikou o internetový přístup pomocí mobilních zařízení“, grant GAČR P102/10/2091, „Increase the safety of lithium-ion batteries“ and project CZ.1.07/2.3.00/20.0103 “Support for human resources and transfer of knowledge in conditions of international cooperation of research teams“.
References
[1] Marcus, Y. The properties of solvents. John Wiley & Sons Ltd, 1998. 399 pages. [2] A&D Company Limited. SV-A Series Users’ Handbook Version 1.13E. June 2009 [3] Reid, R.C., Prausnitz, J.M. & Poling, B.E. (1987). The Properties of Gases and
Liquids, 4th edn. NY: McGaw-Hill. [4] Horvath, A.L. (1985). Handbook of Aqueous Electrolyte Solutions: Physical
Properties, Estimation Methods and Correlation Methods. West Sussex, England: Ellis Horwood.
285

13th Advanced Batteries, Accumulators and Fuel Cells Electrolytes
USE OF DIMETHYL SULFONE IN APROTIC ELECTROLYTES
Máca, J., Vondrák, J., Sedlaříková, M.
Department of Electrical and Electronic Technology, Faculty of Electrical Engineering and Communication, BUT, Technická 10, 616 00 Brno, Czech Republic
Abstract
The aim of this work is to determination the influence of dimethyl sulfone on electrical properties of electrolytes. Dimethyl sulfone is an adjacent product by many chemical manufactory. The key thought of this article is to find a possibility to use of this adjacent product. In this work is dimethyl sulfone used as additive into commonly applied solvents that are used for aprotic electrolytes. There will be established properties in low flammable solvent such as sulfolane too. The article will discussed specific conductivity of this solvents mixtures.
Main used solvents
As one of possible solvents was used sulfolane due his higher fire safety[1]. Sulfolane is clear colorless liquid (with melting point 27.5 °C). From structure are to sulfur atom with a double bond bounded two atoms of oxygen and a carbon ring composed from five carbon atoms. The sulfur – oxygen bond is polar which enables a good dissolving in water (is completely miscible with water). The carbon ring is nonpolar so it is possible blend with water and hydrocarbons. Sulfolane is used as industry solvent and for purification of natural gas and the most used solvent for aromatics purification[2].
Dimethyl sulfone aka. Methylsulfonylmethane (MSM), is an organic sulfur compound, it is a white crystalline solid at room conditions. Dimethyl slufone is used in hight temperature industry for organic and inorganic as extraction and reaction solvent, metal and fungicide treatment. Selected properties of used solvents are shown in Table 1.
Table 1: Properties of used solvents
Solvent Density
[ kg·m3 ]
Viscosity
[ mPa·s ]
Permittivity
[ - ]
Melting point
[ °C ]
Dimethyl sulfone 1450 1.14 (at
123°C)
48 110.0
Sulfolane 1261 10.07 (at
30°C)
44 27.5
Ethylene carbonate 1321 1.50 (at 40°C) 89 36.3
Propylene carbonate 1190 2.50(at 25°C) 65 -55.0
Electrochemical Impedance Spectroscopy (EIS) is a method used among other for description electrochemical processes on electrode - electrolyte interface and in electrolytes. Passage of current through an electrochemical cell leads to a polarization processes with prevents the passage of current they are e.g. transition of electro active materials, creating of SEI layer or transport particles from electrolytes to electrode. Each of this processes by passage AC signal which changing frequency have a various response
286

13th Advanced Batteries, Accumulators and Fuel Cells Electrolytes
and with a phase-sensitive current rectifiers and appropriate displaying it is possible to value the equivalent circuit with characterizes researched system[3].
Experimental
Amount of dimethyl sulfone (DMSO2, from Sigma - Aldrich) was weighed for defined volume from knowledge of its density. DMSO2 was than mixed with second solvents. The sample was heated with hot air gun to temperature 115- 120°C. (temperature over melting point of dimethyl slulfone).
At first was determined saturation of DMSO2 in second solvent. In first step was increased the volume concentration of DMSO2 in second solvent each 5% from 10% to 30% for mixture with sulfolane and mixture with propylene carbonate and from 5% to 80% for mixture with ethylene carbonate. The mixture was heated with help of hot air gun and stand for 24 hours. By visual control was determined in which samples the DMSO2 has crystallized again. The interval between sample which crystallized and sample which does not crystallized was split in 1% step for determination the saturation border more precise. The results of saturation measurement are shown in Table 2.
After DMSO2 dissolution was into the solvents mixture added lithium perchlorate (Sigma-Aldrich) in 1 mol·l-1 concentration and the samples were mixed on cylindrical homogenizer for 24 hours.
Resistance of electrolytes was measured in conductivity cell consisting from glass body and two platinum electrodes covert by platinum black. Resistance of electrolytes was measured by impedance spectroscopy in frequency range from 1 MHz to 100 Hz. Each sample was measured ten times and in the case that the corves in Nyquist graph were overlapped (does not get to temperature shift) was the values of equivalent circuit parts calculated. In the Nyquist graph was the linear part selected and from equivalent circuit which was composed from resistor and constant part element was the electrolytes resistance defined. Compering with a reference sample (1 mol·l-1 of KCl γ = 111.8 mS·cm-1
at 25°C from company Penta) was the specific conductivity of electrolytes determined. The determined values are presented in Table 3 and Table 4.
Table 2: Saturation of dimethyl sulfolane in second solvent
Dimethyl sulfone
Second solvent Volume saturation concentration
[ % ]
Sulfolane 17
Propylene carbonate 15
Ethylene carbonate 25
Due the higher permittivity of ethylene carbonate, was the volume of dimethyl sulfone dissolved in ethylene carbonate higher than in other solvents.
287

13th Advanced Batteries, Accumulators and Fuel Cells Electrolytes
Table 3: Measuring results of specific conductivity for sulfolane and proplylene carbonate
Volume concentation of
dimethyl sulfone [%]
Sulfolane Propylene carbonate
γ [mS·cm-1
] γ [mS·cm-1
]
0 2.69 1.33
3 2.71 1.33
6 2.76 1.31
9 2.80 1.29
12 2.84 1.28
15 2.87 1.27
17 2.90 -
Fig. 1: Specific conductivity dependence of dimethyl sulfone volume concentration in sulfolane
The specific conductivity of DMSO2 and sulfolane is increased with increasing DMSO2 volume concentration due the lower viscosity of the system. The highest conductivity is on the saturation border of dimethyl sulfon 17%.
In figure 2 we can see that the conductivity of electrolyte is decreasing with increasing DMSO2 concentration. It could be caused by lower permittivity of dimethyl sulfone as can be seen in table 1.
Table 4: Measuring results of specific conductivity for ethylene carbonate
Volume concentation of
dimethyl sulfone [%]
Ethylene carbonate
γ [mS·cm-1
]
0 11.93
5 11.48
10 11.21
15 10.81
20 10.40
25 9.99
288

13th Advanced Batteries, Accumulators and Fuel Cells Electrolytes
Fig. 2: Specific conductivity dependence of dimethyl sulfone volume concentration in propylene carbonate
Fig. 3: Specific conductivity dependence of dimethyl sulfone volume concentration in ethylene carbonate
289

13th Advanced Batteries, Accumulators and Fuel Cells Electrolytes
Conclusion
Measurement of different solvent was made. The saturation of dimethyl sulfon in another solvent and specific conductivity of electrolytes based on mixtures of DMSO2 and lithium salt was done. From measured curves it is clear that dimethyl sulfone increases specific conductivity in mixture with sulfolane, highest conductivity was with 17% of DMSO2 and that 1.33 mS·cm-1. On the other hand decreases the specific conductivity in propylene carbonate and ethylene carbonate. It is clear that the addition of DMSO2 into the solvent, with higher fire safety, improves it‘s electrical properties.
Acknowledgements
Grant Agency of Czech Republic, Project P102/10/2091 Increase the safety of lithium-ion batteries and specific research FEKT-S-11-7 Materials and technologies for electronics.
References
[1] J.Máca, M. Sedlariková, J. Vondrák, K Bartusek, Physical Properties of Sulfolane – Dimethyl carbonate Mixture for Using in Electrolytes for Lithium-Ion Batteries. ECS Transactions 2012, Volume 40, Issue 1, Pages 53-57.
[2] Marcus, Y. The properties of solvents. John Wiley & Sons Ltd, p. 399 (1998).
[3] J. Barek, F. Opekar, K Štulik, Electroanalytical chemistry. Karolinum, p.188 (2005) [4] A. Abouimrane, I. Belharouak, K. Amine, Sulfone-based electrolytes for high-voltage
Li-ion batteries. Electrochemistry Communications, Volume 11, Issue 5, May 2009, Pages 1073-1076
[5] J. Máca, M. Sedlaříková, J. Vondrák, K. Bartušek, Phase Diagram For Mixtures Of Sulfolane - Dimethylcarbonate For Using In Electrolytes For Lithium - Ion Batteries. In Advanced Batteries Accumulators and Fuel Cells 12th ABAF Proceeding of the ABAF- 12 Meeting. 1. Brno: Brno University of Technology, p. 65-68. ISBN: 978-80-214-4357- 0 (2011).
[6] Xiaoguang Sun, C. Austen Angell, Doped sulfone electrolytes for high voltage Li-ion cell applications. Electrochemistry Communications, Volume 11, Issue 7, July 2009, Pages 1418-1421
290

13th Advanced Batteries, Accumulators and Fuel Cells Electrolytes
MEMBRANES FOR ALKALINE ACCUMULATORS
Musil, M., Kunovjanek, M., Cech, O., Pleha, D.
Department of Electrical and Electronic Technology, Faculty of Electrical Engineering and Communication, Brno University of Technology, Technická 10, 616 00 Brno, Czech
Republic
Corresponding author: Michal Musil ([email protected]) Phone: +420 541146109
Abstract
In this paper are given global information about our recent research in the field of membranes for alkaline accumulators. Various types of experimentally prepared membranes were tested. We were focused on ionic conductivity and dendritic resistance measurements and on stability in highly alkaline liquid electrolytes. Different materials for electrode coating were also tested as ionic conductivity membranes and holders for active electrode material.
Introduction
Principle of the nickel-zinc accumulator was firstly described at the beginning of the 20th century. First prototypes appeared during thirties of the 20th century. That kind of accumulators was not succesful on the market; the only reason was short lifetime of this product. Nowadays, potential of this electrochemical cell appears. Good electrical properties and recycle possibilities (in comparison with NiCd system). Lifetime of NiZn batteries is still limiting factor. The main prospective usage of these accumulators is replacing NiCd accumulators (cadmium is toxic and recycling is difficult).
Nickel - zinc accumulator consists of Ni (positive) electrode and Zn (negative) electrode. Electrolyte is KOH solution in water enriched with additives, which restrict dendritic growth of the zinc electrode and improve cyclic lifetime of the accumulator.
Basic properties of NiZn accumulators:
Nominal cell voltage 1,65 V. NiCd and NiMH have only 1,2V. Therefore, NiZn accumulators are suitable in appliances designed for primary batteries.
Low self-discharge – 8 % per month
High specific energy - 55 ÷ 75 Wh·kg-1
Specific power – over 200 W·kg-1
Easy to recycle – NiZn accumulators do not contain lead, mercury and cadmium neither.
Low price of active materials
Good electrical properties at low temperatures
Short lifetime is main drawback of NiZn accumulators, it prevents from having success on the market. Short lifetime is mainly caused by dendritic growth of Zn electrode during the charging process, which leads to short-circuit.
291

13th Advanced Batteries, Accumulators and Fuel Cells Electrolytes
Specific charging process in specialized charger for NiZn accumulators.
Experimental
Our research group prepared 11 appropriate PVA membrane types, which were subsequently tested. All samples were tested for the ionic conductivity; these with low resistivity were subsequently measured for the zinc impenetrability.
Membranes were several days conditioned in 5,6 mol/l KOH electrolyte in the room temperature. Membrane resistivity was measured within four electrode glass cell filled with 5,6 mol/l alkaline electrolyte. Membrane was embedded in the center of the cell. Electric current flowed between working electrodes. Reference electrodes were used to determine drop of potential on the membrane. Electric resistance of membrane was calculated thus. Experiment took place in the tempered cell with temperature set on 20 °C.
Membrane resistivities are shown in table 1. It is obvious, that best resistivity result has membrane no. 2, prepared in bulk with KOH electrolyte and glycerol. The same membrane crosslinked with borax (sample no. 3) has almost two times higher resistance. Membrane no. 1 exhibits very low resistance, but we must take into account its small thickens. Resistivity is low too in comparison with previous membranes. Membranes based on NASA Technical Paper 1407 exhibit very high electric resistance, especially with increasing amount of crosslinker glutaraldehyde. Membrane no. 8 with 5 % of glutaraldehyde proved no conductivity. Commercially produced membranes from the company Membrain exhibit very high electric resistance in comparison with PVA membranes. Membrane no. 11, produced by the Academy of Science of the Czech Republic (CAS) does not have long-time resistance to the liquid KOH electrolyte.
Fig. 1: Four electrode glass conductivity cell
292

13th Advanced Batteries, Accumulators and Fuel Cells Electrolytes
Table 1: PVA membranes thicknesses and resistivities
č. vzorku l [mm] R [Ω]
1 0,131 0,088 2 0,558 0,049 3 0,565 0,100 4 0,276 0,250 5 1,029 0,274 6 0,261 1,646 7 0,185 1,025 8 0,366 49,785 9 0,598 2,370
10 11
0,533 0,242
2,291 0,719
Selected membranes (samples 1, 2, 4, 5, 6 and 11) were measured for the zinc impenetrability. This measurement was carried out in two electrode cell, which simulated processes in battery. Cell consists of 2 electrodes and membrane in the center of them. Electric current flows between electrodes through the tested membrane. Membrane separates conductivity cell into two isolated spaces. Both sides of the cell are poured with 5,6 mol/l electrolyte. On the side of the negative electrode is liquid electrolyte saturated with Zn ions. Through the cell flows defined current within specific time. Zn ions concentration in the electrolyte with positive electrode is determined with chelatometric titration in periodic time. Zn(OH)2- ion participation on the total current was calculated. This calculation is based on defined electric current within the cell and duration of the experiment. This measurement ends with the lack of Zn ions on the negative side of the fuel cell.
Zn ions concentration calculation was based on this equation:
Where m - is concentratation of flowed Zn ions [mMOL]
V - is volume of titrimetric solution [ml]
C - is concentration of titrimetric solution (c = 0,01 mol/l)
Current, carried by Zn ions was investigated and calculated:
Where IZn - is electric current of Zn ions [A]
m - is concentration of flowed Zn ions through the cell [mMOL]
t - Zn ions flowed within specific time [s]
Ratio of the overall current and current IZn carried by Zn ions shows how many percents of electric current is carried by Zn ions.
293

13th Advanced Batteries, Accumulators and Fuel Cells Electrolytes
Fig. 2: Glass cell for zinc impenetrability measurements
Figure 1 shows Zn ions impenetrability results of selected PVA membranes. Membranes with the highest ionic conductivity exhibit the worst Zn ion impenetrability. An overall best result exhibits membrane no. 6. Zn ions do not penetrate surface of membrane. On the other hand, ionic conductivity is very low in comparison with other PVA membrane types.
Fig. 3: Zn ions impenetrability results of selected PVA membranes – Zinc ions concentration time dependence
0
0,2
0,4
0,6
0,8
1
1,2
0 10000 20000 30000 40000 50000 60000 70000 80000 90000
mola
rity
[m
MO
L]
Time [s]
Zinc ions concentration time dependence
2
5
4
1
11
6
294

13th Advanced Batteries, Accumulators and Fuel Cells Electrolytes
Fig. 4: Zn ions impenetrability results of selected PVA membranes – percentage of electric current carried by Zn ions
Conclusion
It was investigated, that high ionic conductivity requirement and zinc impenetrability requirement are contrary. In spite of it, our work in this field will continue, because Zn ions participate only in 3 – 5 % of the total current. Rest of the current (95 % or more) is carried by OH- ions. Zn(OH)2- tend to surround the negative electrode. Membrane with ionic conductivity is penetrated only with a small percentage of produced ions.
Acknowledgements
This work was supported by the grant FEKT-S-11-7 and project CVVOZE CZ.1.05/2.1.00/01.0014.
References
[1] CHLADIL, L.; KUNOVJANEK, M.; MUSIL, M. STABLE PVA MEMBRANES FOR ALKALINE FUEL CELLS. In Advanced Batteries Accumulators and Fuel Cells 12th ABAF Proceeding of the ABAF- 12 Meeting. Brno: Brno University of Technology, 2011. s. 42-46. ISBN: 978-80-214-4357- 0.
[2] SPIEGEL, C; Designing and Building Fuel Cells, McGraw-Hill, 2007, first issue, ISBN: 0071489770 / 9780071489775, 434 s.¨
[3] MÍKA, P. Ni- Zn akumulátory. Brno: Vysoké učení technické v Brně, Fakulta elektrotechniky a komunikačních technologií, 2011. 12 s. Vedoucí semestrální práce doc. Ing. Marie Sedlaříková, CSc.
0
1
2
3
4
5
6
7
8
9
0 20000 40000 60000 80000 100000
I Zn [
%]
Time [s]
Membrane Zn ions impenetrability
10
3
8
7
1
2
295

13th Advanced Batteries, Accumulators and Fuel Cells Electrolytes
MECHANISMS OF IONIC CONDUCTION IN PVA BASED NANOCOMPOSITES
Prokhorov, I. Yu., Radionova, O. I., Akimov, G. Ya.
Donetsk Physical & Technical Institute N.A.S. Ukraine 72 R. Luxemburg str., Donetsk, 83114, Ukraine
Abstract
Mechanisms of ionic conduction in PVA based cross-linked nanocomposite polymer membranes were studied using the high resolution electrochemical impedance spectroscopy. It was shown that cross-linking originates second line in the Nyquist spectrum corresponding to second phase of the material. Temperature dependence of ionic conductivity for initial and new phases is different. The initial phase obeys VTF approach determining total temperature behavior of electrolyte. The new phase obeys Arrhenius equation. This finding yields an additional parameter enabling to control the conductivity-to-permeability ratio in polymer electrolytes.
Introduction
Polymer membranes with low temperature proton (or anion) conduction are under development and upgrading since mid-70-s in view of very promising application in low-temperature hydrogen fuel cells (HFC) or direct methanol fuel cells (DMFC) (1). Last few years they attract especial interest in the connection with unitized reversible fuel cells (URFC) and future methanol economy proposed by G. Olah et al. (2). Both these energy storage systems provide electrolytic synthesis of fuel as well as power generation with fuel consumption, being in essence accumulators of unlimited or volume limited capacity.
Hydrogen URFC are very close to commercialization and are implementing where weight considerations are of primary importance (3). On the contrary, methanol systems had been patented only this year (4), although electrolytic synthesis of methanol from mitigated CO2 is known almost as long ago as DMFC’s (5).
One reason of above lagging is connected with high methanol permeability of former perfluorosulfonic copolymerized films precluding their large-scale use if taking into consideration toxicity of methanol. This problem had stimulated an extensive search of proton electrolytes on different polymer basis and made selectivity (conductivity to permeability ratio) most important characteristic of novel polymer membranes.
Recent progress in this field during last decade was related with polymer electrolytes based on polyvinyl alcohol (PVA). This partially crystalline polymer has intrinsic methanol permeability by order or more lower than Nafion (6). Proton conductivity in pure PVA is very small as well (6). However it can be significantly improved by adding inorganic or organic fillers, selectivity still staying few times higher than Nafion (7).
Selection of the best fillers in Nafion based electrolytes is governed by a proton donor ability that is reflected in a slurry pH value (8). In our previous publication we had shown that fillers in PVA based electrolytes obey the same rule but with much stronger effect (9).
296

13th Advanced Batteries, Accumulators and Fuel Cells Electrolytes
Indeed, recent most successful works in the field based on strongest insoluble acids such as heteropoly or sulfonic acids as fillers in PVA have surpassed Nafion in both conductivity and selectivity and reached specific power values of the order of tenths watts per square centimeter (10, 11).
However nearly as high performance was reached in the same years for amorphous PVA based gels or block copolymer blends containing no optimal fillers, e.g. (12, 13). It means that there exist structural factors determining the performance in addition to chemical fillers. The present work is focused on studying mechanisms of ionic conduction in PVA based nanocomposites in all material processing stages using high resolution electrochemical impedance spectroscopy (HR-EIS) with a high capacitance cell (9).
Experimental
PVA based composite polymer membranes were prepared by a solution casting method. A homogeneous PVA solution was first prepared by dissolving 5 wt. % of the powder in distilled water under stirring and heating up to 90oC. The solution was less viscous than commonly used (10 wt. %) that ensured absence of air bubbles and very thin resulting films. Separately aluminum hydroxide gel was prepared by mixing aqueous solutions of sodium hydroxide and aluminum chloride in respective ratio. Final suspension had pH about 5.0. Pre-calculated volume of above suspension was thoroughly mixed to hot PVA solution so that to obtain optimal filler concentration as determined in previous work (9). Re-heated homogeneous mixture or pure PVA solution as a reference specimen were poured out onto clean glass plates and dried at ambient conditions. The dried films had a
mean thickness about 10 m and were strong and elastic enough to be easily separated from glass. Crosslinking was performed by soaking films in the saturated borax solution at room conditions during several hours. Finished washed and dried membranes were transparent in spite of filler charge.
Dry or wet polymer membranes were placed between stainless steel ion-blocking electrodes in a spring-loaded ceramic holder suspended in a thermostat. The electrodes had diameter 3.5 cm and surface area 9.62 cm2 that provided a very high cell capacitance (equal to about 40,000 pF as roughly estimated and measured by a capacitance meter) comparing with conventionally used ones. Such design diminishes the phase angle measurement error due to higher currents, increases resolution, and reduces the required frequency range due to higher capacitance. Lower frequencies in turn diminish errors caused by uncompensated inductance. The pulse shape was sinusoidal with initial amplitude about 80 mV.
Electronic conductivity in all membranes was negligible as was determined by direct current measurements. Data points were represented in Nyquist plots and fitted with separate semicircles or semi-ellipses.
Results and discussion
Electrolyte processing stages
It is well known that both Nafion and PVA proton membranes reveal a single line in EIS spectra measured using cells with capacitance over 1000 pF (e.g. 14, 15). This fact indicates that above materials are structurally homogeneous.
297

13th Advanced Batteries, Accumulators and Fuel Cells Electrolytes
Fig. 1: Fitting curves of EIS spectra for dry PVA/aluminum hydroxide gel membranes.
In full accordance with the literature data, present results show the single EIS line (LPVA) in the case of either dry or wet PVA gel, conductivity of wet electrolyte being several times lower (Fig. 1). It should be noted that the input resistance, as determined by the distance from zero to left (high frequency) intercept point on the real axis, is lower for the wet membrane too. Since the input resistance is contributed by a constant active circuit resistance and electrode-electrolyte contact resistance, this effect is probably due to presence or absence of water in the electrode-electrolyte interfaces.
However the same gel membranes after soaking in the cross-linking agent solution reveal the second line (LCL) with nearly the same total conductivity and somewhat higher input resistance. This phenomenon can be understood in the assumption that the cross-linking agent only partially penetrates into body of membrane, thereby dividing the electrolyte onto series layers with different properties.
Added filler drastically reduces total resistance and sometimes yields one or two lines more. One of less conductive composites studied in (9) is illustrated in Fig. 1 because highly conductive films would be poorly resolvable in the given plot scale. The occasional nature of extra lines indicates that respective highly conductive structures arise only in definite cases. Very small input resistance implies that these cases are connected, at least in part, with the electrode-electrolyte interfaces.
Layered membranes with cross-linked protective surface layers are promising for use in fuel cells due to enhanced selectivity and additional factor of possible optimization (16). For this reason it is worth to study the conduction mechanisms in both phases. One of possible approaches can be analysis of temperature dependences of conductivity.
Temperature dependence of conductivity
When reviewing recent publications devoted to PVA based electrolytes, one may notice that the cross-linked membranes generally demonstrate linear temperature dependence of conductivity in Arrhenius coordinates (e.g. 17-20) whereas non-linked gels show non-linear
298

13th Advanced Batteries, Accumulators and Fuel Cells Electrolytes
behavior (21). Present materials had shown non-linear behavior too although they were cross-linked (9).
This observation combined with above findings and assumption of cross-linked surface layers can be verified by plotting the temperature dependences of individual Nyquist lines in Arrhenius coordinates. Such plot is presented in Fig. 2. It is seen that the nonlinear nature of the total temperature dependence is dictated by nonlinear curve of the PVA line while the line of cross-linked layer gives the linear temperature dependence in Arrhenius coordinates.
The present result confirms two-phase nature of cross-linked PVA membranes and yields once more technological parameter that may be used to optimize the conductivity to permeability ratio.
Fig. 2: Arrhenius plots of total conductivity and lines LPVA and LCL for wet cross-linked PVA/aluminum hydroxide gel membranes.
Analysis of temperature dependences
Simple thermally activated charge transfer, which is fitted with a straight line in Arrhenius coordinates, is only indirectly related with structural parameters of a conducting medium via activation energy and pre-exponential factor. Arrhenius behavior of ionic conductivity is observed in liquid solutions and crystalline ionic conductors. Cross-linked polymers are generally semi-crystalline. The activation energy (0.22 eV in Fig. 2) obtained in the present
work is close to activation energies in aqueous liquid solutions (0.11 0.17 eV) as well as theoretically predicted from models of Grotthuss-like hopping proton motion mechanism (0.11 eV) (22). It is considerably lower that activation energies of ionic conductivity in
crystalline conductors such as stabilized zirconia, for example (0.85 1.4 eV) (23).
It should be noted that magnitude of ionic conductivity in this phase is essentially higher than the conductivity in initial phase, see Fig. 2.
299

13th Advanced Batteries, Accumulators and Fuel Cells Electrolytes
Fig. 3: Temperature dependence for LPVA line of wet cross-linked PVA/aluminum hydroxide gel membrane in VTF coordinates.
Non-linear temperature dependence of ionic conductivity in amorphous polymers is usually fitted by Vogel-Tamman-Fulcher (VTF) equation:
0
0
exp AE
T T, [1]
where is ionic conductivity; EA is a segmental motion pseudoactivation energy; T0 is
zero-free-volume temperature, and 0 is a pre-exponential factor. This equation had been derived as a first order approximation of two-exponential equation for viscosity of an amorphous solid material (24). In application to ionic conductivity it means that an ion moves in free volume of a viscous solid medium occurring near melting point. Temperature T0 is a structural parameter and lays about 60 Kelvins lower the glass transition temperature (25).
Fig. 3 shows the temperature dependence of conductivity for initial phase of the wet nanocomposite membrane in VTF rather than Arrhenius coordinates. It is seen from Fig. 3 that data points are good fitted by VTF function at zero-free-volume temperature T0 equal to 280.4 K (7.4ºC). Glass transition point for pure PVA is close to 85oC (26) but it is lowered in the presence of inorganic filler down to 10 Kelvins or more (19). The present result is hence in good accordance with the VTF approach.
Conclusions
Present results show that PVA based membranes generally are, or can be made, essentially two-phase, one phase remaining primarily amorphous and another being primarily crystalline. Taking into consideration different properties of two phases, especially in relation to ionic conductivity and methanol permeability, this phenomenon yields an additional parameter to control selectivity of polymer electrolytes.
300

13th Advanced Batteries, Accumulators and Fuel Cells Electrolytes
References
[1] A. S. Aricò, V. Baglio, and V. Antonucci, in Electrocatalysis of Direct Methanol Fuel Cells, H. Liu and J. Zhang, Editors, p. 1-78, Wiley-VCH Verlag GmbH & Co. KGaA, Weinheim (2009).
[2] G. A. Olah, A. Goeppert, and G. K. Surya Prakash, J. Org. Chem., 74(2), 487 (2009). [3] C. M. Hwang, M. Ishida, H. Ito, et al., Int. J. Hydrogen Energy, 36(2), 1740 (2011). [4] G. A. Olah and G. K. Surya Prakash, US Patent 8,138,380 (2012). [5] M. Steinberg, US Patent 3,959,094 (1976). [6] B. S. Pivovar, Y. Wang, and E. L. Cussler, J. Membrane Sci., 154(2), 155 (1999). [7] J. Maiti, N. Kakati, S. H. Lee et al., J. Power Sources, 216, 48 (2012). [8] M.-S. Kang, J. H. Kim, J. Won et al., J. Membrane Sci., 247(1-2), 127 (2005). [9] I. Yu. Prokhorov, O. I. Radionova, and G. Ya. Akimov, Meet. Abstr. - Electrochem.
Soc., 1202, 1476 (2012). [10] S. Meenakshi, S. D. Bhat, A. K. Sahu et al., J. Solid State Electrochem., 16(4), 1709
(2012). [11] C.W. Lin, Y.F. Huang, and A.M. Kannan, J. Power Sources, 164(2), 449 (2007). [12] N. Chand, N. Rai, S. L. Agrawal, and S. K. Patel, Bull. Mater. Sci., 34(7), 1297
(2011). [13] D. K. Lee, J. T. Park, J. K. Choi et al., Macromol. Res., 16(6), 549 (2008). [14] S. Siracusano, V. Baglio, M. A. Navarra et al., Int. J. Electrochem. Sci., 7(2), 1532
(2012). [15] M. P. Aji, R. Masturi, S. Bijaksana et al., ISRN Mater. Sci., 2012, Article 795613
(2012). [16] C.-E. Tsai, C.-W. Lin, and B.-J. Hwang, J. Power Sources, 195(8), 2166 (2010). [17] D. S. Kim, H. B. Park, J. W. Rhim, and Y. M. Lee, J. Membrane Sci., 240(1-2), 37
(2004). [18] C.-C. Yang, C.-T. Lin and S.-J. Chiu, Desalination, 233(1-3), 137 (2008). [19] C.-C. Yang, Y.-J. Lee, and J.M. Yang, J. Power Sources, 188(1), 30 (2009). [20] A. Anis, S. M. Al-Zahrani, A.K. Banthia, and S. Bandyopadhyay, Int. J. Electrochem.
Sci., 6(7), 2652 (2011). [21] N. Chand, N. Rai, S. L. Agrawal, and S. K. Patel, Bull. Mater.Sci., 34(7), 1297 (2011). [22] S. Walbran and A. A. Kornyshev, J. Chem. Phys., 114(22) 10039 (2001). [23] C. Zhang, C.-J. Li, G. Zhang et al., Mater. Sci. Eng. B, 137(1), 24 (2007). [24] L. S. Garca-Coln, L. F. del Castillo, and P. Goldstein, Phys. Rev. B (Condensed
Matter), 40(10), 7040 (1989). [25] B. Wang, S. Q. Li, and S. J. Wang, Phys. Rev. B (Condensed Matter), 56(18), 11503
(1997). [26] A.A. Mohamad, N.S. Mohamed, M.Z.A. Yahya et al., Solid State Ionics, 156(1-2), 171
(2003).
301

13th Advanced Batteries, Accumulators and Fuel Cells Electrolytes
PVA MEMBRANES FOR THE PEM FUEL CELLS
Subarda, J., Kunovjanek, M., Musil, M., Novak, V.
Department of Electrical and Electronic Technology, Faculty of Electrical Engineering and Communication, Brno University of Technology, Technická 10, 616 00 Brno, Czech
Republic Corresponding author: Jiri Subarda ([email protected]) Phone: +420 541146109
Abstract
In this paper are are given global information about recent low temperature polymer electrolyte membrane (PEM) fuel cells. Furthermore, experimental preparation and resistivity measurements of polyvinyl alcohol (PVA) polymer electrolyte membranes are described. Fundamental characteristics of fuel cells containing PVA membranes were measured (e. g. volt-ampere and power characteristics).
Introduction
With the lack of fossil fuels and the increasing amount of greenhouse gases is our interest in alternative power sources increasing. Fuel cells seem to be very convenient power source. Fuel cells are electrochemical sources of electric energy, which directly convert chemical energy of fuel into electrical energy. This is very useful to minimize system loses. Therefore, fuel cells have high effectivity (higher than 90 percent). But fuel cells don´t compete source of electrical energy which use fossil fuels for his work. Many types of fuel cell are known now and new types are now being developed. Higher prices are disadvantage of all types of these fuel cells. From of all types of fuel cells are PEMFC fuel cells the most promising (1).
Polymer electrolyte membrane fuel cells (PEMFC) are in category of low temperature fuel cells. Its working temperature is in range 50 - 100 °C. Theoretical effectivity reaches 50 - 60 %. Cells are fueled with H2, CH3OH and CH4. Principle of function of these fuel cells are described on the figure 1 below (1).
302

13th Advanced Batteries, Accumulators and Fuel Cells Electrolytes
Fig. 1: Principe of PEM fuel cell function (2)
This type of fuel cells consist of polymer ion exchange membrane with GDL enriched with catalyst on the both sides of membrane. This structure is called MEA (Membrane electrode assembly) (1).
The properties of membranes is the key of function of this type fuel cells. Two types of membranes are known – acidic and alkali type. If we use acidic membrane type (Nafion) in fuel cell, the chemical reactions in fuel cell are following (3):
Cathode: O2 + 4H+ + 4e- → 2H2O E0 = 1.229 V [1.1]
Anode: H2 → 2H+ + 2e- E0 = 0 V [1.2]
Total summary: 2H2 + O2 → 2H2O E0 = 1.229 V [1.3]
And if we use alkali membrane type in fuel cell, the chemical reactions in fuel cell are following (3):
Cathode: O2 + 2H2O + 4e- → 4OH- E0 = 0.401 V [1.4]
Anode: H2 + 2OH- → 2H2O + 2e- E0 = -0.828 V [1.5]
Total summary: 2H2 + O2 → 2H2O E0 = 1.229 V [1.6]
Using membranes of alkali type is very useful for this fuel cell type. This type of membranes is not too aggressive as acidic membrane types. And when the acidic membrane types are used, we can substitute platinum-based catalysts. When the catalyst based of MnOx is used, we can reduce cost of this type of fuel cells.
For this purpose are very suitable membranes based on PVA. The price of these membranes are lower in comparison with alkali and acidic membrane types, which are fabricated now.
303

13th Advanced Batteries, Accumulators and Fuel Cells Electrolytes
Experimental
Tested PVA membranes were prepared in two ways – direct chemical cross-linking and crosslinking initiated by UV radiation.
Process of direct chemical crosslinking was following:
PVA (Mowiol 15 - 99) was dissolved in hot water (95 °C). Later, after cooling a small quantity of glutaraldehyde crosslinker and H2SO4 catalyst was added into mixture. Mixture of sample 3B was poured on the Petri dishes and let 24 hours in room temperature for crosslinking and next 24 hours in 50 °C for drying. After that, the membrane was three times washed with the destilled water to remove non-crosslinked remains of PVA, glutaraldehyde and H2SO4. Finally, after drying, the membrane was put into 5.6 mol/l KOH electrolyte.
Process of crosslinking initiated by UV radiation followed:
PVA (Mowiol 15 - 99) was modified by glycidylmethacrylate. Further was this mixture dissolved in hot water (75 °C). Later, after cooling, a small quantity of Irgacure 2959 crosslinker catalyst was added into mixture. Mixture for sample 4 B was poured on the Petri dishes and let 24 hours in drying box at 50 °C. Further was membrane inserted in UV chamber for 15 minutes for crosslinking. Process of preparation of sample 2 B was analogous but this sample was crosslinked in wet state. Next was this sample dry in drying box. Sample 1 B was prepared as follows – PVA (Mowiol 15 - 99) was dissolved in KOH solution. In this mixture was a small quantity of glycerol added. Final mixture was poured on Petri dishes and let 24 hours at the room temperature. Further was this sample dryed in drying box at temperature 50 °C.
After that, the membrane was three times washed with destilled water to remove non-crosslinked remains of PVA, glutaraldehyde and H2SO4. Finally, after drying, the membrane was put into 5.6 mol / l KOH electrolyte.
Furthermore, membrane resistivities and their possible usage in fuel cells was examined.
Measurement of resistivity of membranes
To find out resistivity of membranes, 4 electrodes cell, which was designed for these purposes, was used. The cell contains two working Pt electrodes and two referent Hg/HgO electrodes, which indicate voltage differences on membrane. The membrane is placed in the annular middle of the cell (5).
Fig. 2: 4- Electrode cell designed for ionic resistivity measurements (5)
304

13th Advanced Batteries, Accumulators and Fuel Cells Electrolytes
All the membranes underwent resistivity testing in four-electrode glass cell. Resulting PVA membranes resistivities are shown in table 1.
TABLE: PVA membranes resistivities
Sample l [cm] I [A] R [Ω.cm-2
]
3B 0,0263 0,1 0,224
4B 0,0179 0,1 0,049
2B 0,1312 0,1 0,103
1B 0,0911 0,1 0,034
These membranes sized 3 x 3 centimeters were measured in the fuel cell Quintech. Electrodes were made of carbon paper enriched with platinum catalyst ElectroChem EC-20-10-7 Pt. Both sides of membranes were in the middle connected to the planar electrodes. These MEA (Membrane electrode assembly) structures were embedded into Quintech cell. Subsequently, volt-ampere and power characteristics were investigated.
Measured values of open circuit, voltage U0 and maximal values of current Imax of individual membranes for various working temperature are shown in table 2. Subsequently were from measured values deducted values of maximal power. Measured values of maximal power and corresponding values of current for various working temperature are shown in table 3. Measured volt-ampere characteristics of measured membranes at the working temperature 80 °C are in Figure 3. Power characteristics of these membranes for the same working temperature are in Figure 4.
TABLE II: Measured values of U0 and Imax
Sample
Working temperature 26 °C 30 °C 40 °C 50°C 60 °C 70 °C 80 °C
U0 Imax U0 Imax U0 Imax U0 Imax U0 Imax U0 Imax U0 Imax [V] [mA] [V] [mA] [V] [mA] [V] [mA] [V] [mA] [V] [mA] [V] [mA]
1B 0,894 192 0,895 230 0,9 293 0,902 393 0,902 519 0,903 613 0,903 105 2B 0,876 196 0,88 217 0,884 290 0,893 369 0,895 463 0,892 533 0,884 570 3B 0,906 42 0,906 39 0,917 47 0,934 54 0,935 53 0,932 29 0,92 18 4B 0,884 86 0,882 100 0,902 123 0,911 118 0,918 88 0,916 89 0,924 113
305

13th Advanced Batteries, Accumulators and Fuel Cells Electrolytes
0 200 400 600 800
0
200
400
600
800
1000
U (
mV
)
I (mA)
1B
2B
3B
4B
Fig. 3: Volt-ampere characteristics of fuel cell in which PVA membranes is used for working temperature 80 °C
TABLE III: Measured values of maximal power and corresponding values of current
Sample
Working temperature
26 °C 30 °C 40 °C 50°C 60 °C 70 °C 80 °C
I Pmax I Pmax I Pmax I Pmax I Pmax I Pmax I Pmax
[mA] [mW] [mA] [mW] [mA] [mW] [mA] [mW] [mA] [mW] [mA] [mW] [mA] [mW]
1B 109 42 126 53 186 69 232 100 352 142 390 172 600 270
2B 116 44 129 53 198 74 234 101 336 131 367 157 393 179
3B 24 12 29 12 36 16 42 21 43 22 28 18 18 12
4B 33 13 59 22 81 36 114 46 79 40 86 44 126 57
306

13th Advanced Batteries, Accumulators and Fuel Cells Electrolytes
0 200 400 600 800 1000
0
50
100
150
200
250
300
P
(m
W)
I (mA)
1B
2B
3B
4B
Fig. 4: Power characteristic of fuel cell in which PVA membrane 1B is used for working temperature 80 °C
Best results exhibits 1B PVA membrane type. Volt-ampere and power characteristics of PEM fuel cell with 1B PVA membrane are shown in pictures 1 and 2. Membranes must be soaked properly. When membranes lose their hydratation, performance of fuel cell decreases. Performance can by restored by the membrane rehydratation.
Conclusion
PVA membranes tested in this work seem to be suitable to be used in PEM fuel cells. Most convenient are 1B and 2B types with the highest ionic conductivity. High ionic conductivity is ensured by proper soaking of membrane in electrolyte. Thickness of membranes affect the ionic conductivity and power characteristics significantly. Thicker membranes are more convenient to be used in PEM fuel cells. For the next measurements of this type membranes would also be appropriate, focus on the modifications with various amount of glycerol.
307

13th Advanced Batteries, Accumulators and Fuel Cells Electrolytes
Acknowledgments
The investigations were supported by specific university research at NO. FEKT-S-11-7, and projekt CVVOZE CZ.1.05/2.1.00/01.0014.
References
[1] SPIEGEL, C; Designing and Building Fuel Cells, McGraw-Hill, 2007, first issue, ISBN: 0071489770 / 9780071489775, 434 s.
[2] M. Bleha, J. Žitka, Fuel cell in energetics, Vesmir, 87/11, 4 p., (2008) [3] V. Novák, Catalysts based on MnOx for fuel cells, Brno University of Technology,
Faculty of Electrical Engineering and Communications, 76 p., habilitation´s thesis, (2008).
[4] CHLADIL, L.; KUNOVJANEK, M.; MUSIL, M. STABLE PVA MEMBRANES FOR ALKALINE FUEL CELLS. In Advanced Batteries Accumulators and Fuel Cells 12th ABAF Proceeding of the ABAF- 12 Meeting. Brno: Brno University of Technology, 2011. s. 42-46. ISBN: 978-80-214-4357- 0.
[5] M. Kunovjanek, M. Polyvinylalcohol separator membrane design for electrolysers. ECS Transactions, 40/1, p.. 139-144. ISSN: 1938- 5862, (2012)
308

13th Advanced Batteries, Accumulators and Fuel Cells General material research
CRITICAL CRACK LENGTH FOR THE INITIATION OF UNSTABLE PROPAGATION IN RELATION TO FRACTURE TOUGHNESS AND THE EVALUATION OF STRESS AND DEFORMATION CHARACTERISTICS OBTAINED FROM
TENSILE TESTING
Binar, T.1, Dvořák, I.2, Kadlec, J.2, Joska, Z.2, Korecki, Z.1, Kvapilová, P.1
1 Department of Logistics, University of Defence, Kounicova 65, Brno, Czech Republic 2 Department of Mechanical Engineering, University of Defence, Kounicova 65, Brno,
Czech Republic
Corresponding author: Tomas Binar ([email protected]) Phone: +420 724129447
Abstract
The paper is concerned with the relation between temperature and critical crack length for the initiation of a brittle crack unstable propagation at the yield strength level stress. For the purpose of calculation, results of dynamic fracture toughness test were applied; the experiment was supplemented with measuring stress and deformation characteristics in a determined test temperature range. For comprehensive assessment of test temperature effects, a fractographic analysis of fracture surfaces was conducted.
Key words: critical crack length, unstable propagation, stress and deformation characteristics, fracture surface, degradation process.
Introduction
Armour or ballistic resistant materials directed at defeating Amour piercing projectiles are generally selected for hardness and steel is basic armour material. High strength low alloyed (HSLA) steels are very often used in military as personal or vehicle protection plates [1,2]. They dispose of a unique combination of high strength, high hardness with good toughness, weldability and ease application of thermo-chemical treatment. Brittle fracture represents one of the most dangerous causes of machine component breakdowns. A whole range of both external and internal factors contributes to causes of brittle fracture occurrence mechanism, which results in this degradation process. Contemporary evaluation methods of brittle failure risk are based on the approaches of fracture mechanics, which, among others, allow determining a critical defect value for machine component function conditions [3,4,5,6 ]. In the paper, temperature effects on critical crack length (lKR) values for the initiation of unstable propagation at yield strength level stress are evaluated. The test temperature range was determined with regard to the working load of machine components made of ARMOX 600T steel [7]. The paper presents results of stress and deformation characteristics measurements as determined based on a tensile test and a fracture toughness test. Consequently, the probability of limit state occurrence in the material is assessed.
309

13th Advanced Batteries, Accumulators and Fuel Cells General material research
Experimental programme
The experimental programme of the work concentrated on the evaluation of test temperature effects on critical crack length and stress and deformation characteristics mentioned above. The test temperatures were determined in relation to extreme operating temperatures, i.e. in the temperature range –80 °C to +100 °C. Quality guarantees are usually not required for the extreme temperatures of this range; yet, machine components may be exposed to such temperatures. For the experiment, ARMOX 600T low-alloy steel (heat no. 073335-399106) was utilised. Chemical composition of the steel according to the certificate is stated in Tab. 1; the certificate also states guaranteed values of hardness HBW = 632 and impact work Kmin –9 J at the temperature of –40 °C (test as per EN 10 045-1, test specimen 5 x 10 mm, U notch 5 mm deep).
Table 1: Chemical composition (weight %) of the steel studied Steel/Element C Mn Si Cr Ni Mo P S Al B
ARMOX 600T 0.41 0.69 0.26 0.47 1.97 0.337 0.007 0.002 – 0.002
Dynamic fracture toughness test
Dynamic fracture toughness tests were carried out by means of ZWICK RKP 450 iwi instrumented impact pendulum. In the test, the force and time relationship during an impact was recorded. For the dynamic fracture toughness test [8], test specimens for three-point bending of an A–type specimen were utilised. Dynamic fracture toughness tests were carried out in the temperature range –80 °C to +100 °C. For testing at elevated temperatures, specimens were heated by liquid medium (H2O); for testing at low temperatures, a mixture of liquid nitrogen and ethanol was utilised as cooling medium.
In order to determine fracture toughness value KID, or its temporary value KQ, the force FQ
had to be read from the graph [3] in relation to F5 and fracture force Fmax. In the following step, the value KQ, i.e. the value of temporary fracture toughness, was determined. The KQ value is a characteristic of material resistance to brittle failure initiation, and represents dynamic fracture toughness, on the condition that the following requirements are met. A requirement for a limited crack tip plastic zone, a requirement for plane deformation state and a requirement for very limited stable propagation. Performance conditions and the dynamic fracture toughness evaluation method are defined in detail in works by [3,4,5]. Dynamic fracture toughness test results are stated in Tab. 4.
Tensile test
The tensile test is a basic test for stress and deformation characteristics. Performance and conditions of this test are defined in standards ČSN EN 10 002-1 [9, 10] tensile test at ambient temperature, ČSN EN 10 002-5 [11] tensile test at elevated temperature. Strain hardening exponent n was determined in accordance with ČSN EN (ISO) 10275 [12]. The test was conducted using a versatile Zwick test machine. Deformation was measured by means of SANDNER EXA 50/50N extensometer with measured length of the extensometer Le=50 mm and range 5 mm. During the test, force F, elongation ∆Le and time t were recorded.
In cooperation with Military Technical Institute of Protection, Brno, a test chamber was constructed for experiments conducted at elevated and low temperatures. The chamber, shown in Fig. 1, enabled carrying out experimental work in temperature range –80 °C to
310

13th Advanced Batteries, Accumulators and Fuel Cells General material research
+100 °C. For the purpose of reaching the temperature of –80 °C, a cooling system was designed for the existing box utilised for tests at positive temperatures. The cooling system was designed as an evaporator of medium – liquid nitrogen. Oxford Cryogenics pressure vessel served as a storage tank for liquid nitrogen (LigN2). The medium was regulated by ALCON 68 series. The evaporator was made of Cu heating pipes. The area of the evaporator on the LigN2 side is 0.169 m2, which is approximately treble the area required for heat transfer at the differential of temperatures of boiling medium and required lowest temperature –80 °C with ice accretion of up to 2 mm. This evaporator ensured that residual nitrogen in liquid state would not be injected in the chamber, as it would cause undesirable local cooling. The environment was homogenized by a small propeller driven by an electromotor. Eurotherm 810 controller was used to control the supply of the medium in the cooling box by means of a cryogenic valve. The controller kept the
specimen temperature within 2 °C, as required by implementing standard ČSN EN 10002-5 [11].
Fig. 1: Scheme of cooling system
Fractographic analysis
The purpose of the fractographic analysis was to evaluate temperature effects on failure mechanisms in specimens after a tensile test and a fracture toughness test. The analysis of fracture surfaces was conducted by means of JSM 840 (JEOL) scanning electron microscope. The subject matter of the research was the sphere under the notch in dynamic fracture toughness specimens, and the edge of a fracture surface in tensile test specimens.
Results and discussion of the results obtained
The evaluation of tensile test results concentrates on two basic groups of material characteristics, described in section 1.2. In the first group, conditions of plastic deformation occurrence and development (Rp0.2, n) in the determined test temperature range are discussed. In the other group, fracture characteristics (Rm, A) are discussed; in
311

13th Advanced Batteries, Accumulators and Fuel Cells General material research
consequence of the fracture characteristics, final limit state occurs in the material studied, in direct relation to the test temperature range monitored.
When analysing values of fracture characteristics Rm depending on the test temperature in steel, no significant effect of temperature on the Rm quantity values was proved.
When determining the value of ductility A5 in ARMOX 600T steel, decrease was identified at low test temperatures, i.e. at 0 °C (by approx. –14.8 %), –60 °C (by approx. –5.6 %), –80 °C (by approx. –11.7 %), if compared to the value measured at +20 °C. It follows from the graph that the quantity measured clearly decreases at 0 °C, between –20 °C and +20 °C.
Fig. 2: The relation between test temperatures and ductility values A5
Based on the result comparison (Tab. 2) in the test temperature range –80 °C to +100 °C, changes can be observed in measured values Rp0.2, at test temperatures –80 °C and –60 °C, if compared to values determined at +20 °C. In steel (Tab. 2), the Rp0.2 values increased at –60 °C (by approx. +2.44 %), –80 °C (by approx. +2.9 %). At 0 °C, increase in the measured quantity value is apparent if compared to values measured at –20 °C and 20 °C.
Table 2: Proof strength results Temperature –80 °C –60 °C –40 °C –20 °C 0 °C 24 °C 40 °C 60 °C 80 °C 100 °C
Rp0.2[MPa] 1497.5 1490.0 1479.5 1452.5 1469.0 1453.6 1458.5 1431.0 1442.5 1445.0
The effects of test temperature on the degradation process occurrence and development were proved, in the material tested, upon exceeding the proof strength, based on measured quantity of strain hardening exponent n (Tab. 3). Here, n value increased from 0 °C, specifically, at 0 °C (by approx. +7.8 %), –20 °C (by approx. +10.5 %), –40 °C (by approx. +10.8 %), –60 °C (by approx. +12.8 %), and –80 °C (by approx. 13.4 %). The n value also increased at test temperatures +80 °C and +100 °C, specifically at +80 °C (by approx. +5.1 %), and +100 °C (by approx. 13.9 %).
312

13th Advanced Batteries, Accumulators and Fuel Cells General material research
Table 3: Hardening exponent results Temp –80 °C –60 °C –40 °C –20 °C 0 °C 24 °C 40 °C 60 °C 80 °C 100 °C
n [–] 0.11525 0.11435 0.11185 0.11115 0.10815 0.09977 0.09735 0.09995 0.1051 0.1159
The dependence values for the material characteristics specified are stated in Fig. 4. What is interesting about these values is the effect observed at 0 °C. At this temperature, the ductility value decreases, and also minor anomalies can be observed in the yield strength and ultimate strength values.
The relation between dynamic fracture toughness and temperature is stated in Tab. 4.
Table 4: Dynamic fracture toughness test results Temperature –80 °C –60 °C –40 °C –20 °C 0 °C 24 °C 40 °C 60 °C 80 °C 100 °C
KQ[MPa.m0,5
] 51.309 55.851 58.851 65.144 63.917 71.418 71.976 73.675 74.561 75.643
The toughness level of the steel studied is better characterised by a basic dimension value – critical crack length for the initiation of unstable propagation lKR at the yield strength level dynamic stress, determined as follows:
2
2,0
1
p
Q
KRR
Kl
(1)
In this simplified relation, the calibration function expressing a crack and specimen shape and their mutual configuration, is excluded. Its inclusion would decrease the crack size for common configuration by approx. 3x, and up to 10x for extreme configurations. The calculation is, however, sufficiently illustrative for the sake of comparison. Also, the calculation of critical length based on static yield strength is also partly inaccurate. The yield strength corresponding to the loading speed would be higher, which would also decrease the value of calculated lKR and thus the risk of brittle fracture occurrence (lKR values are shown in Fig. 3).
Fig. 3: The relation between temperature and critical crack length lKR
Experimental measurements proved that virtually entire experimentally evaluated temperature range is critical for the material characteristics KQ and derived critical crack length values. At 0 °C, lKR decreases, which corresponds with changes in properties that
313

13th Advanced Batteries, Accumulators and Fuel Cells General material research
also reflect in basic strength and plastic characteristics. Critical crack size decreases with temperature; with regard to its level over the entire measured range, the risk of brittle failure may occur under adverse shaping effects and loading conditions (e.g. extremely high deformation speed). Critical crack lengths do not exceed 1 mm even at temperatures over 20 °C.
Fig. 4: The relation between temperature and measured material characteristics
Fractographic analysis
The failure mechanism in specimens after a dynamic fracture toughness test below 0 °C was a combination of transcrystalline cleavage and transcrystalline ductile failure. In case of testing at elevated temperatures, the failure was transcrystalline ductile. Steel fracture surface morphology is different, in particular for temperature of –80 °C, where unstable propagation immediately starts from a fatigue crack, which is demonstrated by quasi–cleavage character of the fracture surface. Even at 100 °C, the area of stable crack is very narrow; the area of unstable crack propagation has dimple micromorphology with very fine dimples. Their distribution virtually corresponds with quasi–cleavage planes of the structure, and signalizes lower toughness level. The fractographic analysis of fracture surfaces after the evaluation of stress and deformation characteristics proved transcrystalline ductile failure over the entire range of test temperatures.
314

13th Advanced Batteries, Accumulators and Fuel Cells General material research
Specimen 140
Tz = –80°C × 1000 zoom
transcrystalline ductile (fracture surface edge)
Specimen 90
Tz = 0°C × 1000 zoom
transcrystalline ductile (fracture surface edge)
Specimen 52 Tz = 100°C
× 1000 zoom transcrystalline ductile (fracture surface edge)
Fig. 5: Fracture surface morphology after a tensile test
Specimen 60 Tz = –80°C
× 1000 zoom transcrystalline cleavage
(by a crack)
Specimen 42
Tz = 0°C × 1000 zoom
transcrystalline cleavage and the rest transcrystalline
ductile (by a crack)
Specimen 25 Tz = 100°C
× 1000 zoom transcrystalline ductile
(by a crack)
Fig. 6: Fracture surface morphology after a dynamic fracture toughness test
Conclusion
The paper provides results of a dynamic fracture toughness test, when, based on experimentally determined data KQ, the value of critical crack length for the initiation of unstable propagation lKR at yield strength level stress was determined. The experimental programme included a fractographic analysis of fracture surfaces in specimens after a dynamic fracture toughness test and a tensile test. The results obtained can be summarized as follows:
Based on the comparison of lKR values, the risk of brittle failure occurrence may be expected over the entire range of test temperatures –80 °C to 100 °C; at yield strength level stress.
At 0 °C, the proof strength, ductility and critical crack length values decrease if compared to the values determined at –20 °C and 24 °C; based on the values and a fractographic analysis, the test temperature of –20 °C, (or possibly 0 °C) may be considered as the temperature, at which the limit state occurrence in ARMOX 600T steel is most probable;
315

13th Advanced Batteries, Accumulators and Fuel Cells General material research
On fracture surfaces of specimens after a dynamic fracture toughness test, even at 0 °C, certain proportion of quasi–cleavage transcrystalline fracture morphology occurs along with ductile failure morphology.
References
[1] Maweja, K., Stumpf, W. Fracture and ballistic–induced phase transformation in tempered martensitic low–carbon armour steels. Materials Science and Engineering: A, Volume 432, Issues 1–2, 2006. Pages 158–169.
[2] Singh, B. B., Sivakumar, K., Bhat, T. B. Effect of cold rolling on mechanical properties and ballistic performance of nitrogen–alloyed austenitic steels. International Journal of Impact Engineering Volume 36, Issue 4, 2009. Pages 611–620.
[3] Binar, T., Kadlec, J., Rejzek, M., Vlkovsky, M., Hruby, V. Evaluation of the test temperature effect on failure mechanisms and notched impact strength characteristics of ultra–hard low alloy steels. Strength of Materials. Volume 43, Issue 5, 2011. Pages 537–542.
[4] Zhao, M. C., Li, J. L., Zeng, T. Y., Xiaofang, H., Zhao, Y. C., Atrens, A. Strength and toughness tradeoffs for an ultrafine–grain size ferrite/cementite steel produced by warm–rolling and annealing. Materials Science and Engineering: A. Volume 528, Issue 28, 2011. Pages 8157–8168.
[5] Kucharczyk, P., Sharaf, M., Münstermann, S. On the influence of steel microstructure on short crack growth under cyclic loading. International Journal of Fatigue, Volume 41, 2012. Pages 83–89.
[6] Kim, S. W., Zhao, M. C., Li, J. L., Zeng, T. Y., Xiaofang, H., Zhao, Y. C., Atrens, A. The ductile to brittle transition for C–Mn steel with an ultrafine grain ferrite/cementite microstructure. Materials Science and Engineering: A, Volume 528, Issue 24, 2011. Pages 7228–7237.
[7] Data Sheet: ARMOX 600T. SSAB Oxelösund. 2007. [cit. 2010-07-24]. Available from: <http://www.ssab.com/Global/ARMOX/Datasheets/en/197_ARMOX_600T_UK_Data%20Sheet.pdf>.
[8] EN 10045–1:1990. Metallic materials – Charpy impact test – Part 1: Test Method. International Organization for Standardization, Geneva.
[9] EN 10 002–1:1990. Metallic materials – Tensile testing – Part 1: Method of test at ambient temperature. European Committee for Standardization, Bruxelles.
[10] EN ISO 6892–1:2009. Metallic materials – Tensile testing – Part 1: Method of test at room temperature. International Organization for Standardization, Geneva.
[11] EN 10002–5:1991. Metallic materials – Tensile testing – Part 5: Method of test at elevated temperature. European Committee for Standardization, Bruxelles.
[12] ISO 10275:2007. Metallic materials – Sheet and strip: Determination of tensile strain hardening exponent. International Organization for Standardization, Geneva.
316

13th Advanced Batteries, Accumulators and Fuel Cells General material research
STUDY OF BIOCOMPATIBLE ZrN AND ZrN/DLC COATING DEPOSITED ON MEDICAL TOOLS
Kadlec, J.1), Joska, Z.*1), Kadlec, J., jr.2)
1) Department of mechanical engineering, University of Defence, Kounicova 65, Brno, Czech Republic
2) Hospital Vyškov, Purkyňova 36, Vyškov, Czech Republic
Corresponding author: Zdeněk Joska ([email protected]) Phone: +420 723 668 071
Abstract
The paper presents results of study of mechanical and chemical properties of ZrN and ZrN/DLC coatings. These coatings were deposited on martensitic stainless steel surgical instruments by using PVD arc deposition. After treatment, SEM microscopy, laser confocal microscopy, micro-hardness and indentation test were used to characterize surface morphology, thickness, hardness and adhesion.
Introduction
Possibilities of applications of PVD or CVD thin films are increasing. Medicine is one of the fields where are these coatings used. Implants, prostheses, wires, stenos instruments are coated by different type of PVD coatings like TiN, TiCN, ZrN, diamond like carbon (DLC).[1,2,3]
Biomaterials which are used in human body have to satisfy following requirements – they have to be minimally biotolerant, mustn’t initiate reaction with tissues, have to have good adhesion. Nowadays is increasing interest of small praxis in surgical instruments that are colored in their official’s colors. These requirements need a new approach in coating combination. Zirconium nitride is and attractive materiál because of its excellent chemical a physical properties. It has high chemical a thermal stability and high hardness and abrasion resistence. I tis widely applied as diffusion barier, has excellent erosion resistance and exhibits high hardness, good lubricity and ductility [2,3]. Diamond-like carbon (DLC) has emerged as a potential material in recent years due to its high hardness, low frictional coefficient, high wear and corrosion resistance, chemical inertness, high electrical resistivity, infrared-transparency, high refractive index, and excellent smoothness. All these properties match well with the criteria of a good biomaterial for applications in orthopedic, cardiovascular, contact lenses, or dentistry [4,5,6].
This work is interested in the properties of ZrN and ZrN\DLC coatings deposited on real medical instrument made from AISI 420 stainless steel.
317

13th Advanced Batteries, Accumulators and Fuel Cells General material research
Experimental details
All investigated coatings were deposited on real eye scalpel. ZrN was deposited on blade and ZrN\DLC coating was deposited on scalpel holder. The coatings were deposited on two steps firstly was deposited TiN coating afterwards was coated by ZrN coating. The second step ZrN coating was coated by TiN and DLC coating.
Microstructure of multilayered coating was investigated by confocal microscopy. Surface microhardness of coatings was measured by Vickers method. Load was in range of 0.001N –
Fig. 1: Photo of coated scalpel
9.81N dwell was 12s.Adhesion test was performed on both parts of scalpel. I was used Rockwell C indenter with load 1471N.
Results
Fig. 2 shows an optical micrograph of a cross-section of the surface of an coated scalpel. The multilayered coating is composed from 5 layeres. The first and third is TiN coating thicknesses of this coating is 0.5 µm. The second and fourth layer is ZrN coating thicknesses of these coatings are 2 and 1.5 µm. DLC coating is the last layer and thickness of this coating is 3.5 µm. The total thickness of ZrN coating reached 4.5 µm and ZrN\DLC coating reached 7 µm. Fig. 3 shows results of indentation test which was applied on ZrN\DLC coating. Picture show that around indenter DLC coating abrupt. This damage shows that adhesion of DLC on ZrN substrate is very poor. The level of adhesion is HF5. Fig. 4 show results of indentation test of ZrN coating, detail of picture shows that around indenter there are no cracks or delamination of coating the level of adhesion is HF 1. The surface hardness of coatings (Fig. 3.) showed that the highest values 3141 HV0.01 reached ZrN\DLC coating. ZrN coating reached the highest value 2484 HV0.01.
318

13th Advanced Batteries, Accumulators and Fuel Cells General material research
Fig. 2: Cross sectional microstructure of coated scalpel
Fig. 3: Adhesion test of ZrN\DLC coating
Conclusion
In this study PVD coated surgical instrument was investigated. Two types of coating ZrN (blade) and ZrN\DLC (holder) were compared.The results showed that ZrN coating has very good adhesion on blade surface, adhesion of DLC coating on ZrN was very poor, this can be due to insufficient roughness of holder surface. Microhardness results shows that coatings increase very significantly surface microhardness. The results demonstrated that we must approach with caution when choosing coatings, and not all combinations are suitable for coating surgical instruments.
319

13th Advanced Batteries, Accumulators and Fuel Cells General material research
Fig. 4: Adhesion test of ZrN coating
0
500
1000
1500
2000
2500
3000
3500
0 200 400 600 800 1000 1200
Load (N)
Hard
ness (
HV
)
ZrN
ZrN\DLC
Fig. 5: Surface microhardness of coatings
Acknowledgements
The work presented in this paper has been supported by the institutional development project "Support of Education and Research in Mechanical Engineering” and by the specific research project at the Department of Mechanical Engineering, University of Defence.
320

13th Advanced Batteries, Accumulators and Fuel Cells General material research
References:
[1] F. Hollstein, D. Kitta, P. Louda, et al: Surface and Coatings Technology, 142-144 (2001) 1063-106.
[2] M. Jelínek, , T. Kocourek, J. Kadlec, et al: Thin Solid Films, 506-507 (2006) 101-105. [3] Z. Joska, M. Pospíchal, T. Mrazkova, et al: Chemicke Listy 104 (2010) 322-325. [4] Z. Joska, J.Kadlec, V. Hrubý, et al: Chemicke Listy 106 (2012) 446-447. [5] M. Jelinek, T. Kocourek, J. Kadlec, et al: Laser Physic 19 (2009) 149-153. [6] M. Azzi, M. Paquette, J.A. Szpunar,et al: Wear, 267 (2009) 860-866.
321

13th Advanced Batteries, Accumulators and Fuel Cells General material research
APPLICATION OF WIND TURBINE TO TEACHING
Máca, J., Abraham, P., Bača, P.
Department of Electrical and Electronic Technology, Faculty of Electrical Engineering and Communication, BUT, Technická 10, 616 00 Brno, Czech Republic
Abstract
The aim of this article is to introduce a possibility of use a wind turbine in education process. The students will be able to measure the efficiency of wind energy to electricity transformation. To reach this goal there will be a laboratory workplace assembled. The workplace will contain a 100 W wind turbine, lead accumulator, measuring instruments and multiplexor. The measurement will be carried out be using a software interface special created to this purpose.
Energy and wind power
It is possible to express the energy of moving mass its kinetic energy with following equation:
(1)
where m is mass and v is wind velocity.
For mass m applies relation
(2)
where A is surface, which the wind volume flows through and s is trace, which cover the moving wind.
From describe equations it is possible to calculate the wind power through a surface unit
(3)
where velocity is
(4)
in witch is s the trace and t is time.
(5)
From final equation (5) is clear, that wind power through a surface unit is direct proportional to the air density and third power of wind velocity.
To become some power from wind turbine, the wind turbine needs to remove energy from wind, with is reached by slowing the air flow. In ideal case there will by efficiency of energy transfer one hundred percent. For such efficiency it will be necessary that the wind turbine
322

13th Advanced Batteries, Accumulators and Fuel Cells General material research
fully stops the air flow. But when the wind is moving, its do not stops before obstacles but, excepts for increasing pressure ahead of it, it is flowing around the obstacle. Already in year 1919 Albert Betz calculate, from the aerodynamic lows that theoretical highest possible efficiency of a wind devices is about 59.3% it is called the Belz limit[2,3].
The Betz limit applies to all wind droved machines. When we thing like Betz about horizontal wind turbine whose blades defined a swept area (disc perpendicular to the air flow). Then the wind long before disk plane flow undisturbed with velocity v1 and far beyond the disk plane with velocity v3 because the blades are a retardant obstacle. Betz starts with the assumptions that the velocity in disk area is average velocity v2 from velocity before and behind the disk plane:
(6)
This assumption was confirming by Rankie – Froude theorem. There cannot be a velocity change by trespassing the disk plane (otherwise in the disk plane will be cumulated the air mass or it will leave a vacuum) so in the nearest distance before and behind the disk plane is constant velocity v2[3].
The rate at which mass streams across the swept area, A, is:
(7)
The mass m in air flow before the disk plane have the velocity v1 and carrier energy
, and when is the mass rate its carrier the energy . Far behind the disk plane
is the energy of air flow . So the disk removed power from wind according to
equation 8.
(8)
When we compare the removed power and power of undisturbed wind with the same area A then:
(9)
This ratio is function with reach its maximum when it is (Fig. 1), so the wind
velocity behind the disk plane have one third of velocity before the disk plane.
In this case is the maximum power calculated from equation 9:
(10)
which is the Betz limit.
So the maximum theoretical power available from wind turbine is[3]:
(11)
323

13th Advanced Batteries, Accumulators and Fuel Cells General material research
Fig. 1: The v3/v1 function for Betz limit with maximum at 0.33
Measuring workplace
A laboratory workplace will be assembled on with students can test the function of the wind turbine as renewable electric energy power source (Fig.2). There will be familiar with changing electricity power source and its economy.
The students with by help of anemometer measured the wind velocity and calculated the wind power and on a resistance load they will measure the voltage and current and calculate instantaneous power supplied. From input and output power they will define the efficiency of wind turbine. The students will record fluctuation of power output through the time of laboratory lessen and plotted a graph. The students will be educated how work with such unstable power and haw is this problem usually solved.
With the lead-acid battery they can visually verified a possibility of use a small wind turbine as power source at home for standard network appliances in a isled involvement.
0
0,1
0,2
0,3
0,4
0,5
0,6
0 0,1 0,2 0,3 0,4 0,5 0,6 0,7 0,8 0,9 1
P/PW
[-]
v3/v1 [-]
324

13th Advanced Batteries, Accumulators and Fuel Cells General material research
Fig. 2: The workplace block scheme
Wind turbine JTP-100
It is a horizontal axis wind turbine with five blades rotor. Nominal output voltage is 12 V. Output power is 100 W at wind volume 12 m·s-1. The starting wind volume is 3 m·s-1 and maximal operating wind velocity is 20 m·s-1. When is this highest wind velocity overstepped, is the electromagnetic brake activated and the rotation speed is decreased (the nominal output power dependence on wind velocity is on Fig. 3). The wind turbine proportions including the pedestal are 725×648× 680 mm and the gross weight is 6 kg[4].
325

13th Advanced Batteries, Accumulators and Fuel Cells General material research
Fig. 3: The power curve for JTP-100 wind turbine
The wind run the propeller blades and so transform the wind energy to turning force, with rotates the rotor inside a generator stator. The propeller blades are designed to be stable in degradation environmental influence.
The main generator inside the turbine is a synchronous generator with permanent magnet. The function of generator is to transfer the mechanical force of rotating rotor to electricity current generated in stator. In wind turbine JTP 100 is one generator. Behind the generator is an integrated circuit, with rectify generated alternating voltage to direct voltage also its watch overvoltage and send a signal to the electromagnetic brake in case of need.
Another part is yawing and slip ring in the pedestal of wind turbine. The ring is crated so that the turbine can rotate in 360° and make possible the current transfer without a cable connecting.
Rudder serve to turning the wind turbine so that the propeller blades are perpendicular to the wind flow and so the efficiency stay on the maximum possible value[4].
Charging controller
The task of charging controller CC-100-12 is to keep the output voltage on constant level for battery charging, meanwhile the input voltage (output voltage from wind turbine) variance in range of 8 V to 20 V. Part of the charging controller is an evaluation device, with obstruct that the wind turbine work in unsuitable conditions.
The charging regulator is carrying that the battery is not overcharged. The better types of regulators are sets so that they protect the wind turbine to run in no load mode (can cause rapidly increase of rotor speed) and break or stopped the wind turbine when the battery is full charged[2,4].
0
10
20
30
40
50
60
70
80
90
100
110
0 2 4 6 8 10 12 14 16 18 20 22
P
[W]
v [m∙s-1]
326

13th Advanced Batteries, Accumulators and Fuel Cells General material research
Batteries
In laboratory measurements is 12 V and 74 Ah capacity battery used with six cells. The nominal voltage of one lead-acid cell is 2.1 V and it is not discharging more than to 1.6V.
More than 150 years passed from discovery of lead-acid battery. During that time lead-acid batteries become widely used in many kinds of applications that needs cheap and reliable electric power source. SLI (Starting, Lighting, Ignition) batteries are known the most. Lead-acid batteries are easily recyclable so when they are properly returned for recycling they don't mean threat for environment. Overall reaction taking place in lead-acid battery is:
(12)
When the battery is discharged there is lead sulfate on both electrodes. When the battery is charged then there is lead dioxide on the positive electrode and spongeous lead on the negative one. Electrolyte is made of water solution of sulfuric acid and its concentration rises with increasing charge of battery.
Anemometer
For wind velocity measuring will be use an anemometer, with will be installed next to wind turbine. Used anemometer will measured the wind velocity to 50 m·s-1 (i.e. until 180 km·h-
1). As sensor is used classical mechanical propeller with three blades. The wind direction will be measured in 360° range and that in 16 positions. The anemometer will be connected to control computer with Ethernet network.
Rectifier
It will be used a 300 W rectifier, which by use of semiconductor components transfer the DC voltage to AC voltage. So crated voltage can be subsequently transfer with transformer help to required output voltage, in our case 230V/50Hz. The rectifier generated modified sinus wave (Fig. 4). The power of rectifier indicates the maximum possible power transfer that means power, with is able transform from input DC side to output side. The efficiency of rectifiers (e.i. ratio of power output to the input) is by commonly used devices about 90-98%.
Fig. 4: Compare modified sinus wave (dashed line) with sinus wave (solid line)
327

13th Advanced Batteries, Accumulators and Fuel Cells General material research
Acknowledgements
This work was supported by FRVŠ 2227/2012/G1 Measuring workplace to investigate the wind energy characteristics and its application to teaching and specific research FEKT-S-11-7 Materials and technologies for electronics.
References
[1] P. Mastny, J. Drapela, S. Misak, J. Machacek, M. Ptacek, L. Radil, T. Bartosik, T. Pavelka, Obnovitelne zdroje elektricke energie. 256 p. ISBN 978-80-01-04937-2, Ceske vysoke uceni technicke v Praze (2011)
[2] U. Hallenga, Mala vetrna elektrarna, 96 p. ISBN 80-86167-27-5, HEL Ostrava (2006) [3] Da Rosa Aldo V. Fundamentals of Renewable Energy Processes, 2nd Edition, 818 p,
ISBN: 978-0-12-374639-9, Elsevier (2009). [4] JETPRO TECHNOLOGY, INC., JTP-100 Wind Turbine User Manual, 35. p,
April(2011) [5] J. Maca, Vetrne elektrarny. In 33. Nekonvencni zdroje elektrické energie. 1.
Hrotovice: Tribun EU s.r. o, 2012. p. 112-115. ISBN: 978-80-02-02372- 2. [6] E. Hau. Wind Turbines Fundamentals, Technolgies, Application, Economics, 2nd
Edition, 783 p, ISBN: 978-3-540-24240-6, Springers(2008). [7] J. V. Akwa, H. A. Vielmo,A. P. Petry, A review on the performance of Savonius wind
turbines, Renewable and Sustainable Energy Reviews 16, 3054– 3064 (2012).
328

13th Advanced Batteries, Accumulators and Fuel Cells Electric vehicles
THE HYDROGEN BUS AS A MATHEMATICAL MODEL IN MATLAB
© – ITS ACTUAL OPERATION
Morte, M.1,2, Doucek, A.1,3, Kyncl, J.2
1ÚJV Řež, Czech Republic, tel. +420 26617 3564, email: [email protected], [email protected]. 2Dept. of Power Engineering, Faculty of Electrical Engineering, CTU in Prague, Czech
Republic, tel: +420 22435 2142,email: [email protected]. 3Dept. of Gas, Coke and Air Protection, Institute of Chemical Technology Prague, Czech
Republic.
Abstract
The paper firstly outlines control strategies for all three cooperating energy sources of TriHyBus and conditions for their cooperation. For optimization of routine operation of the bus a mathematical model in MATLAB© - Simulink© has been developed at Department of Power engineering, Faculty of Electrical engineering, Czech Technical University in Prague. The solution of power flow consists of control strategies for fuel cell, charging of batteries and supercapacitor, and conditions for both limiting situations: lack and surplus of energy on the main bus.. In the second part of the paper the MATLAB© model is tested and verified by data obtained from the actual operation of the bus and the conclusions about differences between the model and the actual operation are made.
Introduction
Hydrogen is one of the promising fuels for the future, in sector of transport even one of the most promising. Not only for undeniable ecologic advantages, but because in many technical aspects hydrogen exceeds other “clean” sources of energy which are in transport under review. If their technical comparison with electric cars is made, hybrids with hydrogen as a main fuel beat pure electric cars because of weight, volume and time of filling up. Concerning size and heaviness of Li-ion batteries the both would be significant restriction for bigger applications as buses, or trucks. Hydrogen could reduce these parameters without simultaneous reduction of operating range. City transport is one of the most important public areas connected with the energy consumption. Mostly for these two reasons a project of testing of hydrogen bus entitled “Research and Development of Advanced Control Systems for Hydrogen Technologies” was selected as the pilot project. Four companies – ÚJV Řež (the main coordinator), Škoda Electric (traction system, completion), Proton Motor (fuel cells), IFE Halden (interfaces), have united their forces in consortium and as the result TriHyBus is operated in Neratovice as a shuttle bus from 2010. The concept of triple-hybrid bus (TriHyBus) is characterized by combination of three advanced technologies: fuel cells, Li-ion accumulators and supracapacitors. The main energy source is electricity, generated by the fuel cell (manufactured by Proton Motor), with a nominal output of approximately 50 kW. Other key parts are 28 kWh Li-ion accumulator for energy recuperation during braking, and a bank of supracapacitors (more than 200 kW) to cover the current peaks during starting up and acceleration. Cooperation of all three source elements of motion has to be optimized by the appropriate strategies in order not to have undesirable lack or surplus of energy on the main bus. One of the main
329

13th Advanced Batteries, Accumulators and Fuel Cells Electric vehicles
objectives of the whole project is to create predicative control of propulsion by defined speed and altitude profile. A bus of this kind is supposed to shuttling between two points and number of such routes for one vehicle is always restricted and does not change often. For a public transport in a city or around a city the specific route could be analyzed after several rides with data of on-board computer of the bus and with valid collection of data the optimal strategy for the route could be created. For these two objectives (optimization, predication) a computer model has been created at Department of Power Engineering CTU in Prague. Because of poor availability of real charging and discharging characteristics of Li-ion accumulators, the model was firstly created in Mathematica© (Jan Kyncl) which is suitable for theoretic modeling with equations and where theoretical model of each energetic component was verified. Secondly, it was transferred to MATLAB© – Simulink© (Zbyněk Brettschneider), which is better for dynamic simulation of the bus ride. As the final step, the functionality of model has to be proved by valid data from the on-board computer. The paper shows some important points in the process of verification and determines possible ways of improvement.
The modeling of hybrid propulsion
Acceleration
Two tables are read in the initialization file:
Speed profile v=f(x)
Altitude profile h=f(x)
The final distance is divided to linearly spaced vectors in which values of speed are interpolated. Because the two tables can have different ranges the higher one is always chosen for maximal size of the linear space. From “altitude profile” the second vector is prepared in the same linear space as the interpolated difference between two altitudes of the file. For speed the linear interpolation was chosen because the model always takes particular value of demanded speed to which the bus will accelerate, and for altitude differences polynomial interpolation was chosen because these differences are used in each step in “power flow” calculations.
One step of the simulation begins by calculation of the total power needed Psum and power losses Plosses. Current acceleration is computed of it by equation
a= (1/mbus v) (Psum - Plosses)
where power losses Plosses is the sum of three elements - drag, height gradient, and friction.
Drag power losses:
Pdrag=0.5 v3 k cx
where is air density [kg/m3], v is speed [m/s], k is the constant of suspension, cx is the drag coefficient.
Gradient power losses:
Pgradient= mbus g dh v
where mbus is the weight of TriHyBus [kg], g is gravitational acceleration [m/s2], dh is difference of altitude [-].
330

13th Advanced Batteries, Accumulators and Fuel Cells Electric vehicles
Friction power losses:
Pfriction=mbus g v (CRF/rwheel) (1/sqrt(1+dh2))
where CRF is the coefficient of rolling friction [mm], rwheel is radius of wheel [mm].
The total power Psum is the sum of power losses Plosses and power for overcome of inercia Pinercia.
Power for overcome of inercia:
Pinercia=mbus a v
where a is the actual acceleration of TriHyBus [m/s2].
Current acceleration is compared with value obtained of speed profile. The difference between them is the acceleration demanded which is input for new calculation of Psum and the beginning of new iteration.
Strategy for charging of battery and supercapacitor
Equivalent diagram of charging system is on Fig. 1.
MDC/AC
Pbus
Uc
IcId
Udd
Icharg
Pcharg
Uq
Fig. 1: Equivalent diagram of charging system
If voltage on battery Uq is equal or higher than voltage on supercapacitor Uc, the ideal diode used in the equivalent schema as a voltage switch is open (diode´s forward direction) and battery is giving the power to motor. Its voltage Udd was given at 1 V. Otherwise, only the supercapacitor is connected to bus (diode´s reverse direction). In the both cases, the derivative of charge over time and derivative of voltage on supercapacitor over time are computed, integrated and a new evaluation of the condition is made.
Battery is charging (charging power Pcharg is a constant) only when condition (Charge on battery q < Maximal charge Qmax AND Voltage on supercapacitor Uc > Voltage on supercapacitor computed of Qmax) is TRUE.
Supercapacitor is charging by immediate surplus of energy on the main bus. It can be streamed of breaking (recuperation of energy to supercapacitor) or of fuel cell by rapid power drop because of its low dynamics. However, if the surplus of energy is higher than the system can handle, it has to be directed to breaking resistor as Pwaste. This state, surplus of energy, the model has to recognize, as the opposite case, lack of energy, and adjust adequately power flow.
331

13th Advanced Batteries, Accumulators and Fuel Cells Electric vehicles
Strategy for fuel cell
Strategy of the fuel cell is the most important task for optimization. Fuel cell power is dependent on voltage on supercapacitor Uc. If Uc drops below 90 % of its maximum (680 V), the fuel cell will begin to supply to the main bus. Of 60 % of maximum voltage on supercapacitor the fuel cell works on maximum power.
Dependence of fuel cell power on voltage on supercapacitor is limited by these three points:
Fuel Cell Initial voltage o VFCStart = 0.9 Maximal Voltage on Supercapacitor
Minimum Fuel Cell Power (of Maximum Fuel Cell Power PFCMax=50 kW) o PFCmin = 0.2 PFCMax
Fuel Cell Maximum Voltage o VFCMax = 0.6 Maximal Voltage on Supercapacitor
Power flow
Efficiency of
motor
Efficiency of
fuel cell
Efficiency of
charger
Pfc
Pfc1
Pdrive
Pwaste Pother
Pbus
Pchargbatt1
Pchargbatt
Pmech
Charging
system
Fig. 2: Pover Flow - schema
The main schema is on Fig. 2. If the power balance is changed by the requirements from external files, the ability of system to deliver the required power has to be tested. Two values of power are computed – for electrical Pelmax and for mechanical part Pmechreal.
The maximum electrical power Pelmax is compared with the power limit of the bus and if it exceeds, the limit is set as the maximum achievable power. The model tests whether there is enough energy by comparing Pelmax and Psum. If Psum is higher than Pelmax the system does not enough energy and Psum is adequately restricted before the new iteration.
332

13th Advanced Batteries, Accumulators and Fuel Cells Electric vehicles
Verification of model
On-board computer of TriHyBus collects data of each route to file in format csv which is simply transformed to EXCEL supported by Matlab© commands.
Fig. 3: On-board computer output
Variables monitored:
Time (s)
Fuel cell power (W)
Battery power (W)
SOC (state of charge) (%)
Voltage on supercapacitor (V)
Power on the main bus (W)
Pother (W)
Speed (m/s)
Level of H2 (%)
Level of N2 (%)
Altitude (m)
Latitude (°)
Longitude (°)
For loading data of log to model, the Block 3 (loading of speed profile and altitude profile) could be copied for each demanded input and connected with the appropriate output of the model to one Scope, so the comparison can be made very easily.
The predicative simulation of acceleration is on Fig. 4 and consists of three sub-scopes with time on axis x – of bottom there is a distance, in the middle the demanded speed is compared with actual, and at the top acceleration caused by the demanded speed in limits of constants aplus and aminus.
333

13th Advanced Batteries, Accumulators and Fuel Cells Electric vehicles
Fig. 4: Simulation of acceleration (x=f(t), v=f(t), a=f(t))
The simulation of acceleration turned up to be successful, but in case of charge q and voltage on supercapacitor Uc the result cannot be displayed without substantial distortion. The format of external inputs – speed profile and altitude profile is the main problem. If the bus stops for a while (crossroads, jams) the distance in the log does not change. But Matlab© needs a function what means that one input cannot be related to more outputs. The simplest solution is to edit the log in the initial file by for-cycle and to erase all duplicate inputs. But even if the bus stops, the charging and discharging of batteries and supercapacitor continue. Therefore, for the city transport the chosen solution is very inconvenient, because of huge distortion. For the long distances without pauses, the results are satisfying and they prove of rightness of chosen strategy as can be seen on Fig. 5, where the first third of simulation is in order, but the rest is distorted by the problem described above.
334

13th Advanced Batteries, Accumulators and Fuel Cells Electric vehicles
Fig. 5: Simulation of power flow –comparsion of Pmech of on-boar komputer and the model
Future improvement
The format of external inputs has to be changed because of distortion of outputs described above. Alteration of distance to time (v=f(t) and h=f(t)) is the best solution of the problem.
The change of constants to functions will be the main improvement in the next steps of model building. There are prepared blocks for efficiencies which are constants now, but in the future they will be functions of power. The same improvement will be made with maximal and minimal charges on battery Qmin and Qmax, so the computation of charge q and Voltage on supercapacitor Uc will be more accurate.
Conclusion
The verification proves of model functionality. The second step of the research, creation of predicative strategy for hybrid vehicles, was the main objective for creation of model and its implementation will be one of the main results of the whole project. After changing format of external inputs, the optimal way of predictive drive control will be constructed and implemented to on-board computer of TriHyBus.
Acknowledgements
The authors would like to acknowledge the Ministry of Industry and Trade of the Czech Republic for co-funding the project FR-TI3-561 "Research and Developement of Advanced Contol Systems for Hydrogen Technologies".
335

13th Advanced Batteries, Accumulators and Fuel Cells Electric vehicles
References
[1] JANIK, Ludek; DOUCEK, Ales. The First Fuel Cells Hydrogen Bus in New EU Countries. In: Proceedings of the ABAF-11 Meeting. s. 55-59. ISBN 978-80-214-4260-3. [online]. [cit. 2012-09-13]. Available from: http://www.aba-brno.cz/download/Proceeding_ABAF_11.pdf.
[2] JANIK, Ludek; DOUCEK, Ales. The First Fuel Cell Hydrogen Bus in New EU Countries. Journal of Asian Electric Vehicles. 2008, 6(1). ISSN 1348-3927.
[3] JANIK, Ludek; DOUCEK, Ales. Vodíkový autobus - výhody hybridní koncepce autobusu. Vesmír. 2009, č. 12. ISSN 1214-4029.
336

13th Advanced Batteries, Accumulators and Fuel Cells Electric vehicles
HIGH-POWER CHARGER FOR SUPER-EL ELECTRIC PASSENGER CAR
Červinka, D., Vorel, P.
Department of Power Electrical and Electronic Engineering, Faculty of Electrical Engineering and Communication, Brno University of Technology, Technicka 3058/10, 616
00 Brno, Czech Republic, www.uvee.feec.vutbr.cz
Corresponding author: Pavel Vorel ([email protected])
Abstract
Fast-chargers improve dominantly the practical usability of electric vehicles because they enable to charge the traction accumulators during short time periods (ones of hours or tens of minutes). Nowadays “on board” fast-chargers are required instead of heavy and large stationary solutions. Therefore stronger requirements on high power/mass and power/volume ratio appear.
This paper introduces fast-chargers developed by the authors for concrete users. The high power/mass and power/volume ratios are achieved using a non-tradition DC/DC converter operating at a very high switching frequency. Progressive silicon-carbide semiconductors are used in this converter. A modular conception was chosen, each charger module provides output parameters 140V/100A. The modules can be easily connected to series to create a fast-charger for an accumulator with any desired voltage. The developed devices are constructed as auxiliary portable devices (not „on board“). Their dimensions are very small and so the devices can be placed always in the vehicles. Then the charger can be plugged-in to the common grid 3x400V anywhere to charge the traction accumulator.
Introduction
The fast-charging is an important segment of the electro-mobility problems. It is developed very quickly. A DC/DC converter (switching supply source) with a high-frequency pulse transformer is the core of a modern fast-charger. Only “forward types” of converters can be used due to the high power demand. The presence of the pulse transformer is necessary because the galvanic separation between the output terminals and supplying grid is demanded (safety reasons). Converters used in these chargers (tens of kW) are commonly based on IGBT transistors and their switching frequency does not exceed approx. 40kHz.
New development trends (as that one described in this paper) demand a rapid increasing of the switching frequency. This way the dimensions of wound components (power transformers and choke coils) are strongly decreased.
However the increasing of the switching frequency brings the necessity to use faster switching transistors in order to eliminate their switching losses. Fast transistors MOSFET from INFINEON (so called CoolMOS) were used in the introduced devices. The usage of
337

13th Advanced Batteries, Accumulators and Fuel Cells Electric vehicles
these transistors with extremely short switching-on and switching-off times requires the usage of extremely fast diodes in the power circuitry with minimum reverse recovery and forward recovery effects. The diodes operate in the converter under hard conditions with high reverse voltage, high forward current, high operating frequency, high di/dt slope during the diode opening and high du/dt slope during their closing. The only usable diodes in this application are silicon-carbide diodes (SiC).
Developed fast-chargers operate with an unusually high switching frequency of 100 kHz at the power 14 kW, 16 kW, respectively 48 kW. This progressive solution brings the advantage of low weight and dimensions.
The fast-chargers were developed and completely realized in the Department of power electrical and electronic engineering (FEKT VUT Brno). Similar powerful fast-chargers with so low dimensions are not commonly available in the market.
Converter conception
The topology of the converter power circuit was created with respect to maximum simplicity. This is why various variants of resonant or quasi-resonant converters were rejected. The absence of switching losses in these variants enables to use a higher switching frequency with relatively slow semiconductors, but the complicated power circuits lead to a higher price. Also the controllability of these converters is limited.
Very fast high-voltage switching transistors MOSFET (concretely CoolMOS from INFINEON) used instead of common IGBTs enable a high switching frequency in the simple topology with hard switching. The total switch-on and switch-off times of these transistors are only about 100 – 150ns. Therefore the high switching frequency does not represent unacceptable switching losses. The commutation losses of diodes in the secondary rectifier are avoided using progressive diodes from silicon-carbide. These diodes must be used also in the primary power circuits.
It is advantageous to avoid using double-acting converters at the extremely high switching frequency 100kHz (for such high powers). The realization of reliable „dead-time“ at the
switching period 10 s would be a complication. We use two single-acting forward converters (half-bridges). The topology is clear from Fig.1.
2
DCU
2
DCU
i2A
i2B ILB
ILA
Fig. 1: Topology of the power circuit (principle diagram)
The three-phase input voltage is rectified with a simple passive diode six-pulse rectifier with a very low output capacity in the DC link. The DC link (560V) is split (2x280V) so the
338

13th Advanced Batteries, Accumulators and Fuel Cells Electric vehicles
two converters are connected to series on the primary side. Each converter is supplied from the half DC voltage 280V. This enables to use transistors with reverse voltage only 600V with much lower switch-on resistance than those for 800V or 1200V. This brings a reduction of conducting losses.
The converters don ´t work to a common choke (as usually) but each of them must have its own choke. In such configuration a natural negative feedback mechanism is present in the circuit which ensures the voltage symmetry of the split DC link without any additional control.
There are very strong requirements on the drivers for fast CoolMOS (ringing suppressing, extremely low parasitic capacity of the galvanic separation). Also complications in the field of EMC are strong. The parasitic inductances in some parts of the power circuit must be extremely minimized (geometry lay-out). Also the problems of the transformer leakage inductance have a significant importance.
All these problems are known from common converters but the negative influence of all the parasitic effects is much higher in the application with extremely high power and frequency. This is why nowadays only few companies are able to construct such devices.
Basic description and user parameters
The basic technical specifications of the developed fast-chargers are in Tab.1.
Table I: Basic technical specifications of the charger.
Type RN14-140 RN16-380 RN45-450
Max. steady output DC current 100A 42A 100A
Max. output DC voltage 140V 380V 450V
Max. steady output power 14kW 16kW 45kW
Supplying (standard grid 50Hz) 3x400V 3x400V 3x400V
Switching frequency 100kHz 100kHz 100kHz
Weight ca 25kg ca 25kg ca 60kg
Dimensions 37x26x35cm 37x26x35cm 37x26x80cm
The fast-chargers are realized as functional patterns to verify the conception in the real practical usage. They are not solved as “on board” devices but as compact portable devices with uncommonly low dimensions and weight.
Type RN14-140 was developed for a concrete user of electric vehicle Peugeot 106 Electric with NiCd accumulators. This charger is equipped with a cascade voltage control with a slave current loop (adjustable current limit). The required voltage value is ca 145V and the maximum charging current can be chosen 10A, 20A, 50A or 100A. This device is finished and is practically used.
339

13th Advanced Batteries, Accumulators and Fuel Cells Electric vehicles
Fig. 2: Fast-charger RN14-140 (front view)
Fig. 3: Fast-charger RN14-140 (see-through upper cover)
Type RN16-380 was developed for a small electric plane. This plane is equipped with Li-ion accumulators and cooperating BMS circuits. The BMS serves as the master voltage control system at the charging process so it commands the charger via a control signal (actual required charging current). This charger was finished in the laboratory and is still waiting for the practical use (while the plane is not finished).
Fig. 4: Detail of some control and driver circuits (RN16-380)
340

13th Advanced Batteries, Accumulators and Fuel Cells Electric vehicles
Fig. 5: Fast-charger RN16-380 (upper cover removed)
Type RN48-480 is developed for the same user as the RN14-140. It is matched for the electric vehicle SUPER-EL with Li-ion accumulators (Skoda SUPERB rebuilt to an electric vehicle by the company EVC Group). With respect to the higher weight (60kg) this most powerful type is equipped with wheels for a simpler manipulation. This device uses three power modules RN14-140 (the conception is modular and the output parameters can be configured using a serial or parallel ordering of several modules). The development of RN48-480 is not finished, the circuitry of the device must be debugged yet.
Fig. 6: Fast-charger RN48-480 (upper cover removed)
341

13th Advanced Batteries, Accumulators and Fuel Cells Electric vehicles
Ringing problems
Dangerous parasitic high-frequency LC oscillations (so-called ringing) are a specific effect of very fast switching MOSFETs and have to be suppressed with a sufficient power circuit construction and driver design.
Thanks to the leakage of the transformer the load current transformed to the primary side of the converter helps to charge very fast the parasitic capacity of the transistors (drain-source) at the transistor switching-off. This enables a high du/dt slope of the rising voltage drain-source. (In no-load state only the small magnetizing current would charge the transistor parasitic capacity slowly.)
The high du/dt slope excites parasitic high-frequency LC oscillations in the drain circuit (see Fig.7 – closely after the fast rising edge). These oscillations are transferred to the transistor gate through its Miller capacity and via other external parasitic capacitive ways.
Similar oscillations can appear also primarily in the driven gate of the transistor (even if no voltage is in the power circuit). This kind of ringing can be avoided making an appropriate design of driver circuits and their lay-out geometry.
However the above (first) mentioned kind of ringing can not be avoided totally. Here the parasitic LC circuit is created with the inductance of the loop transistor – demagnetizing diode – capacitor of the half DC link and with the capacity drain-source of the transistor parallel with the capacity of the demagnetizing diode (both capacities lay parallel from the “AC point of view” because of the relatively high capacity in the DC link). The frequency of the oscillations is typically about 50-100MHz. The parasitic resonant circuit has very low
characteristic impedance only about 10 – capacity of hundreds of pF and low inductivity of low tens of nH!
Fig. 7: Switching-off process of the transistor yellow – gate-source voltage green – drain-source voltage
Therefore the oscillations are very “voltage hard” and so potentially dangerous as an effective interference source. This can be spread to the ambient not only via capacitive currents (thanks to high du/dt) but also as an electromagnetic wave (the wires in the drain circuit are a parasitic transmitting antenna for UHF band). This must be avoided with the PCB lay-out and with shielding methods.
342

13th Advanced Batteries, Accumulators and Fuel Cells Electric vehicles
The parasitic feed-back through the Miller capacity is negative from principle. However at high frequencies additional phase shifts caused by various parasitic capacities and inductivities can appear. So a real danger of positive feedback is present – while the switching-off process of the transistor is not finished the transistor operates in the linear regime – as an amplifier with common emitter. Then the positive feedback leads to the amplification of the oscillations with fatal consequences – danger of high voltage breakdown, danger of high drain power dissipation. Moreover the transistor structure is not fast enough to operate in this parasitic linear regime at 80MHz in the whole volume symmetrically. So a local concentration to a small part of the chip area would probably appear with damaging effect.
This very dangerous effect (positive feedback for ringing) was avoided with an appropriate driver circuitry and lay-out.
A good immunity of the developed driver to these effects can be observed in Fig.7. Also the high quality of the power circuit is visible from the Fig.7. Although a high current of 55A is switched-off with extremely fast transistors the drain voltage over-shoot (amplitude of the high-frequency oscillations after the rising edge) is only about 50V! This is a perfect result achieved thanks to a careful PCB design, sandwich placement of DC link capacitor terminals, using appropriate DC link capacitors, using SiC demagnetizing diodes with practically zero forward recovery effect and also using a snubber RCD circuit.
Influence on the supplying net
Switching power supplies produce generally low-frequency interference to the supplying net (next to a high-frequency interference spread as electromagnetic wave and via capacitive currents). The low-frequency interference is represented by a deformation of the net phase voltage caused (thanks to the non-zero net internal impedance) by the non-harmonic shape of the phase current. It corresponds to the usage of a passive (diode) input rectifier with an output capacitor in the DC link.
The over-current phase protection (fuse) react on the RMS value of the phase current taken from the net by this rectifier and this RMS value is high. However only the first harmonic component of the phase current brings the true input power from the net. The other harmonics only create the total non-harmonic shape of the current (they are the interference creators) and they increase the total RMS value. This is why they decrease the usable maximum power at a defined fuse sizing.
The usage of active rectifiers (power factor correctors PFC) is an effective solution of these problems but this is very expensive and technically a bit complicated. An AC/DC transistor converter with a sine pulse-width-modulation is used and the input phase current is then almost harmonic.
This expensive solution is not used in the developed fast-chargers (space and price reduction). The input phase current is not ideal harmonic but using an available conception of the rectifier (with low output capacity) low values of higher harmonics of the phase
current were reached. A very good power factor =0,96 was achieved (measured value). The phase current has not the shape of narrow and high pulses like in rectifiers with a high output capacity. In our application the shape of the phase current is approximately rectangular with a duty of 2/3, see Fig.8. This is advantageous with respect to the true power which can be taken from the fused net and also with respect to the deformation of the phase voltage.
343

13th Advanced Batteries, Accumulators and Fuel Cells Electric vehicles
Fig. 8: Phase current taken by the fast-charger
Conclusions
The developed fast-chargers use the most progressive technology of switching devices. The construction is not possible without very fast diodes from silicon-carbide (SiC). Nowadays their price is high (ca 280EUR only for diodes in RN14-140). Even so the material costs are acceptable with respect to the achieved low dimensions and high power of the device.
The mechanical design should be re-configured before a higher serial production. Also no official approval measurements were done. The developed devices are not commercial products.
Silicon-carbide and also gallium-nitride are progressive materials for power switching semiconductors. They provide new challenges to the constructers of power switching supplies to increase the ratio power/mass and power/weight.
Authors want continue the development in this field. SiC MOSFET transistors will be used and an “on board” fast-charger with a water cooler will be probably constructed. Some laboratory pre-development tasks are already solved.
Acknowledgements
This research has been supported with a grant project MŠM 0021630516 “Zdroje, akumulace a optimalizace užití elektrické energie“ and with a grant project MPO FR-TI1/061 “Application of VUT 001 Marabu for hydrogen fuel cells propulsion“. Partially the development was supported by the faculty project FEKT-S-11-14 “Utilization of new technologies in the power electronics”.
References
[1] P. Vorel; P. Procházka; V. Minárik. Powerful fast charger 16kW for electric vehicle. Proceedings of ABAF Brno 2011. ISBN 978-80-214-4310-5
[2] P. Vorel; P. Procházka. Vývojová řada přenosných rychlonabíječů pro elektromobily. Elektro a Automa 2012, pp. 18-19, FCC Public s.r.o., ISSN: 1210-9592, Mart 2012.
344

13th Advanced Batteries, Accumulators and Fuel Cells Electric vehicles
PARASITIC EFFECTS IN POWER CIRCUITS OF HIGH POWER BATTERY CHARGERS
Kuzdas, J., Vorel, P.
Brno University of Technology, Department of Power Electrical and Electronic Engineering,
Technicka 10, 616 00 Brno, Czech Republic
Corresponding author: Jan Kuzdas ([email protected]) Phone: +420 5 4114 2439, Fax: +420 5 4114 2464
Abstract
This article deals with parasitic effects of a battery charger 16kW operating at a very high switching frequency (100kHz). These parasitic effects are negligible at traditional lower switching frequencies.
Introduction
This paper deals with the parasitic effects of a charger (DC/DC converter) with nominal power 16kW.
The minimum possible size, weight and lowest prices of the charger were required while keeping the simplicity and reliability of the equipment. For these reasons the choice of concept and the design of high power converter are very complex. Converter topology is limited by the available magnetic circuits, materials and semiconductor devices.
Required parameters
Charger required power is 16kW (connecting more basic modules can increase the output power). Because of the high power, it’s evident that the device must be powered by a 3-phase net (3x400V/50Hz).
Table 1: Required parameters of the charger.
Symbol Name Value
I Output current 100A
U Output voltage 160V
P Output power 16kW
Uin Input AC RMS voltage 3x400V
UDC DC link voltage (split DC-link) 2x280V
F Switching frequency 100kHz
M Mass ca 25kg
345

13th Advanced Batteries, Accumulators and Fuel Cells Electric vehicles
In addition, there are requirements on these converter output values: 160V/100A DC (modifying the power transformer and the secondary circuit, this converter concept can work with different output voltages and currents).
Power circuit concept
Because of the required smallest size and weight it is necessary for the converter to work with a high switching frequency. For such a high switching frequency and power (current) it is not possible to use slower IGBT transistors and conventional diodes. It is necessary to use Cool-MOS transistors and diodes based on SiC. Total switch-on and total switch-off time of Cool-MOS transistors are only about 100ns and SiC diodes recovery time is about 10ns. Thanks to this, the problems with switching losses are reduced and it’s possible to design such a charger with high power and high switching frequency (16kW/100kHz) (1).
Fig. 1: Scheme of the basic module of the converter 16kW (1).
Parasitic effects due to high switching frequency and their elimination
The usage of Cool-MOS transistors and high switching frequency brings some new problems.
Influence of the leakage inductance of the high frequency transformer on the equivalent internal resistance (in the output of the converters).
Leakage inductance of high frequency transformer LR2 causes "reduction" of duty cycle voltage on the secondary side of the converter. The following illustration shows the leakage inductance LR2 considered on the secondary side of the transformer.
346

13th Advanced Batteries, Accumulators and Fuel Cells Electric vehicles
Fig. 2: Simplified schema of converter with parasitic inductance of the transformer considered on the secondary side.
Where the meaning of the symbols is as follows:
UD1 voltage of one half of the DC-link voltage UD, CF capacitor battery of the voltage DC-link, TH upper transistor, TD down transistor, DD demagnetization diodes, N1 number of primary turns of power high frequency transformer, N2 number of secondary turns of power high frequency transformer, u2 actual value of induced voltage on the secondary side of the transformer, LR2 parasitic leakage inductance of transformer converted to the secondary side of the transformer, DU rectifier diode, i1 instantaneous current flowing through the rectifier diode, D0 free-wheel diode, i1 actual value of current flowing through the rectifier diode, i0 actual value of current flowing through of the free-wheel diode, ux actual value of voltage on the free-wheel diode, L output choke, IZ nominal output current, UZ nominal output voltage.
This parasitic effect is reflected in the moment of "taking" of current from free-wheel diode to the rectifier diode (at the moment of switching transistors TH and TD). Effect can be described as follows: When switching on the transistors, the rectifier diode DU is polarized forward and current begins flow through. However, the current i1 does not increase to a maximum value immediately, but thanks to the transformer leakage inductance increases gradually, until it reaches its maximum value. At the same moment when the current i1 starts to rise, current i0 starts decreasing in free-wheel diode D0.
The output current IZ is still constant. According to 1st Kirchhoff law it results into equation [1].
IZ=i0+i1 [1]
The voltage ux on the free-wheel diode D0 is zero (resp. small negative value – forward voltage of this diode) until the moment when rectifier diode DU takes over current IZ, as shown in Fig. 3. The result: Leakage inductance of the transformer reduces the duty cycle and decreases, the value of the output voltage, see Fig. 3.
For an explanation of this parasitic effect (for the secondary side of the inverter) an analogy to the theory of real voltage source can be used (assuming continuous current). In the Fig. 4 there is a simplification of the circuit at the time of switching on of the transistors, which is reflected in our described parasitic effect.
347

13th Advanced Batteries, Accumulators and Fuel Cells Electric vehicles
Fig. 3: Leakage inductance influence of the resulting output voltage of the transformer.
Fig. 4: Equivalent circuit of the secondary side converter at the moment of switching-on the transistors.
Considering an equivalent internal resistance of a real voltage source we can write:
UZ=UZ0-RiIz [2]
Following general equation is clear:
U/L= i/ t [3]
Using Fig. 3 and expressing t from [3] we get:
IZ/ t = UD1(N2/N1)/LR2 => t =IZLR2/UD1(N2/N1) [4]
The Uz value can be calculated from the curve ux as its average value (see Fig. 3):
UZ = ton- t)/T)UD1(N2/N1) [5]
The duty cycle s is:
s = ton/T [6]
348

13th Advanced Batteries, Accumulators and Fuel Cells Electric vehicles
Next we implement the UZ0 according to [2] and s according to [6] into [5]:
UZ = UD1(N2/N1)s-( t/T)UD1(N2/N1) = UZ0-( t/T)UD1(N2/N1) [7]
Then we use the t according to equation [4] and substitute it to [7]:
UZ = UZ0-(IZLR2/(UD1(N2/N1))(1/T)UD1(N2/N1) [8]
After simplification the equation [8] and using f=1/T we get:
UZ = UZ0-LR2 f IZ [9]
Comparing [9] a [2] we can write:
Ri = LR2 f [10]
Equation [10] shows that the equivalent output resistance of the inverter (i.e. at a constant duty cycle switching) increases with increasing switching frequency and the leakage inductance of the transformer.
Reverse recovery current overshoot of the free-wheel diode
When a free-wheel diode takes current from the rectifier diode, a current overshoot rises. This effect in diode is called the reverse recovery. Both diodes are overshot by current, because of valid equation [1].
Fig. 4: Reverse recovery effects in the secondary rectifier diodes.
Overshoot amplitude is proportional to the di/dt slope (smaller parasitic leakage inductance of the transformer – higher di/dt slope) and the Qrr (diode reverse recovery charge).
It was necessary to reduce this overshoot in the construction. Reducing di/dt slope through the transformer leakage increasing was inappropriate because of the growing parasitic effects, see previous text. It was necessary to use diodes with a smaller Qrr. New diodes
349

13th Advanced Batteries, Accumulators and Fuel Cells Electric vehicles
based on silicon carbide (SiC) IDH15S120 Infineon (1200V/15A) were used. Their Qrr value is 54nC (independently on the di/dt slope).
Conclusion
This article dealt with parasitic effects of high power charger operating at a very high switching frequency.
After the converter topology was chosen, a prototype of charger with nominal output power 16kW with a switching frequency of 100kHz was constructed.
For this reason new semiconductor devices were needed enabling a large du/dt or di/dt slope. Cool-MOS transistors and diodes based on SiC were used. However using of these elements requires an eliminating of new parasitic effect. The text describes how some parasitic effects appear. These parasitic effects were suppressed.
The fact that this concept is functional was verified in a functional sample.
Acknowledgements
This work was solved in the frame of the faculty project FEKT-S-11-14 Utilization of new technologies in the power electronics, further it has been supported by the European Commission under the ENIAC CA-E3Car-2008-120001 E3CAR - Nanoelectronics for an Energy Efficient Electrical Car project.
References
[1] J. Kuzdas; P. Vorel. High- Power Converter Operating at Switching Frequency 100kHz. In XI. International Conference on Low Voltage Electrical Machines LVEM2011.,3, ISBN: 978-80-214-4362-4, (2011).
[2] M. Patočka, Magnetické jevy a obvody ve výkonové elektronice, měřicí technice a silnoproudé elektrotechnice, Brno, 480, B5 (2011).
[3] G. Kovacevic, A. Tenconi, R. Bojoi, Advanced DC–DC converter for power conditioning in hydrogen fuel cell systems, International Journal of Hydrogen Energy, Volume 33, Issue 12, ISSN 0360-3199, June (2008).
350

13th Advanced Batteries, Accumulators and Fuel Cells Electric vehicles
USAGE OF THE FUEL CELL-POWERED ELECTRIC DRIVE IN AVIATION
Prochazka1, P., Pazdera1, I., Bencalik2, K.
1 Brno University of Technology, Faculty of Electrical Engineering and Communication, Department of Power Electrical and Electronic Engineering, Technicka 3058/10, 616 00
Brno, Czech Republic 2 Brno University of Technology, Faculty of Mechanical Engineering, Institute of Aerospace
Engineering, Technicka 2896/2, 616 69 Brno, Czech Republic
Abstract
Weight and consumed space of the fuel cell systems are one of the most important factors limiting its utilization in electric airplanes. Possibilities of its implementation in electric airplane are frequently discussed issues. Power – mass relationship depending on installed power of the fuel cell shows, that the power/mass ratio is unsatisfactory, when powering electric motor directly from fuel cell. Configuration with high-power small-capacity battery and relatively small fuel cell is more profitable. Some calculations were done for functional prototype of the small airplane VUT 051 RAY, its take-off weight is about 600 kg and its max. power is 55 kW. There are some practical measurements on the Ballard fuel cell system presented in this paper, which can documents disputableness of its usage in airplane. Hydrogen management (hydrogen tank, cooling system, armatures etc.) still represents outstanding issue due to high volumes and weight of the whole fuel cell system. Current progress in the field of the Li-Ion accumulators, generally decreases importance of hydrogen-drive systems and focuses more attention to simply accumulator powered airplane.
Introduction
Fuel cells are nothing new in aviation. Firstly were used even in the sixties, for example in Gemini and Apollo projects. Meantime in aerospace industry another application begin to appear. One typical possibility, how to use fuel cell in aviation, is their utilization as an auxiliary energy units (APU) for backup power units.
Boeing Co. developed first airplane which was powered with fuel cells and its first flight was made on 2.4.2008 in Madrid. The fuel cell was built in to the HK36 Super Dimona airplane manufactured by Diamond Aircraft Co. The drive system was made with Fuel Cell propulsion system. The fuel cell wasn’t the only source of the energy on the board. There were used accumulators too and together with fuel cell provided total power about 50 kW.
Another fuel cell airplane, which made its flight on 7th July 2009, was Antares DLR H2. It is modified motored glider which was firstly powered from batteries. Now the fuel cells provide output power 25kW, hydrogen tank and fuel cell are fixed under wings in aerodynamic gondolas.
351

13th Advanced Batteries, Accumulators and Fuel Cells Electric vehicles
Stanardized flight
To get all basic values of desired power during the flight, the standardized flight profile was defined, see Fig. 1. In this flight profile is considered flight altitude 800 m and maximal climb approx. cca 1.5m/s. Descent of the plain can be realized with gliding with turned off motor or with minimal power.
Fig. 1: Nominal flight profile of electric airplane.
Table 1: Specific parameters for particular flight phases. (1)
V Vz t t Pmotor PFC Pt
km/h m/s s min kW kW kWh
Pre-flight
taxi 600 10 15 17.32 2.5
Take off 50 0.83 46 53.1 0.7
Climb 95 1.5 367 8.88 46 53.1 5.4
Cruise 95 0 1800 30 29.99 34.6 17.3
Descent 95 -2 400 6.67 8.80 10.16 1.1
Taxi and
arival 300 5 15 17.32 1.4
Total 3217 53.62 28.4
From measured data (see tab. 1) made on real airplane VUT 001 MARABU, which is determined for the reconfiguration with fuel cell, it is obvious that the desired mechanical power for take off and climb 1.5 m/s is about 46 kW.
352

13th Advanced Batteries, Accumulators and Fuel Cells Electric vehicles
Another desired power of the fuel cell were calculated for various flight modes of the airplane with given efficiency of the each components of the drive:
Motor efficiency 0.94
DC/DC inverter efficiency 0.96
(in case of battery powered airplane)
DC/AC inverter efficiency 0.96
Fuel cell inverter efficiency 0.96
Total efficiency 0.83 (0,866 without DC/DC inverter)
Considering total efficiency and desired mechanical power is desired power of the energy unit 55,42 kW. If the only fuel cell is used than the total efficiency is approx. 0.86 and desired power of the supply unit is 53 kW.
Airplane drive analysis
From data mentioned in paper introduction is obvious that drives with fuel cell aren’t usual in current aviation. Drive conceptions follows two basic directions:
Airplane powered only with fuel cell
Airplane powered with battery and fuel cell
Drive system of the airplane powered only with fuel cell
Drive unit of the airplane is powered only with energy from fuel cells. These cells provide enough energy for all phases of the defined flight (take off, climb, horizontal flight, descent, landing and some taxi). With rising desired power not only weight of the fuel cells but even weight of the various supporting subsystems is rising too. Due to low efficiency of the fuel cell a lot of energy has to be takes away from drive system. The bigger dimensions of the heat sings than generate higher aerodynamic resistance.
Drive system of the airplane powered from accumulators and fuel cells
Drive unit of the airplane uses two independent sources of the energy stored in accumulators and fuel cells. Energy in accumulators provide desired increase of the power to maximal value desired in take off and climb stage of the flight. Only energy of the fuel cell is used in horizontal flight, descent, and pre-flight (arrival) taxi. Advantage of this solution is lower number of the used fuel cells and their subsystems, lower requirements to cooling system, therefore some weight saving are achieved. The main disadvantage is necessity of using of the DC/DC inverter (lower total efficiency, high weight of the DC/DC module) and of course extremely high weight of the accumulators.
The final solution of the drive is highly depended on desired power, total weight, volume of the drive unit and good capability to take away dissipated energy. Despite good weight to power ratio of the fuel cell, still there is significant issue with building the fuel cell into the airplane, due to weight of the necessary subsystems. Most of industrial manufactured components of the drive aren’t optimized in term of weight.
353

13th Advanced Batteries, Accumulators and Fuel Cells Electric vehicles
Drive unit of the airplane
Preliminary component selection was made in terms of to minimal weight and dimensions of the drive. Principle schema is shown in Fig. 2.
Main components of the drive
Component selection is depended on desired actual power during the flight. The standardized flight profile is used to define basic requirements (see. Fig. 1). On the basis of collected data about products and their features, the basic components (motor, fuel cell, inverters, tank) were chose especially for basic analysis and conceptual design and proposals of the drive of the airplane VUT 051 RAY. These preliminary selected components are chosen due to former experience from other projects, where AI and DPEE were participated in.
Fig. 2: Principal diagram of the airplane drive. There are two fuel cells in the Fig. 2. But due to high value of the desired power 53kW and according to available market products, at least two or three fuel cells are needed.
Fuel tank
Size of the hydrogen tank is depended on fuel (hydrogen) consumption and on desired power. For calculation of the hydrogen tank size, two fuel cells Mark 9 SSL from Ballard Co. were taken into consideration. It is modular fuel cell with output power 4.4; 8.8; 13.2 or 19.4 kW.
354

13th Advanced Batteries, Accumulators and Fuel Cells Electric vehicles
Fig. 3: Consumption of the fuel cell.
The fuel cell with output power 19.4 kW was finally chosen, this cell gives best power density related to one kilogram weight (1.14 kW/kg). Since the supplied output power is depended on length of the technical lifetime of the fuel cell and maximal power is reached only in the beginning of this lifetime period. Therefore for further analysis the value 19kW is considered as a maximal output power of the fuel cell.
At maximal fuel cell power is according (2) hydrogen consumption approx. 230 SLPM.
Hydrogen density ρH2 = 9*10-5 kg/l
Hydrogen mass flow
[1]
New auxiliary variable Z is introduced for defining desired size of hydrogen tank. The Z variable gives hydrogen consumption in dependence on operating time of the fuel cell and desired power.
[2]
Table 2: Desired powers and hydrogen consumptions at standardized flight profile.
V Vz t T PFC Pt Consumption
km/h m/s s Min kW kW.h kg
Pre-flight taxi 600 10 17.32 2.5 0.18
Take off 50 0.83 53.1 0.7 0.05
Climb 95 1,5 367 6.12 53.1 5.4 0.35
Cruise 95 0 1800 30 34.6 17.3 1.13
Descent 95 -2 400 6.67 10.16 1.1 0.07
Arrival, taxi 300 5 17.32 1.4 0.09
Total 3217 53,62
28.4 1.87
0
50
100
150
200
250
0 50 100 150 200 250 300
Stan
dar
dn
ích
litr
ů z
a m
inu
tu [
SL/m
in]
I[ A ]
Mark 9 SSL - 19kW
355

13th Advanced Batteries, Accumulators and Fuel Cells Electric vehicles
For standardized flight profile 1.87 kg of hydrogen is desired. Suitable tank is W076 from Dynetek with capacity of 74 liters. This tank can contain 2.17 kg of hydrogen at pressure 350 bar and gives us enough fuel reserves for standardized flight profile.
Construction design of the drive unit on board configuration
Several constructional configurations of the on board drive unit were analyzed to obtain important information used for final conception. Advantages and disadvantages of analysed configurations were defined.
Configuration 1
Fig. 4: Configuration of the airplane drive unit - 1.
For first drive unit configuration (Fig.4) are fuel cell, compressor and hydrogen placed in airplane fuselage.
+ No complicated reconfiguration of the airplane + Easy assembly and disassembly + Better use of space
- Poor accessibility for maintenance and adjusting and - Problematic ensuring of demand on solid fixing at crash landing - Massive bulkhead for tank fixing is desired - Larger amounts of cabling
356

13th Advanced Batteries, Accumulators and Fuel Cells Electric vehicles
Configuration 2
Fig. 5: Configuration of the airplane drive unit - 2.
Constructional design according to Fig.5 considers the hydrogen tank placed either under or above the wing simultaneously with using proper aerodynamic covers.
+ Good accessibility to tank and easy refueling + Simple reconfiguration of the airplane + Good assembly and disassembly + Good accessibility for maintenance and adjusting + No ventilation of the cabin is desired + For tank fixing can be use system for former turbojet motor
- Deterioration of the aerodynamic properties of the airplane - Construction of the new aerodynamic covers of the hydrogen tank
At preliminary design of final constructional configuration both two solutions were taken into consideration. All advantages and disadvantages mentioned above were carefully considered and discussed. Constructional propose 1 is advantageous especially due to fixing components to exiting fixtures and bulkheads which were only reinforcement if needed. Simple maintenance and component adjusting is very beneficial too. Simultaneously there is no degradation of the aerodynamic features of the airplane. Due to safety is the pilot space completely separated from hydrogen tank space and separate ventilation of the pilot cabin is ensured due to risk of hydrogen leak. Constructional propose 2 gives more possibilities how to place each components in the body of the airplane.
Final configuration of drive unit will depend on weight and balancing demands on airplane.
Measured fuel cell
Verification of the fuel cell characteristic and features was made on stack Heliocentris HyPM® XR 8. This stack is contains fuel cell with output power 8.5 kW with nominal voltage in range of 20 - 40 V and maximal output current 380 A. Efficiency of this cell is approx. 51 %. This fuel cell is from Ballard co. and is the same type which was considered by calculation discussed earlier in this paper.
357

13th Advanced Batteries, Accumulators and Fuel Cells Electric vehicles
Fig. 6: Stack Heliocentris HyPM® XR 8.
Only few measurements were done on presented fuel cell to get some general data of the cell features and parameters. Some results are presented in Tab.3:
Table 3: Parameters of fuel cell.
Fuel Cell
Current
Fuel Cell
Voltage
Min. Cell
Voltage
Avg. Cell
Voltage
Max. Cell
Voltage
Coolant
Temp.
[A] [V] [V] [V] [V] [°C]
136 30,6 0,762 0,767 0,772 45
232,5 28,6 0,706 0,716 0,723 53
214,1 28,5 0,704 0,714 0,722 51
Conclusion
This pater deals with design of the electric drive with fuel cell designed for airplane VUT 001 MARABU. Further the installation of the drive into the airplane fuselage is discussed more in detail. Two possible drive installation and drive component placement were proposed to achieve desired balance of the airplane.
Acknowledgements
This work has been prepared under the support provided by research projects FEKT-S-11-14, FR-TI1/061 of Ministry of Industry and Trade of the Czech Republic and Center for Research and Utilization of Renewable Energy no. CZ.1.05/2.1.00/01.0014.
References
[1] Klima B., at al., Battery System of Electric Airplane VUT 051 RAY, Advanced Batteries, Acumulators and Fuel Cells ABAF 12, ISBN 978-80-214-4310-5, Brno, (2011)
358

13th Advanced Batteries, Accumulators and Fuel Cells Photovoltaics
RECYCLING OF PHOTOVOLTAIC CELLS WITH THE POSSIBILITY OF RE-USE SOME COMPONENTS
Šimonová, L., Vaněk, J., Demchikhin, S.
Department of Electrical and Electronic Technology, Faculty of Electrical Engineering and Communication, Brno University of Technology, Technická 10, 616 00 Brno, Czech
Republic
Abstract
Development and installation of photovoltaic (PV) is reaching a large number around the world. Taking into accout that the lifetime of photovoltaic modules sis about 25 years, the question occurs, how we deal with destruction of many such modules in the future. Currently, the old modules are disposed in two basic wals – environmental disposal and recycling. Each options has its pros and cons. We must take into account both the cista of disposal but also on its environmental impact. As for recycling, we can minimize the amount of residual waste from recycled PV modules, we focused on recycling methods with the possibility of using some components that remain after recycling. Recycling must be taken into account all the materials which the PV modules are manufactured, including materials that are used to encapsulate and protect the PV cells. Major recyclable materials for PV modules, which need to be addressed as aluminum, glass, plastic components and to a small extent by heavy metals are. Whether or not worth re-use some components in the manufacture of solar modules, we investigated on the basis of measurements of individual properties and parameters of such a newly manufactured article properties of commercially manufactured articles.
Introduction
Recycling of modules is not focused only on the panels, which is now ending its life cycle. This process may also undergo modules, which are showed e.g. material hidden defects, defects caused by poor manufacturing or transportation (mechanical damage). Through recycling we have to take into account that the type of bar it is. For individual types of modules (e.g. crystalline or thin-film) the different procedures for recycling are selected. The main reason is the thickness of the cell, which in a few years still shrinking.
Recycled materials
The main objective of the recycling of PV modules are reduce the amount of remaining waste and maximize material processed so that they can be further utilized in further production. The main recycled materials are glass, aluminum, plastic, solar cells and heavy metals.
The largest proportion by weight of crystalline modules falls on glass (60 – 70 %) and aluminum frame (around 20 %). For thin-layer modules, the proportion of glass and aluminum is over 95 %. Both of these materials are commonly recycled almost 100 %.
359

13th Advanced Batteries, Accumulators and Fuel Cells Photovoltaics
Other metal materials are prized commodities that are worth acquiring from waste. Plastics can be recycled only partially or not at all. (1)
When recycled materials are re-use it can significantly reduce energy and costs to make new modules. Exception is with plastics, which usually can not be recycled to its original shape. Plastics in the course of their lifetime subject degradation (e.g. UV radiation, etc.) and thereby lose their properties and appearance.
Table I: Solar cells measurements results. (2)
CIS - Module
Producer A Producer B CdTe -
Module Producer C
Amorph. Si - Module
Producer D
Recycling Fractions
% Recycling Fractions
% Recycling Fractions
%
Glass 75.27 84.6 Glass 83.5 Glass 89.78
Aluminium 15.05 10.15 Aluminium 12.29 Aluminium 0.04
Indium 0.02 0.02 Indium 0.13
Copper (Cable)
1.51 0.85 Copper (Cable)
0.2
Gallium 0.01 0.01 Gallium
Recovery Fraction
% Recovery Fraction
% Recovery Fraction
%
Polymers 6.52 5.08 Polymers 3.67 Polymers 9.84
Hazardous % Hazardous % Hazardous %
Cadmium 0.0005 Cadmium 0.1336 - -
Recycling methods
For the recycling of PV modules are used two methods - thermal and chemical processing. The first step is to choose a suitable method of processing for used or damaged modules. Based on the method chosen, the individual parts of the module (EVA, glass, Tedlar, aluminum frame, steel, copper, plastics) separated. After separation of these parts, it is important that the produced PV cells have been thoroughly cleaned and free of anti-reflection coatings, plating and PN junction. Cleaning cells can be done in two ways - by chemical or laser. Clean cell is ready for the next use.
The chemical recycling is used chemical solutions (KOH) to separate encapsulation materials. The main problem with this method is the long time of action, before we reach the desired result. This method is also very cost expensive.
Same results and at the same time lower costs can be achieved using thermal recycling. In this method, the modules are heated. In this process, plastic components are incinerated. The disadvantage of this method is the formation of gas emission during combustion of plastics. This method also has three major advantages - simplicity, high efficiency (up to 85% yield), applicable to different PV modules. While reducing the energy consumption for the production of new panels to ¾ the original cost.
360

13th Advanced Batteries, Accumulators and Fuel Cells Photovoltaics
Fig. 1: Sorting of raw materials (thermal recycling). (4)
Part of each recycling are also needed mechanical work before and after the recycling process (e.g. removing aluminum frame, sorting materials, etc.). After separation of cells from other parts of the panel must be collected cells cleaned. Removing the remaining layers is necessary in order that depends on the manufacturing process - front contacts, bottom contacts, antireflection layer and finally NP junction
For chemical cleaning a solution of KOH is used. After some time of exposure of the solution to the silicon it must be rinsed with water. The silicon wafer is further immersed in the etching solution, and then it is washed again with water.
For chemical cleaning, the following etching solutions can be used: HF/HNO3/H2O, H2SiF6/HNO3 / H2O or H2SiF6/HNO3/C2H4O2. [4]
Laser treatment can be used as neodymium laser pulse (λ = 1064 nm, f 120 Hz, t = 10 ns, E = 300 mJ per pulse), which should help remove the bottom coating and anti-reflective layer.
Fig. 2: Removing layers of ARC solar cells using laser technology. [4]
361

13th Advanced Batteries, Accumulators and Fuel Cells Photovoltaics
Fig. 3: Removing coating of solar cells using laser technology. [4]
If we compare these two methods of cleaning we find that chemical cleaning is more effective. Laser cleaning is very expensive and not very effective. Also the time at which the wafer can be cleaned by laser is much longer.
Conclusion
During the current recycling performed to demonstrate that the old silicon wafer can maintain a good quality and stability. However, with decreasing thickness of silicon wafers it is much harder to regain intact plate. Currently, still prefer the production of new silicon wafers, but in the future are expected to decrease their production. The reason is the high cost of silicon and high consumption of energy in their manufacture. Over the next 15 to 20 years, the number rises rapidly discarded PV modules. It is assumed that the individual components of these modules will be recycled and the existing silicon wafers to be reused in the production of new modules. This reduces the cost of manufacture. It is important that new cells and modules achieve the required efficiency and quality. In order to reuse the silicon wafers, silicon must be sufficiently clean. It is up to the correct execution of each step of recycling.
Reducing the cost of production the PV will be much more competition in the field of renewable energy than it is today. If capacity recycling lines will be some dozen modules one thousand tons per year, then recycling is economically advantageous.
Acknowledgement
The authors gratefully acknowledge the fnancial support by European Commission and Ministry of Education, Youth and Sports of the Czech Republic project no. CZ.1.07/2.3.00/20.0103 and the project FEKT-S-11-7 and Ing. Radim Bařinka from Solartec company.
362

13th Advanced Batteries, Accumulators and Fuel Cells Photovoltaics
References
[1] R. Bechník, Recyklace fotovoltaických panelů na konci životnosti. 26. 9. 2011. Dostupný na: http://oze.tzb-info.cz/fotovoltaika/7868-recyklace-fotovoltaickych-panelu-na-konci-zivotnosti
[2] V. M. Fthenakis; C. Eberspacher; P. D. Moskowitz, Recycling Strategies to Enhance the Viability of CIS Photovoltaics, Progress in Photovoltaics: Research and Applications; 4, 1996. ISBN 447-456
[3] Fotovoltaické panely: Jsou skutečně ekologické? 03. 02. 2010. Dostupný z: http://www.nazeleno.cz/energie/fotovoltaika-1/fotovoltaicke-panely-jsou-skutecne-ekologicke.aspx
[4] S. Demchikhin, Alternativy likvidace fotovoltaických článků jako potenciální ekologické zátěže. Brno: Vysoké učení technické v Brně, Fakulta elektrotechniky a komunikačních technologií, 2012. 49 s.
[5] B. Bechník; R. Bařinka; P. Čech, Analýza životního cyklu FVS.: In: Sborník příspěvků z 3. České fotovoltaické konference. Kongresové centrum BVV. Brno: Czech RE Agency, 5. listopadu 2008. ISBN 978-802-5435-281. Dostupný z: http://www.czrea.org/cs/druhy-oze/fotovoltaika/ziv-cyklus
[6] Vaněček, Česká fotovoltaická konference. Brno: FZÚ AV ČR, 2010. [7] K. Wambach; S. Shlenker; I. Röver; A. Müller, Recycling of Solar Cells and
Photovoltaic Modules. [8] P. Sánchez-Friera; J. E. Galán; D. Guarde; D. Manjón, Application of intelligent
materials to the design of solar modules for their active disassembly and the recycling and reuse of their components: In: 19th European Photovoltaic Solar Energy Conference. Paris, France, 2004.
[9] E. Radziemska; P. Ostrawski, Recycling of silicon in the PV industry. Ecol. Technol., 2009, 17(2), 47-52.
363

13th Advanced Batteries, Accumulators and Fuel Cells Photovoltaics
THE WAYS HOW TO MEASURE THE CHARACTERISTICS OF THE SOLAR CELL
Tošer, P., Bača, P., Neoral, J.
Department of Electrical and Electronic Technology, Faculty of Electrical Engineering and Communication, Brno University of Technology, Technická 10, 616 00 Brno, Czech
Republic Corresponding author: Pavel Tošer ([email protected]) Phone: +420 602 643 637
Abstract
The testing of solar panels and photovoltaic cells as well is a very interesting art of NDT’s (non destructive techniques) allowing the fast and safe inspection. Measuring method uses infrared thermography and this is known more than 10 years and is becoming increasingly important standard. Accurate thermographic images of photovoltaic cells reveal quickly and purposefully for example shunt effects, short circuits, faulty contacts etc.
Introduction
Ineffective solar cells
If a solar cell produces less electricity, it usually produces more heat than the other cells. That means that you can very easily spot such ineffective cells with a thermal camera. The cause for solar cell inefficiency usually lies in the uniformity of the semi-conductor material that is used, for most solar panels this semi-conductor is silicon. The multicrystalline silicon wafers used in most solar cells can be very prone to develop these non-uniformities either during the production process or later on. If a solar cell has a higher concentration of these non-uniformities it produces less electricity and more heat than others, dragging the performance of the entire panel down.
Problems with the solar cells
There are many possible causes for a solar panel’s performing poorly like broken cells, broken glass, water leakage, broken soldering points, defective sub strings, defective bypass diodes, delamination of the semi-conductor material, defective connectors, to name just a few. Whatever the cause may be, thermal imaging cameras help the operator to find out where the cause is located and often it even indicates what the cause might be. In all of the possible scenarios a thermal camera can play an important part in finding out what’s wrong.
Principle how to measure the V-I characteristics
The solar cell can take the place of a battery in a simple electric circuit. In the dark the cell in circuit does nothing. When it is switched on by light it develops a voltage, or e.m.f., analogous to the e.m.f. of the battery in circuit. The voltage developed when the terminals are isolated (infinite load resistance) is called the open circuit voltage Voc. The current
364

13th Advanced Batteries, Accumulators and Fuel Cells Photovoltaics
drawn when the terminals are connected together is the short circuit current Isc. For any intermediate load resistance RL the cell develops a voltage V between 0 and Voc and delivers a current I such that V = IRL and I(V) is determined by the current-voltage characteristic of the cell under that illumination. Thus both I and V are determined by the illumination as well as the load. Since the current is roughly proportional to the illuminated area, the short circuit current density Jsc is the useful quantity for comparison. These quantities are defined for a simple, ideal diode model of a solar cell.
Principle how to measure objects temperature from camera output (calibrated)
For better understanding a real measuring situation is displayed in Fig.1. The final result is a formula for calculation of the object temperature. If we consider radiation power W from blackbody source of temperature Tsource the result is output signal Usource. The Usource means voltage. Than we can write following equation:
[1]
where C is a constant and equation can written in simplified notation,
[2]
But in real situation every object is a graybody or something like this with emittance ε, so then the received radiation will be equal to
[3]
From Fig.1 we can write three radiation power terms. Emission from the object is equal to:
[4]
Where ε is the emittance of the object and τ is the transmittance of the atmosphere. The object temperature is Tobj.
In an ambience there are many sources of reflected emission. These sources can be described by this equation:
[5]
Where (1-ε) is the reflectance of the object. The ambient sources have the temperature Trefl.
Fig. 1: The real thermographic measurement situation.
365

13th Advanced Batteries, Accumulators and Fuel Cells Photovoltaics
The last influence is emission from the atmosphere and can be also described as equation:
[6]
Where (1-τ) is the emittance from the atmosphere at temperature Tatm. Finally the total radiation
power can be now written as:
[7]
By multiplication of each term by constant C from first equation and by replacing the CW products by the corresponding voltage equivalent the result is:
[8]
We are looking for temperature of the object, so then the equation must be solve for Uobj
[9]
Experimental
The thermographic measurement is able to record the temperature changes much faster than the contact measurement. The best performance is obtained with FLIR i7 thermocamera. This type is the highest model of the basic i line. The complete measuring system contains DC power supply, multimeters UT804, solar analyser Prova 210, solar exposure meter and thermocamera as well. The V-I characteristics of the solar panel are measured in traditional way and in parallel the thermograms are measured also. The pictures from thermocamera are evaluated by the professional FLIR Reporter software. The results are shown on Fig.3 where we can find the hot spots (areas with very high temperate about 63°C). If several cells of the solar panel are hotter than others, the warm areas will show up clearly in the thermal image. Depending on the shape and location, these hot spots and areas can indicate several different faults. The temperature rise of a cell or of part of a cell indicates a defective cell or shadowing.
Fig. 2: Scheme for measuring of characteristics of solar panels.
366

13th Advanced Batteries, Accumulators and Fuel Cells Photovoltaics
To measure temperature accurately, it is therefore necessary to compensate for the effects of a number of different radiation sources. This is done on-line automatically by the camera. The following object parameters must, however, be supplied for the camera:
The emissivity of the object
The reflected apparent temperature
The distance between the object and the camera
The relative humidity and temperature of the atmosphere
Results
Several thermal images were made with thermocamera Flir i7. The results are shown on Fig.3 and Fig.4. Hot spots on images have lighter color and these places are in most cases defective. Because the thermal camera has low resolution, the images are modifyied in Matlab m-file script that can allows data filtration (Gaussian filter and another as well) and manipulation with specific image area. The final result is measurement report with all important data.
Fig. 3: Deffective solar cells on new solar panel with modified images in Matlab envinronment – 2D and 3D structure.
367

13th Advanced Batteries, Accumulators and Fuel Cells Photovoltaics
Fig. 4: Example of another defective solar cell on commercial solar panel.
Conclusions
The thermographic inspection of the photovoltaic systems allows the fast localization of potential defects at the cell and module level as well as the detection of possible electrical interconnection problems. The inspections are carried out under normal operating conditions and do not require a system shut down. New laboratory theme was made (details on Fig.2) and three measurements methods are discussed. The properties of a solar cells or panel can be measured with solar analyzer Prova model 210. The V-I characteristics can be measured with an UNIT-804 meters and diametral instrument plus other needed equipment also. The last and probably the most interesting method discussed in this paper is thermography measurement. With a thermocamera Flir i7 type were found the problems with new solar panel. The deffects are shown on Fig.3 and Fig.4, where are evident wrong solar cells. For evaluating and modifying the thermal images was used program created in Matlab environment. This program allows data filtration and making changes in image structure. With this program is very easy to localize the defects and determine the level of damage.
Acknowledgments
This work was supported by the FRVŠ project 2333/2012 and by the specific graduate research of the Brno University of Technology No. FEKT–S–11–7.
References
[1] T. Williams, Thermal Imaging Cameras: Characteristics and Performance, ISBN-13: 978-1420071856, Taylor & Francis 2009, 238 pages.
[2] J.A. Duffie, Solar Engineering of Thermal Processes, ISBN-13: 978-0471698678, Wiley; 3 edition 2006, 928 pages.
[3] W. Minkina, S. Dudzik, Infrared Thermography-Errors and Uncertainties. 2009, Wiley, ISBN: 978-0470747186.
[4] Tošer, P.; Bača, P.; Neoral, J. Bezkontaktní měření solárních panelů s využitím termovize. In 33. Nekonvenční zdroje elektrické energie. Brno: Tribun EU s.r.o., 2012. s. 36-39. ISBN: 978-80-02-02372- 2.
368

13th Advanced Batteries, Accumulators and Fuel Cells Photovoltaics
LONG TIME MONITORING OF HEAT DISTRIBUTION IN PHOTOVOLTAIC MODULE BY THE THERMOVISION
Vanek, J., Strnadel, J.
Department of Electrical and Electronic Technology, Faculty of Electrical Engineering and Communication, Brno University of Technology, Technická 10, 616 00 Brno, Czech
Republic
Abstract
In this work infrared thermography is used for the analyzing of a photovoltaic system. The focus of the measurement was to monitor and compare the heat distribution and the defects distribution in the module via the work in real conditions. The measurement was taken every week at the same time and the conditions of measuring were noted. The output results were recalculated to the relative value to be possible to make correlation of degradation rate and heat distribution. Once per week at the same time, the thermovision pictures were taken of the photovoltaic module connected to the stable load and also the ambient temperature, light intensity and notes of weather conditions were taken. The efficiency of solar module was measured once per month and the correlation of heat distribution was made.
Introduction
The solar photovoltaic system efficiency is highly depending on the temperature distribution on the photovoltaic module. The higher temperature the lower efficiency of photovoltaic conversion because of lowering the module output voltage despite the output current is slightly higher. The second problem of higher local temperature is higher degradation rate. The monitoring of the temperature allows detecting the anomalies before they become failures. Measuring by using IR thermography can be done without disconnection of whole PV panel.
Experimental set-up
The Thermo-camera used was the VarioCam HR INSPECT 580. The not cooled detector with resolution 348x288 was provided high quality IR images. It works between -40⁰C and
1200⁰C with thermal sensitivity 0.08⁰C.
The measurement was taken from the back surface of PV panel every week at 10 am. For acquisition the emissivity was set for 0.85 (value for back surface of PV panel). It is the measure of the radiation sent forth by the object compared to that one would send forth if it were a perfect black body. Normal range of emissivity for objects goes from 0.1 to 0.95. The emissivity of a very shiny (mirror) surface goes down under 0.1, while an oxidized surface or painted has a very great value of emissivity. In our case the value of the back side material emissivity has been set, because it represent the backside surface of the PV panel and the thermocamera operates in the near IR range.
369

13th Advanced Batteries, Accumulators and Fuel Cells Photovoltaics
The IR images were analyzed in the software IRBIS 3. Based on Windows, it integrates function of analysis of the images and creates a technical report.
Fig. 1: VarioCam HR INSPECT 580.
As experimental the panel PV panel Microsol 3311154048 with maximal power 225 Wp was chosen. The panel was exposed to extreme ambient temperature from max. 36.5 ⁰C
to min. -18.1⁰C during the experiment.
The results were evaluated in view of the current weather conditions like intensity of solar radiation and ambient temperature.
Fig. 2: Experimental modules
Measurement of the electrical properties of the experimental panel was taken by the solar module analyzer Prova 200. The main parameters as Uoc - open circuit voltage, Isc - short
370

13th Advanced Batteries, Accumulators and Fuel Cells Photovoltaics
circuit current, Um – voltage in maximum power point, Im current in maximum power point, light intensity, ambient temperature was measured and the EFF – efficiency by the real condition and FF – fill factor ware calculated.
Results
No-defected PV cell (with irrelevant temperature with respect to the surface temperature) has been taken as the reference cell.
Fig. 3: Measured areas on pv panel’s surface
For the evaluation of the measured data, two cells with abnormal overheating with respect to the reference cell were chosen and marked as area 1 and area 2.
Fig. 4: Detail of the selected areas
371

13th Advanced Batteries, Accumulators and Fuel Cells Photovoltaics
Fig. 5: Temperature profile along line L1
Fig.5 shows temperature profile along line L1 (Fig.4). Analyzed area is characterized by a superior temperature about 10⁰C.
As visible on fig. 6 temperature in the selected area is increasing with solar radiation.
Fig. 6: Temperature of area 1
372

13th Advanced Batteries, Accumulators and Fuel Cells Photovoltaics
Fig. 7: Temperature of area 2
During the thermovision measurement the electrical parameters were noted (fig. 8, fig. 9).
Fig. 8: Dependence of temperature and ISH
373

13th Advanced Batteries, Accumulators and Fuel Cells Photovoltaics
Fig. 9: Dependence of temperature and VOC
Evaluation of the defect of the selected PV panel on the power of the panel two measurements of I-V curve have been made. First measurement was taken before the experiment and the second one after the experiment.
Fig. 10a: I-V curve before experiment
Current [A]
Power [W]
374

13th Advanced Batteries, Accumulators and Fuel Cells Photovoltaics
Fig. 10b: I-V curve after experiment
Measurement was made by FLASH tester PASAN 3B on the CTU (Czech Technical University) in Prague.
The measured values were used for the measurement of the mean PV module degradation. The degradation was defined[3]:
(%)
Conclusions
The long time monitoring of the chosen solar module heat and defect distribution was performed. The work has shown that the infrared analysis can be usefully utilized for the efficiency analysis of PV plants. In fact, efficiency depends strongly on the temperature of the PV modules and an overheating causes a decrease of the produced energy. The correlation with the calculated efficiency and also with the defect distribution by the electroluminescence was made and shows the possibility of the thermovision monitoring for foreseeing of the destruction of the photovoltaic module.
Acknowledgments
This research has been supported by research center CVVOZE CZ.1.05/2.1.00/01.0014 and the project FEKT-S-11-7.
375

13th Advanced Batteries, Accumulators and Fuel Cells Photovoltaics
References
[1] Acciani, G., Simione., G., B., Thermographic analysis of Photovoltaic Panels. Granada: International Conference on Renewable energies and Power Quality, 23th to 25th March. 3s, 2010
[2] Moropoulou, A., Palyvos, J., Using IR Thermography for Photovoltaic Array Performance Assessment. Athens National Technical University of Athens, Greece, 4s, 2007
[3] Kaplani E., Detection of degradation effects in field/aged c/Si solar cells through IR thermography and digital image processing. Mechanical Engineering Dept., T.E.I. of Patras, 2012
376

13th Advanced Batteries, Accumulators and Fuel Cells Photovoltaics
V-I CHARACTERISTIC MEASUREMENT OF SOLAR CELL
Vanek, J., Kaderka, T.
Department of Electrical and Electronic Technology, Faculty of Electrical Engineering and Communication, Brno University of Technology, Technická 10, 616 00 Brno,
Czech Republic
Abstract
This paper deals with creating a workplace for automatic measurement of VA characteristics of photovoltaic cells in the LabVIEW. Challenge is to create a functional program, which automatically measures the VA characteristics not only in the lighted cells, but also in the shaded cell (diode mode). The program calculates the power and important parameters, such as short-circuit current, open circuit voltage, maximum power, current and voltage at maximum power article. The program allows you to export the measured values to a text file. In the last chapter of this work is made control measurements of three samples of monocrystal photovoltaic cell by the measuring workplace. The measurement is compared with the reference device Solar Cell Tester
Introduction
The aim of the practical part is to create a software for the automatic measurement of VA characteristics of the photovoltaic cell. The software is designed especially for students, their practical measurements in laboratories. Control software is to be able to measure the VA characteristics according to the specified input parameters. The output is displayed on the front panel, or it may be saved to a file.
Hardware setup
As a Volt-meter and an Amper-meter was chosen the Agilent 34401A digital multimeter (Alternatively, you can use the multimeter Agilent 34410A or Agilent 34411A), which allows you to measure both current and voltage. The instrument is capable of measuring voltage to thousands of volts but the current only up to 3A. Relatively small current range will be sufficient to measure one solar cell but not to measure the entire PV module. All the specifications of the equipment is possible to find in (5). Measurement of current and voltage should be carried out at the same time, but for our purposes it is sufficient to switch between current and voltage measurement. Switching between voltage and current is slowing the whole measurement.
As a power source is used the Agilent N6731B module put in a N6700B Agilent mainframe system. The 0-5V output voltage and output current up to 10A is set up. Other information about instruments can be see in the technical documentation for the apparatus (6). Both devices will communicate with the PC over the USB.
377

13th Advanced Batteries, Accumulators and Fuel Cells Photovoltaics
Software setup
The LabVIEW programming environment was chosen although both measuring instruments are produced by the firm Agilent technologieswhich is connected with programming environment the VEE because the author had already experience with LabVIEW. The LabVIEW uses same as VEE a non-standard way of programming in the language of "G".
Measurement is divided into two main parts: the measurement during the light and dark condition. The measurement shall be carried out in the dark condition in the shaded photovoltaic cell. The solar cell behaves like a standard diode and measurement is identical with the measurement of VA characteristics of the pn junction. VI-characteristics can be see on fig.1.
Fig. 1: The VI-characteristic of photovoltaic solar cell during dark condition
The light measurement is performed at the illuminated photovoltaic cell. In this case the current produced by cell is working against the current of power source. Measurement of VI-characteristics is not so simple. On the Figure 2 is left half characteristics measured at the same polarity as the source set for measuring in the dark condition (source works in same direction as photovoltaic cell). Unfortunately this left part of the characteristic is not sufficient because it is the only small part of the VI-characteristic of explanatory cell. To measure the characteristic the source polarity should be amended so that the source will act against the photovoltaic celle. Both measurements are then combined into one figure.
378

13th Advanced Batteries, Accumulators and Fuel Cells Photovoltaics
Fig. 2: The VI-characteristic of photovoltaic solar cell during light condition
For this reason the switcher of polarity was designed.
Fig. 3: The schema of the involvement of the polarity switch
The change of polarity
379

13th Advanced Batteries, Accumulators and Fuel Cells Photovoltaics
Fig. 3: The realization of the polarity switch
Fig. 4: The experimental set up
380

13th Advanced Batteries, Accumulators and Fuel Cells Photovoltaics
Fig. 5: The sample of software part for the data reading from the power source
Examples of measurement
Table 1: The comparing results of solar cell tester and our VI tester
UOC [V] ISC [A] PM [W] UM [V] IM [A] FF [-] Rs [] Rsh []
SC Tester 0,4976 1,2445 0,2991 0,2908 1,028542 0,4830 0,1698 53,67
VA Tester 0,4964 1,2512 0,2729 0,2881 0,9474 0,4373 0,1943 59,52
381

13th Advanced Batteries, Accumulators and Fuel Cells Photovoltaics
Fig. 6: VI-characteristic taken by reference equipment and our VI-tester
Table 2: The testing of measurement error
Č. měření UOC [V] ISC [A] PM [W] UM [V] IM [A] FF [-] Rs [] Rsh []
1 0,4931 0,4704 0,1409 0,3384 0,4164 0,6075 0,2656 62,11
2 0,4934 0,4705 0,1410 0,3389 0,4160 0,6074 0,2657 62,11
3 0,4927 0,4707 0,1409 0,3384 0,4164 0,6076 0,2655 62,11
382

13th Advanced Batteries, Accumulators and Fuel Cells Photovoltaics
Fig. 7: Development of absolute deviation
Table 3: Comparing the results in different illumination intensity
E [W/m-2] UOC [V] ISC [A] PM [W] UM [V] IM [A] FF [-] Rs [] Rsh []
206 0,4931 0,4704 0,1409 0,3384 0,4164 0,6075 0,2656 62,11
362 0,5202 0,9064 0,2474 0,3189 0,7755 0,5247 0,2088 60,98
Fig. 8: The different illumination intensitz
383

13th Advanced Batteries, Accumulators and Fuel Cells Photovoltaics
Conclusions
The software is designed for the measurement of the VA characteristics of PV cell lit by source of light-powered from AC and DC sources. Therefore, the measurement takes a relatively long period (5 – 100 second depending on the set the number of steps). In the event that the source of illumination is running on battery or DC source, it is possible to shorten the period of averaging the measured values and thus greatly reduce the total time measurement.
Acknowledgements
The authors gratefully acknowledge the financial support by research center CVVOZE CZ.1.05/2.1.00/01.0014 and the project FEKT-S-11-7.
References
[1] KADERKA T. Automatické měřicí pracoviště U-I charakteristik solárních článků. Brno: Vysoké učení technické v Brně, Fakulta elektrotechniky a komunikačních technologií, 2011. 61 s.
[2] Murtinger, Karel, Beranovský, Jiří a Tomeš, Milan. Fotovoltaika. Elektřina ze slunce. Brno: Vydavatelstvi ERA, 2007. ISBN: 97-80-7366-100-7.
[3] Horský, P. Fotoelektrický jev. Katedra obecne fyziky. [Online] Fakulta pedagogicka. [Online: 6. december 2009.] http://www.kof.zcu.cz/st/dp/horsky/html/2fotoel.html.
[4] Boyle, Godfrey. Renewable energy. Oxford : Oxford University Press, 2004. ISBN 0-19-926178-4.
[5] Agilent technologies. Agilent 34410A - User’s Guide. www.agilent.com. [Online] Červenec 2007. [Online: 13th Aril 2010.] http://cp.literature.agilent.com/litweb/pdf/34410-90004.pdf.
[6] Agilent Technologies. Agilent N6700 MPS, Low-Profile Modular Power System. www.agilent.com. [Online] 16. 6 2007. [Online: 13th April 2010.]
384

13th Advanced Batteries, Accumulators and Fuel Cells Photovoltaics
DESIGN AND OPTIMALIZATION OF CONCENTRATOR SOLAR PANELS COOLING SYSTEM USING COMPUTER SIMULATION
Maxa, J., Vyroubal, P., Vaněk, J., Solčanský, M.
Department of Electrical and Electronic Technology, Faculty of Electrical Engineering and Communication, BUT, Technická 10, 616 00 Brno, ČR
Corresponding author: Jiří Maxa ([email protected]) Phone: +420 541 146 129
Abstract
CAx systems provide comprehensive software solutions for the design, development, production and product management (Product Lifecycle Management - PLM) from its inception to the end of its life. Their working environment leverages support systems technical documentation (CAD) systems covering the NC (CAM) and general support systems engineering work (CAE). Design and optimization of cooling equipment for heating concentrator solar cells is realized by these systems, which provides distinct advantages. The equipment is analyzed for fluid flow and heat transfer before manufacturing functional sample.
Introduction
Photovoltaic concentrators are systems using lenses or mirrors for concentration of solar radiation on a photovoltaic cell. The objective is to reduce the size of the cell in order to achieve the desired output. Owing to this we can use more powerful photovoltaic cells which, without the concentrator, would have been too expensive as related to the required output. Concentration of solar radiation, can, however, have certain disadvantages due to a greater heating of the cell. Light radiation is thus converted into electrical energy only partially. The greater part is converted into thermal energy. If this heat is not led away by means of additional cooling components, systems with a high concentration can be totally destroyed.
Concentrator solar systems
In concentrator systems, the same materials are used for manufacturing of cells as in case of conventional photovoltaic panels. They are so called first-generation crystalline quartz cells (conversion efficiency 16-19%, in special structures up to 24%), second-generation GaAs cells (efficiency under 10% generally), thin-layer cells or third-generation cells with multiple PN junctions (under development). Constructions of the systems vary and therefore the requirements are rather different. Low concentrations require standard panels or well positioned cells, which are not suitable for concentration in the order of tens or hundreds of suns. In such cases cells specifically designed for these applications are used. However, requirements for concentrator cells are higher. They require increased
385

13th Advanced Batteries, Accumulators and Fuel Cells Photovoltaics
heat/thermal stress and high flow density in the cell given by exposure several orders higher than in cells without a concentration [1].
Temperature impact on cells
As mentioned above, standard cells designed for applications without a concentration can be used in the given case. Their efficiency is approximately 10% higher at a concentration of 10 suns), but at a higher concentration resistivity loss would considerably increase. Cell efficiency will be increasing up to a certain concentration. When it has been reached, efficiency will decrease. A considerable increase will be observed in the thermal and flow stres of the cell. For this reason, the use of standard cells is limited, and special cells are recommended for higher concentrations, either low concentration cells (2 to 100 suns) and high concentration cells (300 and more suns) [2].
Fig. 1: Concentrator with Fresnel lens.
Temperature has an increased impact on the position of the operating point. At high temperatures, electrical properties of the cell change. Due to this change the terminal voltage decreases, thus causing a decrease in the load output [3], [4] .
Fig. 2: The influence of temperature on the VA characteristic, and the P characteristics.
Solar radiation
Fresnel lens
Solar cell
Heat dissipation
386

13th Advanced Batteries, Accumulators and Fuel Cells Photovoltaics
Analysed model
The analysed cooled model is based on the design of the operating sample implemented and investigated at the Department of Electrical and Electronic. Four variants have been analyzed with different basic shape characteristics for determination of the impact of characteristic design changes:
• Basic vision – simple operating model shape (Fig.5) • Half the flow of cooling medium to the Basic version to determine the effect of
changes in the flow rate of the coolant (Fig.6) • The Leading edge and rounded corners to determine the effect of changes in
aerodynamic shape (Fig.7). • Water supply to the media by 16 holes, rounded corners to determine the effect
of changes in the character of the inflow and outflow of the coolant (Fig.8).
Analysis by finite volumes method
The finite volumes method was used for the solution. In the given case it was a transient problem solving two physical problems: cooling medium flow description and heat conversion. The problem of the cooling medium flow was solved by a system of three partial differential equations describing the flow of a viscous liquid in the Carthesian coordinate system: The continuity equation expressing the mass preservation law:
( ) 3,2,1,0 ==∂∂
+∂∂ isložkau
xt ii
ρρ (1)
Stokes-Navier equation expressing the applied Newton theorem on movement change:
( ) ( ) 3,2,1, =++∂∂
=∂∂
+∂∂
+∂∂ jindexS
xxpuu
xtu
iRijij
jiji
j
i ττρρ (2)
Energy equation expressing the energy conversion law for compressible fluids:
( ) ( )( )2
,2veEQuS
xu
qux
pExu
tE
Hiij
iRiji
Rijijj
ii
i +=+++∂∂
+++∂∂
=+∂∂
+∂∂ ερτττ
ρρ (3)
This system was completed with the state equation:
TRpM
=ρ (4)
In the above equations is the velocity of the fluid, density, temperature, internal energy. external mass forces acting on the mass unit (e.g. gravity, centrifugal), related to volume unit, diffusion heat flow, tensor of viscous stress and are indexes for summation quantities according to three directions of coordinates (Einstein
387

13th Advanced Batteries, Accumulators and Fuel Cells Photovoltaics
summation). It is a three-dimensional flow of compressible, viscous fluid with heat supply [5], [6], [7]. Heat conversion was described by the equation of energy conversion law:
(5)
And
(6)
Where is enthalpy and heat flow is defined:
(7)
Where is the specific internal energy, specific heat, tensor thermal conductivity.
Here constant = 0.9, is Prandtl number. This equation describes the laminar and also the turbulent type of flow. The calculation makes possible conversion from one flow type to another. Anisotropic heat conductivity in solid media was described by equation.
(8)
where e is the specific internal energy, c specific heat, tensor thermal conductivity.
Boundary conditions
Cooling medium inflow: Volume flow: 3 = 0.00005 , Temperature 20.05 .
Cooling medium: Outflow into atmosphere – statistic pressure 101325 .
Onto the upper surface of glass plate: Heat brought to the surface: 15000 W/m2.
Fig. 3: The Boundary conditions.
388

13th Advanced Batteries, Accumulators and Fuel Cells Photovoltaics
Results evaluation Table 1:
Version
The maximum temperature reached
in the Cell. [°C]
The average temperature reached in
the Cell. [°C] 1 Basic version (Fig.5) 28.2 24.6
2 Half the flow of cooling medium (Fig.6) 34.2 28.4
3 The Leading edge (Fig.7) 35.3 25.3
4 Water supply to the media by 16 Holes (Fig. 8) 27.8 23.9
Fig. 4: Graphical Results.
Fig. 5: The basic version.
389

13th Advanced Batteries, Accumulators and Fuel Cells Photovoltaics
The Basic version showed a tendency to swirling due to the cell surface perpendicular to the inlet. From Fig. 5 is apparent the swirling then causes local overheating on the front of the panel.
Fig. 6: Half the flow of cooling medium.
As anticipated, the maximum temperature of the photovoltaic cell is mostly influenced by a reduced cooling medium flow, which is not so big according to the calculated maximum temperature on the panel, but from the graphical representation in Fig. 6 it is apparent that in close vicinity of the cell the medium temperature sharply increases. The medium half-flow can influence increased swirling and poor outflow of the coolant. Further analyses on the final construction shall be focused on an optimal volume flow with the view of preventing local overheating.
Fig. 7: The leading edge.
The leading edge construction (Fig. 7) does not actually remove the problems apparent in the Basic version – the swirling and local overheating, and does not effectively influence the process of cooling. The swirling can be subdued by the manner of the cooling medium inflow and outflow.
390

13th Advanced Batteries, Accumulators and Fuel Cells Photovoltaics
Fig. 8: Water supply to the media by 16 Holes.
Construction with 16 holes (Fig. 8) showed the anticipated balanced flow over the entire cooled profile, but also the necessity to create a variant where swirling having a negative impact on cooling efficiency could be removed.
Fig. 9: The analysis of the flow character in a cooled chamber.
In the system was analysed the character of the flow for each version with the view to direct the cooling medium flow in the final construction to prevent swirling and local overheating of the panel.
CONCLUSION
First analyses of the newly designed cooling system of contractor solar panels have been conducted. The results will constitute a basis for deeper planned analyses in the system ANSYS CFX focused on minimization of the height of the cooling medium column, its volume flow, removal of local overheating due to swirling. The objective will be maximum economic effectiveness of operation.
391

13th Advanced Batteries, Accumulators and Fuel Cells Photovoltaics
ACKNOWLEDGMENT
This work was supported by the grant CVVOZE CZ.1.05/2.1.00/01.0014 and by the specific graduate research of the Brno University of Technology No. FEKT-S-11-7.
REFERENCES
[1] DUFFIE, JOHN A. AND BECKMAN, WILLIAM A. Solar engineering of thermal processes / John A. Duffie, William A. Beckman Wiley, New York, 2006
[2] VESELÝ, A.; VANĚK, J.; STOJAN, R. Concentrator Photovoltaic Systems. ECS Transactions. 2012. 40(1). p. 161 - 165. ISSN 1938-5862.
[3] SOLČANSKÝ, M.; VANĚK, J. Influence of quinhydrone concentration on chemical passivation in solar cell technology. In Elektrotechnika a informatika 2010 - elektrotechnika. Nečtiny: 2010. s. 1-4. ISBN: 978-80-7043-913- 5.
[4] Vaněk, J., Stojan, R. Concentrator Photovoltaic Systems. In Proceeding of the ABAF- 12 Meeting. Brno, CZ: ABAF, 2011. s. 159-164. ISBN: 978-80-214-4357- 0.
[5] http://cleantechnica.com/2011/04/19/solar-junction-breaks-concentrated-solar-world-record-with-43-5-efficiency/
[6] Markvart, T., Castañer, L.: Solar Cells: Materials, Manufacture and Operation, 2005, Elsevier Ltd., Great Britain
[7] Luque, A., Andreev, M.: Concentrator photovoltaics, 2007, Springer-Verlag Berlin Heidelberg, Germany
392

13th Advanced Batteries, Accumulators and Fuel Cells Lead-acid batteries
PERFORMANCE OF THERMAL CELLS, BASED ON Mg-PbSO4 ELECTROCHEMICAL SYSTEM, MADE FROM POWDER
MATERIAL
Styczyński S.1, Missol W.2, Rydzyńska B.1, Szal D.1, Kopczyk M.1
1 Institute of Non-Ferrous Metals Division in Poznan, Central Laboratory of Batteries and Cells, Forteczna 12, 61-362 Poznan, Poland
2 Institute of Non-Ferrous Metals, Sowińskiego 5, 44-100 Gliwice, Poland
Corresponding author: Bożena Rydzyńska ([email protected]) Phone Number: +48 61 2797889 Fax Number: +48 61 2797897
Abstract
One of the types of thermal cells are cells composed of elements in the form of tablets. They are made by a method known as powder technology or pressed technology. This technology is based on the preparation of mixtures of the electrolyte and the cathode in the powder form and then pressing one tablet of specific composition and dimension. Single cell has a cathode, an electrolyte-separator system and anode, which contains a reducing agent in the form of solid metal, bi-metal or metal placed in the matrix. Electrolyte and cathode layers are permanently connected.
The study applied two types of anode (Mg and Mg/ KCl-LiCl 5 wt.%) and the cathode PbSO4 containing percentage additions of graphite and silica. The electrolyte was a mixture of 88 wt.% KCl-LiCl and 12 wt.% of SiO2. A series of cells was performed on the electrical study at temperature ranging from 375 to 550 oC. Electrical tests were carried out by activating cells electric heaters.
Introduction
Characteristic of the thermal battery is that it they can to be used only once and regardless of whether the energy stored therein has been used by a user or not, again they can’t be run. The sense of the existence of the batteries that operate short a time, have a complex structure, specific and unusual application, and hence the requirements to be met should the power source.
Their characteristics is the possibility of a long, maintenance-free storage battery in an inactive state, the possibility of sudden activation, very high resistance to environmental factors, and practically 100% reliability. Therefore highly varying conditions electrical circuits are supplied by a battery, they are designed for specific consumers of electricity. This in turn makes it necessary to use a wide range of active cell materials, construction, isolation and heat-generating [1,2,3].
Magnesium is one of the anode materials used in the thermal battery cells. It is used such pressed powder to the collector of nickel or an alloy thereof, usually having the form of foil, warmed mesh. The electrolyte used in the cells is a mixture of thermal molten salt placed
393

13th Advanced Batteries, Accumulators and Fuel Cells Lead-acid batteries
between the cathode material and anode material. Molten electrolyte is formed when the salts cell heated to a suitable temperature melt. Lead sulfate (II) is used cathode material
in thermal batteries. Its advantage is the high melting point - 1170 C and simple reaction that provides uniform discharge voltage during work of the cell, allowing for accurate determination of donated electrical capacitance. Electrolyte and electrode materials are formed into a tablet. This method minimizes waste production and allows constructing batteries more resistant to exposure to vibration that cause leakage of the electrolyte and cathode material, which can lead to short-circuit cells [1-4].
Experimental
Cells research were designed to test the effect of added electrolyte on the performance of the anode material of the cell. The cathode used the composition of the cathode mass: 45 wt.% PbSO4 (Alfa Aesar), 45 wt.% LiCl-KCleut., 5 wt.% graphite (Alfa Aesar) and 5 wt.% SiO2 (Alfa Aesar). In addition, a test cell containing a cathode weight of the composition: 45 wt.% PbSO4 (Alfa Aesar), 45 wt.% LiCl-KCleut., 2.5 wt.% graphite (Alfa Aesar) and 7.5 wt.% SiO2 (Alfa Aesar) in to verify reproducibility of the effect originating from modification of the anode-cathode system with another. As the anode material used magnesium powder obtained by milling the pulse. The electrolyte was a mixture of 88 wt.% KCl-LiCl and 12 wt.% of SiO2 (Alfa Aesar).
The cathodes and anodes were made by pressing the cathode to the substrate mass in the stamping using a hydraulic press in a glove box with protective atmosphere of argon. Fig.1 presents across section of the test cell. Table 1 shows comparison of cell configuration and the conditions of their study.
Fig.1: Cell research.
Table 1: Comparison of cell configuration and the conditions of their study.
ANODE CATHODE
45% PbSO4
45% LiCl-KCleut.
7.5% SiO2
2.5% graphite
45% PbSO4
45% LiCl-KCleut.
5% SiO2
5% graphite
290 mg 580 mg 290 mg 580 mg
Mg 2.6 Ω
375÷550ºC
2.6 Ω
375÷550ºC
2.6 Ω
375÷550ºC
2.6 Ω
375÷550ºC
Mg
+
LiClKCl
2.6 Ω
375÷550ºC
2.6 Ω
375÷550ºC
2.6 Ω
375÷550ºC
2.6 Ω
375÷550ºC
394

13th Advanced Batteries, Accumulators and Fuel Cells Lead-acid batteries
The obtained electrode a series of cells was performed, and then studied the discharge constant resistance 2.6 Ohms and 50N pressure in the temperature ranging from 375 to
550 C. Electrical tests were carried out by activating cells, electric heaters (Fig.2.).
The measurement was performed using testing equipment cell and a thermal battery ATLAS 1061 MBLT. During the study measured the voltage and current the electric with a frequency of 10 measurements per second, and during the analysis of the results of ten measurements were averaged to give the adjacent frequency of 1 measurement per second.
As a minimum voltage level determined value 1.186V.
Fig. 2: Electric heaters.
Results and discussion
Fig. 3 to 10 presents the results of measurements of individual cells are shown as curves discharge [U = f (Q)]. Descriptions of a particular configuration of cells are located in the signatures for the graphs, each curve reflects a measurement performed at a different temperature (as described in the legend).
Fig. 3: Cells discharge curves of the composition: anode Mg; cathode 45 wt.% PbSO4, 45 wt.% LiCl-KCleut.,7.5 wt.% SiO2, 2.5 wt.% graphite; mass cathode 290 mg.
395

13th Advanced Batteries, Accumulators and Fuel Cells Lead-acid batteries
Fig. 4: Cells discharge curves of the composition: anode Mg; cathode 45 wt.% PbSO4, 45 wt.% LiCl-KCleut.,7.5 wt.% SiO2, 2.5 wt.% graphite; mass cathode 580 mg.
Fig. 5: Cells discharge curves of the composition: anode Mg; cathode 45 wt.% PbSO4, 45 wt.% LiCl-KCleut., 5 wt.% SiO2, 5 wt.% graphite; mass cathode 290 mg.
Fig. 6: Cells discharge curves of the composition: anode Mg; cathode 45 wt.% PbSO4, 45 wt.% LiCl-KCleut., 5 wt.% SiO2, 5 wt.% graphite; mass cathode 580 mg.
396

13th Advanced Batteries, Accumulators and Fuel Cells Lead-acid batteries
Fig. 7: Cells discharge curves of the composition: anode Mg+(LiCl-KCleut.); cathode 45 wt.% PbSO4, 45 wt.% LiCl-KCleut., 7.5 wt.% SiO2, 2.5 wt.% graphite; mass cathode 290 mg.
Fig. 8. Cells discharge curves of the composition: anode Mg+(LiCl-KCleut.); cathode 45 wt.% PbSO4, 45 wt.% LiCl-KCleut., 7.5 wt.% SiO2, 2.5 wt.% graphite; mass cathode 580 mg.
Fig. 9: Cells discharge curves of the composition: anode Mg+(LiCl-KCleut.); cathode 45 wt.% PbSO4, 45 wt.% LiCl-KCleut., 5 wt.% SiO2, 5 wt.% graphite; mass cathode 290 mg.
397

13th Advanced Batteries, Accumulators and Fuel Cells Lead-acid batteries
Fig. 10: Cells discharge curves of the composition: anode Mg+(LiCl-KCleut.); cathode 45 wt.% PbSO4, 45 wt.% LiCl-KCleut., 5 wt.% SiO2, 5 wt.% graphite; mass cathode 580 mg.
Individual graphs presents the dependence obtained electrical capacity and average cell voltage. Capacity value is calculated using integral to the extent to which the cell has a voltage of not less than the accepted minimum value equal to 1.186 V; similarly, the average voltage of a cell is defined as the average value of the part of the discharge curve, in which the voltage is a minimum of 1.186 V.
Analyzing the measurement results summarized in Fig. 11 and 13 shows small increase electrical capacity generated by using anode with the electrolyte; the average voltage was obtained at a similar or slightly higher for cells containing anodes without the addition of electrolyte.
Obtained a substantial increase in capacitance has been increasing double the amount of mass the cathode. This increase is not proportional and was from about 71 to about 95%. The graphite content increasing from 2.5 to 5% causes an increase of capacitance obtained from about 34 to about 53%, without increasing the amount of active substance (PbSO4).
Fig. 11. Comparison of cells voltage in relation to the composition of the anode.
398

13th Advanced Batteries, Accumulators and Fuel Cells Lead-acid batteries
Fig. 12: Comparison of average cells capacity (capacity and average voltage). Individual columns represent the average value obtained by the capacity of the cell configuration across temperature range.
Conclusion
1. Electrodes containing in its composition 7.5 wt. % SiO2 are mechanically unstable. 2. Cells containing a cathode on the composition of 5 wt. % SiO2 and 5 wt. % graphite,
in all studies obtained electric capacity increased about 30% than the cells containing the cathode on the composition of 7.5 wt. % SiO2 and 2.5 wt. % graphite. This follows from the improved conductivity of the electrode.
3. In all cases, the cell containing an anode with 5 wt. % KCl + LiCl have a slightly higher capacity of the anode in the form of metallic magnesium (about 3.25%).
4. Fold increase the amount of weight increases the cathode capacitance obtained an average of 80.7%.
5. The observed differences between the types of test voltage cells are within the measurement error.
Acknowledgements
The authors acknowledge the financial support from the European Fund of Regional Development within the frameworks of the operating program –"Innovative Economy 2007–2013", under Project No. POIG.01.03.01-00-086/09.
References
[1] V. Klasons, C.M. Lamb, Handbook of Batteries, Third Edition, Chapter 21 Thermal Batteries
[2] A. Czerwiński, Współczesne Źródła Energii [3] R.A. Guidotti, P. Masset, J. Power Sources, 1443, 161 (2006) [4] S. Styczyński at al., 3th Advanced Batteries and Accumulators International
Conference, Brno 2002, 23-1
399

13th Advanced Batteries, Accumulators and Fuel Cells Electric vehicles
BATTERY SYSTEM FOR THE AIRPLANE VUT 051 RAY
Cipin1, R., Kadlec1, J., Klima1, B., Hutak1, P.
1 Brno University of Technology, Department of Power Electrical and Electronic Engineering, Technicka 10, Brno, Czech Republic
Corresponding author: Radoslav Cipin ([email protected]) Phone Number +420 54114 2543
Introduction
This paper deals with battery monitoring system for the airplane VUT 051 RAY and description of the whole airplane battery.
Recently, Lithium-ion (Li-ion) accumulators have better capacity/weight ratio of all accumulators types. Due to this fact, they could be successfully used for some mobile applications, because these applications need high accumulated energy with maximally low weight – for example automotive industry or aerospace.
Following chapters present the Li-ion accumulators system (includes a monitoring system) that is designed as an energy source for the airplane VUT 051 RAY. DC-line (the battery), composed of this kind of accumulators, will feed mainly a synchronous motor (about 52 kW). Similar projects of electric airplanes are HK36 Super Dimona, Antares DLR H2 and ENFICA-FC, see lit. (1).
Required airplane drive parameters are divided into two aspects:
The first one is power. There are important requirements on the motor power and total energy of the battery for safety fly:
Motor power 52 kW
Battery output power 60 kW
Stored energy for one flying cycle 34 kWh
The second aspect is total mass of whole electric drive system:
Whole system mass max. 230 kg
Allowed battery mass max. 150 kg
Motor mass 40 kg
From previous aspects, the battery has to have energy density minimally 227 Wh/kg. Other requirement is minimal discharge rate 2C. In next chapters, it is introduced our solution for this problem.
400

13th Advanced Batteries, Accumulators and Fuel Cells Electric vehicles
Airplane electric drive
Electric drive system of airplane VUT 051 RAY consists of three main blocks, see Fig. 1.
Electric drive – consists of permanent magnet synchronous motor and its inverter
Board system – consists of main computer, control inputs and display
Accumulator supply – this part is described in following chapters
Fig. 1: Airplane electric drive scheme.
Battery description
Whole battery consists of 3060 Li-ion cells Panasonic NCR18650A. These accumulators contain a spiral structure with 4 layers. A positive electrode is activated by cobalt acid lithium; a negative electrode is activated by special carbon. A separator is put together in a whirl pattern and stored in the case. It also incorporates the variety of safety protection systems such as a gas discharge valve which helps prevent the accumulator from exploding by releasing internal gas pressure (2).
The next safety system of these accumulators is called Heat Resistant Layer (HRL). This layer is connected between the cathode and the anode of the accumulator. HRL creates a temperature-dependent resistor (posistor). When the accumulator is discharged by high current (e.g. short-circuit), the HRL resistance is so high that the accumulator stops to give current to the circuit and due to this fact the accumulator temperature decreases spontaneously. This action happens when the layers temperature is about 80 °C.
The airplane battery is modular system of Li-ion accumulators and it is consisted of following subgroups:
battery = 6 × battery pack = 30 × battery block = 3060 × accumulator Panasonic
401

13th Advanced Batteries, Accumulators and Fuel Cells Electric vehicles
The battery block is the group of 102 (3 × 34) pieces of the Li-ion accumulators Panasonic NCR18650A, see Fig. 2a). These accumulators are connected in series-parallel by the Fig. 2b). The voltage levels are measured at each parallel combination of the accumulators, i.e. on 34 cells connected in parallel. Each battery block has its own battery block monitoring board that controls important parameters (voltage, temperature and so on).
Fig. 2: Battery pack. a) Illustration photo. b) Connecting scheme of accumulators.
The battery pack (Fig. 3) is the five pieces group of the battery blocks connected in series. These units will be mounted behind a pilot’s cockpit into two panels, see Fig. 4. Six pieces of the battery packs create the battery (complete DC-line of drive).
Fig. 3: Battery pack model.
Fig. 4: The placement of battery packs in the airplane.
a)
b)
10.8V
7.2V
3.6V
34×
0V
Battery block
battery
DC/AC inverter PMS motor
402

13th Advanced Batteries, Accumulators and Fuel Cells Electric vehicles
Important parameters of Li-ion accumulators Panasonic and whole battery are shown in Tab. 1.
Table 1: Important parameters the Li-ion accumulator Panasonic and the battery.
Parameter Panasonic
NCR18650A Battery
Nominal voltage [V] 3.6 324
Maximal voltage [V] 4.2 378
Nominal capacity [Ah] 3 102
Mass [kg] 0.0455 150
Maximal current [A] 6 204
Battery monitoring system
Battery block monitoring computer is included at each battery block; hence the battery contains 30 pieces of these computers. The monitoring system is controlled by the processor Freescale DSP MC56F8036. The Fig. 5 shows the placement of the monitoring PCB and its bottom side.
The primary functions of the monitoring computers:
Temperature measuring of each accumulator by NTC thermistors (tree multiplex structure)
Voltage measuring of each parallel accumulator combinations
Balancing circuits controlling during charging of the battery
Communication with a main computer through CAN bus by the CANaerospace protocol
Monitoring computers has in CAN protocol following emergency messages:
Exceeding of allowed temperature for each accumulator
Non-allowed over-voltage level for each parallel combination of accumulators
Non-allowed under-voltage level for each parallel combination of accumulators
In the case of incorrect processor function, the monitoring PCB is equipped by an analog safety circuit that watches the voltage level of each battery block. In the case of over-voltage or under-voltage level, the analog safety circuit sends an error message directly to the main computer.
An active balancing circuit works during the charging of the accumulators. The capacity difference of individual accumulator series can be caused either by accumulator parameters dispersion during their production or by their aging that it is caused by their working. Each parallel combination of the accumulators is equipped by the active balancing system (see (3)) that reduces the danger of weak accumulator overcharging. This system enables to equally distribute energy between all accumulators connected in series.
403

13th Advanced Batteries, Accumulators and Fuel Cells Electric vehicles
Fig. 5: Battery blocks monitoring PCB. a) Top side – location on Battery block. b) Bottom.
Battery block discharging performance
This chapter describes discharging measurement of battery block by constant current 116 A (3.4 A per one accumulator). This current level is equivalent to current load during horizontal flight of the airplane. External cooling was not used during measurement. Total measuring time was 53 min. After this time, the battery block was completely discharged, i.e. it was taken energy 102 Ah. Ambient temperature before the measurement was 23 °C.
Fig. 6a) shows typical discharging curves measured at each parallel accumulator group of battery block. From the graph, it is apparent that some curve start to decrease critically when voltage is lower than approximately 3 V (accumulator is discharged).
Fig. 6b) shows temperature course during measurement. It is possible to see, that temperature arises about 40 °C without any artificial cooling.
Fig. 7 shows battery block temperature in the end of discharging. The warmest accumulators are at the second row from the top side because warm air moves up. Accumulators at the edge of the battery block are cooled by ambient air. The point of maximal temperature has about 62 °C.
0 10 20 30 40 50 602.6
2.8
3
3.2
3.4
3.6
3.8
4
Napeti [
Volt]
Cas [min]
Fig. 6: a) Discharging curves (constant current 116A). b) Temperature course.
Voltage [V
]
Time [min] Time [min]
Te
mpera
ture
[°C
]
a) b)
a) b)
404

13th Advanced Batteries, Accumulators and Fuel Cells Electric vehicles
Fig. 7: Thermo-figure of battery block after discharging by constant current 116A.
Conclusion
The article presents battery and its monitoring system in the electric aircraft VUT 051 RAY. Battery is constructed according to desired parameters: battery output power 60kW, stored energy for one flying cycle 34 kWh and maximal mass 150 kg. The battery consists of 3060 cells of Li-ion accumulators Panasonic NCR 18650A.
Acknowledgements
This work was solved in the frame of the faculty project FEKT-S-11-14 “Utilization of new technologies in the power electronics”; of the projects CZ.1.07/2.3.00/30.005 and CZ.1.05/2.1.00/01.0014; and of project MPO FR-TI1/061 “Application of VUT 001 Marabu for hydrogen fuel cells propulsion”.
References
[1] Bencalík, K.: Předběžný návrh koncepce vodíkového pohonu letounu VUT 051 RAY, Brno 2011, report number: LU33-2011-RAY.SY
[2] Electronic text available at address: http://industrial.panasonic.com/www-data/pdf/ACA4000/ACA4000PE3.pdf
[3] Active Cell Balancing Methods for Li-Ion Battery Management ICs using the ATA6870, available at: http://www.atmel.com/dyn/resources/prod_documents/doc9184.pdf
405

Title: Advanced Batteries Accumulators and Fuel Cells – 13th ABAF Book of Proceedings
Edited: Jiří Vondrák Vítězslav Novák Marie Sedlaříková Petr Bača
Publishing Office: Jiří Vondrák Vítězslav Novák Marie Sedlaříková Petr Bača
Deadline: October 15th 2012
Publisher: Brno University of Technology Faculty of Electrical Engineering and Communication Department of Electrical and Electronic Technology
Year: 2012
The autors are fully responsible for the content and language of their contribution
ISBN 978-80-214-4610-6