Honda Motorcycle and Scooter India Pvt Ltd, Narsapura - CII ...
52
HMSI 3F CII National Award for Excellence in Energy Management 2020 Presented by 1. A. Joseph Selvaraj - Div. Head - Plant Engineering 2. Ch. Sankar - Sec. Mgr. - Projects 3. Arun V - Dep. Mgr. - Maintenance Honda Motorcycle and Scooter India Pvt Ltd, Narsapura
-
Upload
khangminh22 -
Category
Documents
-
view
0 -
download
0
Transcript of Honda Motorcycle and Scooter India Pvt Ltd, Narsapura - CII ...
HMSI 3F
CII National Award for Excellence in Energy Management 2020
Presented by
1. A. Joseph Selvaraj - Div. Head - Plant Engineering
2. Ch. Sankar - Sec. Mgr. - Projects
3. Arun V - Dep. Mgr. - Maintenance
Honda Motorcycle and Scooter India Pvt Ltd, Narsapura
HMSI 3F
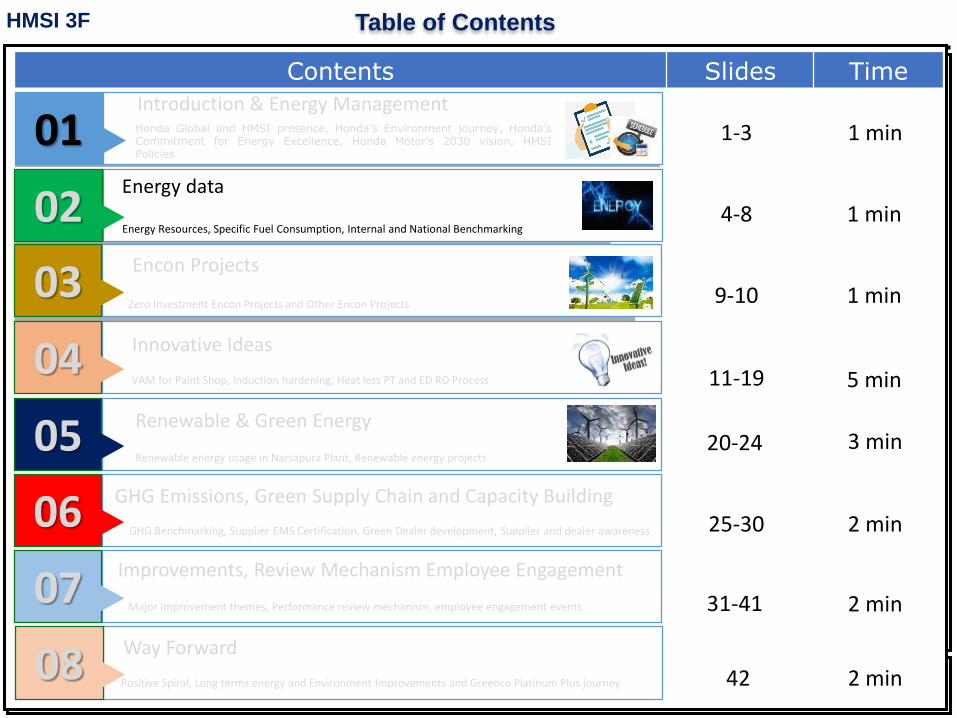
Contents Slides Time
Table of Contents
01
Total
02Energy data
Energy Resources, Specific Fuel Consumption, Internal and National Benchmarking
03Encon Projects
Zero Investment Encon Projects and Other Encon Projects
04Innovative Ideas
VAM for Paint Shop, Induction hardening, Heat less PT and ED RO Process
05Renewable & Green Energy
Renewable energy usage in Narsapura Plant, Renewable energy projects
06GHG Emissions, Green Supply Chain and Capacity Building
07
08Way Forward
Introduction & Energy Management
4-8 1 min
1 min1-3
9-10 1 min
11-19 5 min
20-24 3 min
25-30 2 min
31-41 2 min
42 2 min
GHG Benchmarking, Supplier EMS Certification, Green Dealer development, Supplier and dealer awareness
Major Improvements, Review Mechanism, Employee EngagementMajor Improvement themes, Performance review mechanism, employee engagement events
Positive Spiral, Long terms energy and Environment Improvements and Greenco Platinum Plus journey
Honda Global and HMSI presence, Honda’s Environment journey, Honda’sCommitment for Energy Excellence, Honda Motor’s 2030 vision, HMSIPolicies

HMSI 3F Honda Motorcycle and Scooter India-At a Glance
Honda Narsapura is located in Kolar, Karnataka.
It is Honda’s largest factory globally with a capacity of 2.4 Million vehicles per year
Total 4 Factories in India
Capacity 6.4 mil units/year
Associates 24,000 people
Activa Sales 2.4 mil Units/year
Plant Image
Land Area :4,81,757 m2
Built up Area :2,65,706 m2
Manpower :7041
Capacity :2.4 MillionModels :Activa, SP125, Shine SP, Livo, Dio
OVERALL HMSI
Won Most Innovative Project and Most Useful Project Award at CII Environment Best Practices Award 2018 and 2019
Won Excellent Energy Efficient Unit and Innovative Project at CII National Award for Energy Excellence 2018 and 2019
Mr. Soichiro Honda
(1906 – 1992)
Honda operates in 150 countries
Automobiles Motorcycles Power Products
Robotics Honda jet
Honda Motor Co Was
Founded In 1948 Aero Engine
HONDA MOTOR COMPANY, GLOBAL OPERATIONS
HONDA MOTORCYCLE AND SCOOTER INDIA
01/42

HMSI 3F
Water Energy Waste
Rain water harvesting
& Reuse
REDUCE
Co-processing
Honda’s Commitment for Environment Excellence
The Triple Zero Approach propel our Environment initiatives at every stage of lifecycle so as
to achieve a liveable & sustainable society
02/42

HMSI 3F Energy Policy –Narsapura plant
PDCA & bench marking is an integral part of our energy policy
Key policy highlights
Use of renewable
energy
PDCA Approach Use of monitoring
systems
Use of Energy saving
equipment's
VFD
IE3
IE4
Timers
03/42
HMSI 3F
Contents Slides Time
Table of Contents
01
Total
02Energy data
Energy Resources, Specific Fuel Consumption, Internal and National Benchmarking
03Encon Projects
Zero Investment Encon Projects and Other Encon Projects
04 Innovative Ideas
VAM for Paint Shop, Induction hardening, Heat less PT and ED RO Process
05 Renewable & Green Energy
Renewable energy usage in Narsapura Plant, Renewable energy projects
06GHG Emissions, Green Supply Chain and Capacity Building
07
08Way Forward
Introduction & Energy Management
GHG Benchmarking, Supplier EMS Certification, Green Dealer development, Supplier and dealer awareness
Improvements, Review Mechanism Employee Engagement
Major Improvement themes, Performance review mechanism, employee engagement events
Positive Spiral, Long terms energy and Environment Improvements and Greenco Platinum Plus journey
Honda Global and HMSI presence, Honda’s Environment journey, Honda’sCommitment for Energy Excellence, Honda Motor’s 2030 vision, HMSIPolicies
4-8 1 min
1 min1-3
9-10 1 min
11-19 5 min
20-24 3 min
25-30 2 min
31-41 2 min
42 2 min

HMSI 3F Energy Resources being used in HMSI Narsapura
Electricity and propane gas are the major source of energy for our factory
Electrical ThermalTotal Energy usage pattern Electrical Energy usage pattern Thermal Energy Usage pattern
37%
27%
15%
8%
8%
Utility
Paint
MA
Pr & WE
Others
68%
32%
Electrical Thermal
56%44%
Paint Shop Boiler
04/42

HMSI 3F
29.5926.79 26.09 24.86 24.02 23.13
2014-15 2015-16 2016-17 2017-18 2018-19 2019-20
Power kWh/Veh
Specific energy consumption-Electricity
Specific Electrical consumption is in reducing trend
kW
h/v
eh
VFD for major load
cohesive painting
technology
VFD for major load
Compressor heat recovery
for Vaporizer VAM for Paint
EMS system
AC BMS
05/42

HMSI 3F
1.3 1.23 1.21 1.191.06 1.00
2014-15 2015-16 2016-17 2017-18 2018-19 2019-20
Kg
/Ve
hPropane Kg/Veh
Specific energy consumption-Propane
Specific propane consumption is in reducing trend
Compressor heat recovery for
hot water generation
VAM for Paint Shop Solar Dishes
OF MEE OF ETP
LNG
WHE
Magnetic Resonator
06/42

HMSI 3F
2 1.9 1.8
1
HMSI-Manesar HMSI-Tapukhera HMSI-Vithlapur HMSI-Narsapura
Specific Energy consumption-Internal Bench marking
We are bench mark for all the HMSI factory in India
Kg
/veh
kW
h/v
eh
29
44
36
23
HMSI-Manesar HMSI-Tapukhera HMSI-Vithalapur HMSI-Narsapura
Specific Propane consumption
52%
Less
50%
Less
Specific Power consumption
Mfg process not similar
Mfg process not similar
07/42

HMSI 3F Specific Energy consumption-National Bench marking
We are striving towards being the national bench mark
Specific Power consumption
Kg
/veh
kW
h/v
eh
25.1425.66
23
Comp 1 Comp 2 HMSI
0.76
1
comp 1 HMSI
Specific Propane consumption
No Standard Benchmarks are available for Automobile sector , These are collected from
various presentation.
Our target
Understand the best
practises in other
factories and strive to be
the national bench mark
08/42

HMSI 3F
Contents Slides Time
Table of Contents
01
Total
02Energy data
Energy Resources, Specific Fuel Consumption, Internal and National Benchmarking
03Encon Projects
Zero Investment Encon Projects and Other Encon Projects
04 Innovative Ideas
VAM for Paint Shop, Induction hardening, Heat less PT and ED RO Process
05 Renewable & Green Energy
Renewable energy usage in Narsapura Plant, Renewable energy projects
06GHG Emissions, Green Supply Chain and Capacity Building
07
08Way Forward
Introduction & Energy Management
GHG Benchmarking, Supplier EMS Certification, Green Dealer development, Supplier and dealer awareness
Improvements, Review Mechanism Employee Engagement
Major Improvement themes, Performance review mechanism, employee engagement events
Positive Spiral, Long terms energy and Environment Improvements and Greenco Platinum Plus journey
Honda Global and HMSI presence, Honda’s Environment journey, Honda’sCommitment for Energy Excellence, Honda Motor’s 2030 vision, HMSIPolicies
4-8 1 min
1 min1-3
9-10 1 min
11-19 5 min
20-24 3 min
25-30 2 min
31-41 2 min
42 2 min

HMSI 3F Encon Projects Without Investment
S. No. Parameter Projects implemented Environmental benefits Total Investment
made (Rs. In lakhs)
Monetary
Benefits
(in lakhs)
Intangible benefitsSavings in Quantity
1 RE Third party solar power procurement
Renewable energy,
kWh44000000
0 1078
Through third party solar power
procurement by wheeling, power
requirement is met 24 x 7 irrespective of
seasonal variation as state grid back up
is always available.GHG emission, tons
CO235772
2 EEPropane saving through heat free treatment
technology
Thermal energy,
Mill KCal290
0 144
Reduced water, energy and equipment
efficiency losses in heating process.
Insulation from market fluctuations in
prices of propaneGHG emission, tons
CO2724
3 EEEnergy saving through Cohesive painting
technology
Electrical energy, kWh 1973000
0 123 Reduction in VOC emissionGHG emission, tons
CO21605
4 EE Boiler Pressure reduction from 6 bar to 4 bar
Thermal energy,
Mill KCal645.3
0 24Safety improvement with regard to
handling of highly dangerous steamGHG emission, tons
CO21611
5 EE AHU Frequency Optimization
Electrical Energy, kWh 600000
0 40Reduced wear and tear in motors and
reduced Preventive MaintenanceGHG emission, tons
CO2436
6 EEACED Pumps & Fans Auto Sequence ON/OFF
Operation During empty Mode
Electrical Energy, kWh 3225
0 2.3
Reduced wear and tear in motors and
reduced Preventive MaintenanceGHG emission, tons
CO22.3
7 EE Elimination of Induction Hardening process
Electrical Energy, kWh 2376000
0 159
Reduction in downtime and Repair and
Maintenance leading to production loss.
Safety risk associated with heating
machines has been reduced.GHG emission, tons
CO21725
Total 0 1570
Without Investment Savings – 1570 Lakhs/Annum
09/42

HMSI 3F Encon Projects With Investment
With Investment of 4091 Lakhs/Annum, annual savings of around 1207 Lakhs achieved
S. No. Parameter Projects implemented Environmental benefits Total Investment
made (Rs. In
lakhs)
Monetary
Benefits in
lakhs
Intangible benefitsSavings in Quantity
1 REInstallation of solar roof top panels of
capacity 7MW
Renewable energy, kWh 88000002870 580
Dependency on external agency for power
supply reducedGHG emission 8330
2 REHot water generation through solar
dishes
Renewable energy, kWh 146000250 134
Sope 3 emission reduction on propane
transport. Impact reduction due to market rate
fluctuation and fossil fuel dependanceGHG emission 681
3 RE Waste heat Evaporator in ETP
Thermal energy, Mill KCal 102000
250 100
Waste water treatment is a Legal Compliance
which is a 24 X 7 requirement. Through solar
sludge drying, the risk of dependency on a
single fossil fuel for wastewater treatment is
reduced
GHG emission, tons CO2 607
4 RE Solar solution for sludge dryingThermal energy, Mill KCal 55000
30 55 Improvement in safety wrt handling of propaneGHG emission, tons CO2 317
5 EEInterconnection of compressors through
integration of three compressor houses
Electrical energy, kWh 1100000
12.39 72
Compressed air requirement for the entire
factory has been optimized by reducing the air
pressureGHG emission, tons CO2 924
6 EE VAM for Paint Shop
Electrical energy, kWh 1181250
490 163
VAM can result in reduction of usage of ODS
and GHG Potential Refrigerants currently used
in chillers. Further, handling of steam has been
eliminated thus addressing safety risks
Thermal energy, Mill KCal 2936
GHG Emissions, tons CO2 1591
7 EE Installation of EC FansElectrical energy, kWh 222750
75 15Less Maintenance intensive as the technology is
electrically controlledGHG Emissions, tons CO2 162
8 EE Power Factor Improvement to 0.99Electrical energy, kWh
29.5 12Fixed charges has been reduced in Electricity
billGHG Emissions, tons CO2
9 EERobotic Washing Machine in Machine
Shop
Electrical energy, kWh 111729283.1 75
Quality improvement in machine shop process
and reduction in market complaints of the
productGHG Emissions, tons CO2 811
10 EE Installation of VFD in Paint ShopElectrical energy, kWh 142560
2 1.0Reduced wear and tear of the motors and less
preventive maintenance requiredGHG Emissions, tons CO2 104
Total 4091 1207
10/42

HMSI 3F
Contents Slides Time
Table of Contents
01
Total
02Energy data
Energy Resources, Specific Fuel Consumption, Internal and National Benchmarking
03Encon Projects
Zero Investment Encon Projects and Other Encon Projects
04 Innovative Ideas
VAM for Paint Shop, Induction hardening, Heat less PT and ED RO Process
05 Renewable & Green Energy
Renewable energy usage in Narsapura Plant, Renewable energy projects
06GHG Emissions, Green Supply Chain and Capacity Building
07
08Way Forward
Introduction & Energy Management
GHG Benchmarking, Supplier EMS Certification, Green Dealer development, Supplier and dealer awareness
Improvements, Review Mechanism Employee Engagement
Major Improvement themes, Performance review mechanism, employee engagement events
Positive Spiral, Long terms energy and Environment Improvements and Greenco Platinum Plus journey
Honda Global and HMSI presence, Honda’s Environment journey, Honda’sCommitment for Energy Excellence, Honda Motor’s 2030 vision, HMSIPolicies
4-8 1 min
1 min1-3
9-10 1 min
11-19 5 min
20-24 3 min
25-30 2 min
31-41 2 min
42 2 min

HMSI 3F
Honda Narsapura is having Two Paint Shop consisting of three Electro Deposition lines (2 ACED & 1 CED)
High temperature hot water(80°c) is required for ED process
Chilled water is also required for ED process
Hot water from Boiler Steam + Chilled water from Chiller
Current Situation : ED pre-treatment process
1760
939
Paint 1 Paint 2
Energy required for process ~32.25
mill Kcal/day
Propane consumption/day (in Kg)
Propane
/LNG ED process
(Rinse, Predegreasing,
degreasing, phosphating)
80°c
Hot water
Boiler
Steam @150°c
ED Pretreatment process
Hot water Rinse (80ºC)
Pre degreasing
(70ºC)
Degreasing
(70ºC)
Phosphating & Oil separation
(55ºC)
Purpose:
To have clean oil & grease free surface
Fine & crystalline corrosion inhibiting
base to enhance the performance of
post treatment
The hot water required in the process in
made from steam
Current Hot water generation process
Hot water is generated by boiler steam ( use LNG )
Cold water is generated by chiller ( use Electricity )
3187
Ton/annum
The Chilled water obtained in heat pump can be utilized instead of ED chiller saving power cost
ED+ SPC booth cooling
Chilled water @ 7°cChiller
Electricity
3222
1890
Paint 1 Paint 2
Power consumption/day (in Kwh)
Energy required for process ~5112
Kwh/day 1385
731
Power (MWH) Propane (Tons)
Energy Requirement/Year
11/42
HMSI 3F
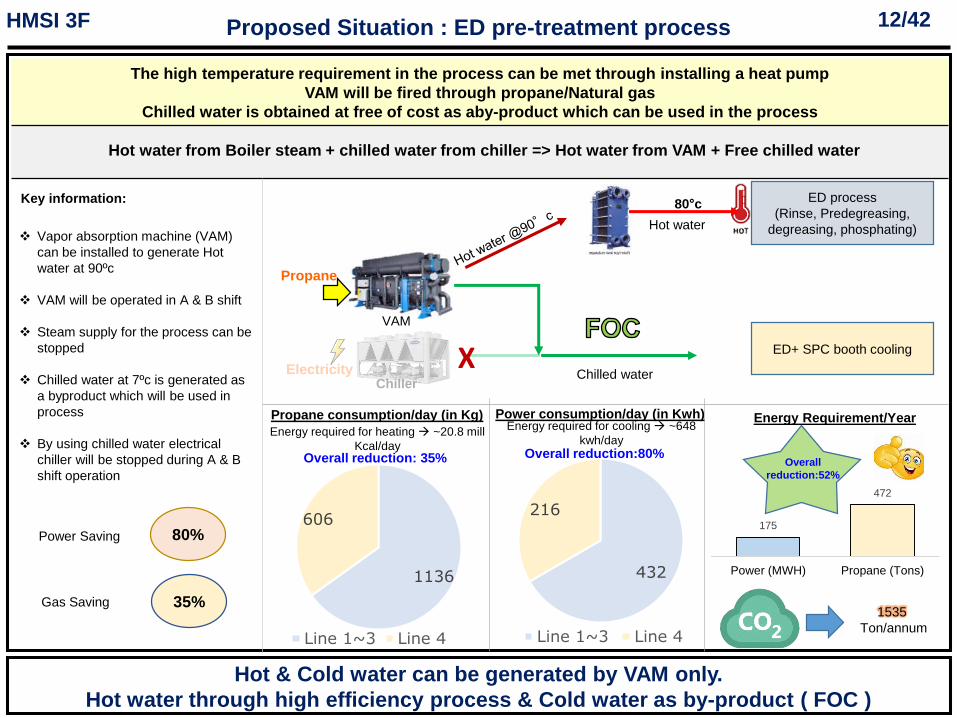
The high temperature requirement in the process can be met through installing a heat pump
VAM will be fired through propane/Natural gas
Chilled water is obtained at free of cost as aby-product which can be used in the process
Proposed Situation : ED pre-treatment process
Propane
ED process
(Rinse, Predegreasing,
degreasing, phosphating)
80°c
Hot water
ED+ SPC booth cooling
Chilled waterChiller
Electricity X
Hot & Cold water can be generated by VAM only.
Hot water through high efficiency process & Cold water as by-product ( FOC )
VAM
1136
606
Line 1~3 Line 4
Energy required for heating ~20.8 mill
Kcal/day
Propane consumption/day (in Kg)
1535
Ton/annum
432
216
Line 1~3 Line 4
Power consumption/day (in Kwh)Energy required for cooling ~648
kwh/day
Overall reduction: 35% Overall reduction:80%
Key information:
80%Power Saving
35%Gas Saving
Vapor absorption machine (VAM)
can be installed to generate Hot
water at 90ºc
VAM will be operated in A & B shift
Steam supply for the process can be
stopped
Chilled water at 7ºc is generated as
a byproduct which will be used in
process
By using chilled water electrical
chiller will be stopped during A & B
shift operation
Hot water from Boiler steam + chilled water from chiller => Hot water from VAM + Free chilled water
175
472
Power (MWH) Propane (Tons)
Energy Requirement/Year
Overall
reduction:52%
12/42

HMSI 3F New Generation VAM
Before Current
New Generation VAM operates without cooling tower
Eliminates the water & power required for cooling tower Improves Process efficiency
Indian Patent: 25/09/2018
US Patent: 23/09/2014
60
0
Before After
Water consumption (in KLD)
Working principle
VAM works on the Vapour absorption refrigeration cycle
Previous generation VAM heater required a cooling tower for part of heat rejection
The current generation VAM heater doesn’t require a cooling tower and rejects the heat into process water heating
Cooling tower is used in the old process
In cooling tower water is evaporated to take the
heat from the machine
Fresh water required on daily basis for cooling
tower top up
The water consumption is ~ 60 KL/Day
3F is not having water source like underground
water, Government water supply etc
Due to unavailability of water this theme was not
feasible in 3F
The latest technology machine operates without
cooling tower
Fresh water is not required on daily basis
Expansion valve
60
36
Before After
Power Consumption (in kWH)
Conventional system New system
13/42

HMSI 3F
Paint ED line needs high temperature (80°c) hot water and cold water for process
High temperature hot water is generated through steam from propane fired boilers
Cold water required in the process in made from electrically operated chillers
Hot water from Boiler steam + Cold water from chiller
Hot water from VAM+ Cold water as a by-product (FOC)
Proposed new generation VAM capable of high efficiency heating & eliminate Chiller
Comparison: Current Vs Proposed
VAM can generate hot water
& cold water as by-product (FOC)
Before
Propane/
Natural Gas
ED process
(Rinse, Predegreasing,
degreasing, phosphating)
80°c
ED
cooling
Cold waterHot water
Boiler Chiller
Electricity Propane/
Natural Gas
FOC
Steam
@150°c
After
Hot water
90°c
ED process
(Rinse, Predegreasing,
degreasing, phosphating)
80°c
ED
cooling
Cold waterHot water
VAM
22°c 22°c
113 Tons of
propane/annum
163
lakhs/annum
490
Lakhs
1580.32
Tons/year
37
Months
14/42

HMSI 3F Elimination of Crankshaft hardening operation
Current induction hardening process was highly energy consuming
In addition to energy water was also getting consumed in cooling towers
Induction hardening is done for crank shaft in machine shop operationProcess requires a cooling tower and power consumption is also very high
Present condition
Process requirements Challenge
Heating Quenching Hardening of a material will
happen after heating the
component to around 900
Degrees and then Quenching
the component suddenly.
28(± 2°C)
NRV
Valve
FilterFilter
3 Way4
0 °C
WaterQuench Tank 35 °C ( ± 2 °C )
35
(±2°C
)
water Water
24(± 2°C)
38(± 2°C)
PHE
28(± 2°C)
35(± 2°C)
Cooling water from Cooling tower
15/42
Water and Cooling Tower elimination
Energy and Electricity saving
Induction Hardening Machine

HMSI 3F
Need for induction hardening In-house Idea generation
Idea validation
Usage of alternate material was judged as successful to achieve the targets
Alternate materials where taken trials and concluded
To increase the wear and fatigue
resistance
Hardness 58-62 HRC case depth of 1.5 –
2mm
Together with core elasticity to absorb
high torque stresses
Elimination of Crankshaft hardening operation
Reduce
Induction
hardening
length
Alternate
process
Alternate
material
Reduce
frequency
from high
to low
Idea Pros Cons Judge
Reduction in length
Reduction in strengthDimensional change will drastically change the engine designEngine development will be very costly
X
Alternate processVery high investmentNot proven processNot used for mass production purpose
X
Reduce frequency from high to low
Reduce power consumptionQuality parameters are not met
X
Alternate materialHardening can be eliminated completelyNo water requiredAll quality parameters are met
O
16/42

HMSI 3F
Proposed material Resources used
Current process Benefits
Project horizontally deployed to all other Honda factories
This is a “Zero investment project”
Elimination of Crankshaft hardening operation
In house
material lab
In house
expertise
Honda R&D
(Japan)
Old material S48C
New material 38Mn VS5-M
C Si Mn P S Cr
0.45 0.15 0.60
0.51 0.35 0.90 0.030 max 0.035 max 0.20 max
C Si Mn P S Cr
0.35 0.5 1.2
0.38 0.7 1.6 0.035 max 0.065 max 0.20 max
100%
reduction
100%
reduction
23,76,000 Kwh of
electricity
159 lakhs/annum
0
Lakhs
1725
Tons/year
water Water
24(± 2°C)
38(± 2°C)
PHE
28(± 2°C)
35(± 2°C)
Cooling water from Cooling tower
17/42
540
KL/year
WATER SAVINGS
By changing the incoming material properties, the below process has been eliminated

HMSI 3F
Present Condition
Proposal Saving Analysis
Propane Saving through Heat Free Pre treatment Technology
Steam usage is completely eliminated by changing the process heating
Steam based Heating Room Temperature Heating
Appln:
Manual
Appln: Robot
+ Manual
Appln: Robot
+ Manual
Primer Base Coat Clear Coat Baking Oven
ASU
Main Frame Parts Plastic Parts
Dry Off OvenPre Treatment Final Part
All the frame & plastic parts
passes through four stages
(Pre-Treatment>Dry off
oven>Paint Booth>Baking
Oven).
Steam is been used for
maintaining temperature in
water baths.
Steam required for the
process is 13.2 Ton/day
Temperature required is
45deg
144 Lakhs/annum243 Tons of
propane/annum 724 Tons /annum ZeroNA
Elimination of Heating process
Propane savings
Reduction in Steam consumption.
Heat Exchanger cleaning Elimination
Pre Treatment
Dry off oven
Dry off oven
Before
After
18/42
HMSI 3F
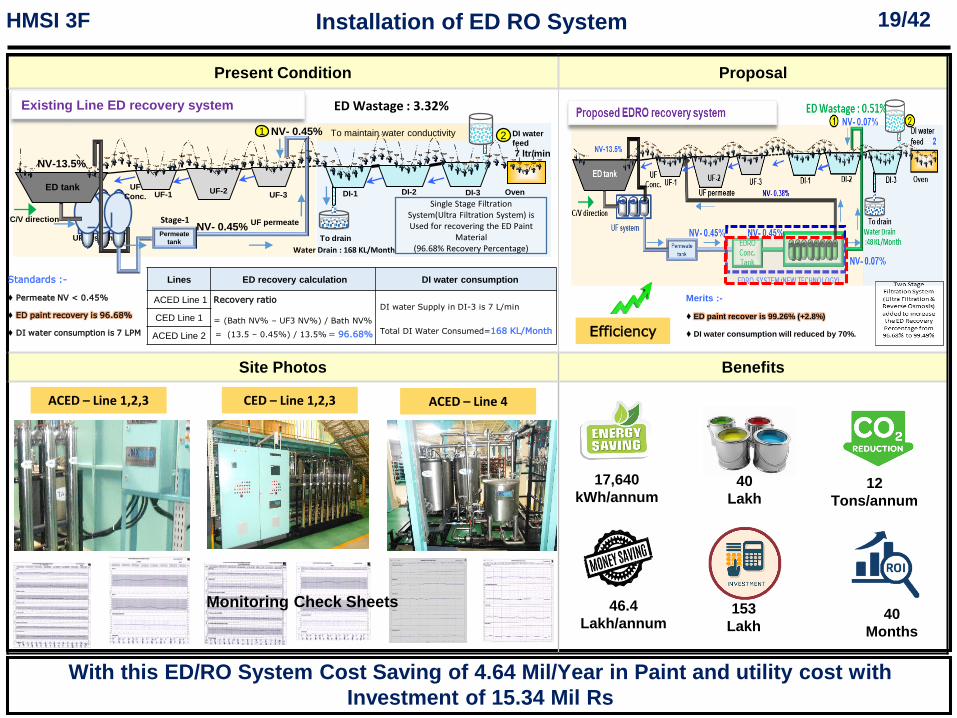
Present Condition Proposal
Site Photos Benefits
Installation of ED RO System
With this ED/RO System Cost Saving of 4.64 Mil/Year in Paint and utility cost with
Investment of 15.34 Mil Rs
Existing Line ED recovery system
To maintain water conductivity1 NV- 0.45%
UF system
UF permeate
DI-1 DI-2 DI-3UF
Conc.
To drain
DI water
feed
7 ltr/min
2
C/V direction
UF-3UF-2UF-1
ED tank
NV-13.5%
Oven
NV- 0.45%Permeate
tank
ED Wastage : 3.32%
Water Drain : 168 KL/Month
Standards :-
♦ Permeate NV < 0.45%
♦ ED paint recovery is 96.68%
♦ DI water consumption is 7 LPM
Lines ED recovery calculation DI water consumption
ACED Line 1
CED Line 1
ACED Line 2
Recovery ratio
= (Bath NV% – UF3 NV%) / Bath NV%
= (13.5 – 0.45%) / 13.5% = 96.68%
DI water Supply in DI-3 is 7 L/min
Total DI Water Consumed=168 KL/Month
Single Stage Filtration System(Ultra Filtration System) is Used for recovering the ED Paint
Material(96.68% Recovery Percentage)
Stage-1
Merits :-
♦ ED paint recover is 99.26% (+2.8%)
♦ DI water consumption will reduced by 70%.
ACED – Line 1,2,3 CED – Line 1,2,3 ACED – Line 4
Monitoring Check Sheets
Efficiency
17,640
kWh/annum
46.4
Lakh/annum
12
Tons/annum
40
Months
153
Lakh
40
Lakh
19/42

HMSI 3F
Contents Slides Time
Table of Contents
01
Total
02Energy data
Energy Resources, Specific Fuel Consumption, Internal and National Benchmarking
03Encon Projects
Zero Investment Encon Projects and Other Encon Projects
04 Innovative Ideas
VAM for Paint Shop, Induction hardening, Heat less PT and ED RO Process
05 Renewable & Green Energy
Renewable energy usage in Narsapura Plant, Renewable energy projects
06GHG Emissions, Green Supply Chain and Capacity Building
07
08Way Forward
Introduction & Energy Management
GHG Benchmarking, Supplier EMS Certification, Green Dealer development, Supplier and dealer awareness
Improvements, Review Mechanism Employee Engagement
Major Improvement themes, Performance review mechanism, employee engagement events
Positive Spiral, Long terms energy and Environment Improvements and Greenco Platinum Plus journey
Honda Global and HMSI presence, Honda’s Environment journey, Honda’sCommitment for Energy Excellence, Honda Motor’s 2030 vision, HMSIPolicies
4-8 1 min
1 min1-3
9-10 1 min
11-19 5 min
20-24 3 min
25-30 2 min
31-41 2 min
42 2 min

HMSI 3F
Dec-18
7MW solar roof top
Jan-19
Solar dishes
Jul-19
Solar effluent evaporators
Oct-17
Third party Solar power
Mar-15
Test track Solar lights
Renewable Energy Usage in Narsapura Plant
2020 target of substituting 70% energy with RE already achieved
Strong road map available to achieve the target
Feb-19
PFET for effluent
treatment
Sep-19
Heat less pretreatment
Oct-20
Additional 2.5 MW Solar Power
Feb-21
2 MW Wind Procurement
Dec-20
Solar/Wind group captive
June-24
Bio mass heater
20/42

HMSI 3F Renewable Energy Usage in Narsapura Plant
This is Zero Investment project
Govt. Network HMSI 3F
Third party solar power purchase to meet Plant Power requirement
The agreement is for a period of 10 years
Plant located ~200 KM away from factory
Plant Capacity is around 40 MW
40 MW Plant
37,000 ton/
annum440 lakh kWh 1078 Lakh
Rs/yearZero -NA-
80%
16%
power
Utilization
4%
Private Generator Public
OM Copy
PPA Signing
Site Photos
21/42

HMSI 3F On-site RE Generation-7MW solar roof top plant
7 MW solar rooftop to meet 12% of total electrical requirement
Key project highlights
8330 ton/annum
88 lakh kWh 580 lakhRs/year
287 lakh Rs 59 Months
7MW Solar Roof Top Installation done on Factory Roof Top.
The installation of On site solar power plant was completed in Dec 2018.
80%
Offsite solar Generator Public
Solar roof top
12%
4%4%
22/42

HMSI 3F
Solar heating system
Hot water
Return waterProcess
application
Hot water tank
Key project highlights
681,000
kg/annum292,000 kg134 Lakh
Rs/year
280 Lakh
Rs/year 25 months
Total 300 numbers of dishes are installed in the factory , which is been distributed in Four Locations .
Thermal energy utilization
Propane cost has been reduced by implementing Solar Dishes in Factory
Hot water generation through Solar energy
Line 4 Canteen Line 4 Open Area Line 4 Subs Fac B
23/42

HMSI 3F
Background & Situation Analysis Proposal
Site Photos Benefits
Conversion of Propane to LNG
Investment 700 Lakhs
Saving 280 Lakhs
ROI 30 months
Continuous cost reduction initiatives taken to reduce utility cost.
Propane Heating LNG Heating
Propane
BoilerPaint Shop
Calorific Value of LNG is
more compared to Propane.
Greener ,cheaper & Safer
fuel compared to propane
158 Tons of
propane/annum
283
lakhs/annum
739
Tons/year
56% Usage of Propane 44% Usage of Propane
L
N
G
Separate Lines are laid in Shop floor for LNG usage (1300 mtrs).
Burner Modification has been done.
2.5 Y
8/12
Pipe line Modification
Installation of Yard & SCADA
700
Lakhs
30
Months
24/42

HMSI 3F
Contents Slides Time
Table of Contents
01
Total
02Energy data
Energy Resources, Specific Fuel Consumption, Internal and National Benchmarking
03Encon Projects
Zero Investment Encon Projects and Other Encon Projects
04 Innovative Ideas
VAM for Paint Shop, Induction hardening, Heat less PT and ED RO Process
05 Renewable & Green Energy
Renewable energy usage in Narsapura Plant, Renewable energy projects
06GHG Emissions, Green Supply Chain and Capacity Building
07
08Way Forward
Introduction & Energy Management
GHG Benchmarking, Supplier EMS Certification, Green Dealer development, Supplier and dealer awareness
Improvements, Review Mechanism Employee Engagement
Major Improvement themes, Performance review mechanism, employee engagement events
Positive Spiral, Long terms energy and Environment Improvements and Greenco Platinum Plus journey
Honda Global and HMSI presence, Honda’s Environment journey, Honda’sCommitment for Energy Excellence, Honda Motor’s 2030 vision, HMSIPolicies
4-8 1 min
1 min1-3
9-10 1 min
11-19 5 min
20-24 3 min
25-30 2 min
31-41 2 min
42 2 min

HMSI 3F
HMSI-Narsapura is the lowest CO2 emission factory in India and Asia region
Benchmarking – CO2
6.1 28.6 35.4 38.3
HMSI
Narsapura
HMSI Vithalpur HMSI Tapukera HMSI Manesar
Among HMSI, Kg/Veh
6.1
22.9 23.35
HMSI Narsapura Competitor - 1 Competitor - 2
Among Indian Companies, Kg/Veh
6.1 6.24
25.4 26.91 28.71 31.7541.5
HMSINarsapura
PhilipinesHPI
PakistanAHL
VietnamHVN
BngladeshBSH
ThailandTH
IndonesiaAHJ
Among Asian Group Companies, Kg/Veh
Uniqueness
One of the first automobile industries in the country which has installed around 300 No's of Solar parabolic dishes.
Complete elimination of MEE and ATFD Operation through sequential alternatives.
Implementation of VAM to generate Hot water with chilled water as free by product
Lowest specific propane consumption among group companies with similar configuration.
One of the lowest specific CO2 emissions among Asian Group companies.
Easy to design and maintain and good reliability since last 3years.
25.83
13.559.37 6.1
2016-17 2017-18 2018-19 2019-20
Specific CO2 Emission reduction Trend YoY
Hydro
Power
25/42

HMSI 3F
Honda has separate Green Purchasing policy which mainly focusses on purchasing Environmentally
friendly materials
Green Purchasing PolicyHMSI – 3F
IE4 Motors
REDUCE
26/42

HMSI 3F CO2 Reduction Activity Status
CO2 Reduction activities are in progress as per ASH / HM Japan Guidelines
27/42

HMSI 3F EMS certification of Suppliers
Yearly targets are set to achieve ISO14001 certification to supplier companies
28/42

HMSI 3F Dealer : Green Consumer Day 28th Sept
Green consumer day is celebrated at dealer end to promote awareness
29/42

HMSI 3F Initiatives @ Dealers
Several initiatives are taken by dealers to reduce energy and environment impact
30/42

HMSI 3F
Contents Slides Time
Table of Contents
01
Total
02Energy data
Energy Resources, Specific Fuel Consumption, Internal and National Benchmarking
03Encon Projects
Zero Investment Encon Projects and Other Encon Projects
04 Innovative Ideas
VAM for Paint Shop, Induction hardening, Heat less PT and ED RO Process
05 Renewable & Green Energy
Renewable energy usage in Narsapura Plant, Renewable energy projects
06GHG Emissions, Green Supply Chain and Capacity Building
07
08Way Forward
Introduction & Energy Management
GHG Benchmarking, Supplier EMS Certification, Green Dealer development, Supplier and dealer awareness
Major Improvements, Review Mechanism, Employee EngagementMajor Improvement themes, Performance review mechanism, employee engagement events
Positive Spiral, Long terms energy and Environment Improvements and Greenco Platinum Plus journey
Honda Global and HMSI presence, Honda’s Environment journey, Honda’sCommitment for Energy Excellence, Honda Motor’s 2030 vision, HMSIPolicies
4-8 1 min
1 min1-3
9-10 1 min
11-19 5 min
20-24 3 min
25-30 2 min
31-41 2 min
42 2 min
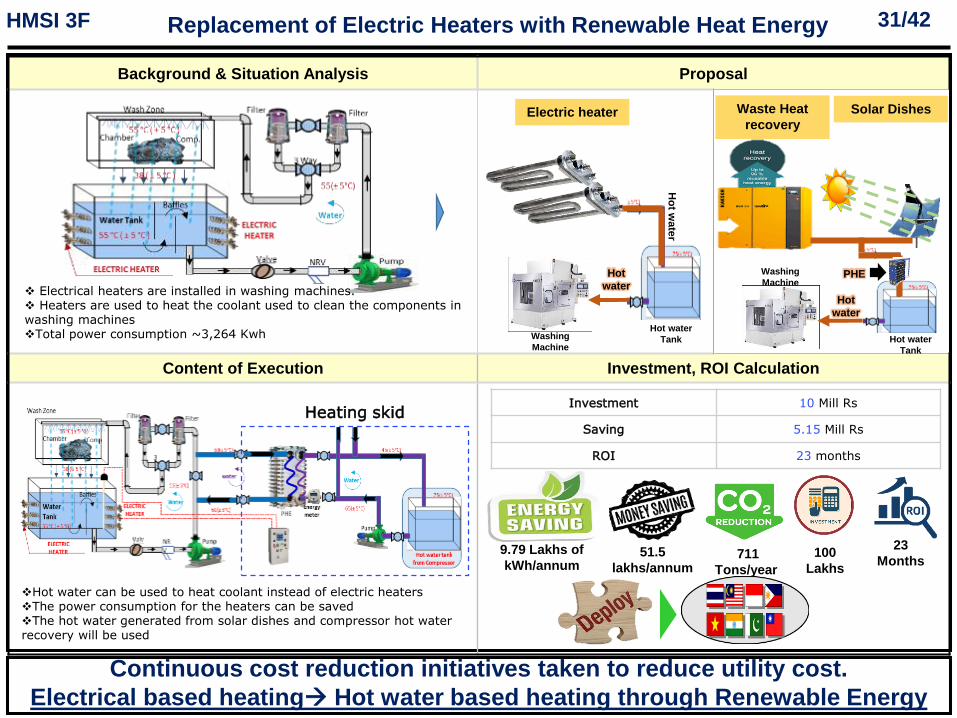
HMSI 3F
Background & Situation Analysis Proposal
Content of Execution Investment, ROI Calculation
Replacement of Electric Heaters with Renewable Heat Energy
Investment 10 Mill Rs
Saving 5.15 Mill Rs
ROI 23 months
Continuous cost reduction initiatives taken to reduce utility cost.
Electrical based heating Hot water based heating through Renewable Energy
Electrical heaters are installed in washing machines. Heaters are used to heat the coolant used to clean the components in washing machinesTotal power consumption ~3,264 Kwh
Hot water can be used to heat coolant instead of electric heatersThe power consumption for the heaters can be savedThe hot water generated from solar dishes and compressor hot water recovery will be used
Heating skid
Waste Heat
recovery
Solar DishesElectric heater
Hot
water
Hot
water
Ho
t wate
r
Hot water
Tank
Hot water
TankWashing
Machine
Washing
MachinePHE
9.79 Lakhs of
kWh/annum51.5
lakhs/annum711
Tons/year
100
Lakhs
23
Months
31/42

HMSI 3F
Background & Situation Analysis Proposal
Saving Analysis Benefits
VFD Installation for VQ Chamber Blowers
Investment 1 Lakh
Saving 6.6 Lakhs
ROI 2 months
VFD Installations are envisaged in all areas where energy conservation is possible
54000
kWh/annum
6.6
lakhs/annum
1 lakh39
Tons/year
2
Months
PLC Program
Main Power
SupplyContractor Control
Circuit-PLC
4 Blower
Motors
There are 4 different capacity motors installed for VQ Blowers.
All the blowers were running at 50 Hz Frequency.
Increase in power consumption as there is no provision to reduce the
frequency.
Main Power
Supply4 No’s VFD 4 Fan
Motors
PLC Program
Contactor
PLC Control
4 No's of VFD installed for individual Blowers.
Frequency has been changed from 50 Hz to 35 Hz. There are 4 different capacity motors installed for VQ Blowers..
Total Savings Motor 1 Motor 2 Motor 3 Motor 4 Total
Energy Cons
kWh/Day 65 64 56 14 200
Energy Cons
Savings kWh /
Year
17777 17344 15219 4032 54373
Cost
Savings/Year180128 205010 167128 112341 664607
32/42

HMSI 3F
Installation of VFD in Oven Circulation Fan
Before After Benefits
Modification of ASU with EC fans
Before After Benefits
VFD Installation & EC fans installation
Fresh Air Fresh Air
EC FansASU
EC fans are installed instead of centrifugal
fans.
Power reduction by 2.2kWh lakhs/year
resulting to savings of 15 lakhs/year
Better control during operation.
Continuous energy efficiency are initiatives taken to reduce Utility cost
Running with centrifugal fan Running with EC Fan
VFD has been installed for Oven Fan
circulation.
Motor Frequency has been reduced from
50 Hz to 30 Hz.
Power reduction by 1.9kWh lakhs/year
resulting to savings of 9.5 lakhs/year
33/42

HMSI 3F Technology improvement through digitization
3F introduced the concept of IOT in 95 Ki through Mt-link. All fanuc machines are connected The way forward is to strengthen Daily work Management through introduction IOT
Activity95KI 96ki 97ki
RemarksH1 H2 H1 H2 H1 H2
Servo Motor Insulation Monitoring
Servo Load Monitoring10.4 Mill.
Daily Tool Change Plan2.4 Mil
Daily Equipment Management
Daily Equipment Management Exp. 2.5 Mil
Daily equipment check – current practice Proposed Method Schedule of execution:
206 Machine
206 Machine
171 Machine
13 Machine
15 Machine
2.7 Mil – Crank L1
Gap in Rule =
site
Writing error
No easy
readable
No continues
monitoringI/O Module
Mtlink Server
Machine
Parameter
INDUSTRIAL
INTERNET
Enhancing daily work management through IoTPredictive Maint.Connected Smart M/Cs
31 abnormality
identified
Daily report
triggered
Sr. Item97 Ki
Q1 Q2 Q3 Q4
1Crank Shaft Line 6 data validation
2 Indent for expansion
3 P.O
4 Implementation
Data shall be
validated and
further expansion to
be executed
Monitoring system implemented in Machine Shop validation Under process
Horizontal deployment for other lines will be done in 97 Ki
34/42

HMSI 3F SMS system for Maintenance Breakdown intimation
Breakdown information through SMS will be sent through SAP to all concerned members
Breakdown is reported by production telephonically or directly to maintenance Area by line executiveThen manually entered in SAP. Delay in Reporting in SAP in all the cases & not even reported sometimes
Manual Reporting Auto Reporting through SMS to reduce MTTR by 10%
Present Method
Benefits
Investment
Rs 0.24 mill.
Proposed Method
Action96Ki 97Ki
3Q 4Q 1Q 2Q 3Q
Concept approval
Approval & Quotation from SIS
Indent & PO
Development
Implementation
Implement sch
Breakdown
RectificationMachine
BD
Make phone
call to shift
Executive
If unable to call, visit
Maint area.
Maint Dashboard
As PC is not available in
every area, Reporting in
SAP is a parallel
process,
which is delayed &
skipped sometimes
Make SAP
Entry
No Delay in Communication to Maintenance & Reporting in SAP
Breakdown
RectificationMachine
BD
Type message, Auto
fetch by SAP server
Maint
Dashboard
SMS received by all
Maint. Team &
Section Head
Manual entry
not required
Immediate communication to all
100% Reporting of Breakdown in SAP as per actual time – Better
analysis due to improved data accuracy
Time spent on SAP reporting can be utilized on GENBA
35/42

HMSI 3F Review Mechanism
Comprehensive review mechanism in place for energy consumption
Plant
headFinance
Energy
Manager
Lead/
Advisor cell
Energy
coordinator
Core cell
member
Facility
member
Monthly
consumption
report
Monthly
variance
analysis
Daily variance
analysis
Daily shop
consumption
Board review
Monthly MRMDaily morning
reviewMonthly MISDaily variance
analysis
Daily shop
mailers
36/42

HMSI 3F Review Mechanism
Honda Motorcycle and Scooter India Private Limited
Budget :-
Plant :-
Cost Center :-
Press 89,809 89,809 86,102 79,052 82,517 71,882 86,223 85,859 89,809 989,498
Weld 402,731 402,731 386,255 356,436 340,592 299,407 387,299 384,167 402,731 4,656,515
Paint 1,748,367 1,748,367 1,680,726 1,599,005 1,562,780 1,440,283 1,698,580 1,645,019 1,748,367 19,463,895
Frame Assembly 106,238 106,238 102,132 97,228 99,129 91,222 103,234 99,928 106,238 1,218,421
Total 2,347,145 2,347,145 2,255,216 2,131,721 2,085,018 1,902,793 2,275,337 2,214,973 2,347,145 26,328,329
AL Machining 442,273 442,273 424,707 398,450 412,556 369,236 427,665 418,791 442,273 5,081,623
FE Machining 442,273 442,273 424,707 398,450 412,556 369,236 427,665 418,791 442,273 5,081,623
LPDC -
HPDC -
Engine Assembly 77,497 77,497 74,305 68,309 71,243 62,184 74,434 74,048 77,497 916,498
Total 962,042 962,042 923,720 865,210 896,355 800,655 929,764 911,630 962,042 11,079,744
Production Support Production Support 1,859,966 1,859,966 1,785,848 1,695,952 1,672,800 1,533,873 1,805,295 1,746,955 1,859,966 21,141,747
Production Control Production Control 83,677 83,677 80,351 75,338 79,536 69,779 80,898 79,256 83,677 920,408
Quality Control Quality Control & DST 264,996 264,996 254,565 239,992 231,984 212,305 256,617 199,900 211,055 2,555,129
Non Mfg Logistics -
Non Mfg Office Area -
-
-
Sub Total 5,517,826 5,517,826 5,299,700 5,008,212 4,965,693 4,519,405 5,347,911 5,152,715 5,463,885 62,025,357
Division Shop Name Jul Aug Sep Oct
Production Body
Production Power Train
Power Genration -KWH Genration - 95 Ki Original Budget
Nov Dec Jan Feb Mar Total
Budget Submission to PPC
Situation Analysis 18-19 Budget Preparation 19-20
Meeting with Opt.Head
Target Setting by Self & PPC
Budget Approval
1 2 3
4 5 6
Target
Legal Requirements
Co
rpo
rate
ad
sit
e le
vel t
arge
ts
Benchmarking
Production Capacity
Bes
t A
vaila
ble
Te
chn
olo
gies
Co
nti
nu
al
Imp
rove
men
t
Target Setting is done and it is been approved by Board of directors
37/42

HMSI 3F Review Mechanism
Cost Down Initiatives are discussed among all four Plants & data is shared till Directors
HO
1F 2F
3F4F
Energy Representative Energy Representative
Energy Representative Energy Representative
Themes Discussion
Applicable Themes Final Submission
Feasibility Study
Summary of Themes
Synergy Meeting
Cost Down
Initiatives
38/42

HMSI 3F
4142
9360
1631918425
2016-17 2017-18 2018-19 2019-20
Purpose of Kaizen Activity Evaluation Method:
Awards Recognition
1st prize winners will participate in
World Kaizen Convention
Kaizen participation Kaizen system started in Narsapura factory
in 2016
Associate involvement-Kaizen
Kaizen is a part of our daily work routine
39/42

HMSI 3F Energy Week Celebration– 17th – 22nd Feb
PURPOSE OF ENERGY WEEK CELEBRATION
1. To create awareness among associatesand suppliers about energy conservation.
2. To create awareness about switching torenewable energy from non renewableenergy.
GLIMPSES OF ENERGY WEEK CELEBRATION
Supplier companies attended training on energy
conservation and renewable energy17
20KANNADA SLOGAN
ENGLISH SLOGAN
FAMILY POSTERS
ASSOCIATE POSTERS
10TEAMS
PARTICIPATED
30
25
15
Total 1350 Participants in Energy Week celebration
HMSI – 3F
Sl. No 17-Feb 18-Feb 19-Feb 20-Feb 21-Feb 22-Feb
1
2
3
4
5
6
7
8
9
10
11
12
Commitment to Energy Conservation by signing on banner
Essay Writing Competition - English
Energy Model
Quiz Competition
Slogan Competition - English
Essay Writing Competition - Kannada
Activity
Poster Competition - Associate
Poster Competition - Family
Slogan Competition - Kannada
Banner display on all gates and factory entrance
ENERGY WEEK ACTIVITY SCHEDULE
Awareness to near by schools
Presentation by an external party (CII)
40/42

HMSI 3F
3F has been awarded by CII for its sustainable environment practicesCII hosts the annual award ceremony to recognize the best Environment practises that companies follow
The award ceremony was held in the 8th Greenco summit held in New Delhi
Greenco Star Performer AwardMost Innovative Environment Best Practices award & Most Useful Presentation
2018-2019 2019-2020 2020-2022
Sustainability Journey-3F
3F will continue its journey toward implementing more Environmentally sustainable
projects which is having very good financial viability also
First factory in Honda India Group to
achieve “Greenco” rating
First Manufacturing facility in Karnataka to
achieve Platinum rating
National best in Waste management and
Innovation
Greenco Star
Performer award
Most Innovative
Environment Best
practises Award
Most Useful
presentation
(selected by Audience)
Greenco Star performer award is given to Greenco
rated companies
Project details97KI 98Ki
Q 1-2 Q3-4 Q 1-2 Q3-4
Zero land fill facility
Additional 2MW roof top PV
Additional Solar dishes installation
ASU hot water conversion project
96ki Water consumption (L/veh)
96ki Co2 emission(L/veh)
>850/1000
score
HMSI – 3F 41/42

HMSI 3F
Contents Slides Time
Table of Contents
01
Total
02Energy data
Energy Resources, Specific Fuel Consumption, Internal and National Benchmarking
03Encon Projects
Zero Investment Encon Projects and Other Encon Projects
04 Innovative Ideas
VAM for Paint Shop, Induction hardening, Heat less PT and ED RO Process
05 Renewable & Green Energy
Renewable energy usage in Narsapura Plant, Renewable energy projects
06GHG Emissions, Green Supply Chain and Capacity Building
07
08Way Forward
Introduction & Energy Management
GHG Benchmarking, Supplier EMS Certification, Green Dealer development, Supplier and dealer awareness
Improvements, Review Mechanism Employee Engagement
Major Improvement themes, Performance review mechanism, employee engagement events
Positive Spiral, Long terms energy and Environment Improvements and Greenco Platinum Plus journey
Honda Global and HMSI presence, Honda’s Environment journey, Honda’sCommitment for Energy Excellence, Honda Motor’s 2030 vision, HMSIPolicies
4-8 1 min
1 min1-3
9-10 1 min
11-19 5 min
20-24 3 min
25-30 2 min
31-41 2 min
42 2 min

HMSI 3F Way forward-Net Zero Energy and Carbon Negative 42/42
Reducing Waste
Reducing toxic chemicals
Supply chain emission reduction
Energy Efficiency
Management Systems & Ratings
Activities to contribute to societyJoint-Community Activities
-Nov’20• Zero Waste to Landfill
-Nov’20• Liner Recycling
-Sept’20• Primerless Painting-Phase 3
• Milk run for south parts supply -Nov’20
-Sep’20• Vapour Absorption Machine
-Oct’20• Propane to LNG
-Dec’20• ISO 50001:2011 certification
-Sep’23• External solar/wind park
-Mar’21• Common STP for neighbouring villages
Zero-Waste
Advanced Treatment technologies
-Feb’21• Phytoremediation
-Jan’21• Decanter
• MBR for STP -Jan’21
Renewable Energy
• Offsite Wind energy -Jun’21
• External Greenbelt expansion
-Mar’22
• Greenco Platinum Plus -Mar’21

HMSI 3F
Let’s make a better tomorrow for our Future Generation………
It is in our hand to protect our beautiful earth
THANK YOU