Holocene environmental changes in northeast Thailand as reconstructed from a tropical wetland
14
Holocene environmental changes in northeast Thailand as reconstructed from a tropical wetland Barbara Wohlfarth a, ⁎, Wichuratree Klubseang b , Suda Inthongkaew b , Sherilyn C. Fritz c , Maarten Blaauw d , Paula J. Reimer d , Akkaneewut Chabangborn a , Ludvig Löwemark a , Sakonvan Chawchai a a Department of Geological Sciences, Stockholm University, Stockholm SE‐10961, Sweden b Department of Geology, Faculty of Science, Chulalongkorn University, Bangkok 10330, Thailand c Department of Earth and Atmospheric Sciences and School of Biological Sciences, University of Nebraska — Lincoln, 214 Bessey Hall, Lincoln 68588-0340, USA d Centre for Climate, The Environment & Chronology (14CHRONO), School of Geography, Archaeology and Palaeoecology, Queen's University Belfast, Belfast BT7 1NN, UK abstract article info Article history: Received 24 May 2011 Accepted 14 May 2012 Available online 26 May 2012 Keywords: Northeast Thailand lake sediments geochemistry Asian monsoon environmental reconstruction moisture availability Geochemical variables (TOC, C/N, TS, δ 13 C) and diatom assemblages were analyzed in a lake sediment sequence from Nong (Lake) Han Kumphawapi in northeast Thailand to reconstruct regional climatic and environmental history during the Holocene. By around c. 10,000–9400 cal yr BP, a large shallow freshwater lake had formed in the Kumphawapi basin. Oxygenated bottom waters and a well-mixed water column were characteristic of this early lake stage, which was probably initiated by higher effective moisture and a stronger summer monsoon. Decreased run-off after c. 6700 cal yr BP favored increased aquatic productivity in the shallow lake. Multiple proxies indicate a marked lowering of the lake level around 5900 cal yr BP, the development of an extensive wetland around 5400 cal yr BP, and the subsequent transition to a peatland. The shift from shallow lake to wetland and later to a peatland is interpreted as a response to lower effective moisture. A hiatus at the transition from wetland to peatland suggests very low accumulation rates, which may result from very dry climatic conditions. A rise in groundwater and lake level around 3200 cal yr BP allowed the re-establishment of a wetland in the Kumphawapi basin. However, the sediments deposited between c. 3200 and 1600 cal yr BP provide evidence for at least two hiatuses at c. 2700–2500 cal yr BP, and at c. 1900–1600 cal yr BP, which would suggest surface dryness and consequently periods of low effec- tive moisture. Around 1600 cal yr BP a new shallow lake became re-established in the basin. Although the un- derlying causes for this new lake phase remain unclear, we hypothesize that higher effective moisture was the main driving force. This shallow lake phase continued up to the present but was interrupted by higher nutrient fluxes to the lake around 1000–600 cal yr BP. Whether this was caused by intensified human impact in the catchment or, whether this signals a lowering of the lake level due to reduced effective moisture, needs to be corroborated by further studies in the region. The multi-proxy study of Kumphawapi's sediment core CP3A clearly shows that Kumphawapi is a sensitive archive for recording past shifts in effective moisture, and as such in the intensity of the Asian summer monsoon. Many more continental paleorecords, however, will be needed to fully understand the spatial and temporal patterns of past changes in Asian monsoon inten- sity and its ecosystem impacts. © 2012 Elsevier B.V. All rights reserved. 1. Introduction Excess precipitation and drought associated with the varying intensities of the Asian monsoon impact a region where more than half of the world's population live. A better knowledge of how tropi- cal ecosystems responded to past shifts in monsoon intensity may help further our understanding of their resilience to changes in effec- tive moisture (precipitation minus evapotranspiration, P-ET) and may provide guidelines for their sustainable management. The Asian monsoon is generally subdivided into the tropical Indi- an Ocean and the tropical/subtropical Southeast Asian monsoon, which are roughly delineated at 105° E (Wang et al., 2005a, 2005b). Paleoclimate archives show that both monsoon systems responded to decreasing insolation patterns during the Holocene (Kutzbach, 1981; Wang et al., 2005a), but whether this response was gradual or abrupt (Morill et al., 2003; Dykoski et al., 2005), synchronous (e.g. Zhou et al., 2005, 2007; Zhang et al., 2011) or asynchronous (An et al., 2000; Herzschuh, 2006; Cai et al., 2010; Wang et al., 2010) over larger regions is still debated. An asynchronous pattern would suggest decoupling of the Indian Ocean and Southeast Asian summer monsoon during much of the Holocene (Herzschuh, 2006; Wang et al., 2010). High-resolution precipitation reconstructions for Global and Planetary Change 92-93 (2012) 148–161 ⁎ Corresponding author. Tel.: + 46 8164883. E-mail address: [email protected] (B. Wohlfarth). 0921-8181/$ – see front matter © 2012 Elsevier B.V. All rights reserved. doi:10.1016/j.gloplacha.2012.05.008 Contents lists available at SciVerse ScienceDirect Global and Planetary Change journal homepage: www.elsevier.com/locate/gloplacha
Transcript of Holocene environmental changes in northeast Thailand as reconstructed from a tropical wetland

Holocene environmental changes in northeast Thailand as reconstructed from atropical wetland
Barbara Wohlfarth a,⁎, Wichuratree Klubseang b, Suda Inthongkaew b, Sherilyn C. Fritz c, Maarten Blaauw d,Paula J. Reimer d, Akkaneewut Chabangborn a, Ludvig Löwemark a, Sakonvan Chawchai a
a Department of Geological Sciences, Stockholm University, Stockholm SE‐10961, Swedenb Department of Geology, Faculty of Science, Chulalongkorn University, Bangkok 10330, Thailandc Department of Earth and Atmospheric Sciences and School of Biological Sciences, University of Nebraska — Lincoln, 214 Bessey Hall, Lincoln 68588-0340, USAd Centre for Climate, The Environment & Chronology (14CHRONO), School of Geography, Archaeology and Palaeoecology, Queen's University Belfast, Belfast BT7 1NN, UK
a b s t r a c ta r t i c l e i n f o
Article history:
Received 24 May 2011Accepted 14 May 2012Available online 26 May 2012
Keywords:
Northeast Thailandlake sedimentsgeochemistryAsian monsoonenvironmental reconstructionmoisture availability
Geochemical variables (TOC, C/N, TS, δ13C) and diatom assemblages were analyzed in a lake sedimentsequence from Nong (Lake) Han Kumphawapi in northeast Thailand to reconstruct regional climatic andenvironmental history during the Holocene. By around c. 10,000–9400 cal yr BP, a large shallow freshwaterlake had formed in the Kumphawapi basin. Oxygenated bottom waters and a well-mixed water columnwere characteristic of this early lake stage, which was probably initiated by higher effective moisture and astronger summer monsoon. Decreased run-off after c. 6700 cal yr BP favored increased aquatic productivityin the shallow lake. Multiple proxies indicate a marked lowering of the lake level around 5900 cal yr BP,the development of an extensive wetland around 5400 cal yr BP, and the subsequent transition to a peatland.The shift from shallow lake to wetland and later to a peatland is interpreted as a response to lower effectivemoisture. A hiatus at the transition from wetland to peatland suggests very low accumulation rates, whichmay result from very dry climatic conditions. A rise in groundwater and lake level around 3200 cal yr BPallowed the re-establishment of a wetland in the Kumphawapi basin. However, the sediments depositedbetween c. 3200 and 1600 cal yr BP provide evidence for at least two hiatuses at c. 2700–2500 cal yr BP,and at c. 1900–1600 cal yr BP, which would suggest surface dryness and consequently periods of low effec-tive moisture. Around 1600 cal yr BP a new shallow lake became re-established in the basin. Although the un-derlying causes for this new lake phase remain unclear, we hypothesize that higher effective moisture wasthe main driving force. This shallow lake phase continued up to the present but was interrupted by highernutrient fluxes to the lake around 1000–600 cal yr BP. Whether this was caused by intensified human impactin the catchment or, whether this signals a lowering of the lake level due to reduced effective moisture, needsto be corroborated by further studies in the region. The multi-proxy study of Kumphawapi's sediment coreCP3A clearly shows that Kumphawapi is a sensitive archive for recording past shifts in effective moisture,and as such in the intensity of the Asian summer monsoon. Many more continental paleorecords, however,will be needed to fully understand the spatial and temporal patterns of past changes in Asian monsoon inten-sity and its ecosystem impacts.
© 2012 Elsevier B.V. All rights reserved.
1. Introduction
Excess precipitation and drought associated with the varyingintensities of the Asian monsoon impact a region where more thanhalf of the world's population live. A better knowledge of how tropi-cal ecosystems responded to past shifts in monsoon intensity mayhelp further our understanding of their resilience to changes in effec-tive moisture (precipitation minus evapotranspiration, P-ET) andmay provide guidelines for their sustainable management.
The Asian monsoon is generally subdivided into the tropical Indi-an Ocean and the tropical/subtropical Southeast Asian monsoon,which are roughly delineated at 105° E (Wang et al., 2005a, 2005b).Paleoclimate archives show that both monsoon systems respondedto decreasing insolation patterns during the Holocene (Kutzbach,1981; Wang et al., 2005a), but whether this response was gradualor abrupt (Morill et al., 2003; Dykoski et al., 2005), synchronous(e.g. Zhou et al., 2005, 2007; Zhang et al., 2011) or asynchronous(An et al., 2000; Herzschuh, 2006; Cai et al., 2010; Wang et al.,2010) over larger regions is still debated. An asynchronous patternwould suggest decoupling of the Indian Ocean and Southeast Asiansummer monsoon during much of the Holocene (Herzschuh, 2006;Wang et al., 2010). High-resolution precipitation reconstructions for
Global and Planetary Change 92-93 (2012) 148–161
⁎ Corresponding author. Tel.: +46 8164883.E-mail address: [email protected] (B. Wohlfarth).
0921-8181/$ – see front matter © 2012 Elsevier B.V. All rights reserved.doi:10.1016/j.gloplacha.2012.05.008
Contents lists available at SciVerse ScienceDirect
Global and Planetary Change
j ourna l homepage: www.e lsev ie r .com/ locate /g lop lacha

the last millennium, however, show that severe drought intervalswere registered more or less simultaneously in paleoarchives acrossthe Asian monsoon region (Cook et al., 2010; Sinha et al., 2011),which suggests a synchronous response. The underlying causes ofsub-millennial scale intensified and weak monsoon phases are stillnot resolved, but climatic links to the North Atlantic region (Sinhaet al., 2007; Berkelhammer et al., 2010) and to the El Niño SouthernOscillation (Buckley et al., 2007) have been suggested, as well as mul-tiple global forcing mechanisms (Cook et al., 2010; Sinha et al., 2011).
Paleoclimatic archives have greatly advanced our understandingof past shifts in Asian summer monsoon intensity. However, the com-parably low number of investigated sites and their often weak chro-nological framework, the application and correlation of differenttypes of proxies for tracing past hydroclimatic variability, and thevarying responses of different ecosystems (and proxies) to shifts inprecipitation suggest that a much denser regional network of well-dated, multi-proxy records is necessary to faithfully trace sub-millennial scale shifts in effective moisture throughout the Asianmonsoon region.
Thailand is one of the regions that is heavily under-sampled withrespect to paleoclimatic and paleoenvironmental records (Penny,1998; White et al., 2004; Buckley et al., 2007; Boyd, 2008; Marwickand Gagan, 2011), despite having several large lake-wetland systemsand extensive cave deposits. Moreover, the country's tropical climateis influenced by both the Indian Ocean and the Southeast Asian mon-soon sub-systems. Summer rainfall intensity shows clear links to theEl Niño Southern Oscillation (Singhrattna et al., 2005), but the IndianOcean and western North Pacific summer monsoon modulate annualrainfall variability over Thailand (Limsakul et al., 2010). Paleoclimaterecords from Thailand have the potential to allow tracing of the influ-ence of the two monsoon sub-systems and to contribute to the open
questions regarding the extent to which they are synchronous andare coupled or decoupled during the Holocene.
One of the few late Pleistocene and Holocene lake sediment recordsthat has been investigated is from Nong (Lake) Han Kumphawapi innortheast Thailand (Kealhofer, 1996; Penny et al., 1996; Penny, 1998;1999). Based on sediment lithology and vegetation reconstructions ofthe longest core KUM.3 (Fig. 1B), Kealhofer and Penny (1998) andPenny (1998) concluded that arid conditions interrupted by intervalswith higher rainfall prevailed between b14,000 and 10,000 cal yearsBP, while the early Holocene (10,000–9000 cal years BP) may haveexperienced higher effective moisture (Kealhofer and Penny, 1998)(Table 1). Marked changes in the local flora between 9000 and5000 cal years BP suggested higher effective moisture, while an increasein charcoal and the reduction of dry‐land taxa after 5000 cal years BP, aswell as the re-appearance of dry-land deciduous forests at around3000 cal years BP were attributed to human activities (Penny, 1998)(Table 1).
Here we combine sediment geochemistry and diatom analysis of anew sediment sequence from Nong Han Kumphawapi, to generate areconstruction of environmental history at higher temporal resolu-tion than prior studies; we also revaluate whether observed changesin the lake environment are linked to shifts in Asian monsoon inten-sity or are an expression of human activities in the lake's catchment.
2. Regional setting
Nong Han Kumphawapi (17° 11′ N, 103° 02′E) is situated at166 m above sea level (asl) on the Khorat Plateau of northeast-Thailand (Fig. 1A, B) and is one of Thailand's few natural freshwaterlakes. The Khorat Plateau reaches elevations of 150–500 masl andcovers an area of about 170,000 km2. It is bordered by 600–1000 m
KUM.2
KUM.6KUM.1
CP3A
CP3B
CP3
CP2 CP1
288000282000 294000 300000
1902000
1896000
288000282000 294000 300000
1902000
1896000
0 2 4 km
KUM.3
Land
>2 m water depth
< 2 m water depth/wetland
Perennial streamsSeasonal streams
KUM.4
CP3B
Coring points (Penny 1998)
Coring points (this work)
v
v
v
N
KUM.9
Hua
i Pha
i Cha
n Yai
Ban Don Kaeo
Lam P
ao
B
Kumphawapi
Khorat Plateau
Bangkok
Andaman Sea
South
Chin
a S
ea
Study area
A
KUM.4
Fig. 1. A. Location of the study area on the Khorat Plateau in northeast Thailand. B. Lake Kumphawapi and location of coring points. The coordinate system is based on the UTM GridSystem (Indian 1975 zone 47). KUM = coring points of Kealhofer (1996) and Penny (1998); CP = coring points of the present survey.
149B. Wohlfarth et al. / Global and Planetary Change 92-93 (2012) 148–161

high escarpments in the west and south, but slopes gently toward theMekong River into Laos. The NW–SE extending Phu Phan mountainrange divides the plateau into two basins: the smaller Sakhon Nakhonbasin in the north and the Khorat basin to the south (El Tabakh et al.,2003). Sedimentary rock sequences on the Khorat Plateau include lateTriassic to Neogene sandstones, conglomerates, mudstones, siltstonesand shale, which accumulated in lacustrine, fluvial and alluvialenvironments (El Tabakh et al., 2003; Wannakomol, 2005). Of specialimportance is the Upper Cretaceous Maha Sarakham Formation, anextensive evaporite succession and the main source of soil andgroundwater salinization and sinkhole formation (El Tabakh et al.,2003; Wongpokhom et al., 2008). Quaternary sediments are mainlyfluvial gravel, sand, silt and clay. Laterites occur frequently, andtheir formation seems to date to about 0.6–0.7 ma based on tektitescontained in the laterites (Tamura, 1992).
The region has a continental and tropical monsoon climate. Thedry, cool continental northeast monsoon operates from Novemberto February, and the wet, warm southwest monsoon supplies precip-itation between May and October. Mean monthly temperatures forthe years 1951–2008 are c. 22–25 °C between November and February,and 27–30 °C between March and October (Klubseang, 2011). Almostno rain falls between November and February, but mean monthly pre-cipitation increases slightly in March and April to ~50–100 mm, andrises to 200–300 mm between May and October (Klubseang, 2011).
Nong Han Kumphawapi is located in the southeast part of the SakonNakhon basin, where it occupies a broad alluvial plain. The lake issurrounded by low-relief hills rising to over 200 m, while higherpeaks to the west and east rise to between 500 and 622 masl. TheMaha Sarakham Formation, which is approximately 130–170 m thick,underlies the Kumphawapi basin and the area immediately to thenorth and south (Fig. 2). It ismadeup of alternating clay-, silt- and sand-stones and evaporites (rock salt inter-bedded with gypsum, potash andanhydrite). The salt facies impact the surface morphology due to disso-lution of underlying salt sequences and diapiric salt domes. The island ofBan Don Kaeo, which rises 10–15 m above the surrounding herbaceousswamp in the southern part of Kumphawapi, constitutes such a saltmound (Figs. 1B, 2). Earlier studies (Rau and Supajanya, 1985) and
more recent seismic investigations (Satarugsa et al., 2004) indicatethe presence of a salt domebelowKumphawapi and rock salt in variablethickness adjacent to the lake. The formation of the lake basin is there-fore likely due to a collapse of sub-surface rock salt cavities.
Kumphawapi today is a shallow circumneutral lake (pH 6.8), witha water depth of b4 m in its deepest part (Fig. 1B), and is c. 7 km longand 4 km wide. Floating plant communities create extensive herba-ceous mats that cover large parts of the lake and form mosaics withsheltered open water areas. The aerial extent of the wetland is esti-mated to around 56 km2, and the open water surface is about20 km2 (Fig. 1B), but this may vary greatly between dry and wet sea-sons. Numerous perennial and seasonal streams feed the lake fromthe surrounding hills. Of these, Huai Phai Chan Yai, which rises onthe southern slopes of the Phu Phan Range, provides the largest fluvi-al input. The Lam Pao River drains the lake to the south (Fig. 1B).Groundwater flow, on the other hand, seems to be toward the north-west. Large irrigation work to expand the lake's water storage capac-ity during the dry season led to the construction of a wide damaround the lake (completed in 1994). Pump stations now pumpwater from the lake into irrigation canals, which irrigate 36 km2 ofagricultural area.
3. Materials and methods
Sediment cores from Nong Han Kumphawapi were obtained inJanuary 2009 from a coring platform using a modified Russian corer(7.5 cm diameter, 1 m length). To achieve a continuous sequence,sediment cores were taken with an overlap of 50 cm at each coringsite. The water depth at coring sites CP1 and CP2 was 1.50 m and1.70 m at sites CP3, CP3A and CP3B. The sediment cores were wrap-ped in plastic and placed in PVC tubes for transport to the Departmentof Geological Sciences at Stockholm University. Laboratory work in-cluded detailed lithostratigraphic descriptions of all sediment se-quences and correlation between overlapping core segments. CP3Awas further analyzed for long-core magnetic susceptibility, geochem-istry, diatoms and 14C dating.
Whole core magnetic susceptibility was measured along the splitcore at 5-mm resolution with a Bartington MS2EI point sensor corelogger (at 0.565 kHz, with a low field intensity of 80 A/m) and isexpressed as volume specific susceptibility (χ) (×10−5 SI).
For loss-on-ignition (LOI) analyses, consecutive 1-cm samples weredried at 105 °C and homogenized. Samples were then combusted for2 h at 550 °C to determine organic matter content, and for 4 h at950 °C to estimate the carbonate content of the sediments. LOI isexpressed as percentage loss of the original dry weight. Selected 1-cmsub-samples were freeze-dried and homogenized prior to analyses oftotal organic carbon (TOC), total nitrogen (TN), total sulfur (TS), andbulk δ13Corg. %TOC and %TN were determined without prior removalof carbonate carbon, since the inorganic carbon content of the sedi-ments was very low, as shown by LOI measurements at 950 °C. %TOC,%TN, %TS and δ13Corgwere measured on a Carlo Erba NC2500 elementalanalyzer, which is coupled to a Finnigan MAT Delta+ mass spectrome-ter. δ13Corg is expressed as δ (‰) relative to the Vienna PeeDeeBelemnite (VPDB) standard, and measurement reproducibility is betterthan 0.15‰. The Corg/Ntot ratio, which is commonly used to discriminatethe origin of lacustrine organic material (aquatic/terrestrial) (Meyersand Lallier-Vergès, 1999; Meyers and Teranes, 2001), was calculatedas Corg (%)/Ntot (%) and multiplied by 1.167 to yield atomic mass ratios.Sulfur in lake sediments comprises inorganic and organic sulfur species,which can become incorporated into iron-sulfide compounds, or intoorganicmatter. Although the incorporation of sulfur into lake sedimentsdepends on a variety of different factors, organic matter concentrationsand availability of soluble iron have been cited as two of the mainfactors (Mitchell et al., 1990). Here we mainly use %TS in conjunctionwith other proxies, to estimate changes in water column oxygenation.
Table 1
Summary of vegetation and climatic reconstructions for Nong Han Kumphawapi basedon pollen and phytolith analyses of core KUM.3 (Kealhofer and Penny, 1998; Penny,1998). The age boundaries are based on the recalibrated 14C dates shown in Table 2.See Fig. 6 for details on the lithostratigraphy of core KUM.3.
Sediment depth(cm)
Vegetation Lake level, climate, humanimpact
0–50 Establishment of re-growth or sec-ondary forest; decline in charcoal
Human activities
ca. 3000 cal yr BP50–120 Further development of local
herbaceous swamp communities,significant reduction of dry‐landtaxa, except for Pinus; increasedburning
Lake level lowering, drier;new and intensifiedhuman activities
ca. 6800 cal yr BP120–220 Expansion of sedges and ferns,
development of a herbaceousswamp
Higher moistureavailability
ca. 9100 cal yr BP220–530 Open dry-land vegetation, incorpo-
rating open woodlands and dry/mixed deciduous forest; charcoalspike between 350 and 250 cm
Increasing humidity;minor human impact onthe landscape
ca. 10,500 cal yr BP530–550 Xeric, species-poor and strongly
seasonal vegetation; Panicoideaeand oryzoid grasses, Cyperaceae
Floodplain or back swamparid, seasonal inundations
>10,500 cal yr BP550–620 Species poor, dominance of
panicoid and bambusoid grassforms
Arid
150 B. Wohlfarth et al. / Global and Planetary Change 92-93 (2012) 148–161

Subsamples for diatom analysis were treated with 10% HCl to re-move any carbonates, heated in H2O2 to oxidize organic matter, andthen rinsed multiple times with distilled water to remove oxidationby-products. Afterwards, an aliquot of each treated sample wasdried onto a coverslip, and the coverslip was mounted onto a glassslide using a permanent mounting medium (Zrax or Naphrax). Atleast 300 diatom valves from each depth interval were identifiedand counted in transects using a 100× oil immersion objective on aZeiss Axioscop 2 plus microscope (University of Nebraska — Lincoln)or Olympus BH 2 microscope (Stockholm University). In each sample,the abundance of each identified diatom taxon is expressed as a per-centage of the total number of valves counted in that sample. Diatomabundance and preservation was variable, and some samples con-tained very low concentrations of diatoms. In these samples, diatomswere enumerated on up to 5 slides in an attempt to achieve a count of300 diatom valves. Samples with total diatom counts of b300 valvesare not included in the diagram.
Sediment samples selected for 14C dating were sieved under run-ning tap water. The sieve remains were stored in deionized andslightly acidified water, examined under a binocular microscope andidentifiable plant remains (seeds, charcoal, leaves, small twigs andwood fragments) were picked out, placed in pre-cleaned glass vialsand dried at 105 °C overnight. Charcoal and wood samples werepretreated following the acid–base–acid method (de Vries andBarendsen, 1952) where HCl is used to remove carbonates and fulvicacids and NaOH to remove humic acids. More fragile plant macrofos-sils were treated with HCl only and are marked in Table 2. The sam-ples were then rinsed in deionized water and dried at 50 °C
overnight, then weighed into pre-combusted quartz tubes with silverand CuO and combusted at 850 °C overnight to produce CO2. Sampleswith less than 0.8 mg of carbon were graphitized in the presence ofhydrogen on an iron catalyst at 560 °C for a maximum of 4 haccording to the Bosch-Manning Hydrogen Reduction Method(Vogel et al., 1984). The CO2 from the larger samples was convertedto graphite on an iron catalyst using the zinc reduction method(Slota et al., 1987). The 14C/12C ratio and 13C/12C were measured ona 0.5MV National Electrostatics Corporation accelerator mass spec-trometer (AMS) at the 14CHRONO Centre, Queen's University Belfast.The radiocarbon age and one standard deviation were calculated fol-lowing the conventions of Stuiver and Polach (1977) using the Libbyhalf-life of 5568 years and a fractionation correction based on δ13Cmeasured on the AMS which accounts for both natural and machinefractionation. The fourteen 14C dates were calibrated with the Calib6.0 online program using the northern hemisphere terrestrial calibra-tion curve (Reimer et al., 2009) (Table 2).
The age–depth curve for CP3A was constructed using theBacon age-modeling software (Blaauw and Christen, 2011), whichexplicitly models past accumulation rates and their variability. Theroutine assumed an average accumulation rate of 25 years/cm, withother rates possible though less likely (using a gamma priordistribution with shape 2). The CP3A sequence was divided into5 cm thick sections, and the accumulation rate of each subsequentcm was allowed to vary to a certain degree (average 50%; a betadistribution with strength 10 and mean 0.5) from its underlying cm,therefore modeling an evolving accumulation rate. In order toaccommodate for outlying dates, we assume that the 14C dates
294000282000
18
96
00
0
270000
294000282000270000
1884000
19
08
00
0
18
96
00
01884000
19
08
00
0
Sao Khua Formation
0 10km 10 km
Phu PhanFormation
Khok KruatFormation
Maha SarakhamFormation
Alluvial
Kumphawapi
Basin
N
River terracedeposits
Ban Don Kaeo
Fig. 2. Geological map of Kumphawapi, redrawn from the Geological Map of Udon Thani Province (2005) (Department of Mineral Resources, Thailand; http://www.dmr.go.th/ewt_news.php?nid=8879). The coordinate system is based on the UTM Grid System (Indian 1975 zone 47). The Upper Jurassic Sao Khua Formation to the west of the KumphawapiBasin includes silt- and sandstones with calcrete and silcrete horizons, and the Lower Cretaceous Phu Phan Formation consists of gravelly sandstone and siltstones. The middle Cre-taceous Khok Kruat Formation with siltstones, calcareous sandstones and conglomerates with calcrete horizons is found to the west and east of the basin. The Upper CretaceousMaha Sarakham Formation, which is approximately 130–170 m thick, underlies the Kumphawapi basin and the area immediately to the north and south. It is made up of alternatingclay-, silt- and sandstones and evaporites (rock salt inter-bedded with gypsum, potash and anhydrite). Dissolution of the rock salt, salt domes and salt anticlines are common fea-tures. River terrace and alluvial deposits are made up of gravel, sand, silt, clay and laterites.
151B. Wohlfarth et al. / Global and Planetary Change 92-93 (2012) 148–161

follow a student t distribution with wider tails than the usualGaussian distribution (Christen and Pérez, 2009).
The sediment sequences that had been described in Penny (1998)were re-drawn to make them comparable to our new sediment suc-cessions, and published 14C dates (Penny, 1998; 1999) were re-calibrated with Calib 6.0 (Reimer et al., 2009) (Table 2).
4. Results and discussion
Coring points CP1, 2, 3, 3A, and 3B and are located in the southeasternand eastern parts of the basin in close proximity to the sedimentsequences described by Penny (1998) (Fig. 1B). CP1, CP2 and CP3 reachedcompact clay between0.8 and1.3 mdepth,while CP3AandCP3B attaineda sediment depth of ca. 4 m without reaching the underlying compactclay. The short sequences of CP1 to CP3 contained peat alternating withdetritus gyttja (CP1), peat overlain by alternating layers of gyttja and de-tritus gyttja (CP2), and gyttja (CP3), respectively. CP3A and CP3B have al-most identical lithostratigraphies; here we focus on the sedimentsequence of CP3A (Fig. 1B; Table 3), which has been analyzed for organicmatter content, geochemical parameters, and diatom assemblages.
4.1. Chronology
The chronology of CP3A is based on fourteen 14C dates obtainedon charcoal, seeds, leaves, wood fragments, small twigs, and other
(undetermined) fragile plant remains (Table 2; Fig. 3A–C). The 14Cdates in the lower and upper parts of the sequence plot sequentiallyaccording to depth, but five 14C dates between 1.18 and 1.60 m donot fit this general pattern (UBA-14170, UBA-12662, UBA-14168,UBA-12661, and UBA-14166), and resulted in older ages thanexpected. Four of these samples consisted of wood fragments(UBA-14170, UBA-12662, UBA-14168, UBA-12661), and one samplewas composed of charcoal and seeds (UBA-14166) (Fig. 3B). Olderages for wood samples may result from reworking, since wood ismore resistant to decomposition than seeds and leaves. Reworkingwould, however, involve transport of the wood fragments, whichseems unlikely for the peat between 1.35 and 1.60 m, but couldhave been the case in the peaty gyttja between 1.18 and 1.35 m(UBA-12662; UBA-14170) (Fig. 3B). Samples UBA-12661 and UBA-14166 are from approximately the same depth interval in the peatas sample UBA-16761 (charcoal, seeds, leaves), but are offset fromthe latter by more than 1000 years (Table 2). Possible explanationsfor the large age difference between these close-by dates are thepresence of a hiatus, or a very low sedimentation rate. The gradualtransition between layers 14 and 13 (Table 3) and the geochemicalproxies (Fig. 4) do not provide support for a hiatus at 1.60 m. Howev-er sieve remains between 1.60 and 1.00 m depth contained varyingamounts of soil mineral particles, including a peak at 1.57 m(Fig. 4). These particles could indicate periodic desiccation, and assuch a break in peat growth and a hiatus. Samples UBA-16763,
Table 214C dates for Lake Kumphawapi. Core depth (in cm) is given below the sediment–water interface. Calibration of 14C dates is according to Reimer et al. (2009) and was made with theCalib 6.0 online program (http://calib.qub.ac.uk/calib/calib.html). See Fig. 1B for the location of the coring points. Sedimentary units 1–3 relate to those shown in Figs. 3 and 4. Plantremains = remains that could neither be identified as seeds, leaves or wood.
Lab ID Core depth(cm)
14C date BP±1 sigma Measured material Calibrated age (2 sigma)range (cal yr BP)
Sedimentary units Published in
KUM.1
NZA-5765 40–41 2010±110 Pollen 1712–2184 2 Penny (1998, 1999)WK-2366 77–79 4950±80 Sediment 5583–5901 2 Penny (1998, 1999)NZA-5766 80–81 5650±110 Pollen 6272–6677 1 Penny (1998, 1999)NZA-5768 100–101 6010±100 Pollen 6651–7160 1 Penny (1998, 1999)OZB070 140–141 5320±60 Pollen 5985–6218 1 Penny (1998, 1999)
KUM.2
OZB071 60–61 1420±90 Pollen 1171–1530 3 Penny (1998, 1999)OZB072 170–171 6280±80 Pollen 6994–7335 2 Penny (1998, 1999)OZB073 235–236 6580±40 Pollen 7427–7520 1 Penny (1998, 1999)OZB074 305.5–307 8150±50 Pollen 9004–9257 1 Penny (1998, 1999)OZB075 379–380 3150±90 Pollen 3141–3579 1 Penny (1998, 1999)
KUM.3
OZC319 45–46 2690±70 Pollen 2710–2964 3 Penny (1998, 1999)BETA93027 80–85 5540±70 Sediment 6208–6470 2 Penny (1998, 1999)BETA93028 136–141 6080±60 Sediment 6793–7157 2 Penny (1998, 1999)BETA93029 152–157 6270±100 Sediment 6949–7418 1 Penny (1998, 1999)BETA93030 255–230 8610±100 Sediment 9428–9913 1 Penny (1998, 1999)BETA93031 355–340 8570±100 Sediment 9402–9889 1 Penny (1998, 1999)BETA72096 540–545 9170±130 Sediment 10,120–10,701 1 Penny (1998, 1999)BETA72097 580–581 12,270±70 Pollen 13,897–14,612 1 Penny (1998, 1999)
CP3A
UBA-16764a 69–66 757±22 Charcoal, plant remains 669–725 3 This workUBA-12663 95–100 1639±29 Charcoal 1417–1611 3 This workUBA-16763a 118–121 1829±24 Charcoal 1706–1825UBA-14170 118–121 5228±28 Wood 5917–6173 2 This workUBA-14169 121–124 2385±24 Charcoal 2344–2473 2 This workUBA-12662 125–130 4282±30 Wood 4823–4958 2 This workUBA-16762a 133–130 2932±24 Charcoal, plant remains 2997–3167 2 This workUBA-14168 140–145 5526±28 Wood 6284–6397 2 This workUBA-14166a 150–155 4689±30 Charcoal, seeds 5320–5576 2 This workUBA-16761a 155–158 3587±31 Charcoal, seeds, leaves 3830–3980 2 This workUBA-12661 155–160 4432±30 Wood 4879–5276 2 This workUBA-12660 265–270 6936±34 Charcoal 7683–7841 1 This workUBA-16759a 325–320 7851±46 Plant remains 8541–8781 1 This workUBA-16758a 375–380 8338±33 Seeds, plant remains, small twig 9280–9462 1 This work
a Acid only pretreatment.
152 B. Wohlfarth et al. / Global and Planetary Change 92-93 (2012) 148–161

UBA-14169 and UBA-14170 are also from approximately the samedepth, but vary in age by 400–3000 years (Table 2, Fig. 3B). Theboundary between layers 11 and 10 is sharp (Table 3), whichwould suggest a hiatus at 1.18 m; moreover, the second peak in soilmineral particles between 1.20 and 1.30 m depth, just below thistransition, points to desiccation, and the high number of charcoalparticles at 1.18–1.25 m could indicate surface burning (Fig. 4).Taken together, these observations would support a break in deposi-tion in layers 11–12, and at the transition between layers 11 and 10.
Different age models were run to test how the outlying dates wouldinfluence the modeled age–depth curve and whether the break insedimentation, as suggested around 1.60 m and 1.30–1.20 m, could bereproduced. Exclusion of the outliers (UBA-14170, UBA-12662, UBA-14168) provided a fairly smooth age–depth curve through most of theaccepted data points, with higher sedimentation rates below 1.60 mand above 1.20 m, and low sedimentation rates around 1.60–1.50 mand 1.30–1.18 m depth (Fig. 3C), but failed to produce clear breaks insedimentation. Modeled minimum and maximum errors between 2.65and 1.60 m are 180 and 1200 years, respectively (mean 660 years),260 and 1400 years (mean 390 years) between 1.60 and 1.20 m, and240 to 760 years (mean 210 years) for the upper 1.20 m. In the follow-ing we use the modeled mean age points for assigning age estimates
to the different layer and unit boundaries (Table 3), but also assumebreaks in peat growth and sedimentation, respectively between 1.60and 1.18 m depth.
4.2. Lithostratigraphy and geochemistry
The gyttja clays of unit 1 (c. 9400–c. 6700 cal yr BP) have bulkmineral magnetic susceptibility (MS) values of around 5×10⁻⁵ SI,suggesting some contribution of magnetic minerals. LOI (at 550 °C)is b6% and TOC around 2–3%, which indicates that the organic mattercontent of the sediments is low. Carbonates are present in the sedi-ments at between 1 and 5% (Fig. 4). The C/N ratio of 15–20 indicatesa mix of terrestrial and lacustrine organic matter sources (Meyers andTeranes, 2001), which is also suggested by δ13Corg values of −21 to−24‰ (Figs. 4, 5A). Sediment composition and geochemical parame-ters thus provide the picture of a low productivity lake, which re-ceived most of its input through catchment run-off. The comparablylow organic matter content of the sediments is, however, somewhatunexpected. The catchment supported open woodlands and dry/mixed deciduous forests (Kealhofer and Penny, 1998; Penny, 1998)(Table 1), whose plant remains should have been transported intothe lake by seasonal streams. The low organic matter content of thesediments could therefore be a product of extensive decompositionand oxidation of the organic material. Low %TS and slightly highervalues of δ13Corg (Fig. 5A, B) favor the assumption of an oxic environ-ment and higher rates of decomposition.
MS values decline in the clay gyttja (layers 19–18) of unit 2a(c. 6700–5900 cal yr BP), coincident with a gradual increase inorganic carbon content (Fig. 4). C/N ratios of 14–18 and δ13Corg
values of around −21 to −22‰ are similar to unit 1, indicatinga mix of terrestrial and aquatic organic matter. The increase in%TS in the upper part of unit 2a precedes the rise in %TOC andsuggests reducing bottom water conditions. The sediments inunit 2a can therefore be interpreted as reflecting less catchmentrun off and increased lacustrine productivity, and/or enhancedpreservation of the organic material under less oxic conditions.
The sediments in unit 2b (c. 5900–1600 cal yr BP) change fromgyttja (layers 17–15) to peaty gyttja (layer 14) and peat (layer 13),and back to peaty gyttja (layers 12–11) (Table 3). Soil mineral parti-cles in sieve remains are present in low amounts throughout unit2b, but show a peak at 1.60 m (layer 13) and 1.30–1.20 m (layers12–11). Charcoal appears at 1.60 m and has a distinct peak at1.25–1.20 m (Fig. 4). MS values are mainly negative, but start to in-crease at 1.40 m, in the upper part of layer 13. LOI and TOC mirrorthis trend with high values of 50–60% and 30–35%, respectively inlayers 17–13, and a subsequent decline to 30% and 18%, respectively(Fig. 4). C/N ratios increase and are ~20–25 throughout unit 2b, andδ13Corg values of b−25‰ (Figs. 4, 5A) are typical of higher plants(Meyers and Teranes, 2001), indicating that most of the organic ma-terial is of terrestrial origin. %TS is highest in layers 16–15 with0.8%, but declines upward, more or less following the pattern of%TOC and %LOI (Figs. 4, 5B). Anoxic conditions could explain the ini-tially high TS values and the gradual decline in %TS could be ascribedto subsequent sulfur limitation. The sediments and the geochemicalproxies thus document a distinct change around 5900 cal yr BP to alake with anoxic bottom water conditions and increasing terrestrialorganic matter contributions. About 500 years later, the shallowlake transformed into a wetland, which became increasingly domi-nated by terrestrial vegetation. The shift from lake to wetland andsubsequently to peatland shows that the water level in the basinhad decreased substantially. The transition from wetland to peat,which is seen in the stratigraphy at 1.60 m (Fig. 4), coincides with ahiatus as suggested by the 14C dates and by high amounts of soil min-eral particles, while the age model points to very low sedimentationrates (Fig. 3B, C). These two assumptions do not necessarily contra-dict each other, since very low sedimentation rates can also conceal
Table 3
Lithostratigraphic description of sediment sequence CP3A and modeled age range ofthe lower boundary of each layer. MAP=mean age point; gLB= gradual lower bound-ary; sLB = sharp lower boundary.
Depth below surface(m)
Lithostratigraphicdescription
Layer Unit Age range (MAP)(cal yr BP)
0.00–0.11 Gray in field, nowoxidized reddish blackclay gyttja, gLB
1 3c 66–386 (307)
0.11–0.25 Gray in field, nowoxidized clay gyttja withreddish spots, lightlaminations, gLB
2 3c 155–515 (440)
0.25–0.42 Gray brown in field, nowgreenish-brown slightlyoxidized clay gyttja, gLB
3 3c 288–648 (551)
0.42–0.51 Dark brown clay gyttja,gLB
4 3c 384–734 (602)
0.51–0.58 Oxidized greenish brownclay gyttja with reddish-black/brown spot, gLB
5 3c 476–836 (615)
0.58–0.65 Olive green gyttja, gLB 6 3b 558–903 (653)0.65–0.77 Dark brown gyttja, gLB 7 3b 727–1217
(1043)0.77–0.91 Dark greenish brown clay
gyttja, gLB8 3a 1213–1608
(1409)0.91–1.05 Dark brown clay gyttja,
some FeS stains, gLB9 3a 1469–2089
(1500)1.05–1.18 Dark brown/blackish
brown clay gyttja, sLB10 3a 1553–2328
(1562)1.18–1.35 Dark brown-black peaty
gyttja, possibly some clay,gLB
11+12
2b 3043–3403(3168)
1.35–1.60 Blackish brown peat, gLB 13 2b 4963–5358(5317)
1.60–1.67 Blackish brown peatygyttja, gLB
14 2b 5026–5741(5554)
1.67–1.72 Dark brown gyttja, gLB 15 2b 5089–5924(5715)
1.72–1.75 Transition zone: greenishbrown and black gyttja,gLB
16 2b 5128–5998(5786)
1.75–1.85 Greenish brown gyttja,gLB
17 2b 5285–6295(5874)
1.85–1.95 Olive brown clay gyttja,gLB
18 2a 5493–6573(6037)
1.95–2.16 Olive brown clay gyttja,gLB
19 2a 6030–7115(6659)
2.16–3.85 Gray gyttja clay 20 1 9294–9574(9420)
153B. Wohlfarth et al. / Global and Planetary Change 92-93 (2012) 148–161
a hiatus. Peat growth seems to have been interrupted by periodic des-iccation, as suggested from the presence of soil mineral particles andthe frequent appearance of charcoal, although this is not corroboratedby the geochemical proxies (Fig. 4). The lithological change from peatto peaty gyttja at 1.35 m and the geochemistry indicate a rise in waterlevel around 3200 cal yr BP and the subsequent establishment of awetland/shallow productive lake. The occurrence of soil mineral par-ticles in the peaty gyttja of layers 12–11 and high amounts of charcoalat 1.20 m depth, just below the transition to unit 3a, however sug-gests that this shallow lake also experienced periodic dryness(Fig. 4). Moreover, the sharp boundary between layers 11 and 10 at1.18 m depth (Table 3) and very low sedimentation rates may indi-cate another hiatus (Fig. 3).
Unit 3a (c. 1600–1000 cal yr BP) is made up of clay gyttja withvarying colors and FeS stains (layers 10–8) (Table 3). The distinct lith-ological transition observed between layers 11 and 10 is not reflectedin the geochemical parameters, which indicate a gradual decline in%LOI, %TOC, %TS and in the C/N ratio, and δ13Corg values of −25 to−24‰ (Fig. 4). The change in sediment composition between units2b and 3a and the geochemical parameters thus document a return toa higher water level, and the slightly higher proportion of mineral mat-ter could signify higher catchment run-off. LOI and TOC values arearound 20% and 10%, respectively, and carbonate percentages increaseslightly in unit 3a. C/N ratios of 11–17 andmore depleted δ13Corg valuesin layers 9 and 8 suggest a higher proportion of algal organicmaterial asopposed to terrestrial derived organic matter (Figs. 4, 5A).
Depth
(m
) belo
w s
edim
ent-
wate
r in
terf
ace
Units
3c
3b
3a
2b
2a
1
1-2
3
0
0.50
1.00
CP3A
1.50
2.00
2.50
3.00
3.50
ClaySilt San
d
4-5
Laye
r #
6-7
8
9
10
11-12
13
1415-161718
19
20
0 1000 2000 3000 4000 5000 6000 7000 8000 9000 10000
Age (cal yr BP)
BA
Charcoal, seeds, plant remains
Wood
0 1000 2000 3000 4000 5000 6000 7000 8000 9000 10000
Age (cal yr BP)
0
0.50
1.00
1.50
2.00
2.50
3.00
3.50
UBA-16764
UBA-12663
UBA-16763
UBA-14169 UBA-14170
UBA-16762UBA-12662 UBA-14168
UBA-14166UBA-12661UBA-16761
UBA-12660
UBA-16759
UBA-16758
Hiatus?
Hiatus?
C
Fig. 3. (A) Lithostratigraphy of CP3A, (B) calibrated 14C dates (2 σ) shown on a depth scale. Samples UAB-12662, UAB-14170 and UBA-14168 were identified as outliers (see text fordiscussion). (C) Modeled age–depth curve, excluding the outlying dates; the shaded gray area and the dotted curve show the calculated errors. See Table 2 for details on the 14Cdates and Fig. 4 for a stratigraphic legend.
De
pth
(m
) b
elo
w s
ed
ime
nt-
wa
ter
inte
rfa
ce
0 10 0 20 40 60 0 5 15 20 25 0 0.5
Sedim
enta
ry
units
3c
3b
3a
2b
2a
1
1-2
3
0
0.50
1.00
CP3A
1.50
2.00
2.50
3.00
3.50
ClaySilt San
d
4-5
Laye
r #
6-7
89
10
11-12
13
1415-16 17
18
19
20
Peat Peaty gyttja Gyttja Clay gyttja Gyttja clay
Age (c
al yr B
P)
c. 9400
c. 6700
c. 5900
c. 1600
c. 1000
c. 600
5 15 0 10 20 30 -25 -20
ooo
o
-- Charcoal oSoil particles
--
------
--
o
o
o
---- oo
oo
o
o-- ----
o
----
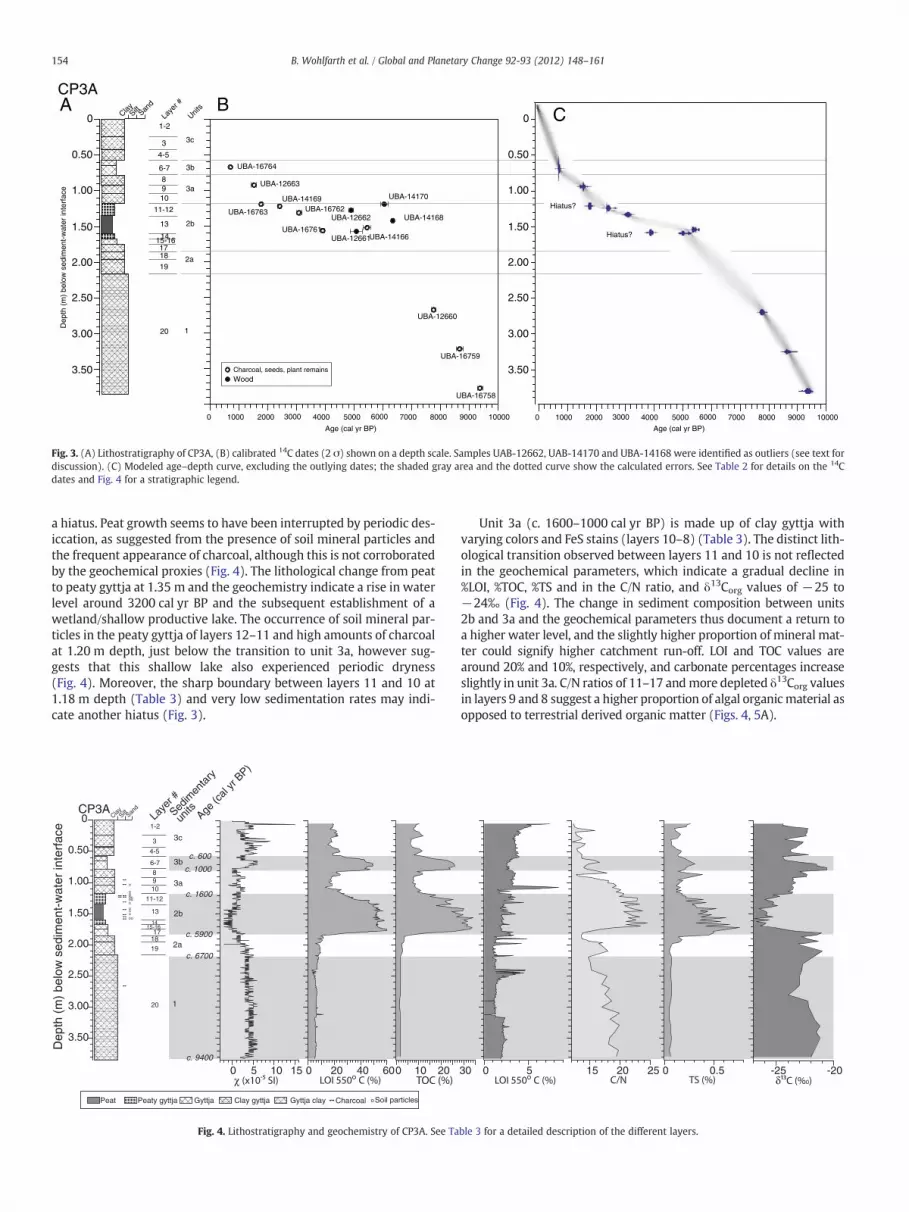
Fig. 4. Lithostratigraphy and geochemistry of CP3A. See Table 3 for a detailed description of the different layers.
154 B. Wohlfarth et al. / Global and Planetary Change 92-93 (2012) 148–161

Unit 3b (c. 1000–c. 600 cal yr BP) with gyttja layers 6–7 (Table 3)is characterized by slightly higher MS values and distinctly high %LOIand %TOC of 50 and 25%, respectively. TS is around 0.3%, C/N ratios areb17, and δ13Corg values decrease from−21 to−24‰ (Figs. 4, 5A, B).The comparably high %LOI and %TOC are surprising and suggest,together with a C/N ratio of b17, high autochthonous productivity.This partly contrasts with the slight increase in MS values, whichcould be related to increased run-off and/or to the presence of iron sul-fides (e.g. greigite). The gradual enrichment of the δ13Corg values mightsuggest higher contributions from C3 plants and/or phytoplanktonsources. Marked increases in primary productivity (‘eutrophication’)in sub-recent lake sediments are generally interpreted as a sign of in-creased human activity in the catchment (e.g., Hodell and Schelske,1998; Matzinger et al., 2007). Higher organic matter content, however,could also indicate expansion of the shore vegetation and a lowering ofthe lake level (Hannon and Gaillard, 1997).
The uppermost unit 3c (last ca. 600 cal years BP) is composed ofclay gyttja, which oxidized rapidly from gray to reddish-black orgreenish-brown (layers 5–1) (Table 3), indicating the presence ofiron sulfides. Higher, but variable mineral magnetic values, includingpeak values of 16×10−5 SI units, therefore may be attributed to iron-bearing minerals washed into the lake from the catchment, and/or togreigite, and as such less oxic bottom water conditions. Organic mat-ter content and %TOC are distinctly lower than in unit 3b, while car-bonates increase to 7–8% (Fig. 4). A C/N ratio of b15 together withδ13C values of −24 to −22‰, suggests a dominantly aquatic originof the organic material (Figs. 4, 5A).
4.3. Diatom assemblages and lake status changes
Diatom abundance and diversity in the sediments are highly vari-able. The lowermost sediments in diatom zone A (3.70–1.95 m;9200–6000 cal yr BP) are dominated by Aulacoseira granulata (>75%),with low relative abundances (b5%) of both Aulacoseira ambigua andCyclotella meneghiniana (Fig. 6). Aulacoseira granulata is a cosmopolitanplanktonic species that is abundant in conditions of low light and highturbulence (Kilham and Kilham, 1975; Anderson, 2000). This includesbothmonomictic and dimictic lakes, where the average daily irradiancenecessary for diatom growth is low because of deep mixing of surfacewaters, as well as shallow polymictic lakes where turbidity is high.Both A. granulata and C. meneghiniana (Tuchman et al., 1984) are com-mon in relatively shallow nutrient-rich tropical lakes (Gasse et al.,1983).
Diatom concentrations are very low in diatom zone B between 1.95and 1.765 m (c. 6000–5800 cal yr BP), which suggests either very lowdiatom production or dissolution of diatom silica. The sediments inthis zone are gyttja, which suggests algal production may have beenmoderately high. Thus, one explanation for the absence of diatoms isthat they were excluded as a result of resource competition withother algal groups. None of the geochemical data provide a clear pictureof a driver of such a shift. It also is possible that the diatoms weredissolved after their deposition in the sediments. Many very differentconditions can dissolve diatom valves, including high pH, high salinity,low dissolved silica, and sediment drying and oxidation. Given theinferred hiatuses subsequent to the deposition of this unit, one logicalscenario is that the periodic desiccation of the sediments enhancedthe breakage and subsequent dissolution of diatoms in the underlyingsediments. However, presently insufficient information is available toconfidently identify the likely cause of the absence of diatoms in thiszone of the core.
The highest diversity of diatoms is in diatom zone C between 1.765and 0.895 m (Fig. 6). In the lower part of this zone (1.765–1.345 m,subzone C1; c. 5800–3200 cal yr BP) Aulacoseira granulata declines inrelative abundance to b35% and is replaced by Aulacoseira ambigua
and a diverse array of benthic diatoms. The higher abundance of A.ambigua (5–20%) and benthic diatoms (55–75%) suggests increasedwater clarity. The assemblage of benthic diatoms consists of speciescharacteristic of low-alkalinity waters, such as Brachysira vitrea,Frustulia rhomboides, multiple Eunotia species, and several Pinnulariaspecies (Charles, 1985). The benthic assemblage is typical of a low-alkalinity shallow lake with abundant aquatic plants or a wetland, assuggested by the lithostratigraphy. In the middle part of zone C(1.345–1.045 m, zone C2; c. 3200–c. 1500 cal yr BP) benthic diatom di-versity and abundance (b30%) declines and A. granulata increases(>70%) (Fig. 6), suggesting somewhat reduced water clarity and in-creased water depth. In the top of zone C (1.045–0.895; c. 1500–c.1400 cal yr BP), diatom concentrations are low and planktonic diatomsdecrease relative to benthic diatoms. The low diatom concentrationmay reflect increased clastic inputs in runoff, consistent with the highermineral content in the sediments.
In the uppermost sediments (b0.895 m, diatom zone D; b1400 cal yrBP) diatom abundance is very low (Fig. 6). In contrast, in the contempo-rary lake, living diatoms are abundant on both plants and mud(Inthongkaew, unpublished data), which suggests that the absence of di-atoms in the uppermost sediments is a result of dissolution of biogenic sil-ica. This hypothesis is corroborated by the absence of phytoliths inthe correlative unit of cores taken by prior researchers (Kealhofer andPenny, 1998). Theprocesses producing silica dissolution again are unclear.
4.4. Correlation of CP3A to the sediment sequences of Kealhofer and
Penny (1998) and Penny (1998)
Although the availability of multiple sediment sequences in thedeeper part of the lake and along its eastern shore (Fig. 1B) would
10 15 20 25
C/N
-20
-22
-24
-26
-28
TOC (%)10 4030200
TS
(%
)
0.8
0.6
0.4
0.2
0
Unit 3c
Unit 3b
Unit 3aUnit 2b
Unit 2a
Unit 1
Unit 3c
Unit 3b
Unit 3aUnit 2b
Unit 2a
Unit 1
A
B
δorg
(‰
)
Fig. 5. Plots of (A) δ13C versus C/N and (B) %TS against %TOC according to the respectivesedimentary units.
155B. Wohlfarth et al. / Global and Planetary Change 92-93 (2012) 148–161

offer an excellent opportunity for detailed lithostratigraphic correla-tions, the sediment descriptions provided in Kealhofer and Penny(1998) and Penny (1998) only allow for general comparisons to ournew cores. We illustrate a possible correlation between Kealhoferand Penny's (1998) and Penny's (1998) sediment sequences andCP3A along a southwest–northeast transect in Fig. 7. The bottommostfine sand and sandy clay sediments, which were reached in sedimentcores KUM.3, KUM.2, KUM.1, and KUM.9 (Kealhofer and Penny, 1998;Penny, 1998) and dated to ~ >10,500 cal yr BP, could not be obtainedin CP3A. The transect, however, shows that the surface of these sedi-ments is very irregular, indicating large variations in lake bottom
topography (Fig. 7). The gray gyttja clay of sedimentary unit 1 inCP3A correlates with the loam, clay and silt in KUM.3, with the clayto silty clay in KUM.2 (Penny, 1998) and the clay/silt in KUM.1 andKUM.9. This correlation is supported by 14C ages, which estimate thedeposition of these sediments to between ~10,000 and 7000 cal yr BP(Kealhofer and Penny, 1998; Penny, 1998). The transect suggests thatthese layers drape the underlying sediments and fill the deeper partsof the basin (Fig. 7). The succession of organic-rich layers between2.16 and 1.18 m in CP3A, which were assigned to sedimentary units2a and 2b (6700–1600 cal yr BP), compares well to the peat layersdescribed for KUM.3, KUM.2 and KUM.1 (Kealhofer and Penny, 1998;
Aulac
oseira
am
bigu
a
0 20 0 20 40 60 80 100
Aulac
oseira
gra
nulata
0
Cyc
lote
lla s
tellig
era
0
Cyc
lote
lla m
eneg
henian
a
0 20
Brach
ysira
vitr
ea
0
Encyo
nem
a silesiac
um
0
Eunot
ia cam
elus
0 0
Eunot
ia in
cisa
0
Eunot
ia in
term
edia
0
Eunot
ia m
onod
on
0 20
Eunot
ia y
anom
ami
0 20
Eunot
ia spp
0
Frustulia rh
ombo
ides
var c
rass
iner
via
0
Gom
phon
ema
grac
ile
0
Gom
phon
ema
spp
0
Nav
icula
radios
a
0 20
Pinnu
laria
spp
BcihtnePcinotknal
%
Diato
m zon
es
Depth
(m
) belo
w s
edim
ent-
wate
r in
terf
ace
Sedim
enta
ry
units
3c
3b
3a
2b
2a
1
1-2
3
0
0.50
1.00
CP3A
1.50
2.00
2.50
3.00
3.50
Cla
ySiltSan
d
4-5
Laye
r #
6-7
8
910
11-12
13
1415-16
1718
19
20
Age (c
al yr B
P)
9200
60005800
15001400
D
C3
C2
C1
B
A
3200
Fig. 6. Diatom diagram for CP3A. See Fig. 4 for a stratigraphic legend.
Yellowish-brown clay/siltDark brown organic clay (?clay gytjja)
Black organic clay (?clay gytjja)
Black to brownish-black humified peat
Dark greyish-yellow clay to silty clay
Yellowish-grey and grey sandy clay, with lenses of fine sand
0
0.50
1.00
1.50
2.00
2.50
3.00
3.50
KUM.2ClaySilt San
d Black to brownish black, poorly humified herbaceous peat
Dark greyish-yellow clay/silt
Dark greyish-yellow sandy clay/silt
KUM.1
0
0.50
1.00
ClaySilt San
d
0
0.50
1.00
1.50
ClaySilt San
d
Black herbaceous peat
Olive black organic clay, abundant plant fragments (?gyttja)
Black clay and silt with strongly humified organic material (?gyttja)
Brown-black humified organic clay (?gyttja)
Dark greyish-yellow clay with some sand
Yellowish-grey fine sand with some organics
KUM.9
Dark brown clay gyttja
Greenish-brown clay gyttja
Dark brown clay gyttja
Dark brown peaty gyttja
Blackish-brown peat
Blackish-brown peaty gyttjaDark brown gyttja
Greenish-brown clay gyttja
Grey gyttja clay
0
0.50
1.00
CP3A
1.50
2.00
2.50
3.00
3.50
ClaySilt San
d
Dark brown clay gyttja
Dark brown gyttja
Unit 1
Unit 2
Unit 3
Legend
Peat
Peaty gyttja
Gyttja
Clay gyttja
Sandy gyttja
Gyttja clay
Clay and clayey silt
Fine sand
KUM.3
Dark brown, dense, sub-fibrous peat
Brown to grey-brown loam
Brown to dark brown organic layers (?gyttja)
Dark brown loam (?clay gyttja)
Dark brown soft clay with organic material
Grey brown silt and clay
Dark brown clay, more rigid and dry
Grey brown loam
Grey brown fine sandy clay loam
Dark brown to grey brown clay loam
Light brown, dense fine sand
0
0.50
1.00
1.50
2.00
2.50
3.00
3.50
4.00
4.50
5.00
5.50
6.00
ClaySilt San
d
De
pth
(m
) b
elo
w s
ed
ime
nt
su
rfa
ce
Consolidated dark brown layer with coarse organic fragments (?peat)
Light brown fine sand, less dense
ca. 3000 cal yr BP
ca. 7100 cal yr BP
ca. 1
0500 cal y
r BP
ca. 2100 cal yr BP
ca. 7000 cal yr BP
ca. 9700 cal yr BP
ca. 1600 cal yr BP
ca. 6700 cal yr BP
ca. 9400 cal yr BP
ca. 6400 cal yr BP
SW
NE
Unit 1
Unit 2
Unit 3
c. 2000 cal yr BP
Fig. 7. Stratigraphic SW–NE transect for the eastern part of the Kumphawapi basin. The stratigraphies for KUM.3, KUM.2, KUM.1 and KUM.9 follow the description by Penny (1998).
156 B. Wohlfarth et al. / Global and Planetary Change 92-93 (2012) 148–161

Penny, 1998) and is also likely correlative to the black organic clay andsilt in KUM.9 (Penny, 1998). The upper boundary of these organic sed-iments coincideswith a hiatus of approximately 1500 years in CP3A, butis dated to c. 2100 cal yr BP in KUM.2 and to c. 3000 cal yr BP in KUM.3.Given that all 14C dates for KUM.2 and also the uppermost 14C date forKUM.3 were made on pollen concentrates, this age difference wouldsuggest that peat formation ended earlier in KUM.3 and that the south-ern part of the basin is slightly deeper (Figs. 1B, 7). The hiatus observedin CP3A, at or just below the boundary of unit 3a, could on the otherhand suggest erosion of the upper part of the peat in KUM.3. The peatlayers in the three sequences KUM.3, KUM.2 and CP3A are overlain byclay gyttja and gyttja sediments, which indicate a rise in lake level. Incontrast, peat formation continued at KUM.1 and KUM.9, sites situatedcloser to the shore of the present lake (Fig. 7).
4.5. Paleoclimatic and paleoenvironmental interpretation
Kealhofer and Penny (1998) and Penny (1998) demonstrated thatsand and clay layers accumulated in the Kumphawapi basin before~10,500 cal yr BP and suggested deposition in a floodplain or backswamp environment (Table 1). The inference of arid climatic condi-tions was based on the reconstructed species-poor and strongly sea-sonal vegetation that surrounded the site. By c. 10,000–9400 cal yrBP a lake had formed in the basin, as documented by the proxies an-alyzed in CP3A. The shallow freshwater lake, where terrestrial andaquatic organic material accumulated together with clastic sedimentsderived from the catchment, was characterized by low light condi-tions, high turbulence in the water column, and oxygenated bottomwater. This suggests high run-off and consequently higher moistureavailability (Fig. 8). Pollen and phytolith assemblages provide evi-dence for the establishment of a mosaic of open dry-land vegetation,open woodlands, and dry/mixed deciduous forests between ~10,500and ~9000 cal yr BP (Table 1), which has been interpreted as a changetoward more humid climatic conditions (Kealhofer and Penny, 1998;Penny, 1998). This assumption compares well to the proxy recordfrom CP3A.
Gradually increasing lake organic productivity between 6700 and5900 cal yr BP and less oxic bottom water conditions suggest de-creased catchment run-off (Fig. 8). This development could havebeen a response to denser vegetation around the lake, but could
also have been initiated by a decrease in effective moisture. Thesubsequent rapidly increasing organic content of the sediments, re-duced bottom water conditions, and a decrease/increase in planktonic/benthic diatoms, indicate a distinct lowering of the water level in the al-ready shallow lake. The fairly abrupt change in lake status at c.5900 cal yr BP indicated by multiple proxies suggests that this shiftwas not a simple response to basin infilling, but was caused by a changeto lower effectivemoisture. By 5400 cal yr BP an extensivewetlandwithpredominantly terrestrial vegetation had become established. Accordingto the chronology of Kealhofer and Penny (1998) and Penny (1998),lowering of the lake level commenced already ~6800 cal yr BP, coinci-dent with a significant reduction in dry-land taxa (Table 1). This is ap-proximately 1000 years earlier than the water level loweringevidenced in our proxy records. Given that most of Kealhofer andPenny's (1998) and Penny's (1998; 1999) 14C dates for KUM.3 weremade on bulk sediment (Table 2), this older age could be explained byincorporation of reworked organic material.
The transition from wetland to peatland coincides with a hiatus, oralternatively with a change to very low peat accumulation startingaround 5200 cal yr BP, as suggested by the age model (Figs. 3B, 8).Both a hiatus and/or slow peat growth would indicate no accumulationor very low accumulation rates, which in turn could be interpreted interms of low effective moisture availability. The peatland persisteduntil about 3200 cal yr BP and seems to have been subject to periodicdesiccation. The change from peatland to wetland around 3200 cal yrBP, indicated by the lithological shift from peat to peaty gyttja and bya decrease in organic matter content and an increase in planktonic dia-toms, would suggest a rise in water level and flooding of the peat sur-face. According to the age model, deposition of the peaty gyttja wouldhave occurred between 3200 and 1600 cal yr BP (Fig. 3, Table 3),which implies very slow sediment deposition, or a hiatus. The highnumber of soil mineral particles between c. 2700 and 2500 cal yr BP,large amounts of charcoal between 1900 and 1600 cal yr BP, and thesharp lithological transition between units 2b and 3a would argue forhiatuses, possibly due to surface dryness. This in turn would indicateat least two intervals of reduced effective moisture availability, onearound 2700–2500 cal yr BP, and one around 1900–1600 cal yr BP(Fig. 8). The latter coincides with the transition to the clay gyttjas ofunit 3a, which document the establishment of a shallow lake. Most ofthe northern and northeast parts of the basin (KUM.1, KUM.6 and
Age (
cal yr
BP
)
Lake KumphawapiCP3A
1000
2000
3000
4000
5000
6000
7000
8000
9000
Peatland,periodic desiccation
Lake status
Peat Peaty gyttja Gyttja Clay gyttja Gyttja clay
Shallow lakehigher productivity
Wetland
Moisture availability
Shallow lake,oxic bottom waters
Lake level
Wetland
Low High Lower Higher
Hiatus
Shallow lake
Low High
Ban Chiang
Hunter-gatherers
Hunter-gatherer-cultivator economies
Agriculture,domestication,
wet rice cultivation
Abandonment ofthe settlement
Hiatus
Hiatus
Wetland
Fig. 8. Reconstructed lake level, run-off and moisture history for Kumphawapi. The different settlement periods at Ban Chiang are according to Pietrusewsky and Douglas (2002)and White (2008).
157B. Wohlfarth et al. / Global and Planetary Change 92-93 (2012) 148–161

KUM.9) were not flooded (Fig. 7), we therefore assume that the newlake had a smaller size than the lake that existed between ~9400 and~5600 cal yr BP. The higher lake level, evidenced in our record around1600 cal yr BP, has not been discussed by Kealhofer and Penny (1998)and Penny (1998), although the stratigraphies of KUM.2 and KUM.3show a distinct transition from peat to gyttja/clay sediments (Fig. 7).The distinct rise in water level in the basin is enigmatic and leads to anumber of questions:Was the rise in lake level caused by anthropogen-ic or natural damming of the outlet, for example by uplift of the saltdome in the southern part of the lake? Did dissolution of the MahaSarakham salt beds cause basin subsidence? Or, can higher ground-water levels and higher moisture availability explain the gradual risein water level?
Kumphawapi's present outlet toward the south runs through aseveral kilometer-wide, low-relief area (Klubseang, 2011). Dam-ming of the outlet at its narrowest point would have involved con-struction of a 0.5 to 1 km long dam by the former settlers.Geoarchaeological investigations in the Upper Mun River valley,some 250 km to the southeast of Kumphawapi, have shown that in-tensified landscape management and construction of drainage chan-nels became common during the Iron Age (c. 2500–1500 cal yr BP)due to limited water availability (Boyd, 2008). On the other hand,the well-known Iron Age settlement of Ban Chiang had been aban-doned around 1800 cal yr BP (Pietrusewsky and Douglas, 2002;White, 2008), which predates the higher lake level in Kumphawapi.The construction of a large dam to raise water levels in Kumphawapiseems therefore less probable. Uplift of the salt dome, which formsthe small island of Ban Don Kaeo to the south of the lake (Figs. 1B,2), could have played a role in blocking the outlet. Active salt domeuplift due to regional tectonic compression or buoyancy has beenreported at rates varying between an extreme of 82 mm yr−1 and2 mm yr−1 (Davison, 2009). Given these uplift rates, Ban DonKaeo could theoretically have been uplifted by between 33 and0.8 m during the c. 400 years, which cover the upper hiatus. How-ever, on-going uplift for Ban Don Kaeo has not been described, al-though many topographic features on the Khorat Plateau areexplained by the formation of salt domes and by the corrosion/dis-solution of salt beds of the Maha Sarakham Formation (Hisao andWichaidit, 1989; Malilla, 2001). Moreover, a gradual uplift of thesalt dome would likely not have caused a hiatus, but would showup as a fairly gradual transition from peaty gyttja to clay gyttja.Subsidence of the Kumphawapi basin, due to the dissolution of un-derlying salt beds, could be another explanation for the risein water level. However, none of the analyzed proxies in the sedi-ments of CP3A indicates a change in lake water salinity, whichwould be expected as a result of salt bed dissolution. Risinggroundwater levels and higher effective moisture is another expla-nation for the gradual increase in lake level. Given that anthropo-genic impact and salt-related processes seem less probable, wehypothesize that climate-induced changes led to higher waterlevels in Kumphawapi.
Kumphawapi's lake phase continued up to the present, but wasinterrupted by a change in lake status between c. 1000 and600 cal yr BP (Fig. 8). The distinct increase in sediment organic mat-ter content could have been caused by intensified agriculture in thecatchment (i.e. deforestation, construction of irrigation channels),which led to increased nutrient flux to the lake. Boundary stonesfrom the island of Ban Don Kaeo (Fig. 1) date the presence of settle-ments to 800 AD (1200 cal yr BP) (Penny, 1998), which comparesapproximately to the interval of higher organic matter content. An-other explanation could be expansion of the shore vegetation dueto a lowering of the water level and lower effective moisture avail-ability, which could have increased the organic matter content inthe shallow lake. In addition, it could be speculated that a strongerhuman impact on the lake's catchment could have been a result ofa change in climatic conditions.
4.6. Is Lake Kumphawapi recording local or regional past climatic changes?
Given the scarcity of paleo-precipitation records from tropicallakes in Southeast Asia, it is important to examine whether LakeKumphawapi can be added as an archive of tropical climate changeor whether the environmental signals stored in its sediments are re-corders of local catchment processes and/or anthropogenic impact.We therefore compare our environmental reconstruction to terrestri-al records from the Asian monsoon region (Fig. 9).
Geoarchaeological investigations in the Upper Mun River valleyto the southeast of Kumphawapi suggest that drier climate condi-tions starting around 3500 cal yr BP led to decreased water availabil-ity, to gradually intensified landscape management, and to the finalabandonment of Iron Age settlements after 1500 cal yr BP (Boyd,2008). This observation is in line with the general view of a mid-Holocene decline in Asian monsoon strength (Morill et al., 2003;Wang et al., 2005a), but diverges from the record of Lake Kara innorthern Cambodia (Maxwell, 2001). The data from this site suggesthigher effective moisture c. 9500–6200 cal yr BP and during the past2700 cal yr BP, and lower effective moisture c. 6200–2700 cal yr BP(Maxwell, 2001). These trends compare fairly well to the lake-levelhistory of Kumphawapi (Fig. 9). Variable lake levels are also reportedfor Lake Tonle Sap since the mid-Holocene, but these are explainedby decreased rainfall and increased seasonality (Penny, 2006).
Paleoclimate reconstructions based on the record from LakeHuguangyan in southern China (Wang et al., 2007) indicate high ef-fective moisture between 9500 and 8000 cal yr BP, lower effectivemoisture between 7800 and 4200 cal yr BP, and distinctly drier condi-tions between 4200 and 350 cal yr BP (Fig. 9). The Dongge cave sta-lagmite δ18O record suggests that the East Asian summer monsoonwas stronger between 9000 and 5600 cal yr BP, and then declinedin a step-wise sequence with marked shifts at 5600 and 3500 cal yr
Age (
cal yr
BP
)
1000
2000
3000
4000
5000
6000
7000
8000
9000
Lake
Kum
phaw
api
Lake K
ara
Cam
bodia
(1)
Huguangyan
S C
hin
a (
2)
weak summer monsoon
NW
India
(4)
Lake S
am
bhar
Thar
Desert
(5)
Sid
dha B
aba
Cave N
epal (7
)
weaker summer monsoon
strong summer monsoon
Pokhara
n P
laya
Thar
Desert
(6)
Dongge C
ave
Chin
a (
3)
Last m
illenniu
m(8
)
Fig. 9. Comparison of the reconstructed effective moisture availability of LakeKumphawapi to selected Asian paleo-monsoon records. 1 = Maxwell (2001); 2 =Wang et al. (2007); 3 = Dykoski et al. (2005); Wang et al. (2005b); 4 = Prasad andEnzel (2005), Singhvi and Kale (2008); 5 = Sinha et al. (2006); 6 = Roy et al.(2009); 7 = Denniston et al. (2000); 8 = A. Sinha et al. (2011).
158 B. Wohlfarth et al. / Global and Planetary Change 92-93 (2012) 148–161

BP (Dykoski et al., 2005; Wang et al., 2005b). Superimposed on thisgeneral trend were a number of short-term events when the mon-soon was distinctly weaker; these were centered at around 8300,7200, 6300, 5500, 4400, 2700, 1600, and 500 cal yr BP (Wang et al.,2005b). Comparisons between speleothem δ18O records from south-ern and central China moreover suggest that East Asian summermonsoon precipitation decreased asynchronously from south tonorth, i.e. starting around 7000 cal yr BP in Dongge cave and around4500 cal yr BP in Jiuxian cave (Cai et al., 2010). These findings con-trast with those of An et al. (2000), who had suggested that the Hol-ocene precipitation maximum reached southern China as late asaround 3000 cal yr BP, and also diverge from the findings of Zhou etal. (2005; 2007) and Zhang et al. (2011), who show that Holocene cli-mate was broadly synchronous across the monsoon region. Moreover,syntheses of paleorecords from central Asia suggest that the IndianOcean and East Asian summer monsoon behaved in an asynchronousway during much of the Holocene (Herzschuh, 2006; Wang et al.,2010). The wettest interval occurred between 10,900 and 7000 cal yrBP, with continued moderately wet conditions until 4400 cal yr BP forsites influenced by the Indian Ocean monsoon. In contrast, sitesinfluencedby the East Asian summermonsoon showgenerallywet con-ditions between 11,500 and 1700 cal yr BP, with the wettest period be-tween 8300 and 5500 cal yr BP. A stronger early Holocene summermonsoon is in line with the moisture history reconstructed forKumphawapi, although the decline in monsoon strength seems tohave been registered earlier in Lake Huguangyan in southern Chinathan in northeast Thailand and in Cambodia (Fig. 9). The early Holoceneshort-term events of a weaker summer monsoon evidenced in theDongge record (Wang et al., 2005b) are not seen in Kumphawapi, butthe timing of late Holocene weak monsoon events at 2700, 1600 and500 cal yr BP corresponds approximately in time to the hiatuses in theKumphawapi record, and to the assumed low lake level phases (Figs. 8,9). The timing of lower effective moisture availability reconstructed forLake Huguangyan between 8000 and 4200 cal yr BP and the subsequentlowmoisture availability only partly compare to the environmental histo-ry of Kumphawapi.
Paleorecords for the Indian Ocean monsoon region (Fig. 9) showhigh lake levels and increased precipitation between approximately7200 and 6000 cal yr BP, and an onset of aridity around 5300 cal yr BPin NW India (Prasad and Enzel, 2005; Singhvi and Kale, 2008). Highlake levels and higher moisture availability have been reported forLake Sambhar between 9600 and 7500 cal yr BP, and between 6800and 2500 cal yr BP, while lower lake levels and decreased precipitationare reconstructed between 7500 and 6800 cal yr BP and during the past2500 years (Sinha et al., 2006) (Fig. 9). Pokhara Playa, also in the TharDesert of Northwest India registered a high rainfall regime between4000 and 2300 cal yr BP and low rainfall conditions between 2300and 1100 cal yr BP (Roy et al., 2009). The rainfall history reconstructedfrom the two TharDesert lakes (Fig. 9) compares partly to that observedin Siddha Baba Cave in Nepal (Denniston et al., 2000), where arid con-ditions are observed between 2300 and 1500 cal yr BP. However theincrease in summer monsoon precipitation around c. 500 cal yr BP(1550–1640 AD) in Nepal (Fig. 9) and the humid phase seen around1000 cal yr BP (peaking 500–750 yr BP) in northern Indian cavedeposits (Yadava and Ramesh, 2005) are not registered in the desertlakes. These latter changes also do not compare in time to the decadalto centennial long intervals of a stronger monsoon between 950 and1200 AD (c. 1000–800 cal yr BP) and the series of decadal droughtsbetween 1250 and 1450 AD (c. 800–600 cal yr BP) (Buckley et al.,2007; 2010; Sinha et al., 2007, 2011; Cosford et al., 2008; Cook etal., 2010) reconstructed from speleothem and tree-ring records inSoutheast Asia. The changes in Kumphawapi's lake level and inferredeffective moisture availability are not comparable to the above-mentioned Indian Oceanmonsoon paleoclimate records. The decadaldroughts between 1250 and 1450 AD (c. 800–600 cal yr BP) seen intree-ring and speleothem archives, however, overlap approximately
with the assumed lake level lowering in Kumphawapi between 1000and 600 cal yr BP.
The discrepancy between the inferred lake-level changes inKumphawapi and moisture records from the Indian and East Asianmonsoon regions (Fig. 9) highlights the problem of interpreting envi-ronmental proxies in lake sediments in terms of hydroclimate, andthe difficulties in correlating moisture histories over large geographi-cal distances. Each lake basin had and has its own specific setting, dif-ferent lakes had different threshold responses to changing climaticconditions, and different paleoproxies provide a range of possible en-vironmental responses. In contrast to temperature, precipitation isspatially heterogeneous; annual and rainy season precipitation totalsfrom the Asian monsoon region can, for example, only be compared atdistances of around 500 km (Dayem et al., 2010), which would meanthat a spatially dense network of well-dated sites is needed for south-east Asia to track changes in monsoon intensity in greater detail. Sucha network already exists for the past 1000 years based on tree-ringseries (Cook et al., 2010). Any conclusions regarding asynchronous/synchronous changes between the different regions remain prema-ture until more well-dated records have become available.
5. Conclusions
Sediment geochemistry combined with diatom assemblagechanges provides a detailed record of past environmental changesin northeast Thailand. Nong (Lake) Han Kumphawapi formed around10,000–9400 cal yr BP as a result of higher run-off and higher mois-ture availability due to a stronger summer monsoon. The sedimentsdeposited between c. 9400 and c. 6700 cal yr BP indicate a wellmixed water column and oxygenated bottom waters. A decrease inrun-off and the concomitant increase in lake organic productivity be-tween c. 6700 and 5900 cal yr BP suggests the development of denseshore vegetation or alternatively a decrease in effective moisture.Multiple proxies indicate a marked lowering of the already shallowlake around 5900 cal yr BP and the development of an extensivewet-land around 5400 cal yr BP. The fairly abrupt change in lake statussuggests that this shift was caused by lower effective moisture. Thesubsequent transition to a peatland coincides with a hiatus, whichindicates very low accumulation rates due to very dry climatic condi-tions. The re-establishment of a wetland around 3200 cal yr BP isinterpreted as a rise in groundwater and lake level, indicative ofslightly higher effectivemoisture. However, the sediments depositedbetween c. 3200 and 1600 cal yr BP provide evidence for at least twohiatuses at c. 2700–2500 cal yr BP, and at c. 1900–1600 cal yr BP,respectively. These hiatuses suggest surface dryness and conse-quently intervals of low effective moisture. Around 1600 cal yr BP anew shallow lake became re-established in the basin, as documentedby the sediment lithology and various other proxies. Although theunderlying causes for this new lake phase remain unclear, we hy-pothesize that higher effective moisture was the main drivingforce. This shallow lake phase continued up to the present, but wasinterrupted by higher nutrient flux to the lake around 1000–600 cal yrBP.Whether this was caused by intensified agriculture in the catchmentor, whether this signals a lowering of the lake level and exposure of theshore vegetation due to reduced effective moisture, needs to be corrob-orated by further studies in the region.
The lake level changes and inferred effective moisture historyreconstructed for Kumphawapi compare well to the general observa-tion of a strong Asian summer monsoon during the early Holoceneand a weakening of the monsoon during the mid-Holocene. The as-sumption of higher effective moisture during the later part of the Holo-cene is in line with reconstructions based on lake sediments fromCambodia and also with precipitation changes inferred from theDongge Cave speleothems, but contrasts with other reconstructions, es-pecially from the Indian subcontinent. Whether this is due to coupling/decoupling between the Indian Ocean and the East Asian monsoon
159B. Wohlfarth et al. / Global and Planetary Change 92-93 (2012) 148–161

systems, or due to local influences on the archive and/or dependent onthe choice of the studied proxies, needs to be evaluated by amuchdens-er network of hydroclimatic reconstructions.
Acknowledgments
We thank Magnus Mörth for discussions, Heike Sigmund for ana-lyzing total and CNS isotopes, Åsa Wallin for help with the magneticsusceptibility measurements and Thanawat Jarupongsakul for logisticsupport during fieldwork. We appreciate the careful reviews of thetwo anonymous reviewers, which resulted in a new version of themanuscript. Research in Thailand is financed through Swedish Re-search Council (VR) research grants 621-2008-2855 and 348-2008-6071. Financial support for fieldwork in 2009 was obtained from theSwedish Foundation for International Cooperation in Research andHigher Education (STINT) and the Swedish School of Advanced AsiaPacific Studies (SSAAPS) under project number 2008/019.
References
An, Z., Porter, S.C., Kutzbach, K.E., Wu, X., Wang, S.Y., Liu, X., Li, X., Zhou, W., 2000. Asyn-chronous Holocene optimum of the East Asian monsoon. Quaternary Science Re-views 19, 743–762.
Anderson, N.J., 2000. Diatoms, temperature and climatic change. European Journal ofPhycology 35, 307–314.
Berkelhammer, M., Sinha, A., Mudelsee, M., Cheng, H., Edwards, R.L., Cannariato, K.,2010. Persistent multidecadal power of the Indian Summer Monsoon. Earth andPlanetary Science Letters 290, 166–172.
Blaauw, M., Christen, J.A., 2011. Flexible paleoclimate age–depth models using an auto-regressive gamma process. Bayesian Analysis 6, 457–474.
Boyd, W.E., 2008. Social change in late Holocene mainland SE Asia: a response to gradualclimate change or a critical climatic event? Quaternary International 184, 11–23.
Buckley, B.M., Palakit, K., Duangsathaporn, Sanguantham, K.P., Prasomsin, P., 2007.Decadal scale droughts over northwestern Thailand over the past 448 years:links to the tropical Pacific and Indian sectors. Climate Dynamics 29, 63–71.
Buckley, B.M., Anchukaitis, K.J., Penny, D., Fletcher, R., Cook, E.R., Sano, M., Nam, L.C.,Wichienkeeo, A., Minh, T.T., Hong, T.M., 2010. Climate as a contributing factor inthe demise of Angkor, Cambodia. PNAS 107, 6748–6752.
Cai, Y., Tan, L., Cheng, H., An, Z., Edwards, R.L., Kelly, M.J., Kong, X., Wang, X., 2010. Thevariation of summer monsoon precipitation in central China since the last deglaci-ation. Earth and Planetary Science Letters 291, 21–31.
Charles, D.F., 1985. Relationships between surface diatom assemblages and lakewatercharacteristics in Adirondack lakes. Ecology 66, 994–1011.
Christen, J.A., Pérez, S., 2009. A new robust statistical model for radiocarbon data. Ra-diocarbon 51, 1047–1059.
Cook, E.R., Anchukaitis, K.J., Buckley, B.M., D'Arrigo, R.D., Jacoby, G.C., W. E., Wright,W.E., 2010. Asian monsoon failure and megadrought during the last millennium.Science 328, 486–489.
Cosford, J., Qing, H., Yuan, D., Zhang, M., Holmden, C., Patterson,W., Hai, C., 2008. Millennial-scale variability in the Asian monsoon: evidence from oxygen isotope records fromstalagmites in southeastern China. Palaeogeography Palaeoclimatology Palaeoecology266, 3–12.
Davison, I., 2009. Faulting and fluid flow through salt. Journal of the Geological Societyof London 166, 1–12.
Dayem, K.E., Molnar, P., Battisti, D.S., Roe, G.H., 2010. Lessons learned from oxygen iso-topes in modern precipitation applied to interpretation of speleothem records ofpaleoclimate from eastern Asia. Earth and Planetary Science Letters 295, 219–230.
de Vries, H., Barendsen, G.W., 1952. A new technique for the measurement of age byradiocarbon. Physica 18, 652.
Denniston, R.F., González, L.A., Asmerom, Y., Sharma, R.H., Reagan, M.K., 2000.Speleothem evidence for changes in Indian summer monsoon precipitation overthe last ca. 2300 years. Quaternary Research 53, 196–202.
Dykoski, D.A., Edwards, R.L., Cheng, H., Yuan, D., Cai, Y., Zhang, M., Lin, Y., Qing, J., An, Z.,Revenaugh, J., 2005. A high-resolution, absolute-dated Holocene and deglacialAsian monsoon record from Dongge Cave, China. Earth and Planetary Science Let-ters 233, 71–86.
El Tabakh, M., Utha-Aroon, C., Warren, J.K., Schreiber, B.C., 2003. Origin of dolomites inthe Cretaceous Maha Sarakham evaporites of the Khorat Plateau, northeast Thailand.Sedimentary Geology 157, 235–252.
Gasse, F., Talling, J.F., Kilham, P., 1983. Diatom assemblages in East Africa: classification,distribution, and ecology. Révue d'Hydrobiologie Tropicale 16, 3–34.
Hannon, G.E., Gaillard, M.J., 1997. The plant-macrofossil record of past lake-levelchanges. Journal of Paleolimnology 18, 15–28.
Herzschuh, U., 2006. Paleo-moisture evolution in monsoonal Central Asia during thelast 50,000 years. Quaternary Science Reviews 25, 163–178.
Hisao, F., Wichaidit, P., 1989. Salt and sinkhole— corrosion as a principle factor governingtopography and mass movement in Northeast Thailand. Southeast Asian Studies 27,3–34.
Hodell, D.A., Schelske, C.L., 1998. Production, sedimentation, and isotopic compositionof organic matter in Lake Ontario. Limnology and Oceanography 43, 200–214.
Kealhofer, L., 1996. The human environment during the terminal Pleistocene andHolocene in Northeastern Thailand: phytolith evidence from Lake Kumphawapi.Asian Perspectives 35, 229–254.
Kealhofer, L., Penny, D., 1998. A combined pollen and phytolith record for fourteenthousand years of vegetation change in northeastern Thailand. Review of Paleobot-any and Palynology 103, 83–93.
Kilham, S.S., Kilham, P., 1975. Melosira granulata (Ehr). Ralfs: morphology and ecologyof a cosmopolitan freshwater diatom. Verhandlungen. Internationale Vereinigungfür theoretische und angewandte Limnologie 19, 2716–2721.
Klubseang, W., 2011. Paleogeography and paleoenvironment of Nong Han Kumphawapi,Changwat Udon Thani. MSc thesis Chulalongkorn University, Bangkok, 110 pp.
Kutzbach, J.E., 1981. Monsoon climate of the early Holocene: climatic experiment usingearth's orbital parameters. Science 214, 59–61.
Limsakul, A., Limjirakan, S., Suttamanuswong, B., 2010. Asian summer monsoon and itsassociated rainfall variability in Thailand. Environment Asia 3, 79–89.
Malilla, K., 2001. Studies on Salt-related Phenomena in the Khorat Basin using RemoteSensing, Geophysics and Field Mapping. Report. Suranaree University of Technolo-gy. 152 pp.
Marwick, B., Gagan, M.K., 2011. Late Pleistocene monsoon variability in northwestThailand: an oxygen isotope sequence from the bivalve Margaritanopsis laosensis
excavated in Mae Hong Son province. Quaternary Science Reviews 30, 3088–3098.Matzinger, A., Schmid, M., Veljanoska-Sarafiloska, E., Patceva, S., Giseka, D., Wagner, B.,
Mueller, B., Sturm, M., Wuest, A., 2007. Eutrophication of ancient Lake Ohrid: glob-al warming amplifies detrimental effects of increased nutrient inputs. Limnologyand Oceanography 52, 338–353.
Maxwell, A.L., 2001. Holocene monsoon changes inferred from lake sediment, pollenand carbonate records, northeastern Cambodia. Quaternary Research 56, 390–400.
Meyers, P.A., Lallier-Vergès, E., 1999. Lacustrine organic matter records of Late Quater-nary paleoclimates. Journal of Paleolimnology 21, 345–372.
Meyers, P.A., Teranes, J.L., 2001. Sediment organic matter. In: Last, W.M., Smol, J.P.(Eds.), Tracking Environmental Change using Lake Sediments. Kluwer AcademicPublishers, Dordrecht, pp. 239–269.
Mitchell, M.J., Owen, J.S., Schindler, S.C., 1990. Factors affecting sulfur incorporation intolake sediments: paleoecological implications. Journal of Paleolimnology 4, 1–22.
Morill, C., Overpeck, J.T., Cole, J.E., 2003. A synthesis of abrupt changes in the Asiansummer monsoon since the last deglaciation. The Holocene 13, 465–476.
Penny, D., 1998. Late Quaternary palaeoenvironments in the Sakon Nakhon Basin,North-east Thailand. PhD thesis, Monash University, Victoria/Australia, 260pp.
Penny, D., 1999. Palaeoenvironmental analysis of the Sakon Nakhon Basin, NortheastThailand: palynological perspectives on climate change and human occupation.Indo-Pacific Prehistory Association Bulletin 18, 139–149.
Penny, D., 2006. The Holocene history and development of the Tonle Sap, Cambodia.Quaternary Science Reviews 25, 310–322.
Penny, D., Grindrod, J., Bishop, P., 1996. Holocene palaeoenvironmental reconstructionsbased on microfossil analysis of a lake sediment core, Nong Han Kumphawapi,Udon Thani, Northeast Thailand. Asian Perspectives 35, 209–228.
Pietrusewsky, M., Douglas, M.T., 2002. Intensification of agriculture at Ban Chiang: isthere evidence from the skeletons? Asian Perspectives 40, 157–178.
Prasad, S., Enzel, Y., 2005. Holocene paleoclimates of India. Quaternary Research 66,442–453.
Rau, J.L., Supajanya, T., 1985. Sinking cities of Thailand. Conference on Geology andMineral Resources Development of the Northeast, Thailand. Khon Kaen University,Thailand, pp. 215–227.
Reimer, P.J., Baillie, M.G.L., Bard, E., Bayliss, A., Beck, J.W., Blackwell, P.G., Bronk Ramsey,C., Buck, C.E., Burr, G., Edwards, R.L., Friedrich, M., Grootes, P.M., Guilderson, T.P.,Hajdas, I., Heaton, T.J., Hogg, A.G., Hughen, K.A., Kaiser, K.F., Kromer, B.,McCormac, F.G., Manning, S.W., Reimer, R.W., Richards, D.A., Southon, J., Turney,C.S.M., van der Plicht, J., Weyhenmeyer, C., 2009. IntCal09 and Marine09 radiocar-bon age calibration curves, 0–50,000 years cal BP. Radiocarbon 51, 1111–1150.
Roy, P.D., Nagar, Y.C., Juyal, N., Smykatz-Kloss, W., Singhvi, A.K., 2009. Geochemical sig-natures of Late Holocene paleo-hydrological changes from Phulera and Pokharansaline playas near the eastern and western margins of the Thar Desert, India. Jour-nal of Asian Earth Sciences 34, 275–286.
Satarugsa, P., Meesawat, N., Thongman, W., Yangmee, W., 2004. Evaluation of naturalhazards from a collapse of subsurface rock salt cavity in Northeastern Thailand(in Thai). Khon Kaen University Research Journal 9, 48–60.
Singhrattna, N., Rajagopalan, B., Kumar, K.K., Clark, M., 2005. Interannual and inter-decadal variability of Thailand summer monsoon season. Journal of Climate 18,1697–1708.
Singhvi, A.K., Kale, V.S., 2008. Paleoclimate Studies in India. IGBP-WCRP-SCOPE-ReportSeries: 4. 34 pp. Indian National Science Academy.
Sinha, R., Smykatz-Kloss, W., Stueben, D., Harrison, S.P., Berner, Z., Kramar, U., 2006. LateQuaternary palaeoclimatic reconstruction from the lacustrine sediments of theSambhar playa core, Thar Desert margin, India. Palaeogeography PalaeoclimatologyPalaeoecology 233, 252–270.
Sinha, A., Cannariato, K.G., Stott, L.D., Cheng, H., Edwards, R.L., Yadava, M.G., Ramesh, R.,Singh, I.B., 2007. A 900-year (600–1500 A.D.) record of the Indian summer mon-soon precipitation from the core monsoon zone of India. Geophysical Research Let-ters 34, L16707. http://dx.doi.org/10.1027/2007GL030431 2007.
Sinha, A., Stott, L., Berkelhammer, M., Cheng, H., Edwards, R.L., Buckley, B., Aldenderfer,M., Mudelsee, M., 2011. A global context for megadroughts in monsoon Asia duringthe past millennium. Quaternary Science Reviews 30, 47–62.
Slota, P.J., Jull, A.J.T., Linick, T.W., Toolin, L.J., 1987. Preparation of small samples for C-14accelerator targets by catalytic reduction of Co. Radiocarbon 29, 303–306.
Stuiver, M., Polach, H.A., 1977. Discussion: reporting of 14C data. Radiocarbon 19, 355–363.
160 B. Wohlfarth et al. / Global and Planetary Change 92-93 (2012) 148–161

Tamura, T., 1992. Landform development and related environmental changes in the ChiRiver Basin, Northeast Thailand. The Science Reports of the Tohoku University 42,107–127.
Tuchman, M.L., Theriot, E., Stoermer, E., 1984. Effects of low level salinity concentra-tions on the growth of Cyclotella meneghiniana Kutz (Bacillariophyta). Archiv fürProtistenkunde 128, 319–326.
Vogel, J.S., Southon, J.R., Nelson, D.E., Brown, T.A., 1984. Performance of catalyticallycondensed carbon for use in accelerator mass-spectrometry. Nuclear Instruments& Methods in Physics Research Section B 233, 289–293.
Wang, P., Clemens, S.C., Beaufort, L., Braconnet, P., Ganssen, G., Jian, Z., Kershaw, P.,Sarntheim, M., 2005a. Evolution and variability of the Asian monsoon system:state of the art and outstanding issues. Quaternary Science Reviews 24, 595–629.
Wang, Y.J., Cheng, H., Edwards, R.L., He, Y.Q., Kong, X.G., An, Z.S., Wu, J.Y., Kelly, M.J.,Dykoski, C.A., Li, X.D., 2005b. The Holocene Asian monsoon: links to solar changesand North Atlantic climate. Science 308, 854–857.
Wang, S.Y., Lue, H.Y., Liu, J.Q., Negendank, J.F.W., 2007. The early Holocene optimum in-ferred from a high-resolution pollen record of Huguangyan Maar Lake in southernChina. Chinese Science Bulletin 52, 2829–2836.
Wang, Y., Liu, X., Herzschuh, U., 2010. Asynchronous evolution of the Indian and EastAsian summer monsoon indicated by Holocene moisture patterns in monsoonalcentral Asia. Earth-Science Reviews 103, 135–153.
Wannakomol, A., 2005. Soil and groundwater salinization problems in the Khorat Pla-teau, NE Thailand— integrated study of remote sensing, geophysical and field data.PhD thesis, Freie Universität Berlin, Berlin, 198 pp.
White, J.C., 2008. Dating Early Bronze at Ban Chiang, Thailand. In: Pautreau, J.P., Coupey,A.S., Zeitoun, V., Rambault, E. (Eds.), From Homo erectus to the Living Traditions:Choice of Papers from the 11th International Conference of the European Associa-tion of Southeast Asian Archaeologists, Bougon, pp. 91–104.
White, J.C., Penny, D., Kealhofer, L., Maloney, B., 2004. Vegetation changes from the latePleistocene through the Holocene from three areas of archaeological significance inThailand. Quaternary International 113, 111–132.
Wongpokhom, N., Kheoruenromne, I., Suddhiprakarn, A., Gilkes, R.J., 2008. Micromor-phological properties of salt affected soils in Northeast Thailand. Geoderma 144,158–170.
Yadava, M.G., Ramesh, R., 2005. Monsoon reconstructions from radiocarbon datedtropical Indian speleothems. The Holocene 15, 48–59.
Zhang, J., Chen, F., Holmes, J.A., Li, H., Guo, X., Wang, J., Li, S., Lü, Y., Zhao, Y., Qiang, M.,2011. Holocene monsoon climate documented by oxygen and carbon isotopesfrom lake sediments and peat bogs in China: a review and synthesis. QuaternaryScience Reviews 30, 1973–1987.
Zhou, W., Xie, S., Meyers, P.A., Zheng, Y., 2005. Reconstruction of late glacial and Holo-cene climate evolution in southern China from geolipids and pollen in the Dingnanpeat sequence. Organic Geochemistry 36, 1272–1284.
Zhou, W., Song, S., Burr, G., Jull, A.J.T., Lu, X., Yu, H., Cheng, P., 2007. Is there a time-transgressive Holocene optimum in East Asian monsoon area? Radiocarbon 49,865–875.
161B. Wohlfarth et al. / Global and Planetary Change 92-93 (2012) 148–161