Histopathological lesions and DNA adducts in the liver of European flounder (Platichthys flesus)...
45
Please note that this is an author-produced PDF of an article accepted for publication following peer review. The definitive publisher-authenticated version is available on the publisher Web site 1 Environmental Science and Pollution Research February 2013, Volume 20, Issue 2, pp 723-737 http://dx.doi.org/10.1007/s11356-012-1287-0 © Springer-Verlag Berlin Heidelberg 2012 The original publication is available at http://www.springerlink.com Archimer http://archimer.ifremer.fr Histopathological lesions and DNA adducts in the liver of European flounder (Platichthys flesus) collected in the Seine estuary versus two reference estuarine systems on the French Atlantic coast Jérôme Cachot 1 , Yan Cherel 2 , Thibaut Larcher 2 , Annie Pfohl-Leszkowicz 3 , Jean Laroche 4 , Louis Quiniou 4 , Jocelyne Morin, 5 Julien Schmitz 6 , Thierry Burgeot 7 , Didier Pottier 8 1 Univ. Bordeaux, EPOC UMR 5805, LPTC Group, Avenue des Facultés, 33405, Talence, France 2 INRA, UMR 703, Oniris, La Chantrerie, 44300, Nantes, France 3 Univ. Toulouse, Laboratoire de Génie Chimique, UMR CNRS/INPT/UPS 5503, INP/ENSA Toulouse, 1 Avenue Agrobiopole, 31326, Castanet-Tolosan, France 4 Université de Brest, UMR 6539, LEMAR, Institut Universitaire Européen de la Mer, 29280, Plouzané, France 5 Ifremer, Laboratoire Ressources Halieutiques, Ave du Général de Gaulle, 14520, Port-en-Bessin, France 6 Institut Français du Pétrole, 1-4 Avenue de Bois-Préau, 92852, Rueil-Malmaison Cedex, France 7 Ifremer Nantes, Département Polluants Chimiques, Rue de l’Ile d’Yeu, 44311, Nantes Cedex, France 8 Université de Caen Basse-Normandie, UR ABTE EA 4651, Centre François Baclesse, 3 Avenue Général Harris, 14000, Caen, France *: Corresponding author : Jérôme Cachot, email address : [email protected] Abstract: An epidemiological survey was conducted in the Seine estuary and in two smaller and relatively preserved estuaries on the French Atlantic coast in order to estimate the occurrence of liver lesions in European flounder, Platichthys flesus, and also to seek putative risk factors for the recorded pathologies. Four hundred and seventy-eight fish of both sexes and of different size ranges were sampled in the three studied areas, 338 of which in the Seine estuary. All fish were examined for histopathological liver lesions, while DNA adducts and otoliths were analyzed on a subsample. Five categories of hepatic lesions were recorded with the following prevalence for the Seine estuary: 36.7 % inflammations, 8 % parasites (mainly encysted nematodes), 6.5 % foci of cellular alteration (FCA), 5.3 % foci of necrosis or regeneration (FNR), and 1.5 % tumors. Inflammation occurrence increased according to age, contrary to parasitic infestations and FCA which were more prevalent in young fish, notably those of <1 year old (group 0). Tumors were only observed in females of more than two winters. Females exhibited a higher prevalence of tumors (3.0 %) and FCA (6.5 %) than males (0 and 2.6 %, respectively). Parasitic and infectious lesions and FNR were equally distributed in males and females. The prevalence of FNR was also shown to vary according to sampling season, with significantly more occurrences of liver necrosis in the fish collected in summer than in spring. Spatial differences were observed with a higher occurrence of encysted parasites in flounders from the upper Seine estuary, while inflammations predominated in flounders living downstream. Temporal trends were also noted, with an increased prevalence of parasitic infestations, inflammations, and FCA in the 2002–2003 period in comparison to the 1996–1997 one. The three flounder populations from
-
Upload
independent -
Category
Documents
-
view
1 -
download
0
Transcript of Histopathological lesions and DNA adducts in the liver of European flounder (Platichthys flesus)...
Ple
ase
note
that
this
is a
n au
thor
-pro
duce
d P
DF
of a
n ar
ticle
acc
epte
d fo
r pub
licat
ion
follo
win
g pe
er re
view
. The
def
initi
ve p
ublis
her-
auth
entic
ated
ver
sion
is a
vaila
ble
on th
e pu
blis
her W
eb s
ite
1
Environmental Science and Pollution Research February 2013, Volume 20, Issue 2, pp 723-737 http://dx.doi.org/10.1007/s11356-012-1287-0 © Springer-Verlag Berlin Heidelberg 2012 The original publication is available at http://www.springerlink.com
Archimer http://archimer.ifremer.fr
Histopathological lesions and DNA adducts in the liver of European flounder (Platichthys flesus) collected in the Seine estuary versus two
reference estuarine systems on the French Atlantic coast
Jérôme Cachot1, Yan Cherel2, Thibaut Larcher2, Annie Pfohl-Leszkowicz3, Jean Laroche4, Louis Quiniou4, Jocelyne Morin,5 Julien Schmitz6, Thierry Burgeot7, Didier Pottier8
1 Univ. Bordeaux, EPOC UMR 5805, LPTC Group, Avenue des Facultés, 33405, Talence, France 2 INRA, UMR 703, Oniris, La Chantrerie, 44300, Nantes, France 3 Univ. Toulouse, Laboratoire de Génie Chimique, UMR CNRS/INPT/UPS 5503, INP/ENSA Toulouse, 1 Avenue Agrobiopole, 31326, Castanet-Tolosan, France 4 Université de Brest, UMR 6539, LEMAR, Institut Universitaire Européen de la Mer, 29280, Plouzané, France 5 Ifremer, Laboratoire Ressources Halieutiques, Ave du Général de Gaulle, 14520, Port-en-Bessin, France 6 Institut Français du Pétrole, 1-4 Avenue de Bois-Préau, 92852, Rueil-Malmaison Cedex, France 7 Ifremer Nantes, Département Polluants Chimiques, Rue de l’Ile d’Yeu, 44311, Nantes Cedex, France 8 Université de Caen Basse-Normandie, UR ABTE EA 4651, Centre François Baclesse, 3 Avenue Général Harris, 14000, Caen, France *: Corresponding author : Jérôme Cachot, email address : [email protected]
Abstract: An epidemiological survey was conducted in the Seine estuary and in two smaller and relatively preserved estuaries on the French Atlantic coast in order to estimate the occurrence of liver lesions in European flounder, Platichthys flesus, and also to seek putative risk factors for the recorded pathologies. Four hundred and seventy-eight fish of both sexes and of different size ranges were sampled in the three studied areas, 338 of which in the Seine estuary. All fish were examined for histopathological liver lesions, while DNA adducts and otoliths were analyzed on a subsample. Five categories of hepatic lesions were recorded with the following prevalence for the Seine estuary: 36.7 % inflammations, 8 % parasites (mainly encysted nematodes), 6.5 % foci of cellular alteration (FCA), 5.3 % foci of necrosis or regeneration (FNR), and 1.5 % tumors. Inflammation occurrence increased according to age, contrary to parasitic infestations and FCA which were more prevalent in young fish, notably those of <1 year old (group 0). Tumors were only observed in females of more than two winters. Females exhibited a higher prevalence of tumors (3.0 %) and FCA (6.5 %) than males (0 and 2.6 %, respectively). Parasitic and infectious lesions and FNR were equally distributed in males and females. The prevalence of FNR was also shown to vary according to sampling season, with significantly more occurrences of liver necrosis in the fish collected in summer than in spring. Spatial differences were observed with a higher occurrence of encysted parasites in flounders from the upper Seine estuary, while inflammations predominated in flounders living downstream. Temporal trends were also noted, with an increased prevalence of parasitic infestations, inflammations, and FCA in the 2002–2003 period in comparison to the 1996–1997 one. The three flounder populations from

Ple
ase
note
that
this
is a
n au
thor
-pro
duce
d P
DF
of a
n ar
ticle
acc
epte
d fo
r pub
licat
ion
follo
win
g pe
er re
view
. The
def
initi
ve p
ublis
her-
auth
entic
ated
ver
sion
is a
vaila
ble
on th
e pu
blis
her W
eb s
ite
2
the Seine estuary (Normandy), Ster estuary (Brittany), and Bay of Veys (Normandy) showed different spectra of hepatic lesions. Flounders from the Bay of Veys had relatively few liver lesions as compared to flounders from the two other estuaries. Flounders from the Ster estuary exhibited the highest prevalence of parasites (37.2 %) and inflammations (51.1 %). Finally, FCA and liver tumors occurred at very similar levels in both flounder populations from the Seine and the Ster estuaries. Group 0 flounders inhabiting the upper Seine estuary were more prone to parasitic and pre-neoplastic hepatic lesions and had higher levels of liver DNA adducts than the older ones living downstream. It was postulated that group 0 European flounders may serve as valuable bioindicators for assessing the quality of estuarine waters and the health status of euryhaline fish populations.
Keywords: Epidemiological study ; European flounder ; Seine estuary ; Liver histopathology ; Necrosis ; FCA ; Tumors ; Inflammations ; Parasites ; DNA adducts ; Pollution
Abbreviations: OSPAR: Oslo-Paris convention on the protection of the marine environment of the North-East Atlantic. DRZ: diagonal radioactive zone. EPCV: European College of Veterinary Pathologists 1. Introduction
Estuarine and coastal marine areas play a crucial ecological role as nursery and/or feeding grounds for a large variety of aquatic species, notably fish (Beck et al. 2001). Since nearly 60 % of the human worldwide population lives and works within 100 miles of a coast (Hinrichsen 1998), these areas are even more impacted by human activities and, particularly, by chemicals. It is now currently accepted that sediments from estuaries and coastal areas are major reservoirs for a large variety of persistent organic or inorganic pollutants and secondary
4
sources of pollution for aquatic ecosystems (Harris et al., 1996). An increase in the occurrence 74
of toxicopathic lesions and/or infectious or parasitic diseases in aquatic organisms chronically 75
exposed to pollutants has extensively been reviewed in recent years (Harmon and Wiley, 76
2010; Mearns et al., 2011). Increased susceptibility to pathologies can directly or indirectly 77
impair the survival or biotic performances of individual organisms which, in turn, can affect 78
the abundance, age structure, genetic diversity, and the reproduction of wild populations 79
(Marchand et al., 2004; Benejam et al., 2010; Brooks et al., 2012). 80
The liver of vertebrates, including fish, is the main target for toxicants because of its high 81
vascularization, its high lipid content and its role in the organic xenobiotic biotransformation 82
and metabolism of sex hormones (Hinton et al., 2001). It has been shown that fish exposure to 83
organic and metallic pollutants can lead to a wide range of toxicopathic lesions, including 84
tumors, FCA (foci of cellular alteration) and several non-neoplastic liver lesions (Hinton et 85
al., 2001). In the field, a strong relationship was reported between toxicopathic liver lesions 86
and environmental contamination by persistent organic pollutants including PAH and 87
organochlorinated hydrocarbons (Myers et al., 1998; Harshbarger and Clark, 1990; Myers et 88
al., 2003). For all these reasons, toxicopathic liver lesions in fish liver are considered as 89
sensitive and integrative biomarkers of pollutant exposure (Hinton et al., 2001) and their 90
integration in a pollution monitoring program is now recommended by the OSPAR 91
international organization (SGIMC, 2011). 92
The European flounder Platichthys flesus (L.) is a coastal and estuarine flatfish species which 93
is widespread along the European coast, in the North Sea, the Atlantic Ocean and the 94
Mediterranean Sea. Because of their benthic way of life, their bottom-feeding behavior and 95
their relative longevity, flounders are particularly exposed to sediment-trapped pollutants. In 96
addition, this species has been recommended by OSPAR for pollution monitoring in the 97
North-East Atlantic. 98
1 2 3 4 5 6 7 8 9 10 11 12 13 14 15 16 17 18 19 20 21 22 23 24 25 26 27 28 29 30 31 32 33 34 35 36 37 38 39 40 41 42 43 44 45 46 47 48 49 50 51 52 53 54 55 56 57 58 59 60 61 62 63 64 65
5
Several epidemiological studies focusing on liver pathologies in the European Flounder have 99
already been conducted in the North Sea and the Baltic Sea along the British, German and 100
Dutch coasts (Bogovski et al., 1999; Vethaak, 1992; Koehler, 2004; Vethaak et Wester, 1996; 101
Stentiford et al., 2003; Lang et al., 2006). But no or little data is available for the French 102
Atlantic coast. Furthermore, risk factors for certain liver lesions are not totally well-103
understood and need further investigation. 104
In the present study, flounders were collected on the French Atlantic coast, in three different 105
estuaries having specific features in terms of size, hydrological conditions, human pressures 106
and water quality. 107
The Seine estuary is a large (50 km2), man-altered, macrotidal ecosystem on the French 108
Atlantic coast. The Seine River catchment covers about 79,000 km2 and is one of the most 109
urbanized and industrialized area in France with about 25% of the metropolitan population 110
(16 million inhabitants), 40% of the national economic activity and 30% of the national 111
agricultural activity. Due to the high pollutant inputs and a relatively low water flow (250 to 112
900 mm3/s), PAHs and PCBs are currently detected at high levels in sediments (Cachot et al., 113
2006), suspended matters (Cailleaud et al., 2007) and biota (Minier et al., 2006; Rocher et al., 114
2006; Cailleaud et al., 2007). Furthermore, sediments from the upper Seine estuary were 115
shown to contain potent mutagenic and carcinogenic pollutants (Cachot et al., 2006) and 116
adverse health effects were reported in various invertebrates (Minier et al., 2006; Rocher et 117
al., 2006; Cailleaud et al., 2009) and fish species (Marchand et al., 2004; Gilliers et al., 2006; 118
Cachot et al., 2007; Amara et al., 2009). 119
The Bay of Veys is a large and shallow estuary of about 37 km2 located in the western part of 120
the Seine bay (east coast of Cotentin). Three main rivers including the Douve, the Taute and 121
the Vire are connected to this bay. The global river catchment of 3,500 km2 is poorly 122
1 2 3 4 5 6 7 8 9 10 11 12 13 14 15 16 17 18 19 20 21 22 23 24 25 26 27 28 29 30 31 32 33 34 35 36 37 38 39 40 41 42 43 44 45 46 47 48 49 50 51 52 53 54 55 56 57 58 59 60 61 62 63 64 65

6
urbanized (about 70 inhabitants/km2) showing mainly agricultural activity (cattle breeding 123
and dairy farming). 124
The Ster of Lesconil estuary is a small (0.36 km2) and pristine area located in Brittany with a 125
water catchment of about 100 km2. This river receives reduced domestic and agricultural 126
inputs and no industrial waste, and the levels of organic pollutants and metals currently found 127
in mussels and European flounders are low (Marchand et al., 2003; 2004). 128
The main objective of the present work is to make a first survey of liver pathologies and DNA 129
adduct levels in feral European flounders from these three contrasted estuaries. In addition, 130
this study aims at analyzing, for each of the various flounder liver pathologies, the putative 131
risk factors including biotic traits (age and sex) and abiotic parameters such as localization, 132
season and year of collection. 133
134
2. Materials and Methods 135
136
2.1 Sampling sites 137
The epidemiological survey was conducted in three estuaries along the French Atlantic coast: 138
the Seine estuary (Normandy, France), the Bay of Veys (Normandy, France) and the Ster of 139
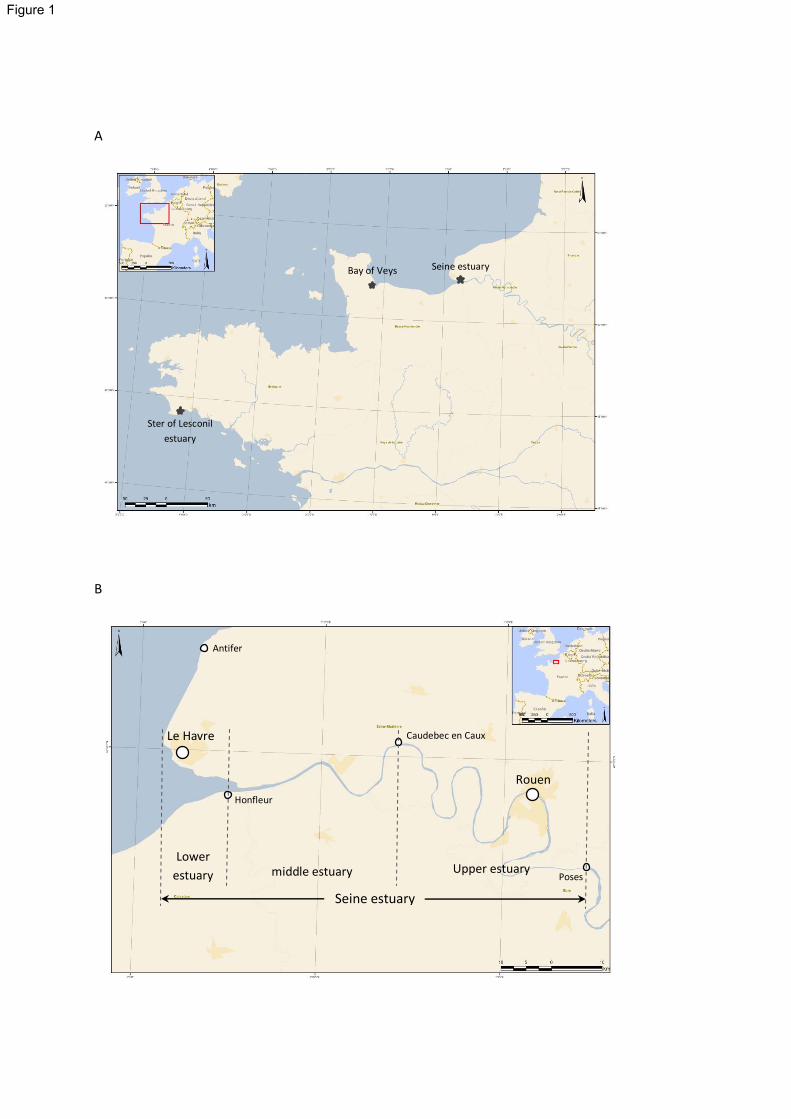
Lesconil estuary (Brittany, France) (Figure 1A). 140
The Seine estuary extends over 170 km from Poses to Le Havre (Cap de la Hève). Three 141
distinct areas can be distinguished within the Seine estuary (Figure 1B): the upper Seine 142
estuary from Poses (upstream limit of the dynamic tide) to Caudebec which is the fresh water 143
part of the estuary, the middle Seine estuary from Caudebec to Honfleur with mesohaline 144
water, and the lower Seine estuary from Honfleur to the Seine Bay characterized by salt water 145
and a high tidal range. A fourth area, named Antifer, localized in the Eastern part of the Seine 146
1 2 3 4 5 6 7 8 9 10 11 12 13 14 15 16 17 18 19 20 21 22 23 24 25 26 27 28 29 30 31 32 33 34 35 36 37 38 39 40 41 42 43 44 45 46 47 48 49 50 51 52 53 54 55 56 57 58 59 60 61 62 63 64 65

7
bay along the Pays de Caux but under the direct influence of the Seine river plume was also 147
sampled (Figure 1B). 148
149
2.2 Fish sampling and liver collection 150
Juvenile and adult European flounders (Platichthys flesus, L.) of both sexes were collected by 151
trawling or netting in the course of 15 fishing campaigns between April 1996 and May 2004 152
(Table 1). Immediately after sampling, alive fish were transferred to tanks filled with 153
recirculated water prior to dissection. Amongst the 1505 captured fish, 478 fish were 154
randomly selected (the first twenty individuals for each sampled sites or all the captured fish 155
if less than twenty) for liver histopathological analysis. The fish had their spinal cord cut and 156
abdominal cavity carefully opened with dissecting scissors, in order to have the integrity of 157
their internal organs preserved. The fish was sized (total body length), sex was determined, 158
and the biggest otolith (the sagittal) was recovered from randomly selected fish for age 159
determination. The whole liver of small fish (up to 110 mm in length) was sampled for 160
histological examination, while for bigger individuals, 1 cm3
slice encompassing the whole 161
tissue thickness and width was collected using clean razor blades. The liver samples were 162
immediately fixed in 10% formalin buffer solutions. DNA adducts were measured in the liver 163
of flounders collected in the Seine estuary in September and October 1996 and in the Bay of 164
Veys in April 1997. A small piece of liver of about 1 cm3 was recovered from 10 to 15 165
individual fish of both genders and within the same size range. Immediately after collection, 166
liver samples were pooled in a clean DNase-free microtube and deep-frozen in liquid 167
nitrogen. Samples were then stored at -80°C prior to analysis. 168
169
2.3 Age determination 170
1 2 3 4 5 6 7 8 9 10 11 12 13 14 15 16 17 18 19 20 21 22 23 24 25 26 27 28 29 30 31 32 33 34 35 36 37 38 39 40 41 42 43 44 45 46 47 48 49 50 51 52 53 54 55 56 57 58 59 60 61 62 63 64 65
8
The biggest otolith (the sagittal) was removed from 87 randomly selected fish of different size 171
and sex which had been caught in the Seine estuary. Otoliths were immersed in water and 172
examined with a stereomicroscope (Leica Wild M8) under transmitted light. Translucent 173
annuli corresponding to winter periods were counted. 174
175
2.4 Liver histopathology 176
Formalin-fixed tissues were dehydrated by transferring them through a series of alcohols of 177
increasing concentrations (80%, 2*1 hour, 35°C, 2 times; 95%, 2*1 hour, 35°C, 2 times) up to 178
100% alcohol (4*1 hour, 4 times). Next, they were placed into methylcyclohexan which is 179
miscible with both 100% alcohol and paraffin (methylcyclohexan, 3*1 hour, 35°C, 3 times). 180
Then they were put into melted paraffin (3*1 hour, 58°C, 3 times). All these operations were 181
performed using an Automat Tissue-Tek VIP 3000. The samples were then embedded in 182
paraffin wax (Automat Tissue-Tek TEC-5) and sliced with a microtom Reichert-Jung 2030 183
into 4-µm thick sections. The sections were stained using a routine hematoxyllin-eosin-184
saffron staining method (Automat Sakura DRS601). A representative section of each sample 185
was examined in a double-blind manner by means of light microscopy by one of the ECVP-186
pathologists (European college of veterinary pathologists, either authors #2 and/or #3 because 187
of the long-term study), but the critical slides were observed by the two pathologists. All 188
lesions were assigned to five main categories recommended for monitoring the biological 189
effects of contaminants in flatfish species: parasitic lesions, inflammations, 190
necrosis/regeneration foci, foci of cellular alteration and neoplasms (Feist et al., 2004). 191
Melano-macrophage aggregates were counted in ten optical fields at high magnification 192
(x400), and only more than 2 aggregates for ten optical fields were considered as an abnormal 193
accumulation. 194
195
1 2 3 4 5 6 7 8 9 10 11 12 13 14 15 16 17 18 19 20 21 22 23 24 25 26 27 28 29 30 31 32 33 34 35 36 37 38 39 40 41 42 43 44 45 46 47 48 49 50 51 52 53 54 55 56 57 58 59 60 61 62 63 64 65

9
2.5 DNA adduct analysis 196
The livers of 10 to 15 individuals were pooled, and high molecular weight DNA was 197
extracted using the chloroform/isoamyl alcohol method. Livers were homogenized in 0.8 mL 198
of a solution containing NaCl (0.1 M), EDTA (20 mM), and Tris-HCl, pH 8 (50 mM) (SET). 199
One hundred µL of SDS (20%) was added to the homogenate, and following incubation for 200
10 min at 65°C, 800 µL of potassium acetate (6M, pH5) was added. Then the reaction mixture 201
was kept at 0°C for 30 min. After centrifugation for 25 min at 0°C (10000g), the supernatant 202
was collected and its nucleic acid content was precipitated overnight at -20°C by adding 2 203
volumes of cold ethanol. DNA pellets were collected, washed once with 1mL of 90% ethanol 204
and dissolved in 500µL of SET (15 min at 37°C). The total extract was mixed with 10µL of a 205
mixture of RNase A (20 mg/mL) and RNase T1 (10 000 U/mL) and incubated for 1 h at 37 206
°C; this treatment was repeated twice. Samples were then treated with 20 mg/mL of 207
proteinase K for 1 h at 37 °C. After digestion, 500µL of Rotiphenol was added. The mixture 208
was then moderately shaken for 20 min at room temperature and centrifuged for 15min at 209
15°C (10000g). The aqueous phase was collected after two extractions. After a final 210
extraction with one volume of chloroform/isoamyl alcohol (24:1), the aqueous phase was 211
collected and 50µL of sodium acetate (3M, pH 6) was added. The DNA was precipitated by 212
the addition of two volumes of cold ethanol overnight at -20°C followed by centrifugation at 213
10000g for 30 min. The DNA pellet was washed four times with 90% ethanol. The purity of 214
the DNA was checked by recording UV spectra between 220 and 320 nm. 215
DNA adducts were measured using the 32
P-postlabeling method with Nuclease P1 treatment 216
as described by Reddy and Randerath (1986) with minor modifications as follow. DNA (4µg) 217
was digested at 37°C for 4h with micrococcal nuclease (500mU), spleen phosphodiesterase 218
(105mU) buffered with sodium succinate (200mM), and calcium chloride (100mM, pH 6). 219
The digested DNA was then treated with a mixture containing nuclease P1 (4mg/mL), ZnCl2 220
1 2 3 4 5 6 7 8 9 10 11 12 13 14 15 16 17 18 19 20 21 22 23 24 25 26 27 28 29 30 31 32 33 34 35 36 37 38 39 40 41 42 43 44 45 46 47 48 49 50 51 52 53 54 55 56 57 58 59 60 61 62 63 64 65

10
(1mM) and sodium acetate (0.5M, pH 5) at 37°C for 45min. The reaction was stopped by 221
adding 3 µL of Tris base. The DNA adducts were labeled as follows. Five µL of the reaction 222
mixture containing 2 µL of bicine buffer [Bicine (800 µM), dithiothreitol (400 mM), MgCl2 223
(400 mM), and spermidine (400 mM) adjusted to pH 9.8 with NaOH], 9.6U of polynucleotide 224
kinase T4, and 100 µCi of [32
P]ATP (specific activity 6000Ci/mmol) was added to the NP1 225
digest and incubated at 37°C for 45 min. Normal nucleotides, pyrophosphate, and excess ATP 226
were removed by chromatography on PEI/cellulose TLC plates in 2.3M NaH2PO4 buffer, pH 227
5.7, overnight. The origin areas containing labeled adducted nucleotides were cut out and 228
transferred to another PEI/cellulose TLC plate, which was run in 5.3M lithium formate and 229
8.5M urea (pH 3.5) for 3 h. A further migration was performed after turning the plate 90° 230
anticlockwise in 1 M LiCl, 0.5M Tris and 8M urea (pH 8) for 2 h. Finally, the chromatogram 231
was washed in the same direction in 1.7M NaH2PO4, pH 6, for 2 h (D4). Autoradiography 232
was carried out at -80 °C for 48 h in the presence of an intensifying screen. Radioactive spots 233
were detected by autoradiography on Kodak super X-Ray film. 234
Quantification of DNA adducts was obtained by storage phosphor imaging techniques. The 235
screens were scanned using a Typhoon 9210 (Amersham). The software program used to 236
process the data was ImageQuant (version 5.0). After background subtraction, the levels of 237
DNA adducts were expressed as relative adduct labeling (RAL) for 109 nucleotides. The 238
sensitivity of the method allows detection of B[a]P adduct as low as 0.1 nucleotide/ 1010
239
nucleotides. 240
241
2.6 Statistical analysis 242
All statistics were performed with the SAS System release 9.3 (SAS Institute Inc., Cary, NC, 243
USA). Categorical data was tested using a Fisher's exact test or a Cochran-Armitage trend 244
test. Bonferroni’s correction was applied for pairwise comparisons. The age and length 245
1 2 3 4 5 6 7 8 9 10 11 12 13 14 15 16 17 18 19 20 21 22 23 24 25 26 27 28 29 30 31 32 33 34 35 36 37 38 39 40 41 42 43 44 45 46 47 48 49 50 51 52 53 54 55 56 57 58 59 60 61 62 63 64 65
11
relationship was investigated using linear regressions (Proc reg). Logistic regressions were 246
used in order to elucidate the implication of period, season, sex or geographic localization on 247
histological responses (Proc logistic). A p-value below 0.05 was considered as significant. 248
249
3. Results 250
3.1 Age of the sampled fish 251
Age determination was performed by counting growth rings on otoliths from 87 flounders 252
collected in the Seine estuary. Most collected fish had one to four winters and only 3 out of 87 253
(3.4%) were much older (Figure 2). 254
In the first three years of fish life (2 winters), a clear age-dependent increase in total body 255
length was observed (Figure 2). For older fish (3 winters and more), body length was no more 256
related to age. In the present study, fish were ranked into four groups according to body 257
length and estimated age. Group 0 included fish up to 110 mm in length and less than one 258
year old. Group 1 included fish sized 115 up to 200 mm and aged from one to less than two 259
years old. Group 2 included individuals of 205 up to 300 mm and aged two to less than three 260
years old. Finally, group 3+ included all fish above 300 mm with an expected age of three 261
years and more. 262
The different groups were not equally distributed throughout the Seine estuary, with group 0 263
mainly located in the upper Seine estuary, group 1 in the upper and median estuary, group 2 in 264
the median and lower estuary, and finally group 3+ only represented in the lower estuary and 265
in the Seine bay. 266
None of the flounders sampled in the Bay of Veys and in the Ster estuary belonged to group 0. 267
Because of age-structure differences between the three flounder populations, 268
histopathological data from the Bay of Veys and Ster estuary were only used for inter-site 269
comparisons with the Seine estuary. 270
1 2 3 4 5 6 7 8 9 10 11 12 13 14 15 16 17 18 19 20 21 22 23 24 25 26 27 28 29 30 31 32 33 34 35 36 37 38 39 40 41 42 43 44 45 46 47 48 49 50 51 52 53 54 55 56 57 58 59 60 61 62 63 64 65
12
271
3.2 Description of flounder liver pathologies 272
The liver of the European flounder is composed of parenchymal cells (hepatic cells) and 273
clusters of pancreatic cells along the branches of the portal vein. A hepatic cell has a 274
polygonal body containing a clear spherical nucleus, usually with a single nucleolus. Large 275
quantities of lipids and glycogen are usually observed in the cytoplasm and cause the clear 276
vacuolar appearance of the cell. 277
Lesions, encountered during the liver pathology assessment were categorized into five main 278
items (Figure 3). 279
(i) Encysted parasites (mainly nematodes) are either surrounded by inflammatory cells, that 280
are mainly macrophages forming a granuloma, or only by a thin fibrous capsule (Figure 3A). 281
Depending on the sectioning level, the center of the granuloma and the causative parasite 282
were not always observable (Figure 3B). Less frequently, amoeba infections are associated 283
with ill-delineated foci of necrosis with an influx of macrophages (Figure 3D). 284
(ii) Inflammatory lesions are characterized by the accumulation of inflammatory cells 285
(lymphocytes and macrophages) mainly observed at the vicinity of major blood vessels. 286
Different grades of inflammations were observed, from a few accumulated melano-287
macrophage aggregates spread in the liver parenchyma to severe diffuse hepatitis. As the 288
melano-macrophage aggregates can occur under normal conditions in flounder as in other 289
fishes, only more than two aggregates for ten optical fields were considered as an abnormal 290
accumulation (Figure 3C). Diffuse inflammations were very rarely observed and all 291
inflammation types, except host reaction to parasites as described in (i), were jointly recorded. 292
(iii) Foci of necrosis and regeneration (FNR) were jointly recorded because they can both 293
result from cell death following parasitic infestation, bacterial or viral infection and exposure 294
to toxicants. Focal necrosis is characterized by small groups of hepatocytes exhibiting strong 295
1 2 3 4 5 6 7 8 9 10 11 12 13 14 15 16 17 18 19 20 21 22 23 24 25 26 27 28 29 30 31 32 33 34 35 36 37 38 39 40 41 42 43 44 45 46 47 48 49 50 51 52 53 54 55 56 57 58 59 60 61 62 63 64 65
13
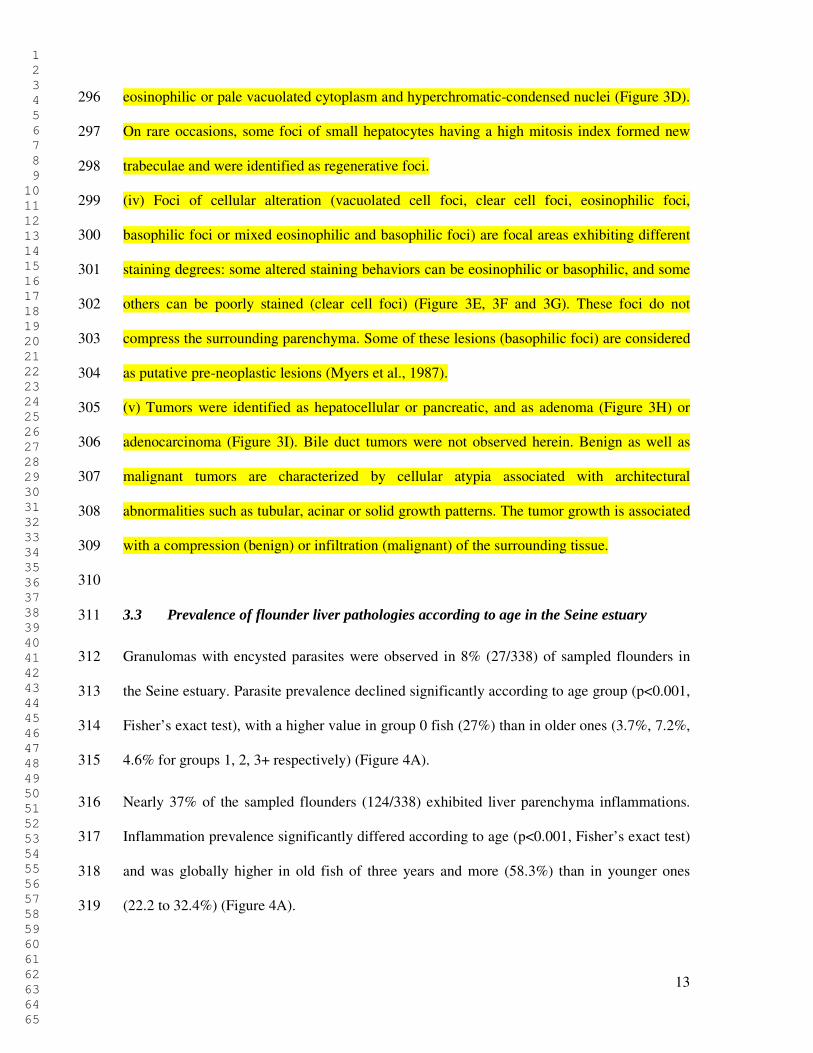
eosinophilic or pale vacuolated cytoplasm and hyperchromatic-condensed nuclei (Figure 3D). 296
On rare occasions, some foci of small hepatocytes having a high mitosis index formed new 297
trabeculae and were identified as regenerative foci. 298
(iv) Foci of cellular alteration (vacuolated cell foci, clear cell foci, eosinophilic foci, 299
basophilic foci or mixed eosinophilic and basophilic foci) are focal areas exhibiting different 300
staining degrees: some altered staining behaviors can be eosinophilic or basophilic, and some 301
others can be poorly stained (clear cell foci) (Figure 3E, 3F and 3G). These foci do not 302
compress the surrounding parenchyma. Some of these lesions (basophilic foci) are considered 303
as putative pre-neoplastic lesions (Myers et al., 1987). 304
(v) Tumors were identified as hepatocellular or pancreatic, and as adenoma (Figure 3H) or 305
adenocarcinoma (Figure 3I). Bile duct tumors were not observed herein. Benign as well as 306
malignant tumors are characterized by cellular atypia associated with architectural 307
abnormalities such as tubular, acinar or solid growth patterns. The tumor growth is associated 308
with a compression (benign) or infiltration (malignant) of the surrounding tissue. 309
310
3.3 Prevalence of flounder liver pathologies according to age in the Seine estuary 311
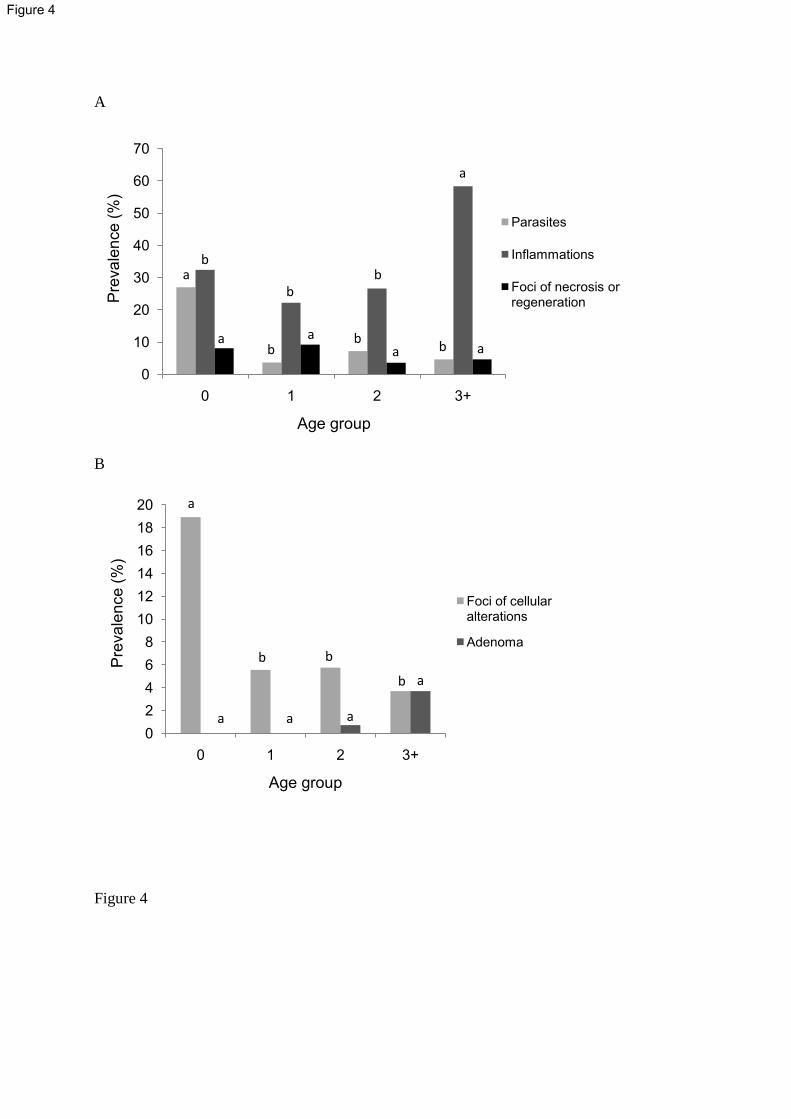
Granulomas with encysted parasites were observed in 8% (27/338) of sampled flounders in 312
the Seine estuary. Parasite prevalence declined significantly according to age group (p<0.001, 313
Fisher’s exact test), with a higher value in group 0 fish (27%) than in older ones (3.7%, 7.2%, 314
4.6% for groups 1, 2, 3+ respectively) (Figure 4A). 315
Nearly 37% of the sampled flounders (124/338) exhibited liver parenchyma inflammations. 316
Inflammation prevalence significantly differed according to age (p<0.001, Fisher’s exact test) 317
and was globally higher in old fish of three years and more (58.3%) than in younger ones 318
(22.2 to 32.4%) (Figure 4A). 319
1 2 3 4 5 6 7 8 9 10 11 12 13 14 15 16 17 18 19 20 21 22 23 24 25 26 27 28 29 30 31 32 33 34 35 36 37 38 39 40 41 42 43 44 45 46 47 48 49 50 51 52 53 54 55 56 57 58 59 60 61 62 63 64 65

14
Foci of necrosis and regeneration (FNR) were recorded in 5.3% (18/338) of the sampled 320
flounders. No significant difference was observed according to age group with prevalence 321
varying from 8.1% for group 0 to 4.6% for group 3+ (Figure 4A). 322
More than 6% (22/338) of all sampled flounders exhibited foci of cellular alteration (FCA). 323
FCA were observed in all groups but with significant prevalence differences according to fish 324
age (p<0.05, Fisher’s exact test). Indeed, FCA prevalence was at least three times higher in 325
group 0 (18.9%) than in other groups (5.6%, 5.8% and 3.7% for group 1, 2 and 3+ 326
respectively) (Figure 4B). 327
Hepatic tumors were recorded in 5 out of 338 flounders (1.5%). Adenoma occurrences were 328
recorded but no adenocarcinoma was observed. Although not significant, an increasing trend 329
of tumor prevalence was observed with age from 0% for age groups 0 and 1 to 0.7% and 3.7% 330
for groups 2 and 3+ respectively (Figure 4B). 331
332
3.4 Prevalence of flounder liver pathologies according to gender in the Seine estuary 333
Prevalence of parasitic infestations, inflammations and FNR did not vary significantly 334
according to sex (Figure 5A). Although the differences were not significant, FCA were 2.5 335
times more frequent in females (6.5%) than in males (2.6%) and tumors were only observed 336
in females (3.0%) (Figure 5B). Moreover, when FCA and tumors were scored together, 337
females appeared significantly more affected (9.5%) than males (2.6%) (p<0.05, Fisher’s 338
exact test). 339
340
3.5 Spatial distribution of flounder liver pathologies in the Seine estuary 341
Prevalence of parasitic infestation was significantly different (p<0.001, Fisher’s exact test) 342
according to the sampling sites (Table 2). Indeed, the infestation prevalence that was recorded 343
1 2 3 4 5 6 7 8 9 10 11 12 13 14 15 16 17 18 19 20 21 22 23 24 25 26 27 28 29 30 31 32 33 34 35 36 37 38 39 40 41 42 43 44 45 46 47 48 49 50 51 52 53 54 55 56 57 58 59 60 61 62 63 64 65

15
in flounders from the upper part of the Seine estuary (18.4%) was significantly higher than in 344
fish collected in the median Seine estuary (2.2%) or Antifer (2.3%). In contrast, prevalence of 345
inflammations, FNR and tumor did not show any spatial difference. Although FCA frequency 346
was particularly high in flounders from the upper Seine estuary (14.3%), no statistical 347
difference was observed between the different sampling sites. 348
349
3.6 Seasonal variations of flounder liver pathologies in the Seine estuary 350
Since flounders were sampled all the year round in the Seine estuary, it was possible to 351
analyze the seasonal variations of flounder liver pathologies. No significant seasonal variation 352
was observed for FCA, tumors, parasitic infestations and inflammations. Only FNR (p<0.05, 353
Fisher’s exact test) did show seasonal fluctuations (Figure 6A and 6B). In flounders from the 354
Seine estuary, FNR occurred more frequently in the summer (11.3%) than in spring (1.0%) 355
(Fisher’s exact test, p=0,004). 356
357
3.7 Temporal evolution of flounder liver pathologies in the Seine estuary 358
The epidemiological survey of liver pathologies was conducted for all the sampled sites, 359
except for the lower Seine estuary, over two distinct periods in 1996-1997 and four years later 360
in 2002-2003. Comparisons of liver pathology profiles between the two sampling periods 361
showed significant differences, including for the 2002-2003 period, a 4-fold increase in 362
parasitic infestations (p<0.01, Fisher’s exact test), a 2-fold increase in inflammations 363
(p<0.001, Fisher’s exact test) and a 5-fold increase in FCA (p<0.01, Fisher’s exact test) 364
(Figure 7A and 7B). In contrast, FNR occurrence did not vary significantly over the two 365
sampling periods (p≥0.05, Fisher’s exact test). For tumor prevalence, the temporal decrease 366
1 2 3 4 5 6 7 8 9 10 11 12 13 14 15 16 17 18 19 20 21 22 23 24 25 26 27 28 29 30 31 32 33 34 35 36 37 38 39 40 41 42 43 44 45 46 47 48 49 50 51 52 53 54 55 56 57 58 59 60 61 62 63 64 65
16
was almost significant (p=0.06, Fisher’s exact test) with 3.4% of flounders exhibiting liver 367
tumors in 1996-1997 versus 0% in 2002-2003 (Figure 7B). 368
369
3.8 Comparison of liver pathologies between flounder populations from the three studied 370
estuaries 371
Flounders were sampled over the same period in three estuaries along the French Atlantic 372
coast. An attempt was made to compare the profiles of liver pathologies between the three 373
flounder populations (Table 3). Since the age structure was different in the three studied 374
populations with an underrepresentation of younger fish in the Bay of Veys and Ster estuary, 375
only adult fish of more than 200mm (groups 2 and 3+) were selected for this analysis. 376
Prevalence of parasitic infestations and inflammations was significantly different between the 377
three flounder populations (p<0.001, Fisher’s exact test in both cases). When recorded 378
together, tumors and FCA occurrence was also almost significantly different between 379
estuaries (p=0.053, Fisher’s exact test). Prevalence of infestations was significantly higher 380
(p<0.001) in the Ster estuary (37.6%) in comparison to the Seine estuary (5.8%) and the Bay 381
of Veys (6.5%). Flounders from the Ster and the Seine populations were more prone (p<0.01) 382
to liver inflammations (51.8% and 40.3% respectively) than individuals from the Bay of Veys 383
(15.2%) (Table 3). Flounders from the Ster and the Seine estuaries in contrast to those from 384
the Bay of Veys exhibited FCA (9.4% and 4.9%, respectively) and tumors (1.2 and 2.1% 385
respectively). For FNR occurrence, no significant difference was noted for the three studied 386
populations. 387
388
3.9 Relationship between the different flounder liver pathologies 389
1 2 3 4 5 6 7 8 9 10 11 12 13 14 15 16 17 18 19 20 21 22 23 24 25 26 27 28 29 30 31 32 33 34 35 36 37 38 39 40 41 42 43 44 45 46 47 48 49 50 51 52 53 54 55 56 57 58 59 60 61 62 63 64 65
17
A strong positive correlation between parasitic infection and inflammation (p<0.001, Fisher’s 390
exact test) and a negative correlation between inflammation and FNR (p<0.001, Fisher’ exact 391
test) were observed. In fact 89% of fish from the Seine estuary bearing encysted parasites also 392
exhibited liver inflammation while only 25% of fish with FNR also showed inflammation. In 393
contrast, no obvious relationship was noted between the other liver lesions. 394
395
3.10 DNA adducts in flounder liver 396
DNA adducts were measured using the 32
P-postlabelling technique from pooled livers of 397
flounders collected in September 1996 in the Seine estuary and in April 1997 in the Bay of 398
Veys. Due to insufficient data available (two DNA adduct analyses per site), statistical 399
analysis could not be performed. Nevertheless some spatial trends could be observed. Firstly, 400
the total number of DNA adducts varied greatly from 21.1±8.0 RAL/109 nucleotides in the 401
Bay of Veys to 149±38.5 RAP/109
nucleotides in the upper Seine estuary (Figure 8). 402
Secondly, the DNA adduct profiles were totally different in the Seine estuary and in the Bay 403
of Veys. The total number of individual spots per site varied from 4 up to 13 in the Seine 404
estuary, and reached 43 in the Bay of Veys (Data not shown). In addition, amongst the 43 405
individual spots detected in the fish from the Bay of Veys, only 18 (42%) were shared with 406
flounders from the Seine estuary. Finally, most of the adducts (65 to 82% of RAL) detected in 407
flounders from the Seine estuary were located within the diagonal radioactive zone (DRZ) 408
(Figure 9) while all the DNA adducts detected in flounders from the Bay of Veys were 409
located outside the DRZ (Data not shown). 410
Some spatial trends can also be noted for the Seine estuary. A 10-fold decrease of total DNA 411
adducts in fish liver was observed between the upper Seine estuary and Antifer (Figure 8). 412
The total number of individual adducts declined from 13 spots in the upper Seine estuary to 4 413
1 2 3 4 5 6 7 8 9 10 11 12 13 14 15 16 17 18 19 20 21 22 23 24 25 26 27 28 29 30 31 32 33 34 35 36 37 38 39 40 41 42 43 44 45 46 47 48 49 50 51 52 53 54 55 56 57 58 59 60 61 62 63 64 65

18
spots in the lower estuary and in Antifer, and no DRZ DNA adducts was detected in Antifer 414
(Figure 9). 415
416
4 Discussion 417
In the present paper, pattern and occurrence of liver pathologies were investigated in 418
European flounders from the Seine estuary and from two other reference estuaries on the 419
French Atlantic coast. Implications of various biotic (age, sex) and abiotic (year, season, 420
location) factors in the onset of the different liver pathologies were investigated. Liver DNA 421
adduct levels were also measured to evaluate fish exposure to genotoxic pollutants. 422
423
4.1 Infectious and parasitic diseases 424
The most prevalent lesion type was inflammation of liver parenchyma, observed in nearly 425
37% of the sampled fish. Inflammation foci and melano-macrophage aggregates were jointly 426
recorded. Both lesions can be induced by multiple stress factors, including at least infectious 427
and parasitic diseases and toxicant exposure (Wolf and Wolfe, 2005). This lesion type was 428
more frequent in older fish but no sex-specific difference was observed. Vethaak and Wester 429
did not show any relationship with fish gender or age (Vethaak and Wester, 1996). This 430
apparent discrepancy could at least partially be explained by the fact that in the latter study 431
only fish with a total length of 200mm or more, i.e. only fish of two winters or more were 432
examined (Vethaak and Wester, 1996). In the present study, inflammations were slightly more 433
frequently observed in late winter. Wethaak and Wester (1996) reported the same pattern with 434
a higher occurrence of inflammatory lesions, including parasitic cysts, at the end of winter in 435
flounders captured in spawning grounds. The authors hypothesized that poor conditions and 436
spawning stress could favor bacterial and/or parasite infections. 437
1 2 3 4 5 6 7 8 9 10 11 12 13 14 15 16 17 18 19 20 21 22 23 24 25 26 27 28 29 30 31 32 33 34 35 36 37 38 39 40 41 42 43 44 45 46 47 48 49 50 51 52 53 54 55 56 57 58 59 60 61 62 63 64 65
19
A clear site-specific profile was also reported with a higher prevalence of inflammatory 438
lesions in individuals from the Ster estuary than in those from the Seine estuary or the Bay of 439
Veys. Previous studies had already documented considerable variations of inflammation 440
occurrence according to geographical area and sampling period from about 12% in Dutch 441
coastal and estuarine waters (Vethaak and Wester, 1996) to 30% in coastal areas of the Baltic 442
sea (Lang et al., 2006) (Table 4). 443
The second most prevalent lesion type was the encysted parasite lesion observed in 13% of all 444
sampled flounders (8% in the Seine estuary). Only a few studies have reported parasitic cysts 445
in flounder liver (Vethaak, 1992; Vethaak and Wester, 1996; Lang et al., 2006; Dezfuli et al., 446
2007). At least one larval and five adult nematode species have already been identified in 447
flounders (El-Darsh and Whitfield, 1999). In contrast to inflammatory lesions, parasitic cysts 448
occurred with a higher prevalence in flounders of group 0. This feature could putatively be 449
explained by an age-dependent sensitivity of European flounder to nematode infestation and 450
also by heterogeneous spatial distribution of the parasite in favor of the oligohaline or 451
mesohaline part of the estuary. Significant spatial and temporal differences were also 452
evidenced with a similar distribution pattern to that of liver inflammations. Indeed, prevalence 453
of parasitic cysts was higher in the Ster estuary than in the Seine estuary or the Bay of Veys. 454
Moreover, encysted parasite prevalence was slightly higher in flounders collected in late 455
winter. 456
The higher frequency of inflammatory lesions and parasitic cysts in the flounder population 457
inhabiting the Ster is probably not related to a significant chemical stress because pollutant 458
inputs in this estuary are low (Marchand et al., 2003,2004). This result could more likely be 459
explained by the localization of this estuary in the southern part of the flounder distribution 460
area and by a possible thermal stress. This thermal stress could directly affect the immune 461
system or the global health condition of the fish, leading to an increased sensitivity to 462
1 2 3 4 5 6 7 8 9 10 11 12 13 14 15 16 17 18 19 20 21 22 23 24 25 26 27 28 29 30 31 32 33 34 35 36 37 38 39 40 41 42 43 44 45 46 47 48 49 50 51 52 53 54 55 56 57 58 59 60 61 62 63 64 65
20
infectious agents or parasites. It is noteworthy that relatively high frequencies of flounder 463
liver lesions were detected in the Gulf of Biscay, as compared to English coasts and the North 464
Sea (Laroche et al., 2012). 465
466
4.2 Toxicopathic liver lesions 467
Necrosis and regeneration foci were observed in 4.2% of the sampled fish (5.3% in the Seine 468
estuary). No significant difference according to age or gender was observed. This lesion type 469
did not show any significant inter-site variations within the Seine estuary or between the three 470
studied estuaries. In contrast, a clear seasonality was observed with a drastic increase in FNR 471
prevalence in the summer. Seasonal variations of hepatocellular necrosis have already been 472
documented for winter flounders (Pleuronectes americanus) sampled along the US Northeast 473
coast (Johnson et al., 1993). Numerous man-made chemicals are known to induce necrotic 474
lesions in the liver of fish but naturally-occurring toxins such as microcystins can also be 475
potent hepatotoxic agents (Wolf and Wolfe, 2005). It was recently documented that blooms of 476
the cyanobacteria Microcystis aeruginosa producing the microcystin-LR can occur in 477
estuarine waters in the summer time when surface water temperature is high and the stream 478
flow is low (Lehman et al., 2008). Therefore it cannot be ruled out that the higher occurrence 479
of FNR in the liver of flounders in the summer time could not be due to cyanobacterial 480
blooms. 481
Liver tumors and FCA were observed in 1.3% and 6.3% of all sampled fish respectively (1.5 482
and 6.5% in the Seine estuary respectively). Tumors were restricted to females aged two years 483
and more. The differential sensitivity of male and female flounders as regards liver tumors has 484
already been reported (Koehler, 2004; Vethaak and Wester, 1996). Exposure to carcinogens 485
likely takes place early in the life of flounders when larvae migrate to their estuarine habitats 486
(Koehler, 2004). Since all the collected individuals live in the same habitat and feed on the 487
1 2 3 4 5 6 7 8 9 10 11 12 13 14 15 16 17 18 19 20 21 22 23 24 25 26 27 28 29 30 31 32 33 34 35 36 37 38 39 40 41 42 43 44 45 46 47 48 49 50 51 52 53 54 55 56 57 58 59 60 61 62 63 64 65

21
same preys, they are likely exposed to the similar cocktail of carcinogens. Koehler proposed 488
that endogenous factors such as estrogen overproduction during vitellogenesis may explain 489
the higher susceptibility of female flounder to develop liver cancer. Indeed, tumor promotion 490
activity of 17-β-oestradiol had already been demonstrated in several fish species (Nunez et al., 491
1989, Cooke and Hinton, 1999). 492
In the present study, adenoma was the predominant tumor type (1.0%) while adenocarcinoma 493
was only observed in a single flounder (0.2%). In fact, flounders bearing malignant tumors are 494
rarely observed in the field (Vethaak and Wester, 1996) likely because of quick death or 495
predation of sick individuals. Tumors and FCA were recorded at similar occurrences in the 496
liver of flounders inhabiting the Seine estuary as well as other estuaries, and coastal areas in 497
the North Sea and Baltic Sea (Table 4). Prevalence was somewhat higher along the German 498
coast and particularly in the Elbe estuary but only fish over 180 mm were analyzed (Koehler, 499
2004). It is noteworthy that FCA prevalence in flounders from the Seine estuary was recorded 500
at a higher level in group 0 than in the other age groups. Interestingly, Amara and 501
collaborators (2009) have also reported lower growth (daily otolith increments) and condition 502
factor (Fulton’s K) for group 0 flounders from the Seine estuary in comparison to those 503
collected in two clean estuaries of the Eastern English Channel. Group 0 flounders are 504
predominantly located in the oligohaline part of the Seine estuary. It was previously 505
documented that sediments from this area were genotoxic resulting at least partially from a 506
high content of mutagenic and carcinogenic PAHs (Cachot et al., 2006). It was also 507
demonstrated that embryos of Japanese medaka exposed to an organic extract of sediment 508
from the upper Seine estuary had an increased mutation rate and developed FCA and 509
neoplasms (Cachot et al., 2007). 510
In the present work, DNA adducts were measured at high levels in the liver of juvenile 511
flounders inhabiting the upper Seine estuary. In addition, the majority of those DNA adducts 512
1 2 3 4 5 6 7 8 9 10 11 12 13 14 15 16 17 18 19 20 21 22 23 24 25 26 27 28 29 30 31 32 33 34 35 36 37 38 39 40 41 42 43 44 45 46 47 48 49 50 51 52 53 54 55 56 57 58 59 60 61 62 63 64 65
22
were located in the DRZ. Several authors have reported that DRZ-related DNA adducts are 513
mainly induced by hydrophobic hydrocarbons including polyaromatic hydrocarbon 514
metabolites (Varanasi et al., 1989; Lyons et al., 1999; 2004). Indeed, DRZ-related DNA 515
adducts have been detected in the liver of fish exposed in controlled laboratory conditions to 516
various hydrophobic genotoxicants, including PAHs (Varanasi et al., 1989; Malmström et al., 517
2000), and numerous field studies have documented a positive relationship between pollutant 518
exposure, notably to PAHs, and DNA adduct levels in fish liver (Varanasi et al., 1989; 519
Ericson et al., 1998; Rose et al., 2000; Shaw and Connell, 2001; Aas et al., 2001; Myers et al., 520
2003). DNA adducts are currently considered as good molecular dosimeters of carcinogenic 521
exposure (Shaw and Connell, 2001) and experimental data supports the role of DNA adducts 522
in the initiation of chemical carcinogenesis (Miller and Miller, 1981). 523
It is thus tempting to build a scenario of exposure for flounders dwelling in the Seine estuary. 524
Juveniles, during their first year of life in the upper Seine estuary, are directly exposed to pro-525
genotoxic and carcinogenic pollutants such as PAHs originating from contaminated sediments 526
and benthic preys. Chronic exposure to these compounds induces DNA damage and cytotoxic 527
effects which in turn, trigger structural changes in liver parenchyma, including inflammations, 528
necrosis and FCA. Since tumor development is a long lasting process, liver tumors appear 529
much later (at least two years later) when fish migrate to their marine habitat. Vethaak and 530
collaborators demonstrated through a 3-year mesocosm experiment with flounder juveniles 531
exposed to a contaminated dredged spoil that at least 30 months is needed for hepatocellular 532
adenoma development while FCA can emerge within 6 to 12 months (Vethaak et al., 1996). 533
From this study several conclusions can be drawn regarding the use of flounder as a sentinel 534
species for pollution monitoring in estuarine ecosystems. (i) Flounder juveniles settle in 535
estuaries just after metamorphosis and spend at least their first year of life there. (ii) Group 0 536
flounders exhibit a high susceptibility to pollutants, which was revealed in the present study 537
1 2 3 4 5 6 7 8 9 10 11 12 13 14 15 16 17 18 19 20 21 22 23 24 25 26 27 28 29 30 31 32 33 34 35 36 37 38 39 40 41 42 43 44 45 46 47 48 49 50 51 52 53 54 55 56 57 58 59 60 61 62 63 64 65
23
by DNA adduct induction and the development of toxicopathic liver lesions including 538
necrosis and FCA. (iii) Tumor development is a long lasting process which does not allow 539
reliable measurement of site-specific pollution. Therefore, the measurement of biochemical 540
and histological markers in flounders from group 0 could represent a valuable approach for 541
pollution biomonitoring and fish health assessment in estuarine areas. 542
543
4.3 Conclusion 544
It was demonstrated herein that flounder liver lesions show high spatial and temporal 545
variations which can be related to various biotic (age, sex, etc.) and abiotic (season, location, 546
pollution, etc.) risk factors. Interestingly, group 0 flounders inhabiting the upper Seine estuary 547
faced a higher prevalence of encysted parasites, and foci of cellular alteration than older ones 548
living in the lower part of the Seine estuary. This result likely reflects differences in the 549
sensitivity of flounders to parasites, pathogens and chemicals, according to age, but also 550
different levels of stress according to season and location. Because of their high sensitivity to 551
multiple stress factors and to their first-year of growth exclusively in estuarine waters, 552
European flounders from group 0 represent valuable bio-indicators for pollution and fish 553
population health monitoring in estuarine ecosystems. 554
555
Acknowledgments 556
This study was supported by the Agence de l’Eau Seine-Normandie, the Seine-Aval program 557
and Ifremer. Authors would like to thank the Cellule du Suivi du Littoral Haut Normand 558
(CSLHN, Le Havre) and the crews from the oceanographic vessels Gwen Drez (Ifremer) and 559
Esturial (Irstea) for their technical assistance in fish collection. 560
561
1 2 3 4 5 6 7 8 9 10 11 12 13 14 15 16 17 18 19 20 21 22 23 24 25 26 27 28 29 30 31 32 33 34 35 36 37 38 39 40 41 42 43 44 45 46 47 48 49 50 51 52 53 54 55 56 57 58 59 60 61 62 63 64 65
24
References 562
Aas E, Beyer J, Jonsson G, Reichert WL, Andersen OK (2001) Evidence of uptake, 563
biotransformation and DNA binding of polyaromatic hydrocarbons in Atlantic cod and 564
corkwing wrasse caught in the vicinity of an aluminium works. Mar Environ Res 52: 213-229 565
Amara R, Selleslagh J, Billon G, Minier C (2009) Growth and condition of 0-group European 566
flounder, Platichthys flesus as indicator of estuarine habitat quality. Hydrobiologia 627: 87-98 567
Amat A, Burgeot T, Castegnaro M, Pfohl-Leszkowicz A (2006) DNA adducts in fish 568
following an oil spill exposure Environ Chem Lett 4: 93-99 569
Beck MW, Heck KL, Jr Able KW, Childers DL, Eggleston DB, Gillanders BM, Halpern B, 570
Hays CG, Hoshino K, Minello TJ, Orth RJ, Sheridan PF, Weinstein MP (2001) The 571
identification, conservation, and management of estuarine and marine nurseries for fish and 572
invertebrates. BioScience 51: 633-641 573
Benejam L, Benito J, García-Berthou E (2010) Decreases in condition and fecundity of 574
freshwater fishes in a highly polluted reservoir. Wat Air Soil Poll 210: 231-242 575
Bogovski S, Lang T, Mellergaard S (1999) Histopathological examinations of liver nodules in 576
flounder (Platichthys flesus L.) from the Baltic Sea. ICES J Mar Sci 56: 148-151 577
Brooks ML, Fleishman E, Brown LR, Lehman PW, Werner I, Scholz N, Mitchelmore C, 578
Lovvorn JR, Johnson, ML, Schlenk D, van Drunick S, Drever, JI, Stoms DM, Parker AE, 579
Dugdale R (2012) Life histories, salinity zones, and sublethal contributions of contaminants to 580
pelagic fish declines illustrated with a case study of San Francisco Estuary, California, USA. 581
Estuaries Coasts 35: 603-621 582
Cachot J, Geffard O, Augagneur S, Lacroix S, Le Menach K, Peluhet L, Couteau J, Denier X, 583
Devier MH, Pottier D, Budzinski H (2006) Evidence of genotoxicity related to high PAH 584
1 2 3 4 5 6 7 8 9 10 11 12 13 14 15 16 17 18 19 20 21 22 23 24 25 26 27 28 29 30 31 32 33 34 35 36 37 38 39 40 41 42 43 44 45 46 47 48 49 50 51 52 53 54 55 56 57 58 59 60 61 62 63 64 65

25
content of sediments in the upper part of the Seine estuary (Normandy, France). Aquat 585
Toxicol 79: 257-267 586
Cachot J, Law M, Pottier D, Peluhet L, Norris M, Budzinski H, Winn R (2007) 587
Characterization of toxic effects of sediment-associated organic pollutants using the λ 588
transgenic medaka. Environ Sci Technol 41: 7830-7836 589
Cailleaud K, Forget-Leray, J, Souissi S, Hilde D, LeMenach K, Budzinski H (2007) Seasonal 590
variations of hydrophobic organic contaminant concentrations in the water-column of the 591
Seine Estuary and their transfer to a planktonic species Eurytemora affinis (Calanoïda, 592
copepoda). Part 1: PCBs and PAHs. Chemosphere 70 : 270-280 593
Cailleaud K, Forget-Leray J, Peluhet L, LeMenach K, Souissi S, Budzinski H (2009) Tidal 594
influence on the distribution of hydrophobic organic contaminants in the Seine Estuary and 595
biomarker responses on the copepod Eurytemora affinis. Environ Poll 157 : 64-71. 596
Cooke JB, Hinton DE (1999) Promotion by 17β-estradiol and β-hexachlorocyclohexane of 597
hepatocellular tumors in medaka, Oryzias latipes. Aquat Toxicol 45: 127-145 598
Dezfuli BS, Pironi F, Shinn AP, Manera M, Giari L (2007) Histopathology and ultrastructure 599
of Platichthys flesus naturally infected with Anisakis simplex s.l. larvae (Nematoda: 600
Anisakidae). J Parasitol 93: 1416-1423 601
El-Darsh HEM, Whitfield, PJ (1999) The parasite community infecting flounders, Platichthys 602
flesus, in the tidal Thames. J Helminthol 73 : 203-214 603
Ericson G, Lindesjöö E, Balk L (1998) DNA adducts and histopathological lesions in perch 604
(Perca fluviatilis) and northern pike (Esox lucius) along a polycyclic aromatic hydrocarbon 605
gradient on the Swedish coastline of the Baltic sea. Can J Fish Aquat Sci 55: 815-824 606
1 2 3 4 5 6 7 8 9 10 11 12 13 14 15 16 17 18 19 20 21 22 23 24 25 26 27 28 29 30 31 32 33 34 35 36 37 38 39 40 41 42 43 44 45 46 47 48 49 50 51 52 53 54 55 56 57 58 59 60 61 62 63 64 65
26
Feist SW, Lang T, Stentiford GD, Köhler A (2004) Biological effects of contaminants: Use of 607
liver pathology of the European flatfish dab (Limanda limanda L.) and flounder (Platichthys 608
flesus L.) for monitoring. ICES Techniques in Marine Environmental Sciences 38 609
Gilliers C, Le Pape O, Désaunay Y, Morin J, Guérault D, Amara R (2006) Are growth and 610
density quantitative indicators of essential fish habitat quality? An application to the common 611
sole Solea solea nursery grounds. Est. Coast Shelf Sci 69: 96-106 612
Harmon SM, Wiley FE (2011) Effects of pollution on freshwater organisms. Wat Environ Res 613
83: 1733-1788 614
Harris JRW, Cleary JJ, Valkirs AO (1996) Particle-water partitioning and the role of 615
sediments as a sink and secondary source of TBT : In : Champ MA, Seligman PF (Eds) 616
Organtin. Environmental fate and effects. Chapman & Hall, London, pp 459-474 617
Harshbarger JC, Clark JB (1990) Epizootiology of neoplasms in bony fish of North America. 618
Sci Total Environ 94: 1-32 619
Hinton DE, Segner H, Braunbeck T (2001) Toxic responses of the liver. In : Schlenk D, 620
Bensen WH (Eds.) Toxicity in marine and freshwater teleosts, Vol 1. Taylor and Francis, 621
London, pp 224-268 622
Hinrichsen D (1998) In : Hinrichsen D (Ed.) Coastal waters of the world. Trends, threats and 623
strategies. Island Press, Washington DC 624
Johnson LL, Stehr CM, Olson OP, Myers MS, Pierce SP, Wigren CA, McCain BB, Varanasi 625
U (1993) Chemical contaminants and hepatic lesions in winter flounder (Pleuronectes 626
americanus) from the Northeast Coast of the United States. Environ Sci Technol 27: 2759-627
2771 628
Koehler A (2004) The gender-specific risk to liver toxicity and cancer of flounder 629
(Platichthys flesus L.) at the German Wadden Sea coast. Aquat Toxicol 70: 257-276 630
1 2 3 4 5 6 7 8 9 10 11 12 13 14 15 16 17 18 19 20 21 22 23 24 25 26 27 28 29 30 31 32 33 34 35 36 37 38 39 40 41 42 43 44 45 46 47 48 49 50 51 52 53 54 55 56 57 58 59 60 61 62 63 64 65

27
Lang T, Wosniok W, Baršiene J, Broeg K, Kopecka J, Parkkonen J (2006) Liver 631
histopathology in Baltic flounder (Platichthys flesus) as indicator of biological effects of 632
contaminants. Mar Pol Bull 53: 488-496 633
Laroche J, Gauthier O, Quiniou L, Devaux A, Bony S, Evrard E, Cachot J, Cherel Y, Larcher 634
T, Riso R, Pichereau V, Devier M-H, Budzinski H (2012) Variation patterns in individual fish 635
responses to chemical stress among estuaries, seasons and genders: the case of the European 636
flounder (Platichthys flesus) in the Bay of Biscay. Environ Sci Pol Res, this issue. 637
Lehman PW, Boyer G, Satchwell M, Waller S (2008) The influence of environmental 638
conditions on the seasonal variation of Microcystis cell density and microcystins 639
concentration in San Francisco Estuary. Hydrobiologia 600: 187-204 640
Lyons BP, Stewart C, Kirby MF (1999) The detection of biomarkers of genotoxin exposure in 641
the European flounder (Platichthys flesus) collected from the River Tyne Estuary. Mutat Res 642
– Genet Toxicol Environ Mutagen 446 : 111-119 643
Lyons BP, Stentiford GD, Green M, Bignell J, Bateman K, Feist SW, Goodsir F, Reynolds 644
WJ, Thain JE (2004) DNA adduct analysis and histopathological biomarkers in European 645
flounder (Platichthys flesus) sampled from UK estuaries. Mutat Res - Fund Mol Mecha 646
Mutagen 552: 177-186 647
Malmström CM, Miettinen S, Bylund G (2000) DNA adducts in liver and leukocytes of 648
flounder (Platichthys flesus) experimentally exposed to benzo[a]pyrene. Aquat Toxicol 48: 649
177-184 650
Marchand J, Tanguy A, Laroche J, Quiniou L, Moraga, D (2003) Responses of European 651
flounder Platichthys flesus populations to contamination in different estuaries along the 652
Atlantic coast of France. Mar Ecol Prog Ser 260: 273-284 653
1 2 3 4 5 6 7 8 9 10 11 12 13 14 15 16 17 18 19 20 21 22 23 24 25 26 27 28 29 30 31 32 33 34 35 36 37 38 39 40 41 42 43 44 45 46 47 48 49 50 51 52 53 54 55 56 57 58 59 60 61 62 63 64 65

28
Marchand J, Quiniou L, Riso R, Thebaut M-T, Laroche J (2004) Physiological cost of 654
tolerance to toxicants in the European flounder Platichthys flesus, along the French Atlantic 655
Coast. Aquat Toxicol 70: 327-343 656
Mearns AJ, Reish DJ, Oshida PS, Ginn T, Rempel-Hester MA (2011) Effects of pollution on 657
marine organisms. Wat Environ Res 83: 1789-1852 658
Miller EC, Miller JA (1981). Mechanisms of chemical carcinogenesis. Cancer Res 47: 1055-659
1064. 660
Minier C, Abarnou A, Jaouen-Madoulet A, Le Guellec A-M, Tutundjian R, Bocquené, G, 661
Leboulenger F (2006) A pollution-monitoring pilot study involving contaminant and 662
biomarker measurements in the Seine Estuary, France, using zebra mussels (Dreissena 663
polymorpha). Environ Toxicol Chem 25: 112-119. 664
Myers MS, Rhodes LD, McCain BB (1987) Pathologic anatomy and patterns of occurrence of 665
hepatic neoplasms, putative preneoplastic lesions, and other idiopathic hepatic conditions in 666
English sole (Parophrys vetulus) from Puget Sound, Washington. J Natl Cancer Inst 78: 333-667
363 668
Myers MS, Johnson LL, Olson OP, Stehr CM, Horness BH, Collier TK, Mccain BB (1998) 669
Toxicopathic hepatic lesions as biomarkers of chemical contaminant exposure and effects in 670
marine bottom fish species from the Northeast and Pacific Coasts, USA. Mar Poll Bull 37: 92-671
113 672
Myers MS, Johnson LL, Collier TK (2003) Establishing the causal relationship between 673
polycyclic aromatic hydrocarbon (PAH) exposure and hepatic neoplasms and neoplasia-674
related liver lesions in English sole (Pleuronectes vetulus). Human and Ecological Risk 675
Assessment 9 : 67-94 676
1 2 3 4 5 6 7 8 9 10 11 12 13 14 15 16 17 18 19 20 21 22 23 24 25 26 27 28 29 30 31 32 33 34 35 36 37 38 39 40 41 42 43 44 45 46 47 48 49 50 51 52 53 54 55 56 57 58 59 60 61 62 63 64 65
29
Nunez O, Hendricks JD, Arbogast DN, Fong AT, Lee BC Bailey GS, (1989) Promotion of 677
aflatoxin B1 hepatocarcinogenesis in rainbow trout by 17-β-estradiol. Aquat Toxicol 15, 289-678
302 679
Reddy MV, Randerath K (1986) Nuclease P1-mediated enhancement of sensitivity of 32
P-680
postlabeling test for structurally diverse DNA adducts. Carcinogenesis 7:1543-51. 681
Rocher B, Le Goff J, Briand M, Manduzio H, Peluhet L, Gallois J, Devier M-H, Gricourt L, 682
Augagneur S, Budzinski H, Pottier D, Andrée V, Lebailly P, Cachot J (2006) Genotoxicant 683
accumulation and cellular defence activation in bivalves chronically exposed to waterborne 684
contaminants from the Seine River. Aquat Toxicol 79: 65-77 685
Rose WL, French BL, Reichert WL, Faisal M (2000) DNA adducts in hematopoietic tissues 686
and blood of the mummichog (Fundulus heteroclitus) from a creosote-contaminated site in 687
the Elizabeth River, Virginia. Mar Environ Res 50: 581-589 688
SGIMC (2011) Report of the Joint ICES/OSPAR Study Group on Integrated Monitoring of 689
Contaminants and Biological Effects (SGIMC). 14-18 march 2011. Copenhaguen , Denmark, 690
ICES Advisory Committee: ICES CM 2011/ACOM:30. 691
Shaw GR, Connell DW (2001) DNA adducts as a biomarker of polycyclic aromatic 692
hydrocarbon exposure in aquatic organisms: Relationship to carcinogenicity. Biomarkers 6: 693
64-71 694
Stentiford GD, Longshaw M, Lyons BP, Jones G, Green M, Feist SW (2003) 695
Histopathological biomarkers in estuarine fish species for the assessment of biological effects 696
of contaminants. Mar Environ Res 55: 137-159 697
Varanasi U, Reichert WL, Stein JE (1989) 32
P-postlabeling analysis of DNA adducts in liver 698
of wild English sole (Parophrys vetulus) and winter flounder (Pseudopleuronectes 699
americanus). Cancer Res 49: 1171-1177 700
1 2 3 4 5 6 7 8 9 10 11 12 13 14 15 16 17 18 19 20 21 22 23 24 25 26 27 28 29 30 31 32 33 34 35 36 37 38 39 40 41 42 43 44 45 46 47 48 49 50 51 52 53 54 55 56 57 58 59 60 61 62 63 64 65
30
Vethaak AD (1992) Diseases of flounder (Platichthys flesus L.) in the Dutch Wadden Sea, 701
and their relation to stress factors. Neth J Sea Res 29: 257-272 702
Vetkaak AD, Wester PW (1996) Diseases of flounder Platichthys flesus in Dutch coastal and 703
estuarine waters, with particular reference to environmental stress factors. II. Liver 704
histopathology. Dis Aqua Org 26: 99-116 705
Vethaak AD, Jol JG, Meijboom A, Eggens ML, Rheinallt TA, Wester PW, Van De Zande T, 706
Bergman A, Dankers N, Ariese F, Baan, RA, Everts, JM, Opperhuizen A, Marquenie JM 707
(1996) Skin and liver diseases induced in flounder (Platichthys flesus) after longterm 708
exposure to contaminated sediments in large-scale mesocosms. Environ Health Perspect 104: 709
1218-1229 710
Vethaak AD, Jol JG, Martinez-Gomez C (2011) Effects of cumulative stress on fish health 711
near freshwater outlet sluices into the Sea : a case study (1988-2005) with evidence for a 712
contributing role of chemical contaminants. Integrat Environ Ass Manag 7: 445-458 713
Williams TD, Turan N, Diab AM, Wu H, Mackenzie C, Bartie KL, Hrydziuszko O, Lyons 714
BP, Stentiford Grant D, Herbert JM, Abraham JK, Katsiadaki I., Leaver MJ, Taggart JB, 715
George SG, Viant MR, Chipman KJ, Falcian F (2011) Towards a System Level 716
Understanding of Non-Model Organisms Sampled from the Environment: A Network 717
Biology Approach. PLoS Comput Biol 7: 1-20 718
Wolf J, Wolfe MJ (2005) A brief overview of nonneoplastic hepatic toxicity in fish. Toxicol 719
Pathol 33: 75-85. 720
721
Figure captions 722
1 2 3 4 5 6 7 8 9 10 11 12 13 14 15 16 17 18 19 20 21 22 23 24 25 26 27 28 29 30 31 32 33 34 35 36 37 38 39 40 41 42 43 44 45 46 47 48 49 50 51 52 53 54 55 56 57 58 59 60 61 62 63 64 65

31
Figure 1: Maps showing the geographical position of the different sampling sites. Localization 723
of the three sampled estuaries (A) and the different sampling areas within the Seine estuary 724
(B). 725
Figure 2: Age-length relationship for European flounder specimens collected in the Seine 726
estuary. 727
Figure 3: Histological presentation of European flounder liver lesions. The liver is composed 728
of parenchymal cells (a cell that has a polygonal body containing a clear spherical nucleus and 729
clear appearance of the cytoplasm) and clusters of pancreatic cells along the branches of the 730
portal vein (large dichromatic cells). (A) Parasitic cyst at the vicinity of a pancreatic islet 731
surrounded by a thin rim of fibrous tissue corresponding to encapsulation (arrow). (B) Two 732
well-delineated granulomata slightly compressing the surrounding liver parenchyma (arrows) 733
are composed of large ill-delineated slightly basophilic mononuclear cells characteristic of 734
macrophages. (C) Melano-macrophagic aggregates: randomly scattered in the liver 735
parenchyma, they are composed of large fainted, rarely pigmented cells without 736
encapsulation. (D) A large focus of liquefactive necrosis with cellular debris and numerous 737
amoeba (not shown at this magnification). (E-G) Alteration foci are observed in the 738
parenchyma without compression and are composed of hepatic cells with modifications of 739
their trabecular organization, their size and their cytoplasmic staining: (E) Vacuolated cell 740
alteration focus, ill-delineated focus made of large macro-vacuolated cells (arrow); (F) 741
eosinophilic alteration focus: well-delineated focus made of hypereosinophilic cells; (G) 742
Small basophilic alteration focus: ill-delineated focus made of small hyperbasophilic cells 743
(arrow). (H) Pancreatic adenoma with papillary organization of tumoral cells, well-delineated, 744
encapsulated and compressing the surrounding area of the pancreatic parenchyma. (I) Large 745
infiltrative hepatocellular carcinoma with tubulo-papillar differentiation and a fibrous stroma, 746
1 2 3 4 5 6 7 8 9 10 11 12 13 14 15 16 17 18 19 20 21 22 23 24 25 26 27 28 29 30 31 32 33 34 35 36 37 38 39 40 41 42 43 44 45 46 47 48 49 50 51 52 53 54 55 56 57 58 59 60 61 62 63 64 65
32
totally replacing liver parenchyma. Hematoxylin-Eosin-Saffron. (A, B, H, I) Bar = 100 µm; 747
(C-G) Bar = 50 µm. 748
Figure 4: Prevalence (%) of liver pathologies in European flounders collected in the Seine 749
estuary according to age group. (A) Parasitic, inflammatory, necrotic and regenerative lesions. 750
(B) Pre-neoplastic and neoplastic lesions. Significant differences between age groups are 751
indicated by different letters (p<0.05, Fisher’s exact test with Bonferroni’s correction). 752
Figure 5: Profile of liver pathologies in European flounders from the Seine estuary according 753
to gender. (A) Parasitic, inflammatory, necrotic and regenerative lesions. (B) Pre-neoplastic 754
and neoplastic lesions. Significant differences between genders are indicated by different 755
letters (p<0.05, Fisher’s exact test with Bonferroni’s correction). 756
Figure 6: Seasonal variations of liver pathologies in European flounders from the Seine 757
estuary. (A) Parasitic, inflammatory, necrotic and regenerative lesions. (B) Pre-neoplastic and 758
neoplastic lesions. Significant differences between seasons are indicated by different letters 759
(p<0.05, Fisher’s exact test with Bonferroni’s correction). 760
Figure 7: Temporal evolution of liver pathologies in European flounder from the Seine 761
estuary. (A) Parasitic, inflammatory, necrotic and regenerative lesions. (B) Pre-neoplastic and 762
neoplastic lesions. Significant differences between sampling sites are indicated by different 763
letters (p<0.05, Fisher’s exact test with Bonferroni’s correction). 764
Figure 8: DNA adduct levels in the liver of European flounders collected in the Seine estuary 765
(September and October 1996) and in the Bay of Veys (April 1997). Data are expressed as 766
relative adduct labeling per 109 nucleotides (Mean ± SD, N=2) 767
Figure 9: Representative autoradiograms obtained for European flounders collected in the 768
upper Seine estuary (A) or in Antifer (B). In the first autoradiogram, DNA adducts are 769
1 2 3 4 5 6 7 8 9 10 11 12 13 14 15 16 17 18 19 20 21 22 23 24 25 26 27 28 29 30 31 32 33 34 35 36 37 38 39 40 41 42 43 44 45 46 47 48 49 50 51 52 53 54 55 56 57 58 59 60 61 62 63 64 65
33
predominantly located within the diagonal radioactive zone (DRZ) while in the second only 770
individual spots outside the DRZ are readily visible. 771
1 2 3 4 5 6 7 8 9 10 11 12 13 14 15 16 17 18 19 20 21 22 23 24 25 26 27 28 29 30 31 32 33 34 35 36 37 38 39 40 41 42 43 44 45 46 47 48 49 50 51 52 53 54 55 56 57 58 59 60 61 62 63 64 65
A
B
Seine estuary Bay of Veys
Ster of Lesconil
estuary
Seine estuary
Le Havre
Rouen
Caudebec en Caux
Honfleur
Poses Upper estuary middle estuary
Lower
estuary
Antifer
Figure 1

Figure 2
0
1
2
3
4
5
6
7
8
9
0 50 100 150 200 250 300 350 400 450
Ag
e (
nu
mb
er
of
win
ters
)
Total body length (mm)
Figure 2

Figure 3
Figure 3
A
B
Figure 4
0
10
20
30
40
50
60
70
0 1 2 3+
Pre
vale
nce
(%)
Age group
Parasites
Inflammations
Foci of necrosis or regeneration
02468
101214161820
0 1 2 3+
Pre
vale
nce
(%)
Age group
Foci of cellular alterations
Adenoma
a
b b
b
a a a
a
a
b
b b b
b
b
a
a a
a
a
Figure 4

A
B
Figure 5
0
5
10
15
20
25
30
35
40
45
Female Male
Pre
vale
nce
(%)
Parasites
Inflammations
Foci of necrosis or regeneration
0
1
2
3
4
5
6
7
Female Male
Pre
vale
nce
(%)
Foci of cellular alterations
Adenoma
a
a
a a a
a
a
b
Figure 5

A
B
Figure 6
0
10
20
30
40
50
60
70
80
Spring Summer Autumn Winter
Pre
va
len
ce
(%
) Parasites
Inflammations
Foci of necrosis or regeneration
0
2
4
6
8
10
12
14
Spring Summer Autumn Winter
Pre
va
len
ce
(%
)
Foci of cellular alterations
Tumors
a
a
a
a
a
a
a
a
a
a, b b a, b
a
a
a
a
a
a
a a
Figure 6

A
B
Figure 7
0
10
20
30
40
50
60
1996-1997 2002-2003
Pre
va
len
ce(%
)
Parasites
Inflammations
Foci of necrosis or regeneration
0
2
4
6
8
10
12
1996-1997 2002-2003
Pre
va
len
ce
(%
)
Foci of Cellular alterationsTumors
a
a
a
b
a b
a
b
a
a
Figure 7

Figure 8
0
20
40
60
80
100
120
140
160
180
200
Upper estuary
Middle estuary
Lower estuary
Antifer Veys bay
RA
L/1
09 n
uc
leo
tid
s
Total adducts
DRZ adducts
Figure 8
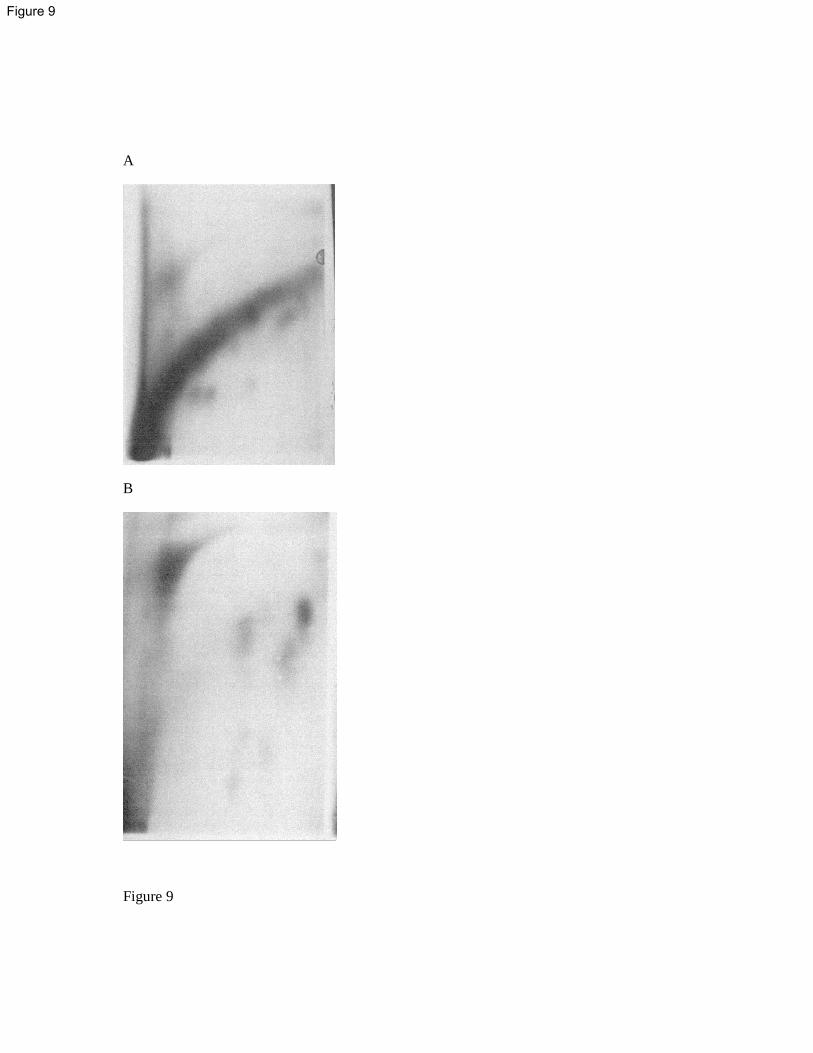
A
B
Figure 9
Figure 9
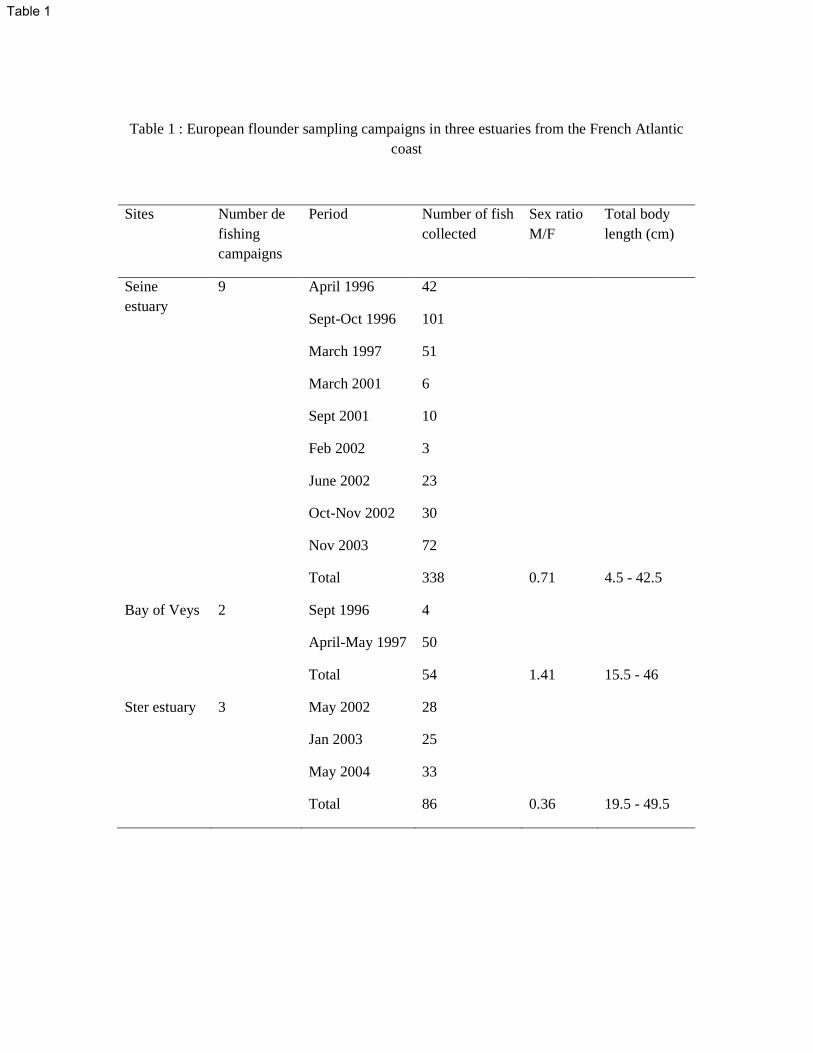
Table 1 : European flounder sampling campaigns in three estuaries from the French Atlantic
coast
Sites Number de
fishing
campaigns
Period Number of fish
collected
Sex ratio
M/F
Total body
length (cm)
Seine
estuary
9
April 1996
Sept-Oct 1996
March 1997
March 2001
Sept 2001
Feb 2002
June 2002
Oct-Nov 2002
Nov 2003
Total
42
101
51
6
10
3
23
30
72
338
0.71
4.5 - 42.5
Bay of Veys 2 Sept 1996
April-May 1997
Total
4
50
54
1.41
15.5 - 46
Ster estuary 3 May 2002
Jan 2003
May 2004
Total
28
25
33
86
0.36
19.5 - 49.5
Table 1

Table 2: Prevalence of liver pathologies in juveniles and adults of European flounder sampled
at different locations in the Seine estuary
Sampling sites
Number
of fish Parasites Inflammations FNR FCA Adenoma Carcinoma
Upper part 49 18.4 a 26.5 a 10.2 a 14.3 a 0.0 a 0.0 a
Median part 45 2.2 b 26.7 a 4.4 a 4.4 a 0.0 a 0.0 a
Lower part 157 9.5 a 36.9 a 3.2 a 6.4 a 1.9 a 0.0 a
Antifer 87 2.3 b 47.1 a 6.9 a 3.4 a 2.3 a 0.0 a
Seine estuary 338 8.0 36.7 5.3 6.5 1.5 0.0
FCA : foci of cellular alteration, FNR : foci of necrosis or regeneration
Different letters indicate significant differences between sampling sites (Fisher’s exact test
with Bonferroni’s correction)
Table 2

Table 3 : Prevalence of liver pathologies in adults of European flounder (total length >
200mm) from three estuaries from the French Atlantic coast
Sampling area
Number
of fish Parasite Inflammation FNR FCA Adenoma Carcinoma
Bay of Veys 46 6.5 b 15.2 b 0.0 a 0.0 a 0.0 a 0.0 a
Ster estuary 85 37.6 a 51.8 a 2.4 a 9.4 a 0.0 a 1.2 a
Seine estuary 243 5.8 b 40.3 a 3.7 a 4.9 a 2.1 a 0.0 a
Median part 38 2.6 28.9 0.0 5.3 0.0 0.0
Lower part 118 9.3 39.0 2.5 5.9 2.5 0.0
Antifer 87 2.3 47.1 6.9 3.5 2.3 0.0
FCA : foci of cellular alteration, FNR : foci of necrosis or regeneration
Different letters indicate significant differences between sampling sites (Fisher’s exact test
with Bonferroni’s correction)
Table 3

Table 4 : Prevalence of liver diseases in European flounders form different geographical areas
of the North-east Atlantic
Sampling area Year Number
of fish
Parasite INF FNR FCA Tumor Reference
Dutch North Sea
coast
1985-
1989
315 - 11.7 5.4 11.4 0.3 Vethaak and
Wester, 1996
Dutch Wadden
Sea coast
1988 9608 5.0 - - <0.1 <0.1 Vethaak, 1992
Dutch Wadden
Sea coast (Den
Oever)
1996 240 - 12.5 - 1.7 0 Vethaak et al.,
2011
German Wadden
Sea coast
1995-
2000
1468 - - - 19-34 4-38 Koehler, 2004
Baltic Sea 1994 3008 - - - 0.6 0.9 Bogovski et al.
1999
Baltic Sea coast 2001-
2002
436* 17.7 28.9 - 4.6 0.7 Lang et al.,
2006
UK estuaries 2000 204 - 20 - 17.6 1.5 Stentiford et al.,
2003
UK estuaries 2006 81 0-6 10-67 5-22 0-28 0-11 Williams et al.,
2011
Seine estuary 1996-
2003
338 8.0 36.7 5.3 6.5 1.5 This study
INF : inflammation, FCA : Foci of Cellular Alteration, FNR : Foci of Necrosis or
Regeneration. (*) Female only
Table 4


![Identification and quantitation of benzo[a]pyrene-DNA adducts formed in mouse skin](https://static.fdokumen.com/doc/165x107/6333eb3bb94d623842027004/identification-and-quantitation-of-benzoapyrene-dna-adducts-formed-in-mouse-skin.jpg)