Highlights 12 May 2022 - NET
82
Title of the Report Highlights Highlights 12 May 2022 World oil demand growth is forecast to slow to 1.9 mb/d in 2Q22 from 4.4 mb/d in 1Q22 and is now projected to ease to 490 kb/d on average in the second half of the year on a more tempered economic expansion and higher prices. As summer driving escalates and jet fuel continues to recover, world oil demand is set to rise by 3.6 mb/d from April to August. For 2022, demand is expected to increase by 1.8 mb/d on average to 99.4 mb/d. Russia shut in nearly 1 mb/d in April, driving down world oil supply by 710 kb/d to 98.1 mb/d. Over time, steadily rising volumes from Middle East OPEC+ and the US along with a slowdown in demand growth is expected to fend off an acute supply deficit amid a worsening Russian supply disruption. Excluding Russia, output from the rest of the world is set to rise by 3.1 mb/d from May through December. Global refinery margins have surged to extraordinarily high levels due to depleted product inventories and constrained refinery activity. Throughputs in April fell 1.4 mb/d to 78 mb/d, the lowest since May 2021, largely driven by China. Between now and August, runs are forecast to ramp up by 4.7 mb/d, but the tightness in product markets is expected to continue based on our current oil demand outlook. Global observed oil inventories declined by a further 45 mb during March and are now a total 1.2 billion barrels lower since June 2020. In the OECD, the release of 24.7 mb of government stocks during March halted the precipitous decline in industry inventories. OECD industry stocks rose by 3 mb to 2 626 mb, but remained 299 mb below the five-year average. Preliminary data for April show OECD industry inventories increased by 5.3 mb. Crude prices fell in April to trade in a narrow $10/bbl range above $100/bbl. ICE Brent last traded around $105/bbl and WTI $102/bbl. Rapid early-May advances on the sixth round of EU sanctions for Russia drove renewed price tensions. High crude prices and exceptional product cracks are supporting strong inflation trends.
-
Upload
khangminh22 -
Category
Documents
-
view
0 -
download
0
Transcript of Highlights 12 May 2022 - NET

Title of the Report Highlights
Highlights
12 May 2022
World oil demand growth is forecast to slow to 1.9 mb/d in 2Q22 from 4.4 mb/d in 1Q22 and is now
projected to ease to 490 kb/d on average in the second half of the year on a more tempered
economic expansion and higher prices. As summer driving escalates and jet fuel continues to
recover, world oil demand is set to rise by 3.6 mb/d from April to August. For 2022, demand is
expected to increase by 1.8 mb/d on average to 99.4 mb/d.
Russia shut in nearly 1 mb/d in April, driving down world oil supply by 710 kb/d to 98.1 mb/d. Over
time, steadily rising volumes from Middle East OPEC+ and the US along with a slowdown in
demand growth is expected to fend off an acute supply deficit amid a worsening Russian supply
disruption. Excluding Russia, output from the rest of the world is set to rise by 3.1 mb/d from May
through December.
Global refinery margins have surged to extraordinarily high levels due to depleted product
inventories and constrained refinery activity. Throughputs in April fell 1.4 mb/d to 78 mb/d, the
lowest since May 2021, largely driven by China. Between now and August, runs are forecast to
ramp up by 4.7 mb/d, but the tightness in product markets is expected to continue based on our
current oil demand outlook.
Global observed oil inventories declined by a further 45 mb during March and are now a total
1.2 billion barrels lower since June 2020. In the OECD, the release of 24.7 mb of government stocks
during March halted the precipitous decline in industry inventories. OECD industry stocks rose by
3 mb to 2 626 mb, but remained 299 mb below the five-year average. Preliminary data for April
show OECD industry inventories increased by 5.3 mb.
Crude prices fell in April to trade in a narrow $10/bbl range above $100/bbl. ICE Brent last traded
around $105/bbl and WTI $102/bbl. Rapid early-May advances on the sixth round of EU sanctions
for Russia drove renewed price tensions. High crude prices and exceptional product cracks are
supporting strong inflation trends.

Table of contents Highlights ............................................................................................................................................. 1
Pressure mounting ...................................................................................................................................... 3
Demand ..................................................................................................................................................... 4
Overview .............................................................................................................................................. 4
OECD ...................................................................................................................................................6
Non-OECD .......................................................................................................................................... 10
Supply ..................................................................................................................................................... 16
Overview ............................................................................................................................................ 16
Russia turns down taps as sanctions bite ............................................................................................... 16
OPEC+ holds firm on policy .................................................................................................................. 17
Steady Rise of Middle East OPEC+ ........................................................................................................ 18
Non-OPEC+ growth concerns linger ...................................................................................................... 20
Refining ................................................................................................................................................... 24
Overview ............................................................................................................................................ 24
Product cracks and refinery margins ..................................................................................................... 25
Regional refining developments ........................................................................................................... 28
Stocks ...................................................................................................................................................... 36
Overview ............................................................................................................................................ 36
Implied balance ................................................................................................................................... 37
Recent OECD industry stock changes .................................................................................................... 38
Other stock developments ................................................................................................................... 40
Prices ....................................................................................................................................................... 44
Overview ............................................................................................................................................ 44
Futures markets .................................................................................................................................. 45
Spot crude oil prices............................................................................................................................. 48
Freight ............................................................................................................................................... 52
Tables ...................................................................................................................................................... 54
List of boxes
Box 1. Oilfield service sector strain caps US supply growth ........................................................ 21 Box 2. Russian oil exports increase in April ............................................................................... 32 Box 3. IEA emergency reserves are making their way to the market .......................................... 42

Oil Market Report Market Overview
Page | 3 12 May 2022 IEA
. All
rig
hts
res
erve
d.
Pressure mounting Russia’s isolation following its invasion of Ukraine is deepening as the EU and G7 contemplate
tougher sanctions that include a full phase out of oil imports from the country. If agreed, the new
embargoes would accelerate the reorientation of trade flows that is already underway and will
force Russian oil companies to shut in more wells. Even so, steadily rising output elsewhere,
coupled with slower demand growth, especially in China, is expected to fend off an acute supply
deficit in the near term. Amid the widening supply and demand uncertainties, oil market volatility
remains rife, but prices are trading in a lower and narrower $10/bbl range above $100/bbl. Brent
last traded at $ 105/bbl and WTI $102/bbl.
Despite mounting international pressure and falling oil production, Russian exports have so far
held up by and large. But now major trading houses are winding down deals ahead of a 15 May
deadline to halt all transactions with state-controlled Rosneft, Gazprom Neft and Transneft.
Following a supply decline of nearly
1 mb/d in April, losses could expand to
around 3 mb/d during the second half of
the year.
Global refinery maintenance and capacity
constraints are exacerbating dislocations
caused by Russia’s war in Ukraine. During
April, crude and product markets saw
diverging trends. While crude prices
trended lower overall, diesel and gasoline
cracks surged to record levels, pulling up
refinery margins and end-user prices.
Limited spare capacity in the global
refining system, together with reduced
exports of Russian fuel oil, diesel and naphtha have aggravated the tightness in product markets,
which have now seen seven consecutive quarters of stock draws. While a first tranche of SPR
releases halted the precipitous decline in OECD industry stocks in March, crude made up the
majority of it and product stocks have continued to fall. Notably, middle distillate reserves
reached their lowest levels since April 2008.
Soaring pump prices and slowing economic growth are expected to significantly curb the demand
recovery through the remainder of the year and into 2023. Moreover, extended lockdowns across
China where the government struggles to contain the spread of Covid-19 are driving a significant
slowdown in the world’s second largest oil consumer. For the year as a whole, global oil demand
is forecast to average 99.4 mb/d in 2022, up 1.8 mb/d y-o-y.
As restrictions in China ease, summer driving picks up and jet fuel continues to recover, world oil
demand is set to rise by 3.6 mb/d from an April low through August. If refiners cannot keep pace,
product markets and consumers could come under additional strain. The IEA’s recent 10-Point
Plan to Cut Oil Use outlines measures that can be taken immediately to cut consumption and ease
the pain caused by high oil prices.
0
20
40
60
80
100
120
140
160
Jan 19 Jul 19 Jan 20 Jul 20 Jan 21 Jul 21 Jan 22
$/bbl Oil Prices in Northwest Europe
Brent Urals Diesel
Source: Argus Media Ltd

Oil Market Report Demand
Page | 4 12 May 2022 IEA
. All
rig
hts
res
erve
d.
Demand
Overview
World oil demand growth slows
Escalating lockdowns across China, as the government struggles to contain the spread of
Covid-19 are driving a dramatic slowdown in the world’s second-largest and fastest-growing oil
consumer. Simultaneously, price expectations for the rest of the year are increasing as Russia’s
invasion of Ukraine shows little sign of easing. However, the impact of these twin crises for oil
demand was moderated in 1Q22 by the continued strong recovery in oil use in Western countries.
Most of these issues were already factored into last month’s Report, which itself assumed a
240 kb/d demand reduction, but we have now revised down growth projections for this year by a
further 70 kb/d, to 1.8 mb/d. Global demand is forecast to average 99.4 mb/d in 2022.
Most of this year’s expected growth took place in 1Q22 (+4.4 mb/d). The comparative absence of
public health restrictions in advanced economies allowed demand for major fuels to rebound
(gasoline +1.4 mb/d, gasoil +1.2 mb/d and jet/kerosene +840 kb/d) while the continuing
expansion of petrochemical capacity helped LPG use to soar by 970 kb/d. In 4Q22, however, we
project that demand will be 230 kb/d lower than in 4Q21 as the economy slows and the impacts
of higher prices bite.
This loss of momentum during the rest of 2022 is fuelled by the significant Chinese lockdowns,
sanctions on Russia that began in late-1Q22 and persistently higher oil prices for the second half
of this year. The higher demand baseline established in 2H21 highlights the slowdown. The ICE
Brent futures prices used as an input to our demand estimates are now expected to average
almost $104/bbl for 2022 (as of 2 May 2022) – up from a little over $102/bbl in early April. In
isolation, a 1.5% price rise like this would theoretically lessen demand by up to 50 kb/d. Our
updated outlook for GDP is largely unchanged, despite higher growth expectations for some
commodity producers and for Brazil, where recent indicators have been more positive.
75.0
80.0
85.0
90.0
95.0
100.0
105.0
Jan Mar May Jul Sep Nov
mb/d World Oil Products Demand
Range 2016-2020 2021
2019 2022 Forecast
5.0
5.5
6.0
6.5
7.0
7.5
8.0
Jan Mar May Jul Sep Nov
mb/d World Naphtha Demand
Range 2016-2020 2021
2019 2022 Forecast

Oil Market Report Demand
Page | 5 12 May 2022 IEA
. All
rig
hts
res
erve
d.
In China, mobility restrictions stifled commerce and left air traffic close to its April 2020 nadir.
Chinese demand for 2Q22 has now been revised down by a total of 890 kb/d across the April and
May Reports. The crisis is having substantial knock-on effects for neighbouring economies and on
shipping networks globally. The Kiel Trade Indicator, a measure of global container shipping,
shows that, despite stabilising in April, volumes stalled in early-2022, after near-continuous
growth since April 2020. Bunker demand in Hong Kong and Singapore fell in February and March.
The crises in China and Russia are also slowing the global recovery in jet fuel demand. In March,
Russia’s international isolation began to weigh on its domestic economy. The sharpest impact so
far has come on jet/kerosene, with consumption falling by 13% month-on-month (m-o-m),
despite a huge increase in military requirements, as commercial flight numbers collapsed by 31%.
In China, air traffic has fallen even more spectacularly, from almost 11 000 daily flights in
February, to just over 3 000 each day in April. While traffic within these countries and to their
neighbours will be slow to recover, passenger and flight numbers continue to rise gradually
elsewhere. We forecast steady gains for global jet/kerosene demand throughout 2022, at
820 kb/d year-on-year (y-o-y). Total global jet/kerosene use should reach 6 mb/d, but will
nevertheless lag 1.9 mb/d behind 2019 levels, highlighting the potential for further growth
beyond our forecast period.
We expect that a large part of the demand response to high prices will come in the form of
curtailed personal mobility and business activity. This will trim transport fuel demand as the year
goes on. Additionally, we already observe changing behaviour from some industrial consumers.
Notably, the costs for gasoil and natural gas in power generation have returned close to parity in
Europe (including emissions trading costs). This implies less switching from gas to oil in power
generation as some users who moved away from gas are incentivised to return. Provisional
German data for March indicate that demand for non-road gasoil was about 100 kb/d lower than
previously forecast, with Europe as a whole unwinding a substantial share of the maximum
250-300 kb/d additional demand in power generation. Furthermore, very high distillate prices
provide a powerful disincentive to the widespread use of back-up generators in Asian countries,
where their utilisation has recently been prevalent. Similarly, petrochemical operators have been
hit with higher naphtha prices and weaker margins. This has triggered rate cuts and feedstock
shifts on an even greater scale than forecast in April’s Report. Globally, naphtha demand shrank
by 310 kb/d y-o-y in March (the first such fall since April 2020), compared with an average y-o-y
increase of 540 kb/d during the previous six months. In contrast, LPG climbed by 820 kb/d, with
flexible steam-cracker operators increasing their intake.
Notwithstanding this month’s downward revision, there could be more pessimistic scenarios
going forward if China’s fight against Covid further undermines demand growth, Russia’s
Global Demand by Region
(thousand barrels per day)
2019 2020 2021 2022 2021 2022 2021 2022
Africa 4 244 3 812 4 036 4 154 225 118 5.9 2.9
Americas 31 843 28 187 30 303 30 917 2 116 614 7.5 2.0
Asia/Pacif ic 35 846 34 073 36 092 36 921 2 019 828 5.9 2.3
Europe 15 093 13 142 13 817 14 265 676 447 5.1 3.2
FSU 4 723 4 497 4 778 4 465 281 - 313 6.3 -6.6
Middle East 8 710 8 206 8 522 8 629 317 107 3.9 1.3
World 100 459 91 916 97 550 99 351 5 634 1 802 6.1 1.8
OECD 47 778 42 128 44 764 45 928 2 637 1 164 6.3 2.6
Non-OECD 52 681 49 788 52 785 53 423 2 997 638 6.0 1.2
D emand A nnual C hg (kb/ d) A nnual C hg (%)

Oil Market Report Demand
Page | 6 12 May 2022 IEA
. All
rig
hts
res
erve
d.
confrontation with Europe expands or economic growth in advanced economies slows more than
anticipated. Hence, the greatest risks to this forecast are likely to the downside, with reduced
pressure on stocks and refineries.
OECD Overall 1Q22 OECD oil demand is almost unchanged from last month’s Report, at 45.5 mb/d. A
3.1 mb/d y-o-y increase reflects the relative absence of large-scale public-health restrictions, in
contrast to 2021. Demand for every major product except naphtha increased significantly and
each of the three OECD sub-regions had higher y-o-y deliveries.
However, this apparent stability disguises some variation within the quarter, with January up by
3 mb/d y-o-y and February a remarkable 5 mb/d higher but March only 1.4 mb/d stronger.
Significantly higher oil product prices and greater economic uncertainty, are combining to cool
demand across all OECD regions, with March falling 570 kb/d faster from February than the
seasonal trend.
Preliminary data suggest that March demand for gasoil contracted by 30 kb/d y-o-y, reflecting
worsening business confidence and supply chain problems, with naphtha demand tumbling by
230 kb/d as weak steam cracker margins based on the feedstock saw operators cut rates or switch
to LPG (+520 kb/d) where possible. Gasoline demand held up better, with greater resilience in
personal mobility and lower pricing compared to diesel. Jet/kerosene accounts for a large
majority of the growth compared with 2021, standing 980 kb/d higher.
Global Demand by Product
(thousand barrels per day)
2019 2020 2021 2022 2021 2022 2021 2022
LPG & Ethane 13 251 13 314 13 907 14 488 593 581 4.5 4.2
Naphtha 6 347 6 380 6 921 6 814 540 - 107 8.5 -1.5
Motor Gasoline 26 717 23 633 25 672 26 053 2 039 381 8.6 1.5
Jet Fuel & Kerosene 7 930 4 664 5 217 6 039 553 822 11.9 15.8
Gas/Diesel Oil 28 317 26 514 27 809 28 025 1 295 216 4.9 0.8
Residual Fuel Oil 6 148 5 721 6 073 6 141 352 68 6.1 1.1
Other Products 11 749 11 690 11 952 11 791 262 - 161 2.2 -1.3
Total Products 100 459 91 916 97 550 99 351 5 634 1 802 6.1 1.8
D emand A nnual C hg (kb/ d) A nnual C hg (%)
35.0
40.0
45.0
50.0
Jan Mar May Jul Sep Nov
mb/d OECD Oil Products Demand
Range 2016-2020 2021
2019 2022 Forecast
18.0
21.0
24.0
27.0
Jan Mar May Jul Sep Nov
mb/d OECD Americas Oil Products Demand
Range 2016-2020 2021
2019 2022 Forecast

Oil Market Report Demand
Page | 7 12 May 2022 IEA
. All
rig
hts
res
erve
d.
Average annual demand is forecast to rise by 1.2 mb/d to 45.9 mb/d. While 1Q22 saw
considerable y-o-y growth at 3.2 mb/d (compared with the relatively weak 1Q21), higher prices
and faltering economic growth are expected to take their toll through the rest of the year in line
with our previous forecasts. Demand in 2Q22 will be up by 1.4 mb/d, 3Q22 500 kb/d higher and
4Q22 deliveries 320 kb/d lower than in 2021.
February rebound in OECD Americas but slowdown looming
OECD Americas oil demand showed renewed strength in February, rising by 820 kb/d m-o-m,
according to monthly oil statistics submitted by member countries. This jump dramatically
outpaced the typical 150 kb/d rise, marking a break with underwhelming January data. However,
preliminary weekly estimates for March and April from the US Energy Information
Administration (EIA) suggest that growth is already slowing. We estimate that demand will slump
by 790 kb/d from February to March, when it usually increases slightly, and by a further 120 kb/d
in April. Overall 1Q22 demand was 1.7 mb/d higher y-o-y, with gasoline (+480 kb/d) and
jet/kerosene (+390 kb/d) benefitting from an easing of public health restrictions this year, and
LPG use (+530 kb/d) profiting from new ethane-based petrochemical capacity given the
competitiveness of such plants in comparison to relatively high-cost naphtha crackers in other
regions.
Gasoline (+750 kb/d m-o-m and +1.1 mb/d y-o-y) was the leading driver of the stronger February
data. US Federal Highway Administration (FHA) data showed that the distance travelled by
vehicles in the country rose from 7.7 billion miles per day in January to 8.4 billion miles each day
in February (+11%). US gasoline demand increased by 620 kb/d. Gasoil deliveries rose counter-
seasonally, climbing by 220 kb/d m-o-m. The S&P Global US Manufacturing Purchasing Managers
Index (PMI) stood at 58.6 in February indicating strong expansion. In addition to robust US
volumes, Mexican demand, estimated based on data from Pemex, continued to gather pace in
February, after a disappointing 2021, rising by 100 kb/d m-o-m. This trend was reproduced in
March (+190 kb/d) and we have lifted our outlook for the rest of 2022. Chilean demand also
outperformed our expectations, rising by 30 kb/d m-o-m on higher gasoline use.
This positive momentum went into reverse in March, with preliminary information indicating that
US gasoline deliveries declined (-90 kb/d m-o-m) contrary to typical seasonality and that gasoil
use dropped by 300 kb/d. This decline continued into April, falling by another 130 kb/d. If
confirmed, this would suggest that the impact of increased prices was felt almost immediately,
OECD Demand based on Adjusted Preliminary Submissions - March 2022
(million barrels per day)
mb/d % pa mb/d % pa mb/d % pa mb/d % pa mb/d % pa mb/d % pa mb/d % pa mb/d % pa
OECD Americas 10.14 0.0 1.73 32.9 3.32 -0.1 1.88 -6.2 3.94 10.4 0.47 -19.6 2.85 -4.2 24.25 2.0
US* 8.54 -0.9 1.52 28.6 2.48 -3.5 1.50 -6.4 3.08 11.4 0.30 -12.8 2.29 -5.1 19.63 1.2
Canada 0.78 -3.8 0.10 76.0 0.26 -1.6 0.32 -10.4 0.50 6.5 0.04 35.6 0.37 11.6 2.36 2.2
Mexico 0.76 17.6 0.09 83.9 0.41 32.0 0.06 34.0 0.32 9.2 0.11 -44.1 0.17 -14.5 1.91 10.4
OECD Europe 1.92 11.9 1.08 84.8 4.90 1.6 1.59 -0.3 1.17 4.1 0.83 17.0 2.19 -1.3 13.41 7.2
Germany 0.43 -3.1 0.13 39.2 0.67 -4.9 0.28 8.0 0.11 -13.8 0.07 26.4 0.36 -0.9 2.03 0.2
United Kingdom 0.25 16.2 0.28 72.6 0.45 -3.2 0.15 3.7 0.13 2.4 0.02 30.9 0.12 15.5 1.37 13.8
France 0.22 14.3 0.11 90.7 0.75 0.8 0.15 1.9 0.15 17.7 0.04 53.8 0.21 -4.4 1.63 7.6
Italy 0.19 40.0 0.06 155.4 0.53 16.6 0.07 -7.7 0.12 31.5 0.07 28.6 0.26 0.4 1.29 19.0
Spain 0.11 -0.8 0.11 240.3 0.44 -2.4 0.26 -5.4 0.07 3.4 0.13 13.9 0.19 -8.7 1.25 3.7
OECD Asia & Oceania 1.32 -3.6 0.71 9.2 1.32 -3.8 0.58 11.7 0.91 12.2 0.52 10.4 2.30 -3.5 7.61 1.1
Japan 0.71 -2.7 0.43 6.4 0.42 -0.9 0.37 9.7 0.48 2.1 0.28 4.4 0.85 -10.7 3.54 -1.3
Korea 0.19 -9.8 0.15 1.2 0.31 -7.5 0.14 17.6 0.37 32.2 0.22 16.3 1.27 1.6 2.61 4.5
Australia 0.29 -4.0 0.10 44.4 0.52 -3.9 - - 0.04 0.3 0.01 41.9 0.12 -3.7 1.08 0.0
OECD Total 13.38 1.2 3.52 38.8 9.54 0.2 4.05 -1.7 6.02 9.4 1.82 3.2 7.34 -3.1 45.28 3.3
Total ProductsGasoline Jet/Kerosene Diesel LPG/Ethane RFO OtherOther Gasoil

Oil Market Report Demand
Page | 8 12 May 2022 IEA
. All
rig
hts
res
erve
d.
but should be treated with caution given the possibility of revision once monthly statistics
become available. Diesel prices rose considerably faster than those for gasoline. The
unexpectedly weak data form a striking contrast with very strong PMI readings for both
manufacturing (rising from 58.8 in March to 59.7 in April – the third successive increase) and
services (58 in March and 55.6 April). Notwithstanding this evidence of rising output, anecdotal
reports of difficulties for freight operators due to rising costs are confirmed by DAT Freight &
Analytics, who identify a dramatic 21% y-o-y decline in spot truck cargoes for April.
Based on these indications that higher prices are already having a substantial impact on demand,
we have slightly reduced our 2022 outlook for US demand. However, these falls are outweighed
by greater expectations for Mexico and we now project growth of 550 kb/d for 2022 for the
Americas as a whole. Most of this growth is concentrated in 1Q22, with demand staying close to
2021 levels throughout the rest of the year.
OECD Europe deliveries steady
Overall 1Q22 demand in OECD Europe rose by 1.2 mb/d y-o-y despite anti-Covid restrictions in
several key countries. While there were partial lockdowns in Germany and the Netherlands
during January, these were less prevalent than in 1Q21 and eased during February and March,
clearing the path to higher demand. Member country monthly statistics reveal that February
deliveries were 1.2 mb/d in excess of January – about 250 kb/d faster than average for the month.
Gasoil was the primary motor of growth, accounting for 800 kb/d of the increase (+620 kb/d
y-o-y) while gasoline went up by 190 kb/d m-o-m. The S&P Global Eurozone Manufacturing PMI
was at 58.2 in February but slid to 56.5 in March and 55.5 in April as cost pressures and greater
supply chain challenges hit manufacturing operations. We project y-o-y gasoil demand growth to
slacken to 70 kb/d in March.
Survey data for German manufacturers shows that new orders and output contracted in April (the
first time since June 2020), although both the Netherlands and France reported quickening
expansion. We expect the pressures on European economies, along with the impact of higher oil
pricing, to weigh ever more heavily on demand through the year. While overall 2022 demand will
be 440 kb/d higher than 2021, virtually all this growth will take place in 1H22, with 4Q22 demand
260 kb/d lower y-o-y.
Fuel switching from natural gas to oil in industry provided substantial support to gasoil demand
in 1Q22, estimated at 250 kb/d as higher natural gas prices made oil an attractive alternative.
4.0
4.5
5.0
5.5
6.0
Jan Mar May Jul Sep Nov
mb/d OECD Americas Gasoil/Diesel Demand
Range 2016-2020 2021
2019 2022 Forecast
7.0
8.0
9.0
10.0
11.0
12.0
Jan Mar May Jul Sep Nov
mb/d OECD Americas Gasoline Demand
Range 2016-2020 2021
2019 2022 Forecast

Oil Market Report Demand
Page | 9 12 May 2022 IEA
. All
rig
hts
res
erve
d.
However, the subsequent stabilisation of gas prices and sharp increases in middle distillate costs
have now brought the fuels close to price parity once again, suggesting that some consumers will
now be incentivised to switch back to gas, which will ease demand for oil. Indeed, provisional
March data for Germany suggests that other gasoil demand (i.e. non-diesel gasoil) was about
100 kb/d lower than previously forecast, a sign that tighter distillate markets are limiting this form
of consumption.
OECD Asia Oceania demand subdued in March
Based on preliminary submissions, March OECD Asia Oceania demand fell by 460 kb/d m-o-m to
7.5 mb/d, 230 kb/d below our expectations in last month’s Report. The decline was in part driven
by typical seasonal variation, with jet/kerosene use going down by 240 kb/d as winter heating
requirements declined. However, y-o-y growth slowed to 80 kb/d from 140 kb/d in February with
gasoline demand down by 50 kb/d and signs that petrochemical producers were trimming rates.
Combined naphtha and LPG deliveries were 30 kb/d lower y-o-y, despite new plant start-ups
during 2021 and showed a major shift towards LPG use (+100 kb/d) at the expense of naphtha
(-130 kb/d). In particular, Japanese naphtha consumption tumbled by 150 kb/d compared with
2021, with four of the country’s 12 steam crackers reportedly down for at least part of the month
(three for checks following March’s earthquake).
For 1Q22 total Asia Oceania demand rebounded by 230 kb/d y-o-y but remained some 460 kb/d
lower than 1Q19. Gasoline and naphtha continue to lag 2021 levels and all major products, save
fuel oil and LPG, are lower than in 2019. Various forms of fuel switching as a result of high relative
natural gas pricing likely contributed an additional 100 kb/d to demand over the quarter.
Growth is forecast to slow slightly in 2Q22, to 210 kb/d y-o-y. The higher price outlook and
economic headwinds apparent in almost every region will restrict the scope for increases, but our
assumptions do not imply an abrupt downturn in demand. S&P Global PMIs for manufacturers
indicated continued expansion in Japan (53.5), Korea (52.1) and Australia (58.8) in April. As in
other advanced economies, the gap between 2021 and 2022 demand will narrow throughout the
year, with Asia Oceania demand essentially flat y-o-y by 4Q22.
10.0
11.0
12.0
13.0
14.0
15.0
16.0
Jan Mar May Jul Sep Nov
mb/d OECD Europe Oil Products Demand
Range 2016-2020 2021
2019 2022 Forecast
6.5
7.0
7.5
8.0
8.5
9.0
9.5
Jan Mar May Jul Sep Nov
mb/d OECD Asia Oceania Oil Products Demand
Range 2016-2020 2021
2019 2022 Forecast

Oil Market Report Demand
Page | 10 12 May 2022 IEA
. All
rig
hts
res
erve
d.
Non-OECD Total non-OECD oil use was close to record levels in 1Q22. At 53.3 mb/d, non-OECD demand
stood 1.3 mb/d higher than a year ago and 1.5 m/d in excess of pre-pandemic levels. However,
severe and increasingly widespread Covid-19 containment measures in China, international
sanctions on Russia and the impact of higher prices is expected to cool oil use in 2Q22. Demand
is forecast 610 kb/d lower quarter-on-quarter (q-o-q), to stand only 160 kb/d ahead of 2Q19.
China’s lockdowns are creating widespread disruption to personal mobility and activity as well as
a range of different industries. Total 2Q22 oil use in China is expected to fall by 570 kb/d y-o-y
compared with annual growth of 520 kb/d in 1Q22. Oil demand in Russia is already showing the
strain of international pressure, falling by 150 kb/d m-o-m (-30 kb/d y-o-y) in March and with
domestic businesses reporting significant problems. Deliveries in India (+220 kb/d y-o-y), Latin
America (+140 kb/d), the Middle East (+140 kb/d) and Egypt (+120 kb/d) saw more positive trends.
While we expect problems in Russia to persist, China should return to growth before the end of
the year, helping total non-OECD demand grow by 640 kb/d to 53.4 mb/d for 2022.
Chinese demand reels on deepening lockdowns
Cities across China continue to be gripped by stringent lockdowns designed to stop the spread of
Covid-19. These measures appear to have been, at most, a partial success. Reported new cases
have declined from a late-April peak and are low in comparison with many Western countries.
Nevertheless, the lockdowns required to achieve this have often been longer and more severe
than initially expected, while the virus continues to spread to new cities and regions. Most
notably, Beijing has introduced a number of new restrictions although not yet as severe as in
Shanghai. Japan’s Nomura Research Institute estimated that in late-April almost 330 million
people across 43 Chinese cities were under some form of lockdown. This geographical widening
highlights the possibility of new public health measures and has the potential to substantially
deepen and extend the impact on oil demand.
Non-OECD: Demand by Product
(thousand barrels per day)
2019 2020 2021 2022 2021 2022 2021 2022
LPG & Ethane 7 748 7 888 8 322 8 557 434 236 5.5% 2.8%
Naphtha 3 080 3 238 3 549 3 605 311 56 9.6% 1.6%
Motor Gasoline 12 128 10 976 12 047 12 303 1 071 256 9.8% 2.1%
Jet Fuel & Kerosene 3 447 2 090 2 221 2 337 131 116 6.2% 5.2%
Gas/Diesel Oil 14 580 13 832 14 637 14 833 805 195 5.8% 1.3%
Residual Fuel Oil 4 359 4 217 4 373 4 353 157 - 20 3.7% -0.5%
Other Products 7 339 7 548 7 636 7 434 88 - 202 1.2% -2.6%
Total Products 52 681 49 788 52 785 53 423 2 997 638 6.0% 1.2%
D emand A nnual C hg (kb/ d) A nnual C hg (%)

Oil Market Report Demand
Page | 11 12 May 2022 IEA
. All
rig
hts
res
erve
d.
Provincial-level information on restrictions produced by Oxford University’s Blavatnik School of
Government underscores the growing scale of the measures in effect. A weighted average of
restrictions has remained above 75% of maximum 2020 levels since mid-March, with little sign of
a major decrease. The China Caixin Manufacturing PMI fell to 46 in April from 48.1 in March. In the
second heaviest fall on record, their Services PMI slumped to 36.2 versus 42 in March. Both indices
are at their lowest since April 2020 and indicate substantial contractions. Such limits on activity
and their economic corollaries have led us to further reduce our expectations for Chinese oil
demand in 2Q22 by 275 kb/d on average. For the year as a whole, we now forecast demand to
grow by only 130 kb/d, reaching 15.7 mb/d. This is 50 kb/d lower than in the April Report and
300 kb/d below our February forecast.
Sources: IEA, Oxford University BSG
March apparent demand recorded a m-o-m fall of 800 kb/d, compared with an average seasonal
drop of 140 kb/d. March oil use was 310 kb/d lower than a year ago, the first y-o-y decline since
February 2020 and a strong contrast with the 1.1 mb/d annual growth in February 2022. All major
products except LPG (+70 kb/d) fell m-o-m. Gasoil lead the declines (-270 kb/d), but jet/kerosene,
naphtha and gasoline demand (each about -190 kb/d lower) also dropped steeply. Despite a
weaker final month, 1Q22 demand rose by 520 kb/d y-o-y. While road fuel demand is likely to
benefit to a limited extent from widespread public transport closures, we have reduced our
expectations for April oil use to 14.5 mb/d, 420 kb/d lower than March and 890 kb/d below a year
ago. We expect demand to fall by 570 kb/d y-o-y in 2Q22.
10.0
12.0
14.0
16.0
18.0
Jan Mar May Jul Sep Nov
mb/d China Oil Products Demand
Range 2016-2020 2021
2019 2022 Forecast
2.0
2.5
3.0
3.5
4.0
4.5
Jan Mar May Jul Sep Nov
mb/d China Gasoil/Diesel Demand
Range 2016-2020 2021
2019 2022 Forecast
14.0
14.5
15.0
15.5
16.0
16.5
mb/dChina Total Oil Demand Revisions
Apr OMR Rev May OMR Rev
Mar OMR Forecast May OMR Demand
0%
20%
40%
60%
80%
100%
Jan
-20
Ap
r-20
Jul-
20
Oct
-20
Jan
-21
Ap
r-21
Jul-
21
Oct
-21
Jan
-22
Ap
r-22
China Covid restrictions, weighted average

Oil Market Report Demand
Page | 12 12 May 2022 IEA
. All
rig
hts
res
erve
d.
The large decline in gasoil demand principally reflects the slowdown in manufacturing and
commercial activity. We estimate that this worsened in April, as evidenced by the lower PMI
values. Factories across the country are closed or hampered by lockdown measures and ensuing
supply chain issues. Rising global commodity prices have added further difficulties for businesses.
Similarly, gasoline demand has been hindered by a large decline in personal mobility and
consumer activity. Alongside the low March and April services PMI numbers, Alibaba reported
that sales via their Taobao e-commerce platform tumbled by 8% y-o-y in March. Baidu’s
Congestion Index suggests that during late April and early May, traffic was noticeably reduced
compared with 2021 in more than half of China’s largest 98 cities. In Shanghai (home to 25 million
people) there was an almost total lack of congestion throughout April, with similarly large
reductions in peak traffic in cities like Jinan (9 million people) and Changchun (also 9 million
people). Notably, in recent weeks the index for Beijing (22 million people) indicates a significant
disruption to normal behaviour.
Sources: IEA, Radarbox.
While major ports in affected areas have been able to keep operating, significant congestion has
disrupted supply chains for local producers and bunker fuel demand. Consulting firm Linerlytica
reported that congestion at Shanghai (the world’s busiest port) and Ningbo rose steadily during
March and April while data provider Windward indicated that the number of vessels waiting at
Chinese ports doubled from February to mid-April. Fuel oil use in China was 75 kb/d lower m-o-m
in March (15% lower y-o-y) and we expect it to remain subdued in April. Recent fuel oil data in
associated shipping centres Hong Kong (February -6% y-o-y) and Singapore (February -13% and
March -9% y-o-y) highlights the extent of these disruptions.
In proportion to market size, jet/kerosene use experienced the most precipitous fall of any
product, collapsing by 44% m-o-m. According to data from Radarbox, the number of flights from
Chinese airports plummeted by a remarkable 46% m-o-m. Having stood at 10 800 each day in
February they tumbled to 5 800 a day in March before all-but-reaching February 2020 levels in
April, at only 3 300 a day (a further 43% fall). Jet/kerosene demand fell by 190 kb/d in March and
we expect this fall to be extended by a further 60 kb/d in April. Flight numbers ticked upwards in
early May but remain at remarkably low levels. Any rebound in demand is likely to take several
months and could struggle to return to 1H21 levels during 2022.
Naphtha demand slumped by 190 kb/d in March. This reflected a combination of lower operating
rates at Chinese steam crackers, with tighter margins and supply chain issues, alongside a switch
300
350
400
450
500
550
600
650
700
750
3
4
5
6
7
8
9
10
11
12
kb/dFlights China air traffic and jet fuel demand
Daily flights Jet/Kerosene Demand
0.2
0.3
0.4
0.5
0.6
0.7
0.8
0.9
1.0
1.1
Jan Mar May Jul Sep Nov
mb/d China Jet/Kerosene Demand
Range 2016-2020 2021
2019 2022 Forecast

Oil Market Report Demand
Page | 13 12 May 2022 IEA
. All
rig
hts
res
erve
d.
by flexible cracker operators in favour of LPG consumption as margins based on the lighter
feedstock became more favourable. As in other countries, we expect that petrochemical
producers will maximise the share of LPG feedstock used throughout the year. Ship-tracking data
from Kpler showed lower imports of US ethane bound for steam crackers during March, down by
50 kb/d to just under 100 kb/d. These leapt to 170 kb/d April, the highest level since September
2021. LPG/ethane demand is projected to rise by 220 kb/d in 2022, the fastest growth of any oil
product in the country.
Russia sanctions begin to bite
As expected, March data for Russia shows a substantial decline in demand. Total oil use dropped
by 150 kb/d m-0-m, where the normal seasonal change is for a 20 kb/d fall. Jet/kerosene (-30 kb/d)
and fuel oil (-40 kb/d) saw the largest reductions. Commercial flights from major Russian airports
tumbled by 31% in March according to FlightRadar24 data. However, jet fuel demand was partly
insulated by the near trebling of Russian military consumption from 30 kb/d in January to almost
90 kb/d in early April. International flights from Russia have been severely restricted due to
airspace closures and the possibility of the seizure of leased aircraft at foreign airports, while
domestic flight numbers have been curtailed by the continued closure of airports across a large
swathe of south-western Russia. Our jet/kerosene demand outlook has been revised slightly
higher on a partial rebound in domestic flights in late April and early May. Nonetheless, we expect
maintenance and equipment issues to weigh more heavily on demand in 2H22.
Gasoil and gasoline demand both exceeded expectations in March. Gasoil demand was flat, in
contrast to the ordinary seasonal rise. Gasoline use was also largely unchanged, outperforming
the normal seasonal fall. According to GlobalPetrolPrices.com, domestic diesel and gasoline
prices did not rise significantly in March or April (indeed gasoline prices actually fell). Our previous
projections assumed that effective prices would increase along with global markets, weighing on
demand. We have modified our assumptions slightly to lessen the price impact on Russian
domestic consumption. Nevertheless, the outlook for 2022 remains grim – as evidenced by a
third month of declines in the S&P Global Russia Manufacturing PMI, which registered at 48.2 in
April amid the impact of sanctions, rampant inflation and a fall in new orders as customer
confidence remained weak. Total 2022 oil demand will be 240 kb/d lower y-o-y at 3.4 mb/d.
China: Demand by Product
(thousand barrels per day)
2019 2020 2021 2022 2021 2022 2021 2022
LPG & Ethane 1 781 1 912 2 230 2 445 317 215 16.6 9.7
Naphtha 1 373 1 478 1 679 1 769 201 90 13.6 5.4
Motor Gasoline 3 332 3 284 3 630 3 674 345 44 10.5 1.2
Jet Fuel & Kerosene 877 722 700 596 - 21 - 104 -3.0 -14.9
Gas/Diesel Oil 3 151 3 259 3 636 3 642 377 6 11.6 0.2
Residual Fuel Oil 444 445 481 483 36 2 8.1 0.3
Other Products 2 948 3 197 3 165 3 041 - 32 - 123 -1.0 -3.9
Total Products 13 905 14 298 15 521 15 651 1 223 130 8.6 0.8
D emand A nnual C hg (kb/ d) A nnual C hg (%)

Oil Market Report Demand
Page | 14 12 May 2022 IEA
. All
rig
hts
res
erve
d.
Growth cools amid Indian price hikes
Total Indian demand declined by 70 kb/d m-o-m in April. Gasoline and gasoil use were essentially
flat m-o-m, as firms began to pass on higher global prices to consumers. On 22 March, state
companies ended a 137-day freeze on prices, following a round of state elections. The first half of
April recorded a 10% m-o-m fall in gasoline demand and a 16% fall in diesel demand. In March,
stock-building by users in anticipation of price hikes had contributed to unusually strong sales.
Demand for LPG, which is important for residential cooking and heating, dropped by an
estimated 90 kb/d m-o-m in April (in excess of the average seasonal 50 kb/d decline). LPG sales
in March are believed to have benefitted substantially from stock-building ahead of a 50 Rupees
per cylinder price increase.
Nevertheless, overall April demand was 510 kb/d higher y-o-y. During April 2021, India was in the
midst of severe anti-Covid lockdowns. Compared with the weak baseline, 2Q22 demand is
expected to climb 660 kb/d y-o-y, with annual growth of 290 kb/d for 2022. The S&P Global India
Manufacturing PMI shows activity gathering pace in April, up to 54.7 from 54 in March.
Growth is forecast to slow dramatically in 3Q22, to 190 kb/d y-o-y. The principal reason for this is
the comparison to a stronger period in 2021, when lockdowns were easing. Additionally, higher
oil prices will erode oil use, especially personal consumption. We forecast that 3Q22 gasoline use
will be flat y-o-y while growth for gasoil will slow to 100 kb/d, from 290 kb/d in 2Q22. Broadly
2.8
3.0
3.2
3.4
3.6
3.8
4.0
Jan Mar May Jul Sep Nov
mb/d Russia Oil Products Demand
Range 2016-2020 2021
2019 2022 Forecast
0.6
0.7
0.8
0.9
1.0
1.1
1.2
Jan Mar May Jul Sep Nov
mb/d Russia Gasoil/Diesel Demand
Range 2016-2020 2021
2019 2022 Forecast
2.5
3.0
3.5
4.0
4.5
5.0
5.5
6.0
Jan Mar May Jul Sep Nov
mb/d India Oil Products Demand
Range 2016-2020 2021
2019 2022 Forecast
0.6
0.8
1.0
1.2
1.4
1.6
1.8
2.0
Jan Mar May Jul Sep Nov
mb/d India Gasoil/Diesel Demand
Range 2016-2020 2021
2019 2022 Forecast
Oil Market Report Demand
Page | 15 12 May 2022 IEA
. All
rig
hts
res
erve
d.
speaking, this situation is likely to persist into 4Q22 (+180 kb/d y-o-y) with average 2022 demand
standing 20 kb/d higher than 2019 levels at 5 mb/d.
Other Non-OECD
Brazil posted strong oil demand in March, 70 kb/d in excess of our previous expectations. Gasoil
use (-20 kb/d y-o-y) was close to the unusually high level of March 2021, while gasoline posted
80 kb/d y-o-y growth. Overall 1Q22 demand was flat y-o-y. Improving assessments of the
country’s economic position, with the S&P Global Brazil Manufacturing PMI showing increased
activity in both March (52.3) and April (51.8), is supporting the outlook. Our GDP growth
assumptions have been raised for 2Q22 and 3Q22, albeit from a low base. We now expect
Brazilian demand to fall by only 20 kb/d, to just over 3 mb/d during 2022. Total Latin American
oil demand is forecast to rise by 60 kb/d for the year as a whole, reaching 6.4 mb/d.
Projected Middle Eastern demand growth for 2022 has increased to 110 kb/d, following an
upward revision to our GDP estimates for major energy exporters in the region. Higher global
commodity prices have strengthened local economies and we forecast gasoline and jet/kerosene
demand to rise by about 100 kb/d each compared with 2021. This will easily outweigh the sizeable
reductions in the quantity of crude oil burnt for power generation as Gulf economies continue to
diversify their sources of electricity.
African oil use grew by 120 kb/d in 1Q22, with fuel oil use in Egypt increasing by an average of
90 kb/d in January and February as the government prioritised LNG exports from Idku and
Damietta and oil filled the gap in power generation. Increased traffic through the Suez Canal
during April (6.3% higher y-o-y) likely supported bunker demand at Egypt’s ports. We expect total
Egyptian demand to be 70 kb/d higher y-o-y in 2022.
India: Demand by Product
(thousand barrels per day)
2019 2020 2021 2022 2021 2022 2021 2022
LPG & Ethane 837 869 888 898 19 10 2.1% 1.1%
Naphtha 308 318 319 308 2 - 11 0.5% -3.4%
Motor Gasoline 734 667 750 781 83 31 12.4% 4.1%
Jet Fuel & Kerosene 225 120 128 159 9 30 7.2% 23.5%
Gas/Diesel Oil 1 667 1 414 1 516 1 637 102 121 7.2% 8.0%
Residual Fuel Oil 145 136 141 145 6 4 4.1% 2.6%
Other Products 1 076 1 016 968 1 078 - 49 110 -4.8% 11.4%
Total Products 4 991 4 540 4 711 5 006 171 294 3.8% 6.2%
D emand A nnual C hg (%)A nnual C hg (kb/ d)
Non-OECD: Demand by Region
(thousand barrels per day)
2019 2020 2021 2022 2021 2022 2021 2022
Africa 4 244 3 812 4 036 4 154 225 118 5.9 2.9
Asia 27 911 26 934 28 683 29 332 1 749 649 6.5 2.3
FSU 4 723 4 497 4 778 4 465 281 - 313 6.3 -6.6
Latin America 6 310 5 631 6 029 6 096 397 67 7.1 1.1
Middle East 8 710 8 206 8 522 8 629 317 107 3.9 1.3
Non-OECD Europe 782 708 737 746 28 9 4.0 1.3
Total Products 52 681 49 788 52 785 53 423 2 997 638 6.0 1.2
D emand A nnual C hg (kb/ d) A nnual C hg (%)

Oil Market Report Supply
Page | 16 12 May 2022 IEA
. All
rig
hts
res
erve
d.
Supply
Overview World oil supply fell to 98.1 mb/d in April, down 710 kb/d - the biggest monthly loss since February
2021 – after Russia shut-in nearly 1 mb/d. Production from other OPEC+ members continued to
disappoint, with total oil output from the bloc down more than 1 mb/d. Libya and Kazakhstan lost
more than 400 kb/d between them due to unplanned closures at export terminals. The sharp
declines widened the shortfall between the bloc’s supply versus official output targets to around
2.7 mb/d compared to 1.3 mb/d in March, reflecting the group’s persistent battle with capacity
constraints and technical issues. The overall global decline was partially offset by higher
non-OPEC+ supply, which rose by 380 kb/d led by strong gains in biofuels and a modest
production increase from the United States.
Over time, steadily rising volumes from Middle East OPEC+ members and the US along with
slower demand growth is expected to fend off an acute supply deficit even amid a worsening
Russian disruption. Excluding Russia, output from the rest of the world is set to rise by 3.1 mb/d
from May through December. The US is expected to deliver the single largest gain – adding
1.1 mb/d of the total non-OPEC+ increase of 1.5 mb/d. OPEC+ is poised to boost output gradually
by 1.6 mb/d if cuts are unwound fully, with Middle East producers delivering the lion’s share. Saudi
Arabia is slated to add 480 kb/d while Iraq, Kuwait and the UAE combined could contribute a
similar amount. For the year as a whole, production is forecast to rise 5.2 mb/d y-o-y (excluding
Russia), with OPEC+ accounting for 3.4 mb/d and non OPEC+ for 1.8 mb/d.
Russia turns down taps as sanctions bite After holding broadly steady in March, Russian oil production plunged during April as the
country’s refiners processed much less crude due to slower products exports and falling domestic
demand in the wake of Western sanctions. Though a smaller drop than we anticipated in last
month’s Report, total output of crude oil, condensates and NGLs tumbled 960 kb/d m-o-m to
10.4 mb/d in April, the lowest level since November 2020. Supply of crude oil declined by 900 kb/d
88
90
92
94
96
98
100
102
Jan 21 Apr 21 Jul 21 Oct 21 Jan 22 Apr 22 Jul 22 Oct 22
mb/d
Global Oil Supply
* Assumes OPEC+ cut phased out by Sept 2022. Iran remains under sanctions.
-1.5
-1.0
-0.5
0.0
0.5
1.0
Jan-22 Feb Mar Apr May Jun
mb/d
Oil Supply Response
(m-o-m change)
Saudi RussiaOther OPEC+ CanadaUS Other Non-OPEC+

Oil Market Report Supply
Page | 17 12 May 2022 IEA
. All
rig
hts
res
erve
d.
to 9.1 mb/d, which was 1.3 mb/d below the country’s OPEC+ target. Top producer Rosneft has
reportedly shouldered much of the reduction so far. Sanctions are also taking a toll on projects
operated by Western oil companies. ExxonMobil declared force majeure at the 300 kb/d Sakhalin-
1 field where it is curbing output as operations become more difficult. The company intends to
withdraw from the country following Russia's invasion of Ukraine.
As sanctions tighten and a lack of storage forces producers to shut in still more wells, we are
expecting a further loss of 600 kb/d this month – taking the overall decline since February to
around 1.6 mb/d. This could stretch to more than 2 mb/d in June and deepen to close to 3 mb/d
from July onwards if existing sanctions deter further buying or should the embargo on Russian oil
expand (at the time of writing, the EU was still discussing a ban on Russian oil imports). If that
were to prove the case, annual average oil production would fall to 9.6 mb/d, a yearly level last
seen in 2004. Given the rapidly evolving situation and high degree of uncertainty, our estimates
are under continuous review and will be revised as necessary.
In neighbouring Kazakhstan maintenance and repair work is making for erratic flows. Output
slumped during March and April due to unscheduled outages, is rebounding in May but is set to
fall again in June because of planned maintenance. Total oil production of crude oil and
condensates fell by 230 kb/d in April to 1.72 mb/d, with crude oil dropping by 190 kb/d to
1.41 mb/d due to repair of the Caspian Pipeline Consortium (CPC) loading terminal on Russia's
Black Sea coast. Before the unscheduled maintenance that started in March, total oil supply
stood at 1.95 mb/d.
By late April, the CPC terminal and pipeline returned to full capacity – with production recovering
to above 1.9 mb/d. Those higher rates are holding up so far this month, which suggests the
country’s top three fields – Tengiz, Kashagan and Karachaganak are pumping at or near March
levels. Kashagan, which had been producing around 400 kb/d, is due for maintenance from May
through July, with a full field shut down next month. Following the upgrade work, Kashagan
output is expected to rise to around 450 kb/d.
OPEC+ holds firm on policy The 23-member OPEC+ bloc agreed on 5 May to stick with its existing policy to raise crude oil
output in modest monthly increments. It endorsed a 432 kb/d supply rise for June, in line with its
8
9
10
11
12
Jan-20 Jul-20 Jan-21 Jul-21 Jan-22 Jul-22
mb/d
Russia Total Oil Supply
1.4
1.6
1.8
2.0
2.2
Jan-20 Jul-20 Jan-21 Jul-21 Jan-22 Jul-22
mb/d
Kazakhstan Total Oil Supply

Oil Market Report Supply
Page | 18 12 May 2022 IEA
. All
rig
hts
res
erve
d.
plan to phase out record cuts enforced in 2020 when demand collapsed in the wake of Covid. The
producer group is due to meet again on 2 June.
During April, total crude oil production from all 23 members of the OPEC+ bloc plunged 1.03 mb/d
to 43.12 mb/d. Production of crude from OPEC countries edged up 50 kb/d to 28.67 mb/d in April
as higher flows from Saudi Arabia and Iraq offset a hefty decline in Libya. Non-OPEC partners
pumped 14.45 mb/d, down 1.08 mb/d, led lower by Russian losses. The magnitude of the Russian
decline meant that - taking into account only the 19 members bound by the supply deal - output
tumbled 840 kb/d compared to a planned 400 kb/d increase. As a result, their combined
production trailed roughly 2.7 mb/d below target in April compared to a deficit of 1.3 mb/d the
previous month. Apart from Russia, many countries can’t keep up with rising targets due to
dwindling spare capacity and reduced operational efficiency. Prime examples are Nigeria and
Angola, which between them pumped nearly 800 kb/d below target in April.
Steady Rise of Middle East OPEC+ Core Gulf producers are tapping into their spare capacity to continue along an upward supply
trend through this year. From January 2021 to April 2022, Saudi Arabia, the UAE, Iraq and Kuwait
have added a combined 2.8 mb/d of crude oil and should boost that amount to 3.9 mb/d by
September when OPEC+ cuts are due to be phased out.
Only Saudi Arabia and the UAE hold substantial, readily available spare capacity and so far they
are lifting supply broadly in line with their previously-agreed OPEC+ quotas. During April,
Saudi Arabia pumped 10.4 mb/d of crude oil, up 120 kb/d m-o-m.
In Iraq, production rose 90 kb/d to 4.42 mb/d in April. Refinery glitches cut internal consumption,
but exports climbed 180 kb/d to 3.8 mb/d, the highest rate since March 2020. Shipments of
southern Basrah crude increased by 90 kb/d to 3.29 mb/d in April, while loadings from the north
rose by the same amount to 510 kb/d. Output in Kuwait inched up while supply held steady in the
UAE during April. In a rare move that suggests global trade flows may be readjusting to shifts in
Russian oil supplies, TotalEnergies’s shipping arm reportedly chartered a tanker to load Murban
crude from the UAE in early May for Europe.
-1.5
-1.0
-0.5
0.0
0.5
1.0
Jan
-21
Feb
Mar
Jun
Jul
Au
g
Sep
Oct
No
v
Dec
Jan
-22
Feb
Mar
Ap
r
mb/d
OPEC+ Crude Oil Production
(m-o-m change)
Russia Libya Kazakhstan Saudi Iraq Total Chg
34
36
38
40
42
44
Jan-21 Apr Jul Oct Jan-22 Apr Jul
mb/d
OPEC+-19 Target vs Production
Target
~3 mb/d Russian off-line from Jul
Russia Steady at Apr Level

Oil Market Report Supply
Page | 19 12 May 2022 IEA
. All
rig
hts
res
erve
d.
Iran’s crude oil output eased to 2.55 mb/d. Negotiations between Tehran and the West to revive
the 2015 nuclear deal have been on hold since March, primarily because Iran insists that the US
must remove the Islamic Revolutionary Guard Corps from its list of Foreign Terrorist
Organization. Iran could be a source of significant supplies if sanctions were to be eased, although
its return to the market would not happen overnight.
In terms of crude oil supply, Libya posted the second largest decrease within OPEC+, with output
falling 200 kb/d to 900 kb/d due to political unrest. Since mid-April, at least 500 kb/d has been
offline because of field and export terminal closures that forced the National Oil Corp (NOC) to
declare force majeure on loadings from several ports. On 1 May, NOC lifted force majeure at the
Zueitina oil terminal, which should see the resumption of some 90 kb/d. But at the time of writing,
the order remained in place at Libya’s biggest oil field, El-Sharara, and the nearby El-Feel in the
-2
-1
0
1
2
3
4
5
Jan-21 Apr Jul Oct Jan-22 Apr Jul
mb/d
Middle East Drives OPEC+ Crude Supply(Cumulative Change)
Saudi Iraq
UAE Kuwait
Other Middle East* Non-Mid East OPEC+
* Oman, Bahrain, Iran
-1.5 -1.0 -0.5 0.0 0.5 1.0 1.5 2.0
Russia
Nigeria
Angola
Kazakhstan
Malaysia
Azerbaijan
Saudi
Kuwait
Iraq
UAE
mb/d
OPEC+ Output vs Target, Spare Capacity*
Apr Output vs Target Apr Spare* Selected producers.
OPEC+ Crude Oil Production1
(million barrels per day)
Mar 2022 Apr 2022 April Apr 2022 Sustainable Spare Cap
Supply Supply Compliance Target Capacity2 vs Apr
Algeria 1.00 1.00 104% 1.00 1.00 0.00
Angola 1.14 1.18 446% 1.45 1.15 0.00
Congo 0.26 0.27 344% 0.31 0.29 0.02
Equatorial Guinea 0.09 0.10 450% 0.12 0.11 0.01
Gabon 0.20 0.19 -30% 0.18 0.20 0.01
Iraq 4.33 4.42 97% 4.41 4.82 0.40
Kuwait 2.64 2.65 110% 2.67 2.79 0.14
Nigeria 1.25 1.23 637% 1.74 1.52 0.29
Saudi Arabia 10.28 10.40 106% 10.44 12.24 1.84
UAE 3.03 3.03 85% 3.01 4.12 1.09
Total OPEC-10 24.22 24.47 162% 25.32 28.25 3.81
Iran3 2.58 2.55 3.80 1.25
Libya3 1.10 0.90 1.20 0.30
Venezuela3 0.72 0.75 0.75 0.00
Total OPEC 28.62 28.67 34.00 5.37
Azerbaijan 0.58 0.58 376% 0.68 0.60 0.02
Kazakhstan 1.60 1.41 340% 1.62 1.69 0.28
Mexico4 1.63 1.64 1.75 1.69 0.05
Oman 0.83 0.84 100% 0.84 0.87 0.03
Russia 10.00 9.10 337% 10.44 10.23 1.13
Others50.89 0.89 392% 1.05 0.94 0.05
Total Non-OPEC 15.53 14.45 330% 16.38 16.02 1.56
OPEC+-19 in cut deal4
38.12 37.28 223% 39.94 42.58 5.33
Total OPEC+ 44.15 43.12 50.02 6.93
1 Excludes condensates. 4 Mexico excluded from OPEC+ compliance. Only cut in May, June 2020.
2 Capacity levels can be reached within 90 days and sustained for extended period. 5 Bahrain, Brunei, Malaysia, Sudan and South Sudan.
3 Iran, Libya, Venezuela exempt from cuts.

Oil Market Report Supply
Page | 20 12 May 2022 IEA
. All
rig
hts
res
erve
d.
southwest as well as the eastern port of Marsa el-Brega. Because of its ongoing political crisis,
the country remains prone to supply outages.
Disruptions are also hitting output elsewhere in Africa. In Gabon, Perenco has reportedly
declared force majeure for 150 days following a late-April leak at its 130 kb/d Cap Lopez oil
terminal. Roughly 50 kb/d is expected to be offline. Crude production during April was 190 kb/d.
Perenco shut the terminal near Port Gentil after a storage tank leaked more than 300,000 barrels
of oil. The cause of the spill is still unclear.
Non-OPEC+ growth concerns linger Total oil volumes from non-OPEC+ countries grew by 380 kb/d to 47.2 mb/d in April, following
seasonally higher biofuels production and increased output from the US and Brazil. Non-OPEC+
oil supply is projected to average 48.1 mb/d in 2022, a boost of 1.8 mb/d y-o-y. The US is expected
to add 1.2 mb/d, or 64% of the non-OPEC+ 2022 gain. Growth will also come from Canada and
Guyana, up by 190 kb/d and 140 kb/d, respectively.
US output rose by an estimated 110 kb/d m-o-m in April to 17.3 m/d, driven by a seasonal rebound
in NGLs while a late winter freeze cut output in North Dakota. In February, the latest month for
which official data from the Energy Information Administration (EIA) is available, total oil supply
fell by 20 kb/d. February declines of 100 kb/d m-o-m in the Gulf of Mexico (GoM) were offset by a
marginal increase in onshore crude production and NGL volumes. Total US output is forecast to
average 17.9 mb/d in 2022, down 90 kb/d compared with last month’s Report.
US GoM 2022 annual volumes were revised down by 80 kb/d in this Report, primarily from lower
baseline production. Supply is nonetheless expected to increase by close to 100 kb/d y-o-y to
1.8 mb/d as new projects come online (Kings Quay, Power Nap, Mad Dog South and Vito) and
others such as Jack Saint Malo and Julia continue to grow.

Oil Market Report Supply
Page | 21 12 May 2022 IEA
. All
rig
hts
res
erve
d.
Box 1. Oilfield service sector strain caps US supply growth
Greater than expected weather effects at the start of the year, an extremely tight oilfield services
(OFS) sector and a recent slowdown in completions underpin a 90 kb/d downward revision to our
2022 US LTO forecast. While frack spreads, rigs and labour availability should allow for growth over
the course of the year, with output projected to rise by 1.1 mb/d on average to 8.3 mb/d, continued
tightness in oilfield services and supply chains could limit any upside.
US onshore oil rigs have increased year-to-date through the end of April by 71 rigs, or 15%, and from
one year ago there are 210 more oil rigs drilling, up 61%. Enverus, a consultancy and data provider,
estimates that 90% of super-spec drilling rigs are currently active and that 70% of high-spec rigs are
in the field. Additionally, hydraulic horsepower for frac crews is thought to be at 85-90% utilisation
rates, with US lower 48 total capacity 30-40% below its 2019 peak. Recent data from Rystad Energy
suggests that frac spreads have been steady since June 2021, averaging about 200 per month while
drilling has increased – this is confirmed by the growth seen in drilled but uncompleted (DUC) well
counts across multiple basins.
Recent commentary from publicly listed OFS executives and shale producers points to continued
tightness ahead. Two companies stated that the earliest delivery for new, currently uncontracted
frac crews would be 2023. Historically, this market structure would incentivise new capacity to be
built, but the sector has been structurally underinvested in since the 2015 price crash and after years
of lacklustre performance shareholders are pushing for higher returns. Companies are seeing the
current environment as a way to bolster margins, repair balance sheets and return cash as opposed
to investing in more capacity. As slack is taken out of the system, prices will continue to increase
leading shale producers to think twice about adding margin dilutive rigs; and any stops and starts to
the global supply chain could cause more hiccups in the oil patch.
In March, Canadian supply was relatively flat, according to data from the Alberta Energy
Regulator and Canada-Newfoundland & Labrador Offshore Petroleum Board (C-NLOPB).
Offshore production increased by 10 kb/d m-o-m for the second straight month, on higher
volumes from both Hebron and Hibernia. Total Canadian oil output in April fell by 50 kb/d on
reduced upgrader throughput and lower NGLs. Seasonal maintenance in the oil sands are

Oil Market Report Supply
Page | 22 12 May 2022 IEA
. All
rig
hts
res
erve
d.
expected to continue through June. Growth will, however, come in the second half of the year,
bringing full-year production to 5.8 mb/d, up 190 kb/d from 2021.
Brazilian supply edged up by 30 kb/d m-o-m in April to 3.1 mb/d, according to provisional daily
data from the Agencia Nacional do Petroleo (ANP). This gain comes after an increase of 50 kb/d
m-o-m in March. Brazil’s 2022 output is expected to average 3.2 mb/d, up 140 kb/d from 2021.
The Petrobras-operated Guanabara floating production storage and offloading (FPSO) vessel,
the first of four planned FPSOs in the Mero development, saw first oil in April. The FPSO is
expected to reach its 180 kb/d nameplate capacity by the end of the year. Additionally, the first
two wells of an 18 well increased oil recovery project at Roncador started up five months ahead
of schedule. These two wells are expected to produce 20 kb/d and reduce the carbon intensity of
the field.
Argentinean supply increased in April by 10 kb/d m-o-m to 700 kb/d on continued strength of
Neuquén LTO. Activity in Argentina’s main shale region is up three-fold from one year ago and
4% from March. High prices and commissioning of more take-away capacity are projected to
sustain growth rates in the region. Ecuadorian output was flat m-o-m in April, while Colombian
volumes fell by 10 kb/d to 740 kb/d. Production in Guyana gained 50 kb/d to 180 kb/d as the Unity
FPSO continues to ramp up. Peruvian supply fell in March by 20 kb/d due to flood damage on the
Oleducto Norperuano (ONP) pipeline and social unrest around Block 95 in the Maranon Basin in
the northern Amazon region. Both of these issues were reportedly resolved by mid-April.
North Sea loadings (as measured by BFOE plus Troll and Johan Sverdrup) are expected to
average 1.15 mb/d in the second quarter, down 110 kb/d q-o-q on planned maintenance at Johan
Sverdrup and fields in the Ekofisk area, with the majority of the decline expect in June and July.
UK output was essentially flat in April at 910 kb/d, and is expected to remain largely unchanged
on the year, averaging 900 kb/d – 20 kb/d higher than 2021 volumes. In concert with an
announcement by BP to invest an incremental $22.5 billion in the UK’s energy system by the end
of 2030, the UK’s Prime Minister and Energy Minister both backed away from calls for a windfall
tax on oil companies. Details of BP’s incremental investment in the region are to be forthcoming,
yet the company stated it will be used to help the country deliver on its dual ambitions of ensuring
energy security and reaching its net zero target.

Oil Market Report Supply
Page | 23 12 May 2022 IEA
. All
rig
hts
res
erve
d.
Data from the Norwegian Petroleum Directorate indicates that output in March was largely
unchanged around 2 mb/d. April supply increased by only 20 kb/d. Maintenance at Johan
Sverdrup and the Greater Ekofisk Area is expected to take 340 kb/d off the market in June and
200 kb/d in July. In September, maintenance work at Oseberg and the Sture oil terminal is
estimated to reduce volumes by 160 kb/d. For the year as a whole, production is projected to
average 2 mb/d, down 80 kb/d from 2021 levels, primarily due to the larger maintenance
programme this year.
In non-OPEC+ Africa, production from Ghana is projected to fall by 50 kb/d in April as
maintenance work is performed on the Jubilee field. Full-year output is expected to be flat y-o-y
at 170 kb/d. Recoverable resources from TotalEnergies’ Venus discovery offshore Namibia have
been revised upwards, from 3 billion barrels of oil equivalent (boe) when first discovered in
February 2022 to 13 billion boe, of which 10 billion barrels is oil. If these numbers are confirmed
by appraisal work, this would be the largest ever deepwater field to be found. This and the
neighbouring Graff oil discovery, owned by Shell, present strong opportunities for large volumes
of oil to be delivered in the later part of this decade.
Total Chinese oil production rose by 30 kb/d to 4.3 mb/d in March, primarily on continued
improvement in the Changqinq and Xinjiang provinces. Strong 1Q22 supply and PetroChina’s
comments during its recent earnings call have led us to revise Chinese full-year output upwards
by 50 kb/d to 4.2 mb/d, up 170 kb/d annually.

Oil Market Report Refining
Page | 24 12 May 2022
IEA
. All
rig
hts
res
erve
d.
Refining
Overview Global refinery throughputs in April plunged to 78 mb/d, the lowest level since May 2021. Most of
the 1.4 mb/d m-o-m decline came from China, where refiners cut back run rates in the wake of
severe lockdown measures. US refining activity in April was also underwhelming, with
operational issues and tight available capacity, leading to a counter-seasonal monthly fall. In
addition, Russian throughputs fell further in April on weaker domestic demand and limited fuel
oil and heavy feedstock export opportunities, while European and OECD Asian were in seasonal
maintenance.
Seven consecutive quarters of stock draws have drained product storage across the globe to
precariously low levels, especially in the emerging economies of Africa and Asia. Transport fuel
shortages started to curtail daily mobility and economic activity for large swathes of the
population in several African countries, Yemen and Sri Lanka. Jet fuel shortages have been
reported across Africa and even in Mexico.
Demand growth and rapidly depleting inventories have led refinery margins to unprecedented
levels across all regions and configurations. We expect a strong ramp-up in refining activity to fill
the product supply gap. From the seasonal low in April to the peak in August, global throughputs
are forecast to rise by 4.7 mb/d, helping restock depleted product inventories in 3Q22 for the first
time in two years. The increase will come mostly from China, Europe and the US.
On balance, there is more downside risk to the refinery throughput forecast than upside
potential. Depending on the severity of the EU sanctions package and the phase-in specifics,
Russian product exports could continue at lower levels or stop altogether. US refiners may not be
able to operate at the high utilisation rates assumed in our forecast. New capacity ramp-up in the
Middle East and refinery restarts in Europe, Latin America and Asia could be further delayed.
Crucially, the growth in 3Q22 throughputs would require crude oil stock draws on the order of
1.5 mb/d. While the IEA collective and member country individual stock releases have made more
than 230 mb of crude oil available to the market, upward pressure on prices may discourage
refiner appetite.
65
70
75
80
85
Jan Mar May Jul Sep Nov
mb/d Global Refining
Crude Throughput
2019 2020 2021 2022-4.0
-3.0
-2.0
-1.0
0.0
1.0
2.0
3.0
4.0
1Q19 3Q19 1Q20 3Q20 1Q21 3Q21 1Q22 3Q22
mb/d Global Refined Product Balance

Oil Market Report Refining
Page | 25 12 May 2022
IEA
. All
rig
hts
res
erve
d.
Product cracks and refinery margins In April, spot crude prices fell by $6-15/bbl, depending on the grade, but most product prices did
not follow suit, resulting in extraordinarily high product cracks in all trading hubs. Russian crude
seaborne crude oil exports increased by 260 kb/d m-o-m to 3.6 mb/d, their highest since April
2017 (see Box Russian oil exports increase in April), adding to the bearish factors for crude oil
prices.
Gasoline cracks reached record daily and monthly average levels in all trading regions. US Gulf
Coast cracks were up by $10/bbl m-o-m to $40/bbl. In Europe, which is a net exporter of gasoline,
cracks more than doubled to $21.40/bbl. Singapore gasoline cracks rose $3/bbl to $23.80/bbl.
Naphtha cracks, meanwhile, plunged to -$5/bbl in Singapore, leading to the first monthly average
negative value since June last year. In Europe, naphtha cracks remained negative but halved their
discount to crude oil to -$2.80/bbl, as refinery maintenance and rejection of Russian origin
product supported prices.
Global Refinery Crude Throughput1
(million barrels per day)
2019 2020 4Q21 2021 Feb-22 Mar-22 1Q22 Apr-22 May-22 Jun-22 2Q22 3Q22 4Q22 2022
Americas 19.2 16.6 18.2 17.8 18.3 18.5 18.4 18.4 19.1 19.4 19.0 19.1 18.6 18.8
Europe 12.2 10.7 11.5 11.0 11.2 10.9 11.1 11.2 11.0 11.7 11.3 11.8 11.7 11.5
Asia Oceania 6.8 5.9 6.0 5.8 6.3 6.0 6.2 5.7 5.5 5.4 5.5 6.1 6.1 6.0
Total OECD 38.1 33.2 35.7 34.5 35.8 35.5 35.7 35.3 35.6 36.4 35.8 37.0 36.4 36.2
FSU 6.8 6.4 6.8 6.7 6.7 6.1 6.6 5.6 5.2 5.2 5.3 5.3 5.4 5.6
Non-OECD Europe 0.5 0.4 0.4 0.4 0.4 0.4 0.5 0.4 0.4 0.5 0.4 0.5 0.5 0.5
China 13.4 13.8 14.1 14.2 14.1 13.8 14.0 13.1 13.8 14.2 13.7 14.5 14.7 14.2
Other Asia 10.3 9.3 9.9 9.5 10.3 10.1 10.2 10.1 10.6 10.6 10.4 10.7 10.7 10.5
Latin America 3.2 3.0 3.3 3.2 3.3 3.4 3.3 3.4 3.5 3.6 3.5 3.5 3.6 3.5
Middle East 7.8 7.1 8.0 7.6 7.7 8.1 7.9 8.2 8.4 8.6 8.4 8.6 8.8 8.4
Africa 2.0 1.9 1.9 1.8 1.9 1.9 1.9 1.8 1.9 1.9 1.9 1.9 1.9 1.9
Total Non-OECD 44.0 41.9 44.4 43.6 44.5 43.9 44.3 42.7 43.7 44.4 43.6 44.9 45.5 44.6
Total 82.1 75.1 80.1 78.1 80.3 79.3 80.0 78.0 79.3 80.9 79.4 82.0 81.9 80.8
Year-on-year change -0.2 -7.1 4.2 3.0 5.9 3.1 4.1 0.8 2.2 2.1 1.7 3.4 1.8 2.8 1 Preliminary and estimated runs based on capacity, known outages, economic runcuts and global demand forecast.
-5
10
25
40
55
70
Jan Feb Mar Apr May Jun Jul Aug Sep Oct Nov Dec
$/bbl US Gulf Coast Gasoline Crack
2019 2020 2021 2022
Argus Media Ltd -10
0
10
20
30
40
Jan Feb Mar Apr May Jun Jul Aug Sep Oct Nov Dec
$/bbl NW Europe Gasoline Crack
2019 2020 2021 2022
Argus Media Ltd

Oil Market Report Refining
Page | 26 12 May 2022
IEA
. All
rig
hts
res
erve
d.
In Northwest Europe, diesel cracks resumed their upward march, gaining $10/bbl m-o-m to reach
a record-high of $47.20/bbl in April. Premiums for guaranteed non-Russian origin product
reportedly added another $4/bbl to the quoted prices. Crucially, kerosene cracks topped diesel
by $1.70/bbl, their first such premium since October 2019. European diesel shortages lifted all
other regional quotes to record levels. In fact, US Gulf Coast diesel and kerosene prices were
above European levels, reflecting the strength of the pull from Latin American importers, bidding
up US barrels against the European contenders. The disappointing US refining performance in
April meant that the 150 kb/d m-o-m increase in US refined product exports in April came from a
Apr-Mar Week Ending
Chg % 08 Apr 15 Apr 22 Apr 29 Apr 06 May
Rotterdam, Barges FOB Differential to North Sea Dated
Gasoline EBOB oxy 106.55 127.41 125.68 -1.73 -1.4 123.50 122.65 127.37 128.74 138.48 8.54 8.66 21.43 12.77
Naphtha 96.44 113.24 101.44 -11.80 -10.4 100.71 102.67 102.84 99.74 100.63 -1.57 -5.51 -2.81 2.71
Jet/Kerosene 109.98 150.44 153.17 2.73 1.8 146.03 148.25 155.33 163.79 170.88 11.97 31.69 48.92 17.23
ULSD 10ppm 112.77 156.47 151.46 -5.01 -3.2 143.53 148.07 155.89 158.30 159.12 14.76 37.73 47.22 9.49
Gasoil 0.1% 110.26 151.41 145.48 -5.93 -3.9 136.59 141.16 149.41 154.58 156.71 12.25 32.66 41.23 8.57
VGO 2.0% 97.83 124.68 124.92 0.25 0.2 123.53 124.24 127.18 124.97 128.47 -0.18 5.93 20.68 14.75
Fuel Oil 0.5% 106.08 129.40 122.73 -6.68 -5.2 122.72 122.68 123.14 121.55 121.66 8.07 10.65 18.48 7.83
LSFO 1% 91.90 110.94 98.73 -12.21 -11.0 99.39 97.75 99.36 97.58 101.85 -6.11 -7.81 -5.52 2.30
HSFO 3.5% 81.00 97.98 91.93 -6.05 -6.2 93.04 90.75 91.73 90.97 97.51 -17.01 -20.77 -12.32 8.45
Mediterranean, FOB Cargoes Differential to Urals
Premium Unl 10 ppm 108.01 128.55 126.02 -2.53 -2.0 124.17 122.30 127.73 129.55 138.84 13.07 35.96 53.59 17.63
Naphtha 93.90 110.29 97.78 -12.51 -11.3 98.20 98.29 98.04 96.16 97.11 -1.04 17.69 25.34 7.65
Jet Aviation fuel 108.03 148.12 150.30 2.18 1.5 144.29 144.62 151.24 161.09 168.48 13.09 55.53 77.86 22.33
ULSD 10ppm 110.31 153.21 147.98 -5.23 -3.4 139.67 144.51 152.53 155.28 155.44 15.37 60.61 75.54 14.93
Gasoil 0.1% 109.08 146.07 142.97 -3.10 -2.1 134.17 138.59 147.08 152.17 152.83 14.14 53.48 70.53 17.05
LSFO 1% 93.09 115.65 105.01 -10.64 -9.2 106.05 103.91 105.25 103.83 108.04 -1.85 23.06 32.57 9.52
HSFO 3.5% 78.87 95.64 89.21 -6.43 -6.7 90.26 87.30 88.98 88.66 94.96 -16.07 3.05 16.78 13.73
US Gulf, FOB Pipeline Differential to WTI Houston
Super Unleaded 116.98 140.78 143.25 2.47 1.8 136.21 143.85 145.53 148.68 163.08 23.75 30.52 40.32 9.80
Jet/Kerosene 112.50 145.78 156.86 11.08 7.6 147.59 148.87 161.93 168.05 177.84 19.27 35.52 53.93 18.41
ULSD 10ppm 118.06 151.09 160.12 9.03 6.0 148.65 152.38 164.26 175.78 179.74 24.83 40.84 57.20 16.36
Heating Oil 104.17 136.20 136.68 0.48 0.4 125.79 131.10 145.24 144.15 152.92 10.94 25.95 33.75 7.81
No. 6 3%* 80.13 93.44 89.41 -4.03 -4.3 86.78 88.45 91.25 91.16 93.70 -13.10 -16.81 -13.51 3.30
Singapore, FOB Cargoes Differential to Dubai
Premium Unleaded 110.72 131.07 126.73 -4.34 -3.3 123.51 122.85 131.49 129.54 141.27 18.25 20.58 23.82 3.24
Naphtha 95.75 111.42 97.75 -13.67 -12.3 97.69 99.21 100.15 94.41 95.43 3.28 0.93 -5.16 -6.09
Jet/Kerosene 106.17 134.32 134.35 0.04 0.0 131.41 130.00 138.71 136.74 149.00 13.69 23.83 31.45 7.62
Gasoil 0.001% 110.70 142.57 148.86 6.29 4.4 142.58 146.30 155.74 152.33 162.83 18.22 32.08 45.95 13.87
Fuel Oil 0.5% 111.24 134.07 125.16 -8.91 -6.6 124.36 125.04 128.61 122.81 129.65 18.76 23.58 22.26 -1.33
HSFO 180 CST 82.63 103.13 110.91 7.78 7.5 110.19 111.24 111.61 111.10 114.87 -9.85 -7.36 8.00 15.36
HSFO 380 CST 4% 81.08 99.20 104.14 4.94 5.0 103.84 102.36 106.03 103.98 106.85 -11.40 -11.29 1.23 12.52
Copyright © 2021 Argus M edia Ltd - A ll rights reserved * Waterborne
Chg
Spot Product Prices
(mo nthly and weekly averages, $ / bbl)
AprFeb Mar Apr Feb Mar
0
10
20
30
40
50
60
70
80
Jan Feb Mar Apr May Jun Jul Aug Sep Oct Nov Dec
$/bbl NW Europe Diesel Crack
2019 2020 2021 2022
Argus Media Ltd
-10
0
10
20
30
40
50
60
70
80
Jan Feb Mar Apr May Jun Jul Aug Sep Oct Nov Dec
$/bbl NW Europe Jet Kerosene Crack
2019 2020 2021 2022
Argus Media Ltd

Oil Market Report Refining
Page | 27 12 May 2022
IEA
. All
rig
hts
res
erve
d.
500 kb/d stock draw that pushed US distillate fuel inventories to their lowest levels since
March 2005.
Fuel oil cracks were helped by lower crude prices in April and tighter markets as US buyers (the
principal importer of Russian fuel) sought alternative molecules following the country’s embargo
on Russian oil. Northwest Europe high sulphur fuel oil (HSFO) cracks strengthened by $8/bbl
to -$12.30/bbl, an unusually narrow ratio to crude prices. In Singapore, HSFO cracks turned
positive on a monthly average basis, which reflected the impact of the recent bunker fuel
contamination.
All of our refinery margin indicators were in double-digit territory in April for the first time,
regardless of region and complexity. The current almost universal product shortage, low
inventories and refinery capacity bottlenecks have led to inelastic short-term supply, pushing
cracks for almost all products to extraordinarily high levels. Refiners running Urals are enjoying
even more impressive windfalls. Our indicative margin for a Northwest Europe cracking refinery
on Urals averaged $55/bbl in April. Polish refiner Lotos disclosed their April margin at $59/bbl,
which they calculate based on Urals quotes. Hungary’s Mol, which is supplied Urals by the
Druzhba pipeline, withdrew the publication of its monthly margin indicator for April.
-45
-40
-35
-30
-25
-20
-15
-10
-5
0
5
Jan Feb Mar Apr May Jun Jul Aug Sep Oct Nov Dec
$/bbl NWE HSFO Crack
2019 2020 2021 2022
Argus Media Ltd -45
-40
-35
-30
-25
-20
-15
-10
-5
0
5
Jan Feb Mar Apr May Jun Jul Aug Sep Oct Nov Dec
$/bbl NW Europe HSFO Crack
2019 2020 2021 2022
Argus Media Ltd
-3159
131721252933374145
Mar 21 Jun 21 Sep 21 Dec 21 Mar 22
$/bbl Regional Refining Margins Daily
USGC ASCI coking
NWE Brent cracking
Singapore Dubai cracking
-2
3
8
13
18
23
28
33
Mar 20 Sep 20 Mar 21 Sep 21 Mar 22
$/bbl Regional Refining Margins Monthly
USGC ASCI coking
NWE Brent cracking
Singapore Dubai cracking
Data Source: IEA/KBC

Oil Market Report Refining
Page | 28 12 May 2022
IEA
. All
rig
hts
res
erve
d.
Regional refining developments US throughputs in April fell 90 kb/d m-o-m to 15.7 mb/d, in contrast with the seasonal trend of
second-quarter increases. The decline was due to outages on the West Coast, with the Gulf Coast
and Midcontinent regions largely flat m-o-m, despite extremely attractive refinery margins.
Several refineries experienced unplanned outages, and the available capacity in the system was
too tight to respond. Utilisation rates were above 89% in March and April. US buyers, mostly
refiners and blenders, are phasing out purchases of Russian oil, primarily refinery feedstocks.
They did not lift any Russian barrels in April, but some 160 kb/d landed during that month, from
earlier purchases, down from about 600 kb/d on average in 2021. US refiners had accelerated
purchases of Russian oil after the introduction of sanctions on Venezuela in 2019. In their first-
quarter earnings calls several US refiners noted possible difficulties in securing alternatives for
heavy feedstocks.
IEA/KBC Global Indicator Refining Margins1
($/bbl)
M onthly Average Change Average for week ending:
Jan 22 Feb 22 Mar 22 Apr 22 Apr-Mar 08 Apr 15 Apr 22 Apr 29 Apr 06 May
NW Europe
Brent (Cracking) 4.29 3.28 11.84 22.33 10.50 18.48 19.51 23.39 28.27 25.96
Urals (Cracking) 4.14 7.04 38.78 55.01 16.23 51.63 52.69 56.13 60.54 58.02
Brent (Hydroskimming) 1.29 -0.37 6.26 14.30 8.05 11.48 12.01 15.06 18.81 15.65
Urals (Hydroskimming) -0.84 0.76 29.76 45.32 15.56 43.24 43.40 45.76 49.55 47.06
Mediterranean
Es Sider (Cracking) 5.66 4.21 15.62 24.45 8.83 20.02 21.18 25.83 30.81 27.46
Urals (Cracking) 4.21 5.16 38.66 55.11 16.44 50.80 52.29 56.52 61.59 58.13
Es Sider (Hydroskimming) 2.95 0.79 9.46 16.61 7.15 13.77 13.84 17.38 21.25 17.84
Urals (Hydroskimming) -2.05 -2.40 26.15 41.65 15.50 39.35 39.22 42.12 46.20 43.35
US Gulf Coast
Mars (Cracking) 7.84 8.11 11.76 16.98 5.22 15.95 14.67 15.39 20.87 24.77
50/50 HLS/LLS (Coking) 15.17 17.29 27.01 36.25 9.24 32.11 32.47 36.40 43.74 48.46
50/50 Maya/Mars (Coking) 11.43 12.33 18.13 25.71 7.58 22.23 21.93 25.32 32.83 36.79
ASCI (Coking) 13.01 14.73 22.13 30.24 8.11 27.56 26.71 29.25 36.62 41.08
US Midwest
30/70 WCS/Bakken (Cracking) 8.21 9.14 16.10 24.20 8.10 19.53 20.92 25.20 31.15 33.90
Bakken (Cracking) 9.29 11.05 20.22 30.39 10.17 24.71 26.84 31.73 38.42 41.79
WTI (Coking) 10.74 11.89 22.74 34.23 11.49 28.74 30.90 35.19 42.23 46.32
30/70 WCS/Bakken (Coking) 10.49 12.22 21.75 31.79 10.04 26.02 28.08 33.13 40.05 43.62
Singapore
Dubai (Hydroskimming) -1.31 -1.47 2.11 11.86 9.74 10.81 11.67 11.54 13.58 16.20
Tapis (Hydroskimming) 1.02 -0.76 2.82 15.45 12.62 13.55 14.00 18.15 17.94 18.01
Dubai (Hydrocracking) 8.56 10.35 16.87 23.58 6.72 21.41 23.46 24.37 25.92 31.03
Tapis (Hydrocracking) 0.95 -1.02 3.12 17.80 14.68 15.21 15.72 20.92 21.37 22.01
1 Global Indicator Refining M argins are calculated for various complexity configurations, each optimised for processing the specific crude(s) in a specific refining
centre. M argins include energy cost, but exclude other variable costs, depreciation and amortisation. Consequently, reported margins should be taken as an
indication, or proxy, o f changes in profitability for a given refining centre. No attempt is made to model or o therwise comment upon the relative economics of
specific refineries running individual crude slates and producing custom product sales, nor are these calculations intended to infer the marginal values of crude
for pricing purposes.
Sources: IEA, KBC Advanced Technologies (KBC).

Oil Market Report Refining
Page | 29 12 May 2022
IEA
. All
rig
hts
res
erve
d.
US refinery throughputs are expected to rise by 680 kb/d in 3Q22 compared to 1Q22, but this may
not increase available export barrels as domestic demand for main refined products – gasoline,
kerosene and diesel – is set to gain seasonally by almost as much. For this throughput increase
we assume record high utilisation rates, but the ability of plants to resist operational stress and
the hurricane season at the end of summer may yet affect our forecast. Currently, US refiners are
the most flexible in terms of yield switches between gasoline, kerosene and diesel. The output
for the first two products is largely driven by domestic demand, while the call on US diesel exports
will skyrocket as Europe seeks to replace Russian-origin product. US refiners have increased
kerosene output in recent months, although yields are yet to reach their usual double-digit levels.
Competition between the three products for available molecules will be intense, leading to
persistently high and volatile cracks.
The government of the US Virgin Islands asked President Biden to help restart the 200 kb/d
refinery formerly operated by Limetree Bay. The plant was shut by the US Environmental
Protection Agency last year after just a few months of operations, due to pollution concerns.
When it operated, it exported mostly low sulphur fuel oil for the Caribbean bunkers market.
Mexican throughputs in March fell to 825 kb/d. April runs likely declined further due to a fire at
the Salina Cruz refinery, which shut the plant for several days. The government plans to officially
launch the newly built 340 kb/d Olmeca refinery in July but the work is not yet completed. The
refinery may only run in a test mode this year, without producing on-specification fuels.
Refinery throughputs in Europe fell by 330 kb/d m-o-m in March, to just 10.9 mb/d, the lowest
level since June 2021. Preliminary data from Euroilstock indicate that runs increased by around
350 kb/d in April. TotalEnergies announced that the 220 kb/d Donges refinery in France will
restart this month, following a 17-month shutdown. In Germany, the future of the 230 kb/d
Schwedt refinery is increasingly uncertain. In January, Rosneft agreed with Shell to buy the
latter’s 37.5% stake, bringing its total share to 92%. The German government has suspended the
approval of this deal and has been discussing the nationalisation of Rosneft’s share. Shell said in
early May it will continue as a minority shareholder in the plant, but will eventually seek to sell its
stake.
This refinery, along with TotalEnergies’s Leuna, receives most of its crude from the Druzhba
pipeline, making Germany the largest offtaker, with a 43% share. At the same time, Germany has
the lowest overall reliance on the pipeline compared to other customers, with more than 80% of
its crude imported through other routes. Both refineries are connected to ports in Germany and
Poland. However, the capacity of the line to Rostock in Germany, which is not in regular use,
12
13
14
15
16
17
18
Jan Mar May Jul Sep Nov
mb/d US
Crude Throughput
2019 2020 2021 2022
0
0.1
0.2
0.3
0.4
0.5
0.6
0.7
0.8
0.9
Jan-17 Jan-18 Jan-19 Jan-20 Jan-21 Jan-22
mb/d US Oil Imports
Venezuela RussiaSources: EIA, Kpler

Oil Market Report Refining
Page | 30 12 May 2022
IEA
. All
rig
hts
res
erve
d.
combined with the available capacity of the pipeline to the port of Gdansk in Poland, could cover
only 60% of these two refineries’ feedstock requirements.
With the EU embargo on Russian imports currently being discussed, attention is focused on
Druzhba flows that mostly serve landlocked refineries in Eastern and Central Europe. Poland is
the second largest offtaker, accounting for 23% of flows. In 2021, the country sourced 35% of its
crude through the pipeline. Polish refiners started switching to alternative suppliers even before
the Russian invasion into Ukraine, by cutting seaborne imports first, where Russian origin barrels
accounted for almost as much as Druzhba deliveries in 2021.
Due to their landlocked situation, countries on the southern branch of the pipeline are in a less
advantaged position in terms of alternative supply routes, even as together they only import just
a third of the total. Slovakia is the largest offtaker on the southern branch, with 105 kb/d, taking
essentially all of its crude imports via the Druzhba pipeline. Hungary and the Czech Republic take
around 70 kb/d each, accounting for 50% and 60% of their crude oil imports respectively. In
principle, the Adria pipeline from the Croatian port of Omisalj can offer an alternative to Druzhba
for both refineries in Slovakia and Hungary, even as the route has yet to be tested in full capacity
mode. For the Czech Republic, one option is a capacity upgrade of the Transalpine (TAL) pipeline
that starts at the port of Trieste in Italy. Another possibility is Germany’s Miro refinery in
Karlsruhe switching some supply to the SPSE pipeline from the French port of Fos, freeing up TAL
capacity for Czech refineries. The 450 kb/d SPSE pipeline serves the 110 kb/d Feyzin refinery in
France and the 70 kb/d Cressier refinery in Switzerland, with the mainline section to Germany
currently idle.
In OECD Asia, refinery intake continues to
decline seasonally from winter peak run
rates. In March, throughputs fell 245 kb/d
m-o-m. At the end of April, Japanese
refiner Eneos restarted the Chiba and
Sendai refineries that were shut
mid-March following a powerful
earthquake. The government increased
the upper limit of subsidies available to
refiners and importers to an equivalent of
$42/bbl and included jet fuel in the
consumer basket of oil products covered
9
10
11
12
13
Jan Mar May Jul Sep Nov
mb/d OECD Europe
Crude Throughput
2019 2020 2021 2022
0
50
100
150
200
250
300
350
0%
20%
40%
60%
80%
100%
Czech Hungary Slovakia Poland Germany
kb/dDruzhba Shipments in 2021
Druzhba Other imports Druzhba volumes, RHS
5.0
5.5
6.0
6.5
7.0
7.5
Jan Mar May Jul Sep Nov
mb/d OECD Asia Oceania
Crude Throughput
2019 2020 2021 2022

Oil Market Report Refining
Page | 31 12 May 2022
IEA
. All
rig
hts
res
erve
d.
by the scheme. Japan and Korea have not announced embargoes on Russian oil yet but Japan is
considering a gradual phase-out. Both countries imported close to normal levels of Russian
barrels in April but their refiners have announced plans to reduce future purchases. Korean
refiners are looking for alternatives to Russian naphtha and light crude grades Sokol and ESPO.
New Zealand’s sole refinery, the 130 kb/d Marsden Point plant, did not import any crude in April
and is likely running down inventories in preparation for a permanent shutdown this summer.
Chinese crude runs declined 270 kb/d m-o-m in March to 13.8 mb/d and were down 500 kb/d
y-o-y. April throughputs are estimated to have fallen further, likely to their lowest level since
March 2020. The peak impact from Covid lockdowns is expected in 2Q22, with demand
recovering to year-earlier levels in the
second half of 2022. We have revised down
our forecasts for 2Q22 by 500 kb/d and
3Q22 by 200 kb/d, resulting in a small
overall decline of 25 kb/d in 2022, which
would be the first since 1998. Apart from
domestic demand issues, the potential cut
of product exports is also weighing on
refinery activity prospects. The Chinese
government is reportedly planning to
phase out transport fuel exports already in
2023, earlier than the previously planned
2025 deadline, in an effort to accelerate
transition to net zero.
Refinery Crude Throughput and Utilisation in OECD Countries(million barrels per day)
Change from Utilisation rate
Oct 21 Nov 21 Dec 21 Jan 22 Feb 22 Mar 22 Feb 22 Mar 21 Mar 22 Mar 21
US1 15.05 15.73 15.76 15.45 15.38 15.79 0.41 1.41 90% 81%
Canada 1.63 1.83 1.82 1.80 1.84 1.72 -0.12 0.02 90% 84%
Chile 0.18 0.14 0.19 0.19 0.21 0.21 0.00 0.01 92% 84%
Mexico 0.74 0.72 0.76 0.79 0.85 0.83 -0.03 0.00 50% 87%
OECD Americas1 17.60 18.43 18.52 18.23 18.28 18.54 0.26 1.36 87% 79%
France 0.72 0.79 0.78 0.80 0.78 0.80 0.01 0.19 70% 54%
Germany 1.90 1.93 1.88 1.71 1.82 1.72 -0.10 0.18 85% 76%
Italy 1.38 1.39 1.25 1.13 1.11 1.23 0.12 0.06 71% 68%
Netherlands 1.13 1.05 0.95 0.96 0.90 0.94 0.04 -0.18 78% 93%
Spain 1.12 1.20 1.23 1.23 1.22 1.17 -0.04 0.11 83% 75%
United Kingdom 0.91 1.04 1.03 1.04 1.02 1.05 0.03 0.35 87% 59%
Other OECD Europe2 4.23 4.38 4.37 4.30 4.38 4.00 -0.39 -0.05 82% 82%
OECD Europe 11.39 11.78 11.49 11.18 11.23 10.90 -0.33 0.64 80% 74%
Japan 2.50 2.62 2.93 2.85 2.82 2.73 -0.10 0.28 79% 71%
South Korea 2.72 2.71 2.81 2.91 2.87 2.78 -0.09 0.25 79% 72%
Other Asia Oceania3 0.56 0.58 0.58 0.58 0.59 0.54 -0.05 -0.07 83% 70%
OECD Asia Oceania 5.79 5.92 6.32 6.34 6.29 6.04 -0.24 0.46 79% 71%
OECD Total 34.78 36.12 36.33 35.76 35.80 35.48 -0.32 2.47 83% 76%
1 US includes US50, OECD Americas include Chile and US territories
2 Includes Lithuania
3 Includes Israel
10
11
12
13
14
15
16
Jan Mar May Jul Sep Nov
mb/d China
Crude Throughput
2019 2020 2021 2022

Oil Market Report Refining
Page | 32 12 May 2022
IEA
. All
rig
hts
res
erve
d.
Refinery throughputs in India fell slightly to
5.2 mb/d in March from the record levels of
February. Indian refiners loaded about
770 kb/d of Russian crude in April,
compared to less than 50 kb/d imported on
average in 2021. We forecast Indian
refining activity up by 510 kb/d this year,
which results in a similar increase in crude
oil import requirements. The 300 kb/d
Pengerang refinery in Malaysia restarted
this month, according to news reports.
Saudi throughputs were down 270 kb/d in
February on refinery maintenance, while
Iraq reported the highest runs since November 2019, at 630 kb/d. The Kuwait Integrated
Petroleum Industries Company said the trial run of one of Al-Zour’s three 205 kb/d crude
distillation units is expected to start in coming weeks. We have revised UAE refinery throughputs
higher based on newly reported 2020 annual statistics, moving the baseline up by 170 kb/d.
According to preliminary data, Russian refinery throughputs in April fell 310 kb/d to 4.9 mb/d, the
lowest since 2011, on reduced exports and domestic demand. The cumulative decline from
February is now at almost 1 mb/d and is expected to deepen further to 1.4 mb/d as more sanctions
are put in place. Most of the decline so far has come from reduced product exports as a result of
the US and UK sanctions (see Box Russian oil exports increase in April). Belarus has reportedly
started exporting fuel to Russia, having lost access to the Ukrainian market.
Box 2. Russian oil exports increase in April
Despite the sanctions currently in place, and talk of more to come, total Russian oil exports increased
by 620 kb/d in April, to 8.1 mb/d, back to the January-February average. Nevertheless, the
reorientation of trade flows is already taking shape, with a notable shift of volumes from Europe and
the US to India. The US was the second country to declare an embargo on Russian oil imports, with
no cargoes loaded in Russia in April for delivery to the US. Shipments to the UK, also sanctioned, all
but stopped, too. Most product volumes previously going to the US and the UK have yet to find
6.0
6.5
7.0
7.5
8.0
8.5
9.0
Jan Mar May Jul Sep Nov
mb/d Middle East
Crude Throughput
2019 2020 2021 2022
4.5
5.0
5.5
6.0
6.5
7.0
7.5
Jan Mar May Jul Sep Nov
mb/d FSU
Crude Throughput
2019 2020 2021 2022
3.0
3.5
4.0
4.5
5.0
5.5
6.0
Jan Mar May Jul Sep Nov
mb/d India
Crude Throughput
2019 2020 2021 2022

Oil Market Report Refining
Page | 33 12 May 2022
IEA
. All
rig
hts
res
erve
d.
alternative markets, leading to lower refinery throughputs. This has resulted in higher crude oil
exports in April despite production cuts.
Our preliminary assessment of Russian oil trade is primarily based Kpler tanker tracking data. We
aggregate loadings by seller and by port to distinguish between Russian and non-Russian origin
barrels, as Russian Black and Baltic Sea ports also ship Central Asian and Caspian crude and products
for exports. For overland flows we assumed no change in Druzhba deliveries, based on preliminary
reports; a 40% reduction in rail exports to the EU countries; a monthly increase in crude deliveries to
Belarus and no change in deliveries to China.
Total Russian oil exports in April increased by 620 kb/d m-o-m to 8.1 mb/d, largely in line with the
January-February average. Reductions in shipments to the EU (-535 kb/d), US (-545 kb/d) and the UK
(-160 kb/d) were primarily offset by increases to India (+730 kb/d) and Turkey (+180 kb/d).
The EU remained the largest market for Russian oil exports in April, with 3.4 mb/d, or 43%. Its share,
however, was down from 50% at the start of the year, with volumes falling by 535 kb/d. The US and
the UK together accounted for 9% of Russian exports earlier in the year, but their share went to zero
in April. These falls were offset by increased loadings to India (+730 kb/d), with its market share up
0
2
4
6
8
Jan-22 Feb-22 Mar-22 Apr-22
mb/d Total Russian Oil Exports
EU crude EU products Other Europe
China US OECD Asia
India FSU Unknown
RoW Sources: IEA, Argus, Kpler
6.2
6.6
7.0
7.4
7.8
8.2
Jan-Feb
average
Reductions Increases April exports
mb/d
Th
ou
san
ds
April vs Jan-Feb
EU crude EU prods US crude
US prods UK total Other
India crude Turkey total Unknown/Other
Sources: IEA, Argus, Kpler

Oil Market Report Refining
Page | 34 12 May 2022
IEA
. All
rig
hts
res
erve
d.
from zero to 10%, and Turkey (+180 kb/d). Some 430 kb/d, or 7% of April seaborne volumes were
missing destination information. This was mostly the case for fuel oil and naphtha cargoes, likely
implying ship-to-ship transfers for subsequent exports to Asia.
Crude oil exports increased by 520 kb/d m-o-m in April and 630 kb/d versus the Jan-Feb average.
Exports to the EU fell by 65 kb/d m-o-m, and by a total of 330 kb/d compared to the pre-war average.
The EU’s share in total crude exports went down from 49% in January-February to 37% in April, while
India’s share increased from nothing to 14%. China’s share was marginally down from 33% to 30%.
For products, volumes backed out of the US, EU and the UK (450 kb/d, 205 kb/d and 140 kb/d,
respectively) were only partly offset by an increase in undisclosed destinations (+300 kb/d). Diesel
exports fell by 60 kb/d m-o-m to 815 kb/d, and
by 155 kb/d compared to the pre-war average.
Volumes to the EU fell by just 43 kb/d compared
to January-February average, but its share in
Russian diesel offtake increased from 62% to
69%.
Despite higher exports, estimated export
revenues fell m-o-m by $2.3 bn, due to lower
prices. We assume a 25% discount to European
products assessments for the purpose of these
calculations. However, total oil export revenues
were up by more than 50% y-o-y for the first
four months of the year compared to the same period last year.
Refinery runs increased in March in Brazil and Argentina. In Peru, Petroperu started trial runs at
its expanded 95 kb/d Talara site in mid-April, after a two-year closure. There has been no news
concerning the restart of Repsol’s 120 kb/d La Pampilla refinery that was ordered to shut after an
oil spill in January at the jetty. Repsol had previously said it was going to finish cleaning operations
by end-March. Jamaica’s sole refinery, the 35 kb/d Petrojam facility, was forced to shut in April
due to a fire.
0
1
2
3
4
5
6
Jan-22 Feb-22 Mar-22 Apr-22
mb/d Russian Crude Oil Exports
EU seaborne EU Druzhba Turkey
China seaborne China overland OECD Asia
India FSU RoW
Sources: IEA, Argus, Kpler
0.0
0.5
1.0
1.5
2.0
2.5
3.0
3.5
Jan-22 Feb-22 Mar-22 Apr-22
mb/d Russian Product Exports
EU products US products UK products
Turkey products FSU Unknown
RoWSources: IEA, Argus, Kpler

Oil Market Report Refining
Page | 35 12 May 2022
IEA
. All
rig
hts
res
erve
d.
African throughput in April was estimated at 1.9 mb/d, 90 kb/d higher m-o-m. There has been a
flurry of announcements regarding work progress of several greenfield or expansion projects.
Algeria’s Sonatrach said it is preparing to start a new 60 kb/d refinery in Hassi Massoud this year.
The Angolan government reported that the equipment for the 30 kb/d first phase of the Cabinda
refinery is ready to be shipped from Houston. Nigeria expects to complete the first phase of the
210 kb/d Port Harcourt refinery rehabilitation next year and bring online a 60 kb/d train.
Meanwhile, an explosion at one of the country’s numerous illegal “bush” refineries reportedly
killed 100 people in April. The country’s 650 kb/d Lekki refinery is expected to start up in early
2023. The Zambian government reiterated their plan to shut down the country’s sole 40 kb/d
refinery by the end of this year and convert the crude oil pipeline from a Tanzanian port to carry
imported refined products. The refinery has likely been idle since 2Q20, based on data for cargo
discharges at the port of Dar Es Salam.
2.0
2.5
3.0
3.5
4.0
Jan Mar May Jul Sep Nov
mb/d Latin America
Crude Throughput
2019 2020 2021 2022
1.6
1.8
2.0
2.2
2.4
Jan Mar May Jul Sep Nov
mb/d Africa
Crude Throughput
2019 2020 2021 2022

Oil Market Report Stocks
Page | 36 12 May 2022 IEA
. All
rig
hts
res
erve
d.
Stocks
Overview Global observed oil inventories slumped by a further 45 mb during March, extending the declines
ongoing since June 2020. Over the past 22 months, a total of 1.2 billion barrels have been drawn
from storage tanks, which now stand at their lowest levels since at least 2016 when our data series
start. Approximately 60% of the decline has come from OECD countries, 16% from non-OECD
crude stocks mainly derived from satellite observations, and the remainder from oil on the water.
Scant information is available for product stocks, crude held in underground caverns or fixed roof
tanks in non-OECD countries. Product holdings in China rose in March after stringent lockdowns
slashed domestic consumption. Russian crude and product stocks also increased sharply as
sellers struggled to place cargoes following the Russian invasion of Ukraine.
In the OECD, a first round of emergency stock releases during March halted the precipitous
decline in industry inventories. According to preliminary data, 24.7 mb (800 kb/d) of government
stocks were made available to the market, including 17.6 mb of crude oil and 7.1 mb of products.
(See IEA oil stock supplies are making their way to the market). Total OECD industry stocks
marginally rose by 3 mb in March, but remained 299.4 mb below the five-year average and at
their lowest since 2014. At 2 626 mb, OECD industry stocks covered 57.7 days of forward demand,
0.3 days below end-February and 8.4 days lower than the five-year average.
While OECD industry stocks in March were little changed m-o-m, crude oil inventories rose by
22.8 mb to 993 mb in line with the seasonal trend. Europe accounted for the largest gain at
16.4 mb. Crude stocks in OECD Asia Oceania rose counter-seasonally by 6.4 mb. By contrast,
OECD American crude stocks held steady compared with normal builds of 15.1 mb in March.
Total OECD product stocks drew by 25.5 mb m-o-m, on par with the five-year average. Of the
drawdown, gasoline and middle distillates decreased by 12.1 mb and 10.2 mb, respectively. OECD
Americas stocks fell by 10.3 mb, led by gasoline. OECD Europe marked the largest decline at
11 mb, of which 3.5 mb in middle distillates and 3 mb of gasoline. OECD Asia Oceania product
stocks also fell by 4.2 mb. Total OECD middle distillates stocks fell to 486.2 mb, and reached their
lowest levels since April 2008.
7.0
7.2
7.4
7.6
7.8
8.0
8.2
8.4
8.6
8.8
Jan-17 Jan-18 Jan-19 Jan-20 Jan-21 Jan-22
bn bbl Global Observed Inventories
Sources: IEA, Kayrros, Kpler, S&P Global, Enterprise SIngapore
2 555
2 655
2 755
2 855
2 955
3 055
3 155
3 255
3 355
Jan Mar May Jul Sep Nov Jan
mbOECD Total Oil Industry Stocks
Range 2017-2021 Avg 2017-2021
2021 2022

Oil Market Report Stocks
Page | 37 12 May 2022 IEA
. All
rig
hts
res
erve
d.
Preliminary data for April show that OECD industry inventories rose by 5.3 mb. Crude stocks were
up by 7.9 mb while products fell a further 5.2 mb. According to EIA data, US crude stocks gained
3.7 mb and other refined product stocks increased by 17.8 mb while gasoline and middle distillates
slumped by 8.5 mb and 8.6 mb, respectively. Inventories in Europe decreased by 4.1 mb, led by
an 11.5 mb drop in middle distillates, according to Euroilstock data. Japanese industry stocks
increased in crude oil and feedstocks by 3.8 mb while other petroleum product stocks rose
marginally, by 2.2 mb in total, data from the Petroleum Association of Japan show.
In addition, Kayrros data show crude oil stocks in non-OECD countries in April rose by 19.9 mb,
on the back of a 21 mb build in China. Kpler data show oil on water surging by 41.9 mb in April,
with +17.9 mb crude oil and +24 mb oil products.
OECD stock data for February have been revised up by 12.1 mb since last month’s Report,
including 3. 4 mb of crude and 8.7 mb of products. The largest adjustment came from Europe,
where crude oil stocks were revised 12 mb higher. OECD Asia Oceania crude inventories were
also adjusted up, by 2 mb, while a 10.6 mb decrease in OECD Americas provided a partial offset.
There were also upward revisions for product stocks in OECD Americas and OECD Asia Oceania,
by 5.9 mb and 3.2 mb, respectively.
Implied balance The global supply and demand balance shows an implied stock build of 790 kb/d in March, while
the total observed stock change was -1.47 mb/d based on available data. There is 2.26 mb/d of oil
that is not accounted for in the balance, including some product inventory builds in non-OECD
countries, which are poorly covered by available data. Most notably, oil product stocks in China
Am Europe As.Ocean Total Am Europe As.Ocean Total Am Europe As.Ocean Total
Crude Oil 0.0 16.4 6.4 22.8 0.0 0.5 0.2 0.7 -0.3 0.3 0.1 0.0
Gasoline -8.4 -3.0 -0.7 -12.1 -0.3 -0.1 0.0 -0.4 0.1 0.0 0.0 0.2
Middle Distillates -5.2 -3.5 -1.5 -10.2 -0.2 -0.1 0.0 -0.3 -0.1 0.0 -0.1 -0.2
Residual Fuel Oil 1.8 -1.2 -2.4 -1.8 0.1 0.0 -0.1 -0.1 0.1 0.0 0.0 0.1
Other Products 1.5 -3.4 0.5 -1.4 0.0 -0.1 0.0 0.0 -0.4 0.0 0.0 -0.4
Total Products -10.3 -11.0 -4.2 -25.5 -0.3 -0.4 -0.1 -0.8 -0.3 0.0 0.0 -0.4
Other Oils1 3.6 3.7 -1.7 5.7 0.1 0.1 -0.1 0.2 0.1 0.1 -0.1 0.1
Total Oil -6.7 9.1 0.6 3.0 -0.2 0.3 0.0 0.1 -0.5 0.4 -0.1 -0.2 1 Other o ils includes NGLs, feedstocks and other hydrocarbons.
(million barrels) (million barrels per day) (million barrels per day)
Preliminary OECD Industry Stock Change in March 2022 and First Quarter 2022March 2022 (preliminary) First Quarter 2022
(million barrels)
Jan-22 Feb-22 Jan-22 Feb-22 Jan-22 Feb-22 Jan-22 Feb-22
Crude Oil -1.2 -10.6 -2.1 12.0 0.0 2.0 -3.3 3.4
Gasoline -0.2 2.7 -0.1 -0.6 0.0 1.8 -0.3 3.9
Middle Distillates 0.0 2.4 2.5 -1.5 0.0 1.1 2.5 1.9
Residual Fuel Oil 0.0 0.2 0.7 2.0 0.0 0.2 0.7 2.5
Other Products 0.0 0.6 0.7 -0.2 0.0 0.1 0.7 0.5
Total Products -0.2 5.9 3.7 -0.4 0.0 3.2 3.5 8.7
Other Oils1 0.0 -1.1 -0.1 1.3 0.0 -0.2 -0.1 0.0
Total Oil -1.4 -5.9 1.6 13.0 0.0 4.9 0.1 12.1 1 Other o ils includes NGLs, feedstocks and other hydrocarbons.
Americas Europe Asia Oceania OECD
OECD Industry Stock Revisions versus April 2022 Oil Market Report

Oil Market Report Stocks
Page | 38 12 May 2022 IEA
. All
rig
hts
res
erve
d.
likely rose sharply following stringent Covid lockdowns. Hefty crude and product stock builds in
Russia following its invasion of Ukraine at the end of February are also not fully captured by the
data. In March, OECD industry crude oil stocks, including NGLs, rose by 920 kb/d and product
stocks dropped by 820 mb/d. In addition, OECD government stocks fell by 800 kb/d. Non-OECD
crude inventories drew by 220 kb/d, according to satellite data from Kayrros. Crude oil on the
water, including floating storage, fell by a large 1.3 mb/d, while products swelled by 880 kb/d,
according to data from Kpler. In 1Q22, the global balance data show a stock draw of 350 kb/d,
2.32 mb/d less than the decline in 4Q21 ( 2.67 mb/d).
Recent OECD industry stock changes
OECD Americas
Industry stocks in OECD Americas were down by 6.7 mb in March, compared with a seasonal
increase of 9.4 mb. Crude stocks held steady when they usually build by 15.1 mb. The United
States released 14 mb of strategic petroleum reserves through mixed schemes of exchange,
mandatory sale and emergency drawdown. By end-month, regional industry crude stocks stood
at 561 mb, 76.5 mb below the five-year average.
Product stocks fell by 10.3 mb, marginally larger than the average drop of 7.8 mb. Gasoline drove
the decline, falling by 8.4 mb, followed by middle distillates at -5.2 mb. Middle distillates stocks
dropped to 185.7 mb, the lowest level since April 2008. Fuel oil and other products increased by
1.8 mb and 1.5 mb, respectively, in line with seasonal trends.
Weekly data from the US Energy Information Administration (EIA) show total stocks rose by
3.3 mb in April. Crude gained 3.7 mb, when they typically build by 10.4 mb. Other refined products
built by 17.8 mb, much larger than the five-year average. Gasoline and middle distillates drew by
a further 8.5 mb and 8.6 mb, respectively, accelerated by higher exports. Middle distillates
exports rose to 1.9 mb/d in the second week of April, the highest since April 2019, reflecting
strong demand from buyers abroad looking for alternative sources to Russian supplies.
2020 1Q21 2Q21 3Q21 4Q21 2021 Jan-22 Feb-22 Mar-22 1Q22 Apr-22
Global oil balance 1.86 -1.96 -2.16 -2.39 -2.67 -2.30 0.34 -2.38 0.79 -0.35 1.31
Observed stock changes
OECD total stocks 0.43 -1.29 -0.72 -1.42 -1.50 -1.23 -0.03 -1.52 -0.70 -0.72 -0.33
Non-OECD crude stocks* 0.34 0.40 -0.39 -0.58 -1.00 -0.40 1.41 -0.63 -0.22 0.21 0.66
Selected non-OECD product stocks** 0.05 0.13 -0.06 -0.43 -0.16 -0.13 0.52 -0.21 -0.12 0.07 -0.07
Oil on w ater 0.00 -0.52 -0.49 -0.34 1.11 -0.06 -2.17 0.50 -0.42 -0.74
Total observed stock changes 0.82 -1.28 -1.66 -2.76 -1.54 -1.81 -0.27 -1.86 -1.47 -1.18
Unaccounted for balance 1.04 -0.68 -0.50 0.37 -1.13 -0.48 0.61 -0.52 2.26 0.87
**JODI data adjusted for monthly gaps in reporting, latest data for Jan 2021, plus Fujairah and Singapore inventories.
Sources: IEA, EIA, PAJ, Euroilstock, Kayrros , JODI, Kpler , FEDCom/S&P Global Platts , Enterprise Singapore .
*Crude stock change data from Kayrros. Data are available for selected countries and include only, and not all, above-ground storage.
Global Oil Balance and Observed Stock Changes (mb/d)

Oil Market Report Stocks
Page | 39 12 May 2022 IEA
. All
rig
hts
res
erve
d.
OECD Europe
OECD industry stocks in Europe rose by 9.1 mb in March when they normally decline by 1.4 mb.
Crude stock builds of 16.4 mb led the way, as in February, reducing the gap with the five-year
average to 31.4 mb.
Product stocks fell by 11 mb, in line with the normal trend, led by a 3.5 mb draw in middle
distillates. Additionally, France and Germany released 5.2 mb and 1.2 mb of middle distillates
from their strategic reserves, respectively. Fuel oil, gasoline and other products also fell, by
1.2 mb, 3 mb and 3.4 mb, respectively. Refinery runs in the region eased by 330 kb/d m-o-m,
contributing to crude stock builds along with the draws in products.
Preliminary data from Euroilstock show total oil stocks decreased by 4.1 mb in April. Crude oil
inventories rose again by 3.6 mb, mainly in France (+4.4 mb), while products fell by 7.8 mb. Middle
distillate stocks plunged by a steep 11.5 mb. Following a sharp build in March, oil stocks in Italy
declined by 15 mb according to the latest data. Gasoline, fuel oil and naphtha increased by
2.1 mb, 0.5 mb and 1.1 mb, respectively.
555
575
595
615
635
655
675
695
715
Jan Mar May Jul Sep Nov Jan
mbOECD Americas Crude Oil Industry Stocks
Range 2017-2021 Avg 2017-2021
2021 2022
180
190
200
210
220
230
240
250
260
Jan Mar May Jul Sep Nov Jan
mbOECD Americas Middle Distillates Industry
Stocks
Range 2017-2021 Avg 2017-2021
2021 2022
285
305
325
345
365
385
405
Jan Mar May Jul Sep Nov Jan
mbOECD Europe Crude Oil Industry Stocks
Range 2017-2021 Avg 2017-2021
2021 2022
225
245
265
285
305
325
345
365
Jan Mar May Jul Sep Nov Jan
mbOECD Europe Middle Distillates Industry
Stocks
Range 2017-2021 Avg 2017-2021
2021 2022
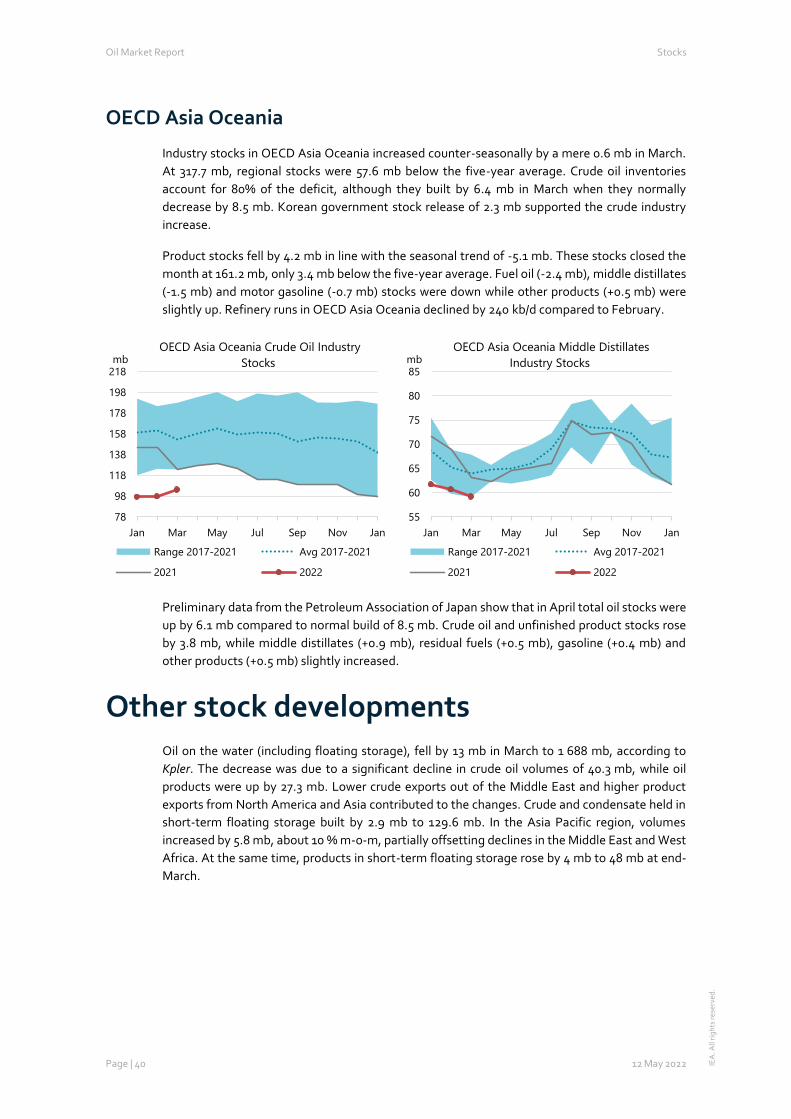
Oil Market Report Stocks
Page | 40 12 May 2022 IEA
. All
rig
hts
res
erve
d.
OECD Asia Oceania
Industry stocks in OECD Asia Oceania increased counter-seasonally by a mere 0.6 mb in March.
At 317.7 mb, regional stocks were 57.6 mb below the five-year average. Crude oil inventories
account for 80% of the deficit, although they built by 6.4 mb in March when they normally
decrease by 8.5 mb. Korean government stock release of 2.3 mb supported the crude industry
increase.
Product stocks fell by 4.2 mb in line with the seasonal trend of -5.1 mb. These stocks closed the
month at 161.2 mb, only 3.4 mb below the five-year average. Fuel oil (-2.4 mb), middle distillates
(-1.5 mb) and motor gasoline (-0.7 mb) stocks were down while other products (+0.5 mb) were
slightly up. Refinery runs in OECD Asia Oceania declined by 240 kb/d compared to February.
Preliminary data from the Petroleum Association of Japan show that in April total oil stocks were
up by 6.1 mb compared to normal build of 8.5 mb. Crude oil and unfinished product stocks rose
by 3.8 mb, while middle distillates (+0.9 mb), residual fuels (+0.5 mb), gasoline (+0.4 mb) and
other products (+0.5 mb) slightly increased.
Other stock developments Oil on the water (including floating storage), fell by 13 mb in March to 1 688 mb, according to
Kpler. The decrease was due to a significant decline in crude oil volumes of 40.3 mb, while oil
products were up by 27.3 mb. Lower crude exports out of the Middle East and higher product
exports from North America and Asia contributed to the changes. Crude and condensate held in
short-term floating storage built by 2.9 mb to 129.6 mb. In the Asia Pacific region, volumes
increased by 5.8 mb, about 10 % m-o-m, partially offsetting declines in the Middle East and West
Africa. At the same time, products in short-term floating storage rose by 4 mb to 48 mb at end-
March.
78
98
118
138
158
178
198
218
Jan Mar May Jul Sep Nov Jan
mbOECD Asia Oceania Crude Oil Industry
Stocks
Range 2017-2021 Avg 2017-2021
2021 2022
55
60
65
70
75
80
85
Jan Mar May Jul Sep Nov Jan
mbOECD Asia Oceania Middle Distillates
Industry Stocks
Range 2017-2021 Avg 2017-2021
2021 2022

Oil Market Report Stocks
Page | 41 12 May 2022 IEA
. All
rig
hts
res
erve
d.
In Fujairah, independent product stocks posted a small decline in April, down 0.8 mb to 16.3 mb.
Middle distillates fell by 0.5 mb to 1.4 mb, hovering at historically low levels. Light distillates
stocks were also down, by 1 mb, while heavy distillates rose by 0.7 mb.
Independent product stocks in Singapore, the world’s largest bunkering hub, fell by 1.3 mb to
40.3 mb in April, according to data from
Enterprise Singapore. Residual fuels led the
way with a 1.1 mb decline. Middle distillate
inventories were down by 0.4 mb while
light distillates built by 0.3 mb.
Total oil stocks in 12 non-OECD economies
reporting data to the JODI-Oil database
decreased by 2.8 mb in February. Crude oil
and NGLs fell in Iraq (-3.6 mb), and Algeria
(-1.6 mb) while they rose in Saudi Arabia
(+3.4 mb) and Venezuela (+1.6 mb).
Products stocks built in Algeria (+1.7 mb),
Chinese Taipei (+1.5 mb) and Hong Kong
(+1.2). By contrast, products drew in Saudi
Arabia (-3.1 mb), Nigeria (-1.8 mb) and Venezuela (-1.2 mb).
0
200
400
600
800
1,000
1,200
1,400
1,600
1,800
2,000
2,200
Oil on Water* by quality
Crude Fuel Oil Total Clean
Source: Kpler
* including floating storage
mb
0
20
40
60
80
100
120
140
160
180
200
220
Global Crude and Condensate in floating storage*
Middle East Gulf Asia Pacific US Gulf+WC
NW Europe West Africa Other
Source: Kplermb
*Volume of commodities on tankers that are idled offshore for 12 or more days
0
5
10
15
20
25
30
35
Jan 19 Jul 19 Jan 20 Jul 20 Jan 21 Jul 21 Jan 22
mb
Fujairah Oil Stocks
Light Distillates Middle Distillates Residual Fuels
Source: FEDCom/S&P Global Platts
12
16
20
24
28
32
Jan Feb Mar Apr May Jun Jul Aug Sep Oct Nov Dec
mb
Singapore Bunker and Fuel Oil Stocks
Range 2017-2021 5-yr Average
2021 2022
Source: Enterprise Singapore
-4 -2 0 2 4
Algeria
Azerbaijan
Chinese Taipei
Hong Kong China
India
Iraq
Nigeria
Saudi Arabia
Venezuela
JODI Oil Stocks m-o-m
Crude NGL Oil Product
February 2022

Oil Market Report Stocks
Page | 42 12 May 2022 IEA
. All
rig
hts
res
erve
d.
Box 3. IEA emergency reserves are making their way to the market
The first tranche of deliveries from the IEA’s collective actions agreed in March and April 2022 are
coming to market. In March, net drawdowns from the US Strategic Petroleum Reserve (SPR) were
around 14 mb, inclusive of sales related to the IEA collective action and previously committed stock
releases. In addition, 2.3 mb of crude oil was released from strategic stocks in Korea, while France
and Germany drew 5.2 mb and 1.2 mb of middle distillates, respectively. Public stocks were also
released in four other IEA countries in March. Additional volumes of OECD government stocks will
be released in April, including 18 mb from the US SPR.
In addition to stocks released from public reserves, around 47 mb of oil stocks have been made
available from commercial inventories, mainly refined products, by lowering the stockpiling
obligations imposed on private companies.
Crude oil accounts for 73% of the 183 mb
emergency stocks that have already or will be
made available as part of the March and April IEA
collective actions. Gasoil/diesel is expected to
account for 14%, residual fuel 3%, and gasoline
2%. Crude oil will make up the entire stock
release from the United States, as well as the
additional volumes that the United States has
pledged to release from its reserves independent
of the IEA collective action (on March 31, the
Biden administration committed to the release of
1 mb/d of crude through October, which includes its commitments as part of the IEA collective action
and additional volumes). More than 90% of stocks being released in Korea will consist of crude oil,
and two-thirds in Japan. On the other hand, 70% of volumes released in Europe will come from
petroleum products.
The US Department of Energy announced in early May a long-term plan to buy back 60 mb of oil to
replenish its strategic reserves at an
undetermined point in the future, when it
expects market tightness to have eased. Bids
will be placed in the fall of 2022. At the end of
March, the United States held about 570 mb
of oil in its SPR, covering 28.2 days of forward
demand. SPR volumes will drop to 40-years
lows when all committed barrels have been
released. However, in the longer term, it
plans to significantly reduce volumes held in
the SPR. Following the surge in domestic oil
production and lower net imports in recent
years, Washington previously announced
that it intends to sell about 360 mb of SPR crude from 2017 to 2031 in order to allocate the profits
from the sale of oil to other budgets.
73%
14%3%
2%
2%0% 6%
IEA collective action release breakdown
Crude Gasoil/ diesel
Residual fuels Gasoline
Jet/kero Other
Products not specified
0
2
4
6
8
10
12
14
0
100
200
300
400
500
600
700
800
1983
1987
1991
1995
1999
2003
2007
2011
2015
2019
mb/dmb
US SPR volume and oil production
US SPR volume US Crude oil production
Source: EIA

Oil Market Report Stocks
Page | 43 12 May 2022 IEA
. All
rig
hts
res
erve
d.
1 Days of forward demand are based on average OECD demand over the next three months.
Days1 Million Barrels
Regional OECD End-of-Month Industry Stocks
(in days of forward demand and million barrels of total oil)
50
55
60
65
70
75
80
85
Jan Mar May Jul Sep Nov Jan
Days OECD Total Oil
Range 2017-2021 Avg 2017-2021
2021 2022
50
55
60
65
70
75
80
Jan Mar May Jul Sep Nov Jan
DaysAmericas
Range 2017-2021 Avg 2017-2021
2021 2022
60
70
80
90
100
Jan Mar May Jul Sep Nov Jan
DaysEurope
Range 2017-2021 Avg 2017-2021
2021 2022
35
40
45
50
55
60
65
Jan Mar May Jul Sep Nov Jan
Days Asia Oceania
Range 2017-2021 Avg 2017-2021
2021 2022
1,400
1,450
1,500
1,550
1,600
1,650
1,700
1,750
Jan Mar May Jul Sep Nov Jan
mb Americas
Range 2017-2021 Avg 2017-2021
2021 2022
840
890
940
990
1,040
1,090
1,140
Jan Mar May Jul Sep Nov Jan
mbEurope
Range 2017-2021 Avg 2017-2021
2021 2022
300
320
340
360
380
400
420
440
460
Jan Mar May Jul Sep Nov Jan
mbAsia Oceania
Range 2017-2021 Avg 2017-2021
2021 2022
2,500
2,600
2,700
2,800
2,900
3,000
3,100
3,200
3,300
Jan Mar May Jul Sep Nov Jan
mb OECD Total Oil
Range 2017-2021 Avg 2017-2021
2021 2022

Oil Market Report Stocks
Page | 44 12 May 2022 IEA
. All
rig
hts
res
erve
d.
Prices
Overview The protracted war in Ukraine has compounded oil market uncertainties. Crude oil prices fell from
March to April, remaining volatile but in a lower and narrower $10/bbl range above $100/bbl for
ICE Brent. Since February, Western nations have imposed evermore-severe sanctions on Russia
to quell the conflict by political and economic means. The spreading impact of these injunctions
has collided with toughening US Federal Reserve (Fed) measures to fight persistent inflation and
the industrial supply shock from China’s zero-Covid lockdowns. Oil demand growth remains
relatively sustained, despite pessimistic economic indicators, and refinery output has struggled
to keep pace despite the release of strategic reserves to ease crude and product supply tensions.
This has resulted in a massive product price dislocation versus crude for middle distillates, and
increasingly for gasoline, as well as lofty refinery margins that are driving stronger demand for
crude.
April is normally a seasonal low point for end-user demand that allows refiners to undertake plant
maintenance. In the coming weeks, the end of refinery turnarounds and an expected easing of
China’s lockdowns will coincide with oil field maintenance work in the North Sea and US Gulf
Coast from May through early-July. As global refinery capacity outages drop, runs will increase
by ~4 mb/d from April to July versus a relatively flat trend for crude supply. This, combined with
toughening sanctions on Russian oil, will tighten physical crude markets. Oil prices already reflect
those tensions as North Sea Dated prices have moved from discounts to ICE Brent futures
throughout April to premiums since the beginning of May.
The wind down period for the fourth EU sanction package ends on 15 May, after which a number
of current loopholes for accessing Russian barrels will close. A new sixth round of European Union
(EU) sanctions - still under negotiation but expected to come into effect starting 16 May - could
affect Russian crude and product imports and shipping services by EU entities. The proposed ban
on crude imports would be implemented within six months and that on products by the end of
the year.
Week of Last
Apr-21 Mar-22 Apr-22 02 May 06 May m-o-m y-o-y
Crude Futures (M1)
NYMEX WTI 61.69 108.26 101.64 106.68 109.77 -6.62 39.95
ICE Brent 65.33 112.46 105.92 109.20 112.39 -6.54 40.59
Crude Marker Grades
North Sea Dated 64.59 118.75 104.25 110.52 114.46 -14.50 39.66
WTI (Cushing) 61.71 108.52 101.77 106.68 109.77 -6.75 40.06
Dubai 62.92 110.49 102.91 106.00 107.20 -7.58 39.99
Differential to North Sea Dated
WTI (Cushing) -2.88 -10.23 -2.48 -3.84 -4.69 7.75 0.41
Dubai -1.68 -8.26 -1.34 -4.52 -7.26 6.92 0.34
Differential to ICE Brent
North Sea Dated -0.74 6.29 -1.67 1.32 2.07 -7.96 -0.93
NYMEX WTI -3.64 -4.20 -4.28 -2.52 -2.62 -0.08 -0.64
Sources: Argus M edia Ltd, ICE, NYM EX (NYM EX WTI = NYM EX Light Sweet Crude)
Crude Prices and Differentials ($/bbl)
Month Chng Apr-22
75
85
95
105
115
125
135
145
01-Jan 22 01-Feb 22 01-Mar 22 01-Apr 22 01-May 22
$/bbl Benchmark Crude Prices
WTI Cushing N. Sea Dated
Dubai ICE Brent M1
Source: Argus Media Ltd

Oil Market Report Stocks
Page | 45 12 May 2022 IEA
. All
rig
hts
res
erve
d.
The weakening economic growth outlook has weighed on financial markets in general, including
crude futures. Macroeconomic headwinds have arisen from high inflation (driven by fiscal
stimulus, energy and food prices), deteriorating industrial and service activity worldwide.
Consumer confidence has fallen sharply due to heightened inflation, but particularly in Europe
due to the proximity of the war in Ukraine, the expanding refugee crisis and diminishing but
continued dependence on Russian energy.
To contain inflation, the US Fed announced a 0.5% pt policy rate hike on 4 May, the biggest
increase in over 20 years, and a drawdown of its $9 trillion in bonds that will reduce market
liquidity. On the other hand, growth concerns are holding back further increases by other central
banks. Higher US dollar exchange rates will affect 60% of the poorest emerging markets that are
already debt-distressed. Rising energy and food prices plus higher interest rates in emerging
economies have already started triggering social unrest that could further weaken economic
activity.
Futures markets Open interest and trading volumes across oil market contracts remain at their lowest level since
end-2014. The broadening consequences of hawkish monetary policy and of the conflict in
Ukraine have resulted in extreme financial market volatility. This has reduced liquidity and
lowered trading volumes in oil futures. Banks and clearing houses have been much tougher on
commodity margin calls and financing conditions since the massive nickel short squeeze in
mid-March.
Prompt crude oil futures prices fell by around $6.60/bbl m-o-m in April. This was a smaller fall
than physical crude prices, where strategic reserve availability deflated the additional premium
for access to supply. However, the general drop in prices may represent a trough rather than the
transition to a lower regime.
Concerns about the economic outlook, inflation and the impact of Chinese lockdowns
maintained downward pressure on prompt prices over most of April. Prices eased as some Asian
uptake of Russian crude suggested a supply redistribution could avoid an outright loss of barrels
due to self-imposed embargoes by European companies. However, prices came under upward
tension by late April as negotiators made rapid advances on the sixth round of EU sanctions for
Russia.
3500
4000
4500
5000
5500
6000
6500
7000
7500
Total Open Interest ICE + NYMEX
All oil contracts (in million barrels)
Pre-invasion peak: week of 16 Feb 2022
8
12
16
20
24
28
32
36
Oil futures trading volumes - 2 wk MAvg
All Exchanges (billion b/d)

Oil Market Report Stocks
Page | 46 12 May 2022 IEA
. All
rig
hts
res
erve
d.
Futures prices fell from their second peak of March in the week beginning the 24th (weekly
averages of $118.48/bbl for ICE Brent and $113.01/bbl for NYMEX WTI) to a trough in the first
week of April ($103.72/bbl for ICE Brent and $99.15/bbl for NYMEX WTI). Massive strategic
reserve releases announced by the US and by the IEA, plus the full lockdown of Shanghai to fight
the spread of Covid, drove the sell-off that pushed both contracts below $100/bbl on 11 April. As
well, the Fed inferred that it would be raising interest rates by 0.5% at its next meeting in May,
boosting the US dollar that in turn pressured crude prices.
Futures prices rallied in mid-month on supply outages in Libya, data for the first week of April
showing Russian production fell to just over 10 mb/d as well as statistics indicating stronger than
expected Chinese GDP growth in 1Q22. Prices subsequently retrenched as the World Bank and
the IMF published pessimistic updates to their global economic forecasts and as the US
government revealed that the economy contracted unexpectedly in 1Q22 q-o-q. A resurgence of
Covid cases and cuts to government pandemic assistance payments undermined growth. Prices
recovered into the final days of April and early May with improving prospects for a full EU ban on
Russian oil and with the cut-off of Russian gas supply to Bulgaria and Poland that triggered alarm
about access to energy exports. The Fed’s interest rate hike that boosted the US dollar and
concern that severe Covid restrictions could spread to Beijing failed to immediately slow the
increase in prices.
Prompt futures prices rose overall from 1 April to 6 May, despite their volatility. On the other
hand, the long-dated contract months fell, dropping $3.21/bbl to $78.85/bbl for ICE Brent and
$3.15/bbl to $74.05/bbl for NYMEX WTI on the 36 contract month. On the 12 month contract,
prices eased into the end of April, lagging the trend on prompt contracts and increasing the
12 month backwardation to $16-$18/bbl. The unexpected disconnect reflects the deteriorating
economic outlook that will affect forward months and comes despite the planned EU embargo
that could result in tighter crude markets.
The ICE Brent prompt premium to NYMEX WTI rose $0.10/bbl on average in April, to $4.30/bbl.
However, after peaking in the week of 28 March at $6.20/bbl, the differential narrowed to
$3.50/bbl in late April and $2.50/bbl in the first week of May. Shipping costs fell, US sweet crude
markets tightened and European sweet crude remained robust.
The ICE gasoil premium to ICE Brent gained just $0.50/bbl m-o-m in April to $41.97/bbl, but rose
steadily and averaged $49.31/bbl in the last week of the month. The NYMEX ULSD premium to
WTI surged by $15.74/bbl m-o-m to $60.88/bbl, averaging $92/bbl in the week of 25 April. The
extreme NYMEX tensions reflects the isolated delivery conditions in the New York harbour
75
80
85
90
95
100
105
110
115
M1 2 3 4 5 6 7 8 9 10 11 12
$/bbl Forward Price Curves
28 Feb 22 31 Mar 22 06 May 22
28 Feb 22 31 Mar 22 06 May 22
Source: ICE, NYMEX
NYMEX WTI
ICE Brent
60
70
80
90
100
110
120
130
Jan 22 Feb 22 Mar 22 Apr 22 May 22
$/bbl Crude Futures Month 1 vs Month 36
WTI M1 WTI M36
Brent M1 Brent M36
Source: ICE, NYMEX

Oil Market Report Stocks
Page | 47 12 May 2022 IEA
. All
rig
hts
res
erve
d.
market and the competition for incremental barrels from the US Gulf of Mexico combined with
the rising cost of the renewable diesel component.
The NYMEX RBOB gasoline premium to WTI rose $4.99/bbl m-o-m to $35.13/bbl and reached
$42.50/bbl in the final week of April. US gasoline demand remains strong, supported by robust
consumer demand in general. Gasoline cracks must rise to levels that ensure refiners don’t pull
too much supply out of the gasoline pool in response to very strong gasoil-diesel cracks. The gap
between gasoil cracks and gasoline cracks provided an incentive for refiners to withdraw available
light gasoil components from fluid catalytic cracking (FCC) feedstock streams to the detriment
of gasoline production.
Money manager net long positions on crude futures were stable overall over the four weeks from
early-April to early-May. Net positions on ICE Brent futures rose 9% while they contracted by 3%
for NYMEX WTI. Both outright long and short positions declined, but short positions fell more
(-14%) than longs (-2%). While short positions on ICE Brent dropped 26%, those on NYMEX WTI
rose 25%, highlighting a shift in expectations to a tighter US crude balance while international
market tensions could increase with an EU embargo on Russian oil. The long-short ratio rose 14%
to 5.0 as an increase in the ratio for ICE Brent offset a decline for NYMEX WTI.
20
40
60
80
100
120
140
0
2
4
6
8
10
12
Jan-19 Jan-20 Jan-21 Jan-22
$/bbl
Money Managers' Long/Short Ratio
in Crude Futures vs. ICE Brent Price
Ratio
3-year average
ICE Brent (RHS)
Sources: CFTC, ICE
0
50
100
150
200
250
0
100
200
300
400
500
May-21 Jul-21 Sep-21 Nov-21 Jan-22 Mar-22 May-22
Th
ou
san
ds
Money Managers' Net Long Positions
(Futures & Options, million barrels)
WTI (LHS) Brent (LHS)
ICE LS Gasoil Futures NYMEX RBOB Futures
NYMEX ULSD Futures Source: CFTC, ICE
Apr-21 Feb-22 Mar-22 Apr-22 Last
m-o-m Chg y-o-y Chg 28 Mar 04 Apr 11 Apr 18 Apr 25 Apr 02 May 06 May
NYMEX
Light Sw eet Crude Oil (WTI) 1st contract 61.69 91.63 108.26 101.64 -6.62 39.95 103.51 99.15 101.52 103.88 102.46 106.68 109.77
Light Sw eet Crude Oil (WTI) 12th contract 57.98 79.20 86.41 89.24 2.83 31.26 86.53 89.28 91.32 90.05 86.93 89.21 91.31
RBOB 84.33 112.84 138.40 136.77 -1.63 52.43 135.16 130.88 134.71 139.05 142.88 151.88 157.88
ULSD 78.14 119.57 153.39 162.52 9.12 84.38 154.75 142.34 150.21 164.35 194.46 172.03 166.08
ULSD ($/mmbtu) 14.09 20.94 25.93 26.70 0.76 12.60 25.55 24.38 25.80 27.47 29.41 28.85 28.67
Henry Hub Natural Gas ($/mmbtu) 2.68 4.46 4.98 6.71 1.73 4.02 5.56 6.08 6.91 7.09 6.98 8.13 8.04
ICE
Brent 1st contract 65.33 94.10 112.46 105.92 -6.54 40.59 109.69 103.72 105.90 108.44 105.91 109.20 112.39
Brent 12th contract 61.37 82.62 91.40 93.86 2.46 32.49 91.95 93.72 95.52 94.75 91.94 93.28 95.39
Gasoil 69.53 111.67 153.94 147.89 -6.06 78.35 145.85 141.50 142.84 151.27 155.22 160.15 153.50
Prompt Month Differentials
NYMEX WTI - ICE Brent -3.64 -2.47 -4.20 -4.28 -0.08 -0.64 -6.18 -4.57 -4.38 -4.56 -3.45 -2.52 -2.62
NYMEX WTI 1st vs. 12th 3.71 12.43 21.85 12.40 -9.45 8.69 16.98 9.87 10.20 13.83 15.53 17.47 18.46
ICE Brent 1st - 12th 3.96 11.48 21.06 12.06 -9.00 8.10 17.74 10.00 10.38 13.69 13.97 15.92 17.00
NYMEX ULSD - WTI 16.45 27.94 45.13 60.88 15.74 44.43 51.24 43.19 48.69 60.47 92.00 65.35 56.31
NYMEX RBOB - WTI 22.64 21.21 30.14 35.13 4.99 12.48 31.65 31.73 33.19 35.17 40.42 45.20 48.11
NYMEX 3-2-1 Crack (RBOB) 20.58 23.45 35.14 43.71 8.57 23.13 38.18 35.55 38.36 43.60 57.62 51.92 50.84
NYMEX ULSD - Natural Gas ($/mmbtu) 11.41 16.48 20.96 19.99 -0.97 8.58 19.99 18.30 18.90 20.38 22.43 20.71 20.62
ICE Gasoil - ICE Brent 4.20 17.57 41.48 41.97 0.48 37.76 36.16 37.78 36.94 42.83 49.31 50.95 41.11
Source: ICE, NYM EX.
Prompt Month Oil Futures Prices(monthly and weekly averages, $/bbl)
Week Commencing:Apr-22

Oil Market Report Stocks
Page | 48 12 May 2022 IEA
. All
rig
hts
res
erve
d.
Net long positions of money managers on product futures rose 8% overall during the four-week
period, affecting all product contracts. While the increase for ICE gasoil was just 1%, the NYMEX
product contracts both rose by 14%. The changes reflect the tightening US product markets,
notably on the US East Coast where the contracts are delivered at maturity. Outright long
positions rose for the NYMEX contracts while outright short positions fell slightly for ICE gasoil.
The long-short ratio on products was stable overall.
Spot crude oil prices Physical crude markets eased in April versus futures. The flattening of the backwardation and
improved supply compressed most crude price premiums. Since the Russian invasion of Ukraine,
the supply options for buyers to meet crude requirements have increased, notably in Europe. The
initial surge of non-Russian crude buying in March resulted in a brief supply overhang in Europe
whose effect was amplified by the availability of barrels from strategic reserves. Worldwide,
crude demand has eased since March with persistently high levels of refinery capacity offline and
reduced Chinese runs as Covid lockdowns undermine demand. Finally, some redistribution of
Russian crude exports to new buyers has limited pressure to reduce exports.
As a result, North Sea Dated prices flipped from a $6.29/bbl premium versus ICE Brent in March
to a $1.67/bbl discount in April, falling overall by -$14.50/bbl to $104.25/bbl. The size of the
reversal is all the more remarkable as the market already held a premium from 6 January through
the invasion and until 6 April. However, North Sea Dated prices rebounded to $110.52/bbl in the
first week of May and to $114.86/bbl on 6 May. North Sea Dated flipped to a solid premium versus
ICE Brent in the first week of May. Prices recovered as trading shifted from May to June
programmes when substantial North Sea production volumes will be lost.
The situation in May is a reversal of April. On the one hand, regional refinery maintenance
programmes are wrapping up. On the other hand, intense discussions of a full EU embargo on
Russian oil have heightened the urgency to identify new supply sources. Regional field
maintenance will reach exceptionally high levels, pushing the June output of the BFOET (Brent,
Forties, Oseberg, Ekofisk and Troll that make up the North Sea Dated basket) to its lowest
production level in 15 years. Finally, Libyan production issues persist.
As well, sweet crude differentials remain supported by uptake to meet gasoline, diesel and jet
demand requirements while reducing costs for energy and desulphurisation (both driven by
-4
-2
0
2
4
6
8
Jan-22 Feb-22 Mar-22 Apr-22 May-22
North Sea Dtd vs ICE Brent
(London close, $/bbl)
Source: Argus Media Ltd
-2
0
2
4
6
8
Jan 22 Feb 22 Mar 22 Apr 22 May 22
$/bbl Crude Prices Prompt Month Differentials
WTI M1 - M2 North Sea M1 - M2
Dubai M1 - M2
Source: Argus Media Ltd

Oil Market Report Stocks
Page | 49 12 May 2022 IEA
. All
rig
hts
res
erve
d.
natural gas prices). Backwardation also favours short-haul supply, pushing European refiners to
buy more light sweet barrels from the North Sea, North Africa, West Africa and the US.
The Forties premium to North Sea Dated declined $4.12/bl to -$0.20/bbl, that for Ekofisk
fell -$1.55/bbl to $2.97/bbl, Oseberg lost $0.56/bbl to $4.34/bbl while Stafjord gained $0.04/bbl to
$3.32/bbl due to rising shipping costs.
The North Sea Dated M1 premium to WTI at Houston fell $4.59/bbl to $2.61/bbl in April, reaching
a trough of $0.94/bbl in the last week of the month, with substantial exports scheduled for May.
But the need to cover the regional production shortfall in June pushed out the spread to $3.95/bbl
in the first week of May, attracting more US barrels to the European market. The North Sea Dated
M2 premium to Dubai narrowed by $0.63/bbl in April to $2.63/bbl, slowing the arrival of Middle
East barrels into Europe. However, anticipation of an EU embargo on imports of Russian oil
boosted the spread to $4/bbl in the first week of May and to $6.20/bbl on 6 May.
In the Mediterranean, CPC Blend discounts to North Sea Dated remain wide, reflecting risks
associated with loading out of a Russian terminal. The discount narrowed by $0.44/bbl
to -$6.15/bbl overall in April, but was -$6.90/bbl in the first week of May. Planned maintenance at
Kashagan throughout June does not yet appear to have supported the price of CPC, which
remained pressured by the restart of its export terminal. The wide discount for CPC has supported
its arbitrage to Asia. On the other hand, premiums for Azeri Light rose $1.16/bbl to $5/bbl in April
and reached $5.20/bb in the first week of May, supported by continued Libyan production issues.
-4.0
-3.0
-2.0
-1.0
0.0
1.0
2.0
3.0-1.0
0.0
1.0
2.0
3.0
4.0
5.0
6.0
Dec 21 Jan 22 Feb 22 Mar 22 Apr 22 May 22
$/bbl North Sea Crude Differentials
to Dated
Ekofisk Oseberg
Forties North Sea M1 RHS
Source: Argus Media Ltd
-20.0
-15.0
-10.0
-5.0
0.0
5.0
Feb 22 Mar 22 Apr 22 May 22
$/bbl WTI Houston vs North Sea M1
WTI Houston - North Sea M1
Source: Argus Media Ltd
-15
-10
-5
0
5
10
Dec 21 Jan 22 Feb 22 Mar 22 Apr 22 May 22
$/bbl Urals, CPC, Azeri Light price differentials
to North Sea Dated
BTC Saharan Blend CPC
Source: Argus Media Ltd
-40
-30
-20
-10
0
10
Dec 21 Jan 22 Feb 22 Mar 22 Apr 22 May 22
$/bbl Russian Price Differentials vs N.Sea Dtd
Urals (NWE)
ESPO vs Dubai M1
Urals (Med)
Source: Argus Media Ltd

Oil Market Report Stocks
Page | 50 12 May 2022 IEA
. All
rig
hts
res
erve
d.
The last known deals on Russian Urals sales date from the first week of April and put its price
discount versus North Sea Dated at -$34.85/bbl in Northwest Europe and -$31.95/bbl in the
Mediterranean. Transactions that are more recent have been on a private and confidential basis.
The significant reduction in Chinese refinery buying since the beginning of the Shanghai Covid
outbreak has pressured crude price differentials in the Middle East and West Africa. In addition
to run cuts to accommodate the Covid lockdowns, government import quotas continue to choke
independent refiner purchases while national majors have refinery capacity in maintenance.
Finally, the Chinese government continues to discourage increased uptake of Russian crude at
significant price discounts, which has limited any opportunistic purchases for runs or storage. The
surge of Indian Urals uptake also displaced some buying of Middle East and West African grades.
West African crude price differentials deteriorated from March to April despite a flatter
backwardation and falling freight rates. Some cargoes from the May programme were still unsold
at end-April, adding to the pressure on prices. Angolan grades fell sharply due to flagging Chinese
buying which normally dominates uptake. Cabinda premiums fell $1.39/bbl to $0.74/bbl and
slipped to a discount of $0.50/bbl in the first week of May with the overhang of unsold barrels.
Girassol fell $1.95/bbl to $0.88/bbl in April and to -$0.22/bbl in the first week of May. Premiums
for light sweet Nigerian barrels fell $0.75/bbl to $1.33/bbl for Brass River and $0.25/bbl to $1.57/bbl
for Bonny Light. Differentials rebounded in late April and early May, to $1.33/bbl and $1.48/bbl,
respectively, on stronger European demand to replace North Sea barrels.
Indian refiners took advantage of the sharp discounts for Russian Urals, ESPO and Sokol grades,
to buy substantial volumes via tender and spot purchases for delivery in May and June. An
estimated 25-30 mb were picked up, mostly through trading houses. They have also begun to
negotiate longer-term contracts. The trading houses (Trafigura, Vitol) reportedly sold the crude
to Indian refiners on a delivered basis, covering shipping and insurance costs, which resulted in a
price paid by India’s refiners that is higher than the quoted discounts for Russian spot crude sales.
On the other hand, South Korean refiners waived Urals cargoes and increasingly sought Middle
East and US grades.
Middle East crude price premiums to regional marker Dubai fell on average in April versus March
as the Dubai price structure flattened. Initial weakness opened the arbitrage to Europe for UAE
grades Upper Zakum and Murban loading in June. However, Asian demand recovered in the first
week of May for July programmes, supporting differentials late month. The absence of Chinese
demand impacted Iraq which made several attempts to tender crude – directly, via the Platts
window and via the DME – without attracting satisfactory bids. Oman premiums fell $0.98/bbl to
-0.5
0.0
0.5
1.0
1.5
2.0
2.5
3.0
3.5
4.0
Dec 21 Jan 22 Feb 22 Mar 22 Apr 22 May 22
$/bbl Africa Crude Prices vs N. Sea Dated
Cabinda Girassol
Forcados Bonny Light
Source: Argus Media Ltd
-3.0
-2.0
-1.0
0.0
1.0
2.0
3.0
4.0
5.0
6.0
7.0
8.0
Jan 22 Feb 22 Mar 22 Apr 22 May 22
$/bbl East of Suez Price Differentials vs Dubai
Dubai M1 - M2 Murban
Oman
Source: Argus Media Ltd

Oil Market Report Stocks
Page | 51 12 May 2022 IEA
. All
rig
hts
res
erve
d.
-$0.51/bbl in April, but rose to $0.34/bbl in the first week of May. Murban eased by $0.41/bbl to
$1.58/bbl and rose to $3.11/bbl while Upper Zakum premiums declined $0.62/bbl to -$0.13/bbl
and recovered to $0.35/bbl. Russian ESPO crude out of Sakhalin continued to attract the usual
level of Chinese buying, but barrels struggled to sell beyond China. ESPO trade remains relatively
transparent and discounts to Dubai widened by $7.22/bbl in April to -$21.50/bbl. Japan plans to
phase out crude oil purchases from Russia, as part of an 8 May statement issued by the G7
countries, which will further support Middle East crude price differentials. Japan imported
109 kb/d of Russian crude in March, (-19% y-o-y) of which 71 kb/d of ESPO, 23 kb/d of Sokol and
10 kb/d of Sakhalin Blend.
The trading houses are winding down their Russian crude oil term contracts, forcing Rosneft to
perform its own marketing through direct negotiations and tenders. Rosneft does not have crude
marketing and shipping know-how comparable to that of the trading houses. Both Rosneft’s
tenders in April failed (6.5 million tonnes of Urals, ESPO and Sokol loading in May as well as
nine cargoes for ESPO for June delivery). The absence of bidders reflects Rosneft sales conditions
(prepayment in roubles), shipping complications and the risks of buying from a Russian company
hit by various sanctions.
US crude price differentials versus WTI were hit by the planned release of strategic reserves that
was announced on 31 March. This compounded pressure from the previous release of late
February. The flattening price structure initially supported crude price differentials. However,
discounts widened in late month on a stronger WTI backwardation and on the announced award
on 21 April by the US Department of Energy (DOE) of 30 mb from the second emergency SPR
crude sale that increases deliveries in May and June to 50 mb. The DOE also announced a third
Notice of Sale for 40 mb scheduled for 24 May for delivery starting in June. Much of the volumes
from the sale announced in April could go to exports, which would support crude prices in the
local market.
The WTI backwardation steepened over the month, partly due to blizzards in North Dakota that
knocked out the state’s shale oil production in April. WTI premiums at Houston and Midland
versus Cushing narrowed by $0.60/bbl to $1.16/bbl and $0.75/bbl, respectively, but averaged
$1.38/bbl and $0.97/bbl in the first week of May on strong European demand for light sweet US
barrels. Sour Mars crude discounts narrowed by $1.57/bbl in April to -$2.18/bbl but blew out again
to -$4.16/bbl in the first week of May. Maintenance on the Mars platform scheduled for May
initially supported differentials.
0.0
0.5
1.0
1.5
2.0
2.5
Jan 22 Feb 22 Mar 22 Apr 22 May 22
$/bbl Differentials to WTI Cushing
WTI Houston WTI Midland
Source: Argus Media Ltd
-12
-10
-8
-6
-4
-2
0
2
4
Jan 22 Feb 22 Mar 22 Apr 22 May 22
$/bbl Sweet-Sour Crude Price Differentials
(vs WTI Houston)
LLS M1 Mars Maya USGC WCS USGC
Source: Argus Media Ltd

Oil Market Report Stocks
Page | 52 12 May 2022 IEA
. All
rig
hts
res
erve
d.
Western Canadian Select (WCS) discounts at Hardisty versus WTI at Cushing for June barrels
narrowed by $2.25/bbl to -$14.33/bbl on good US demand. The discount widened slightly in the
first week of May to -$15.32/bbl as the WTI backwardation steepened. WCS discounts in Houston
narrowed by $1.75/bbl to -$7.21/bbl, reaching -$5.65/bbl in the third week of April on healthy sour
crude demand. They blew out to -$9.46/bbl in the first week of May.
Freight Freight rates rose overall in April, boosted by tonne-mile demand as more ships move cargoes
over longer distances as state and self-imposed company embargoes on Russian oil force trade
flows to adapt. Rates for crude tankers hit a peak in the first half of April before cooling to the
levels of March at the beginning of May. Clean tanker rates rose steadily over the month in most
cases, beginning May at levels much above their averages for March of April.
The changing crude trade flows have benefited the Aframax and Suezmax tanker classes. The
existing overhang of tonnage in VLCC s continues to increase. However, the initial spike in rates
gave way to a correction as the early panic to charter tankers to lock-in non-Russian supply eased
and volumes shifted between tanker classes to reduce overall costs.
According to BRS Group, while VLCC scrapping has been very modest so far in 2022, some 13 new
VLCCs have been added to the fleet and another 31 are scheduled for delivery before the end of
the year. Several new VLCCs are transporting middle distillate for the moment rather than crude,
however. The resulting weak chartering rates leave little to cover operating costs beyond the
bunker payments that have been boosted by strong gasoil prices.
Apr-21 Feb-22 Mar-22 Apr-22 Last
m-o-m Chg y-o-y Chg 28 Mar 04 Apr 11 Apr 18 Apr 25 Apr 02 May 06 May
Crudes
North Sea Dated 64.59 98.01 118.75 104.25 -14.50 39.66 112.31 103.58 104.28 105.78 103.07 110.52 114.46
North Sea Mth 1 65.80 97.35 117.45 105.54 -11.92 39.74 112.35 104.83 105.22 107.28 104.73 112.01 115.98
North Sea Mth 2 65.32 94.16 113.46 105.24 -8.22 39.92 110.35 104.10 104.88 107.56 104.68 109.99 113.39
WTI (Cushing) Mth 1 61.71 91.74 108.52 101.77 -6.75 40.06 103.51 99.15 101.52 104.20 102.66 106.68 109.77
WTI (Cushing) Mth 2 61.71 90.31 106.01 100.85 -5.15 39.14 101.51 98.23 101.06 103.54 101.21 105.12 108.33
WTI (Houston) Mth 1 62.61 93.23 110.25 102.93 -7.33 40.32 104.96 100.32 102.72 105.29 103.78 108.06 111.22
Urals (NWE) 62.06 92.50 89.92 69.58 -20.34 7.52 80.91 68.73 69.43 70.93 68.22 75.67 79.61
Dubai (1st month) 62.92 92.48 110.49 102.91 -7.58 39.99 107.32 101.66 100.84 106.72 102.34 106.00 107.20
Differentials to Futures
North Sead Dated vs. ICE Brent -0.74 3.91 6.29 -1.67 -7.96 -0.93 2.62 -0.14 -1.62 -2.66 -2.84 1.32 2.07
WTI (Cushing) Mth1 vs. NYMEX 0.02 0.11 0.26 0.13 -0.13 0.11 0.00 0.00 0.00 0.32 0.20 0.00 0.00
Differentials to Physical Markers
WTI (Houston) versus North Sea Mth 1 -3.19 -4.13 -7.20 -2.61 4.59 0.58 -7.39 -4.51 -2.51 -1.99 -0.94 -3.95 -4.76
WTI (Houston) versus WTI (Cushing) Mth 1 0.90 1.49 1.73 1.16 -0.58 0.25 1.45 1.16 1.19 1.08 1.13 1.38 1.45
Urals (NWE) versus North Sea Dated -2.53 -5.52 -28.83 -34.67 -5.84 -32.14 -31.40 -34.85 -34.85 -34.85 -34.85 -34.85 -34.85
Dubai versus North Sea Mth 2 -2.40 -1.68 -2.97 -2.34 0.63 0.07 -3.03 -2.44 -4.03 -0.84 -2.33 -3.99 -6.19
Dubai versus WTI (Cushing) Mth 2 1.20 2.17 4.48 2.05 -2.43 0.85 5.80 3.42 -0.22 3.18 1.14 0.87 -1.13
Prompt Month Differentials
Forw ard North Sea Mth1-Mth2 0.48 3.20 4.00 0.29 -3.70 -0.19 2.01 0.73 0.35 -0.28 0.05 2.02 2.59
Forw ard WTI Cushing Mth1-Mth2 -0.01 1.43 2.51 0.92 -1.60 0.92 2.00 0.92 0.46 0.66 1.45 1.56 1.44
Forw ard Dubai Mth1-Mth2 0.50 2.04 4.76 2.13 -2.63 1.63 2.56 2.79 1.83 1.89 1.64 1.81 1.93
Source: Argus M edia Ltd, ICE
Apr-22
Spot Crude Oil Prices and Differentials
(monthly and weekly averages, $/bbl)
Week Commencing:

Oil Market Report Stocks
Page | 53 12 May 2022 IEA
. All
rig
hts
res
erve
d.
Most of the initial trade flow adjustments impacted Aframax and Suezmax tankers. More West
African and US cargoes going to Europe have increased the call for both classes of tankers.
Aframaxes benefitted in particular from the rise in transatlantic traffic. The loss of Russian vessels
also contributed to tighten these tanker segments where much of that capacity was
concentrated.
Clean product tanker classes have seen a steady increase in tension over the course of the month.
The Atlantic Basin middle distillate supply deficit has been compounded by a dearth of stocks.
This has opened an arbitrage to move from East of Suez to the Atlantic Basin. Moreover, pressure
to reduce uptake of Russian product has increased the call on other exporters to Europe, notably
US refiners. Increased transatlantic and Middle East trade have boosted Long Range (LR) and
Medium Range (MR) tanker rates. Higher Asian rates reflect increased Chinese product exports
as Covid lockdowns weaken demand.
0
2
4
6
8
10
0
1
2
3
4
5
Jul 21 Aug 21 Oct 21 Dec 21 Feb 22 Apr 22
$/bblDaily Crude Tanker Rates
130Kt WAF - UKC
VLCC MEG-Asia
North Sea Aframax
Baltic Aframax (RHS)
Source: Argus Media Ltd
1
2
3
4
5
6
7
8
9
Jul 21 Aug 21 Oct 21 Dec 21 Feb 22 Apr 22
$/bblDaily Product Tanker Rates
LR MEG - Japan
MR Sing - JPN
MR Carib - US Atlantic
MR UK-US Atlantic
Source: Argus Media Ltd
Apr-21 Feb-22 Mar-22 Apr-22 m-o-m chg y-o-y chg 28-Mar 04-Apr 11-Apr 18-Apr 25-Apr 02-May
Crude Tankers
VLCC MEG-Asia 0.89 1.05 1.33 1.50 0.17 0.6 1.27 1.52 1.57 1.49 1.43 1.33
130Kt WAF - UKC 1.15 1.49 1.86 3.06 1.20 1.9 2.04 3.69 3.70 2.88 2.07 1.68
Baltic Aframax 0.74 1.45 5.37 6.35 0.98 5.6 5.12 6.66 8.04 7.02 4.15 2.87
North Sea Aframax 0.70 0.89 1.27 1.39 0.12 0.7 1.24 1.36 1.48 1.41 1.32 1.33
Product Tankers
LR MEG - Japan 2.46 2.02 4.50 4.22 -0.27 1.8 4.42 3.65 3.50 3.80 5.80 7.18
MR Sing - JPN 1.82 1.73 2.80 3.02 0.22 1.2 2.76 2.70 2.78 2.99 3.57 4.91
MR Carib - US Atlantic 1.22 1.83 2.61 3.84 1.23 2.6 2.70 4.71 5.23 3.19 2.53 3.45
MR UK-US Atlantic 1.86 2.55 3.06 3.66 0.61 1.8 3.23 3.20 3.43 3.46 4.47 5.46
Source: Argus M edia Ltd
Freight Costs
(mo nthly and weekly averages, $ / bbl)
Apr-22 Week Commencing

Oil Market Report Tables
Page | 54 12 May 2022 IEA
. All
rig
hts
res
erve
d.
Tables
Table 1: World Oil Supply And Demand 2018 2019 1Q20 2Q20 3Q20 4Q20 2020 1Q21 2Q21 3Q21 4Q21 2021 1Q22 2Q22 3Q22 4Q22 2022
OECD DEMAND
Americas 25.4 25.5 24.4 20.0 22.7 23.1 22.6 22.8 24.4 24.8 25.0 24.3 24.5 24.8 25.0 25.0 24.8
Europe 14.3 14.3 13.3 11.0 12.9 12.5 12.4 11.9 12.6 13.8 13.9 13.1 13.1 13.5 13.8 13.6 13.5
Asia Oceania 8.0 7.9 7.9 6.6 6.8 7.3 7.1 7.7 7.0 7.1 7.8 7.4 7.9 7.2 7.4 7.8 7.6
Total OECD 47.7 47.8 45.6 37.6 42.3 43.0 42.1 42.4 44.0 45.8 46.8 44.8 45.5 45.5 46.3 46.4 45.9
NON-OECD DEMAND
FSU 4.7 4.7 4.6 4.1 4.7 4.7 4.5 4.6 4.7 4.9 5.0 4.8 4.6 4.3 4.5 4.5 4.5
Europe 0.8 0.8 0.7 0.7 0.7 0.7 0.7 0.7 0.7 0.7 0.8 0.7 0.7 0.7 0.8 0.8 0.7
China 13.1 13.9 12.2 14.8 15.0 15.2 14.3 15.0 15.7 15.7 15.7 15.5 15.5 15.1 16.0 16.0 15.6
Other Asia 14.0 14.0 13.5 11.3 12.3 13.5 12.6 13.5 12.9 12.6 13.7 13.2 13.8 13.8 13.3 13.9 13.7
Americas 6.3 6.3 5.8 5.1 5.7 5.9 5.6 5.8 5.9 6.2 6.2 6.0 6.0 6.0 6.2 6.2 6.1
Middle East 8.7 8.7 8.4 7.6 8.6 8.3 8.2 8.3 8.5 8.9 8.4 8.5 8.5 8.6 9.0 8.5 8.6
Africa 4.2 4.2 4.1 3.5 3.7 3.9 3.8 4.1 4.0 3.9 4.1 4.0 4.2 4.2 4.1 4.2 4.2
Total Non-OECD 51.8 52.7 49.3 46.9 50.7 52.2 49.8 51.9 52.3 53.0 53.9 52.8 53.3 52.7 53.7 54.0 53.4
Total Demand1 99.5 100.5 94.9 84.5 93.1 95.2 91.9 94.3 96.3 98.8 100.7 97.5 98.8 98.2 100.0 100.4 99.4
OECD SUPPLY
Americas 23.0 24.8 25.9 22.6 23.2 23.7 23.8 23.3 24.3 24.4 25.3 24.3 24.7 25.4 26.2 26.6 25.7
Europe 3.5 3.4 3.7 3.6 3.4 3.5 3.6 3.6 3.1 3.4 3.4 3.4 3.3 3.2 3.2 3.4 3.3
Asia Oceania 0.4 0.5 0.5 0.5 0.5 0.5 0.5 0.5 0.5 0.5 0.5 0.5 0.5 0.5 0.5 0.5 0.5
Total OECD4 26.9 28.6 30.1 26.7 27.1 27.8 27.9 27.4 27.8 28.3 29.2 28.2 28.6 29.1 29.9 30.5 29.5
NON-OECD SUPPLY
FSU 14.6 14.6 14.8 13.2 12.8 13.2 13.5 13.4 13.7 13.7 14.3 13.8 14.4 12.5 11.5 11.7 12.5
Europe 0.1 0.1 0.1 0.1 0.1 0.1 0.1 0.1 0.1 0.1 0.1 0.1 0.1 0.1 0.1 0.1 0.1
China 3.8 3.9 4.0 4.0 4.0 3.9 4.0 4.1 4.1 4.1 4.0 4.1 4.2 4.3 4.2 4.2 4.2
Other Asia 3.4 3.3 3.2 3.0 2.9 3.0 3.0 3.0 2.9 2.8 2.8 2.9 2.8 2.8 2.8 2.7 2.8
Americas 5.1 5.3 5.6 5.1 5.4 5.2 5.3 5.3 5.3 5.4 5.2 5.3 5.4 5.5 5.7 5.8 5.6
Middle East 3.1 3.0 3.1 3.0 3.0 3.0 3.0 3.1 3.1 3.1 3.1 3.1 3.2 3.2 3.2 3.2 3.2
Africa 1.5 1.5 1.4 1.4 1.4 1.3 1.4 1.3 1.3 1.3 1.3 1.3 1.3 1.3 1.3 1.3 1.3
Total Non-OECD4 31.6 31.8 32.2 29.9 29.6 29.7 30.3 30.2 30.5 30.5 30.8 30.5 31.4 29.6 28.9 29.1 29.7
Processing gains3 2.4 2.4 2.3 2.0 2.1 2.1 2.1 2.1 2.2 2.3 2.3 2.3 2.3 2.3 2.3 2.3 2.3
Global Biofuels 2.7 2.8 2.3 2.5 3.1 2.6 2.6 2.2 2.9 3.2 2.7 2.8 2.4 3.0 3.3 2.9 2.9
Total Non-OPEC Supply 63.5 65.6 66.8 61.1 61.9 62.2 63.0 61.9 63.5 64.3 65.0 63.7 64.7 64.0 64.4 64.9 64.5
OPEC2
Crude 31.4 29.6 28.2 25.6 24.1 24.9 25.7 25.4 25.6 27.0 27.8 26.4 28.5
NGLs 5.4 5.3 5.3 5.1 5.0 5.0 5.1 5.1 5.1 5.1 5.2 5.1 5.3 5.4 5.4 5.4 5.4
Total OPEC 36.8 35.0 33.5 30.6 29.1 30.0 30.8 30.4 30.7 32.1 33.0 31.5 33.7
Total Supply 100.3 100.6 100.3 91.7 90.9 92.2 93.8 92.4 94.2 96.4 98.0 95.3 98.4
STOCK CHANGES AND MISCELLANEOUS
Reported OECD
Industry 0.1 0.1 1.0 2.6 -0.4 -1.6 0.4 -1.3 -0.5 -1.3 -1.2 -1.1 -0.2
Government -0.1 0.0 0.0 0.3 -0.1 -0.1 0.0 0.0 -0.2 -0.1 -0.3 -0.2 -0.5
Total 0.0 0.0 1.1 2.9 -0.5 -1.7 0.4 -1.3 -0.7 -1.4 -1.5 -1.2 -0.7
Floating storage/Oil in transit 0.1 0.1 0.4 0.6 -2.0 1.0 0.0 -0.5 -0.5 -0.3 1.1 -0.1 -0.7
Miscellaneous to balance5
0.6 0.0 3.9 3.8 0.4 -2.3 1.4 -0.1 -1.0 -0.6 -2.3 -1.0 1.1
Total Stock Ch. & Misc 0.8 0.1 5.4 7.3 -2.1 -3.0 1.9 -2.0 -2.2 -2.4 -2.7 -2.3 -0.4
Memo items:
Call on OPEC crude + Stock ch.6 30.6 29.5 22.8 18.3 26.2 27.9 23.8 27.3 27.7 29.4 30.5 28.7 28.8 28.8 30.2 30.2 29.5
1 Measured as deliveries from refineries and primary stocks, comprises inland deliveries, international marine bunkers, refinery fuel, crude for direct burning,
oil from non-conventional sources and other sources of supply. Includes biofuels.
2 OPEC data based on today's membership throughout the time series.
3 Net volumetric gains and losses in the refining process and marine transportation losses.
4 Comprises crude oil, condensates, NGLs, oil from non-conventional sources and other sources of supply.
5 Includes changes in non-reported stocks in OECD and non-OECD areas.
6 Total demand minus total non-OPEC supply minus OPEC NGLs.
Table 1
WORLD OIL SUPPLY AND DEMAND(million barrels per day)

Oil Market Report Tables
Page | 55 12 May 2022 IEA
. All
rig
hts
res
erve
d.
Table 1a: World Oil Supply And Demand:
Changes From Last Month’s Table 1
2018 2019 1Q20 2Q20 3Q20 4Q20 2020 1Q21 2Q21 3Q21 4Q21 2021 1Q22 2Q22 3Q22 4Q22 2022
OECD DEMAND
Americas - - - - - - - - - - - - 0.1 - - - -
Europe - - - - - - - - - - - - - - - - -
Asia Oceania - - - - - - - - - - - - -0.1 - -0.1 -0.1 -0.1
Total OECD - - - - - - - - - - - - - - -0.1 - -
NON-OECD DEMAND
FSU - - - - - - - - - - - - - - - - -
Europe - - - - - - - - - - - - - - - - -
China - - - - - - - - - - - - 0.1 -0.3 - - -0.1
Other Asia - - - - - - - - - - - - -0.1 - -0.1 -0.1 -0.1
Americas - - - - - - - - - - 0.1 - 0.1 - - - -
Middle East - - - - - - - - - - - - - - - - -
Africa - - - - - - - - - - - - 0.1 - - - -
Total Non-OECD - - - - - - - - - - 0.1 0.1 0.2 -0.2 - - -
Total Demand - - - - - - - - - - 0.1 0.1 0.2 -0.1 -0.1 - -
OECD SUPPLY
Americas - - - - - - - - - - - - -0.2 -0.2 - 0.1 -0.1
Europe - - - - - - - - - - - - - -0.2 - - -0.1
Asia Oceania - - - - - - - - - - - - - - - - -
Total OECD - - - - - - - - - - - - -0.3 -0.4 - - -0.2
NON-OECD SUPPLY
FSU - - - - - - - - - - - - - 0.7 - - 0.2
Europe - - - - - - - - - - - - - - - - -
China - - - - - - - - - - - - - 0.1 0.1 0.1 -
Other Asia - - - - - - - - - - - - - - - - -
Americas - - - - - - - - - - - - - -0.1 -0.1 - -
Middle East - - - - - - - - - - - - - - - - -
Africa - - - - - - - - - - - - - - - - -
Total Non-OECD - - - - - - - - - - - - - 0.7 - - 0.2
Processing gains - - - - - - - - - - - - - - - - -
Global Biofuels - - - - - - - - - - - - - - - - -
Total Non-OPEC Supply - - - - - - - - - - - - -0.3 0.3 - 0.1 -
OPEC
Crude - - - - - - - - - - - - 0.1
NGLs - - - - - - - - - - - - - - - - -
Total OPEC - - - - - - - - - - - - -
Total Supply - - - - - - - - - - - - -0.3
STOCK CHANGES AND MISCELLANEOUS
REPORTED OECD
Industry - - - - - - - - - - - -
Government - - - - - - - - - - - -
Total - - - - - - - - - - - -
Floating storage/Oil in transit - - - - - - - - - - - -
Miscellaneous to balance - - - -0.1 - - - - - - -0.1 -
Total Stock Ch. & Misc - - - - - - - - - - -0.1 - -0.5
Memo items:
Call on OPEC crude + Stock ch. - - - - - - - - - - 0.1 0.1 0.5 -0.4 -0.1 -0.1 -
Note: When submitting monthly oil statistics, OECD member countries may update data for prior periods. Similar updates to non-OECD data can also occur.
Table 1a
WORLD OIL SUPPLY AND DEMAND: CHANGES FROM LAST MONTH'S TABLE 1(million barrels per day)

Oil Market Report Tables
Page | 56 12 May 2022 IEA
. All
rig
hts
res
erve
d.
Table 1b: World Oil Supply And Demand
(Including OPEC+ based on current
agreement1)
2018 2019 1Q20 2Q20 3Q20 4Q20 2020 1Q21 2Q21 3Q21 4Q21 2021 1Q22 2Q22 3Q22 4Q22 2022
Total Demand 99.5 100.5 94.9 84.5 93.1 95.2 91.9 94.3 96.3 98.8 100.7 97.5 98.8 98.2 100.0 100.4 99.4
OECD SUPPLY
Americas2
20.9 22.8 23.9 20.7 21.3 21.8 21.9 21.4 22.3 22.4 23.3 22.4 22.7 23.4 24.2 24.6 23.7
Europe 3.5 3.4 3.7 3.6 3.4 3.5 3.6 3.6 3.1 3.4 3.4 3.4 3.3 3.2 3.2 3.4 3.3
Asia Oceania 0.4 0.5 0.5 0.5 0.5 0.5 0.5 0.5 0.5 0.5 0.5 0.5 0.5 0.5 0.5 0.5 0.5
Total OECD (non-OPEC+) 24.8 26.7 28.1 24.8 25.2 25.9 26.0 25.5 25.9 26.4 27.2 26.2 26.6 27.1 27.9 28.5 27.5
NON-OECD SUPPLY
FSU3
0.3 0.4 0.4 0.4 0.4 0.4 0.4 0.4 0.4 0.4 0.4 0.4 0.4 0.3 0.3 0.3 0.3
Europe 0.1 0.1 0.1 0.1 0.1 0.1 0.1 0.1 0.1 0.1 0.1 0.1 0.1 0.1 0.1 0.1 0.1
China 3.8 3.9 4.0 4.0 4.0 3.9 4.0 4.1 4.1 4.1 4.0 4.1 4.2 4.3 4.2 4.2 4.2
Other Asia4
2.6 2.5 2.4 2.3 2.3 2.3 2.3 2.2 2.2 2.2 2.1 2.2 2.1 2.1 2.1 2.0 2.1
Latin America 5.1 5.3 5.6 5.1 5.4 5.2 5.3 5.3 5.3 5.4 5.2 5.3 5.4 5.5 5.7 5.8 5.6
Middle East5
1.9 1.8 1.9 1.9 1.9 1.9 1.9 1.9 1.9 1.9 1.9 1.9 1.9 2.0 2.0 2.0 1.9
Africa6
1.2 1.2 1.2 1.2 1.2 1.1 1.2 1.1 1.1 1.1 1.1 1.1 1.1 1.1 1.1 1.1 1.1
Total Non-OECD (non-OPEC+) 15.1 15.3 15.5 14.9 15.1 14.8 15.1 15.1 15.1 15.2 14.8 15.0 15.2 15.3 15.5 15.5 15.4
Processing Gains 2.4 2.4 2.3 2.0 2.1 2.1 2.1 2.1 2.2 2.3 2.3 2.3 2.3 2.3 2.3 2.3 2.3
Global Biofuels 2.7 2.8 2.3 2.5 3.1 2.6 2.6 2.2 2.9 3.2 2.7 2.8 2.4 3.0 3.3 2.9 2.9
Total Non-OPEC+ 44.9 47.2 48.2 44.3 45.5 45.4 45.9 44.9 46.1 47.0 47.0 46.3 46.5 47.7 49.0 49.2 48.1
OPEC+ CRUDE
Algeria 1.0 1.0 1.0 0.9 0.8 0.9 0.9 0.9 0.9 0.9 1.0 0.9 1.0 1.0 1.0 1.0 1.0
Angola 1.5 1.4 1.4 1.3 1.2 1.2 1.3 1.1 1.1 1.1 1.1 1.1 1.2 1.1 1.1 1.1 1.1
Azerbaijan 0.7 0.7 0.7 0.6 0.6 0.6 0.6 0.6 0.6 0.6 0.6 0.6 0.6 0.6 0.6 0.6 0.6
Bahrain 0.2 0.2 0.2 0.2 0.2 0.2 0.2 0.2 0.2 0.2 0.2 0.2 0.2 0.2 0.2 0.2 0.2
Brunei 0.1 0.1 0.1 0.1 0.1 0.1 0.1 0.1 0.1 0.1 0.1 0.1 0.1 0.1 0.1 0.1 0.1
Congo 0.3 0.3 0.3 0.3 0.3 0.3 0.3 0.3 0.3 0.3 0.3 0.3 0.3 0.3 0.3 0.3 0.3
Equatorial Guinea 0.1 0.1 0.1 0.1 0.1 0.1 0.1 0.1 0.1 0.1 0.1 0.1 0.1 0.1 0.1 0.1 0.1
Gabon 0.2 0.2 0.2 0.2 0.2 0.2 0.2 0.2 0.2 0.2 0.2 0.2 0.2 0.2 0.2 0.2 0.2
Iran 3.6 2.4 2.0 1.9 2.0 2.1 2.0 2.3 2.4 2.5 2.5 2.4 2.6 2.6 2.6 2.6 2.6
Iraq 4.6 4.7 4.6 4.1 3.7 3.8 4.0 3.9 3.9 4.1 4.2 4.0 4.3 4.4 4.6 4.7 4.5
Kazakhstan 1.6 1.6 1.7 1.5 1.4 1.4 1.5 1.5 1.5 1.4 1.7 1.5 1.6 1.4 1.5 1.6 1.6
Kuwait 2.7 2.7 2.7 2.4 2.2 2.3 2.4 2.3 2.4 2.4 2.5 2.4 2.6 2.7 2.8 2.8 2.7
Libya 1.0 1.1 0.3 0.1 0.1 0.9 0.4 1.2 1.2 1.2 1.1 1.1 1.1 1.0 1.2 1.2 1.1
Malaysia 0.5 0.5 0.5 0.4 0.4 0.4 0.5 0.4 0.4 0.4 0.4 0.4 0.4 0.4 0.4 0.4 0.4
Mexico 1.8 1.7 1.7 1.6 1.6 1.6 1.7 1.7 1.7 1.7 1.7 1.7 1.6 1.6 1.7 1.7 1.7
Nigeria 1.6 1.7 1.8 1.6 1.4 1.3 1.5 1.4 1.3 1.3 1.2 1.3 1.3 1.3 1.4 1.4 1.3
Oman 0.9 0.8 0.9 0.8 0.7 0.7 0.8 0.7 0.7 0.8 0.8 0.8 0.8 0.8 0.9 0.9 0.8
Russia 10.4 10.4 10.4 9.2 8.9 9.1 9.4 9.3 9.5 9.7 10.0 9.6 10.0 8.4 7.2 7.3 8.2
Saudi Arabia 10.3 9.9 9.8 9.3 8.8 9.0 9.2 8.5 8.6 9.6 9.9 9.2 10.2 10.5 10.9 11.0 10.7
South Sudan 0.1 0.2 0.2 0.2 0.2 0.1 0.2 0.1 0.2 0.2 0.2 0.2 0.1 0.1 0.2 0.2 0.1
Sudan 0.1 0.1 0.1 0.1 0.1 0.1 0.1 0.1 0.1 0.1 0.1 0.1 0.1 0.1 0.1 0.1 0.1
UAE 3.0 3.2 3.2 2.9 2.8 2.5 2.9 2.7 2.7 2.8 2.9 2.8 3.0 3.0 3.1 3.2 3.1
Venezuela 1.4 0.9 0.8 0.5 0.4 0.4 0.5 0.5 0.5 0.6 0.8 0.6 0.7 0.8 0.8 0.8 0.7
OPEC+ Crude 47.8 45.9 44.6 40.2 38.2 39.3 40.6 40.0 40.5 42.0 43.3 41.5 44.0 42.8 42.7 43.1 43.1
OPEC+ NGLs & Condensate 7.4 7.4 7.4 7.1 7.1 7.3 7.2 7.4 7.4 7.3 7.5 7.4 7.7 7.8 7.9 8.0 7.9
OPEC+ Nonconventionals 0.1 0.1 0.1 0.1 0.1 0.1 0.1 0.1 0.1 0.1 0.1 0.1 0.1 0.1 0.1 0.1 0.1
Total OPEC+ 55.3 53.4 52.1 47.5 45.4 46.7 47.9 47.5 48.0 49.4 51.0 49.0 51.9 50.7 50.7 51.2 51.1
Total Supply Oil 100.3 100.6 100.3 91.7 90.9 92.2 93.8 92.4 94.2 96.4 98.0 95.3 98.4 98.4 99.7 100.4 99.2
Memo items:
Call on OPEC+ crude + Stock ch. 47.0 45.8 39.1 33.0 40.3 42.3 38.7 42.0 42.7 44.4 46.0 43.8 44.4 42.6 43.0 43.1 43.3
1 From May 2022, OPEC+ supply reflects latest OPEC+ deal and individual country's sustainable capacity. Libya, Iran, Venezuela held at most recent level through 2022.
2 OECD Americas excludes Mexico
3 FSU excludes Russia, Kazakhstan, Azerbaijan
4 Other Asia excludes Brunei, Malaysia
5 Middle East excludes Oman, Bahrain
6 Africa excludes Sudan, South Sudan
Table 1bWORLD OIL SUPPLY AND DEMAND (Including OPEC+ based on current agreement
1)
(million barrels per day)

Oil Market Report Tables
Page | 57 12 May 2022 IEA
. All
rig
hts
res
erve
d.
Table 2: Summary of Global Oil Demand 2019 1Q20 2Q20 3Q20 4Q20 2020 1Q21 2Q21 3Q21 4Q21 2021 1Q22 2Q22 3Q22 4Q22 2022
Demand (mb/d)
Americas 25.53 24.40 19.98 22.70 23.13 22.56 22.82 24.38 24.83 25.05 24.27 24.49 24.76 25.05 24.98 24.82
Europe 14.31 13.33 11.02 12.87 12.51 12.43 11.91 12.63 13.85 13.90 13.08 13.10 13.48 13.85 13.64 13.52
Asia Oceania 7.93 7.86 6.60 6.75 7.35 7.14 7.67 7.04 7.11 7.82 7.41 7.90 7.25 7.38 7.82 7.59
Total OECD 47.78 45.59 37.59 42.33 42.99 42.13 42.40 44.05 45.79 46.77 44.76 45.48 45.49 46.28 46.44 45.93
Asia 27.91 25.73 26.06 27.26 28.67 26.93 28.50 28.55 28.29 29.39 28.68 29.31 28.87 29.27 29.88 29.33
Middle East 8.71 8.36 7.58 8.62 8.27 8.21 8.26 8.47 8.90 8.45 8.52 8.49 8.55 8.99 8.48 8.63
Americas 6.31 5.79 5.06 5.74 5.93 5.63 5.82 5.88 6.22 6.18 6.03 5.95 6.04 6.20 6.19 6.10
FSU 4.72 4.57 4.09 4.67 4.66 4.50 4.56 4.67 4.90 4.98 4.78 4.62 4.33 4.45 4.46 4.47
Africa 4.24 4.12 3.47 3.74 3.91 3.81 4.08 3.98 3.94 4.14 4.04 4.19 4.15 4.06 4.21 4.15
Europe 0.78 0.72 0.66 0.72 0.74 0.71 0.72 0.72 0.75 0.75 0.74 0.72 0.74 0.76 0.76 0.75
Total Non-OECD 52.68 49.29 46.90 50.74 52.18 49.79 51.94 52.28 53.01 53.89 52.79 53.29 52.68 53.73 53.98 53.42
World 100.46 94.88 84.50 93.06 95.18 91.92 94.34 96.32 98.79 100.66 97.55 98.77 98.18 100.00 100.43 99.35
of which:
United States1 20.46 19.50 16.07 18.45 18.72 18.19 18.45 20.03 20.21 20.41 19.78 19.86 20.01 20.15 20.21 20.06
Europe five2 8.20 7.62 5.93 7.11 7.03 6.92 6.68 7.08 7.67 7.82 7.32 7.41 7.51 7.67 7.67 7.57
China 13.90 12.22 14.75 14.99 15.21 14.30 14.97 15.68 15.68 15.74 15.52 15.50 15.11 16.00 15.98 15.65
Japan 3.74 3.78 2.93 3.06 3.53 3.33 3.73 3.08 3.18 3.67 3.42 3.73 3.23 3.30 3.62 3.47
India 4.99 4.92 3.89 4.25 5.10 4.54 4.99 4.45 4.48 4.93 4.71 5.14 5.10 4.67 5.11 5.01
Russia 3.57 3.52 3.08 3.58 3.50 3.42 3.50 3.58 3.76 3.76 3.65 3.62 3.29 3.39 3.33 3.40
Brazil 3.08 2.95 2.64 2.99 3.13 2.93 2.97 2.98 3.19 3.12 3.07 2.98 3.01 3.09 3.11 3.05
Saudi Arabia 3.59 3.40 3.23 3.77 3.48 3.47 3.24 3.54 3.76 3.45 3.50 3.30 3.40 3.75 3.42 3.47
Canada 2.63 2.51 2.10 2.31 2.29 2.30 2.26 2.24 2.50 2.40 2.35 2.36 2.42 2.57 2.48 2.46
Korea 2.60 2.53 2.45 2.36 2.40 2.44 2.55 2.50 2.59 2.70 2.59 2.74 2.55 2.63 2.69 2.65
Mexico 1.96 1.85 1.40 1.50 1.58 1.58 1.62 1.64 1.60 1.71 1.64 1.75 1.84 1.85 1.81 1.81
Iran 1.93 2.01 1.79 1.84 1.87 1.87 2.02 1.93 1.93 1.93 1.95 2.04 1.96 1.95 1.93 1.97
Total 70.64 66.80 60.25 66.21 67.86 65.29 66.99 68.72 70.56 71.64 69.49 70.42 69.44 71.02 71.38 70.57
% of World 70.3% 70.4% 71.3% 71.1% 71.3% 71.0% 71.0% 71.3% 71.4% 71.2% 71.2% 71.3% 70.7% 71.0% 71.1% 71.0%
Annual Change (% per annum)
Americas 0.5 -3.4 -21.2 -12.4 -9.5 -11.7 -6.5 22.0 9.4 8.3 7.6 7.3 1.6 0.9 -0.3 2.3
Europe 0.0 -5.4 -22.8 -12.7 -11.6 -13.1 -10.6 14.7 7.5 11.1 5.2 10.0 6.7 0.0 -1.9 3.3
Asia Oceania -1.0 -6.0 -12.6 -12.3 -9.6 -10.0 -2.5 6.7 5.4 6.4 3.8 3.1 3.0 3.8 0.0 2.4
Total OECD 0.1 -4.5 -20.3 -12.5 -10.2 -11.8 -7.0 17.2 8.2 8.8 6.3 7.3 3.3 1.1 -0.7 2.6
Asia 3.0 -6.7 -6.9 -1.4 0.9 -3.5 10.8 9.6 3.8 2.5 6.5 2.8 1.1 3.5 1.6 2.3
Middle East -0.1 -1.6 -11.3 -5.6 -4.7 -5.8 -1.1 11.8 3.3 2.2 3.9 2.8 1.0 1.0 0.4 1.3
Americas 0.6 -6.4 -19.6 -10.3 -6.7 -10.8 0.4 16.3 8.4 4.3 7.1 2.3 2.7 -0.4 0.1 1.1
FSU 0.8 1.6 -11.9 -4.8 -3.8 -4.8 -0.2 14.2 5.1 6.8 6.3 1.4 -7.3 -9.2 -10.4 -6.6
Africa 0.8 -4.2 -19.0 -9.6 -8.0 -10.2 -1.1 14.8 5.5 5.7 5.9 2.8 4.2 3.0 1.8 2.9
Europe 3.4 -4.8 -16.4 -9.5 -6.5 -9.4 1.0 9.8 3.7 1.9 4.0 -0.3 2.6 1.4 1.3 1.3
Total Non-OECD 1.8 -4.9 -10.7 -4.3 -2.2 -5.5 5.4 11.5 4.5 3.3 6.0 2.6 0.8 1.4 0.2 1.2
World 1.0 -4.7 -15.3 -8.2 -5.9 -8.5 -0.6 14.0 6.2 5.8 6.1 4.7 1.9 1.2 -0.2 1.8
Annual Change (mb/d)
Americas 0.12 -0.87 -5.39 -3.20 -2.44 -2.98 -1.58 4.40 2.13 1.91 1.72 1.66 0.39 0.22 -0.06 0.55
Europe 0.00 -0.76 -3.24 -1.87 -1.64 -1.88 -1.42 1.62 0.97 1.39 0.65 1.19 0.85 0.00 -0.26 0.44
Asia Oceania -0.08 -0.50 -0.95 -0.95 -0.78 -0.80 -0.19 0.44 0.36 0.47 0.27 0.23 0.21 0.27 0.00 0.18
Total OECD 0.05 -2.14 -9.59 -6.02 -4.86 -5.65 -3.19 6.45 3.46 3.77 2.64 3.08 1.45 0.49 -0.32 1.16
Asia 0.80 -1.86 -1.93 -0.39 0.26 -0.98 2.77 2.49 1.03 0.72 1.75 0.81 0.32 0.98 0.48 0.65
Middle East -0.01 -0.13 -0.96 -0.51 -0.41 -0.50 -0.09 0.89 0.29 0.18 0.32 0.23 0.08 0.09 0.04 0.11
Americas 0.04 -0.40 -1.23 -0.66 -0.43 -0.68 0.02 0.83 0.48 0.25 0.40 0.13 0.16 -0.03 0.01 0.07
FSU 0.04 0.07 -0.55 -0.24 -0.19 -0.23 -0.01 0.58 0.24 0.32 0.28 0.06 -0.34 -0.45 -0.52 -0.31
Africa 0.03 -0.18 -0.82 -0.40 -0.34 -0.43 -0.05 0.51 0.21 0.22 0.22 0.12 0.17 0.12 0.07 0.12
Europe 0.03 -0.04 -0.13 -0.08 -0.05 -0.07 0.01 0.06 0.03 0.01 0.03 0.00 0.02 0.01 0.01 0.01
Total Non-OECD 0.93 -2.54 -5.62 -2.27 -1.15 -2.89 2.65 5.37 2.27 1.71 3.00 1.35 0.41 0.72 0.09 0.64
World 0.98 -4.68 -15.21 -8.29 -6.01 -8.54 -0.54 11.83 5.73 5.48 5.63 4.43 1.85 1.21 -0.23 1.80
Revisions to Oil Demand from Last Month's Report (mb/d)
Americas 0.00 0.00 0.00 0.00 0.00 0.00 0.00 0.00 0.00 0.00 0.00 0.11 0.00 -0.01 0.04 0.04
Europe 0.00 0.00 0.00 0.00 0.00 0.00 0.00 0.00 0.00 0.00 0.00 0.01 0.04 -0.02 -0.02 0.00
Asia Oceania 0.00 0.00 0.00 0.00 0.00 0.00 0.00 0.00 0.00 0.00 0.00 -0.09 -0.03 -0.07 -0.06 -0.06
Total OECD - - - - - - 0.00 -0.00 -0.00 0.01 0.00 0.04 0.01 -0.09 -0.04 -0.02
Asia 0.01 0.01 0.01 0.01 0.01 0.01 0.01 0.01 0.01 0.03 0.02 -0.01 -0.31 -0.06 -0.07 -0.11
Middle East 0.00 0.00 0.00 0.00 0.00 0.00 0.00 0.00 0.00 0.00 0.00 0.02 0.04 0.02 0.02 0.03
Americas 0.02 0.02 0.02 0.02 0.02 0.02 0.02 0.02 0.02 0.06 0.03 0.06 0.05 0.02 0.05 0.04
FSU 0.00 0.00 0.00 0.00 0.00 0.00 0.00 0.00 0.00 0.00 0.00 0.05 0.02 -0.01 -0.03 0.01
Africa -0.01 -0.01 -0.01 -0.01 -0.01 -0.01 -0.01 -0.01 -0.01 0.03 0.00 0.07 0.04 0.03 0.03 0.04
Europe 0.00 0.00 0.00 0.00 0.00 0.00 0.00 0.00 0.00 0.00 0.00 0.00 0.00 0.00 0.00 0.00
Total Non-OECD 0.02 0.03 0.03 0.03 0.03 0.03 0.03 0.03 0.03 0.12 0.05 0.19 -0.16 -0.01 0.00 0.01
World 0.02 0.03 0.03 0.03 0.03 0.03 0.03 0.03 0.03 0.13 0.05 0.23 -0.15 -0.10 -0.03 -0.01
Revisions to Oil Demand Growth from Last Month's Report (mb/d)
World 0.01 0.00 0.00 0.01 0.01 0.01 0.00 0.00 0.00 0.10 0.03 0.20 -0.18 -0.12 -0.16 -0.07
1 US figures exclude US territories.
2 France, Germany, Italy, Spain and UK
Table 2
SUMMARY OF GLOBAL OIL DEMAND

Oil Market Report Tables
Page | 58 12 May 2022 IEA
. All
rig
hts
res
erve
d.
Table 2a: OECD Regional Oil Demand
2020 2021 1Q21 2Q21 3Q21 4Q21 Dec 21 Jan 22 Feb 22 2 Jan 22 Feb 21
Americas
LPG and ethane 3.56 3.71 3.71 3.58 3.59 3.94 4.44 4.53 4.28 -0.25 0.95
Naphtha 0.25 0.25 0.23 0.27 0.26 0.24 0.28 0.24 0.19 -0.04 0.00
Motor gasoline 9.55 10.34 9.45 10.57 10.73 10.58 10.63 9.47 10.22 0.75 1.05
Jet and kerosene 1.23 1.55 1.28 1.48 1.72 1.72 1.77 1.65 1.62 -0.02 0.38
Gasoil/diesel oil 4.93 5.08 5.08 5.05 5.02 5.16 5.07 5.19 5.41 0.22 0.37
Residual fuel oil 0.40 0.53 0.52 0.49 0.54 0.58 0.61 0.55 0.54 -0.01 0.03
Other products 2.64 2.82 2.55 2.93 2.96 2.83 2.70 2.60 2.78 0.18 0.50
Total 22.56 24.27 22.82 24.38 24.83 25.05 25.50 24.22 25.04 0.82 3.29
Europe
LPG and ethane 1.08 1.09 1.12 1.06 1.10 1.07 1.14 1.02 1.19 0.17 0.08
Naphtha 1.07 1.14 1.23 1.02 1.11 1.19 1.19 1.27 1.21 -0.05 -0.04
Motor gasoline 1.75 1.92 1.57 1.92 2.19 2.01 1.98 1.73 1.93 0.19 0.39
Jet and kerosene 0.73 0.84 0.61 0.67 1.01 1.05 1.08 0.94 1.00 0.06 0.36
Gasoil/diesel oil 5.96 6.26 5.70 6.13 6.52 6.69 6.56 5.64 6.44 0.80 0.62
Residual fuel oil 0.68 0.70 0.69 0.69 0.73 0.71 0.73 0.74 0.71 -0.03 0.04
Other products 1.15 1.13 1.00 1.14 1.19 1.17 1.04 1.04 1.08 0.03 0.09
Total 12.43 13.08 11.91 12.63 13.85 13.90 13.72 12.38 13.55 1.17 1.53
Asia Oceania
LPG and ethane 0.78 0.79 0.86 0.77 0.73 0.79 0.91 0.95 1.01 0.06 0.13
Naphtha 1.82 1.99 1.97 1.86 2.02 2.09 2.20 2.06 1.92 -0.14 -0.09
Motor gasoline 1.35 1.36 1.32 1.37 1.36 1.40 1.49 1.30 1.32 0.01 -0.06
Jet and kerosene 0.61 0.61 0.82 0.47 0.43 0.72 0.94 0.97 0.94 -0.03 0.09
Gasoil/diesel oil 1.79 1.83 1.82 1.82 1.77 1.92 2.03 1.83 1.93 0.10 0.01
Residual fuel oil 0.43 0.46 0.50 0.41 0.44 0.49 0.52 0.56 0.51 -0.05 -0.01
Other products 0.35 0.37 0.37 0.35 0.36 0.40 0.46 0.35 0.44 0.09 0.06
Total 7.14 7.41 7.66 7.04 7.11 7.82 8.54 8.03 8.07 0.05 0.14
OECD
LPG and ethane 5.43 5.59 5.70 5.41 5.43 5.80 6.49 6.50 6.48 -0.02 1.16
Naphtha 3.14 3.37 3.43 3.15 3.38 3.52 3.67 3.56 3.33 -0.23 -0.14
Motor gasoline 12.66 13.62 12.34 13.86 14.29 13.99 14.11 12.51 13.47 0.95 1.38
Jet and kerosene 2.57 3.00 2.70 2.62 3.16 3.49 3.78 3.55 3.56 0.01 0.83
Gasoil/diesel oil 12.68 13.17 12.61 13.00 13.30 13.77 13.66 12.66 13.78 1.12 1.00
Residual fuel oil 1.50 1.70 1.71 1.59 1.71 1.79 1.86 1.85 1.76 -0.09 0.06
Other products 4.14 4.32 3.91 4.42 4.52 4.41 4.20 3.99 4.29 0.30 0.65
Total 42.13 44.76 42.40 44.05 45.79 46.77 47.76 44.62 46.66 2.04 4.96
1 Demand, measured as deliveries from refineries and primary stocks, comprises inland deliveries, international bunkers and refinery fuel. It includes crude for direct burning, oil from
non-conventional sources and other sources of supply. Jet/kerosene comprises jet kerosene and non-aviation kerosene. Gasoil comprises diesel, light heating oil and other gasoils.
North America comprises US 50 states, US territories, Mexico, Canada and Chile.
2 Latest official OECD submissions (MOS).
Latest month vs.
Table 2a
OECD REGIONAL OIL DEMAND1
(million barrels per day)

Oil Market Report Tables
Page | 59 12 May 2022 IEA
. All
rig
hts
res
erve
d.
Table 2b: Oil Demand in Selected OECD
Countries 2020 2021 1Q21 2Q21 3Q21 4Q21 Dec 21 Jan 22 Feb 22 2 Jan 22 Feb 21
United States3
LPG and ethane 2.74 2.85 2.85 2.76 2.73 3.07 3.50 3.62 3.46 -0.16 1.02
Naphtha 0.18 0.19 0.16 0.21 0.20 0.18 0.21 0.16 0.14 -0.03 0.01
Motor gasoline 8.05 8.80 8.00 9.07 9.13 8.96 8.95 7.98 8.60 0.62 0.85
Jet and kerosene 1.08 1.38 1.14 1.34 1.52 1.49 1.53 1.44 1.40 -0.03 0.28
Gasoil/diesel oil 3.78 3.94 3.97 3.93 3.87 4.00 3.93 4.08 4.18 0.10 0.23
Residual fuel oil 0.21 0.31 0.26 0.25 0.33 0.41 0.42 0.33 0.36 0.03 0.10
Other products 2.13 2.32 2.05 2.47 2.43 2.30 2.23 2.11 2.30 0.19 0.49
Total 18.19 19.78 18.45 20.03 20.21 20.41 20.76 19.73 20.44 0.70 2.99
JapanLPG and ethane 0.41 0.42 0.50 0.40 0.37 0.43 0.51 0.52 0.54 0.02 0.03
Naphtha 0.68 0.73 0.74 0.68 0.70 0.79 0.83 0.72 0.67 -0.05 -0.07
Motor gasoline 0.76 0.74 0.71 0.71 0.78 0.76 0.80 0.69 0.69 0.00 -0.05
Jet and kerosene 0.36 0.36 0.55 0.24 0.21 0.45 0.63 0.64 0.63 -0.01 0.03
Diesel 0.40 0.40 0.41 0.39 0.39 0.42 0.44 0.38 0.42 0.04 -0.01
Other gasoil 0.30 0.31 0.35 0.28 0.27 0.33 0.37 0.35 0.38 0.03 0.00
Residual fuel oil 0.21 0.24 0.27 0.21 0.23 0.26 0.28 0.30 0.28 -0.03 0.02
Other products 0.20 0.22 0.20 0.18 0.23 0.25 0.27 0.21 0.28 0.07 0.10
Total 3.33 3.42 3.73 3.08 3.18 3.67 4.14 3.80 3.87 0.07 0.04
GermanyLPG and ethane 0.11 0.12 0.12 0.13 0.12 0.11 0.11 0.11 0.11 0.00 -0.01
Naphtha 0.29 0.34 0.35 0.31 0.32 0.36 0.37 0.38 0.39 0.01 0.01
Motor gasoline 0.45 0.45 0.40 0.44 0.48 0.46 0.44 0.40 0.42 0.01 0.03
Jet and kerosene 0.10 0.13 0.09 0.11 0.16 0.16 0.16 0.15 0.15 0.01 0.06
Diesel 0.71 0.71 0.60 0.71 0.77 0.75 0.70 0.64 0.63 -0.01 0.05
Other gasoil 0.36 0.28 0.22 0.26 0.26 0.36 0.35 0.26 0.28 0.02 0.02
Residual fuel oil 0.05 0.05 0.05 0.04 0.05 0.06 0.06 0.07 0.04 -0.03 -0.01
Other products 0.08 0.07 0.05 0.06 0.07 0.08 0.06 0.05 0.06 0.01 0.00
Total 2.15 2.14 1.89 2.07 2.23 2.34 2.26 2.05 2.09 0.03 0.16
ItalyLPG and ethane 0.09 0.10 0.11 0.09 0.09 0.11 0.14 0.11 0.13 0.02 0.01
Naphtha 0.10 0.10 0.11 0.10 0.09 0.11 0.11 0.11 0.12 0.01 0.03
Motor gasoline 0.14 0.17 0.13 0.17 0.19 0.18 0.17 0.14 0.17 0.03 0.02
Jet and kerosene 0.04 0.04 0.02 0.04 0.07 0.05 0.04 0.05 0.04 0.00 0.02
Diesel 0.42 0.49 0.44 0.49 0.52 0.52 0.53 0.44 0.52 0.08 0.04
Other gasoil 0.06 0.06 0.05 0.06 0.07 0.06 0.06 0.02 0.04 0.01 -0.01
Residual fuel oil 0.06 0.06 0.05 0.05 0.06 0.06 0.05 0.05 0.05 0.01 0.00
Other products 0.14 0.15 0.14 0.16 0.16 0.16 0.15 0.13 0.15 0.02 0.02
Total 1.05 1.18 1.04 1.15 1.25 1.25 1.26 1.05 1.23 0.18 0.13
FranceLPG and ethane 0.11 0.12 0.12 0.13 0.11 0.10 0.12 0.12 0.13 0.01 0.00
Naphtha 0.12 0.14 0.15 0.12 0.13 0.15 0.15 0.15 0.14 -0.01 -0.02
Motor gasoline 0.17 0.21 0.18 0.20 0.24 0.22 0.22 0.19 0.22 0.03 0.04
Jet and kerosene 0.09 0.09 0.08 0.07 0.11 0.11 0.10 0.10 0.09 0.00 0.01
Diesel 0.67 0.73 0.68 0.72 0.78 0.76 0.73 0.64 0.74 0.10 0.06
Other gasoil 0.14 0.13 0.17 0.09 0.11 0.15 0.17 0.17 0.17 0.00 0.00
Residual fuel oil 0.03 0.03 0.03 0.03 0.03 0.03 0.03 0.04 0.04 0.00 0.01
Other products 0.09 0.09 0.07 0.09 0.12 0.09 0.08 0.06 0.08 0.02 0.01
Total 1.42 1.54 1.47 1.45 1.63 1.61 1.59 1.46 1.61 0.15 0.10
United KingdomLPG and ethane 0.13 0.11 0.13 0.09 0.10 0.11 0.10 0.11 0.11 0.00 -0.02
Naphtha 0.02 0.00 0.01 0.01 0.00 0.00 0.00 0.01 0.00 0.00 -0.01
Motor gasoline 0.22 0.25 0.20 0.26 0.28 0.28 0.28 0.26 0.28 0.02 0.11
Jet and kerosene 0.19 0.18 0.17 0.14 0.16 0.24 0.29 0.22 0.25 0.03 0.06
Diesel 0.43 0.48 0.42 0.50 0.50 0.50 0.50 0.44 0.54 0.10 0.11
Other gasoil 0.11 0.13 0.11 0.14 0.14 0.12 0.11 0.10 0.12 0.02 0.00
Residual fuel oil 0.02 0.02 0.02 0.01 0.02 0.02 0.02 0.02 0.01 0.00 0.00
Other products 0.10 0.11 0.09 0.11 0.11 0.10 0.10 0.10 0.11 0.01 0.02
Total 1.21 1.27 1.16 1.25 1.31 1.37 1.40 1.26 1.42 0.16 0.27
CanadaLPG and ethane 0.47 0.50 0.51 0.49 0.50 0.49 0.53 0.54 0.42 -0.12 -0.12
Naphtha 0.03 0.03 0.03 0.03 0.03 0.03 0.04 0.04 0.03 -0.01 0.00
Motor gasoline 0.77 0.80 0.75 0.78 0.87 0.80 0.81 0.75 0.81 0.06 0.06
Jet and kerosene 0.07 0.08 0.06 0.05 0.10 0.11 0.12 0.08 0.10 0.02 0.06
Diesel 0.27 0.27 0.27 0.27 0.27 0.26 0.26 0.26 0.29 0.03 0.00
Other gasoil 0.34 0.35 0.33 0.33 0.37 0.35 0.32 0.34 0.40 0.06 0.09
Residual fuel oil 0.03 0.03 0.03 0.03 0.02 0.03 0.04 0.05 0.03 -0.03 0.00
Other products 0.32 0.31 0.28 0.27 0.35 0.34 0.29 0.31 0.29 -0.02 0.03
Total 2.30 2.35 2.26 2.24 2.50 2.40 2.41 2.36 2.35 -0.01 0.12
1 Demand, measured as deliveries from refineries and primary stocks, comprises inland deliveries, international bunkers and refinery fuel. It includes crude for direct burning, oil from
non-conventional sources and other sources of supply. Jet/kerosene comprises jet kerosene and non-aviation kerosene. Gasoil comprises diesel, light heating oil and other gasoils.
2 Latest official OECD submissions (MOS).
3 US figures exclude US territories.
Latest month vs.
Table 2b
OIL DEMAND IN SELECTED OECD COUNTRIES1
(million barrels per day)

Oil Market Report Tables
Page | 60 12 May 2022 IEA
. All
rig
hts
res
erve
d.
Table 3: World Oil Production 2020 2021 2022 4Q21 1Q22 2Q22 3Q22 4Q22 Feb 22 Mar 22 Apr 22
OPEC
Crude Oil
Saudi Arabia 9.21 9.15 9.91 10.20 10.23 10.28 10.40
Iran 2.00 2.42 2.48 2.56 2.58 2.58 2.55
Iraq 4.05 4.03 4.24 4.29 4.23 4.33 4.42
UAE 2.87 2.76 2.90 3.01 2.95 3.03 3.03
Kuwait 2.41 2.42 2.53 2.61 2.61 2.64 2.65
Angola 1.27 1.12 1.12 1.16 1.16 1.14 1.18
Nigeria 1.49 1.31 1.24 1.30 1.27 1.25 1.23
Libya 0.35 1.15 1.12 1.08 1.16 1.10 0.90
Algeria 0.90 0.91 0.96 0.99 0.98 1.00 1.00
Congo 0.30 0.27 0.26 0.27 0.26 0.26 0.27
Gabon 0.20 0.18 0.19 0.19 0.19 0.20 0.19
Equatorial Guinea 0.11 0.10 0.08 0.09 0.09 0.09 0.10
Venezuela 0.53 0.61 0.76 0.71 0.72 0.72 0.75
Total Crude Oil 25.69 26.43 27.80 28.46 28.43 28.62 28.67
of which Neutral Zone1
0.11 0.25 0.28 0.27 0.22 0.28 0.29
Total NGLs2
5.09 5.12 5.37 5.16 5.28 5.37 5.41 5.41 5.26 5.31 5.36
Total OPEC3 30.78 31.55 32.96 33.74 33.69 33.93 34.03
NON-OPEC4
OECD
Americas 23.84 24.32 25.74 25.30 24.73 25.37 26.19 26.65 24.66 24.95 25.01
United States 16.56 16.73 17.88 17.54 17.05 17.65 18.22 18.59 16.96 17.21 17.32
Mexico 1.93 1.95 2.03 1.97 2.00 2.02 2.04 2.08 1.99 2.01 2.00
Canada 5.35 5.63 5.82 5.77 5.67 5.70 5.92 5.97 5.70 5.73 5.68
Chile 0.01 0.01 0.01 0.01 0.01 0.01 0.01 0.01 0.01 0.01 0.01
Europe 3.56 3.38 3.31 3.38 3.34 3.23 3.25 3.40 3.37 3.32 3.33
UK 1.08 0.89 0.91 0.88 0.92 0.89 0.91 0.90 0.94 0.91 0.91
Norway 2.01 2.04 1.96 2.04 1.97 1.89 1.90 2.07 1.98 1.96 1.98
Others 0.47 0.46 0.44 0.46 0.46 0.44 0.43 0.43 0.45 0.45 0.44
Asia Oceania 0.52 0.50 0.49 0.51 0.49 0.49 0.49 0.49 0.49 0.49 0.49
Australia 0.45 0.43 0.42 0.45 0.42 0.42 0.42 0.42 0.41 0.42 0.42
Others 0.07 0.07 0.07 0.07 0.07 0.07 0.07 0.07 0.07 0.07 0.07
Total OECD 27.92 28.20 29.54 29.19 28.57 29.10 29.93 30.54 28.52 28.77 28.83
NON-OECD
Former USSR 13.50 13.77 12.53 14.31 14.41 12.52 11.52 11.73 14.45 14.34 13.13
Russia 10.61 10.87 9.62 11.24 11.37 9.80 8.65 8.71 11.40 11.35 10.40
Azerbaijan 0.70 0.70 0.70 0.71 0.70 0.69 0.69 0.70 0.69 0.70 0.70
Kazakhstan 1.84 1.85 1.89 1.99 1.98 1.72 1.86 2.00 2.00 1.95 1.72
Others 0.36 0.36 0.33 0.36 0.36 0.32 0.32 0.32 0.37 0.34 0.31
Asia 6.99 6.91 6.98 6.81 7.02 7.02 6.98 6.91 7.05 7.05 7.01
China 3.97 4.06 4.23 4.01 4.23 4.26 4.23 4.19 4.22 4.25 4.24
Malaysia 0.60 0.57 0.57 0.55 0.58 0.55 0.58 0.58 0.60 0.59 0.57
India 0.75 0.73 0.70 0.72 0.72 0.71 0.70 0.69 0.72 0.72 0.71
Indonesia 0.73 0.68 0.65 0.67 0.66 0.66 0.65 0.64 0.66 0.66 0.66
Others 0.93 0.88 0.83 0.85 0.83 0.84 0.83 0.82 0.85 0.83 0.84
Europe 0.12 0.11 0.11 0.11 0.11 0.11 0.11 0.10 0.11 0.11 0.11
Americas 5.32 5.30 5.61 5.18 5.43 5.46 5.73 5.84 5.39 5.43 5.51
Brazil 3.04 3.00 3.15 2.93 3.08 3.03 3.21 3.26 3.02 3.07 3.10
Argentina 0.61 0.64 0.70 0.67 0.69 0.70 0.71 0.71 0.69 0.69 0.70
Colombia 0.79 0.74 0.74 0.75 0.75 0.74 0.74 0.75 0.75 0.75 0.74
Ecuador 0.48 0.48 0.47 0.40 0.47 0.48 0.47 0.46 0.49 0.48 0.48
Others 0.40 0.43 0.55 0.42 0.44 0.51 0.60 0.66 0.45 0.44 0.49
Middle East 3.01 3.09 3.21 3.13 3.16 3.23 3.23 3.23 3.13 3.19 3.21
Oman 0.96 0.98 1.07 1.01 1.04 1.07 1.08 1.08 1.05 1.05 1.06
Qatar 1.77 1.82 1.84 1.83 1.82 1.85 1.85 1.85 1.79 1.82 1.85
Others 0.28 0.29 0.30 0.29 0.30 0.31 0.30 0.30 0.30 0.31 0.31
Africa 1.39 1.31 1.28 1.30 1.27 1.27 1.29 1.29 1.24 1.28 1.24
Egypt 0.60 0.57 0.57 0.57 0.57 0.57 0.57 0.57 0.57 0.57 0.57
Others 0.79 0.74 0.72 0.73 0.71 0.70 0.73 0.72 0.67 0.71 0.67
Total Non-OECD 30.33 30.50 29.73 30.84 31.40 29.59 28.86 29.10 31.38 31.39 30.20
Processing gains5
2.11 2.25 2.29 2.32 2.29 2.29 2.29 2.29 2.29 2.29 2.29
Global biofuels 2.63 2.75 2.92 2.69 2.43 3.03 3.29 2.93 2.47 2.48 2.78
TOTAL NON-OPEC 63.00 63.71 64.48 65.03 64.69 64.01 64.37 64.86 64.65 64.92 64.11
TOTAL SUPPLY 93.78 95.25 97.99 98.42 98.34 98.85 98.14
1 Neutral Zone production is already included in Saudi Arabia and Kuwait production with their respective shares.
2 Includes condensates reported by OPEC countries, oil from non-conventional sources, e.g. GTL in Nigeria and non-oil inputs to Saudi Arabian MTBE.
3 OPEC data based on today's membership throughout the time series.
4 Comprises crude oil, condensates, NGLs and oil from non-conventional sources
5 Net volumetric gains and losses in refining and marine transportation losses.
Table 3
WORLD OIL PRODUCTION(million barrels per day)

Oil Market Report Tables
Page | 61 12 May 2022 IEA
. All
rig
hts
res
erve
d.
Table 3a: Oil Supply in OECD Countries 2020 2021 2022 4Q21 1Q22 2Q22 3Q22 4Q22 Feb 22 Mar 22 Apr 22
United States
Alaska 448 437 448 445 446 454 434 459 450 439 464
California 404 369 342 356 347 343 340 337 347 346 344
Texas 4854 4771 5205 4984 4887 5160 5369 5399 4831 4968 5063
Federal Gulf of Mexico2
1644 1701 1796 1729 1688 1799 1869 1827 1615 1734 1790
Other US Lower 48 3934 3909 4272 4118 4049 4125 4420 4488 4069 4080 3923
NGLs3
5175 5397 5639 5738 5463 5591 5611 5888 5475 5468 5563
Other Hydrocarbons 98 142 179 173 170 173 180 193 170 170 170
Total 16556 16727 17883 17542 17050 17647 18222 18591 16956 17205 17317
Canada
Alberta Light/Medium/Heavy 423 436 468 459 468 470 468 465 467 487 466
Alberta Bitumen 1718 1921 2143 1963 2018 2133 2283 2136 1955 1955 2168
Saskatchewan 435 445 442 451 448 444 440 436 449 447 445
Other Crude 490 456 385 428 291 413 412 421 354 372 413
NGLs 949 1007 1032 988 1046 1027 1044 1011 1041 1052 1034
Other Upgraders 219 180 181 199 188 163 171 201 193 191 155
Synthetic Crudes 1116 1181 1166 1280 1214 1052 1102 1296 1246 1229 1000
Total 5349 5625 5817 5768 5674 5702 5920 5966 5705 5732 5682
Mexico
Crude 1716 1780 1864 1803 1825 1844 1870 1916 1812 1834 1831
NGLs 206 170 165 167 170 166 163 160 170 166 168
Total 1926 1954 2034 1975 2001 2015 2039 2082 1986 2006 2004
UK
Brent Fields 35 25 23 23 27 26 19 21 27 27 27
Forties Fields 297 212 217 245 242 208 199 221 241 238 237
Ninian Fields 31 24 18 20 20 19 18 17 19 19 19
Flotta Fields 51 50 40 44 42 38 41 40 41 41 42
Other Fields 575 511 533 472 513 530 562 529 534 511 507
NGLs 88 67 74 72 74 74 74 73 75 76 74
Total 1077 888 907 877 918 895 912 902 937 912 905
Norway5
Ekofisk-Ula Area 132 141 111 141 132 71 115 127 131 133 131
Oseberg-Troll Area 234 212 224 224 223 231 198 245 227 205 233
Statfjord-Gullfaks Area 230 262 238 268 246 241 236 231 240 248 242
Haltenbanken Area 280 284 281 296 287 285 276 279 279 290 285
Sleipner-Frigg Area 743 822 841 862 871 792 809 892 868 870 799
Other Fields 101 67 59 23 -1 68 69 99 28 8 81
NGLs 288 249 204 231 211 207 200 200 207 208 209
Total 2007 2037 1960 2044 1969 1894 1902 2073 1980 1961 1980
Other OECD Europe
Denmark 71 66 65 67 67 66 64 63 68 67 66
Italy 101 100 126 114 126 126 125 124 133 127 125
Turkey 62 66 64 67 64 64 64 63 63 64 63
Other 91 99 87 97 89 89 87 85 79 91 89
NGLs 7 7 7 6 8 7 7 7 7 7 8
Non-Conventional Oils 144 120 92 105 104 90 88 88 101 89 93
Total 474 457 441 456 457 441 435 430 451 446 445
AustraliaGippsland Basin 8 4 4 4 4 4 4 3 4 4 4
Cooper-Eromanga Basin 35 23 19 21 20 20 19 19 20 20 20
Carnarvon Basin 106 112 112 118 116 113 111 108 116 115 114
Other Crude 202 195 179 202 175 179 181 184 169 182 178
NGLs 102 99 103 101 104 103 102 102 107 102 104
Total 453 434 417 446 418 418 417 416 415 422 419
Other OECD Asia OceaniaNew Zealand 21 18 17 18 16 17 17 16 16 17 17
Japan 4 4 4 4 4 4 4 4 4 4 4
NGLs 11 11 10 11 11 10 10 10 12 10 10
Non-Conventional Oils 34 37 41 35 41 41 40 40 42 39 41
Total 71 71 71 68 72 71 71 70 74 70 72
OECDCrude Oil 19475 19525 20631 20066 19750 20376 21121 21257 19656 19943 20193
NGLs 6834 7013 7244 7324 7096 7195 7220 7460 7102 7099 7178
Non-Conventional Oils4
1615 1664 1664 1796 1722 1523 1587 1823 1757 1724 1464
Total 27923 28202 29539 29186 28568 29095 29928 30540 28516 28766 28835
1 Subcategories refer to crude oil only unless otherwise noted.
2 Only production from Federal waters is included.
3 To the extent possible, condensates from natural gas processing plants are included with NGLs, while field condensates are counted as crude oil.
4 Does not include biofuels.
5 North Sea production is grouped by area including all fields being processed through the named field complex, ie, not just the field of that name.
6 Other North Sea NGLs are included.
Table 3a
OIL SUPPLY IN OECD COUNTRIES1
(thousand of barrels per day)

Oil Market Report Tables
Page | 62 12 May 2022 IEA
. All
rig
hts
res
erve
d.
Table 3b: World Oil Production
(Including OPEC+ based on current
agreement1)
2020 2021 2022 1Q21 2Q21 3Q21 4Q21 1Q22 Jan 22 Mar 22 Apr 22
OPEC+
Crude Oil
Algeria 0.90 0.91 0.99 0.87 0.89 0.92 0.96 0.99 0.98 1.00 1.00
Angola 1.27 1.12 1.13 1.14 1.12 1.11 1.12 1.16 1.19 1.14 1.18
Azerbaijan 0.61 0.59 0.57 0.59 0.60 0.60 0.59 0.58 0.58 0.58 0.58
Bahrain 0.17 0.17 0.19 0.17 0.17 0.18 0.18 0.18 0.16 0.20 0.19
Brunei 0.08 0.08 0.09 0.09 0.09 0.08 0.08 0.08 0.08 0.08 0.09
Congo 0.30 0.27 0.28 0.28 0.27 0.27 0.26 0.27 0.28 0.26 0.27
Equatorial Guinea 0.11 0.10 0.10 0.11 0.11 0.10 0.08 0.09 0.09 0.09 0.10
Gabon 0.20 0.18 0.18 0.17 0.18 0.18 0.19 0.19 0.18 0.20 0.19
Iran 2.00 2.42 2.55 2.32 2.40 2.47 2.48 2.56 2.52 2.58 2.55
Iraq 4.05 4.03 4.50 3.88 3.94 4.06 4.24 4.29 4.30 4.33 4.42
Kazakhstan 1.50 1.52 1.56 1.49 1.52 1.41 1.66 1.63 1.63 1.60 1.41
Kuwait 2.41 2.42 2.72 2.34 2.35 2.44 2.53 2.61 2.57 2.64 2.65
Libya 0.35 1.15 1.11 1.15 1.15 1.16 1.12 1.08 1.00 1.10 0.90
Malaysia 0.46 0.42 0.42 0.45 0.43 0.39 0.40 0.42 0.40 0.43 0.41
Mexico 1.66 1.66 1.66 1.67 1.69 1.65 1.65 1.64 1.65 1.63 1.64
Nigeria 1.49 1.31 1.34 1.39 1.34 1.27 1.24 1.30 1.38 1.25 1.23
Oman 0.76 0.75 0.84 0.73 0.74 0.76 0.78 0.82 0.81 0.83 0.84
Russia 9.42 9.62 8.23 9.26 9.54 9.72 9.95 10.04 10.07 10.00 9.10
Saudi Arabia 9.21 9.15 10.66 8.51 8.56 9.60 9.91 10.20 10.10 10.28 10.40
South Sudan 0.16 0.15 0.15 0.14 0.16 0.16 0.15 0.14 0.15 0.13 0.14
Sudan 0.06 0.06 0.06 0.06 0.06 0.06 0.06 0.06 0.06 0.06 0.06
UAE 2.87 2.76 3.10 2.65 2.68 2.80 2.90 3.01 3.05 3.03 3.03
Venezuela 0.53 0.61 0.74 0.55 0.55 0.59 0.76 0.71 0.69 0.72 0.75
Total Crude Oil 40.57 41.47 43.14 40.02 40.54 41.98 43.31 44.04 43.93 44.15 43.12
of which Neutral Zone 0.11 0.22 0.23 0.26 0.24 0.28 0.30 0.28 0.29
Total NGLs 7.36 7.50 8.00 7.48 7.48 7.39 7.64 7.86 7.80 7.92 7.85
TOTAL OPEC+ 47.9 49.0 51.1 47.5 48.0 49.4 51.0 51.9 51.7 52.1 51.0
NON-OPEC+
OECD
Americas2
21.91 22.36 23.71 21.37 22.30 22.43 23.32 22.73 22.58 22.95 23.01
United States 16.56 16.73 17.88 15.68 16.88 16.79 17.54 17.05 16.98 17.21 17.32
Canada 5.35 5.63 5.82 5.69 5.42 5.63 5.77 5.67 5.59 5.73 5.68
Chile 0.01 0.01 0.01 0.01 0.01 0.01 0.01 0.01 0.01 0.01 0.01
Europe 3.56 3.38 3.31 3.63 3.13 3.39 3.38 3.34 3.34 3.32 3.33
UK 1.08 0.89 0.91 1.03 0.77 0.88 0.88 0.92 0.91 0.91 0.91
Norway 2.01 2.04 1.96 2.14 1.92 2.05 2.04 1.97 1.97 1.96 1.98
Others 0.47 0.46 0.44 0.47 0.45 0.46 0.46 0.46 0.47 0.45 0.44
Asia Oceania 0.52 0.50 0.49 0.51 0.46 0.54 0.51 0.49 0.49 0.49 0.49
Australia 0.45 0.43 0.42 0.44 0.39 0.46 0.45 0.42 0.42 0.42 0.42
Others 0.07 0.07 0.07 0.07 0.07 0.08 0.07 0.07 0.07 0.07 0.07
Total OECD (non-OPEC+) 26.00 26.25 27.50 25.51 25.89 26.36 27.21 26.57 26.41 26.76 26.83
Non-OECD
FSU 0.36 0.36 0.33 0.35 0.35 0.36 0.36 0.36 0.36 0.34 0.31
Asia 6.27 6.24 6.31 6.29 6.28 6.25 6.15 6.35 6.33 6.36 6.34
China 3.97 4.06 4.23 4.06 4.09 4.08 4.01 4.23 4.22 4.25 4.24
India 0.75 0.73 0.70 0.74 0.72 0.73 0.72 0.72 0.71 0.72 0.71
Indonesia 0.73 0.68 0.65 0.70 0.68 0.68 0.67 0.66 0.67 0.66 0.66
Others 0.82 0.77 0.73 0.79 0.79 0.76 0.74 0.74 0.73 0.73 0.73
Europe 0.12 0.11 0.11 0.11 0.11 0.11 0.11 0.11 0.11 0.11 0.11
Americas 5.32 5.30 5.61 5.27 5.31 5.42 5.18 5.43 5.46 5.43 5.51
Brazil 3.04 3.00 3.15 2.95 3.04 3.10 2.93 3.08 3.14 3.07 3.10
Argentina 0.61 0.64 0.70 0.62 0.63 0.64 0.67 0.69 0.69 0.69 0.70
Colombia 0.79 0.74 0.74 0.75 0.72 0.75 0.75 0.75 0.75 0.75 0.74
Ecuador 0.48 0.48 0.47 0.51 0.50 0.49 0.40 0.47 0.46 0.48 0.48
Others 0.4 0.4 0.6 0.4 0.4 0.4 0.4 0.4 0.4 0.4 0.5
Middle East 1.87 1.93 1.95 1.92 1.92 1.93 1.93 1.93 1.96 1.93 1.95
Qatar 1.77 1.82 1.84 1.82 1.82 1.82 1.83 1.82 1.85 1.82 1.85
Others 0.10 0.10 0.10 0.10 0.10 0.10 0.11 0.11 0.11 0.11 0.11
Africa 1.2 1.1 1.1 1.11 1.11 1.08 1.09 1.08 1.08 1.09 1.04
Egypt 0.60 0.57 0.57 0.57 0.58 0.56 0.57 0.57 0.57 0.57 0.57
Others 0.57 0.53 0.51 0.54 0.53 0.52 0.52 0.51 0.52 0.53 0.48
Total non-OECD (non-OPEC+) 15.11 15.03 15.38 15.06 15.09 15.15 14.82 15.24 15.30 15.26 15.27
Processing gains 2.11 2.25 2.29 2.13 2.22 2.34 2.32 2.29 2.29 2.29 2.29
Global biofuels 2.63 2.75 2.92 2.18 2.94 3.19 2.69 2.43 2.34 2.48 2.78
TOTAL NON-OPEC+ 45.85 46.28 48.10 44.88 46.14 47.04 47.04 46.53 46.34 46.78 47.17
TOTAL SUPPLY 93.78 95.25 99.24 92.39 94.16 96.40 97.99 98.42 98.06 98.85 98.14
1 From May 2022, OPEC+ supply reflects latest OPEC+ deal and individual country's sustainable capacity. Libya, Iran, Venezuela held at most recent level through 2022.
2 Excludes Mexico
Table 3bWORLD OIL PRODUCTION (Including OPEC+ based on current agreement
1)
(million barrels per day)

Oil Market Report Tables
Page | 63 12 May 2022 IEA
. All
rig
hts
res
erve
d.
Table 4: OECD Industry Stocks and
Quarterly Stock Changes
RECENT MONTHLY STOCKS2
PRIOR YEARS' STOCKS2
STOCK CHANGES
in Million Barrels in Million Barrels in mb/d
Nov2021 Dec2021 Jan2022 Feb2022 Mar2022³ Mar2019 Mar2020 Mar2021 2Q2021 3Q2021 4Q2021 1Q2022
OECD INDUSTRY-CONTROLLED STOCKS1
OECD Americas
Crude 605.1 588.5 570.5 561.0 561.0 605.1 635.6 664.6 -0.58 -0.33 0.07 -0.31
Motor Gasoline 247.6 259.8 280.8 279.9 271.5 267.3 292.0 266.7 -0.02 -0.13 0.07 0.13
Middle Distillate 196.2 195.4 193.7 190.9 185.7 207.5 198.5 215.4 -0.01 -0.12 -0.09 -0.11
Residual Fuel Oil 35.0 31.9 33.7 34.7 36.5 33.9 40.8 39.5 -0.01 -0.04 -0.03 0.05
Total Products4
739.9 725.9 725.7 705.3 695.0 737.5 772.5 742.0 0.26 -0.03 -0.40 -0.34
Total4
1505.1 1465.8 1452.2 1424.1 1417.4 1503.4 1583.1 1569.9 -0.29 -0.39 -0.45 -0.54
OECD Europe
Crude 313.3 300.5 295.0 311.0 327.4 363.5 363.9 352.9 -0.12 -0.38 -0.06 0.30
Motor Gasoline 87.9 86.8 94.9 92.6 89.7 98.7 99.5 90.3 -0.04 -0.07 0.07 0.03
Middle Distillate 255.9 244.5 256.2 244.7 241.2 268.0 292.4 312.2 -0.06 -0.37 -0.31 -0.04
Residual Fuel Oil 60.8 59.6 61.1 62.0 60.8 59.4 71.0 66.6 -0.03 -0.01 -0.04 0.01
Total Products4
502.2 487.9 510.4 496.8 485.8 540.9 586.3 572.6 -0.19 -0.44 -0.29 -0.02
Total5
888.7 857.2 877.3 881.7 890.7 988.9 1032.9 1002.3 -0.31 -0.89 -0.38 0.37
OECD Asia Oceania
Crude 108.8 99.4 97.6 97.9 104.3 158.8 132.0 123.8 0.01 -0.17 -0.11 0.06
Motor Gasoline 24.5 24.0 27.0 27.6 26.9 26.7 26.3 29.1 0.00 -0.03 -0.03 0.03
Middle Distillate 70.2 64.2 61.8 60.8 59.3 67.4 68.0 63.2 0.02 0.07 -0.09 -0.05
Residual Fuel Oil 16.0 16.9 16.9 18.0 15.6 19.3 18.7 17.1 0.00 0.02 -0.02 -0.01
Total Products4
175.0 162.8 168.8 165.4 161.2 166.2 172.5 166.2 0.05 0.15 -0.23 -0.02
Total5
344.9 323.7 323.7 317.2 317.7 381.3 365.9 346.3 0.12 -0.02 -0.34 -0.07
Total OECD
Crude 1027.2 988.4 963.1 969.9 992.7 1127.4 1131.5 1141.3 -0.69 -0.88 -0.10 0.05
Motor Gasoline 360.0 370.6 402.7 400.1 388.0 392.7 417.8 386.1 -0.06 -0.22 0.11 0.19
Middle Distillate 522.3 504.2 511.8 496.4 486.2 542.9 558.9 590.7 -0.04 -0.42 -0.48 -0.20
Residual Fuel Oil 111.8 108.4 111.7 114.7 112.9 112.6 130.5 123.2 -0.04 -0.03 -0.09 0.05
Total Products4
1417.1 1376.6 1404.9 1367.5 1342.0 1444.5 1531.2 1480.8 0.11 -0.32 -0.92 -0.38
Total5
2738.7 2646.7 2653.1 2622.9 2625.8 2873.6 2981.8 2918.5 -0.48 -1.30 -1.18 -0.23
OECD GOVERNMENT-CONTROLLED STOCKS6
OECD Americas
Crude 601.5 593.7 588.3 578.9 564.9 649.1 635.0 637.8 -0.18 -0.04 -0.26 -0.32
Products 2.0 2.0 2.0 2.0 2.0 2.0 2.0 2.0 0.00 0.00 0.00 0.00
OECD Europe
Crude 202.4 200.3 199.6 198.9 197.5 208.9 206.8 207.3 -0.02 0.00 -0.05 -0.03
Products 275.2 277.0 276.5 274.8 267.8 276.5 275.4 283.2 -0.05 -0.01 -0.01 -0.10
OECD Asia Oceania
Crude 370.5 370.1 370.1 370.1 367.8 378.6 377.4 374.6 0.00 -0.05 0.01 -0.03
Products 38.9 38.9 38.4 38.0 37.9 38.8 38.9 38.8 0.00 0.00 0.00 -0.01
Total OECD
Crude 1174.3 1164.0 1158.0 1147.9 1130.2 1236.6 1219.2 1219.6 -0.20 -0.10 -0.31 -0.38
Products 316.1 317.9 316.9 314.8 307.6 317.3 316.3 324.0 -0.05 -0.01 -0.01 -0.11
Total5
1492.4 1483.8 1476.4 1464.2 1439.5 1556.9 1537.3 1545.8 -0.24 -0.12 -0.31 -0.49
1 Stocks are primary national territory stocks on land (excluding utility stocks and including pipeline and entrepot stocks where known) and include stocks held by
industry to meet IEA, EU and national emergency reserve commitments and are subject to government control in emergencies.
2 Closing stock levels.
3 Estimated.
4 Total products includes gasoline, middle distillates, fuel oil and other products.
5 Total includes NGLs, refinery feedstocks, additives/oxygenates and other hydrocarbons.
6 Includes government-owned stocks and stock holding organisation stocks held for emergency purposes.
Table 4
OECD STOCKS AND QUARTERLY STOCK CHANGES
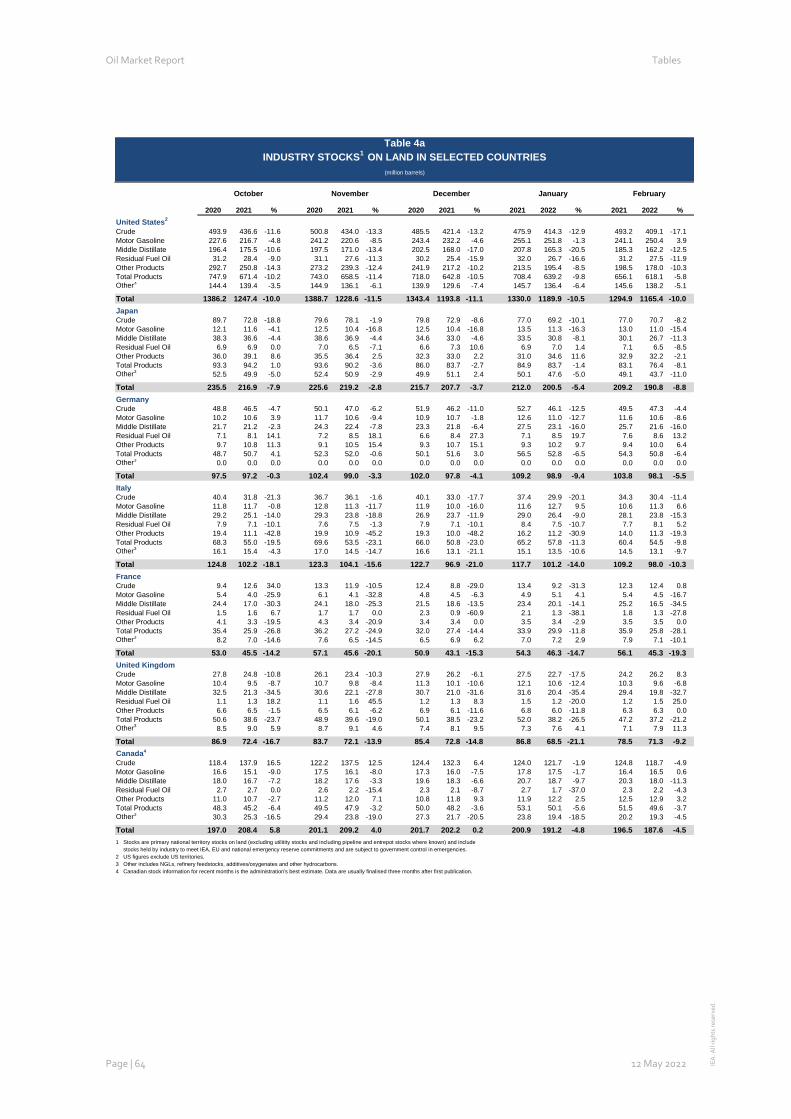
Oil Market Report Tables
Page | 64 12 May 2022 IEA
. All
rig
hts
res
erve
d.
Table 4a: Industry Stocks on Land in
Selected Countries October November December January February
2020 2021 % 2020 2021 % 2020 2021 % 2021 2022 % 2021 2022 %
United States2
Crude 493.9 436.6 -11.6 500.8 434.0 -13.3 485.5 421.4 -13.2 475.9 414.3 -12.9 493.2 409.1 -17.1
Motor Gasoline 227.6 216.7 -4.8 241.2 220.6 -8.5 243.4 232.2 -4.6 255.1 251.8 -1.3 241.1 250.4 3.9
Middle Distillate 196.4 175.5 -10.6 197.5 171.0 -13.4 202.5 168.0 -17.0 207.8 165.3 -20.5 185.3 162.2 -12.5
Residual Fuel Oil 31.2 28.4 -9.0 31.1 27.6 -11.3 30.2 25.4 -15.9 32.0 26.7 -16.6 31.2 27.5 -11.9
Other Products 292.7 250.8 -14.3 273.2 239.3 -12.4 241.9 217.2 -10.2 213.5 195.4 -8.5 198.5 178.0 -10.3
Total Products 747.9 671.4 -10.2 743.0 658.5 -11.4 718.0 642.8 -10.5 708.4 639.2 -9.8 656.1 618.1 -5.8
Other3
144.4 139.4 -3.5 144.9 136.1 -6.1 139.9 129.6 -7.4 145.7 136.4 -6.4 145.6 138.2 -5.1
Total 1386.2 1247.4 -10.0 1388.7 1228.6 -11.5 1343.4 1193.8 -11.1 1330.0 1189.9 -10.5 1294.9 1165.4 -10.0
Japan
Crude 89.7 72.8 -18.8 79.6 78.1 -1.9 79.8 72.9 -8.6 77.0 69.2 -10.1 77.0 70.7 -8.2
Motor Gasoline 12.1 11.6 -4.1 12.5 10.4 -16.8 12.5 10.4 -16.8 13.5 11.3 -16.3 13.0 11.0 -15.4
Middle Distillate 38.3 36.6 -4.4 38.6 36.9 -4.4 34.6 33.0 -4.6 33.5 30.8 -8.1 30.1 26.7 -11.3
Residual Fuel Oil 6.9 6.9 0.0 7.0 6.5 -7.1 6.6 7.3 10.6 6.9 7.0 1.4 7.1 6.5 -8.5
Other Products 36.0 39.1 8.6 35.5 36.4 2.5 32.3 33.0 2.2 31.0 34.6 11.6 32.9 32.2 -2.1
Total Products 93.3 94.2 1.0 93.6 90.2 -3.6 86.0 83.7 -2.7 84.9 83.7 -1.4 83.1 76.4 -8.1
Other352.5 49.9 -5.0 52.4 50.9 -2.9 49.9 51.1 2.4 50.1 47.6 -5.0 49.1 43.7 -11.0
Total 235.5 216.9 -7.9 225.6 219.2 -2.8 215.7 207.7 -3.7 212.0 200.5 -5.4 209.2 190.8 -8.8
Germany
Crude 48.8 46.5 -4.7 50.1 47.0 -6.2 51.9 46.2 -11.0 52.7 46.1 -12.5 49.5 47.3 -4.4
Motor Gasoline 10.2 10.6 3.9 11.7 10.6 -9.4 10.9 10.7 -1.8 12.6 11.0 -12.7 11.6 10.6 -8.6
Middle Distillate 21.7 21.2 -2.3 24.3 22.4 -7.8 23.3 21.8 -6.4 27.5 23.1 -16.0 25.7 21.6 -16.0
Residual Fuel Oil 7.1 8.1 14.1 7.2 8.5 18.1 6.6 8.4 27.3 7.1 8.5 19.7 7.6 8.6 13.2
Other Products 9.7 10.8 11.3 9.1 10.5 15.4 9.3 10.7 15.1 9.3 10.2 9.7 9.4 10.0 6.4
Total Products 48.7 50.7 4.1 52.3 52.0 -0.6 50.1 51.6 3.0 56.5 52.8 -6.5 54.3 50.8 -6.4
Other30.0 0.0 0.0 0.0 0.0 0.0 0.0 0.0 0.0 0.0 0.0 0.0 0.0 0.0 0.0
Total 97.5 97.2 -0.3 102.4 99.0 -3.3 102.0 97.8 -4.1 109.2 98.9 -9.4 103.8 98.1 -5.5
Italy
Crude 40.4 31.8 -21.3 36.7 36.1 -1.6 40.1 33.0 -17.7 37.4 29.9 -20.1 34.3 30.4 -11.4
Motor Gasoline 11.8 11.7 -0.8 12.8 11.3 -11.7 11.9 10.0 -16.0 11.6 12.7 9.5 10.6 11.3 6.6
Middle Distillate 29.2 25.1 -14.0 29.3 23.8 -18.8 26.9 23.7 -11.9 29.0 26.4 -9.0 28.1 23.8 -15.3
Residual Fuel Oil 7.9 7.1 -10.1 7.6 7.5 -1.3 7.9 7.1 -10.1 8.4 7.5 -10.7 7.7 8.1 5.2
Other Products 19.4 11.1 -42.8 19.9 10.9 -45.2 19.3 10.0 -48.2 16.2 11.2 -30.9 14.0 11.3 -19.3
Total Products 68.3 55.0 -19.5 69.6 53.5 -23.1 66.0 50.8 -23.0 65.2 57.8 -11.3 60.4 54.5 -9.8
Other316.1 15.4 -4.3 17.0 14.5 -14.7 16.6 13.1 -21.1 15.1 13.5 -10.6 14.5 13.1 -9.7
Total 124.8 102.2 -18.1 123.3 104.1 -15.6 122.7 96.9 -21.0 117.7 101.2 -14.0 109.2 98.0 -10.3
France
Crude 9.4 12.6 34.0 13.3 11.9 -10.5 12.4 8.8 -29.0 13.4 9.2 -31.3 12.3 12.4 0.8
Motor Gasoline 5.4 4.0 -25.9 6.1 4.1 -32.8 4.8 4.5 -6.3 4.9 5.1 4.1 5.4 4.5 -16.7
Middle Distillate 24.4 17.0 -30.3 24.1 18.0 -25.3 21.5 18.6 -13.5 23.4 20.1 -14.1 25.2 16.5 -34.5
Residual Fuel Oil 1.5 1.6 6.7 1.7 1.7 0.0 2.3 0.9 -60.9 2.1 1.3 -38.1 1.8 1.3 -27.8
Other Products 4.1 3.3 -19.5 4.3 3.4 -20.9 3.4 3.4 0.0 3.5 3.4 -2.9 3.5 3.5 0.0
Total Products 35.4 25.9 -26.8 36.2 27.2 -24.9 32.0 27.4 -14.4 33.9 29.9 -11.8 35.9 25.8 -28.1
Other38.2 7.0 -14.6 7.6 6.5 -14.5 6.5 6.9 6.2 7.0 7.2 2.9 7.9 7.1 -10.1
Total 53.0 45.5 -14.2 57.1 45.6 -20.1 50.9 43.1 -15.3 54.3 46.3 -14.7 56.1 45.3 -19.3
United Kingdom
Crude 27.8 24.8 -10.8 26.1 23.4 -10.3 27.9 26.2 -6.1 27.5 22.7 -17.5 24.2 26.2 8.3
Motor Gasoline 10.4 9.5 -8.7 10.7 9.8 -8.4 11.3 10.1 -10.6 12.1 10.6 -12.4 10.3 9.6 -6.8
Middle Distillate 32.5 21.3 -34.5 30.6 22.1 -27.8 30.7 21.0 -31.6 31.6 20.4 -35.4 29.4 19.8 -32.7
Residual Fuel Oil 1.1 1.3 18.2 1.1 1.6 45.5 1.2 1.3 8.3 1.5 1.2 -20.0 1.2 1.5 25.0
Other Products 6.6 6.5 -1.5 6.5 6.1 -6.2 6.9 6.1 -11.6 6.8 6.0 -11.8 6.3 6.3 0.0
Total Products 50.6 38.6 -23.7 48.9 39.6 -19.0 50.1 38.5 -23.2 52.0 38.2 -26.5 47.2 37.2 -21.2
Other38.5 9.0 5.9 8.7 9.1 4.6 7.4 8.1 9.5 7.3 7.6 4.1 7.1 7.9 11.3
Total 86.9 72.4 -16.7 83.7 72.1 -13.9 85.4 72.8 -14.8 86.8 68.5 -21.1 78.5 71.3 -9.2
Canada4
Crude 118.4 137.9 16.5 122.2 137.5 12.5 124.4 132.3 6.4 124.0 121.7 -1.9 124.8 118.7 -4.9
Motor Gasoline 16.6 15.1 -9.0 17.5 16.1 -8.0 17.3 16.0 -7.5 17.8 17.5 -1.7 16.4 16.5 0.6
Middle Distillate 18.0 16.7 -7.2 18.2 17.6 -3.3 19.6 18.3 -6.6 20.7 18.7 -9.7 20.3 18.0 -11.3
Residual Fuel Oil 2.7 2.7 0.0 2.6 2.2 -15.4 2.3 2.1 -8.7 2.7 1.7 -37.0 2.3 2.2 -4.3
Other Products 11.0 10.7 -2.7 11.2 12.0 7.1 10.8 11.8 9.3 11.9 12.2 2.5 12.5 12.9 3.2
Total Products 48.3 45.2 -6.4 49.5 47.9 -3.2 50.0 48.2 -3.6 53.1 50.1 -5.6 51.5 49.6 -3.7
Other330.3 25.3 -16.5 29.4 23.8 -19.0 27.3 21.7 -20.5 23.8 19.4 -18.5 20.2 19.3 -4.5
Total 197.0 208.4 5.8 201.1 209.2 4.0 201.7 202.2 0.2 200.9 191.2 -4.8 196.5 187.6 -4.5
1 Stocks are primary national territory stocks on land (excluding utilitity stocks and including pipeline and entrepot stocks where known) and include
stocks held by industry to meet IEA, EU and national emergency reserve commitments and are subject to government control in emergencies.
2 US figures exclude US territories.
3 Other includes NGLs, refinery feedstocks, additives/oxygenates and other hydrocarbons.
4 Canadian stock information for recent months is the administration's best estimate. Data are usually finalised three months after first publication.
Table 4a
INDUSTRY STOCKS1 ON LAND IN SELECTED COUNTRIES
(million barrels)

Oil Market Report Tables
Page | 65 12 May 2022 IEA
. All
rig
hts
res
erve
d.
Table 5: Total Stocks on Land in OECD
Countries 3
Stock Days Fwd2
Stock Days Fwd Stock Days Fwd Stock Days Fwd Stock Days Fwd
Level Demand Level Demand Level Demand Level Demand Level Demand
OECD Americas
Canada 198.3 89 201.6 81 198.3 82 202.3 - - -
Chile 9.7 30 11.7 31 10.4 28 10.8 - - -
Mexico 38.1 27 36.4 26 36.0 24 36.7 - - -
United States4
1941.5 97 1894.8 94 1860.5 91 1789.5 - - -
Total4 2209.7 91 2166.6 88 2127.3 86 2061.5 84 1984.3 80
OECD Asia Oceania
Australia 43.5 40 39.8 40 41.1 38 37.8 - - -
Israel - - - - - - - - - -
Japan 506.5 164 528.6 166 525.1 143 519.4 - - -
Korea 201.5 81 194.9 75 189.3 70 168.8 - - -
New Zealand 8.3 57 7.6 56 8.3 54 6.8 - - -
Total 759.7 108 770.9 108 763.7 98 732.8 93 723.4 100
OECD Europe5
Austria 23.6 97 23.0 84 21.1 83 20.9 - - -
Belgium 51.2 82 51.0 83 47.1 70 43.3 - - -
Czech Republic 23.1 108 21.8 93 21.7 97 22.5 - - -
Denmark 31.7 229 28.1 189 25.3 171 23.8 - - -
Estonia 2.9 107 2.9 99 2.7 102 2.5 - - -
Finland 39.1 230 39.5 209 37.3 191 36.2 - - -
France 162.1 112 163.0 100 157.3 98 151.6 - - -
Germany 278.0 134 275.7 123 270.4 116 268.9 - - -
Greece 34.4 144 30.5 100 26.4 92 28.4 - - -
Hungary 25.8 147 25.6 135 25.9 138 27.0 - - -
Ireland 11.7 87 12.0 83 10.6 66 10.8 - - -
Italy 126.8 110 128.9 103 118.0 94 112.5 - - -
Latvia 3.0 82 3.0 70 2.7 75 2.6 - - -
Lithuania 7.8 116 8.5 113 9.1 131 8.2 - - -
Luxembourg 0.6 13 0.8 14 0.5 9 0.6 - - -
Netherlands 158.1 196 147.2 181 125.8 160 109.5 - - -
Norway 28.2 146 23.6 99 20.2 81 21.4 - - -
Poland 82.7 126 80.0 103 78.1 104 80.6 - - -
Portugal 20.7 98 19.9 90 19.0 82 20.9 - - -
Slovak Republic 12.3 144 12.3 136 12.2 138 12.2 - - -
Slovenia 5.3 117 5.3 104 4.9 99 5.2 - - -
Spain 121.7 107 118.8 96 111.6 89 104.9 - - -
Sweden 48.8 162 45.2 144 38.3 123 30.1 - - -
Switzerland 33.7 192 32.9 178 33.4 156 31.5 - - -
Turkey 84.4 91 85.1 74 85.6 82 87.4 - - -
United Kingdom 76.9 61 76.2 58 71.6 52 72.8 - - -
Total 1494.9 118 1461.0 106 1377.0 99 1336.2 102 1357.6 101
Total OECD 4464.2 102 4398.5 97 4268.0 92 4130.5 91 4065.3 89
DAYS OF IEA Net Imports6 - 240 - 167 - 160 - 156 - -
1 Total Stocks are industry and government-controlled stocks (see breakdown in the table below). Stocks are primary national territory stocks on land (excluding utility stocks
and including pipeline and entrepot stocks where known) they include stocks held by industry to meet IEA, EU and national emergency reserves commitments and are
subject to government control in emergencies.
2 Note that days of forward demand represent the stock level divided by the forward quarter average daily demand and is very different from the days of net
imports used for the calculation of IEA Emergency Reserves.
3 End March 2022 forward demand figures are IEA Secretariat forecasts.
4 US figures exclude US territories. Total includes US territories.
5 Data not available for Iceland.
6 Reflects stock levels and prior calendar year's net imports adjusted according to IEA emergency reserve definitions (see www.iea.org/netimports.asp).
Net exporting IEA countries are excluded.
CLOSING STOCKS Total Industry Total Industry
1Q2019 4430 1557 2874 94 33 61
2Q2019 4483 1549 2934 93 32 61
3Q2019 4488 1544 2944 94 32 62
4Q2019 4429 1535 2894 98 34 64
1Q2020 4519 1537 2982 121 41 80
2Q2020 4779 1561 3217 113 37 76
3Q2020 4733 1551 3182 111 36 74
4Q2020 4579 1541 3038 109 37 72
1Q2021 4464 1546 2918 102 35 67
2Q2021 4398 1524 2875 97 33 63
3Q2021 4268 1513 2755 92 33 59
4Q2021 4130 1484 2647 91 33 58
1Q2022 4065 1439 2626 89 32 58
1 Includes government-owned stocks and stock holding organisation stocks held for emergency purposes.
2 Days of forward demand calculated using actual demand except in 1Q2022 (where latest forecasts are used).
Table 5
TOTAL STOCKS ON LAND IN OECD COUNTRIES1
controlled
Days of Fwd. Demand2
End March 2022End June 2021 End March 2021 End September 2021 End December 2021
Millions of Barrels
Government1
controlled
Government1
('millions of barrels' and 'days')
TOTAL OECD STOCKS

Oil Market Report Tables
Page | 66 12 May 2022 IEA
. All
rig
hts
res
erve
d.
Table 6: IEA Member Country
Destinations of Selected Crude Streams 2019 2020 2021 1Q21 2Q21 3Q21 4Q21 Dec 21 Jan 22 Feb 22 Feb 21 change
Saudi Light & Extra Light
Americas 0.20 0.26 0.34 0.18 0.31 0.45 0.43 0.45 0.36 0.42 0.08 0.33
Europe 0.68 0.59 0.48 0.43 0.40 0.55 0.55 0.53 0.51 0.48 0.41 0.08
Asia Oceania 1.42 1.39 1.30 1.41 1.12 1.18 1.48 1.77 1.65 1.59 1.60 -0.01
Saudi Medium
Americas 0.12 0.14 0.01 0.06 - - - - - - - -
Europe 0.02 0.02 0.01 0.01 - 0.02 - - - - - -
Asia Oceania 0.23 0.25 0.21 0.22 0.17 0.19 0.26 0.27 0.25 0.17 0.19 -0.02
Canada Heavy
Americas 2.27 2.39 2.59 2.62 2.43 2.47 2.82 2.89 2.49 2.92 2.51 0.41
Europe 0.04 0.03 0.03 0.04 0.03 0.04 0.03 0.04 0.02 0.02 0.06 -0.03
Asia Oceania 0.00 0.00 0.02 0.01 0.04 0.01 0.00 - - 0.01 0.02 -0.01
Iraqi Basrah Light2
Americas 0.31 0.11 0.08 0.06 0.05 0.04 0.17 0.26 0.21 0.15 - -
Europe 0.85 0.58 0.62 0.56 0.63 0.60 0.68 0.49 0.30 0.49 0.58 -0.09
Asia Oceania 0.37 0.22 0.17 0.15 0.17 0.16 0.19 0.19 0.12 0.21 0.17 0.03
Kuwait Blend
Americas - - - - - - - - - - - -
Europe 0.11 0.04 - - - - - - - - - -
Asia Oceania 0.61 0.55 0.48 0.47 0.45 0.47 0.52 0.50 0.61 0.56 0.51 0.05
Iranian Light
Americas - - - - - - - - - - - -
Europe 0.00 - - - - - - - - - - -
Asia Oceania 0.00 - - - - - - - - - - -
Iranian Heavy3
Americas - - - - - - - - - - - -
Europe 0.04 - - - - - - - - - - -
Asia Oceania 0.14 - - - - - - - - - - -
BFOE
Americas 0.00 - 0.00 - 0.00 0.01 - - - - - -
Europe 0.37 0.42 0.36 0.39 0.28 0.36 0.40 0.46 0.48 0.31 0.40 -0.10
Asia Oceania 0.01 0.03 0.05 0.08 0.07 - 0.05 0.06 - 0.08 0.07 0.00
Kazakhstan
Americas - - 0.01 - 0.03 - - - - - - -
Europe 0.76 0.74 0.70 0.73 0.73 0.68 0.66 0.75 0.88 0.78 0.64 0.14
Asia Oceania 0.18 0.07 0.09 0.07 0.10 0.10 0.10 0.14 0.10 0.15 0.08 0.08
Venezuelan 22 API and heavier
Americas 0.05 - - - - - - - - - - -
Europe 0.09 0.04 - - - - - - - - - -
Asia Oceania - - - - - - - - - - - -
Mexican Maya
Americas 0.51 0.48 0.40 0.36 0.45 0.45 0.32 0.30 0.40 0.32 0.33 -0.01
Europe 0.19 0.16 0.14 0.15 0.15 0.13 0.12 0.13 0.13 0.10 0.18 -0.08
Asia Oceania 0.13 0.12 0.14 0.15 0.12 0.14 0.13 0.10 0.09 0.11 0.18 -0.07
Russian Urals
Americas 0.01 - - - - - - - - - - -
Europe 1.37 1.12 1.05 0.97 0.99 1.08 1.14 0.97 1.23 1.06 0.91 0.15
Asia Oceania - - 0.01 0.01 - 0.03 - - - - 0.03 -
Cabinda and Other Angola
North America 0.01 0.01 - - - - - - - - - -
Europe 0.15 0.12 0.03 0.02 0.04 0.03 0.04 0.03 0.03 0.03 - -
Pacific 0.00 - - - - - - - - - - -
Nigerian Light4
Americas 0.03 - 0.02 - 0.06 0.03 - - - - - -
Europe 0.51 0.49 0.41 0.41 0.30 0.40 0.52 0.48 0.38 0.45 0.38 0.06
Asia Oceania 0.02 0.02 0.01 0.00 0.01 - 0.01 - - - - -
Libya Light and Medium
Americas 0.00 - 0.02 - 0.03 0.06 - - - - - -
Europe 0.67 0.19 0.79 0.75 0.79 0.87 0.76 0.74 0.44 0.80 0.73 0.07
Asia Oceania 0.03 0.01 0.02 0.01 0.02 0.01 0.03 0.03 0.03 0.02 0.02 0.00
1 Data based on monthly submissions from IEA countries to the crude oil import register (in '000 bbl), subject to availability. May differ from Table 8 of the Report. IEA Americas includes United States
and Canada. IEA Europe includes all countries in OECD Europe except Estonia, Hungary, Slovenia and Latvia. IEA Asia Oceania includes Australia, New Zealand, Korea and Japan.
2 Iraqi Total minus Kirkuk.
3 Iranian Total minus Iranian Light.
4 33° API and lighter (e.g., Bonny Light, Escravos, Qua Iboe and Oso Condensate).
Year Earlier
Table 6
IEA MEMBER COUNTRY DESTINATIONS OF SELECTED CRUDE STREAMS1
(million barrels per day)

Oil Market Report Tables
Page | 67 12 May 2022 IEA
. All
rig
hts
res
erve
d.
Table 7: Regional OECD Imports
2019 2020 2021 1Q21 2Q21 3Q21 4Q21 Dec 21 Jan 22 Feb 22 Feb 21 % change
Crude Oil
Americas 2726 1896 2077 1695 2109 2367 2129 2178 2095 2075 1766 17%
Europe 9872 8349 8510 7780 8382 8748 9115 8755 8897 9492 7539 26%
Asia Oceania 6542 5603 5529 5336 5459 5431 5883 5912 6189 6120 5690 8%
Total OECD 19139 15848 16116 14812 15951 16546 17127 16845 17181 17687 14995 18%
LPG
Americas 26 28 21 21 16 22 25 31 30 52 26 99%
Europe 434 422 404 394 421 378 424 530 471 494 345 43%
Asia Oceania 582 559 563 642 555 528 528 584 664 669 747 -11%
Total OECD 1042 1009 988 1057 992 927 976 1144 1165 1215 1119 9%
Naphtha
Americas 5 7 8 7 7 11 8 14 7 3 6 -47%
Europe 347 409 512 526 514 445 563 538 426 397 454 -13%
Asia Oceania 993 1005 1149 1087 1076 1229 1201 1284 1169 1096 1204 -9%
Total OECD 1345 1422 1669 1620 1597 1685 1773 1836 1602 1495 1664 -10%
Gasoline3
Americas 822 577 803 597 1074 973 565 524 401 549 472 16%
Europe 112 109 108 102 159 75 98 185 119 116 214 -46%
Asia Oceania 114 126 157 155 196 135 140 167 168 139 187 -25%
Total OECD 1048 812 1068 854 1429 1183 803 876 687 804 872 -8%
Jet & Kerosene
Americas 174 159 164 108 166 207 175 161 127 122 104 17%
Europe 520 337 335 281 291 349 416 470 276 307 278 11%
Asia Oceania 76 63 75 100 71 43 86 96 73 89 130 -31%
Total OECD 770 559 574 489 528 600 677 727 476 518 512 1%
Gasoil/Diesel
Americas 118 134 197 266 149 154 222 126 124 269 199 35%
Europe 1300 1192 1192 1117 1213 1173 1264 1086 1130 1120 1199 -7%
Asia Oceania 262 328 355 336 353 345 385 359 267 319 308 3%
Total OECD 1680 1655 1744 1718 1715 1672 1870 1571 1521 1707 1707 0%
Heavy Fuel Oil
Americas 116 143 102 116 96 91 104 115 62 206 103 99%
Europe 223 295 376 369 314 435 384 461 276 350 327 7%
Asia Oceania 101 88 119 109 116 121 129 146 135 153 111 38%
Total OECD 440 526 596 594 526 648 617 722 473 709 541 31%
Other Products
Americas 716 591 580 505 698 607 510 486 442 485 455 7%
Europe 865 574 578 515 510 585 699 604 571 811 407 99%
Asia Oceania 268 241 260 246 260 267 267 267 227 266 249 7%
Total OECD 1849 1406 1418 1266 1468 1458 1476 1357 1240 1562 1110 41%
Total Products
Americas 1978 1639 1875 1620 2205 2064 1607 1457 1193 1685 1365 23%
Europe 3800 3339 3505 3304 3422 3440 3849 3874 3270 3595 3224 12%
Asia Oceania 2397 2410 2676 2674 2627 2668 2736 2903 2702 2731 2936 -7%
Total OECD 8175 7388 8056 7598 8255 8172 8192 8233 7164 8010 7525 6%
Total Oil
Americas 4703 3535 3952 3315 4315 4431 3736 3634 3288 3760 3132 20%
Europe 13672 11688 12016 11084 11804 12187 12964 12629 12166 13086 10763 22%
Asia Oceania 8939 8014 8205 8011 8087 8100 8619 8815 8891 8851 8625 3%
Total OECD 27314 23236 24173 22410 24206 24718 25319 25078 24345 25698 22520 14%
1 Based on Monthly Oil Questionnaire data submitted by OECD countries in tonnes and converted to barrels.
2 Excludes intra-regional trade.
3 Includes additives.
Year Earlier
Table 7
REGIONAL OECD IMPORTS1,2
(thousand barrels per day)

Oil Market Report Tables
Page | 68 12 May 2022 IEA
. All
rig
hts
res
erve
d.
Table 7a: Regional OECD Imports From
Non- OECD Countries Year Earlier
2019 2020 2021 1Q21 2Q21 3Q21 4Q21 Dec 21 Jan 22 Feb 22 Feb 21 % change
Crude Oil
Americas 2576 1835 1982 1613 2006 2275 2028 2063 2029 1998 1696 18%
Europe 8913 7115 7259 6643 7109 7455 7815 7446 7608 8117 6426 26%
Asia Oceania 5914 5076 4915 4710 4840 4785 5320 5503 5559 5390 5022 7%
Total OECD 17403 14027 14157 12966 13956 14515 15163 15012 15197 15505 13145 18%
LPG
Americas 23 22 20 19 16 22 25 31 24 52 18 190%
Europe 303 252 242 244 228 245 250 274 228 286 237 21%
Asia Oceania 74 57 46 58 60 35 33 44 74 85 26 223%
Total OECD 400 331 309 321 304 302 308 349 326 423 281 51%
Naphtha
Americas 2 1 4 4 2 5 5 11 5 0 4 -99%
Europe 320 390 425 427 452 337 485 526 331 377 382 -1%
Asia Oceania 898 835 977 870 948 1012 1075 1177 950 990 892 11%
Total OECD 1220 1226 1406 1301 1402 1354 1565 1714 1285 1367 1278 7%
Gasoline3
Americas 308 195 248 174 330 312 174 163 77 99 111 -11%
Europe 108 104 102 98 152 70 89 179 93 106 210 -50%
Asia Oceania 88 109 152 144 189 135 140 167 168 139 180 -23%
Total OECD 504 408 502 417 671 518 404 509 339 344 501 -31%
Jet & Kerosene
Americas 41 55 63 31 63 65 93 115 51 47 12 306%
Europe 464 297 299 248 273 309 367 425 275 300 242 24%
Asia Oceania 76 63 75 100 71 43 86 96 73 89 130 -31%
Total OECD 581 415 437 378 406 418 545 636 399 437 384 14%
Gasoil/Diesel
Americas 86 103 134 203 94 94 146 88 61 172 157 9%
Europe 1126 1062 1110 1045 1136 1070 1188 1006 1078 1026 1122 -9%
Asia Oceania 261 324 355 336 353 345 385 359 267 319 308 3%
Total OECD 1473 1489 1598 1583 1582 1509 1719 1453 1406 1517 1588 -4%
Heavy Fuel Oil
Americas 102 110 86 105 84 78 77 100 62 121 94 28%
Europe 202 279 350 341 280 417 360 452 258 346 310 12%
Asia Oceania 100 88 119 109 116 121 129 146 135 153 111 38%
Total OECD 404 477 554 555 480 615 565 698 456 621 515 21%
Other Products
Americas 543 513 530 469 631 556 463 437 403 449 437 3%
Europe 629 352 401 358 335 398 511 405 405 616 294 109%
Asia Oceania 184 164 182 176 198 178 176 154 172 178 195 -9%
Total OECD 1356 1029 1113 1003 1164 1133 1150 995 981 1243 926 34%
Total Products
Americas 1106 1000 1084 1005 1219 1131 983 944 684 941 833 13%
Europe 3152 2735 2929 2760 2856 2847 3250 3268 2669 3058 2796 9%
Asia Oceania 1681 1640 1906 1793 1934 1871 2023 2143 1839 1953 1843 6%
Total OECD 5939 5375 5920 5558 6009 5849 6256 6354 5191 5952 5473 9%
Total Oil
Americas 3682 2835 3067 2618 3225 3406 3010 3007 2713 2938 2529 16%
Europe 12064 9850 10189 9403 9966 10302 11065 10713 10277 11175 9222 21%
Asia Oceania 7595 6716 6821 6503 6775 6656 7343 7646 7398 7344 6866 7%
Total OECD 23342 19401 20076 18524 19965 20364 21418 21366 20388 21457 18617 15%
1 Based on Monthly Oil Questionnaire data submitted by OECD countries in tonnes and converted to barrels.
2 Excludes intra-regional trade
3 Includes additives
Table 7a
REGIONAL OECD IMPORTS FROM NON-OECD COUNTRIES1,2
(thousand barrels per day)

Oil Market Report Tables
Page | 69 12 May 2022 IEA
. All
rig
hts
res
erve
d.
Table 7b: Inter-Regional OECD Transfers Year Earlier
2019 2020 2021 1Q21 2Q21 3Q21 4Q21 Dec 21 Jan 22 Feb 22 Feb 21 % change
Crude Oil
Americas 149 60 95 83 104 92 101 115 66 78 70 11%
Europe 959 1234 1251 1137 1272 1293 1300 1309 1288 1375 1114 23%
Asia Oceania 628 527 614 627 619 646 563 409 630 730 667 9%
Total OECD 1736 1821 1960 1846 1995 2031 1964 1834 1984 2182 1851 18%
LPG
Americas 3 6 1 3 0 0 0 0 6 0 8 -100%
Europe 131 171 162 150 193 132 173 255 243 208 108 92%
Asia Oceania 508 501 517 584 495 493 495 540 590 584 721 -19%
Total OECD 642 678 679 737 688 625 669 795 839 791 837 -6%
Naphtha
Americas 3 6 4 3 4 6 2 3 2 3 2 100%
Europe 27 20 87 99 62 108 79 11 95 19 73 -73%
Asia Oceania 96 170 172 217 128 216 126 107 219 106 311 -66%
Total OECD 125 196 263 319 195 330 207 122 317 128 386 -67%
Gasoline3
Americas 514 382 555 423 744 661 391 362 323 450 361 25%
Europe 4 5 6 3 7 5 9 5 26 10 4 138%
Asia Oceania 26 18 5 11 8 0 0 0 0 0 7 -100%
Total OECD 544 404 565 437 759 665 399 367 349 460 372 24%
Jet & Kerosene
Americas 133 103 101 77 103 142 83 46 75 75 93 -19%
Europe 56 40 35 33 19 40 49 45 2 7 36 -81%
Asia Oceania 0 0 0 0 0 0 0 0 0 0 0 na
Total OECD 190 144 137 110 122 182 132 91 77 82 128 -36%
Gasoil/Diesel
Americas 32 31 63 63 55 60 76 38 63 97 42 128%
Europe 174 131 82 72 77 103 76 81 52 94 77 22%
Asia Oceania 1 4 0 0 0 0 0 0 0 0 0 na
Total OECD 207 166 145 135 132 163 151 118 115 191 119 60%
Heavy Fuel Oil
Americas 14 33 16 11 12 13 27 15 0 84 9 859%
Europe 21 16 26 29 34 19 25 9 18 4 17 -76%
Asia Oceania 1 0 0 0 0 0 0 0 0 0 0 na
Total OECD 36 49 42 39 46 32 52 24 18 89 26 240%
Other Products
Americas 173 78 50 37 67 51 47 50 39 35 18 99%
Europe 236 222 177 157 175 187 189 200 165 195 113 73%
Asia Oceania 83 77 78 70 62 88 91 113 54 88 53 66%
Total OECD 493 377 305 263 304 326 326 362 259 319 184 73%
Total Products
Americas 872 639 790 615 986 933 625 513 509 744 532 40%
Europe 649 604 576 543 566 593 599 606 601 537 427 26%
Asia Oceania 716 770 771 881 693 797 712 760 863 777 1092 -29%
Total OECD 2236 2013 2137 2040 2246 2323 1936 1879 1973 2059 2052 0%
Total Oil
Americas 1021 699 885 698 1090 1025 726 628 574 822 602 36%
Europe 1608 1838 1827 1681 1839 1886 1899 1915 1889 1912 1541 24%
Asia Oceania 1343 1297 1384 1508 1312 1444 1275 1169 1494 1508 1759 -14%
Total OECD 3972 3835 4096 3886 4241 4354 3901 3712 3958 4241 3903 9%
1 Based on Monthly Oil Questionnaire data submitted by OECD countries in tonnes and converted to barrels.
2 Excludes intra-regional trade
3 Includes additives
Table 7b
INTER-REGIONAL OECD TRANSFERS1,2
(thousand barrels per day)

Oil Market Report Tables
Page | 70 12 May 2022 IEA
. All
rig
hts
res
erve
d.
Table 8: Regional OECD Crude Imports
by Source Year Earlier
2019 2020 2021 1Q21 2Q21 3Q21 4Q21 Dec 21 Jan 22 Feb 22 Feb 21 change
OECD AmericasVenezuela 81 - - - - - - - - - - -
Other Central & South America 868 745 719 648 689 809 731 762 768 826 737 89
North Sea 148 59 92 83 93 92 101 115 66 78 70 7
Other OECD Europe 2 1 3 - 11 - - - - - - -
Non-OECD Europe - - - - - - - - - - - -
Former Soviet Union 192 91 229 128 295 307 185 132 63 110 56 55
Saudi Arabia 621 588 427 331 370 483 520 574 554 517 363 155
Kuwait 45 21 21 7 20 36 20 12 46 13 23 -10
Iran - - 3 12 - - - - 16 - - -
Iraq 331 177 152 115 172 128 192 223 254 235 121 114
Oman - - - - - - - - - - - -
United Arab Emirates 3 5 17 - - 44 22 32 30 - - -
Other Middle East - - - - - - - - - - - -
West Africa2
267 145 228 206 272 255 180 180 143 178 120 59
Other Africa 137 45 161 149 172 167 157 148 156 117 278 -161
Asia 32 17 25 17 16 46 22 - - - - -
Other 0 3 - - - - - - - - - -
Total 2726 1896 2077 1695 2109 2367 2129 2178 2095 2075 1766 309
of which Non-OECD 2576 1835 1982 1613 2006 2275 2028 2063 2029 1998 1696 301
OECD EuropeCanada 60 95 83 108 81 89 55 45 88 100 96 4
Mexico + USA 900 1139 1168 1029 1191 1204 1245 1265 1200 1274 1017 257
Venezuela 106 44 - - - - - - - - - -
Other Central & South America 118 208 219 143 272 263 194 301 239 180 150 30
Non-OECD Europe 14 25 23 23 19 28 23 23 20 26 23 3
Former Soviet Union 4239 3504 3524 3305 3466 3525 3797 3674 4103 4528 3233 1295
Saudi Arabia 792 756 521 517 484 587 494 423 498 459 524 -66
Kuwait 97 48 0 - - 0 0 0 - - - -
Iran 74 6 1 - - 6 - - - - - -
Iraq 1124 814 895 783 916 927 951 650 556 662 837 -175
Oman - - - - - - - - - - - -
United Arab Emirates 2 - - - - - - - - - - -
Other Middle East 3 8 9 6 12 12 6 - - - 6 -
West Africa2
1140 1074 821 780 719 842 942 873 780 694 602 92
Other Africa 1180 596 1185 1071 1204 1228 1233 1007 855 975 1051 -76
Asia - 0 0 - - 0 - - - - - -
Other 13 11 38 - - - 151 431 502 558 - -
Total 9863 8329 8487 7766 8364 8712 9091 8690 8840 9456 7539 1916
of which Non-OECD 8913 7115 7259 6643 7109 7455 7815 7446 7608 8117 6426 1691
OECD Asia OceaniaCanada 5 1 16 17 38 5 3 - - 11 18 -7
Mexico + USA 613 477 500 493 491 554 463 311 614 642 574 68
Venezuela - - - - - - - - - - - -
Other Central & South America 48 91 110 107 145 93 97 126 141 84 137 -53
North Sea 10 49 98 116 90 87 97 98 17 77 75 2
Other OECD Europe - - - - - - - - - - - -
Non-OECD Europe - - - - - - - - - - - -
Former Soviet Union 435 300 335 328 372 265 376 360 423 403 263 140
Saudi Arabia 1878 1867 1766 1868 1574 1601 2020 2392 2156 2025 2066 -41
Kuwait 666 584 506 482 484 493 563 549 633 624 528 97
Iran 137 - - - - - - - - - - -
Iraq 364 224 167 151 165 160 192 189 124 207 175 33
Oman 59 22 32 15 43 49 22 16 16 18 - -
United Arab Emirates 1256 1096 1083 908 1094 1143 1184 1256 1081 1084 906 178
Other Middle East 449 387 362 396 383 371 301 335 471 425 394 31
West Africa2
56 65 80 46 119 77 79 45 60 35 61 -27
Other Africa 90 42 50 59 35 68 39 61 50 22 49 -26
Non-OECD Asia 220 161 170 193 161 174 153 141 128 137 210 -73
Other 255 234 248 155 264 285 288 26 266 323 235 88
Total 6542 5602 5524 5336 5455 5424 5877 5906 6181 6117 5690 427
of which Non-OECD 5914 5076 4915 4710 4840 4785 5320 5503 5559 5390 5022 368
Total OECD Trade 19130 15826 16089 14798 15929 16502 17097 16774 17115 17648 14995 2653
of which Non-OECD 17403 14027 14157 12966 13956 14515 15163 15012 15197 15505 13145 2360
1 Based on Monthly Oil Questionnaire data submitted by OECD countries in tonnes, and converted to barrels at 7.37 barrels per tonne. Data will differ from Table 6
which is based on submissions in barrels.
2 West Africa includes Angola, Nigeria, Gabon, Equatorial Guniea, Congo and Democratic Republic of Congo.
Table 8
REGIONAL OECD CRUDE IMPORTS BY SOURCE1
(thousand barrels per day)

Oil Market Report Tables
Page | 71 12 May 2022 IEA
. All
rig
hts
res
erve
d.
Table 9: Regional OECD Gasoline
Imports by Source Year Earlier
2019 2020 2021 1Q21 2Q21 3Q21 4Q21 Dec 21 Jan 22 Feb 22 Feb 21 change
OECD Americas
Venezuela 4 - - - - - - - - - - -
Other Central & South America 83 40 41 10 67 37 51 52 9 6 5 1
ARA (Belgium Germany Netherlands) 190 149 193 127 312 240 93 113 107 128 84 44
Other Europe 296 213 326 274 380 380 268 223 197 291 253 39
FSU 79 57 82 83 98 92 57 42 12 40 58 -18
Saudi Arabia 7 6 24 4 50 41 - - - - 7 -
Algeria - 4 1 4 - - - - - - - -
Other Middle East & Africa 14 13 13 23 12 15 4 - 5 7 9 -2
Singapore 5 1 4 4 3 8 3 - - - - -
OECD Asia Oceania 28 21 37 21 52 43 30 26 19 30 24 6
Non-OECD Asia (excl. Singapore) 116 72 81 47 99 116 60 68 52 46 32 14
Other 0 - 0 0 - - - - - - - -
Total2 822 577 803 597 1074 973 565 524 401 549 472 77
of which Non-OECD 308 195 248 174 330 312 174 163 77 99 111 -12
OECD Europe
OECD Americas 3 3 5 2 5 3 8 5 23 10 2 8
Venezuela 0 0 2 1 1 5 - - 4 - - -
Other Central & South America 3 4 7 8 2 11 5 - 5 30 - -
Non-OECD Europe 18 16 10 9 16 10 6 9 9 1 12 -12
FSU 54 31 8 13 7 9 2 2 12 7 23 -16
Saudi Arabia 0 8 3 - - 13 0 - - - - -
Algeria 0 1 - - - - - - - - - -
Other Middle East & Africa 8 3 5 8 6 3 2 1 3 9 1 8
Singapore 3 2 0 - - 0 0 0 1 1 - -
OECD Asia Oceania 1 1 1 1 2 1 1 0 3 - 2 -
Non-OECD Asia (excl. Singapore) 0 0 3 3 2 2 3 3 3 3 3 0
Other 21 37 65 57 117 15 70 165 57 55 170 -115
Total2 112 107 108 102 159 75 98 185 119 116 214 -98
of which Non-OECD 108 104 102 98 152 70 89 179 93 106 210 -104
OECD Asia Oceania
OECD Americas 6 4 1 2 0 0 0 0 - 0 7 -6
Venezuela - - - - - - - - - - - -
Other Central & South America - - - - - - - - - - - -
ARA (Belgium Germany Netherlands) 14 4 4 9 7 0 0 0 0 - - -
Other Europe 5 10 - - - - - - - - - -
FSU 0 0 - - - - - - - - - -
Saudi Arabia 1 - - - - - - - - - - -
Algeria - - - - - - - - - - - -
Other Middle East & Africa - 1 - - - - - - - - - -
Singapore 46 51 100 86 98 97 121 148 125 115 120 -5
Non-OECD Asia (excl. Singapore) 21 37 29 39 58 19 0 - 23 3 39 -36
Other 21 19 23 20 33 19 19 19 19 21 21 0
Total2 114 126 157 155 196 135 140 167 168 139 187 -48
of which Non-OECD 88 109 152 144 189 135 140 167 168 139 180 -41
Total OECD Trade2 1048 810 1068 854 1429 1183 803 876 687 804 872 -69
of which Non-OECD 504 408 502 417 671 518 404 509 339 344 501 -157
1 Based on Monthly Oil Questionnaire data submitted by OECD countries in tonnes.
2 Total figure excludes intra-regional trade.
Table 9
REGIONAL OECD GASOLINE IMPORTS BY SOURCE1
(thousand barrels per day)

Oil Market Report Tables
Page | 72 12 May 2022 IEA
. All
rig
hts
res
erve
d.
Table 10: Regional OECD Gasoil/Diesel
Imports by Source 2019 2020 2021 1Q21 2Q21 3Q21 4Q21 Dec 21 Jan 22 Feb 22 Feb 21 change
OECD Americas
Venezuela 1 - - - - - - - - - - -
Other Central and South America 38 34 28 40 30 24 20 9 7 - 50 -
ARA (Belgium Germany Netherlands) 5 11 34 51 31 30 22 - 24 76 12 64
Other Europe 2 4 5 2 9 1 10 0 0 8 - -
FSU 6 12 25 35 21 10 33 11 - 77 21 56
Saudi Arabia 3 8 15 23 9 11 18 12 6 52 3 50
Algeria - - - - - - - - - - - -
Other Middle East and Africa 2 9 25 48 8 18 26 26 - 19 39 -19
Singapore 0 - 2 - 2 8 - - 7 - - -
OECD Asia Oceania 24 16 25 10 15 29 44 38 39 13 31 -17
Non-OECD Asia (excl. Singapore) 30 34 27 48 16 12 31 24 0 - 40 -
Other 7 6 12 8 8 11 18 6 41 23 5 18
Total2 118 134 197 266 149 154 222 126 124 269 199 69
of which Non-OECD 86 103 134 203 94 94 146 88 61 172 157 15
OECD Europe
OECD Americas 138 99 40 34 38 55 33 51 18 52 33 18
Venezuela - - - - - - - - - - - -
Other Central and South America 0 3 1 - 1 1 3 9 - - - -
Non-OECD Europe 41 30 35 39 40 30 32 33 40 22 34 -12
FSU 608 627 611 698 687 546 514 484 550 617 737 -121
Saudi Arabia 205 193 139 137 128 142 150 119 174 39 167 -128
Algeria 0 2 - - - - - - - - - -
Other Middle East and Africa 83 71 157 65 143 198 220 220 208 103 93 10
Singapore 27 17 18 10 18 24 21 27 1 79 12 67
OECD Asia Oceania 36 32 42 38 39 48 43 29 34 42 43 -1
Non-OECD Asia (excl. Singapore) 152 101 126 72 112 122 195 96 60 93 54 39
Other 10 15 22 23 7 6 53 18 44 73 25 48
Total2 1300 1190 1192 1116 1213 1173 1264 1086 1130 1120 1199 -79
of which Non-OECD 1126 1062 1110 1045 1136 1070 1188 1006 1078 1026 1122 -96
OECD Asia Oceania
OECD Americas 1 4 - - - - - - - - - -
Venezuela - - - - - - - - - - - -
Other Central and South America - 0 - - - - - - - - - -
ARA (Belgium Germany Netherlands) - 0 0 - 0 0 0 0 - 0 - -
Other Europe - - - - - - - - - - - -
FSU 4 2 1 1 1 2 1 - - - 2 -
Saudi Arabia - - - - - - - - - - - -
Algeria - - - - - - - - - - - -
Other Middle East and Africa 7 13 4 13 - - 3 1 - - - -
Singapore 111 91 110 82 92 153 115 108 83 150 85 64
Non-OECD Asia (excl. Singapore) 133 208 227 229 249 182 248 205 143 138 216 -78
Other 5 10 9 11 11 9 5 5 5 11 6 6
Total2 262 328 351 336 353 345 371 319 231 299 308 -10
of which Non-OECD 261 324 355 336 353 345 385 359 267 319 308 10
Total OECD Trade2 1680 1653 1740 1718 1715 1671 1857 1531 1485 1688 1707 -19
of which Non-OECD 1473 1489 1598 1583 1582 1509 1719 1453 1406 1517 1588 -71
1 Based on Monthly Oil Questionnaire data submitted by OECD countries in tonnes.
2 Total figure excludes intra-regional trade.
Year Earlier
Table 10
REGIONAL OECD GASOIL/DIESEL IMPORTS BY SOURCE1
(thousand barrels per day)

Oil Market Report Tables
Page | 73 12 May 2022 IEA
. All
rig
hts
res
erve
d.
Table 11: Regional OECD Jet and Kerosene Imports by Source
Table 11: Regional OECD Jet and
Kerosene Imports by Source Year Earlier
2019 2020 2021 1Q21 2Q21 3Q21 4Q21 Dec 21 Jan 22 Feb 22 Feb 21 change
OECD Americas
Venezuela 0 - - - - - - - - - - -
Other Central and South America 7 5 1 3 - - - - - - 2 -
ARA (Belgium Germany Netherlands) - - 5 4 0 14 - - - - - -
Other Europe 0 4 6 6 5 6 7 - - - - -
FSU - 0 4 - 0 0 16 28 2 9 - -
Saudi Arabia 2 6 6 - 4 4 17 20 1 6 - -
Algeria - 1 4 9 0 3 5 8 - - 10 -
Other Middle East and Africa 10 11 18 6 31 14 22 33 11 11 - -
Singapore 3 4 2 - 2 5 - - 2 3 - -
OECD Asia Oceania 133 100 91 67 98 122 76 46 75 75 93 -18
Non-OECD Asia (excl. Singapore) 16 23 27 13 25 34 33 26 21 18 - -
Other 3 4 1 - - 4 - - 14 - - -
Total2 174 159 164 108 166 207 175 161 127 122 104 18
of which Non-OECD 41 55 63 31 63 65 93 115 51 47 12 35
OECD Europe
OECD Americas 20 13 3 1 2 1 9 4 0 2 1 1
Venezuela - - - - - - - - - - - -
Other Central and South America 1 0 0 - - - 1 - - - - -
Non-OECD Europe 2 0 0 - - - 0 - - - - -
FSU 41 21 27 34 24 30 21 28 15 30 37 -8
Saudi Arabia 105 40 27 36 39 11 21 34 46 21 63 -42
Algeria 11 9 5 6 8 6 - - - 11 - -
Other Middle East and Africa 199 155 154 137 136 179 165 177 161 133 102 31
Singapore 29 10 11 3 4 23 15 6 3 - - -
OECD Asia Oceania 36 27 32 32 17 39 40 41 1 5 34 -30
Non-OECD Asia (excl. Singapore) 73 50 62 17 59 59 113 110 27 80 20 60
Other 2 10 11 12 2 1 30 71 23 25 19 6
Total2 520 336 334 278 291 349 416 470 276 307 278 30
of which Non-OECD 464 297 299 248 273 309 367 425 275 300 242 58
OECD Asia Oceania
OECD Americas - - - - - - - - - - - -
Venezuela - - - - - - - - - - - -
Other Central and South America - - - - - - - - - - - -
ARA (Belgium Germany Netherlands) - - - - - - - - - - - -
Other Europe - - - - - - - - - - - -
FSU - - - - - - - - - - - -
Saudi Arabia - - - - - - - - - - - -
Algeria - - - - - - - - - - - -
Other Middle East and Africa - - 1 3 - - - - - - - -
Singapore 21 14 16 6 18 20 19 17 22 33 12 21
Non-OECD Asia (excl. Singapore) 29 28 33 55 37 15 27 22 17 14 72 -58
Other 26 21 24 36 17 8 37 49 32 34 46 -12
Total2 76 63 74 100 71 43 83 88 72 81 130 -49
of which Non-OECD 76 63 75 100 71 43 86 96 73 89 130 -41
Total OECD Trade2 770 558 573 486 528 600 674 719 475 510 512 -2
of which Non-OECD 581 415 437 378 406 418 545 636 399 437 384 53
1 Based on Monthly Oil Questionnaire data submitted by OECD countries in tonnes.
2 Total figure excludes intra-regional trade.
Table 11
REGIONAL OECD JET AND KEROSENE IMPORTS BY SOURCE1
(thousand barrels per day)

Oil Market Report Tables
Page | 74 12 May 2022 IEA
. All
rig
hts
res
erve
d.
Table 12: Regional OECD Residual Fuel
Oil Imports by Source Year Earlier
2019 2020 2021 1Q21 2Q21 3Q21 4Q21 Dec 21 Jan 22 Feb 22 Feb 21 change
OECD Americas
Venezuela 7 - - - - - - - - - - -
Other Central and South America 50 52 34 29 25 39 44 61 13 60 46 14
ARA (Belgium Germany Netherlands) 6 12 6 3 2 9 9 15 - 17 - -
Other Europe 8 21 10 8 10 4 18 - - 67 9 59
FSU 29 43 34 62 36 19 18 12 50 60 49 12
Saudi Arabia 2 2 0 - 0 - 2 - - 0 - -
Algeria 8 2 7 8 4 3 13 27 - - - -
Other Middle East and Africa 5 10 8 6 11 15 0 0 - 1 - -
Singapore 1 1 0 - - 2 - - - - - -
OECD Asia Oceania - - 0 - - 1 - - - - - -
Non-OECD Asia (excl. Singapore) 0 - 2 - 8 0 - - - - - -
Other - - - - - - - - - - - -
Total2 116 143 102 116 96 91 104 115 62 206 103 103
of which Non-OECD 102 110 86 105 84 78 77 100 62 121 94 27
OECD Europe
OECD Americas 7 12 24 28 32 14 20 9 18 4 17 -13
Venezuela - - - - - - - - - - - -
Other Central and South America 5 6 4 5 1 10 1 2 2 - 14 -
Non-OECD Europe 21 13 12 12 12 12 11 15 16 5 12 -6
FSU 144 141 247 241 150 315 279 233 152 290 196 95
Saudi Arabia - 2 - - - - - - - - - -
Algeria 0 2 2 3 - 2 3 - - - - -
Other Middle East and Africa 19 13 14 14 10 18 13 24 13 11 10 1
Singapore 1 3 3 2 7 2 2 0 - - - -
OECD Asia Oceania 14 4 3 0 2 5 5 - - - - -
Non-OECD Asia (excl. Singapore) 3 - - - - - - - - - - -
Other 8 93 62 48 94 54 51 177 76 36 51 -15
Total2 222 288 370 354 308 432 384 461 276 348 300 48
of which Non-OECD 202 279 350 341 280 417 360 452 258 346 310 36
OECD Asia Oceania
OECD Americas 1 - - - - - - - - - - -
Venezuela - - - - - - - - - - - -
Other Central and South America - 0 - - - - - - - - - -
ARA (Belgium Germany Netherlands) - - - - - - - - - - - -
Other Europe - - - - - - - - - - - -
FSU 6 5 0 1 - - - - - - - -
Saudi Arabia 1 1 13 - 14 13 25 28 8 9 - -
Algeria - - - - - - - - - - - -
Other Middle East and Africa 27 38 30 32 27 31 30 43 - - 23 -
Singapore 25 18 29 27 44 22 23 13 63 19 8 11
Non-OECD Asia (excl. Singapore) 40 26 47 49 30 56 51 64 63 126 79 46
Other 1 - - - - - - - - - - -
Total2 101 88 119 109 116 121 129 146 135 153 111 43
of which Non-OECD 100 88 119 109 116 121 129 146 135 153 111 43
Total OECD Trade2 439 519 590 579 520 645 616 722 473 707 514 193
of which Non-OECD 404 477 554 555 480 615 565 698 456 621 515 106
1 Based on Monthly Oil Questionnaire data submitted by OECD countries in tonnes.
2 Total figure excludes intra-regional trade.
Table 12
REGIONAL OECD RESIDUAL FUEL OIL IMPORTS BY SOURCE1
(thousand barrels per day)

Oil Market Report Tables
Page | 75 12 May 2022 IEA
. All
rig
hts
res
erve
d.
Table 13: Average IEA CIF Crude Cost
and Spot Crude and Production Prices 2019 2020 2021 2Q21 3Q21 4Q21 1Q22 Nov 21 Dec 21 Jan 22 Feb 22 Mar 22 Apr 22
CRUDE OIL PRICES
IEA CIF Average Import1
IEA Americas 56.93 37.31 64.78 63.76 67.32 73.13 75.73 68.22 74.95 83.45
IEA Europe 64.25 42.91 69.96 67.23 72.11 78.43 80.33 74.41 84.08 95.12
IEA Asia Oceania 66.38 46.28 70.41 67.63 74.07 80.92 82.51 81.65 81.59 89.56
IEA Total 62.75 42.19 68.55 66.29 71.18 77.54 79.55 74.52 80.90 90.38
FOB Spot
North Sea Dated 64.12 41.76 70.82 68.84 73.42 79.67 102.12 81.37 74.01 87.10 98.01 118.75 104.25
Brent (Asia) Mth 1 64.86 44.86 71.49 69.50 74.09 80.47 101.21 82.58 74.82 86.18 97.89 117.53 106.07
WTI (Cushing) Mth 1 57.03 39.25 68.10 66.19 70.54 77.33 95.18 79.18 71.53 83.13 91.74 108.52 101.77
Urals (Mediterranean) 64.31 41.93 69.47 67.48 71.32 78.39 91.49 80.08 73.07 86.76 94.94 92.59 72.44
Dubai (1st month) 63.49 42.36 69.35 67.01 71.60 78.23 96.06 80.21 73.25 83.34 92.48 110.49 102.91
Tapis (Dated)2 69.16 43.28 72.80 69.81 75.30 83.38 108.06 85.09 78.88 91.73 104.62 125.65 111.36
PRODUCT PRICES
Rotterdam, Barges FOB
Premium Unl 10 ppm 71.35 44.65 80.25 78.57 85.64 90.71 110.45 93.21 82.88 94.85 106.55 127.41 125.68
Naphtha 56.27 39.64 71.14 66.69 74.61 82.00 99.54 82.33 78.27 86.87 96.44 113.24 101.44
Jet/Kerosene 79.24 44.79 76.50 72.52 78.87 90.15 121.79 90.46 85.18 100.65 109.98 150.44 153.17
ULSD 10ppm 79.45 49.32 78.52 74.64 80.81 92.06 125.05 92.83 86.38 101.18 112.77 156.47 151.46
Gasoil 0.1 % 77.73 48.10 77.12 73.43 79.41 90.20 121.77 90.67 84.69 99.18 110.26 151.41 145.48
LSFO 1% 62.21 42.78 70.18 66.88 72.12 78.63 96.33 78.61 74.57 83.98 91.90 110.94 98.73
HSFO 3.5% 50.31 34.43 62.07 60.08 63.95 68.68 85.42 67.40 64.43 75.42 81.00 97.98 91.93
Mediterranean, FOB Cargoes
Premium Unl 10 ppm 71.31 45.59 80.69 77.94 86.49 91.08 111.91 91.68 84.94 96.68 108.01 128.55 126.02
Naphtha 54.43 37.81 69.60 65.19 73.44 80.04 97.03 80.76 75.50 84.89 93.90 110.29 97.78
Jet Aviation Fuel 77.76 43.28 75.26 71.22 77.96 88.66 119.87 89.29 83.07 99.21 108.03 148.12 150.30
ULSD 10ppm 79.05 48.76 78.00 74.07 80.64 91.16 122.64 91.96 85.03 99.81 110.31 153.21 147.98
Gasoil 0.1 % 77.70 47.60 76.89 72.94 79.60 89.87 119.44 90.64 83.90 99.18 109.08 146.07 142.97
LSFO 1% 63.90 44.06 71.27 67.84 73.10 80.24 99.17 80.30 76.33 86.30 93.09 115.65 105.01
HSFO 3.5% 52.17 34.36 60.50 58.23 62.69 67.23 83.38 66.01 62.67 73.78 78.87 95.64 89.21
US Gulf, FOB Pipeline
Super Unleaded 79.24 50.64 91.17 90.78 97.57 99.76 121.45 100.72 92.61 104.58 116.46 140.25 142.72
Unleaded 72.28 46.02 86.46 85.70 91.72 95.12 116.65 95.45 88.83 100.62 112.28 134.21 132.98
Jet/Kerosene 78.81 46.20 77.91 73.74 79.86 92.09 121.50 92.43 87.63 102.12 112.50 145.78 156.86
ULSD 10 ppm 79.09 50.17 84.69 82.05 87.33 97.51 126.65 97.70 91.78 106.71 118.06 151.09 160.12
No. 6 3%2 52.57 34.63 59.90 57.77 62.33 67.41 83.38 66.25 63.04 74.91 80.13 93.44 89.41
Singapore, FOB Cargoes
Premium Unleaded 72.55 46.65 80.49 76.86 83.45 93.71 113.98 95.01 87.92 98.04 110.72 131.07 126.73
Naphtha 57.15 40.77 70.99 66.41 73.93 82.09 97.77 84.21 77.82 84.56 95.75 111.42 97.75
Jet/Kerosene 77.26 44.83 75.26 71.52 77.10 88.47 113.09 89.09 83.47 95.78 106.17 134.32 134.35
Gasoil 0.05% 77.23 48.43 76.12 72.28 77.16 89.64 116.43 90.84 84.94 97.84 109.91 138.51 139.18
HSFO 180 CST 58.62 39.32 64.53 61.28 68.34 71.42 88.05 71.15 65.86 76.17 82.63 103.13 110.91
HSFO 380 CST 4% 57.57 38.25 63.22 60.20 66.13 70.14 85.45 69.87 64.79 74.15 81.08 99.20 104.14
1 IEA CIF Average Import price for February is an estimate.
IEA Americas includes United States and Canada.
IEA Europe includes all countries in OECD Europe except Estonia, Hungary and Slovenia.
IEA Asia Oceania includes Australia, New Zealand, Korea and Japan.
2 Waterborne
Copyright © 2022 Argus Media Ltd - All rights reserved
Table 13
AVERAGE IEA CIF CRUDE COST AND SPOT CRUDE AND PRODUCT PRICES($/bbl)

Oil Market Report Tables
Page | 76 12 May 2022 IEA
. All
rig
hts
res
erve
d.
Table 14: Monthly Average End-User
Prices for Petroleum Products Total Ex-Tax Total Ex-Tax
Price Mar-22 Apr-21 Price Mar-22 Apr-21 Price Mar-22 Apr-21 Price Mar-22 Apr-21
GASOLINE 1 (per litre)
France 1.805 - 9.2 19.1 0.813 -15.8 42.1 1.950 -11.0 7.5 0.878 -17.4 28.3
Germany 2.037 - 5.2 33.9 1.057 -8.2 69.7 2.200 -7.1 20.9 1.142 -10.0 53.2
Italy 1.774 - 12.9 12.7 0.976 -2.7 73.7 1.916 -14.6 1.8 1.054 -4.6 56.8
Spain 1.673 - 6.5 26.7 0.910 -9.5 47.2 1.807 -8.4 14.4 0.983 -11.4 33.0
United Kingdom 1.619 1.1 29.0 0.819 6.6 75.8 2.092 -0.8 20.4 1.059 4.6 64.1
Japan 173.6 - 0.6 15.4 101.2 -0.9 26.3 1.374 -6.7 -0.3 0.801 -7.0 9.1
Canada 1.758 - 2.7 35.2 1.247 -3.3 49.7 1.392 -2.4 33.9 0.988 -3.0 48.2
United States 1.086 - 2.7 43.8 0.955 -3.0 52.3 1.086 -2.7 43.8 0.955 -3.0 52.3
AUTOMOTIVE DIESEL FOR NON COMMERCIAL USE (per litre)
France 1.862 - 8.2 35.6 0.943 -12.8 76.3 2.011 -10.1 22.5 1.019 -14.6 59.2
Germany 2.031 - 6.6 55.2 1.237 -8.8 96.3 2.194 -8.4 40.1 1.336 -10.7 77.3
Italy 1.771 - 11.1 23.3 1.085 0.6 93.8 1.913 -12.9 11.4 1.172 -1.4 75.0
Spain 1.702 - 3.2 44.1 1.028 -4.3 72.2 1.838 -5.1 30.1 1.110 -6.2 55.5
United Kingdom 1.762 3.3 36.0 0.938 9.8 87.6 2.277 1.4 26.9 1.212 7.8 75.1
Japan 153.3 - 0.6 17.4 107.4 -0.8 23.9 1.213 -6.8 1.4 0.850 -6.9 7.0
Canada 1.964 - 0.3 58.9 1.482 -0.3 80.7 1.555 -0.1 57.3 1.174 -0.1 78.9
United States 1.353 0.3 63.6 1.202 0.3 77.3 1.353 0.3 63.6 1.202 0.3 77.3
DOMESTIC HEATING OIL (per litre)
France 1.502 - 7.2 78.0 1.095 -8.2 100.3 1.622 -9.1 60.8 1.183 -10.0 80.9
Germany 1.376 - 13.9 100.5 1.095 -14.5 112.5 1.486 -15.6 81.0 1.183 -16.2 91.8
Italy 1.763 - 1.6 42.4 1.042 -2.3 70.4 1.904 -3.6 28.6 1.125 -4.2 53.9
Spain 1.335 0.8 99.2 1.006 0.8 120.2 1.442 -1.2 79.9 1.087 -1.2 98.8
United Kingdom 1.060 - 8.1 97.7 0.898 -9.0 124.9 1.370 -9.9 84.6 1.161 -10.8 110.0
Japan 2
114.3 - 0.3 27.8 101.1 -0.3 28.8 0.905 -6.5 10.4 0.801 -6.5 11.2
Canada 1.940 4.7 69.5 1.730 4.7 74.0 1.536 5.0 67.8 1.370 5.0 72.3
United States - - - - - - - - - - - -
LOW SULPHUR FUEL OIL FOR INDUSTRY 3 (per kg)
France 0.830 - 5.4 47.2 0.690 -6.5 62.7 0.896 -7.3 32.9 0.745 -8.4 46.9
Germany - - - - - - - - - - - -
Italy 0.785 - 5.0 56.4 0.753 -5.2 60.1 0.848 -6.9 41.2 0.814 -7.1 44.6
Spain 0.664 4.5 57.0 0.647 4.6 59.4 0.718 2.4 41.7 0.699 2.5 43.9
United Kingdom - - - - - - - - - - - -
Japan - - - - - - - - - - - -
Canada - - - - - - - - - - - -
United States - - - - - - - - - - - -
1 Unleaded premium (95 RON) for France, Germany, Italy, Spain, UK; regular unleaded for Canada, Japan and the United States.
2 Kerosene for Japan.
3 VAT excluded from prices for low sulphur fuel oil when refunded to industry.
* Prices for France, Germany, Italy and Spain are in Euros; UK in British Pounds, Japan in Yen, Canada in Canadian Dollars.
% change from% change from
Table 14
MONTHLY AVERAGE END-USER PRICES FOR PETROLEUM PRODUCTS
April 2022
NATIONAL CURRENCY * US DOLLARS
% change from % change from

Oil Market Report Tables
Page | 77 12 May 2022 IEA
. All
rig
hts
res
erve
d.
Table 15: IEA/KBC Global Indicator
Refining Margins Change
Jan 22 Feb 22 Mar 22 Apr 22 Apr-Mar 08 Apr 15 Apr 22 Apr 29 Apr 06 May
NW Europe
Brent (Cracking) 4.29 3.28 11.84 22.33 10.50 18.48 19.51 23.39 28.27 25.96
Urals (Cracking) 4.14 7.04 38.78 55.01 16.23 51.63 52.69 56.13 60.54 58.02
Brent (Hydroskimming) 1.29 -0.37 6.26 14.30 8.05 11.48 12.01 15.06 18.81 15.65
Urals (Hydroskimming) -0.84 0.76 29.76 45.32 15.56 43.24 43.40 45.76 49.55 47.06
Mediterranean
Es Sider (Cracking) 5.66 4.21 15.62 24.45 8.83 20.02 21.18 25.83 30.81 27.46
Urals (Cracking) 4.21 5.16 38.66 55.11 16.44 50.80 52.29 56.52 61.59 58.13
Es Sider (Hydroskimming) 2.95 0.79 9.46 16.61 7.15 13.77 13.84 17.38 21.25 17.84
Urals (Hydroskimming) -2.05 -2.40 26.15 41.65 15.50 39.35 39.22 42.12 46.20 43.35
US Gulf Coast
Mars (Cracking) 7.84 8.11 11.76 16.98 5.22 15.95 14.67 15.39 20.87 24.77
50/50 HLS/LLS (Coking) 15.17 17.29 27.01 36.25 9.24 32.11 32.47 36.40 43.74 48.46
50/50 Maya/Mars (Coking) 11.43 12.33 18.13 25.71 7.58 22.23 21.93 25.32 32.83 36.79
ASCI (Coking) 13.01 14.73 22.13 30.24 8.11 27.56 26.71 29.25 36.62 41.08
US Midwest
30/70 WCS/Bakken (Cracking) 8.21 9.14 16.10 24.20 8.10 19.53 20.92 25.20 31.15 33.90
Bakken (Cracking) 9.29 11.05 20.22 30.39 10.17 24.71 26.84 31.73 38.42 41.79
WTI (Coking) 10.74 11.89 22.74 34.23 11.49 28.74 30.90 35.19 42.23 46.32
30/70 WCS/Bakken (Coking) 10.49 12.22 21.75 31.79 10.04 26.02 28.08 33.13 40.05 43.62
Singapore
Dubai (Hydroskimming) -1.31 -1.47 2.11 11.86 9.74 10.81 11.67 11.54 13.58 16.20
Tapis (Hydroskimming) 1.02 -0.76 2.82 15.45 12.62 13.55 14.00 18.15 17.94 18.01
Dubai (Hydrocracking) 8.56 10.35 16.87 23.58 6.72 21.41 23.46 24.37 25.92 31.03
Tapis (Hydrocracking) 0.95 -1.02 3.12 17.80 14.68 15.21 15.72 20.92 21.37 22.01
1 Global Indicator Refining Margins are calculated for various complexity configurations, each optimised for processing the specific crude(s) in a specific refining centre. Margins include energy cost, but exclude other variable costs,
depreciation and amortisation. Consequently, reported margins should be taken as an indication, or proxy, of changes in profitability for a given refining centre. No attempt is made to model or otherwise comment upon the relative
economics of specific refineries running individual crude slates and producing custom product sales, nor are these calculations intended to infer the marginal values of crude for pricing purposes.
Source: IEA, KBC Advanced Technologies (KBC)
Table 15
IEA/KBC Global Indicator Refining Margins1
($/bbl)
Monthly Average Average for week ending:

Oil Market Report Tables
Page | 78 12 May 2022 IEA
. All
rig
hts
res
erve
d.
Table 16: Refined Product Yields Based
On Total Input (%) Dec-21 Jan-22 Feb-22 Feb-21
Feb 22 vs
Previous
Month
Feb 22 vs
Previous
Year
Feb 22 vs
5 Year
Average
5 Year
Average
OECD Americas
Naphtha 1.1 1.1 1.1 1.1 0.0 -0.1 -0.3 1.4
Motor gasoline 48.0 46.8 45.7 46.1 -1.1 -0.5 -0.6 46.3
Jet/kerosene 8.1 8.5 8.3 6.6 -0.2 1.7 -0.4 8.7
Gasoil/diesel oil 28.0 27.9 28.3 28.0 0.4 0.3 0.4 27.9
Residual fuel oil 2.6 3.2 2.9 3.5 -0.3 -0.6 -0.4 3.3
Petroleum coke 4.3 4.2 4.2 4.2 0.1 0.1 -0.3 4.5
Other products 11.2 11.6 11.7 12.3 0.1 -0.6 0.5 11.3
OECD Europe
Naphtha 8.5 8.5 8.9 10.1 0.5 -1.2 0.1 8.8
Motor gasoline 21.2 21.3 21.4 19.4 0.1 2.0 1.2 20.2
Jet/kerosene 6.5 7.4 7.7 5.3 0.3 2.4 -0.1 7.8
Gasoil/diesel oil 41.4 39.9 39.4 41.0 -0.5 -1.7 -0.6 40.0
Residual fuel oil 8.8 9.3 8.6 9.1 -0.7 -0.6 -1.5 10.1
Petroleum coke 1.6 1.7 1.7 1.6 0.1 0.1 0.3 1.4
Other products 15.0 14.5 15.2 16.1 0.7 -0.9 1.0 14.1
OECD Asia Oceania
Naphtha 15.9 15.8 15.7 16.4 -0.1 -0.7 -0.1 15.8
Motor gasoline 22.9 21.4 21.4 22.2 0.0 -0.8 0.1 21.3
Jet/kerosene 13.5 14.3 13.9 13.5 -0.4 0.4 -1.8 15.8
Gasoil/diesel oil 30.1 29.6 30.1 30.2 0.4 -0.1 0.9 29.2
Residual fuel oil 8.3 8.4 9.0 7.5 0.5 1.5 1.5 7.5
Petroleum coke 0.5 0.4 0.5 0.4 0.0 0.1 0.1 0.4
Other products 12.2 12.2 12.3 12.6 0.0 -0.4 0.1 12.2
OECD Total
Naphtha 6.0 6.1 6.2 7.0 0.1 -0.8 -0.4 6.6
Motor gasoline 35.1 34.1 33.6 32.8 -0.6 0.8 0.5 33.0
Jet/kerosene 8.6 9.2 9.2 7.5 -0.1 1.6 -0.6 9.8
Gasoil/diesel oil 32.6 32.0 32.1 32.7 0.1 -0.5 0.1 32.1
Residual fuel oil 5.5 6.1 5.8 6.1 -0.3 -0.3 -0.5 6.3
Petroleum coke 2.7 2.7 2.8 2.6 0.1 0.2 0.0 2.7
Other products 12.6 12.6 12.9 13.6 0.3 -0.7 0.6 12.4
1 Due to processing gains and losses, yields in % will not always add up to 100%
Table 16
REFINED PRODUCT YIELDS BASED ON TOTAL INPUT (%)1

Oil Market Report Tables
Page | 79 12 May 2022 IEA
. All
rig
hts
res
erve
d.
Table 17: World Biofuels Production 2019 2020 2021 3Q21 4Q21 1Q22 Feb 22 Mar 22 Apr 22
ETHANOL
OECD Americas1
1063 934 1010 993 1092 1045 1046 1016 1016
United States 1029 906 979 963 1061 1010 1011 980 980
Other 34 28 30 30 30 35 35 35 35
OECD Europe2
97 93 103 118 117 113 122 103 103
France 21 17 18 25 22 24 29 19 19
Germany 12 11 12 15 15 19 23 12 12
Spain 9 8 10 10 10 7 5 11 11
United Kingdom 5 5 9 9 16 14 22 7 7
Other 50 52 54 59 54 49
OECD Asia Oceania3
4 4 4 3 4 4 4 4 4
Australia 4 4 4 3 4 4 4 4 4
Other 0 0 0 0 0 0 0 0 0
Total OECD Ethanol 1165 1031 1117 1114 1213 1163 1172 1123 1123
Total Non-OECD Ethanol 809 735 703 1130 515 312 303 305 606
Brazil 621 560 515 942 327 100 91 93 394
China 67 69 76 76 76 79
Argentina 19 15 18 18 18 21
Other 102 91 94 94 94 112 212 212 212
TOTAL ETHANOL 1974 1766 1820 2244 1728 1475 1475 1428 1729
BIODIESEL
OECD Americas1
151 159 168 163 197 186 230 239 239
United States 145 153 160 156 190 182 229 229 229
Other 7 6 7 7 7 4 1 10 10
OECD Europe2
295 281 313 328 314 295 291 335 335
France 43 41 43 48 43 49 57 47 47
Germany 69 61 66 74 66 58 58 68 68
Italy 18 28 30 31 31 24 19 35 35
Spain 42 30 39 40 38 33 30 42 42
Other 123 121 136 136 136 131 127 144 144
OECD Asia Oceania3
15 12 12 15 8 11 11 12 12
Australia 0 0 0 0 0 0 0 0 0
Other 15 12 12 15 8 11 11 12 12
Total OECD Biodiesel 461 452 493 506 520 492 532 587 587
Total Non-OECD Biodiesel 405 411 439 439 439 464 464 464 464
Brazil 102 111 116 117 114 101 110 101 105
Argentina* 42 27 36 36 36 42
Other 261 274 287 287 289 321
TOTAL BIODIESEL 866 863 932 945 959 955 996 1050 1050
GLOBAL BIOFUELS 2839 2630 2752 3190 2687 2430 2471 2478 2779
* monthly data not available.
Table 17
WORLD BIOFUELS PRODUCTION(thousand barrels per day)

Source: IEA 2022. All Rights Reserved
Without prejudice to the terms and conditions on the IEA website at
www.iea.org/t&c/termsandconditions/ (the Terms), which also apply to this Oil Market Report
(OMR) and its related publications, the Executive Director and the Secretariat of the IEA are
responsible for the publication of the OMR. Although some of the data are supplied by IEA
Member-country governments, largely on the basis of information they in turn receive from oil
companies, neither these governments nor these oil companies necessarily share the
Secretariat’s views or conclusions as expressed in the OMR. The OMR is prepared for general
circulation and is distributed for general information only. Neither the information nor any
opinion expressed in the OMR constitutes an offer, or an invitation to make an offer, to buy or
sell any securities or any options, futures or other derivatives related to such securities.
As set out in the Terms, the IEA owns the copyright in this OMR. However, in relation to the
edition of OMR made available to Subscribers (as defined in the Terms), all Argus information is
sourced as Copyright © 2022 Argus Media Limited and is published here with the permission of
Argus. The spot crude and product price assessments are based on daily Argus prices, converted
when appropriate to USD per barrel according to the Argus specification of products. Argus
Media Limited reserves all rights in relation to all Argus information. Any reproduction of Argus
information requires the express prior written permission of Argus. Argus shall not be liable to
any party for any inaccuracy, error or omission contained or provided in Argus information
contained in this OMR or for any loss, or damage, whether or not due to reliance placed by that
party on information in this OMR.

Oil Market Report Stocks
Page | 81 12 May 2022 IEA
. All
rig
hts
res
erve
d.
Oil Market Team
Editor
Toril Bosoni +33 (0)1 40 57 67 18
Data Manager
Luis Fernando Rosa +33 (0)1 40 57 65 56
Demand Ciarán Healy +33 (0)1 40 57 67 58
Data Scientist
Tsuyoshi Deguchi +33 (0)1 40 57 65 78
OPEC Supply
Peg Mackey +33 (0)1 40 57 65 81
Data Officer Olaoye Oloyede +33 (0)1 40 57 65 03
Non-OPEC Supply
Jacob Messing +33 (0)1 40 57 66 98
Refining Kristine Petrosyan +33 (0)1 40 57 66 05
OIM Assistant
Deven Mooneesawmy +33 (0)1 40 57 65 03
Stocks Yuya Akizuki +33 (0)1 40 57 67 30
Data Enquiries to Oil Market Report: [email protected]
Prices Joel R. Couse +33 (0)1 40 57 67 22
Subscription & Delivery Enquiries +33 (0)1 40 57 66 90
Analyst Jenny Thomson +33 (0)1 40 57 67 11
Media Enquiries/IEA Press Office +33 (0)1 40 57 66 94
Next Issue: 15 June 2022
For information on the data sources, definitions, technical terms and general approach used in preparing the Oil Market Report (OMR), Market Report Series_Oil and Annual Statistical Supplement (current issue of the Statistical Supplement dated 12 August 2021), readers are referred to the Users’ Guide at https://www.iea.org/articles/oil-market-report-glossary. It should be noted that the spot crude and product price assessments are based on daily Argus prices, converted when appropriate to US$ per barrel according to the Argus specification of products (Copyright © 2022 Argus Media Limited - all rights reserved)