Higher level phylogenetic relationships within the bamboos (Poaceae: Bambusoideae) based on five...
26
Higher level phylogenetic relationships within the bamboos (Poaceae: Bambusoideae) based on five plastid markers Scot A. Kelchner ⇑ , Bamboo Phylogeny Group 1 Department of Biological Sciences, Campus Stop 8007, Idaho State University, Pocatello, ID 83209-8007, USA article info Article history: Received 2 July 2012 Revised 14 November 2012 Accepted 6 February 2013 Available online 20 February 2013 Keywords: Bamboo Plastid phylogeny Exploratory data analysis Noncoding DNA ndhF Microstructural characters abstract Bamboos are large perennial grasses of temperate and tropical forests worldwide. Two general growth forms exist: the economically and ecologically important woody bamboos (tribes Arundinarieae and Bambuseae), and the understory herbaceous bamboos (tribe Olyreae). Evolutionary relationships among the 1400 + described species have been difficult to resolve with confidence. Comparative analysis of bam- boo plastid (chloroplast) DNA has revealed three to five major lineages that show distinct biogeographic distributions. Taxon sampling across tribes and subtribes has been incomplete and most published data sets include a relatively small number of nucleotide characters. Branching order among lineages is often poorly supported, and in more than one study herbaceous bamboos form a clade within the woody bam- boos. In this paper, the Bamboo Phylogeny Group presents the most complete phylogeny estimation to date of bamboo tribes and subtribes using 6.7 kb of coding and noncoding sequence data and 37 micro- structural characters from the chloroplast genome. Quality of data is assessed, as is the possibility of long branch attraction, the degree of character conflict at key nodes in the tree, and the legitimacy of three alternative hypotheses of relationship. Four major plastid lineages are recognized: temperate woody, paleotropical woody, neotropical woody, and herbaceous bamboos. Woody bamboos are resolved as paraphyletic with respect to Olyreae but SH tests cannot reject monophyly of woody species (Arundinarieae + Bambuseae). Published by Elsevier Inc. 1. Introduction Bamboos are remarkably robust forest grasses that number more than 1400 described species in 115 genera (Bamboo Phylog- eny Group [BPG], 2012). Most familiar and useful are those with ‘‘woody’’ (lignified) stems that belong to the tribes Arundinarieae (temperate woody bamboos) and Bambuseae (tropical woody bamboos). The roughly 1300 woody species often play critical roles in the ecology of their forest habitats and have long been of eco- nomic importance to humans (see McClure, 1966; Judziewicz et al., 1999). Less popularly known are the herbaceous bamboos (tribe Olyreae), a lineage of about 120 non-woody understory spe- cies found in tropical forests, predominantly in the New World. To- gether the three tribes constitute the grass subfamily Bambusoideae, members of which share the unique character of asymmetrically invaginated arm cells in the chlorenchyma (Zhang and Clark, 2000). Most species also possess fusoid cells in the mesophyll, papillae on at least the abaxial leaf epidermis, and a broad leaf blade with a basal constriction called a pseudopetiole (GPWG, 2001; Judziewicz and Clark, 2007; BPG, 2012). Members of Bambusoideae are found from sea level to over 4000 m in mainly forest and high montane grassland habitats worldwide, except for Europe and Antarctica (Fig. 1). At least 40% of species (including many awaiting formal description) are ende- mic to the Americas. In both the Americas and Asia, several taxa can reach gigantic proportions: plant height can be to 40 m and clonal individuals can occupy many hectares (Judziewicz et al., 1999). Famously, woody bamboos can take between 7 and 120 years to flower, often in gregarious events that lead to mass seed production and an accompanying dieback of parent plants. Because of this rarity of flowering, woody bamboos are usually encountered in their vegetative stage and identification of species can be difficult for a non-specialist. Bambusoideae is one of three subfamilies in the BEP clade of grass family Poaceae (GPWG, 2001; GPWG II, 2012). Although each is monophyletic in molecular analyses, branching order of the BEP subfamilies has been difficult to resolve. Several recent analyses (e.g., Bouchenak-Khelladi et al., 2008; Davis and Soreng, 2010; GPWG II, 2012; Wu and Ge, 2012) support a sister relationship be- tween Bambusoideae (B) and Pooideae (P; the bluegrasses), with 1055-7903/$ - see front matter Published by Elsevier Inc. http://dx.doi.org/10.1016/j.ympev.2013.02.005 ⇑ Fax: +1 208 282 4570. E-mail address: [email protected] 1 Bamboo Phylogeny Group members: Lynn Clark, Gilberto Cortés, Reyjane P. Oliveira, Soejatmi Dransfield, Tarciso Filgueiras, Amanda E. Fisher, Gerald F. Guala, Trevor Hodkinson, Emmet Judziewicz, M. Kumar, De-Zhu Li, Ximena Londoño, M. Teresa Mejia, Ana Paula Santos-Gonçalves, Chris Stapleton, Sarawood Sungkaew, Jimmy Triplett, Elizabeth Widjaja, Khoon Meng Wong, Nian-He Xia. Molecular Phylogenetics and Evolution 67 (2013) 404–413 Contents lists available at SciVerse ScienceDirect Molecular Phylogenetics and Evolution journal homepage: www.elsevier.com/locate/ympev
-
Upload
independent -
Category
Documents
-
view
3 -
download
0
Transcript of Higher level phylogenetic relationships within the bamboos (Poaceae: Bambusoideae) based on five...

Molecular Phylogenetics and Evolution 67 (2013) 404–413
Contents lists available at SciVerse ScienceDirect
Molecular Phylogenetics and Evolution
journal homepage: www.elsevier .com/locate /ympev
Higher level phylogenetic relationships within the bamboos (Poaceae:Bambusoideae) based on five plastid markers
Scot A. Kelchner ⇑, Bamboo Phylogeny Group 1
Department of Biological Sciences, Campus Stop 8007, Idaho State University, Pocatello, ID 83209-8007, USA
a r t i c l e i n f o
Article history:Received 2 July 2012Revised 14 November 2012Accepted 6 February 2013Available online 20 February 2013
Keywords:BambooPlastid phylogenyExploratory data analysisNoncoding DNAndhFMicrostructural characters
1055-7903/$ - see front matter Published by Elsevierhttp://dx.doi.org/10.1016/j.ympev.2013.02.005
⇑ Fax: +1 208 282 4570.E-mail address: [email protected]
1 Bamboo Phylogeny Group members: Lynn ClarkOliveira, Soejatmi Dransfield, Tarciso Filgueiras, AmanTrevor Hodkinson, Emmet Judziewicz, M. Kumar, DeTeresa Mejia, Ana Paula Santos-Gonçalves, Chris StaJimmy Triplett, Elizabeth Widjaja, Khoon Meng Wong,
a b s t r a c t
Bamboos are large perennial grasses of temperate and tropical forests worldwide. Two general growthforms exist: the economically and ecologically important woody bamboos (tribes Arundinarieae andBambuseae), and the understory herbaceous bamboos (tribe Olyreae). Evolutionary relationships amongthe 1400 + described species have been difficult to resolve with confidence. Comparative analysis of bam-boo plastid (chloroplast) DNA has revealed three to five major lineages that show distinct biogeographicdistributions. Taxon sampling across tribes and subtribes has been incomplete and most published datasets include a relatively small number of nucleotide characters. Branching order among lineages is oftenpoorly supported, and in more than one study herbaceous bamboos form a clade within the woody bam-boos. In this paper, the Bamboo Phylogeny Group presents the most complete phylogeny estimation todate of bamboo tribes and subtribes using 6.7 kb of coding and noncoding sequence data and 37 micro-structural characters from the chloroplast genome. Quality of data is assessed, as is the possibility of longbranch attraction, the degree of character conflict at key nodes in the tree, and the legitimacy of threealternative hypotheses of relationship. Four major plastid lineages are recognized: temperate woody,paleotropical woody, neotropical woody, and herbaceous bamboos. Woody bamboos are resolved asparaphyletic with respect to Olyreae but SH tests cannot reject monophyly of woody species(Arundinarieae + Bambuseae).
Published by Elsevier Inc.
1. Introduction
Bamboos are remarkably robust forest grasses that numbermore than 1400 described species in 115 genera (Bamboo Phylog-eny Group [BPG], 2012). Most familiar and useful are those with‘‘woody’’ (lignified) stems that belong to the tribes Arundinarieae(temperate woody bamboos) and Bambuseae (tropical woodybamboos). The roughly 1300 woody species often play critical rolesin the ecology of their forest habitats and have long been of eco-nomic importance to humans (see McClure, 1966; Judziewiczet al., 1999). Less popularly known are the herbaceous bamboos(tribe Olyreae), a lineage of about 120 non-woody understory spe-cies found in tropical forests, predominantly in the New World. To-gether the three tribes constitute the grass subfamilyBambusoideae, members of which share the unique character ofasymmetrically invaginated arm cells in the chlorenchyma (Zhang
Inc.
, Gilberto Cortés, Reyjane P.da E. Fisher, Gerald F. Guala,
-Zhu Li, Ximena Londoño, M.pleton, Sarawood Sungkaew,Nian-He Xia.
and Clark, 2000). Most species also possess fusoid cells in themesophyll, papillae on at least the abaxial leaf epidermis, and abroad leaf blade with a basal constriction called a pseudopetiole(GPWG, 2001; Judziewicz and Clark, 2007; BPG, 2012).
Members of Bambusoideae are found from sea level to over4000 m in mainly forest and high montane grassland habitatsworldwide, except for Europe and Antarctica (Fig. 1). At least 40%of species (including many awaiting formal description) are ende-mic to the Americas. In both the Americas and Asia, several taxacan reach gigantic proportions: plant height can be to 40 m andclonal individuals can occupy many hectares (Judziewicz et al.,1999). Famously, woody bamboos can take between 7 and120 years to flower, often in gregarious events that lead to massseed production and an accompanying dieback of parent plants.Because of this rarity of flowering, woody bamboos are usuallyencountered in their vegetative stage and identification of speciescan be difficult for a non-specialist.
Bambusoideae is one of three subfamilies in the BEP clade ofgrass family Poaceae (GPWG, 2001; GPWG II, 2012). Although eachis monophyletic in molecular analyses, branching order of the BEPsubfamilies has been difficult to resolve. Several recent analyses(e.g., Bouchenak-Khelladi et al., 2008; Davis and Soreng, 2010;GPWG II, 2012; Wu and Ge, 2012) support a sister relationship be-tween Bambusoideae (B) and Pooideae (P; the bluegrasses), with

Fig. 1. World distribution of bamboos (Poaceae: Bambusoideae).
S.A. Kelchner, Bamboo Phylogeny Group / Molecular Phylogenetics and Evolution 67 (2013) 404–413 405
the B + P clade being sister to Ehrhartoideae (E; the rices). Branch-ing order of the three clades varies across studies, possibly as afunction of outgroup sampling.
Within Bambusoideae, three to five major lineages are recov-ered by comparative DNA sequence analyses (Clark et al., 1995,2007; Kelchner and Clark, 1997; Zhang and Clark, 2000; Bouche-nak-Khelladi et al., 2008; Sungkaew et al., 2009) despite the oftenmarked dissimilarity of taxa and genetic loci sampled. Temperatewoody bamboos form the most robust of these lineages, appearingas an uninterrupted branch in molecular phylogenies that suggestsa long evolutionary history followed by recent and rapid radiation(Hodkinson et al., 2010). Herbaceous bamboos are also clearlymonophyletic and at many loci show rates of sequence evolutionmuch higher than those of other bamboos and more similar tograsses in general (Gaut et al., 1997). The tropical woody bamboosform between one and three main lineages; they are most com-monly resolved as two (paleotropical woody; neotropical woody)or three (paleotropical woody; Arthrostylidiinae + Guaduinae;Chusqueinae). Rate of sequence evolution in subtribe Chusqueinaealso appears to be accelerated, though to a lesser degree than theherbaceous lineage.
Since the first comparative DNA sequence analysis of bamboos byKelchner and Clark (1997), more than 20 molecular phylogeneticanalyses have been published on taxonomic subsets of Bambusoi-deae (reviewed by BPG (2012)). In that time, several phenomenathat complicate phylogeny estimation have been observed in mostbamboo nuclear and plastid (chloroplast) DNA data sets. These in-clude strong heterogeneity of sequence evolution rates among lin-eages, poor support for internodes that separate major clades, longbranch attraction that can affect both ingroup and outgroup topol-ogy, lack of strict congruence among trees from different studies(or data sets from different genomic compartments), and problemswith attaining supported resolution in certain lineages such as thetemperate woody and paleotropical woody clades.
Molecular phylogeny estimation in bamboos is thus widely con-sidered to be a difficult problem. Maximum parsimony has beenthe most common optimization criterion used for tree selectionin bamboo molecular systematics, yet it is well known that parsi-mony can mislead phylogeny estimation when the above phenom-ena are a feature of the data set and its analysis. Recent studieshave used Bayesian inference together with parsimony (e.g., Yanget al., 2007; Peng et al., 2008; Sungkaew et al., 2009; Triplett and
Clark, 2010), which at least provides an opportunity to test robust-ness of a phylogeny estimation to certain changes in the model ofcharacter evolution employed. Frequently the two analyticalframeworks do not produce the same topology (e.g., Yang et al.,2007; Peng et al., 2008), suggesting that the problematic issueslisted here for bamboo molecular studies can indeed affect the esti-mate of bamboo phylogeny.
In response to the challenge of generating a well sampled, datarich, and carefully tested molecular phylogeny of Bambusoideae,the Bamboo Phylogeny Group was formed to better coordinate ef-forts among many of the world’s bamboo systematists (BPG, 2006).Molecular studies had already suggested that a taxonomic reorga-nization of bamboos was inevitable; BPG members sought to alignthat reclassification to a strongly supported estimate of phylogeny.The endeavor was to begin with a phylogeny estimation of chloro-plast genomes (plastomes) in bamboos because the task could bereadily addressed with existing collections of silica-gel-dried leaftissue from which sequence data of chloroplast loci are easily ob-tained. Taxon sampling was designed to include all subtribes ofbamboos, and DNA sequences would be taken from five plastomeloci. Phylogenetic analyses were to employ several available teststhat determine data quality, tree stability, and whether bias and er-ror were negatively affecting the phylogeny estimation.
In this paper, the Bamboo Phylogeny Group presents its first rig-orously tested plastome phylogeny estimation. The estimate repre-sents the breadth of taxonomic, geographic, and morphologicaldiversity in the subfamily Bambusoideae. Aims of this study in-clude (i) improvement of resolution and support for commonlyrecognized lineages, (ii) identification of previously unknown rela-tionships, (iii) establishment of branching order among majorclades, (iv) stabilization of the plastid phylogeny estimation, and(v) identification of remaining areas of concern in the topology thatmight hinder further progress in deciphering the biogeography,history, and evolution of bamboos.
2. Material and methods
2.1. Taxon sampling
A total of 40 species, including 33 ingroup (Bambusoideae) andseven outgroup (Ehrhartoideae, Pharoideae, Pooideae) taxa, was

Table 1Taxon samples used in this study, with classification and voucher information provided.Subtribe nomenclature, when previously contradictory, follows that of BPG (2012).
Ingroup taxa
Tribe ArundinarieaeAmpelocalamus scandens J.R. Xue and W.D.
Li(LC 1291)
Arundinaria gigantea (Walter) Muhl. (JT 197)Chimonobambusa marmorea (Mitford)
Makino(JT 69)
Chimonocalamus pallens J.R. Xue and T.P. Yi (JT238)Phyllostachys bambusoides Siebold and
Zucc.(LC 1289, JT 121)
Pleioblastus argenteo-striatus (Regel) Nakai (JT 66)Sasa veitchii (Carriere) Rehder (JT 126, LC 1325)Shibataea kumasaca (Zoll. ex Steud.)
Makino(LC 1290)
Thamnocalamus spathiflorus (Trin.) Munro (LC 1319)
Tribe BambuseaeSubtribe Arthrostylidiinae
Atractantha radiata McClure (ASG 599, AMC 4362)Glaziophyton mirabile Franch. (LSS 1066)Rhipidocladum pittieri (Hack.) McClure (LC 1349, LC and WZ 1349)
Subtribe BambusinaeBambusa vulgaris Schrad. ex. J.C. Wendl. (GSK 666)Cyrtochloa luzonica (Gamble) S. Dransf. (SD 1323)Neololeba atra (Lindl.) Widjaja (LC and JT 1663)Oxytenanthera abyssinica (A. Rich.) Munro (LC and JT1664)Temochloa liliana S. Dransf. (SD 1494)
Subtribe ChusqueinaeChusquea bambusoides (Raddi) Hack. (LC 1029)Chusquea elata (Kunth) L.G. Clark
(=Neurolepis elata)(LC and PA1409)
Chusquea scandens Kunth (LC and XL 1235)Chusquea spectabilis L.G. Clark (=Neurolepis
aperta)(LC 919)
Subtribe GuadinaeApoclada simplex McClure and L.B. Sm. (LC and WO 1027)Guadua angustifolia Kunth (LC and XL 931)Otatea acuminata (Munro) C. Calderon and
Soderstr.(LC and WZ 1348, LC et al.1312)
Subtribe HickeliinaeHickelia madagascariensis A. Camus (SD 1290, SD 1292)Nastus borbonicus J.F. Gmel. (LC and SD 1656)
Subtribe MelocanninaeCephalostachyum pergracile (Munro) R.B.
Majumdar(WZ 8400635, SD 1435)
Melocanna baccifera (Roxb.) Kurz (XL and LC 930)Subtribe Racemobambosinae
Racemobambos hepburnii S. Dransf. (WKM2891)
Tribe OlyreaeSubtribe Buergersiochloinae
Buergersiochloa bambusoides Pilg. (SD 1365, SD 1382)Subtribe Olyrinae
Olyra latifolia L. (XL and LC911)Sucrea maculata Soderstr. (LC and WZ 1345)
Subtribe ParianineaePariana radiciflora Doell in Martius (LC and WZ 1344)
Outgroup taxaEhrhartoideae
Ehrharta dura Nees ex Trin. (NB 1118)Oryza sativa L. (GenBankNC 0013201)Streptogyna americana C.E. Hubb. (RP and GD 12310, GSK
657)
PharoideaePharus latifolius L. (LC 1302)
PooideaeBrachyelytrum erectum (Schreb.) P. Beauv. (JT 199)Diarrhena obovata (Gleason) Brandenberg (LC and WZ 1216, JT 290)Triticum aestivum L. (GenBankNC 0027621)
Voucher abbreviations: AMC – Andre Mauricio Carvalho; ASG – Ana Paula Santos-Gonçalves; GD –Gerrit Davidse; GSK – Gabriel Sanchez-Ken; JT – Jimmy Triplett; LC– Lynn Clark; LSS – Luis Sergio Sarahyba; NB – Nigel Barker; PA – Patricio Asimbaya;RP – Richard Pohl; SD – Soejatmi Dransfield; WKM – Wong Khoon Meng; WO –Walter de Oliveira; WZ – Weiping Zhang; XL – Ximena Londoño.
406 S.A. Kelchner, Bamboo Phylogeny Group / Molecular Phylogenetics and Evolution 67 (2013) 404–413
analyzed (Table 1). Ingroup species were chosen to represent thethree major lineages of bamboos now recognized as tribes (Arundi-narieae, Bambuseae and Olyreae), and each of the currently or, inthe case of Arundinarieae, previously recognized, subtribes of Bam-busoideae (BPG, 2012). With the exceptions of Parianinae, Racemo-bambosinae and the monotypic Buergersiochloinae, each subtribewas represented by two to four species. Neurolepis taxa are treatedhere as Chusquea after Fisher et al. (2009). In addition to represent-ing taxonomic diversity, the particular species sampled in thisstudy were also chosen to represent as much morphological diver-sity as possible, given samples available at the time. The seven out-group taxa consisted of three species each from BEP cladesubfamilies Pooideae and Ehrhartoideae (including a sister taxonto the main lineage of each subfamily), and one species from thePharoideae, an early diverging Poaceae lineage that is sister tomost of the remaining grasses (GPWG, 2001; GPWG II, 2012). Leafmaterial was collected in the field or from greenhouse-grown spec-imens and silica-gel dried tissue (Chase and Hills, 1991) except forOryza sativa and Triticum sativum for which sequences were down-loaded from GenBank (Table 1).
2.2. DNA sequencing and alignment
Five plastid DNA regions were used in this analysis: one gene(ndhF), two group II introns (rpl16 intron, rps16 intron), and twointergenic spacers (trnD–trnT, trnT–trnL). Total genomic DNAextractions were performed with Qiagen DNeasy Plant Mini Kits(Qiagen, Valencia, USA) on vouchered silica gel-dried leaf tissue.Isolations were cleaned using Qiagen PCR Purification Columnsand then quantified with fluorometry. Target regions were PCR-amplified in the laboratories of Clark and Kelchner. Each auto-mated sequence file was reviewed for base-calling errors, poor se-quence reads, and multiple peaks. Unusual sequences were verifiedby conducting a second DNA isolation, PCR amplification, and se-quence from the original vouchered leaf materials. BLAST searcheswere used to confirm probable homology of each target sequence.
Regions were aligned individually by process partition using acriterion-based manual methodology that infers secondary struc-tures and mutational mechanisms to then inform the positioningof gaps (Kelchner and Clark, 1997; Kelchner, 2000). Specific criteriafor choosing insertions, deletions, and hairpin inversions (Kelchnerand Wendel, 1996) as scored microstructural characters followedKelchner (2000) and Löhne and Borsch (2005). Gap placements inthe combined alignment are staggered to reflect hypothesizedindependent insertion and deletion events (Morrison, 2006,2009). This approach allowed us to recover nucleotide substitutioncharacters within length mutations that had reasonable biologicalevidence of homology. Insertions and deletions that involvedmononucleotide repeats were not coded as microstructuralcharacters.
2.3. Data quality and model selection
Ambiguous characters in each alignment were included forpairwise characterization of sequence structure (base frequencyand sequence length comparisons) but were excluded prior to phy-logenetic analyses of individual data sets following Morgan andKelchner (2010). In the combined data set, ambiguous regionswere deleted entirely from the matrix prior to phylogeny estima-tion for the purposes of decreasing the overall quantity of missingdata and for facilitating maximum likelihood and network analysesacross multiple software platforms.
Base composition homogeneity was assessed for individual andcombined data sets by the chi-squared test of base frequencyinequalities implemented in PAUP� 4.0b10 (Swofford, 2002). PAUP�
was also used to measure variation in uncorrected pairwise

S.A. Kelchner, Bamboo Phylogeny Group / Molecular Phylogenetics and Evolution 67 (2013) 404–413 407
distances among sequences and the number of potentially infor-mative substitutions observed in each alignment matrix. Charactersaturation was assessed by plotting uncorrected pairwise distancesagainst model-corrected distances (Philippe et al., 1994), a methodthat can be use for noncoding DNA because it does not rely on co-don position. Model-corrected distances were produced using abest-fit model for the combined data set (discussed below).
For phylogeny estimations using probability frameworks (Sec-tion 2.4), a model of character evolution had to be specified. Boththe hierarchical likelihood ratio test (hLRT) and the Akaike Infor-mation Criterion (AIC) were used to ascertain model adequacyamong the 56 models available for comparison in ModelTest (Posa-da and Crandall, 1998). The hLRT method might be biased due toits hierarchical approach (Kelchner and Thomas, 2007), but allhLRT results were compared to models that show reasonable evi-dence of being ‘‘best fit’’ by AIC (i.e., those models that have AICdifferences of D 6 2; the rationale follows Posada and Buckley(2004) and Kelchner (2009)).
Conflict among character state changes in the data was evalu-ated in two ways. First, the data were visualized with a neigh-bor-net analysis using the program SplitsTree 4 (Huson andBryant, 2006). Networks of uncorrected and model-corrected dis-tances were surveyed to identify sequences involved in large retic-ulations that indicate character conflict (Morrison, 2005, 2010).Second, nonparametric bootstrap analyses were performed on eachdata set using maximum likelihood in PhyML 3 (Guindon andGascuel, 2003). The best-fit model was set for each data partitionwith all parameter values estimated in 1000 pseudoreplicates. Re-sults were surveyed for bootstrap-supported incongruence amongtrees recovered for each sequence region. In one case (rpl16 intron),the Shimodaira–Hasegawa test (SH test, Shimodaira and Hasegawa(1999)) was used to determine if an observed incongruence withbootstrap support of 80 was significantly different to the combinednucleotide phylogeny estimation when given the rpl16 intron dataand three different models of character evolution. The SH test wasperformed with PAUP� using RELL and 10,000 pseudoreplicates.
2.4. Tree estimation
Three analytical frameworks were applied to establish whetherthe phylogeny estimation for Bambusoideae plastomes was robustto reasonable changes in assumptions about character evolution(Penny et al., 1992; Kelchner and Thomas, 2007). Two of the frame-works, maximum parsimony (MP) and Bayesian inference (BI),could be applied to both nucleotide and microstructural characters.The third framework, maximum likelihood (ML), is most efficientlyused for phylogeny estimation from nucleotide data. Therefore,only nucleotide characters were used for topology comparisonsthat evaluated robustness across frameworks. In the estimationsproduced by MP and BI from combined data, scored microstruc-tural changes were included at the end of the alignment matrixas 0/1 standard characters.
Equal weight MP analyses (sensu Fitch, 1971) were conductedin PAUP� using a rapid, suboptimal search strategy in which 1000replicates of random taxon-addition starting trees produced a poolof 100,000 topologies from which a secondary TBR search wasswapped to completion and a strict consensus of the most parsi-monious trees was produced. This strategy provided a computa-tionally tractable way to perform nonparametric MP bootstrapanalyses using PAUP� (1000 pseudoreplicates). The most parsimo-nious topology was not sought for or required by our assessment ofrobust signal across analytical frameworks.
ML analysis was performed in PAUP� when the aim was to ob-tain an optimal (i.e., maximized likelihood estimate, or MLE) topol-ogy for the individual and combined data sets. The program PhyMLwas used for nonparametric ML bootstrapping (10,000
pseudoreplicates). In both programs, the model was designatedto be one of the best fit candidate models for the data set, withmodel parameter values estimated during analysis and microstruc-tural characters excluded. Each PAUP� MLE search was conductedtwice, and MLE topologies were used primarily for SH testing ofalternative hypotheses. Although PhyML might not be an optimalsearch algorithm for MLE topologies, it is computationally inex-pensive and is likely to be conservative when used for nonpara-metric bootstrapping: if some pseudoreplicates fail to producetruly optimal estimates, then the spurious topological conflict overten thousand repetitions would slightly lower bootstrap supportvalues.
BI was conducted with MrBayes 3.1 (Huelsenbeck and Ronquist,2001) using a partitioned GTR + I + G model for reasons outlined byHuelsenbeck and Rannala (2004) with all parameter values esti-mated during analysis. A Dirichlet prior was used for base frequen-cies and the rate matrix. A uniform prior was used for the shapeparameter (a), proportion of invariable sites (I), and topology.Branch lengths were unconstrained. Partitions were designatedfor each data set and for the microstructural characters and allparameters were unlinked across partitions. Four separate analyseswere performed with four runs of four chains each that continuedfor 20 million generations. Posterior probabilities were calculatedusing the final 10 million generations in each run, with samplingevery 100 generations; this cut-off value was computationally effi-cient and it conservatively satisfied a rough convergence criterionthat average standard deviation of split frequencies should stabi-lize below 0.01.
2.5. Rooting and potential long branch attraction
Estimated phylogenies were rooted with Pharus latifolius. P.latifolius is, however, one of many long branches in this study thatattaches to a short internode in each tree. To survey for potentialerror caused by long branch attraction (LBA) in our analyses, taxonremoval experiments were performed in PAUP� with combinednucleotide data using ML (model GTR + I + G). The following taxonremovals were tested individually: (i) Olyreae; (ii) all outgrouptaxa except Streptogyna americana; (iii) Pooideae; (iv) Triticum aes-tivum; (v) Ehrhartoideae; (vi) Oryza sativa; (vii) Chusqueineae; and(viii) Streptogyna americana. The MLE topology from each analysiswas checked for changes in relationship among remaining taxawhen rooted with P. latifolius. The removal of Streptogyna ameri-cana also included a nonparametric ML bootstrap analysis (1000pseudoreplicates) because of its high level of character conflict atkey nodes in the SplitsTree neighbor-net graph.
2.6. Testing of alternative hypotheses
Three ML constraint analyses of combined nucleotide data wereconducted with PAUP�. In the first analysis, all woody bamboos(Arundinarieae and Bambuseae) were required to form a singleclade that was sister to herbaceous bamboos (Olyreae). In the sec-ond analysis, Ehrhartoideae was constrained to be sister to Bambu-soideae. In the third analysis, Chusqueinae was forced to be sisterto a clade of all other tropical woody bamboos (Paleotropi-cal + Arthrostylidiinae + Guaduinae). A fourth analysis involvedthe incongruent topology from the rpl16 intron data set. ConstraintMLE topologies were tested individually against the unconstrainedMLE topology of combined nucleotide data in a two–tree SH test(sensu Buckley et al., 2001) that maintains excellent type 1 errorcontrol yet avoids the conservative behavior the test shows in mul-tiple tree comparisons (Shimodaira, 2002); in this form, the test re-duces to a KH test with correction for a posteriori topologies(Shimodaira and Hasegawa, 1999; Goldman et al., 2000). All SHtests were performed with PAUP� and used 10,000 RELL replicates.

408 S.A. Kelchner, Bamboo Phylogeny Group / Molecular Phylogenetics and Evolution 67 (2013) 404–413
Because SH test results can vary with model choice (Buckley et al.,2001), each test was performed three times using the models JC,HKY + G, and GTR + I + G.
3. Results
3.1. Sequence alignments and data quality
Sequence recovery from the five plastid regions was generallystraightforward. PCR amplifications resulted in single bands andthe sequence files showed no problematic double peaks. Of theGenBank sequences downloaded for the analysis, the rps16 intronin T. aestivum appeared to be inaccurately labeled (see below, thissection) and was scored as missing data in the combined analyses.GenBank accession numbers for sequences generated by this studyare KC020491–KC020545, and KC020547–KC020602; a table ofGenBank accession numbers by sequence region and taxon is in-cluded in the online Supplementary material.
Alignment length (number of characters) by region was 2120for ndhF, 1364 for rpl16 intron, 1006 for rps16 intron, 1465 fortrnD–trnT spacer, and 1066 for trnT–trnL spacer. Percent informa-tive characters for all regions was between 10% and 11% exceptfor the rps16 intron (6.96%). The combined alignment with ambig-uous regions removed was 6657 nucleotide characters with 10.03%informative characters. Microstructural changes for which reason-able estimation of homology could be made totaled 37: two in ndhF(including one hairpin inversion), 13 in rpl16 intron (including onehairpin inversion), three in rps16 intron, nine in trnD–trnT spacer(including one hairpin inversion, with an additional hairpin inver-sion located in a deleted ambiguous region), and ten in trnT–trnL. Alist of character types and scoring across taxa is included in Supple-mentary material.
None of the alignments showed significant differences in basecomposition among taxa. Saturation plots indicated slight devia-tion when model correction was applied, but the deviation wasnot strong (Supplementary material) and there was no obviousplateau to indicate problematic saturation of the noncoding data(e.g., Simon et al., 2009). Neighbor-net analysis of uncorrectedand model-corrected pairwise distances showed considerablecharacter conflict among outgroup sequences, particularly in rela-tion to S. americana and the herbaceous bamboo lineage Olyreae.The network also allowed for the identification of an incorrect se-quence for the rps16 intron in T. aestivum, which was subsequentlyremoved from the alignments. A table of data set characteristics isincluded in Supplementary material.
Phylogeny estimations of individual data sets showed no wellsupported incongruence among region signal except in the rpl16intron for the clade Rhipidocladum pittieri + Glaziophyton mirabile.However, an SH test showed no significant difference between thisarrangement and the combined data topology when given rpl16 in-tron data and three models of character evolution (Supplementarymaterials). The clade is also not present in the MLE topology ofrpl16 intron data produced by PAUP�. These observations, as wellas the general lack of character conflict among ingroup sequencesin the neighbor-net analysis and the relatively low bootstrap val-ues on incongruent nodes from each region, suggested that thesame tree-like signal was present among data sets and that combi-nation of data was acceptable.
3.2. Phylogeny estimations
Models selected for each data set, together with relevant AICinformation, are presented in Supplementary material. Each regionhad GTR + G or GTR + I + G as one of its best-fit models from themodel candidate pool according to the criterion of AIC differencesD 6 2. Hierarchical likelihood ratio test results were either
TVM + G or TVM + I + G for all data sets. The combined matrixhad both GTR + I + G and TVM + I + G as potentially best-fit usingthe same AIC and hLRT criteria. ML analyses of each data set, there-fore, used the following models: GTR + I + G for ndhF, GTR + G forrpl16 intron, GTR + G for rps16 intron, GTR + G for trnD–trnT spacer,GTR + G for trnT–trnL spacer, and GTR + I + G for combined nucleo-tide data.
ML bootstrap topologies for each region, with minor incongru-ences identified, are presented in Supplementary material.Although the percent of informative characters is nearly equal forall regions except rps16 intron, ndhF gave good resolution through-out its tree whereas noncoding regions provided improved resolu-tion at mid-levels of divergence (e.g., among the four majorlineages of Bambusoideae). The position of Olyreae is dependenton noncoding DNA data in this study.
The ndhF phylogeny estimation was congruent with the topol-ogy of the combined nucleotide analysis. Each noncoding region,however, showed between two and five minor incongruences. Allbut one of these had low bootstrap support (between 50 and 69)on generally very short branches. The case of the rpl16 intronincongruence with a bootstrap value of 80 is discussed aboveand was ruled out as being significant conflicting signal. Rps16 in-tron showed the most incongruence (five nodes) but also had theleast number of potentially informative characters and the leastnumber of resolved nodes with bootstrap support of P80. Simi-larly supported nodes in other data sets totaled 15 in ndhF, 13 inrpl16 intron, 15 in trnD–trnT, and only nine in trnT–trnL despiteits 10.88% of potentially informative characters. Microstructuralcharacters resolved 14 nodes in the MP consensus tree of 641 mostparsimonious topologies (Supplementary material) with the singleincongruence of Atractantha radiata + R. pittieri; the tree has alength of 83, a consistency index of 0.446, a homoplasy index of0.554, and a retention index of 0.711.
The independent phylogeny estimations of rps16 intron, trnD–trnT, and trnT–trnL data place Olyreae within Bambusoideae, butndhF and rpl16 intron data recover only a polytomy. Rpl16 intronand trnT–trnL place Ehrhartoideae sister to Bambusoideae withlow bootstrap support (69 and 57, respectively). This differs fromndhF, trnD–trnT and the combined data which place Pooideae assister to Bambusoideae with ML bootstrap support below 67. Boot-strapping of rps16 intron data produced a polytomy involving thesethree lineages.
Phylogenetic analysis of combined nucleotide characters pro-duced a congruent topology across MP, ML and BI frameworks(Fig. 2a). The topology was robust to all models of character evolu-tion trialed. Four main lineages are present within Bambusoideae:the Paleotropical Woody clade (subtribes Bambusinae, Racemo-bambosinae, Hickeliinae, Melocanninae), the Neotropical Woodyclade (subtribes Chusqueinae, Arthrostylidiinae, Guaduinae), theHerbaceous clade (subtribes Buergersiochloinae, Olyrinae, Pariani-nae), and the Temperate Woody clade (tribe Arundinarieae). Pooi-deae is weakly supported as sister to Bambusoideae (ML bootstrapof 67, posterior probability of 0.94). Twenty-seven nodes wererecovered with ML bootstrap support of P80 although five nodeswithin the Paleotropical Woody clade and the Temperate Woodyclade show either very low bootstrap support or low posteriorprobabilities. MP and BI analyses that included microstructuralcharacters with the combined nucleotide data gave the same topol-ogy as Fig. 2a (see Supplementary materials).
3.3. LBA and alternative hypothesis testing
Taxon removal experiments to survey for long branch attractionresulted in no changes to ingroup or outgroup topologies. MLEtopology estimates from each taxon removal data set show onlyone minor difference: the position of Racemobambos hepburnii

Fig. 2. Phylogeny estimation and geographic distribution of major bamboo lineages based upon plastid (chloroplast) DNA sequences from five loci: ndhF, rpl16 intron, rps16intron, trnD–trnT intergenic spacer, and trnL–trnF intergenic spacer. (A) Consensus posterior topology of the partitioned BI analysis of combined nucleotide andmicrostructural characters. The topology is congruent with the MP strict consensus topology of the same data set and the ML topology of nucleotide data alone. Posteriorprobabilities are shown above branches. ML bootstrap values are listed first below each branch, followed by MP bootstrap values. Paired dashes indicate support values below50 (bootstraps) or 0.5 (posterior probabilities). The ML estimate of topology shows additional resolution (Fig. 4). (B) Subtribe relationships and geographic distributions of thefour major lineages of bamboos recovered in this study. Clade order follows that of (A). Question mark in the Herbaceous diagram represents uncertainty about the nativestatus of Olyra latifolia in Africa and Madagascar.
S.A. Kelchner, Bamboo Phylogeny Group / Molecular Phylogenetics and Evolution 67 (2013) 404–413 409

410 S.A. Kelchner, Bamboo Phylogeny Group / Molecular Phylogenetics and Evolution 67 (2013) 404–413
usually collapses into a polytomy with other members of thePaleotropical Woody clade (see Supplementary materials). Pooi-deae remains sister to Bambusoideae in all taxon removal experi-ments which included members of that lineage, when P. latifoliusis used to root each topology.
Two–tree SH tests of three alternative hypotheses of bambooand outgroup relationships failed to reject any alternative con-straint MLE topology for each of three character evolution models(attained significance p = 0.05). A table of SH test results can befound in Supplementary materials.
4. Discussion
Bamboos have long been a problematic plant group to examinewith molecular phylogenetic techniques. Rate heterogeneityamong lineages, lack of sequence variation in certain genera andsubtribes, and short internodes deep within the topology have pre-vented consistent and well supported resolution of branching or-der among and within major bamboo clades. Despite thedifficulty of comparative sequence analysis in Bambusoideae, wehave been able to use 6.7 kb of high quality nucleotide data and37 microstructural changes to produce a robust and rigorouslytested phylogeny estimation for bamboo chloroplasts. Nuclear datawill be required before an organismal phylogeny of bamboos canbe established with greatest confidence, but the generation of areliable chloroplast phylogeny is an essential step in that process.We therefore present an evaluation of our phylogeny estimation,its strengths and weaknesses, and corresponding evidence frompublished literature that allow us to assess whether this topologyshould be considered a best estimate of higher level relationshipsamong bamboo plastid genomes.
4.1. Strengths of the phylogeny estimation
A worldwide effort of Bamboo Phylogeny Group members to at-tain leaf tissue samples for this study has improved upon previousefforts of taxon sampling and vouchering of materials for bamboomolecular analysis. The phylogeny estimation represents the great-est breadth to date of bamboo taxonomic, morphological and geo-graphic diversity to be included in a single analysis. The estimate isderived from data representing multiple process partitions in theplastid genome, including one fast-evolving gene, two group II in-trons, and two intergenic spacers. Congruence of supported treeresolution among each of those partitions indicates that the datacontains one dominant signal. Phylogeny estimation from micro-structural characters mirrors the estimation derived from nucleo-tide characters. These observations suggest that contradictions inthe data to this dominant signal are minor and are likely due toconflict among homoplastic characters.
Potential bias in the phylogeny estimation was not detectedwith available tests for error. There is no evidence of base compo-sition inequalities among sequences and lineages, and no problem-atic site saturation. The topology is robust to moderate changes inthe model of character evolution (sensu Kelchner and Thomas,2007) including the analytical framework (MP, ML, BI). Taxon re-moval experiments cause no alteration of ingroup topology thatwould indicate the misleading effect of long branch attraction.
With nearly 6.7 kb of nucleotide data showing 10–11% se-quence variation among taxa, posterior probabilities and bootstrapvalues are high on most nodes of the Bambusoideae phylogenyestimation. This observation indicates that more sequence datafrom the chloroplast genome in these specimens is likely to showthe same branching order among well supported clades. Furthersequencing of chloroplast regions, if bias and poor data qualityare minimal, is therefore unlikely to alter our estimation of
higher-level plastid relationships among the bamboos. An excep-tion might be in the resolution of monophyly of neotropical bam-boos (Section 4.2). Additional independent sequencing effortshave, encouragingly, provided corroborative evidence of these re-sults (Kelchner et al., in prep.).
4.2. Weaker nodes of the tree
Despite many positive signs that our topology is robust and wellsupported, there remain a few areas of concern in the chloroplastphylogeny estimation that warrant further consideration. A resultthat justifies caution is the failure to reject alternative hypothesesof relationships in the three cases tested. Although the SH test canbe unnecessarily conservative when several topologies are com-pared at once, the test is proper to use when the number of candi-date topologies is very small and it does give better type 1 errorcontrol than the AU test (Shimodaira, 2002). In our case only twotrees were compared in each test, conditions under which the SHtest reduces to a KH test (Kishino and Hasegawa, 1989) with cor-rection for the comparison of a posteriori topologies.
One possible explanation for the failure to reject alternativehypotheses can be found in the neighbor-net network of gap-free,model-corrected sequence data (Fig. 3) and in the branch lengthsof the MLE phylogram of combined nucleotide data (Fig. 4). Sub-stantial character conflict exists in the network, represented inthe diagram as boxes outlining alternative edges of character sup-port. The most important ingroup relationship affected by this con-flict is the edge between temperate woody bamboos andherbaceous bamboos, a part of the network to which all outgroupsequences join. Although this character conflict might arise simplyfrom stochastic parallelism and reversal of nucleotide changes, it isproblematic enough that bootstrap-supported resolution still rep-resents indecisive signal in SH tests. The conflict allows for a pos-sibility that outgroup sequences are misrooting to the temperateclade sequences, which produces an apparent paraphyly of thewoody bamboos that is due to analytical error and not evolution-ary history.
A second problem spot is the monophyly of Neotropical woodybamboos, a relationship that is likely to be unstable due to a pau-city of unique character variation at the node. Again the issue ispresent despite bootstrap values of 73 (ML) and 75 (MP), and pos-terior probability (1.00) for the clade (Fig. 2). The branch is com-paratively short in the MLE phylogram of combined nucleotidedata (Fig. 4) and involves a clade (Chusqueinae) with faster thannormal rates of sequence evolution for woody bamboo chloro-plasts. An SH test failed to reject the possibility that Neotropicalwoody bamboos are paraphyletic with respect to the PaleotropicalWoody clade, which allows for a reasonable alternative hypothesisthat Chusqueinae is sister to a lineage that includes all remainingtropical woody bamboos.
Although Melocanninae is supported as sister to the remainingpaleotropical woody bamboos (bootstraps 96 ML, 96 MP; posteriorprobability 1.00), the network analysis (Fig. 3) shows characterconflict from R. hepburnii that likely prevents supported resolutionof branching order within the paleotropical woody lineage. The fi-nal problem area is already well known to bamboo phylogeneti-cists: a lack of sufficient resolution to clarify relationships withinthe temperate woody clade. Encouragingly, the absence of a clearbifurcation pattern here is not due to character conflict (Fig. 3)but rather an absence of observed character state variation in thesequence data. Adding further high quality sequences from addi-tional chloroplast loci therefore holds considerable promise inthe eventual resolution of major lineages within this clade (e.g.,Triplett and Clark, 2010; Zheng et al., 2010; Zhang et al., 2011),although if the radiation is recent enough the bamboos in the tem-perate clade might still fail to exhibit clear signs of lineage sorting.

Fig. 3. A data-display network of combined nucleotide sequences. The neighbor-net method is used here to explore data conflict and not to estimate phylogeny. For visualclarity, taxon names have been abbreviated as the first four letters of the genus name except in the following cases: chuB (Chusquea bambusoides), chuS (Chusquea scandens),chuA (Chusquea spectabilis), chuE (Chusquea elata), chib (Chimonobambusa marmorea) and chic (Chimonocalamus pallens). The shaded arrow shows a network location thatcorresponds to the question of monophyly in neotropical woody bamboos. The white arrow indicates the joining location of outgroup sequences to the long edges betweenthe herbaceous and temperate woody bamboo groups.
Fig. 4. Maximized likelihood estimate of topology based upon combined nucleotide data and a best-fit model (GTR + I + G). Nodes of persistent difficulty are (1) paraphyly ofwoody bamboos with respect to the herbaceous lineage, (2) monophyly of neotropical woody bamboos, (3) monophyly of Bambusinae sensu stricto, and (4) the long branchleading to a probable rapid diversification of temperate woody bamboos.
S.A. Kelchner, Bamboo Phylogeny Group / Molecular Phylogenetics and Evolution 67 (2013) 404–413 411
Despite the robustness of the ingroup topology to long branchattraction experiments, several long branches still exist in the
phylogeny estimation that might not improve with additional tax-on sampling. The branch leading to the radiation of Temperate

412 S.A. Kelchner, Bamboo Phylogeny Group / Molecular Phylogenetics and Evolution 67 (2013) 404–413
Woody bamboos, for example, could remain uninterrupted: newlysequenced members continue to show strong sequence similarityto all other species in the clade (Triplett and Clark, 2010; Zhenget al., 2010; Hodkinson et al., 2010). Similarly, the sister relation-ship of Buergersiochloa bambusoides to all other herbaceous bam-boos will probably remain the earliest split in that lineage: theremaining unsampled species taxonomically fall within the Pari-aninae and Olyrinae clades further up that branch. So far, outgrouptaxa have proven to be relatively distant in sequence similarity andwill continue to cause problematic character conflict when joiningthe long branch between herbaceous and temperate woody cladesin unrooted topologies and networks.
4.3. Congruence with other studies
Several features of our topology are worth comparison withpublished literature on bamboo phylogenetics. Presented here isa short discussion of congruence and inconsistencies betweenour phylogeny estimation and those published in other studiesfor the purpose of evaluating our topology. A more complete re-view of bamboo molecular phylogenetics literature is presentedin an accompanying classification paper by the Bamboo PhylogenyGroup (BPG, 2012).
Four major bamboo lineages were recovered that show biogeo-graphic and morphological distinction (Fig. 2). The finding is con-sistent with two other recent studies that have comparable taxonand marker sampling (Bouchenak-Khelladi et al., 2008; Sungkaewet al., 2009). The Temperate Woody clade has long been distinct inmolecular analyses. Early evidence came from plastid RFLPs(Watanabe et al., 1994; Kobayashi, 1997), followed by comparativeDNA sequence analysis (Kelchner and Clark, 1997; Zhang andClark, 2000; Bouchenak-Khelladi et al., 2008; Peng et al., 2008and several subsequent studies). Lack of resolution within theTemperate Woody clade is common to all chloroplast DNA studies,including the present one.
The Herbaceous clade has also been recognized for more than adecade, both in chloroplast and nuclear DNA studies (e.g., Clarket al., 1995; Kelchner and Clark, 1997; Mathews et al., 2000; Bou-chenak-Khelladi et al., 2008; Sungkaew et al., 2009). A Paleotropi-cal Woody clade first appeared in Kelchner and Clark (1997) andwas supported with additional taxon sampling in Zhang and Clark(2000). This clade has since been recovered in the well sampledstudies of Bouchenak-Khelladi et al. (2008) and Sungkaew et al.(2009). A novel result of the present study is the well-supportedinclusion of Hickeliinae, represented by two Malagasy species, inthe Paleotropical Woody clade. The subtribe forms a trichotomywith Racemobambosinae and the Bambusinae. Although Clarket al. (2007) included a more extensive sampling of Hickeliinaein their analysis, the subtribe was only weakly associated withthe other paleotropical woody bamboos.
A tropical woody clade (Paleotropical + Neotropical Woodybamboos) is well supported in both Bouchenak-Khelladi et al.(2008) and Sungkaew et al. (2009), with only slightly less supportin our analysis. More problematic has been a confirmation of theNeotropical Woody clade. Previous to this study, the only pub-lished molecular evidence of a Neotropical Woody clade was a pre-liminary rpl16 intron analysis by Kelchner and Clark (1997) and amore taxon and data rich analysis by Sungkaew et al. (2009). Wenote that bootstrap support for this clade in both Sungkaew et al.(2009) and the present study is moderate at best, that problematiccharacter conflict exists at these nodes in the network analyses,and that possible paraphyly of Neotropical woody bamboos withrespect to the Paleotropical Woody clade cannot be rejected withSH tests.
As in Bouchenak-Khelladi et al. (2008), Sungkaew et al. (2009),GPWG II (2012) and Kelchner et al. (in prep) our tree suggests
paraphyly of plastids in woody bamboos. The topology, however,is incongruent with Mathews et al.’s (2000) phylogeny estimationof nuclear phyB sequences in grasses, the only published nucleardata set to include taxa from all three woody and herbaceous bam-boo tribes. Although the phyB analysis was focused on tribal rela-tionships in Poaceae, a bamboo clade was recovered with awoody lineage sister to an herbaceous lineage, as predicted bythe traditional classification scheme of two Bambusoideae tribes.Only the herbaceous clade had bootstrap support. SH tests of ourplastid data fail to reject this alternative arrangement of taxa,which suggests that the potential incongruence of nuclear signalwith most plastid studies could be due to analytical error fromthe accumulation of homoplasious characters in bamboo plastidlineages. Alternatively, it is also possible that the incongruence ishistorically accurate and represents an echo of early hybridizationevents among ancestral populations of diverging herbaceous andwoody bamboos. Until more data is available from the nuclear gen-ome and directed morphological analyses, commitment to a stanceof paraphyly in woody bamboos is inadvisable.
4.4. Summary and future directions
In this paper, the Bamboo Phylogeny Group presents a rigor-ously tested plastid phylogeny estimation of branching orderamong the world’s major bamboo lineages. The tree is well re-solved, most branches have high support values, and all tribesand subtribes of bamboos are adequately positioned within thetopology. Corroboration of the tree by an independent study (Kel-chner et al., in prep.) and congruence of major lineages with previ-ous molecular phylogeny estimations suggests that we haveconverged upon a predominant plastid signal for Bambusoideae.
Four main plastid lineages are recognized that correspond todistinct biogeographic categories: paleotropical woody, neotropi-cal woody, temperate woody, and herbaceous bamboos. The sub-tribe Hickeliinae is robustly placed in a trichotomy withRacemobambosinae and Bambusinae that is sister to Melocanninaein the paleotropical woody clade. Chusqueinae is sister to theremaining neotropical woody bamboos, and Buergersiochloinae issister to the remaining herbaceous subtribes. Resolution withintribe Arundinarieae is weak because of limited sequence variationamong sampled taxa.
Monophyly of the woody bamboos remains plausible because ofcharacter conflict in the plastid data and the possible incongruenceof plastid signal with a phylogeny estimation based on nuclearDNA sequences. What is evident, however, is that a deep split ex-ists in the woody bamboo plastid phylogeny between tropical spe-cies and temperate ones. By classifying the two woody lineages asseparate tribes (Arundinarieae and Bambuseae), the Bamboo Phy-logeny Group can provide a stable system for bamboo taxonomythat is resilient to the possibility of monophyly of woody bamboonuclear genomes (BPG, 2012).
A thorough reconstruction of organismal phylogeny for bam-boos will require morphological and nuclear data to be evaluatedin addition to the chloroplast sequences presented here. A detailedmorphological analysis of bamboo species is currently being pre-pared by members of the BPG. Ongoing efforts in bamboo plastidcomparisons are focusing on the addition of many more taxa inmost subtribe lineages (BPG, in prep.) and on whole plastome se-quences (Zhang et al., 2011) to generate additional resolutionwithin each of the four major bamboo clades. This is likely to rein-force and enhance our knowledge of subtribal plastid relationshipsover the next few years. Sequencing of low-copy nuclear loci is alsounderway that will offer critical evidence for an accurate recon-struction of bamboo evolutionary history. These data sets, whenavailable, should provide a robust framework for advanced testingof morphological and molecular character evolution, biogeographic

S.A. Kelchner, Bamboo Phylogeny Group / Molecular Phylogenetics and Evolution 67 (2013) 404–413 413
hypotheses, and discernment of evolutionary steps in the develop-ment of modern day Bambusoideae.
Acknowledgments
Chloroplast DNA sequences were produced in the laboratoriesof Lynn Clark and Scot Kelchner with the assistance of Jimmy Trip-lett, Amanda Fisher, Chi-Sing Ho, Idaho State University’s Molecu-lar Research Core Facility, and the DNA Facility of the Iowa StateUniversity Office of Biotechnology. Funding for the Project wasprovided by National Science Foundation awards DEB-0515828to Scot Kelchner and DEB-0515712 and DEB-9806877 to LynnClark. Field work for temperate bamboo collections was supportedin part by National Geographic Society Grant 7336-02 to LynnClark and De-Zhu Li.
Appendix A. Supplementary material
Supplementary data associated with this article can be found, inthe online version, at http://dx.doi.org/10.1016/j.ympev.2013.02.005.
References
Bamboo Phylogeny Group, 2006. The bamboo phylogeny project. Bamboo 27, 11–14.
Bamboo Phylogeny Group, 2012. An updated tribal and subtribal classification ofthe bamboos (Poaceae: Bambusoideae). In: Proceedings of the 9th WorldBamboo Congress, 10–12 April 2012, Antwerp, Belgium, pp. 3–27.
Bouchenak-Khelladi, Y., Salamin, N., Savolainen, V., Forest, F., van der Bank, M.,Chase, M.W., Hodkinson, T.R., 2008. Large multi-gene phylogenetic trees of thegrasses (Poaceae): progress towards complete tribal and generic level sampling.Mol. Phylogenet. Evol. 47, 488–505.
Buckley, T.R., Simon, C., Shimodaira, H., Chambers, G.K., 2001. Evaluatinghypotheses on the origin and evolution of the New Zealand alpine cicadas(Maoricicada) using multiple-comparison tests of tree topology. Mol. Biol. Evol.18, 223–234.
Chase, M.W., Hills, H.H., 1991. Silica gel: an ideal material for field preservation ofleaf samples for DNA studies. Taxon 40, 215–220.
Clark, L.G., Dransfield, S., Triplett, J., Sánchez-Ken, J.G., 2007. Phylogeneticrelationships among the one-flowered, determinate genera of Bambuseae(Poaceae: Bambusoideae). Aliso 23, 315–332.
Clark, L.G., Zhang, W., Wendel, J.F., 1995. A phylogeny of the grass family (Poaceae)based on ndhF sequence data. Syst. Bot. 20, 436–460.
Davis, J.I., Soreng, R.J., 2010. Migration of endpoints of two genes relative toboundaries between regions of the plastid genome in the grass family(Poaceae). Am. J. Bot. 97, 874–892.
Fisher, A.E., Triplett, J.K., Ho, C.S., Schiller, A.D., Oltrogge, K.A., Schroder, E.S.,Kelchner, S.A., Clark, L.G., 2009. Paraphyly in the bamboo subtribe Chusqueinae(Poaceae: Bambusoideae) and a revised infrageneric classification for Chusquea.Syst. Bot. 34, 673–683.
Fitch, W.M., 1971. Toward defining the course of evolution: minimum change for aspecific tree topology. Syst. Zool. 20, 406–416.
Gaut, B.S., Clark, L.G., Wendel, J.F., Muse, S.V., 1997. Comparisons of the molecularevolutionary process at rbcL and ndhF in the grass family (Poaceae). Mol. Biol.Evol. 14, 769–777.
Goldman, N., Anderson, J.P., Rodrigo, A.G., 2000. Likelihood-based tests of topologiesin phylogenetics. Syst. Biol. 49, 652–670.
Grass Phylogeny Working Group [GPWG], 2001. Phylogeny and subfamilialclassification of the grasses (Poaceae). Ann. Missouri Bot. Gard. 88, 373–457.
Grass Phylogeny Working Group II [GPWG II], 2012. New grass phylogeny resolvesdeep evolutionary relationships and discovers C4 origins. New Phytol. 193, 304–312.
Guindon, S., Gascuel, O., 2003. A simple, fast, and accurate algorithm to estimatelarge phylogenies by maximum likelihood. Syst. Biol. 52, 696–704.
Hodkinson, T.R., Chonghaile, G.N., Sungkaew, S., Chase, M.W., Salamin, N., Stapleton,C.M.A., 2010. Phylogenetic analyses of plastid and nuclear DNA sequencesindicate a rapid late Miocene radiation of the temperate bamboo tribeArundinarieae (Poaceae, Bambusoideae). Plant Ecol. Divers. 3, 109–120.
Huelsenbeck, J.P., Rannala, B., 2004. Frequentist properties of Bayesian posteriorprobabilities of phylogenetic trees under simple and complex substitutionmodels. Syst. Biol. 53, 904–913.
Huelsenbeck, J.P., Ronquist, F., 2001. MrBayes: Bayesian inference of phylogeny.Biometrics 17, 754–755.
Huson, D.H., Bryant, D., 2006. Application of phylogenetic networks in evolutionarystudies. Mol. Biol. Evol. 23, 254–267.
Judziewicz, E.J., Clark, L.G., 2007. Classification and biogeography of New Worldgrasses: Anomochlooideae, Pharoideae, Ehrhartoideae, and Bambusoideae.Aliso 23, 303–314.
Judziewicz, E.J., Clark, L.G., Londoño, X., Stern, M.J., 1999. American Bamboos.Smithsonian Institution Press, Washington, DC.
Kelchner, S.A., 2000. The evolution of non-coding chloroplast DNA and itsapplication in plant systematics. Ann. Missouri Bot. Gard. 87, 482–498.
Kelchner, S.A., 2009. Phylogenetic models and model selection for noncoding DNA.Plant Syst. Evol. 282, 109–126.
Kelchner, S.A., Clark, L.G., 1997. Molecular evolution and phylogenetic utility of therpl16 intron in Chusquea and the Bambusoideae (Poaceae). Mol. Phylogenet.Evol. 8, 385–397.
Kelchner, S.A., Thomas, M.A., 2007. Model use in phylogenetics: nine key questions.Trends Ecol. Evol. 22, 87–94.
Kelchner, S.A., Wendel, J.F., 1996. Hairpins create minute inversions in non-codingregions of chloroplast DNA. Curr. Genet. 30, 259–262.
Kishino, H., Hasegawa, M., 1989. Evaluation of the maximum likelihood estimate ofthe evolutionary tree topologies from DNA sequence data, and the branchingorder in Hominoidea. J. Mol. Evol. 29, 170–179.
Kobayashi, M., 1997. Phylogeny of world bamboos analysed by restriction fragmentlength polymorphisms of chloroplast DNA. In: Chapman, G.P. (Ed.), TheBamboos. Academic Press, London, England, pp. 227–234.
Löhne, C., Borsch, T., 2005. Molecular evolution and phylogenetic utility of the petDgroup II intron: a case study in basal angiosperms. Mol. Biol. Evol. 22, 317–332.
Mathews, S., Tsai, R.C., Kellogg, E.A., 2000. Phylogenetic structure in the grass family(Poaceae): evidence from the nuclear gene phytochrome B. Am. J. Bot. 87, 96–107.
McClure, F.M., 1966. The Bamboos: A Fresh Perspective. Harvard University Press,Cambridge, Massachusetts.
Morgan, M.J., Kelchner, S.A., 2010. Inference of molecular homology and sequencealignment by direct optimization. Mol. Phylogenet. Evol. 56, 305–311.
Morrison, D.A., 2005. Networks in phylogenetic analysis: new tools for populationbiology. Int. J. Parasitol. 35, 567–582.
Morrison, D.A., 2006. Multiple sequence alignment for phylogenetic purposes. Aust.Syst. Bot. 19, 479–539.
Morrison, D.A., 2009. A framework for phylogenetic sequence alignment. Plant Syst.Evol. 282, 127–149.
Morrison, D.A., 2010. Using data-display networks for exploratory data analysis inphylogenetic studies. Mol. Biol. Evol. 27, 1044–1057.
Peng, S., Yang, H.-Q., Li, D.-Z., 2008. Highly heterogeneous generic delimitationwithin the temperate bamboo clade (Poaceae: Bambusoideae): evidence fromGBSSI and ITS sequences. Taxon 57, 799–810.
Penny, D., Hendy, M.D., Steel, M.A., 1992. Progress with methods for constructingevolutionary trees. Trends Ecol. Evol. 7, 73–79.
Philippe, H., Sorhannus, U., Baroin, A., Perasso, R., Gasse, F., Adoutt, A., 1994.Comparison of molecular and paleontological data in diatoms suggests a majorgap in the fossil record. J. Evol. Biol. 7, 247–265.
Posada, D., Buckley, T.R., 2004. Model selection and model averaging inphylogenetics: advantages of Akaike information criterion and Bayesianapproaches over likelihood ratio tests. Syst. Biol. 53, 793–808.
Posada, D., Crandall, K.A., 1998. ModelTest: testing the model of DNA substitution.Bioinformatics 14, 817–818.
Shimodaira, H., 2002. An approximately unbiased test of phylogenetic treeselection. Syst. Biol. 51, 492–508.
Shimodaira, H., Hasegawa, M., 1999. Multiple comparisons of log-likelihoods withapplications to phylogenetic inference. Mol. Biol. Evol. 16, 1114–1116.
Simon, D.M., Kelchner, S.A., Zimmerly, S., 2009. A broadscale phylogenetic analysisof group II intron RNAs and intron-encoded reverse transcriptases. Mol. Biol.Evol. 26, 2795–2808.
Sungkaew, S., Stapleton, S.M.A., Salamin, N., Hodkinson, T.R., 2009. Non-monophylyof the woody bamboos (Bambuseae; Poaceae): a multi-gene regionphylogenetic analysis of Bambusoideae s.s. J. Plant Res. 122, 95–108.
Swofford, D.L., 2002. PAUP� Phylogenetic Analysis using Parsimony (�and othermethods). Sinauer Associates, Sunderland, Massachusetts.
Triplett, J.K., Clark, L.G., 2010. Phylogeny of the temperate woody bamboos(Poaceae: Bambusoideae) with an emphasis on Arundinaria and allies. Syst.Bot. 35, 102–120.
Watanabe, M., Ito, M., Kurita, S., 1994. Chloroplast DNA phylogeny of Asianbamboos (Bambusoideae, Poaceae) and its systematic implication. J. Plant Res.107, 253–261.
Wu, Z.-Q., Ge, S., 2012. The phylogeny of the BEP clade in grasses revisited: evidencefrom the whole-genome sequences of chloroplasts. Mol. Phylogenet. Evol. 62,573–578.
Yang, H.-Q., Peng, S., Li, D.-Z., 2007. Generic delimitations of Schizostachyum and itsallies (Gramineae: Bambusoideae) inferred from GBSSI and trnL-F sequencephylogenies. Taxon 56, 45–54.
Zhang, W.P., Clark, L.G., 2000. Phylogeny and classification of the Bambusoideae(Poaceae). In: Jacobs, S.W.L., Everett, J. (Eds.), Grasses: Systematics andEvolution. CSIRO, Melbourne, Australia, pp. 35–42.
Zhang, Y.-J., Ma, P.-F., Li, D.-Z., 2011. High-throughput sequencing of six bamboochloroplast genomes: phylogenetic implications for temperate woody bamboos(Poaceae: Bambusoideae). PLoS ONE 6, e20596.
Zheng, C.-Z., Zhang, Y.-X., Triplett, J.K., Yang, J.-B., Li, D.-Z., 2010. Large multi-locusplastid phylogeny of the tribe Arundinarieae (Poaceae: Bambusoideae) revealsten major lineages and low rate of molecular divergence. Mol. Phylogenet. Evol.56, 821–839.

Supplemental Data for Bamboo Phylogeny Group, prepared by Scot A. Kelchner
1
Sampling: GenBank Accession Information Taxon ndhF rpl16 intron rps16 intron trnD-trnT trnT-trnL Ampelocalamus scandens KC020491 KC020510 KC020565 FJ643977 FJ644128 Apoclada simplex KC020492 KC020511 KC020566 KC020530 KC020545 Arundinaria gigantea FJ643707 KC020512* KC020567 FJ643980 FJ644131 Atractantha radiata KC020493 AY912190 KC020568 KC020531 KC117174 Bambusa vulgaris FJ643709 AY912192 KC020569 FJ643982 FJ644133 Brachyelytrum erectum U22005 KC020513 KC020570 FJ643985 FJ644136 Buergersiochloa bambusoides KC020494 AF133461 KC020571 FJ643988 FJ644139 Cephalostachyum pergracile KC020495 AY912199 KC020572 KC020532 KC020547 Chimonobambusa marmorea FJ643711 KC117173 KC020573 FJ643989 FJ644140 Chimonocalamus pallens KC020496 KC020514 KC020574 FJ643994 FJ644145 Chusquea bambusoides FJ751649 AY912194 KC020575 FJ751742 KC020548 Chusquea elata (Neurolepis elata) FJ643716 FJ751668 KC020576 FJ644015 FJ644166 Chusquea scandens FJ751643 U62781 KC020577 FJ751736 KC020549 Chusquea spectabilis (Neurolepis aperta) AF182355 U62793 KC020578 FJ751752 KC020550 Cyrtochloa luzonica KC020497 KC020515 KC020579 KC020533 KC020551 Diarrhena obovata U21999 KC020516 KC020580 FJ643995 FJ644146 Ehrharta dura KC020498 KC020517 KC020581 KC020534 KC020552 Glaziophyton mirabile KC020499 U54748 KC020582 KC020535 KC020553 Guadua angustifolia FJ643714 AY912198 KC020583 FJ644003 FJ644154 Hickelia madagascariensis AF182351 AY912206 KC020584 KC020536 KC020554 Melocanna baccifera AF182348 KC020518 KC020585 KC020537 KC020555 Nastus borbonicus KC020500 AY912207 KC020586 KC020538 KC020556 Neololeba atra KC020501 KC020519 KC020587 KC020539 KC020557 Olyra latifolia KC020502 KC020520 KC020588 KC020540 KC020558 Oryza sativa NC001320 NC001320 NC001320 NC001320 NC001320 Otatea acuminata AF182350 U54749 KC020589 FJ751732 KC020559 Oxytenanthera abyssinica KC020503 AY912193 KC020590 KC020541 KC020560 Pariana radiciflora KC020504 U54740 KC020591 FJ644017 FJ644168 Pharus latifolius U21993 KC020521 KC020592 FJ644018 FJ644169 Phyllostachys bambusoides KC020505 KC020522 KC020593 FJ644020 FJ644171 Pleioblastus argenteostriatus FJ643718 KC020523 KC020594 FJ644023 FJ644174 Racemobambos hepburnii KC020506 KC020524 KC020595 KC020542 KC020561 Rhipidocladum pittieri FJ751639 KC020525 KC020596 FJ751731 KC020562 Sasa veitchii FJ643724 KC020526 KC020597 FJ644048 FJ644199 Shibataea kumasaca FJ643727 KC020527 KC020598 FJ644057 FJ644208 Streptogyna americana U21965 AY847115 KC020599 FJ644060 FJ644211 Sucrea maculata KC020507 U54741 KC020600 FJ644061 FJ644212 Temochloa liliana KC020508 KC020528 KC020601 KC020543 KC020563 Thamnocalamus spathiflorus KC020509 KC020529 KC020602 KC020544 KC020564 Triticum aestivum NC002762 NC002762 none NC002762 NC002762 * The BPG1 sequence is longer than the sequence listed in GenBank (FJ751663); cross-reference the GenBank accession as a subset of BPG1 sequence. PREPARED BY AMANDA FISHER

Supplemental Data for Bamboo Phylogeny Group, prepared by Scot A. Kelchner
2
Chloroplast DNA Sequence Data
Characteristics of each data set ndhF rpl16 intron rps16 introna trnD-trnT trnT-trnL Combinedb
alignment length 2120 1364 1006 1465 1066 6657 variable characters 483 325 180 354 248 1529 potentially informative sites 211 127 67 151 106 631 potentially informative indels 2 13 3 9 10 37 number of PICsc (total) 213 140 70 160 116 668 % informative characters 10.05 10.26 6.96 10.92 10.88 10.03 ratio informative/variable 0.44099 0.43077 0.38889 0.45198 0.46774 0.43689 lowest uncorrect p-distance 0.00048 0.00000 0.00000 0.00086 0.00128 0.00035 highest uncorrected p-distance 0.07712 0.09176 0.08253 0.10670 0.12097 0.08251 %A (mean) 26.994 41.002 36.467 32.835 39.429 33.228 %C (mean) 16.556 13.314 14.977 18.136 10.836 15.601 %G (mean) 17.877 16.805 18.676 17.766 15.950 17.562 %T (mean) 38.563 28.878 29.880 31.263 33.759 33.610 arps16 intron alignment contains only 39 taxa (Triticum aestivum is missing data) balignment with ambiguous regions removed cPIC=potentially informative characters, total (nucleotides plus indels)
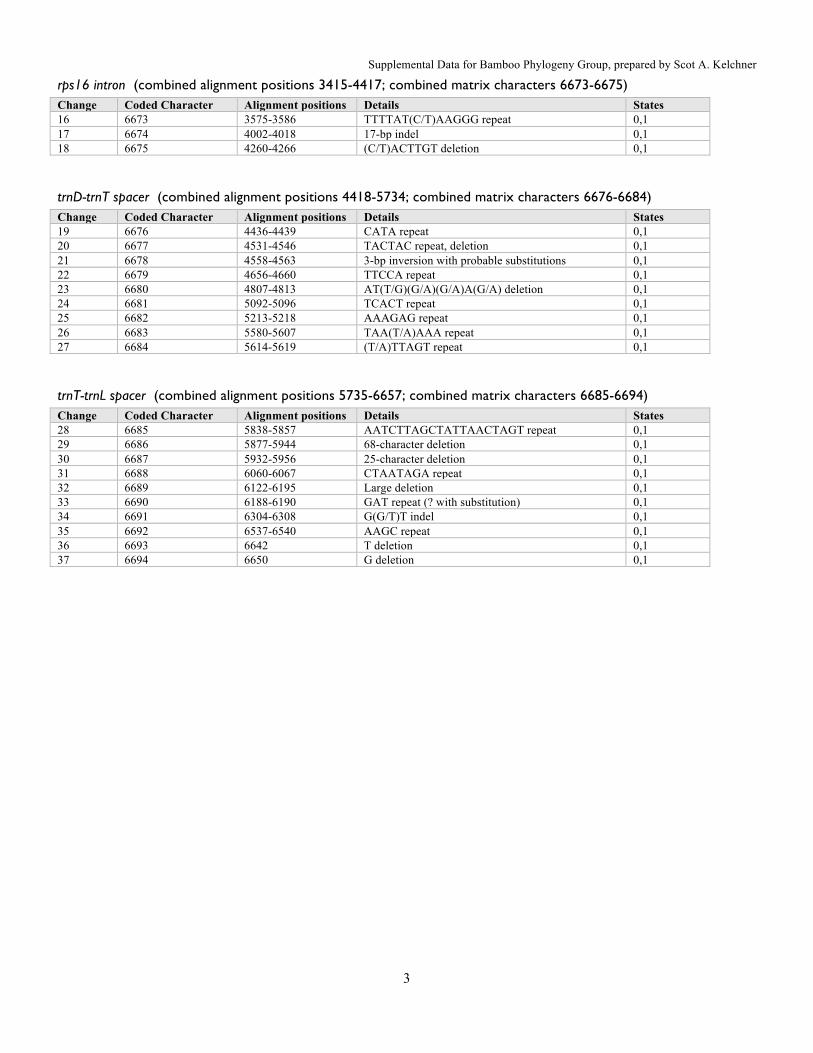
Coding of Microstructural ChangesMicrostructural characters were defined and coded using the criteria outlined in Kelchner (2000) with reference to Lohne and Borsch (2005) and Graham et al. (2000). Gaps were positioned to minimize the number of inferred length mutations and conserved secondary structure was used when appropriate (particularly for the rpl16 intron and rps16 intron). Probable mechanisms of mutation followed Kelchner (2000) and included minute inversions and repeat motifs related to slipped-strand mispairing (SSM). Microstructural changes involving mono-nucleotide repeats of 4 or more sites were left uncoded due to high rates of SSM in such regions. Missing data is treated as ‘-’ in the alignment file, which bears relevance to the scoring of unambiguous indel characters: for example, missing data at the beginning and end of a region appears as ‘---’ in the alignment, but is in actuality ‘???’. Hence, indels were not scored in such areas. All states are unordered (i.e., non-directional); estimated deletions and insertions were determined using the final rooted topology.
ndhF (combined alignment positions 1-2120; combined matrix characters 6658-6659) Change Coded Character Alignment positions Details States 1 6658 778-780 AAC 0,1 2 6659 1928-1933 3-bp inversion with multiple substitutions 0,1
rpl16 intron (combined alignment positions 2121-3414; combined matrix characters 6660-6672) Change Coded Character Alignment positions Details States 3 6660 2178-2186 GAAAAAA(AA) of various length 0,1 4 6661 2270-2274 AA(T)AA deletion 0,1 5 6662 2272 T deletion 0,1 6 6663 2584-2598 ATCGTAACTTG deletion 0,1 7 6664 2592-2595 Inserted repeat with substitutions 0,1 8 6665 2626-2630 AATAA repeat 0,1 9 6666 2851-2855 TATAA repeat 0,1 10 6667 2910-2941 ATTGAATTAGAATACTTTCCCGC deletion 0,1 11 6668 2982-2987 AAA(T)AA insertion, w/ T deletion 0,1 12 6669 3006-3011 TAT(C/A)TA deletion 0,1 13 6670 3022-3028 ATATAGA repeat, deletion 0,1 14 6671 3205 T deletion 0,1 15 6672 3264-3271 4-bp inversion with probable substitutions 0,1
Supplemental Data for Bamboo Phylogeny Group, prepared by Scot A. Kelchner
3
rps16 intron (combined alignment positions 3415-4417; combined matrix characters 6673-6675) Change Coded Character Alignment positions Details States 16 6673 3575-3586 TTTTAT(C/T)AAGGG repeat 0,1 17 6674 4002-4018 17-bp indel 0,1 18 6675 4260-4266 (C/T)ACTTGT deletion 0,1
trnD-trnT spacer (combined alignment positions 4418-5734; combined matrix characters 6676-6684) Change Coded Character Alignment positions Details States 19 6676 4436-4439 CATA repeat 0,1 20 6677 4531-4546 TACTAC repeat, deletion 0,1 21 6678 4558-4563 3-bp inversion with probable substitutions 0,1 22 6679 4656-4660 TTCCA repeat 0,1 23 6680 4807-4813 AT(T/G)(G/A)(G/A)A(G/A) deletion 0,1 24 6681 5092-5096 TCACT repeat 0,1 25 6682 5213-5218 AAAGAG repeat 0,1 26 6683 5580-5607 TAA(T/A)AAA repeat 0,1 27 6684 5614-5619 (T/A)TTAGT repeat 0,1
trnT-trnL spacer (combined alignment positions 5735-6657; combined matrix characters 6685-6694) Change Coded Character Alignment positions Details States 28 6685 5838-5857 AATCTTAGCTATTAACTAGT repeat 0,1 29 6686 5877-5944 68-character deletion 0,1 30 6687 5932-5956 25-character deletion 0,1 31 6688 6060-6067 CTAATAGA repeat 0,1 32 6689 6122-6195 Large deletion 0,1 33 6690 6188-6190 GAT repeat (? with substitution) 0,1 34 6691 6304-6308 G(G/T)T indel 0,1 35 6692 6537-6540 AAGC repeat 0,1 36 6693 6642 T deletion 0,1 37 6694 6650 G deletion 0,1

Supp
lem
enta
l Dat
a fo
r Bam
boo
Phyl
ogen
y G
roup
, pre
pare
d by
Sco
t A. K
elch
ner
4
Cod
ed M
icro
stru
ctur
al C
hara
cter
s T
able
(ch
arac
ters
665
8–66
94)
Cha
ract
er N
umbe
rsa
1
2
3
4
5
6
7
8
9
10
11
12
13
14
15
16
17
18
19
20
21
22
23
24
25
26
27
28
29
30
31
32
33
34
35
36
37
Am
pelo
cala
mus
sca
nden
s 0
0 0
0 0
0 0
1 0
0 0
0 0
0 1
0 0
0 0
0 0
1 0
1 0
1 0
0 0
0 0
0 1
1 0
0 0
Apo
clad
a si
mpl
ex
1 0
1 0
0 0
0 0
1 0
0 0
0 0
0 0
1 0
0 1
0 0
0 0
0 1
1 1
1 0
0 0
0 1
0 1
0 A
rund
inar
ia g
igan
tea
0 0
0 0
0 0
0 1
0 0
0 0
0 0
1 0
0 0
0 0
0 1
0 1
0 1
0 0
0 0
0 0
1 1
0 0
0 A
tract
anth
a ra
diat
a 0
0 0
0 0
0 0
0 1
0 0
0 0
0 0
0 1
0 0
0 0
0 0
0 1
1 0
1 1
0 0
0 0
1 0
0 0
Bam
busa
vul
garis
0
0 0
1 ?
0 0
0 1
0 0
0 0
0 0
0 1
0 0
0 0
0 0
0 0
1 0
0 0
0 0
0 0
1 0
0 0
Bra
chye
lytru
m e
rect
um
0 0
0 0
0 0
0 0
0 0
0 0
0 0
0 0
0 1
0 0
1 0
0 0
0 0
0 0
0 0
0 0
0 0
1 0
0 B
uerg
ersi
ochl
oa b
ambu
soid
es
1 0
0 0
0 0
0 0
0 0
0 0
0 0
0 0
1 0
1 0
1 0
0 0
0 1
0 0
0 0
0 1
0 1
0 0
0 C
epha
lost
achy
um p
ergr
acile
1
0 0
0 0
0 0
0 1
0 0
0 0
0 0
0 1
0 0
0 0
0 0
0 0
1 0
1 0
0 0
0 0
1 1
0 0
Chi
mon
obam
busa
mar
mor
ea
0 0
0 0
0 0
0 1
0 0
0 0
0 0
1 0
0 0
0 0
0 1
0 1
0 1
0 0
0 0
0 0
1 1
0 0
0 C
him
onoc
alam
us p
alle
ns
0 0
0 0
0 0
0 1
0 0
0 0
0 0
1 0
0 0
0 0
0 1
0 1
0 1
0 0
0 0
0 0
1 1
0 0
0 C
husq
uea
bam
buso
ides
0
1 0
0 0
1 0
0 1
1 0
1 0
0 ?
0 1
0 0
0 0
0 0
0 0
? 0
0 0
1 0
0 0
1 0
0 0
Chu
sque
a sc
ande
ns
0 1
0 0
0 1
0 0
1 1
0 0
0 0
0 0
1 0
0 0
0 0
0 0
0 ?
0 ?
? ?
0 0
0 1
0 0
0 C
yrto
chlo
a lu
zoni
ca
1 0
0 0
0 0
0 0
1 0
0 0
0 1
0 0
1 0
? 0
0 0
0 0
0 1
0 0
0 0
0 0
0 1
0 0
0 D
iarr
hena
obo
vata
0
0 0
0 0
0 0
0 0
0 0
0 0
0 0
0 0
1 0
0 0
0 0
0 0
0 0
0 0
0 0
0 0
0 1
0 0
Ehr
harta
dur
a 0
0 0
0 0
0 1
0 ?
0 1
0 0
0 0
0 0
0 ?
0 1
0 0
0 0
? 0
0 0
? ?
? ?
? 0
0 0
Gla
ziop
hyto
n m
irabi
le
1 0
0 0
0 0
0 0
1 0
0 0
0 1
0 0
1 0
? 0
0 0
0 0
1 1
0 1
1 0
0 0
0 0
0 0
0 G
uadu
a an
gust
ifolia
0
0 ?
0 0
0 0
0 1
0 0
0 0
0 0
0 1
0 0
1 0
0 0
0 0
1 0
1 1
0 0
0 0
1 0
0 0
Hic
kelia
mad
agas
carie
nsis
0
0 1
0 0
0 0
0 1
0 0
0 0
0 0
0 1
0 ?
0 0
0 0
0 0
1 0
0 0
0 ?
? ?
? 0
0 1
Mel
ocan
na b
acci
fera
?
0 0
0 0
0 0
0 1
0 0
0 0
0 0
0 1
0 0
0 0
0 1
0 0
1 0
1 0
0 0
0 0
1 0
0 0
Nas
tus
borb
onic
us
0 0
1 0
0 0
0 0
1 0
0 0
0 0
0 0
1 0
0 0
0 0
0 0
0 1
0 0
0 0
0 0
0 0
0 0
1 N
eolo
leba
atra
0
0 0
0 0
0 0
0 1
0 0
0 0
0 0
0 1
0 0
0 0
0 0
0 0
1 0
0 0
0 0
0 0
? 0
0 0
Chu
sque
a sp
ecta
bilis
?
0 0
0 0
1 0
0 1
1 0
0 0
0 0
0 1
0 0
0 0
0 1
0 0
? 0
1 0
1 0
0 0
0 0
0 0
Chu
sque
a el
ata
0 0
0 0
0 1
0 0
1 1
0 0
0 0
0 0
1 0
0 0
0 0
1 0
0 ?
0 0
0 1
0 0
0 1
0 ?
? O
lyra
latif
olia
0
1 0
0 1
0 0
0 0
0 0
0 0
0 0
1 1
0 1
0 1
0 0
0 0
1 0
0 0
0 0
1 0
1 0
0 0
Ory
za s
ativ
a 0
0 ?
0 0
0 1
0 0
0 1
1 0
? 0
0 0
? 0
0 0
0 0
0 0
0 0
0 0
? ?
0 0
1 0
0 0
Ota
tea
acum
inat
a 1
0 1
0 0
0 0
0 1
0 0
0 0
0 0
0 1
0 0
0 0
0 0
0 0
1 0
1 1
? 0
0 0
1 0
0 0
Oxy
tena
nthe
ra a
byss
inic
a 0
0 0
1 ?
0 0
0 1
0 0
0 0
0 0
0 1
0 0
0 0
0 0
0 0
1 0
0 0
0 0
0 0
1 0
0 0
Par
iana
radi
ciflo
ra
1 1
0 0
1 0
0 0
0 0
0 0
0 0
0 1
1 0
1 0
1 0
0 0
0 1
1 0
0 0
1 1
0 1
0 0
0 P
haru
s la
tifol
ius
1 1
1 0
0 0
0 0
0 0
0 0
1 0
0 0
0 0
0 0
0 0
0 ?
0 0
0 0
0 0
0 0
0 1
0 1
0 P
hyllo
stac
hys
bam
buso
ides
0
0 0
0 0
0 0
1 0
0 0
0 0
0 1
0 0
0 0
0 0
1 0
1 0
1 0
0 0
0 0
0 1
1 0
0 0
Ple
iobl
astu
s ar
gent
eost
riatu
s 0
0 0
0 0
0 0
1 0
0 0
0 0
0 1
0 0
0 0
0 0
1 0
1 0
1 0
0 0
0 0
0 1
1 0
0 0
Rac
emob
ambo
s he
pbur
nii
0 0
0 0
0 0
0 0
1 0
0 0
1 0
1 0
1 0
0 0
0 0
1 0
0 1
0 0
0 0
0 0
0 1
0 0
0 R
hipi
docl
adum
pitt
ieri
0 0
0 0
0 0
0 0
1 0
0 ?
0 0
0 0
1 0
? 0
0 1
0 0
1 1
0 1
1 0
0 0
0 1
0 0
0 S
asa
veitc
hii
0 0
0 0
0 0
0 1
0 0
0 0
0 0
1 0
0 0
0 0
0 1
0 1
0 1
0 0
0 0
0 0
1 1
0 0
0 S
hiba
taea
kum
asac
a 0
0 0
0 0
0 0
1 0
0 0
0 0
0 1
0 0
0 0
0 0
1 0
1 0
1 0
0 0
0 0
0 1
1 0
0 0
Stre
ptog
yna
amer
ican
a 0
0 0
0 0
0 0
0 0
0 0
0 0
0 0
0 0
0 ?
0 0
0 0
0 0
0 0
0 0
0 1
0 0
1 0
0 0
Suc
rea
mac
ulat
a 0
1 0
0 1
0 0
0 0
0 0
0 1
1 0
1 1
0 1
0 1
0 0
0 0
0 0
0 0
0 0
1 0
1 0
0 0
Tem
ochl
oa li
liana
0
0 0
1 ?
0 0
0 1
0 0
0 0
0 0
0 1
0 0
0 0
0 0
0 0
1 0
0 0
0 0
0 0
1 0
0 0
Tham
noca
lam
us s
path
iflor
us
0 0
0 0
0 0
0 1
0 0
0 0
0 0
1 0
0 0
0 0
0 1
0 1
0 1
0 0
0 0
0 0
1 1
0 0
0 Tr
iticu
m a
estiv
um
0 0
0 0
0 0
0 0
0 0
0 0
0 0
0 ?
? ?
0 0
0 0
0 0
0 0
0 0
0 0
0 ?
? ?
1 0
0
Nex
us fi
le c
hara
cter
6658
6659
6660
6661
6662
6663
6664
6665
6666
6667
6668
6669
6670
6671
6672
6673
6674
6675
6676
6677
6678
6679
6680
6681
6682
6683
6684
6685
6686
6687
6688
6689
6690
6691
6692
6693
6694
a ndhF
(1-2
); rp
l16
intro
n (3
-15)
; rps
16 in
tron
(16-
18);
trnD
-trnT
(19-
27);
trnT
-trnL
(28-
37)

Supplemental Data for Bamboo Phylogeny Group, prepared by Scot A. Kelchner
5
Models
ModelTest Results Each locus alignment was assessed for model fit using the program ModelTest (Posada & Crandall, 1998). Both the hierarchical likelihood ratio test (hLRT) and Akaike Information Criterion (AIC) methods were investigated. AIC differences of Δ ≤ 2 were considered substantial evidence of model fit, following Posada & Buckley (2004) and Kelchner (2009). Pertinent information on model fit is listed below. The model used in PhyML and PAUP* analyses is in bold. NDHF hlrt: TVM+I+G Model -lnL K AIC delta weight cumWeight
TVM+I+G 7644.3096 9 15306.6191 0.0000 0.5811 0.5811 GTR+I+G 7643.6460 10 15307.2920 0.6729 0.4151 0.9962 RPL16 INTRON hlrt: TVM+G Model -lnL K AIC delta weight cumWeight
GTR+G 4725.3506 9 9468.7012 0.0000 0.4123 0.4123 TVM+G 4726.9355 8 9469.8711 1.1699 0.2297 0.6420 GTR+I+G 4725.0625 10 9470.1250 1.4238 0.2023 0.8443 RPS16 INTRON hlrt: TVM+G Model -lnL K AIC delta weight cumWeight
GTR+I+G 3028.8376 10 6077.6753 0.0000 0.4664 0.4664 GTR+G 3030.8130 9 6079.6260 1.9507 0.1759 0.6423 TRNDT SPACER hlrt: TVM+G Model -lnL K AIC delta weight cumWeight
TVM+G 5282.4482 8 10580.8965 0.0000 0.5067 0.5067 TVM+I+G 5282.2773 9 10582.5547 1.6582 0.2212 0.7279 GTR+G 5282.4341 9 10582.8682 1.9717 0.1891 0.9170 TRNTL SPACER hlrt: TVM+G Model -lnL K AIC delta weight cumWeight
TVM+G 3671.8140 8 7359.6279 0.0000 0.4131 0.4131 GTR+G 3671.1108 9 7360.2217 0.5938 0.3070 0.7202 TVM+I+G 3671.7556 9 7361.5112 1.8833 0.1611 0.8813 COMBINED hlrt: TVM+I+G Model -lnL K AIC delta weight cumWeight
GTR+I+G 23459.1445 10 46938.2891 0.0000 0.6958 0.6958 TVM+I+G 23460.9805 9 46939.9609 1.6719 0.3016 0.9974

Supplemental Data for Bamboo Phylogeny Group, prepared by Scot A. Kelchner
6
SH Tests SH tests were performed to assess alternative hypotheses of relationships. Each test was conducted between two tree topologies and repeated for three models that cover the range of model diversity commonly used in phylogenetics. All unconstrained trees were first generated with PHYML or PAUP* using the model specified in the table (all parameter values estimated during analysis), then brought into PAUP* for SH testing (RELL with 10,000 replicates and attained significance of p=0.05). ‘Alternative hypotheses’ were the maximized likelihood estimate (MLE) for a pre-defined topology constraint in PAUP* (in which case model parameter values for the unconstrained topology were used in the tree search for the constraint MLE), or the notably incongruent topology derived from individual data set comparisons with the combined nucleotide MLE tree. Hypothesis tested SH result
(JC model) SH result (HKY+G)
SH result (GTR+I+G)
1. Bambuseae (woody bamboos) are monophyletic p = 0.112 p = 0.124 p = 0.149 2. Rpl16 intron data has incongruent signal p = 0.111 p = 0.117 p = 0.125 3. Ehrhartoideae is sister to Bambusoideae p = 0.393 p = 0.368 p = 0.422 4. Chusqueinae sister to monophyletic remainder of tropical woody p = 0.202 p = 0.248 p = 0.224
Long Branch Attraction Taxon removal was performed to see if ingroup relationships or outgroup rooting altered. All analyses were performed with maximum likelihood analysis and the GTR+I+G model for combined nucleotide data. Taxon or taxa removed Result to topology
1. Herbaceous bamboo clade removed (4 taxa) No change to ingroup or outgroup relationships 2. All outgroups removed except Streptogyna (6 taxa) No change to ingroup or outgroup relationships 3. Pooideae removed (3 taxa) No change to ingroup or outgroup relationships 4. Triticum removed (1 taxon) No change to ingroup or outgroup relationships 5. Erhartoideae removed (2 taxa) No change to ingroup or outgroup relationships 6. Oryza removed (1 taxon) No change to ingroup or outgroup relationships 7. Chusqueinae removed (4 taxa) No change to ingroup or outgroup relationships 8. Streptogyna americana removed (1 taxon) No change to ingroup or outgroup relationships
Saturation Plot A plot was made to survey for saturation at sites in the combined nucleotide character matrix. Uncorrected pairwise distances (y axis) were plotted against model-corrected pairwise distances (x axis) following Philippe et al. (1994). Deviation from the line is observed, but no “plateau” that would indicate high levels of site saturation.

Supplemental Data for Bamboo Phylogeny Group, prepared by Scot A. Kelchner
7
Phylogeny Estimations
ndhF nucleotides Topology showing maximum likelihood nonparametric bootstrap values based on 1,000 pseudoreplicate ML analyses using the GTR+I+G model with all parameters estimated in the program PhyML. Branches with less than 50% bootstrap support are collapsed.
Oxytenanthera*abyssinicaBambusa*vulgaris
65
Temochloa*liliana95
Racemobambos*hepburniiNeololeba*atraCyrtochloa*luzonica
60
Melocanna*bacciferaCephalostachyum*pergracile
72
Nastus*borbonicusHickelia*madagascariensis
93
80
Atractantha*radiataGlaziophyton*mirabileRhipidocladum*pittieri
86
Guadua*angustifoliaApoclada*simplex
55
Otatea*acuminata98
99
Chusquea*scandensChusquea*bambusoides
59
Chusquea*elata78
Chusquea*spectabilis
68
55
Sucrea*maculataOlyra*latifolia
100
Pariana*radiciflora90
Buergersiochloa*bambusoides
100
Shibataea*kumasacaChimonocalamus*pallens
72
Pleioblastus*argenteostriatusArundinaria*giganteaSasa*veitchiiPhyllostachys*bambusoidesThamnocalamus*spathiflorusChimonobambusa*marmorea
58
Ampelocalamus*scandens
95
99
100
Triticum*aestivumDiarrhena*obovataBrachyelytrum*erectum
10086
Oryza*sativaEhrharta*dura
97
Streptogyna*americana58
61
Pharus*latifolius

Supplemental Data for Bamboo Phylogeny Group, prepared by Scot A. Kelchner
8
rpl16 intron nucleotides Topology showing maximum likelihood nonparametric bootstrap values based on 1,000 pseudoreplicate ML analyses using the GTR+G model with all parameters estimated in the program PhyML. Branches with less than 50% bootstrap support are collapsed. Gray branches indicate those that are incongruent with the combined nucleotide phylogeny estimation. Oxytenanthera*abyssinica*
Bambusa*vulgaris72
Temochloa*liliana
70
Racemobambos*hepburniiNeololeba*atraCyrtochloa*luzonica
98
Nastus*borbonicusHickelia*madagascariensis
96
73
Melocanna*bacciferaCephalostachyum*pergracile
60
77
Chusquea*scandensChusquea*bambusoides
83
Chusquea*elata
90
Rhipidocladum*pittieriGlaziophyton*mirabile
80
Atractantha*radiata
70
Guadua*angustifoliaApoclada*simplex
78
Otatea*acuminata
79
83
Chusquea*spectabilisPhyllostachys*bambusoidesChimonobambusa*marmorea
99
Thamnocalamus*spathiflorus
63
Ampelocalamus*scandens
62
Shibataea*kumasacaPleioblastus*argenteostriatusArundinaria*giganteaSasa*veitchii
55
Chimonocalamus*pallens
100
Sucrea*maculataOlyra*latifoliaPariana*radiciflora
100
Buergersiochloa*bambusoides
9692
Oryza*sativaEhrharta*dura
70
Streptogyna*americana
92
76
Triticum*aestivumDiarrhena*obovata
99
Brachyelytrum*erectum
79
69
Pharus*latifolius

Supplemental Data for Bamboo Phylogeny Group, prepared by Scot A. Kelchner
9
rps16 intron nucleotides Topology showing maximum likelihood nonparametric bootstrap values based on 1,000 pseudoreplicate ML analyses using the GTR+G model with all parameters estimated in the program PhyML. Branches with less than 50% bootstrap support are collapsed. Gray branches indicate those that are incongruent with the combined nucleotide phylogeny estimation. Neololeba'atra
Cyrtochloa'luzonica64
Bambusa'vulgarisOxytenanthera'abyssinica
61
Temochloa'lilianaHickelia'madagascariensisRacemobambos'hepburniiMelocanna'bacciferaCephalostachym'pergracile
79
Chusquea'elataChusquea'scandens
69
Chusquea'bambusoides
55
Chusquea'spectabilis
75
Nastus'borbonicusGuadua'angustifoliaApoclada'simplex
93
Otatea'acuminata
61
Glaziophyton'mirabileAtractantha'radiata
62
Rhipidocladum'pittieri
78
55
Sucrea'maculataOlyra'latifoliaPariana'radiciflora
90
Buergersiochloa'bambusoides
9098
Phyllostachys'bambusoidesThamnocalamus'spathiflorusAmpelocalamus'scandens
65
Chimonobambusa'marmorea
67
Shibataea'kumasacaPleioblastus'argenteostriatus
64
Arundinaria'giganteaChimonocalamus'pallens
58
Sasa'veitchii
97
95
Diarrhena'obovataBrachyelytrum'erectum
70
Oryza'sativaEhrharta'dura
56
Streptogyna'americana
56
Pharus'latifolius
87

Supplemental Data for Bamboo Phylogeny Group, prepared by Scot A. Kelchner
10
trnD-trnT nucleotides Topology showing maximum likelihood nonparametric bootstrap values based on 1,000 pseudoreplicate ML analyses using the GTR+G model with all parameters estimated in the program PhyML. Branches with less than 50% bootstrap support are collapsed. Gray branches indicate those that are incongruent with the combined nucleotide phylogeny estimation.
Nastus&borbonicusHickelia&madagascariensis
54
Racemobambos&hepburniiOxytenanthera&abyssinicaBambusa&vulgaris
76
Temochloa&liliana
88
Neololeba&atraCyrtochloa&luzonica
67
80
Melocanna&bacciferaCephalostachyum&pergracile
75
83
Guadua&angustifoliaApoclada&simplex
65
Otatea&acuminata
65
Rhipidocladum&pittieriAtractantha&radiata
61
Glaziophyton&mirabile
74
Chusquea&elataChusquea&bambusoides
64
Chusquea&scandens
75
Chusquea&spectabilis
86
Sucrea&maculataOlyra&latifolia
99
Pariana&radiciflora
86
Buergersiochloa&bambusoides
100
90
Pleioblastus&argenteostriatusArundinaria&gigantea
74
Sasa&veitchii
88
Shibataea&kumasacaPhyllostachys&bambusoidesChimonobambusa&marmoreaThamnocalamus&spathiflorusAmpelocalamus&scandens
64
Chimonocalamus&pallens
100
85
Triticum&aestivumDiarrhena&obovataBrachyelytrum&erectum
10090
Oryza&sativaEhrharta&dura
82
Streptogyna&americana
78
51
Pharus&latifolius

Supplemental Data for Bamboo Phylogeny Group, prepared by Scot A. Kelchner
11
trnT-trnL nucleotides Topology showing maximum likelihood nonparametric bootstrap values based on 1,000 pseudoreplicate ML analyses using the GTR+G model with all parameters estimated in the program PhyML. Branches with less than 50% bootstrap support are collapsed. Gray branches indicate those that are incongruent with the combined nucleotide phylogeny estimation.
Otatea%acuminataGlaziophyton%mirabileAtractantha%radiataRhipidocladum%pittieriChusquea%spectabilisGuadua%angustifoliaApoclada%simplexChusquea%scandensChusquea%bambusoides
64
Chusquea%elata
93
Neololeba%atraCyrtochloa%luzonica
94
Nastus%borbonicusHickelia%madagascariensisTemochloa%lilianaOxytenanthera%abyssinica
63
Bambusa%vulgaris
85
Racemobambos%hepburniiMelocanna%bacciferaCephalostachyum%pergracile
99
Sucrea%maculataOlyra%latifolia
99
Pariana%radiciflora
85
Buergersiochloa%bambusoides
95
61
Thamnocalamus%spathiflorusPhyllostachys%bambusoidesChimonobambusa%marmoreaAmpelocalamus%scandens
51
Shibataea%kumasacaChimonocalamus%pallensSasa%veitchiiArundinaria%giganteaPleioblastus%argenteostriatus
53
99
65
Oryza%sativaEhrharta%dura
67
Streptogyna%americana
58
57
Triticum%aestivumDiarrhena%obovataBrachyelytrum%erectum
10073
Pharus%latifolius

Supplemental Data for Bamboo Phylogeny Group, prepared by Scot A. Kelchner
12
Microstructural Characters Maximum Parsimony analysis of 37 scored, informative microstructural characters. Strict consensus of 641 MP trees is shown.
Apoclada simplex
Guadua angustifolia
Otatea acuminata
Atractantha radiata
Rhipidocladum pittieri
Glaziophyton mirabile
Bambusa vulgaris
Oxytenanthera abyssinica
Temochloa liliana
Brachyelytrum erectum
Diarrhena obovata
Triticum aestivum
Buergersiochloa bambusoides
Olyra latifolia
Pariana radiciflora
Sucrea maculata
Cephalostachyum pergracile
Chusquea bambusoides
Chusquea scandens
Chusquea elata
Chusquea spectabilis
Cyrtochloa luzonica
Ehrharta dura
Oryza sativa
Hickelia madagascariensis
Nastus borbonicus
Melocanna baccifera
Neololeba atra
Racemobambos hepburnii
Streptogyna americana
Ampelocalamus scandens
Arundinaria gigantea
Chimonobambusa marmorea
Chimonocalamus pallens
Phyllostachys bambusoides
Pleioblastus argenteostriatus
Sasa veitchii
Shibataea kumasaca
Thamnocalamus spathiflorus
Pharus latifolius

Supplemental Data for Bamboo Phylogeny Group, prepared by Scot A. Kelchner
13
Constraint MLE Topology: Monophyletic Bambuseae Maximum likelihood estimate (MLE) of combined nucleotide data given the topological constraint of monophyly for Bambuseae (woody bamboos). Optimization was performed with PAUP* using the GTR+I+G model with parameter values with parameter values derived from the unconstrained combined analysis.
Bambusa'vulgarisOxytenanthera'abyssinicaTemochloa'lilianaRacemobambos'hepburniiHickelia'madagascariensisNastus'borbonicusCyrtochloa'luzonicaNeololeba'atraCephalostachyum'pergracileMelocanna'bacciferaApoclada'simplexGuadua'angustifoliaOtatea'acuminataAtractantha'radiataGlaziophyton'mirabileRhipidocladum'pittieriChusquea'bambusoidesChusquea'scandensChusquea'elataChusquea'spectabilisArundinaria'giganteaPleioblastus'argenteostriatusSasa'veitchiiChimonocalamus'pallensShibataea'kumasacaChimonobambusa'marmoreaPhyllostachys'bambusoidesThamnocalamus'spathiflorusAmpelocalamus'scandensOlyra'latifoliaSucrea'maculataPariana'radicifloraBuergersiochloa'bambusoidesDiarrhena'obovataTriticum'aestivumBrachyelytrum'erectumEhrharta'duraOryza'sativaStreptogyna'americanaPharus'latifolius
Forced'constraint

Supplemental Data for Bamboo Phylogeny Group, prepared by Scot A. Kelchner
14
Constraint MLE Topology: Ehrhartoideae sister to Bambusoideae Maximum likelihood estimate (MLE) of combined nucleotide data given the topological constraint of monophyly for Bambuseae/Ehrhartoideae. Optimization was performed with PAUP* using the GTR+I+G model with parameter values derived from the unconstrained combined analysis. Bambusa'vulgaris
Oxytenanthera'abyssinicaTemochloa'liliana'Racemobambos'hepburniiHickelia'madagascariensisNastus'borbonicusCyrtochloa'luzonicaNeololeba'atraCephalostachyum'pergracileMelocanna'bacciferaApoclada'simplexGuadua'angustifoliaOtatea'acuminataAtractantha'radiataGlaziophyton'mirabileRhipidocladum'pittieriChusquea'bambusoidesChusquea'scandensChusquea'elataChusquea'spectabilisOlyra'latifoliaSucrea'maculataPariana'radicifloraBuergersiochloa'bambusoidesArundinaria'giganteaPleioblastus'argenteostriatusSasa'veitchiiChimonocalamus'pallensShibataea'kumasacaChimonobambusa'marmoreaPhyllostachys'bambusoidesThamnocalamus'spathiflorusAmpelocalamus'scandensEhrharta'duraOryza'sativaStreptogyna'americanaDiarrhena'obovataTriticum'aestivumBrachyelytrum'erectumPharus'latifolius
Forced'Constraint

Supplemental Data for Bamboo Phylogeny Group, prepared by Scot A. Kelchner
15
Constraint MLE Topology: Chusqueinae sister to monophyletic remainder of tropical woody bamboos Maximum likelihood estimate (MLE) of combined nucleotide data given the topological constraint of monophyletic Chusqueinae as sister to clade containing remainder of tropical woody bamboo taxa. Optimization was performed with PAUP* using the GTR+I+G model with parameter values with parameter values derived from the unconstrained combined analysis. Forced constraints are indicated by shaded boxes.

Supplemental Data for Bamboo Phylogeny Group, prepared by Scot A. Kelchner
16
Literature Cited Graham SW, Reeves PA, Burns ACE, Olmstead RG (2000) Microstructural changes in noncoding chloroplast DNA:
interpretation, evolution, and utility of indels and inversions in basal angiosperm phylogenetic inference. International Journal of Plant Sciences (Supplement) 6:S83-S96.
Huson DH, Bryant D (2006) Application of phylogenetic networks in evolutionary studies. Molecular Biology and
Evolution 23:254-267. Kelchner SA (2000) The evolution of non-coding chloroplast DNA and its application in plant systematics. Annals of
the Missouri Botanical Gardens 87:482-498. Kelchner SA (2009) Phylogenetic models and model selection for noncoding DNA. Plant Systematics and Evolution
282:109-126. Lohne C, Borsch T (2005) Molecular evolution and phylogenetic utility of the petD group II intron: a case study in
basal angiosperms. Molecular Biology and Evolution 22:317-332. Philippe H, Sorhannus U, Baroin A, Perasso R, Gasse F, Adoutte A (1994) Comparison of molecular and
paleontological data in diatoms suggests a major gap in the fossil record. Journal of Evolutionary Biology 7:247-265.
Posada D, Buckley TR (2004) Model selection and model averaging in phylogenetics: advantages of Akaike
Information Criterion and Bayesian approaches over likelihood ratio tests. Systematic Biology 53:793-808. Posada D, Crandall K (1998) ModelTest: testing the model of DNA substitution. Bioinformatics 14:817-818.