High-throughput peptide quantification using mTRAQ reagent triplex
12
RESEARCH Open Access High-throughput peptide quantification using mTRAQ reagent triplex Joo Young Yoon 1 , Jeonghun Yeom 2,3 , Heebum Lee 1 , Kyutae Kim 2 , Seungjin Na 4 , Kunsoo Park 1* , Eunok Paek 4* , Cheolju Lee 2,3* From The Ninth Asia Pacific Bioinformatics Conference (APBC 2011) Inchon, Korea. 11-14 January 2011 Abstract Background: Protein quantification is an essential step in many proteomics experiments. A number of labeling approaches have been proposed and adopted in mass spectrometry (MS) based relative quantification. The mTRAQ, one of the stable isotope labeling methods, is amine-specific and available in triplex format, so that the sample throughput could be doubled when compared with duplex reagents. Methods and results: Here we propose a novel data analysis algorithm for peptide quantification in triplex mTRAQ experiments. It improved the accuracy of quantification in two features. First, it identified and separated triplex isotopic clusters of a peptide in each full MS scan. We designed a schematic model of triplex overlapping isotopic clusters, and separated triplex isotopic clusters by solving cubic equations, which are deduced from the schematic model. Second, it automatically determined the elution areas of peptides. Some peptides have similar atomic masses and elution times, so their elution areas can have overlaps. Our algorithm successfully identified the overlaps and found accurate elution areas. We validated our algorithm using standard protein mixture experiments. Conclusions: We showed that our algorithm was able to accurately quantify peptides in triplex mTRAQ experiments. Its software implementation is compatible with Trans-Proteomic Pipeline (TPP), and thus enables high- throughput analysis of proteomics data. Background Introduction of mass spectrometry (MS) provides mas- sive biological information of proteins for both qualita- tive and quantitative analysis [1]. Recently, quantitative analyses have become of particular interest in proteo- mics research [2]. To determine the expressional differ- ences of proteins across samples representing different physiological or disease states, various experimental approaches have been developed: spectral counting, stable isotope labeling, and label-free quantification [3]. Stable isotope labeling is one of popular methods for protein quantification. Peptides of two or more samples are differently labeled using stable isotopes to introduce mass shifts. Then they are experimented within a single LC/MS run, so that the sample throughput could be mul- tiplied when compared with that of label-free quantifica- tion. There are various labeling techniques: ICAT [4], SILAC [5], 18 O labelling [6], iTRAQ [7], mTRAQ [8], and so on. Numerous computational tools for the stable isotope labeling have also been developed, including XPRESS [9], ASAPRatio [10], STEM [11], ZoomQuant [12], MSInspect [13], Multi-Q [14], Q3 [15], VIPER [16], MaxQuant [17], Census [18], and IEMM [19]. In this paper, we focus on the isotope label mTRAQ, which is a nonisobaric variant of the iTRAQ and was originally designed for multiple reaction monitoring (MRM) [20]. The mTRAQ labels were first designed in two chemically identical versions. The heavy-label is identical to the iTRAQ 117 label and its mass is 145 Da. The light-label is chemically identical to the heavy-label, but it has no 13C or 15N, so its mass is 141 Da. They * Correspondence: [email protected]; [email protected]; [email protected] 1 School of Computer Science and Engineering, Seoul National University, Seoul, 151-742, Korea 2 Life Sciences Division, Korea Institute of Science and Technology, Seoul, 136-791, Korea Full list of author information is available at the end of the article Yoon et al. BMC Bioinformatics 2011, 12(Suppl 1):S46 http://www.biomedcentral.com/1471-2105/12/S1/S46 © 2011 Yoon et al; licensee BioMed Central Ltd. This is an open access article distributed under the terms of the Creative Commons Attribution License (http://creativecommons.org/licenses/by/2.0), which permits unrestricted use, distribution, and reproduction in any medium, provided the original work is properly cited.
-
Upload
independent -
Category
Documents
-
view
2 -
download
0
Transcript of High-throughput peptide quantification using mTRAQ reagent triplex
RESEARCH Open Access
High-throughput peptide quantification usingmTRAQ reagent triplexJoo Young Yoon1, Jeonghun Yeom2,3, Heebum Lee1, Kyutae Kim2, Seungjin Na4, Kunsoo Park1*, Eunok Paek4*,Cheolju Lee2,3*
From The Ninth Asia Pacific Bioinformatics Conference (APBC 2011)Inchon, Korea. 11-14 January 2011
Abstract
Background: Protein quantification is an essential step in many proteomics experiments. A number of labelingapproaches have been proposed and adopted in mass spectrometry (MS) based relative quantification. ThemTRAQ, one of the stable isotope labeling methods, is amine-specific and available in triplex format, so that thesample throughput could be doubled when compared with duplex reagents.
Methods and results: Here we propose a novel data analysis algorithm for peptide quantification in triplexmTRAQ experiments. It improved the accuracy of quantification in two features. First, it identified and separatedtriplex isotopic clusters of a peptide in each full MS scan. We designed a schematic model of triplex overlappingisotopic clusters, and separated triplex isotopic clusters by solving cubic equations, which are deduced from theschematic model. Second, it automatically determined the elution areas of peptides. Some peptides have similaratomic masses and elution times, so their elution areas can have overlaps. Our algorithm successfully identified theoverlaps and found accurate elution areas. We validated our algorithm using standard protein mixture experiments.
Conclusions: We showed that our algorithm was able to accurately quantify peptides in triplex mTRAQexperiments. Its software implementation is compatible with Trans-Proteomic Pipeline (TPP), and thus enables high-throughput analysis of proteomics data.
BackgroundIntroduction of mass spectrometry (MS) provides mas-sive biological information of proteins for both qualita-tive and quantitative analysis [1]. Recently, quantitativeanalyses have become of particular interest in proteo-mics research [2]. To determine the expressional differ-ences of proteins across samples representing differentphysiological or disease states, various experimentalapproaches have been developed: spectral counting,stable isotope labeling, and label-free quantification [3].Stable isotope labeling is one of popular methods for
protein quantification. Peptides of two or more samplesare differently labeled using stable isotopes to introduce
mass shifts. Then they are experimented within a singleLC/MS run, so that the sample throughput could be mul-tiplied when compared with that of label-free quantifica-tion. There are various labeling techniques: ICAT [4],SILAC [5], 18O labelling [6], iTRAQ [7], mTRAQ [8],and so on. Numerous computational tools for the stableisotope labeling have also been developed, includingXPRESS [9], ASAPRatio [10], STEM [11], ZoomQuant[12], MSInspect [13], Multi-Q [14], Q3 [15], VIPER [16],MaxQuant [17], Census [18], and IEMM [19].In this paper, we focus on the isotope label mTRAQ,
which is a nonisobaric variant of the iTRAQ and wasoriginally designed for multiple reaction monitoring(MRM) [20]. The mTRAQ labels were first designed intwo chemically identical versions. The heavy-label isidentical to the iTRAQ 117 label and its mass is 145 Da.The light-label is chemically identical to the heavy-label,but it has no 13C or 15N, so its mass is 141 Da. They
* Correspondence: [email protected]; [email protected]; [email protected] of Computer Science and Engineering, Seoul National University,Seoul, 151-742, Korea2Life Sciences Division, Korea Institute of Science and Technology, Seoul,136-791, KoreaFull list of author information is available at the end of the article
Yoon et al. BMC Bioinformatics 2011, 12(Suppl 1):S46http://www.biomedcentral.com/1471-2105/12/S1/S46
© 2011 Yoon et al; licensee BioMed Central Ltd. This is an open access article distributed under the terms of the Creative CommonsAttribution License (http://creativecommons.org/licenses/by/2.0), which permits unrestricted use, distribution, and reproduction inany medium, provided the original work is properly cited.
are labeled at lysine residue and N-terminal. We verifiedthat the mTRAQ is a powerful isotope label for MS-based relative quantification [8], and developed a newalgorithm to improve the accuracy of peptide quantifica-tion in mTRAQ labeling based MS experiments [21].Recently, the mTRAQ has become available in triplexformat, where the label with 149 Da is added.One of the major obstacles to accurate peptide quanti-
fication is the overlap of isotopic clusters. There are twotypes of overlap problems, one is the overlap betweendifferently labeled peptides, and the other is the overlapbetween chemically different peptides. The former canhappen when the mass difference between labels is verysmall. In mTRAQ experiments, the mass differencebetween differently labeled peptides is 4 Da if the origi-nal peptide has no lysine, so it is important to separatetheir isotopic clusters correctly. The latter could befound in all kinds of MS-based experiments. For peptidequantification, most of the times we are interested inrelative quantification of peptides whose amino acidsequences are known. When we know the sequences ofpeptides of interest, there are better chances to recog-nize the overlaps from differential labeling by comparingthem to the theoretical isotopic distributions.In this manuscript, we present a new data analysis
algorithm for peptide quantification in triplex mTRAQexperiments. It is an extension of the algorithm forduplex mTRAQ experiments [21]. We identify isotopicclusters of triplex labeled peptides and separate theirintensities using cubic equation modelling when thereare overlaps. We also designed an automatic determina-tion algorithm for the elution area of peptides, whichcould recognize the overlap between chemically differentpeptides. We demonstrate the performance of our algo-rithm using standard protein mixture experiments.
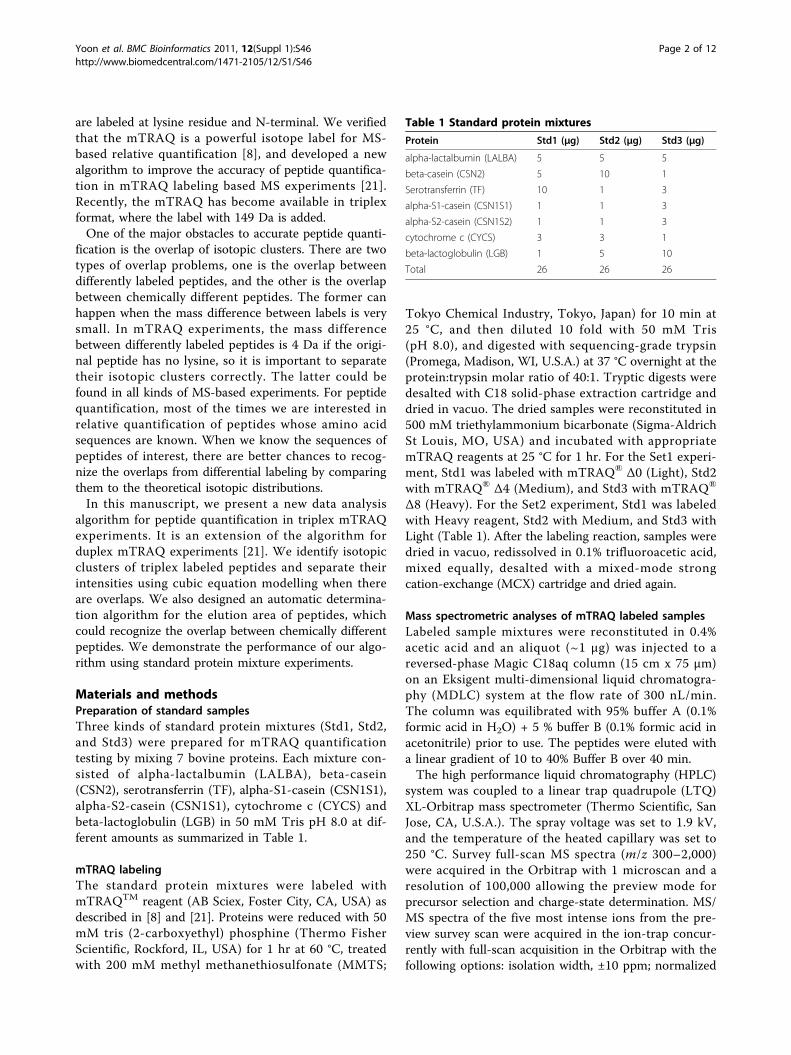
Materials and methodsPreparation of standard samplesThree kinds of standard protein mixtures (Std1, Std2,and Std3) were prepared for mTRAQ quantificationtesting by mixing 7 bovine proteins. Each mixture con-sisted of alpha-lactalbumin (LALBA), beta-casein(CSN2), serotransferrin (TF), alpha-S1-casein (CSN1S1),alpha-S2-casein (CSN1S1), cytochrome c (CYCS) andbeta-lactoglobulin (LGB) in 50 mM Tris pH 8.0 at dif-ferent amounts as summarized in Table 1.
mTRAQ labelingThe standard protein mixtures were labeled withmTRAQTM reagent (AB Sciex, Foster City, CA, USA) asdescribed in [8] and [21]. Proteins were reduced with 50mM tris (2-carboxyethyl) phosphine (Thermo FisherScientific, Rockford, IL, USA) for 1 hr at 60 °C, treatedwith 200 mM methyl methanethiosulfonate (MMTS;
Tokyo Chemical Industry, Tokyo, Japan) for 10 min at25 °C, and then diluted 10 fold with 50 mM Tris(pH 8.0), and digested with sequencing-grade trypsin(Promega, Madison, WI, U.S.A.) at 37 °C overnight at theprotein:trypsin molar ratio of 40:1. Tryptic digests weredesalted with C18 solid-phase extraction cartridge anddried in vacuo. The dried samples were reconstituted in500 mM triethylammonium bicarbonate (Sigma-AldrichSt Louis, MO, USA) and incubated with appropriatemTRAQ reagents at 25 °C for 1 hr. For the Set1 experi-ment, Std1 was labeled with mTRAQ® Δ0 (Light), Std2with mTRAQ® Δ4 (Medium), and Std3 with mTRAQ®
Δ8 (Heavy). For the Set2 experiment, Std1 was labeledwith Heavy reagent, Std2 with Medium, and Std3 withLight (Table 1). After the labeling reaction, samples weredried in vacuo, redissolved in 0.1% trifluoroacetic acid,mixed equally, desalted with a mixed-mode strongcation-exchange (MCX) cartridge and dried again.
Mass spectrometric analyses of mTRAQ labeled samplesLabeled sample mixtures were reconstituted in 0.4%acetic acid and an aliquot (~1 μg) was injected to areversed-phase Magic C18aq column (15 cm x 75 μm)on an Eksigent multi-dimensional liquid chromatogra-phy (MDLC) system at the flow rate of 300 nL/min.The column was equilibrated with 95% buffer A (0.1%formic acid in H2O) + 5 % buffer B (0.1% formic acid inacetonitrile) prior to use. The peptides were eluted witha linear gradient of 10 to 40% Buffer B over 40 min.The high performance liquid chromatography (HPLC)
system was coupled to a linear trap quadrupole (LTQ)XL-Orbitrap mass spectrometer (Thermo Scientific, SanJose, CA, U.S.A.). The spray voltage was set to 1.9 kV,and the temperature of the heated capillary was set to250 °C. Survey full-scan MS spectra (m/z 300–2,000)were acquired in the Orbitrap with 1 microscan and aresolution of 100,000 allowing the preview mode forprecursor selection and charge-state determination. MS/MS spectra of the five most intense ions from the pre-view survey scan were acquired in the ion-trap concur-rently with full-scan acquisition in the Orbitrap with thefollowing options: isolation width, ±10 ppm; normalized
Table 1 Standard protein mixtures
Protein Std1 (μg) Std2 (μg) Std3 (μg)
alpha-lactalbumin (LALBA) 5 5 5
beta-casein (CSN2) 5 10 1
Serotransferrin (TF) 10 1 3
alpha-S1-casein (CSN1S1) 1 1 3
alpha-S2-casein (CSN1S2) 1 1 3
cytochrome c (CYCS) 3 3 1
beta-lactoglobulin (LGB) 1 5 10
Total 26 26 26
Yoon et al. BMC Bioinformatics 2011, 12(Suppl 1):S46http://www.biomedcentral.com/1471-2105/12/S1/S46
Page 2 of 12
collision energy, 35%; dynamic exclusion duration,30 sec. Precursors with unmatched and single chargestates were discarded during data dependant acquisition.Data were acquired using the Xcalibur software v2.0.7(Thermo Scientific).
Database searching of MS/MS data for peptideidentificationThe data files collected on the mass spectrometer (.raw)were converted to MGF format by use of Trans-Proteo-mic Pipeline (TPP, version 4.3 JETSTREAM rev 1,http://www.proteomecenter.org), which is an opensource proteomics analysis tool. The data were thensearched using MASCOT [22] (version 2.2.06) against acompound database consisting of the International Pro-tein Index (IPI, European Bioinformatics Institute,http://www.ebi.ac.uk/IPI) bovine database (version 3.42)and IPI human database (version 3.57) totaling 107,511protein entries, allowing the options of trypsin, ±0.5 Damass tolerance for fragment ion, ±15 ppm mass toler-ance for precursor ion, variable modifications ofmTRAQ Light (+140.095 Da), mTRAQ Medium(+144.1021 Da) and mTRAQ Heavy (+148.1092 Da) onpeptide N-terminus and Lys residue. A fixed modifica-tion of MMTS (+45.9877 Da) on Cys residue and a vari-able modification of Met oxidation (+15.9949) were alsoallowed. TPP was used for the validation of databasesearch results. Peptides with TPP peptide probabilitygreater 0.9 and MASCOT E-value less than 0.01 wereused for further quantification analysis.
Overview of the algorithmOur algorithm is designed to be executed within TPP.For each LC/MS experiment, TPP generates a pepXMLfile which contains a list of peptides with sequences,tandem scans, charges, and modifications. Our algo-rithm calculates medium to light (M/L) and heavy tolight (H/L) ratios of peptides in pepXML files and pro-duces new pepXML files that can be used for furtheranalysis. For each peptide, our algorithm first deter-mines its elution area. It then identifies triplex isotopicclusters and calculates M/L and H/L ratios for each MSscan contained in the elution area. Finally, each of theset of M/L and H/L ratios is integrated based on linearregression.
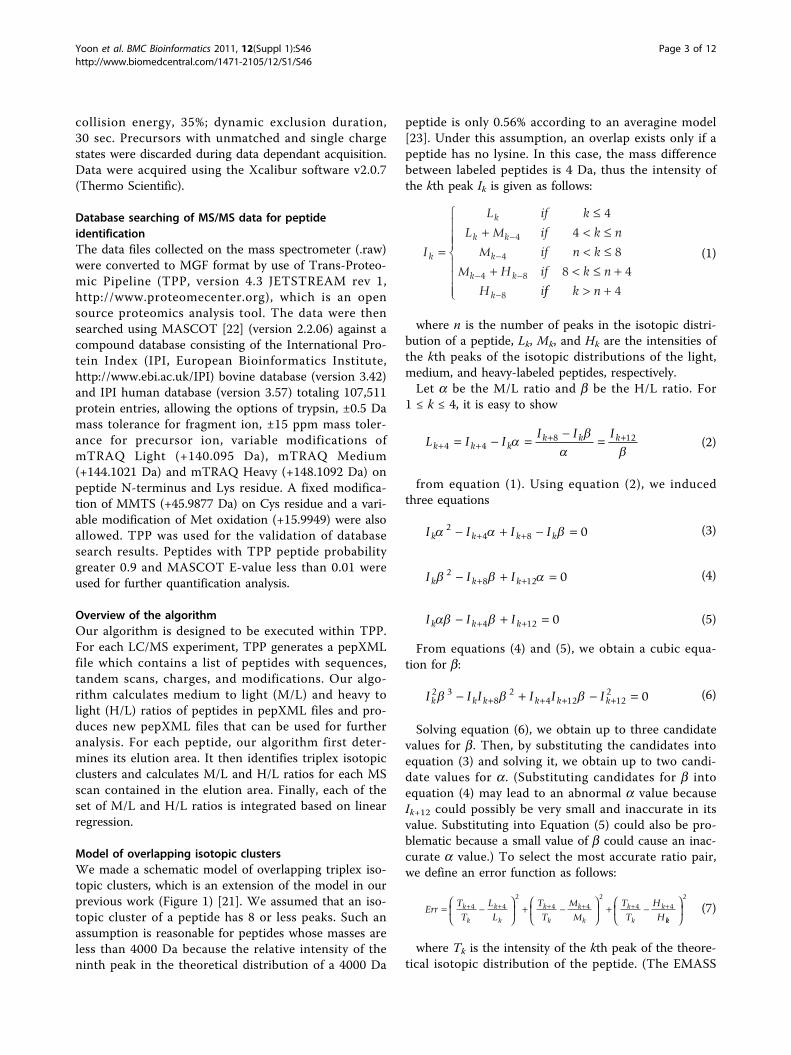
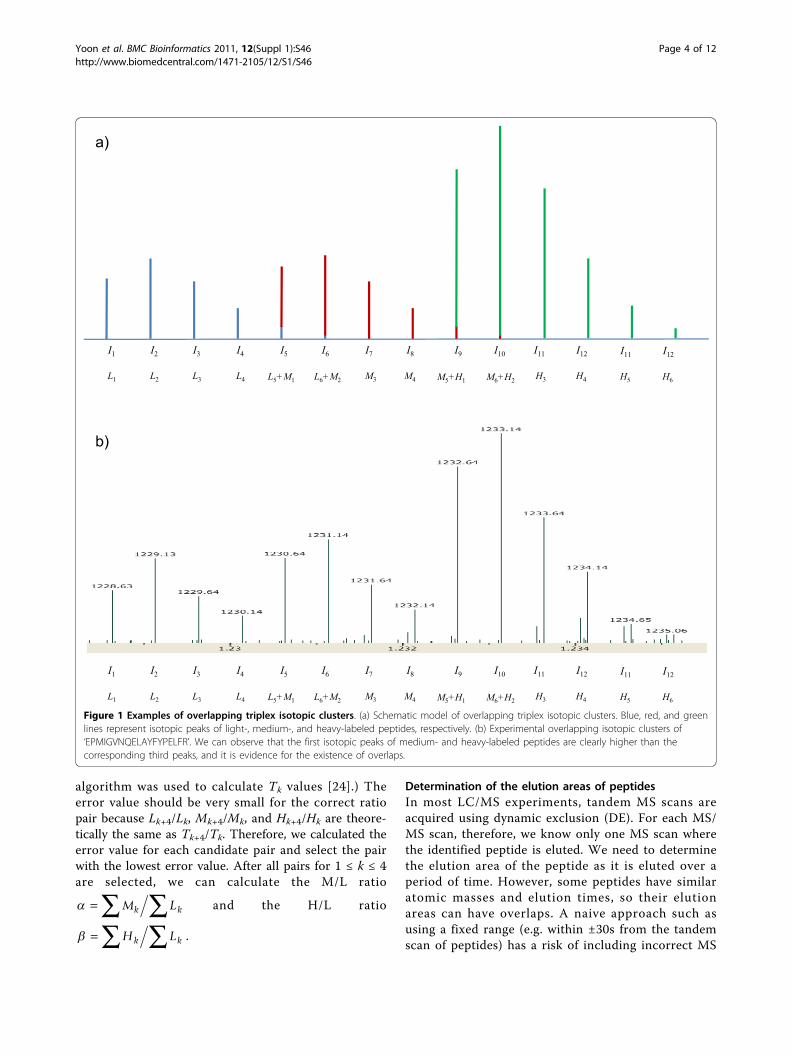
Model of overlapping isotopic clustersWe made a schematic model of overlapping triplex iso-topic clusters, which is an extension of the model in ourprevious work (Figure 1) [21]. We assumed that an iso-topic cluster of a peptide has 8 or less peaks. Such anassumption is reasonable for peptides whose masses areless than 4000 Da because the relative intensity of theninth peak in the theoretical distribution of a 4000 Da
peptide is only 0.56% according to an averagine model[23]. Under this assumption, an overlap exists only if apeptide has no lysine. In this case, the mass differencebetween labeled peptides is 4 Da, thus the intensity ofthe kth peak Ik is given as follows:
I
L if k
L M if k n
M if n k
M H if k n
H i
k
k
k k
k
k k
k
=
≤+ < ≤
< ≤+ < ≤ +
−
−
− −
−
4
4
8
8 4
4
4
4 8
8 ff k n> +
⎧
⎨
⎪⎪⎪
⎩
⎪⎪⎪ 4
(1)
where n is the number of peaks in the isotopic distri-bution of a peptide, Lk, Mk, and Hk are the intensities ofthe kth peaks of the isotopic distributions of the light,medium, and heavy-labeled peptides, respectively.Let a be the M/L ratio and b be the H/L ratio. For
1 ≤ k ≤ 4, it is easy to show
L I II I I
k k kk k k
+ ++ += − = − =4 4
8 12
(2)
from equation (1). Using equation (2), we inducedthree equations
I I I Ik k k k 24 8 0− + − =+ + (3)
I I Ik k k 28 12 0− + =+ + (4)
I I Ik k k − + =+ +4 12 0 (5)
From equations (4) and (5), we obtain a cubic equa-tion for b:
I I I I I Ik k k k k k2 3
82
4 12 122 0 − + − =+ + + + (6)
Solving equation (6), we obtain up to three candidatevalues for b. Then, by substituting the candidates intoequation (3) and solving it, we obtain up to two candi-date values for a. (Substituting candidates for b intoequation (4) may lead to an abnormal a value becauseIk+12 could possibly be very small and inaccurate in itsvalue. Substituting into Equation (5) could also be pro-blematic because a small value of b could cause an inac-curate a value.) To select the most accurate ratio pair,we define an error function as follows:
ErrT
T
L
L
T
T
M
M
T
T
H
Hk
k
k
k
k
k
k
k
k
k
k= −⎛
⎝⎜
⎞
⎠⎟ + −
⎛
⎝⎜
⎞
⎠⎟ + −+ + + + + +4 4
24 4
24 4
kk
⎛
⎝⎜
⎞
⎠⎟
2
(7)
where Tk is the intensity of the kth peak of the theore-tical isotopic distribution of the peptide. (The EMASS
Yoon et al. BMC Bioinformatics 2011, 12(Suppl 1):S46http://www.biomedcentral.com/1471-2105/12/S1/S46
Page 3 of 12
algorithm was used to calculate Tk values [24].) Theerror value should be very small for the correct ratiopair because Lk+4/Lk, Mk+4/Mk, and Hk+4/Hk are theore-tically the same as Tk+4/Tk. Therefore, we calculated theerror value for each candidate pair and select the pairwith the lowest error value. After all pairs for 1 ≤ k ≤ 4are selected, we can calculate the M/L ratio
= ∑ ∑M Lk k and the H/L ratio
= ∑ ∑H Lk k .
Determination of the elution areas of peptidesIn most LC/MS experiments, tandem MS scans areacquired using dynamic exclusion (DE). For each MS/MS scan, therefore, we know only one MS scan wherethe identified peptide is eluted. We need to determinethe elution area of the peptide as it is eluted over aperiod of time. However, some peptides have similaratomic masses and elution times, so their elutionareas can have overlaps. A naive approach such asusing a fixed range (e.g. within ±30s from the tandemscan of peptides) has a risk of including incorrect MS
a)
L1 L2 L3 L4 H3 H4
I1 I2 I3 I4 I9 I10 I11 I12I5 I6 I7 I8
b)
H5 H6
I11 I12
L5+M1 L6+M2 M3 M4 M5+H1 M6+H2
L1 L2 L3 L4 H3 H4
I1 I2 I3 I4 I9 I10 I11 I12I5 I6 I7 I8
H5 H6
I11 I12
L5+M1 L6+M2 M3 M4 M5+H1 M6+H2
Figure 1 Examples of overlapping triplex isotopic clusters. (a) Schematic model of overlapping triplex isotopic clusters. Blue, red, and greenlines represent isotopic peaks of light-, medium-, and heavy-labeled peptides, respectively. (b) Experimental overlapping isotopic clusters of‘EPMIGVNQELAYFYPELFR’. We can observe that the first isotopic peaks of medium- and heavy-labeled peptides are clearly higher than thecorresponding third peaks, and it is evidence for the existence of overlaps.
Yoon et al. BMC Bioinformatics 2011, 12(Suppl 1):S46http://www.biomedcentral.com/1471-2105/12/S1/S46
Page 4 of 12
scans where other peptides are overlapped. Therefore,it is very important to determine accurate elutionareas of the peptides for accurate relativequantification.We assume that the distribution of peptide elution
time can be approximated as a normal distribution.Because of noise and overlap of peptides, MS scans withlow intensities at both ends of the elution area may notbe trusted. If we use only MS scans with high total ioncurrent while modeling the elution profile as a normaldistribution, the mean μ of the normal distribution canbe approximated, but the variance s2 can’t. Instead, weuse the full width at half maximum (FWHM) to induces2. From the probability density function of the normal
distribution, we deducee
−=
( / )
/FWHM 2
2
2
21 2 and obtain
s2 = FWHM2/8 ln 2.When a peptide identification and the associated tan-
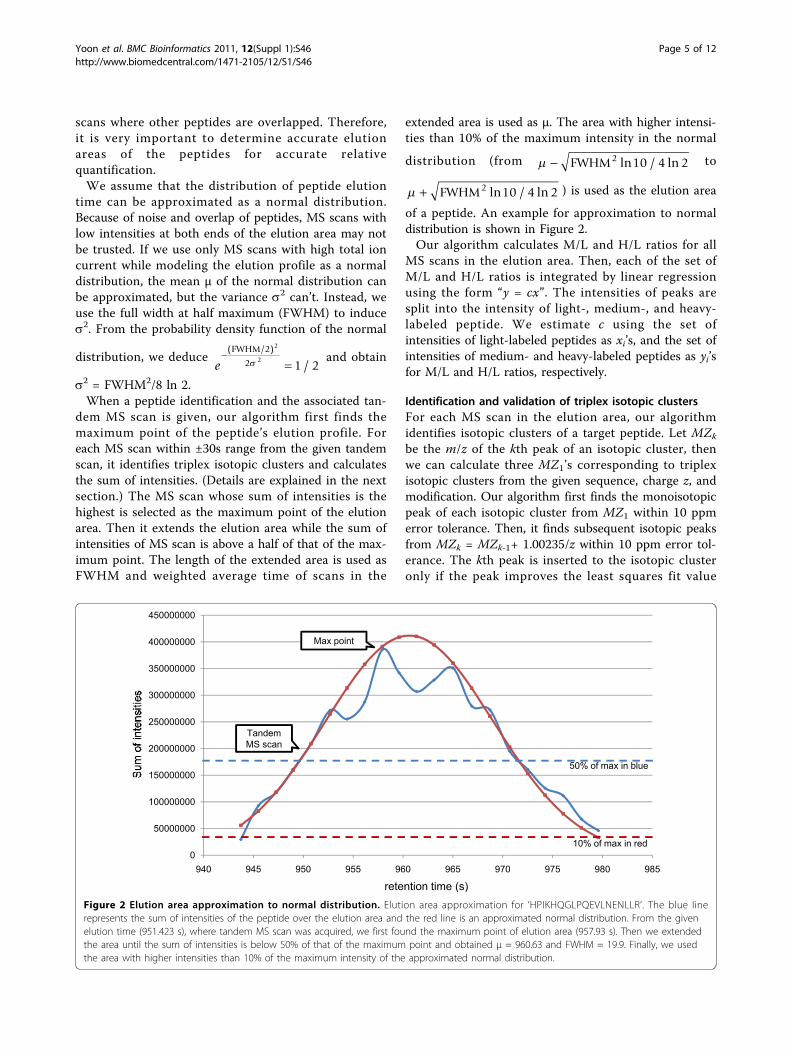
dem MS scan is given, our algorithm first finds themaximum point of the peptide’s elution profile. Foreach MS scan within ±30s range from the given tandemscan, it identifies triplex isotopic clusters and calculatesthe sum of intensities. (Details are explained in the nextsection.) The MS scan whose sum of intensities is thehighest is selected as the maximum point of the elutionarea. Then it extends the elution area while the sum ofintensities of MS scan is above a half of that of the max-imum point. The length of the extended area is used asFWHM and weighted average time of scans in the
extended area is used as μ. The area with higher intensi-ties than 10% of the maximum intensity in the normal
distribution (from − FWHM2 10 4 2ln / ln to
+ FWHM2 10 4 2ln / ln ) is used as the elution area
of a peptide. An example for approximation to normaldistribution is shown in Figure 2.Our algorithm calculates M/L and H/L ratios for all
MS scans in the elution area. Then, each of the set ofM/L and H/L ratios is integrated by linear regressionusing the form “y = cx”. The intensities of peaks aresplit into the intensity of light-, medium-, and heavy-labeled peptide. We estimate c using the set ofintensities of light-labeled peptides as xi’s, and the set ofintensities of medium- and heavy-labeled peptides as yi’sfor M/L and H/L ratios, respectively.
Identification and validation of triplex isotopic clustersFor each MS scan in the elution area, our algorithmidentifies isotopic clusters of a target peptide. Let MZk
be the m/z of the kth peak of an isotopic cluster, thenwe can calculate three MZ1’s corresponding to triplexisotopic clusters from the given sequence, charge z, andmodification. Our algorithm first finds the monoisotopicpeak of each isotopic cluster from MZ1 within 10 ppmerror tolerance. Then, it finds subsequent isotopic peaksfrom MZk = MZk-1+ 1.00235/z within 10 ppm error tol-erance. The kth peak is inserted to the isotopic clusteronly if the peak improves the least squares fit value
0
50000000
100000000
150000000
200000000
250000000
300000000
350000000
400000000
450000000
940 945 950 955 960 965 970 975 980 985
retention time (s)
50% of max in blue
10% of max in red
TandemMS scan
Max point
Figure 2 Elution area approximation to normal distribution. Elution area approximation for ‘HPIKHQGLPQEVLNENLLR’. The blue linerepresents the sum of intensities of the peptide over the elution area and the red line is an approximated normal distribution. From the givenelution time (951.423 s), where tandem MS scan was acquired, we first found the maximum point of elution area (957.93 s). Then we extendedthe area until the sum of intensities is below 50% of that of the maximum point and obtained μ = 960.63 and FWHM = 19.9. Finally, we usedthe area with higher intensities than 10% of the maximum intensity of the approximated normal distribution.
Yoon et al. BMC Bioinformatics 2011, 12(Suppl 1):S46http://www.biomedcentral.com/1471-2105/12/S1/S46
Page 5 of 12
a)
*
*
*
b) *
*
*
c)
*
*
*
*
*
*
o
o
od)
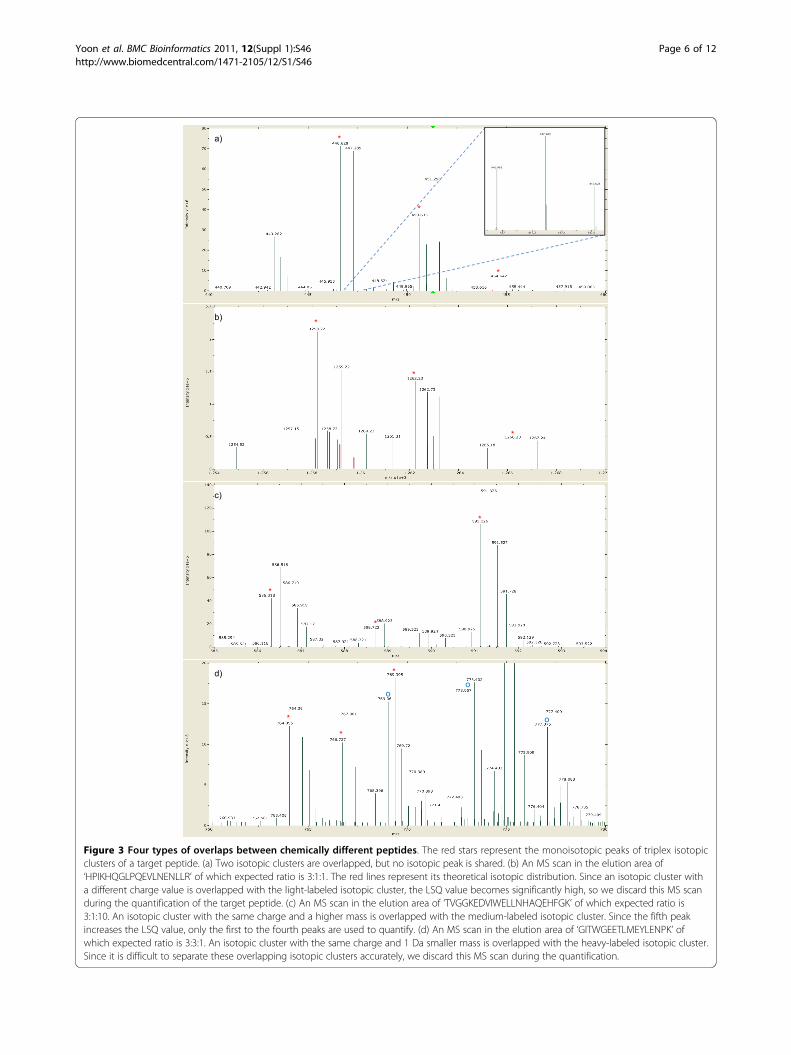
Figure 3 Four types of overlaps between chemically different peptides. The red stars represent the monoisotopic peaks of triplex isotopicclusters of a target peptide. (a) Two isotopic clusters are overlapped, but no isotopic peak is shared. (b) An MS scan in the elution area of‘HPIKHQGLPQEVLNENLLR’ of which expected ratio is 3:1:1. The red lines represent its theoretical isotopic distribution. Since an isotopic cluster witha different charge value is overlapped with the light-labeled isotopic cluster, the LSQ value becomes significantly high, so we discard this MS scanduring the quantification of the target peptide. (c) An MS scan in the elution area of ‘TVGGKEDVIWELLNHAQEHFGK’ of which expected ratio is3:1:10. An isotopic cluster with the same charge and a higher mass is overlapped with the medium-labeled isotopic cluster. Since the fifth peakincreases the LSQ value, only the first to the fourth peaks are used to quantify. (d) An MS scan in the elution area of ‘GITWGEETLMEYLENPK’ ofwhich expected ratio is 3:3:1. An isotopic cluster with the same charge and 1 Da smaller mass is overlapped with the heavy-labeled isotopic cluster.Since it is difficult to separate these overlapping isotopic clusters accurately, we discard this MS scan during the quantification.
Yoon et al. BMC Bioinformatics 2011, 12(Suppl 1):S46http://www.biomedcentral.com/1471-2105/12/S1/S46
Page 6 of 12
(LSQ). If the LSQ between the theoretical distributionof the peptide and the isotopic cluster without the kthpeak is lower than that with the kth peak, the kth peakis discarded and the algorithm does not look for anymore peaks. If there are two or more candidate peaksfor the kth peak, the peak with the lowest LSQ isselected. For example, there are two candidates for thethird isotopic peak of the light-labeled isotopic clusterof the target peptide and the smaller peak is selected inFigure 3a.After identification of triplex isotopic clusters of a tar-
get peptide, we check them and discard the current MSscan if they are doubtful according to the following cri-teria. First, we check whether the overall shape of eachisotopic cluster resembles that of a theoretical isotopicdistribution. At least the LSQ of the most abundant iso-topic cluster must be below a threshold (e.g. 0.2). TheLSQ of the others should also be below the thresholdunless their sums of intensities are lower than a half ofthat of the most abundant isotopic cluster. (If an isoto-pic cluster has low abundance, its shape could be abnor-mal because it may be interfered by chemical noise andother peptides.) Second, we check whether the identifiedisotopic cluster is overlapped with another peptide. Fourtypes of overlaps are shown in Figure 3. There is noproblem if no isotopic peak is shared by two isotopicclusters (Figure 3a). If an isotopic cluster with a differ-ent charge value is overlapped, the LSQ of the identifiedisotopic cluster should be significantly high, so we can
discard the current MS scan (Figure 3b). If an isotopiccluster with the same charge and a higher mass is over-lapped, shared isotopic peaks could not be inserted tothe isotopic cluster of the target peptide because itincreases the LSQ of the isotopic cluster (Figure 3c).Only the case in which an isotopic cluster with thesame charge and a lower mass is overlapped needs addi-tional filtering (Figure 3d). We can easily detect theseoverlaps by considering previous peaks, but we can’tseparate overlapping isotopic clusters in this casebecause they look like one isotopic cluster. Therefore,we discard the current MS scan if at least one isotopiccluster of a target peptide could be identified as an iso-topic cluster with the same charge and a lower mass.
Results and discussionApplication to 7-standard protein data mixed with knownratiosWe analyzed two datasets in which seven standard pro-teins were mixed in different ratios. For the Set1 experi-ment, Std1 was labeled with light, Std2 with medium,and Std3 with heavy. For the Set2 experiment, Std1 waslabeled with heavy, Std2 with medium, and Std3 withlight. The expected ratios for each experiment areshown in Table 2.After validation, we obtained 147 MS/MS scans from
Set1 and 139 MS/MS scans from Set2, resulting in 168unique peptides in total. We calculated M/L and H/Lratios of the peptides and classified them according to
Table 2 Expected ratios and computed ratios for seven proteins in standard mixtures
(a) Set1 experiment
Protein Number of MS/MS M/L H/L
Expected ratio Our ratio Standard deviation Expected ratio Our ratio Standard deviation
LALBA 17 1 1.074858 0.085456 1 0.695681 0.072863
CSN2 3 2 4.847636 0.093352 0.2 0.184493 0.045277
TF 76 0.1 0.098397 0.186558 0.3 0.160631 0.141608
CSN1S1 10 1 1.264178 0.10274 3 1.948002 0.085701
CSN1S2 4 1 2.419368 0.133448 3 1.644656 0.088651
CYCS 15 1 0.846116 0.068538 0.3 0.34976 0.123581
LGB 22 5 5.138141 0.181286 10 8.143161 0.174779
(b) Set2 experiment
Protein Number of MS/MS M/L H/L
Expected ratio Our ratio Standard deviation Expected ratio Our ratio Standard deviation
LALBA 18 1 1.010655 0.098869 1 0.487596 0.076048
CSN2 3 10 13.64935 0.112667 5 1.517403 0.112521
TF 64 0.33 0.43843 0.166834 3.3 2.829079 0.108205
CSN1S1 13 0.33 0.471544 0.071577 0.33 0.223681 0.084549
CSN1S2 10 0.33 0.984124 0.042867 0.33 0.274309 0.083823
CYCS 13 3 1.83768 0.049094 3 1.417869 0.083364
LGB 18 0.5 0.436385 0.049273 0.1 0.050817 0.220646
We first calculated the averages and standard deviations of log10(H/L) values of peptides. Then, we transformed the averages into H/L scale to compare them toexpected ratios.
Yoon et al. BMC Bioinformatics 2011, 12(Suppl 1):S46http://www.biomedcentral.com/1471-2105/12/S1/S46
Page 7 of 12
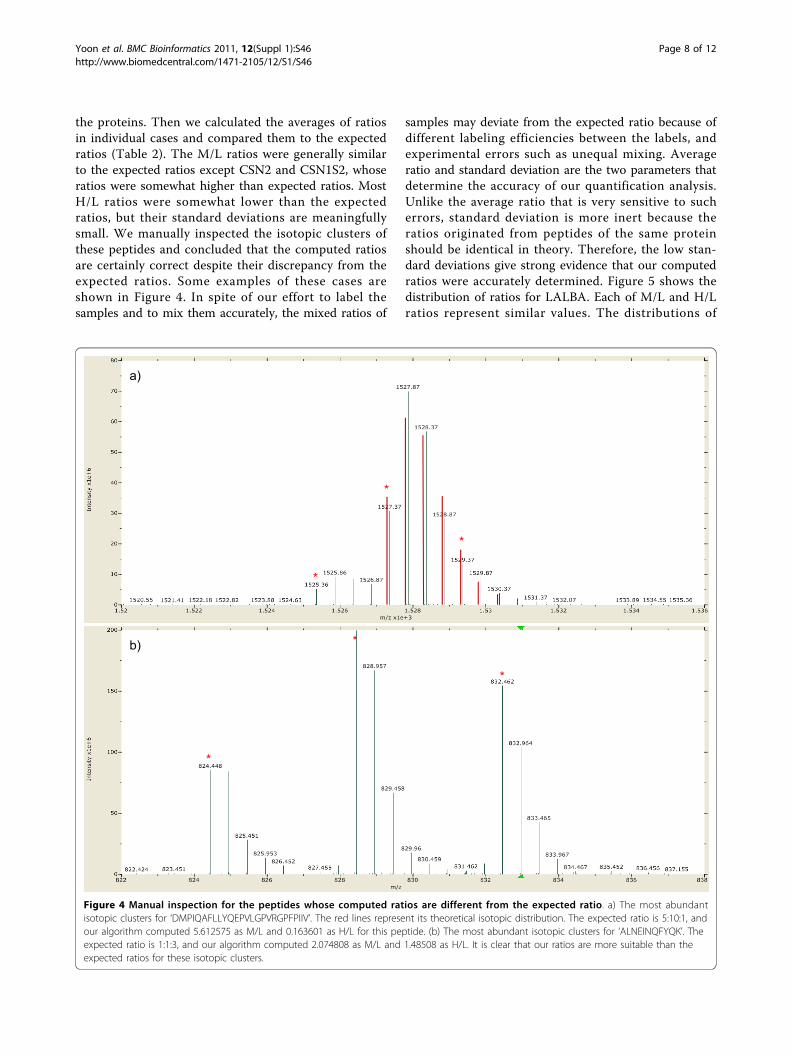
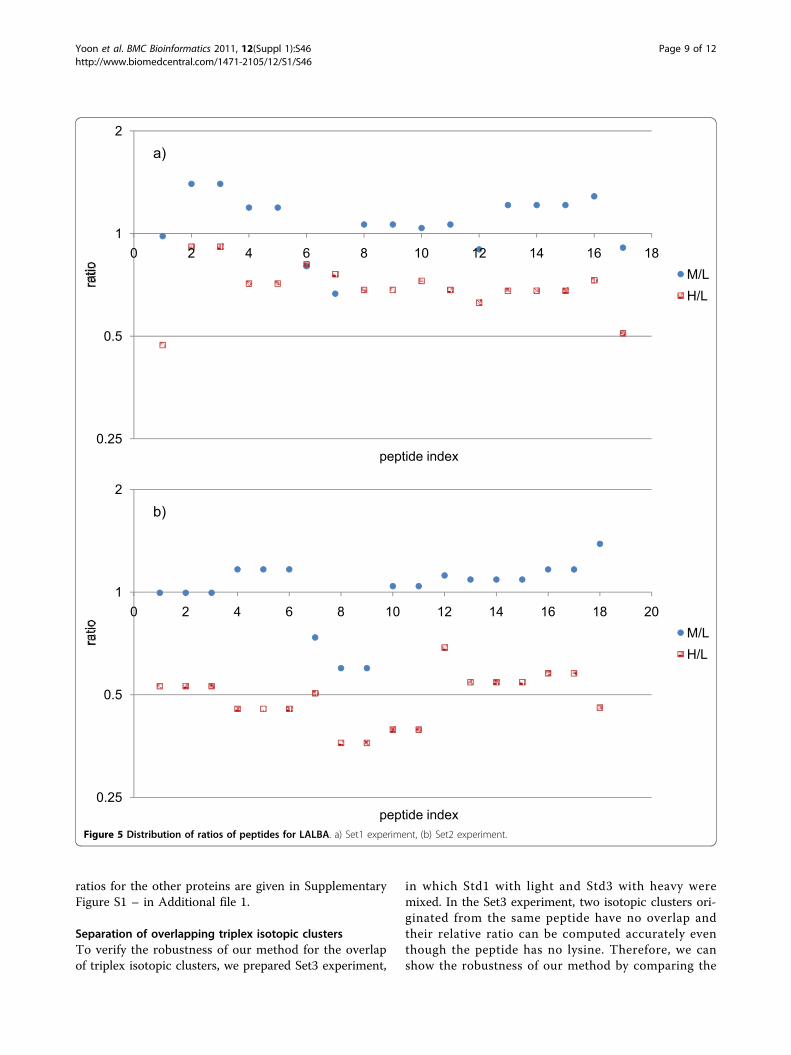
the proteins. Then we calculated the averages of ratiosin individual cases and compared them to the expectedratios (Table 2). The M/L ratios were generally similarto the expected ratios except CSN2 and CSN1S2, whoseratios were somewhat higher than expected ratios. MostH/L ratios were somewhat lower than the expectedratios, but their standard deviations are meaningfullysmall. We manually inspected the isotopic clusters ofthese peptides and concluded that the computed ratiosare certainly correct despite their discrepancy from theexpected ratios. Some examples of these cases areshown in Figure 4. In spite of our effort to label thesamples and to mix them accurately, the mixed ratios of
samples may deviate from the expected ratio because ofdifferent labeling efficiencies between the labels, andexperimental errors such as unequal mixing. Averageratio and standard deviation are the two parameters thatdetermine the accuracy of our quantification analysis.Unlike the average ratio that is very sensitive to sucherrors, standard deviation is more inert because theratios originated from peptides of the same proteinshould be identical in theory. Therefore, the low stan-dard deviations give strong evidence that our computedratios were accurately determined. Figure 5 shows thedistribution of ratios for LALBA. Each of M/L and H/Lratios represent similar values. The distributions of
a)
*
*
*
b)
*
*
*
Figure 4 Manual inspection for the peptides whose computed ratios are different from the expected ratio. a) The most abundantisotopic clusters for ‘DMPIQAFLLYQEPVLGPVRGPFPIIV’. The red lines represent its theoretical isotopic distribution. The expected ratio is 5:10:1, andour algorithm computed 5.612575 as M/L and 0.163601 as H/L for this peptide. (b) The most abundant isotopic clusters for ‘ALNEINQFYQK’. Theexpected ratio is 1:1:3, and our algorithm computed 2.074808 as M/L and 1.48508 as H/L. It is clear that our ratios are more suitable than theexpected ratios for these isotopic clusters.
Yoon et al. BMC Bioinformatics 2011, 12(Suppl 1):S46http://www.biomedcentral.com/1471-2105/12/S1/S46
Page 8 of 12
ratios for the other proteins are given in SupplementaryFigure S1 – in Additional file 1.
Separation of overlapping triplex isotopic clustersTo verify the robustness of our method for the overlapof triplex isotopic clusters, we prepared Set3 experiment,
in which Std1 with light and Std3 with heavy weremixed. In the Set3 experiment, two isotopic clusters ori-ginated from the same peptide have no overlap andtheir relative ratio can be computed accurately eventhough the peptide has no lysine. Therefore, we canshow the robustness of our method by comparing the
0.25
0.5
1
2
0 2 4 6 8 10 12 14 16 18M/LH/L
a)
peptide index
0.25
0.5
1
2
0 2 4 6 8 10 12 14 16 18 20M/LH/L
peptide index
b)
Figure 5 Distribution of ratios of peptides for LALBA. a) Set1 experiment, (b) Set2 experiment.
Yoon et al. BMC Bioinformatics 2011, 12(Suppl 1):S46http://www.biomedcentral.com/1471-2105/12/S1/S46
Page 9 of 12
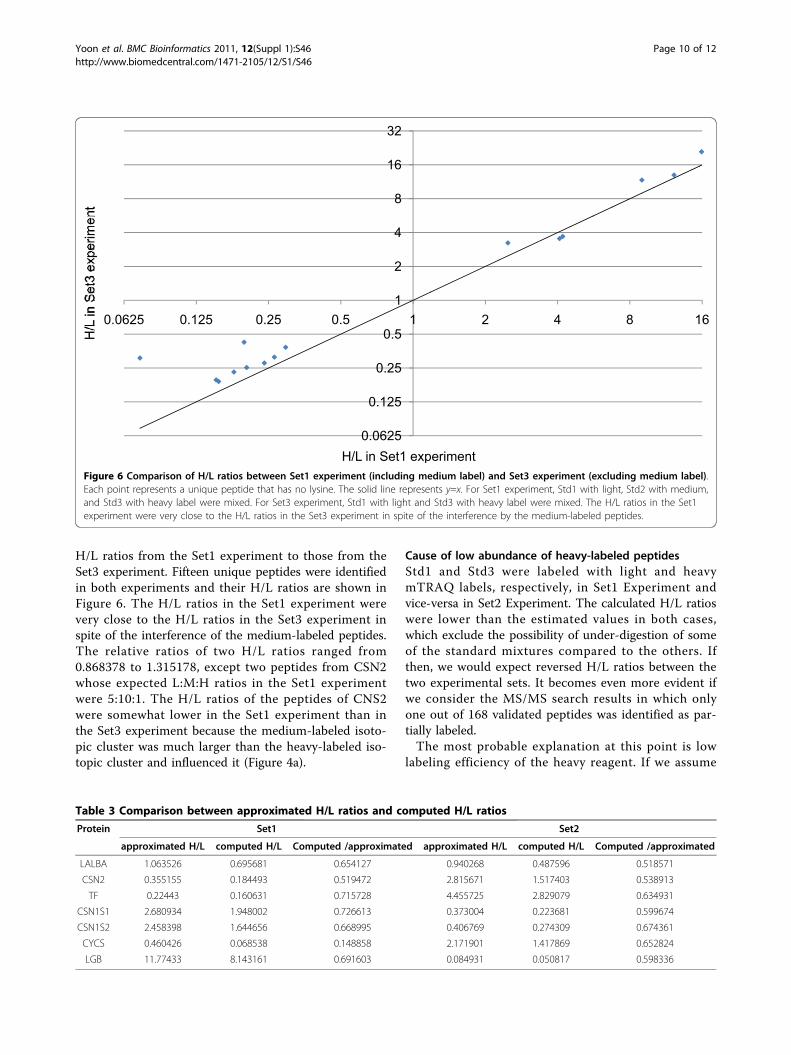
H/L ratios from the Set1 experiment to those from theSet3 experiment. Fifteen unique peptides were identifiedin both experiments and their H/L ratios are shown inFigure 6. The H/L ratios in the Set1 experiment werevery close to the H/L ratios in the Set3 experiment inspite of the interference of the medium-labeled peptides.The relative ratios of two H/L ratios ranged from0.868378 to 1.315178, except two peptides from CSN2whose expected L:M:H ratios in the Set1 experimentwere 5:10:1. The H/L ratios of the peptides of CNS2were somewhat lower in the Set1 experiment than inthe Set3 experiment because the medium-labeled isoto-pic cluster was much larger than the heavy-labeled iso-topic cluster and influenced it (Figure 4a).
Cause of low abundance of heavy-labeled peptidesStd1 and Std3 were labeled with light and heavymTRAQ labels, respectively, in Set1 Experiment andvice-versa in Set2 Experiment. The calculated H/L ratioswere lower than the estimated values in both cases,which exclude the possibility of under-digestion of someof the standard mixtures compared to the others. Ifthen, we would expect reversed H/L ratios between thetwo experimental sets. It becomes even more evident ifwe consider the MS/MS search results in which onlyone out of 168 validated peptides was identified as par-tially labeled.The most probable explanation at this point is low
labeling efficiency of the heavy reagent. If we assume
0.0625
0.125
0.25
0.5
1
2
4
8
16
32
0.0625 0.125 0.25 0.5 1 2 4 8 16
H/L in Set1 experimentFigure 6 Comparison of H/L ratios between Set1 experiment (including medium label) and Set3 experiment (excluding medium label).Each point represents a unique peptide that has no lysine. The solid line represents y=x. For Set1 experiment, Std1 with light, Std2 with medium,and Std3 with heavy label were mixed. For Set3 experiment, Std1 with light and Std3 with heavy label were mixed. The H/L ratios in the Set1experiment were very close to the H/L ratios in the Set3 experiment in spite of the interference by the medium-labeled peptides.
Table 3 Comparison between approximated H/L ratios and computed H/L ratios
Protein Set1 Set2
approximated H/L computed H/L Computed /approximated approximated H/L computed H/L Computed /approximated
LALBA 1.063526 0.695681 0.654127 0.940268 0.487596 0.518571
CSN2 0.355155 0.184493 0.519472 2.815671 1.517403 0.538913
TF 0.22443 0.160631 0.715728 4.455725 2.829079 0.634931
CSN1S1 2.680934 1.948002 0.726613 0.373004 0.223681 0.599674
CSN1S2 2.458398 1.644656 0.668995 0.406769 0.274309 0.674361
CYCS 0.460426 0.068538 0.148858 2.171901 1.417869 0.652824
LGB 11.77433 8.143161 0.691603 0.084931 0.050817 0.598336
Yoon et al. BMC Bioinformatics 2011, 12(Suppl 1):S46http://www.biomedcentral.com/1471-2105/12/S1/S46
Page 10 of 12
that the M/L ratios are correct, we can approximate theH/L ratios in Set1 experiment using M/L ratios in Set2experiment. Similarly, we can approximate the H/Lratios in Set2 experiment using M/L ratios in Set1experiment. We compared them with the computed H/L ratios and observed that the computed H/L ratios areconsistently 50~70% of the approximated H/L ratiosexcept for the cases of CYCS in Set1 experiment(Table 3). This result shows the possibility that theheavy reagent had low labeling efficiency.The origin can also be explained, though in part, by
isotope impurity of heavy label. Upon closer inspectionof MS spectra of the identified peptides, a peak 1 Dasmaller than the monoisotopic peak of heavy label wasfrequently found (Supplementary Figure S2 in Addi-tional file 1). It was reported that iTRAQ reagents con-tain trace levels of isotopic impurities [25]. SincemTRAQ shares the same chemical structure withiTRAQ, we expect that the same problem will happenin mTRAQ data analysis.In real experiments where quantification of complex
proteome is needed, one can add a known standard atthe ratio of 1:1:1, and use the calculated ratio of thestandard as a correction factor. For example, if the cal-culated ratio of LALBA in the current study is used as acorrection factor, the ratios of other proteins becomecloser to the expected ratios.
ConclusionsWe have developed a new data analysis algorithm forpeptide quantification in triplex mTRAQ experiments. Itcan calculate the ratios of peptides accurately by separ-ating overlapping triplex isotopic clusters based on thearithmetic models of isotope overlap and an automaticdetermination for the elution area of peptides. Whenused within the TPP pipeline, it can easily analyze high-throughput proteomics data.
Additional material
Additional file 1: Supplementary Material Supplementary Figures.
AcknowledgementsThis work was supported by 21C Frontier Functional Proteomics Projectfrom Korean Ministry of Education, Science & Technology (FPR08-A1-020,FPR08-A1-021, FPR08-A1-090).This article has been published as part of BMC Bioinformatics Volume 12Supplement 1, 2011: Selected articles from the Ninth Asia PacificBioinformatics Conference (APBC 2011). The full contents of the supplementare available online at http://www.biomedcentral.com/1471-2105/12?issue=S1.
Author details1School of Computer Science and Engineering, Seoul National University,Seoul, 151-742, Korea. 2Life Sciences Division, Korea Institute of Science and
Technology, Seoul, 136-791, Korea. 3Department of Biomolecular Science,University of Science and Technology, Daejeon, 305-333, Korea. 4Departmentof Mechanical and Information Engineering, University of Seoul, Seoul, 130-743, Korea.
Authors’ contributionsJYY, KP, EP and CL conceived the research. JYY and HL implemented theprogram. JY and KK prepared experimental datasets. SN identified thesequence of peptides by database searching. JYY and HL analyzed the resultof the program. JYY, KP, EP, JY and CL wrote and revised the manuscript. Allauthors read and approved the final manuscript.
Competing interestsThe authors declare no competing financial interests.
Published: 15 February 2011
References1. Aebersold R, Mann M: Mass spectrometry-based proteomics. Nature 2003,
422(6928):198-207.2. MacCoss MJ, Matthews DE: Quantitative MS for proteomics: teaching a
new dog old tricks. Anal Chem 2005, 77(15):294A-302A.3. Mueller LN, Brusniak MY, Mani DR, Aebersold R: An assessment of software
solutions for the analysis of mass spectrometry based quantitativeproteomics data. Journal of Proteome Research 2008, 7(1):51-61.
4. Gygi SP, Rist B, Gerber SA, Turecek F, Gelb MH, Aebersold R: Quantitativeanalysis of complex protein mixtures using isotope-coded affinity tags.Nature Biotechnology 1999, 17(10):994-999.
5. Ong SE, Blagoev B, Kratchmarova I, Kristensen DB, Steen H, Pandey A,Mann M: Stable isotope labeling by amino acids in cell culture, SILAC, asa simple and accurate approach to expression proteomics. Mol CellProteomics 2002, 1(5):376-386.
6. Yao XD, Freas A, Ramirez J, Demirev PA, Fenselau C: Proteolytic O-18labeling for comparative proteomics: Model studies with two serotypesof adenovirus. Analytical Chemistry 2001, 73(13):2836-2842.
7. Aggarwal K, Choe LH, Lee KH: Shotgun proteomics using the iTRAQisobaric tags. Brief Funct Genomic Proteomic 2006, 5(2):112-120.
8. Kang UB, Yeom J, Kim H, Lee C: Quantitative Analysis of mTRAQ-LabeledProteome Using Full MS Scans. Journal of Proteome Research 2010,9(7):3750-3758.
9. Han DK, Eng J, Zhou HL, Aebersold R: Quantitative profiling ofdifferentiation-induced microsomal proteins using isotope-coded affinitytags and mass spectrometry. Nature Biotechnology 2001, 19(10):946-951.
10. Li XJ, Zhang H, Ranish JA, Aebersold R: Automated statistical analysis ofprotein abundance ratios from data generated by stable-isotope dilutionand tandem mass spectrometry. Analytical Chemistry 2003,75(23):6648-6657.
11. Shinkawa T, Taoka M, Yamauchi Y, Ichimura T, Kaji H, Takahashi N, Isobe T:STEM: A software tool for large-scale proteomic data analyses. Journal ofProteome Research 2005, 4(5):1826-1831.
12. Halligan BD, Slyper RY, Twigger SN, Hicks W, Olivier M, Greene AS:ZoomQuant: An application for the quantitation of stable isotopelabeled peptides. Journal of the American Society for Mass Spectrometry2005, 16(3):302-306.
13. Bellew M, Coram M, Fitzgibbon M, Igra M, Randolph T, Wang P, May D,Eng J, Fang RH, Lin CW, et al: A suite of algorithms for thecomprehensive analysis of complex protein mixtures using high-resolution LC-MS. Bioinformatics 2006, 22(15):1902-1909.
14. Lin WT, Hung WN, Yian YH, Wu KP, Han CL, Chen YR, Chen YJ, Sung TY,Hsu WL: Multi-Q: a fully automated tool for multiplexed proteinquantitation. J Proteome Res 2006, 5(9):2328-2338.
15. Faca V, Coram M, Phanstiel D, Glukhova V, Zhang Q, Fitzgibbon M,McIntosh M, Hanash S: Quantitative analysis of acrylamide labeled serumproteins by LC-MS/MS. Journal of Proteome Research 2006, 5(8):2009-2018.
16. Monroe ME, Tolic N, Jaitly N, Shaw JL, Adkins JN, Smith RD: VIPER: anadvanced software package to support high-throughput LC-MS peptideidentification. Bioinformatics 2007, 23(15):2021-2023.
17. Cox J, Mann M: MaxQuant enables high peptide identification rates,individualized p.p.b.-range mass accuracies and proteome-wide proteinquantification. Nature Biotechnology 2008, 26(12):1367-1372.
Yoon et al. BMC Bioinformatics 2011, 12(Suppl 1):S46http://www.biomedcentral.com/1471-2105/12/S1/S46
Page 11 of 12
18. Park SK, Venable JD, Xu T, Yates JR: A quantitative analysis software toolfor mass spectrometry-based proteomics. Nature Methods 2008,5(4):319-322.
19. Dasari S, Wilmarth PA, Reddy AP, Robertson LJG, Nagalla SR, David LL:Quantification of Isotopically Overlapping Deamidated and O-18-LabeledPeptides Using Isotopic Envelope Mixture Modeling. Journal of ProteomeResearch 2009, 8(3):1263-1270.
20. DeSouza LV, Taylor AM, Li W, Minkoff MS, Romaschin AD, Colgan TJ,Siu KWM: Multiple reaction monitoring of mTRAQ-labeled peptidesenables absolute quantification of endogenous levels of a potentialcancer marker in cancerous and normal endometrial tissues. Journal ofProteome Research 2008, 7(8):3525-3534.
21. Yoon JY, Lim KY, Lee S, Park K, Paek E, Kane UB, Yeom J, Lee C: ImprovedQuantitative Analysis of Mass Spectrometry using Quadratic Equations.Journal of Proteome Research 2010, 9(5):2775-2785.
22. Perkins DN, Pappin DJC, Creasy DM, Cottrell JS: Probability-based proteinidentification by searching sequence databases using massspectrometry data. Electrophoresis 1999, 20(18):3551-3567.
23. Senko MW, Beu SC, Mclafferty FW: Determination of Monoisotopic Massesand Ion Populations for Large Biomolecules from Resolved IsotopicDistributions. J Am Soc Mass Spectr 1995, 6(4):229-233.
24. Rockwood AL, Haimi P: Efficient calculation of accurate masses ofisotopic peaks. Journal of the American Society for Mass Spectrometry 2006,17(3):415-419.
25. Ow SY, Salim M, Noirel J, Evans C, Rehman I, Wright PC: iTRAQUnderestimation in Simple and Complex Mixtures: “The Good, the Badand the Ugly”. Journal of Proteome Research 2009, 8(11):5347-5355.
doi:10.1186/1471-2105-12-S1-S46Cite this article as: Yoon et al.: High-throughput peptide quantificationusing mTRAQ reagent triplex. BMC Bioinformatics 2011 12(Suppl 1):S46.
Submit your next manuscript to BioMed Centraland take full advantage of:
• Convenient online submission
• Thorough peer review
• No space constraints or color figure charges
• Immediate publication on acceptance
• Inclusion in PubMed, CAS, Scopus and Google Scholar
• Research which is freely available for redistribution
Submit your manuscript at www.biomedcentral.com/submit
Yoon et al. BMC Bioinformatics 2011, 12(Suppl 1):S46http://www.biomedcentral.com/1471-2105/12/S1/S46
Page 12 of 12