Phylogenomic Reconstruction Indicates Mitochondrial ... - PLOS
Earth and Planetary Science Letters 405 (2014) 194–206
Contents lists available at ScienceDirect
Earth and Planetary Science Letters
www.elsevier.com/locate/epsl
High-precision 10Be chronology of moraines in the Southern Alps
indicates synchronous cooling in Antarctica and New Zealand 42,000
years ago
Samuel E. Kelley a,∗,1, Michael R. Kaplan b, Joerg M. Schaefer b, Bjørn G. Andersen c,2, David J.A. Barrell d, Aaron E. Putnam b, George H. Denton a, Roseanne Schwartz b, Robert C. Finkel e, Alice M. Doughty f
a Department of Earth Sciences and Climate Change Institute, University of Maine, Orono, ME 04469, USAb Lamont–Doherty Earth Observatory, Palisades, NY 10964, USAc Department of Geosciences, University of Oslo, Oslo, Norwayd GNS Science, Dunedin, New Zealande Lawrence Livermore National Laboratory, Livermore, CA 94550, USAf Department of Earth Sciences, Dartmouth College, Hanover, NH 03750, USA
a r t i c l e i n f o a b s t r a c t
Article history:Received 13 July 2013Received in revised form 22 July 2014Accepted 25 July 2014Available online 16 September 2014Editor: G.M. Henderson
Keywords:10Be surface-exposure datingLGMMIS 3Southern Hemispherewesterly wind fieldNew Zealand
Millennial-scale temperature variations in Antarctica during the period 80,000 to 18,000 years ago are known to anti-correlate broadly with winter-centric cold–warm episodes revealed in Greenland ice cores. However, the extent to which climate fluctuations in the Southern Hemisphere beat in time with Antarctica, rather than with the Northern Hemisphere, has proved a controversial question. In this study we determine the ages of a prominent sequence of glacial moraines in New Zealand and use the results to assess the phasing of millennial climate change. Forty-four 10Be cosmogenic surface-exposure ages of boulders deposited by the Pukaki glacier in the Southern Alps document four moraine-building events from Marine Isotope Stage 3 (MIS 3) through to the end of the Last Glacial Maximum (∼18,000 years ago; LGM). The earliest moraine-building event is defined by the ages of nine boulders on a belt of moraine that documents the culmination of a glacier advance 42,000 years ago. At the Pukaki locality this advance was of comparable scale to subsequent advances that, from the remaining exposure ages, occurred between 28,000 and 25,000, at 21,000, and at 18,000 years ago. Collectively, all four moraine-building events represent the LGM. The glacier advance 42,000 years ago in the Southern Alps coincides in Antarctica with a cold episode, shown by the isotopic record from the EPICA Dome C ice core, between the prominent A1 and A2 warming events. Therefore, the implication of the Pukaki glacier record is that as early as 42,000 years ago an episode of glacial cold similar to that of the LGM extended in the atmosphere from high on the East Antarctic plateau to at least as far north as the Southern Alps (∼44◦S). Such a cold episode is thought to reflect the translation through the atmosphere and/or the ocean of the anti-phased effects of Northern Hemisphere interstadial conditions to the southern half of the Southern Hemisphere. Regardless of the mechanism, any explanation for the cold episode at 42,000 years ago must account for its widespread atmospheric footprint not only in Antarctica but also within the westerly wind belt in southern mid-latitudes.
© 2014 Elsevier B.V. All rights reserved.
1. Introduction
The role of millennial-scale climate episodes in Late Quater-nary glacial cycles is only partly resolved. Between 80,000 and
* Corresponding author. Tel.: +1 716 645 4331.E-mail address: [email protected] (S.E. Kelley).
1 Present address: Department of Geology, 411 Cooke Hall, University at Buffalo, Buffalo, NY 14260, USA.
2 Deceased.
http://dx.doi.org/10.1016/j.epsl.2014.07.0310012-821X/© 2014 Elsevier B.V. All rights reserved.
18,000 years ago during the last glaciation, the climate record from the EPICA Dronning Maud Land (EPICA DML) ice core in-dicates strong coupling of millennial-scale cold events in Green-land with warming events in Antarctica (EPICA Community Mem-bers, 2006). This relation is highlighted during the middle of the last glaciation when cold northern Heinrich stadials HS4, HS5, HS5a, and HS6 were coupled, respectively, with the pro-nounced A1, A2, A3, and A4 warming events in Antarctica (Ahn and Brook, 2008; Ahn et al., 2012). This anti-phased relation
S.E. Kelley et al. / Earth and Planetary Science Letters 405 (2014) 194–206 195
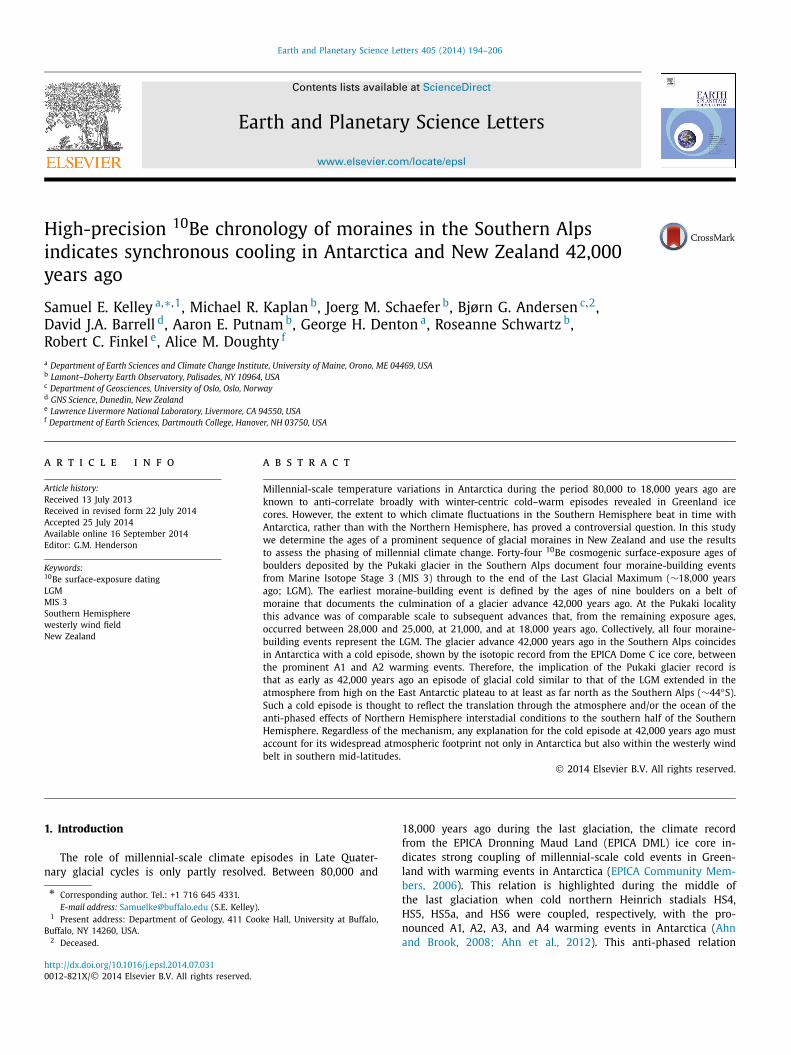
Fig. 1. The setting of the Southern Alps, in relation to the landmasses of the mid- to southern sector of the Southern Hemisphere and the Southern Ocean, with schematic physical oceanography adapted from Brown et al. (2001). The subtropical front marks the outer boundary of the Southern Ocean. Sites referred to in the text are annotated.
between Greenland and Antarctic millennial-scale climate episodes is generally ascribed to the operation of a so-called bipolar see-saw between the hemispheres (Broecker, 1998). But it is debat-able as to how much of this seesaw is internal to the ocean and how much resides in latitudinal shifts of atmospheric wind belts (Anderson et al., 2009; Denton et al., 2010). A resolution of the mechanisms controlling interhemispheric relationships de-pends, in part, on determining the spatial expanse and precise chronology of Antarctic climate signals elsewhere in the Southern Hemisphere.
Progress has been made with regard to establishing the wider geographical spread and timing of Antarctic climate signals, par-ticularly during the latter part of the last glaciation, in terres-trial locations (Denton et al., 1999; Putnam et al., 2010a, 2013a; Whittaker et al., 2011) as well as in marine settings (Barrows and Juggins, 2005; Kaiser et al., 2005; Pahnke and Zahn, 2005;Pahnke and Sachs, 2006; De Deckker et al., 2012). But data re-main sparse prior to Marine Isotope Stage 2 (MIS 2) in terres-trial localities due to the limitations of radiocarbon dating, as well as to the destructive effects of multiple glaciations on the landscape. Here we contribute to the resolution of this question by precise 10Be surface-exposure dating of a prominent sequence of moraines in the Southern Alps, central South Island of New Zealand.
2. Setting
New Zealand lies in a maritime setting in the Southern Hemi-sphere mid-latitudes (Fig. 1). Straddling the Subtropical Front, which marks the northern edge of the Southern Ocean, the South Island of New Zealand is well positioned for the evaluation of hypotheses concerning climate-forcing mechanisms. Of particu-lar importance is the geomorphological record of glaciers in the Southern Alps, because there are few landmasses in the Southern Hemisphere mid-latitudes from which to obtain terrestrially-based palaeoclimate histories. The highest parts of the Southern Alps support localized modern glaciers, but during glaciations, South-ern Alps glaciers extended out onto adjacent lowlands, where they formed belts of moraines marking the extent of past glacier ex-pansions (Suggate, 1990; Barrell, 2011; Barrell et al., 2011). Using these moraine records in concert with dating and spatial recon-structions of the past extents of glaciers affords a basis for es-timating the climatic conditions, especially atmospheric temper-atures, necessary to have generated glaciers of a particular ex-tent (Putnam et al., 2012, 2013a, 2013b; Doughty et al., 2013;Kaplan et al., 2013).
The South Island lies within the Southern Hemisphere mid-latitude westerly wind belt. The strength of the westerly circu-lation varies semi-annually, in unison with the seasonal shift of the global atmospheric circulation belts. During austral summer and autumn, South Island climate is partly influenced by the
196 S.E. Kelley et al. / Earth and Planetary Science Letters 405 (2014) 194–206
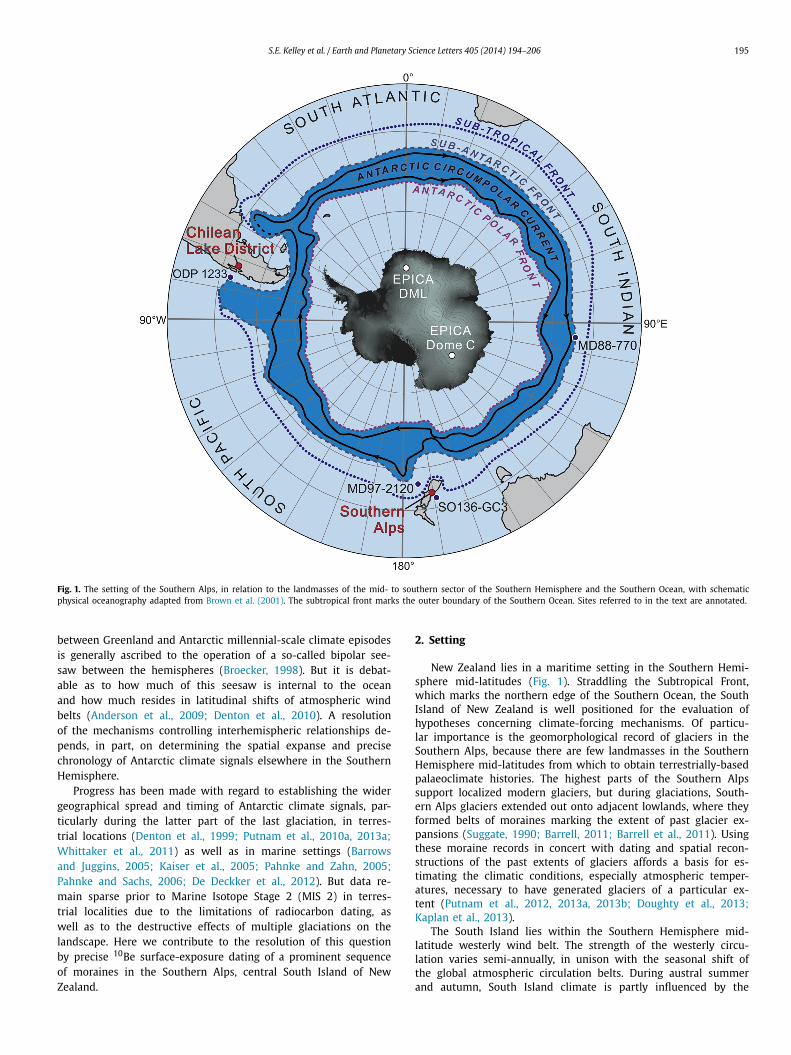
Fig. 2. Location map showing the study area (black box; Fig. 3) overlain on a glacial geomorphologic map (after Barrell et al., 2011), annotated with the points of view for Figs. 4, 5, and 6. The location of a radiocarbon age from previous work (white box) is also shown, in cal. ka BP (Barrell and Read, 2014). Inset in the upper left corner is the location in New Zealand. Geomorphologic legend is inset in the lower right.
subtropical high-pressure belt, but is dominated by the westerly wind belt during austral winter and spring. Mean annual tem-perature at the west and east coasts of the central South Island is ∼12 ◦C (Barrell et al., 2011). The northeast–southwest trend-ing Southern Alps present a topographic barrier to the prevailing westerly-quarter winds, creating a strong orographic precipitation regime. Mean annual precipitation is at least 10 m/yr at and im-mediately west of the crest of the mountain chain, but undergoes a near-exponential decline across the rain-shadow zone east of the crest, and is only ∼0.6 m/yr at the south end of Lake Pukaki, 60 km to the south (Henderson and Thompson, 1999).
This study focuses on the Lake Pukaki area, located on the southeastern side of the Southern Alps. The Lake Pukaki catch-ment includes the highest part of the mountain chain, lies in the footprint of a past glacier, and is flanked by an exceptionally well-preserved set of moraine belts (Barrell et al., 2011). Furthermore, the Pukaki valley moraines are studded by many boulders that are well suited to cosmogenic exposure dating (Schaefer et al., 2006). This study utilizes cosmogenic exposure dating to determine the age of lateral moraines on the true left (eastern) side of the Lake Pukaki valley.
3. Glacial history
During Late Quaternary glaciations, a large ice lobe as much as 80 km long (referred to here as Pukaki glacier) flowed southward from the highest parts of the Southern Alps. Lake Pukaki lies in the lowest part of the trough evacuated by the retreat of the Pukaki glacier at the end of the Last Glaciation (Fig. 2). Belts of moraines and associated outwash plains on the perimeter of the Pukaki glacier trough provide geomorphological evidence for at least four major episodes of glacial advance from the Pukaki catchment. From oldest to youngest, they are named the Wolds, Balmoral, Mt. John and Tekapo (Gair, 1967; Cox and Barrell, 2007). Recent studies have provided direct chronologic constraints on the Balmoral moraine belt (Schaefer, 2012) and the Tekapo moraine belt (Schaefer et al., 2006; Putnam et al., 2010b), of 64.8 ± 3.2 ka and 18.4 ± 2.2 ka re-spectively. We regard the expansion of ice into the Pukaki glacier trough as indicative of full-scale glaciation climatic conditions in the catchment, abbreviated in this paper to ‘full-glacial’ condi-tions. The Tekapo advance was associated with the last major episode of full-glacial conditions during the Last Glacial Maxi-mum (LGM) in the Pukaki catchment. The Pukaki glacier retreated rapidly from the Tekapo moraine belt during the Last Termination
S.E. Kelley et al. / Earth and Planetary Science Letters 405 (2014) 194–206 197
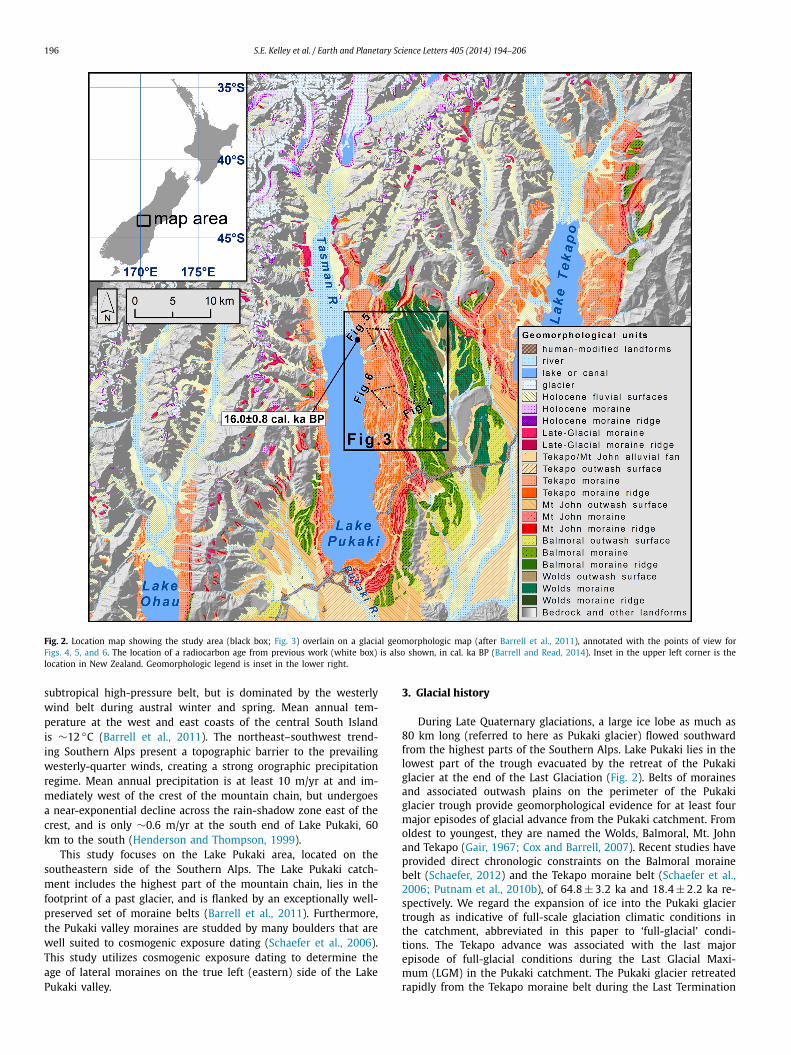
Fig. 3. 10Be ages (inside white boxes), with sample locations (yellow dots) overlain on a geomorphological map, slightly modified after (Barrell et al., 2011). Shaded regions represent different glacial deposits; see legend in Fig. 2 for explanation. A legend for linear geomorphic features is included in the upper right corner. (For interpretation of the references to color in this figure legend, the reader is referred to the web version of this article.)
(Barrell and Read, 2014), but later underwent a resurgence, cul-minating at 12.97 ± 0.30 ka, that formed the Birch Hill moraines in the lower reaches of the Tasman River valley (Fig. 2; Putnam et al., 2010a), during the Late Glacial climate episode in New Zealand (15.64 ± 0.41 ka to 12.55 ± 0.14 ka; Barrell et al., 2013;Barrell and Read, 2014).
It is widely held that the main climatic parameter affecting the behavior of mountain valley glaciers is atmospheric temperature (e.g., Oerlemans, 1997; Anderson et al., 2010; Purdie et al., 2011). Reconstructions of the Pukaki glacier (Porter, 1975; Golledge et al., 2012) and the Ohau glacier (Putnam et al., 2013a) which occupied the catchment of Lake Ohau (Fig. 2) indicate that under full-glacial conditions during the LGM, the equilibrium line was approximately
900 m lower than present, implying a mean annual temperature of about 6◦ to 6.5◦ cooler than present.
The area targeted in this study comprises the northern portion of the Pukaki glacier lateral moraine sequence on the eastern side of the valley at ∼43.9◦S, 170.2◦E. The moraine sequence there comprises three main elements (Figs. 2 and 3). Outermost are topographically subdued moraines attributed to the Balmoral ad-vance (Gair, 1967; Cox and Barrell, 2007; Barrell, 2014). Balmoral moraine ridges are of low relief and have few surface boulders. In-board is a broad complex of more sharply defined moraines and outwash channels, attributed to the Mt. John advances. The Mt. John moraines are in places very bouldery and of greater relief than their Balmoral counterparts. An underfit stream, Mary Burn, flows along the outer (eastern) margin of the Mt. John landform
198 S.E. Kelley et al. / Earth and Planetary Science Letters 405 (2014) 194–206
complex. Closest to the lake basin is the Tekapo moraine belt, with prominent constructional moraine ridges near its outer margin, giving way to gently inward sloping morainal topography, with dis-continuous moraine ridges, numerous kettle holes and basinward-draining gullies, that marks recession following the culmination of the Tekapo advance (corresponding to the ‘deglacial moraines’ of Schaefer et al., 2006).
4. Methods
The relatively dry climate of the eastern flank of the Southern Alps is ideal for surface-exposure dating (e.g., Schaefer et al., 2006, 2009; Kaplan et al., 2010, 2013; Putnam et al., 2010b). Our sam-pling targeted quartzofeldspathic sandstone (greywacke) boulders, which is the predominant lithology of the Pukaki catchment. The sampling focused on large boulders that are well embedded at or near the crests of moraine ridges, and hence are unlikely to have rolled or to have been tipped since emplacement. For preference, we selected boulders with a level and flat top, as these are consid-ered to have been less susceptible to erosion than boulders with irregular tops, and we avoided boulders showing any signs of ero-sion, such as debris accumulations beside the boulder.
Most samples were collected using a hammer and titanium-carbide chisel. On particularly hard boulders, a Hilti TE-6A rotary hammer drill was used to bore a hole into the boulder, in which a small charge (0.22 caliber blank cartridge) was detonated to re-lease the desired sample (Kelly et al., 2008). Samples ranged in thickness from ∼1 to ∼4 cm, averaging 2.3 cm (Table 1). All sam-pled boulders were measured, sketched, and photographed from at least four directions to characterize fully the boulder, the sampling surface, and the geomorphic context. The locations of all sampled boulders, as well as the topographic profiles of the landforms, were measured by differential GPS with a Trimble ProXH GPS, in terms of the WGS 1984 geographical datum, and using the Mt. John Ob-servatory as a base station. To estimate topographic shielding, the local horizon was characterized by measuring the inclination of the skyline at specific azimuths using compass and clinometer. The attitude of the sampled surface was measured using a geological compass. Samples were processed at the Lamont-Doherty Cosmo-genic Nuclide Laboratory (LDCN) for 10Be analysis using a low background 9Be carrier. The LDCN laboratory’s procedure involves both physical and chemical preparations (see Schaefer et al., 2009). Ratios of 10Be/9Be were measured relative to the 07KNSTD3110standard (Nishiizumi et al., 2007) at Lawrence Livermore National Laboratory, and were corrected for background 10Be by procedural blanks with an average blank value of 4.335 × 10⁻¹⁶ (n = 6).
Following Balco et al. (2009), we calculated ages from the mea-sured 10Be/9Be ratios using the CRONUS-Earth online calculator, v. 2.1 (Balco et al., 2008), and the New Zealand production rate (Putnam et al., 2010b). Mean sea-level air pressure was derived from the NCAR world monthly surface station climatology dataset used in the CRONUS calculator. Measured topographic shielding corrections were entered into the calculator, along with sample thickness, expressed as a measured mass-weighted average thick-ness, utilizing a density value of 2.7 g/cm3. A neutron attenuation length of 177 g/cm2 was used in all calculations (Farber et al., 2008), though we note here calculations using a value between 160 and 150 g/cm2 (Balco et al., 2008) yield ages <1% older, thus our conclusions below are independent of the choice used. No cor-rections were applied for snow cover or erosion, following the reasoning set out by Putnam et al. (2010a, 2013b), and references therein. By way of summary, there is no persistent winter snow cover at the elevations of the study area, and the effects of ero-sion, if any, will essentially be accounted for in the use of the local 10Be production rate, which is defined from locations within a few tens of kilometers of the study area, in a similar geological and
climatic setting, and on a similar greywacke lithology. The error terms of the calculated ages reflect only internal analytical uncer-tainty derived from the measurement of 9Be/10Be ratios.
5. Results and interpretations
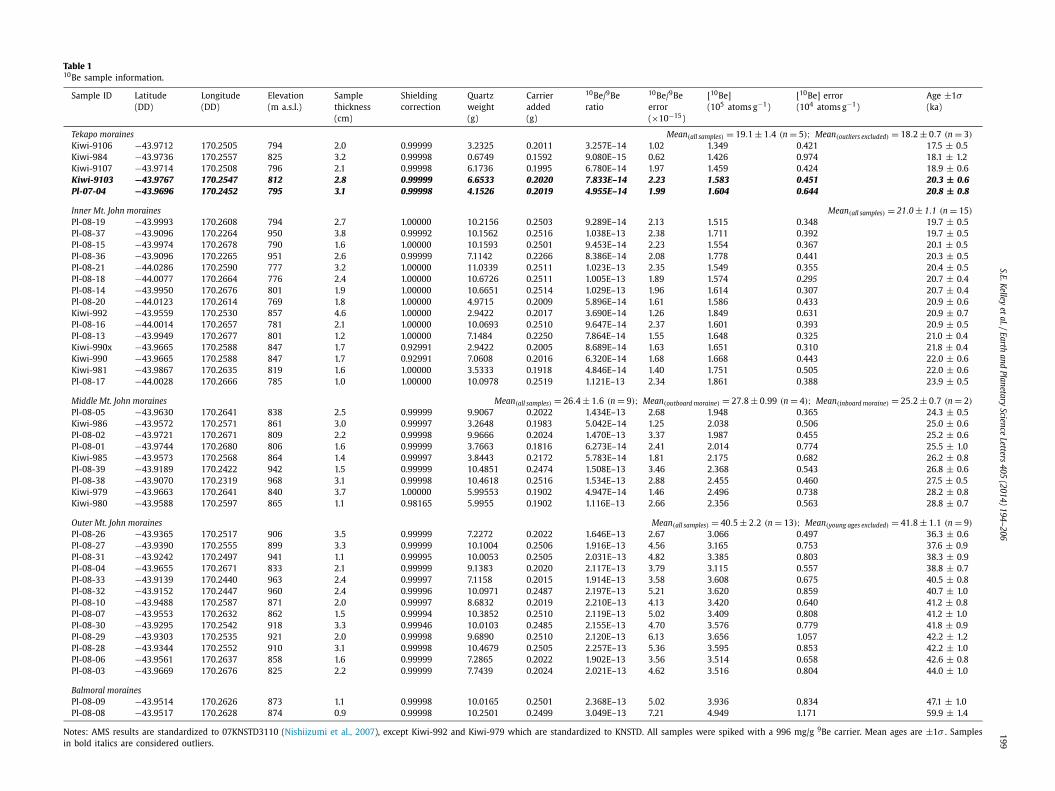
Our chronology consists of forty-four 10Be exposure ages from surface boulders. Detail information on the samples is provided in Table 1, and sample locations are plotted on a glacial geomorphic map in Fig. 3, as well as on oblique aerial photographs in Figs. 4, 5, and 6.
5.1. Balmoral moraines
Two boulders were dated from the Balmoral moraine belt, the outermost moraines examined in this study, and yielded the oldest ages of our chronology, 59.9 ± 1.4 ka (PL-08-08), and 47.1 ± 1.0 ka(PL-08-09; Figs. 3, 4, 5; Table 1). These two boulders are located within 10 m of one another on the same moraine ridge crest. The boulder that yielded the younger age protrudes 0.5 m above the moraine ridge surface, while the other boulder protrudes 0.8 m. Thus the younger age came from the shorter boulder. There are at least four possible interpretations of the different ages yielded by these boulders: (1) the younger age is a correct depositional age, and the older age is due to a prior exposure history of that boulder’s surface; (2) the older age is a correct depositional age, and the younger age is due to post-depositional disturbance of the boulder, for example by an unrecognized spallation of the boul-der surface, or its exhumation by erosion of formerly enclosing sediments; (3) both ages are correct, and the moraine ridge is of composite age, representing two separate glacier margins positions at different times; and (4) both ages are incorrect depositional ages.
Unfortunately, as there are only two ages and thus no objec-tive way to identify which, if either, is an outlier, we may only speculate on the relative likelihoods of the four possible interpre-tations. In favor of interpretation (1) is the tentative recognition of a ‘full-glacial’ ice advance at ∼48 ka in the southwestern South Island (Williams, 1996) and in the Rakaia valley of the eastern cen-tral South Island (Shulmeister et al., 2010a), noting that in each case, the identification is based on a single date from a single stratigraphic exposure. In addition, evidence for a ‘full-glacial’ ice advance in the western South Island is presented by Almond et al.(2001), with an age estimated to lie between ∼45 and ∼50 ka. In favor of (2) is that the older age is close to the age of the Balmoral moraines in the southern terminal sector of the Pukaki moraine sequence (Schaefer, 2012). However, we note that our study area encroaches the innermost margin of the Balmoral moraines, well up-valley of the terminus, and may conceivably be on a younger sector of the Balmoral moraine belt. This consideration potentially corroborates interpretation (2), but also means that interpretation (1) cannot be excluded in regard to the results for Schaefer (2012). There is no direct morphological evidence that would support in-terpretation (3), and given the mutual proximity of the boulders, interpretation (3) seems the least likely explanation. Interpreta-tion (4) remains a valid possibility that cannot be discounted from present information. For the reason that only interpretation (3) seems unlikely, and we cannot determine which of the mutually-incompatible interpretations (1), (2) and (4) is more likely to be correct, we do not devote any further evaluation or discussion to the results from our dating of these two boulders on the Balmoral moraine belt, other than noting that both ages are older than those from the Mt. John moraines.
S.E.Kelleyet
al./Earthand
PlanetaryScience
Letters405
(2014)194–206
199Table 1
g−1)[10Be] error (104 atoms g−1)
Age ±1σ(ka)
± 1.4 (n = 5); Mean(outliers excluded) = 18.2 ± 0.7 (n = 3)
0.421 17.5 ± 0.50.974 18.1 ± 1.20.424 18.9 ± 0.60.451 20.3 ± 0.60.644 20.8 ± 0.8
Mean(all samples) = 21.0 ± 1.1 (n = 15)
0.348 19.7 ± 0.50.392 19.7 ± 0.50.367 20.1 ± 0.50.441 20.3 ± 0.50.355 20.4 ± 0.50.295 20.7 ± 0.40.307 20.7 ± 0.40.433 20.9 ± 0.60.631 20.9 ± 0.70.393 20.9 ± 0.50.325 21.0 ± 0.40.310 21.8 ± 0.40.443 22.0 ± 0.60.505 22.0 ± 0.60.388 23.9 ± 0.5
0.99 (n = 4); Mean(inboard moraine) = 25.2 ± 0.7 (n = 2)
0.365 24.3 ± 0.50.506 25.0 ± 0.60.455 25.2 ± 0.60.774 25.5 ± 1.00.682 26.2 ± 0.80.543 26.8 ± 0.60.460 27.5 ± 0.50.738 28.2 ± 0.80.563 28.8 ± 0.7
.2 (n = 13); Mean(young ages excluded) = 41.8 ± 1.1 (n = 9)
0.497 36.3 ± 0.60.753 37.6 ± 0.90.803 38.3 ± 0.90.557 38.8 ± 0.70.675 40.5 ± 0.80.859 40.7 ± 1.00.640 41.2 ± 0.80.808 41.2 ± 1.00.779 41.8 ± 0.91.057 42.2 ± 1.20.853 42.2 ± 1.00.658 42.6 ± 0.80.804 44.0 ± 1.0
0.834 47.1 ± 1.01.171 59.9 ± 1.4
ith a 996 mg/g 9Be carrier. Mean ages are ±1σ . Samples
10Be sample information.
Sample ID Latitude (DD)
Longitude (DD)
Elevation (m a.s.l.)
Sample thickness (cm)
Shielding correction
Quartz weight (g)
Carrier added (g)
10Be/9Be ratio
10Be/9Be error (×10−15)
[10Be] (105 atoms
Tekapo moraines Mean(all samples) = 19.1Kiwi-9106 −43.9712 170.2505 794 2.0 0.99999 3.2325 0.2011 3.257E–14 1.02 1.349Kiwi-984 −43.9736 170.2557 825 3.2 0.99998 0.6749 0.1592 9.080E–15 0.62 1.426Kiwi-9107 −43.9714 170.2508 796 2.1 0.99998 6.1736 0.1995 6.780E–14 1.97 1.459Kiwi-9103 −43.9767 170.2547 812 2.8 0.99999 6.6533 0.2020 7.833E–14 2.23 1.583Pl-07-04 −43.9696 170.2452 795 3.1 0.99998 4.1526 0.2019 4.955E–14 1.99 1.604
Inner Mt. John morainesPl-08-19 −43.9993 170.2608 794 2.7 1.00000 10.2156 0.2503 9.289E–14 2.13 1.515Pl-08-37 −43.9096 170.2264 950 3.8 0.99992 10.1562 0.2516 1.038E–13 2.38 1.711Pl-08-15 −43.9974 170.2678 790 1.6 1.00000 10.1593 0.2501 9.453E–14 2.23 1.554Pl-08-36 −43.9096 170.2265 951 2.6 0.99999 7.1142 0.2266 8.386E–14 2.08 1.778Pl-08-21 −44.0286 170.2590 777 3.2 1.00000 11.0339 0.2511 1.023E–13 2.35 1.549Pl-08-18 −44.0077 170.2664 776 2.4 1.00000 10.6726 0.2511 1.005E–13 1.89 1.574Pl-08-14 −43.9950 170.2676 801 1.9 1.00000 10.6651 0.2514 1.029E–13 1.96 1.614Pl-08-20 −44.0123 170.2614 769 1.8 1.00000 4.9715 0.2009 5.896E–14 1.61 1.586Kiwi-992 −43.9559 170.2530 857 4.6 1.00000 2.9422 0.2017 3.690E–14 1.26 1.849Pl-08-16 −44.0014 170.2657 781 2.1 1.00000 10.0693 0.2510 9.647E–14 2.37 1.601Pl-08-13 −43.9949 170.2677 801 1.2 1.00000 7.1484 0.2250 7.864E–14 1.55 1.648Kiwi-990x −43.9665 170.2588 847 1.7 0.92991 2.9422 0.2005 8.689E–14 1.63 1.651Kiwi-990 −43.9665 170.2588 847 1.7 0.92991 7.0608 0.2016 6.320E–14 1.68 1.668Kiwi-981 −43.9867 170.2635 819 1.6 1.00000 3.5333 0.1918 4.846E–14 1.40 1.751Pl-08-17 −44.0028 170.2666 785 1.0 1.00000 10.0978 0.2519 1.121E–13 2.34 1.861
Middle Mt. John moraines Mean(all samples) = 26.4 ± 1.6 (n = 9); Mean(outboard moraine) = 27.8 ±Pl-08-05 −43.9630 170.2641 838 2.5 0.99999 9.9067 0.2022 1.434E–13 2.68 1.948Kiwi-986 −43.9572 170.2571 861 3.0 0.99997 3.2648 0.1983 5.042E–14 1.25 2.038Pl-08-02 −43.9721 170.2671 809 2.2 0.99998 9.9666 0.2024 1.470E–13 3.37 1.987Pl-08-01 −43.9744 170.2680 806 1.6 0.99999 3.7663 0.1816 6.273E–14 2.41 2.014Kiwi-985 −43.9573 170.2568 864 1.4 0.99997 3.8443 0.2172 5.783E–14 1.81 2.175Pl-08-39 −43.9189 170.2422 942 1.5 0.99999 10.4851 0.2474 1.508E–13 3.46 2.368Pl-08-38 −43.9070 170.2319 968 3.1 0.99998 10.4618 0.2516 1.534E–13 2.88 2.455Kiwi-979 −43.9663 170.2641 840 3.7 1.00000 5.99553 0.1902 4.947E–14 1.46 2.496Kiwi-980 −43.9588 170.2597 865 1.1 0.98165 5.9955 0.1902 1.116E–13 2.66 2.356
Outer Mt. John moraines Mean(all samples) = 40.5 ± 2Pl-08-26 −43.9365 170.2517 906 3.5 0.99999 7.2272 0.2022 1.646E–13 2.67 3.066Pl-08-27 −43.9390 170.2555 899 3.3 0.99999 10.1004 0.2506 1.916E–13 4.56 3.165Pl-08-31 −43.9242 170.2497 941 1.1 0.99995 10.0053 0.2505 2.031E–13 4.82 3.385Pl-08-04 −43.9655 170.2671 833 2.1 0.99999 9.1383 0.2020 2.117E–13 3.79 3.115Pl-08-33 −43.9139 170.2440 963 2.4 0.99997 7.1158 0.2015 1.914E–13 3.58 3.608Pl-08-32 −43.9152 170.2447 960 2.4 0.99996 10.0971 0.2487 2.197E–13 5.21 3.620Pl-08-10 −43.9488 170.2587 871 2.0 0.99997 8.6832 0.2019 2.210E–13 4.13 3.420Pl-08-07 −43.9553 170.2632 862 1.5 0.99994 10.3852 0.2510 2.119E–13 5.02 3.409Pl-08-30 −43.9295 170.2542 918 3.3 0.99946 10.0103 0.2485 2.155E–13 4.70 3.576Pl-08-29 −43.9303 170.2535 921 2.0 0.99998 9.6890 0.2510 2.120E–13 6.13 3.656Pl-08-28 −43.9344 170.2552 910 3.1 0.99998 10.4679 0.2505 2.257E–13 5.36 3.595Pl-08-06 −43.9561 170.2637 858 1.6 0.99999 7.2865 0.2022 1.902E–13 3.56 3.514Pl-08-03 −43.9669 170.2676 825 2.2 0.99999 7.7439 0.2024 2.021E–13 4.62 3.516
Balmoral morainesPl-08-09 −43.9514 170.2626 873 1.1 0.99998 10.0165 0.2501 2.368E–13 5.02 3.936Pl-08-08 −43.9517 170.2628 874 0.9 0.99998 10.2501 0.2499 3.049E–13 7.21 4.949
Notes: AMS results are standardized to 07KNSTD3110 (Nishiizumi et al., 2007), except Kiwi-992 and Kiwi-979 which are standardized to KNSTD. All samples were spiked win bold italics are considered outliers.
200 S.E. Kelley et al. / Earth and Planetary Science Letters 405 (2014) 194–206
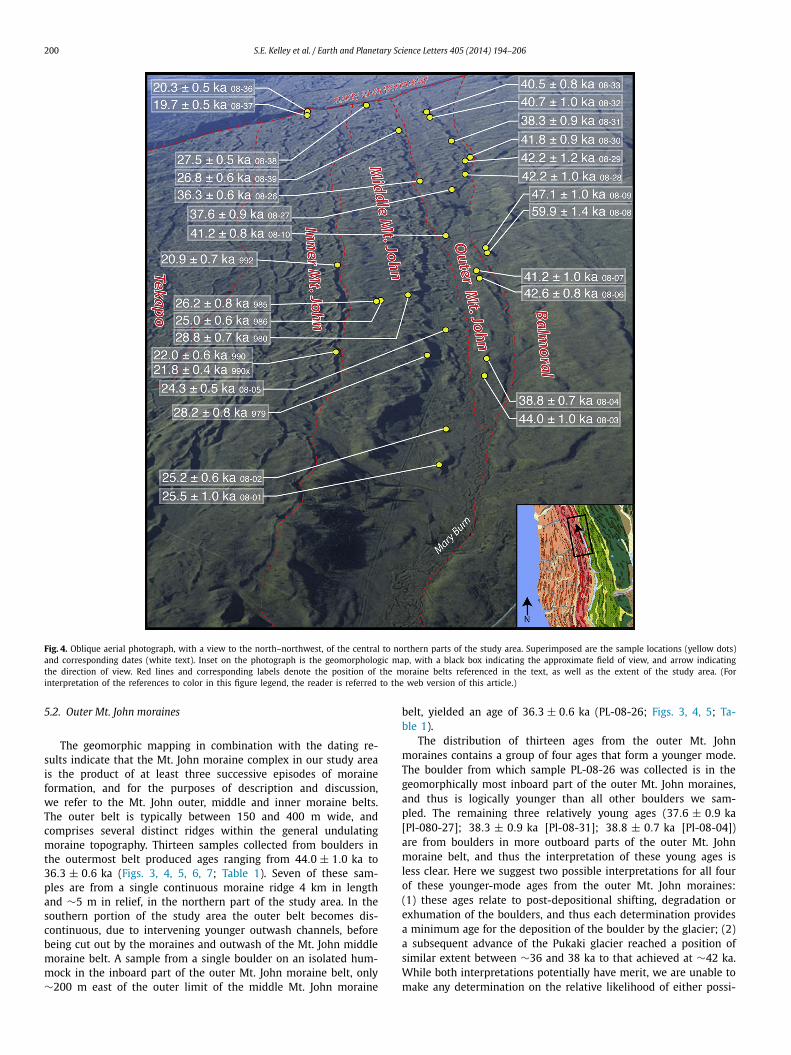
Fig. 4. Oblique aerial photograph, with a view to the north–northwest, of the central to northern parts of the study area. Superimposed are the sample locations (yellow dots) and corresponding dates (white text). Inset on the photograph is the geomorphologic map, with a black box indicating the approximate field of view, and arrow indicating the direction of view. Red lines and corresponding labels denote the position of the moraine belts referenced in the text, as well as the extent of the study area. (For interpretation of the references to color in this figure legend, the reader is referred to the web version of this article.)
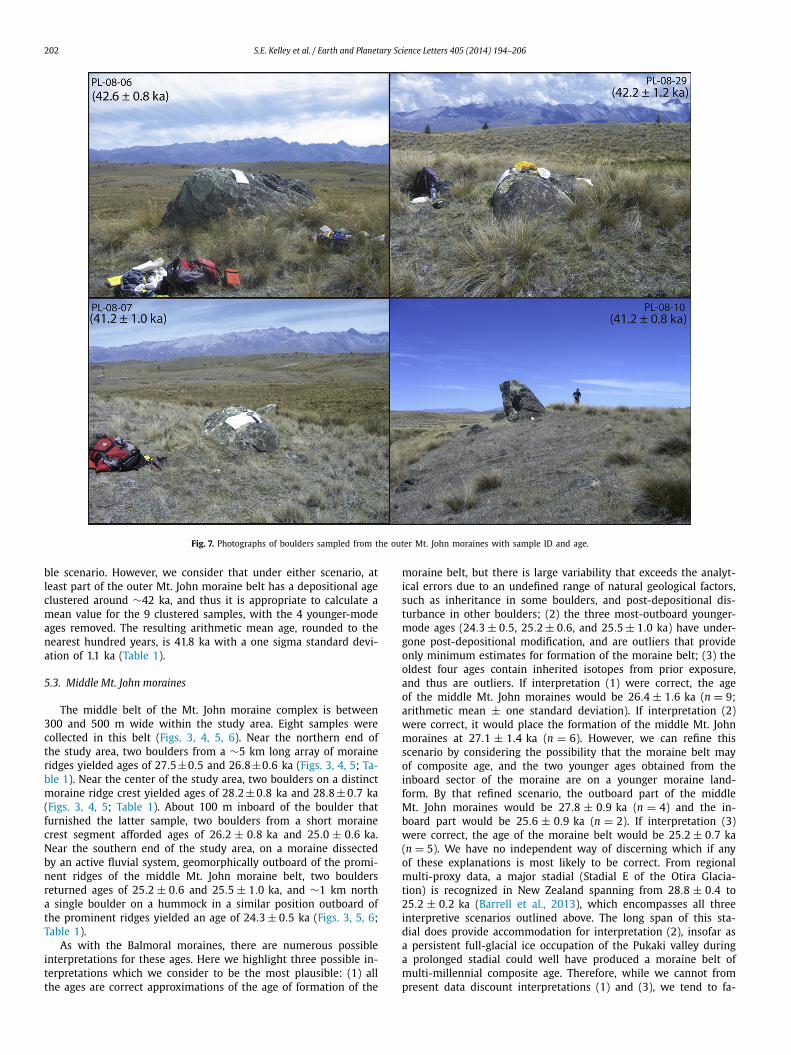
5.2. Outer Mt. John moraines
The geomorphic mapping in combination with the dating re-sults indicate that the Mt. John moraine complex in our study area is the product of at least three successive episodes of moraine formation, and for the purposes of description and discussion, we refer to the Mt. John outer, middle and inner moraine belts. The outer belt is typically between 150 and 400 m wide, and comprises several distinct ridges within the general undulating moraine topography. Thirteen samples collected from boulders in the outermost belt produced ages ranging from 44.0 ± 1.0 ka to 36.3 ± 0.6 ka (Figs. 3, 4, 5, 6, 7; Table 1). Seven of these sam-ples are from a single continuous moraine ridge 4 km in length and ∼5 m in relief, in the northern part of the study area. In the southern portion of the study area the outer belt becomes dis-continuous, due to intervening younger outwash channels, before being cut out by the moraines and outwash of the Mt. John middle moraine belt. A sample from a single boulder on an isolated hum-mock in the inboard part of the outer Mt. John moraine belt, only ∼200 m east of the outer limit of the middle Mt. John moraine
belt, yielded an age of 36.3 ± 0.6 ka (PL-08-26; Figs. 3, 4, 5; Ta-ble 1).
The distribution of thirteen ages from the outer Mt. John moraines contains a group of four ages that form a younger mode. The boulder from which sample PL-08-26 was collected is in the geomorphically most inboard part of the outer Mt. John moraines, and thus is logically younger than all other boulders we sam-pled. The remaining three relatively young ages (37.6 ± 0.9 ka[Pl-080-27]; 38.3 ± 0.9 ka [Pl-08-31]; 38.8 ± 0.7 ka [Pl-08-04]) are from boulders in more outboard parts of the outer Mt. John moraine belt, and thus the interpretation of these young ages is less clear. Here we suggest two possible interpretations for all four of these younger-mode ages from the outer Mt. John moraines: (1) these ages relate to post-depositional shifting, degradation or exhumation of the boulders, and thus each determination provides a minimum age for the deposition of the boulder by the glacier; (2) a subsequent advance of the Pukaki glacier reached a position of similar extent between ∼36 and 38 ka to that achieved at ∼42 ka. While both interpretations potentially have merit, we are unable to make any determination on the relative likelihood of either possi-
S.E. Kelley et al. / Earth and Planetary Science Letters 405 (2014) 194–206 201
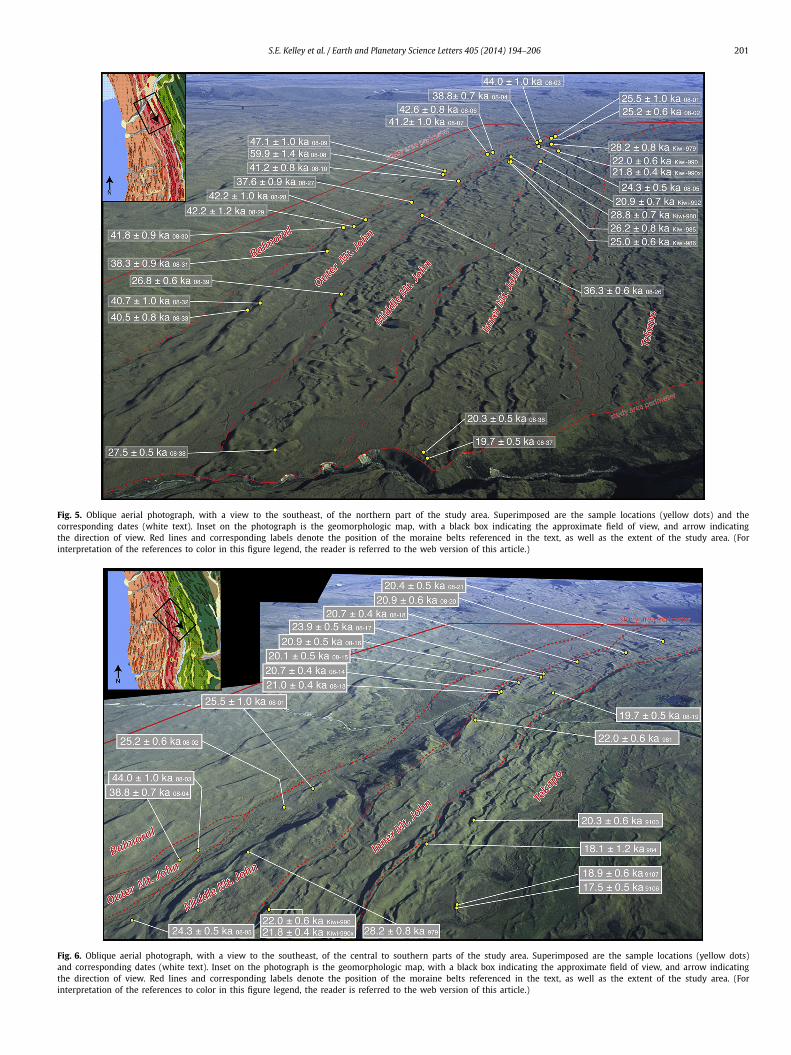
Fig. 5. Oblique aerial photograph, with a view to the southeast, of the northern part of the study area. Superimposed are the sample locations (yellow dots) and the corresponding dates (white text). Inset on the photograph is the geomorphologic map, with a black box indicating the approximate field of view, and arrow indicating the direction of view. Red lines and corresponding labels denote the position of the moraine belts referenced in the text, as well as the extent of the study area. (For interpretation of the references to color in this figure legend, the reader is referred to the web version of this article.)
Fig. 6. Oblique aerial photograph, with a view to the southeast, of the central to southern parts of the study area. Superimposed are the sample locations (yellow dots) and corresponding dates (white text). Inset on the photograph is the geomorphologic map, with a black box indicating the approximate field of view, and arrow indicating the direction of view. Red lines and corresponding labels denote the position of the moraine belts referenced in the text, as well as the extent of the study area. (For interpretation of the references to color in this figure legend, the reader is referred to the web version of this article.)
202 S.E. Kelley et al. / Earth and Planetary Science Letters 405 (2014) 194–206
Fig. 7. Photographs of boulders sampled from the outer Mt. John moraines with sample ID and age.
ble scenario. However, we consider that under either scenario, at least part of the outer Mt. John moraine belt has a depositional age clustered around ∼42 ka, and thus it is appropriate to calculate a mean value for the 9 clustered samples, with the 4 younger-mode ages removed. The resulting arithmetic mean age, rounded to the nearest hundred years, is 41.8 ka with a one sigma standard devi-ation of 1.1 ka (Table 1).
5.3. Middle Mt. John moraines
The middle belt of the Mt. John moraine complex is between 300 and 500 m wide within the study area. Eight samples were collected in this belt (Figs. 3, 4, 5, 6). Near the northern end of the study area, two boulders from a ∼5 km long array of moraine ridges yielded ages of 27.5 ±0.5 and 26.8 ±0.6 ka (Figs. 3, 4, 5; Ta-ble 1). Near the center of the study area, two boulders on a distinct moraine ridge crest yielded ages of 28.2 ±0.8 ka and 28.8 ±0.7 ka(Figs. 3, 4, 5; Table 1). About 100 m inboard of the boulder that furnished the latter sample, two boulders from a short moraine crest segment afforded ages of 26.2 ± 0.8 ka and 25.0 ± 0.6 ka. Near the southern end of the study area, on a moraine dissected by an active fluvial system, geomorphically outboard of the promi-nent ridges of the middle Mt. John moraine belt, two boulders returned ages of 25.2 ± 0.6 and 25.5 ± 1.0 ka, and ∼1 km north a single boulder on a hummock in a similar position outboard of the prominent ridges yielded an age of 24.3 ± 0.5 ka (Figs. 3, 5, 6; Table 1).
As with the Balmoral moraines, there are numerous possible interpretations for these ages. Here we highlight three possible in-terpretations which we consider to be the most plausible: (1) all the ages are correct approximations of the age of formation of the
moraine belt, but there is large variability that exceeds the analyt-ical errors due to an undefined range of natural geological factors, such as inheritance in some boulders, and post-depositional dis-turbance in other boulders; (2) the three most-outboard younger-mode ages (24.3 ± 0.5, 25.2 ± 0.6, and 25.5 ± 1.0 ka) have under-gone post-depositional modification, and are outliers that provide only minimum estimates for formation of the moraine belt; (3) the oldest four ages contain inherited isotopes from prior exposure, and thus are outliers. If interpretation (1) were correct, the age of the middle Mt. John moraines would be 26.4 ± 1.6 ka (n = 9; arithmetic mean ± one standard deviation). If interpretation (2) were correct, it would place the formation of the middle Mt. John moraines at 27.1 ± 1.4 ka (n = 6). However, we can refine this scenario by considering the possibility that the moraine belt may of composite age, and the two younger ages obtained from the inboard sector of the moraine are on a younger moraine land-form. By that refined scenario, the outboard part of the middle Mt. John moraines would be 27.8 ± 0.9 ka (n = 4) and the in-board part would be 25.6 ± 0.9 ka (n = 2). If interpretation (3) were correct, the age of the moraine belt would be 25.2 ± 0.7 ka(n = 5). We have no independent way of discerning which if any of these explanations is most likely to be correct. From regional multi-proxy data, a major stadial (Stadial E of the Otira Glacia-tion) is recognized in New Zealand spanning from 28.8 ± 0.4 to 25.2 ± 0.2 ka (Barrell et al., 2013), which encompasses all three interpretive scenarios outlined above. The long span of this sta-dial does provide accommodation for interpretation (2), insofar as a persistent full-glacial ice occupation of the Pukaki valley during a prolonged stadial could well have produced a moraine belt of multi-millennial composite age. Therefore, while we cannot from present data discount interpretations (1) and (3), we tend to fa-
S.E. Kelley et al. / Earth and Planetary Science Letters 405 (2014) 194–206 203
vor interpretation (2), and thus use 27.8 ± 0.9 ka as the age of the outboard part of the middle Mt. John moraines in our discus-sion with tentative evidence of an inboard moraine deposited at 25.6 ± 0.9 ka. Overall, we have high certainty that the age of this moraine belt lies somewhere between ∼25 ka and ∼28 ka, which encompasses all three interpretations that are set out above.
5.4. Inner Mt. John moraines
The inner belt of the Mt. John moraine complex is typically about 800 m wide and has, at its outboard margin, a semi-continuous composite moraine ridge characterized by a moderate (12◦ to 15◦) ice-proximal slope and a maximum height of 11 m. Fourteen boulders were sampled, producing fifteen ages ranging from 23.9 ± 0.5 ka to 19.7 ± 0.5 and yielding an arithmetic mean of 21.0 ka, with a one sigma standard deviation of 1.1 ka (Figs. 3, 5, 6; Table 1). The results include a duplicate measurement on material from a single sample, which was done as a check for consistency. Two portions of the sample (Kiwi-990 and Kiwi-990x) were run through chemical processing and AMS measurement in-dependently, and yielded ages of 22.0 ± 0.6 and 21.8 ± 0.4 karespectively.
5.5. Tekapo moraines
Five samples were collected from the outermost crests of the Tekapo moraines, the most lake-proximal deposits sampled in this study (Figs. 2, 3, 6). The samples were collected from the cen-ter of the study area, from moraines that form long (> 500 m) continuous crests that are ∼1–3 m in relief. The five ages range from 20.8 ± 0.8 to 17.5 ± 0.5 ka, though the ages form two dis-tinct populations. The younger population of ages (n = 3) has a mean of 18.7 ka, with a one-sigma standard deviation of 0.7 ka, which is consistent with previous dating of Tekapo moraines in the Pukaki sequence (Schaefer et al., 2006; Putnam et al., 2010b). The remaining two ages (20.3 ± 0.6 ka [Kiwi-9103] and 20.8 ± 0.8 ka[PL-07-04]) are greater than one-sigma older than the mean and do not overlap in error with any of the three younger samples. We view these ages as old outliers, though we do note that they fall within one-sigma of previously dated Tekapo moraines, 18.4 ± 2.2 ka (Schaefer et al., 2006; Putnam et al., 2010b).
6. Discussion
Our chronology identifies moraine-building events of the Pukaki glacier under full-glacial conditions at ∼42,000, somewhere be-tween ∼28,000 and ∼25,000, at ∼21,000, and at ∼18,000 years ago. The second, and latter two moraine-building events corre-spond in time to Otira Glaciation stadials E and A respectively (Barrell et al., 2013). The ∼42 ka moraine is the first reported well-dated occurrence in New Zealand of a moraine equating in age to the ‘Aurora 4’ stadial proposed by Williams (1996) from in-direct stratigraphic evidence from a limestone cave in the Te Anau area in southwestern South Island. That stadial was identified on the evidence of lens of gravelly sediment, inferred to have been de-posited in response to a major ice expansion in the valley to which the cave drains, and overlain and underlain in by calcite deposits, inferred to have been precipitated at times when the ice had re-ceded from the immediate vicinity of the cave. Although it is open to question as to whether the cave deposits are robust indicators of major ice advances (Barrell, 2011), the ∼42 ka moraine near Lake Pukaki may provide corroboration of the significance of the stadial proposed by Williams (1996). There is even more tentative evi-dence for a stadial at about 40 ka, or younger, in the Rakaia valley in eastern central South Island, based on a single, and rather prob-lematic OSL date from a stratigraphic exposure (Shulmeister et al.,
2010a). Whether or not that suggested ice advance in the Rakaia valley corresponds to the ∼42 ka moraine dated near Lake Pukaki would require further information and dating from the Rakaia val-ley. Moraines near Mt. Field in Tasmania, with reported ages of ∼41–44 ka derived from 36Cl dating (Mackintosh et al., 2006) are, at face value, possible correlatives of the ∼42 ka moraine of the Pukaki glacier. However, Barrows et al. (2013) found that 36Cl pro-duction rates appear to be too high, and thus derived ages too young, in relation to 10Be ages calculated using the Putnam et al.(2010b) production rate. It seems likely that the moraines near Mt. Field dated using 36Cl may be of the order of 15% older than the ages reported by Mackintosh et al. (2006), and thus are not correl-ative with the ∼42 ka moraine near Lake Pukaki.
It is difficult to make any definitive assessment about the rela-tive extents of the Pukaki glacier during the formation of moraines at ∼42, ∼28 to ∼25, ∼21, and ∼18 ka because the ages of the terminal moraines of Mt. John moraine belt at Pukaki are yet to be determined. For example, progressive erosive deepening of the basin over the full course of the Last Glaciation may have resulted in different ice surface gradients at different times, and therefore differing ice extents as a result of geometric and process-related factors, rather than just climatic factors (Kaplan et al., 2009;Anderson et al., 2012; McKinnon et al., 2012). Or, differential re-gional uplift may have resulted in sectors of the moraine belt hav-ing been raised sufficiently to protect from subsequent advances (see Putnam et al., 2010b). However, the physical arrangement of these three belts of Mt. John lateral moraines preserved alongside each other in our study area suggests that the Pukaki glacier was of approximately similar size at the time of formation of the Mt. John and Tekapo moraines. In any case, it indicates that similar full-glacial conditions prevailed at the time when each moraine belt was formed.
Surface-exposure moraine chronologies that have similarities to elements of the Pukaki moraine sequence dated in our study have been obtained at other locations in the South Island, for ex-ample in the Rakaia valley of the eastern central South Island (Shulmeister et al., 2010b; Putnam et al., 2013b), in the Tara-makau valley of the western South Island (Barrows et al., 2013)and at Lake Ohau in the central South Island (Putnam et al., 2013a). In the Taramakau valley and its former ice distributaries, there is evidence for ice of full-glacial extent at ∼26 ka and at ∼20 ka (Barrows et al., 2013), and in the Rakaia valley at ∼28 ka (Shulmeister et al., 2010b, recalibrated by Putnam et al., 2013b) using the New Zealand production rate. At Lake Ohau, there is a rather different chronological pattern of moraine preservation, with a prominent moraine dated at ∼32 ka, hints of a moraine at ∼28 ka, and a prominent moraine at ∼22 ka (Putnam et al., 2013a). Rather than necessarily being in conflict, all these results most likely reflect the discontinuous preservation of specific com-ponents of moraine sequences from valley to valley and small-scale variability in the timing of local maxima due to glacier hypsome-try (Young et al., 2011). Detailed geomorphic circumstances and vagaries of glacier configuration, in concert with serendipity (and the availability of finding high-quality boulders for dating) influ-ence the survival or otherwise of a moraine in any particular valley (Barrell et al., 2011).
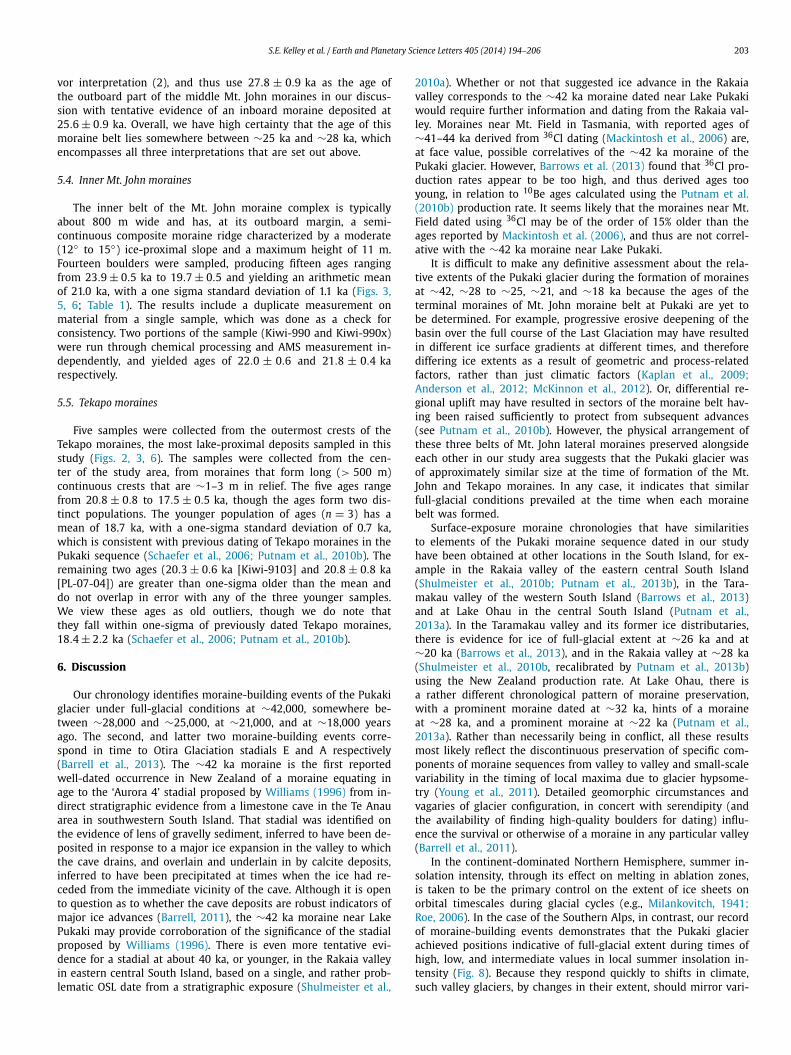
In the continent-dominated Northern Hemisphere, summer in-solation intensity, through its effect on melting in ablation zones, is taken to be the primary control on the extent of ice sheets on orbital timescales during glacial cycles (e.g., Milankovitch, 1941;Roe, 2006). In the case of the Southern Alps, in contrast, our record of moraine-building events demonstrates that the Pukaki glacier achieved positions indicative of full-glacial extent during times of high, low, and intermediate values in local summer insolation in-tensity (Fig. 8). Because they respond quickly to shifts in climate, such valley glaciers, by changes in their extent, should mirror vari-
204 S.E. Kelley et al. / Earth and Planetary Science Letters 405 (2014) 194–206
Fig. 8. Comparison of the Pukaki moraine record with other Southern Hemisphere climate records. A: Summer insolation intensity at 30◦S (grey line) and 60◦ S (black line) from Berger and Loutre (1991); B: Sea surface temperature (SST) record from core MD97-2120 (Pahnke and Sachs, 2006); C: Sea surface temperature (SST) record from core ODP-1233 (Kaiser et al., 2005); D: ∂18O values from the EPICA Dron-ning Maud Land core corrected for sea-level change and altitude (EPICA Community Members, 2010); E: Probability curves for 10Be ages in this study, eleven ages con-sidered to be possible outliers are omitted. Thick black lines are summed probability curves for multiple ages (grey curves) from each geomorphic sector of the moraine belt, arithmetic means and number of samples included above the summed curve. Thin black lines denote probability curves not included in summed curves. Vertical dashed lines depict the timing of Heinrich stadials in the North Atlantic (Hemming, 2004).
ations in local summer insolation intensity on orbital timescales, if such forcing is important. Therefore, this finding of a mismatch between glacier extent and summer intensity indicates that other mechanisms are responsible for controlling variability in local cli-mate and supports the concept that fluctuations in New Zealand’s climate, and thus glaciers, are driven largely by factors other than local summer insolation intensity (Denton et al., 1999; Shulmeister et al., 2010a; Whittaker et al., 2011; De Deckker et al., 2012;Ryan et al., 2012; Putnam et al., 2013a, 2013b).
Theoretical and empirical climate–glacier studies indicate that glaciers in the Southern Alps are highly responsive to variations in climate, particularly temperature (e.g., Oerlemans, 1997; Anderson et al., 2010; Purdie et al., 2011). In the ocean-dominated Southern Hemisphere, the changes in temperature of marine waters sur-rounding the South Island, rather than local summer insolation in-tensity, are likely to have been the major influence on variations in the mass balance of Southern Alps glaciers (Anderson et al., 2010;Anderson and Mackintosh, 2012). This is not surprising if one con-siders the modern analogue of the South Island’s climate, which is dominated by air masses brought in from over the Southern Ocean by westerly wind flow (Sturman and Tapper, 2006). Presum-ably because of this marine influence, the Pukaki moraine record shows similarity to Southern Hemisphere mid-latitude sea sur-face temperature records such as from core ODP 1233, collected off the Chilean Lake District, IMAGES core MD97-2120 on the Chatham Rise, collected ∼400 km southeast of the Pukaki valley (Pahnke and Zahn, 2005; Pahnke and Sachs, 2006), and from core
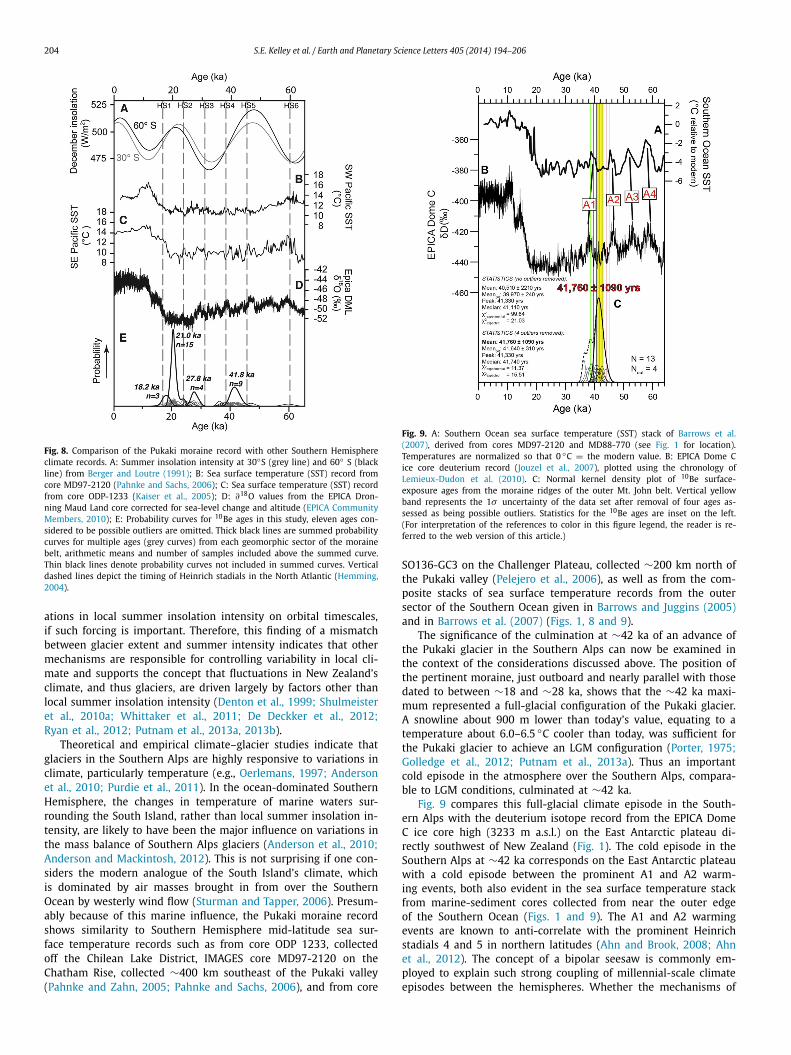
Fig. 9. A: Southern Ocean sea surface temperature (SST) stack of Barrows et al.(2007), derived from cores MD97-2120 and MD88-770 (see Fig. 1 for location). Temperatures are normalized so that 0 ◦C = the modern value. B: EPICA Dome C ice core deuterium record (Jouzel et al., 2007), plotted using the chronology of Lemieux-Dudon et al. (2010). C: Normal kernel density plot of 10Be surface-exposure ages from the moraine ridges of the outer Mt. John belt. Vertical yellow band represents the 1σ uncertainty of the data set after removal of four ages as-sessed as being possible outliers. Statistics for the 10Be ages are inset on the left. (For interpretation of the references to color in this figure legend, the reader is re-ferred to the web version of this article.)
SO136-GC3 on the Challenger Plateau, collected ∼200 km north of the Pukaki valley (Pelejero et al., 2006), as well as from the com-posite stacks of sea surface temperature records from the outer sector of the Southern Ocean given in Barrows and Juggins (2005)and in Barrows et al. (2007) (Figs. 1, 8 and 9).
The significance of the culmination at ∼42 ka of an advance of the Pukaki glacier in the Southern Alps can now be examined in the context of the considerations discussed above. The position of the pertinent moraine, just outboard and nearly parallel with those dated to between ∼18 and ∼28 ka, shows that the ∼42 ka maxi-mum represented a full-glacial configuration of the Pukaki glacier. A snowline about 900 m lower than today’s value, equating to a temperature about 6.0–6.5 ◦C cooler than today, was sufficient for the Pukaki glacier to achieve an LGM configuration (Porter, 1975;Golledge et al., 2012; Putnam et al., 2013a). Thus an important cold episode in the atmosphere over the Southern Alps, compara-ble to LGM conditions, culminated at ∼42 ka.
Fig. 9 compares this full-glacial climate episode in the South-ern Alps with the deuterium isotope record from the EPICA Dome C ice core high (3233 m a.s.l.) on the East Antarctic plateau di-rectly southwest of New Zealand (Fig. 1). The cold episode in the Southern Alps at ∼42 ka corresponds on the East Antarctic plateau with a cold episode between the prominent A1 and A2 warm-ing events, both also evident in the sea surface temperature stack from marine-sediment cores collected from near the outer edge of the Southern Ocean (Figs. 1 and 9). The A1 and A2 warming events are known to anti-correlate with the prominent Heinrich stadials 4 and 5 in northern latitudes (Ahn and Brook, 2008; Ahn et al., 2012). The concept of a bipolar seesaw is commonly em-ployed to explain such strong coupling of millennial-scale climate episodes between the hemispheres. Whether the mechanisms of
S.E. Kelley et al. / Earth and Planetary Science Letters 405 (2014) 194–206 205
such a seesaw lie largely in the ocean (e.g., Broecker, 1998) or in shifts in atmospheric wind belts (e.g., Anderson et al., 2009;Barker et al., 2009; Moreno et al., 1999), or both, is a matter of de-bate. For example, as part of this seesaw, the southern cooling may have been facilitated by a northward shift of the Southern Hemi-sphere’s westerly wind field, along with sea surface temperature isotherms and the Subtropical Front, in response to warming in northern latitudes accompanied by a northward shift of the earth’s thermal equator (e.g., Denton et al., 2010; Putnam et al., 2013a, 2013b). Whatever the resolution, any explanation for a southern cold episode as early as ∼42 ka must account for its widespread geographic footprint in the atmosphere, extending from high on the East Antarctic plateau to the westerly wind stream that passes over New Zealand at southern mid-latitudes.
7. Conclusions
10Be dating of moraines formed by the Pukaki glacier shows that the glacier attained a full-glacial configuration at approxi-mately 42 ka, somewhere between ∼28 and ∼25 ka, at ∼21 ka, and lastly at ∼18 ka. There is no clear relationship between these times of moraine formation and local summer insolation intensity, which highlights that other factors are primarily re-sponsible for controlling fluctuations in New Zealand’s climate, and thus glaciers. A closer match between sea surface tempera-tures variations and glacier extent attests to the importance of the ocean–atmosphere linkages in the ocean-dominated South-ern Hemisphere. The ∼42 ka cold episode is well represented in Antarctic ice core records and in sea surface temperature records from near the outer limit of the Southern Ocean. Its identifica-tion in the Southern Alps moraine record, at a location where the ∼42 ka moraine fortuitously escaped being overprinted by later advances, emphasizes the widespread geographic footprint of this southern stadial event, and provides more data to address the mechanisms underlying the north–south climatic anti-phasing so prominent during the last glaciation.
Acknowledgements
This work was supported by funding from the Comer Science and Education Foundation (CSEF), the National Oceanic and At-mospheric Administration (NOAA), and by National Science Foun-dation grants EAR-110278 and EAR-0745781. D. Barrell was sup-ported by funding from the New Zealand Government through the GNS Science ‘Global Change through Time’ research programme. We are grateful to J. Frisch and D. Sprecher for assistance with laboratory work and to T. and K. Ritchie of Lake Ruataniwha Hol-iday Park for a home away from home during long field seasons. We thank the owners and caretakers of Braemar Station, Mt. Cook Station, Irishman Creek Station, Balmoral Station, Tasman Downs Station, and the New Zealand Defence Force for granting access to their land. S.E.K. was supported by a University of Maine, Cli-mate Change Institute Fellowship. This paper is LDEO contribution no. 7821.
Appendix A. Supplementary data
Supplementary data associated with this article can be found in the online version at http://dx.doi.org/10.1016/j.epsl.2014.07.031. These data include the Google map of the most important areas described in this article.
References
Ahn, J., Brook, E.J., 2008. Atmospheric CO2 and climate on millennial time scales during the last glacial period. Science 322, 83–85.
Ahn, J., Brook, E.J., Schmittner, A., Kreutz, K., 2012. Abrupt change in atmospheric CO2 during the last ice age. Geophys. Res. Lett. 39, L18711.
Almond, P.C., Moar, N.T., Lian, O.B., 2001. Reinterpretation of the glacial chronology of south Westland, New Zealand. N.Z. J. Geol. Geophys. 44, 1–15.
Anderson, B., Mackintosh, A., 2012. Controls on mass balance sensitivity of maritime glaciers in the Southern Alps, New Zealand: the role of debris cover. J. Geophys. Res. 117, F01003.
Anderson, B., Mackintosh, A., Stumm, D., George, L., Kerr, T., Winter-Billington, A., Fitzsimons, S., 2010. Climate sensitivity of a high-precipitation glacier in New Zealand. J. Glaciol. 56, 114–128.
Anderson, R.F., Ali, S., Bradtmiller, L.I., Nielsen, S.H.H., Fleisher, M.Q., Anderson, B.E., Burckle, L.H., 2009. Wind-driven upwelling in the Southern Ocean and the deglacial rise in atmospheric CO2. Science 323, 1443–1448.
Anderson, R.S., Dühnforth, M., Colgan, W., Anderson, L., 2012. Far-flung moraines: exploring the feedback of glacial erosion on the evolution of glacier length. Ge-omorphology 179, 269–285.
Balco, G., Stone, J.O., Lifton, N.A., Dunai, T.J., 2008. A complete and easily accessible means of calculating surface exposure ages or erosion rates from 10Be and 26Al measurements. Quat. Geochronol. 4, 93–107.
Balco, G., Briner, J.P., Finkel, R., Rayburn, J.A., Ridge, J.C., Schaefer, J.M., 2009. Re-gional beryllium-10 production rate calibration for late-glacial northeastern North America. Quat. Geochronol. 4, 93–107.
Barker, S., Diz, P., Vautravers, M.J., Pike, J., Knorr, G., Hall, I.R., Broecker, W.S., 2009. Interhemispheric Atlantic seesaw response during the last deglaciation. Na-ture 457, 1097–1102.
Barrell, D.J.A., 2011. Quaternary glaciers of New Zealand. In: Ehlers, J., Gibbard, P.L., Hughes, P.D. (Eds.), Quaternary Glaciations – Extent and Chronology: A Closer Look. In: Dev. Quat. Sci., vol. 15. Elsevier, Amsterdam, pp. 1047–1064.
Barrell, D.J.A., 2014. The Balmoral moraines near Lake Pukaki, Southern Alps: a new reference area for the early Otira Glaciation in New Zealand. N.Z. J. Geol. Geo-phys. http://dx.doi.org/10.1080/00288306.2014.936473. In press.
Barrell, D.J.A., Almond, P.C., Vandergoes, M.J., Lowe, D.J., Newnham, R.M., 2013. A composite pollen-based stratotype for inter-regional evaluation of climatic events in New Zealand over the past 30,000 years (NZ-INTIMATE project). Quat. Sci. Rev. 74, 4–20.
Barrell, D.J.A., Andersen, B.G., Denton, G.H., 2011. Glacial geomorphology of the cen-tral South Island, New Zealand. GNS Sci. Monogr. 27. Map (5 sheets) and 81 pp.
Barrell, D.J.A., Read, S.A.L., 2014. The deglaciation of Lake Pukaki, South Island, New Zealand – a review. N.Z. J. Geol. Geophys. 57, 86–101.
Barrows, T.T., Almond, P., Rose, R., Fifield, L.K., Mills, S.C., Tims, S.G., 2013. Late Pleis-tocene glacial stratigraphy of the Kumara–Moana region, West Coast of South Island, New Zealand. Quat. Sci. Rev. 74, 139–159.
Barrows, T.T., Juggins, S., 2005. Sea-surface temperatures around the Australian mar-gin and Indian Ocean during the last glacial maximum. Quat. Sci. Rev. 24, 1017–1047.
Barrows, T.T., Juggins, S., De Deckker, P., Calvo, E., Pelejero, C., 2007. Long-term sea surface temperature and climate change in the Australian–New Zealand region. Paleoceanography 22, PA 2215. http://dx.doi.org/10.1029/2006PA001328.
Berger, A., Loutre, M.F., 1991. Insolation values for the climate of the last 10 million years. Quat. Sci. Rev. 10, 297–317.
Broecker, W.S., 1998. Paleocean circulation during the last deglaciation: a bipolar seesaw? Paleoceanography 13, 119–121.
Brown, E., Colling, A., Park, D., Phillips, J., Rothery, D., Wright, J., 2001. Ocean Circu-lation, 2nd edition. The Open University, 286 pp.
Cox, S.C., Barrell, D.J.A., 2007. Geology of the Aoraki area. Institute of Geological and Nuclear Sciences 1:250,000 Geological Map 15. GNS Science, Lower Hutt, New Zealand. Map (1 sheet) and 71 pp.
De Deckker, P., Moros, M., Perner, K., Jansen, E., 2012. Influence of the tropics and southern westerlies on glacial interhemispheric asymmetry. Nat. Geosci. 5, 266–269.
Denton, G.H., Heusser, C.J., Lowell, T.V., Moreno, P.I., Andersen, B.G., Heusser, L.E., Schlüchter, C., Marchant, D.R., 1999. Interhemispheric linkage of paleoclimate during the last glaciation. Geogr. Ann. 81A, 107–153.
Denton, G.H., Anderson, R.F., Toggweiler, J.R., Edwards, R.L., Schaefer, J.M., Putnam, A.E., 2010. The last glacial termination. Science 328, 1652–1656.
Doughty, A.M., Anderson, B.M., Mackintosh, A.N., Kaplan, M.R., Vandergoes, M.J., Barrell, D.J.A., Denton, G.H., Schaefer, J.M., Chinn, T.J.H., Putnam, A.E., 2013. Eval-uation of Lateglacial temperatures in the Southern Alps of New Zealand based on glacier modelling at Irishman Stream, Ben Ohau Range. Quat. Sci. Rev. 74, 160–169.
EPICA Community Members, 2006. One-to-one coupling of glacial climate variability in Greenland and Antarctica. Nature 444, 195–198.
EPICA Community Members, 2010. Stable oxygen isotopes of ice core EDML. 10.1594/PANGAEA.754444.
Farber, D.L., Mériaux, A.-S., Finkel, R.C., 2008. Attenuation length for fast nucleon production of 10Be derived from near-surface production profiles. Earth Planet. Sci. Lett. 274, 294–300.
Gair, H.S., 1967. Sheet 20 – Mount Cook. Geological Map of New Zealand 1:250,000. Department of Scientific and Industrial Research, Wellington. 1 sheet.
206 S.E. Kelley et al. / Earth and Planetary Science Letters 405 (2014) 194–206
Golledge, N.R., Mackintosh, A.N., Anderson, B.M., Buckley, K.M., Doughty, A.M., Bar-rell, D.J.A., Denton, G.H., Vandergoes, M.J., Andersen, B.G., Schaefer, J.M., 2012. Last Glacial Maximum climate in New Zealand inferred from a modelled South-ern Alps icefield. Quat. Sci. Rev. 46, 30–45.
Hemming, S.R., 2004. Heinrich events: massive late Pleistocene detritus layers of the North Atlantic and their global climate imprint. Rev. Geophys. 42, RG1005.
Henderson, R.D., Thompson, S.M., 1999. Extreme rainfalls in the Southern Alps of New Zealand. J. Hydrol. (NZ) 38, 309–330.
Jouzel, J., Masson-Delmotte, V., Cattani, O., Dreyfus, G., Falourd, S., Hoffmann, G., Minster, B., Nouet, J., Barnola, J.M., Chappellaz, J., Fischer, H., Gallet, J.C., Johnsen, S., Leuenberger, M., Loulergue, L., Luethi, D., Oerter, H., Parrenin, F., Raisbeck, G., Raynaud, D., Schilt, A., Schwander, J., Selmo, E., Souchez, R., Spahni, R., Stauffer, B., Steffensen, J.P., Stenni, B., Stocker, T.F., Tison, J.L., Werner, M., Wolff, E.W., 2007. Orbital and millennial Antarctic climate variability over the past 800,000 years. Science 317, 793–796.
Kaiser, J., Lamy, F., Hebbeln, D., 2005. A 70-kyr sea surface temperature record off southern Chile (Ocean Drilling Program Site 1233). Paleoceanography 20, PA4009.
Kaplan, M.R., Hein, A.S., Hubbard, A., Lax, S.M., 2009. Can glacial erosion limit the extent of glaciation? Geomorphology 103, 172–179.
Kaplan, M.R., Schaefer, J.M., Denton, G.H., Barrell, D.J.A., Chinn, T.J.H., Putnam, A.E., Andersen, B.G., Finkel, R.C., Schwartz, R., Doughty, A.M., 2010. Glacier retreat in New Zealand during the Younger Dryas stadial. Nature 467, 194–197.
Kaplan, M.R., Schaefer, J.M., Denton, G.H., Doughty, A.M., Barrell, D.J.A., Chinn, T.J.H., Putnam, A.E., Andersen, B.G., Mackintosh, A., Finkel, R.C., Schwartz, R., Anderson, B., 2013. The anatomy of ’long-term’ warming since 15 kyr ago in New Zealand based on net glacier snowline rise. Geology 41, 887–890.
Kelly, M.A., Lowell, T.V., Hall, B.L., Schaefer, J.M., Finkel, R.C., Goehring, B.M., Alley, R.B., Denton, G.H., 2008. A 10Be chronology of lateglacial and Holocene moun-tain glaciation in the Scoresby Sund region, east Greenland: implications for seasonality during lateglacial time. Quat. Sci. Rev. 27, 2273–2282.
Lemieux-Dudon, B., Blayo, E., Petit, J.R., Waelbroeck, C., Svensson, A., Ritz, C., Barnola, J.-M., Narcisa, B.M., Parrenin, F., 2010. Consistent dating for Antarctic and Green-land ice cores. Quat. Sci. Rev. 29, 8–20.
Mackintosh, A.N., Barrows, T.T., Colhoun, E.A., Fifield, L.K., 2006. Exposure dating and glacial reconstruction at Mt. Field, Tasmania, Australia, identifies MIS 3 and MIS 2 glacial advances and climatic variability. J. Quat. Sci. 21, 363–376.
McKinnon, K.A., Mackintosh, A.N., Anderson, B.M., Barrell, D.J.A., 2012. The influence of sub-glacial bed evolution on ice extent: a model-based evaluation of the Last Glacial Maximum Pukaki glacier, New Zealand. Quat. Sci. Rev. 57, 46–57.
Milankovitch, M., 1941. Kanon der Erdbestrahlung und Seine Andwendung auf das Eiszeitenproblem. Belgrade.
Moreno, P.I., Lowell, T.V., Jacobson Jr., G.L., Denton, G.H., 1999. Abrupt vegetation and climate changes during the last glacial maximum and last termination in the Chilean Lake District: a case study from Canal de la Puntilla (41◦S). Geogr. Ann. 81A, 285–311.
Nishiizumi, K., Imamura, M., Caffee, M.W., Southon, J.R., Finkel, R.C., McAnich, J., 2007. Absolute calibration of 10Be AMS standards. Nucl. Instrum. Methods Phys. Res., Sect. B, Beam Interact. Mater. Atoms 258, 403–413.
Oerlemans, J., 1997. Climate sensitivity of Franz Josef Glacier, New Zealand, as re-vealed by numerical modelling. Arct. Alp. Res. 29, 233–239.
Pahnke, K., Sachs, J.P., 2006. Sea surface temperatures of southern midlatitudes 0–160 kyr BP. Paleoceanography 21, PA2003.
Pahnke, K., Zahn, R., 2005. Southern Hemisphere water mass conversion linked with North Atlantic climate variability. Science 307, 1741–1746.
Pelejero, C., Calvo, E., Barrows, T.T., Logan, G.A., De Deckker, P., 2006. South Tasman Sea alkenone palaeothermometry over the last four glacial/interglacial cycles. Mar. Geol. 230, 73–86.
Porter, S.C., 1975. Equilibrium-line altitudes of Late Quaternary glaciers in the Southern Alps, New Zealand. Quat. Res. 5, 27–47.
Purdie, H., Mackintosh, A., Lawson, W., Anderson, B., Morgenstern, U., Chinn, T., Mayewski, P., 2011. Interannual variability in net accumulation on Tasman Glacier and its relationship with climate. Glob. Planet. Change 77, 142–152.
Putnam, A.E., Denton, G.H., Schaefer, J.M., Barrell, D.J.A., Andersen, B.G., Finkel, R., Schwartz, R., Doughty, A.M., Kaplan, M., Schlüchter, C., 2010a. Glacier advance in southern middle latitudes during the Antarctic Cold Reversal. Nat. Geosci. 3, 700–704.
Putnam, A.E., Schaefer, J.M., Barrell, D.J.A., Vandergoes, M., Denton, G.H., Kaplan, M.R., Schwartz, R., Finkel, R.C., Goehring, B.M., Kelley, S.E., 2010b. In situ cos-mogenic 10Be production-rate calibration from the Southern Alps, New Zealand. Quat. Geochronol. 5, 392–409.
Putnam, A.E., Schaefer, J.M., Denton, G.H., Barrell, D.J.A., Finkel, R.C., Andersen, B.G., Schwartz, R., Chinn, T.J.H., Doughty, A.M., 2012. Regional climate control of glaciers in New Zealand and Europe during the pre-industrial Holocene. Nat. Geosci. 5, 627–630.
Putnam, A.E., Schaefer, J.M., Denton, G.H., Barrell, D.J.A., Birkel, S.D., Andersen, B.G., Kaplan, M.R., Finkel, R.C., Schwartz, R., Doughty, A.M., 2013a. The Last Glacial Maximum at 44◦S documented by a 10Be moraine chronology at Lake Ohau, Southern Alps of New Zealand. Quat. Sci. Rev. 62, 114–141.
Putnam, A.E., Schaefer, J.M., Denton, G.H., Barrell, D.J.A., Andersen, B.G., Koffman, T.N.B., Rowan, A.V., Finkel, R.C., Rood, D.H., Schwartz, R., Vandergoes, M.J., Plum-mer, M.A., Brocklehurst, S.H., Kelley, S.E., Ladig, K.L., 2013b. Warming and glacier recession in the Rakaia valley, Southern Alps of New Zealand, during Heinrich Stadial 1. Earth Planet. Sci. Lett. 382, 98–110.
Roe, G., 2006. In defense of Milankovitch. Geophys. Res. Lett. 33, L24703.Ryan, M.T., Dunbar, G.B., Vandergoes, M.J., Neil, H.L., Hannah, M.J., Newnham, R.M.,
Bostock, H., Alloway, B.V., 2012. Vegetation and climate in Southern Hemisphere mid-latitudes since 210 ka: new insights from marine and terrestrial pollen records from New Zealand. Quat. Sci. Rev. 48, 80–98.
Schaefer, J.M., Denton, G.H., Barrell, D.J.A., Ivy-Ochs, S., Kubik, P.W., Andersen, B.G., Phillips, F.M., Lowell, T.V., Schlüchter, C., 2006. Near-synchronous interhemi-spheric termination of the last glacial maximum in mid-latitudes. Science 312, 1510–1513.
Schaefer, J.M., Denton, G.H., Kaplan, M., Putnam, A., Finkel, R.C., Barrell, D.J.A., An-dersen, B.G., Schwartz, R., Mackintosh, A., Chinn, T., Schlüchter, C., 2009. High-frequency Holocene glacier fluctuations in New Zealand differ from the northern signature. Science 324, 622–625.
Schaefer, J., 2012. Dominant glacier culmination in New Zealand 65,000 years ago and its relevance for understanding the termination of ice ages. Quat. Int. 279–280, 432.
Shulmeister, J., Thackray, G.D., Rieser, U., Hyatt, O.M., Rother, H., Smart, C.C., Evans, D.J.A., 2010a. The stratigraphy, timing and climatic implications of glaciolacus-trine deposits in the middle Rakaia Valley, South Island, New Zealand. Quat. Sci. Rev. 29, 2362–2381.
Shulmeister, J., Fink, D., Hyatt, O.M., Thackray, G.D., Rother, H., 2010b. Cosmogenic 10Be and 26Al exposure ages of moraines in the Rakaia Valley, New Zealand and the nature of the last termination in New Zealand glacial systems. Earth Planet. Sci. Lett. 297, 558–566.
Sturman, A.P., Tapper, N., 2006. The weather and climate of Australia and New Zealand, 2nd ed. Oxford University Press, Melbourne.
Suggate, R.P., 1990. Late Pliocene and Quaternary glaciations of New Zealand. Quat. Sci. Rev. 9, 175–197.
Williams, P.W., 1996. A 230 ka record of glacial and interglacial events from Aurora Cave, Fiordland, New Zealand. N.Z. J. Geol. Geophys. 39, 225–241.
Whittaker, T.E., Hendy, C.H., Hellstrom, J.C., 2011. Abrupt millennial-scale changes in intensity of Southern Hemisphere westerly winds during marine isotope stages 2-4. Geology 39, 455–458.
Young, N.E., Briner, J.P., Leonard, E.M., Licciardi, J.M., Lee, K., 2011. Assessing climatic and nonclimatic forcing of Pinedale glaciation and deglaciation in the western United States. Geology 39, 171–174.
Copyright © 2022 FDOKUMEN