High Fidelity Data Reduction for Big Data Security ...
13
High Fidelity Data Reduction for Big Data Security Dependency Analyses Zhang Xu †1 [email protected] Zhenyu Wu ‡ [email protected] Zhichun Li ‡ [email protected] Kangkook Jee ‡ [email protected] Junghwan Rhee ‡ [email protected] Xusheng Xiao ‡ [email protected] Fengyuan Xu [email protected] Haining Wang * [email protected] Guofei Jiang ‡ [email protected] † NofutzNetworks Inc., Croton-on-hudson, NY, USA ‡ NEC Labs America, Inc., Princeton, NJ, USA Nanjing University, Nanjing, China * University of Delaware, Newark, DE, USA ABSTRACT Intrusive multi-step attacks, such as Advanced Persistent Threat (APT) attacks, have plagued enterprises with signif- icant financial losses and are the top reason for enterprises to increase their security budgets. Since these attacks are sophisticated and stealthy, they can remain undetected for years if individual steps are buried in background “noise.” Thus, enterprises are seeking solutions to “connect the sus- picious dots” across multiple activities. This requires ubiq- uitous system auditing for long periods of time, which in turn causes overwhelmingly large amount of system audit events. Given a limited system budget, how to efficiently handle ever-increasing system audit logs is a great challenge. This paper proposes a new approach that exploits the de- pendency among system events to reduce the number of log entries while still supporting high-quality forensic analysis. In particular, we first propose an aggregation algorithm that preserves the dependency of events during data reduction to ensure the high quality of forensic analysis. Then we pro- pose an aggressive reduction algorithm and exploit domain knowledge for further data reduction. To validate the effi- cacy of our proposed approach, we conduct a comprehensive evaluation on real-world auditing systems using log traces of more than one month. Our evaluation results demonstrate that our approach can significantly reduce the size of system logs and improve the efficiency of forensic analysis without losing accuracy. 1 Work done during an internship in NEC Labs America, Inc. Permission to make digital or hard copies of all or part of this work for personal or classroom use is granted without fee provided that copies are not made or distributed for profit or commercial advantage and that copies bear this notice and the full cita- tion on the first page. Copyrights for components of this work owned by others than ACM must be honored. Abstracting with credit is permitted. To copy otherwise, or re- publish, to post on servers or to redistribute to lists, requires prior specific permission and/or a fee. Request permissions from [email protected]. CCS’16, October 24-28, 2016, Vienna, Austria c 2016 ACM. ISBN 978-1-4503-4139-4/16/10. . . $15.00 DOI: http://dx.doi.org/10.1145/2976749.2978378 1. INTRODUCTION Today’s enterprises are facing serious cyber-threat posed by intrusive multi-step attacks such as Advanced Persistent Threat (APT) attacks. It takes much time for attackers to gradually penetrate into an enterprise, to understand its infrastructure, to own the high-value targets, and to steal important information [1, 6, 2, 9, 10, 12] or to sabotage mission critical infrastructures [11]. Compared with conven- tional attacks, sophisticated multi-step attacks such as APT attacks usually inflict much more severe damage upon the enterprises’ business. The recent DARPA Transparent Com- puting (TC) program [13] emphasizes that the challenges of multi-step attacks come from modern computing systems be- ing large, complex and opaque, and the threats can remain undetected for years if individual steps are buried in back- ground“noise.” Thus, to counter these sophisticated attacks, enterprises are in great need of solutions to “connect the dots” across multiple activities that individually might not be sus- picious enough. Even though these attacks can be powerful and stealthy, one typical constraint from the attacker side is that such an attack needs multiple steps to succeed, such as infrastructure reconnaissance and target discovery, as illus- trated in the cyber kill chain [5]. Therefore, multiple attack footprints might be left as “dots.” In order to achieve the vision of connecting the dots, the first challenge is to collect and store the dots (attack prove- nance). Since the attackers have the potential to reach each host, we need to monitor and collect attack provenance from every single host. According to [14], in 2014 APT attacks penetrated enterprises and remained stealthy for 188 days on average and even years before launching harmful harvesting actions. This implies that in order to detect and understand the impact of such attacks, the enterprises need to keep a half year to one year worth of data. However, monitoring at- tack provenance on every host in an enterprise for more than a half year is burdensome and laborious. The system level audit data collected from Linux Audit system [8] or Window Event Tracing framework [7] alone can easily reach 0.5 to 1GB per host. In a real-world scenario, for a commercial
-
Upload
khangminh22 -
Category
Documents
-
view
0 -
download
0
Transcript of High Fidelity Data Reduction for Big Data Security ...

High Fidelity Data Reduction for Big Data SecurityDependency Analyses
Zhang Xu†[email protected]
Zhenyu Wu‡[email protected]
Zhichun Li‡[email protected]
Kangkook Jee‡[email protected]
Junghwan Rhee‡[email protected]
Xusheng Xiao‡[email protected]
Fengyuan Xu�[email protected]
Haining Wang∗[email protected]
Guofei Jiang‡[email protected]
† NofutzNetworks Inc., Croton-on-hudson, NY, USA‡ NEC Labs America, Inc., Princeton, NJ, USA
� Nanjing University, Nanjing, China∗ University of Delaware, Newark, DE, USA
ABSTRACTIntrusive multi-step attacks, such as Advanced PersistentThreat (APT) attacks, have plagued enterprises with signif-icant financial losses and are the top reason for enterprisesto increase their security budgets. Since these attacks aresophisticated and stealthy, they can remain undetected foryears if individual steps are buried in background “noise.”Thus, enterprises are seeking solutions to “connect the sus-picious dots” across multiple activities. This requires ubiq-uitous system auditing for long periods of time, which inturn causes overwhelmingly large amount of system auditevents. Given a limited system budget, how to efficientlyhandle ever-increasing system audit logs is a great challenge.
This paper proposes a new approach that exploits the de-pendency among system events to reduce the number of logentries while still supporting high-quality forensic analysis.In particular, we first propose an aggregation algorithm thatpreserves the dependency of events during data reduction toensure the high quality of forensic analysis. Then we pro-pose an aggressive reduction algorithm and exploit domainknowledge for further data reduction. To validate the effi-cacy of our proposed approach, we conduct a comprehensiveevaluation on real-world auditing systems using log traces ofmore than one month. Our evaluation results demonstratethat our approach can significantly reduce the size of systemlogs and improve the efficiency of forensic analysis withoutlosing accuracy.
1Work done during an internship in NEC Labs America, Inc.
Permission to make digital or hard copies of all or part of this work for personal orclassroom use is granted without fee provided that copies are not made or distributedfor profit or commercial advantage and that copies bear this notice and the full cita-tion on the first page. Copyrights for components of this work owned by others thanACM must be honored. Abstracting with credit is permitted. To copy otherwise, or re-publish, to post on servers or to redistribute to lists, requires prior specific permissionand/or a fee. Request permissions from [email protected].
CCS’16, October 24-28, 2016, Vienna, Austriac© 2016 ACM. ISBN 978-1-4503-4139-4/16/10. . . $15.00
DOI: http://dx.doi.org/10.1145/2976749.2978378
1. INTRODUCTIONToday’s enterprises are facing serious cyber-threat posed
by intrusive multi-step attacks such as Advanced PersistentThreat (APT) attacks. It takes much time for attackersto gradually penetrate into an enterprise, to understand itsinfrastructure, to own the high-value targets, and to stealimportant information [1, 6, 2, 9, 10, 12] or to sabotagemission critical infrastructures [11]. Compared with conven-tional attacks, sophisticated multi-step attacks such as APTattacks usually inflict much more severe damage upon theenterprises’ business. The recent DARPA Transparent Com-puting (TC) program [13] emphasizes that the challenges ofmulti-step attacks come from modern computing systems be-ing large, complex and opaque, and the threats can remainundetected for years if individual steps are buried in back-ground“noise.” Thus, to counter these sophisticated attacks,enterprises are in great need of solutions to“connect the dots”across multiple activities that individually might not be sus-picious enough. Even though these attacks can be powerfuland stealthy, one typical constraint from the attacker side isthat such an attack needs multiple steps to succeed, such asinfrastructure reconnaissance and target discovery, as illus-trated in the cyber kill chain [5]. Therefore, multiple attackfootprints might be left as “dots.”
In order to achieve the vision of connecting the dots, thefirst challenge is to collect and store the dots (attack prove-nance). Since the attackers have the potential to reach eachhost, we need to monitor and collect attack provenance fromevery single host. According to [14], in 2014 APT attackspenetrated enterprises and remained stealthy for 188 days onaverage and even years before launching harmful harvestingactions. This implies that in order to detect and understandthe impact of such attacks, the enterprises need to keep ahalf year to one year worth of data. However, monitoring at-tack provenance on every host in an enterprise for more thana half year is burdensome and laborious. The system levelaudit data collected from Linux Audit system [8] or WindowEvent Tracing framework [7] alone can easily reach 0.5 to1GB per host. In a real-world scenario, for a commercial
bank with 200,000 hosts, the required data is around 17PB(half year 0.5GB per host) to 70PB (one year 1GB per host).
Furthermore, to achieve fast dependency correlation anal-ysis or to promptly connect the dots even interleaved withmultiple normal activities, the data has to be efficiently storedand indexed. Therefore, meeting these storage and retrievalrequirements for such a big-data system is a daunting task.Very little previous research focuses on how to mitigate theproblem of overwhelmingly big-data of attack provenance de-rived from system-level audit events for dependency analy-sis. LogGC [31] observes that some system objects such astemporary files are isolated, have short life-spans, and havelittle impact on the dependency analysis; such objects andevents can be garbage collected to save space. In our ap-proach, we take a different perspective and primarily studythe impact of different events. We found that some eventshave identical dependency impact scope, and therefore theycan be safely aggregated. Based on this observation, wepropose an algorithm called Causality Preserved Reduction(CPR) for event aggregation. Furthermore, we found thatcertain popular system behaviors lead to densely connecteddependency graphs of objects and their related neighbors.Thus, we devise a causality-preserving one-hop graph reduc-tion technique called Process-centric Causality Approxima-tion Reduction (PCAR), which can further improve data re-duction with very few false positives.
To validate the efficacy of our proposed approach, we con-duct a comprehensive evaluation on real-world auditing sys-tems using log traces of more than one month. Our evalua-tion results demonstrate that the CPR algorithm is generaland does not lose any accuracy by design, which can improvethe capacity of a big-data system by up to 3.4 times. In otherwords, the same system can store 3.4 times more data with-out affecting storage and data processing efficiency. With atrade off of introducing very few false positives (in our evalu-ation at the rate of 0.2%), the PCAR algorithm can enlargethe capacity of the system by up to 5.6 times. We also com-pared our approach with a naive time-window-based dataaggregation. We show that the naive approach introducesmany more false positives at the rate of 13.9%. Withoutconsidering manually tuning our approach for each applica-tion in an enterprise environment, we achieve a similar re-duction ratio as LogGC, but our solution can be combinedwith LogGC to achieve more significant data reduction.
The major contributions of this paper can be summarizedas follows:
• Through intensive data collection and analysis, we ob-serve that some events have identical contributions todependency analysis and thus can be aggregated. Basedon this observation, we propose the CPR algorithm fordata reduction.
• We further observe that some high-level system behav-iors such as PCI scanning will result in dense one-hopdependency graphs, and such a subgraph as a wholeis more useful than its internal structures. Thus, wepropose the PCAR algorithm, which can achieve evenhigher data reduction rates with few false positives.
• We conduct a comprehensive evaluation over extensivedatasets collected from a real enterprise environmentfor one month. The evaluation results demonstratethat our approach can improve the efficiency of forensicanalysis up to 5.6 times without losing accuracy.
• Our work will facilitate the detection of multi-step at-tack behaviors that involve multiple steps of maliciousbehaviors (i.e., dots) whose footprints are buried insidedata gathered from multiple hosts over a long periodof time.
The remainder of this paper is organized as follows. Sec-tion 2 introduces the background and motivates our work.Section 3 provides the definitions and design details of ourwork. Section 4 presents our real-world data driven evalua-tion. Section 5 discusses attack resilience and generality ofour approach. Section 6 surveys related works, and finally,Section 7 draws the conclusion.
2. BACKGROUND AND MOTIVATIONIn this section, we briefly introduce the basic concept of
a system dependency graph and causality tracking. Then,we present our observation of data characteristics of low-level system event traces. Finally, we provide an intuition-based description of how to reduce event trace data whilepreserving its embedded causal dependencies.
2.1 System Dependency AnalysisA system event trace is a sequence of recorded interactions
among multiple system objects (processes, files, network con-nections, etc.). It contains information, such as timing, typeof operation, and information flow directions, which can beused to reconstruct causal dependencies between historicalevents. For ease of discussion, we use the terms causalityand dependency interchangeably in this paper.
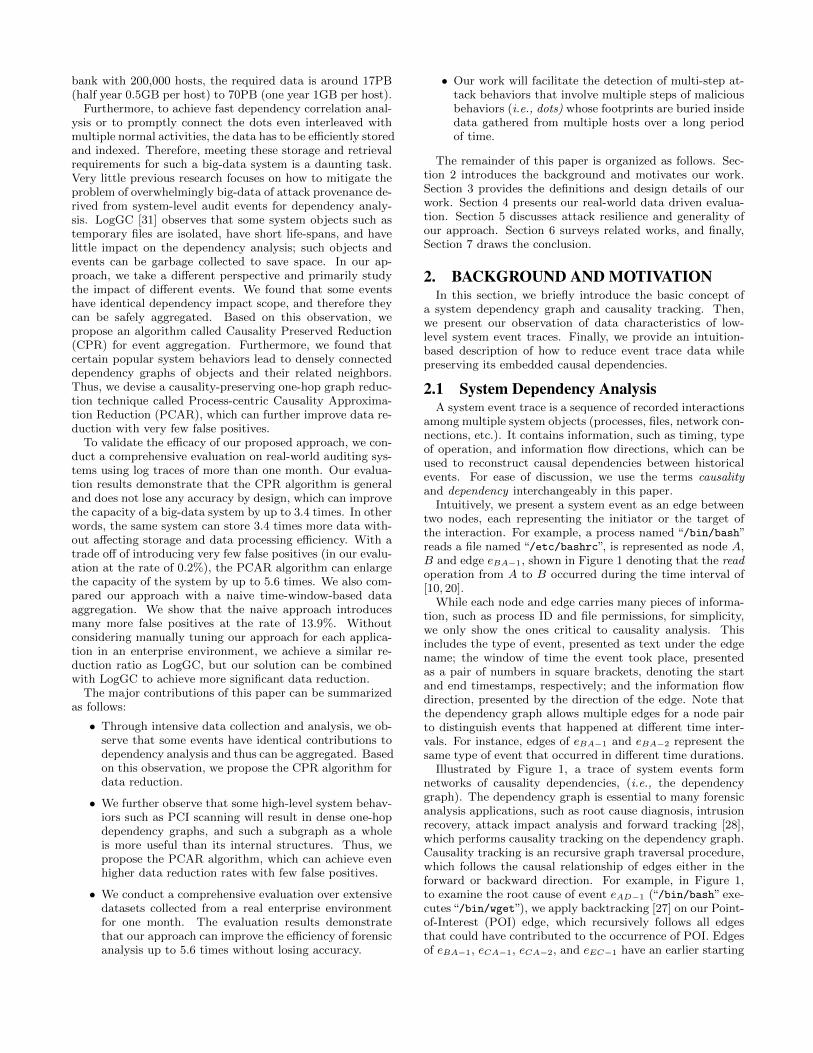
Intuitively, we present a system event as an edge betweentwo nodes, each representing the initiator or the target ofthe interaction. For example, a process named “/bin/bash”reads a file named “/etc/bashrc”, is represented as node A,B and edge eBA−1, shown in Figure 1 denoting that the readoperation from A to B occurred during the time interval of[10, 20].
While each node and edge carries many pieces of informa-tion, such as process ID and file permissions, for simplicity,we only show the ones critical to causality analysis. Thisincludes the type of event, presented as text under the edgename; the window of time the event took place, presentedas a pair of numbers in square brackets, denoting the startand end timestamps, respectively; and the information flowdirection, presented by the direction of the edge. Note thatthe dependency graph allows multiple edges for a node pairto distinguish events that happened at different time inter-vals. For instance, edges of eBA−1 and eBA−2 represent thesame type of event that occurred in different time durations.
Illustrated by Figure 1, a trace of system events formnetworks of causality dependencies, (i.e., the dependencygraph). The dependency graph is essential to many forensicanalysis applications, such as root cause diagnosis, intrusionrecovery, attack impact analysis and forward tracking [28],which performs causality tracking on the dependency graph.Causality tracking is an recursive graph traversal procedure,which follows the causal relationship of edges either in theforward or backward direction. For example, in Figure 1,to examine the root cause of event eAD−1 (“/bin/bash” exe-cutes“/bin/wget”), we apply backtracking [27] on our Point-of-Interest (POI) edge, which recursively follows all edgesthat could have contributed to the occurrence of POI. Edgesof eBA−1, eCA−1, eCA−2, and eEC−1 have an earlier starting
A
B
eBA-1
Read [10,20]
A: /bin/bash B: /etc/bashrc C: /etc/inputrc D: /bin/wget E: /usr/bin/vi
D
eBA-2 Read [40, 42]
C
eCA-1
Read [15,23]
eCA-2
Read [28,32]
eAD-1 Exec [36, 37]
POI Event
Relevant Event
Irrelevant Event
E eEC-1
Write [2,8]
Figure 1: Dependency Graph and Backtracking
time than their predecessors and are therefore identified asrelevant events.
2.2 Data CharacteristicsThe accuracy of system dependency analysis heavily de-
pends on the granularity of event trace – the more finelygrained the data, the more accurate the analysis results.
We built a ubiquitous monitoring system for enterprise se-curity analyses, which collects low-level system events fromLinux and Windows machines using kernel audit [8] andETW kernel event tracing [7], respectively. We observe thatan average desktop computer produces more than 1 millionevents per day, while a server could yield 10 to 100 timesthe volume. Each day, a rather small system of 100 comput-ers generated more than 200 million events, which requiresmid- to high-end server to process and produces databasesover 200GB. A large enterprise can easily have more than100,000 computers, and may require them to store the moni-tored data for several months or even years. Such a workloadmade it impractical to deploy an accurate dependency anal-ysis to large enterprises. Reducing the data volume is key tosolving the scalability problem.
While data reduction is a well-studied topic, the most com-monly used techniques, spatial and temporal sampling, arenot applicable to dependency analysis based on system eventtraces. Because sampling techniques do not have the inheritconcept of causal relations, they are prone to introducingrandom causal errors. On the other hand, the recursivenature of causality tracking exponentially magnifies errorson the causal path – a single falsely introduced dependencywhen tracked forward or backward several hops could easilyleads to hundreds of false positives. Therefore, any practicaldata reduction on system event traces must take great careto limit the introduction of causal errors.
2.3 Data Reduction InsightsRecognizing their critical importance, we first explore all
possibilities to perform data reduction while perfectly pre-serving the causal dependencies. By studying causal rela-tions of every event in our system traces, we discover thatonly a small fraction of events, which we call “key events”,bear causal significances to other events. When performingforensic analysis on multi-step attacks, the key events revealthe footprint of an attacker (i.e., the sequences of activitiesan attacker triggers). Moreover, for each “key event” thereexist a series of “shadowed events” whose causal relations toother events are negligible in the presence of the “key event”,
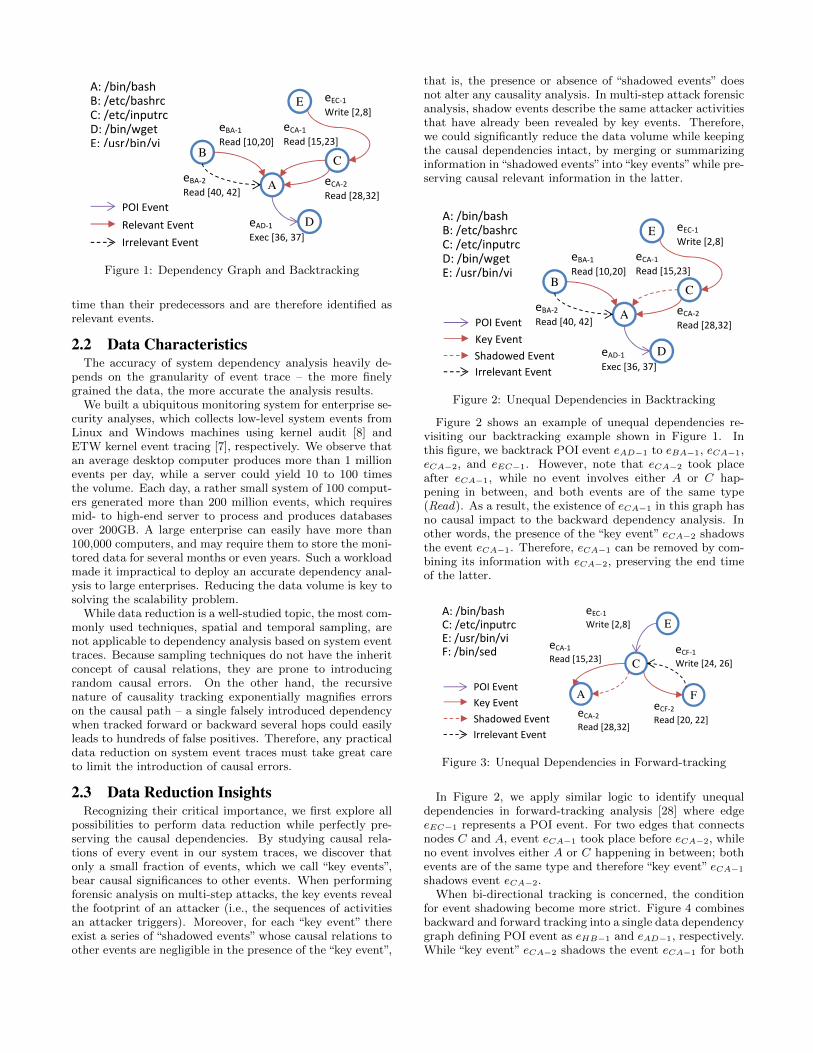
that is, the presence or absence of “shadowed events” doesnot alter any causality analysis. In multi-step attack forensicanalysis, shadow events describe the same attacker activitiesthat have already been revealed by key events. Therefore,we could significantly reduce the data volume while keepingthe causal dependencies intact, by merging or summarizinginformation in“shadowed events” into“key events”while pre-serving causal relevant information in the latter.
A
B
eBA-1
Read [10,20]
A: /bin/bash B: /etc/bashrc C: /etc/inputrc D: /bin/wget E: /usr/bin/vi
D
eBA-2 Read [40, 42]
C
eCA-1
Read [15,23]
eCA-2
Read [28,32]
eAD-1 Exec [36, 37]
POI Event
Key Event
Irrelevant Event
E eEC-1
Write [2,8]
Shadowed Event
Figure 2: Unequal Dependencies in Backtracking
Figure 2 shows an example of unequal dependencies re-visiting our backtracking example shown in Figure 1. Inthis figure, we backtrack POI event eAD−1 to eBA−1, eCA−1,eCA−2, and eEC−1. However, note that eCA−2 took placeafter eCA−1, while no event involves either A or C hap-pening in between, and both events are of the same type(Read). As a result, the existence of eCA−1 in this graph hasno causal impact to the backward dependency analysis. Inother words, the presence of the “key event” eCA−2 shadowsthe event eCA−1. Therefore, eCA−1 can be removed by com-bining its information with eCA−2, preserving the end timeof the latter.
eCF-2 Read [20, 22]
eCA-1
Read [15,23]
eCA-2
Read [28,32]
eCF-1 Write [24, 26] C
eEC-1
Write [2,8]
A
E
F POI Event
Key Event
Shadowed Event
Irrelevant Event
A: /bin/bash
C: /etc/inputrc
E: /usr/bin/vi F: /bin/sed
Figure 3: Unequal Dependencies in Forward-tracking
In Figure 2, we apply similar logic to identify unequaldependencies in forward-tracking analysis [28] where edgeeEC−1 represents a POI event. For two edges that connectsnodes C and A, event eCA−1 took place before eCA−2, whileno event involves either A or C happening in between; bothevents are of the same type and therefore “key event” eCA−1
shadows event eCA−2.When bi-directional tracking is concerned, the condition
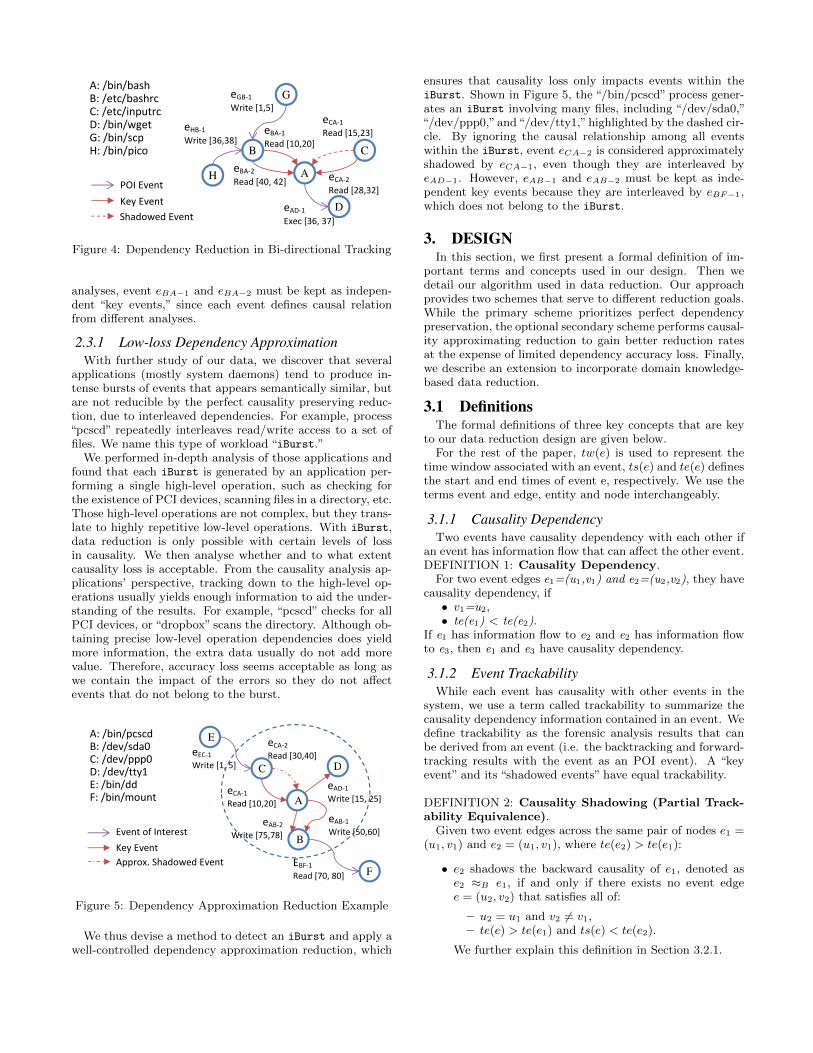
for event shadowing become more strict. Figure 4 combinesbackward and forward tracking into a single data dependencygraph defining POI event as eHB−1 and eAD−1, respectively.While “key event” eCA−2 shadows the event eCA−1 for both
A
B
eBA-1
Read [10,20]
A: /bin/bash B: /etc/bashrc C: /etc/inputrc D: /bin/wget G: /bin/scp H: /bin/pico
D
eBA-2 Read [40, 42]
C
eCA-1
Read [15,23]
eCA-2
Read [28,32]
eAD-1 Exec [36, 37]
POI Event
Key Event
Shadowed Event
G eGB-1
Write [1,5]
H
eHB-1
Write [36,38]
Figure 4: Dependency Reduction in Bi-directional Tracking
analyses, event eBA−1 and eBA−2 must be kept as indepen-dent “key events,” since each event defines causal relationfrom different analyses.
2.3.1 Low-loss Dependency ApproximationWith further study of our data, we discover that several
applications (mostly system daemons) tend to produce in-tense bursts of events that appears semantically similar, butare not reducible by the perfect causality preserving reduc-tion, due to interleaved dependencies. For example, process“pcscd” repeatedly interleaves read/write access to a set offiles. We name this type of workload “iBurst.”
We performed in-depth analysis of those applications andfound that each iBurst is generated by an application per-forming a single high-level operation, such as checking forthe existence of PCI devices, scanning files in a directory, etc.Those high-level operations are not complex, but they trans-late to highly repetitive low-level operations. With iBurst,data reduction is only possible with certain levels of lossin causality. We then analyse whether and to what extentcausality loss is acceptable. From the causality analysis ap-plications’ perspective, tracking down to the high-level op-erations usually yields enough information to aid the under-standing of the results. For example, “pcscd” checks for allPCI devices, or “dropbox” scans the directory. Although ob-taining precise low-level operation dependencies does yieldmore information, the extra data usually do not add morevalue. Therefore, accuracy loss seems acceptable as long aswe contain the impact of the errors so they do not affectevents that do not belong to the burst.
EBF-1 Read [70, 80]
eCA-1
Read [10,20]
eAB-1
Write [50,60]
eAD-1 Write [15, 25]
B
eCA-2
Read [30,40]
A
C D
Event of Interest
Key Event
Approx. Shadowed Event
A: /bin/pcscd B: /dev/sda0 C: /dev/ppp0 D: /dev/tty1 E: /bin/dd F: /bin/mount
E
eEC-1 Write [1, 5]
F
eAB-2
Write [75,78]
Figure 5: Dependency Approximation Reduction Example
We thus devise a method to detect an iBurst and apply awell-controlled dependency approximation reduction, which
ensures that causality loss only impacts events within theiBurst. Shown in Figure 5, the “/bin/pcscd” process gener-ates an iBurst involving many files, including “/dev/sda0,”“/dev/ppp0,” and“/dev/tty1,”highlighted by the dashed cir-cle. By ignoring the causal relationship among all eventswithin the iBurst, event eCA−2 is considered approximatelyshadowed by eCA−1, even though they are interleaved byeAD−1. However, eAB−1 and eAB−2 must be kept as inde-pendent key events because they are interleaved by eBF−1,which does not belong to the iBurst.
3. DESIGNIn this section, we first present a formal definition of im-
portant terms and concepts used in our design. Then wedetail our algorithm used in data reduction. Our approachprovides two schemes that serve to different reduction goals.While the primary scheme prioritizes perfect dependencypreservation, the optional secondary scheme performs causal-ity approximating reduction to gain better reduction ratesat the expense of limited dependency accuracy loss. Finally,we describe an extension to incorporate domain knowledge-based data reduction.
3.1 DefinitionsThe formal definitions of three key concepts that are key
to our data reduction design are given below.For the rest of the paper, tw(e) is used to represent the
time window associated with an event, ts(e) and te(e) definesthe start and end times of event e, respectively. We use theterms event and edge, entity and node interchangeably.
3.1.1 Causality DependencyTwo events have causality dependency with each other if
an event has information flow that can affect the other event.DEFINITION 1: Causality Dependency.
For two event edges e1=(u1,v1) and e2=(u2,v2), they havecausality dependency, if• v1=u2,• te(e1) < te(e2).
If e1 has information flow to e2 and e2 has information flowto e3, then e1 and e3 have causality dependency.
3.1.2 Event TrackabilityWhile each event has causality with other events in the
system, we use a term called trackability to summarize thecausality dependency information contained in an event. Wedefine trackability as the forensic analysis results that canbe derived from an event (i.e. the backtracking and forward-tracking results with the event as an POI event). A “keyevent” and its “shadowed events” have equal trackability.
DEFINITION 2: Causality Shadowing (Partial Track-ability Equivalence).
Given two event edges across the same pair of nodes e1 =(u1, v1) and e2 = (u1, v1), where te(e2) > te(e1):
• e2 shadows the backward causality of e1, denoted ase2 ≈B e1, if and only if there exists no event edgee = (u2, v2) that satisfies all of:
– u2 = u1 and v2 6= v1,– te(e) > te(e1) and ts(e) < te(e2).
We further explain this definition in Section 3.2.1.
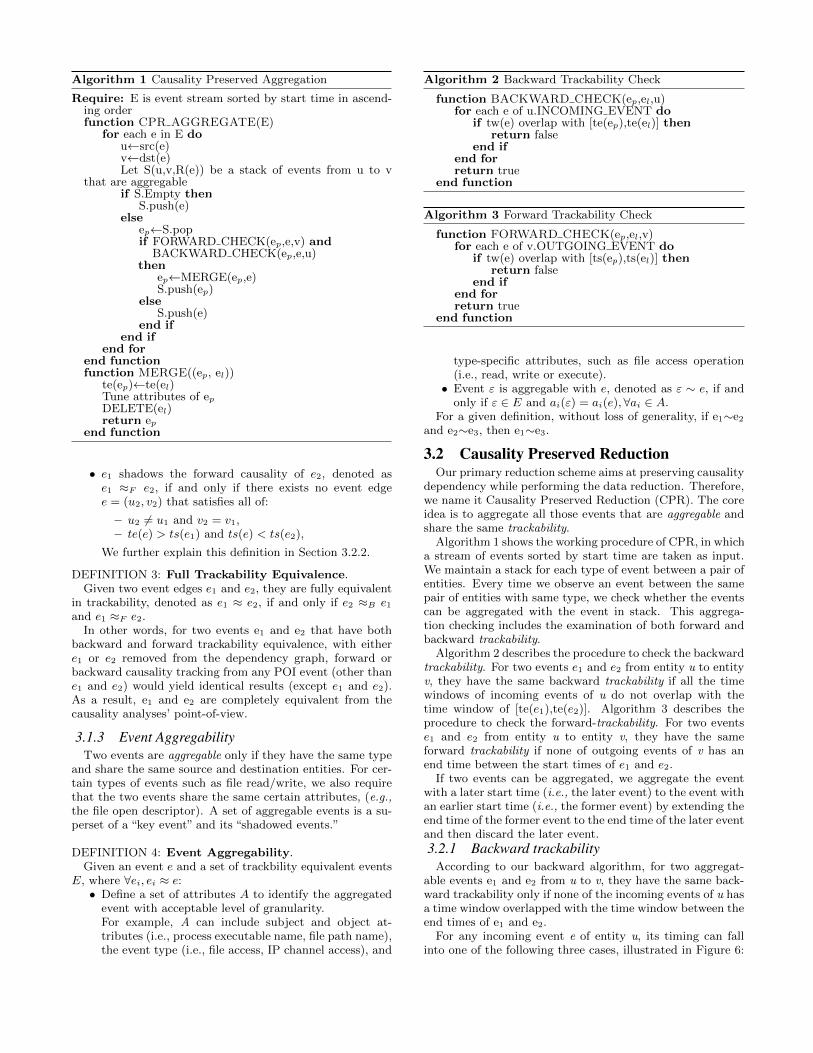
Algorithm 1 Causality Preserved Aggregation
Require: E is event stream sorted by start time in ascend-ing orderfunction CPR AGGREGATE(E)
for each e in E dou←src(e)v←dst(e)Let S(u,v,R(e)) be a stack of events from u to v
that are aggregableif S.Empty then
S.push(e)else
ep←S.popif FORWARD CHECK(ep,e,v) and
BACKWARD CHECK(ep,e,u)then
ep←MERGE(ep,e)S.push(ep)
elseS.push(e)
end ifend if
end forend functionfunction MERGE((ep, el))
te(ep)←te(el)Tune attributes of epDELETE(el)return ep
end function
• e1 shadows the forward causality of e2, denoted ase1 ≈F e2, if and only if there exists no event edgee = (u2, v2) that satisfies all of:
– u2 6= u1 and v2 = v1,– te(e) > ts(e1) and ts(e) < ts(e2),
We further explain this definition in Section 3.2.2.
DEFINITION 3: Full Trackability Equivalence.Given two event edges e1 and e2, they are fully equivalent
in trackability, denoted as e1 ≈ e2, if and only if e2 ≈B e1and e1 ≈F e2.
In other words, for two events e1 and e2 that have bothbackward and forward trackability equivalence, with eithere1 or e2 removed from the dependency graph, forward orbackward causality tracking from any POI event (other thane1 and e2) would yield identical results (except e1 and e2).As a result, e1 and e2 are completely equivalent from thecausality analyses’ point-of-view.
3.1.3 Event AggregabilityTwo events are aggregable only if they have the same type
and share the same source and destination entities. For cer-tain types of events such as file read/write, we also requirethat the two events share the same certain attributes, (e.g.,the file open descriptor). A set of aggregable events is a su-perset of a “key event” and its “shadowed events.”
DEFINITION 4: Event Aggregability.Given an event e and a set of trackbility equivalent events
E, where ∀ei, ei ≈ e:• Define a set of attributes A to identify the aggregated
event with acceptable level of granularity.For example, A can include subject and object at-tributes (i.e., process executable name, file path name),the event type (i.e., file access, IP channel access), and
Algorithm 2 Backward Trackability Check
function BACKWARD CHECK(ep,el,u)for each e of u.INCOMING EVENT do
if tw(e) overlap with [te(ep),te(el)] thenreturn false
end ifend forreturn true
end function
Algorithm 3 Forward Trackability Check
function FORWARD CHECK(ep,el,v)for each e of v.OUTGOING EVENT do
if tw(e) overlap with [ts(ep),ts(el)] thenreturn false
end ifend forreturn true
end function
type-specific attributes, such as file access operation(i.e., read, write or execute).• Event ε is aggregable with e, denoted as ε ∼ e, if and
only if ε ∈ E and ai(ε) = ai(e), ∀ai ∈ A.For a given definition, without loss of generality, if e1∼e2
and e2∼e3, then e1∼e3.
3.2 Causality Preserved ReductionOur primary reduction scheme aims at preserving causality
dependency while performing the data reduction. Therefore,we name it Causality Preserved Reduction (CPR). The coreidea is to aggregate all those events that are aggregable andshare the same trackability.
Algorithm 1 shows the working procedure of CPR, in whicha stream of events sorted by start time are taken as input.We maintain a stack for each type of event between a pair ofentities. Every time we observe an event between the samepair of entities with same type, we check whether the eventscan be aggregated with the event in stack. This aggrega-tion checking includes the examination of both forward andbackward trackability.
Algorithm 2 describes the procedure to check the backwardtrackability. For two events e1 and e2 from entity u to entityv, they have the same backward trackability if all the timewindows of incoming events of u do not overlap with thetime window of [te(e1),te(e2)]. Algorithm 3 describes theprocedure to check the forward-trackability. For two eventse1 and e2 from entity u to entity v, they have the sameforward trackability if none of outgoing events of v has anend time between the start times of e1 and e2.
If two events can be aggregated, we aggregate the eventwith a later start time (i.e., the later event) to the event withan earlier start time (i.e., the former event) by extending theend time of the former event to the end time of the later eventand then discard the later event.
3.2.1 Backward trackabilityAccording to our backward algorithm, for two aggregat-
able events e1 and e2 from u to v, they have the same back-ward trackability only if none of the incoming events of u hasa time window overlapped with the time window between theend times of e1 and e2.
For any incoming event e of entity u, its timing can fallinto one of the following three cases, illustrated in Figure 6:
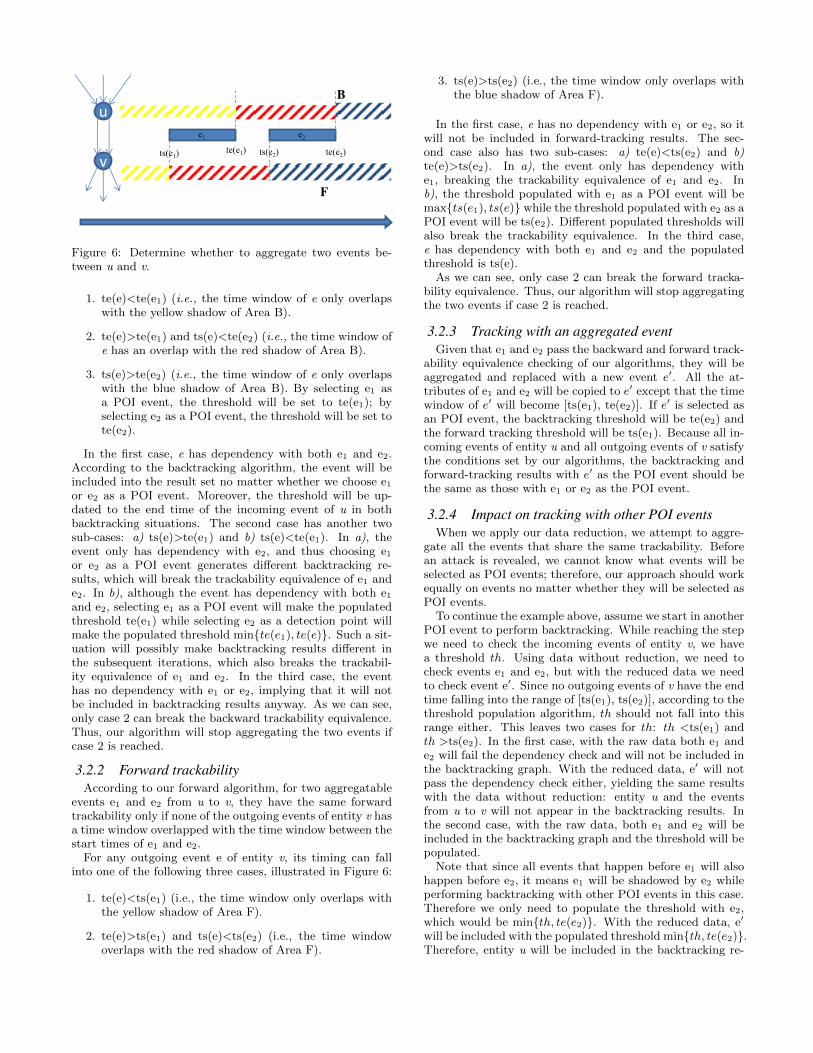
e1 e2
u
v ts(e1) ts(e2) te(e1) te(e2)
B
F
Figure 6: Determine whether to aggregate two events be-tween u and v.
1. te(e)<te(e1) (i.e., the time window of e only overlapswith the yellow shadow of Area B).
2. te(e)>te(e1) and ts(e)<te(e2) (i.e., the time window ofe has an overlap with the red shadow of Area B).
3. ts(e)>te(e2) (i.e., the time window of e only overlapswith the blue shadow of Area B). By selecting e1 asa POI event, the threshold will be set to te(e1); byselecting e2 as a POI event, the threshold will be set tote(e2).
In the first case, e has dependency with both e1 and e2.According to the backtracking algorithm, the event will beincluded into the result set no matter whether we choose e1or e2 as a POI event. Moreover, the threshold will be up-dated to the end time of the incoming event of u in bothbacktracking situations. The second case has another twosub-cases: a) ts(e)>te(e1) and b) ts(e)<te(e1). In a), theevent only has dependency with e2, and thus choosing e1or e2 as a POI event generates different backtracking re-sults, which will break the trackability equivalence of e1 ande2. In b), although the event has dependency with both e1and e2, selecting e1 as a POI event will make the populatedthreshold te(e1) while selecting e2 as a detection point willmake the populated threshold min{te(e1), te(e)}. Such a sit-uation will possibly make backtracking results different inthe subsequent iterations, which also breaks the trackabil-ity equivalence of e1 and e2. In the third case, the eventhas no dependency with e1 or e2, implying that it will notbe included in backtracking results anyway. As we can see,only case 2 can break the backward trackability equivalence.Thus, our algorithm will stop aggregating the two events ifcase 2 is reached.
3.2.2 Forward trackabilityAccording to our forward algorithm, for two aggregatable
events e1 and e2 from u to v, they have the same forwardtrackability only if none of the outgoing events of entity v hasa time window overlapped with the time window between thestart times of e1 and e2.
For any outgoing event e of entity v, its timing can fallinto one of the following three cases, illustrated in Figure 6:
1. te(e)<ts(e1) (i.e., the time window only overlaps withthe yellow shadow of Area F).
2. te(e)>ts(e1) and ts(e)<ts(e2) (i.e., the time windowoverlaps with the red shadow of Area F).
3. ts(e)>ts(e2) (i.e., the time window only overlaps withthe blue shadow of Area F).
In the first case, e has no dependency with e1 or e2, so itwill not be included in forward-tracking results. The sec-ond case also has two sub-cases: a) te(e)<ts(e2) and b)te(e)>ts(e2). In a), the event only has dependency withe1, breaking the trackability equivalence of e1 and e2. Inb), the threshold populated with e1 as a POI event will bemax{ts(e1), ts(e)} while the threshold populated with e2 as aPOI event will be ts(e2). Different populated thresholds willalso break the trackability equivalence. In the third case,e has dependency with both e1 and e2 and the populatedthreshold is ts(e).
As we can see, only case 2 can break the forward tracka-bility equivalence. Thus, our algorithm will stop aggregatingthe two events if case 2 is reached.
3.2.3 Tracking with an aggregated eventGiven that e1 and e2 pass the backward and forward track-
ability equivalence checking of our algorithms, they will beaggregated and replaced with a new event e′. All the at-tributes of e1 and e2 will be copied to e′ except that the timewindow of e′ will become [ts(e1), te(e2)]. If e′ is selected asan POI event, the backtracking threshold will be te(e2) andthe forward tracking threshold will be ts(e1). Because all in-coming events of entity u and all outgoing events of v satisfythe conditions set by our algorithms, the backtracking andforward-tracking results with e′ as the POI event should bethe same as those with e1 or e2 as the POI event.
3.2.4 Impact on tracking with other POI eventsWhen we apply our data reduction, we attempt to aggre-
gate all the events that share the same trackability. Beforean attack is revealed, we cannot know what events will beselected as POI events; therefore, our approach should workequally on events no matter whether they will be selected asPOI events.
To continue the example above, assume we start in anotherPOI event to perform backtracking. While reaching the stepwe need to check the incoming events of entity v, we havea threshold th. Using data without reduction, we need tocheck events e1 and e2, but with the reduced data we needto check event e′. Since no outgoing events of v have the endtime falling into the range of [ts(e1), ts(e2)], according to thethreshold population algorithm, th should not fall into thisrange either. This leaves two cases for th: th <ts(e1) andth >ts(e2). In the first case, with the raw data both e1 ande2 will fail the dependency check and will not be included inthe backtracking graph. With the reduced data, e′ will notpass the dependency check either, yielding the same resultswith the data without reduction: entity u and the eventsfrom u to v will not appear in the backtracking results. Inthe second case, with the raw data, both e1 and e2 will beincluded in the backtracking graph and the threshold will bepopulated.
Note that since all events that happen before e1 will alsohappen before e2, it means e1 will be shadowed by e2 whileperforming backtracking with other POI events in this case.Therefore we only need to populate the threshold with e2,which would be min{th, te(e2)}. With the reduced data, e′
will be included with the populated threshold min{th, te(e2)}.Therefore, entity u will be included in the backtracking re-
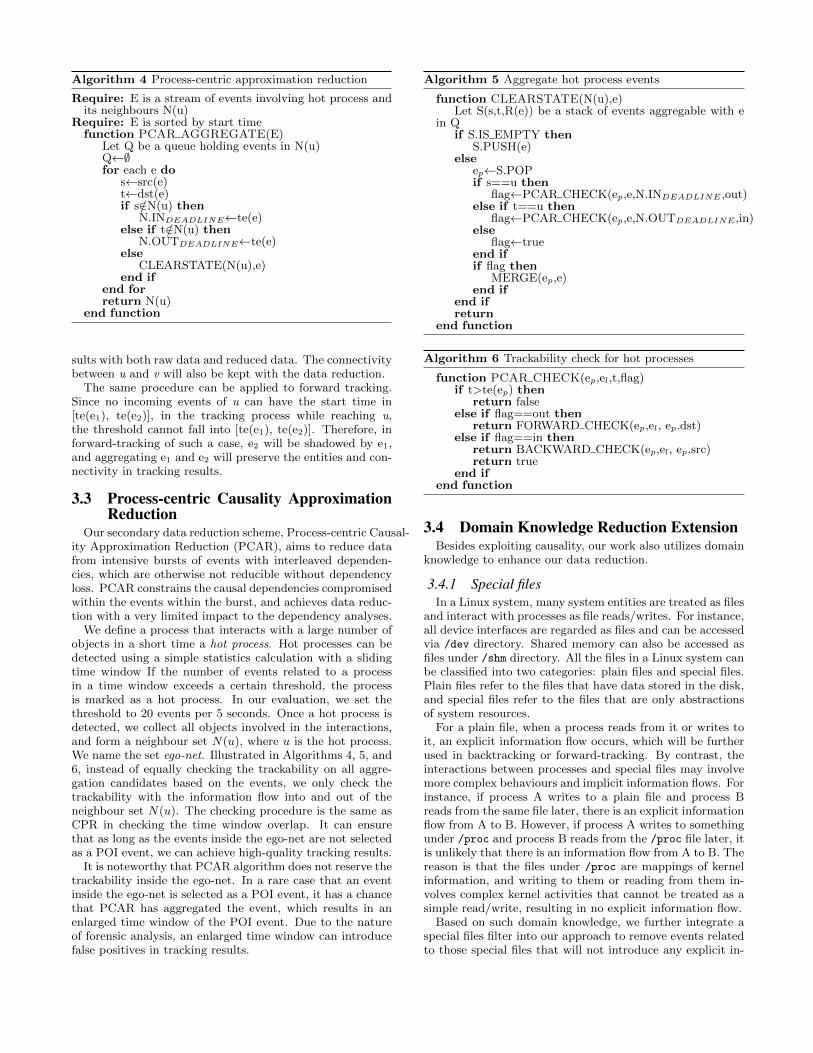
Algorithm 4 Process-centric approximation reduction
Require: E is a stream of events involving hot process andits neighbours N(u)
Require: E is sorted by start timefunction PCAR AGGREGATE(E)
Let Q be a queue holding events in N(u)Q←∅for each e do
s←src(e)t←dst(e)if s/∈N(u) then
N.INDEADLINE←te(e)else if t/∈N(u) then
N.OUTDEADLINE←te(e)else
CLEARSTATE(N(u),e)end if
end forreturn N(u)
end function
sults with both raw data and reduced data. The connectivitybetween u and v will also be kept with the data reduction.
The same procedure can be applied to forward tracking.Since no incoming events of u can have the start time in[te(e1), te(e2)], in the tracking process while reaching u,the threshold cannot fall into [te(e1), te(e2)]. Therefore, inforward-tracking of such a case, e2 will be shadowed by e1,and aggregating e1 and e2 will preserve the entities and con-nectivity in tracking results.
3.3 Process-centric Causality ApproximationReduction
Our secondary data reduction scheme, Process-centric Causal-ity Approximation Reduction (PCAR), aims to reduce datafrom intensive bursts of events with interleaved dependen-cies, which are otherwise not reducible without dependencyloss. PCAR constrains the causal dependencies compromisedwithin the events within the burst, and achieves data reduc-tion with a very limited impact to the dependency analyses.
We define a process that interacts with a large number ofobjects in a short time a hot process. Hot processes can bedetected using a simple statistics calculation with a slidingtime window If the number of events related to a processin a time window exceeds a certain threshold, the processis marked as a hot process. In our evaluation, we set thethreshold to 20 events per 5 seconds. Once a hot process isdetected, we collect all objects involved in the interactions,and form a neighbour set N(u), where u is the hot process.We name the set ego-net. Illustrated in Algorithms 4, 5, and6, instead of equally checking the trackability on all aggre-gation candidates based on the events, we only check thetrackability with the information flow into and out of theneighbour set N(u). The checking procedure is the same asCPR in checking the time window overlap. It can ensurethat as long as the events inside the ego-net are not selectedas a POI event, we can achieve high-quality tracking results.
It is noteworthy that PCAR algorithm does not reserve thetrackability inside the ego-net. In a rare case that an eventinside the ego-net is selected as a POI event, it has a chancethat PCAR has aggregated the event, which results in anenlarged time window of the POI event. Due to the natureof forensic analysis, an enlarged time window can introducefalse positives in tracking results.
Algorithm 5 Aggregate hot process events
function CLEARSTATE(N(u),e)Let S(s,t,R(e)) be a stack of events aggregable with e
in Qif S.IS EMPTY then
S.PUSH(e)else
ep←S.POPif s==u then
flag←PCAR CHECK(ep,e,N.INDEADLINE ,out)else if t==u then
flag←PCAR CHECK(ep,e,N.OUTDEADLINE ,in)else
flag←trueend ifif flag then
MERGE(ep,e)end if
end ifreturn
end function
Algorithm 6 Trackability check for hot processes
function PCAR CHECK(ep,el,t,flag)if t>te(ep) then
return falseelse if flag==out then
return FORWARD CHECK(ep,el, ep.dst)else if flag==in then
return BACKWARD CHECK(ep,el, ep.src)return true
end ifend function
3.4 Domain Knowledge Reduction ExtensionBesides exploiting causality, our work also utilizes domain
knowledge to enhance our data reduction.
3.4.1 Special filesIn a Linux system, many system entities are treated as files
and interact with processes as file reads/writes. For instance,all device interfaces are regarded as files and can be accessedvia /dev directory. Shared memory can also be accessed asfiles under /shm directory. All the files in a Linux system canbe classified into two categories: plain files and special files.Plain files refer to the files that have data stored in the disk,and special files refer to the files that are only abstractionsof system resources.
For a plain file, when a process reads from it or writes toit, an explicit information flow occurs, which will be furtherused in backtracking or forward-tracking. By contrast, theinteractions between processes and special files may involvemore complex behaviours and implicit information flows. Forinstance, if process A writes to a plain file and process Breads from the same file later, there is an explicit informationflow from A to B. However, if process A writes to somethingunder /proc and process B reads from the /proc file later, itis unlikely that there is an information flow from A to B. Thereason is that the files under /proc are mappings of kernelinformation, and writing to them or reading from them in-volves complex kernel activities that cannot be treated as asimple read/write, resulting in no explicit information flow.
Based on such domain knowledge, we further integrate aspecial files filter into our approach to remove events relatedto those special files that will not introduce any explicit in-

formation flow. Note that for some special files, such as filesunder /shm, the processes interacting with them can still in-troduce information flows. Therefore, we will not filter them.
3.4.2 Temporary filesIn a system, there are many files that only serve temporary
purposes and will be deleted afterwards. Many processesneed to store temporary information during execution, andhence generate files that only exist for a short period of time.Thus, these temporary files only interact with the processthat creates them.
Similar to previous work [31], we define a temporary file asa file that is only touched by one process during its lifetime.Since a temporary file only has information exchange withone process, it does not introduce any explicit informationflow in attack forensics either, and therefore we can removeall the events of temporary files from the data.
4. EVALUATIONWe implement a prototype of our proposed approach, which
consists of CPR, PCAR, and domain knowledge extension(which will be referred to as DOM). Then we conduct a se-ries of experiments based on real-world data collected from acorporate R&D laboratory to demonstrate the effectivenessof our data reduction approach, in terms of data processing,storage capacity improvement and the support for forensicanalysis.
We also perform a break-down analysis to show the ef-fectiveness of our approach on different workload patterns,which therefore benefits enterprises with different workloads.Moreover, to fully evaluate our approach, we also implementa naıve event aggregation and conduct experiments for com-parison. Finally, we measure the runtime overhead of ourdata reduction system.
4.1 Data collectionIn the corporate research laboratory from which our data
is collected, we have deployed an enterprise-wide audit sys-tem. There are monitoring agents deployed across servers,desktops and laptops to collect system events. We select onemonth of data for our study. The data logs we used are col-lected from more than 30 machines with various server mod-els and operating systems. All the data collected is stored ina daily basis (i.e., the data of each day is stored in a sepa-rate database) and there will be a separate dependency graphgenerated from each individual day’s data. There are morethan 10 billion events captured during our data collection.
4.2 Data reductionWe first evaluate the overall effectiveness of our approach
in data reduction, and then we present a break-down anal-ysis to demonstrate how our solution works under differentworkloads. Finally, we compare our approach with a naıveaggregation in data reduction.
Our reduction system records how many events are aggre-gated and then reports the reduction statistics. A reduceddata volume has multi-fold significance. Most intuitively, itresults in saved storage capacity and reduced storage cost.Moreover, since our reduction system is a module in the dataprocessing stream, the reduced data will save bandwidth andimprove the data processing capacity for the following mod-ules. For instance, if our system can reduce data by 80%and the following data processing module needs to perform
�
�
��
��
��
��� ���� ��
������������ �����
��������
��� �������� ������������
Figure 7: The effectiveness of our system on improving dataprocessing and storage capacities
event queries on our output, our reduction can increase theprocessing capacity of the query module by 5 times.
4.2.1 Overall effectivenessFor comparison reasons, the log data is processed in three
phrases. In the first phrase, we only apply CPR. In thesecond phrase, we further apply PCAR. Finally, we applydomain knowledge reduction extension in the third phrase.
Figure 7 shows the data reduction results of our system(i.e., the improvements on the data processing and storagecapacities after applying our data reduction techniques). Intotal we collected data from 31 hosts, 18 of which have Linuxas operating systems and 13 of which have Windows as op-erating systems. For CPR, on average it can achieve thereduction ratio of 56% (i.e., it can reduce the data size by56%) thus increasing the data processing and storage ca-pacities by 2.27 times (2.63 in Linux and 1.61 in Windows,respectively). Next, if we apply CPR+PCAR, the overallreduction ratio will be raised to 70%, which achieves 3.33times growth in the data processing and storage capacities(4 in Linux and 2.44 in Windows, respectively). Finally, af-ter we apply our domain knowledge reduction extension, thereduction ratio can reach 77%, which increases the data pro-cessing and storage capacities by 4.35 times (5.26 in Linuxand 2.56 in Windows, respectively).
It is evident that our system can effectively reduce datalogs and improve data process and storage capacities in asignificant fashion. Even with CPR alone, the data size canbe reduced by more than half, increasing the data process-ing/storage capacities by 2 times; on certain hosts, our sys-tem can help to increase the data processing and storagecapacities by more than 20 times. From Figure 7 we cansee that at different hosts, the benefits gained by our systemvary. This is because different hosts run different workloads,and the effectiveness of our system is affected by differentworkloads.
4.2.2 Break-down analysisDifferent workloads introduce different system activities,
resulting in different process behaviours and different amountsof event redundancy. Since the effectiveness of our system issensitive to different workloads, we need to conduct a break-down analysis to scrutinize how our system works on differentworkloads.
�
������
����
���������
���
����
�����
����������
�������������
������������
�������
�����������
�����������
���� !�����
��"���#
����$���
%���&���'�����
(�!��
)���&��*�����
(++�*�
,�$� ��"��
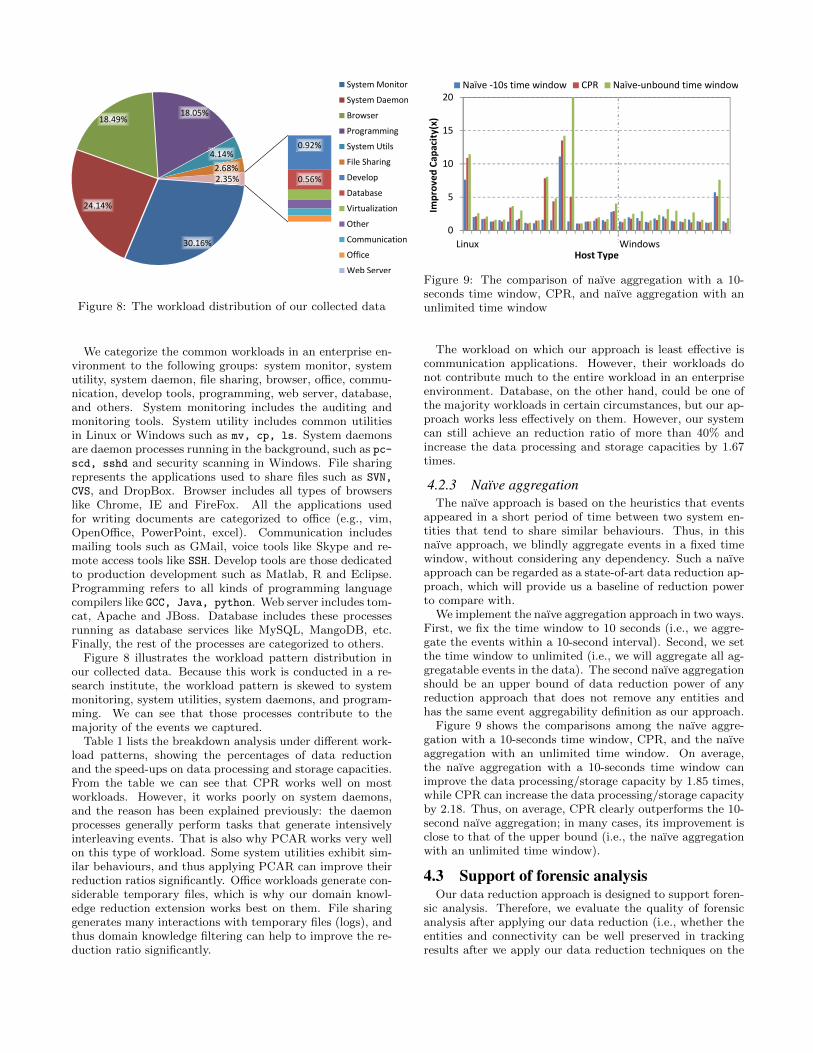
Figure 8: The workload distribution of our collected data
We categorize the common workloads in an enterprise en-vironment to the following groups: system monitor, systemutility, system daemon, file sharing, browser, office, commu-nication, develop tools, programming, web server, database,and others. System monitoring includes the auditing andmonitoring tools. System utility includes common utilitiesin Linux or Windows such as mv, cp, ls. System daemonsare daemon processes running in the background, such as pc-scd, sshd and security scanning in Windows. File sharingrepresents the applications used to share files such as SVN,
CVS, and DropBox. Browser includes all types of browserslike Chrome, IE and FireFox. All the applications usedfor writing documents are categorized to office (e.g., vim,OpenOffice, PowerPoint, excel). Communication includesmailing tools such as GMail, voice tools like Skype and re-mote access tools like SSH. Develop tools are those dedicatedto production development such as Matlab, R and Eclipse.Programming refers to all kinds of programming languagecompilers like GCC, Java, python. Web server includes tom-cat, Apache and JBoss. Database includes these processesrunning as database services like MySQL, MangoDB, etc.Finally, the rest of the processes are categorized to others.
Figure 8 illustrates the workload pattern distribution inour collected data. Because this work is conducted in a re-search institute, the workload pattern is skewed to systemmonitoring, system utilities, system daemons, and program-ming. We can see that those processes contribute to themajority of the events we captured.
Table 1 lists the breakdown analysis under different work-load patterns, showing the percentages of data reductionand the speed-ups on data processing and storage capacities.From the table we can see that CPR works well on mostworkloads. However, it works poorly on system daemons,and the reason has been explained previously: the daemonprocesses generally perform tasks that generate intensivelyinterleaving events. That is also why PCAR works very wellon this type of workload. Some system utilities exhibit sim-ilar behaviours, and thus applying PCAR can improve theirreduction ratios significantly. Office workloads generate con-siderable temporary files, which is why our domain knowl-edge reduction extension works best on them. File sharinggenerates many interactions with temporary files (logs), andthus domain knowledge filtering can help to improve the re-duction ratio significantly.
�
�
��
��
��
��� ���� ��
������������ �����
��������
�������������������� � ��� �������� ������������ �
Figure 9: The comparison of naıve aggregation with a 10-seconds time window, CPR, and naıve aggregation with anunlimited time window
The workload on which our approach is least effective iscommunication applications. However, their workloads donot contribute much to the entire workload in an enterpriseenvironment. Database, on the other hand, could be one ofthe majority workloads in certain circumstances, but our ap-proach works less effectively on them. However, our systemcan still achieve an reduction ratio of more than 40% andincrease the data processing and storage capacities by 1.67times.
4.2.3 Naïve aggregationThe naıve approach is based on the heuristics that events
appeared in a short period of time between two system en-tities that tend to share similar behaviours. Thus, in thisnaıve approach, we blindly aggregate events in a fixed timewindow, without considering any dependency. Such a naıveapproach can be regarded as a state-of-art data reduction ap-proach, which will provide us a baseline of reduction powerto compare with.
We implement the naıve aggregation approach in two ways.First, we fix the time window to 10 seconds (i.e., we aggre-gate the events within a 10-second interval). Second, we setthe time window to unlimited (i.e., we will aggregate all ag-gregatable events in the data). The second naıve aggregationshould be an upper bound of data reduction power of anyreduction approach that does not remove any entities andhas the same event aggregability definition as our approach.
Figure 9 shows the comparisons among the naıve aggre-gation with a 10-seconds time window, CPR, and the naıveaggregation with an unlimited time window. On average,the naıve aggregation with a 10-seconds time window canimprove the data processing/storage capacity by 1.85 times,while CPR can increase the data processing/storage capacityby 2.18. Thus, on average, CPR clearly outperforms the 10-second naıve aggregation; in many cases, its improvement isclose to that of the upper bound (i.e., the naıve aggregationwith an unlimited time window).
4.3 Support of forensic analysisOur data reduction approach is designed to support foren-
sic analysis. Therefore, we evaluate the quality of forensicanalysis after applying our data reduction (i.e., whether theentities and connectivity can be well preserved in trackingresults after we apply our data reduction techniques on the
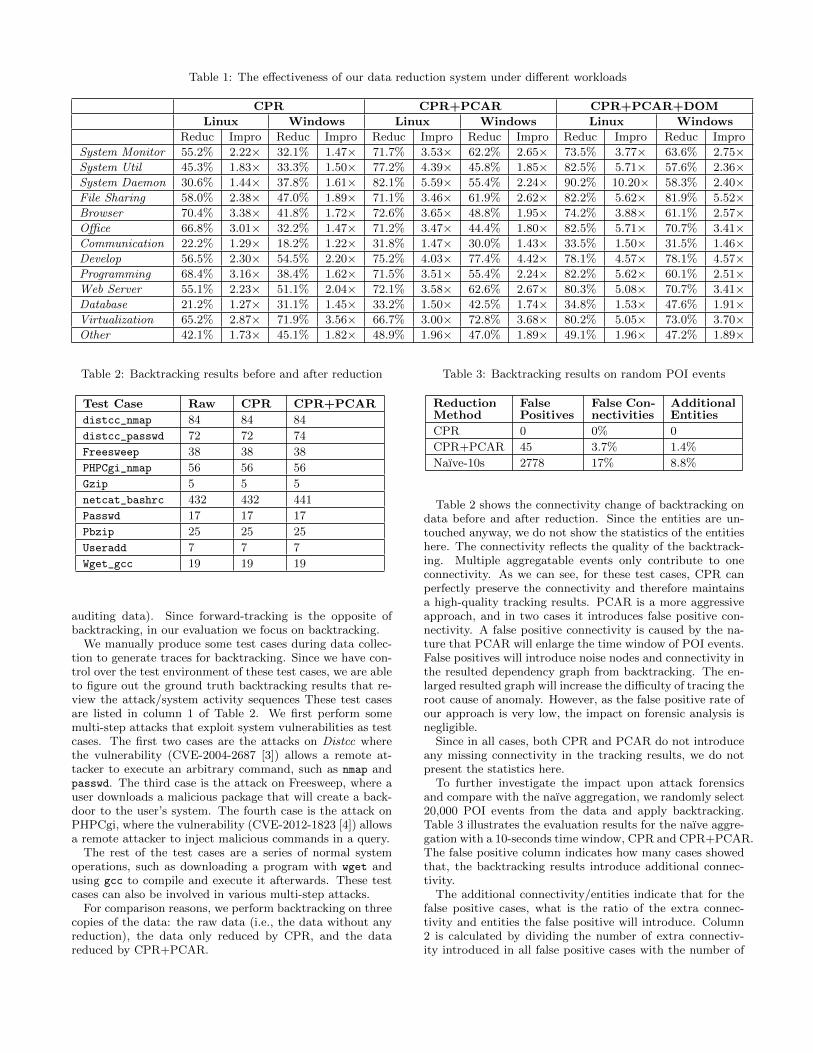
Table 1: The effectiveness of our data reduction system under different workloads
CPR CPR+PCAR CPR+PCAR+DOM
Linux Windows Linux Windows Linux Windows
Reduc Impro Reduc Impro Reduc Impro Reduc Impro Reduc Impro Reduc Impro
System Monitor 55.2% 2.22× 32.1% 1.47× 71.7% 3.53× 62.2% 2.65× 73.5% 3.77× 63.6% 2.75×System Util 45.3% 1.83× 33.3% 1.50× 77.2% 4.39× 45.8% 1.85× 82.5% 5.71× 57.6% 2.36×System Daemon 30.6% 1.44× 37.8% 1.61× 82.1% 5.59× 55.4% 2.24× 90.2% 10.20× 58.3% 2.40×File Sharing 58.0% 2.38× 47.0% 1.89× 71.1% 3.46× 61.9% 2.62× 82.2% 5.62× 81.9% 5.52×Browser 70.4% 3.38× 41.8% 1.72× 72.6% 3.65× 48.8% 1.95× 74.2% 3.88× 61.1% 2.57×Office 66.8% 3.01× 32.2% 1.47× 71.2% 3.47× 44.4% 1.80× 82.5% 5.71× 70.7% 3.41×Communication 22.2% 1.29× 18.2% 1.22× 31.8% 1.47× 30.0% 1.43× 33.5% 1.50× 31.5% 1.46×Develop 56.5% 2.30× 54.5% 2.20× 75.2% 4.03× 77.4% 4.42× 78.1% 4.57× 78.1% 4.57×Programming 68.4% 3.16× 38.4% 1.62× 71.5% 3.51× 55.4% 2.24× 82.2% 5.62× 60.1% 2.51×Web Server 55.1% 2.23× 51.1% 2.04× 72.1% 3.58× 62.6% 2.67× 80.3% 5.08× 70.7% 3.41×Database 21.2% 1.27× 31.1% 1.45× 33.2% 1.50× 42.5% 1.74× 34.8% 1.53× 47.6% 1.91×Virtualization 65.2% 2.87× 71.9% 3.56× 66.7% 3.00× 72.8% 3.68× 80.2% 5.05× 73.0% 3.70×Other 42.1% 1.73× 45.1% 1.82× 48.9% 1.96× 47.0% 1.89× 49.1% 1.96× 47.2% 1.89×
Table 2: Backtracking results before and after reduction
Test Case Raw CPR CPR+PCAR
distcc_nmap 84 84 84
distcc_passwd 72 72 74
Freesweep 38 38 38
PHPCgi_nmap 56 56 56
Gzip 5 5 5
netcat_bashrc 432 432 441
Passwd 17 17 17
Pbzip 25 25 25
Useradd 7 7 7
Wget_gcc 19 19 19
auditing data). Since forward-tracking is the opposite ofbacktracking, in our evaluation we focus on backtracking.
We manually produce some test cases during data collec-tion to generate traces for backtracking. Since we have con-trol over the test environment of these test cases, we are ableto figure out the ground truth backtracking results that re-view the attack/system activity sequences These test casesare listed in column 1 of Table 2. We first perform somemulti-step attacks that exploit system vulnerabilities as testcases. The first two cases are the attacks on Distcc wherethe vulnerability (CVE-2004-2687 [3]) allows a remote at-tacker to execute an arbitrary command, such as nmap andpasswd. The third case is the attack on Freesweep, where auser downloads a malicious package that will create a back-door to the user’s system. The fourth case is the attack onPHPCgi, where the vulnerability (CVE-2012-1823 [4]) allowsa remote attacker to inject malicious commands in a query.
The rest of the test cases are a series of normal systemoperations, such as downloading a program with wget andusing gcc to compile and execute it afterwards. These testcases can also be involved in various multi-step attacks.
For comparison reasons, we perform backtracking on threecopies of the data: the raw data (i.e., the data without anyreduction), the data only reduced by CPR, and the datareduced by CPR+PCAR.
Table 3: Backtracking results on random POI events
ReductionMethod
FalsePositives
False Con-nectivities
AdditionalEntities
CPR 0 0% 0
CPR+PCAR 45 3.7% 1.4%
Naıve-10s 2778 17% 8.8%
Table 2 shows the connectivity change of backtracking ondata before and after reduction. Since the entities are un-touched anyway, we do not show the statistics of the entitieshere. The connectivity reflects the quality of the backtrack-ing. Multiple aggregatable events only contribute to oneconnectivity. As we can see, for these test cases, CPR canperfectly preserve the connectivity and therefore maintainsa high-quality tracking results. PCAR is a more aggressiveapproach, and in two cases it introduces false positive con-nectivity. A false positive connectivity is caused by the na-ture that PCAR will enlarge the time window of POI events.False positives will introduce noise nodes and connectivity inthe resulted dependency graph from backtracking. The en-larged resulted graph will increase the difficulty of tracing theroot cause of anomaly. However, as the false positive rate ofour approach is very low, the impact on forensic analysis isnegligible.
Since in all cases, both CPR and PCAR do not introduceany missing connectivity in the tracking results, we do notpresent the statistics here.
To further investigate the impact upon attack forensicsand compare with the naıve aggregation, we randomly select20,000 POI events from the data and apply backtracking.Table 3 illustrates the evaluation results for the naıve aggre-gation with a 10-seconds time window, CPR and CPR+PCAR.The false positive column indicates how many cases showedthat, the backtracking results introduce additional connec-tivity.
The additional connectivity/entities indicate that for thefalse positive cases, what is the ratio of the extra connec-tivity and entities the false positive will introduce. Column2 is calculated by dividing the number of extra connectiv-ity introduced in all false positive cases with the number of
�
���
���
���
����
����
���
����
� � � �� �� � �� � �� �� �
������������ �������
��������������
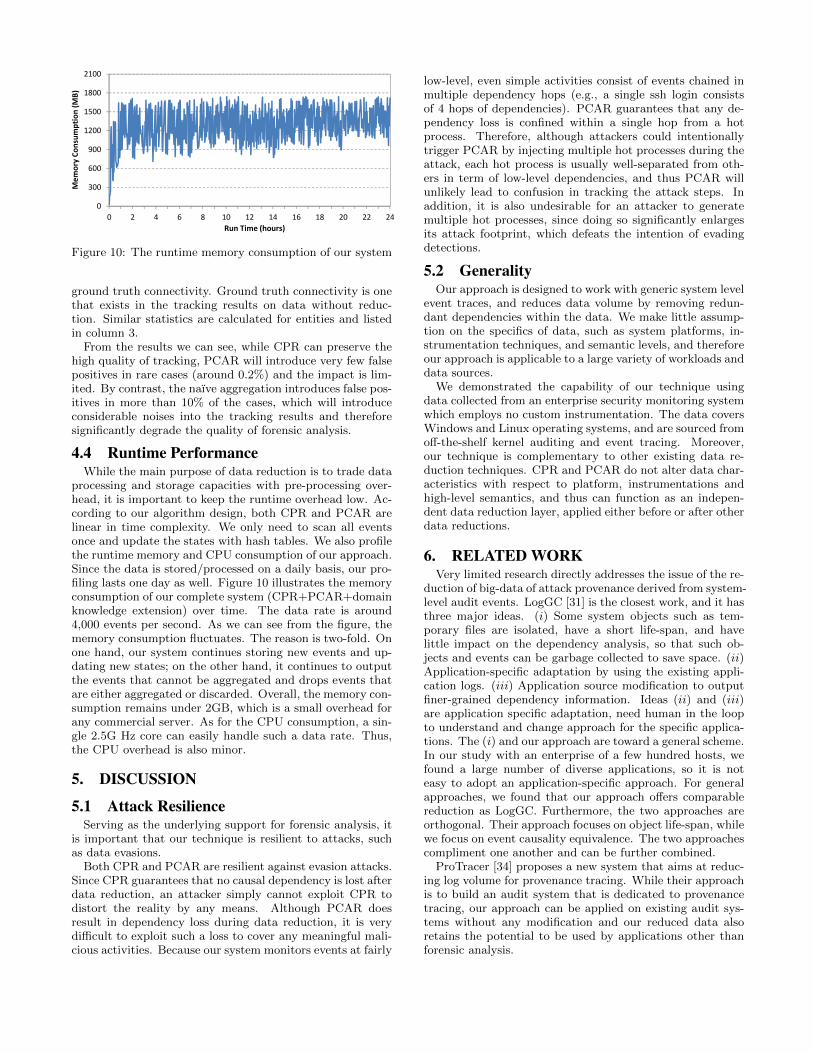
Figure 10: The runtime memory consumption of our system
ground truth connectivity. Ground truth connectivity is onethat exists in the tracking results on data without reduc-tion. Similar statistics are calculated for entities and listedin column 3.
From the results we can see, while CPR can preserve thehigh quality of tracking, PCAR will introduce very few falsepositives in rare cases (around 0.2%) and the impact is lim-ited. By contrast, the naıve aggregation introduces false pos-itives in more than 10% of the cases, which will introduceconsiderable noises into the tracking results and thereforesignificantly degrade the quality of forensic analysis.
4.4 Runtime PerformanceWhile the main purpose of data reduction is to trade data
processing and storage capacities with pre-processing over-head, it is important to keep the runtime overhead low. Ac-cording to our algorithm design, both CPR and PCAR arelinear in time complexity. We only need to scan all eventsonce and update the states with hash tables. We also profilethe runtime memory and CPU consumption of our approach.Since the data is stored/processed on a daily basis, our pro-filing lasts one day as well. Figure 10 illustrates the memoryconsumption of our complete system (CPR+PCAR+domainknowledge extension) over time. The data rate is around4,000 events per second. As we can see from the figure, thememory consumption fluctuates. The reason is two-fold. Onone hand, our system continues storing new events and up-dating new states; on the other hand, it continues to outputthe events that cannot be aggregated and drops events thatare either aggregated or discarded. Overall, the memory con-sumption remains under 2GB, which is a small overhead forany commercial server. As for the CPU consumption, a sin-gle 2.5G Hz core can easily handle such a data rate. Thus,the CPU overhead is also minor.
5. DISCUSSION
5.1 Attack ResilienceServing as the underlying support for forensic analysis, it
is important that our technique is resilient to attacks, suchas data evasions.
Both CPR and PCAR are resilient against evasion attacks.Since CPR guarantees that no causal dependency is lost afterdata reduction, an attacker simply cannot exploit CPR todistort the reality by any means. Although PCAR doesresult in dependency loss during data reduction, it is verydifficult to exploit such a loss to cover any meaningful mali-cious activities. Because our system monitors events at fairly
low-level, even simple activities consist of events chained inmultiple dependency hops (e.g., a single ssh login consistsof 4 hops of dependencies). PCAR guarantees that any de-pendency loss is confined within a single hop from a hotprocess. Therefore, although attackers could intentionallytrigger PCAR by injecting multiple hot processes during theattack, each hot process is usually well-separated from oth-ers in term of low-level dependencies, and thus PCAR willunlikely lead to confusion in tracking the attack steps. Inaddition, it is also undesirable for an attacker to generatemultiple hot processes, since doing so significantly enlargesits attack footprint, which defeats the intention of evadingdetections.
5.2 GeneralityOur approach is designed to work with generic system level
event traces, and reduces data volume by removing redun-dant dependencies within the data. We make little assump-tion on the specifics of data, such as system platforms, in-strumentation techniques, and semantic levels, and thereforeour approach is applicable to a large variety of workloads anddata sources.
We demonstrated the capability of our technique usingdata collected from an enterprise security monitoring systemwhich employs no custom instrumentation. The data coversWindows and Linux operating systems, and are sourced fromoff-the-shelf kernel auditing and event tracing. Moreover,our technique is complementary to other existing data re-duction techniques. CPR and PCAR do not alter data char-acteristics with respect to platform, instrumentations andhigh-level semantics, and thus can function as an indepen-dent data reduction layer, applied either before or after otherdata reductions.
6. RELATED WORKVery limited research directly addresses the issue of the re-
duction of big-data of attack provenance derived from system-level audit events. LogGC [31] is the closest work, and it hasthree major ideas. (i) Some system objects such as tem-porary files are isolated, have a short life-span, and havelittle impact on the dependency analysis, so that such ob-jects and events can be garbage collected to save space. (ii)Application-specific adaptation by using the existing appli-cation logs. (iii) Application source modification to outputfiner-grained dependency information. Ideas (ii) and (iii)are application specific adaptation, need human in the loopto understand and change approach for the specific applica-tions. The (i) and our approach are toward a general scheme.In our study with an enterprise of a few hundred hosts, wefound a large number of diverse applications, so it is noteasy to adopt an application-specific approach. For generalapproaches, we found that our approach offers comparablereduction as LogGC. Furthermore, the two approaches areorthogonal. Their approach focuses on object life-span, whilewe focus on event causality equivalence. The two approachescompliment one another and can be further combined.
ProTracer [34] proposes a new system that aims at reduc-ing log volume for provenance tracing. While their approachis to build an audit system that is dedicated to provenancetracing, our approach can be applied on existing audit sys-tems without any modification and our reduced data alsoretains the potential to be used by applications other thanforensic analysis.

The other data reduction works do not consider preserv-ing the dependency path and thus are not applicable to ourproblem. Some works on data aggregation aim to reducecommunication cost and improving data privacy [17, 19, 20,21, 26, 24, 38]. In contrast to these works, we focus on reduc-ing system auditing data while supporting forensic analysis,particularly backtracking and forward-tracking. There arealso other studies exploiting graph techniques for data reduc-tion [18, 37]. However, none of them leverages dependencyin data reduction.
Since the assumptions and usage scenarios in our approachare very different from these previous data reduction, it ishard to compare them side-by-side. Our work has its uniquecontribution in the novelty of the key techniques and is com-plementary to other reduction techniques.
Forensic analysis plays an important role in security. Kingand Chen [27] proposed a backtracking technique to performintrusion analysis by automatically reconstructing a chainof events in a dependency graph. Following this approach,various forensic analysis techniques have been developed invarious scenarios such as recovering an intrusion [23], wormbreak-in detection [25], forensic analysis in virtualized envi-ronments [29], binary level attack provenance [30], risk anal-ysis in networks [35], and file system intrusion detection [36].Ma et al. [33] proposed a Windows audit logging techniquethat can provide accurate traces for forensic analysis
Although there are different tracking techniques, the keyconcept of exploiting the dependency between system eventsfor analysis remains the same. Dependency graphs havebeen widely used in system and security studies. Besidesthe usage of a dependency graph in forensic analysis [27,23], researchers have leveraged dependency graphs to per-form code generation on multiprocessor systems [15], identifyuser clicks in http requests [32], predict system failures [41],diagnose networking failures [40], assess attacks in enter-prises [22], perform malware classification [39], and detectsecurity failures in the cloud environment [16].
7. CONCLUSIONWe presented a novel approach that exploits dependency
among system events to reduce the size of data without com-promising the accuracy of the forensic analysis. Core to ourcontribution, we proposed the concept of trackability, whichdetermines causality relation among system events. By ag-gregating events under the same trackability, our approachcould reduce a large potion of data while preserving eventsrelevant to a forensic analysis. Incorporated with domainknowledges specific to system process behaviours, our pro-totype implemented data reduction for two types of forensicanalyses: backtracking and forward-tracking.
Evaluated over datasets gathered from a real-world enter-prise environment, our results show that our approach im-proves space capacity by 3.4 times with no or little accuracycompromise. Although the overall space and computationalrequirements for large-scale data analysis remain challeng-ing, we hope our data reduction approach will bring forensicanalysis in a big data context closer to become practical.
8. ACKNOWLEDGEMENTWe would like to thank our shepherd Tudor Dumitras
and the anonymous reviewers for their insightful and de-tailed comments. Zhang Xu and Haining Wang were par-
tially supported by ONR grant N00014-13-1-0088 and NSFgrant CNS-1618117.
9. REFERENCES[1] Anthem cyber attack.
http://abcnews.go.com/Business/anthem-cyber-attack-things-happen-personal-information/story?id=28747729.
[2] Case study: The Home Depot data breach. https://www.sans.org/reading-room/whitepapers/casestudies/case-study-home-depot-data-breach-36367.
[3] CVE-2004-2687. https://cve.mitre.org/cgi-bin/cvename.cgi?name=CVE-2004-2687.
[4] CVE-2012-1823. https://cve.mitre.org/cgi-bin/cvename.cgi?name=CVE-2012-1823.
[5] Cyber kill chain. http://www.lockheedmartin.com/us/what-we-do/information-technology/cybersecurity/tradecraft/cyber-kill-chain.html.
[6] Ebay inc. to ask Ebay users to change passwords.http://blog.ebay.com/ebay-inc-ask-ebay-users-change-passwords/.
[7] Etw events in the common language runtime.https://msdn.microsoft.com/en-us/library/ff357719(v=vs.110).aspx.
[8] The Linux audit framework.https://www.suse.com/documentation/sled10/auditsp1/data/book sle audit.html.
[9] OPM government data breach impacted 21.5 million.http://www.cnn.com/2015/07/09/politics/office-of-personnel-management-data-breach-20-million/.
[10] Sony reports 24.5 million more accounts hacked.http://www.darkreading.com/attacks-and-breaches/sony-reports-245-million-more-accounts-hacked/d/d-id/1097499?
[11] Stuxnet. https://en.wikipedia.org/wiki/Stuxnet.
[12] Target hit by credit-card breach.http://online.wsj.com/news/articles/SB10001424052702304773104579266743230242538.
[13] Transparent computing. http://www.darpa.mil/program/transparent-computing.
[14] Trustwave Global Security Report, 2015.https://www2.trustwave.com/rs/815-RFM-693/images/2015 TrustwaveGlobalSecurityReport.pdf.
[15] J. A. Ambrose, J. Peddersen, S. Parameswaran,A. Labios, and Y. Yachide. Sdg2kpn: Systemdependency graph to function-level kpn generation oflegacy code for mpsocs. In Proceedings of IEEEASP-DAC’14, pages 267–273.
[16] S. Bleikertz, C. Vogel, and T. Groß. Cloud radar: nearreal-time detection of security failures in dynamicvirtualized infrastructures. In Proceedings of ACMACSAC’14, pages 26–35.
[17] C. Castelluccia, E. Mykletun, and G. Tsudik. Efficientaggregation of encrypted data in wireless sensornetworks. In Proceedings of IEEE MobiQuitous’05,pages 109–117.
[18] A. P. Chapman, H. V. Jagadish, and P. Ramanan.Efficient provenance storage. In Proceedings of theACM SIGMOD’08, pages 993–1006.
[19] S. Cheng and J. Li. Sampling based (epsilon,delta)-approximate aggregation algorithm in sensor

networks. In Proceedings of IEEE ICDCS’09, pages273–280.
[20] S. Cheng, J. Li, Q. Ren, and L. Yu. Bernoulli samplingbased (ε, δ)-approximate aggregation in large-scalesensor networks. In Proceedings of IEEEINFOCOM’10, pages 1181–1189.
[21] G. Cormode and K. Yi. Tracking distributedaggregates over time-based sliding windows. InProceedings of SSDBM’12, pages 416–430.
[22] N. Ghosh, I. Chokshi, M. Sarkar, S. K. Ghosh, A. K.Kaushik, and S. K. Das. Netsecuritas: An integratedattack graph-based security assessment tool forenterprise networks. In Proceedings of ACMICDCN’15.
[23] A. Goel, K. Po, K. Farhadi, Z. Li, and E. De Lara.The taser intrusion recovery system. In Proceedings ofACM SOSP’05, pages 163–176.
[24] M. Gupta, J. Gao, X. Yan, H. Cam, and J. Han. Top-kinteresting subgraph discovery in informationnetworks. In Proceedings of IEEE ICDE’14, pages820–831.
[25] X. Jiang, A. Walters, D. Xu, E. H. Spafford,F. Buchholz, and Y.-M. Wang. Provenance-awaretracing ofworm break-in and contaminations: Aprocess coloring approach. In Proceedings of IEEEICDCS’06.
[26] J. Jose and S. Manoj Kumar. Energy efficientrecoverable concealed data aggregation in wirelesssensor networks. In Proceedings of IEEE ICE-CCN’13,pages 322–329.
[27] S. T. King and P. M. Chen. Backtracking intrusions.In Proceedings of ACM SOSP’03.
[28] S. T. King, Z. M. Mao, D. G. Lucchetti, and P. M.Chen. Enriching intrusion alerts through multi-hostcausality. In Proceedings of the Network andDistributed System Security Symposium, NDSS 2005,San Diego, California, USA, 2005.
[29] S. Krishnan, K. Z. Snow, and F. Monrose. Trail ofbytes: efficient support for forensic analysis. InProceedings of ACM CCS’10, pages 50–60.
[30] K. H. Lee, X. Zhang, and D. Xu. High accuracy attackprovenance via binary-based execution partition. InProceedings of NDSS’13.
[31] K. H. Lee, X. Zhang, and D. Xu. Loggc: garbagecollecting audit log. In Proceedings of ACM CCS’13,pages 1005–1016.
[32] J. Liu, C. Fang, and N. Ansari. Identifying user clicksbased on dependency graph. In Proceedings of IEEEWOCC’14, pages 1–5.
[33] S. Ma, K. H. Lee, C. H. Kim, J. Rhee, X. Zhang, andD. Xu. Accurate, low cost and instrumentation-freesecurity audit logging for windows. In Proceedings ofACM ACSAC’15.
[34] S. Ma, X. Zhang, and D. Xu. Protracer: Towardspractical provenance tracing by alternating betweenlogging and tainting. In Proceedings of NDSS’16.
[35] M. Rezvani, A. Ignjatovic, E. Bertino, and S. Jha.Provenance-aware security risk analysis for hosts andnetwork flows. In Proceedings of IEEE NOMS’14,pages 1–8.
[36] S. Sitaraman and S. Venkatesan. Forensic analysis offile system intrusions using improved backtracking. InProceedings of IEEE IWIA’05, pages 154–163.
[37] Y. Xie, D. Feng, Z. Tan, L. Chen, K.-K.Muniswamy-Reddy, Y. Li, and D. D. Long. A hybridapproach for efficient provenance storage. InProceedings of ACM CIKM’12, pages 1752–1756.
[38] X. Xu, R. Ansari, A. Khokhar, and A. V. Vasilakos.Hierarchical data aggregation using compressivesensing (hdacs) in wsns. ACM Transactions on SensorNetworks, 11(3):45, 2015.
[39] M. Zhang, Y. Duan, H. Yin, and Z. Zhao.Semantics-aware android malware classification usingweighted contextual api dependency graphs. InProceedings of ACM SIGSAC’14, pages 1105–1116.
[40] M. Zibaeenejad and J. Thistle. Dependency graph: analgorithm for analysis of generalized parameterizednetworks. In Proceedings of IEEE ACC’15, pages696–702.
[41] T. Zimmermann and N. Nagappan. Predictingsubsystem failures using dependency graphcomplexities. In Proceedings of ISSRE’07, pages227–236.