High-fat diet leads to tissue-specific changes reflecting risk factors for diseases in DBA/2J mice
24
doi:10.1152/physiolgenomics.00072.2009 42:55-66, 2010. First published Mar 9, 2010; Physiol Genomics A. Churchill and Gudrun A. Brockmann Rachael S. Hageman, Asja Wagener, Claudia Hantschel, Karen L. Svenson, Gary You might find this additional information useful... for this article can be found at: Supplemental material http://physiolgenomics.physiology.org/cgi/content/full/00072.2009/DC1 55 articles, 27 of which you can access free at: This article cites http://physiolgenomics.physiology.org/cgi/content/full/42/1/55#BIBL including high-resolution figures, can be found at: Updated information and services http://physiolgenomics.physiology.org/cgi/content/full/42/1/55 can be found at: Physiological Genomics about Additional material and information http://www.the-aps.org/publications/pg This information is current as of July 2, 2010 . http://www.the-aps.org/. the American Physiological Society. ISSN: 1094-8341, ESSN: 1531-2267. Visit our website at July, and October by the American Physiological Society, 9650 Rockville Pike, Bethesda MD 20814-3991. Copyright © 2005 by techniques linking genes and pathways to physiology, from prokaryotes to eukaryotes. It is published quarterly in January, April, publishes results of a wide variety of studies from human and from informative model systems with Physiological Genomics on July 2, 2010 physiolgenomics.physiology.org Downloaded from
-
Upload
independent -
Category
Documents
-
view
2 -
download
0
Transcript of High-fat diet leads to tissue-specific changes reflecting risk factors for diseases in DBA/2J mice

doi:10.1152/physiolgenomics.00072.2009 42:55-66, 2010. First published Mar 9, 2010;Physiol Genomics
A. Churchill and Gudrun A. Brockmann Rachael S. Hageman, Asja Wagener, Claudia Hantschel, Karen L. Svenson, Gary
You might find this additional information useful...
for this article can be found at: Supplemental material http://physiolgenomics.physiology.org/cgi/content/full/00072.2009/DC1
55 articles, 27 of which you can access free at: This article cites http://physiolgenomics.physiology.org/cgi/content/full/42/1/55#BIBL
including high-resolution figures, can be found at: Updated information and services http://physiolgenomics.physiology.org/cgi/content/full/42/1/55
can be found at: Physiological Genomicsabout Additional material and information http://www.the-aps.org/publications/pg
This information is current as of July 2, 2010 .
http://www.the-aps.org/.the American Physiological Society. ISSN: 1094-8341, ESSN: 1531-2267. Visit our website at July, and October by the American Physiological Society, 9650 Rockville Pike, Bethesda MD 20814-3991. Copyright © 2005 bytechniques linking genes and pathways to physiology, from prokaryotes to eukaryotes. It is published quarterly in January, April,
publishes results of a wide variety of studies from human and from informative model systems withPhysiological Genomics
on July 2, 2010 physiolgenom
ics.physiology.orgD
ownloaded from

High-fat diet leads to tissue-specific changes reflecting risk factors fordiseases in DBA/2J mice
Rachael S. Hageman,1 Asja Wagener,2 Claudia Hantschel,2 Karen L. Svenson,1 Gary A. Churchill,1
and Gudrun A. Brockmann2
1The Jackson Laboratory, Bar Harbor, Maine; and 2Department for Crop and Animal Sciences, Humboldt-Universität zuBerlin, Berlin, Germany
Submitted 20 April 2009; accepted in final form 6 March 2010
Hageman RS, Wagener A, Hantschel C, Svenson KL,Churchill GA, Brockmann GA. High-fat diet leads to tissue-specific changes reflecting risk factors for diseases in DBA/2J mice.Physiol Genomics 42: 55–66, 2010. First published March 9, 2010;doi:10.1152/physiolgenomics.00072.2009.—The aim of this study wasto characterize the responses of individual tissues to high-fat feedingas a function of mass, fat composition, and transcript abundance. Weexamined a panel of eight tissues [5 white adipose tissues (WAT),brown adipose tissue (BAT), liver, muscle] obtained from DBA/2Jmice on either a standard breeding diet (SBD) or a high-fat diet(HFD). HFD led to weight gain, decreased insulin sensitivity, andtissue-specific responses, including inflammation, in these mice. Thedietary fatty acids were partially metabolized and converted in bothliver and fat tissues. Saturated fatty acids (SFA) were converted in theliver to monounsaturated fatty acids (MUFA) and polyunsaturatedfatty acids (PUFA), and oleic acid (C18:1) was the preferred MUFAfor storage of excess energy in all tissues of HFD-fed mice. Tran-scriptional changes largely reflected the tissue-specific fat deposition.SFA were negatively correlated with genes in the collagen family andprocesses involving the extracellular matrix. We propose a novel roleof the tryptophan hydroxylase 2 (Tph2) gene in adipose tissues ofdiet-induced obesity. Tissue-specific responses to HFD were identi-fied. Liver steatosis was evident in HFD-fed mice. Gonadal, retroper-itoneal and subcutaneous adipose tissue and BAT exhibited severeinflammatory and immune responses. Mesenteric adipose tissue wasthe most metabolically active adipose tissue. Gluteal adipose tissuehad the highest mass gain but was sluggish in its metabolism. In HFDconditions, BAT functioned largely like WAT in its role as a depot forexcess energy, whereas WAT played a role in thermogenesis.
tissue panel; gene expression; insulin; obesity; steatosis; palmitic acid;stearic acid; palmitoleic acid; tryptophan hydroxylase; serum amyloidA3; regenerating islet family
OBESITY IS a well-recognized risk factor for metabolic syndromeand disease that is often accompanied by low-grade chronicinflammation (20, 27). Pioneering work of McGarry (36) posedthat insulin resistance and hyperglycemia may be better under-stood if viewed in the context of lipid metabolism. Alterationsto the fat composition and distribution across different tissuescan have whole body metabolic consequences that lead todisease states. Lipids are not only storage molecules for excessenergy; they are also major components of cell membranes andact as signaling molecules that regulate systemic biologicalprocesses. As such, they can alter transcription locally or act asinformation carriers to alter function in other cells, tissues, ororgans.
White adipose tissue (WAT) and brown adipose tissue(BAT) play complementary roles in energy balance and bodyweight control. In most mammals, BAT is the primary medi-ator of adaptive thermogenesis and therefore plays a criticalrole in energy expenditure. WAT serves as a depot for energystorage and signals information to peripheral organs and tissuesabout energy reserves. During weight gain, fat depots are notutilized equally, and they differ in their architecture and func-tion (20, 34, 35). It has become increasingly evident that theregion of fat accumulation and the availability of specific fattyacids play a pivotal role in disease susceptibility. Centralobesity, characterized by high levels of visceral fat, has beenshown to correlate to type 2 diabetes, dyslipidemia, and car-diovascular diseases (10, 55, 58). Alternatively, peripheralobesity, increased amounts of subcutaneous fat, can haveprotective effects that improve insulin sensitivity and lowerrisk factors for diseases (44, 51). In addition, ectopic storage offat in liver and muscle has been linked to liver steatosis andinsulin resistance in muscle (5, 23).
Nutritional genomic studies have analyzed responses oftissues to different diets and nutrients (1, 14, 18). However,results vary across species and tissues as well as experimentalprotocols (48, 53). The extent and manner in which differenttissues respond to increased fat storage is not well understood.Therefore, the aim of this study was to link diet-induced fatdeposition and fatty acid profiles with tissue-specific functionaladaptations in response to fat storage. We expected that dif-ferences in tissue mass and fatty acid composition would leadto differential changes in specific transcripts involved in path-ways that lead to obesity and insulin resistance.
DBA/2J mice showed the highest weight gain in response toa high-fat diet (HFD) among 43 inbred strains (49). Therefore,we exposed young DBA/2J mice to 6 wk of HFD feeding [richin saturated fatty acids (SFA)] and examined tissue-specificmass gain, fat composition, and transcript abundances. Westudied the responses of BAT, WAT (gonadal, gluteal, mesen-teric, retroperitoneal, subcutaneous), liver, and muscle at 12 wkof age, when mice on HFD continued to gain weight and hadan overall slowed metabolic rate.
MATERIALS AND METHODS
Animals, diets, and housing. Twenty-four 5-wk-old male DBA/2Jmice were obtained from The Jackson Laboratory. The average bodyweight at delivery was 14.8 � 1.5 g. All animals were fed standardbreeding diet (SBD) until 6 wk of age. Animals were then divided intotwo feeding groups with the same average body weight per group. Inthe 6 wk that followed, one group was fed a HFD and the other kepton a SBD. Animals were fed ad libitum and had free access to water.Mice were housed in pairs in a specific pathogen-free room with a12:12-h light-dark cycle. All experimental procedures were approved
Address for reprint requests and other correspondence: G. A. Brockmann,Breeding Biology and Molecular Genetics, Dept. for Crop and Animal Sci-ences, Humboldt-Universität zu Berlin, Invalidenstraße 42, 10115 Berlin,Germany (e-mail: [email protected]).
Physiol Genomics 42: 55–66, 2010.First published March 9, 2010; doi:10.1152/physiolgenomics.00072.2009.
1094-8341/10 Copyright © 2010 the American Physiological Society 55
on July 2, 2010 physiolgenom
ics.physiology.orgD
ownloaded from

by the Animal Care and Use Committee for experiments at theJackson Laboratory (approval no. A3268-01) and by the GermanAnimal Welfare Authorities for the experiments at the Animal Facilityat Humboldt-University (approval no. G0301/08).
The HFD was a Purified TestDiet 58G8 with 45% energy from fat,which is based on TestDiet Basal Diet 5755 (Purina Mills, Richmond,IN). The diet consisted of 21.9% proteins, 23.5% fat, 4.9% fibers, and42.7% carbohydrates, minerals, and vitamins (values are in wt/wt).The energy content was 4.70 kcal/g (19.68 kJ/g); fat contributed 45%,proteins 18.6%, and carbohydrates 36.4%. The SBD was standard Ratand Mouse/Auto 4F breeding LabDiet 5K54 (Purina Mills). The dietconsisted of 18% protein, 4% fat, and 5% fibers. The gross energy ofSBD was 3.97 kcal/g (16.62 kJ/g); 22% of the energy was provided byproteins, 11% by fat, and 67% by carbohydrates. The physiologicalfuel value was 3.28 kcal/g (13.73 kJ/g), and the metabolizable energywas 3.09 kcal/g (12.94 kJ/g). The fat in HFD was primarily lard, withsome corn oil, while the fat source in the SBD was soy oil. Oneproduction batch of diet was fed over the whole experimental period.The producer provided the data on the food composition. The chem-ical analysis of the diets showed that HFD and SBD contained 21.8and 4.6 g of fat per 100 g of diet, respectively. Diets were sterilizedbefore use.
Mouse phenotyping and tissue sampling. Mice were weighedweekly between 5 and 12 wk of age. Food intake was estimated as thedifference between the offered and the remnant amount of food at7-day intervals from week 8 onward. The food was provided aspressed pellets for low spillage, and residual spillage was not consid-ered here. Energy intake, determined from the energy content in eachdiet and mass consumed, was calculated on a per-day basis. Feedefficiency was determined as the ratio of body weight gain in gramsto consumed energy in kilojoules. For comparison between animals,energy intake, feed efficiency, and weekly measurements of foodintake were averaged over the period between 8 and 12 wk.
After the 6-wk feeding period with different diets, blood and tissuesamples were collected from 12-wk-old mice for the determination ofserum factors, gene expression analyses, and fatty acid profiles. Micewere individually fasted for 2 h before dissection, which was carriedout between 1 PM and 3 PM on three successive days. After thefasting period, blood was withdrawn from the retroorbital plexus ofeach mouse through a heparin-coated hematocrit tube into a 1.5-mltube and placed at room temperature until all samples were centri-fuged at 600 g for 10–15 min to obtain serum for the analysis oflipids, glucose, insulin, and leptin. Subsequently, animals were killedby cervical dislocation. After bleeding, the subcutaneous fat (mainlyinguinal fat pads), the gluteal fat pad (which is subcutaneous upon thegluteal musculus maximus between the legs left and right of the tail),the quadriceps (musculus rectus femulus, musculus vastus interme-dius, musculus vastus lateralis, musculus vastus medialis), the gonadalfat pads (surrounding gonads), the retroperitoneal fat pads (below thekidney), the liver, the mesenteric fat pad (hanging at the intestine), andthe BAT (surrounded by WAT) were carefully dissected in the givenorder. Tissues from six animals in each feeding group were collectedin RNAlater (Ambion, Austin, TX) for gene expression analysis. Thetissues of the other six animals per feeding group were shock frozenand stored under nitrogen at �80°C before determination of the fattyacid profile.
Serum lipids [total cholesterol, high-density lipoprotein (HDL)cholesterol, triglycerides (TG), free (nonesterified) fatty acids(NEFA)] and glucose were measured on the day of dissection with aBeckman Coulter Synchron CX5 Delta Chemistry Analyzer (Beck-man Coulter, Fullerton, CA) according to the manufacturer’s instruc-tions (details at http://pga.jax.org/protocols). Total cholesterol andHDL cholesterol were measured directly. An estimate of non-HDLcholesterol, which in the mouse consists of low-density lipoprotein(LDL) and very low-density lipoprotein (VLDL) cholesterol, may beobtained by subtracting HDL cholesterol from total cholesterol. Se-rum insulin was determined in 5-�l samples with the commercial
Insulin Mouse Ultrasensitive ELISA Kit from DRG Instruments(Marburg, Germany). As described above, leptin was determined withthe m/rLeptin ELISA kit by Mediagnost (Reutlingen, Germany). Forthe comparison of phenotypic values between feeding groups, Stu-dent’s t-test for two-tailed distributions with equal variances wasapplied. The influence of diet and tissue on the variance of fatty aciddistribution pattern was analyzed with the statistical package SAS(SAS 1989).
For chemical analysis of the fatty acid profiles, diet samples anddifferent tissues of three mice per diet group were collected separatelyin 15-ml tubes, which were filled with nitrogen gas. All tissues wereweighed, transferred into tubes, and overlaid with nitrogen gas againto prevent oxidization of fatty acids during storage at �18°C. Foranalysis in the serum, six sera per group were pooled to obtain enoughmaterial for the analysis. The determination of fatty acid profilescomprised quantification of the SFA C10:0, C12:0, C14:0, C15:0,C16:0, C17:0, C18:0, C20:0, C21:0, C21:0, and C24:0, the monoun-saturated fatty acids (MUFA) C14:1, C15:1, C16:1, C17:1, C18:1,C18:1, C20:1, C22:1, and C24:1, and the polyunsaturated fatty acids(PUFA) C18:2 n–6, C18:3 n–3, C18–4 n–3, C20:2, C20:3 n–6,C20:4 n–6, C20:5 n–3, C22:2, C22–5, and C22–6 n–3. The accuracyof measurements for fatty acid components per 100 g was as follows: �5g/100 g fat � 10%, 1–5 g/100 g fat � 10–15%, 0.5–1 g/100 g fat � 20%,and �0.5 g/100 g fat � 100%. Since the fatty acid amounts of C10–C15,C17, C18:4 n–3, and C20–C24 were below 0.5 g/100 g fat, and thus notreliably detectable, these fatty acids were not further considered. Thechemical analyses were performed at Bilacon (Berlin, Germany) accord-ing to a standardized method that used trimethyl sulfonium hydroxide foresterification of fatty acids to fatty acid methyl ester (21) with a gaschromatograph (Shimadzu, Japan) and a flame ionization detector.
In a separate experiment, an intraperitoneal glucose tolerance test(IPGTT) and measurement of TG in the liver and fatty acid compo-sition in serum were obtained for six DBA/2J male mice per dietgroup. Feeding and management conditions were the same as de-scribed above, except that housing was conventional, not pathogenfree. To assess glucose tolerance, 12-wk-old animals were fasted for9 h before the experiment. After a baseline blood sample was taken forfasting glucose and fasting insulin determination, each animal re-ceived a single intraperitoneal injection of glucose (B. Braun, Mel-sungen, Germany) at a dose of 2 g/kg body wt as described previously(8). For glucose concentrations, blood was obtained at 15, 30, 60, and120 min after injection from the tail tip. Blood glucose concentrationwas measured with the glucose analyzer Ascensia Elite (BayerHealthCare, Leverkusen, Germany). To minimize distress, mice werekept in their accustomed cages and had free access to water. To assessglucose tolerance, the area under glucose curves (AUC) was calcu-lated between 0 and 120 min after glucose injection and expressed asmillimoles per liter � 120 min. Lower AUC values reflect moreefficient glucose clearance. Serum insulin was determined in duplicateas described above.
Liver tissue was collected from these mice to determine TG contentfor Oil Red O staining. The liver TG extraction procedure was adaptedfrom Ref. 29. The content of extracted TG was determined from thesupernatant with a TG kit from Sigma (St. Louis, MO). TG contentwas correlated to the total protein content in the liver homogenates,determined with the BCA kit from Thermo Scientific (Pierce, Rock-ford, IL). For histological examination, parts of livers were immedi-ately fixed upon dissection in 4% buffered formaldehyde solution (pH7.4) for 24 h. Cryosections (10 �m) were incubated with 0.18% OilRed O for 10 min, washed with 60% isopropanol, and counterstainedwith hematoxylin. Sections were photographed at �10 magnification(digital camera).
Microarray processing and analysis. Total RNA was isolated byTRIzol Plus after tissue homogenization (Invitrogen, Carlsbad, CA)according to the manufacturer’s protocols. RNA quality was assessedwith an Agilent 2100 Bioanalyzer instrument and the RNA 6000 NanoLabChip assay (Agilent Technologies, Palo Alto, CA). Total RNA
56 TISSUE RESPONSES OF DBA/2J MICE TO HIGH-FAT DIET
Physiol Genomics • VOL 42 • www.physiolgenomics.org
on July 2, 2010 physiolgenom
ics.physiology.orgD
ownloaded from

was then reverse transcribed, followed by second-strand cDNA syn-thesis. An in vitro transcription (IVT) reaction was carried outincorporating biotinylated nucleotides according to the manufacturer’sprotocol for the Illumina Totalprep RNA amplification kit (Ambion).Biotin-labeled cRNA (1.5 �g) was hybridized onto Mouse-6 Expres-sion BeadChips (Illumina, San Diego, CA) for 16 h at 55°C.
The tissue samples were randomized over 16 BeadChips. Posthy-bridization staining and washing were performed according to Illumina’sprotocols. BeadChips were scanned with Illumina’s BeadStation 500scanner. Images were checked for grid alignment and quantified withBeadStudio v3.1 software, and control summary graphs were gener-ated. Probe set data, mean pixel intensities by bead type, were createdwith BeadStudio v3.1 and processed within the R/beadarray package(17). Data quality was assessed with histograms of raw signal inten-sities, MA plots, and analysis of the control probe sets. A log2
transformation was applied to the data, and quantile normalizationwas performed (6). The 90th quantile was calculated from the nega-tive controls as 7.68 and used as an approximation of the geneexpression background intensity.
Analysis of variance (ANOVA) was used to determine gene ex-pression differences (30). In an ANOVA model, the expressionmeasures are described as the sum of components that contribute tothe overall intensity of each probe Yi on the array. For each tissue, thefollowing model was fit and tested to determine differences in geneexpression due to diet:
Yi � � � Diet � �i
where � is the mean for each array, Diet is a two-level factor for thetwo diet groups and εi captures the random error. In addition, thefollowing ANOVA model was fit and tested:
Yb � � � Tissue � Diet � Tissue: Diet � �i
where Tissue:Diet is a 16-level factor describing the possible inter-actions between the 8 tissues and 2 diet groups.
Statistical tests were performed with a modified F statistic, Fs,which incorporates shrinkage estimates of variance components (13).P values were obtained by permuting the model residuals 1,000 times(Supplemental Fig. S1).1 Calculations were performed with theR/MAANOVA package (56). The false discovery rate (FDR) forstatistically significant probes was estimated with q values (46).
Correlation analysis and principal component analysis. Pairwisecorrelations between variance components of differentially expressedgenes from the tissue-by-diet interaction ANOVA model and fatty acidcomponents were calculated as the Pearson correlation coefficient.
Principal component analysis (PCA) applied to individual variancecomponents in an ANOVA model has been shown to provide insight intothe effects of treatments on gene expression data (15). We applied PCAto the variance components from the ANOVA tissue-by-diet interactionmodel together with the fatty acid components C16:0, C16:1, C18:0,C18:1, C18:2 n–6, and C18:3 n–3 in different tissues and dietaryconditions. The variance components from the tissue-by-diet interactionmodel were combined with the standardized fatty acid compositionmeasurements for each tissue and diet condition for the PCA analysis.The first four principal components explained 90% of the variation. Abiplot of the first four principal components is shown in Fig. 4. TheHotelling T2 statistic was calculated for each gene and fatty acid com-ponent as
Ti2 � �
k�1
4 uik2
su2
where u is the score of the ith observation on the kth principalcomponent and su
2 is the variance of scores. A critical value wascalculated at the � � 0.01 level as
Tc2 �
(n � 1)p
(n � p)F�;p,n�p
which yielded 2,508 probe sets with significant diet-by-tissue inter-action.
Pathway enrichment. The Gene Ontology Consortium has estab-lished a controlled vocabulary, Gene Ontology (GO), to describe geneand gene product relationships (26). Kyoto Encyclopedia of Genesand Genomes (KEGG) pathways have been developed to describerelationships over metabolic, signaling, and disease pathways (28).We applied two types of pathway analyses that aim to capturedifferent aspects of the enrichment signal to detect overrepresentedKEGG and GO categories.
Hypergeometric tests were performed with the GOstats package todetect enriched biological categories (19). The gene universe (back-ground) was defined as the 12,656 unique Entrez Gene Identifierspresent in the data set. Gene sets were tested for significance at thethreshold level P value � 0.01 in KEGG and GO categories.
Random set enrichment analysis was applied to assess whichpathways and processes were most significantly changed in the HFDcondition within each of the tissues (41). Briefly, the method calcu-lates category scores from gene-level evidence, which is a quantitativemeasure for each gene in the expression data set. In the case at hand,we considered the genes, g � {g1, g2, . . . , gG}, and their gene levelscores, sg � { s1, s2, . . . , sG}, as the t statistics calculated from the Fs
statistic. In this analysis, a biological category of genes is scored forenrichment by averaging the gene level evidence across the category
X �1
m �g�c
sg
and computing the standardized category enrichment score Z � (X�
minus �)/, where � and are the first two moments of theunderlying distribution. Enrichment scores were calculated for eachtissue and adjusted to account for the effects of category size andmultiple probes per gene. All computations were done with the Rfunction allez.R (http://www.stat.wisc.edu/newton/), with mappingsfrom the Illumina annotation package lumiMouseV1 in Bioconductor(http://www.bioconductor.org/).
RESULTS
Physiological changes due to high-fat feeding. Mice on aHFD gained 17.5 g body wt compared with a 8.3-g weight gainin mice on SBD (Supplemental Table S1). Increased weight onHFD was observed in all examined tissues except muscle(Table 1). The increased liver weight represents ectopic fatstorage and is consistent with elevated TG content (Fig. 1, Aand B), which was about three times higher in HFD- compared
1 The online version of this article contains supplemental material.
Table 1. Fat deposition in tissues
Tissue HFD SBD HFD/SBD P Value
BAT 0.39 � 0.02 0.14 � 0.02 2.38 �0.001GonF 1.08 � 0.18 0.45 � 0.11 2.41 0.002GlutF 0.35 � 0.03 0.09 � 0.03 3.73 �0.001MesF 0.5 � 0.02 0.24 � 0.04 2.04 �0.001RetF 0.42 � 0.01 0.16 � 0.03 2.74 �0.001SubF 1.51 � 0.16 0.54 � 0.13 2.81 �0.001Liver 1.21 � 0.04 1.07 � 0.03 1.13 0.003Muscle 0.24 � 0.04 0.25 � 0.02 1.09 0.398
Values (in g) are mean � SD weights of the surveyed tissues [brown adiposetissue (BAT); gonadal (GonF), gluteal (GlutF), mesenteric (MesF), retroperi-toneal (RetF), and subcutaneous (SubF) white adipose tissues; liver; andmuscle] in male mice at 12 wk after a 6-wk feeding period with standardbreeding diet (SBD) or high-fat diet (HFD).
57TISSUE RESPONSES OF DBA/2J MICE TO HIGH-FAT DIET
Physiol Genomics • VOL 42 • www.physiolgenomics.org
on July 2, 2010 physiolgenom
ics.physiology.orgD
ownloaded from
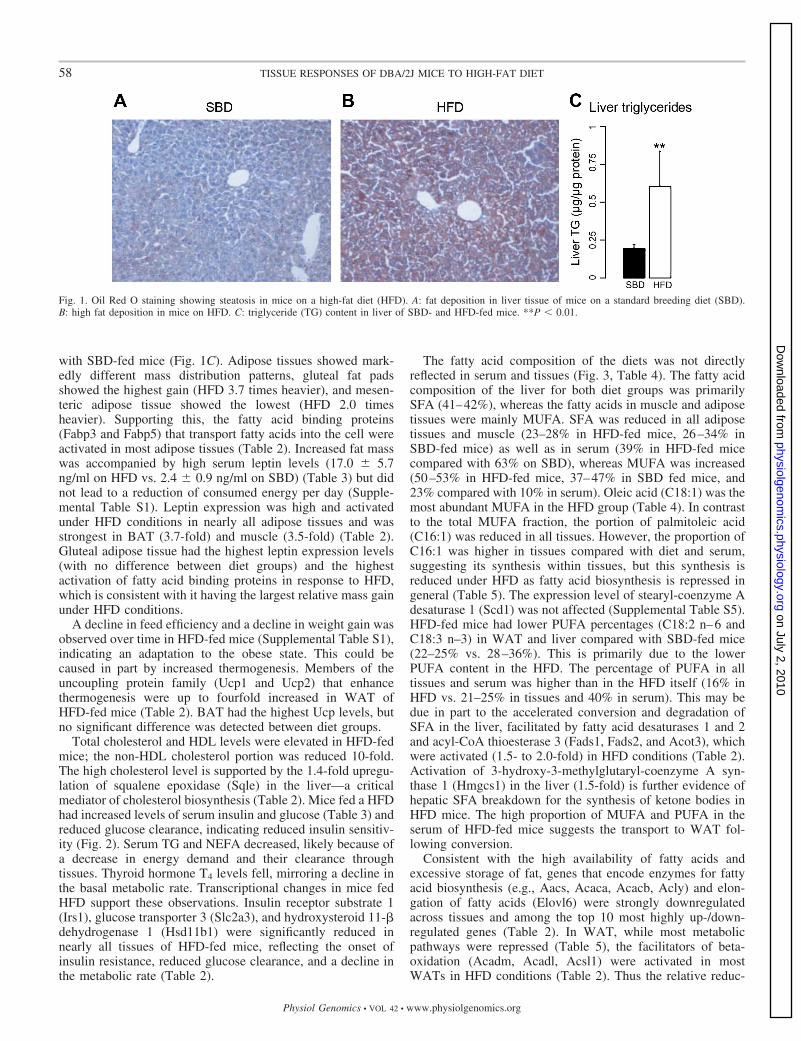
with SBD-fed mice (Fig. 1C). Adipose tissues showed mark-edly different mass distribution patterns, gluteal fat padsshowed the highest gain (HFD 3.7 times heavier), and mesen-teric adipose tissue showed the lowest (HFD 2.0 timesheavier). Supporting this, the fatty acid binding proteins(Fabp3 and Fabp5) that transport fatty acids into the cell wereactivated in most adipose tissues (Table 2). Increased fat masswas accompanied by high serum leptin levels (17.0 � 5.7ng/ml on HFD vs. 2.4 � 0.9 ng/ml on SBD) (Table 3) but didnot lead to a reduction of consumed energy per day (Supple-mental Table S1). Leptin expression was high and activatedunder HFD conditions in nearly all adipose tissues and wasstrongest in BAT (3.7-fold) and muscle (3.5-fold) (Table 2).Gluteal adipose tissue had the highest leptin expression levels(with no difference between diet groups) and the highestactivation of fatty acid binding proteins in response to HFD,which is consistent with it having the largest relative mass gainunder HFD conditions.
A decline in feed efficiency and a decline in weight gain wasobserved over time in HFD-fed mice (Supplemental Table S1),indicating an adaptation to the obese state. This could becaused in part by increased thermogenesis. Members of theuncoupling protein family (Ucp1 and Ucp2) that enhancethermogenesis were up to fourfold increased in WAT ofHFD-fed mice (Table 2). BAT had the highest Ucp levels, butno significant difference was detected between diet groups.
Total cholesterol and HDL levels were elevated in HFD-fedmice; the non-HDL cholesterol portion was reduced 10-fold.The high cholesterol level is supported by the 1.4-fold upregu-lation of squalene epoxidase (Sqle) in the liver—a criticalmediator of cholesterol biosynthesis (Table 2). Mice fed a HFDhad increased levels of serum insulin and glucose (Table 3) andreduced glucose clearance, indicating reduced insulin sensitiv-ity (Fig. 2). Serum TG and NEFA decreased, likely because ofa decrease in energy demand and their clearance throughtissues. Thyroid hormone T4 levels fell, mirroring a decline inthe basal metabolic rate. Transcriptional changes in mice fedHFD support these observations. Insulin receptor substrate 1(Irs1), glucose transporter 3 (Slc2a3), and hydroxysteroid 11-�dehydrogenase 1 (Hsd11b1) were significantly reduced innearly all tissues of HFD-fed mice, reflecting the onset ofinsulin resistance, reduced glucose clearance, and a decline inthe metabolic rate (Table 2).
The fatty acid composition of the diets was not directlyreflected in serum and tissues (Fig. 3, Table 4). The fatty acidcomposition of the liver for both diet groups was primarilySFA (41–42%), whereas the fatty acids in muscle and adiposetissues were mainly MUFA. SFA was reduced in all adiposetissues and muscle (23–28% in HFD-fed mice, 26–34% inSBD-fed mice) as well as in serum (39% in HFD-fed micecompared with 63% on SBD), whereas MUFA was increased(50–53% in HFD-fed mice, 37–47% in SBD fed mice, and23% compared with 10% in serum). Oleic acid (C18:1) was themost abundant MUFA in the HFD group (Table 4). In contrastto the total MUFA fraction, the portion of palmitoleic acid(C16:1) was reduced in all tissues. However, the proportion ofC16:1 was higher in tissues compared with diet and serum,suggesting its synthesis within tissues, but this synthesis isreduced under HFD as fatty acid biosynthesis is repressed ingeneral (Table 5). The expression level of stearyl-coenzyme Adesaturase 1 (Scd1) was not affected (Supplemental Table S5).HFD-fed mice had lower PUFA percentages (C18:2 n–6 andC18:3 n–3) in WAT and liver compared with SBD-fed mice(22–25% vs. 28–36%). This is primarily due to the lowerPUFA content in the HFD. The percentage of PUFA in alltissues and serum was higher than in the HFD itself (16% inHFD vs. 21–25% in tissues and 40% in serum). This may bedue in part to the accelerated conversion and degradation ofSFA in the liver, facilitated by fatty acid desaturases 1 and 2and acyl-CoA thioesterase 3 (Fads1, Fads2, and Acot3), whichwere activated (1.5- to 2.0-fold) in HFD conditions (Table 2).Activation of 3-hydroxy-3-methylglutaryl-coenzyme A syn-thase 1 (Hmgcs1) in the liver (1.5-fold) is further evidence ofhepatic SFA breakdown for the synthesis of ketone bodies inHFD mice. The high proportion of MUFA and PUFA in theserum of HFD-fed mice suggests the transport to WAT fol-lowing conversion.
Consistent with the high availability of fatty acids andexcessive storage of fat, genes that encode enzymes for fattyacid biosynthesis (e.g., Aacs, Acaca, Acacb, Acly) and elon-gation of fatty acids (Elovl6) were strongly downregulatedacross tissues and among the top 10 most highly up-/down-regulated genes (Table 2). In WAT, while most metabolicpathways were repressed (Table 5), the facilitators of beta-oxidation (Acadm, Acadl, Acsl1) were activated in mostWATs in HFD conditions (Table 2). Thus the relative reduc-
Fig. 1. Oil Red O staining showing steatosis in mice on a high-fat diet (HFD). A: fat deposition in liver tissue of mice on a standard breeding diet (SBD).B: high fat deposition in mice on HFD. C: triglyceride (TG) content in liver of SBD- and HFD-fed mice. **P � 0.01.
58 TISSUE RESPONSES OF DBA/2J MICE TO HIGH-FAT DIET
Physiol Genomics • VOL 42 • www.physiolgenomics.org
on July 2, 2010 physiolgenom
ics.physiology.orgD
ownloaded from

Table 2. Fold changes of selected genes influenced by diet
Symbol BAT GonF GlutF MesF RetF SubF Liver Muscle
Highly upregulated genes
Ccdc3 1.5 1.7 1.6 1.7 1.5 1.4 �1.0 1.0Col6a1 1.6 2.0 1.4 1.5 1.9 1.8 �1.0 �1.1Degs1 1.6 1.4 1.5 1.3 1.7 1.7 �1.0 �1.0Ear2 3.7 2.3 2.1 1.6 3.9 2.6 1.0 1.4Fgf13 1.9 2.9 2.2 2.2 1.8 3.0 1.1 1.1Hp 1.4 1.7 1.3 2.0 2.4 1.7 1.2 1.5Lbp 2.4 1.8 1.4 2.3 1.8 2.1 �1.3 1.2Lrg1 1.5 1.4 1.0 2.0 1.9 1.3 1.1 1.3Mest 3.9 2.0 2.3 3.4 1.7 4.2 �1.0 1.4Mrc2 1.6 3.8 1.5 2.0 2.5 3.0 �1.1 1.1Saa3 2.4 3.3 4.8 2.0 2.3 5.1 �1.2 1.3Slc5a7 1.2 3.0 2.7 1.4 2.1 2.9 �1.0 1.0Tnfrsf12a 2.4 1.8 2.8 1.7 1.7 2.2 �1.0 �1.3Tph2 4.6 20.7 13.6 5.2 24.7 16.2 �1.1 1.3Trem2 2.3 2.5 2.8 1.8 7.1 2.7 1.0 1.1Ubd 4.6 9.4 7.7 1.8 9.6 4.0 1.2 1.6
Highly downregulated genes
Aacs �1.7 �1.7 �1.5 �1.7 �1.9 �1.7 1.5 �1.4Acaca �1.2 �2.2 �1.6 �2.7 �3.0 �2.5 1.1 �1.8Acacb �1.5 �2.2 �1.8 �2.4 �3.1 �3.9 1.7 1.1Acly �1.1 �2.1 �1.5 �2.5 �2.5 �2.9 1.3 �1.7Acsm5 �1.2 �2.4 �2.3 �1.4 �2.0 �1.6 �1.1 �1.1AU018778 �1.7 �2.6 �1.6 �1.7 �2.9 �1.6 �1.2 1.0Cldn22 �1.6 �2.6 �1.7 �1.5 �2.5 �1.9 �1.0 1.0Cyp2e1 �7.0 �11.4 �5.4 �6.2 �8.2 �7.6 1.1 �3.3Dlc1 �1.5 �1.4 �1.6 �1.2 �1.6 �1.2 �1.0 �1.1Elovl6 �1.5 �2.7 �1.9 �4.4 �5.1 �6.4 1.2 �1.8Gcat �1.5 �1.5 �1.3 1.2 �1.6 �1.6 �1.3 1.0Gchfr �1.5 �2.7 �1.4 �1.6 �2.2 �2.8 1.1 �1.0Gpr81 �2.2 �1.6 �1.4 �1.8 �2.1 �2.0 1.0 �1.1Gstp1 �1.3 �1.6 �1.5 �1.3 �1.5 �1.4 �1.3 1.1Hsd11b1 �1.5 �2.0 �1.9 �1.9 �2.3 �2.5 �1.0 �1.3Immp2l �1.4 �2.0 �1.3 �1.2 �1.9 �2.0 1.2 �1.0Irs1 �1.7 �2.0 �2.4 �1.5 �2.6 �1.9 �1.3 �1.3Lman2l �1.4 �1.4 �1.4 �1.3 �1.6 �1.7 �1.2 �1.1Ndufa12 �1.3 �1.7 �1.4 �1.3 �1.7 �1.5 �1.1 �1.0Prkrir �1.3 �1.4 �1.5 �1.3 �1.7 �1.3 �1.1 1.1Pth1r �2.5 �1.7 �1.8 �1.7 �2.0 �2.5 �1.0 �1.0Rorc �1.5 �1.9 �2.3 �1.7 �3.1 �3.5 1.2 �1.1Slc1a3 �1.6 �2.1 �2.2 �1.6 �2.0 �2.0 �1.0 �1.3Tmem79 �1.4 �2.1 �1.4 �2.0 �3.5 �2.9 �1.0 �1.1
Signature genes associated with obesity
Acadl 1.2 1.2 1.7 1.1 1.1 1.1 1.1 1.3Acadm 1.3 1.2 1.7 1.5 1.3 1.4 1.0 1.3Acot3 �1.1 1.1 1.1 1.1 1.0 �1.1 2.0 1.1Acsl1 1.4 1.7 2.3 1.5 1.4 1.5 �1.1 1.1Fabp3 1.2 1.0 4.3 2.8 �1.1 1.3 �1.1 1.2Fabp5 1.1 1.7 2.3 1.1 1.5 1.4 �1.2 �1.1Fads1 �1.2 �1.2 �1.5 �1.1 1.0 �1.3 1.5 �1.3Fads2 �1.1 �1.2 �1.1 �1.0 �1.2 �1.1 2.0 �1.1Hmgcs1 1.5 1.1 1.1 1.2 1.1 1.3 1.5 1.0Lep 3.7 1.4 1.0 2.8 1.4 1.9 �1.1 3.5Retn �1.1 �2.1 �1.1 �1.2 �1.5 1.0 �1.0 1.0Slc2a3 1.0 �1.9 �1.6 �1.0 �1.5 �1.4 1.0 �1.1Sqle �1.8 �1.1 1.2 �1.0 �1.1 �1.3 1.4 �1.2Ucp1 1.3 4.8 4.6 4.1 2.2 1.1 �1.1 1.2Ucp2 �1.1 1.6 1.8 1.1 1.9 1.5 1.3 1.2
Genes associated with extracellular matrix
Col1a1 1.3 2.1 �1.1 1.2 2.0 1.3 �1.1 �1.2Col3a1 1.8 1.6 1.5 1.3 1.9 1.5 �1.0 �1.2Col4a1 1.5 1.4 1.0 1.3 1.2 1.6 �1.3 �1.2Col4a6 �1.0 �1.5 �1.6 �1.4 �1.6 �1.2 1.0 �1.1Col5a1 1.4 1.4 �1.1 1.2 1.4 1.3 �1.0 �1.2Col5a2 1.3 1.8 1.1 1.2 1.7 1.5 �1.1 �1.2Col6a1 1.6 2.0 1.4 1.5 1.9 1.8 �1.0 �1.1Col6a2 1.4 1.9 1.5 1.4 1.9 1.7 1.0 �1.0
Continued
59TISSUE RESPONSES OF DBA/2J MICE TO HIGH-FAT DIET
Physiol Genomics • VOL 42 • www.physiolgenomics.org
on July 2, 2010 physiolgenom
ics.physiology.orgD
ownloaded from

tion of SFA compared with MUFA may also be due topreferred oxidation of SFA in HFD-fed mice.
Fatty acid profiles associate with transcriptional changes.Eight hundred sixty genes were significantly correlated (Pvalue � 0.01) to at least one of the fatty acid components(Supplemental Table S2). Saturated fatty acids C16:0 andC18:0 were correlated with a large number of transcripts thatshowed tissue-specific responses to diet, and there was aconsiderable overlap of genes correlated to both (SupplementalTable S2, Supplemental Fig. S2). These genes are enriched forregulation of cellular growth, cell adhesion, anatomic andextracellular structure development and organization, as wellas transport of phosphate, inorganic ions, and electrons (Pvalue � 0.01). C18:0 is positively correlated with the activa-tion of NF-�B-induced signaling, while C16:0 is associatedwith Ras and Rho protein signal transduction. The strongestnegative correlations were observed between C16:0 and C18:0and genes in the collagen family (Col16a1, Col1a1, Col4a1,Col4a2, Col4a6, Col5a1, Col5a2, Col16a1, Col16a2, Col16a2,Col16a3, Col18a1) and genes related to collagen binding andprocessing (Mrc2, Mmp12). Many of these genes, along withothers critical for regulation of extracellular matrix (ECM),were activated by HFD in adipose tissues but not in liver andmuscle (Table 2, Supplemental Fig. S3). Leptin (Lep) andresistin (Retn) transcript amounts were negatively correlatedwith C18:0 (r � �0.70 and r � �0.71, respectively).
The MUFA C16:1 also showed strong correlation withtranscripts. In contrast with the SFA, it is negatively correlatedto transcripts that are enriched for metabolic processes, includ-ing biosynthesis of steroids, nutrient turnover, and energy
partitioning. Despite an abundance of C18:1 in tissues ofHFD-fed mice, there was only a weak association with tran-scripts.
PCA analysis was performed over fatty acid compositiondata together with variance components from the ANOVAtissue-by-diet interaction model. The first four principal com-ponents explained 90% of the variation and revealed genes thatare significantly affected by the interaction of tissue and diet.These genes are highly enriched (P value � 0.001) for pro-cesses that utilize fat, including Ppar signaling pathways, fattyacid metabolism, arachidonic acid metabolism, and biosynthe-sis of steroids. The first two components (41% and 30% of thevariation, respectively) separate the tissue groups, liver, mus-cle, WAT, and BAT (Fig. 4). The major signature of thetranscripts highlights differences in gene expression changesbetween liver and WAT, particularly differences in the meta-bolic roles of liver and fat. The collagen genes and processesinvolved in the ECM were also overrepresented and positivelycorrelated with loadings for WAT and negatively correlatedwith SFA components C16:0 and C18:0.
Effects of HFD on genes and pathways are tissue specific.ANOVA models were used to determine differences due toHFD within each tissue. Differential expression was deter-mined at the threshold level P value �0.001, which yielded anestimated FDR �0.15 for each test (Supplemental Table S3).Among the adipose tissues, retroperitoneal adipose tissue hadthe largest number of significant changes (1,790 genes) andmesenteric adipose tissue had the smallest number of signifi-cant changes (245 genes). Mesenteric adipose tissue sampleswere highly variable across individuals and most different from
Table 2.—Continued
Symbol BAT GonF GlutF MesF RetF SubF Liver Muscle
Col8a1 1.5 1.6 1.3 1.4 1.4 1.6 �1.1 1.1Col15a1 1.5 1.2 1.2 1.5 1.1 1.8 1.1 �1.0Col16a1 1.5 2.0 1.7 1.4 2.3 2.1 �1.0 �1.1Col17a1 1.1 �1.2 �1.2 �1.1 �1.2 1.2 �1.0 �1.0Col18a1 1.7 1.3 1.1 1.4 1.5 1.8 �1.0 �1.1Col20a1 �1.6 �1.1 �1.3 �1.2 �1.3 �1.4 �1.1 1.0Mmp12 3.2 3.3 3.5 2.1 7.5 4.4 �1.0 1.1Mmp9 �1.3 �1.4 �1.9 �1.1 �1.4 �1.8 �1.0 �1.1Mrc2 1.6 3.8 1.5 2.0 2.5 3.0 �1.1 1.1Pcolce2 1.7 1.7 1.7 1.6 1.6 1.8 �1.2 1.2
Values are fold change (HFD vs. SBD). In cases where �1 transcript represents a gene, the fold change corresponding to the most significant transcript(smallest P value) is represented. A full list of absolute normalized expression values of the transcripts of all genes differentially expressed in at least 1 tissuein response to diet is given in Supplemental Table S5. Normalized expression data are also available through the Gene Expression Omnibus (GEO) database(accession no. 15822). Boldface, significantly upregulated; italics, significantly downregulated.
Table 3. Serum measurements
HFD (n � 10) SBD (n � 11) HFD/SBD P Value
Leptin, ng/ml 17.03 � 5.70 2.37 � 0.87 7.18 �0.001Insulin, ng/ml 8.57 � 5.16 1.73 � 0.76 4.95 �0.001Glucose, mg/dl 160.9 � 16.29 118.9 � 8.84 1.35 �0.001Triglycerides, mg/dl 112.9 � 27.05 139.6 � 13.72 0.81 0.009NEFA, meq/l 1.82 � 0.25 2.03 � 0.19 0.90 0.044Total cholesterol, mg/dl 120.8 � 9.29 73.45 � 5.85 1.65 �0.001HDL cholesterol, mg/dl 116.5 � 10.95 52.48 � 4.90 2.22 �0.001non-HDL cholesterol, mg/dl 3.59 � 4.78 19.23 � 6.74 0.19 �0.001T4 thyroid hormone, �g/dl 4.95 � 0.68 7.23 � 1.19 0.69 �0.001
Serum values are means � SD for n mice. Measurements were done on 12-wk-old males after feeding of either HFD or SBD between 6 and 12 wk of age.Serum was collected 2 h after fasting at 1:00 PM. NEFA, nonesterified fatty acids; HDL, high-density lipoprotein.
60 TISSUE RESPONSES OF DBA/2J MICE TO HIGH-FAT DIET
Physiol Genomics • VOL 42 • www.physiolgenomics.org
on July 2, 2010 physiolgenom
ics.physiology.orgD
ownloaded from

other WAT (Supplemental Table S4, Fig. 4). This reduces ourability to detect statistically significant differences betweendiet groups in the mesenteric adipose tissue. Aside from themesenteric tissue, there was a high concordance in the differ-entially expressed genes across WAT, ranging from 31% to71% pairwise overlap (Supplemental Table S4). Among thegenes that were differentially expressed in BAT, 68% werealso differentially expressed in at least one WAT. Liver andmuscle had limited transcriptional responses to HFD andonly a small overlap with other tissue types (SupplementalFig. S4).
Additionally, we identified differentially expressed genesthat were consistently up- or downregulated (Table 2). Tryp-tophan hydroxylase 2 (Tph2), ubiquitin D (Ubd), and serumamyloid A3 (Saa3) were strongly activated across all adiposetissues and muscle. Mesoderm-specific transcript (Mest), fibro-blast growth factor 13 (Fgf13), and collagen type VI �1(Col6a1) were highly activated across adipose tissues. Inter-estingly, many of the upregulated genes play a role in cellcommunication as they encode transmembrane proteins (Tph2,Degs1, Mrc2, Slc5a7) or are secreted into the extracellularspace (Col6a1, Saa3, Trem2). The corresponding pathway forenvironmental information processing (including the ECM-
receptor interaction pathway) is also upregulated in most adi-pose tissues (Table 5).
Genes of the regenerating islet family (Reg2, Reg3a, Reg3b,Reg3g) had the largest transcriptional responses to diet inmesenteric tissue (Supplemental Fig. S5). However, we cannotcompletely rule out the possibility of contamination of mesen-teric fat with nearby pancreatic tissue, despite careful andcomplete separation of the pancreas before mesenteric adiposetissue was collected.
Pathway analysis distinguished diet-induced responses inKEGG pathways (Table 5). Pathways contributing to the pro-cessing of environmental information, including ECM-receptorinteraction, cell adhesion, and cytokine-cytokine interaction,were significantly activated across most adipose tissues. Cel-lular processes that drive cell motility by regulation of the actincytoskeleton and cell growth and death and that contribute tothe communication between cells via focal adhesion are up-regulated across most adipose tissues. Pathways related toimmune response and diseases, including cancers and type 1diabetes mellitus, are significantly upregulated in gonadal andretroperitoneal adipose tissues and BAT. Consistent with itsreputation as the “good” adipose tissue, the subcutaneous depotwas not significantly activated for immune response.
Pathways in the liver were often regulated in the oppositedirection from adipose tissues, reflecting the overall flow ofenergy in HFD conditions. Generally, KEGG pathways con-tributing to the accumulation of lipids (fatty acid biosynthesis,arachidonic acid and linoleic acid metabolisms), carbohydrates(glycolysis/gluconeogenesis), and amino acids (alanine aspar-tate metabolism) were significantly downregulated in all adi-pose tissues on HFD and activated in liver. Gluteal and mes-enteric metabolic pathways often show changes in the samedirection as other adipose tissues, but they are not significant.This suggests that these two tissues retain their metabolicactivity under diet-induced obesity. However, for mesentericadipose tissue, this conclusion must be drawn with care, as thenumber of genes contributing to pathway analysis is muchsmaller than in gluteal adipose tissue (245 vs. 1,973). Muscleshowed few significant pathway changes that were often in thesame direction as adipose tissues.
Fig. 2. A: glucose clearance in mice on SBD or HFD after intraperitonealglucose injection after 9-h fasting. B: area under the curve (AUC). *P � 0.05.
Fig. 3. Percentage of saturated fatty acid(SFA), polyunsaturated fat (PUFA), andmonounsaturated fat (MUFA) in the diet,serum, and tissues of mice fed SBD (A) andHFD (B). BAT, brown adipose tissue; Glut,Gon, Mes, Ret, Sub, gonadal, gluteal, mes-enteric, retroperitoneal, and subcutaneouswhite adipose tissues.
61TISSUE RESPONSES OF DBA/2J MICE TO HIGH-FAT DIET
Physiol Genomics • VOL 42 • www.physiolgenomics.org
on July 2, 2010 physiolgenom
ics.physiology.orgD
ownloaded from

DISCUSSION
DBA/2J mice responded to HFD with increased adiposityand typical features of metabolic syndrome. After 6 wk onHFD, DBA/2J mice have elevated glucose levels and reducedinsulin sensitivity, despite carbohydrate reduction in HFD.Mice show ectopic fat deposition in liver and muscle. Devel-oping liver steatosis and high hepatic and serum TG andcholesterol levels indicate impaired fatty acid utilization. Fur-thermore, low thyroid hormone T4 serum levels mirror loweredmetabolic rate. High leptin levels correspond with the highadipose tissue mass. Both changes in leptin and thyroid hor-mone levels hint at imbalances of energy uptake and partition-ing. The observed physiological changes are likely the result ofhigh dietary SFA and subsequent high oleic acid (C18:1) andreduced PUFA content in tissues. The typical features of themetabolic syndrome in DBA/2J mice were also observed witha HFD rich in cholesterol in a recent comparison among 10inbred mouse strains (43). However, the cholesterol prescrip-tion led to the inactivation of cholesterol synthesis and manydifferently regulated pathways in the liver compared with ourstudy.
Patterns of pathway regulation in liver suggest the increasedproduction and accumulation of pyruvate from glucose, ala-nine, and fatty acid precursors in HFD-fed mice. The accruedpyruvate was likely converted to acetyl-coenzyme A for thesynthesis of fats and ketone bodies, processes that repressoxidative phosphorylation. Together with mass gain, thesefactors suggest the development of fatty liver in the HFDfeeding group. Ketone bodies could be a necessary energyprovision because of the reduction of dietary carbohydrates butalso for the synthesis of cholesterol, resulting in the high totalcholesterol serum level in HFD-fed mice. However, an over-production of ketone bodies followed by hyperketonemia isseen in diabetes mellitus as glucose is not sufficiently taken upby the cells. Elevated glucose levels accompanied by reducedinsulin sensitivity despite reduced carbohydrates in HFD mightbe explained by reduced content of PUFA, which are able tosuppress liver lipogenesis and enhance glucose transport andfatty acid oxidation in muscle (1, 9). In addition, the loweredC16:1 synthesis in the tissues together with the high cellular
content of C18:1 in HFD-fed DBA/2J mice may contribute toreduced transcripts of Irs1 in adipose tissues and impairedglucose uptake in muscle, which in turn leads to impairedinsulin sensitivity (16). For circulating C16:1, stimulation ofmuscle insulin action and suppression of hepatosteatosis couldbe shown (9).
Fatty acid profiles and transcriptional responses in liver,where most fat is metabolized, indicated that HFD-fed miceexhibited an overall increase in the conversion of SFA toMUFA and PUFA before being taken up by target tissues. Thehigh degree of the monounsaturated oleic acid (C18:1) inadipose tissues and muscle suggests it as the preferred fattyacid for storage, but the proportions of SFA to MUFA couldalso be explained by preferred oxidation of SFA. The transportof MUFA seems to play a secondary role, as the level ofMUFA in serum is lower than in the tissues.
Fatty acid composition and gene transcription profiles in fiveWATs, BAT, liver, and muscle suggest that dietary fatty acidsexert direct actions on gene transcription. However, the dietaryfatty acids are further metabolized and converted, and theadipocyte itself actively contributes to these processes. Boththe intracellular ratio of fatty acids and the amount of intracel-lular fat seem to influence the tissue-specific transcriptionalregulation of genes. As a result, several proteins are producedand partially secreted to the ECM, which may change theflexibility of the cell and support the invasion of macrophagesleading to enhanced immune response. Furthermore, the intra-cellular ratio of fatty acids and the amount of fat influence thecomposition of the lipid bilayer in cell membranes. This mayaffect not only the elasticity of the cell but also the activationof intra- and transmembrane proteins including receptors,transporters, proteinases, and peptidases.
In WAT of HFD-fed mice, SFA content was decreased andcollagen gene expression was increased. A significant negativecorrelation between C16:0 and C18:0 with collagen geneexpression and related processes involving the ECM wasdetected. Elevated levels of collagen genes in HFD conditionsare in agreement with findings in ob/ob versus db/db and db/dbversus wild-type mice (32). Among these collagen genes,recently Col6a1 has been identified as a factor that controls
Table 4. Fatty acid composition in diets, serum, adipose tissues, liver, and muscle
Diet Fatty Acid Diet Serum
Tissues
BAT GonF GluF MesF RetF SubF Liver Muscle
Mean SD Mean SD Mean SD Mean SD Mean SD Mean SD Mean SD Mean SD
HFD C16:0 25.4 21.7 19.6 0.9 20.4 0.4 18.7 0.3 20.8 0.2 19.5 0.2 18.9 0.1 27.7 1.1 22.0 0.4C16:1 1.7 1.9 4.3 0.3 6.2 0.2 5.9 0.2 5.7 0.1 6.3 0.2 6.6 0.3 2.4 0.8 7.9 0.5C18:0 16.0 9.5 6.2 1.1 2.7 0.1 2.7 0.0 3.1 0.0 2.9 0.6 3.1 0.4 5.3 0.5 4.0 1.3C18:1 33.9 19.7 45.0 2.0 43.9 0.5 45.5 0.7 46.4 0.5 45.6 0.7 45.6 1.7 30.0 1.2 41.2 2.4C18:2n-6 15.5 32.9 20.7 0.7 24.0 0.4 24.3 0.3 21.2 0.4 23.0 0.5 22.3 0.2 23.7 2.6 20.3 1.1
SBD C16:0 17.3 43.3 24.5 1.7 22.7 2.0 20.8 1.4 24.6 0.7 22.7 0.9 21.2 0.5 29.4 2.7 24.0 0.6C16:1 1.7 1.4 5.1 1.7 7.9 0.5 7.6 0.8 7.1 0.2 8.0 0.5 7.3 0.5 4.2 1.1 10.6 1.4C18:0 3.8 14.4 5.9 0.7 2.1 0.2 2.4 0.6 3.4 0.6 2.6 0.7 3.0 0.2 6.3 1.8 4.2 1.3C18:1 21.8 8.5 37.3 1.4 28.1 0.2 28.4 0.6 33.4 0.4 29.7 0.5 34.4 0.5 21.1 4.0 35.6 0.6C18:2n-6 43.4 14.6 22.7 2.1 34.0 0.3 34.7 2.4 26.8 0.9 31.7 2.3 29.7 0.6 26.9 4.6 20.2 2.7C18:3n-3 4.2 1.05 0.9 0.1 2.1 0.1 2.2 0.2 1.4 0.1 1.7 0.2 1.4 0.1 1.5 0.2 1.1 0.2
Serum measurements were derived from pooled serum from 6 animals. Fatty acid compositions in tissues are based on 3 separate measurements from 3individual animals. Values are expressed as gram of specific fatty acid per 100 g of total fatty acids. Diet had effect on the proportion of all fatty acids, exceptfor stearic acid (C18:0). A tissue effect was evident for all fatty acids. C16:0, palmitic acid; C16:1, palmitoleic acid; C18:1, oleic acid; C18:2 n–6, linoleic acid;C18:3 n–3, �-linolenic acid; SFA, saturated fatty acids; MUFA, monounsaturated fatty acids; PUFA, polyunsaturated fatty acids.
62 TISSUE RESPONSES OF DBA/2J MICE TO HIGH-FAT DIET
Physiol Genomics • VOL 42 • www.physiolgenomics.org
on July 2, 2010 physiolgenom
ics.physiology.orgD
ownloaded from

adipocyte size by forming a fibrinogenic net around the cellsurface and suppresses cell expansion (25). Lack of Col6a1 inknockout mice resulted in reduction of lipid accumulation andthus improved carbohydrate and lipid metabolism (32). Col6a1
transcription in our experiment correlates with expression of othergenes of the collagen family across tissue and diet conditions.Because adipose tissues respond differently in the activation orinactivation of genes encoding collagens and collagen processing
Table 5. Enrichment scores for KEGG pathways associated with high-fat diet
Major category Subcategory KEGG Pathway BAT GonF GlutF MesF RetF SubF Liver Muscle
Pathways downregulated in most adipose tissues
Metabolism Carbohydrate metabolism Glycolysis/gluconeogenesis �2.76 �1.79 0.78 �2.42 �2.37 �3.19 1.84 2.06Propanoate metabolism �2.77 �3.76 �1.70 �2.65 �3.16 �4.08 2.97 2.94Butanoate metabolism �2.96 �3.06 �0.73 �2.10 �2.43 �2.97 3.25 0.36Pyruvate metabolism �4.12 �4.06 �0.21 �4.36 �5.54 �5.81 3.98 1.63
Lipid metabolism Fatty acid biosynthesis �2.80 �2.81 �2.23 �4.87 �3.03 �3.99 1.87 �1.13Arachidonic acid metabolism �0.96 �3.68 �1.32 �1.26 �2.34 �2.30 0.83 �1.51Linoleic acid metabolism �1.76 �2.40 0.82 �1.19 �1.76 �0.89 �1.86 �2.63
Amino acid metabolism Alanine and aspartatemetabolism
�2.90 �4.29 �0.37 �2.95 �4.78 �3.94 2.31 �0.22
Lysine degradation �2.75 �2.18 �0.71 �1.78 �1.45 �1.63 0.95 0.01Oxidative phosphorylation Oxidative phosphorylation �2.57 �6.59 1.96 �1.21 �5.62 �4.83 �2.01 1.73Xenobiotics biodegradation
and metabolismBenzoate degradation via
CoA ligation�2.37 �2.33 �0.57 �1.08 �2.23 �1.63 4.02 0.60
Glutathione metabolism �2.38 �4.73 �6.21 �1.28 �3.97 �3.44 �6.67 �0.59Metabolism of xenobiotics by
cytochrome P-450�2.71 �6.26 �5.01 �1.45 �5.22 �3.17 �6.39 �1.86
Tetrachloroethene degradation �1.96 �2.02 0.15 �2.30 �1.16 �2.57 1.13 0.00Glucan biosynthesis and
metabolismKeratan sulfate biosynthesis �0.98 �2.46 �2.48 �2.31 �2.49 �1.76 �0.50 1.06
Environmental inform.processing
Signal transduction Hedgehog signaling pathway �1.19 �1.55 �2.99 �1.04 �2.65 �0.85 0.58 1.40
Cellular processes Endocrine system Insulin signaling pathway �3.25 �2.41 �1.51 �1.29 �2.99 �2.55 0.83 �0.56Adipocytokine signaling
pathway�2.17 �0.30 �1.14 �1.35 �1.89 �2.22 0.00 1.85
Pathways upregulated in most adipose tissues
Environment inform.processing
Signaling molecules andinteraction
ECM-receptor interaction 0.55 2.04 �3.36 �0.48 0.16 2.15 �0.87 �1.24
Cell adhesion molecules(CAMs)
3.30 3.47 �1.23 �1.59 1.76 �1.15 �0.64 1.23
Cytokine-cytokine receptorinteraction
4.86 2.89 �0.48 1.13 3.33 �0.77 0.46 3.08
Genetic inform.processing
Translation Ribosome 2.84 �0.52 �0.15 2.94 6.50 �0.89 �8.39 �4.80
Cellular processes Development Dorso-ventral axis formation 1.74 1.70 0.14 2.33 0.75 3.22 �2.34 �2.25Cell motility Regulation of actin
cytoskeleton2.71 3.01 1.82 �0.08 3.46 2.87 �1.20 �2.45
Cell growth and death Cell cycle 3.70 2.81 3.15 3.32 3.84 4.30 �0.27 �0.69Cell communication Focal adhesion 2.05 3.02 �1.55 1.24 0.96 3.63 �1.13 �1.63Immune system Complement and coagulation
cascades3.84 2.00 0.57 2.21 1.38 3.56 �2.69 �3.21
Antigen processing andpresentation
2.74 4.97 2.16 0.01 4.55 �0.54 0.65 2.50
Toll-like receptor signalingpathway
2.80 3.33 3.08 1.92 4.06 1.77 �0.21 �0.10
Hematopoietic cell lineage 3.06 2.95 0.25 0.56 3.98 �1.03 0.10 0.67Natural killer cell-mediated
cytotoxicity3.22 4.34 2.71 0.99 5.00 0.13 �0.36 0.45
T-cell receptor signalingpathway
2.61 3.89 1.84 �0.27 4.60 �1.96 0.17 �0.40
B-cell receptor signalingpathway
3.18 4.73 2.36 0.60 6.08 �0.05 �0.13 �0.31
FcεRI signaling pathway 2.52 4.09 2.90 0.89 3.90 1.22 �0.39 �0.48Leukocyte transendothelial
migration3.97 2.92 �0.84 0.33 2.16 1.36 �1.36 �0.71
Human diseases Metabolic disorder Type 1 diabetes mellitus 2.84 3.41 1.75 0.41 3.72 �0.52 1.22 1.92Cancers Colorectal cancer 3.10 2.32 1.51 1.56 2.42 3.20 �0.18 0.23
Pancreatic cancer 2.98 2.23 1.07 1.23 2.48 2.43 0.21 �1.27Glioma 2.49 3.10 3.20 1.92 2.99 2.80 0.08 �0.84Chronic myeloid leukemia 2.08 1.91 1.78 1.93 2.32 2.04 �0.46 �1.75Melanoma 2.20 1.06 3.12 0.70 1.94 3.09 �0.25 �1.09
Thresholds of 2 and �2 were used to determine significant up- and downregulation in a Kyoto Encyclopedia of Genes and Genomes (KEGG) pathway,respectively. The t statistic was used as gene-level evidence for the calculations. Boldface, significantly upregulated; italics, significantly downregulated.
63TISSUE RESPONSES OF DBA/2J MICE TO HIGH-FAT DIET
Physiol Genomics • VOL 42 • www.physiolgenomics.org
on July 2, 2010 physiolgenom
ics.physiology.orgD
ownloaded from

enzyme, their influence on the ECM and subsequently the infil-tration of macrophages into adipose tissues, for example, mightaffect distinct immune responses of adipose tissues.
Serum amyloid A3 (Saa3) is an inflammatory adipokineassociated with adipose tissue mass that was activated in WATof animals on HFD (57). Lipopolysaccharides and IL-1� werefound to stimulate expression of Saa3 in a dose-dependentmanner (45). Saa3 also has a role in reverse cholesteroltransport process as an HDL particle. Saa3 particles containapolipoproteins (38). The activation of Saa3 in tissues of micefed HFD is consistent with the observed increase in transcrip-tion of apolipoprotein C-IV (Apoc4). A feedback mechanisminvolving Saa3 was recently found to regulate lipid metabolismin pigs (12). We suggest that Saa3 supports the fatty acidtransport in serum and thus communication between tissues.
Tryptophan hydroxylase (Tph2) and ubiquitin D (Ubd) wereamong the most highly activated genes on HFD. Tph2 is a keyenzyme in the synthesis of serotonin (39) and is expected tomodify the mitochondrial transmembrane potential (4). Tph2 isa primary regulator of serotonin in the gastrointestinal tract,where it stimulates formation of precursors in development ofgut microvilli (33, 40). Mice lacking Tph2 had growth retar-dation, altered body temperature control, and decreased bloodpressure (2). These data suggest a novel role of Tph2 inautonomic pathways linking obesity with health risk factors. Acausal link between perinatal �-3 fatty acid deficiency andreduced central serotonin synthesis via reduced Tph2 transcriptamounts has been shown in rat (37). Therefore, we believe thatthe high Tph2 transcript levels in adipose tissues in our modelresult from direct interaction with tissue-specific fatty acidcomposition.
Ubd catalyzes the ubiquitination of proteins as a key step fortheir proteasomal degradation. Ubiquitination also controls thestability, function, and intracellular localization of a widevariety of proteins. The high transcript levels of a variety ofgenes, including Saa3 and Tph2, and their translation intoproteins likely require increased control of translated proteinquality and levels. This cleaning routine itself requires theprovision of energy and likely contributes to cellular stress,which in turn could lead to the activation of the immuneresponse.
Given the less pronounced downregulation in metabolicpathways, it is likely that mesenteric adipose tissue is the mostmetabolically active adipose tissue leading to low mass gain.The strong activation of genes regenerating islets (Reg genefamily) suggests their role in intestinal inflammation. Themesenteric adipose tissue-specific diet-response genes showedno significant contribution to KEGG pathways correspondingto human diseases.
Gluteal adipose tissue exhibited the highest mass gain com-pared with SBD and showed only a slight response in meta-
Fig. 4. Principal component analysis (PCA) biplots for the first 4 principalcomponents (PCs) (PC1 vs. PC2, A; PC1 vs. PC3, B; PC1 vs. PC4, C), whichaccount for 90% of the variability in the PCA analysis of fatty acid composi-tion data and variance components from the ANOVA interaction model Yi �� Diet Tissue Diet:Tissue εi. Points represent the scores for theprobes (blue) and for the fatty acid components (red) PCA loadings are shownas black lines. A list of genes that correlate with adipose tissue contents ofpalmitic (C16:0), stearic (C18:0), palmitoleic (C16:1), and oleic (C18:1) acidsis given in Supplemental Table S6.
64 TISSUE RESPONSES OF DBA/2J MICE TO HIGH-FAT DIET
Physiol Genomics • VOL 42 • www.physiolgenomics.org
on July 2, 2010 physiolgenom
ics.physiology.orgD
ownloaded from

bolic pathways. This is consistent with evidence that glutealadipose tissue is more sluggish in its metabolism (22) andcontributes less to cardiovascular disease risk (50). In somesheep breeds, gluteal adipose tissue is well known to be amajor fat storage depot for the delivery of energy duringseasonally restricted feed supply (3, 31).
Traditionally, BAT has been known for its role in thermo-genesis. Clearly, the role of BAT in obesity has changed tomirror WAT as a major storage depot of excess energy. Notonly did the majority of differentially expressed genes in BAToverlap with WAT, but there was a high correspondence inpathway regulation, particularly with gonadal and retroperito-neal adipose tissues. On the other hand, Ucp1 and Ucp2activation together with an enhanced fatty acid oxidation inWAT suggests a role of thermogenic activity in response tosustained high-fat feeding and insulin resistance. The role ofWAT in thermogenesis has been suggested in the literature, butnot specific to the depot location (24). High levels of Ucp1 andUcp2 transcripts in BAT did not change with diet. We conclude thatin HFD conditions BAT maintains its function in thermogenesis andtakes on additional roles in fat storage, signaling, and mobilizationthat are typical to WAT. The conversion of BAT to WAT and viceversa could be a strategy for the control of fat mass (52).
Muscle was the weakest responder to HFD, although it isplausible that a longer HFD feeding period may be required tosee changes. Fatty acids present in muscle are mostly liberatedfrom adipose tissues and from the breakdown of TG in pools ofliver-derived LDL. Despite the mixed origin of deposited fatwe found a striking similarity in fatty acid composition ofmuscle and adipose tissues, implicating adipose tissues as thedominant source. It is tempting to speculate that at a later timepoint muscle would begin to play a physiological role thatparallels adipose tissue responses to HFD. Muscle tissue hasbeen shown previously to play a role in the development ofobesity (11, 42). In correspondence with physiological find-ings, genetic studies provided evidence that genetic factorscontributing to obesity and body weight can act through mech-anisms affecting muscle weight and fat weight (7).
In summary, HFD in DBA/2 mice led to weight gain,metabolic dysregulation, and insulin sensitivity. Effects ontranscriptional regulation were largely a function of the tissue-specific proportions of different fatty acids. Novel associationswere found between SFA C16:0 and C18:0, which negativelycorrelated with genes in the collagen family and processesinvolving the ECM. SFA was converted in the liver to MUFAand PUFA, and oleic acid (C18:1) was the preferred MUFA forstorage of excess energy in all tissues of HFD-fed mice. A roleof Tph2 in adipose tissues in diet-induced obesity has beenproposed. We have identified tissue-specific responses to HFD.Liver steatosis was evident, and pathways in liver and adiposetissues were often regulated in opposite directions. Gonadal,retroperitoneal, and subcutaneous adipose tissues and BATexhibited severe inflammatory and immune responses and hadactivated disease pathways associated with cancers and type 1diabetes. Mesenteric adipose tissue was the most metabolicallyactive adipose tissue, and the least affected by the dietarycondition. Gluteal adipose tissue had the highest relative massgain but was sluggish in its metabolism. In HFD conditions,BAT functioned largely like WAT in its role as a depot forexcess energy, whereas WAT played a role in thermogenesis.
Our findings support the importance of multidimensionalexaminations of the biology of complex systemic traits likeobesity (54). Assessments of response to diet of individualtissues as a function of mass, fat composition, and geneticfactors are critical steps in unraveling the pathologies ofmetabolic disorders and diseases. The effects found in ourstudy are largely caused by the high proportion of fatty acids inthe HFD. However, it is necessary to mention that someobserved effects could also result from the influence of otherfood components (e.g., phytoestrogens) that might differ be-tween the diets and that may exert independent effects onobesity or direct effects on increased expression of inflamma-tory genes, for example (43, 47).
ACKNOWLEDGMENTS
We thank Stephan Scherneck for determination of liver triglycerides.
GRANTS
This project was funded with grants from National Institute of GeneralMedical Sciences Centers of Excellence in Systems Biology Program GM-076468 (G. A. Churchill), the National Genome Research Network NGFNplus01GS0829, Germany (G. A. Brockmann, A. Wagener), National Heart, Lung,and Blood Institute NSRA Fellowship 1F32-HL-095240-01 (R. S. Hageman),and the Deutsche Forschungsgemeinschaft for the graduate college programGRK 1208 (C. Hantschel).
DISCLOSURES
No conflicts of interest, financial or otherwise, are declared by the author(s).
REFERENCES
1. Al-Hasani H, Joost HG. Nutrition-/diet-induced changes in gene expres-sion in white adipose tissue. Best Pract Res Clin Endocrinol Metab 19:589–603, 2005.
2. Alenina N, Kikic D, Todiras M, Mosienko V, Qadri F, Plehm R, BoyéP, Vilianovitch L, Sohr R, Tenner K, Hörtnagl H, Bader M. Growthretardation and altered autonomic control in mice lacking brain serotonin.Proc Natl Acad Sci USA 106: 10332–10337, 2009.
3. Attia N, Bocquierb F, Khaldic G. Performance of the fat-tailed Barbar-ine sheep in its environment: adaptive capacity to alternation of under-feeding and re-feeding periods. A review. Anim Res 53: 165–176, 2004.
4. Basu B, Desai R, Cherkady JBR, Sriram V, Maiti S, Panicker MM.Serotonin in pre-implantation mouse embryos is localized to the mito-chondria and can modulate mitochondrial potential. Reproduction 135:657–669, 2008.
5. Bergman RN, Basciano H, Adeli L. Lipid and lipoprotein dysregulationin insulin resistant states. Clin Chim Acta 368: 1–19, 2006.
6. Bolstad BM, Irizarry RA, Speed TP. A comparison of normalizationmethods for high density oligonucleotide array data based on variance andbias. Bioinformatics 19: 185–193, 2003.
7. Brockmann GA, Tsaih SW, Neuschl C, Churchill GA, Li R. Geneticfactors contributing to obesity and body weight can act through mecha-nisms affecting muscle weight, fat weight, or both. Physiol Genomics 36:114–126, 2009.
8. Buchmann J, Meyer C, Neschen S, Augustin R, Schmolz K, Kluge R,Al-Hasani H, Jürgens H, Eulenberg K, Wehr R, Dohrmann C, JoostHG, Schürmann A. Ablation of the cholesterol transporter ABCG1reduces adipose cell size and corrects diet induced insulin resistance.Endocrinology 148: 1561–1573, 2007.
9. Cao HG, Gerhold K, Mayers J, Wiest M, Watkins S, Hotamisligil G.Identification of a lipokine, a lipid hormone linking adipose tissue tosystemic metabolism. Cell 134: 933–944, 2008.
10. Carey VJ, Walters EE, Coldiz AG, Solomon GC, Willet CW, RosnerBA, Speizer FE, Manson JE. Body fat distribution and risk of insulin-dependent diabetes mellitus in women. Am J Epidemiol 145: 614–619,1997.
11. Chadt A, Leicht K, Deshmukh A, Jiang LQ, Scherneck S, BernhardtU, Dreja T, Vogel H, Schmolz K, Kluge R, Zierath JR, Hultschig C,Hoeben RC, Schürmann A, Joost HG, Al-Hasani H. Tbc1d1 mutation
65TISSUE RESPONSES OF DBA/2J MICE TO HIGH-FAT DIET
Physiol Genomics • VOL 42 • www.physiolgenomics.org
on July 2, 2010 physiolgenom
ics.physiology.orgD
ownloaded from

in lean mouse strain confers leanness and protects from diet-inducedobesity. Nat Genet 40: 1354–1359, 2008.
12. Chen CH, Wang PH, Bing H, Liu HH, Mersmann HJ, Ding ST. Serumamyloid A protein regulates the expression of porcine genes related tolipid metabolism. J Nutr 138: 674–679, 2008.
13. Cui X, Hwang JT, Qui J, Blades NJ, Churchill GA. Improved statisticaltests for differential gene expression by shrinking variance componentestimates. Biostatistics 6: 59–75, 2005.
14. Daniel H, Dieck TH. Nutrient-gene interactions: a single nutrient andhundreds of target genes. J Biol Chem 385: 571–583, 2004.
15. de Haan JR, Wehrens R, Bauerschmidt S, Piek E, van Schaik RC,Buydens LMC. Interpretation of ANOVA models for microarray datausing PCA. Bioinformatics 23: 184–190, 2007.
16. Denechaud PD, Dentin R, Girard F, Postic C. Role of ChREBP inhepatic steatosis and insulin resistance. FEBS Lett 582: 68–73, 2008.
17. Dunning MJ, Smith ML, Ritchie MF, Tavare S. R classes and methodsfor Illumina bead-based data. Bioinformatics 23: 2183–2184, 2007.
18. Einstein FH, Atzmon G, Yang XM, Ma XH, Rincon M, Rudin E,Muzumdar R, Barzilai N. Differential responses of visceral and subcu-taneous fat depots to nutrients. Diabetes 54: 672–678, 2005.
19. Falcon S, Gentleman R. Using GOstats to test gene lists for GO termassociation. Bioinformatics 23: 257–258, 2007.
20. Festa A, D’Agostino R Jr, Williams K, Karter A, Mayer-Davis E,Tracey R, Haffner W. The relation of body fat mass and distribution tomarkers of chronic inflammation. Int J Obes Relat Metab Disord 25:1407–1415, 2001.
21. Fettforschung DGF. DGF Einheitsmethoden. Stuttgart, Germany: Wis-senschaftliche Verlagsgesellschaft, 2009.
22. Frayn KN, Fielding BA, Karpe F. Adipose tissue fatty acid metabolismand cardiovascular disease. Curr Opin Lipidol 16: 409–415, 2005.
23. Ginsberg H, Zhang Y, Hernandez-Ono A. Metabolic syndrome: focuson dyslipidemia. Obesity (Silver Spring) 14: 41S–49S, 2006.
24. Grannerman JG, Burnazi M, Zhu Z, Schwamb LA. White adiposetissue contributes to UCP1-independent thermogenesis. Am J PhysiolEndocrinol Metab 285: E1230–E1236, 2003.
25. Halberg N, Wernstedt I, Scherer PE. The adipocyte as an endocrine cell.Endocrinol Metab Clin North Am 37: 753–768, 2008.
26. Gene Ontology Consortium. The Gene Ontology (GO) database andinformatics resource. Nucleic Acids Res 32: D258–D261, 2004.
27. Hotamisligil G. Inflammation and metabolic disorders. Nature 444: 860–867, 2006.
28. Kanehisa M, Goto S. KEGG: Kyoto Encyclopedia of Genes and Ge-nomes. Nucleic Acids Res 28: 27–30, 2000.
29. Katterle Y, Keipert S, Hof J, Klaus S. Dissociation of obesity andinsulin resistance in transgenic mice with skeletal muscle expression ofuncoupling protein 1. Physiol Genomics 32: 352–359, 2008.
30. Kerr MK, Martin M, Churchill GA. Analysis of variance for geneexpression microarray. J Comput Biol 7: 819–837, 2000.
31. Khachadurian AK, Adrouni B, Yacoubian H. Metabolism of adiposetissue in the fat tail of the sheep in vivo. J Lipid Res 7: 427–436, 1996.
32. Khan T, Muise ES, Iyengar P, Wang ZV, Chandalia M, Abate N,Zhang BB, Bonaldo P, Chua S, Schere PE. Metabolic dysregulation andadipose tissue fibrosis: role of collagen VI. Mol Cell Biol 29: 1575–1591,2009.
33. Liu Q, Yang Q, Sun W, Vogel P, Heydorn W, Yu XQ, Hu Z, Yu W,Jonas B, Pineda R, Claderon-Gay V, Germann M, O’Neill E, Brom-mage R, Cullinan E, Platt K, Powell D, Sands A, Zambrowicz B, ShiZC. Discovery and characterization of novel tryptophan hydroxylaseinhibitors that selectively inhibit serotonin synthesis in the gastrointestinaltract. Pharmacol Exp Ther 325: 47–55, 2008.
34. Matsuzaka T, Shimano H, Yahagi N, Kato T, Atsumi A, Yamamoto T,Inoue N, Ishikawa M, Okada S, Ishigaki N, Iwasaki H, Iwasaki Y,Karasawa T, Kumadaki S, Matsui T, Sekiya M, Ohashi K, Hasty AH,Nakagawa Y, Takahashi A, Suzuki H, Yatoh S, Sone H, ToyoshimaH, Osuga J, Yamada N. Crucial role of a long-chain fatty acid elongase,Elov16, in obesity-induced insulin resistance. Nat Med 13: 1193–1202,2007.
35. Matsuzawa Y. Therapy insight: adipocytokines in metabolic syndromeand related cardiovascular disease. Nat Clin Pract Cardiovasc 3: 35–42,2006.
36. McGarry J. What if Minkowski had been ageusic? Science 30: 770–774,1992.
37. McNamara RK, Able J, Liu Y, Jandacek R, Rider T, Tso P, LiptonJW. Omega-3 fatty acid deficiency during perinatal development in-creases serotonin turnover in the prefrontal cortex and decreases midbraintryptophan hydroxylase-2 expression in adult female rats: dissociationfrom estrogenic effects. J Psychiatr Res 656–663, 2009.
38. Meek RL, Eriksen N, Benditt EP. Murine serum amyloid A3 is a highdensity apolipoprotein and is secreted by macrophages. Proc Natl AcadSci USA 89: 7949–7952, 1992.
39. Murphy KL, Zhang X, Gainetdinov RR, Beaulieu JM, Caron MG. Aregulatory domain in the N terminus of tryptophan hydroxylase 2 controlsenzyme expression. J Biol Chem 283: 13216–13224, 2008.
40. Nakamura K, Sato T, Ohashi A, Tsurui H, Hasegawa H. Role of aserotonin precursor in development of gut microvilli. Am J Pathol 172:333–344, 2008.
41. Newton M, Quintana F, Boon JD, Sengupta S, Ahlquist P. Random-setmethods identify distinct aspects of the enrichment signal in gene set-analysis. Ann Appl Stat 1: 85–106, 2001.
42. Sheffield-Moore M, Urban RJ. An overview of the endocrinology ofskeletal muscle. Trends Endocrinol Metab 15: 110–115, 2004.
43. Shockley KR, Witmer D, Burgess-Herbert SL, Paigen B, ChurchillGA. Effects of atherogenic diet on hepatic gene expression across mousestrains. Physiol Genomics 39: 172–182, 2009.
44. Snijder M, Dekker J, Visser M, Bouter LM, Stehouwer CD, Kostense PJ,Yudkin JA, Heine RJ, Nijpels G, Seidell JC. Associations of hip and thighcircumferences independent of waist circumference with the incidence of type2 diabetes: the Hoorn Study. Am J Clin Nutr 77: 1192–1197, 2003.
45. Sommer G, Weise S, Kralisch S, Scherer PE, Lössner U, Blüher M,Stumvoll M, Fasshauer M. The adipokine SAA3 is induced by interleu-kin-1beta in mouse adipocytes. J Cell Biochem 104: 2241–2247, 2008.
46. Storey JD. A direct approach to false discovery rates. J R Stat Soc B 64:479–498, 2002.
47. Strissel KJ, Stancheva Z, Miyoshi H, Perfield JW, DeFurosa J, Jick Z,Greenberg AS, Olbin MS. Adipocyte death, adipose tissue remodeling,and obesity complications. Diabetes 56: 2910–2918, 2007.
48. Strolien LH, Bauer LA, Krinketos AD, Pan DA, Cooney GJ, JenkinsAB, Calvert GD, Campbell LV. Dietary fats and insulin action. Diabe-tologia 39: 621–631, 1996.
49. Svenson KL, Smith RV, Magnani PA, Suetin HR, Paigen B, NaggertJK, Li R, Churchill GA, Peters LL. Multiple trait measurements in 43inbred mouse strains capture the phenotypic diversity characteristic ofhuman populations. J Appl Physiol 102: 2369–2378, 2007.
50. Tan GD, Goossens GH, Humphreys SM, Vidal H, Karpe F. Upper andlower body adipose tissue function: a direct comparison of fat mobilizationin humans. Obes Res 12: 114–118, 2004.
51. Tankó LB, Bagger YZ, Alexandersen P, Larsen PJ, Christiansen C.Peripheral adiposity exhibits an independent dominant antiatherogeniceffect in elderly women. Circulation 107: 1626–1631, 2003.
52. Tiraby C, Langin D. Conversion from white to brown adipocytes: astrategy for the control of fat mass? Trends Endocrinol Metab 14:439–441, 2003.
53. Vessby B, Aro A, Skarfors E, Berglund L, Salminen I, Lithell H. Therisk to develop NIDDM is related to the fatty acid composition of theserum cholesterol esters. Diabetes 43: 1353–1357, 1994.
54. Voy BH, Aronow BJ. Embrace diversity! Systems genetics-enableddiscovery of disease networks. Physiol Genomics 39: 169–171, 2009.
55. Wang Y, Rimm EB, Stampfer MJ, Willett WC, Hu FB. Comparison ofabdominal adiposity and overall obesity in predicting risk of type 2diabetes among men. Am J Clin Nutr 81: 555–563, 2005.
56. Wu H, Kerr K, Churchill GA. MAANOVA: a software package for theanalysis of spotted cDNA microarray experiments. In: The Analysis of GeneExpression Data and Overview of Methods and Software. New York: Springer,2003.
57. Yang RZ, Lee MJ, Hu H, Pollin TI, Ryan AS, Nicklas BJ, Snitker S,Horenstein RB, Hull K, Goldberg NH, Goldberg AP, Shuldiner AR,Fried SK, Gong DW. Acute-phase serum amyloid A: an inflammatoryadipokine and potential link between obesity and its metabolic complica-tions. PLoS Med 3: 884–894, 2006.
58. Yusuf S, Hawken S, Ounpuu S, Dans T, Avezum A, Lanas F, Mc-Queen M, Budaj A, Pais P, Varigos J, Lisheng L, INTERHEARTStudy Investigators. Effect of potentially modifiable risk factors associ-ated with myocardial infarction in 52 countries (the INTERHEARTstudy): case-control study. Lancet 364: 11–17, 2004.
66 TISSUE RESPONSES OF DBA/2J MICE TO HIGH-FAT DIET
Physiol Genomics • VOL 42 • www.physiolgenomics.org
on July 2, 2010 physiolgenom
ics.physiology.orgD
ownloaded from

Supplemental Table 1: Body Weight Development and Food Conversion
HFD (Mean ± SD) SBD (Mean ± SD) HFD/SBD P-valuebody weight at 5 wk (g) 15.37 ± 1.32 14.14 ± 1.08 1.08 0.048body weight at 6 wk (g) 18.12 ± 1.97 16.66 ± 1.08 1.08 0.073body weight at 12 wk (g) 35.59 ± 3.31 24.91 ± 1.43 1.43 <0.001body weight gain 6-12 wk (g) 17.47 ± 3.08 8.25 ± 2.12 2.12 <0.001
body weight gain/day*(g) 0.55 ± 0.22 0.28 ± 0.12 1.96 0.043food consumption/day* (g) 6.15 ± 0.26 7.59 ± 0.17 0.81 <0.001consumed energy/day* (kcal) 28.9 ± 1.23 30.12 ± 0.69 0.96 0.090feed efficiency at 8 wk** 0.028 ± 0.006 0.01 ± 0.004 2.80 <0.001feed efficiency at 12 wk** 0.016 ± 0.004 0.011 ± 0.004 1.45 0.103
*Data are given for the age between 8 and 12 weeks when food intake was measured.
** body weight gain/consumed energy (g/kcal)
Supplemental Table 1: Body weight development and food conversion for mice fed a high fat diet (HFD) and standard breeding diet (SBD). The energy density for high fat diet (HFD) is 4.70 kcal/g and for standard breeding diet 3.97 kcal/g.
�

Fatty Acid Positive Correlations Negative Correlations Total CorrelationsC16:0 128 341 469C16:1 122 113 235C18:0 135 328 463C18:1 0 6 6C18:2:n-6 37 1 38C18:3:n-3 0 0 0
Supplemental Table 2: Correlation of Fatty Acids with ANOVA Variance Components
�
Supplemental Table 2: The number of significant correlations (positive, negative and total) between fatty acid components and ANOVA variance components for genes that show significant differences in their Diet:Tissue interaction.
�
�

Tissue No. of DE probes No. of DE genes �0 q-value BAT 1354 1136 0.57 0.01GonF 1160 1000 0.61 0.02GlutF 1973 1670 0.53 0.01MesF 297 245 0.7 0.07RetF 2128 1790 0.56 0.01SubF 1710 1426 0.59 0.01Liver 330 283 0.94 0.08Muscle 113 103 0.92 0.15
No. of DE probes No. of DE genes �0 q-value 3165 2842 0.84 0.01
Supplemental Table 3: ANOVA Results
Model: Yi = ��+�Diet�+��i
Model: Yi = ��+�Diet�+�Tissue�+�Diet:Tissue�+��i
Supplemental�Table�3:�Distribution�of�permutation�P�values�from�the�Fs�statistic�for�the�test�contrasting�diet�within�each�tissue�(Yi�=���+�Diet�+��i)�and�the�interaction�between�diet�and�tissue�(Yi�=���+�Diet�+�Tissue�+�Diet:Tissue�+��i)�(1).��A�P�value�cutoff�of�0.001�was�used�to�generate�the�genelists.��The�estimated�proportion�of�null�hypothesis�is�given�as��0�and�the�q�value�is�the�estimate�of�the�proportion�of�differentially�expressed�probes�that�are�false�discoveries�(2).��No.�of�DE�probes�is�the�number�of�probes�differentially�expressed,�and�No.�of�D.E.�genes�is�the�number�of�probes�with�unique�Entrez�Gene�Identifiers.�� �

Tissue BAT GonF GlutF MesF RetF SubF WAT Liver MuscleBAT 577/597 217 214 44 281 238 428 8 1GonF 123 441/559 306 37 422 250 559 6 3GlutF 139 214 815/855 37 402 313 855 9 1MesF 60 54 62 160/85 25 57 85 1 0RetF 173 284 328 76 752/1038 275 1038 8 4SubF 204 211 264 101 252 691/735 735 13 5WAT* 311 441 815 160 752 691 1686/1686 20 12Liver 13 6 17 1 11 13 23 125/158 4Muscle 8 8 13 6 8 8 14 4 53/50
Tissue BAT GonF GlutF MesF RetF SubF WAT Liver MuscleBAT 30 35 9 41 38 68 5 3GonF 34 53 9 71 47 4 3GlutF 24 31 7 45 36 4 2MesF 43 37 44 42 66 3 7RetF 26 40 41 6 34 3 2SubF 32 33 42 11 40 5 3WAT* 22 28 48 7 51 42 4 2Liver 19 14 24 3 20 43 23Muscle 25 25 31 18 27 57 33 11*WAT includes all genes differentially expressed in gonadal, gluteal, mesenteric, retroperitoneal and subcutaneous adipose tissues.
% of overlap of differentially expressed genes
Supplemental Table 4: Overlaps in Up-regulated and Down-Regulated
Percentage of overlap of differentially expressed
differentially expressed genes from ANOVA tests for diet within Tissue
genes from ANOVA tests for diet within Tissue
4
�
Supplemental Table 4: Top: Overlap in the number of up-regulated (red) and down-regulated (green) differentially expressed genes from the ANOVA tests for diet within tissue. The number of differentially expressed genes in WAT is the union of the white adipose tissue gene lists.Bottom: The percent of overlap in differential expression between tissue types. The table is read row-wise, e.g., of the differentially expressed genes in BAT, 30% are also differentially expressed in gonadal, 35% in gluteal, etc.
�

Supplemental Figures
1

Permutation pvalues
Freq
uenc
y
0.0 0.2 0.4 0.6 0.8 1.0
010
0020
0030
00
Brown Adipose Tissue
π0 = .57
Permutation pvalues
Freq
uenc
y
0.0 0.2 0.4 0.6 0.8 1.0
010
0020
0030
0040
00
Gluteal Adipose Tissue
π0 = .57
Permutation pvalues
Freq
uenc
y
0.0 0.2 0.4 0.6 0.8 1.0
050
010
0015
0020
0025
0030
00
Gonadal Adipose Tissue
π0 = .53
Permutation pvalues
Freq
uenc
y
0.0 0.2 0.4 0.6 0.8 1.0
050
010
0015
00 Mesenteric Adipose Tissue
π0 = .70
Permutation pvalues
Freq
uenc
y
0.0 0.2 0.4 0.6 0.8 1.0
020
040
060
0
Muscle
π0 = .92
Permutation pvalues
Freq
uenc
y
0.0 0.2 0.4 0.6 0.8 1.0
010
0020
0030
0040
0050
00 Retroperitonreal Adipose Tissue
π0 = .56
Permutation pvaluesFr
eque
ncy
0.0 0.2 0.4 0.6 0.8 1.0
010
0020
0030
0040
00
Subcutaneous Adipose Tissue
π0 = .59
Permutation pvalues
Freq
uenc
y
0.0 0.2 0.4 0.6 0.8 1.0
020
040
060
080
010
00
Liver
π0 = .94
Diet:Tissue Interaction
ftest$Fs$Pvalperm
Freq
uenc
y
0.0 0.2 0.4 0.6 0.8 1.0
010
0020
0030
0040
0050
00
π0 = .92
π0 = .84
Supplemental Figure 1: Distribution of permutation P-values from the Fs
statistic for the test contrasting diet within each tissue (Yi = μ + Diet + εi)and the interaction between diet and tissue (Yi = μ + Diet + Tissue + Diet :Tissue+εi) (1). P-value cutoff of 0.001 was used for the generation of genelists.The estimated proportion of truly null hypothesis is given as π0 (2). A bin sizeof .01 is shown.
2

C16:0 C16:1
C18:0N = 828
206
119
34
205
182
41
41
Overlap of Significant Correlations
Supplemental Figure 2: A venn-diagram indicating the overlap correlationsbetween fatty acid components and variance components from the ANOVA in-teraction model Yi = μ+Diet+Tissue+Diet : Tissue+ εi. SFA C16:0, C18:0and MUFA C18:0 showed the most correlations, other fatty acid componentsshow only few significant correlations are therefore not shown. Considerableoverlap is observed particularly between SFA components which exhibit coordi-nation in their correlation with transcripts and processes.
3

-2
2Col1a1
+-1
+-1
+-1
-2
2 Col3a1
-2
2
-2
2 Col8a1
+-1
-2
2 Col15a1
+-1
-2
2Col16a1
+-1
-
-2
2 Pcolce2
+-1
-1
4
Mrc2
-2
2 Mmp9
+-1
-1
4
8 Mmp12
-2
2Col5a1 Col5a2
-2
2
+-1
+-1
-2
2 Col17a1
+-1
2
2 Col18a1
+-1
-2
2 Col20a1
+-1
BAT
GonF
GlutF
MesF
RetF
SubF BAT
GonF
GlutF
MesF
RetF
SubF
Col6a1 Col6a2
Col4a1 Col4a6
Supplemental Figure 3: Fold changes of selected genes that contribute toextracellular matrix changes, cell communication and focal adhesion in adiposetissues, but not in liver and muscle and that differ significantly between dietconditions: different collagen genes (Col1a1, Col3a1, Col4a1, Col4a2, Col5a1,Col5a2, Col6a1, Col6a2, Col8a1, Col15a1, Col16a1, Col17a1, Col18a1, Col20a1),procollagen C-proteinase enhancer protein (Pcolce), matrix metallopeptidases9 and 12 (Mmp9, Mmp12), and mannose receptor C type 2 (Mrc2). Adiposetissues: brown adipose tissue (BAT), gonadal (Gon), gluteal (Glut), mesenteric(Mest), retroperitoneal (Ret), subcutaneous (Sub).
4

2
36 6
26 2
6
98
865 9
513 91
3657 197
BAT Muscle
WAT Liver
Only in BAT & Liver: 17 Only in Muscle & WAT: 53
Overlap of Differentially Expressed Genes
N = 5578
Supplemental Figure 4: The overlap of differentially expressed genes due todiet between WAT, BAT, liver and muscle.
5
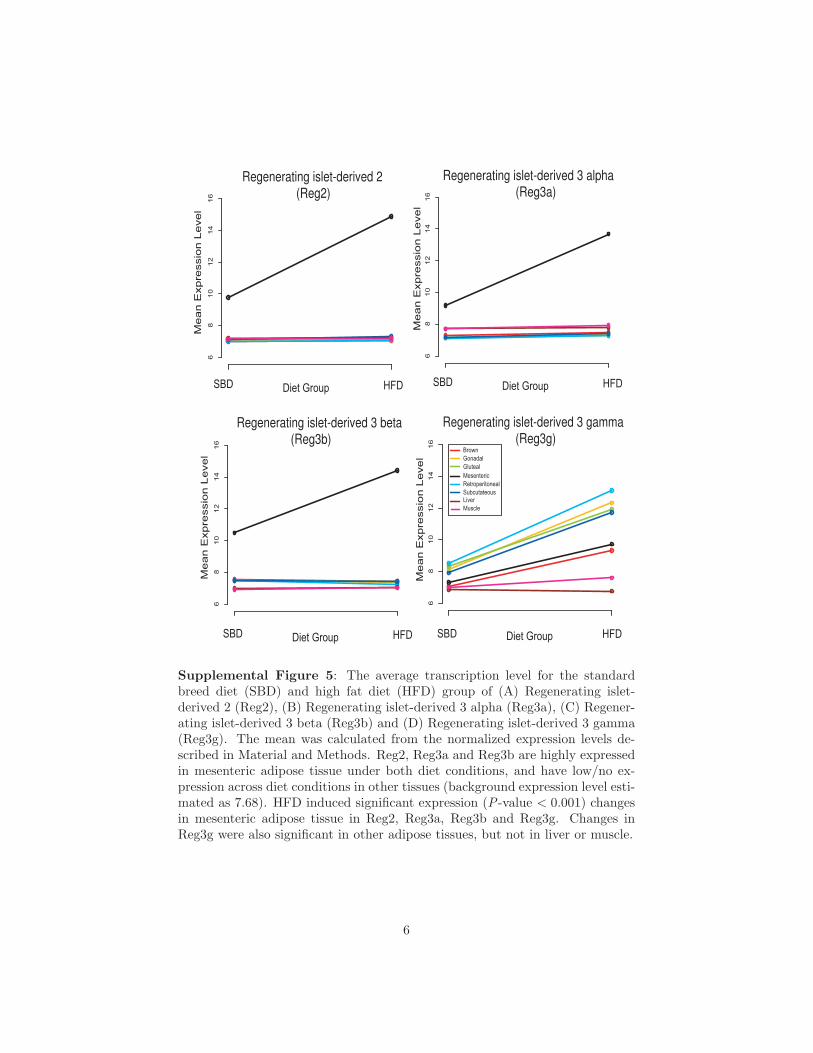
68
10
12
14
16
Regenerating islet-derived 2 (Reg2)
Me
an
Exp
ress
ion
Le
vel
Regenerating islet-derived 3 alpha (Reg3a)
68
10
12
14
16
Me
an
Exp
ress
ion
Le
vel
SBD HFDDiet GroupSBD HFDDiet Group
68
10
12
14
16
Me
an
Exp
ress
ion
Le
vel
SBD HFDDiet Group
Regenerating islet-derived 3 beta (Reg3b)
68
10
12
14
16
Regenerating islet-derived 3 gamma (Reg3g)
Me
an
Exp
ress
ion
Le
vel
SBD Diet Group
BrownGonadalGlutealMesentericRetroperitonealSubcutateousLiverMuscle
HFD
Supplemental Figure 5: The average transcription level for the standardbreed diet (SBD) and high fat diet (HFD) group of (A) Regenerating islet-derived 2 (Reg2), (B) Regenerating islet-derived 3 alpha (Reg3a), (C) Regener-ating islet-derived 3 beta (Reg3b) and (D) Regenerating islet-derived 3 gamma(Reg3g). The mean was calculated from the normalized expression levels de-scribed in Material and Methods. Reg2, Reg3a and Reg3b are highly expressedin mesenteric adipose tissue under both diet conditions, and have low/no ex-pression across diet conditions in other tissues (background expression level esti-mated as 7.68). HFD induced significant expression (P -value < 0.001) changesin mesenteric adipose tissue in Reg2, Reg3a, Reg3b and Reg3g. Changes inReg3g were also significant in other adipose tissues, but not in liver or muscle.
6

References
1. X. Cui, J.T. Hwang, J. Qui, N.J. Blades, and Churchill GA. Improvedstatistical tests for differential gene expression by shrinking variance com-ponent estimates. Biostatistics 6: 59-75, 2005.
2. Storey JD. A direct approach to false discovery rates. J R Stat Soc B 64:479-498, 2002.
7