DETERMINATION OF A BUS SERVICE COVERAGE AREA REFLECTING PASSENGER ATTRIBUTES
15
DETERMINATION OF A BUS SERVICE COVERAGE AREA REFLECTING PASSENGER ATTRIBUTES KIM Jumsan Guest researcher/Ph.D. Research Institute of Engineering Science, Seoul National University San 56-1, Shillim-dong, Gwanak-gu, Seoul 151-742 Korea Fax: +82-2-889-0032 E-mail: [email protected] KIM Jongmin Researcher Traffic Improvement Division, Transportation Bureau in Seoul City Gov. Euljiro 1-ga, Jung-gu, Seoul, 100-744 Korea Fax: +82-2-3707-8764 E-mail: [email protected] JUN Misun Researcher/Master’s course Graduate School of Engineering Seoul National University San 56-1, Shillim-dong, Gwanak-gu, Seoul 151-742 Korea Fax: +82-2-889-0032 E-mail: [email protected] KHO Seongyoung Professor Graduate School of Engineering Seoul National University San 56-1, Shillim-dong, Gwanak-gu, Seoul 151-742 Korea Fax: +82-2-889-0032 E-mail: [email protected] Abstract: The paper presented not only the difference of the marginal walking time by passenger, but also the derivation of the bus service determination model by passenger attributes. The marginal walking distance to bus stop is a basic parameter to estimate bus service coverage area in certain area. And the marginal walking distance could be transformed from the marginal walking time, which is the focus of this paper. The result of analysis revealed that the age and income of passenger are strongly related to the marginal walking time. The model suggested in this paper help for the planner to choose optimal alternative in planning or regulating the spacing of bus routes or bus stops in certain area,. Key Words: Passenger Attributes, Bus Service Coverage Area, marginal walking time 1. INTRODUCTION Determining transit service coverage is one of basic studies on fixed-route transit service availability in system. The presence or absence of transit service near one’s origin and destination is key factor in one’s choice to use transit. When service is not available, other aspects of service quality do not matter for given trip. Transit service will be provided within a reasonable walking distance of one’s origin and destination. The planning methodology defines the area covered by a particular route as that area within working distance of transit stop. This area is defined as the air distance within 0.25 mile (400m) of a bus stop or 0.5 mile (800m) of busway or rail station in TCQSM (Transit Capacity and Quality of Service Manual, TCRP Report 100). The general analysis procedure is similar to the planning methodology. However, instead of using a set service coverage radius for every stop, each stop’s service area is reduced in proportion to the additional time required to climb hills, cross busy streets, wind one’s way out of subdivision, elderly pedestrians (65 years or older) and so on. Previous researches that contributed to TCQSM have mainly been interested in just topographical factors without considering user personal attributes. To determine bus service coverage area more practically, passenger attributes should be Journal of the Eastern Asia Society for Transportation Studies, Vol. 6, pp. 529 - 543, 2005 529
-
Upload
independent -
Category
Documents
-
view
0 -
download
0
Transcript of DETERMINATION OF A BUS SERVICE COVERAGE AREA REFLECTING PASSENGER ATTRIBUTES

DETERMINATION OF A BUS SERVICE COVERAGE AREA REFLECTING PASSENGER ATTRIBUTES
KIM Jumsan Guest researcher/Ph.D. Research Institute of Engineering Science, Seoul National University San 56-1, Shillim-dong, Gwanak-gu, Seoul 151-742 Korea Fax: +82-2-889-0032 E-mail: [email protected]
KIM Jongmin Researcher Traffic Improvement Division, Transportation Bureau in Seoul City Gov. Euljiro 1-ga, Jung-gu, Seoul, 100-744 Korea Fax: +82-2-3707-8764 E-mail: [email protected]
JUN Misun Researcher/Master’s course Graduate School of Engineering Seoul National University San 56-1, Shillim-dong, Gwanak-gu, Seoul 151-742 Korea Fax: +82-2-889-0032 E-mail: [email protected]
KHO Seongyoung Professor Graduate School of Engineering Seoul National University San 56-1, Shillim-dong, Gwanak-gu, Seoul 151-742 Korea Fax: +82-2-889-0032 E-mail: [email protected]
Abstract: The paper presented not only the difference of the marginal walking time by passenger, but also the derivation of the bus service determination model by passenger attributes. The marginal walking distance to bus stop is a basic parameter to estimate bus service coverage area in certain area. And the marginal walking distance could be transformed from the marginal walking time, which is the focus of this paper. The result of analysis revealed that the age and income of passenger are strongly related to the marginal walking time. The model suggested in this paper help for the planner to choose optimal alternative in planning or regulating the spacing of bus routes or bus stops in certain area,. Key Words: Passenger Attributes, Bus Service Coverage Area, marginal walking time 1. INTRODUCTION Determining transit service coverage is one of basic studies on fixed-route transit service availability in system. The presence or absence of transit service near one’s origin and destination is key factor in one’s choice to use transit. When service is not available, other aspects of service quality do not matter for given trip. Transit service will be provided within a reasonable walking distance of one’s origin and destination. The planning methodology defines the area covered by a particular route as that area within working distance of transit stop. This area is defined as the air distance within 0.25 mile (400m) of a bus stop or 0.5 mile (800m) of busway or rail station in TCQSM (Transit Capacity and Quality of Service Manual, TCRP Report 100). The general analysis procedure is similar to the planning methodology. However, instead of using a set service coverage radius for every stop, each stop’s service area is reduced in proportion to the additional time required to climb hills, cross busy streets, wind one’s way out of subdivision, elderly pedestrians (65 years or older) and so on. Previous researches that contributed to TCQSM have mainly been interested in just topographical factors without considering user personal attributes. To determine bus service coverage area more practically, passenger attributes should be
Journal of the Eastern Asia Society for Transportation Studies, Vol. 6, pp. 529 - 543, 2005
529

considered. The attributes to affect service coverage radius are 1) residential area (big city/city/composite city/county), 2) sex (male/female), 3) age (more disaggregated than the population factor of TCQSM), 4) employed status, 5) income per month, 6) car ownership, 7) frequency of week, 8) trip purpose (trip to work/school/shopping/recreation/visiting/personal business/other). The purpose of this paper is to find the difference of the marginal walking time by passenger attributes, and to develop the bus service coverage area determination model by passenger attribute. The marginal walking distance to bus stop is a basic parameter to estimate bus service coverage area in certain area. And the marginal walking distance could be transformed from the marginal walking time, which is the focus of this paper. 2. BUS SERVICE COVERAGE AREA CONCEPT & DEFINITION 2.1 Fixed-Route Quality of Service Measures Fixed-route quality of service measures into two main categories: (1) availability and (2) comfort and convenience. The availability measures address the spatial and temporal availability of transit service. If transit service is located too far away from a potential user or if service does not run at the times a user requires it, that user would not consider transit service to be available and thus the quality of service would be poor. Assuming, however, that transit service is available, the comfort and convenience measures can be used to evaluate a user’s perception of the quality of his or her transit experience. Different elements of a transit system require different performance measures.
Table 1. Fixed-Route Quality of Service Measures
Transit stop Route Segment System Availability Frequency Hours of Service Service Coverage Comfort &
Convenience Passenger Load Reliability Transit-Auto Travel Time
Source: Transit Capacity and Quality of Service Manual, page 3-3 2.2 Service Coverage The presence or absence of transit service near one’s origin and destination is a key factor in one’s choice to use transit. Ideally, transit service will be provided within a reasonable walking distance of one’s origin and destination. The presence of accessible transit stops, as well as accessible routes to transit stops, is a necessity for many persons with disabilities who wish to use fixed-route transit. Service coverage considers both ends of a trip, for example, home and work. Transit service at one’s origin is of little use if service is not provided near one’s destination. Options for getting from a transit stop to one’s destination are more limited than the options for getting from one’s origin to a transit stop. The car one drove to a park-and-ride lot will not be available at the destination nor will a bicycle left behind in a storage facility. A bicycle carried on a bus-mounted bicycle rack or brought on board a train will be available at the destination, as long as space was available for the bicycle on the transit vehicle.
Journal of the Eastern Asia Society for Transportation Studies, Vol. 6, pp. 529 - 543, 2005
530

The maximum distance that people will walk to transit varies depending on the situation. Figure 1 shows the results of several studies of walking distances to transit in North American cities. Although there is some variation between cities and income groups among the studies represented in the exhibit, it can be seen that most passengers (75 to 80% on average) walk one-quarter mile (400 meters) or less to bus stops. At an average walking speed of 3 mph (5 km/h), this is equivalent to a maximum walking time of 5 minutes. These times and distances can be doubled for rail transit. Bus service that emulates rail transit—frequent service throughout much of the day, relatively long stop spacing, passenger amenities at stops, etc.—is expected to have the same walking access characteristics as rail transit (e.g., a maximum walking time of 10 minutes). However, at the time of writing, no research had yet been conducted to confirm this expectation.
Figure 1. Walking Distance to Bus Stops
Source: Transit Capacity and Quality of Service Manual, page 3-10 2.3 Service Coverage Area & Transit-Supportive Areas The planning methodology defines the service coverage area covered by a particular route as that area within walking distance of a transit stop. This area is defined as the air distance within 0.25 mile (400 m) of a bus stop or 0.5 mile (800 m) of a busway or rail station. Any location within 0.25 mile (400 m) of the area served by deviated fixed-route bus service is also considered to be covered.
Figure 2. The Concept of Bus service Coverage and Marginal Walking Distance
CB
x
Bus route
Marginal walking distance
Bus service coverage area
Bus stop
Journal of the Eastern Asia Society for Transportation Studies, Vol. 6, pp. 529 - 543, 2005
531

Pushkarev and Zupan (1977) suggest that a household density of 4.5 units per net acre (11 units per net hectare) is a typical minimum residential density for hourly transit service to be feasible. This equates to a density of approximately 3 units per gross acre (7.5 units per gross hectare). A TriMet long-range service planning study found that an employment density of approximately 4 jobs per gross acre (10 jobs per gross hectare) produced the same level of ridership as a household density of 3 units per gross acre (7.5 units per gross hectare). These density values are used as the minimum job densities that are capable of supporting hourly transit service. 2.4 Fixed-Route Service Coverage LOS Areas with a minimum density capable of supporting hourly service are referred to as transit-supportive areas. For policy reasons, or simply to provide a route connecting two higher-density areas, an agency may choose to—and likely will—cover a larger area than that defined by its transit-supportive areas. However, service coverage LOS is based solely on the percentage of the transit supportive area covered by transit, as shown in Table 2.
Table 2. Fixed-Route Service Coverage LOS
LOS % TSA Covered Comments
A 90.0-100.0% Virtually all major origins & destinations served
B 80.0-89.9% Most major origins & destinations served
C 70.0-79.9% About ¾ of higher-density areas served
D 60.0-69.9% About two-thirds of higher-density areas served
E 50.0-59.9% At least ½ of the higher-density areas served
F <50.0% Less than ½ of higher-density areas served Note: Transit-Supportive Area (TSA): The portion of the area being analyzed that has a household density of at least 3 units per gross acre (7.5 units per gross hectare) or an employment density of at least 4 jobs per gross acre (10 jobs per gross hectare), Covered Area: The area within 0.25 mile (400 m) of local bus service or 0.5 mile (800 m) of a busway or rail station, where pedestrian connections to transit are available from the surrounding area. Source: Transit Capacity and Quality of Service Manual, page 3-34 3. MARGINAL WALKING TIME BY PASSENGER ATTRIBUTE 3.1 Data The data for the bus service coverage area estimation is collected as followings; 1) Date: 2004. 10. 1 - 10. 15(2 weeks), 2) Area: Gyeonggi Province, KOREA (including 31 cities possibly classified into 4 city types, big city/city/composite city/county), 3) Samples: 831 respondents, who is 16 or older, and has ridden within the past a week, 4) Method and contents: a short-form questionnaire suitable for obtaining rider demographic information, and transit usage including the walking time and marginal walking time to bus stop.
Journal of the Eastern Asia Society for Transportation Studies, Vol. 6, pp. 529 - 543, 2005
532

3.2 Walking time and Marginal Walking time to a Bus Stop The walking time to bus stop regardless of passenger attribute is a average value of 8min, a minimum value of 2 min, and a maximum value of 50 min. The shape of distribution follows exponential distribution. As for the walking time to bus stop by city types (big city/small town/urban-rural composition city/rural county), the average value of big city and rural county is 9 min, somewhat larger than other types of city.
Table 3. Statistical Characteristics of Samples
1 2 3 4 5 6 7
Sex 37% 63%
Age 9% 17% 33% 30% 6% 5%
Employment status 30% 4% 19% 3% 13% 29% 2%
Income 34% 27% 24% 10% 2% 2%
Car ownership 51% 49%
Frequency of use 33% 23% 16% 5% 5% 14% 5%
Trip purpose 23% 9% 11% 6% 6% 37% 8%
Access mode 86% 2% 2% 4% 5% Notes: SEX: 1.Male 2.Female, AGE: 1. 15-19 2. 20-29 3. 30-39 4. 40-49 5. 50-59 6. 60-, EMPLOYED STATUS: 1. Employed full-time 2. Employed part-time 3. Business on one's own account 4. Unemployed 5. Student 6. Housewife 7. Retired, INCOME PER MONTH: 1. less than 1 million won 2. 1 million won to less than 2 million won 3. 2 million won to less than 3 million won 4. 3 million won to less than 4 million won 5. 4 million won to less than 5 million won 6. 5 million won or more, CAR OWNERSHIP: 1. yes 2. no, FREQUENCY OF USE PER 1 WEEK: 1. 1 time 2. 2 times 3. 3 times 4. 4 times 5. 5 times 6. 6 times 7. 7 times, TRIP PURPOSE: 1. Work 2. School 3. Shopping 4. Recreation 5. Visiting 6. Personal business 7. Other, ACCESS MODE TO BUS STOP: 1. Walking 2. Bicycle 3. Carpool 4. Car 5. Other
Figure 3. The Percent of Passengers by Walking Time
Journal of the Eastern Asia Society for Transportation Studies, Vol. 6, pp. 529 - 543, 2005
533

Table 4. The Walking Time to Bus Stop by City Types
Total Big city
(More than 500,000 pop)
City (Less than
500,000 pop)
Composite city* County
# of Samples 829 452 224 147 6 Min 1 2 1 2 5 Max 50 40 45 50 20
Average 8 9 6 8 9
Note: Composite city is in intermediate state between city and county. The marginal walking time is collected with question, “How much added-walking time to bus stop force you to give up a trip by bus or to choose other modes (private car, taxi, etc)?” The marginal walking time to bus stop not considering passenger attribute also follows exponential distribution.
Figure 4. The Percent of Passengers by Marginal Walking Time
3.3 Marginal Walking time by Passenger Attribute This section is to find the difference of bus service coverage radius by passenger attributes. To determine bus service coverage area more practically, passenger attributes should be considered. In this paper, the attributes to affect service coverage radius are suggested as following: 1) residential area (big city/city/composite city/county), 2) sex (male/female), 3) age, 4) employed status, 5) income per month, 6) car ownership, 7) frequency of week, 8) trip purpose (trip to work/school/shopping/recreation/visiting/personal business/other). The result of analysis, to find the percent of passengers who can accept each marginal walking time, shows the difference by passenger attributes. The difference is certain in the marginal walking time, which could be accepted by 10%, 20% and 30% passenger for each passenger attribute. The specific result of analysis for each passenger attribute is as follows. In the first case, when the residential area of passenger is classified into big city (more than 500,000pop.), city (less than 500,000pop.), composite city, and county, the marginal walking time which could be accepted by 30% passenger is estimated at 20min in big city, 15min in
Journal of the Eastern Asia Society for Transportation Studies, Vol. 6, pp. 529 - 543, 2005
534
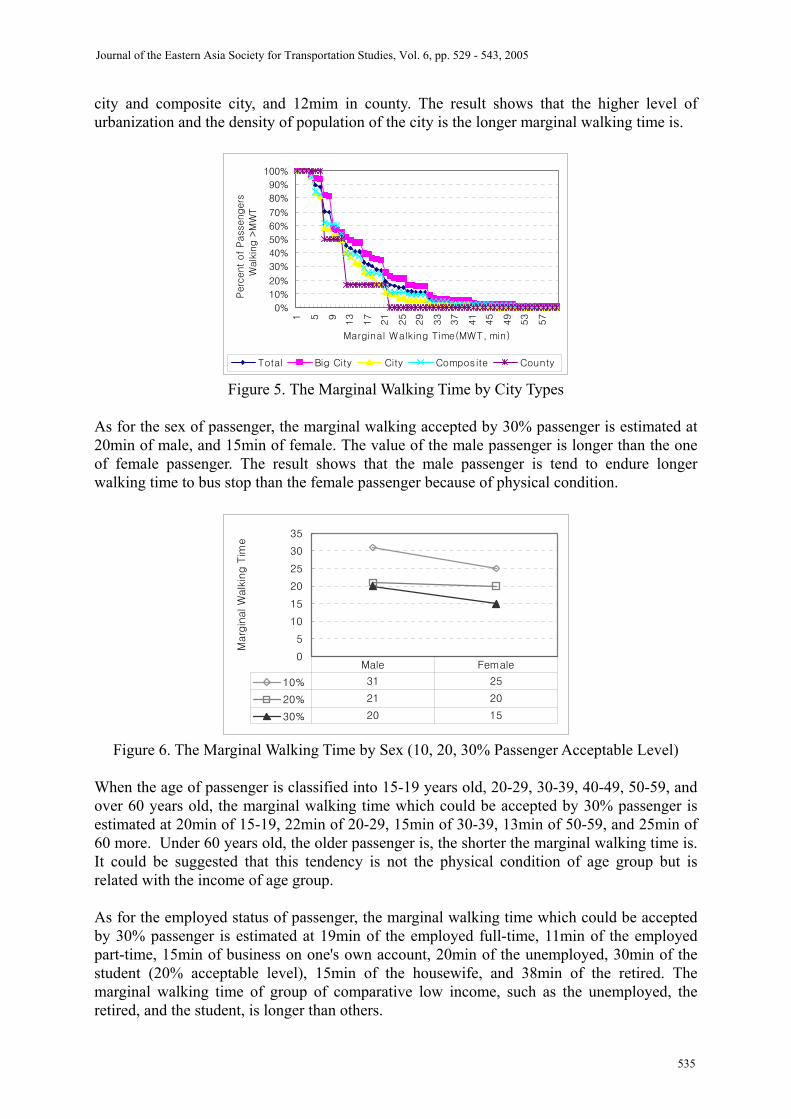
city and composite city, and 12mim in county. The result shows that the higher level of urbanization and the density of population of the city is the longer marginal walking time is.
0%
10%
20%
30%
40%
50%
60%
70%
80%
90%
100%
1 5 9
13
17
21
25
29
33
37
41
45
49
53
57
Marginal Walking Time(MWT, min)
Perc
ent of
Passengers
Walk
ing >
MW
T
Total Big City City Composite County
Figure 5. The Marginal Walking Time by City Types
As for the sex of passenger, the marginal walking accepted by 30% passenger is estimated at 20min of male, and 15min of female. The value of the male passenger is longer than the one of female passenger. The result shows that the male passenger is tend to endure longer walking time to bus stop than the female passenger because of physical condition.
0
5
10
15
20
25
30
35
Marg
inal W
alk
ing T
ime
10% 31 25
20% 21 20
30% 20 15
Male Female
Figure 6. The Marginal Walking Time by Sex (10, 20, 30% Passenger Acceptable Level)
When the age of passenger is classified into 15-19 years old, 20-29, 30-39, 40-49, 50-59, and over 60 years old, the marginal walking time which could be accepted by 30% passenger is estimated at 20min of 15-19, 22min of 20-29, 15min of 30-39, 13min of 50-59, and 25min of 60 more. Under 60 years old, the older passenger is, the shorter the marginal walking time is. It could be suggested that this tendency is not the physical condition of age group but is related with the income of age group. As for the employed status of passenger, the marginal walking time which could be accepted by 30% passenger is estimated at 19min of the employed full-time, 11min of the employed part-time, 15min of business on one's own account, 20min of the unemployed, 30min of the student (20% acceptable level), 15min of the housewife, and 38min of the retired. The marginal walking time of group of comparative low income, such as the unemployed, the retired, and the student, is longer than others.
Journal of the Eastern Asia Society for Transportation Studies, Vol. 6, pp. 529 - 543, 2005
535

0
5
10
15
20
25
30
35
Marg
inal W
alk
ing T
ime
10% 31 31 25 20 21 31
20% 25 30 20 15 19 30
30% 20 22 15 13 13 25
15-19 20-29 30-39 40-49 50-59 60-
Figure 7. The Marginal Walking Time by Age (10, 20, 30% Passenger Acceptable Level)
0
10
20
30
40
50
Marg
inal W
alk
ing T
ime
10% 30 20 26 31 31 25 40
20% 20 15 20 30 30 20 39
30% 19 11 15 20 15 38
Full-
time
Part-
time
Busin
ess
Unem
ploye
Stude
nt
House
wife
Retire
d
Figure 8. The Marginal Walking Time by Employed Status (10, 20, 30% Passenger
Acceptable Level) The higher the income of the group is, the shorter the marginal walking time is. It could be strongly suggested that the marginal walking time is deeply related with the income of passenger.
0
5
10
15
20
25
30
35
Marg
inal W
alk
ing T
ime
10% 30 30 30 20
20% 21 20 21 15
30% 20 18 16 11
less 1mil 1mil-2mil 2mil-3mil 3mil more
Figure 9. The Marginal Walking Time by Income (10, 20, 30% Passenger Acceptable Level)
Journal of the Eastern Asia Society for Transportation Studies, Vol. 6, pp. 529 - 543, 2005
536

As for the car ownership of passenger, the result shows that the group with a private car is not tend to endure longer walking time to bus stop than the other group.
0
5
10
15
20
25
30
35
Marg
inal W
alk
ing T
ime
10% 23 30
20% 20 23
30% 15 20
YES NO
Figure 10. The Marginal Walking Time by Car Ownership (10, 20, 30% Passenger Acceptable
Level) As for the frequency of use, the marginal walking accepted by 30% passenger is estimated at 15min of the 1-2times/week, 17min of the 3times/week, 23min of the 4times/week, and 20min of 5times more. The passengers who frequently use bus is tend to endure longer walking time.
0
10
20
30
40
50
Marg
inal W
alk
ing T
ime
10% 25 25 30 41 35
20% 20 20 21 30 25
30% 15 15 17 23 20
1 2 3 4 5 more
Figure 11. The Marginal Walking Time by Frequency of Use (10, 20, 30% Passenger
Acceptable Level) When the trip purpose of passenger is classified into to work, to school, to shopping, to recreation, to visiting, to personal business and to other, the marginal walking time which could be accepted by 30% passenger is estimated at 20min to work, 30min to school (20% acceptable level), 15min to shopping, 21min to recreation, 20min to visiting, and 15min to personal business, 17min to other. The marginal walking time of trip purpose not limited time, such as the trip to recreation and visiting is longer than others. The result of analysis in this section revealed that two variables of passenger attributes, 1) the age of passenger and 2) the income of passenger are strongly related to the marginal walking time. As mentioned earlier, the marginal walking distance to bus stop is a basic parameter to estimate bus service coverage area in certain area. And the marginal walking distance could be transformed from the marginal walking time, which is the focus of this paper.
Journal of the Eastern Asia Society for Transportation Studies, Vol. 6, pp. 529 - 543, 2005
537

0
10
20
30
40
50
Marg
inal W
alk
ing T
ime
10% 30 31 30 30 40 23 25
20% 21 30 17 29 21 20 20
30% 20 15 21 20 15 17
WorkScho
ol
Shopi
ng
Recr
eatio
V is iti
ng
perso
nalOther
Figure 12. The Marginal Walking Time by Trip Purpose (10, 20, 30% Passenger Acceptable
Level) 4. BUS SERVICE COVERAGE AREA DETERMINATION MODEL The section presents the derivation of the bus service coverage determination model by passenger attribute. The two variables of passenger attributes considered in this paper are 1) the age of passenger and 2) the income of passenger, because it is clearly certified that the variables are strongly related to the marginal walking time to bus stop in section 3. 4.1 ModelⅠ- Not Considering Passenger Attributes Model equations such as liner, log, and exponential equations are built from the relationship between the percent of passengers (y, %) and the marginal walking time (x, min) not considering the passenger attributes. The result shows that the exponential explain the relationship better than others as comparing the coefficient of determination (R2) of the equations.
0%
10%
20%
30%
40%
50%
60%
70%
80%
90%
100%
0 5 10 15 20 25 30
Marginal Walking Time(MWT, min)
Perc
ent of
Passengers
Walk
ing
>M
WT
Figure 13. ModelⅠ-The relationship between The Percent of Passengers(y, %) and Marginal
Walking Time(x, min)
Journal of the Eastern Asia Society for Transportation Studies, Vol. 6, pp. 529 - 543, 2005
538

Table 5. ModelⅠ- The Percent of Passengers(y, %) and Marginal Walking Time(x, min)
Model specification Model Equation Coefficient of determination (R2)
Linear Equation y = -0.0341x + 0.9741 0.9266 Log Equation y = -0.351Ln(x) + 1.3192 0.9165
Exponential Equation y = 1.3189exp(-0.0872x) 0.9846 The main advantage of this model is to allow a methodology to estimate the number of passengers in certain interval of bus stops. But we cannot estimate the number of passengers in different demographic condition, for example, in different proportion of age group or in different proportion of income group. 4.2 ModelⅡ- Considering The Age of Passenger Model equations for age groups are built from the relationships between the percent of passengers (y, %) and the marginal walking time (x, min) for age groups by Exponential equation form, fixed the coefficient of exponential, suggested in ModelⅠ. The result shows that all of the model equations for age groups explain the relationship well in the view of the coefficient of determination (R2) of the equations. Table 6. ModelⅡ - The Percent of Passengers(y, %) and Marginal Walking Time(x, min) by
Age Group
Age Group specification Model Equation by Group Coefficient of determination (R2)
1 15 - 19 years old y = 1.3189exp(-0.0709x) 0.9499
2 20 - 29 years old y = 1.3189exp(-0.0578x) 0.9231
3 30 - 39 years old y = 1.3189exp(-0.0926x) 0.9829
4 40 - 49 years old y = 1.3189exp(-0.1135x) 0.9796
5 50years old more y = 1.3189exp(-0.1189x) 0.9603 The model equation for age group can be simplified from high correlation between the multipliers of the exponential equations and the age groups as follows:
30}5,4,3,2,1{0452.00152.0)(
3189.1)( )(
≤=−−=
=
xaaag
exf xag
Where, f(x) = the percent of passengers (%) to use bus in certain area, x= marginal walking time(min), a = age group This model overcome the limit of ModelⅠnot to estimate the number of passengers in certain area which has different proportion of age group. This means that the model reflects the
Journal of the Eastern Asia Society for Transportation Studies, Vol. 6, pp. 529 - 543, 2005
539

demographic characteristic of the area.
0%
10%
20%
30%
40%
50%
60%
70%
80%
90%
100%
0 5 10 15 20 25 30
Marginal Walking Time(MWT, min)
Perc
ent of
Passengers
Walk
ing
>M
WT
Figure 14. ModelⅡ - The relationship between The Percent of Passengers(y, %) and Marginal
Walking Time(x, min) by Age Group
g(a) = -0.0152a - 0.0452
R2 = 0.8239
-0.14
-0.12
-0.1
-0.08
-0.06
-0.04
-0.02
0
0 1 2 3 4 5 6
Age group(a)
The m
ultip
lier of
Exp
onential
Eq.(
g(a
))
Figure 15. ModelⅡ - The relationship between The multiplier of Exponential Eq.(g(a)) and
Age Group(a) 4.3 ModelⅢ- Considering The Income of Passenger Model equations for income groups are built from the relationships between the percent of passengers (y, %) and the marginal walking time (x, min) for income groups by Exponential equation form, fixed the coefficient of exponential, suggested in ModelⅠ. The result shows that all of the model equations for income groups explain the relationship well in the view of the coefficient of determination (R2) of the equations. The model equation for income group can be simplified from high correlation between the multipliers of the exponential equations and the age groups as follows:
30}4,3,2,1{0622.00154.0)(
3189.1)( )(
≤=−−=
=
xiiih
exf xih
Journal of the Eastern Asia Society for Transportation Studies, Vol. 6, pp. 529 - 543, 2005
540

Where, f(x) = the percent of passengers (%) to use bus in certain area, x= marginal walking time(min), a = income group
Table 7. ModelⅢ - The Percentile of Passengers(y, %) and Marginal Walking Time(x, min) by Income Group
Income Group specification Model Equation by Group Coefficient of determination (R2)
1 Less than 1 million won y = 1.3189exp(-0.0838x) 0.9780
2 1 million won to less than 2 million won y = 1.3189exp(-0.0931x) 0.9659
3 2 million won to less than 3 million won y = 1.3189exp(-0.0893x) 0.9803
4 3 million won or more y = 1.3189exp(-0.1364x) 0.9530
0%
10%
20%
30%
40%
50%
60%
70%
80%
90%
100%
0 5 10 15 20 25 30
Marginal Walking Time(MWT, min)
Perc
ent of
Passengers
Walk
ing
>M
WT
Figure 16. ModelⅢ - The relationship between The Percentile of Passengers(y, %) and
Marginal Walking Time(x, min) by Income Group
h(I) = -0.0154i - 0.0622
R2 = 0.6784
-0.16
-0.14
-0.12
-0.1
-0.08
-0.06
-0.04
-0.02
0
0 1 2 3 4 5
Income group(i)
The m
ultip
lier of
Exp
onential
Eq.(
h(i))
Figure 17. ModelⅢ - The relationship between The multiplier of Exponential Eq.(h(i)) and
Income Group(i)
Journal of the Eastern Asia Society for Transportation Studies, Vol. 6, pp. 529 - 543, 2005
541

4.4. Numerical Example This section presents methodology to determine the bus stop spacing (L) suitable for the target passenger number (OP) in certain area. In planning level, it is important to determine the bus stop spacing or bus route spacing (= band width). In the case (a) which the bus stop and route spacing is short, the cost of construction and operating is higher and the number of passenger is lower than the case (b). In this case, planner could estimate the cost of construction and operating for each case, not the number of passenger for each case.
Figure 17. Numerical Example- Case (a) and Case (b)
The model suggested in this paper allows methodology for the planner to estimate the number of passenger in this case. We can estimate the number passenger in certain bus stop spacing by following equation.
30}5,4,3,2,1{0452.00152.0)(
)(3189.1)( )(
≤=−−=
=∑
xaaag
asexPa
xag
Where, P(x) = the number of passenger to use bus in certain area
x= (L/PS)/2 L = bus stop spacing PS = average pedestrian walking speed (m/min) a = age group s(a)= potential bus passenger in age group a
5. CONCLUSION The presence or absence of transit service near one’s origin and destination is key factor in one’s choice to use transit. When service is not available, other aspects of service quality do not matter for given trip. Transit service will be provided within a reasonable walking distance of one’s origin and destination. To determine bus service coverage area more practically, passenger attributes should be considered. The paper presented not only the difference of the marginal walking time by passenger attributes such as 1) residential area (big city/city/composite city/county), 2) sex (male/female), 3) age, 4) employed status, 5)
CBD CBD
xx (a) (b)
Journal of the Eastern Asia Society for Transportation Studies, Vol. 6, pp. 529 - 543, 2005
542

income per month, 6) car ownership, 7) frequency of week, and 8) trip purpose, but also the derivation of the bus service determination model by passenger attribute. As mentioned earlier, the marginal walking distance to bus stop is a basic parameter to estimate bus service coverage area in certain area. And the marginal walking distance could be transformed from the marginal walking time, which is the focus of this paper. The result of analysis in section 3 revealed that two variables of passenger attributes, 1) the age of passenger and 2) the income of passenger are strongly related to the marginal walking time. The model, developed with these variables in section 4, allows a methodology to estimate the number of passengers in certain spacing of bus stops despite of different demographic condition of the area. The model suggested in this paper help for the planner to choose optimal alternative in planning or regulating the spacing of bus routes or bus stops in certain area. There are some studies to model reluctance of walking for transit access by including many personal attributes as explanatory, but most of these studies only provide the percent of transit users walking > distance x for walking distance x to bus in each personal attribute to help finding the difference among the personal attributes.
ACKNOWLEDGEMENTS The authors would like to express their sincere gratitude to Engineering Research Institute in Seoul National University by which they are supported, for giving them the opportunity to carry out this paper.
REFERENCE Lazar N. Spasovic, Maria P. Boile, and Athanassios K. Bladikas (1994) Bus Transit Service Coverage for Maximum Profit and Social Welfare. Transportation Research Record 1451. Lazar N. Spasovic and Paul M. Schonfeld (1993) Method for Optimizing Transit Service Coverage. Transportation Research Record 1402. Nelson\Nygaard Consulting Associates (1997) Tri-Met Transit Network PhaseⅡ Report. Portland, PA. Pushkarev, Boris and Jeffrey M. Zupan (1977) Public Transportation and Land Use Policy. Indiana University Press, Bloomington, IN. Transportation Research Board (2003) Transit Capacity and Quality of Service. TCRP Report 100, Washington, DC. Transportation Research Board (1999) A Handbook for Measuring Customer Satisfaction and Service Quality. National Academy Press, Washington, DC.
Journal of the Eastern Asia Society for Transportation Studies, Vol. 6, pp. 529 - 543, 2005
543