Knockdown of FIBRILLIN4 gene expression in apple decreases plastoglobule plastoquinone content
Upload
independentCategory
view
0download
0
http://jbx.sagepub.com/Journal of Biomolecular Screening
http://jbx.sagepub.com/content/12/6/775The online version of this article can be found at:
DOI: 10.1177/1087057107302675
2007 12: 775 originally published online 21 May 2007J Biomol ScreenKoller, Eric Marcusson, Kerry Blanchard and Louis Stancato
Jonathan Low, Shuguang Huang, Michele Dowless, Wayne Blosser, Thomas Vincent, Scott Davis, Jeff Hodson, ErichOligonucleotides
High-Content Imaging Analysis of the Knockdown Effects of Validated siRNAs and Antisense
Published by:
http://www.sagepublications.com
On behalf of:
Journal of Biomolecular Screening
can be found at:Journal of Biomolecular ScreeningAdditional services and information for
http://jbx.sagepub.com/cgi/alertsEmail Alerts:
http://jbx.sagepub.com/subscriptionsSubscriptions:
http://www.sagepub.com/journalsReprints.navReprints:
http://www.sagepub.com/journalsPermissions.navPermissions:
http://jbx.sagepub.com/content/12/6/775.refs.htmlCitations:
What is This?
- May 21, 2007 OnlineFirst Version of Record
- Sep 11, 2007Version of Record >>
by guest on October 11, 2013jbx.sagepub.comDownloaded from by guest on October 11, 2013jbx.sagepub.comDownloaded from by guest on October 11, 2013jbx.sagepub.comDownloaded from by guest on October 11, 2013jbx.sagepub.comDownloaded from by guest on October 11, 2013jbx.sagepub.comDownloaded from by guest on October 11, 2013jbx.sagepub.comDownloaded from by guest on October 11, 2013jbx.sagepub.comDownloaded from by guest on October 11, 2013jbx.sagepub.comDownloaded from by guest on October 11, 2013jbx.sagepub.comDownloaded from by guest on October 11, 2013jbx.sagepub.comDownloaded from by guest on October 11, 2013jbx.sagepub.comDownloaded from by guest on October 11, 2013jbx.sagepub.comDownloaded from by guest on October 11, 2013jbx.sagepub.comDownloaded from by guest on October 11, 2013jbx.sagepub.comDownloaded from by guest on October 11, 2013jbx.sagepub.comDownloaded from
High-Content Imaging Analysis of the Knockdown Effects of Validated siRNAs and Antisense Oligonucleotides
JONATHAN LOW,1,* SHUGUANG HUANG,2,* MICHELE DOWLESS,1 WAYNE BLOSSER,1
THOMAS VINCENT,3 SCOTT DAVIS,3 JEFF HODSON,3 ERICH KOLLER,3
ERIC MARCUSSON,3 KERRY BLANCHARD,1 and LOUIS STANCATO1
High-content imaging (HCI) provides researchers with a powerful tool for understanding cellular processes. Although pheno-typic analysis generated through HCI is a potent technique to determine the overall cellular effects of a given treatment, it fre-quently produces complex data sets requiring extensive interpretation. The authors developed statistical analyses to decrease thetime spent to determine the outcome of each HCI assay and to better understand complex phenotypic changes. To test thesetools, the authors performed a comparison experiment between 2 types of oligonucleotide-mediated gene silencing (OMGS),antisense oligonucleotides (ASOs), and short, double-stranded RNAs (siRNAs). Although similar in chemical structure, these 2methods differ in cellular mechanism of action and off-target effects. Using a library of 50 validated ASOs and siRNAs to thesame targets, the authors characterized the differential effects of these 2 technologies using a HeLa cell G2-M cell cycle assay.Although knockdown of a variety of targets by ASOs or siRNAs affected the cell cycle profile, few of those targets were affectedby both ASOs and siRNAs. Distribution analysis of population changes induced through target knockdown led to the identifi-cation of targets that, when inhibited, could affect the G2-M transition in the cell cycle in a statistically significant manner. Thedistinctly different mechanisms of action of these 2 forms of gene silencing may help define the use of these treatments in bothclinical and research environments. (Journal of Biomolecular Screening 2007:775-788)
Key words: mitosis, high-content screening, siRNA, antisense oligonucleotide, distribution analysis
© 2007 Society for Biomolecular Sciences www.sbsonline.org 775
INTRODUCTION
OLIGONUCLEOTIDE-MEDIATED GENE SILENCING (OMGS) asboth a laboratory tool and as a therapeutic concept has
advanced significantly since its initial discovery nearly 30 yearsago.1 Interest in OMGS grew as evidence accumulated that botheukaryotes and prokaryotes use this process to control cellulargene expression as well as to destroy invading viral genomicmaterial. Early OMGS reports focused on antisense oligonu-cleotides (ASO), which are small, single-stranded oligonu-cleotides that bind to mRNA through Watson-Crick base-pair hybridization. Hybridization of an ASO with the targetmRNA blocks protein synthesis through the activation of RNase
H or through steric interference of the ribosome. Initial prob-lems using ASOs in vitro and in vivo included low stability,specificity, solubility, and immune activation.2,3 Recently,modifications to the ASO structure, such as the addition of a phosphorothioate backbone and 2′-methoxyethyl-modifiedregions at the 5′ and 3′ ends, increase ASO specificity, affinity,and stability while promoting degradation by RNase H follow-ing hybridization with the target mRNA.4,5 Cancer patients inclinical trials have been treated with ASOs targeted to a varietyof gene transcripts including BCL-2, PKC-α, H-Ras, andDNMT-1.6-9 These same ASOs have also been used in combina-torial chemotherapy in conjunction with antibodies, radiation,or radical prostatectomy. A more recent prostate cancer trial ofan ASO targeting the antiapoptotic protein clusterin used lasercapture microdissection to harvest prostate cancer cells afterradical prostatectomy. The investigators demonstrated up to a90% knock down of target mRNA and protein, which correlatedto drug concentrations in the prostate.10
More recently, short, double-stranded RNA (siRNA) wasfound to suppress gene expression in Caenorhabditis elegansand that a mixture of both sense and antisense RNA is up to 10-fold more effective at gene expression knock down than eithersense or antisense RNA alone.11 Double-stranded RNAs are
1Cancer Growth and Translational Genetics and 2Genomic and MolecularInformatics, Eli Lilly and Company, Indianapolis, Indiana.3Oncology, Isis Pharmaceuticals, Carlsbad, California.*These authors contributed equally to this work.
Received Jan 30, 2007, and in revised form Mar 16, 2007. Accepted for publi-cation Apr 1, 2007.
Journal of Biomolecular Screening 12(6); 2007DOI: 10.1177/1087057107302675
processed in the cell by dimers of Dicer class III RNase, whichcleaves the double-stranded RNA into 22-nucleotide siRNAfragments that inhibit gene expression.12 Once processed byDicer, the 22-mer siRNAs interact with the RNA-induced silenc-ing complex to identify and destroy target mRNAs.13 Recently,using tissue culture and mouse xenografts, siRNAs enhancedtumor sensitivity to chemotherapeutic agents in squamous cellcarcinoma, osteosarcoma, and mammary carcinoma.14,15 Althoughpotentially a very powerful therapeutic, siRNAs have not yetbeen developed fully in the clinic and are currently used in early-stage clinical trials to combat a variety of viral infections wherefew other treatment options exist.16,17
The completion of the human genome sequencing projectand the relative ease of synthesis and use of oligonucleotidesmake OMGS an ideal technology to study loss-of-function phe-notypes in the mammalian cells. In addition, OMGS is an idealtool for testing biological function in a high-throughput settingin conjunction with the emerging technology of high-contentimaging (HCI). HCI combines the flexibility of fluorescentmicroscopy with the power of automated computerized pro-cessing and display.18 Importantly, HCI generates data at boththe well and cell level, encouraging analysis of distinct cellularpopulations found under each experimental condition. As a tool fordrug discovery, HCI is an excellent way to capture and analyzecomplex interactions and perturbations of cellular processesusing a wide variety of molecules such as small molecules andinterfering RNA.
Recent advances in HCI have made common the collectionof multiparametric data sets from high-throughput screening(HTS), but analysis of these data remains a challenge. The fewexisting statistical methods and models used to validate HCIdata across a series of experiments require extensive operatorinteraction. As HCI data become increasingly complex, analy-sis of the many parameters determining the activities of a givenmolecule will require additional tedious analysis of the data bya trained specialist. To ease this burden, we developed and val-idated informatics tools for the analysis of high-content imag-ing data and used these tools to demonstrate differences inbiological activity between 2 types of OMGS currently beingdeveloped as therapeutic agents, siRNAs and ASOs. Theseinformatics tools greatly decrease the amount of time requiredto analyze HCI data, allow a more robust statistical analysis ofcellular populations and subpopulations, and advance HCI dataanalysis in a data-driven, objective, and statistical fashion.
MATERIALS AND METHODS
Cell culture
HeLa cells (ATCC, Manassas, VA, #CCL-2) were cultured inDMEM (Invitrogen, Carlsbad, CA, #119650084) supplementedwith 10% fetal bovine serum (FBS; Invitrogen #1009-148) and 2 mM L-glutamine (Invitrogen #25030-081) and grown at 37 °Cwith 5% CO2. For the assays described below, HeLa cells were
plated onto poly-D-lysine–coated 96-well dishes (BD, FranklinLakes, NJ, #356640) at a density of 5000 cells/well in 100 µl ofmedia, as determined by a Coulter Z2 cell and particle counter.
Oligonucleotides
2′-Methoxyethyl (MOE) modified chimeric ASOs wereused throughout this study and were synthesized as previouslydescribed.19 siRNA constructs were obtained from Dharmacon(Lafayette, CO) or Ambion (Austin, TX). Between 6 and 50MOE chimeric ASOs or siRNAs were designed against eachtarget and screened to determine which were most effective atreducing target mRNA as determined by TaqMan real-timereverse transcriptase PCR (RT-PCR) analysis. The top 5 con-structs of each type were then transfected at multiple concen-trations to determine potency and maximum efficacy of theconstruct. For the screen, the MOE chimeric ASO or siRNAwith the best combination of potency and maximum efficacywas used. For follow-up studies and confirmation, the 2nd-bestconstructs of each type were also used.
Transfections and compound treatments
HeLa cells were transfected with either ASOs or siRNAs.ASOs, used at a final concentration of 66 nM, were transfectedusing the Lipofectin system (Invitrogen #18292) according to themanufacturer’s specifications. siRNAs, used at a final concentra-tion of 100 nM, were transfected using oligofectamine (Invitrogen#12252) according to the manufacturer’s specifications. Transfec-tions were performed using a Multimek-96 automated pipettor(Saigen/Beckmann, Fullerton, CA), and target knock down pro-ceeded for 48 h posttransfection at 37 °C with 5% CO2. HeLa cellswere treated with either nocodazole (Sigma, St. Louis, MO,#74151) or staurosporine (Sigma #S4400) in 0.5% DMSO for 1 or48 h at 37 °C with 5% CO2. All transfections and compound treat-ments were performed in triplicate. OMGS transfections were alsorepeated and confirmed by an additional operator.
Immunofluorescence
HeLa cells were fixed in 3.7% formaldehyde (Sigma #F-1268) for 20 min at 37 °C with 50 µl of a prewarmed solutioncontaining 11.1% formaldehyde in phosphate-buffered saline(PBS) added directly to the culture media. All following dilu-tions were performed in PBS at 25 °C. Fixative-containingmedia were removed, and each well was washed with 100 µlPBS, permeabilized with 50 µl of 0.1% Triton X-100 (Roche,Basel, Switzerland, #92522020) for 15 min at 25 °C, andwashed once with 100 µl of 25 °C PBS. Cells were blockedusing 1% bovine serum albumin (BSA; Invitrogen #15260-037) for 1 h at 25 °C. Primary antibodies against phosphory-lated histone H3 (Upstate Biolabs, Lake Placid, NY, #06-570)and cyclin B1 (BD Pharmingen #554177) were diluted in 1% BSA to a final concentration of 5 µg/ml, and 50 µl of this
Low et al.
776 www.sbsonline.org Journal of Biomolecular Screening 12(6); 2007
mixture was added to each well for 1 h at 25 °C. Each well waswashed 3 times with 200 µl of PBS and incubated for 1 h at 25 °C with a solution containing 5 µg/ml goat α-mouse-Alexa-488 (Molecular Probes, Carlsbad, CA, #A-11001), 5µg/ml goat α-rabbit-Alexa-647 (Molecular Probes #A-21244),and 200 ng/ml Hoechst 33342 (Molecular Probes #21492) in PBS. For some experiments, α-mouse-Alexa-555 (MolecularProbes #21422) and α-mouse-Alexa-647 (Molecular Probes#21236) were used against cyclin B1 (BD Pharmingen #554177).Each well was washed 3 times with 200 µl PBS and stored at 4 °C until analysis.
Fluorescent imaging and analysis
Images of the immunostained wells were captured on aCellomics Arrayscan Vti using a 10× objective fluorescent detec-tor (Cellomics, Pittsburgh, PA). Subsequent images were analyzedusing the Cellomics Target Activation BioApplication. The targetactivation algorithm identifies objects through Hoescht dye inter-action with DNA, and the relative levels and subcellular localiza-tion of cyclin B1 and phosphorylated histone H3 were determinedthrough the respective intensities and locations of Alexa-488 andAlexa-647 fluorescence. All fluorescent intensities are displayedas relative fluorescent units. For each cell, along with the intensityfrom each channel, several nuclear features were also capturedincluding total nuclear area, the ratio of the perimeter of thenucleus compared to its area, and nuclear length-to-width ratio.
Statistical analysis
Histograms were used to investigate the distributional proper-ties of various cell-level phenotypic data. Nonparametric kerneldensity estimate with Gaussian smoother was used to delineatethe distribution profile. For the variable X with the observed val-ues x1, x2, . . . , xN, the Gaussian kernel density estimate is given by
f̂ x(x) = 1 N∑i =1
φ(
x − xi
),
N λ
where the bandwidth λ is determined by Silverman’s rule-of-thumb λ = 0.9 min (σ̂, IQR/1.34)N–1/5, with σ̂ being the samplestandard deviation and IQR being the sample interquartilerange.20,21 A logarithmic transformation (base 2) was performedto avoid potential skewing of the data due to distribution errorsand to stabilize the variance of the subpopulations.22 Variabilityplots were then used to examine variation due to cell-to-cell,well-to-well, and plate-to-plate variation. Variance componentswere calculated to quantify the contribution of variation sources,and t-tests were then used to determine the statistical significanceof observed distributional differences.
RESULTS
Targeting the cell cycle regulatory machinery with smallmolecules is a prominent anticancer strategy, which we built on
to characterize a variety of phenotypic effects. A significant cellcycle checkpoint is the G2-M transition, which prevents bothchromosomal instability and mitotic catastrophe and is the tar-get for numerous anticancer agents. We developed an HCIassay using the Cellomics Arrayscan Vti to identify phenotypicchanges resulting from G2-M cell cycle arrest as identifiedthrough the expression of cyclin B1 (cyclin B) and phosphory-lated histone H3 (pHH3) at the serine-10 position, as well asthe amount of DNA as measured through Hoescht staining.Both cyclin B and pHH3 protein levels are temporally and spa-tially controlled during the cell cycle and are excellent sentinelsfor the G2-M transition. Specifically, cyclin B expression isrequired for mammalian cell mitotic entry and accumulatesbeginning in late S phase, peaks in early mitosis, and is thendramatically reduced during the metaphase/anaphase transi-tion. Histone H3 phosphorylation begins in G2, peaks in mito-sis, and is degraded upon cytokinesis. Thus, both proteins haveunique and overlapping expression patterns. Hoescht stainingof the nuclear material as the cells progressed through the cellcycle was confirmed using traditional flow cytometry andreturned results similar to those found in the HCI assay. Cellscontaining 1 copy of the nuclear material were sorted into a 2Npopulation, and cells containing 2 or more copies of the nuclearmaterial were grouped into a 4N population. The presence orabsence of the 2 protein markers, used in conjunction withchanges in DNA content and nuclear morphology, allows thedetermination of cell cycle perturbations.
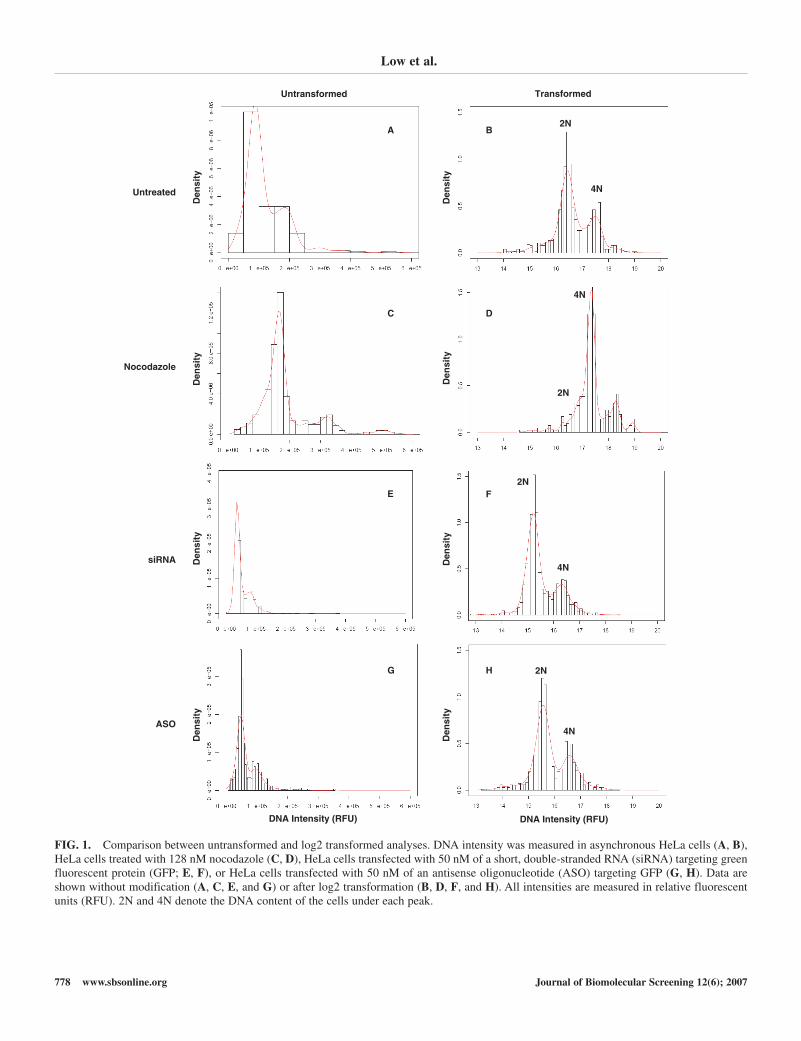
Before characterizing the effects of ASO and siRNA treat-ments using this assay, we first determined how several experi-mental conditions affected the analysis of the HeLa cell cycle.Total DNA content of HeLa cells treated for 48 h with eithernocodazole, staurosporine, or an siRNA or ASO to green fluo-rescent protein (GFP) was measured and visualized using eitheruntransformed plots (Fig. 1A, C, E, G) or after a log2 transfor-mation (Fig. 1B, D, F, H), in which the fitted curves are theGaussian kernel density estimates. The plotting of untransformeddata consistently led to a skewing of the results, making analysisof even a control population difficult. The skewing of data, asso-ciated with whole population measurements, is a common issuebetween HCI, microarray analysis, and functional magnetic res-onance imaging.22 Logarithmic transformation is a common sta-tistical technique used to stabilize population variation andeliminate skewed distributions found in data generated usingtechnologies measuring large populations.23 This transformationchanges a multiplicative scale into an additive scale and reducesthe influence of extreme values such as outliers caused by cellclumps. We chose log2 transformation due to the ease of inter-pretation, with a 2-fold increase in the raw scale correspondingto a 1 unit difference in the log2-transformed scale. Log2 transfor-mation of the data identified 2 distinct populations of cells wherepreviously these populations were less obvious. An unadjustedplot of total DNA intensity from untreated HeLa cells consisted of2 poorly defined peaks (Fig. 1A); however, transformation ofthese data generated a plot consisting of 2 well-defined peaks. In
HCI Analysis of siRNA and ASO Knockdown
Journal of Biomolecular Screening 12(6); 2007 www.sbsonline.org 777
Low et al.
778 www.sbsonline.org Journal of Biomolecular Screening 12(6); 2007
TransformedUntransformed
ASO
siRNA
Nocodazole
Untreated
DNA Intensity (RFU) DNA Intensity (RFU)
4N
4N
4N
4N
2N
2N
2N
2N
A
F
C
G
B
D
E
H
Den
sity
Den
sity
Den
sity
Den
sity
Den
sity
Den
sity
Den
sity
Den
sity
FIG. 1. Comparison between untransformed and log2 transformed analyses. DNA intensity was measured in asynchronous HeLa cells (A, B),HeLa cells treated with 128 nM nocodazole (C, D), HeLa cells transfected with 50 nM of a short, double-stranded RNA (siRNA) targeting greenfluorescent protein (GFP; E, F), or HeLa cells transfected with 50 nM of an antisense oligonucleotide (ASO) targeting GFP (G, H). Data areshown without modification (A, C, E, and G) or after log2 transformation (B, D, F, and H). All intensities are measured in relative fluorescentunits (RFU). 2N and 4N denote the DNA content of the cells under each peak.
both cases, the 1st of these peaks is composed of cells with 2NDNA content, and the 2nd smaller peak corresponds to 4N orgreater DNA content (Fig. 1B).
To confirm the robust nature of subpopulation analysis usinga log2 transformation, we tested a variety of cellular perturba-tions. As expected, the addition of nocodazole, which arrestscells in mitosis through microtubule depolymerization, alteredthe DNA intensity profile from a 2N major population and a 4Nminor population to a 4N major population with 8N and 16Nminor populations (Fig. 1C-D). Transfection of HeLa cells withan siRNA against GFP produced only minor effects on the population distribution but shifted more cells to a 2N DNA con-tent (Fig. 1E-F). Alternatively, transfection with an ASO againstGFP slightly increased the 4N or greater population of cells (Fig. 1G-H). Interestingly, these population shifts were not
observed in the presence of the transfection reagent alone and aretherefore likely siRNA or ASO off-target effects.
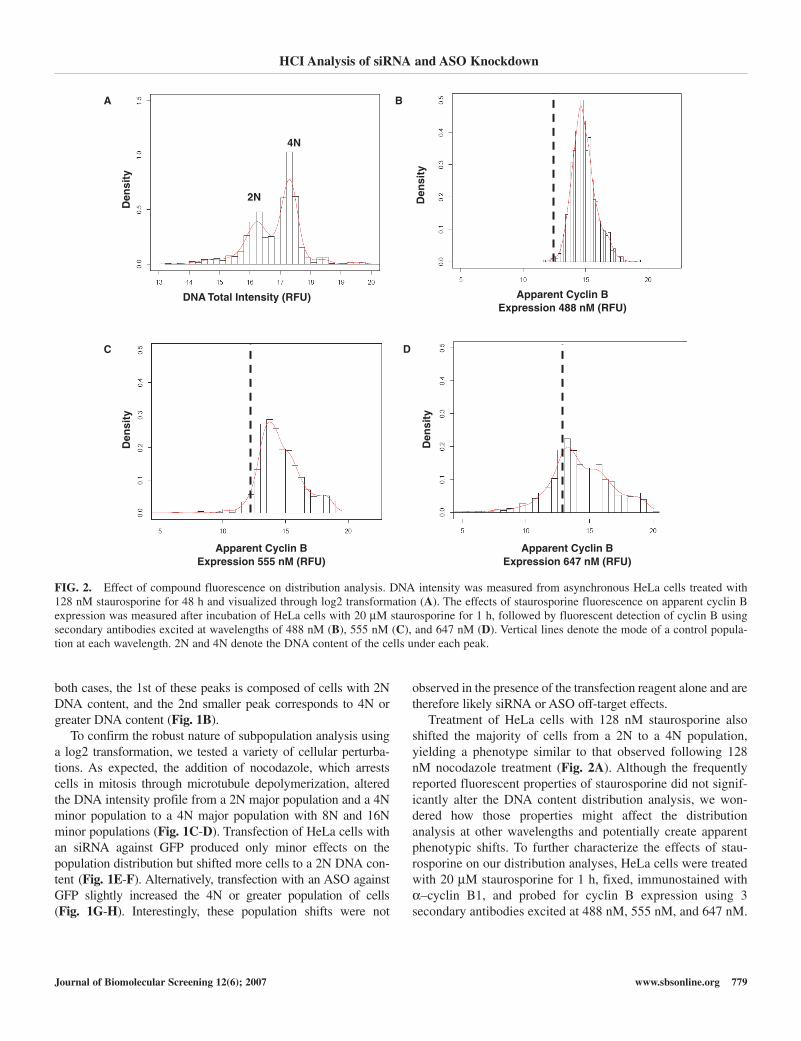
Treatment of HeLa cells with 128 nM staurosporine alsoshifted the majority of cells from a 2N to a 4N population,yielding a phenotype similar to that observed following 128nM nocodazole treatment (Fig. 2A). Although the frequentlyreported fluorescent properties of staurosporine did not signif-icantly alter the DNA content distribution analysis, we won-dered how those properties might affect the distributionanalysis at other wavelengths and potentially create apparentphenotypic shifts. To further characterize the effects of stau-rosporine on our distribution analyses, HeLa cells were treatedwith 20 µM staurosporine for 1 h, fixed, immunostained withα–cyclin B1, and probed for cyclin B expression using 3 secondary antibodies excited at 488 nM, 555 nM, and 647 nM.
HCI Analysis of siRNA and ASO Knockdown
Journal of Biomolecular Screening 12(6); 2007 www.sbsonline.org 779
DNA Total Intensity (RFU)
Den
sity
A
DC
B
Apparent Cyclin BExpression 488 nM (RFU)
Den
sity
Den
sity
Den
sity
Apparent Cyclin BExpression 647 nM (RFU)
Apparent Cyclin BExpression 555 nM (RFU)
4N
2N
FIG. 2. Effect of compound fluorescence on distribution analysis. DNA intensity was measured from asynchronous HeLa cells treated with 128 nM staurosporine for 48 h and visualized through log2 transformation (A). The effects of staurosporine fluorescence on apparent cyclin Bexpression was measured after incubation of HeLa cells with 20 µM staurosporine for 1 h, followed by fluorescent detection of cyclin B usingsecondary antibodies excited at wavelengths of 488 nM (B), 555 nM (C), and 647 nM (D). Vertical lines denote the mode of a control popula-tion at each wavelength. 2N and 4N denote the DNA content of the cells under each peak.
Compound fluorescence was subsequently measured at eachwavelength. The short incubation time with staurosporineallows the HeLa cells to take up the compound without effectson cyclin B expression. Measurement of cyclin B expression incells following fluorescent excitation at 488 nM determinedthat there was a nearly 5-fold right shift in the cyclin B peakdue to staurosporine fluorescence at this wavelength (Fig. 2B).A similar but diminished effect was noted on cells excited with555 nM light (Fig. 2C). Finally, when cyclin B expression wasquantified after excitation at 647 nM, we found that the distri-bution of the staurosporine-treated cells was similar to the dis-tribution of those treated with media alone, indicating nocompound fluorescence at this excitation wavelength (Fig. 2D).Although the fluorescent properties of compounds such as stau-rosporine affect the distribution analysis, these same properties
also allow visualization and even quantitation of cellular com-pound uptake.
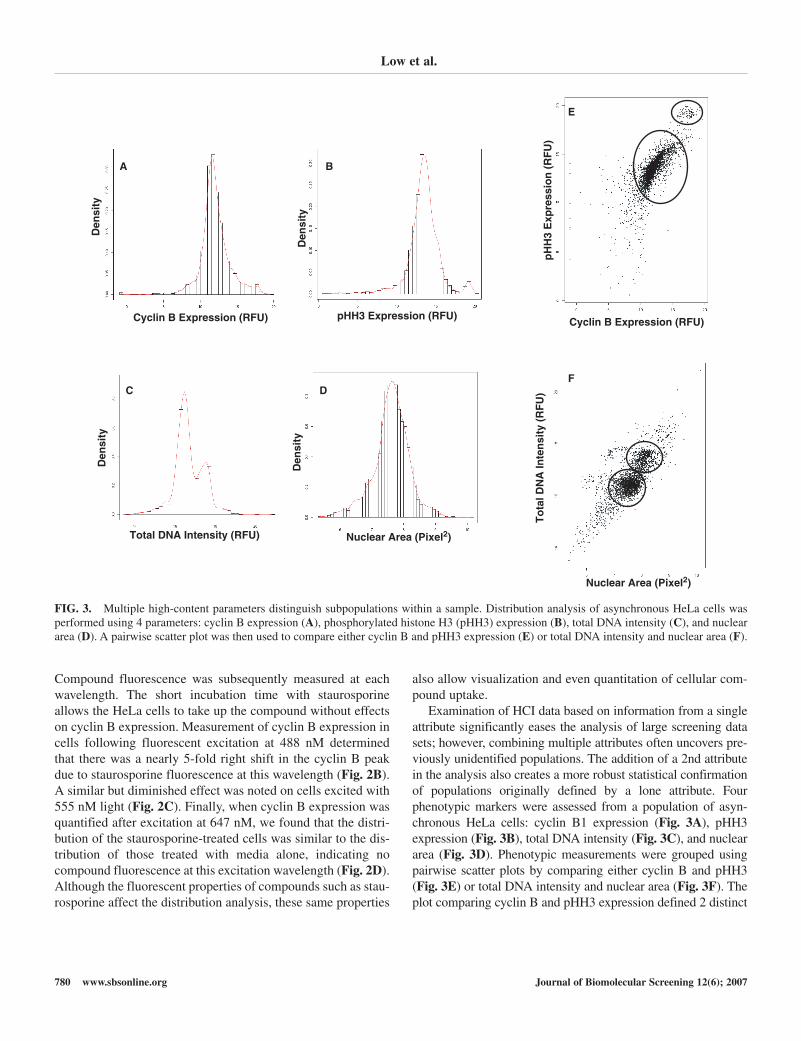
Examination of HCI data based on information from a singleattribute significantly eases the analysis of large screening datasets; however, combining multiple attributes often uncovers pre-viously unidentified populations. The addition of a 2nd attributein the analysis also creates a more robust statistical confirmationof populations originally defined by a lone attribute. Four phenotypic markers were assessed from a population of asyn-chronous HeLa cells: cyclin B1 expression (Fig. 3A), pHH3expression (Fig. 3B), total DNA intensity (Fig. 3C), and nucleararea (Fig. 3D). Phenotypic measurements were grouped usingpairwise scatter plots by comparing either cyclin B and pHH3(Fig. 3E) or total DNA intensity and nuclear area (Fig. 3F). Theplot comparing cyclin B and pHH3 expression defined 2 distinct
Low et al.
780 www.sbsonline.org Journal of Biomolecular Screening 12(6); 2007
A
F
E
DC
B
Den
sity
Den
sity
Den
sity
Cyclin B Expression (RFU) pHH3 Expression (RFU)
Total DNA Intensity (RFU) Nuclear Area (Pixel2)
Nuclear Area (Pixel2)
pH
H3
Exp
ress
ion
(R
FU
)
Cyclin B Expression (RFU)
To
tal D
NA
Inte
nsi
ty (
RF
U)
Den
sity
FIG. 3. Multiple high-content parameters distinguish subpopulations within a sample. Distribution analysis of asynchronous HeLa cells wasperformed using 4 parameters: cyclin B expression (A), phosphorylated histone H3 (pHH3) expression (B), total DNA intensity (C), and nucleararea (D). A pairwise scatter plot was then used to compare either cyclin B and pHH3 expression (E) or total DNA intensity and nuclear area (F).
populations of cells with 1 population of cells expressing highlevels of both cyclin B and pHH3, likely a mitotic population,and another population expressing reduced pHH3 and varyinglevels of cyclin B. The use of 2 attributes together robustlydefined these subpopulations, whereas either of the attributesalone led to 2 poorly distinguished clusters or even a single groupof cells. Similar patterns emerged upon examination of nucleararea and total DNA intensity (Fig. 3F). Although populationswere discerned using only total DNA intensity, the addition of anuclear area measurement further characterized the 2 discretepopulations that were otherwise less clearly defined. PairwisePearson correlations between the attributes used above demon-strate a strong correlation between nuclear area and total DNAintensity (ρ = 0.802), indicating that larger cells generally con-tain more DNA and moderate correlation between cyclin B andpHH3 expression (ρ = 0.573), signifying that although there is anoverlap in the expression of these 2 molecules during G2 andmitosis, they have distinct expression patterns.
Although HCI produces large amounts of data in a relativelyrapid fashion, efficient screening requires defined guidelines todetermine a relevant, but not excessive, population size becauseof the time necessary to obtain the data from each treatment aswell as data storage requirements. As high-content imagingbecomes more commonly used for screening, these standardsmay then be used to validate data from a wide range of experi-ments. We determined the number of data points required undereach condition to ensure the detection of a statistically stablesampling of a given population. HCI data characterizing totalDNA intensity, nuclear area, cyclin B, and pHH3 expressionwere obtained from 3 replicate 96-well plates of asynchronousHeLa cells. We captured 25 fields from each well, yielding atotal sampling of 7200 fields corresponding to 462,993 cellswith an average of 64 cells captured in each field. These datawere then pooled to determine variation at the cell, field, andplate level (Table 1). Not surprisingly, the major contributor ofvariation in this sampling occurred between the cells them-selves and accounted for more than 95% of the variationdetected in each of the 4 parameters measured.
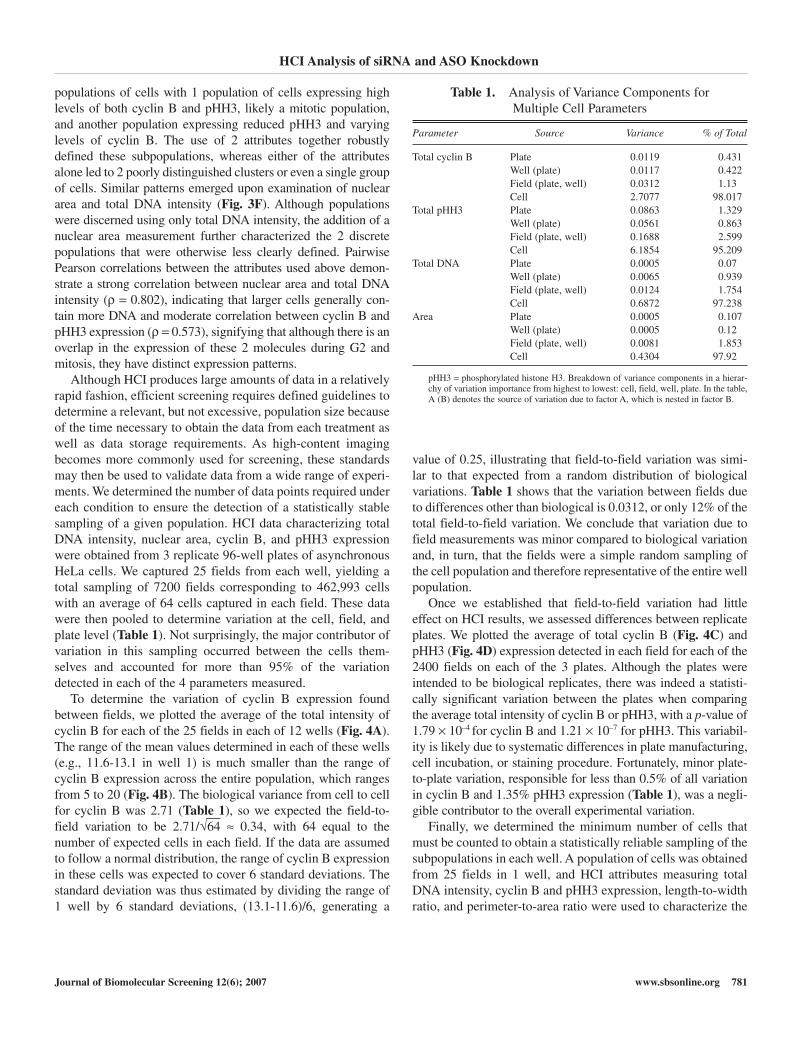
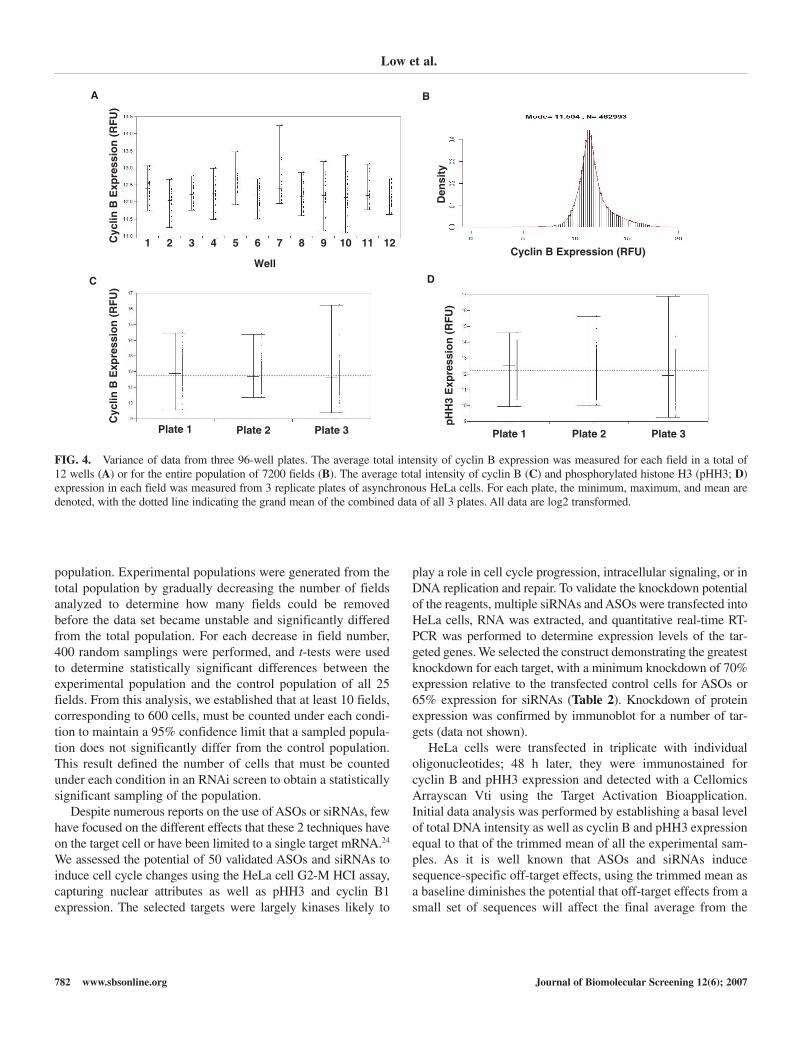
To determine the variation of cyclin B expression foundbetween fields, we plotted the average of the total intensity ofcyclin B for each of the 25 fields in each of 12 wells (Fig. 4A).The range of the mean values determined in each of these wells(e.g., 11.6-13.1 in well 1) is much smaller than the range ofcyclin B expression across the entire population, which rangesfrom 5 to 20 (Fig. 4B). The biological variance from cell to cellfor cyclin B was 2.71 (Table 1), so we expected the field-to-field variation to be 2.71/√64 ≈ 0.34, with 64 equal to thenumber of expected cells in each field. If the data are assumedto follow a normal distribution, the range of cyclin B expressionin these cells was expected to cover 6 standard deviations. Thestandard deviation was thus estimated by dividing the range of1 well by 6 standard deviations, (13.1-11.6)/6, generating a
value of 0.25, illustrating that field-to-field variation was simi-lar to that expected from a random distribution of biologicalvariations. Table 1 shows that the variation between fields dueto differences other than biological is 0.0312, or only 12% of thetotal field-to-field variation. We conclude that variation due tofield measurements was minor compared to biological variationand, in turn, that the fields were a simple random sampling ofthe cell population and therefore representative of the entire wellpopulation.
Once we established that field-to-field variation had littleeffect on HCI results, we assessed differences between replicateplates. We plotted the average of total cyclin B (Fig. 4C) andpHH3 (Fig. 4D) expression detected in each field for each of the2400 fields on each of the 3 plates. Although the plates wereintended to be biological replicates, there was indeed a statisti-cally significant variation between the plates when comparingthe average total intensity of cyclin B or pHH3, with a p-value of1.79 × 10–4 for cyclin B and 1.21 × 10⁻⁷ for pHH3. This variabil-ity is likely due to systematic differences in plate manufacturing,cell incubation, or staining procedure. Fortunately, minor plate-to-plate variation, responsible for less than 0.5% of all variationin cyclin B and 1.35% pHH3 expression (Table 1), was a negli-gible contributor to the overall experimental variation.
Finally, we determined the minimum number of cells thatmust be counted to obtain a statistically reliable sampling of thesubpopulations in each well. A population of cells was obtainedfrom 25 fields in 1 well, and HCI attributes measuring totalDNA intensity, cyclin B and pHH3 expression, length-to-widthratio, and perimeter-to-area ratio were used to characterize the
HCI Analysis of siRNA and ASO Knockdown
Journal of Biomolecular Screening 12(6); 2007 www.sbsonline.org 781
Table 1. Analysis of Variance Components for Multiple Cell Parameters
Parameter Source Variance % of Total
Total cyclin B Plate 0.0119 0.431Well (plate) 0.0117 0.422Field (plate, well) 0.0312 1.13Cell 2.7077 98.017
Total pHH3 Plate 0.0863 1.329Well (plate) 0.0561 0.863Field (plate, well) 0.1688 2.599Cell 6.1854 95.209
Total DNA Plate 0.0005 0.07Well (plate) 0.0065 0.939Field (plate, well) 0.0124 1.754Cell 0.6872 97.238
Area Plate 0.0005 0.107Well (plate) 0.0005 0.12Field (plate, well) 0.0081 1.853Cell 0.4304 97.92
pHH3 = phosphorylated histone H3. Breakdown of variance components in a hierar-chy of variation importance from highest to lowest: cell, field, well, plate. In the table,A (B) denotes the source of variation due to factor A, which is nested in factor B.
population. Experimental populations were generated from thetotal population by gradually decreasing the number of fieldsanalyzed to determine how many fields could be removedbefore the data set became unstable and significantly differedfrom the total population. For each decrease in field number,400 random samplings were performed, and t-tests were usedto determine statistically significant differences between theexperimental population and the control population of all 25fields. From this analysis, we established that at least 10 fields,corresponding to 600 cells, must be counted under each condi-tion to maintain a 95% confidence limit that a sampled popula-tion does not significantly differ from the control population.This result defined the number of cells that must be countedunder each condition in an RNAi screen to obtain a statisticallysignificant sampling of the population.
Despite numerous reports on the use of ASOs or siRNAs, fewhave focused on the different effects that these 2 techniques haveon the target cell or have been limited to a single target mRNA.24
We assessed the potential of 50 validated ASOs and siRNAs toinduce cell cycle changes using the HeLa cell G2-M HCI assay,capturing nuclear attributes as well as pHH3 and cyclin B1expression. The selected targets were largely kinases likely to
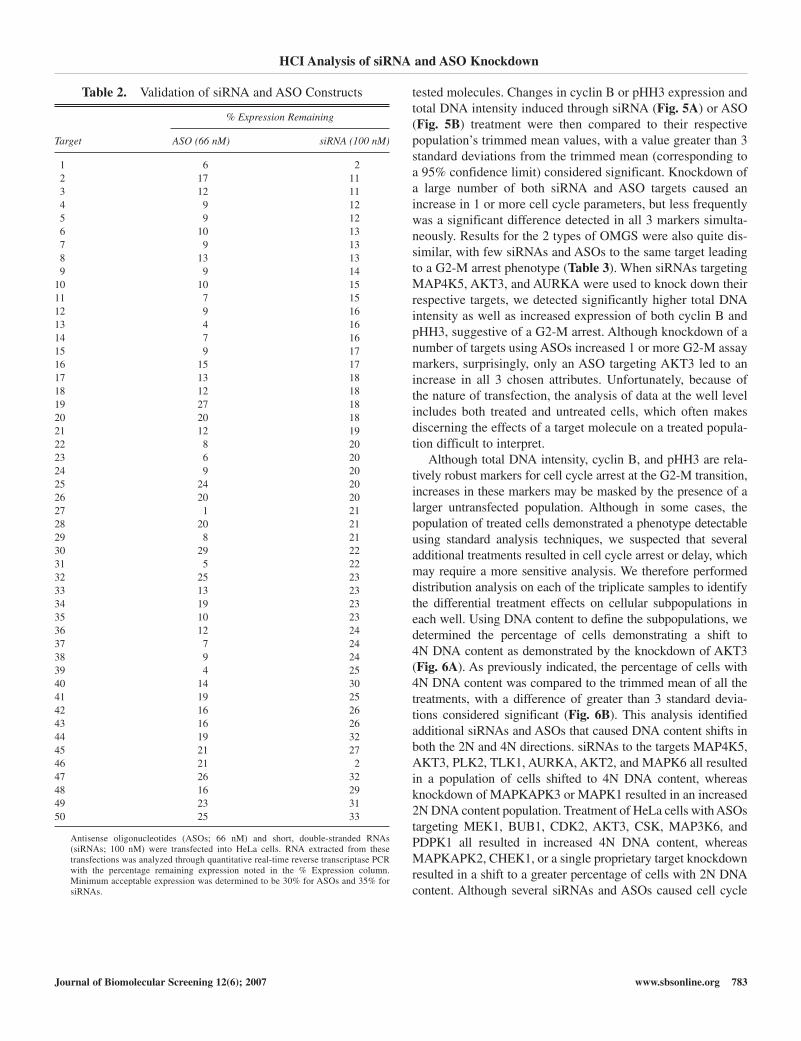
play a role in cell cycle progression, intracellular signaling, or inDNA replication and repair. To validate the knockdown potentialof the reagents, multiple siRNAs and ASOs were transfected intoHeLa cells, RNA was extracted, and quantitative real-time RT-PCR was performed to determine expression levels of the tar-geted genes. We selected the construct demonstrating the greatestknockdown for each target, with a minimum knockdown of 70%expression relative to the transfected control cells for ASOs or65% expression for siRNAs (Table 2). Knockdown of proteinexpression was confirmed by immunoblot for a number of tar-gets (data not shown).
HeLa cells were transfected in triplicate with individualoligonucleotides; 48 h later, they were immunostained forcyclin B and pHH3 expression and detected with a CellomicsArrayscan Vti using the Target Activation Bioapplication.Initial data analysis was performed by establishing a basal levelof total DNA intensity as well as cyclin B and pHH3 expressionequal to that of the trimmed mean of all the experimental sam-ples. As it is well known that ASOs and siRNAs inducesequence-specific off-target effects, using the trimmed mean asa baseline diminishes the potential that off-target effects from asmall set of sequences will affect the final average from the
Low et al.
782 www.sbsonline.org Journal of Biomolecular Screening 12(6); 2007
Cyc
lin B
Exp
ress
ion
(R
FU
)
A B
C
Cyclin B Expression (RFU)Well
Cyc
lin B
Exp
ress
ion
(R
FU
)
pH
H3
Exp
ress
ion
(R
FU
)Plate 1 Plate 2 Plate 3
D
Den
sity
1 3 4 5 6 7 8 9 10 11 122
Plate 1 Plate 2 Plate 3
FIG. 4. Variance of data from three 96-well plates. The average total intensity of cyclin B expression was measured for each field in a total of 12 wells (A) or for the entire population of 7200 fields (B). The average total intensity of cyclin B (C) and phosphorylated histone H3 (pHH3; D)expression in each field was measured from 3 replicate plates of asynchronous HeLa cells. For each plate, the minimum, maximum, and mean aredenoted, with the dotted line indicating the grand mean of the combined data of all 3 plates. All data are log2 transformed.
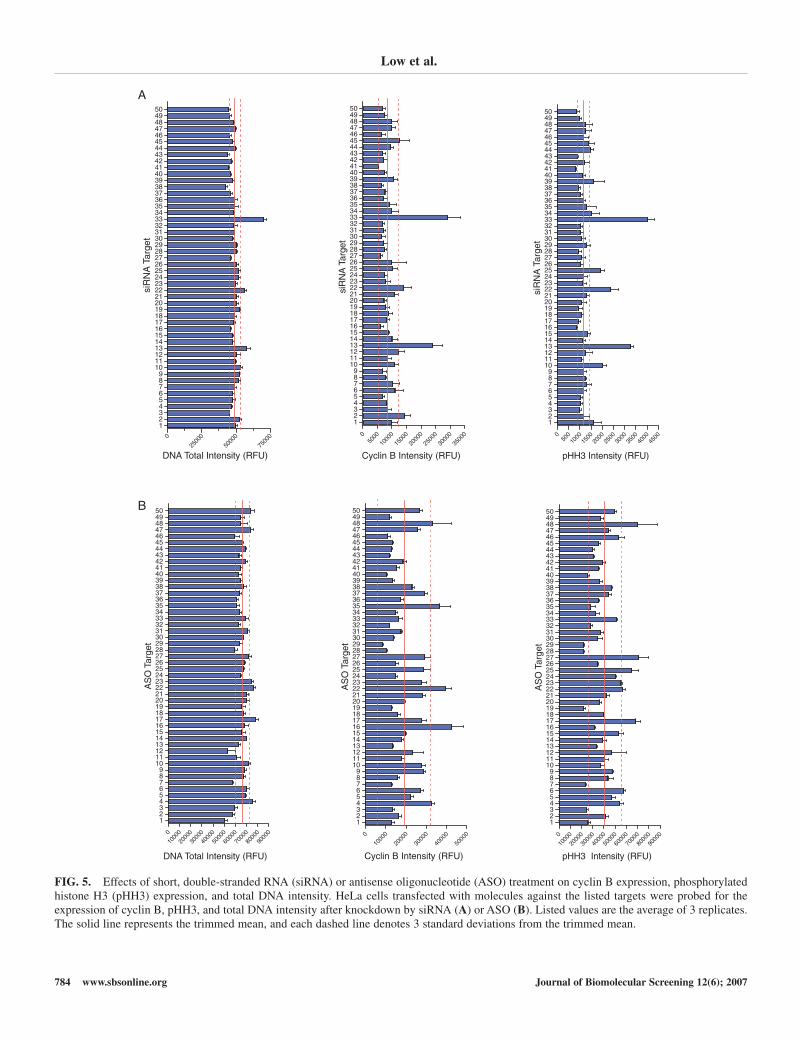
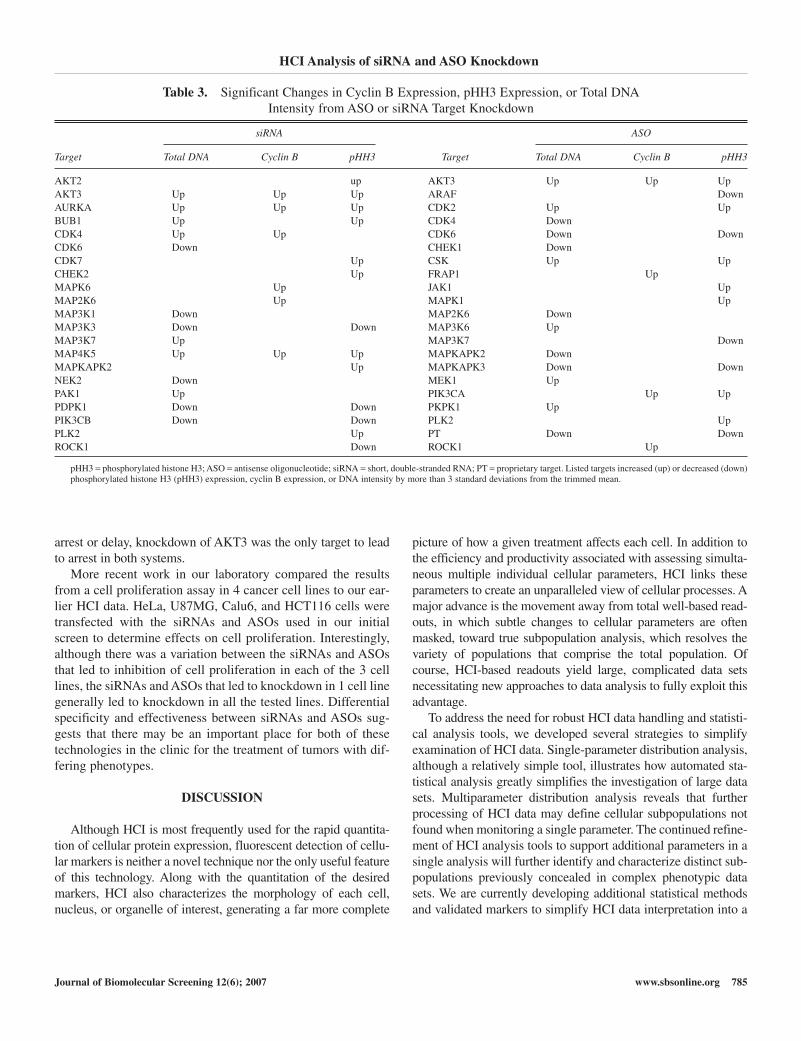
tested molecules. Changes in cyclin B or pHH3 expression andtotal DNA intensity induced through siRNA (Fig. 5A) or ASO(Fig. 5B) treatment were then compared to their respectivepopulation’s trimmed mean values, with a value greater than 3standard deviations from the trimmed mean (corresponding toa 95% confidence limit) considered significant. Knockdown ofa large number of both siRNA and ASO targets caused anincrease in 1 or more cell cycle parameters, but less frequentlywas a significant difference detected in all 3 markers simulta-neously. Results for the 2 types of OMGS were also quite dis-similar, with few siRNAs and ASOs to the same target leadingto a G2-M arrest phenotype (Table 3). When siRNAs targetingMAP4K5, AKT3, and AURKA were used to knock down theirrespective targets, we detected significantly higher total DNAintensity as well as increased expression of both cyclin B andpHH3, suggestive of a G2-M arrest. Although knockdown of anumber of targets using ASOs increased 1 or more G2-M assaymarkers, surprisingly, only an ASO targeting AKT3 led to anincrease in all 3 chosen attributes. Unfortunately, because ofthe nature of transfection, the analysis of data at the well levelincludes both treated and untreated cells, which often makesdiscerning the effects of a target molecule on a treated popula-tion difficult to interpret.
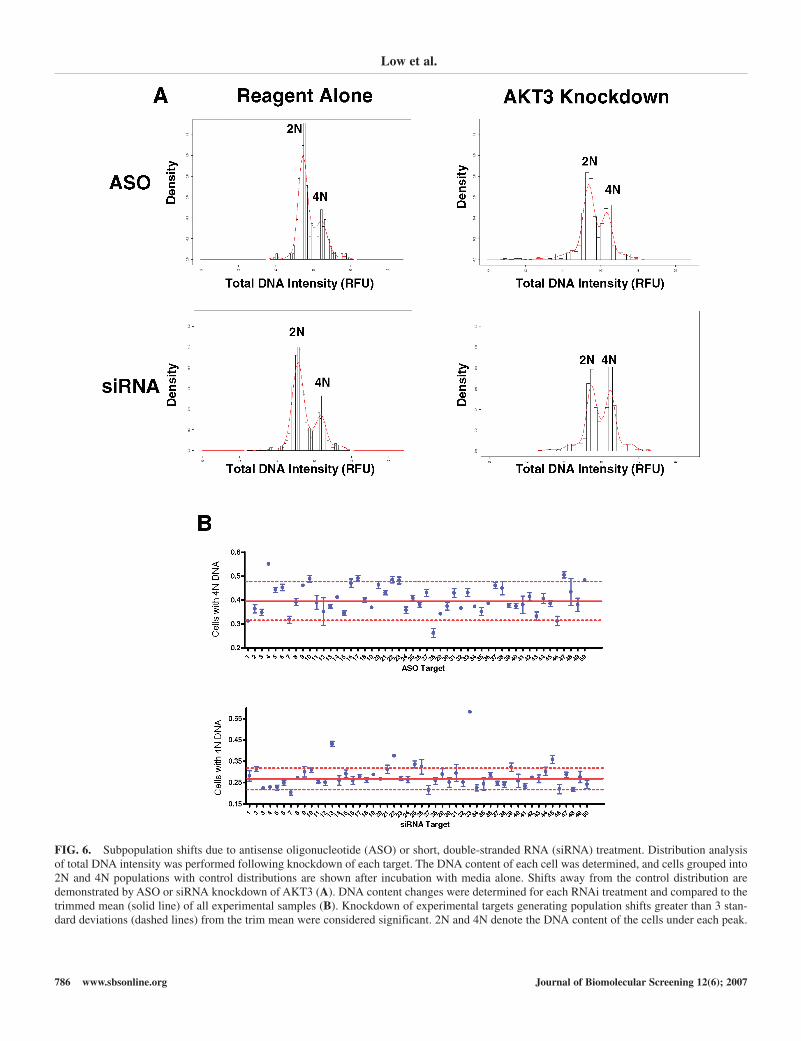
Although total DNA intensity, cyclin B, and pHH3 are rela-tively robust markers for cell cycle arrest at the G2-M transition,increases in these markers may be masked by the presence of alarger untransfected population. Although in some cases, thepopulation of treated cells demonstrated a phenotype detectableusing standard analysis techniques, we suspected that severaladditional treatments resulted in cell cycle arrest or delay, whichmay require a more sensitive analysis. We therefore performeddistribution analysis on each of the triplicate samples to identifythe differential treatment effects on cellular subpopulations ineach well. Using DNA content to define the subpopulations, wedetermined the percentage of cells demonstrating a shift to 4N DNA content as demonstrated by the knockdown of AKT3(Fig. 6A). As previously indicated, the percentage of cells with4N DNA content was compared to the trimmed mean of all thetreatments, with a difference of greater than 3 standard devia-tions considered significant (Fig. 6B). This analysis identifiedadditional siRNAs and ASOs that caused DNA content shifts inboth the 2N and 4N directions. siRNAs to the targets MAP4K5,AKT3, PLK2, TLK1, AURKA, AKT2, and MAPK6 all resultedin a population of cells shifted to 4N DNA content, whereasknockdown of MAPKAPK3 or MAPK1 resulted in an increased2N DNA content population. Treatment of HeLa cells with ASOstargeting MEK1, BUB1, CDK2, AKT3, CSK, MAP3K6, andPDPK1 all resulted in increased 4N DNA content, whereasMAPKAPK2, CHEK1, or a single proprietary target knockdownresulted in a shift to a greater percentage of cells with 2N DNAcontent. Although several siRNAs and ASOs caused cell cycle
HCI Analysis of siRNA and ASO Knockdown
Journal of Biomolecular Screening 12(6); 2007 www.sbsonline.org 783
Table 2. Validation of siRNA and ASO Constructs
% Expression Remaining
Target ASO (66 nM) siRNA (100 nM)
1 6 22 17 113 12 114 9 125 9 126 10 137 9 138 13 139 9 14
10 10 1511 7 1512 9 1613 4 1614 7 1615 9 1716 15 1717 13 1818 12 1819 27 1820 20 1821 12 1922 8 2023 6 2024 9 2025 24 2026 20 2027 1 2128 20 2129 8 2130 29 2231 5 2232 25 2333 13 2334 19 2335 10 2336 12 2437 7 2438 9 2439 4 2540 14 3041 19 2542 16 2643 16 2644 19 3245 21 2746 21 247 26 3248 16 2949 23 3150 25 33
Antisense oligonucleotides (ASOs; 66 nM) and short, double-stranded RNAs(siRNAs; 100 nM) were transfected into HeLa cells. RNA extracted from thesetransfections was analyzed through quantitative real-time reverse transcriptase PCRwith the percentage remaining expression noted in the % Expression column.Minimum acceptable expression was determined to be 30% for ASOs and 35% forsiRNAs.
Low et al.
784 www.sbsonline.org Journal of Biomolecular Screening 12(6); 2007
0
1000
0
2000
0
3000
0
4000
0
5000
0
6000
0
7000
0
8000
0
9000
0
123456789
1011121314151617181920212223242526272829303132333435363738394041424344454647484950
DNA Total Intensity (RFU)
AS
O T
arge
t
0
1000
0
2000
0
3000
0
4000
0
5000
0
123456789
1011121314151617181920212223242526272829303132333435363738394041424344454647484950
Cyclin B Intensity (RFU)
AS
O T
arge
t
0
1000
0
2000
0
3000
0
4000
0
5000
0
6000
0
7000
0
8000
0
9000
0
123456789
1011121314151617181920212223242526272829303132333435363738394041424344454647484950
pHH3 Intensity (RFU)
AS
O T
arge
t
0
2500
0
5000
0
7500
0
123456789
1011121314151617181920212223242526272829303132333435363738394041424344454647484950
DNA Total Intensity (RFU)
siR
NA
Tar
get
050
00
1000
0
1500
0
2000
0
2500
0
3000
0
3500
0
123456789
1011121314151617181920212223242526272829303132333435363738394041424344454647484950
Cyclin B Intensity (RFU)
siR
NA
Tar
get
050
010
0015
0020
0025
0030
0035
0040
0045
00
123456789
1011121314151617181920212223242526272829303132333435363738394041424344454647484950
pHH3 Intensity (RFU)
siR
NA
Tar
get
A
B
FIG. 5. Effects of short, double-stranded RNA (siRNA) or antisense oligonucleotide (ASO) treatment on cyclin B expression, phosphorylatedhistone H3 (pHH3) expression, and total DNA intensity. HeLa cells transfected with molecules against the listed targets were probed for theexpression of cyclin B, pHH3, and total DNA intensity after knockdown by siRNA (A) or ASO (B). Listed values are the average of 3 replicates.The solid line represents the trimmed mean, and each dashed line denotes 3 standard deviations from the trimmed mean.
arrest or delay, knockdown of AKT3 was the only target to leadto arrest in both systems.
More recent work in our laboratory compared the resultsfrom a cell proliferation assay in 4 cancer cell lines to our ear-lier HCI data. HeLa, U87MG, Calu6, and HCT116 cells weretransfected with the siRNAs and ASOs used in our initialscreen to determine effects on cell proliferation. Interestingly,although there was a variation between the siRNAs and ASOsthat led to inhibition of cell proliferation in each of the 3 celllines, the siRNAs and ASOs that led to knockdown in 1 cell linegenerally led to knockdown in all the tested lines. Differentialspecificity and effectiveness between siRNAs and ASOs sug-gests that there may be an important place for both of thesetechnologies in the clinic for the treatment of tumors with dif-fering phenotypes.
DISCUSSION
Although HCI is most frequently used for the rapid quantita-tion of cellular protein expression, fluorescent detection of cellu-lar markers is neither a novel technique nor the only useful featureof this technology. Along with the quantitation of the desiredmarkers, HCI also characterizes the morphology of each cell,nucleus, or organelle of interest, generating a far more complete
picture of how a given treatment affects each cell. In addition tothe efficiency and productivity associated with assessing simulta-neous multiple individual cellular parameters, HCI links theseparameters to create an unparalleled view of cellular processes. Amajor advance is the movement away from total well-based read-outs, in which subtle changes to cellular parameters are oftenmasked, toward true subpopulation analysis, which resolves thevariety of populations that comprise the total population. Ofcourse, HCI-based readouts yield large, complicated data setsnecessitating new approaches to data analysis to fully exploit thisadvantage.
To address the need for robust HCI data handling and statisti-cal analysis tools, we developed several strategies to simplifyexamination of HCI data. Single-parameter distribution analysis,although a relatively simple tool, illustrates how automated sta-tistical analysis greatly simplifies the investigation of large datasets. Multiparameter distribution analysis reveals that furtherprocessing of HCI data may define cellular subpopulations notfound when monitoring a single parameter. The continued refine-ment of HCI analysis tools to support additional parameters in asingle analysis will further identify and characterize distinct sub-populations previously concealed in complex phenotypic datasets. We are currently developing additional statistical methodsand validated markers to simplify HCI data interpretation into a
HCI Analysis of siRNA and ASO Knockdown
Journal of Biomolecular Screening 12(6); 2007 www.sbsonline.org 785
Table 3. Significant Changes in Cyclin B Expression, pHH3 Expression, or Total DNA Intensity from ASO or siRNA Target Knockdown
siRNA ASO
Target Total DNA Cyclin B pHH3 Target Total DNA Cyclin B pHH3
AKT2 up AKT3 Up Up UpAKT3 Up Up Up ARAF DownAURKA Up Up Up CDK2 Up UpBUB1 Up Up CDK4 DownCDK4 Up Up CDK6 Down DownCDK6 Down CHEK1 DownCDK7 Up CSK Up UpCHEK2 Up FRAP1 UpMAPK6 Up JAK1 UpMAP2K6 Up MAPK1 UpMAP3K1 Down MAP2K6 DownMAP3K3 Down Down MAP3K6 UpMAP3K7 Up MAP3K7 DownMAP4K5 Up Up Up MAPKAPK2 DownMAPKAPK2 Up MAPKAPK3 Down DownNEK2 Down MEK1 UpPAK1 Up PIK3CA Up UpPDPK1 Down Down PKPK1 UpPIK3CB Down Down PLK2 UpPLK2 Up PT Down DownROCK1 Down ROCK1 Up
pHH3 = phosphorylated histone H3; ASO = antisense oligonucleotide; siRNA = short, double-stranded RNA; PT = proprietary target. Listed targets increased (up) or decreased (down)phosphorylated histone H3 (pHH3) expression, cyclin B expression, or DNA intensity by more than 3 standard deviations from the trimmed mean.
Low et al.
786 www.sbsonline.org Journal of Biomolecular Screening 12(6); 2007
FIG. 6. Subpopulation shifts due to antisense oligonucleotide (ASO) or short, double-stranded RNA (siRNA) treatment. Distribution analysisof total DNA intensity was performed following knockdown of each target. The DNA content of each cell was determined, and cells grouped into2N and 4N populations with control distributions are shown after incubation with media alone. Shifts away from the control distribution aredemonstrated by ASO or siRNA knockdown of AKT3 (A). DNA content changes were determined for each RNAi treatment and compared to thetrimmed mean (solid line) of all experimental samples (B). Knockdown of experimental targets generating population shifts greater than 3 stan-dard deviations (dashed lines) from the trim mean were considered significant. 2N and 4N denote the DNA content of the cells under each peak.
format that can quickly and easily be examined to identify dis-tinct biological effects that would otherwise be masked.
When analyzing data from assays in which only a subpopula-tion of cells is affected because of transfection efficiency, it iscrucial to define appropriate markers and identification criteria todetermine treatment effects. In this assay, we found that althougha variety of cell cycle markers led to differing conclusions, thecritical phenotype of arrest at G2-M was a shift in the populationof cells from 2N to 4N DNA content. Distribution analysis ofHCI data, in conjunction with the use of stringent cutoffs,defined significant changes in the populations of treated anduntreated cells. As well as being an excellent marker for anarrested cell phenotype, these changes to DNA content facilitatethe screening of large numbers of samples relatively quickly in ahigh-throughput setting.
Although improved assays decrease the time required toobtain results from a single experiment, the sampling used in thescreen can itself be made more efficient. For HCI to becomeincreasingly relevant as screening technology evolves, it is necessary to obtain a sampling that is statistically significant but not overly cumbersome. We determined that, in general,each field captured using HCI represents a random sampling of a population, that variability between replicate plates is negligible, and that quantitation of data from 600 cells is an ideal number to retain significant population sampling.Streamlining the discovery process simplifies the screening oflarge-compound and oligonucleotide libraries, facilitating effi-cient detection of novel phenotypes and targets.
Both ASOs and siRNAs are potential therapeutic agents, buttheir differential effects on gene knockdown remain poorly char-acterized. Although siRNA treatment has increasingly becomethe technique of choice for transient knockdown of a cellular tar-get, ASOs have been in use significantly longer and have thus pro-gressed further into clinical trials, with 1 drug already approved.25
Stability and toxicity of ASOs have been largely ameliorated with 2 structural changes: phosphorothioate backbones and 2′-sugar modifications at the 5′ and 3′ ends. Phosphorothioate link-ages lead to increased resistance to endonuclease digestion andbetter plasma protein binding, allowing for distribution to a variety of tissues after systemic dosing, whereas the addition of2′-methoxyethyl-modified regions increase affinity for targetmRNA, nuclease resistance, tissue uptake, and half-life. TheASOs used in this report were chimeric in nature, containing 2′ methoxyethyl-modified sugars in the 5′ and 3′ regions as wellas a central section of deoxyribose. In the future, 1 or more ofthese molecule classes may be used in clinical combinatorial ther-apy, and it is therefore critical to understand how each of thesemolecules interacts with the machinery of the host cell to affectboth target knockdown and phenotypic effects.
Using a variety of techniques, we determined that bothsiRNAs and ASOs knocked down a number of cellular factorssignificantly enough to perturb normal cell cycle function.Surprisingly, however, there was little correlation between the 2
forms of OMGS with the sole exception of AKT3, whose knock-down led to an increase in 4N DNA content, cyclin B expression,and pHH3 expression in both systems. Some of the disparityfound between these 2 technologies may be due to differences inthe target knockdown efficiency or the different mechanisms ofaction used by the 2 technologies and their attendant off-targeteffects. Interestingly, we have found that virally expressed shorthairpin RNA (shRNA) against the same active targets indicates abetter correlation with the siRNA data than with the ASO data(data not shown). This correlation may indicate that RNA-basedknockdown methods are more robust or may be due to the simi-lar mechanism of action used by shRNA and siRNA. The differ-ential effects of ASOs and siRNAs may play a role as treatmentsadvance through clinical trials. One OMGS treatment type oranother may lead to an improved clinical outcome depending onthe cellular target or the treatment used in conjunction with tar-get knockdown.
ACKNOWLEDGMENTS
We thank Dr. Mark Uhlik, the members of the StancatoLaboratory, and the Lilly high-content imaging statistics andinformatics team for helpful discussions and advice.
REFERENCES
1. Zamecnik PC, Stephenson ML: Inhibition of Rous sarcoma virus replica-tion and cell transformation by a specific oligodeoxynucleotide. Proc NatlAcad Sci U S A 1978;75(1):280-284.
2. Jansen B, Wacheck V, Heere-Ress E, Schlagbauer-Wadl H, Hoeller C,Lucas T, et al: Chemosensitisation of malignant melanoma by BCL2 anti-sense therapy. Lancet 2000;356(9243):1728-1733.
3. Gewirtz AM: Oligonucleotide therapeutics: a step forward. J Clin Oncol2000;18(9):1809-1811.
4. Monia BP, Lesnik EA, Gonzalez C, Lima WF, McGee D, Guinosso CJ,et al: Evaluation of 2′-modified oligonucleotides containing 2′-deoxy gapsas antisense inhibitors of gene expression. J Biol Chem 1993;268(19):14514-14522.
5. Braasch DA, Corey DR: Novel antisense and peptide nucleic acid strategiesfor controlling gene expression. Biochemistry 2002;41(14):4503-4510.
6. Davis AJ, Gelmon KA, Siu LL, Moore MJ, Britten CD, Mistry N, et al:Phase I and pharmacologic study of the human DNA methyltransferaseantisense oligodeoxynucleotide MG98 given as a 21-day continuous infu-sion every 4 weeks. Invest New Drugs 2003;21(1):85-97.
7. Adjei AA, Dy GK, Erlichman C, Reid JM, Sloan JA, Pitot HC, et al: Aphase I trial of ISIS 2503, an antisense inhibitor of H-ras, in combinationwith gemcitabine in patients with advanced cancer. Clin Cancer Res2003;9(1):115-123.
8. Bartholomeusz C, Itamochi H, Yuan LX, Esteva FJ, Wood CG, Terakawa N,et al: Bcl-2 antisense oligonucleotide overcomes resistance to E1A gene ther-apy in a low HER2-expressing ovarian cancer xenograft model. Cancer Res2005;65(18):8406-8413.
9. Marshall JL, Eisenberg SG, Johnson MD, Hanfelt J, Dorr FA, El-Ashry D,et al: A phase II trial of ISIS 3521 in patients with metastatic colorectal can-cer. Clin Colorectal Cancer 2004;4(4):268-274.
HCI Analysis of siRNA and ASO Knockdown
Journal of Biomolecular Screening 12(6); 2007 www.sbsonline.org 787
10. Chi KN, Eisenhauer E, Fazli L, Jones EC, Goldenberg SL, Powers J, et al:A phase I pharmacokinetic and pharmacodynamic study of OGX-011, a 2′-methoxyethyl antisense oligonucleotide to clusterin, in patients with local-ized prostate cancer. J Natl Cancer Inst 2005;97(17):1287-1296.
11. Fire A, Xu S, Montgomery MK, Kostas SA, Driver SE, Mello CC: Potent andspecific genetic interference by double-stranded RNA in Caenorhabditis ele-gans. Nature 1998;391(6669):806-811.
12. Bernstein E, Caudy AA, Hammond SM, Hannon GJ: Role for a bidentateribonuclease in the initiation step of RNA interference. Nature 2001;409(6818):363-366.
13. Hammond SM, Bernstein E, Beach D, Hannon GJ: An RNA-directednuclease mediates post-transcriptional gene silencing in Drosophila cells.Nature 2000;404(6775):293-296.
14. Spee B, Jonkers MD, Arends B, Rutteman GR, Rothuizen J, Penning LC:Specific down-regulation of XIAP with RNA interference enhances thesensitivity of canine tumor cell-lines to TRAIL and doxorubicin. MolCancer 2006;5:34.
15. Nozawa H, Tadakuma T, Ono T, Sato M, Hiroi S, Masumoto K, et al: Smallinterfering RNA targeting epidermal growth factor receptor enhanceschemosensitivity to cisplatin, 5-fluorouracil and docetaxel in head and necksquamous cell carcinoma. Cancer Sci 2006;97(10):1115-1124.
16. Barik S, Bitko V: Prospects of RNA interference therapy in respiratory viraldiseases: update 2006. Expert Opin Biol Ther 2006;6(11):1151-1160.
17. Shen J, Samul R, Silva RL, Akiyama H, Liu H, Saishin Y, et al: Suppressionof ocular neovascularization with siRNA targeting VEGF receptor 1. GeneTher 2005;13(3):225-234.
18. Giuliano KA, Haskins JR, Taylor DL: Advances in high content screen-ing for drug discovery. Assay Drug Dev Technol 2003;1(4):565-577.
19. Bennett CF, Cowsert LM. Antisense oligonucleotides as a tool for genefunctionalization and target validation. Biochim Biophys Acta 1999;1489(1):19-30.
20. Silverman BW. Density Estimation for Statistics and Data Analysis.London: Chapman & Hall/CRC, 1986.
21. Venables WN, Ripley BD: Modern Applied Statistics with S. New York:Springer, 2002.
22. Ghosh RN, Grove L, Lapets O: A quantitative cell-based high-contentscreening assay for the epidermal growth factor receptor-specific activa-tion of mitogen-activated protein kinase. Assay Drug Dev Technol 2004;2(5):473-481.
23. Montgomery DC: Design and Analysis of Experiments. New York:John Wiley & Sons, 1997.
24. Bilanges B, Stokoe D: Direct comparison of the specificity of genesilencing using antisense oligonucleotides and RNAi. Biochem J 2005;388(pt 2):573-583.
25. Holmlund JT. Applying antisense technology: Affinitak and other anti-sense oligonucleotides in clinical development. Ann N Y Acad Sci 2003;1002:244-251.
Address correspondence to:Louis Stancato
Lilly Corporate CenterBldg 98C, DC0434
Indianapolis, IN 46285
E-mail: [email protected]
Low et al.
788 www.sbsonline.org Journal of Biomolecular Screening 12(6); 2007
Copyright © 2022 FDOKUMEN