HemaBook Chapter 1-18 - Mindray
69
HemaBook Discover the latest clinical applications and technologies about Mindray hematology
-
Upload
khangminh22 -
Category
Documents
-
view
0 -
download
0
Transcript of HemaBook Chapter 1-18 - Mindray

HemaBookDiscover the latest clinical applications and
technologies about Mindray hematology
Content
Chapter 1
The Stories of Platelet Clump03
Chapter 2
One More Option to Solve EDTA-PTCP?07
Chapter 3Low Value? High Risk?Resolve Your Concerns about the Risk of Low-value Platelet Measurements
10
Chapter 4
Is Platelet Transfusion Always Required in Thrombocytopenia?13
Chapter 5
How Mindray Counts Low Platelets Correctly16
Chapter 6
Mindray’s Solution for Solving In-vitro PLT Aggregation19
Chapter 7
How D-dimer in Coagulation Correlates with COVID-19?23
Chapter 8
Have You Noticed the Changes of Red Blood Cells in COVID-19?28
Chapter 9
How Does Eosinophil Count Change in COVID-19 Patients?33
Chapter 10
How Does a Digital Morphology System Help Labs to Optimize Their Work�ow?36
Platelet Series
COVID-19 Series
Morphology Series
Content
Chapter 11
A ‘Sherlock Holmes’ Helps You to Capture the Culprit of Diseases39
Chapter 12
A Clearer Truth? Find it Faster!42
Chapter 14
Quick Facts About Erythrocyte Sedimentation Rate (ESR) Part A49
Chapter 13
Capture the truth about cell morphology45
Chapter 15
Applications of CBC, ESR and CRP Analysis, Part B52
Chapter 16
World Malaria Day: Where do you �nd maurer pigments?58
Chapter 17
The clinical signi�cance of all-in-one CBC and ESR analysis, Part C61
Chapter 18
PLT-H: A new parameter for accurate platelet counting with anti-interference ability63
The Stories of Platelet Clump
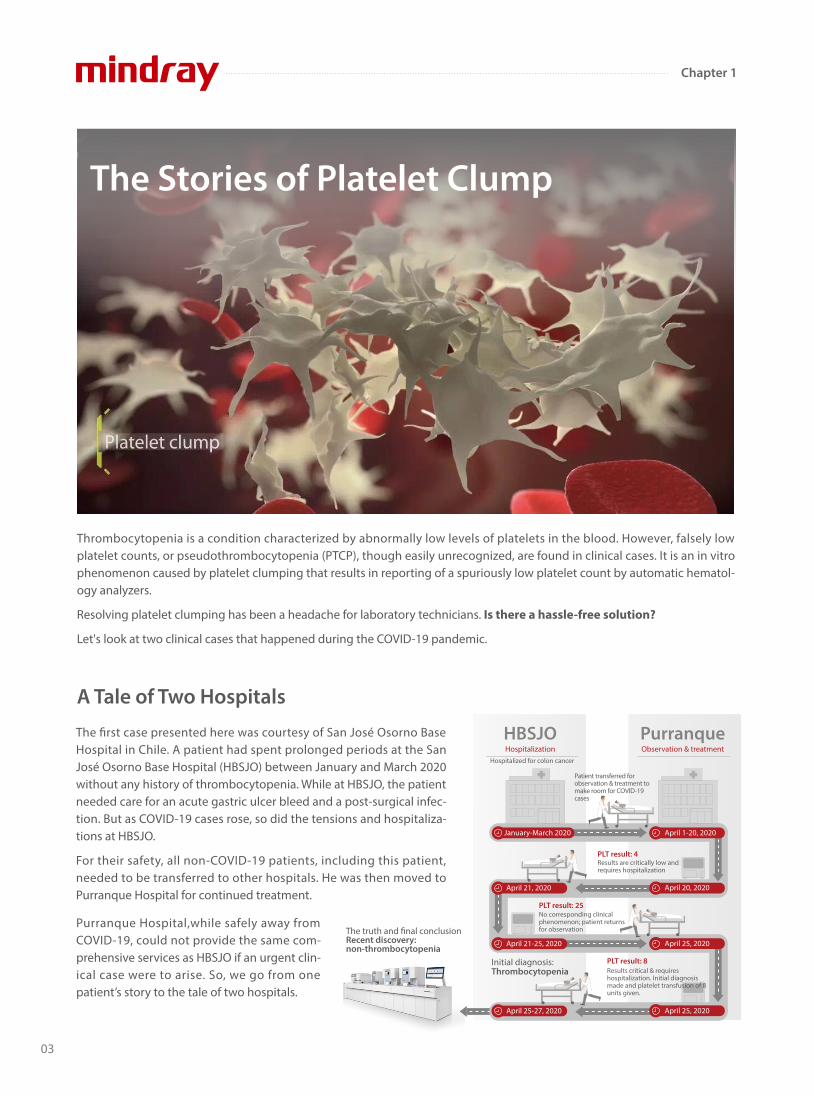
Thrombocytopenia is a condition characterized by abnormally low levels of platelets in the blood. However, falsely low platelet counts, or pseudothrombocytopenia (PTCP), though easily unrecognized, are found in clinical cases. It is an in vitro phenomenon caused by platelet clumping that results in reporting of a spuriously low platelet count by automatic hematol-ogy analyzers.
Resolving platelet clumping has been a headache for laboratory technicians. Is there a hassle-free solution?
Let's look at two clinical cases that happened during the COVID-19 pandemic.
The �rst case presented here was courtesy of San José Osorno Base Hospital in Chile. A patient had spent prolonged periods at the San José Osorno Base Hospital (HBSJO) between January and March 2020 without any history of thrombocytopenia. While at HBSJO, the patient needed care for an acute gastric ulcer bleed and a post-surgical infec-tion. But as COVID-19 cases rose, so did the tensions and hospitaliza-tions at HBSJO. For their safety, all non-COVID-19 patients, including this patient, needed to be transferred to other hospitals. He was then moved to Purranque Hospital for continued treatment.
A Tale of Two Hospitals
HBSJOHospitalization
PurranqueObservation & treatment
January-March 2020
April 21, 2020
April 21-25, 2020
April 25-27, 2020
April 1-20, 2020
April 20, 2020
April 25, 2020
April 25, 2020
Initial diagnosis: Thrombocytopenia
The truth and �nal conclusionRecent discovery: non-thrombocytopenia
PLT result: 4
PLT result: 8
PLT result: 25
Patient transferred for observation & treatment to make room for COVID-19 cases
Results are critically low and requires hospitalization
Results critical & requires hospitalization. Initial diagnosis made and platelet transfusion of 8 units given.
No corresponding clinical phenomenon; patient returns for observation
Hospitalized for colon cancer
Purranque Hospital,while safely away from COVID-19, could not provide the same com-prehensive services as HBSJO if an urgent clin-ical case were to arise. So, we go from one patient’s story to the tale of two hospitals.
03
Chapter 1
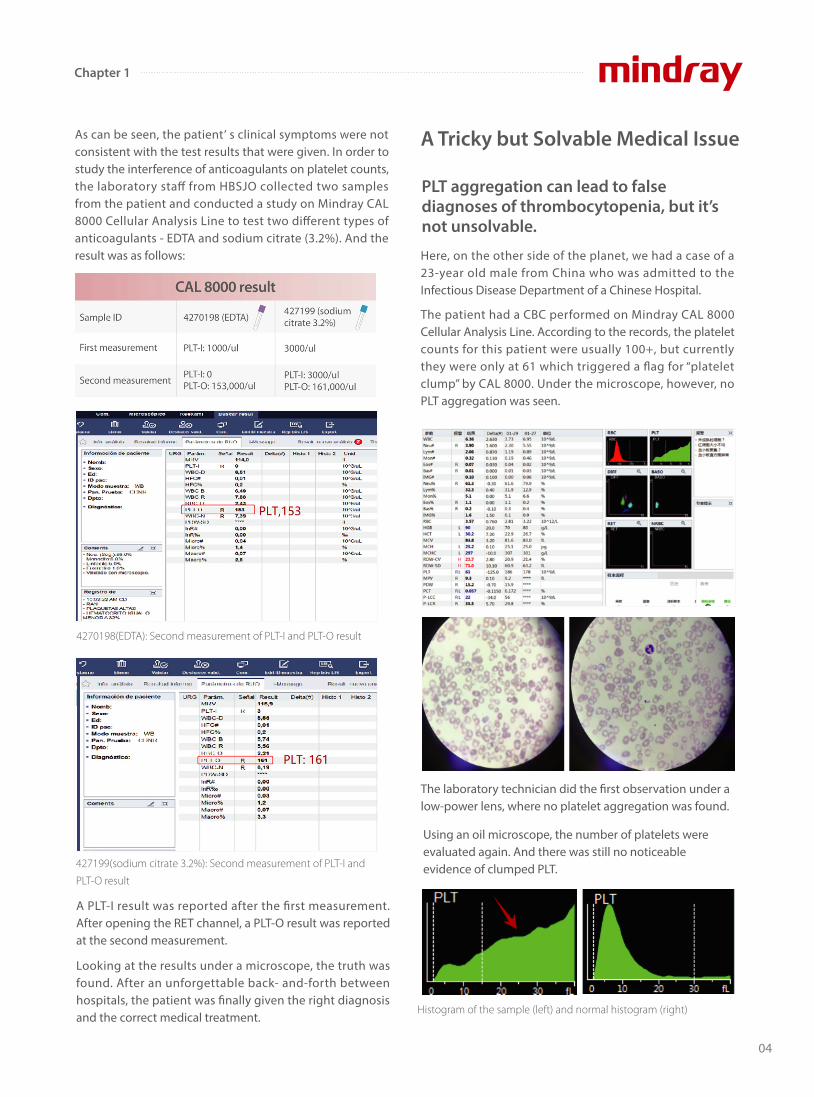
As can be seen, the patient’ s clinical symptoms were not consistent with the test results that were given. In order to study the interference of anticoagulants on platelet counts, the laboratory sta� from HBSJO collected two samples from the patient and conducted a study on Mindray CAL 8000 Cellular Analysis Line to test two di�erent types of anticoagulants - EDTA and sodium citrate (3.2%). And the result was as follows: Here, on the other side of the planet, we had a case of a
23-year old male from China who was admitted to the Infectious Disease Department of a Chinese Hospital.
The patient had a CBC performed on Mindray CAL 8000 Cellular Analysis Line. According to the records, the platelet counts for this patient were usually 100+, but currently they were only at 61 which triggered a �ag for “platelet clump” by CAL 8000. Under the microscope, however, no PLT aggregation was seen.
PLT aggregation can lead to false diagnoses of thrombocytopenia, but it’s not unsolvable.
A PLT-I result was reported after the �rst measurement. After opening the RET channel, a PLT-O result was reported at the second measurement.
Looking at the results under a microscope, the truth was found. After an unforgettable back- and-forth between hospitals, the patient was �nally given the right diagnosis and the correct medical treatment.
A Tricky but Solvable Medical Issue
4270198(EDTA): Second measurement of PLT-I and PLT-O result
427199(sodium citrate 3.2%): Second measurement of PLT-I and
PLT-O result
Histogram of the sample (left) and normal histogram (right)
The laboratory technician did the �rst observation under a low-power lens, where no platelet aggregation was found.
Using an oil microscope, the number of platelets were evaluated again. And there was still no noticeable evidence of clumped PLT.
04
Chapter 1
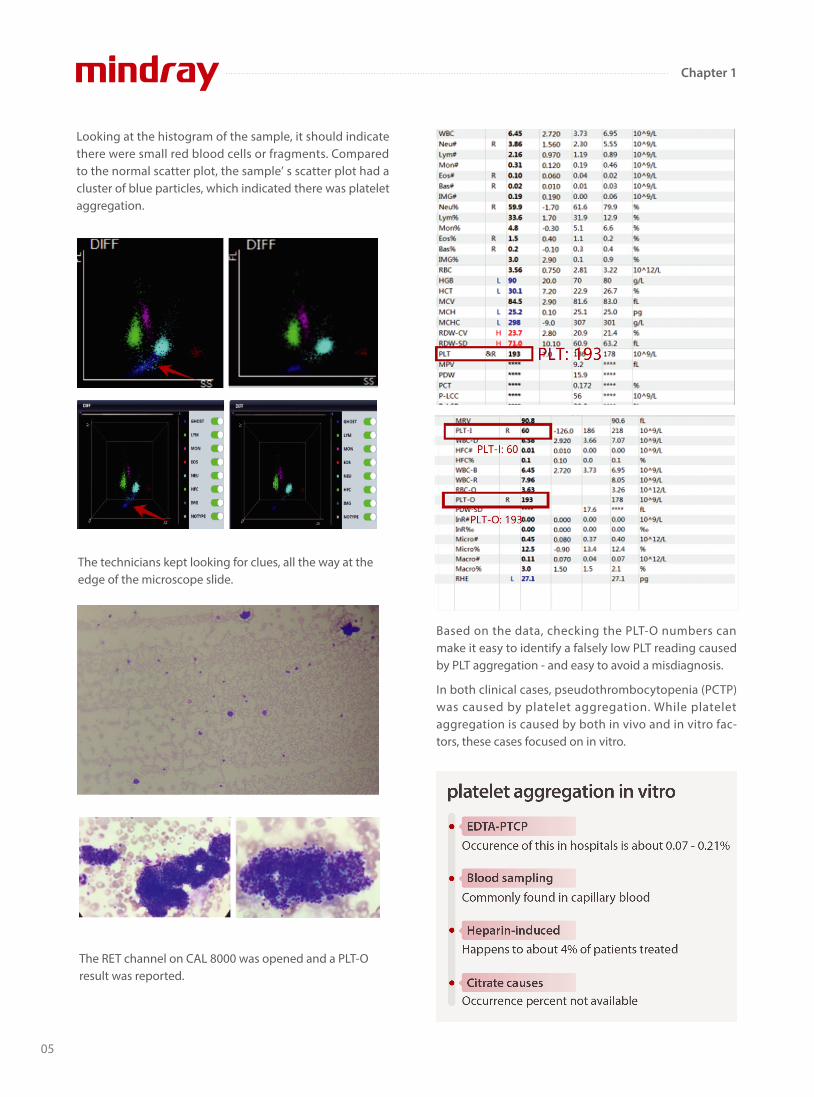
Looking at the histogram of the sample, it should indicate there were small red blood cells or fragments. Compared to the normal scatter plot, the sample’ s scatter plot had a cluster of blue particles, which indicated there was platelet aggregation.
The technicians kept looking for clues, all the way at the edge of the microscope slide.
Based on the data, checking the PLT-O numbers can make it easy to identify a falsely low PLT reading caused by PLT aggregation - and easy to avoid a misdiagnosis. In both clinical cases, pseudothrombocytopenia (PCTP) was caused by platelet aggregation. While platelet aggregation is caused by both in vivo and in vitro fac-tors, these cases focused on in vitro.
The RET channel on CAL 8000 was opened and a PLT-O result was reported.
05
Chapter 1
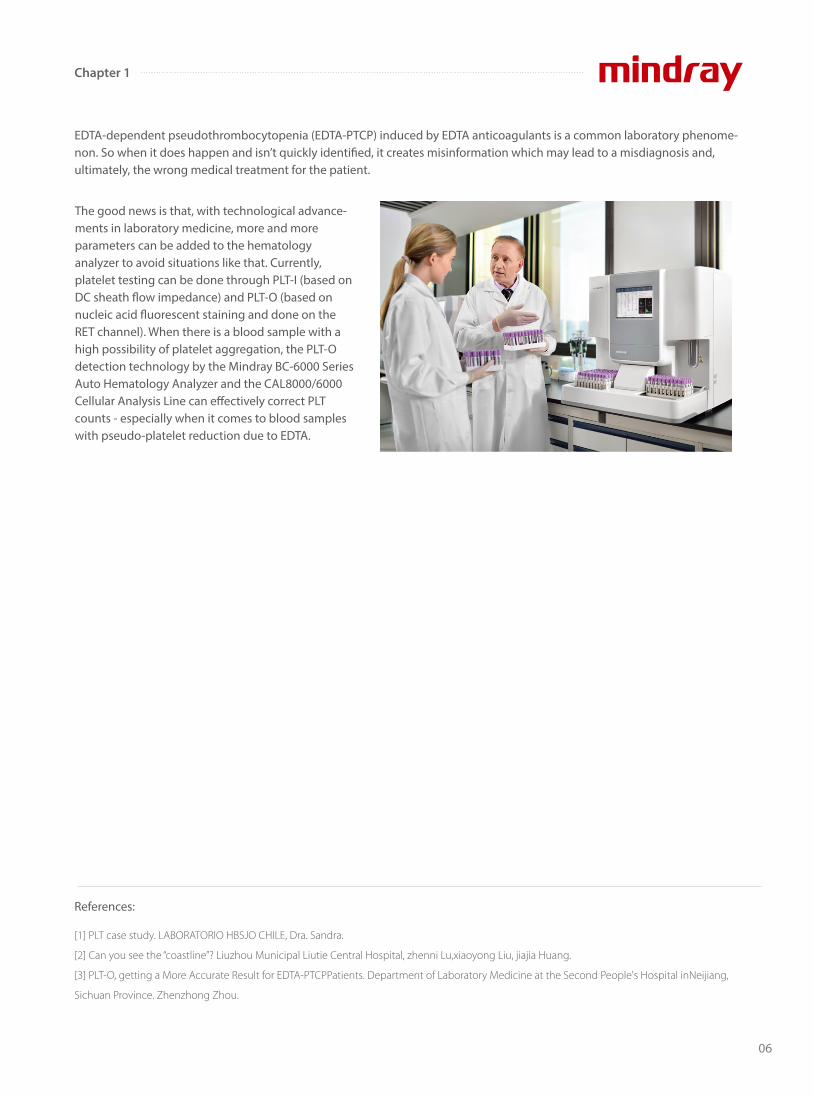
EDTA-dependent pseudothrombocytopenia (EDTA-PTCP) induced by EDTA anticoagulants is a common laboratory phenome-non. So when it does happen and isn’t quickly identi�ed, it creates misinformation which may lead to a misdiagnosis and, ultimately, the wrong medical treatment for the patient.
The good news is that, with technological advance-ments in laboratory medicine, more and more parameters can be added to the hematology analyzer to avoid situations like that. Currently, platelet testing can be done through PLT-I (based on DC sheath �ow impedance) and PLT-O (based on nucleic acid �uorescent staining and done on the RET channel). When there is a blood sample with a high possibility of platelet aggregation, the PLT-O detection technology by the Mindray BC-6000 Series Auto Hematology Analyzer and the CAL8000/6000 Cellular Analysis Line can e�ectively correct PLT counts - especially when it comes to blood samples with pseudo-platelet reduction due to EDTA.
References:
[1] PLT case study. LABORATORIO HBSJO CHILE, Dra. Sandra.
[2] Can you see the “coastline”? Liuzhou Municipal Liutie Central Hospital, zhenni Lu,xiaoyong Liu, jiajia Huang.
[3] PLT-O, getting a More Accurate Result for EDTA-PTCPPatients. Department of Laboratory Medicine at the Second People's Hospital inNeijiang,
Sichuan Province. Zhenzhong Zhou.
06
Chapter 1
07
A Clinical Case Report
Ethylenediaminetetraacetic Acid - Pseudothrombocytopenia (EDTA-PTCP) is a laboratory artifact that may lead to an incorrect evaluation and unnecessary treatment of patients.
Which of the following method (or methods) would you take to correct platelet counts in case of an EDTA-induced platelet aggregation in thrombocytopenia?
Professional clinical laboratory doctors pursue accuracy and truth with the highest sense of responsibility. Nowadays, some clinical studies have been conducted to explore EDTA-PTCP solutions, suggesting that Mindray hematology systems with SF Cube technology would be an option to e�ectively assist lab technicians in identifying correct platelet counts.
Recheck with blood smear and estimate the platelet count
Recheck with addition of amikacin
Recheck after warming at 37°C
Recheck immediately dilution without any anticoagulant
Reexamine on another hematology device
Recheck with other anticoagulants
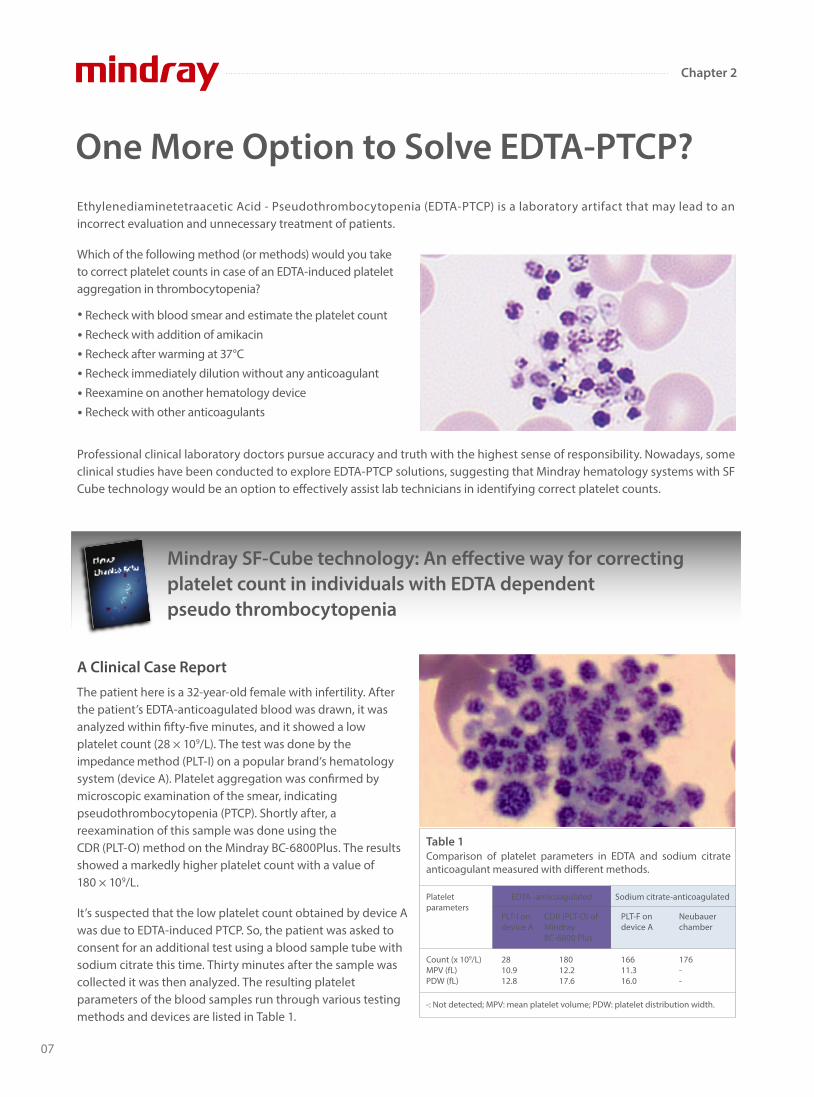
The patient here is a 32-year-old female with infertility. After the patient’s EDTA-anticoagulated blood was drawn, it was analyzed within �fty-�ve minutes, and it showed a low platelet count (28 × 109/L). The test was done by the impedance method (PLT-I) on a popular brand’s hematology system (device A). Platelet aggregation was con�rmed by microscopic examination of the smear, indicating pseudothrombocytopenia (PTCP). Shortly after, a reexamination of this sample was done using the CDR (PLT-O) method on the Mindray BC-6800Plus. The results showed a markedly higher platelet count with a value of 180 × 109/L.
It’s suspected that the low platelet count obtained by device A was due to EDTA-induced PTCP. So, the patient was asked to consent for an additional test using a blood sample tube with sodium citrate this time. Thirty minutes after the sample was collected it was then analyzed. The resulting platelet parameters of the blood samples run through various testing methods and devices are listed in Table 1.
One More Option to Solve EDTA-PTCP?
Mindray SF-Cube technology: An e�ective way for correcting platelet count in individuals with EDTA dependent pseudo thrombocytopenia
Comparison of platelet parameters in EDTA and sodium citrate anticoagulant measured with di�erent methods.
-: Not detected; MPV: mean platelet volume; PDW: platelet distribution width.
Table 1
Platelet parameters
PLT-I ondevice A
Count (x 109/L)MPV (fL)PDW (fL)
2810.912.8
18012.217.6
16611.316.0
176--
CDR (PLT-O) of Mindray BC-6800 Plus
PLT-F on device A
Neubauer chamber
EDTA -anticoagulated Sodium citrate-anticoagulated
Chapter 2

Further Comparison of Other Samples
Under microscopic evaluation of the blood smear, the EDTA-anticoagulated blood showed platelet aggregation while the sodium citrate-anticoagulated blood showed none. The blood samples were analyzed within four hours from the time of collection, according to the manufacturer’ s instructions. In addition to that patient, the data from an additional �ve cases of EDTA-PTCP were collected and assessed (Table 2).
Identi�cation and Characteristics of EDTA-PTCP Samples
Samples that triggered the “PLT aggregation” �ag on the hematology analyzer showed a typical serrated irregularity and a zigzag tail (Figure 1) on the platelet histogram. Also, under microscopic evaluation, the presence of platelet satellitism, or giant platelets, is not seen.
Spurious Low Platelet Counts of BC-6800 by Optical Platelet Counting (PLT-O)
Twenty-three EDTA-PTCP samples in EDTA tubes (with platelet aggregation) were tested in the impedence (PLT-I (EDTA)) and reticulocyte channel of the Mindray BC-6800 (PLT-O (EDTA)). Interestingly, the PLT-O (EDTA) results were comparable to) the platelet counts of the re-collected sam-ples in citrate tubes (PLT-I (Citrate)), which proves that the PLT-O (EDTA) method can accurately adjust for the platelet aggregation issue caused by EDTA (Figure 2).
Figure 2: BC-6800's optical fluorescence platelet counts of EDTA-PTCP samples in EDTA tubes were comparable with impedance platelet counts
of EDTA-PTCP samples in citrate tubes. PLT-I (EDTA), impedance platelet counts of EDTA-PTCP samples in EDTA tubes; PLT-O (EDTA), optical
fluorescence platelet counts of EDTA-PTCP samples in EDTA tubes; PLT-I (citrate), impedance platelet counts of EDTA-PTCP samples in citrate
tubes; EDTA-PTCP, ethylene diamine tetraacetic acid-dependent pseudo thrombocytopenia.
In the end, the author concludes: In patients with known or suspected EDTA-PTCP Mindray SF-Cube technology is a straightforward and e�ective way of determining the plate-let count in EDTA-anticoagulated blood.
Sam
ple
1
0
100
200
300
400
500
600
700
PLT (x109/L)
Sam
ple
2
Sam
ple
3
Sam
ple
4
Sam
ple
5
Sam
ple
6
Sam
ple
7
Sam
ple
8
Sam
ple
9
Sam
ple
10
Sam
ple
11
Sam
ple
12
Sam
ple
13
Sam
ple
14
Sam
ple
15
Sam
ple
16
Sam
ple
17
Sam
ple
18
Sam
ple
19
Sam
ple
20
Sam
ple
21
Sam
ple
22
Sam
ple
23
PLT-I (EDTA) PLT-O (EDTA) PLT-I (Citrate)
Figure 1: Typical platelet histogram and microscopic pictures of
EDTA-PTCP samples. EDTA-PTCP, ethylene diamine tetraacetic
acid-dependent pseudo thrombocytopenia.
Correction of spurious low platelet counts by optical Fluorescence platelet counting of BC-6800 hematology analyzer in EDTA-dependent pseudo thrombocytopenia patients
Data on the di�erent compared samples.Table 2
Cases
PLT-I ondevice A
12345
Mean
8612291477
44
322133345192227
244
292195334179236
247
300173326185260
249
CDR (PLT-O) of Mindray BC-6800 Plus
PLT-F on device A
Neubauer chamber
Platelet count (x109/L)
EDTA -anticoagulated Sodium citrate-anticoagulated
08
Chapter 2
One Mainstream Brand’s Hematology System’s EDTA-PTCP Dissociation E�ect: Available with Fluorescent Dye Staining?
Optical �uorescence platelet counting is available in both high-end hematology analyzers (device B) and Mindray BC-6000 series hematology analyzers. In this method, a �uo-rescent dye is used to stain the nucleic acids in platelets, allowing the recognition of large platelets and excluding non-platelet particles such as erythrocyte debris, micro erythrocytes, or leukocyte debris.
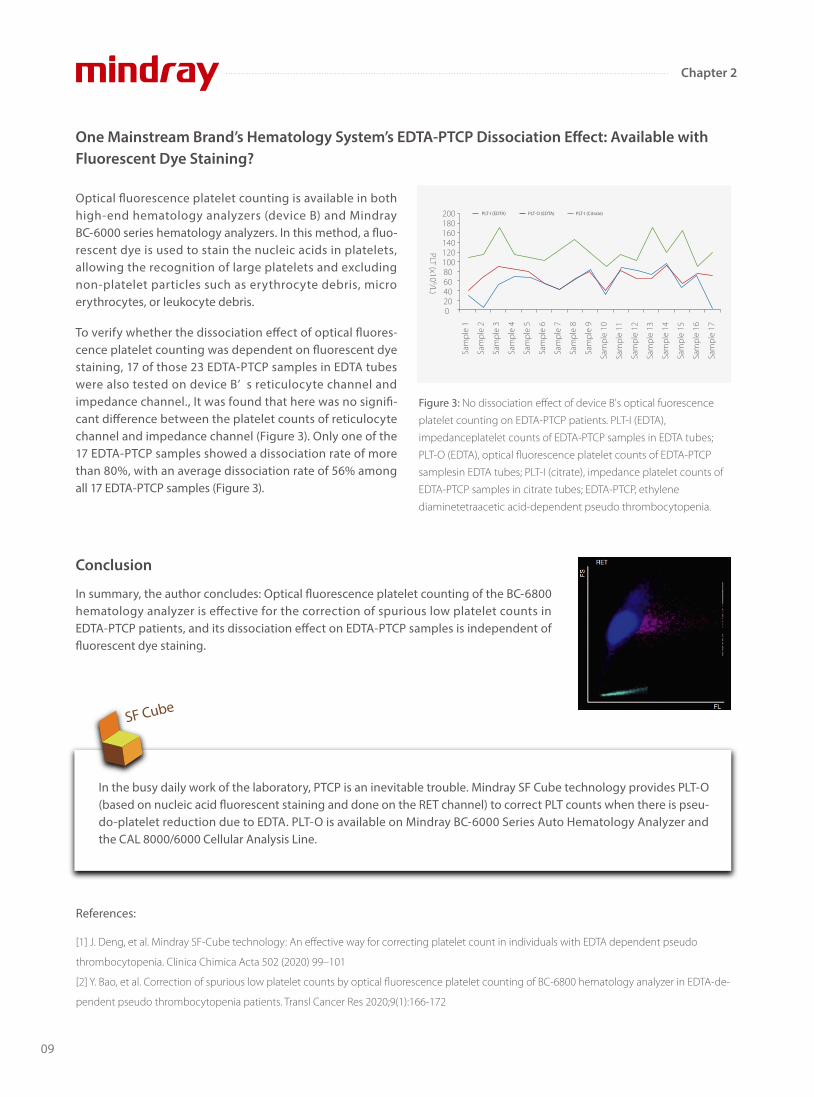
To verify whether the dissociation e�ect of optical �uores-cence platelet counting was dependent on �uorescent dye staining, 17 of those 23 EDTA-PTCP samples in EDTA tubes were also tested on device B’ s reticulocyte channel and impedance channel., It was found that here was no signi�-cant di�erence between the platelet counts of reticulocyte channel and impedance channel (Figure 3). Only one of the 17 EDTA-PTCP samples showed a dissociation rate of more than 80%, with an average dissociation rate of 56% among all 17 EDTA-PTCP samples (Figure 3).
Conclusion
In summary, the author concludes: Optical �uorescence platelet counting of the BC-6800 hematology analyzer is e�ective for the correction of spurious low platelet counts in EDTA-PTCP patients, and its dissociation e�ect on EDTA-PTCP samples is independent of �uorescent dye staining.
In the busy daily work of the laboratory, PTCP is an inevitable trouble. Mindray SF Cube technology provides PLT-O (based on nucleic acid �uorescent staining and done on the RET channel) to correct PLT counts when there is pseu-do-platelet reduction due to EDTA. PLT-O is available on Mindray BC-6000 Series Auto Hematology Analyzer and the CAL 8000/6000 Cellular Analysis Line.
Sam
ple
1
020406080100120PLT (x10
9/L)
140160180200
Sam
ple
2
Sam
ple
3
Sam
ple
4
Sam
ple
5
Sam
ple
6
Sam
ple
7
Sam
ple
8
Sam
ple
9
Sam
ple
10
Sam
ple
11
Sam
ple
12
Sam
ple
13
Sam
ple
14
Sam
ple
15
Sam
ple
16
Sam
ple
17
PLT-I (EDTA) PLT-O (EDTA) PLT-I (Citrate)
Figure 3: No dissociation effect of device B's optical fuorescence
platelet counting on EDTA-PTCP patients. PLT-I (EDTA),
impedanceplatelet counts of EDTA-PTCP samples in EDTA tubes;
PLT-O (EDTA), optical fluorescence platelet counts of EDTA-PTCP
samplesin EDTA tubes; PLT-I (citrate), impedance platelet counts of
EDTA-PTCP samples in citrate tubes; EDTA-PTCP, ethylene
diaminetetraacetic acid-dependent pseudo thrombocytopenia.
SF Cube
References:
[1] J. Deng, et al. Mindray SF-Cube technology: An effective way for correcting platelet count in individuals with EDTA dependent pseudo
thrombocytopenia. Clinica Chimica Acta 502 (2020) 99–101
[2] Y. Bao, et al. Correction of spurious low platelet counts by optical fluorescence platelet counting of BC-6800 hematology analyzer in EDTA-de-
pendent pseudo thrombocytopenia patients. Transl Cancer Res 2020;9(1):166-172
09
Chapter 2
When the platelet value is low, patients are at risk of bleeding. Bleeding in vital organs is life-threatening.
According to Giuseppe Lippi and other professors, there is no universal agreement on the de�nition of platelet transfusion thresholds.[1] However, the degree of accuracy and imprecision of the vast majority of fully automated hematological analyzers appears unsatisfactory, especially in the lower thrombocytopenic range, i.e.,<50× 109/L .
The current guidelines and recommendations show that there is no consensus on the low PLT infusion threshold in several spe-ci�c clinical situations, as shown in the following table. [1]
Abbreviations: SIMTI, Italian Society of Transfusion Medicine and Immunohaematology; GMA, German Medical Association; AABB, American
Association of Blood Banks; BCSH, British Committee for Standards in Haematology; TMAG, British Columbia Transfusion Medicine Advisory Group;
WHO, World Health Organization; ARC, American Red Cross; N/A, not available.
*Only in case of perioperative bleeding.
Low Value? High Risk?
Resolve Your Concerns about the Risk of Low-value Platelet Measurements
20 x 109/L
0 x 109/L
40 x 109/L
60 x 109/L
80 x 109/L
100 x 109/L
Thrombocytopenia of any reason
WHO
Minor surgery
GMA
Lumbar puncture
BCSH
Major surgery
TMAG
Neurosurgery
ARC
Platelet function defects
SIMTI AABB
N/A
No threshold
No threshold
N/A
N/A
No
No
N/A
Guidelines and Recommendations on Platelet Transfusion Thresholds
PLT Concentration
Bleeding Risk
Subcutaneous bleeding
Intracranial hemorrhage
Mucosal bleeding
Fundus bleeding
Visceral bleeding
10
Chapter 3
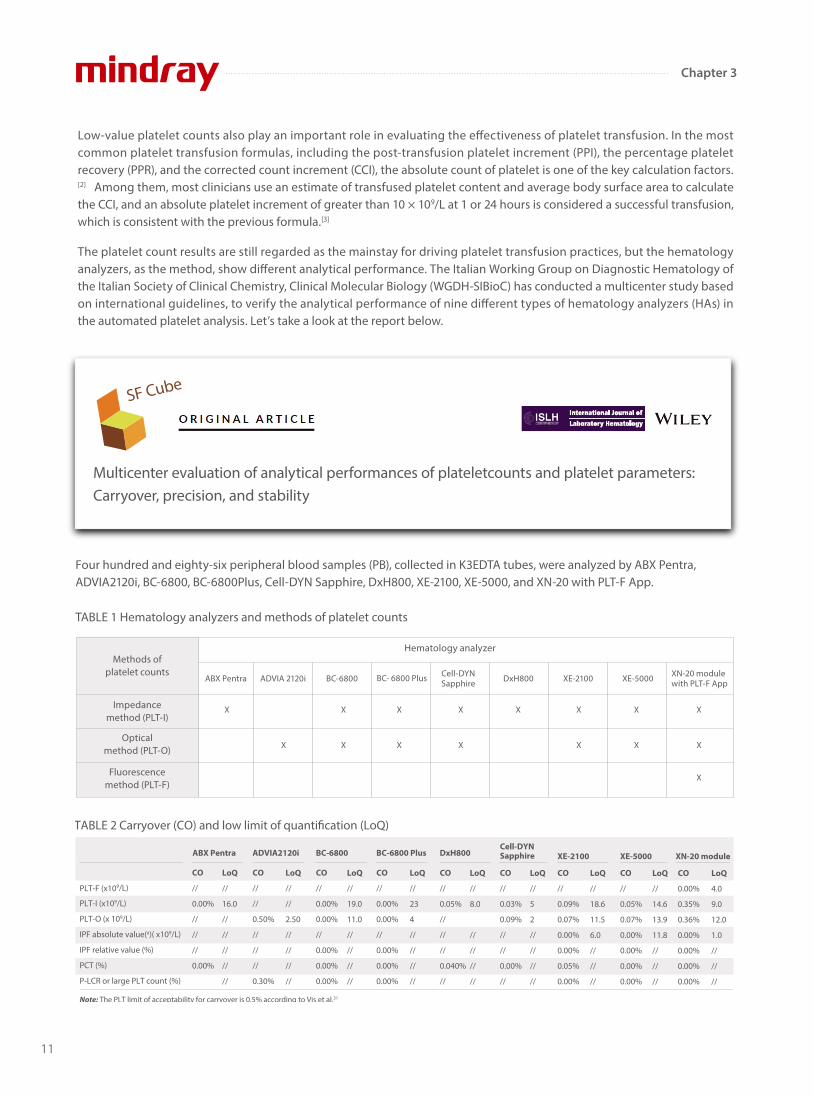
TABLE 2 Carryover (CO) and low limit of quanti�cation (LoQ)
CO
//
0.00%
//
//
//
0.00%
CO
//
//
0.50%
//
//
//
0.30%
CO
//
0.00%
0.00%
//
0.00%
0.00%
0.00%
CO
//
0.00%
0.00%
//
0.00%
0.00%
0.00%
LoQ
//
16.0
//
//
//
//
//
LoQ
//
//
2.50
//
//
//
//
LoQ
//
19.0
11.0
//
//
//
//
CO
//
0.05%
//
//
//
0.040%
//
LoQ
//
23
4
//
//
//
//
CO
//
0.03%
0.09%
//
//
0.00%
//
LoQ
//
8.0
//
//
//
//
CO
//
0.09%
0.07%
0.00%
0.00%
0.05%
0.00%
LoQ
//
5
2
//
//
//
//
CO
//
0.05%
0.07%
0.00%
0.00%
0.00%
0.00%
LoQ
//
18.6
11.5
6.0
//
//
//
CO
0.00%
0.35%
0.36%
0.00%
0.00%
0.00%
0.00%
LoQ
//
14.6
13.9
11.8
//
//
//
LoQ
4.0
9.0
12.0
1.0
//
//
//
PLT-F (x109/L)
PLT-I (x109/L)
PLT-O (x 109/L)
IPF absolute value(a)( x109/L)
IPF relative value (%)
PCT (%)
P-LCR or large PLT count (%)
Note: The PLT limit of acceptability for carryover is 0.5% according to Vis et al.31
ABX Pentra ADVIA2120i BC-6800 BC-6800 Plus DxH800Cell-DYNSapphire XE-2100 XE-5000 XN-20 module
Low-value platelet counts also play an important role in evaluating the e�ectiveness of platelet transfusion. In the most common platelet transfusion formulas, including the post-transfusion platelet increment (PPI), the percentage platelet recovery (PPR), and the corrected count increment (CCI), the absolute count of platelet is one of the key calculation factors.[2] Among them, most clinicians use an estimate of transfused platelet content and average body surface area to calculate the CCI, and an absolute platelet increment of greater than 10 × 109/L at 1 or 24 hours is considered a successful transfusion, which is consistent with the previous formula.[3]
The platelet count results are still regarded as the mainstay for driving platelet transfusion practices, but the hematology analyzers, as the method, show di�erent analytical performance. The Italian Working Group on Diagnostic Hematology of the Italian Society of Clinical Chemistry, Clinical Molecular Biology (WGDH-SIBioC) has conducted a multicenter study based on international guidelines, to verify the analytical performance of nine di�erent types of hematology analyzers (HAs) in the automated platelet analysis. Let’s take a look at the report below.
Four hundred and eighty-six peripheral blood samples (PB), collected in K3EDTA tubes, were analyzed by ABX Pentra, ADVIA2120i, BC-6800, BC-6800Plus, Cell-DYN Sapphire, DxH800, XE-2100, XE-5000, and XN-20 with PLT-F App.
Multicenter evaluation of analytical performances of plateletcounts and platelet parameters: Carryover, precision, and stability
SF Cube
TABLE 1 Hematology analyzers and methods of platelet counts
Methods of platelet counts
Hematology analyzer
Impedancemethod (PLT-I)
Opticalmethod (PLT-O)
Fluorescencemethod (PLT-F)
ABX Pentra ADVIA 2120i BC-6800 BC- 6800 Plus Cell-DYN Sapphire DxH800 XE-2100 XE-5000 XN-20 module
with PLT-F App
X
X
X X X X
X X X
X X X
X X X
X
11
Chapter 3
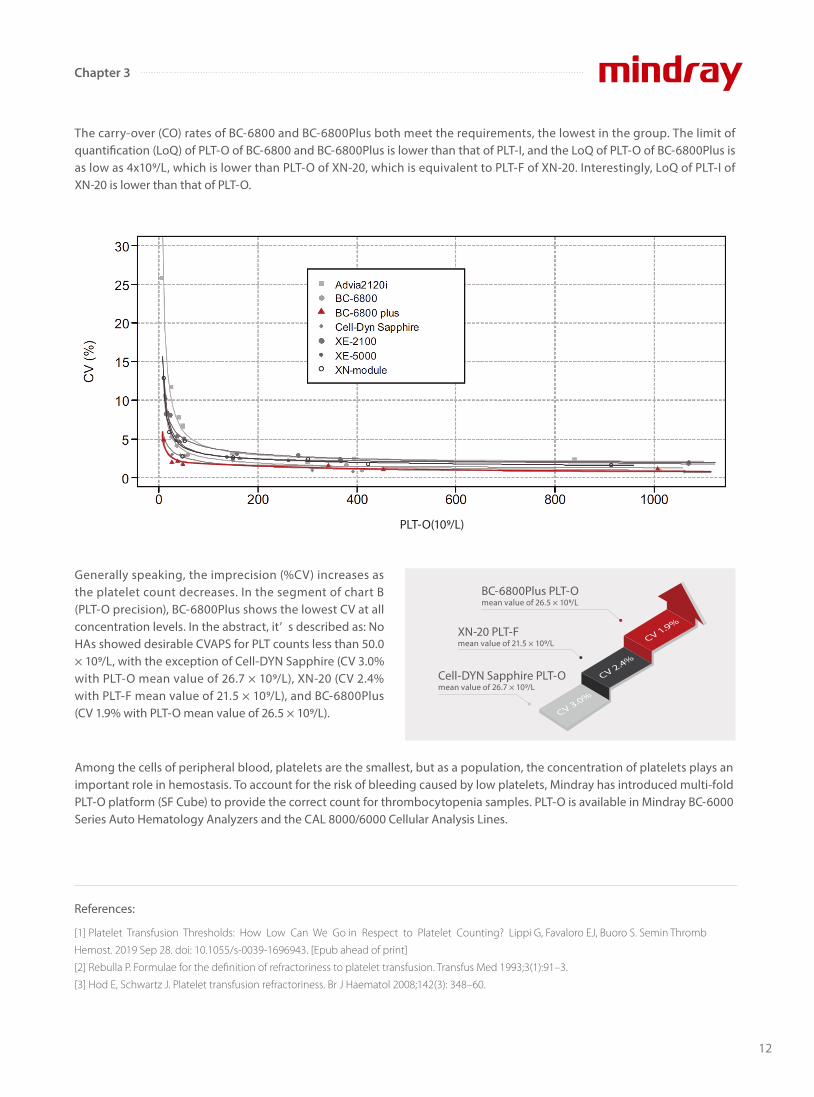
The carry-over (CO) rates of BC-6800 and BC-6800Plus both meet the requirements, the lowest in the group. The limit of quanti�cation (LoQ) of PLT-O of BC-6800 and BC-6800Plus is lower than that of PLT-I, and the LoQ of PLT-O of BC-6800Plus is as low as 4x10⁹/L, which is lower than PLT-O of XN-20, which is equivalent to PLT-F of XN-20. Interestingly, LoQ of PLT-I of XN-20 is lower than that of PLT-O.
Among the cells of peripheral blood, platelets are the smallest, but as a population, the concentration of platelets plays an important role in hemostasis. To account for the risk of bleeding caused by low platelets, Mindray has introduced multi-fold PLT-O platform (SF Cube) to provide the correct count for thrombocytopenia samples. PLT-O is available in Mindray BC-6000 Series Auto Hematology Analyzers and the CAL 8000/6000 Cellular Analysis Lines.
Generally speaking, the imprecision (%CV) increases as the platelet count decreases. In the segment of chart B (PLT-O precision), BC-6800Plus shows the lowest CV at all concentration levels. In the abstract, it’ s described as: No HAs showed desirable CVAPS for PLT counts less than 50.0 × 10⁹/L, with the exception of Cell-DYN Sapphire (CV 3.0% with PLT-O mean value of 26.7 × 10⁹/L), XN-20 (CV 2.4% with PLT-F mean value of 21.5 × 10⁹/L), and BC-6800Plus (CV 1.9% with PLT-O mean value of 26.5 × 10⁹/L).
References:
[1] Platelet Transfusion Thresholds: How Low Can We Go in Respect to Platelet Counting? Lippi G, Favaloro EJ, Buoro S. Semin Thromb
Hemost. 2019 Sep 28. doi: 10.1055/s-0039-1696943. [Epub ahead of print]
[2] Rebulla P. Formulae for the definition of refractoriness to platelet transfusion. Transfus Med 1993;3(1):91–3.
[3] Hod E, Schwartz J. Platelet transfusion refractoriness. Br J Haematol 2008;142(3): 348–60.
BC-6800Plus PLT-O mean value of 26.5 × 10⁹/L
XN-20 PLT-F mean value of 21.5 × 10⁹/L
Cell-DYN Sapphire PLT-O mean value of 26.7 × 10⁹/L
PLT-O(109/L)
12
Chapter 3
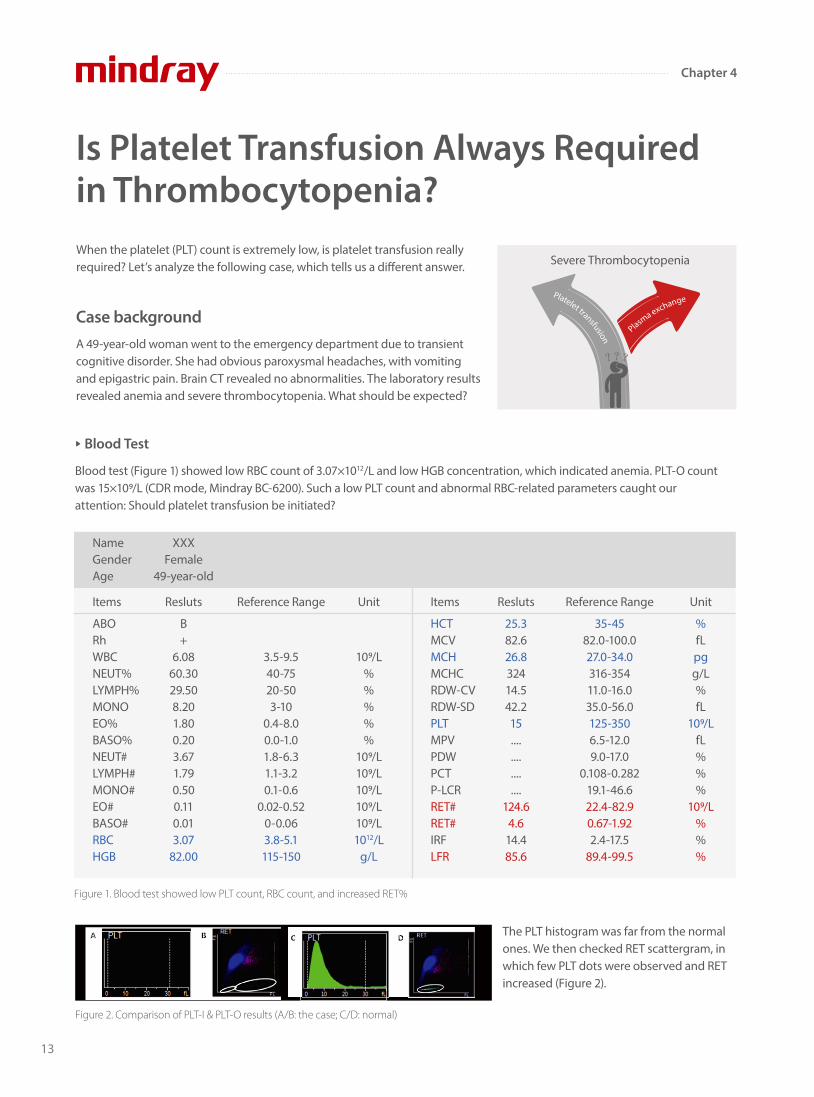
When the platelet (PLT) count is extremely low, is platelet transfusion really required? Let’s analyze the following case, which tells us a di�erent answer.
A 49-year-old woman went to the emergency department due to transient cognitive disorder. She had obvious paroxysmal headaches, with vomiting and epigastric pain. Brain CT revealed no abnormalities. The laboratory results revealed anemia and severe thrombocytopenia. What should be expected?
Blood test (Figure 1) showed low RBC count of 3.07×10¹²/L and low HGB concentration, which indicated anemia. PLT-O count was 15×109/L (CDR mode, Mindray BC-6200). Such a low PLT count and abnormal RBC-related parameters caught our attention: Should platelet transfusion be initiated?
The PLT histogram was far from the normal ones. We then checked RET scattergram, in which few PLT dots were observed and RET increased (Figure 2).
Figure 1. Blood test showed low PLT count, RBC count, and increased RET%
Is Platelet Transfusion Always Required in Thrombocytopenia?
Case background
Severe Thrombocytopenia
Figure 2. Comparison of PLT-I & PLT-O results (A/B: the case; C/D: normal)
A B C D
NameGenderAge
XXXFemale
49-year-old
Items
ABORhWBCNEUT%LYMPH%MONOEO%BASO%NEUT#LYMPH#MONO#EO#BASO#RBCHGB
Resluts
B+
6.0860.3029.508.201.800.203.671.790.500.110.013.07
82.00
Reference Range
3.5-9.540-7520-503-10
0.4-8.00.0-1.01.8-6.31.1-3.20.1-0.6
0.02-0.520-0.063.8-5.1115-150
Unit
109/L%%%%%
109/L109/L109/L109/L109/L1012/L
g/L
Unit
%fLpgg/L%fL
109/LfL%%%
109/L%%%
Items
HCTMCVMCHMCHCRDW-CVRDW-SDPLTMPVPDWPCTP-LCRRET#RET#IRFLFR
Resluts
25.382.626.832414.542.215................
124.64.6
14.485.6
Reference Range
35-4582.0-100.027.0-34.0316-35411.0-16.035.0-56.0125-3506.5-12.09.0-17.0
0.108-0.28219.1-46.622.4-82.90.67-1.922.4-17.5
89.4-99.5
Blood Test
Plasma exchangePlatelet transfusion
13
Chapter 4
Considering the cases with typical symptoms:(1) hemolytic anemia (schistocytes); (2) thrombocytopenia; (3) neurologic symptoms (transient mental disorder), thrombotic thrombocytopenia (TTP) disease is likely. The results and TTP diagnostic suggestion were transferred to doctors immediately. And Further ADAMTS13 testing con�rmed TTP. Finally, plasma exchange instead of platelet transfusion was taken.
Erythrocytic cell lines 44%, Granulocytic cell lines 40%, G/E=0.91/1.
Undi�erentiated erythroblasts were common in the bone marrow smear, and Howell-Jolly body were found. A total of 257 megakaryocytes were found in the smear, and 50 were di�erentiated, including 3 megakaryoblasts, 44 promegakaryocytes and 3 naked nucleus megakaryocytes. PLT was rarely seen. Such bone marrow smear showed a megakaryocytic thrombocy-topenia, increased function of erythroid di�erentiation.
Figure 4. Chemistry testing results
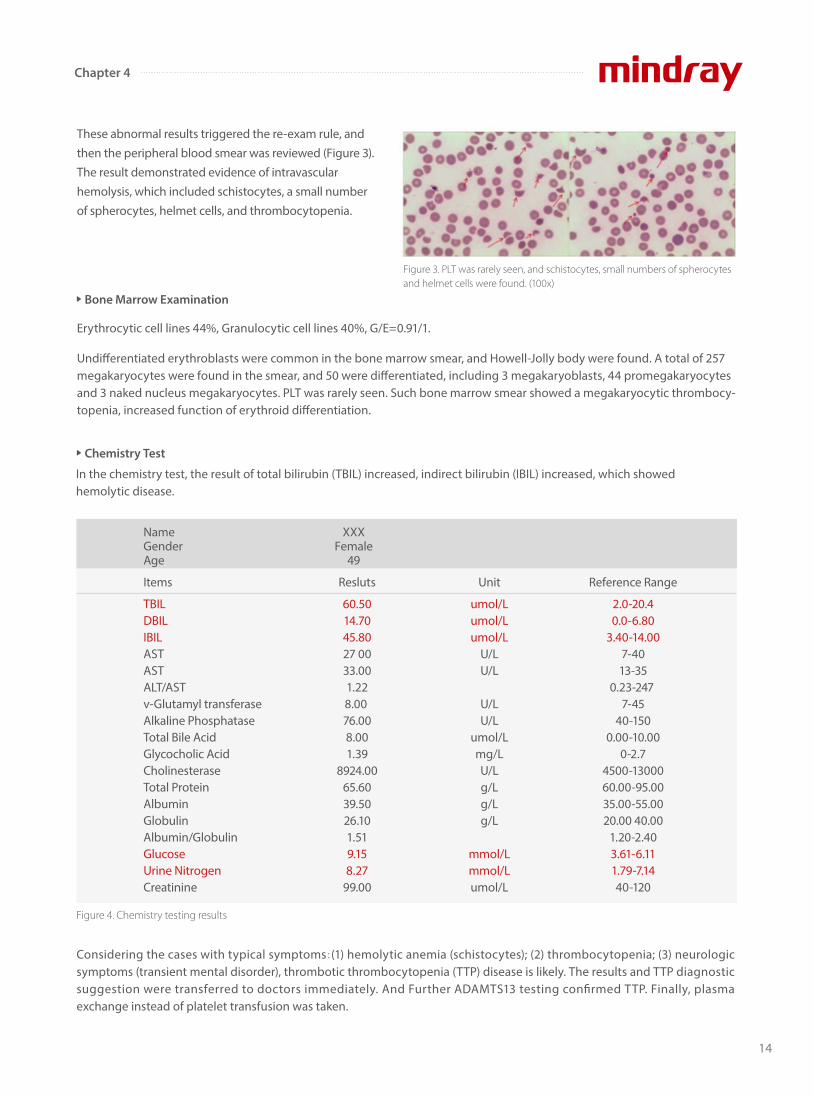
These abnormal results triggered the re-exam rule, and then the peripheral blood smear was reviewed (Figure 3). The result demonstrated evidence of intravascular hemolysis, which included schistocytes, a small number of spherocytes, helmet cells, and thrombocytopenia.
Figure 3. PLT was rarely seen, and schistocytes, small numbers of spherocytes and helmet cells were found. (100x)
NameGenderAge
XXXFemale
49
Items
TBILDBILIBILASTASTALT/ASTv-Glutamyl transferaseAlkaline PhosphataseTotal Bile AcidGlycocholic AcidCholinesteraseTotal ProteinAlbuminGlobulinAlbumin/GlobulinGlucoseUrine NitrogenCreatinine
Resluts
60.5014.7045.8027 0033.001.228.00 76.008.001.39
8924.0065.6039.5026.101.519.158.27
99.00
Unit
umol/Lumol/Lumol/L
U/LU/L
U/LU/L
umol/Lmg/LU/Lg/Lg/Lg/L
mmol/Lmmol/Lumol/L
Reference Range
2.0-20.40.0-6.80
3.40-14.007-4013-35
0.23-247 7-45
40-1500.00-10.00
0-2.74500-1300060.00-95.0035.00-55.0020.00 40.00
1.20-2.403.61-6.111.79-7.1440-120
Bone Marrow Examination
Chemistry Test
In the chemistry test, the result of total bilirubin (TBIL) increased, indirect bilirubin (IBIL) increased, which showed hemolytic disease.
14
Chapter 4

If the PLT level is lower than the decision-making threshold, experienced doctors will immediately recheck whether the specimen is quali�ed, the histogram and scattergram are normal or not, and any other abnormal cell counting results or signi�cant �ag messages, etc. Further con�rmation will be carried out by blood smear examination under the microscope. Finally, after considering the patient's symptoms and medical history information, the laboratory can report the results and provide possible diagnosis.
Mindray’s automatic 8x PLT-O counting (SF Cube technology) provides accurate and stable counting for thrombocytopenia samples. Together with high quality blood smear from SC-120 Auto Slide Maker, Mindray hematology solutions support e�cient management of thrombocytopenia. PLT-O is available in Mindray BC-6000 Series Auto Hematology Analyzers, and the CAL 8000/6000
References:
[1] What Is Thrombocytopenia? - NHLBI, NIH". www.nhlbi.nih.gov. Retrieved 2015-05-01.
[2] Tsai, Han-Mou(2010). “Pathophysiology of thrombotic thrombocytopenic purpura.” International journal of hematology vol. 91,1: 1-19.
doi:10.1007/s12185-009-0476-1.
[3] Joly, BS; Coppo, P; Veyradier, A (2017). "Thrombotic thrombocytopenic purpura." Blood. 129 (21): 2836–2846. doi:10.1182/blood-2016-10-709857.
Figure 5. Clinical symptoms of TTP disease
Five medical signs[2]
Fever
Hemolytic Anemia
Thrombocytopenia
Transient neurologic symptoms
Reduced kidney function
In this case
No
Yes
Yes
Yes
No
Cellular Analysis Lines.
Extension: Why is platelet transfusion not recommended in thrombotic thrombocytopenia?
Common causes of thrombocytopenia include decreased production in bone marrow, increased destruction in peripheral blood, and medication induced[1].
Thrombotic thrombocytopenia, including TTP in this case, is a kind of disease caused by increased PLT destruction. Because of von Willebrand factor (VWF) cleavage protease (ADAMTS13) de�ciency, VWF cannot be cut o� normally, and ultra-large VWF (ULVWF) accumulate, resulting in abnormal PLT aggregation, microthrombosis and fragmented RBC[2]. Under such condition, platelet transfusion may accelerate thrombosis, leading to worsening symptoms[3]. So for thrombotic thrombocytopenia, the main treatment should be plasma exchange.
Conclusion
Acknowledgement
Thrombotic Thrombocytopenic
purpura (TTP)
Figure 6. PLT-O scattergram
We would like to extend our thanks to Dr. Xiao Zuomiao, Dr. Chen Xianchun, Dr. Xiao Dejun and Dr. Luo Shi from Ganzhou People’s Hospital,
China, for providing the case information.
15
Chapter 4
Derived from megakaryocytes, platelets (PLT) are produced and matured in the bone marrow. Besides widely known throm-bosis and wound repair, PLT also plays important roles in in�ammation, immunity and cancer biology[1]. Normal reference intervals of PLT in peripheral blood varies in the range of 150-400×109/L. When the PLT value is lower than 100×109/L, a common clinical problem identi�ed as thrombocytopenia (low PLT) may be the result[2].
There are several causes of thrombocytopenia including decreased PLT production, increased PLT destruction, increased splenic sequestration and dilution[3]. Currently, complete blood count (CBC) and blood smear reviews are essential diagnostic methods for the initial evaluation of thrombocytopenia samples[2]. Therefore, counting low PLT correctly by an auto hematolo-gy analyzer might be a prospective approach which will greatly reduce the blood smear rate, and save laborious time in the diagnostic lab, rapidly screening out thrombocytopenia samples.
How Mindray Counts Low Platelets Correctly
Clinical Signi�cance
Mindray Solution
Tech 1. Highly speci�c �uorescent staining
However, counting low PLT correctly is not a simple process. How does Mindray’s high-end auto-hematology analyzer deal with low PLT samples?
Fluorescent staining dye (FR dye) has been specially designed with the ability to identify target cells immediately. Next, the �uorescent molecule captures nucleic acid in PLT cells while avoiding interfer-ences from small RBCs, RBC /WBC fragments and other small parti-cles. PLT stained with speci�c �uorescent dye subsequently goes through the laser detector for optical measurement. The high spec-i�city and a�nity of �uorescent dye ensures that the binding inside PLT cells is stable enough for cells to �ow through the laser. This ensures that even low amounts of PLT can be mapped and counted in the SF CUBE 3D scattergram accurately.
SF CUBE 3D Analysis Tech
SF Cube
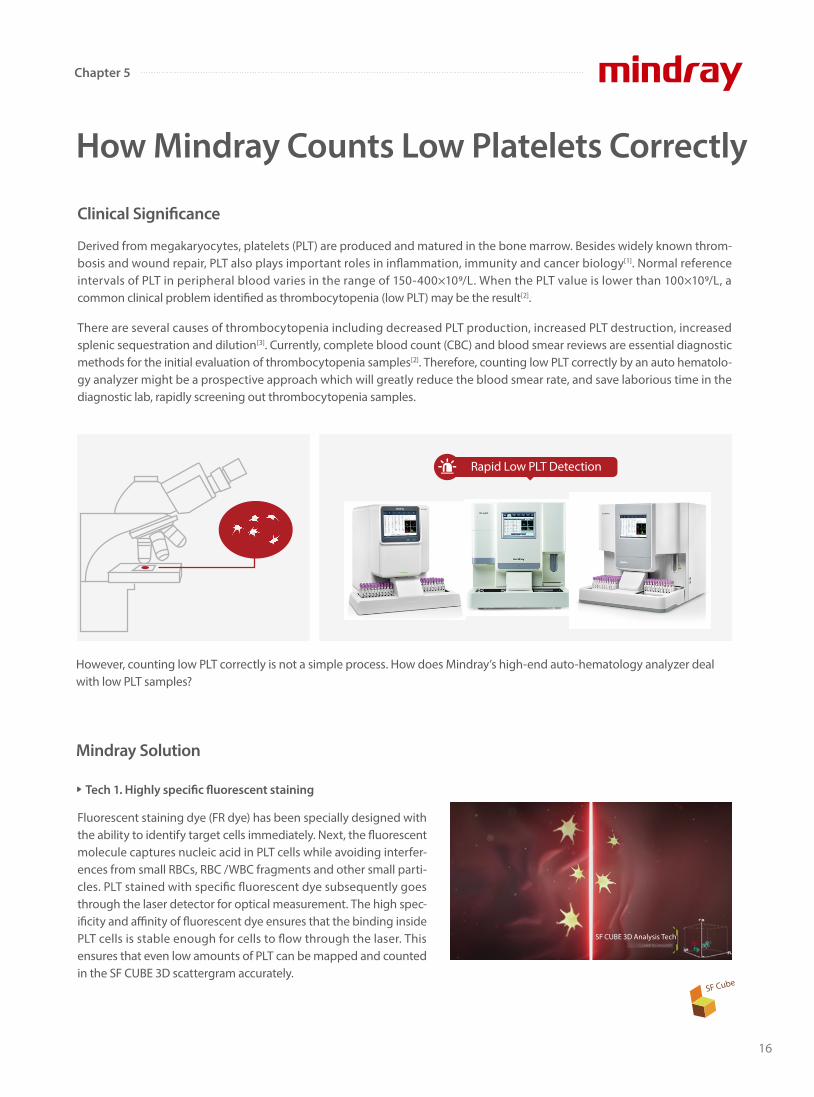
Rapid Low PLT Detection
16
Chapter 5
Also, Mindray’ s high-end hematology analyzer combines re�ec-tive light suppression technology with SiPM (Silicon photomulti-plier), which is highly sensitive to �uorescence signals while simul-taneously minimizing the background noise during optical detec-tion. This greatly improves the detection limit of particles, and the lower limit for small particles reaching up to 1um (a diameter of 2 um is de�ned as small PLT), ensuring that the sample results are not interfered by small PLT or particles.
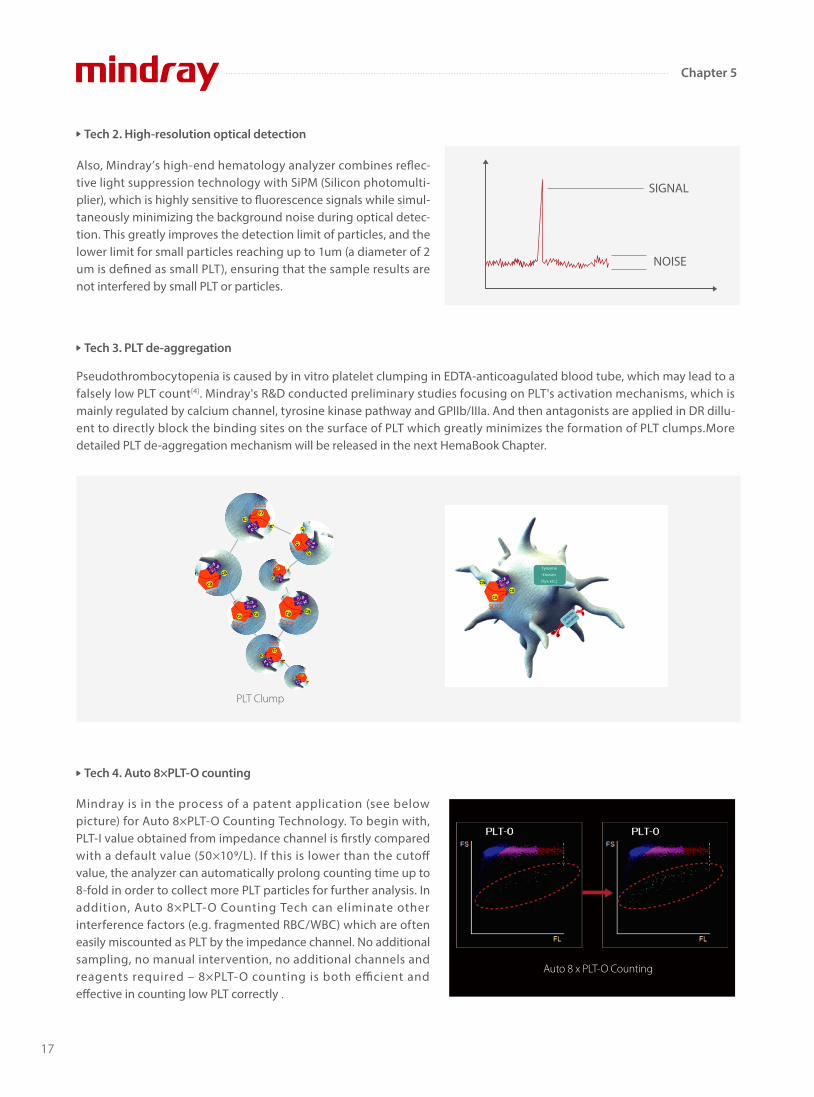
Tech 2. High-resolution optical detection
Tech 4. Auto 8×PLT-O counting
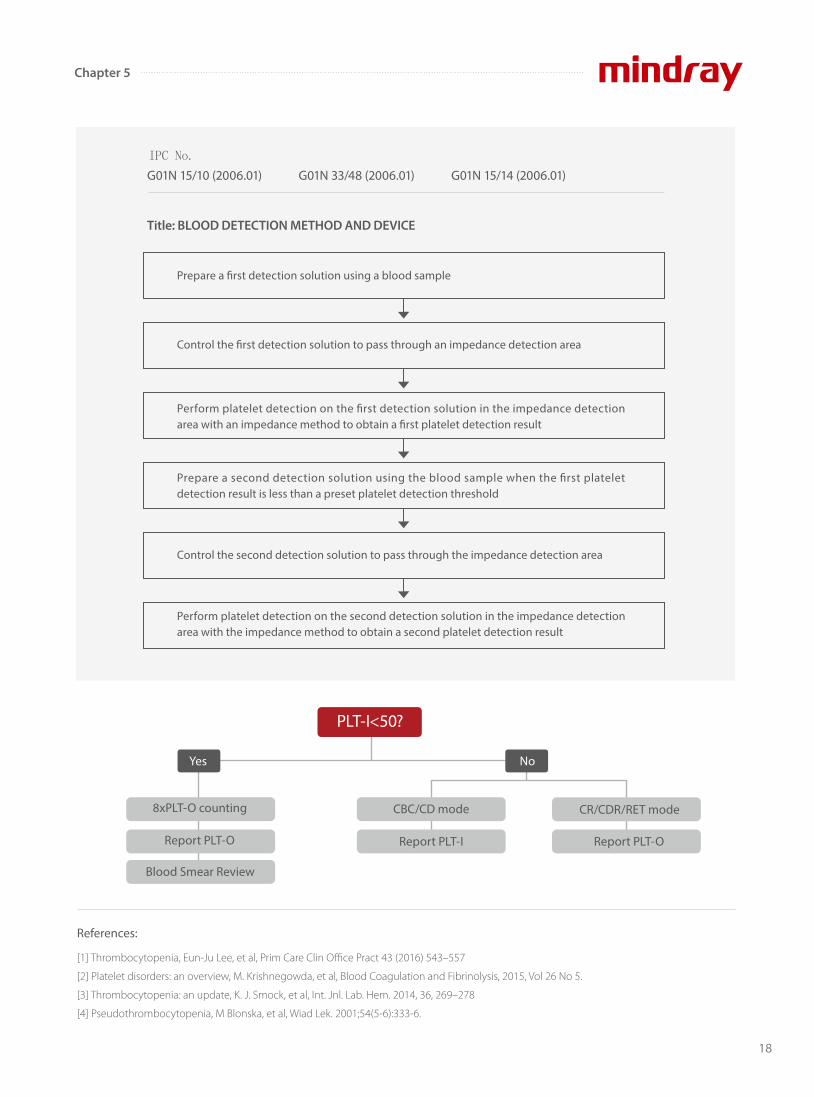
Pseudothrombocytopenia is caused by in vitro platelet clumping in EDTA-anticoagulated blood tube, which may lead to a falsely low PLT count[4]. Mindray's R&D conducted preliminary studies focusing on PLT's activation mechanisms, which is mainly regulated by calcium channel, tyrosine kinase pathway and GPIIb/IIIa. And then antagonists are applied in DR dillu-ent to directly block the binding sites on the surface of PLT which greatly minimizes the formation of PLT clumps.More detailed PLT de-aggregation mechanism will be released in the next HemaBook Chapter.
PLT Clump
Tech 3. PLT de-aggregation
SIGNAL
NOISE
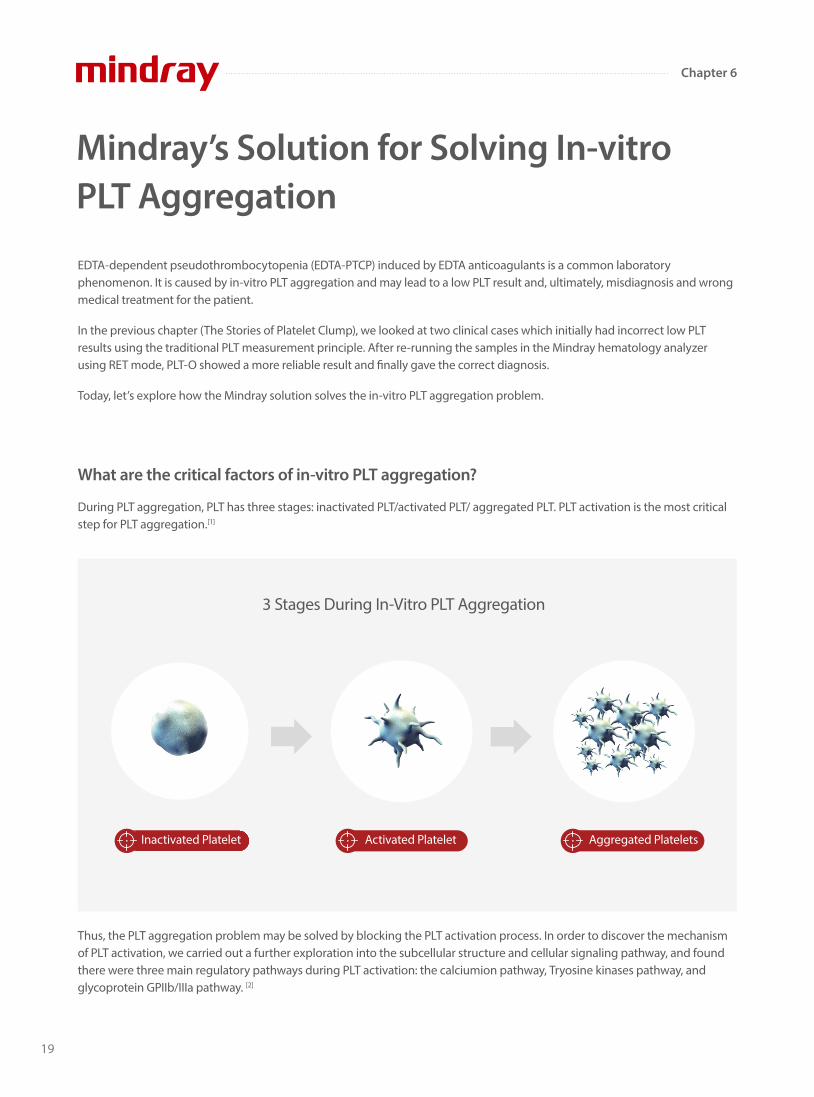
Mindray is in the process of a patent application (see below picture) for Auto 8×PLT-O Counting Technology. To begin with, PLT-I value obtained from impedance channel is �rstly compared with a default value (50×109/L). If this is lower than the cuto� value, the analyzer can automatically prolong counting time up to 8-fold in order to collect more PLT particles for further analysis. In addition, Auto 8×PLT-O Counting Tech can eliminate other interference factors (e.g. fragmented RBC/WBC) which are often easily miscounted as PLT by the impedance channel. No additional sampling, no manual intervention, no additional channels and reagents required – 8×PLT-O counting is both e�cient and e�ective in counting low PLT correctly .
Auto 8 x PLT-O Counting
17
Chapter 5
References:
[1] Thrombocytopenia, Eun-Ju Lee, et al, Prim Care Clin Office Pract 43 (2016) 543–557
[2] Platelet disorders: an overview, M. Krishnegowda, et al, Blood Coagulation and Fibrinolysis, 2015, Vol 26 No 5.
[3] Thrombocytopenia: an update, K. J. Smock, et al, Int. Jnl. Lab. Hem. 2014, 36, 269–278
[4] Pseudothrombocytopenia, M Blonska, et al, Wiad Lek. 2001;54(5-6):333-6.
No
PLT-I<50?
CBC/CD mode
Report PLT-I
CR/CDR/RET mode
Report PLT-O
Blood Smear Review
8xPLT-O counting
Report PLT-O
Yes
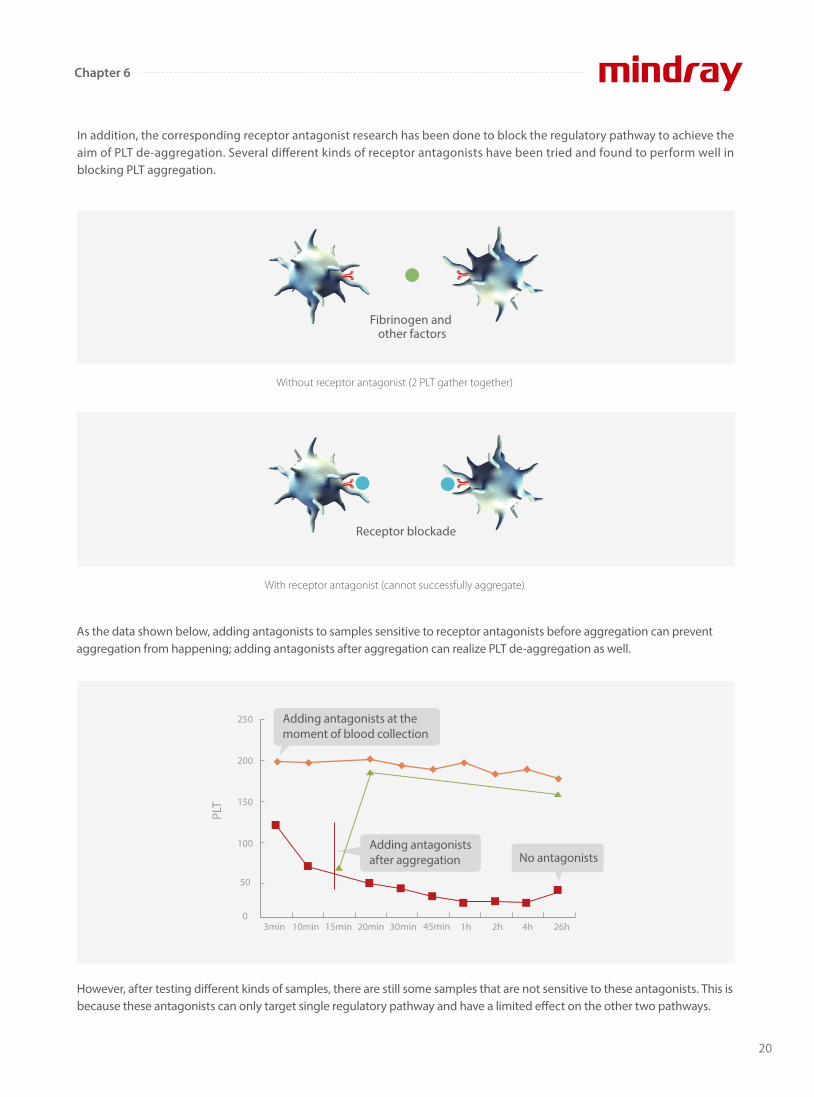
Title: BLOOD DETECTION METHOD AND DEVICE
G01N 15/10 (2006.01) G01N 33/48 (2006.01) G01N 15/14 (2006.01)IPC No.
Prepare a �rst detection solution using a blood sample
Control the �rst detection solution to pass through an impedance detection area
Perform platelet detection on the �rst detection solution in the impedance detection area with an impedance method to obtain a �rst platelet detection result
Prepare a second detection solution using the blood sample when the �rst platelet detection result is less than a preset platelet detection threshold
Control the second detection solution to pass through the impedance detection area
Perform platelet detection on the second detection solution in the impedance detection area with the impedance method to obtain a second platelet detection result
18
Chapter 5
EDTA-dependent pseudothrombocytopenia (EDTA-PTCP) induced by EDTA anticoagulants is a common laboratory phenomenon. It is caused by in-vitro PLT aggregation and may lead to a low PLT result and, ultimately, misdiagnosis and wrong medical treatment for the patient.
In the previous chapter (The Stories of Platelet Clump), we looked at two clinical cases which initially had incorrect low PLT results using the traditional PLT measurement principle. After re-running the samples in the Mindray hematology analyzer using RET mode, PLT-O showed a more reliable result and �nally gave the correct diagnosis.
Today, let’s explore how the Mindray solution solves the in-vitro PLT aggregation problem.
Mindray’s Solution for Solving In-vitro PLT Aggregation
What are the critical factors of in-vitro PLT aggregation?
3 Stages During In-Vitro PLT Aggregation
During PLT aggregation, PLT has three stages: inactivated PLT/activated PLT/ aggregated PLT. PLT activation is the most critical step for PLT aggregation.[1]
Thus, the PLT aggregation problem may be solved by blocking the PLT activation process. In order to discover the mechanism of PLT activation, we carried out a further exploration into the subcellular structure and cellular signaling pathway, and found there were three main regulatory pathways during PLT activation: the calciumion pathway, Tryosine kinases pathway, and glycoprotein GPIIb/IIIa pathway. [2]
Inactivated Platelet Activated Platelet Aggregated Platelets
19
Chapter 6
In addition, the corresponding receptor antagonist research has been done to block the regulatory pathway to achieve the aim of PLT de-aggregation. Several di�erent kinds of receptor antagonists have been tried and found to perform well in blocking PLT aggregation.
Without receptor antagonist (2 PLT gather together)
With receptor antagonist (cannot successfully aggregate)
As the data shown below, adding antagonists to samples sensitive to receptor antagonists before aggregation can prevent aggregation from happening; adding antagonists after aggregation can realize PLT de-aggregation as well.
Receptor blockade
Fibrinogen and other factors
βα β
αβ
α βα
However, after testing di�erent kinds of samples, there are still some samples that are not sensitive to these antagonists. This is because these antagonists can only target single regulatory pathway and have a limited e�ect on the other two pathways.
3min 10min 15min 20min 30min 45min 1h 2h 4h 26h
250
200
150
100
50
0
Adding antagonists at the moment of blood collection
Adding antagonists after aggregation
PLT
No antagonists
20
Chapter 6
De-aggregation e�ect comparison
97.32%
Control group( with antagonists )
24.7%
Experiment group( antagonists are blocked )
Tyrosine kinase pathway
GPIIb/IIIa pathway
Tyrosine kinase pathway
GPIIb/IIIa pathway
Calciumion pathway
Antagonist
Calciumion pathway
Antagonist
Antagonist
Antagonist
In order to further prove their e�ects on PLT de-aggregation using those antagonists, a comparison experiment was performed between control group and the group where antagonists were blocked. The experiment results are shown below:
Inactivated Platelets
Inactivated Platelets
Aggregated Platelets
Inactivated Platelets
Traditional solution: single target antagonist
Mindray solution: a series of optimal compounds which can block the three pathways
A further study was done by combining the molecular biology method to explore the molecular mechanism and di�erent radical group characteristics. Ultimately, from thousands of potential chemical compounds, a series of optimal compounds were found which contain speci�c radical groups which are highly e�cient at blocking the three regulatory pathways.
21
Chapter 6
[1] The Platelet Membrane Glycoprotein IIb/IIIа Complex, David R. Phillips, etc.,Annals of the New York Academy of Science(509), 177-187
[2] Ilya Reviakine. New horizons in platelet research: Understanding and harnessing platelet functional diversity[J]. Clinical Hemorheology and
Microcirculation,2015,60:133-152
From the experiment, we have found that antagonists containing speci�c radical groups have an obvious e�ect on platelet de-aggregation.
Besides, there are also 3 critical factors (appropriate pH, temperature, mechanical mixing) that enhance the PLT de-aggregation. The superposition e�ect of these factors in de-aggregation is obvious. Thanks to the joint e�ects of multiple factors, the aggregation platelets are de-aggregated, and a reliable platelet value is obtained.
The PLT de-aggregation function was used in BC-6800/BC-6200/BC-6800Plus/CAL 6000/CAL 8000 in RET mode.
References:
22
Chapter 6
D-dimer in COVID-19
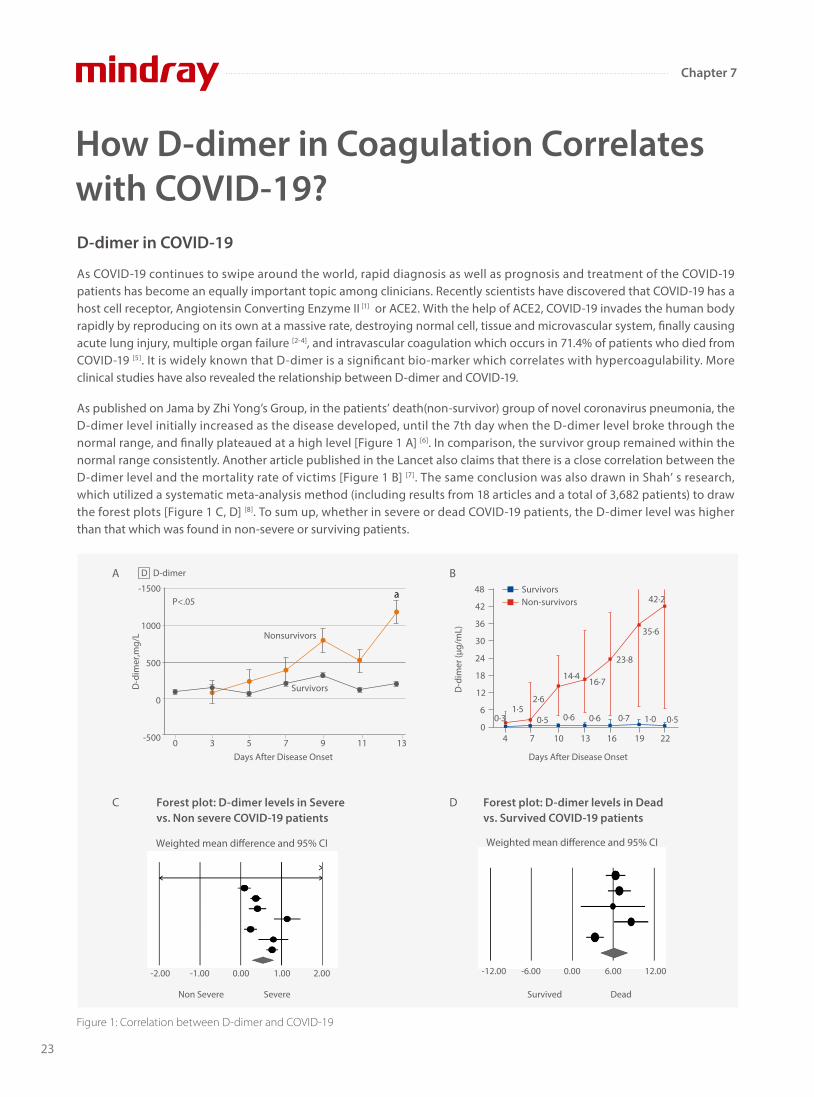
As COVID-19 continues to swipe around the world, rapid diagnosis as well as prognosis and treatment of the COVID-19 patients has become an equally important topic among clinicians. Recently scientists have discovered that COVID-19 has a host cell receptor, Angiotensin Converting Enzyme II [1] or ACE2. With the help of ACE2, COVID-19 invades the human body rapidly by reproducing on its own at a massive rate, destroying normal cell, tissue and microvascular system, finally causing acute lung injury, multiple organ failure [2-4], and intravascular coagulation which occurs in 71.4% of patients who died from COVID-19 [5]. It is widely known that D-dimer is a significant bio-marker which correlates with hypercoagulability. More clinical studies have also revealed the relationship between D-dimer and COVID-19.
As published on Jama by Zhi Yong’s Group, in the patients’ death(non-survivor) group of novel coronavirus pneumonia, the D-dimer level initially increased as the disease developed, until the 7th day when the D-dimer level broke through the normal range, and finally plateaued at a high level [Figure 1 A] [6]. In comparison, the survivor group remained within the normal range consistently. Another article published in the Lancet also claims that there is a close correlation between the D-dimer level and the mortality rate of victims [Figure 1 B] [7]. The same conclusion was also drawn in Shah’ s research, which utilized a systematic meta-analysis method (including results from 18 articles and a total of 3,682 patients) to draw the forest plots [Figure 1 C, D] [8]. To sum up, whether in severe or dead COVID-19 patients, the D-dimer level was higher than that which was found in non-severe or surviving patients.
How D-dimer in Coagulation Correlates with COVID-19?
Figure 1: Correlation between D-dimer and COVID-19
4 7 10 13 16 19 220
D-d
imer
(µg/
mL)
6
12
18
24
30
36
42
48
1·50·5
2·6
14·416·7
0·6 0·7 1·0 0·5
42·2
35·6
23·8
0·60·3
SurvivorsNon-survivors
Weighted mean di�erence and 95% CI
Non Severe
-2.00 -1.00 0.00 1.00 2.00
Severe
Weighted mean di�erence and 95% CI
Survived Dead
-12.00 -6.00 0.00 6.00 12.00
Nonsurvivors
P<.05
Survivors
a-1500
1000
500
0
-500 0 3 5 7 9 11 13Days After Disease Onset Days After Disease Onset
D D-dimer
D-d
imer
,mg/
L
A B
C DForest plot: D-dimer levels in Severe vs. Non severe COVID-19 patients
Forest plot: D-dimer levels in Dead vs. Survived COVID-19 patients
23
Chapter 7
In conclusion, D-dimer has enormous clinical values in the treatment and prognosis of COVID-19 as a sensitive monitoring index. In consideration of disordered coagulation micro-environment in patients infected with COVID-19 or at high risk of VTE induced by reduced activity, increased bed time, or in people being quarantined for hospitalization, testing of D-dimer on a regular basis is necessary for rapid monitoring of disease treatment. While a cut-o� value of over 2 ug/ml has been proved by many researchers monitoring patients’ treatment, laboratories are still advised to set their own standard so the variation in demographics can be taken into account.
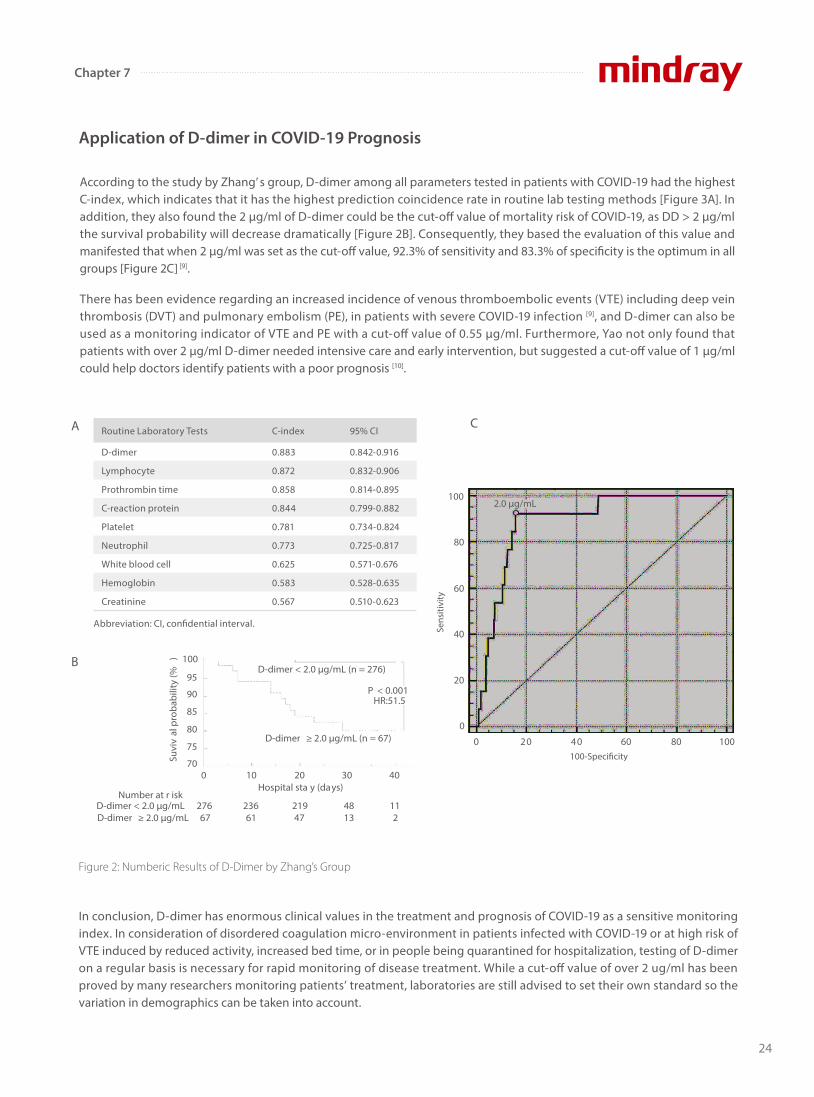
Figure 2: Numberic Results of D-Dimer by Zhang’s Group
According to the study by Zhang’ s group, D-dimer among all parameters tested in patients with COVID-19 had the highest C-index, which indicates that it has the highest prediction coincidence rate in routine lab testing methods [Figure 3A]. In addition, they also found the 2 μg/ml of D-dimer could be the cut-o� value of mortality risk of COVID-19, as DD > 2 μg/ml the survival probability will decrease dramatically [Figure 2B]. Consequently, they based the evaluation of this value and manifested that when 2 μg/ml was set as the cut-o� value, 92.3% of sensitivity and 83.3% of specificity is the optimum in all groups [Figure 2C] [9].
There has been evidence regarding an increased incidence of venous thromboembolic events (VTE) including deep vein thrombosis (DVT) and pulmonary embolism (PE), in patients with severe COVID-19 infection [9], and D-dimer can also be used as a monitoring indicator of VTE and PE with a cut-o� value of 0.55 μg/ml. Furthermore, Yao not only found that patients with over 2 μg/ml D-dimer needed intensive care and early intervention, but suggested a cut-o� value of 1 μg/ml could help doctors identify patients with a poor prognosis [10].
Application of D-dimer in COVID-19 Prognosis
A
B
C
2.0 µg/mL
80
100
60
Sens
itivi
ty
40
20
0
0 20 40100-Speci�city
60 80 100
Routine Laboratory Tests C-index 95% CI
D-dimer 0.883 0.842-0.916
Lymphocyte 0.872 0.832-0.906
Prothrombin time 0.858 0.814-0.895
C-reaction protein 0.844 0.799-0.882
Platelet 0.781 0.734-0.824
Neutrophil 0.773 0.725-0.817
White blood cell 0.625 0.571-0.676
Hemoglobin 0.583 0.528-0.635
Creatinine 0.567 0.510-0.623
Abbreviation: CI, con�dential interval.
0
Suvi
val
pro
babi
lity
(%)
70
80
90
100
75
85
95
10 20 30
P < 0.001HR:51.5
40
236 219
Hospital sta y (days)
48 11276Number at r isk
D-dimer < 2.0 µg/mLD-dimer ≥ 2.0 µg/mL
D-dimer ≥ 2.0 µg/mL (n = 67)
D-dimer < 2.0 µg/mL (n = 276)
67 61 47 13 2
24
Chapter 7

Mindray’ s auto-coagulation analyzers C3100 & C3510 are equipped with both classic mechanical and optical detection mechanisms. The mechanical methodology is insensitive to interference from icteric, lipemic, chylus and hemolytic samples. Moreover, the patented VRIM(VLin-Rate Integrative Method) algorithm has also been developed to combine “Two Point End Method” at a low D-dimer concentration together with “Rate Method” at a higher level [Figure 3]. This has enabled a much wider linearity range of D-dimer results compared with other models on the market [Figure 4].
Mindray’s Coagulation D-dimer Solution
In addition, Mindray’ s coagulation solution to D-dimer testing is less susceptible to common interferents. As is shown in [Figure 5], when the serum samples are added with bilirubin, hemoglobin, triglycerides and rheumatoid factors at respective concentration, D-dimer results remain at constant levels as before. The Comparison study with Sysmex CS5100 has also shown a good correlation with R2> 97% with interferents added.
Figure 3: Mindray’s patented VRIM Algorithm for D-dimer testing
Patented VRIM Algorithm
Two Point End MethodRepeatability at low Level
Small linearity range
Minimized interferences at low level
Rate MethodRepeatability at high level
Large linearity range
Susceptible to Interferences at high level
Take start/end-timepoint to draw the graph
3200
3000
2800
2400
2200
2000
1800
14000 20 40 60 80 100 120 140
Lum
inou
s Fl
ux
time(s)
LinearityRange
MaximizedReaction Rate
Take the slope oflinearity range tocalculate absorbance
Curve Fitting0.6
0.5
0.4
0.3
0.2
0.1
0 0 50 100 150
Abs
orba
nce
time(s)
Combine
High Repeatability
Wide Linearity Range
Anti-interferences
Smooth Transition
Figure 4: Comparison of Linearity Range (without dilution) between Mindray and other brands
Manufacturer
Brand A
Brand C
Mindray
Brand B
Algorithm
Rate
Two Point End
VRIM
Two Point End
Linearity Range( µg/ml)
0.20~8.0
0.17~4.4
0.15~3.7
0.22~3.0
25
Chapter 7
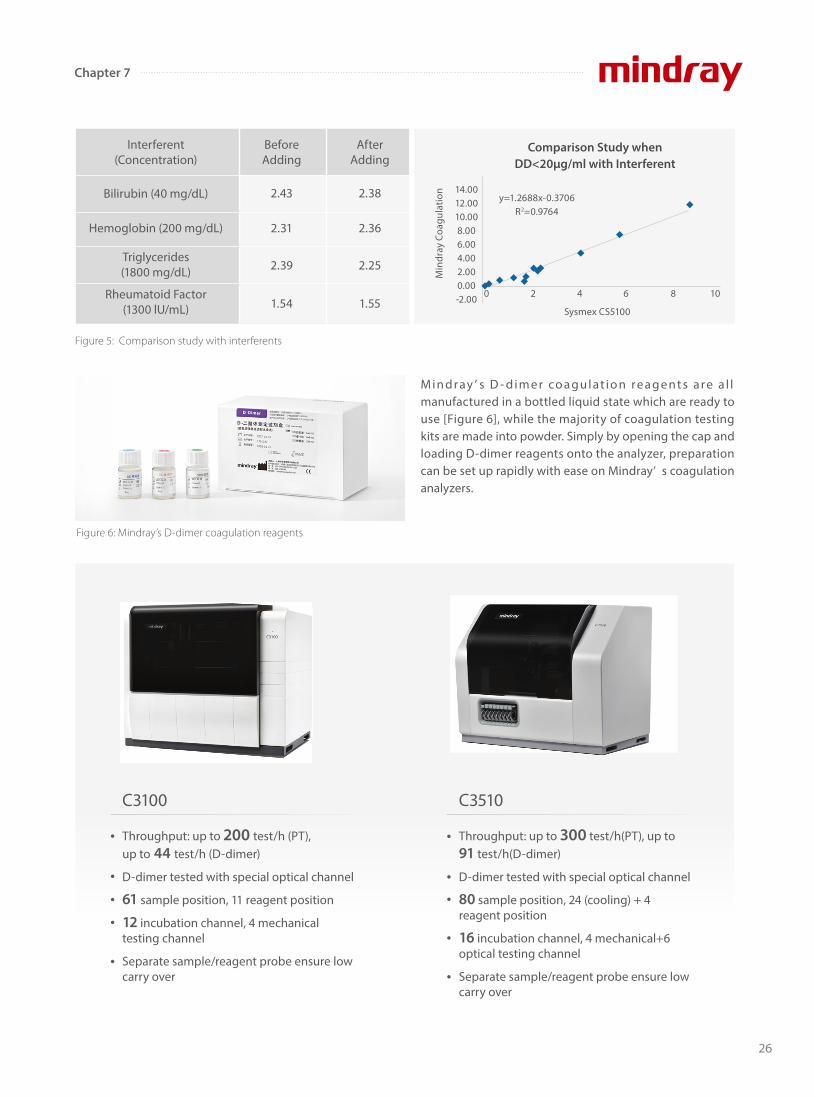
Figure 5: Comparison study with interferents
Throughput: up to 200 test/h (PT), up to 44 test/h (D-dimer)
D-dimer tested with special optical channel
61 sample position, 11 reagent position
12 incubation channel, 4 mechanical testing channel
Separate sample/reagent probe ensure low carry over
Throughput: up to 300 test/h(PT), up to 91 test/h(D-dimer)
D-dimer tested with special optical channel
80 sample position, 24 (cooling) + 4 reagent position
16 incubation channel, 4 mechanical+6 optical testing channel
Separate sample/reagent probe ensure low carry over
C3100 C3510
M i n d r ay ’ s D - d i m e r co a g u l at i o n r e a g e nt s a r e a l l manufactured in a bottled liquid state which are ready to use [Figure 6], while the majority of coagulation testing kits are made into powder. Simply by opening the cap and loading D-dimer reagents onto the analyzer, preparation can be set up rapidly with ease on Mindray’ s coagulation analyzers.
Interferent(Concentration)
Triglycerides (1800 mg/dL)
Rheumatoid Factor(1300 lU/mL)
Bilirubin (40 mg/dL)
Hemoglobin (200 mg/dL)
AfterAdding
2.38
2.36
2.25
1.55
BeforeAdding
2.43
2.31
2.39
1.54
14.0012.0010.008.006.004.002.000.00-2.00
Comparison Study when DD<20µg/ml with Interferent
Min
dray
Coa
gula
tion
Sysmex CS5100
y=1.2688x-0.3706R2=0.9764
0 2 4 6 8 10
Figure 6: Mindray’s D-dimer coagulation reagents
26
Chapter 7

References:
[1] Behl T., Kaur I., Bungau S., Kumar A., Uddin M. S., Kumar C., et al. (2020). The dual impact of ACE2 in COVID-19 and ironical actions in geriatrics
and pediatrics with possible therapeutic solutions. Life Sci. 257, 118075. 10.1016/j.lfs.2020.118075
[2] Tian S, Hu W, Niu L, Liu H, Xu H, Xiao SY. Pulmonary pathology of early phase 2019 novel coronavirus (COVID-19) pneumonia in two patients
with lung cancer. J Thorac Oncol. 2020
[3] Chousterman BG, Swirski FK, Weber GF. Cytokine storm and sepsis disease pathogenesis. Semin Immunopathol. 2017;39(5):517–28.
[4] Ding YQ, Bian XW. Analysis of coronavirus disease-19 (covid-19). Chin J Pathol. 2020;49(00):E003.
[5] Tang N., Li D., Wang X., Sun Z. (2020. b). Abnormal coagulation parameters are associated with poor prognosis in patients with novel
coronavirus pneumonia. J. Thromb. Haemost. 18, 844–847. 10.1111/jth.14768
[6] Dawei Wang, Bo Hu ,et al. Clinical Characteristics of 138 hospitalized patients with 2019 novel Coronavirus-Infected Pneumonia in Wuhan,Chi-
na[J]. JAMA. 2020.
[7] Fei Zhou., MD,a., Ting Yu., MD,b. Clinical course and risk factors for mortality of adult inpatients with COVID-19 in Wuhan, China: a retrospec-
tive cohort study. Lancet. 2020 28 March-3 April; 395(10229): 1054–1062.
[8] Shah Siddharth., Shah Kuldeep., Patel Siddharth B., Patel Foram S., Osman Mohammed., Velagapudi Poonam., Turagam Mohit K., Lakkireddy
Dhanunjaya., Garg Jalaj.(2020). Elevated D-Dimer Levels Are Associated With Increased Risk of Mortality in Coronavirus Disease 2019: A Systemat-
ic Review and Meta-Analysis. Cardiol Rev, 28(6), 295-302. doi:10.1097/CRD.0000000000000330
[9] Zhang Y, Xiao M, Zhang S, et al. Coagulopathy and antiphospholipid antibodies in patients with Covid-19. N Engl J Med. 2020;382:e38.
[10] Simadibrata Daniel Martin., Lubis Anna Mira.(2020). D-dimer levels on admission and all-cause mortality risk in COVID-19 patients: a
meta-analysis. Epidemiol Infect, 148(undefined), e202. doi:10.1017/S0950268820002022
27
Chapter 7
As of January 26th, 2021, the coronavirus disease 2019 (COVID-19) pandemic has a�ected over 100 million people worldwide. Vaccination would help improve the situation in future. However, at this time, identifying patients at highest risk for severe disease is important. In order to facilitate early intervention and to manage local hospital resources to mitigate the critical care crises, our smart doctors conduct research in routine, low-cost, and suggestive parameters to assist with COVID-19 prognosis and the identi�cation of severe cases[1] [2] [3].
In�ammatory parameters, such as white blood cell count (WBC), neutrophil count, neutrophil-to-lymphocyte ratio (NLR) could support COVID-19 diagnosis and prognosis. How about red blood cells?
Dr. Wang compared hematological results from the good and poor outcome groups and found the best single parameter for predicting the prognosis of severe patients is RDW-SD[4 ,7]. What’s more, combined parameters Lym# & RDW-CV as well as Lym# & RDW-SD are better for predicting the prognosis of severe COVID-19 (Figure 2)[7].
Have You Noticed the Changes of Red Blood Cells in COVID-19?
Figure 2. Prediction analysis of hematology parameters and the outcomes of patients with severe COVID-19. (A) ROC curve, the single parameter for predicting the prognosis of ill patients; (B) ROC curve, joint parameters for predicting the prognosis of ill patients; (C) the linearly fitted schematic scatter plot for Lym# & RDW-SD; (D) comparison of Lym# & RDW-SD in ill patients with different progno-ses. Lym# & RDW-SD: joint parameter generated after linear fitting of Lym# and RDW-SD. ****, P<0.0001.
Monitoring
Dynamic measurement of hematological co-variates
Predicting
Good outcomeSevere
Poor outcome
Di�erentiating
Combined parameter ROCSingle parameter ROC
100
80
60
40
20
0
Sens
itivi
ty%
100
80
60
40
20
0
Sens
itivi
ty%
Lym#
HGB
RDW-CV
RDW-SD
Lym#&RDW-CV
Lym#&RDW-SD
HGB&RDW-SD
001 0 20 40 60 80100%-Speci�city%
001 0 20 40 60 80100%-Speci�city%
55
50
45
40
35
RDW
-SD
6
4
2
0
–2
–4
Lym
#&RD
W-S
D
Good outcome
Poor outcome
Fit line
0 1 2 3Lym# (10 9/L)
Scatter gram Lym#&RDW-SD****
A B
C D
Good outcome
Poor outcome
Observed erythrocytes changes in critically ill patients
Moderate Severe
Figure 1. Applications of routine blood tests.
28
Chapter 8

Another article from Dr. Wang[6] described that many hematological parameters changed as the disease progressed, including NLR, RDW-CV, RDW-SD. The combined parameters of NLR & RDW-SD, as generated by linear �tting, had the better diagnostic e�ciency (AUC =0.938), which was the best one among single parameters (Figure 3). When the cut-o� value was 1.046, the sensitivity for distinguishing the severe cases from the moderate cases of COVID-19 was 90.0% while the speci�city was 84.7%.
Dr. Zhang has found that HGB is lower in the severe group than in the moderate group[5]. New joint parameters Lym% & HGB have the best sensitivity and speci�city (Table1). So Lym% & HGB can be used as indicators of disease prognosis..
Table 1. Receiver operating characteristic analysis results for the three parameters
ROC curve
RDW-SDRDW-CVMCHPLRNLRBaso#Neu#WBC
NLR & RDW-SD
NLR & RDW-CV
Sens
itivi
ty%
Sens
itivi
ty%
0 20 40 60 80 100100%-Speci�city%
NLR & RDW-CV
Moderate Severe Moderate Severe
10
5
0
10
5
0
NLR & RDW-SD
* *
0 20 40 60 80 100100%-Speci�city%
100
80
60
40
20
0
100
80
60
40
20
0
ROC curveB
D
A
C
Parameter
Lym (%)
HGB (g/L)
Lym% & HGB
AUC
0.89
0.79
0.92
95% CI
0.88-0.91
0.76-0.81
0.91-0.94
Cuto�
18.8
116
0.481
Sensitivity
85.6%
71.1%
88.9%
Speci�city
77.5%
77.2%
79.8%
Predict value (+)
0.83
0.80
0.85
Predict value (-)
0.81
0.68
0.85
AUC, area under the ROC; Lym%, percentage of lymphocytes; HGB, hemoglobin.
29
Chapter 8
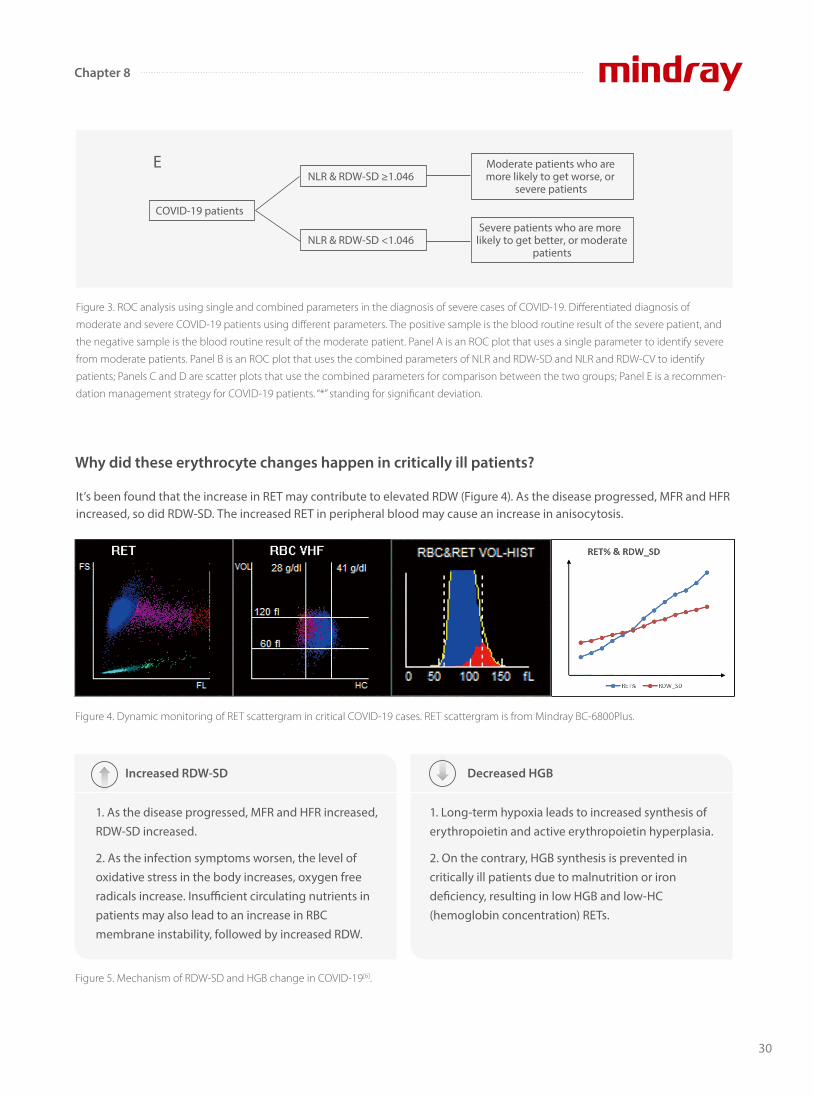
Figure 4. Dynamic monitoring of RET scattergram in critical COVID-19 cases. RET scattergram is from Mindray BC-6800Plus.
Figure 5. Mechanism of RDW-SD and HGB change in COVID-19[6].
Figure 3. ROC analysis using single and combined parameters in the diagnosis of severe cases of COVID-19. Differentiated diagnosis of
moderate and severe COVID-19 patients using different parameters. The positive sample is the blood routine result of the severe patient, and
the negative sample is the blood routine result of the moderate patient. Panel A is an ROC plot that uses a single parameter to identify severe
from moderate patients. Panel B is an ROC plot that uses the combined parameters of NLR and RDW-SD and NLR and RDW-CV to identify
patients; Panels C and D are scatter plots that use the combined parameters for comparison between the two groups; Panel E is a recommen-
dation management strategy for COVID-19 patients. “*” standing for significant deviation.
It’s been found that the increase in RET may contribute to elevated RDW (Figure 4). As the disease progressed, MFR and HFR increased, so did RDW-SD. The increased RET in peripheral blood may cause an increase in anisocytosis.
Why did these erythrocyte changes happen in critically ill patients?
COVID-19 patients
NLR & RDW-SD ≥1.046Moderate patients who are more likely to get worse, or
severe patients
Severe patients who are more likely to get better, or moderate
patientsNLR & RDW-SD <1.046
E
Increased RDW-SD Decreased HGB
1. As the disease progressed, MFR and HFR increased, RDW-SD increased.
2. As the infection symptoms worsen, the level of oxidative stress in the body increases, oxygen free radicals increase. Insu�cient circulating nutrients in patients may also lead to an increase in RBC membrane instability, followed by increased RDW.
1. Long-term hypoxia leads to increased synthesis of erythropoietin and active erythropoietin hyperplasia.
2. On the contrary, HGB synthesis is prevented in critically ill patients due to malnutrition or iron de�ciency, resulting in low HGB and low-HC (hemoglobin concentration) RETs.
30
Chapter 8
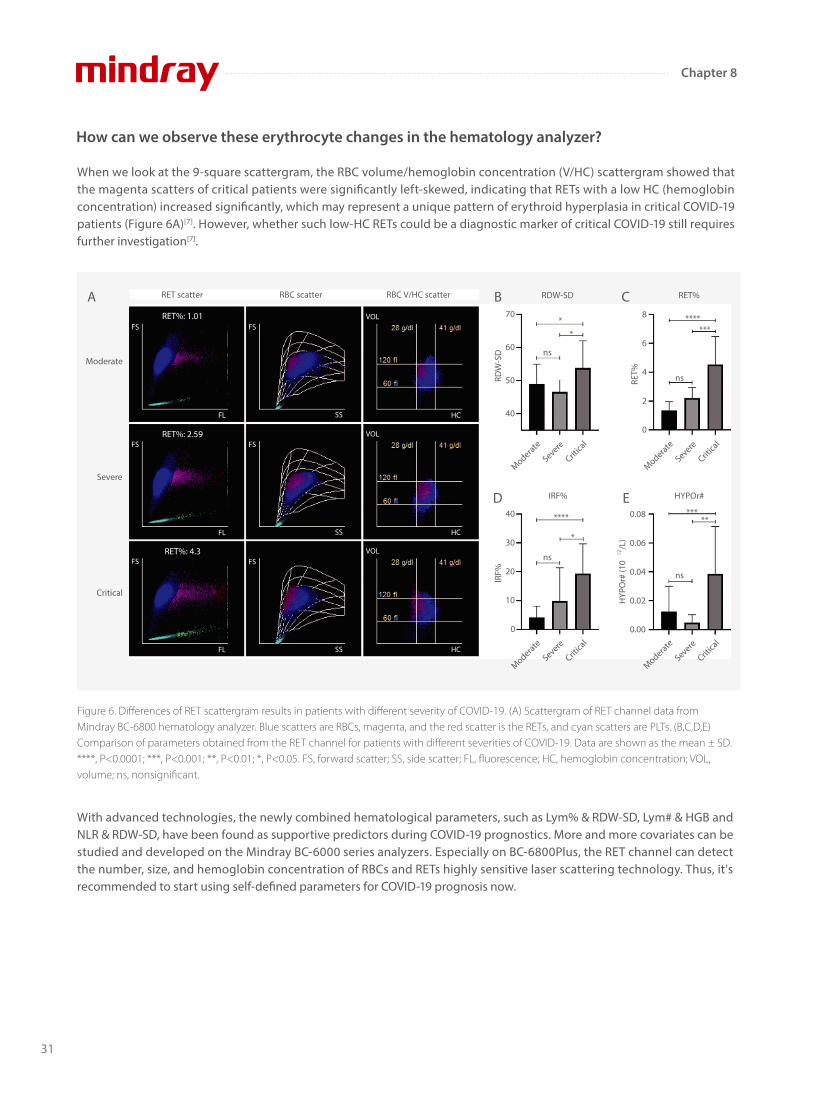
When we look at the 9-square scattergram, the RBC volume/hemoglobin concentration (V/HC) scattergram showed that the magenta scatters of critical patients were signi�cantly left-skewed, indicating that RETs with a low HC (hemoglobin concentration) increased signi�cantly, which may represent a unique pattern of erythroid hyperplasia in critical COVID-19 patients (Figure 6A)[7]. However, whether such low-HC RETs could be a diagnostic marker of critical COVID-19 still requires further investigation[7].
With advanced technologies, the newly combined hematological parameters, such as Lym% & RDW-SD, Lym# & HGB and NLR & RDW-SD, have been found as supportive predictors during COVID-19 prognostics. More and more covariates can be studied and developed on the Mindray BC-6000 series analyzers. Especially on BC-6800Plus, the RET channel can detect the number, size, and hemoglobin concentration of RBCs and RETs highly sensitive laser scattering technology. Thus, it's recommended to start using self-defined parameters for COVID-19 prognosis now.
How can we observe these erythrocyte changes in the hematology analyzer?
Figure 6. Differences of RET scattergram results in patients with different severity of COVID-19. (A) Scattergram of RET channel data from Mindray BC-6800 hematology analyzer. Blue scatters are RBCs, magenta, and the red scatter is the RETs, and cyan scatters are PLTs. (B,C,D,E) Comparison of parameters obtained from the RET channel for patients with different severities of COVID-19. Data are shown as the mean ± SD. ****, P<0.0001; ***, P<0.001; **, P<0.01; *, P<0.05. FS, forward scatter; SS, side scatter; FL, fluorescence; HC, hemoglobin concentration; VOL, volume; ns, nonsignificant.
Moderate
Severe
Critical
Moderate
Severe
Critica
l
Moderate
Severe
Critica
l
Moderate
Severe
Critica
l
Moderate
Severe
Critica
l
RET scatter RBC scatter RBC V/HC scatter RET%
HYPOr#
RDW-SD
IRF%
**** *****
70
60
50
40
RDW
-SD
40
30
20
10
0
IRF%
0.08
0.06
0.04
0.02
0.00H
YPO
r# (1
012
/L)
8
6
4
2
0
RET%
**
*******
*
ns
ns
ns
ns
A B
D
C
E
RET%: 1.01FS
FL
FS
SS
FS
SS
FS
SS
FS
FL
FS
FL
RET%: 2.59
RET%: 4.3
VOL
VOL
VOL
HC
HC
HC
31
Chapter 8
References:
[1] Ghahramani, S., Tabrizi, R., Lankarani, K.B. et al. Laboratory features of severe vs. non-severe COVID-19 patients in Asian populations: a
systematic review and meta-analysis. Eur J Med Res 25, 30 (2020).
[2] Li, Q., Cao, Y., Chen, L. et al. Hematological features of persons with COVID-19. Leukemia 34, 2163–2172 (2020).
[3] Wang D, Hu B, Hu C, et al. Clinical Characteristics of 138 Hospitalized Patients With 2019 Novel Coronavirus–Infected Pneumonia in Wuhan,
China. JAMA. 2020;323(11):1061–1069.
[4] Henry BM, Benoit JL, Benoit S, Pulvino C, Berger BA, Olivera MHS, Crutchfield CA, Lippi G. Red Blood Cell Distribution Width (RDW) Predicts
COVID-19 Severity: A Prospective, Observational Study from the Cincinnati SARS-CoV-2 Emergency Department Cohort. Diagnostics (Basel). 2020
Aug 21;10(9):618.
[5] Zhang W, Zhang Z, Ye Y, Luo Y, Pan S, Qi H, Yu Z, Qu J. Lymphocyte percentage and hemoglobin as a joint parameter for the prediction of
severe and nonsevere COVID-19: a preliminary study. Ann Transl Med. 2020 Oct;8(19):1231.
[6] Wang C, Deng R, Gou L, et al. Preliminary study to identify severe from moderate cases of COVID-19 using combined hematology parameters.
Ann Transl Med. 2020;8(9):593. doi:10.21037/atm-20-3391.
[7] Wang C, Zhang H, Cao X, et al. Red cell distribution width (RDW): a prognostic indicator of severe COVID-19[J]. Annals of translational
medicine, 2020, 8(19).
32
Chapter 8

Is prophylactic anticoagulant therapy a common
treatment for clinicians to deal with thrombotic events in
COVID-19?
Is there a connection between the eosinophil count and
anticoagulation monitoring in COVID-19 patients?
Thrombosis has emerged as an important complication
among hospitalized patients with COVID-19. A prothrom-
botic state induced by SARS-Cov-2 can manifest in
venous thromboembolism (VTE), arterial thrombosis and
disseminated intravenous coagulation (DIC). [1]
In 28 studies including 2928 patients, thrombotic compli-
cations occurred in 34% of ICU patients, deep venous
thrombosis (DVT) reported in 16.1% and pulmonary
embolism in 12.6% of patients, and were associated with
high mortality. [2]
Thrombotic events in COVID-19 patients
Low molecular weight heparin (LMWH) and unfractionated heparin (UFH) are recommended by the international society for
thrombosis on hemostasis (ISTH), American Society of Hematology (ASH) for the treatment of thrombotic events associated
with SARS-CoV-2 infection. Particularly, LMWH has a stronger antithrombotic e�ect than UFH.
Antithrombotic treatment of low molecular weight heparin in COVID-19 patients
Common parameter, new application
How Does Eosinophil Count Change in COVID-19 Patients?
Figure 1. Possible venous and arterial thrombotic complications associated with COVID-19. [1]
Stroke
Pulmonary embolism/thrombosis
Myocardial infarction
DVT
33
Chapter 9

LMWH predominantly acts on factor Xa. For this reason,
LMWH activity is monitored using serum anti-factor Xa
activity (AFXa) levels instead of activated Partial Thrombo-
plastin Time (aPTT) ( Figure 2). [3]
Enoxaparin is one of the most important LMWH. The AFXa
level reached peak 3-5 hours after administration. The
AFXa levels below 0.2 IU/mL may increase the risk of VTE
in COVID-19 patients, due to the hypercoagulability. [4]
In the laboratory results, only eosinophil counts and AFXa
are signi�cantly di�erent between subprophylactic antico-
agulation group and prophylactic anticoagulation group
when the patients are admitted to hospital (Table 1). [5]
LMWH dose monitoring
Dr. Selma Ari has found the increased eosinophil count is
associated with the level of subprophylactic anticoagula-
tion in COVID-19 patients. [5]
Eosinophil counts in antithrombotic treatment to COVID-19 patients
Figure 2. The antithrombotic mechanism of LMWH. [3]
LMWH Antithrombin Factor Xa
Polysaccharide sequence
Figure 3. Variation in AFXa over time for each dose of enoxaparin. [4]
AFXa levels after sc administration of enoxaparin
0
00.
10.
20.
3
5
40 mg
50 mg
60 mg
70 mg
10 15 20 25
Hours after administration
AFX
a ni
veau
in IU
/ml
Variable
Subprophylactic anticoagulation group
(13 patients) anti-factor Xa < 0.2 IU/mL
p value
Prophylactic anticoagulation group
(67 patients)anti-factor Xa > 0.2 IU/mL
Table 1 Results of laboratory parameters at admission
Parameters whose p<0.05 are written in italics
WBC X103 /mL
Neutrophil
Lymphocyte
Eosinophil (%)
Eosinophil count
Platelet X103 /mL
CRP (mg/L)
Fibrinogen (mg/dl)
D-dimer (µgr/mL)
PT
aPTT (s)
INR
Baseline anti-factor Xa level (IU/mL)
5.91 ± 1.31
3.57 ± 1.27
1.76 ± 0.60
2.96 ± 2.55
168.42 ± 147.25
232.00 ± 62.21
12.18 ± 16.66
367.08 ± 134.97
0.57 ± 0.38
11.55 ± 0.91
23.25 ± 3.24
0.95 ± 0.06
5.54 ± 1.89
3.51 ± 1.71
1.54 ± 0.66
0.90 ± 1.28
50.32 ± 73.42
197.57 ± 57.87
25.12 ± 31.04
410.00 ± 117.34
1.21 ± 3.35
11.82 ± 1.92
25.62 ± 8.45
0.96 ± 0.19
0.51
0.91
0.25
0.001
0.001
0.06
0.08
0.24
0.50
0.62
0.32
0.89
0.18 ± 0.06 0.43 ± 0.23 <0.001
Variable
Subprophylactic anticoagulation group
(13 patients) anti-factor Xa < 0.2 IU/mL
p value
Prophylactic anticoagulation group
(67 patients)anti-factor Xa > 0.2 IU/mL
Table 2 Results of laboratory parameters before discharge
Parameters whose p<0.05 are written in italics
WBC X103 /mL
Neutrophil
Lymphocyte
Eosinophil (%)
Eosinophil count
Platelet X103 /mL
CRP (mg/L)
Fibrinogen (mg/dl)
D-dimer (µgr/mL)
PT
aPTT (s)
INR
6.25 ± 0.82
3.81 ± 1.14
1.81 ± 0.69
3.06 ± 1.49
182.49 ± 95.81
264.42 ± 117.14
8.54 ± 11.47
377.33 ± 145.03
0.72 ± 0.77
11.72 ± 0.59
22.34 ± 1.38
0.96 ± 0.05
5.55 ± 1.95
3.26 ± 1.58
1.79 ± 0.78
2.07 ± 1.92
112.18 ± 102.54
226.94 ± 89.08
19.45 ± 35.44
416.98 ± 148.71
0.78 ± 1.08
11.93 ± 1.28
24.38 ± 3.58
0.98 ± 0.11
0.08
0.08
0.52
0.001
0.009
0.25
0.19
0.31
0.91
0.65
0.01
0.46
0.16 ± 0.04 0.53 ± 0.26 <0.001Control anti-factor
Xa level (IU/mL)
34
Chapter 9
Laboratory analysis collected before the discharge of
patients revealed that eosinophil counts in subprophylac-
tic anticoagulation group were higher than in prophylac-
tic anticoagulation group , whereas AFXa were lower in
subprophylactic anticoagulation group (Table 2). [5]
Eosinophil induces platelet aggregation and thrombus
formation through the production of major basic protein
(MBP) and eosinophil peroxidase (EPX). [6]
Enzymes released from eosinophils (peroxidases, cationic
proteins, and neurotoxins) may decrease the anticoagu-
lant activity of heparin. [7]
In this study, in subprophylactic anticoagulation group,
high eosinophil levels had lower anticoagulant activity in
COVID-19 patients. Eosinophil counts were examined with
Mindray BC- 6800 auto hematology analyzer. Its SF Cube
analysis technology can produce three-dimensional
scattergram which can help doctors better identify and
di�erentiate blood cell populations, especially to reveal
abnormal cell population undetected by other techniques.
Eosinophils and thrombosis
Figure 4. Eosinophil induces platelet aggregation.
Eosinophil Platelets
MBP EPX
Figure 5. SF Cube on Mindray BC-6800.
Nowadays a large number of parameters on BC-6800 can
be used in clinical diagnosis and scienti�c research. There
fore, clinicians are welcome to do more research on
COVID-19 on Mindray BC-6200/BC-6800/BC-6800Plus/
CAL 6000/CAL 8000.
[1] Godoy, L. C., Goligher, E. C., Lawler, P. R., Slutsky, A. S. & Zarychanski, R. Anticipating and managing coagulopathy and thrombotic manifestations of severe COVID-19. CMAJ 192, E1156-E1161, doi:10.1503/cmaj.201240 (2020).
[2] Jenner, W. J. et al. Thrombotic complications in 2928 patients with COVID-19 treated in intensive care: a systematic review. J Thromb Thrombolysis, doi:10.1007/s11239-021-02394-7 (2021).
[3] Lai, S. & Coppola, B. Use of enoxaparin in end-stage renal disease. Kidney Int 84, 433-436, doi:10.1038/ki.2013.163 (2013).
[4] Robinson, S. et al. Enoxaparin, effective dosage for intensive care patients: double-blinded, randomised clinical trial. Crit Care 14, R41, doi:10.1186/cc8924 (2010).
[5] Ari, S. et al. Elevated eosinophil count is related with lower anti-factor Xa activity in COVID-19 patients. J Hematop, 1-10, doi:10.1007/s12308-020-00419-3 (2020).
[6] Varricchi, G. et al. Reslizumab and Eosinophilic Asthma: One Step Closer to Precision Medicine? Front Immunol 8, 242, doi:10.3389/fimmu.2017.00242 (2017).
[7] Ames, P. R., Aloj, G. & Gentile, F. Eosinophilia and thrombosis in parasitic diseases: an overview. Clin Appl Thromb Hemost 17, 33-38, doi:10.1177/1076029609348314 (2011).
References
35
Chapter 9
Nowadays, hematology analyzers are used widely in
laboratories to automatically count and di�erentiate
blood cells. Nevertheless, blood morphology
examination for the presence of abnormal cells is still the
‘gold standard’ in the routine blood count. Microscopic
examination is the most valuable procedure in the
laboratory, which can suggest some disorders previously
identi�ed by the analyzer.
However, a skillful examination requires an experienced
technician, can take a long time, and is very labor
intensive. As a result, there is an increasing demand for
digital morphology systems which help to optimize the
labs’ work�ow by:
A digital morphology analyzer can automatically locate,
capture, and identify cells, which helps technicians to
check cell morphology easily on a big screen.
How Does a Digital Morphology System Help Labs to Optimize Their Work�ow?
Providing a reliable cell pre-classi�cation result using intelligent algorithms
36
Chapter 10
With the help of intelligent algorithms, a digital
morphology system can help to pre-classify di�erent
cells in di�erent groups and give a reliable
pre-classi�cation result.
A digital morphology system avoids inter-observer
variability and retains the same standard when
pre-classifying cells.
Generally, a manual morphology examination takes
around 10 mins, and more time is needed for
abnormal samples.
By using digital morphology systems, the average
examination only takes 2-3 minutes, which improves
lab e�ciency dramatically.
Improving the e�ciency of the morphology examination
With the help of cell digitalization, laboratories can
store slides and morphology results in a single PC
instead of storing a lot of conventional glass slides.
Enabling convenient data management and remote consultation
By using the remote review function, senior
technicians in satellite labs or even from home can
easily review the slide results sent from the core labs.
VS
10min 2-3min
37
Chapter 10

Today, an increasing number of advanced automated digital morphology systems have been developed and introduced to
the laboratory. These digital morphology systems optimize the labs’ work�ow by improving lab quality assurance, reducing
labor costs, providing the availability of morphology digitalization and enabling remote consultations.
Mindray is soon going to launch a brand new digital morphology system. Stay tuned as we bring you more updates!
38
Chapter 10
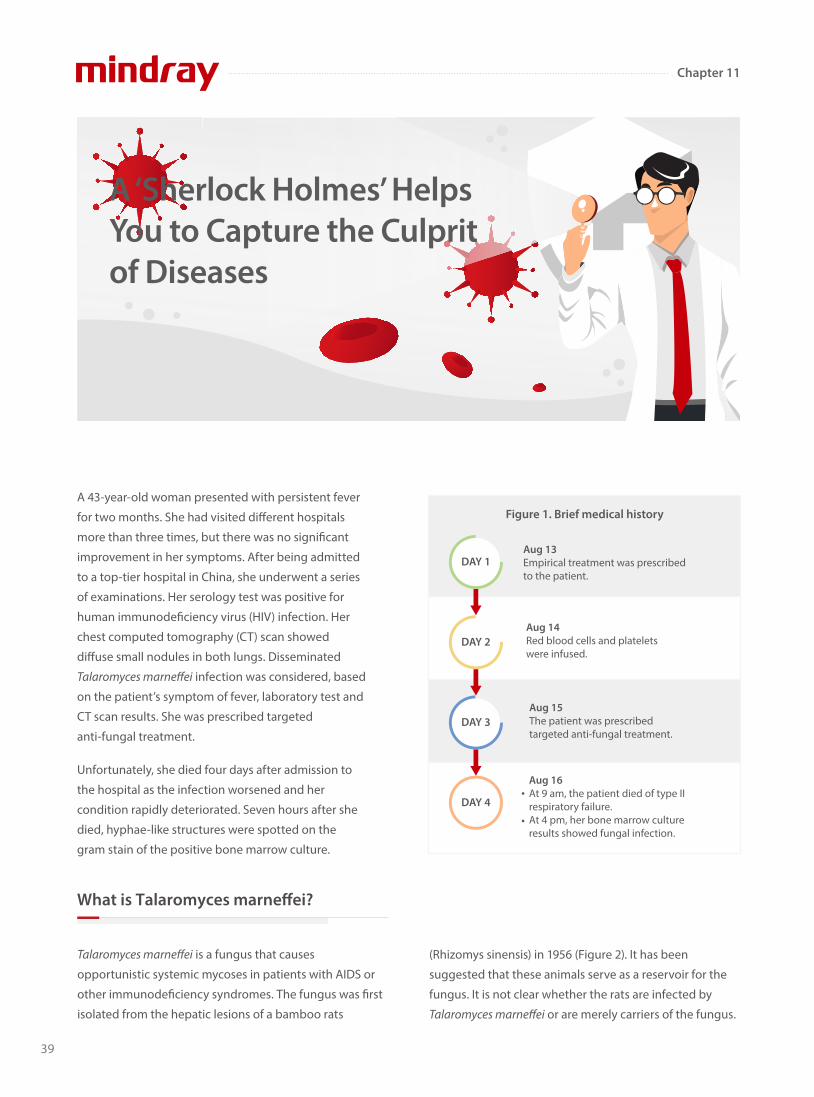
A 43-year-old woman presented with persistent fever
for two months. She had visited di�erent hospitals
more than three times, but there was no signi�cant
improvement in her symptoms. After being admitted
to a top-tier hospital in China, she underwent a series
of examinations. Her serology test was positive for
human immunode�ciency virus (HIV) infection. Her
chest computed tomography (CT) scan showed
di�use small nodules in both lungs. Disseminated
Talaromyces marneffei infection was considered, based
on the patient’s symptom of fever, laboratory test and
CT scan results. She was prescribed targeted
anti-fungal treatment.
Unfortunately, she died four days after admission to
the hospital as the infection worsened and her
condition rapidly deteriorated. Seven hours after she
died, hyphae-like structures were spotted on the
gram stain of the positive bone marrow culture.
Talaromyces marneffei is a fungus that causes
opportunistic systemic mycoses in patients with AIDS or
other immunode�ciency syndromes. The fungus was �rst
isolated from the hepatic lesions of a bamboo rats
What is Talaromyces marne�ei?
A ‘Sherlock Holmes’ Helps You to Capture the Culprit of Diseases
Aug 13 Empirical treatment was prescribed to the patient.
Aug 14Red blood cells and platelets were infused.
Aug 15The patient was prescribed targeted anti-fungal treatment.
Aug 16At 9 am, the patient died of type II respiratory failure.At 4 pm, her bone marrow culture results showed fungal infection.
DAY 1
DAY 2
DAY 3
DAY 4
Figure 1. Brief medical history
(Rhizomys sinensis) in 1956 (Figure 2). It has been
suggested that these animals serve as a reservoir for the
fungus. It is not clear whether the rats are infected by
Talaromyces marneffei or are merely carriers of the fungus.
39
Chapter 11
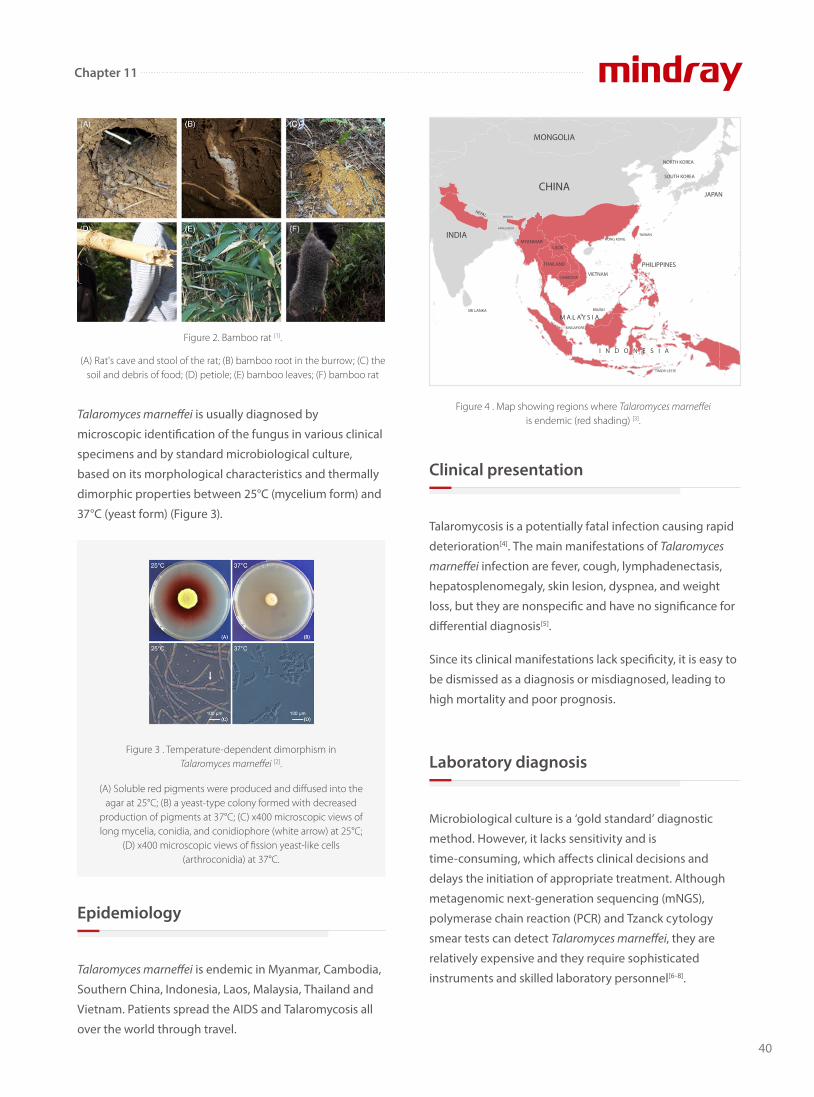
Talaromyces marneffei is usually diagnosed by
microscopic identi�cation of the fungus in various clinical
specimens and by standard microbiological culture,
based on its morphological characteristics and thermally
dimorphic properties between 25°C (mycelium form) and
37°C (yeast form) (Figure 3).
Talaromyces marneffei is endemic in Myanmar, Cambodia,
Southern China, Indonesia, Laos, Malaysia, Thailand and
Vietnam. Patients spread the AIDS and Talaromycosis all
over the world through travel.
Epidemiology
Talaromycosis is a potentially fatal infection causing rapid
deterioration[4]. The main manifestations of Talaromyces
marneffei infection are fever, cough, lymphadenectasis,
hepatosplenomegaly, skin lesion, dyspnea, and weight
loss, but they are nonspeci�c and have no signi�cance for
di�erential diagnosis[5].
Since its clinical manifestations lack speci�city, it is easy to
be dismissed as a diagnosis or misdiagnosed, leading to
high mortality and poor prognosis.
Clinical presentation
Microbiological culture is a ‘gold standard’ diagnostic
method. However, it lacks sensitivity and is
time-consuming, which a�ects clinical decisions and
delays the initiation of appropriate treatment. Although
metagenomic next-generation sequencing (mNGS),
polymerase chain reaction (PCR) and Tzanck cytology
smear tests can detect Talaromyces marneffei, they are
relatively expensive and they require sophisticated
instruments and skilled laboratory personnel[6-8].
Laboratory diagnosis
Figure 2. Bamboo rat [1].
(A) Rat's cave and stool of the rat; (B) bamboo root in the burrow; (C) the soil and debris of food; (D) petiole; (E) bamboo leaves; (F) bamboo rat
Figure 3 . Temperature-dependent dimorphism in Talaromyces marneffei [2].
(A) Soluble red pigments were produced and diffused into the agar at 25°C; (B) a yeast-type colony formed with decreased
production of pigments at 37°C; (C) x400 microscopic views of long mycelia, conidia, and conidiophore (white arrow) at 25°C;
(D) x400 microscopic views of fission yeast-like cells (arthroconidia) at 37°C.
Figure 4 . Map showing regions where Talaromyces marneffei is endemic (red shading) [3].
CHINA
INDIA
BHUTAN
BANGLADESH
MYANMARLAOS
THAILAND
CAMBODIA
SINGAPORE
BRUNEI
VIETNAM
TIMOR-LESTE
HONG KONGTAIWAN
PHILIPPINES
JAPAN
NORTH KOREA
SOUTH KOREA
M A L A Y S I A
I N D O N E S I A
SRI LANKA
NEPAL
MONGOLIA
40
Chapter 11
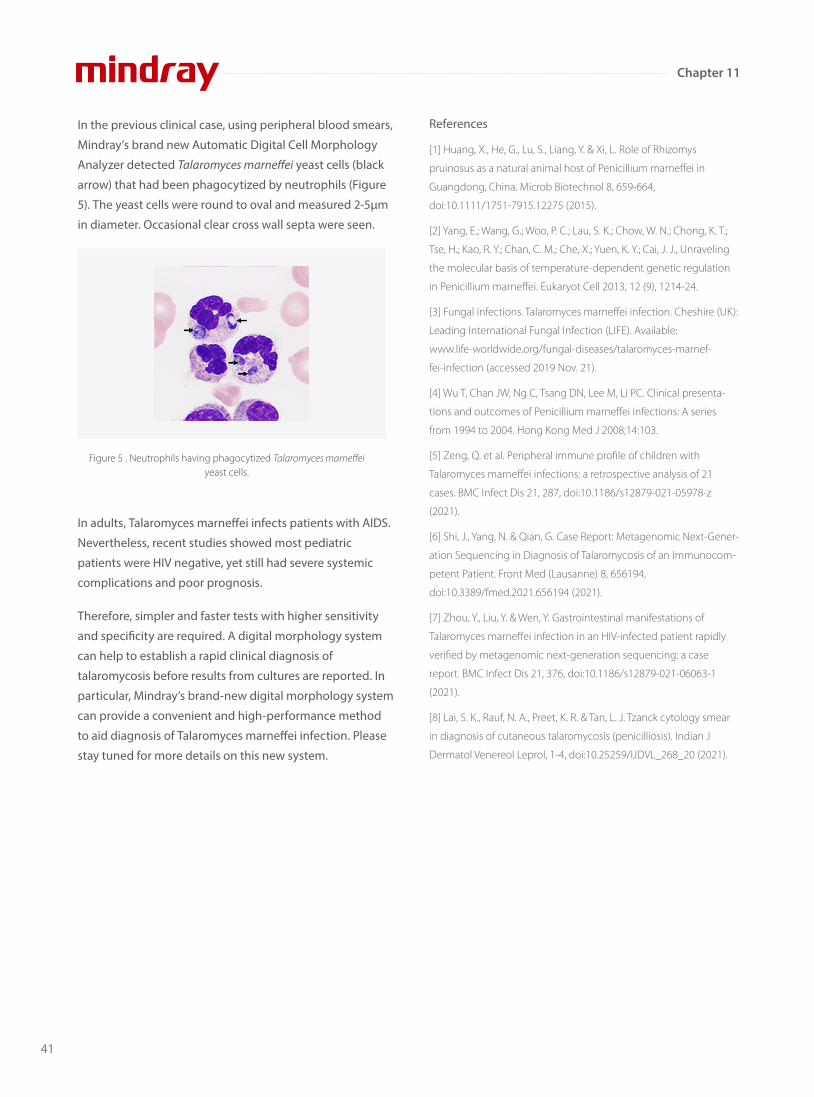
In the previous clinical case, using peripheral blood smears,
Mindray’s brand new Automatic Digital Cell Morphology
Analyzer detected Talaromyces marneffei yeast cells (black
arrow) that had been phagocytized by neutrophils (Figure
5). The yeast cells were round to oval and measured 2-5μm
in diameter. Occasional clear cross wall septa were seen.
In adults, Talaromyces marne�ei infects patients with AIDS.
Nevertheless, recent studies showed most pediatric
patients were HIV negative, yet still had severe systemic
complications and poor prognosis.
Therefore, simpler and faster tests with higher sensitivity
and speci�city are required. A digital morphology system
can help to establish a rapid clinical diagnosis of
talaromycosis before results from cultures are reported. In
particular, Mindray’s brand-new digital morphology system
can provide a convenient and high-performance method
to aid diagnosis of Talaromyces marne�ei infection. Please
stay tuned for more details on this new system.
Figure 5 . Neutrophils having phagocytized Talaromyces marneffei yeast cells.
References
[1] Huang, X., He, G., Lu, S., Liang, Y. & Xi, L. Role of Rhizomys
pruinosus as a natural animal host of Penicillium marneffei in
Guangdong, China. Microb Biotechnol 8, 659-664,
doi:10.1111/1751-7915.12275 (2015).
[2] Yang, E.; Wang, G.; Woo, P. C.; Lau, S. K.; Chow, W. N.; Chong, K. T.;
Tse, H.; Kao, R. Y.; Chan, C. M.; Che, X.; Yuen, K. Y.; Cai, J. J., Unraveling
the molecular basis of temperature-dependent genetic regulation
in Penicillium marneffei. Eukaryot Cell 2013, 12 (9), 1214-24.
[3] Fungal infections. Talaromyces marneffei infection. Cheshire (UK):
Leading International Fungal Infection (LIFE). Available:
www.life-worldwide.org/fungal-diseases/talaromyces-marnef-
fei-infection (accessed 2019 Nov. 21).
[4] Wu T, Chan JW, Ng C, Tsang DN, Lee M, Li PC. Clinical presenta-
tions and outcomes of Penicillium marneffei infections: A series
from 1994 to 2004. Hong Kong Med J 2008;14:103.
[5] Zeng, Q. et al. Peripheral immune profile of children with
Talaromyces marneffei infections: a retrospective analysis of 21
cases. BMC Infect Dis 21, 287, doi:10.1186/s12879-021-05978-z
(2021).
[6] Shi, J., Yang, N. & Qian, G. Case Report: Metagenomic Next-Gener-
ation Sequencing in Diagnosis of Talaromycosis of an Immunocom-
petent Patient. Front Med (Lausanne) 8, 656194,
doi:10.3389/fmed.2021.656194 (2021).
[7] Zhou, Y., Liu, Y. & Wen, Y. Gastrointestinal manifestations of
Talaromyces marneffei infection in an HIV-infected patient rapidly
verified by metagenomic next-generation sequencing: a case
report. BMC Infect Dis 21, 376, doi:10.1186/s12879-021-06063-1
(2021).
[8] Lai, S. K., Rauf, N. A., Preet, K. R. & Tan, L. J. Tzanck cytology smear
in diagnosis of cutaneous talaromycosis (penicilliosis). Indian J
Dermatol Venereol Leprol, 1-4, doi:10.25259/IJDVL_268_20 (2021).
41
Chapter 11

A Clearer Truth? Find it Faster!
In the laboratory, what is the most common reason for you to gather with colleagues to look at and discuss samples or
patient results on the screen or in a report?
The answers may vary. One of the reasons may be to discuss the special cell cases you �nd in a morphological examination.
The routine hematology analysis is one of the most important screening tools among in-vitro diagnostics methods. The
professionalism of the pathologist guarantees fast and accurate diagnosis based on the results from hematology analysis.
Experienced and skilled cell morphology experts, in particular, play a vital role in it.
According to the IDF, there are approximately 232 million
people with undiagnosed DM worldwide. Many
guidelines tend to suggest DM screening in the
population with or without speci�c medical conditions,
and HbA1c is a convenient test to meet this objective. [2]
Unlike glucose tests, HbA1c is not a�ected by recent food
intake, so patients do not have to fast or intake certain
quantities of glucose before the test. Accompanied with
medical history and some auxiliary evidence, doctors can
make the DM diagnosis if the patient’s HbA1c matches
the criteria.
The hematology results showed pancytopenia and
�agged many causes for concern, including anemia,
thrombocytopenia, white blood cell abnormal
scattergram, and immature granulocytes.
A Clinical Case
μmol/LkPa
Hypertension Hyperuricemia
Sore throat Rheumatism
The re-exam rule was triggered, so the doctor carried out
the smear and stained it in the slide marker. The current
digital cell morphology system read the blood smear
automatically, and a high percentage of blasts and a few
immature granulocytes were found.
42
Chapter 12
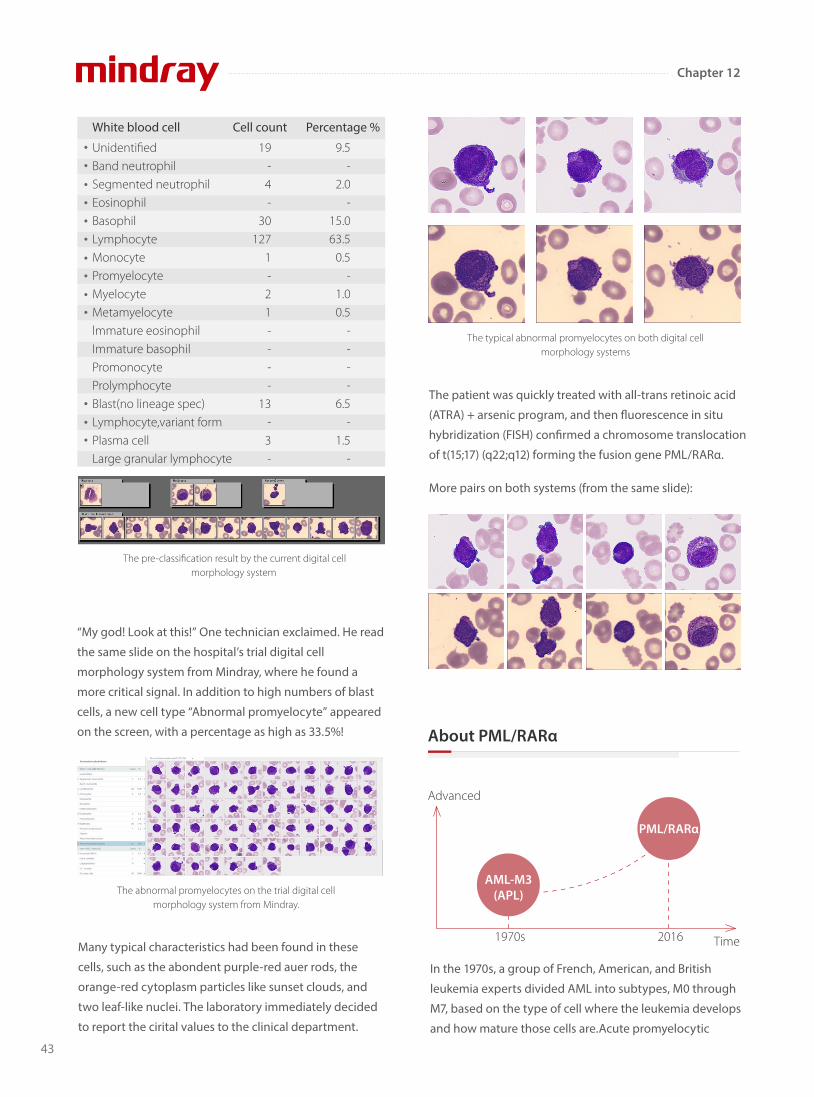
UnidentifiedBand neutrophilSegmented neutrophilEosinophilBasophilLymphocyteMonocytePromyelocyteMyelocyteMetamyelocytelmmature eosinophilImmature basophilPromonocyteProlymphocyteBlast(no lineage spec)Lymphocyte,variant formPlasma cellLarge granular lymphocyte
19- 4-
30127
1-21----
13-3-
9.5-
2.0-
15.063.5
0.5-
1.00.5
----
6.5-
1.5-
White blood cell Cell count Percentage %
The pre-classification result by the current digital cell morphology system
The abnormal promyelocytes on the trial digital cell morphology system from Mindray.
“My god! Look at this!” One technician exclaimed. He read
the same slide on the hospital’s trial digital cell
morphology system from Mindray, where he found a
more critical signal. In addition to high numbers of blast
cells, a new cell type “Abnormal promyelocyte” appeared
on the screen, with a percentage as high as 33.5%!
The typical abnormal promyelocytes on both digital cell morphology systems
Many typical characteristics had been found in these
cells, such as the abondent purple-red auer rods, the
orange-red cytoplasm particles like sunset clouds, and
two leaf-like nuclei. The laboratory immediately decided
to report the cirital values to the clinical department.
The patient was quickly treated with all-trans retinoic acid
(ATRA) + arsenic program, and then �uorescence in situ
hybridization (FISH) con�rmed a chromosome translocation
of t(15;17) (q22;q12) forming the fusion gene PML/RARα.
More pairs on both systems (from the same slide):
Time
PML/RARα
Advanced
AML-M3(APL)
1970s 2016
In the 1970s, a group of French, American, and British
leukemia experts divided AML into subtypes, M0 through
M7, based on the type of cell where the leukemia develops
and how mature those cells are.Acute promyelocytic
About PML/RARα
43
Chapter 12

leukemia (APL) is the subtype AML-M3 using the
French-American-British (FAB) classi�cation.By taking into
account many of the factors that are now known to a�ect
prognosis, the World Health Organization (WHO) system
updated the classi�cation of AML in 2016. APL with the
PML- RARα fusion gene was independently listed, as
PML/RARα is the central leukemia-inducing lesion in APL.
It is directly targeted by all trans retinoic acid (ATRA) and
by arsenic, with both compounds able to induce
complete remissions (CRs).
Clinically, it is critical that APL is distinguished from other
AML subtypes quickly, because of:
Its life-threatening bleeding disorders in case of delay in the proper treatment
Its achievement of CRs in about 90% of APL patients upon ATRA treatment
Its induction of CRs in 75–90% of APL patients upon exposure to low-dose arsenic trioxide
Although there are a variety of digital cell morphology
systems with automatic cell classi�cation on the market,
there are still problems with insu�cient recognition ability
and low levels of e�ciency. It takes a lot of manpower to
check and con�rm abnormalities on the cell image, and
even check the smear under the microscope again.
Mindray provides reliable hematology solutions that can
deliver e�cient, accurate information about the true
conditions of patients, helping health professionals,
especially morphology experts, to �nd abnormalities,
identify emergencies, as well as treat and cure patients fast.
References
[1] J. Bennet, D. Catovsky, M.-T. Daniel, et al. Proposals for the
classification of the acute leukaemias. Br J Haematol, 33 (1976), pp.
451-458
[2] C.M. Segeren, M.B. uan ‘t Veer, The FAB classification for acute
myeloid leukaemia-is it outdated? Netherlands Journal of Medicine
49 (1996) 126-131
[3] Puccetti, E., Ruthardt, M. Acute promyelocytic leukemia: PML/RAR
α and the leukemic stem cell.Leukemia18,1169–1175 (2004).
https://doi.org/10.1038/sj.leu.2403367
[4] ARBER et al, The 2016 revision to the World Health Organization
classification of myeloid neoplasms and acute leukemia, Blood (2016)
127 (20): 2391–2405.https://doi.org/10.1182/blood-2016-03-6435 44
However, the low incidence of PML/RARα and the rapid
deterioration of the disease mean that rapid diagnosis
and the timely and successful treatment of patients are
still huge challenges facing medical professionals today.
Conclusion
44
Chapter 12

Many laboratories are troubled by problems such as
lengthy analysis processes and less e�cient microscopic
examinations due to lacking of experts in cell
morphology and inadequate equipment. This makes
them hard to reach a 30% overall re-exam rate, a target
recommended by the international consensus group for
hematology review. Furthermore, the abilities of the
laboratory sta� are varied, leading to inconsistency in lab
standards and results.
Mindray’s MC-80 Automated Digital Cell Morphology
Analyzer is designed to provide "More Clarity, More
Intelligence, and More Productivity" for cell morphology
analysis, with intelligent tools to help discover the truth
about cells.
Committed to improving the e�ciency and accuracy of
laboratories, Mindray has been collaborating with experts
and scholars in hospitals around the world since 2014.
Based on intensive research, Mindray has come up with the
innovative solutions in cell imaging such as Multi-layer
fusion technology, "Solid Rock" Hyper-stable Anti-shake
System, Fly-mode Technology, and many more.
Cells are the basic units of life, and cell morphology test is
one of the prime tools for detecting malignant diseases.
Pathologists study the internal structure and details of
the cells for various needs.
Currently in most laboratories, morphology experts
observe the cell images of each re-examination sample
manually with a microscope, making it a prolonged
process when the test volume is large.
In order to e�ectively alleviate the workload of manual
analysis with a microscope, cell morphology analyzers
need to simulate the details captured by manual
microscopy as clearly as possible. How can planar
imaging of cells achieve this?45
More Clarity: more details beyond appearances
Chapter 13
Capture the truth aboutcell morphology

The essence of the multi-depth fusion technology is to
recreate manual focusing normally performed by the
doctor by superimposing the clear parts of the 20
images. In the cell imaging from the MC-80, the features
and internal details of normal and abnormal cells can be
clearly presented.
Therefore, doctors can gain insight into the pathological
features of cells for more accurate early screening of
blood disorders and infectious diseases, avoiding
misdetection.
Collecting cell images is just the beginning. It is then
necessary to classify each cell correctly to re�ect the
all-around view of the sample. When analyzing
manually, the classi�cation process is often recorded
once at a time by the doctor. However, as the various
types of cells are similar, doctors can only classify them
based on their details. Over time, errors occur, a�ecting
the accuracy and e�ciency.
Through reliable identi�cation and pre-classi�cation
of di�erent types of cells, the MC-80 can accurately
re�ect the all-around view of the sample, helping
doctors to understand the patient's true status.
Accurate recognition is based on the accurate extraction
of features from the digital images of cells. With the
guidance of morphology and pathology experts in the
early stage, Mindray team extracts the information
regarding cell color, texture, and geometric
characteristics on di�erent scales. By improving the
recognition rate of cells using cascade classi�cation,
pathologists can accurately con�rm the types of cells
through comparison within categories and
subcategories.
Chapter 13
46
The MC-80 innovatively captures 20 images of each
cell at di�erent depths of �eld.
More Intelligence: delivering an all-round view of samples
Restore the true characteristics ofvarious types of normal cells
Segmentedneutrophils
Bandneutrophils
Lymphocytes
Eosinophils
Basophils
Monocytes
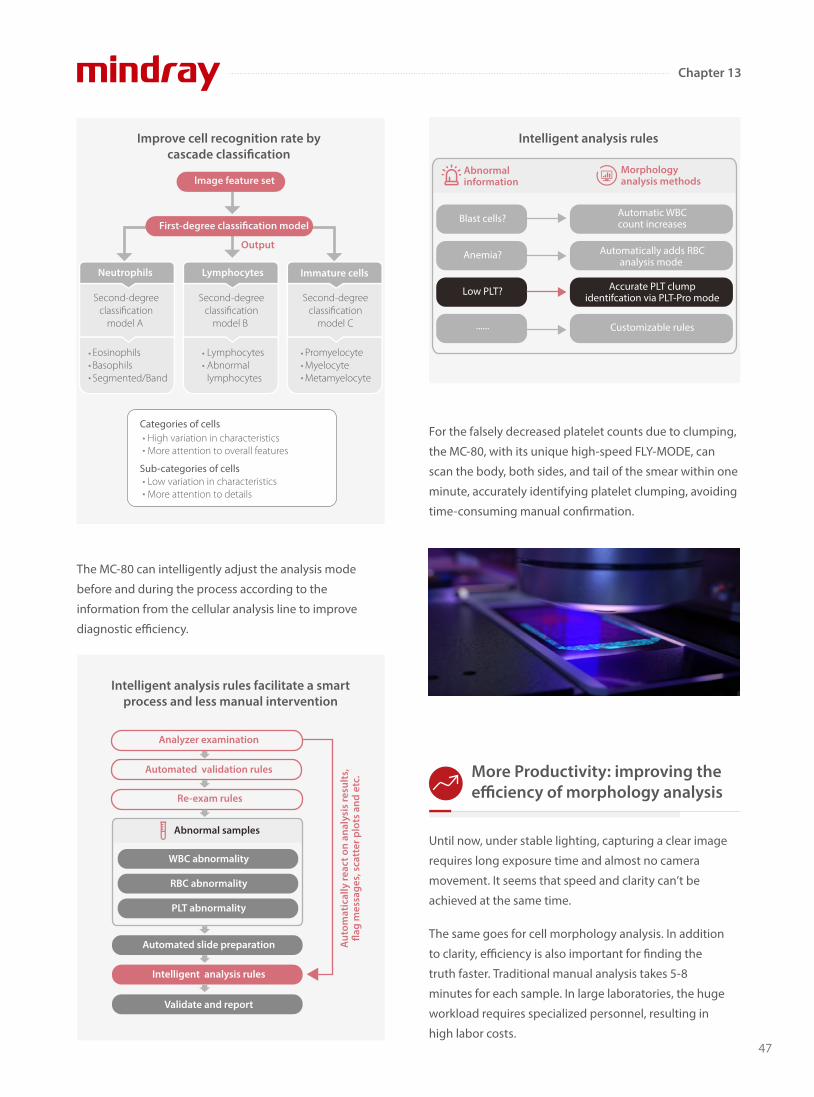
Chapter 13
Until now, under stable lighting, capturing a clear image
requires long exposure time and almost no camera
movement. It seems that speed and clarity can’t be
achieved at the same time.
The same goes for cell morphology analysis. In addition
to clarity, e�ciency is also important for �nding the
truth faster. Traditional manual analysis takes 5-8
minutes for each sample. In large laboratories, the huge
workload requires specialized personnel, resulting in
high labor costs.
For the falsely decreased platelet counts due to clumping,
the MC-80, with its unique high-speed FLY-MODE, can
scan the body, both sides, and tail of the smear within one
minute, accurately identifying platelet clumping, avoiding
time-consuming manual con�rmation.
More Productivity: improving the e�ciency of morphology analysis
47
Improve cell recognition rate bycascade classi�cation
Categories of cells
Sub-categories of cells
High variation in characteristicsMore attention to overall features
Low variation in characteristicsMore attention to details
Second-degreeclassification
model A
Second-degreeclassification
model B
Second-degreeclassification
model C
Output
Neutrophils Lymphocytes Immature cells
LymphocytesAbnormallymphocytes
EosinophilsBasophilsSegmented/Band
PromyelocyteMyelocyteMetamyelocyte
lmage feature set
First-degree classi�cation model
Intelligent analysis rules facilitate a smartprocess and less manual intervention
Analyzer examination
Automated validation rules
Re-exam rules
Automated slide preparation
WBC abnormality
RBC abnormality
PLT abnormality
Intelligent analysis rules
Validate and report
Abnormal samples
Aut
omat
ical
ly re
act o
n an
alys
is re
sult
s,�a
g m
essa
ges,
sca
tter
plo
ts a
nd e
tc.
Morphologyanalysis methods
Intelligent analysis rules
Abnormalinformation
Accurate PLT clumpidentifcation via PLT-Pro mode
Low PLT?
Customizable rules......
Automatic WBCcount increasesBlast cells?
Automatically adds RBCanalysis mode
Anemia?
The MC-80 can intelligently adjust the analysis mode
before and during the process according to the
information from the cellular analysis line to improve
diagnostic e�ciency.
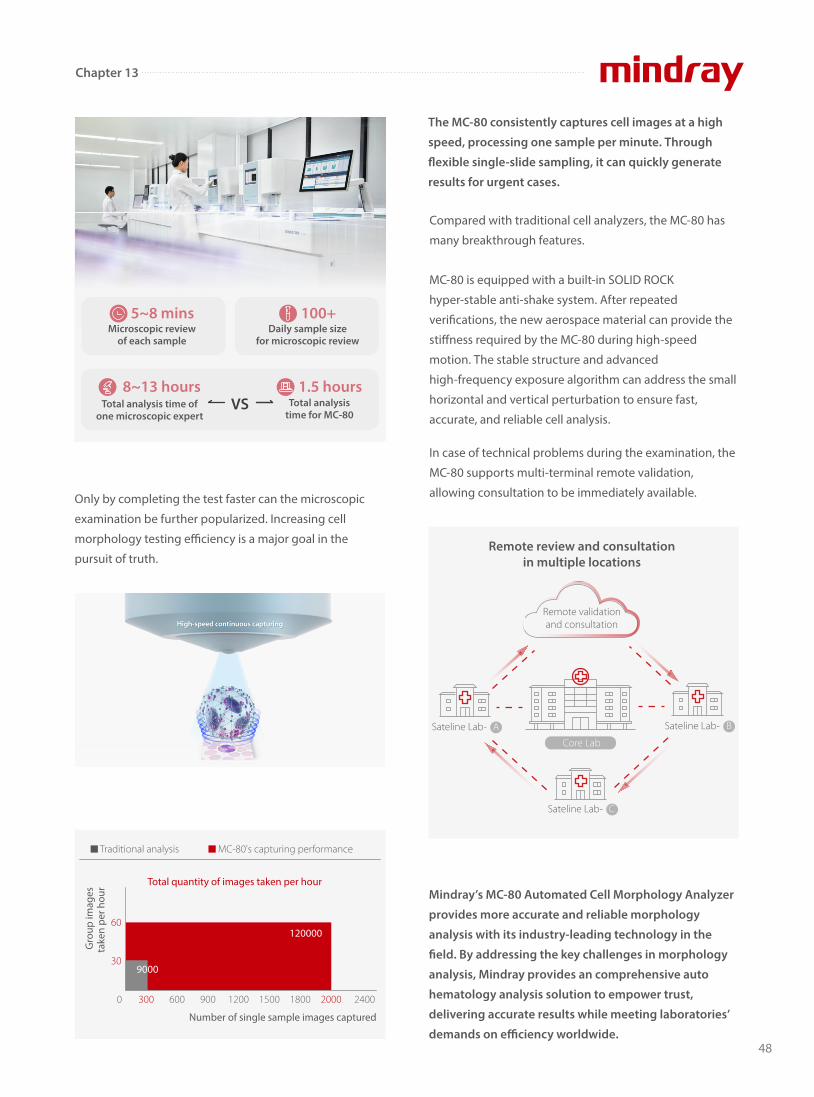
Chapter 13
48
Only by completing the test faster can the microscopic
examination be further popularized. Increasing cell
morphology testing e�ciency is a major goal in the
pursuit of truth.
MC-80 is equipped with a built-in SOLID ROCK
hyper-stable anti-shake system. After repeated
veri�cations, the new aerospace material can provide the
sti�ness required by the MC-80 during high-speed
motion. The stable structure and advanced
high-frequency exposure algorithm can address the small
horizontal and vertical perturbation to ensure fast,
accurate, and reliable cell analysis.
In case of technical problems during the examination, the
MC-80 supports multi-terminal remote validation,
allowing consultation to be immediately available.
Compared with traditional cell analyzers, the MC-80 has
many breakthrough features.
The MC-80 consistently captures cell images at a high
speed, processing one sample per minute. Through
�exible single-slide sampling, it can quickly generate
results for urgent cases.
Mindray’s MC-80 Automated Cell Morphology Analyzer
provides more accurate and reliable morphology
analysis with its industry-leading technology in the
�eld. By addressing the key challenges in morphology
analysis, Mindray provides an comprehensive auto
hematology analysis solution to empower trust,
delivering accurate results while meeting laboratories’
demands on e�ciency worldwide.
Microscopic reviewof each sample
100+Daily sample size
for microscopic review
5~8 mins
Total analysistime for MC-80
VSTotal analysis time ofone microscopic expert
8~13 hours 1.5 hours
0 300 600 900 1200 1500 1800 2000 2400
30
60
Gro
up im
ages
take
n pe
r hou
r
Number of single sample images captured
120000
9000
Total quantity of images taken per hour
Traditional analysis MC-80's capturing performance
Remote review and consultationin multiple locations
Remote validationand consultation
Sateline Lab- A Sateline Lab- B
Sateline Lab- C
Core Lab

49
Chapter 14
What is erythrocyte sedimentation rate The erythrocyte sedimentation rate (ESR), which is
determined by the Westergren method, measures how
quickly red blood cells (RBCs) settle at the bottom of a
blood sample tube in millimeters (mm) in one hour.
Quick Facts About Erythrocyte Sedimentation Rate (ESR) Part A
Deoxygenatedblood
Westergrentube
+Anticoagulant
mm
mmm
m
mins mins mins mins
When blood is left alone in an upright test tube, the sedimentation increases over time, but the ESR stays the same, which indicates how quickly the sedimentation happens.
WBCs
Platelets
Plasma(55%)
Bu�yCoat
(<1%)
RBCs(45%)
Rouleaux formation PackingSettling
3 stages of sedimentation
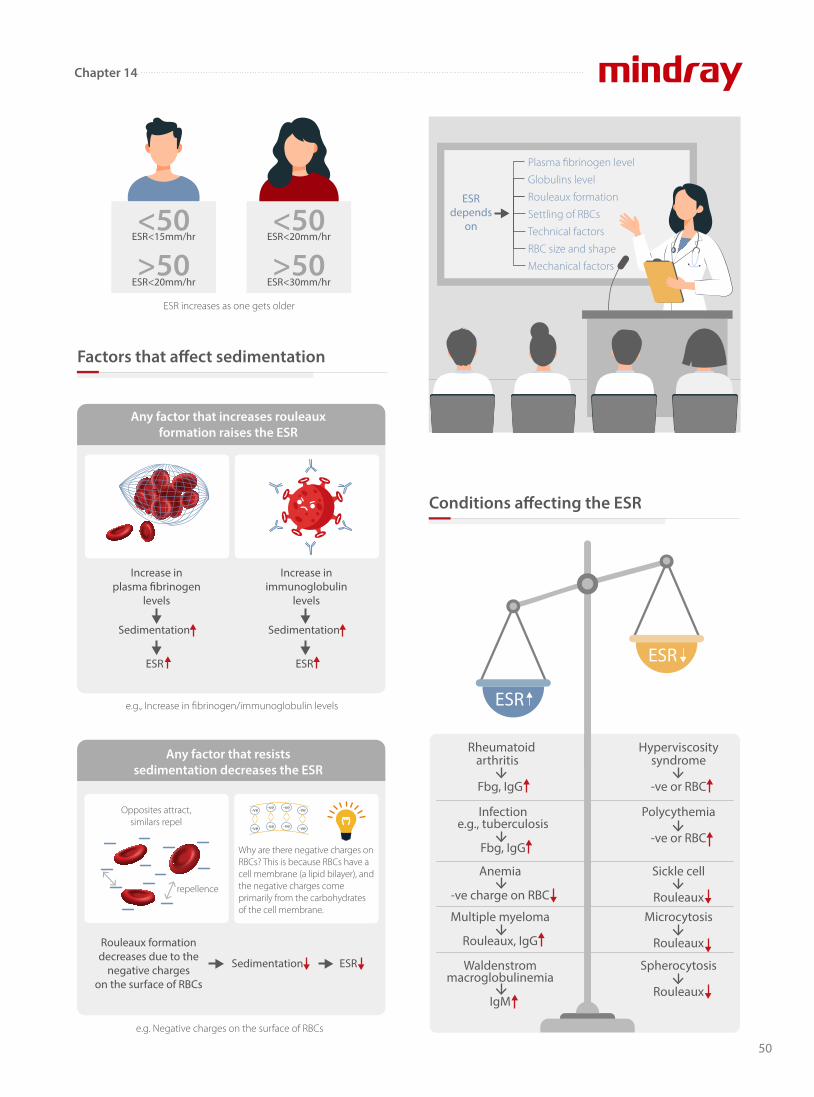
50
Factors that a�ect sedimentation
Conditions a�ecting the ESR
ESR increases as one gets older
ESR<30mm/hr>50
ESR<20mm/hr<50
ESR<20mm/hr>50
ESR<15mm/hr<50
Increase inimmunoglobulin
levels
Any factor that increases rouleauxformation raises the ESR
e.g., Increase in fibrinogen/immunoglobulin levels
Sedimentation
ESR
Sedimentation
ESR
Increase inplasma �brinogen
levels
e.g. Negative charges on the surface of RBCs
Any factor that resistssedimentation decreases the ESR
repellence
Opposites attract,similars repel
Rouleaux formationdecreases due to the
negative chargeson the surface of RBCs
ESRSedimentation
-ve
-ve
-ve
-ve
-ve
-ve
-ve
-ve
Why are there negative charges on RBCs? This is because RBCs have a cell membrane (a lipid bilayer), and the negative charges come primarily from the carbohydrates of the cell membrane.
Plasma fibrinogen level
Globulins level
Rouleaux formation
Settling of RBCs
Technical factors
RBC size and shape
Mechanical factors
ESRdepends
on
ESR
ESR
Rheumatoidarthritis
Fbg, IgG
Infectione.g., tuberculosis
Fbg, IgG
Anemia
-ve charge on RBC
Multiple myeloma
Rouleaux, IgG
Waldenstrommacroglobulinemia
IgM
Polycythemia
-ve or RBC
Sickle cell
RouleauxMicrocytosis
Rouleaux
Spherocytosis
Rouleaux
Hyperviscositysyndrome
-ve or RBC
Chapter 14
Before we move onto the next lesson, here are some
take-home messages for you.
In general, ESR has higher sensitivity and negative
predictive value (NPV) but lower speci�city and positive
predictive value (PPV).
Mindray is soon going to launch a new hematology series
that incorporates both CBC and ESR analysis. Stay tuned
for its global launch lunch event on March 1st !
ESR is a very important means to rule out giant cell arteritis.
In sickle cell disease
In sickle cell frait → no sickle cells → normal ESR
Both ESR and CRP will be detected to elevate in the caseof any in�ammation.
ESR starts to rise 24-48 hours after onset of in�ammation.
ESR elevation is one of the minor criteria for diagnosis ofrheumatic fever.
asymptomatic → ESR
painful crises → in�ammation→ Fibrinogen → ESR
AbnormalHaemoglobin
AbnormalHaemoglobin
Sickle cell Normal RBC
Although ESR is a nonspecific test, it is the
most effective way to find any abnormality in the body. Whenever
you detect a raised ESR, never ignore it. Instead, you should perform a
thorough workup on the patient. The result will very likely indicate
some underlying disease.
References
[1] Aldo F.F.R, Luiz J.S. Alteration in the Erythrocyte Sedimentation
Rate in Dengue Patients: Analysis of 1,398 Cases The Brazilian
journal of infectious diseases: an official publication of the Brazilian
Society of Infectious Diseases Med 2009;12(6):472-5.
[2]. https://labtestsonline.org.uk/tests/erythrocyte- sedimenta-
tion-rate-esr
[3]. https://labs.selfdecode.com/blog/erythrocyte- sedimenta-
tion-rate-esr-high-low-levels-how-to-decrease-it/
[4]. ICSH recommendations for measurement of erythrocyte
sedimentation rate. International Council for Standardization in
Haematology (Expert Panel on Blood Rheology). J Clin Pathol. 1993
Mar;46(3):198-203. [PMC free article] [PubMed]
51
Chapter 14

Three routine laboratory tests
Blood, urine and feces analysis are the three common
tests in clinical laboratories. Among them, blood testing is
the most important way to keep track of one’s overall
physical well-being.
In the past, routine blood tests were performed manually
on a microscope, Neubauer's hemacytometer, Sahli’s
colorimeter and ESR tube rack.
In addition to complete blood count (CBC) and white
blood cell di�erential (DIFF) count which have become
fully automated, other simple but time-consuming blood
tests like ESR and CRP also transform from manual
methods to automated analysis. Integrated systems have
been developed for easier operation.
Applications of CBC, ESR and CRP Analysis, Part B
CBC+ESR
Peripheral bloodcell morphology
Sahli’s calorimeter
In the past
ESR tube rack
Neubauer'shemacytometer
52
Chapter 15
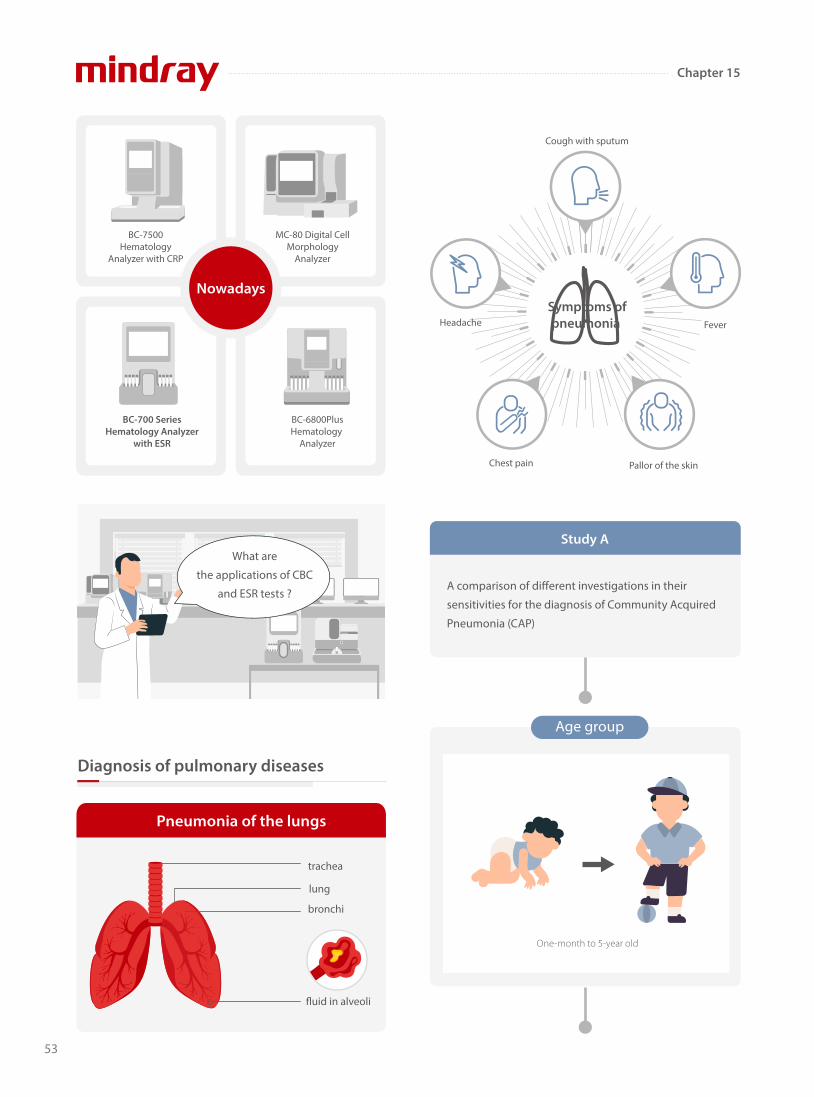
Diagnosis of pulmonary diseases
trachea
lung
bronchi
�uid in alveoli
Pneumonia of the lungs
Nowadays
Cough with sputum
FeverHeadache
Chest pain Pallor of the skin
Symptoms ofpneumonia
A comparison of di�erent investigations in their
sensitivities for the diagnosis of Community Acquired
Pneumonia (CAP)
Study A
One-month to 5-year old
Age group
BC-700 Series Hematology Analyzer
with ESR
BC-7500 Hematology
Analyzer with CRP
MC-80 Digital Cell Morphology
Analyzer
BC-6800PlusHematology
Analyzer
What are
the applications of CBC
and ESR tests ?
53
Chapter 15
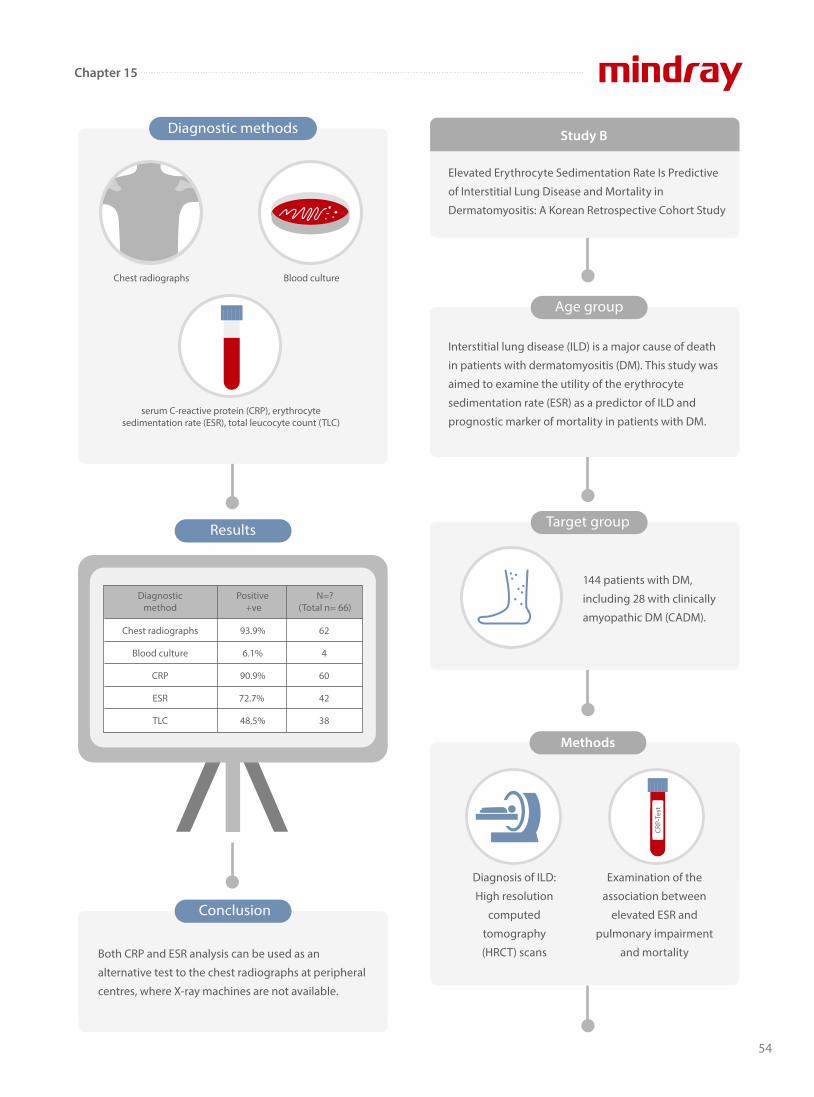
CRP-
Test
Diagnosis of ILD:
High resolution
computed
tomography
(HRCT) scans
Examination of the
association between
elevated ESR and
pulmonary impairment
and mortality
Elevated Erythrocyte Sedimentation Rate Is Predictive
of Interstitial Lung Disease and Mortality in
Dermatomyositis: A Korean Retrospective Cohort Study
Study B
Age group
Diagnostic methods
serum C-reactive protein (CRP), erythrocyte sedimentation rate (ESR), total leucocyte count (TLC)
Chest radiographs Blood culture
Diagnosticmethod
Positive +ve
N=?(Total n= 66)
Chest radiographs
Blood culture
CRP
ESR
TLC
93.9%
6.1%
90.9%
72.7%
48.5%
62
4
60
42
38
Results
Conclusion
Both CRP and ESR analysis can be used as an
alternative test to the chest radiographs at peripheral
centres, where X-ray machines are not available.
Interstitial lung disease (ILD) is a major cause of death
in patients with dermatomyositis (DM). This study was
aimed to examine the utility of the erythrocyte
sedimentation rate (ESR) as a predictor of ILD and
prognostic marker of mortality in patients with DM.
Target group
144 patients with DM,
including 28 with clinically
amyopathic DM (CADM).
Methods
54
Chapter 15
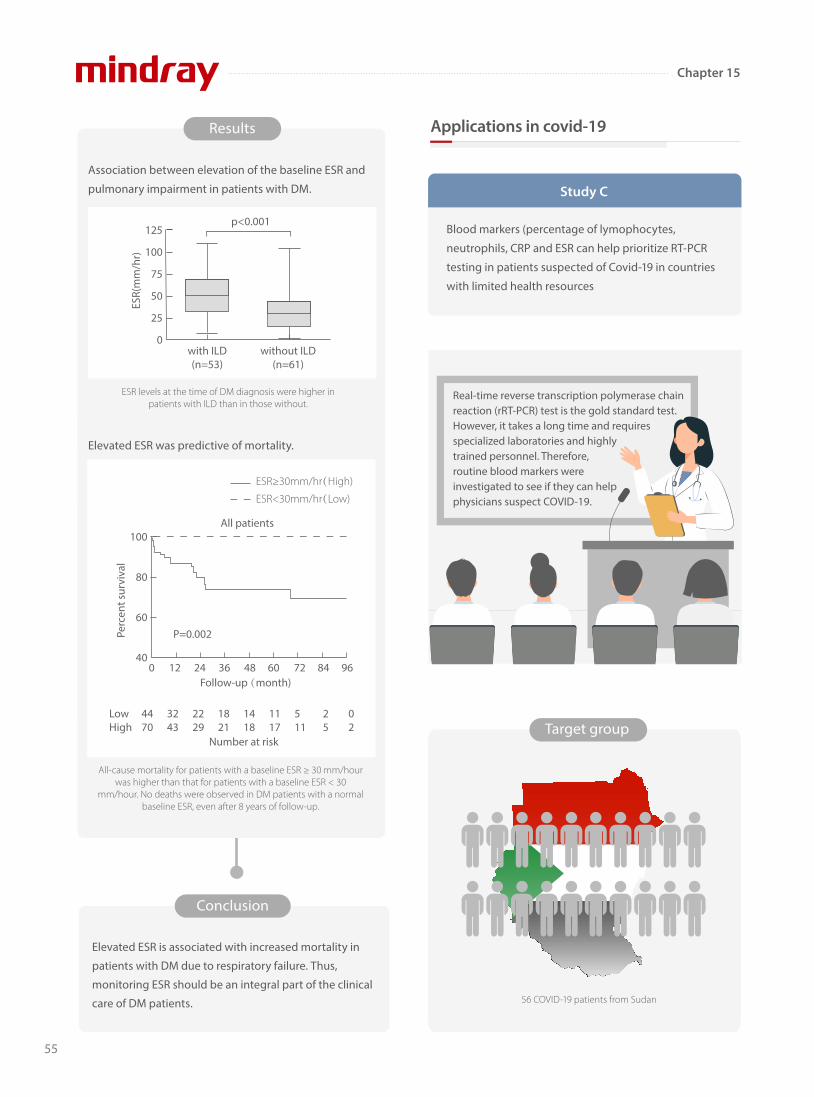
Blood markers (percentage of lymophocytes,
neutrophils, CRP and ESR can help prioritize RT-PCR
testing in patients suspected of Covid-19 in countries
with limited health resources
Study C
Results
Conclusion
Association between elevation of the baseline ESR and
pulmonary impairment in patients with DM.
Elevated ESR is associated with increased mortality in
patients with DM due to respiratory failure. Thus,
monitoring ESR should be an integral part of the clinical
care of DM patients.
ESR levels at the time of DM diagnosis were higher in patients with ILD than in those without.
Elevated ESR was predictive of mortality.
All-cause mortality for patients with a baseline ESR ≥ 30 mm/hour was higher than that for patients with a baseline ESR < 30
mm/hour. No deaths were observed in DM patients with a normal baseline ESR, even after 8 years of follow-up.
with ILD(n=53)
125
100
75
50
25
0without ILD
(n=61)
p<0.001
ESR(
mm
/hr)
ESR≥30mm/hr(High)
ESR<30mm/hr(Low)
LowHigh
4470
2229
1821
1418
1117
511
25
02
3243
100
80
60
400 12 24 36 48 60 72 84 96
All patients
Follow-up (month)
Number at risk
P=0.002Perc
ent s
urvi
val
Applications in covid-19
Real-time reverse transcription polymerase chain reaction (rRT-PCR) test is the gold standard test. However, it takes a long time and requires specialized laboratories and highlytrained personnel. Therefore,routine blood markers wereinvestigated to see if they can helpphysicians suspect COVID-19.
Target group
56 COVID-19 patients from Sudan
55
Chapter 15
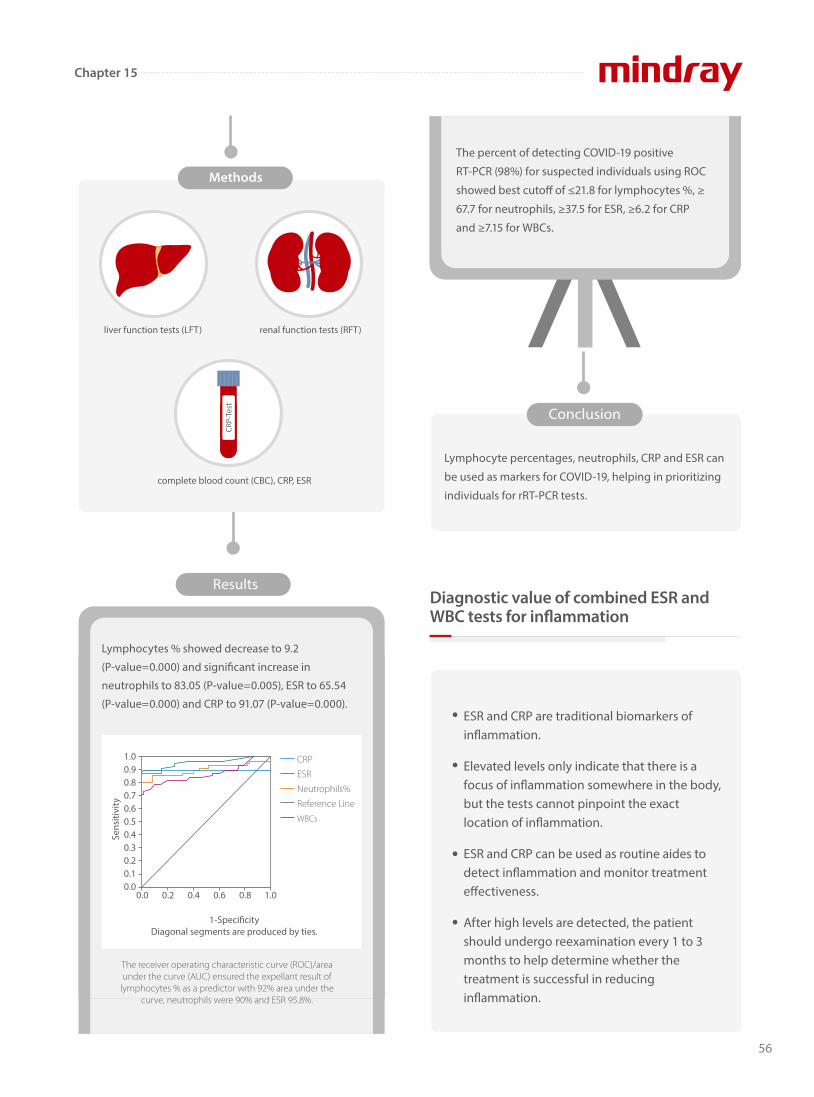
56
Chapter 15
Results
Conclusion
Lymphocyte percentages, neutrophils, CRP and ESR can
be used as markers for COVID-19, helping in prioritizing
individuals for rRT-PCR tests.
Methods
CRP-
Test
Lymphocytes % showed decrease to 9.2
(P-value=0.000) and signi�cant increase in
neutrophils to 83.05 (P-value=0.005), ESR to 65.54
(P-value=0.000) and CRP to 91.07 (P-value=0.000).
The percent of detecting COVID-19 positive
RT-PCR (98%) for suspected individuals using ROC
showed best cuto� of ≤21.8 for lymphocytes %, ≥
67.7 for neutrophils, ≥37.5 for ESR, ≥6.2 for CRP
and ≥7.15 for WBCs.
ESR and CRP are traditional biomarkers of in�ammation.
Elevated levels only indicate that there is a focus of in�ammation somewhere in the body, but the tests cannot pinpoint the exact location of in�ammation.
ESR and CRP can be used as routine aides to detect in�ammation and monitor treatment e�ectiveness.
After high levels are detected, the patient should undergo reexamination every 1 to 3 months to help determine whether the treatment is successful in reducing in�ammation.
1.00.90.80.70.60.50.40.30.20.10.0
0.0 0.2 0.4 0.6 0.8 1.0
Sens
itivi
ty
CRP
ESR
Neutrophils%
Reference Line
WBCs
1-Speci�cityDiagonal segments are produced by ties.
The receiver operating characteristic curve (ROC)/area under the curve (AUC) ensured the expellant result of
lymphocytes % as a predictor with 92% area under the curve, neutrophils were 90% and ESR 95.8%.
Diagnostic value of combined ESR and WBC tests for in�ammation
complete blood count (CBC), CRP, ESR
liver function tests (LFT) renal function tests (RFT)
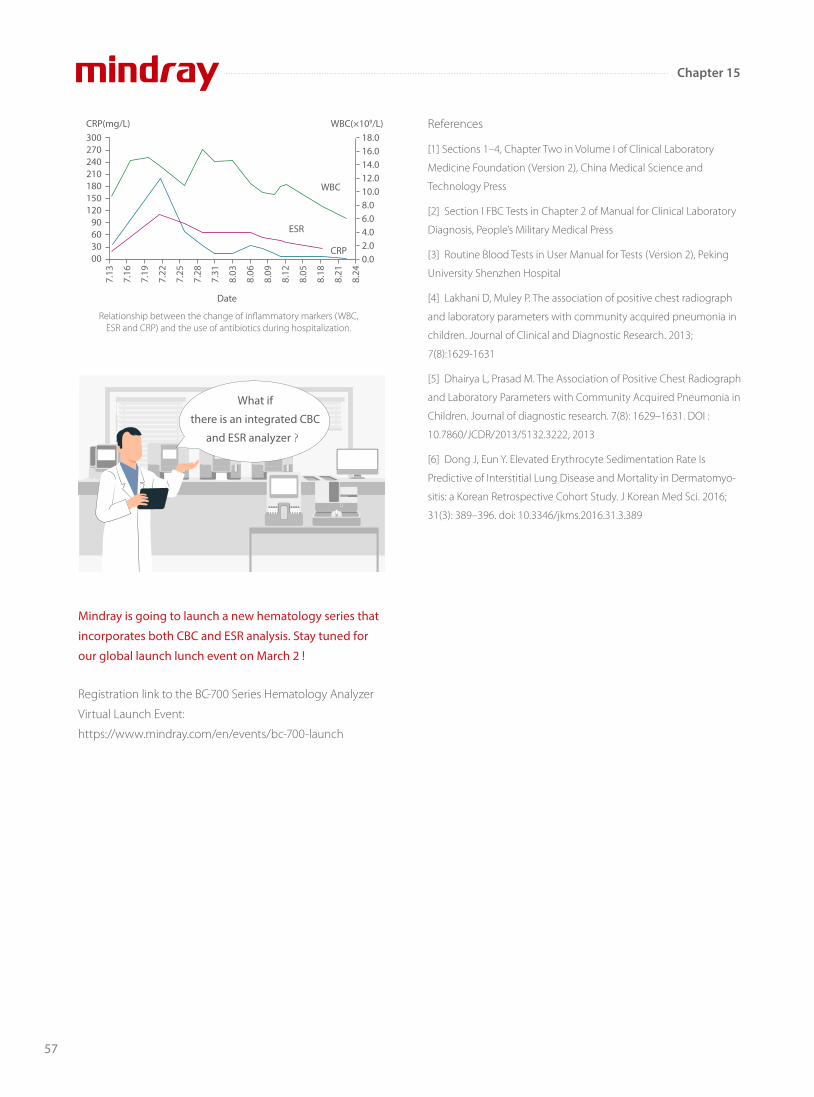
57
Chapter 15
Mindray is going to launch a new hematology series that
incorporates both CBC and ESR analysis. Stay tuned for
our global launch lunch event on March 2 !
Registration link to the BC-700 Series Hematology Analyzer
Virtual Launch Event:
https://www.mindray.com/en/events/bc-700-launch
References
[1] Sections 1–4, Chapter Two in Volume I of Clinical Laboratory
Medicine Foundation (Version 2), China Medical Science and
Technology Press
[2] Section I FBC Tests in Chapter 2 of Manual for Clinical Laboratory
Diagnosis, People’s Military Medical Press
[3] Routine Blood Tests in User Manual for Tests (Version 2), Peking
University Shenzhen Hospital
[4] Lakhani D, Muley P. The association of positive chest radiograph
and laboratory parameters with community acquired pneumonia in
children. Journal of Clinical and Diagnostic Research. 2013;
7(8):1629-1631
[5] Dhairya L, Prasad M. The Association of Positive Chest Radiograph
and Laboratory Parameters with Community Acquired Pneumonia in
Children. Journal of diagnostic research. 7(8): 1629–1631. DOI :
10.7860/JCDR/2013/5132.3222, 2013
[6] Dong J, Eun Y. Elevated Erythrocyte Sedimentation Rate Is
Predictive of Interstitial Lung Disease and Mortality in Dermatomyo-
sitis: a Korean Retrospective Cohort Study. J Korean Med Sci. 2016;
31(3): 389–396. doi: 10.3346/jkms.2016.31.3.389
Relationship between the change of inflammatory markers (WBC, ESR and CRP) and the use of antibiotics during hospitalization.
300270240210180150120
90603000
18.016.014.012.010.08.06.04.02.00.0
WBC
ESR
CRP
7.13
7.16
7.19
7.22
7.25
7.28
7.31
8.03
8.06
8.09
8.12
8.05
8.18
8.21
8.24
CRP(mg/L)
Date
WBC(×109/L)
What if
there is an integrated CBC
and ESR analyzer?
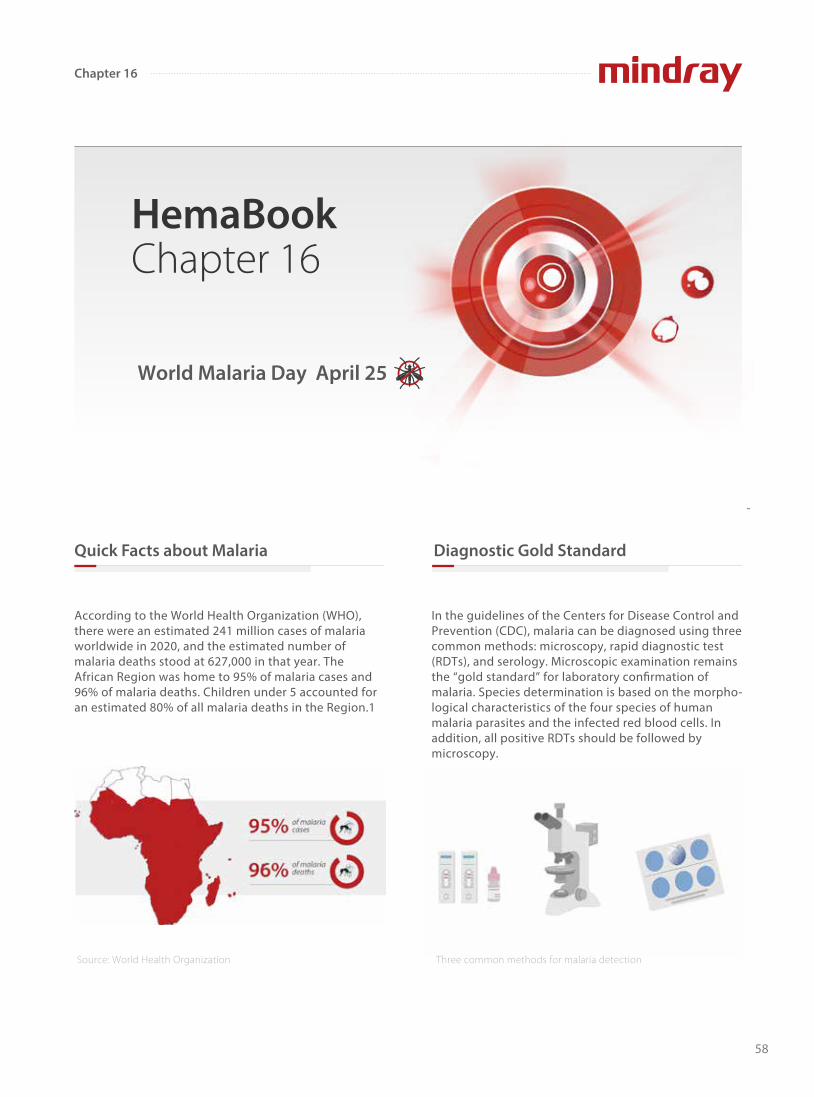
Quick Facts about Malaria
-
Chapter 16
According to the World Health Organization (WHO), there were an estimated 241 million cases of malaria worldwide in 2020, and the estimated number of malaria deaths stood at 627,000 in that year. The African Region was home to 95% of malaria cases and 96% of malaria deaths. Children under 5 accounted for an estimated 80% of all malaria deaths in the Region.1
Source: World Health Organization
World Malaria Day April 25
HemaBook Chapter 16
In the guidelines of the Centers for Disease Control and Prevention (CDC), malaria can be diagnosed using three common methods: microscopy, rapid diagnostic test (RDTs), and serology. Microscopic examination remains the “gold standard” for laboratory confirmation of malaria. Species determination is based on the morpho-logical characteristics of the four species of human malaria parasites and the infected red blood cells. In addition, all positive RDTs should be followed by microscopy.
Three common methods for malaria detection
Diagnostic Gold Standard
58
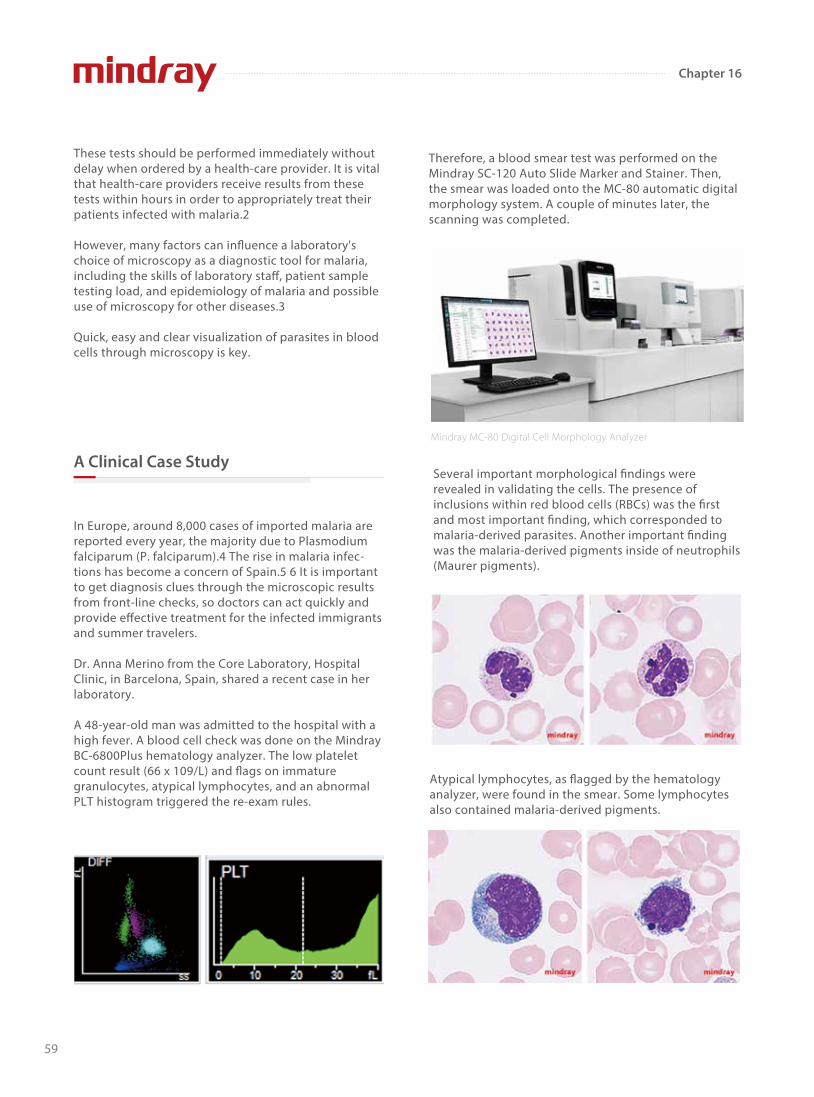
Chapter 16
These tests should be performed immediately without delay when ordered by a health-care provider. It is vital that health-care providers receive results from these tests within hours in order to appropriately treat their patients infected with malaria.2
However, many factors can influence a laboratory's choice of microscopy as a diagnostic tool for malaria, including the skills of laboratory sta�, patient sample testing load, and epidemiology of malaria and possible use of microscopy for other diseases.3
Quick, easy and clear visualization of parasites in blood cells through microscopy is key.
In Europe, around 8,000 cases of imported malaria are reported every year, the majority due to Plasmodium falciparum (P. falciparum).4 The rise in malaria infec-tions has become a concern of Spain.5 6 It is important to get diagnosis clues through the microscopic results from front-line checks, so doctors can act quickly and provide e�ective treatment for the infected immigrants and summer travelers.
Dr. Anna Merino from the Core Laboratory, Hospital Clinic, in Barcelona, Spain, shared a recent case in her laboratory.
A 48-year-old man was admitted to the hospital with a high fever. A blood cell check was done on the Mindray BC-6800Plus hematology analyzer. The low platelet count result (66 x 109/L) and flags on immature granulocytes, atypical lymphocytes, and an abnormal PLT histogram triggered the re-exam rules.
Therefore, a blood smear test was performed on the Mindray SC-120 Auto Slide Marker and Stainer. Then, the smear was loaded onto the MC-80 automatic digital morphology system. A couple of minutes later, the scanning was completed.
Several important morphological findings were revealed in validating the cells. The presence of inclusions within red blood cells (RBCs) was the first and most important finding, which corresponded to malaria-derived parasites. Another important finding was the malaria-derived pigments inside of neutrophils (Maurer pigments).
Mindray MC-80 Digital Cell Morphology Analyzer
Atypical lymphocytes, as flagged by the hematology analyzer, were found in the smear. Some lymphocytes also contained malaria-derived pigments.
A Clinical Case Study
59
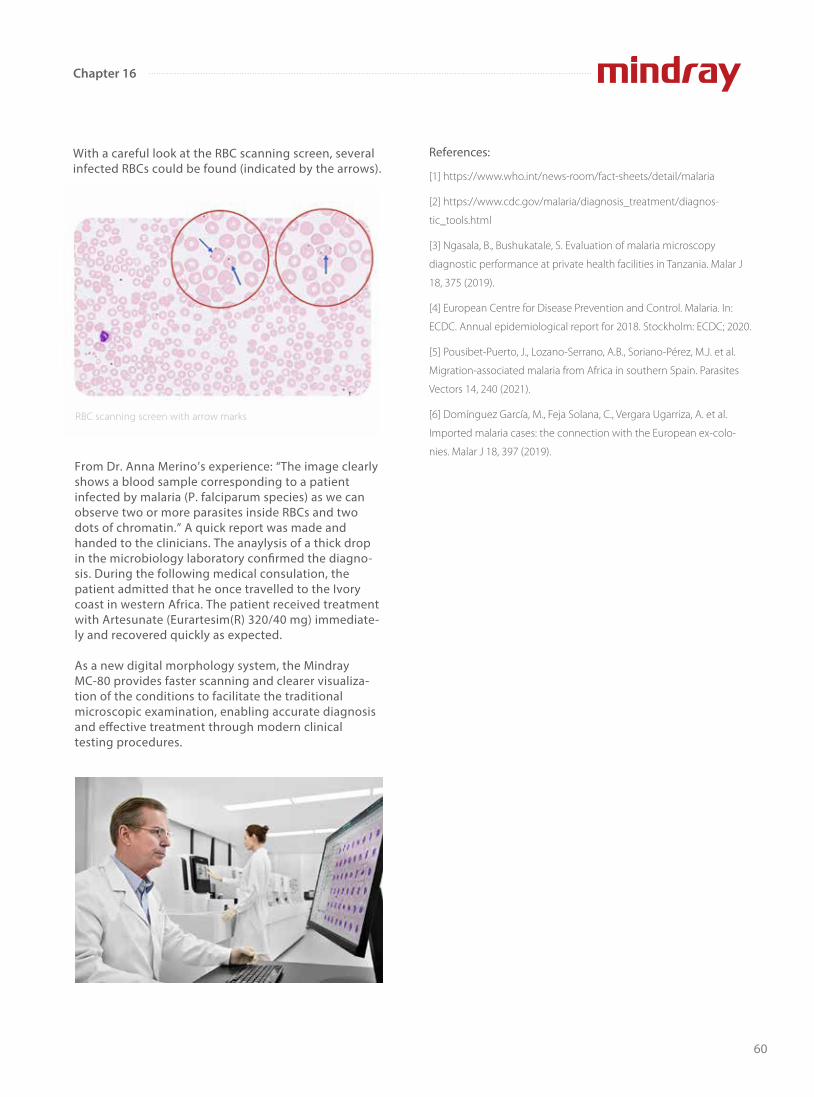
From Dr. Anna Merino’s experience: “The image clearly shows a blood sample corresponding to a patient infected by malaria (P. falciparum species) as we can observe two or more parasites inside RBCs and two dots of chromatin.” A quick report was made and handed to the clinicians. The anaylysis of a thick drop in the microbiology laboratory confirmed the diagno-sis. During the following medical consulation, the patient admitted that he once travelled to the Ivory coast in western Africa. The patient received treatment with Artesunate (Eurartesim(R) 320/40 mg) immediate-ly and recovered quickly as expected.
As a new digital morphology system, the Mindray MC-80 provides faster scanning and clearer visualiza-tion of the conditions to facilitate the traditional microscopic examination, enabling accurate diagnosis and e�ective treatment through modern clinical testing procedures.
[1] https://www.who.int/news-room/fact-sheets/detail/malaria
[2] https://www.cdc.gov/malaria/diagnosis_treatment/diagnos-
tic_tools.html
[3] Ngasala, B., Bushukatale, S. Evaluation of malaria microscopy
diagnostic performance at private health facilities in Tanzania. Malar J
18, 375 (2019).
[4] European Centre for Disease Prevention and Control. Malaria. In:
ECDC. Annual epidemiological report for 2018. Stockholm: ECDC; 2020.
[5] Pousibet-Puerto, J., Lozano-Serrano, A.B., Soriano-Pérez, M.J. et al.
Migration-associated malaria from Africa in southern Spain. Parasites
Vectors 14, 240 (2021).
[6] Domínguez García, M., Feja Solana, C., Vergara Ugarriza, A. et al.
Imported malaria cases: the connection with the European ex-colo-
nies. Malar J 18, 397 (2019).
Chapter 16
03
With a careful look at the RBC scanning screen, several infected RBCs could be found (indicated by the arrows).
RBC scanning screen with arrow marks
References:
60
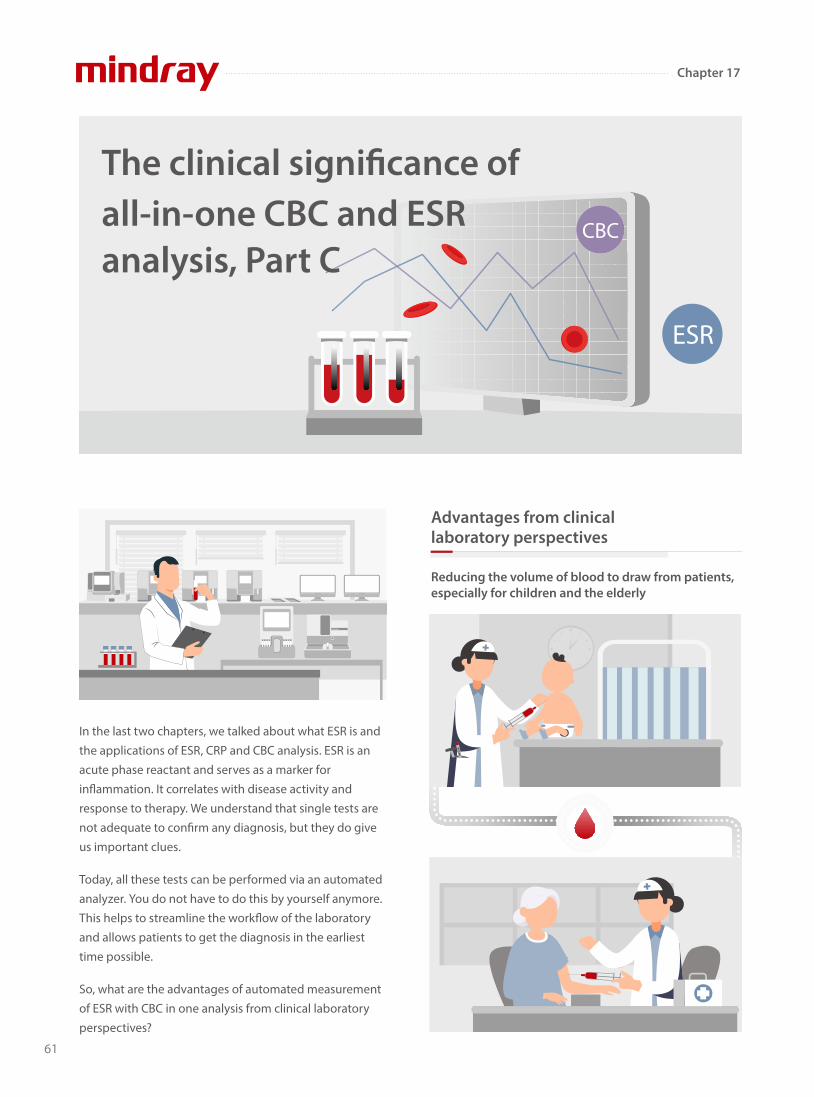
61
CBC
ESR
In the last two chapters, we talked about what ESR is and
the applications of ESR, CRP and CBC analysis. ESR is an
acute phase reactant and serves as a marker for
in�ammation. It correlates with disease activity and
response to therapy. We understand that single tests are
not adequate to con�rm any diagnosis, but they do give
us important clues.
Today, all these tests can be performed via an automated
analyzer. You do not have to do this by yourself anymore.
This helps to streamline the work�ow of the laboratory
and allows patients to get the diagnosis in the earliest
time possible.
So, what are the advantages of automated measurement
of ESR with CBC in one analysis from clinical laboratory
perspectives?
Advantages from clinical laboratory perspectives
Reducing the volume of blood to draw from patients, especially for children and the elderly
The clinical signi�cance ofall-in-one CBC and ESR analysis, Part C
Chapter 17
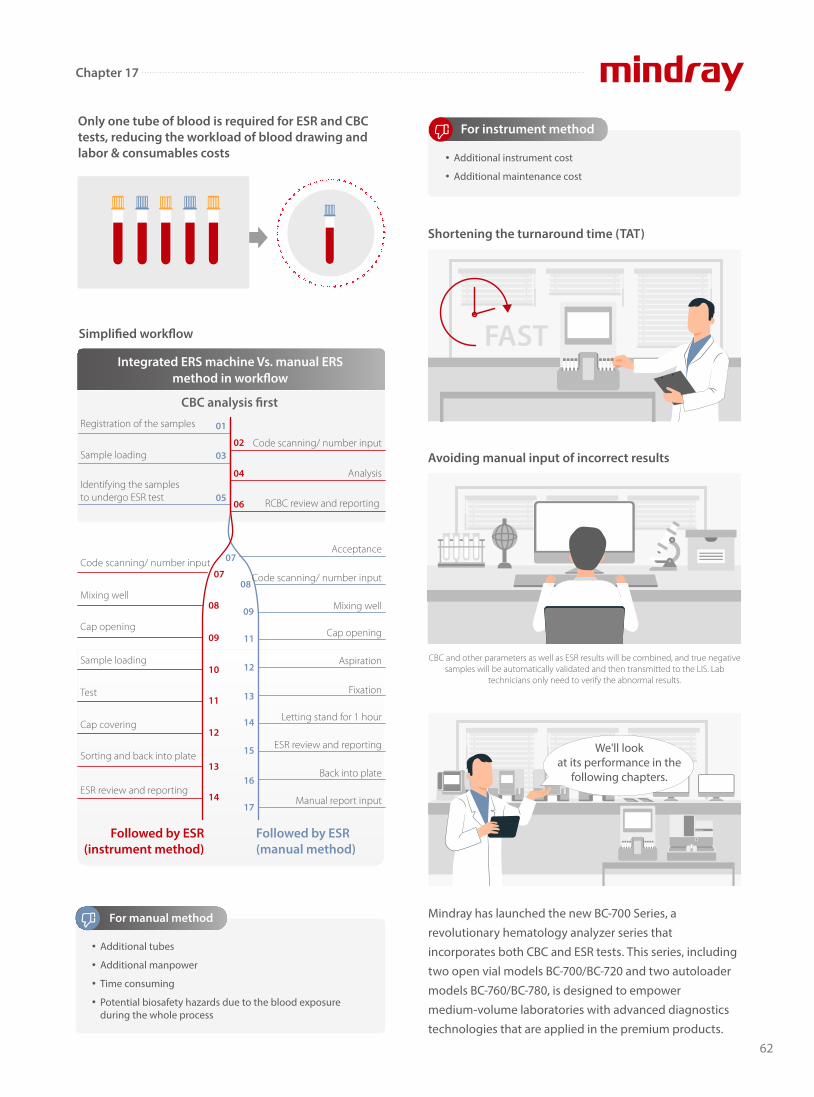
62
Mindray has launched the new BC-700 Series, a
revolutionary hematology analyzer series that
incorporates both CBC and ESR tests. This series, including
two open vial models BC-700/BC-720 and two autoloader
models BC-760/BC-780, is designed to empower
medium-volume laboratories with advanced diagnostics
technologies that are applied in the premium products.
Only one tube of blood is required for ESR and CBC tests, reducing the workload of blood drawing and labor & consumables costs
Shortening the turnaround time (TAT)
Simpli�ed work�ow
Integrated ERS machine Vs. manual ERS method in work�ow
Followed by ESR (instrument method)
Followed by ESR(manual method)
08
07
05
03
01
06
04
02
09
11
12
13
14
15
16
17
09
08
07
10
11
12
13
14
CBC analysis �rst
Additional tubes
Additional manpower
Time consuming
Potential biosafety hazards due to the blood exposure during the whole process
For manual method
Additional instrument cost
Additional maintenance cost
For instrument method
Avoiding manual input of incorrect results
CBC and other parameters as well as ESR results will be combined, and true negative samples will be automatically validated and then transmitted to the LIS. Lab
technicians only need to verify the abnormal results.
Registration of the samples
Sample loading
Identifying the samples to undergo ESR test
Code scanning/ number input
Mixing well
Cap opening
Sample loading
Test
Cap covering
Sorting and back into plate
ESR review and reporting
Code scanning/ number input
Analysis
Acceptance
Code scanning/ number input
Mixing well
Cap opening
Aspiration
Fixation
Letting stand for 1 hour
ESR review and reporting
Back into plate
Manual report input
RCBC review and reporting
FAST
We'll look at its performance in the
following chapters.
Chapter 17

63
Chapter 18
Hemostasis and coagulation are the main functions of platelets (PLTs). Thrombocytopenia is a common cause of bleeding. A
PLT count from 20 to 50×109/L may indicate mild or surgical bleeding. If it is lower than 20×109/L, this may indicate severe
bleeding. If it reduces to 5×10⁹/L or lower, the patient may be experiencing a life-threatening condition.
Nowadays, laboratories usually count PLTs by using automatic hematology analyzers, which work based on various methods
with di�erent characteristics.
PLTs and red blood cells (RBCs) can be distinguished by the
magnitude of the electrical impedance signal in normal
samples. However, PLT-I is subject to the interference of
microcytic RBCs, fragments, and large PLTs when it is used
to di�erentiate PLTs by cell volume.
PLT-H: A new parameter for accurate platelet counting with anti-interference ability
Conventional impedance methods (PLT-I)
When microcytic RBCs and fragments are present in the
blood, the result of PLT-I will be falsely high due to the
interference of RBCs; when large PLTs or PLT aggregations
are present in the blood, the PLT measurement result will
be falsely low.
Large PLTs
Small RBCs
fL
Interfered PLT
RBC fragments
Histogram of PLT counts by the impedance method with interferences of small RBCs, RBC
fragments and large PLTs
Histogram of PLT counts by the impedance method in normal samples
PLT
fL
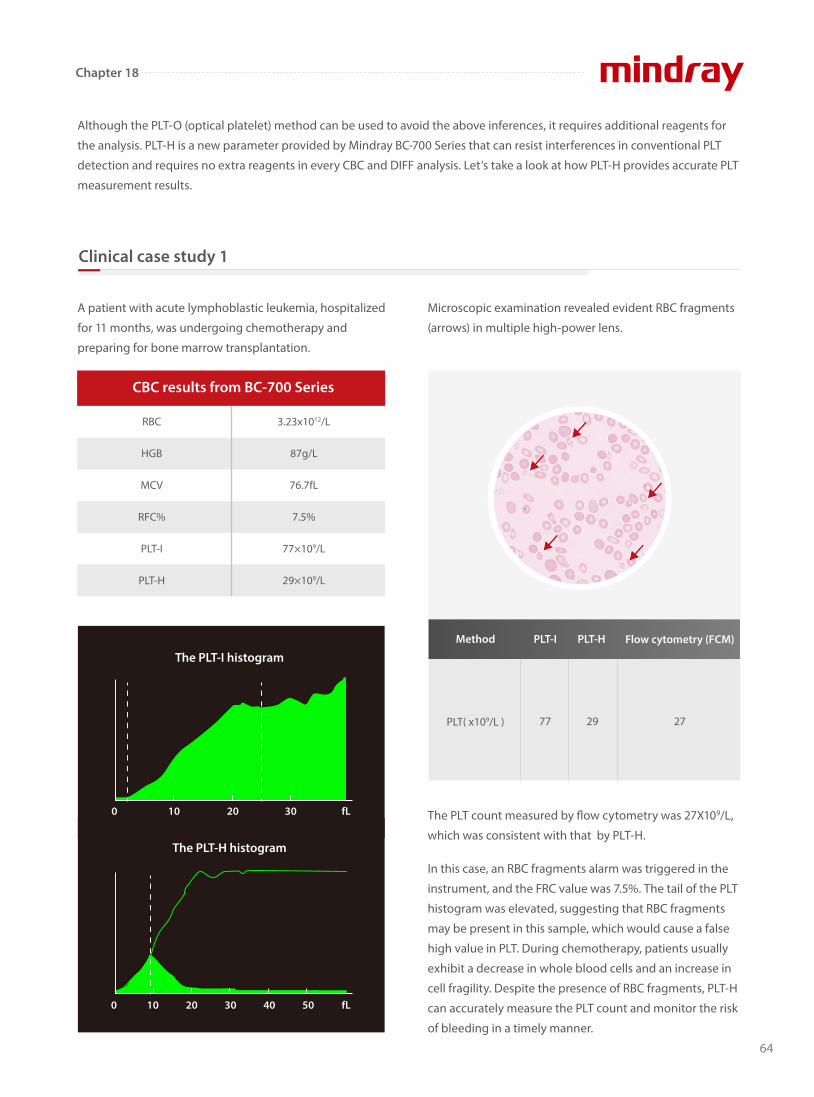
64
Chapter 18
Although the PLT-O (optical platelet) method can be used to avoid the above inferences, it requires additional reagents for
the analysis. PLT-H is a new parameter provided by Mindray BC-700 Series that can resist interferences in conventional PLT
detection and requires no extra reagents in every CBC and DIFF analysis. Let’s take a look at how PLT-H provides accurate PLT
measurement results.
A patient with acute lymphoblastic leukemia, hospitalized
for 11 months, was undergoing chemotherapy and
preparing for bone marrow transplantation.
Microscopic examination revealed evident RBC fragments
(arrows) in multiple high-power lens.
The PLT count measured by �ow cytometry was 27X109/L,
which was consistent with that by PLT-H.
In this case, an RBC fragments alarm was triggered in the
instrument, and the FRC value was 7.5%. The tail of the PLT
histogram was elevated, suggesting that RBC fragments
may be present in this sample, which would cause a false
high value in PLT. During chemotherapy, patients usually
exhibit a decrease in whole blood cells and an increase in
cell fragility. Despite the presence of RBC fragments, PLT-H
can accurately measure the PLT count and monitor the risk
of bleeding in a timely manner.
Clinical case study 1
RBC
HGB
MCV
RFC%
PLT-I
PLT-H
3.23x10¹²/L
87g/L
76.7fL
7.5%
77×109/L
29×109/L
CBC results from BC-700 Series
The PLT-I histogram
0
0 10 20 30 40 50 fL
10 20 30 fL
The PLT-H histogram
PLT( x109/L ) 77 29 27
PLT-IMethod PLT-H Flow cytometry (FCM)

65
Chapter 18
A patient with systematic lupus erythematosus revisited
the hospital and got checked by Mindray BC-700 Series
hematology analyzer.
From the impedance channel, the large PLTs are interfered by microcytic RBCs and fragments, but the small ones are not.
From the DIFF channel, the RBCs are dissolved by speci�c reagents, the PLT structure remains intact, and large PLTs are
detected by the precise optical methodology. By combining the small PLTs from the conventional impedance method and
the large ones from the optical method, an accurate PLT count will be obtained.
Microscopic examination revealed evident large PLTs
(arrows) having a similar size to the RBCs in multiple
high-power lens.
The PLT count measured by �ow cytometry was 90X109/L,
which was consistent with that by PLT-H.
In this case, the MPV and P-LCR values increased signi�cantly.
The tail of the PLT histogram was elevated, suggesting that
large PLTs may be present in this sample, which would cause
a pseudo-thrombocytopenia. The information obtained
from the DIFF channel can ensure the accurate detection of
large PLTs, avoiding unnecessary blood transfusion.
Clinical case study 2
Principle of brand-new parameter - PLT-H
MCV
MPV
P-LCR
PLT-I
PLT-H
98.8fL
17.0fL
75.2%
52×109/L
89×109/L
CBC results from BC-700 Series
The PLT-I histogram
0
0 10 20 30 40 50 fL
10 20 30 fL
The PLT-H histogram
PLT( x109/L ) 52 89 90
PLT-IMethod PLT-H Flow cytometry (FCM)
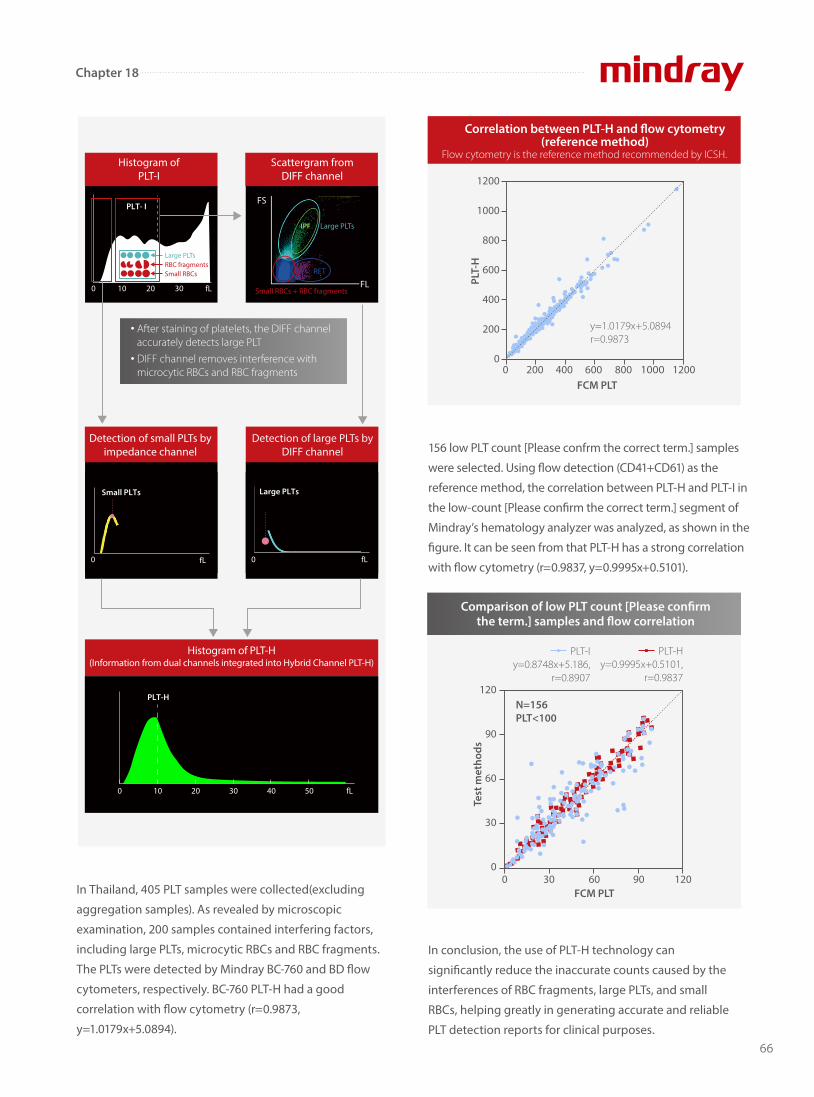
66
Chapter 18
In Thailand, 405 PLT samples were collected(excluding
aggregation samples). As revealed by microscopic
examination, 200 samples contained interfering factors,
including large PLTs, microcytic RBCs and RBC fragments.
The PLTs were detected by Mindray BC-760 and BD �ow
cytometers, respectively. BC-760 PLT-H had a good
correlation with �ow cytometry (r=0.9873,
y=1.0179x+5.0894).
156 low PLT count [Please confrm the correct term.] samples
were selected. Using �ow detection (CD41+CD61) as the
reference method, the correlation between PLT-H and PLT-I in
the low-count [Please con�rm the correct term.] segment of
Mindray’s hematology analyzer was analyzed, as shown in the
�gure. It can be seen from that PLT-H has a strong correlation
with �ow cytometry (r=0.9837, y=0.9995x+0.5101).
In conclusion, the use of PLT-H technology can
signi�cantly reduce the inaccurate counts caused by the
interferences of RBC fragments, large PLTs, and small
RBCs, helping greatly in generating accurate and reliable
PLT detection reports for clinical purposes.
fL FL
FS
Histogram of PLT-I
0 10 20 30 Small RBCs + RBC fragments
Large PLTs
RET
Scattergram from DIFF channel
fL
Small PLTs
fL00
Large PLTs
Histogram of PLT-H(Information from dual channels integrated into Hybrid Channel PLT-H)
0 10 20 30 40 50 fL
PLT-H
PLT- I
Large PLTs
After staining of platelets, the DIFF channel accurately detects large PLT
DIFF channel removes interference with microcytic RBCs and RBC fragments
Small RBCsRBC fragments
Detection of small PLTs by impedance channel
Detection of large PLTs by DIFF channel
Correlation between PLT-H and �ow cytometry (reference method)
Flow cytometry is the reference method recommended by ICSH.
0 200 400 600 800 1000 1200FCM PLT
PLT-
H
y=1.0179x+5.0894r=0.9873
1200
1000
800
600
400
200
0
PLT-Hy=0.9995x+0.5101,
r=0.9837
PLT-Iy=0.8748x+5.186,
r=0.8907
Comparison of low PLT count [Please con�rm the term.] samples and �ow correlation
0 30 60 90 120
N=156PLT<100
FCM PLT
Test
met
hods
120
90
60
30
0
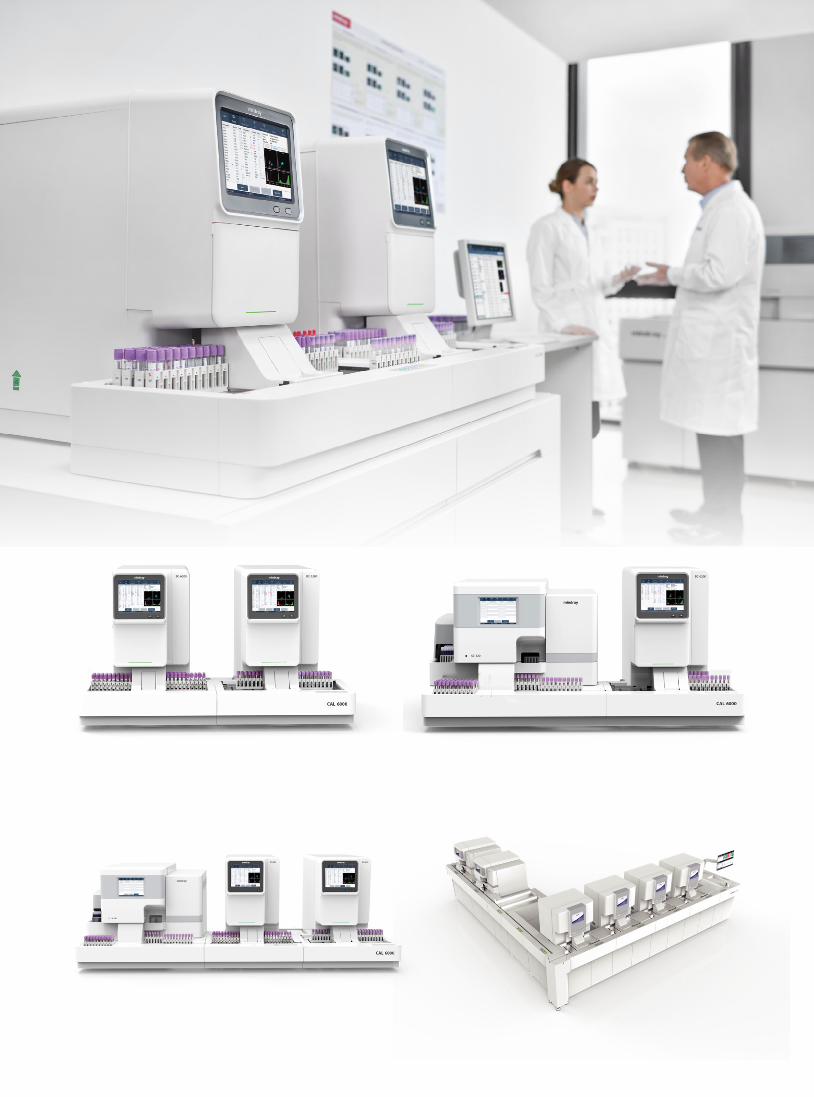

www.mindray.comP/N: ENG-HemaBook-210285X69P-20220811©2021 Shenzhen Mindray Bio-Medical Electronics Co.,Ltd. All rights reserved.
Follow Mindray on Social Media
APP Storelabclub.mindray.com
Join LabClub, a global online community for lab professionals.