Heat waves observed in 2007 in Athens, Greece: Synoptic conditions, bioclimatological assessment,...
10
Heat waves observed in 2007 in Athens, Greece: Synoptic conditions, bioclimatological assessment, air quality levels and health effects $ George Theoharatos a , Katerina Pantavou a,n , Anastasios Mavrakis a , Anastasia Spanou a , George Katavoutas a , Panos Efstathiou b , Periklis Mpekas b , Dimosthenis Asimakopoulos a a Department of Environmental Physics and Meteorology, Faculty of Physics, University of Athens, University Campus – Zografou, Building Physics 5, 157 84 Athens, Greece b National Health Operations Center, Hellenic Ministry of Health and Social Solidarity, Athens, Greece article info Article history: Received 10 February 2009 Received in revised form 4 November 2009 Accepted 8 December 2009 Available online 8 January 2010 Keywords: Heat wave Heat load Air quality AQSI Heatstroke abstract Heat waves are considered to be increasing in frequency and intensity whereas they comprise a significant weather-related cause of deaths in several countries. Two heat waves occurred in Greece in summer 2007. These severe heat waves are assessed by analyzing the prevailing synoptic conditions, evaluating human thermal discomfort, through the Heat Load Index (HL), as well as investigating its interrelation of air pollutant concentrations, and the daily air quality stress index (AQSI), in the greater region of Athens (Attica), Greece. Furthermore, the relation of HL values and the number of heatstroke and heat exhaustion events recorded in public hospitals operating within the Greek National Health System is examined. Data included radiosonde measurements from the Athens airport station (LGAT), NCEP/NCAR reanalysis data in order to obtain the position of the Subtropical Jet Stream (STJ), GDAS meteorological data for back-trajectory calculation, 10-min meteorological data from 10 Hydro- Meteorological stations and mean hourly values of nitric dioxide (NO 2 ), sulphur dioxide (SO 2 ) and ozone (O 3 ) concentrations, measured at 7 different sites, for the last 10-day period of June and July 2007. Spearman’s rank correlation test was used to observe any possible correlation between HL values and air pollutant concentrations, and AQSI values. The results demonstrated different synoptic characteristics for the heat waves of June and July. In the heat wave of June, higher ambient temperatures were recorded and greater HL values were calculated. Extreme discomfort conditions were identified in both heat waves during both day-time and night-time hours. The air pollution analysis showed poor air quality conditions for the heat wave of July, while a significant correlation was found between HL values and average hourly concentrations of O 3 , NO 2 and SO 2 . The number of heat- affected patients reported during the June heat wave was larger. & 2009 Elsevier Inc. All rights reserved. 1. Introduction A heat wave is an extended period of excessively hot weather condition, which may be accompanied by high levels of humidity and it is considered to be linked to the synoptic-scale circulation of the atmosphere (Kysely ´ , 2002; Meehl and Tebaldi, 2004). There is no universal definition of the heat wave (Meehl and Tebaldi, 2004); the term is related to the average atmospheric conditions of an area. Temperatures that inhabitants of hot climate zones consider normal, can be extremely high for those living in cooler areas. Scientific interest has been expressed for heat waves and other extreme phenomena as they affect ecosystems and human society owing to adverse impacts in agriculture, water resources, energy demand, regional economies and human health (Meehl et al., 2000; WHO, 2004). Moreover, the impact of global warming on the frequency, duration and intensity of heat waves has been examined (Meehl and Tebaldi, 2004; WHO, 2004). Studies of heat waves have analyzed thermal and air quality conditions (Giles and Balafoutis, 1990; Giles et al., 1990; Matzarakis and Mayer, 1991), investigated the relation between heat waves and atmo- spheric circulation (Kysely ´ , 2002; Makrogiannis et al., 2008), calculated discomfort indices (based on combinations of various meteorological and personal parameters such as clothing, activity as well as human physiology) so as to estimate human thermal discomfort (Giles et al., 1990; Matzarakis and Mayer, 1997) and tackle heat-related mortality and morbidity (Pantavou et al., 2008; Dolney and Sheridan, 2006; Fouillet et al.,2006; Basu and Samet, 2002). Heat waves are not very rare in Greece as a consequence of the warm climate. Several scientists have studied the conditions leading to the occurrence of this phenomenon over Greece as well ARTICLE IN PRESS Contents lists available at ScienceDirect journal homepage: www.elsevier.com/locate/envres Environmental Research 0013-9351/$ - see front matter & 2009 Elsevier Inc. All rights reserved. doi:10.1016/j.envres.2009.12.002 $ There were no funding sources to support the work described in the manuscript. n Corresponding author. Fax: + 30 210 7295281. E-mail address: [email protected] (K. Pantavou). Environmental Research 110 (2010) 152–161
-
Upload
independent -
Category
Documents
-
view
3 -
download
0
Transcript of Heat waves observed in 2007 in Athens, Greece: Synoptic conditions, bioclimatological assessment,...

ARTICLE IN PRESS
Environmental Research 110 (2010) 152–161
Contents lists available at ScienceDirect
Environmental Research
0013-93
doi:10.1
$The
manuscn Corr
E-m
journal homepage: www.elsevier.com/locate/envres
Heat waves observed in 2007 in Athens, Greece: Synoptic conditions,bioclimatological assessment, air quality levels and health effects$
George Theoharatos a, Katerina Pantavou a,n, Anastasios Mavrakis a, Anastasia Spanou a,George Katavoutas a, Panos Efstathiou b, Periklis Mpekas b, Dimosthenis Asimakopoulos a
a Department of Environmental Physics and Meteorology, Faculty of Physics, University of Athens, University Campus – Zografou, Building Physics 5, 157 84 Athens, Greeceb National Health Operations Center, Hellenic Ministry of Health and Social Solidarity, Athens, Greece
a r t i c l e i n f o
Article history:
Received 10 February 2009
Received in revised form
4 November 2009
Accepted 8 December 2009Available online 8 January 2010
Keywords:
Heat wave
Heat load
Air quality
AQSI
Heatstroke
51/$ - see front matter & 2009 Elsevier Inc. A
016/j.envres.2009.12.002
re were no funding sources to support
ript.
esponding author. Fax: +30 210 7295281.
ail address: [email protected] (K. Pantavo
a b s t r a c t
Heat waves are considered to be increasing in frequency and intensity whereas they comprise a
significant weather-related cause of deaths in several countries. Two heat waves occurred in Greece in
summer 2007. These severe heat waves are assessed by analyzing the prevailing synoptic conditions,
evaluating human thermal discomfort, through the Heat Load Index (HL), as well as investigating its
interrelation of air pollutant concentrations, and the daily air quality stress index (AQSI), in the greater
region of Athens (Attica), Greece. Furthermore, the relation of HL values and the number of heatstroke
and heat exhaustion events recorded in public hospitals operating within the Greek National Health
System is examined. Data included radiosonde measurements from the Athens airport station (LGAT),
NCEP/NCAR reanalysis data in order to obtain the position of the Subtropical Jet Stream (STJ), GDAS
meteorological data for back-trajectory calculation, 10-min meteorological data from 10 Hydro-
Meteorological stations and mean hourly values of nitric dioxide (NO2), sulphur dioxide (SO2) and
ozone (O3) concentrations, measured at 7 different sites, for the last 10-day period of June and July
2007. Spearman’s rank correlation test was used to observe any possible correlation between HL values
and air pollutant concentrations, and AQSI values. The results demonstrated different synoptic
characteristics for the heat waves of June and July. In the heat wave of June, higher ambient
temperatures were recorded and greater HL values were calculated. Extreme discomfort conditions
were identified in both heat waves during both day-time and night-time hours. The air pollution
analysis showed poor air quality conditions for the heat wave of July, while a significant correlation was
found between HL values and average hourly concentrations of O3, NO2 and SO2. The number of heat-
affected patients reported during the June heat wave was larger.
& 2009 Elsevier Inc. All rights reserved.
1. Introduction
A heat wave is an extended period of excessively hot weathercondition, which may be accompanied by high levels of humidityand it is considered to be linked to the synoptic-scale circulationof the atmosphere (Kysely, 2002; Meehl and Tebaldi, 2004). Thereis no universal definition of the heat wave (Meehl and Tebaldi,2004); the term is related to the average atmospheric conditionsof an area. Temperatures that inhabitants of hot climate zonesconsider normal, can be extremely high for those living in coolerareas.
Scientific interest has been expressed for heat waves and otherextreme phenomena as they affect ecosystems and human society
ll rights reserved.
the work described in the
u).
owing to adverse impacts in agriculture, water resources, energydemand, regional economies and human health (Meehl et al.,2000; WHO, 2004). Moreover, the impact of global warming onthe frequency, duration and intensity of heat waves has beenexamined (Meehl and Tebaldi, 2004; WHO, 2004). Studies of heatwaves have analyzed thermal and air quality conditions (Gilesand Balafoutis, 1990; Giles et al., 1990; Matzarakis and Mayer,1991), investigated the relation between heat waves and atmo-spheric circulation (Kysely, 2002; Makrogiannis et al., 2008),calculated discomfort indices (based on combinations of variousmeteorological and personal parameters such as clothing, activityas well as human physiology) so as to estimate human thermaldiscomfort (Giles et al., 1990; Matzarakis and Mayer, 1997) andtackle heat-related mortality and morbidity (Pantavou et al.,2008; Dolney and Sheridan, 2006; Fouillet et al.,2006; Basu andSamet, 2002).
Heat waves are not very rare in Greece as a consequence of thewarm climate. Several scientists have studied the conditionsleading to the occurrence of this phenomenon over Greece as well
ARTICLE IN PRESS
G. Theoharatos et al. / Environmental Research 110 (2010) 152–161 153
as its implications (Metaxas and Kallos, 1980; Giles et al., 1990;Karakostas and Gawith, 1994; Karacostas and Downing, 1996;Gawith et al., 1999; Brikas et al., 2006; Pakalidou and Karacostas,2004) whereas others have focused on the more severe heatwaves that were observed during the past twenty years or so(Katsouyanni et al., 1988; Prezerakos, 1989; Matzarakis andMayer, 1991; Giles and Balafoutis, 1990; Balafoutis and Makro-giannis, 2001; Makrogiannis et al., 2008; Founda and Giannako-poulos, 2009).
According to the World Meteorological Organization (WMO) aheat wave is defined as the phenomenon during which the dailymaximum temperature for at least five consecutive days exceedsthe average maximum temperature by 5 1C, considering theperiod between 1961 and 1990 as the normal measuring period(Frich et al., 2002). In the case of Greece, according to Metaxas andKallos (1980), a heat wave occurs when the following criteria aremet:
�
The maximum temperature at the station of the NationalObservatory of Athens (NOA) located in Thission in the centerof Athens, is at least 37 1C. � The average daily temperature is at least 31 1C, at theaforementioned station.
� The maximum temperature at Larissa station (Central Greece)is at least 38 1C on that day.
� The temperatures is at least 51 above normal in parts of thisarea for a period of at least two days or more (USA norms).
The key synoptic feature for the occurrence of a heat wave overGreece is the position of the Subtropical Jet Stream (STJ) in theupper troposphere (Balafoutis and Makrogiannis, 2001). Undernormal meteorological conditions the main position of the STJ isobserved over SW Spain, Sicily, south of the Greek peninsula,Central Aegean Sea and SW Turkey (Prezerakos, 1989). Themaximum wind speed is observed at the 200 mb level. Whenthe STJ moves to the North of the Greek area, abnormalmeteorological conditions are formed over Greece which resultin very high values of surface air temperature. As the STJ movesaway from Greece, towards the North, heat waves become moreintense.
This northward displacement of the STJ can be effected by low-pressure systems over the SW of England—Northern BiscayanGulf, combined with ridges protruding from Africa towards theMediterranean. This type of mechanism causes powerful heatinvasions to the SE Balkan region, with the climaxing to befall 3–4days afterwards (Prezerakos, 1989; Katsouyanni et al., 1993;Brikas et al., 2006). Moreover, the physical process that takesplace under these synoptic conditions is the large-scale sub-sidence within the tropospheric air below and to the south of theSTJ which leads to: (a) Raising air temperature due to adiabaticcompression, (b) surface horizontal divergence of the vertical flux,and (c) increase of the Sea Level Pressure, enhancing theanticyclonic circulation and the concurrent hot weather.
In conclusion, the combination of large-scale subsidence andhorizontal movement of air masses from southern parts is thetypical cause of the heat wave phenomenon over Greece.
During the last ten days of June and July 2007, Athensexperienced two extreme heat events, defined as such accordingto both the WMO and Metaxa’s and Kallos’ definitions. At thattime, these heat waves became front page news in all Greeknewspapers and the Public Authorities took preventive measures.Air temperatures reached the highest levels recorded in the past100 years, breaking the previous records with temperaturesexceeding 45 1C at the meteorological station of Philadelphia inAthens. Air pollution exceeded the World Health Organization air
quality guidelines on 42% of the days in the center of Athens(Patission St.), where the highest levels of air pollutantsconcentrations were observed. The highest ambient temperaturefor the summer of 2007 was recorded on June 26. That day themaximum temperature at NOA (Thission station) was 44.8 1C(Founda and Giannakopoulos, 2009). The previous record max-imum temperature recorded at NOA was 43 1C on June 21, 1916and July 2, 1998 . On June 28th, a wild fire broke out in theNational Park of Greece, Parnitha, due to the combination ofstrong westerly winds and high temperatures. This was the mostsevere heat wave ever recorded and the second longest heat waveof significant intensity after that of 1987 (Katsouyanni et al.,1988; Matzarakis and Mayer, 1991). These parameters resulted inpossibly the worst heat wave event recorded in Greece. In July2007, the daily maximum temperature remained above 40 1C forfour consecutive days. According to the records of NOA, since1897 only twice has Athens experienced two heat waves the samesummer period: in the years 2000 and 2007.
The main target of this paper is to describe and analyze thesynoptic situation, the resulting meteorological conditions andthe consequences of this relatively rare phenomenon on the life ofinhabitants in greater region of Athens, Attica, through theinduced thermal stress and its possible association to air pollution(Katsouyanni et al., 1997; Giles et al., 1990; Giles and Balafoutis,1990; Katsouyanni et al., 1993; Philandras et al., 1999; Paliatsosand Nastos, 1999; Balafoutis and Makrogiannis 2001; Kassomenoset al., 2001; Makra et al., 2003). The greater urban zone of Athenswas chosen for this paper, as it is the largest city of Greece, with apopulation of 3,761,810 people—about 34.31% of the populationof Greece—according to the 2001 census carried out by theGeneral Secretariat of National Statistical Service in Greece (ESYE,2001) and it is also a popular tourist destination for peoplecoming from northern Europe who are more vulnerable to theheat (WHO, 2004). Moreover, individuals living in large citiesprobably have greater risk for mortality or morbidity attributableto elevated ambient temperatures since urban environments areconsiderably warmer than the surrounding suburban areas due tothe so-called ‘urban heat island effect’. Athens has a reliablenetwork of urban and suburban meteorological stations recordingvarious meteorological parameters for a long period of time.
2. Materials and methods
2.1. Study area
The Greater Athens area is situated in a small peninsula located in the south-
eastern end of the Greek mainland. It covers about 450 km2 and the built-up area
is mainly located in a basin surrounded by high and rather stony mountains from
three sides and open to the sea from the south (Fig. 1). There are small openings
connecting the metropolitan area of Athens with the Greek mainland to the north,
northwest, and northeast of the basin. In Athens, more than 2,000,000 vehicles are
registered; industrial activities are mainly located in the western part of the basin
(Thriassion Plain).
2.2. Meteorological data
In order to investigate the vertical temperature distribution from the surface
to the 10 mb pressure level, radiosonde data were gathered from the station of
Athens airport (LGAT) at 00 and 12 UTC, from 22nd to the 27th of June and from
23rd to the 27th of July 2007 (University of Wyoming, 2008). For detailed
information on the synoptic structure and an analysis of atmospheric circulation,
we used the National Center for Environmental Prediction/National Center for
Atmospheric Research (NCEP/NCAR) reanalysis data to obtain the position of the
Subtropical Jet Stream (STJ) at the 300 mb level, and additionally at the 700 mb
and 500 mb levels for the two heat wave incidents (June 22nd to 27th and July
23rd to 27th, 2007), respectively, (Kalnay et al., 1996; Brikas et al., 2006; Earth
System Research Laboratory, 2008). Finally, the HISPLYT model from the READY
system of the NOAA Air Resources Laboratory (ARL) (Draxler and Rolph, 2003;
Rolph, 2003; ARL, 2008) was used to generate isentropic back-trajectories at three

ARTICLE IN PRESS
Fig. 1. Map showing the Attica region and the air quality (diamonds) and hydro-meteorological (dots) stations.
Table 1Correspondence between (A) Heat Load index values and thermal stress levels (B)
AQSI values and air quality related stress conditions.
A HL Thermal sensation B AQSI Assessment
r0.25 Extreme cold stress 0.0–0.5 Barely stressed
0.251–0.820 Great cold stress 0.5–1.0 Slightly stressed
0.821–0.975 Slight cold stress 1.0–1.5 Moderately stressed
0.976–1.025 Thermoneutral 1.5–2.0 Distinctly stressed
1.026–1.180 Slight hot stress 42.0 Heavily stressed
1.181–1.750 Great hot stress
Z1.715 Extreme hot stress
G. Theoharatos et al. / Environmental Research 110 (2010) 152–161154
heights (1000, 3000, and 5000 m) at 12 UTC on June 26th and on July 25th, 2007.
Back-trajectories were based on Global Data Assimilation System (GDAS)
meteorological data.
In the urban area of Athens, a monitoring network of ten Hydro-Meteor-
ological surface stations has been operated by the National Technical University of
Athens (NTUA). Seven of these stations (Agios Kosmasm, Ano Liosiam, Galatsim,
Zografoum, Ilioupolim, Menidim and Pentelim) are located within the basin of
Athens. One is located in the east, in the Messogia plain (Pikermim station), and
another one in the west, in the neighboring Thriassion plain (Mandram station).
The last station is located south, on the small rocky island of Psitaliam (Fig.1).
Meteorological measurements were obtained from the NTUA network including
air temperature (Tair), relative humidity (RH), horizontal wind speed (WS) and
global solar radiation (SR) in intervals of 10 min, for the periods from 22 to 30 June
and from 22 to 30 of July 2007 (NTUA, 2008). Sun altitude data were obtained from
the Astronomical Applications Department of the US Naval Observatory (USNO) in
intervals of 10 min (USNO, 2008).
Assessment of the thermal environment was obtained through the thermo-
physiological index Heat Load (HL). Based on the Man–ENvironment heat
EXchange model (MENEX model), meteorological conditions as well as physiolo-
gical parameters establish the heat gain or loss of the human body by radiation,
convection, conduction, evaporation and respiration. According to the MENEX
model, the general equation of the heat balance has the following form
(Blazejczyk, 2001):
MþmRþmLþmCþmEþmRes¼mS; ð1Þ
where M is the metabolic heat production, mR the absorbed solar radiation, mL the
net long-wave radiation, mC the turbulent exchange of sensible heat, mE
the turbulent exchange of latent heat, mRes the respiratory heat loss and mS
stands for the net heat storage. All parameters in Wm�2. The HL index represents
the load of the thermoregulatory system due to the intensity of adaptation
processes of a human body, on a seven-step scale according to Table 1. The HL
index is estimated as the combination of the three principal heat fluxes of the
human heat balance equation, as follows:
At mSo0 W m�2 and mEZ�50 W m�2,
HL¼ ½ðmSþ1000Þ=ð1000Þ�ð5=ð1þmRÞÞ ð2Þ
At mSZ0 W m�2 and mEZ�50 W m�2,
HL¼ ½ðmSþ1000Þ=ð1000Þ�ð2-1=ð1þmRÞÞ ð3Þ
At mSo0 W m�2 and mEo�50 W m�2,
HL¼ ½mE=ð�50Þ�½ðmSþ1000Þ=1000�ð5=ð1þmRÞÞ ð4Þ
At mSZ0 W m�2 and mEo�50 W m�2,
HL¼ ½mE=ð�50Þ�½ðmSþ1000Þ=1000�ð2-1=ð1þmRÞÞ ð5Þ
In this paper, the HL index was estimated for a walking young male person,
walking with a speed of 1.1 ms�1 and a metabolic heat production of 135 Wm�2,
according to ISO 8996.
2.3. Air quality data
Air pollution data encompassed mean hourly values of nitric dioxide (NO2),
sulphur dioxide (SO2) and ozone (O3) concentrations, measured at 7 different
locations within the Attica region covering the study area and are representative of
the population exposure. These include the suburban station of Ellinikoap, the
suburban industrial station of Elefsinap, the suburban background stations of Ano
Liosiaap and Zofrafouap and the urban, urban background and urban traffic stations
of Ilioupoliap, Marousiap and Piraeusap, respectively. The data cover a 21-day
period (June 21st to 30th 2007 and July, 21st to 31st 2007) and were obtained
from the Directory of Air and Noise Pollution Control (DANPC) of the Ministry of
the Environment. Statistical analysis was performed using the statistical software
SPSS, Version 12 (SPSS Inc., Chicago, Illinois, USA).
For the assessment of the urban air environment, the air quality stress index
AQSI was calculated on a daily basis. AQSI24 is stated based on the average daily
concentrations of air pollutants, by the formula (Matzarakis and Mayer, 1991):
AQSI24 ¼X3
i ¼ 1
average daily value
MI24 h valueð6Þ
i indicating the three air pollutants, NO2, SO2 and O3 during heat waves and
MI24hvalue indicating the threshold values of air pollutants according to the
European Community standards (NO2: 100 mg/m3; O3: 50 mg/m3; SO2: 125 mg/m3).
Table 1 displays the AQSI24 values with the suggested description of human
biometeorological stress conditions.
ARTICLE IN PRESS
G. Theoharatos et al. / Environmental Research 110 (2010) 152–161 155
In order to examine a possible link between human biometeorological
conditions and air quality, the linear cross-correlation and lagged cross-correlation
between mean hourly HL values and mean hourly values of air pollutants
concentrations, as well as AQSI24 values were estimated using the Spearman’s rank
correlation test. The confidence level was set at 0.05.
2.4. Data on human health effects
In summer 2007, the National Health’s Operational Center (NHOC) declared a
state of national alert from June 22 to June 28 and from July 23 to 27. During these
periods, all patients diagnosed with heat exhaustion and heatstroke in the
emergency department units, as well as mortality data of heatstroke, were
recorded in all public hospitals operating within the Greek National Health System
in the region of Attica, and were obtained from the NHOC. Heat exhaustion is a
milder form of heat-related illness, the symptoms of which may include increased
body temperature (not above 40 1C). The signs that could indicate a heat
exhaustion are fatigue, dizziness, nausea, vomiting, tachycardia and hypotension.
Heatstroke is the most dangerous condition, in which the human body is unable to
regulate its temperature due to excessive heat and it is defined by elevated body
temperature (above 40 1C) and dehydration. A heatstroke can cause death or
permanent disability if emergency treatment is not provided.
3. Results
3.1. Synoptic situation and atmospheric circulation analysis
During the studied periods, a deep low-pressure systemrotated in the region of Britain for several days and then movednorth–northeast. At the same time, there was a shallow ridge overthe central Mediterranean. The result was temperatures that byfar exceeded the previous maximum temperature records.
The radiosonde data at 00 and 12 UTC for Athens airport(LGAT), for the period from 24 to 27 June and from 24 to 27 July2007, demonstrate high air temperature values between 950 mband 850 mb, which overrun the values of air temperature at thesurface and a temperature drop at the level of 700 mb, for themajority of radiosondes (for detailed information see Supplemen-tary Material). On June 25th, a strong adiabatic heating can beobserved, accompanied by a small drop of temperature on thesurface. However, during the heat wave of July, there is no suchphenomenon observed, except for the 12 UTC radiosonde on July25, which was also the hottest day of this second heat wave.Radiosonde measurements of wind velocity indicated that STJ washigher at day than at night, at the level of 300 mb. A temperaturedecrement is observed at 500 mb. Furthermore, an importantvariation observed in surface RH between day and night for bothheat waves. Radiosondes show that RH decreased up to 37% and30% during the day in June and July heat waves, respectively.
The reanalysis data of NCEP/NCAR model suggest that duringthe heat wave of June, maximum air velocities of STJ were locatednortheast of Balkans, over central Europe, with average windvelocity of 30 ms�1 at 00 UTC, at the level of 300 mb. Moreover,average wind velocity was 10 ms�1 at 700 mb and maximumvalues of wind speed were recorded in northwest Greece and inthe west of Balkans. During the heat wave of July, the maximumwind speed at 00 UTC at the 300 mb level was 25 ms�1. At500 mb, the mean air velocity was 20 ms�1 and the maximumvalues of wind speed were observed northwest of Balkans, at adistance long enough from Greece. These characteristics, duringthe heat wave of July, comply with those reported in previouslypublished studies so they can be considered as typical of a heatwave over Greece (Metaxas and Kallos, 1980; Prezerakos, 1989;Giles and Balafoutis, 1990; Balafoutis and Makrogiannis, 2001;Brikas et al., 2006) (see Supplementary Material).
According to the analysis of the back trajectories, the origin ofair masses for the two heat wave episodes differs (see Supple-mentary Material). We observed that in the heat wave of June, airmasses originated from the Northern African desert. Dry and hot
air masses, enriched in water vapor above the Mediterranean andreached Greece with increased amounts of humidity. At the1000 m level the air mass departs from Northern Africa with RHless than 10% and arrives at Athens with an average RH value of30%. A similar increase is observed at the 5000 m with an RHvalue of 40% at the point of origin and an RH value of 60% overAthens, whereas the situation is inverted at the 3000 m level withhigher RH values observed over Africa compared to the RH valuesover Athens. This movement of air masses during the heat wave ofJune does not comply with the usual characteristics of heat wavesobserved over Greece. By contrast, the heat wave of July hadtypical characteristics. Low and middle level masses, starting fromthe Balkan Peninsula, moved southward, reaching the surfacelayer over Greece with increased temperature and relativelyreduced humidity. At the lower level (1000 m) the decrease in RHreaches 25%, at the 3000 m there is a 40% RH increase, while at thehigher level (5000 m) there is a small decrease, around 10%.
The two heat waves had markedly different thermohygro-metric characteristics at the surface level that could be character-ized as hot and damp for the event of June and hot and dry for theevent of July. Evidently the hot and wet characteristics of the Juneevent lead to extremely high values of the HL index.
3.2. Thermal discomfort assessment
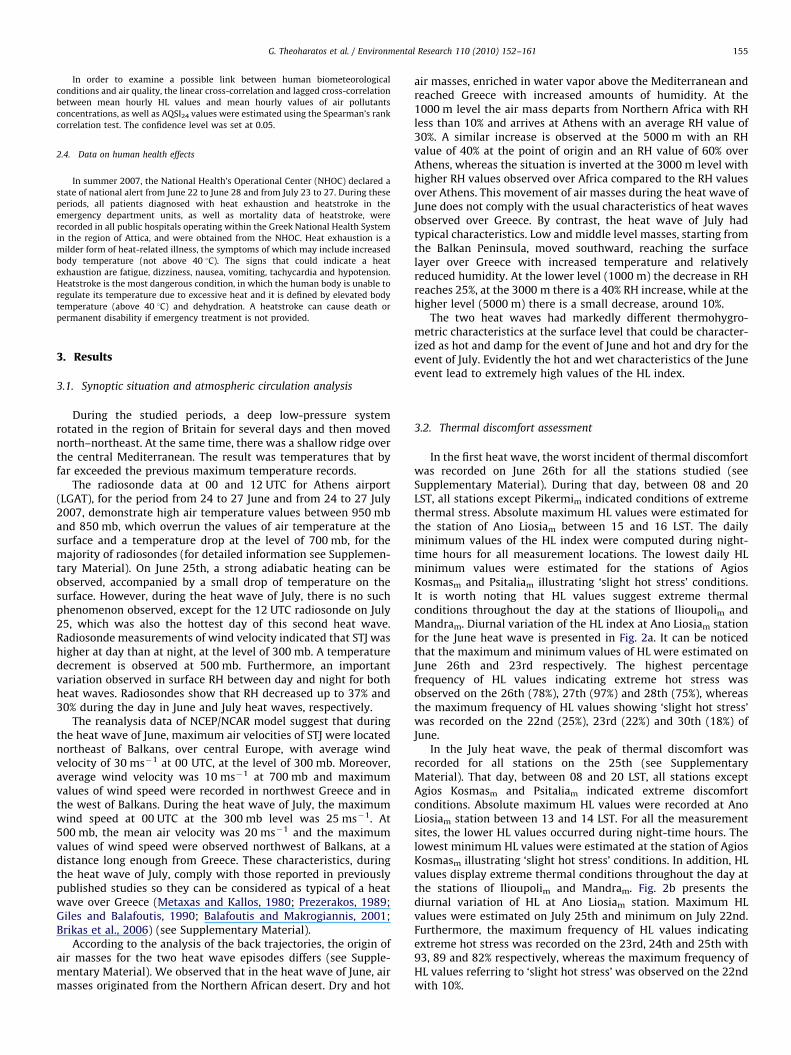
In the first heat wave, the worst incident of thermal discomfortwas recorded on June 26th for all the stations studied (seeSupplementary Material). During that day, between 08 and 20LST, all stations except Pikermim indicated conditions of extremethermal stress. Absolute maximum HL values were estimated forthe station of Ano Liosiam between 15 and 16 LST. The dailyminimum values of the HL index were computed during night-time hours for all measurement locations. The lowest daily HLminimum values were estimated for the stations of AgiosKosmasm and Psitaliam illustrating ‘slight hot stress’ conditions.It is worth noting that HL values suggest extreme thermalconditions throughout the day at the stations of Ilioupolim andMandram. Diurnal variation of the HL index at Ano Liosiam stationfor the June heat wave is presented in Fig. 2a. It can be noticedthat the maximum and minimum values of HL were estimated onJune 26th and 23rd respectively. The highest percentagefrequency of HL values indicating extreme hot stress wasobserved on the 26th (78%), 27th (97%) and 28th (75%), whereasthe maximum frequency of HL values showing ‘slight hot stress’was recorded on the 22nd (25%), 23rd (22%) and 30th (18%) ofJune.
In the July heat wave, the peak of thermal discomfort wasrecorded for all stations on the 25th (see SupplementaryMaterial). That day, between 08 and 20 LST, all stations exceptAgios Kosmasm and Psitaliam indicated extreme discomfortconditions. Absolute maximum HL values were recorded at AnoLiosiam station between 13 and 14 LST. For all the measurementsites, the lower HL values occurred during night-time hours. Thelowest minimum HL values were estimated at the station of AgiosKosmasm illustrating ‘slight hot stress’ conditions. In addition, HLvalues display extreme thermal conditions throughout the day atthe stations of Ilioupolim and Mandram. Fig. 2b presents thediurnal variation of HL at Ano Liosiam station. Maximum HLvalues were estimated on July 25th and minimum on July 22nd.Furthermore, the maximum frequency of HL values indicatingextreme hot stress was recorded on the 23rd, 24th and 25th with93, 89 and 82% respectively, whereas the maximum frequency ofHL values referring to ‘slight hot stress’ was observed on the 22ndwith 10%.
ARTICLE IN PRESS
Fig. 2. Diurnal variation of Heat Load index at Ano Liosiam station for: (a) June and (b) July heat wave event.
G. Theoharatos et al. / Environmental Research 110 (2010) 152–161156
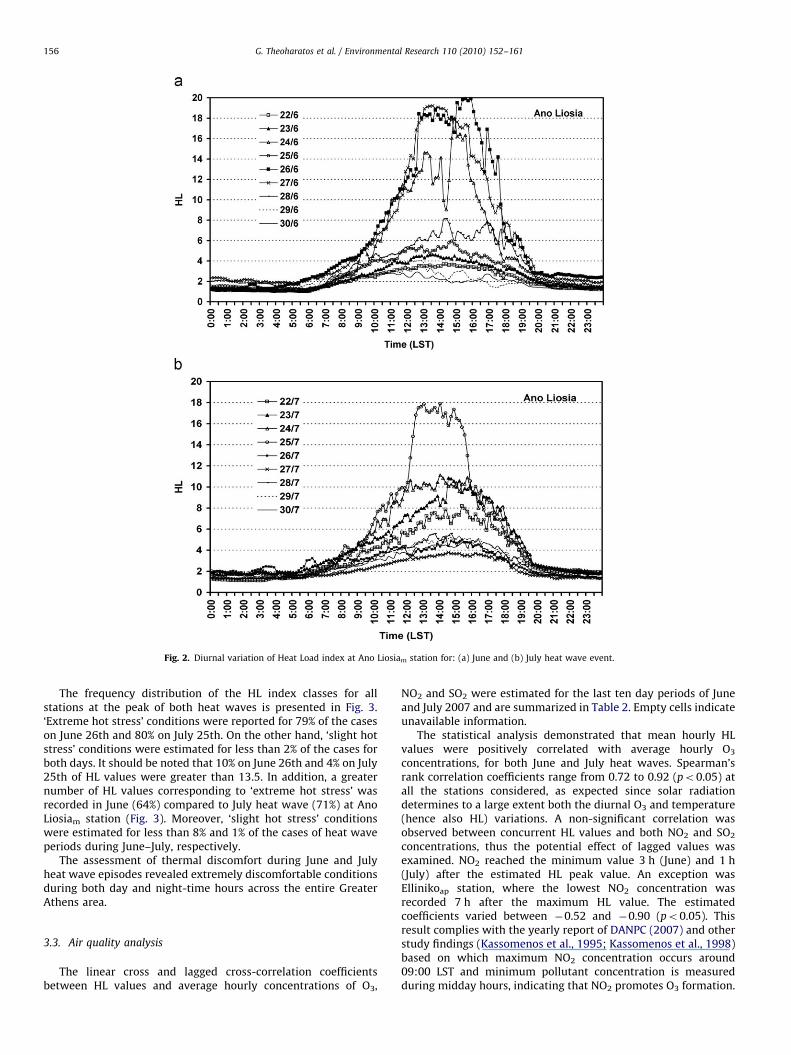
The frequency distribution of the HL index classes for allstations at the peak of both heat waves is presented in Fig. 3.‘Extreme hot stress’ conditions were reported for 79% of the caseson June 26th and 80% on July 25th. On the other hand, ‘slight hotstress’ conditions were estimated for less than 2% of the cases forboth days. It should be noted that 10% on June 26th and 4% on July25th of HL values were greater than 13.5. In addition, a greaternumber of HL values corresponding to ‘extreme hot stress’ wasrecorded in June (64%) compared to July heat wave (71%) at AnoLiosiam station (Fig. 3). Moreover, ‘slight hot stress’ conditionswere estimated for less than 8% and 1% of the cases of heat waveperiods during June–July, respectively.
The assessment of thermal discomfort during June and Julyheat wave episodes revealed extremely discomfortable conditionsduring both day and night-time hours across the entire GreaterAthens area.
3.3. Air quality analysis
The linear cross and lagged cross-correlation coefficientsbetween HL values and average hourly concentrations of O3,
NO2 and SO2 were estimated for the last ten day periods of Juneand July 2007 and are summarized in Table 2. Empty cells indicateunavailable information.
The statistical analysis demonstrated that mean hourly HLvalues were positively correlated with average hourly O3
concentrations, for both June and July heat waves. Spearman’srank correlation coefficients range from 0.72 to 0.92 (po0.05) atall the stations considered, as expected since solar radiationdetermines to a large extent both the diurnal O3 and temperature(hence also HL) variations. A non-significant correlation wasobserved between concurrent HL values and both NO2 and SO2
concentrations, thus the potential effect of lagged values wasexamined. NO2 reached the minimum value 3 h (June) and 1 h(July) after the estimated HL peak value. An exception wasEllinikoap station, where the lowest NO2 concentration wasrecorded 7 h after the maximum HL value. The estimatedcoefficients varied between �0.52 and �0.90 (po0.05). Thisresult complies with the yearly report of DANPC (2007) and otherstudy findings (Kassomenos et al., 1995; Kassomenos et al., 1998)based on which maximum NO2 concentration occurs around09:00 LST and minimum pollutant concentration is measuredduring midday hours, indicating that NO2 promotes O3 formation.
ARTICLE IN PRESS
Fig. 3. Frequency distribution for the classes of Heat Load index between all stations at the peak of each heat wave event and during each heat wave event at Ano Liosiam
station.
Table 2Linear cross and lagged cross-correlation coefficient between HL values and concentrations of air pollutants during the summer of 2007 heat wave.
Station Linear cross coefficient Lag cross coefficient(HL–O3) (HL–NO2) (HL–SO2)
June July June July June July
Elefsinaap 0.77 0.87 R3a=�0.83 R1a=�0.85 R1a=0.81 R2n=0.65
Ellinikoap 0.84 0.92 R7n=�0.78 – R3=0.81 R6n=0.67
Ilioupoliap 0.77 0.91 R3=�0.71 – R6a=0.48 R6=0.65
Ano Liosiaap 0.79 0.85 R3=�0.76 R1=�0.81 R3=0.86 R7a=0.6
Marousiap 0.86 0.87 R3=�0.90 – – –
Piraeusap 0.46 0.88 R3=�0.78 R1=�0.81 R3=0.93 R6=0.73
Zografouap 0.72 0.76 R3=�0.77 R1=�0.52 – –
a R1: value of 1 h time lag, R3: value of 3 h time lag, R6 value of 6 h time lag, R6 value of 6 h time lag, R7: value of 7 h time lag.
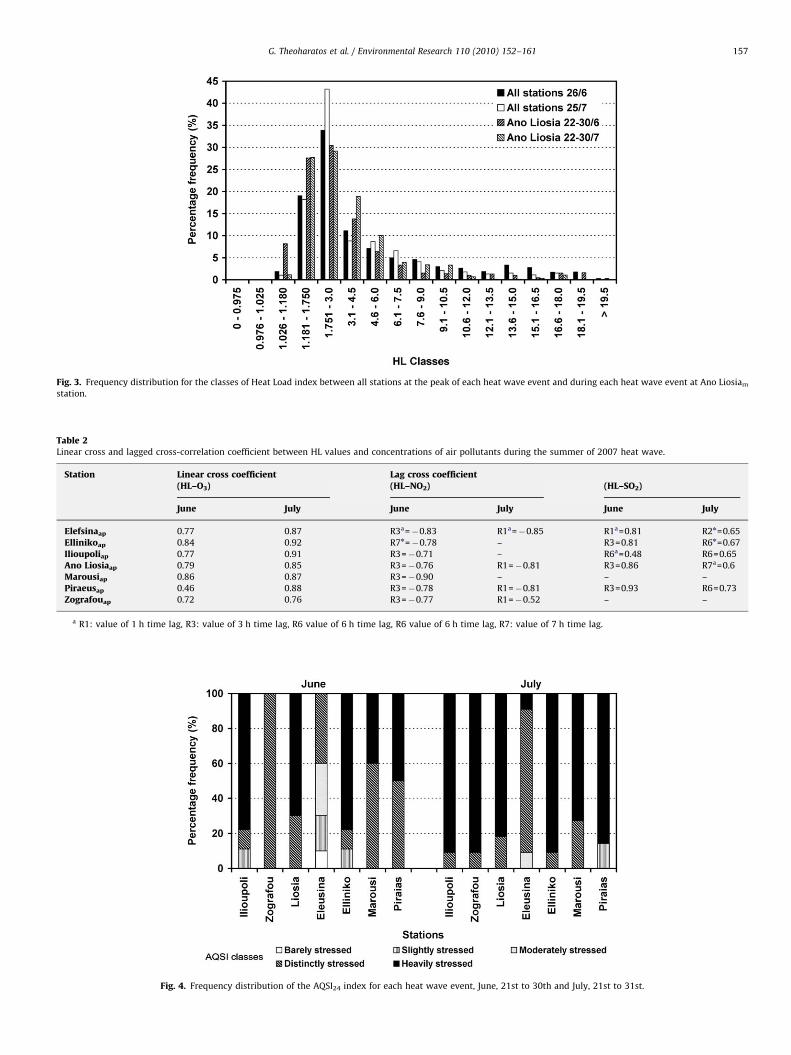
Fig. 4. Frequency distribution of the AQSI24 index for each heat wave event, June, 21st to 30th and July, 21st to 31st.
G. Theoharatos et al. / Environmental Research 110 (2010) 152–161 157
ARTICLE IN PRESS
G. Theoharatos et al. / Environmental Research 110 (2010) 152–161158
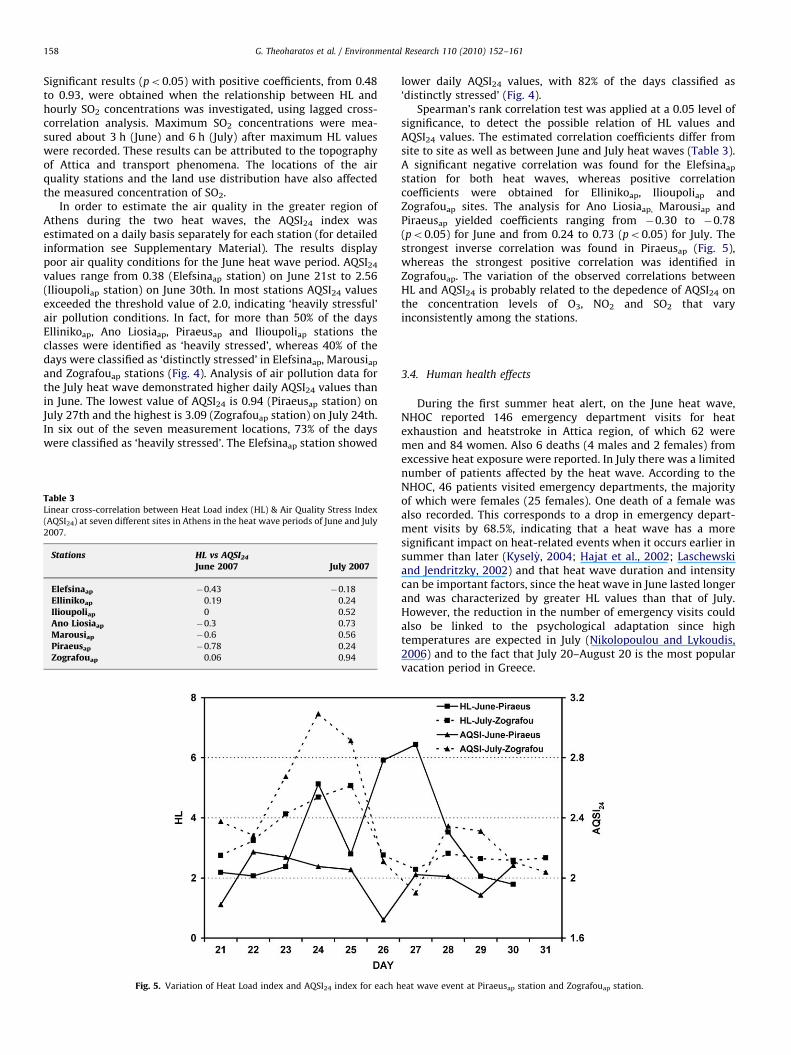
Significant results (po0.05) with positive coefficients, from 0.48to 0.93, were obtained when the relationship between HL andhourly SO2 concentrations was investigated, using lagged cross-correlation analysis. Maximum SO2 concentrations were mea-sured about 3 h (June) and 6 h (July) after maximum HL valueswere recorded. These results can be attributed to the topographyof Attica and transport phenomena. The locations of the airquality stations and the land use distribution have also affectedthe measured concentration of SO2.
In order to estimate the air quality in the greater region ofAthens during the two heat waves, the AQSI24 index wasestimated on a daily basis separately for each station (for detailedinformation see Supplementary Material). The results displaypoor air quality conditions for the June heat wave period. AQSI24
values range from 0.38 (Elefsinaap station) on June 21st to 2.56(Ilioupoliap station) on June 30th. In most stations AQSI24 valuesexceeded the threshold value of 2.0, indicating ‘heavily stressful’air pollution conditions. In fact, for more than 50% of the daysEllinikoap, Ano Liosiaap, Piraeusap and Ilioupoliap stations theclasses were identified as ‘heavily stressed’, whereas 40% of thedays were classified as ‘distinctly stressed’ in Elefsinaap, Marousiap
and Zografouap stations (Fig. 4). Analysis of air pollution data forthe July heat wave demonstrated higher daily AQSI24 values thanin June. The lowest value of AQSI24 is 0.94 (Piraeusap station) onJuly 27th and the highest is 3.09 (Zografouap station) on July 24th.In six out of the seven measurement locations, 73% of the dayswere classified as ‘heavily stressed’. The Elefsinaap station showed
Table 3Linear cross-correlation between Heat Load index (HL) & Air Quality Stress Index
(AQSI24) at seven different sites in Athens in the heat wave periods of June and July
2007.
Stations HL vs AQSI24
June 2007 July 2007
Elefsinaap �0.43 �0.18
Ellinikoap 0.19 0.24
Ilioupoliap 0 0.52
Ano Liosiaap �0.3 0.73
Marousiap �0.6 0.56
Piraeusap �0.78 0.24
Zografouap 0.06 0.94
Fig. 5. Variation of Heat Load index and AQSI24 index for each h
lower daily AQSI24 values, with 82% of the days classified as‘distinctly stressed’ (Fig. 4).
Spearman’s rank correlation test was applied at a 0.05 level ofsignificance, to detect the possible relation of HL values andAQSI24 values. The estimated correlation coefficients differ fromsite to site as well as between June and July heat waves (Table 3).A significant negative correlation was found for the Elefsinaap
station for both heat waves, whereas positive correlationcoefficients were obtained for Ellinikoap, Ilioupoliap andZografouap sites. The analysis for Ano Liosiaap, Marousiap andPiraeusap yielded coefficients ranging from �0.30 to �0.78(po0.05) for June and from 0.24 to 0.73 (po0.05) for July. Thestrongest inverse correlation was found in Piraeusap (Fig. 5),whereas the strongest positive correlation was identified inZografouap. The variation of the observed correlations betweenHL and AQSI24 is probably related to the depedence of AQSI24 onthe concentration levels of O3, NO2 and SO2 that varyinconsistently among the stations.
3.4. Human health effects
During the first summer heat alert, on the June heat wave,NHOC reported 146 emergency department visits for heatexhaustion and heatstroke in Attica region, of which 62 weremen and 84 women. Also 6 deaths (4 males and 2 females) fromexcessive heat exposure were reported. In July there was a limitednumber of patients affected by the heat wave. According to theNHOC, 46 patients visited emergency departments, the majorityof which were females (25 females). One death of a female wasalso recorded. This corresponds to a drop in emergency depart-ment visits by 68.5%, indicating that a heat wave has a moresignificant impact on heat-related events when it occurs earlier insummer than later (Kysel �y, 2004; Hajat et al., 2002; Laschewskiand Jendritzky, 2002) and that heat wave duration and intensitycan be important factors, since the heat wave in June lasted longerand was characterized by greater HL values than that of July.However, the reduction in the number of emergency visits couldalso be linked to the psychological adaptation since hightemperatures are expected in July (Nikolopoulou and Lykoudis,2006) and to the fact that July 20–August 20 is the most popularvacation period in Greece.
eat wave event at Piraeusap station and Zografouap station.

ARTICLE IN PRESS
Fig. 6. Daily number of heat exhaustion and heatstroke patients affected during (a) June and (b) July 2007 heat wave events.
G. Theoharatos et al. / Environmental Research 110 (2010) 152–161 159
The daily variation of heat exhaustion and heatstroke cases forJune and July heat waves are presented in Figs. 6a and b,respectively. In the first heat wave, a relatively moderatemaximum of HL values occurred on June 24th and the peakmaximum value of HL was measured on the 26th, while a gradualincrement in heat-affected patients is observed between June25th and 27th. In July, the maximum thermal discomfort wasestimated on the 25th, whereas a smooth increase of heatexhaustion and heatstroke incidents was recorded from July26th to July 27th. In both cases, the maximum numbers ofpatients were observed 1 or 2 days after the hottest day of theheat wave, suggesting a potential lagged effect of HL values onpatient’s number. Based on this, the possibility of extending theheat alert duration to 3 or 4 days (instead of 2) after maximum HLvalues are observed should be considered.
4. Conclusions
Athens experienced two severe heat waves in summer 2007. Inthis study we examined associations of daily synoptic conditions
with the surface weather conditions and we assessed humanthermal stress during these extreme events using the HL index.We also investigated the possible correlation between HL valuesand air pollutants concentrations as well as the AQSI index.Finally, we evaluated the consequences of a hot thermalenvironment on human health.
During the June heat wave, the prevailing synoptic circulationfacilitated North-African air masses to move over the Balkans.These hot air masses were enriched in water vapor when passingover the Mediterranean and at the time they arrived over theAttica were trapped below the pressure level of 700 mb,generating extreme HL values in Athens. On the contrary, thesynoptic conditions during the July heat wave, comply with thosereported in previously published studies as being typical of heatwaves over the region of Attica (Prezerakos, 1989; Balafoutis andMakrogiannis, 2001; Katsouyanni et al., 1993; Brikas et al., 2006)and can be considered as typical for the region of Attica.
The minimum estimated HL values indicated ‘slight hot stress’conditions during night-time hours whereas during day-timehours HL values overrun the threshold of 16.6 on the warmestdays of the studied periods. The June heat wave appeared more
ARTICLE IN PRESS
G. Theoharatos et al. / Environmental Research 110 (2010) 152–161160
intense compared to that of July. HL values reached the maximumpermitted values of the index and stayed in high levels for moreconsecutive days in June than in the July heat wave.
Statistical analysis showed a positive correlation and a positivelagged correlation between HL values and hourly concentrationsof O3 and SO2, respectively, in both heat waves periods. A negativelagged correlation was obtained for HL and NO2 concentrations.These results can be justified considering the formationmechanisms of the pollutants (primary and secondary pollutants).AQSI24 values suggested worse air quality conditions for the heatwave period of June.
The analysis of patient data demonstrated a relatively lownumber of heat exhaustion and heatstroke incidents, especiallyduring the July heat wave, probably due to the adoption ofpreventive measures by the NHOC. The maximum number ofpatients with heat exhaustion or heatstroke was recorded within2 days after the daily peak value of HL. The number of heat-affected patients is certainly underestimated, as excessive heat isalso related to increased morbidity and mortality from a numberof causes other than heat exhaustion and heatstroke, respectively(Shen et al., 1998).
The present research probably has limitations. An apparentissue is the short period of observation since a heat wave isusually a relatively short period of time. Another important issueis the lack of measurements on important air pollutants such asparticulate matter. Finally the nature of human health effects datadid not permit a sophisticated statistical analysis. Additional datarelated to the variety of factors affecting human response to heatstress, such as exposure conditions or demographic informationon the reported medical incidents were unavailable due to thelack of targeted and detailed recording. Nevertheless, this study isone of few applying a multidisciplinary approach on the heatwaves in Attica and it could be a starting point for a betterunderstanding of the physical processes creating extreme heatphenomena, aiming to update the heat wave forecast and improvethe preventative measures of the central administration.
Acknowledgment
The authors wish to thank Mr. K. Gogosis, MSc, Director ofNHOC and Mr. M.Grivas, Officer of NHOC, for assisting in thecollection of health effects data. Also, the authors would like toacknowledge the provision of Air Quality data for Athens by theDirectory of Air and Noise Pollution Control (DANPC) of theMinistry of the Environment, Greece.
Appendix A. Supplementary Material
Supplementary data associated with this article can be foundin the online version at doi:10.1016/j.envres.2009.12.002.
References
ARL, 2008, HYSPLIT—Hybrid Single Particle Lagrangian Integrated TrajectoryModel. Website /http://ready.arl.noaa.gov/HYSPLIT.phpS.
Balafoutis, C., Makrogiannis, T., 2001. Analysis of a heat wave phenomenon overGreece and it’s implications for tourism and recreation. In: Matzarakis, A. andde Freitas, C.R. (Eds), Proceedings of the First International Workshop onClimate, Tourism and Recreation. Report of a Workshop, Halkidiki, Greece, pp.113–121.
Basu, R., Samet, J.M., 2002. Relation between elevated ambient temperature andmortality: a review of the epidemiologic evidence. Epidemiol. Rev. 24,190–202.
Blazejczyk, K., 2001. Assessment of recreational potential of bioclimate based onthe human heat balance. In: Matzarakis, A. and de Freitas, C.R., (Eds),
Proceedings of the First International Workshop on Climate, Tourism andRecreation. Report of a Workshop, Halkidiki, Greece, pp. 133-152.
Brikas, D.P., Karacostas, T.S., Pennas, P.J., Flocas, A.A., 2006. The role of thesubtropical jet stream during heat wave events over north-central Greece.Meteorol. Atmos. Phys. 94, 219–233.
Directory of Air and Noise Pollution Control, Ministry of Environment, Planningand Public works, 2007. Atmospheric Pollution Association of Athens-Airquality data report. Technical Report, Athens, Greece.
Dolney, T.J., Sheridan, S.C., 2006. The relationship between extreme heat andambulance response calls for the city of Toronto, Ontario, Canada. Environ. Res.101, 94–103.
Draxler R.R., Rolph, G.D., 2003. ‘HYSPLIT – (Hybrid, Single-Particle Lagrangian IntegratedTrajectory): Model access via NOAA ARL READY’ /http://www.arl.noaa.gov/ready/hysplit4.htmlS. NOAA Air Resources Laboratory, Silver Spring, MD.
Earth System Research Laboratory, 2008. NCEP/NCAR Reanalysis 1. Website/http://www.esrl.noaa.gov/psd/data/gridded/data.ncep.reanalysis.htmlS.
Fouillet, A., Rey., G.; Laurent, F., et al., 2006. Excess mortality related to the August2003 heat wave in France. Int. Arch. Occup. Environ. Health. 80, 16-24.
ESYE, 2001 General Secretariat of the National Statistical Service of Greece, 2001.General census. Website /http://www.statistics.gr/portal/page/ portal/ESYE/BUCKET/S A1604/Other/A1604_SAP02_TB_DC_00_2001_01_F_GR.pdf.
Founda, D., Giannakopoulos, C., 2009. The exceptionally hot summer of 2007 inAthens, Greece—a typical summer in the future climate? Global Planet.Change 67, 227–236.
Frich, P., Alexander, L.V., Della-Marta, P., Gleason, B., Haylock, M., Klein Tank,A.M.G., Peterson, T., 2002. Observed coherent changes in climatic extremesduring the second half of the twentieth century. Clim. Res. 19, 193–212.
Gawith, M.T., Downing, T.E., Karacostas, T.S., 1999. Heatwaves in a changingclimate. In: Downing, T.E., Olsthoorn, A.A., Tol, R.S.J. (Eds.), Climate Change andRisk. Routlege, London, pp. 279–307.
Giles, B.D., Balafoutis, C.J., 1990. The Greek Heat Waves of 1987 and 1988. Int. J.Climatol. 10, 505–517.
Giles, B.D., Balafoutis, C., Maheras, P., 1990. Too hot for comfort: the heat waves inGreece in 1987 and 1988. Int. J. Biometeorol. 34, 98–104.
Hajat, S., Kovats, R.S., Atkinson, R.W., Haines, A., 2002. Impact of hot temperatureson death in London: a time series approach. J. Epidemiol. Community Health56, 367–372.
Kalnay, E., Kanamitsu, M., Kistler, R., Collins, W., Deaven, D., et al., 1996. The NCEP/NCAR reanalysis 40-year project. Bull. Am. Meteorol. Soc. 77, 437–471.
Karacostas, T.S., Downing, T.E., 1996. Heatwaves in a changing climate. In:Downing, T.E., Olsthoorn, A.A., Tol, R.S.J. (Eds.), Climate Change and ExtremeEvents: Altered Risk, Socio-Economic Impacts and Policy. Oxford andAmsterdam: Environmental change unit. Oxford University and VricjUniversiteit, Amnsterdam, pp. 139–156.
Karakostas, T.S., Gawith, M.T., 1994. Heat Waves in a changing climate, 53–60,Climate Change and Extreme Events. University of Oxford Press, pp. 125.
Kassomenos, P., Flocas, H.A., Lykoudis, S., Skouloudis, A.N., 1998. Spatial andtemporal characteristics of the relationship between air quality status andmesoscale atmospheric circulation over an urban Mediterranean basin. Sci.Total. Environ. 217, 37–57.
Kassomenos, P., Gryparis, A., Samoli, E., Katsouyanni, K., Lykoudis, S., Flocas, H.A.,2001. Atmospheric circulation types and daily mortality in Athens, Greece.Environ. Health. Perspect. 109, 591–596.
Kassomenos, P., Kotroni, V., Kallos, G., 1995. Analysis of climatological and air qualityobservations from the greater Athens area. Atmos. Environ. 29B, 3671–3688.
Katsouyanni, K., Pandazopoulou, A., Touloumi, G., Moustris, K., Tselepidaki, I.,Asimakopoulos, D., Poulopoulou, G., Trichopoulos, D., 1993. Evidence for theinteraction between air pollution and high temperature in the causation ofexcess mortality. Arch. Environ. Health. 48, 235–242.
Katsouyanni, K., Touloumi, G., Spix, C., Schwartz, J., Balducci, F., Medina, S., Rossi,G., Wojtyniak, B., Sunyer, J., Bacharova, L., et al., 1997. Short-term effects ofambient sulphur dioxide and particulate matter on mortality in 12 Europeancities: results from time series data from the APHEA project. Br. Med. J. 314,1658–1663.
Katsouyanni, K., Trichopoulos, D., Zavitsanos, X., Touloumi, G., 1988. The 1987Athens heat wave [Letter]. Lancet 2, 573.
Kysely, J., 2002. Temporal fluctuation in heat waves at Prague-Klementinum, theCzech Republic, from 1901–97, and their relationships to atmosphericcirculation. Int. J. Climatol. 22, 33–50.
Kysel �y, J., 2004. Mortality and displaced mortality during heat waves in the CzechRepublic. Int. J. Biometeorol. 49, 91–97.
Laschewski, G., Jendritzky, G., 2002. Effects of the thermal environment on humanhealth: an investigation of 30 years of daily mortality data from SW Germany.Clim. Res. 21, 91–103.
Makra, L., Mayer, H., Beczi, R., Borsos, E., 2003. Evaluation of the air quality ofSzeged with some assessment methods. Acta Climatol. Univ. Szegediensis 36-37, 85–93.
Makrogiannis, T., Balafoutis, Ch., Pytharoulis, I., 2008. The Heat Waves overBalkans as an indicator of the climate change: a case study on August 2006. In:Maheras, P., Zanis, P., Anagnostopoulou, C., et al. (Eds.), Proceedings of the 9thConference of Meteorology, Climatology and Atmospheric Physics. Thessalo-niki, Greece, pp. 417–423.
Matzarakis, A., Mayer, H., 1991. The extreme heat wave in Athens July 1987 fromthe point of view of human biometeorology. Atmos. Environ. 25B (2), 203–211.
Matzarakis, A., Mayer, H., 1997. Heat stress in Greece. Int. J. Biometeorol. 41, 34–39.

ARTICLE IN PRESS
G. Theoharatos et al. / Environmental Research 110 (2010) 152–161 161
Meehl, G.A., Karl, T., Easterling, D.R., Changnon, S., Pielke, R.J., Changnon, D., Evans,J., Groisman, P.Y., Knutson, T.R., Kunkel, K.E., Mearns, L.O., Parmesan, C.,Pulwarty, R., Root, T., Sylves, R.T., Whetton, P., Zwiersl, F., 2000. Anintroduction to trends in extreme weather and climate events: observations,socioeconomic impacts, terrestrial ecological impacts, and model projections.Bull. Am. Meteorol. Soc. 81, 413–416.
Meehl, A.G., Tebaldi, C., 2004. More intense, more frequent, and longer lasting heatwaves in the 21st century. Science 305, 94.
Metaxas, D.A., Kallos, G., 1980. Heat waves from a synoptic point of view. Riv.Meteorol. Aeronaut. JL 2–3, 107–119.
Nikolopoulou, M., Lykoudis, S., 2006. Thermal comfort in outdoor urban spaces:analysis across different European countries. Build. Environ. 41, 1455–1470.
NTUA, 2008. METEONET. Website /http://meteonet.chi.civil.ntua.gr/gr/divs.htmlS.
Pakalidou, N.; Karacostas T., 2004. Heat wave in Thessaloniki, during the last 44years. In: Silas, Chr., Michaelides, Dr. (Eds,), Proceedings of the 7th Panhellenic(International) Conference of Meteorology, Climatology and AtmosphericPhysics. pp. 744–751.
Paliatsos, A.G., Nastos, P.T.H., 1999. Relation between air pollution episodes anddiscomfort index. Global Nest: Int. J. 1, 91–97.
Pantavou, K., Theoharatos, G., Nikolopoulos, G., Katavoutas, G., Asimakopoulos, D.,2008. Evaluation of thermal discomfort in Athens territory and its effect on thedaily number of recorded patients at hospitals’ emergency rooms. Int. J.Biometeorol. 52, 773–778.
Philandras, C.M., Metaxas, D.A., Nastos, P.T., 1999. Climate variability andurbanization in Athens. Theor. Appl. Climatol. 63, 65–72.
Prezerakos, N.G., 1989. A contribution to the study of the extreme heat wave overthe South Balkans in July 1987. Meteorol. Atmos. Phys. 41, 261–271.
Rolph, G.D., 2003. Real-time Environmental Applications and Display sYstem(READY). Website /http://www.arl.noaa.gov/ready/hysplit4.htmlS NOAA AirResources Laboratory, Silver Spring, MD.
Shen, T., Howe, H.L., Alo, C., Moolenaar, R.L., 1998. Towards a broader definition ofheat-related death: comparison of mortality estimates from total deathdifferentials during the July 1995 heat wave in Chicago, Illinois. Am. J.Forensic Med. Pathol. 19, 113–118.
University of Wyoming, 2008, Upper Air Data. Website /http://weather.uwyo.edu/upperairS.
USNO, 2008. Sun or moon altitude table. Website /http://aa.usno.navy.mil/data/docs/AltAzS.
World Health Organization, 2004. Heatwaves: risks and responses. CCASHh Projectreport, October 2003.