Heat-induced alterations of dental tissues - University of ...
274
Heat-induced alterations of dental tissues By Michael Sandholzer A thesis submitted to The University of Birmingham for the degree of DOCTOR OF PHILOSOPHY School of Dentistry The University of Birmingham March 2014
-
Upload
khangminh22 -
Category
Documents
-
view
0 -
download
0
Transcript of Heat-induced alterations of dental tissues - University of ...

Heat-induced alterations of dental tissues
By
Michael Sandholzer
A thesis submitted to
The University of Birmingham for the degree of
DOCTOR OF PHILOSOPHY
School of Dentistry
The University of Birmingham March 2014

University of Birmingham Research Archive
e-theses repository This unpublished thesis/dissertation is copyright of the author and/or third parties. The intellectual property rights of the author or third parties in respect of this work are as defined by The Copyright Designs and Patents Act 1988 or as modified by any successor legislation. Any use made of information contained in this thesis/dissertation must be in accordance with that legislation and must be properly acknowledged. Further distribution or reproduction in any format is prohibited without the permission of the copyright holder.

DEDICATED TO MY FAMILY

I
Synopsis
In forensic investigations involving severely burned human remains, dental analysis stands alone as
other means of identification are often destroyed. It is therefore important to perform lab-based
research to characterise any tissue changes providing relevant information that can facilitate these
investigations. The aim of the present work was to investigate the influence of duration of heat
exposure and heating regimes regarding the macroscopic, compositional, structural and crystalline
alterations of dental tissues.
A range of experiments were carried out using a total of 215 freshly extracted human teeth, exposed
to temperatures of 400 to 1000°C. Shrinkage and shape preservation was analysed using X-ray micro-
computed tomography (micro-CT), whilst crystalline alterations were evaluated with synchrotron-
based X-ray scattering experiments. The alterations of organic constituents were assessed using
thermogravimetry (TGA) and Fourier-transformed infrared spectroscopy (FTIR). Moreover,
calibrated digital photographs were used to document and analyse colour alterations.
Although dentinal shrinkage was already found at 400°C, tooth morphology was well preserved even
at 1000°C. Surface colour alterations were linked to the gradual degradation of organic components,
and were also highly dependent upon the duration of heat exposure and the heating regime. The
crystalline alterations were less influenced by these factors, providing relevant reference values for
cremation temperature estimations.
The combination of novel analytical approaches enabled the documentation and quantification of
heat-induced alterations of dental tissues, providing an improved understanding of the influences of
heating regimes on the macroscopic, compositional, structural and crystalline alterations. The results
of the present work can be used in the forensic identification process and allow an improved
estimation of the cremation temperature range based on human dental remains.

II
Acknowledgments
Foremost, I want to thank my supervisors Professors Gabriel Landini, Damien Walmsley and Phil
Lumley for giving me the opportunity to pursue this Ph.D. They challenged me to reach higher, work
harder and go further than I dreamed possible. I am also much obliged to Prof. Alexander Korsunsky
and his Ph.D. students Alexander, Nikos and Tan at the University of Oxford for the fruitful
collaboration. Although soon earning the nickname ‘Trouble’, thanks to the lab technicians Gay,
Michelle and Sue for their support to realise some of my experiments. Thanks to all the other
collaborators, funding bodies, advisors and academics worldwide that believed in me and enabled
some incredible opportunities.
To spend time up in the air and travel the world was definitely the most encouraging momentum
during this Ph.D. During the last three years, I was able to attend numerous national and international
conferences, expand my knowledge, meet up with old friends and connect with many new people. I
will never forget the great time I had in the postgraduate office and the local pubs. From day one all
made me feel welcome and accepted my Austrian Manners (pun intended). A special thanks to Eisha
for introducing me to crisp sandwiches and Twitter, Helen for the amazing cakes and travel
companionship, Jonathan for the help with the image analysis and his indefinite clumsiness, Krunal
for the daily baguette walk and the tech talk, and Owen for pointing out auntie Julie in Colmore Bar
and dragging me to all the noisy gigs. The years abroad told me to be truly grateful for those close
friends that continue conversations after a long period where the last one ended, and most importantly
never question the friendship. Thanks for being there for me: Alexander, Christina, David, Jasmin,
Kathy and Sarah. I also want to thank all friends and colleagues not mentioned by name that
encouraged and motivated me over the years in one way or the other.
Zuletzt möchte ich meinen Eltern Günther und Christine, sowie meinen Schwestern Margareta und
Lucia für die kontinuierliche Unterstützung und den emotionalen Rückhalt danken. Dank euch konnte
ich meine Ziele bestmöglich verfolgen – ohne jegliche Sorgen. Diese Arbeit ist euch gewidmet.
III
Table of contents
Synopsis .......................................................................................................................................... I
Acknowledgments .................................................................................................................................. II
Table of contents ................................................................................................................................... III
List of figures ..................................................................................................................................... VII
List of tables ........................................................................................................................................ X
List of abbreviations ............................................................................................................................. XI
Declaration .................................................................................................................................... XIII
Dissemination of research .................................................................................................................. XIV
Chapter 1 – Introduction ...................................................................................................................... 1
1.1. Structure and composition of teeth .............................................................................................. 2
1.2. The role of the dentition in the determination of human identity ................................................ 3
1.2.1. Methods of human identification .......................................................................................... 3
1.2.2. Odontological identification of human remains .................................................................... 5
1.2.3. Comparative dental identification ......................................................................................... 6
1.2.4. The role of imaging in dental identification .......................................................................... 9
1.3. Odontological identification of fire victims ............................................................................... 10
1.3.1. Dental restorative materials as an aid in fire victim identification ..................................... 12
1.4. Experimental approaches for the analysis of burned dental remains ......................................... 15
1.5. Heat-induced alterations of skeletal hard tissue ......................................................................... 18
1.5.1. Macroscopic alterations of burned dental remains .............................................................. 20
1.5.1.1. Morphology .................................................................................................................. 20
1.5.1.2. Surface colour .............................................................................................................. 22
1.5.1.3. Shrinkage ..................................................................................................................... 25
1.5.2. Destruction of organic components .................................................................................... 26
1.5.3. Crystalline alterations ......................................................................................................... 27
1.6. Aim and objectives .................................................................................................................... 29

IV
Chapter 2 – Materials and Methods .................................................................................................. 30
2.1. Sample preparation .................................................................................................................... 31
2.2. Photography and video imaging ................................................................................................ 32
2.3. Scanning electron microscopy (SEM) ....................................................................................... 32
2.4. Thermal treatment ...................................................................................................................... 33
2.4.1. Laboratory furnace .............................................................................................................. 33
2.4.2. Direct heating of tooth cross-sections ................................................................................. 34
2.4.2. Synchrotron furnace setup .................................................................................................. 36
2.4.3. Thermogravimetry (TGA) ................................................................................................... 36
2.4.4. Fourier-transformed infrared spectroscopy (FTIR) heating stage ....................................... 37
2.5. X-ray imaging ............................................................................................................................ 37
2.5.1. Digital radiographs .............................................................................................................. 37
2.5.2. X-ray micro-computed tomography (Micro-CT) ................................................................ 37
2.6. Fourier-transformed infrared spectroscopy (FTIR) ................................................................... 38
2.6.1. Attenuated Reflective Fourier-transformed infrared spectroscopy (ATR-FTIR) ............... 38
2.6.2. Real-time Fourier-transformed infrared spectroscopy ........................................................ 38
2.7. Synchrotron X-ray scattering ..................................................................................................... 40
2.7.1. X-ray scattering data acquisition ......................................................................................... 40
2.8. Image processing and analysis ................................................................................................... 43
2.8.1. Photographic colour analysis .............................................................................................. 43
2.8.2. X-ray micro-computed tomography (Micro-CT) data analysis .......................................... 46
2.9. X-ray scattering data analysis .................................................................................................... 46
2.9.1. Small-angle X-ray scatting (SAXS) .................................................................................... 46
2.9.2. Wide-angle X-ray scatting (WAXS) ................................................................................... 47
2.10. Statistical analysis .................................................................................................................... 48

V
Chapter 3 – Results: Heat-induced weight loss and compositional changes ................................. 49
3.1. Weight loss of teeth ................................................................................................................... 50
3.1.1. Analytical scale measurements ........................................................................................... 50
3.1.2. Influence of duration of heat exposure and heating regimes on weight loss ...................... 50
3.1.2. Thermogravimetric (TGA) measurements .......................................................................... 54
3.2. Compositional alterations of teeth ............................................................................................. 59
3.2.1. Attenuated Reflective Fourier-transformed infrared spectroscopy (ATR-FTIR) analysis.. 59
3.2.2. Real-time Fourier-transformed infrared spectroscopy measurements ................................ 62
Chapter 4 – Results: Heat-induced surface colour alterations ....................................................... 64
4.1. Influence of duration of heat exposure on surface colour .......................................................... 65
4.1.1. Colour reduction process .................................................................................................... 70
4.1.2. Hierarchical cluster analysis of colour alterations .............................................................. 75
4.2. Influence of the heating regimes and soft tissue protection on surface colour .......................... 84
Chapter 5 – Results: Heat-induced structural and dimensional alterations ................................. 89
5.1. Failure of the dentine-enamel junction ...................................................................................... 90
5.2. Cracks and fractures ................................................................................................................... 90
5.2. Shrinkage ................................................................................................................................... 94
5.3. Morphological preservation ....................................................................................................... 98
Chapter 6 – Results: Heat-induced crystalline alterations ............................................................ 101
6.1. Macroscopic and microscopic alterations ................................................................................ 102
6.2. Ex situ synchrotron small-angle X-Ray scattering (SAXS) measurements ............................. 104
6.2.1. Mean crystallite thickness ................................................................................................. 104
6.2.2. Crystalline degree of alignment ........................................................................................ 106
6.2.3. Crystallite shape ................................................................................................................ 110
6.3. Ex situ synchrotron wide-angle X-Ray scattering (WAXS) measurements ............................ 113

VI
6.4. Real-time small-angle X-Ray scattering (SAXS) measurements ............................................ 115
6.4.1. Mean crystallite thickness ................................................................................................. 115
6.4.2. Crystalline degree of alignment ........................................................................................ 115
Chapter 7 – Discussion ..................................................................................................................... 118
7.1. Macroscopic alterations ........................................................................................................... 119
7.1.1. Failure of the dentine-enamel junction ............................................................................. 119
7.1.2. Cracks and fractures .......................................................................................................... 121
7.1.3. Preservation of tooth morphology ..................................................................................... 121
7.2. Weight loss............................................................................................................................... 122
7.3. Destruction of organic components ......................................................................................... 123
7.4. Surface colour alterations ........................................................................................................ 124
7.5. Shrinkage ................................................................................................................................. 129
7.6. Crystalline alterations .............................................................................................................. 131
Chapter 8 - Conclusions ................................................................................................................... 135
Chapter 9 - Future Work ................................................................................................................. 138
Chapter 10 - References ................................................................................................................... 141
Chapter 11 - Appendix ..................................................................................................................... 155
11. 1. ImageJ/Fiji macros ................................................................................................................ 156
11.1.1. Create mask for uniform black background .................................................................... 156
11.1.2. Create colour palettes from *.txt files ............................................................................. 157
11.1.3. Extraction of colour entropy from RGB images ............................................................. 158
11.2. Reprints of peer-reviewed publications ................................................................................. 159

VII
List of figures
Unless stated otherwise, all figures result from my own work.
Figure 1.1 Heat-induced failure of dentine-enamel junction........................................................... 21
Figure 1.2 Heat-induced surface colour alterations of teeth ........................................................... 23
Figure 2.1 Fourier-transformed infrared spectroscopy (FTIR) setup .............................................. 39
Figure 2.2 Representative small and wide-angle X-ray scattering (SAXS/WAXS) patterns ......... 42
Figure 2.3 Quantitative colorimetric analysis of surface colour alterations .................................... 45
Figure 3.1 Fragmentation of enamel after 30min constant exposure at high temperatures ............. 51
Figure 3.2 Thermogravimetric plots showing the average weight loss at rates of 6, 12, 20.75 and 24°C/min for dentine, enamel and demineralised dentine heated from RT to 900°C ... 57
Figure 3.3 First derivative of TGA curves indicating regions of increased weight loss at heating rates of 6, 12 and 24°C/min ........................................................................................... 58
Figure 3.4 FTIR spectra of dentine and enamel at room temperature. ............................................ 60
Figure 3.5 Changes of FTIR spectrum of dentine after 30min constant exposure to 400, 700 and 900°C compared to room temperature ........................................................................... 61
Figure 3.6 Real-time FTIR measurements of the heat-induced destruction of organic components and lattice carbonates in dentine heated from RT to 400°C .......................................... 63
Figure 4.1 Example of root surface colour alterations after exposure to various temperatures ...... 66
Figure 4.2 Root surface colour alterations after exposure to elevated temperatures (400 to 1000°C) ....................................................................................................................................... 68
Figure 4.3 Colour entropy of root surface colours after exposure to elevated temperatures. ......... 69
Figure 4.4 Results of the Wu-Chant colour reduction algorithm. Original image (21,148 colours) reduced to 2 to 24 colours with corresponding palettes ................................................. 71
Figure 4.5 Root surface selections after applying the Wu-Chant colour reduction algorithm (down to 16 colours) after 5, 15, 30 and 45min constant exposure to high temperature (400 to 1000°C) .......................................................................................................................... 72
Figure 4.6 Colour entropy of root surface colours after exposure to elevated temperatures plotted against the duration following the application of the Wu-Chant colour reduction algorithm (16 colours) ................................................................................................... 73
Figure 4.7 Palettes of root surface colour alterations after the application of the Wu-Chant colour reduction algorithm ........................................................................................................ 74

VIII
Figure 4.8 Colour distribution of the individual duration groups and temperature groups within the L*a*b* colour space ...................................................................................................... 76
Figure 4.9 ΔE value distributions between each of the 448 colours (100,128 pairings) ................. 77
Figure 4.10 Hierarchical cluster analysis of root surface L*a*b*colours after 5, 15, 30 and 45min constant exposure to elevated temperatures (400 to 1000°C) ........................................ 78
Figure 4.11 First cluster of root surface colour alterations ............................................................... 79
Figure 4.12 Second cluster of root surface colour alterations ........................................................... 80
Figure 4.13 Third cluster of root surface colour alterations .............................................................. 81
Figure 4.14 Fourth cluster of root surface colour alterations ............................................................ 82
Figure 4.15 Fifth cluster of root surface colour alterations ............................................................... 83
Figure 4.16 Differences in colour alterations of human teeth at 400, 700 and 900ºC using various heating regimes .............................................................................................................. 85
Figure 4.17 Root surface sections of the various heating regime groups before and after the application of the Wu-Chant colour reduction algorithm (16 colours) .......................... 86
Figure 4.18 Hierarchical cluster analysis of root surface colours after exposure to 400, 700 and 900°C using various heating regimes ............................................................................ 87
Figure 4.19 Composition of four main clusters of root surface colours after exposure to 400, 700 and 900°C using various heating regimes ...................................................................... 88
Figure 5.1 Separation of the enamel alongside the dentine-enamel junction .................................. 91
Figure 5.2 Visible cracks and fractures in scanning electron microscopic images ......................... 92
Figure 5.3 Micro-CT cross-sections of premolars of the 400, 700 and 900°C 30min constant exposure group ............................................................................................................... 93
Figure 5.4 Mean volumetric shrinkage of heat-affected teeth ......................................................... 97
Figure 5.5 Comparative 3-D models indicating shape preservation after exposure to elevated temperatures (700 to 1000°C) ........................................................................................ 99
Figure 5.6 Corresponding digital radiographs indicating dentinal shrinkage and shape preservation of molars and premolars after 30min constant exposure at 900°C .............................. 100
Figure 6.1 Documentation of tooth sections used for the ex situ synchrotron X-ray scattering experiment ................................................................................................................... 103
Figure 6.2 Variation of the mean crystal thickness in dentine and enamel determined by SAXS 105
Figure 6.3 Variation of the degree of alignment in dentine and enamel determined by SAXS .... 107

IX
Figure 6.4 Representative variation of degree of alignment in dentine and enamel at RT, 400 and 800°C ........................................................................................................................... 108
Figure 6.5 Regions of interest (0.6×0.6mm) of tooth section containing 225 SAXS patterns ...... 109
Figure 6.6 Variations of crystallite shape in dentine and enamel determined by SAXS .............. 111
Figure 6.7 WAXS results of the (002) reflection of dentine from a series of tooth sections for a selected region of scattering angles (11.2-11.5°) ......................................................... 114
Figure 6.8 In situ variation of mean crystallite thickness considering a constant volume fraction of the mineral phase ..................................................................................................... 116
Figure 6.9 In situ variation of the crystalline degree of alignment in dentine (12°C/min increase up to 880°C) ................................................................................................................. 117

X
List of tables
Unless stated otherwise, all tables result from my own work.
Table 1.1 Four conclusions reached when reporting a dental identification .................................... 8
Table 1.2 Melting points of dental restorative materials ............................................................... 14
Table 1.3 Comparison of 17 lab-based heating protocols for human teeth and dental restorative materials ......................................................................................................................... 17
Table 1.4 Four stages of heat-induced transformations in bone reported by Mayne-Correira (1997) and Thompson (2004) ........................................................................................ 19
Table 2.1 Overview of heating experiments involving laboratory furnace ................................... 35
Table 3.1 Mean weight loss of teeth after exposure to elevated temperatures of 400 to 1000°C (n=179) .......................................................................................................................... 52
Table 3.2 Significance levels of mean weight loss differences ..................................................... 53
Table 3.3 Mean percentage weight loss at rates of 6, 12, 20.75 and 24°C/min for dentine (n=2), enamel (n=1) and demineralised dentine (n=2) heated from RT to 900°C .................... 56
Table 5.1 Mean dentinal shrinkage after 30min constant exposure (n=56) ................................... 95
Table 5.2 Mean dentinal shrinkage using three different heating regimes (n=72) ........................ 96
Table 6.1 Overview of ex situ synchrotron SAXS results on mean thickness, degree of alignment and shape of dentine and enamel crystallites ............................................................... 112

XI
List of abbreviations
1-D one-dimensional
2-D two-dimensional
3-D three-dimensional
ABFO American Board of Forensic Odontologists
ANOVA Analysis of variance
ATR-FTIR Attenuated reflectance Fourier-transformed infrared spectroscopy
AVI Audio Video Interleave (video file format)
CBCT Cone beam computed tomography
CCD Charge-coupled device
CI Crystallinity index
CIE Commission internationale de l'éclairage
CT Computed tomography
DLS Diamond Light Source
DNA Deoxyribonucleic acid
DSLR Digital single-lens reflex camera
DVI Disaster victim identification
EDS Energy dispersive X-ray spectroscopy
FTIR Fourier-transformed infrared spectroscopy
HAp Hydroxyapatite
HPLC High-performance liquid chromatography
IR Infrared
JPG Joint Photographic Expert Group (image file format)
LSD Least significant difference
LUT Lookup table
Micro-CT X-ray micro-computed tomography
MS Mass-spectrometry
NIST National Institute of Standards and Technology
NRRD Nearly Raw Raster Data (image file format)

XII
PBS Phosphate buffered saline
PMMA Poly-methylmetacrylate
ROI Region of interest
RT Room temperature
SAXS Small-angle X-ray scattering
SD Standard deviation
SE Secondary electron
SEM Scanning electron microscopy
TCP Tribasic calcium phosphate
TEM Transmission electron microscopy
TGA Thermogravimetric analysis
WAXS Wide-angle X-ray scattering
XRD X-ray diffraction
XRF X-ray fluorescence

XIII
Declaration
I hereby declare that this thesis is my own work and effort. Where other sources of information have
been used, they have been acknowledged. The X-ray scattering data analysis, reported in chapters 2.9
and 6 was conducted by Mrs. Tan Sui as part of an ongoing collaboration between the School of
Dentistry (University of Birmingham) and the Department of Engineering (University of Oxford),
investigating thermal and mechanical alterations of dental tissues.
Reprints of the following seven peer-reviewed publications resulting from work conducted during the
Ph.D. scholarship are included in the Appendix (Chapter 11.2), with written permission of Elsevier,
Wiley-Blackwell and Royal Society Publishing.
Sandholzer MA, Walmsley AD, Lumley PJ, Landini G. Radiologic evaluation of heat-induced shrinkage and shape preservation of human teeth using micro-CT. Journal of Forensic Radiology and Imaging 2013; 1(3) 107-111, DOI 10.1016/j.jofri.2013.05.003. Sandholzer MA, Sui T, Korsunsky A, Walmsley AD, Lumley PJ, Landini G. X-ray scattering evaluation of ultrastructural changes of human dental tissue with thermal treatment. Journal of Forensic Sciences 2014; 59(3) 769-774, DOI 10.1111/1556-4029.12400. Sui T, Sandholzer MA, Le Bourhis E, Baimpas N, Landini G, Korsunsky AM. Structure-mechanical function relations at nano-scale in heat-affected human dental tissue. Journal of the Mechanical Behavior of Biomedical Materials 2014, 32 113-124, DOI 10.1016/j.jmbbm.2013.12.014. Sui T, Sandholzer MA, Lunt AJG, Baimpas N, Smith A, Landini G, Korsunsky AM. In-situ X-ray scattering evaluation of heat-induced ultrastructural changes in dental tissues and synthetic hydroxyapatite Journal Royal Society Interface 2014, 11(95), 20130928, DOI 10.1098/rsif.2013.0928
Sui T, Lunt A, Baimpas N, Sandholzer MA, Hu J, Dolbnya IP, Landini G, Korsunsky AM. Hierarchical modelling of in situ elastic deformation of human enamel based on photoelastic and diffraction analysis of stresses and strains. Acta Biomaterialia 2014,10(1) 343-354, DOI 10.1016/j.actbio.2013.09.043. Sui T, Sandholzer MA, Baimpas N, Dolbnya IP, Walmsley AD, Lumley PJ, Landini G, Korsunsky AM. Multi-scale modelling and diffraction-based characterization of elastic behaviour of human dentine. Acta Biomaterialia 2013; 9(8) 7937-7947, DOI 10.1016/j.actbio.2013.04.020. Sui T, Sandholzer MA, Baimpas N, Dolbnya IP, Landini G, Korsunsky AM. Hierarchical modelling of elastic behaviour of human enamel based on synchrotron diffraction characterization. Journal of Structural Biology 2013; 184(2) 136-146, DOI 10.1016/j.jsb.2013.09.023.

XIV
Dissemination of research
The work conducted during the Ph.D. scholarship resulted in 7 peer-reviewed publications, 7 invited
talks and academic lectures, and 15 conference presentations (7 delivered as presenter).
Invited talks and academic lectures ∙ Royal Society of Chemistry (Teesside Section), Middlesbrough – June 2013 ∙ Midlands SEM User Meeting, Birmingham – June 2013 ∙ Faculty of Life Sciences, University of Vienna – April 2013 ∙ Institute of Physics, University of Vienna – April 2013 ∙ British Association of Forensic Odontology, Brighton – November 2012 ∙ British Association of Forensic Odontology, York– November 2011 ∙ Royal Society of Medicine (Clinical Forensic and Legal Medicine Section), London – October 2011
Conference presentations (* as presenter)
2014 Sui T, Sandholzer MA, Baimpas N, Lunt AJG, Dolbnya IP, Hu J, Walmsley AD, Lumley PJ, Landini G, Korsunsky AM. Hierachical modelling and X-ray analysis of human dentine and enamel. International Multi Conference of Engineers and Computer Scientists, Hong Kong (China).
2013 Sui T, Sandholzer MA, Le Bourhis E, Baimpas N, Landini G, Korsunsky AM. Nano-scale thermo-mechanical structure-property relationships in human dental tissues studied by nano-indentation and synchrotron X-ray scattering. 15th International Conference on Biomedical Engineering, Singapore (Singapore) published in: The 15th International Conference on Biomedical Engineering, IFMBE Proceedings 43, 251-54. Sandholzer MA*, Sui T, Korsunksy AM, Walmsley AD, Lumley PJ, Landini G. Structural and functional characterisation of dental nanostructures. British Society for Oral and Dental Research Meeting, Bath (UK).
Tomson PL, Sandholzer MA, Lumley PJ, Sui T, Korsunksy AM, Smith AJ, Cooper PR. Dissolution products from MTA release novel growth factors from dentine. British Society for Oral and Dental Research Meeting, Bath (UK).
Sandholzer MA*, Walmsley AD, Lumley PJ, Landini G. Heat-induced shrinkage and shape preservation of teeth: A radiologic evaluation.. International Organization for Forensic Odonto-Stomatology Congress, Florence (Italy) published in: Journal of Forensic Odontostomatology 2013; 31(1) Suppl 1:40-1.

XV
Sandholzer MA*, Sui T, Lunt AJG, Korsunksy AM, Walmsley AD, Lumley PJ, Landini G, Ultrastructural changes of biological apatite with in situ thermal treatment. UK Society for Biomaterials Conference, Birmingham (UK) published in: UK Society for Biomaterials 13th Annual Conference Abstract Book, ISBN 978-09559548-4-9.
Sui T, Sandholzer MA, Baimpas N, Dolbnya IP, Landini G, Korsunsky AM. Multi-scale modelling and X-ray diffraction characterization of elastic behaviour of human dental tissue. 7th International Conference on Materials for Advanced Technologies, Singapore (Singapore).
Sui T, Sandholzer MA, Landini G, Korsunsky AM. Multi-scale modelling and diffraction-based characterization of elastic behaviour of human enamel. 13th International Conference on Fracture, Bejing (China) published in: Proceedings of the 13th International Conference on Fracture, Beijing.
Sui T, Sandholzer MA, Baimpas N, Landini G, Walmsley AD, Lumley PJ, Korsunsky AM. Ultrastructural changes in burnt dental tissue revealed by synchrotron X-ray scattering. International Multi Conference of Engineers and Computer Scientists, Hong Kong (China) published in: Lecture Notes in Engineering and Computer Science (2), 775-779.
2012 Sandholzer MA*, Sui T, Korsunksy AM, Teschler-Nicola M, Landini G. Ultra-structural evaluation of cremated teeth using small and wide-angle x-ray scattering (SAXS/WAXS). 19th European Meeting of the Paleopathology Association, Lille (France).
Sui T, Sandholzer MA, Landini G, Korsunsky AM. In situ SAXS evaluation of ultrastructural changes of human dental tissues with thermal treatment. 14th CMA Conference on Materials Science and Engineering, Didcot (UK).
Sandholzer MA*, Walmsley AD, Lumley PJ, Landini G. Heat-induced alterations of dental tissues: Implications for the identification of fire victims. SkyScan User Meeting, Brussels (Belgium) published in: Micro-CT User Meeting Abstract Book, ISBN 978-90816781-0-0.
Robinson JP, Claridge E, Cooper PR, Grover LM, Sandholzer MA, Walmsley AD. 3D Slicer: A Free, Open Source Tool for 3D Image Registration. SkyScan User Meeting, Brussels (Belgium) published in: Micro-CT User Meeting Abstract Book, ISBN 978-90816781-0-0.
2011 Sandholzer MA*, Baron K, Walmsley AD, Lumley PJ, Landini G. Investigation on heat-induced alterations of skeletal hard tissue microstructure using x-ray microtomography. 8th International Symposium Advances in Legal Medicine, Frankfurt (Germany) published in: Rechtsmedizin 2011(21):341–432.
Sandholzer MA*, Teschler-Nicola M, Walmsley AD, Lumley PJ, Landini G. High-resolution micro-CT imaging as a novel tool in the analysis of cremated bones and teeth: A comparison of experimental results with Bronze Age human remains. 13th Annual BABAO Conference, Edinburgh (UK).

1
Chapter 1 – Introduction

2
1.1. Structure and composition of teeth
The normal deciduous and permanent human dentition comprises of 20 and 32 teeth respectively,
subdivided into anterior (incisors, canines) and posterior (premolars, molars) teeth. Although similar
in tissue structure and composition, the size, morphology as well as the number of roots varies
depending on the tooth type (Hillson, 1996).
Human teeth can be divided into the crown, which is normally exposed to the oral cavity, and the
roots, which after eruption, are anchored to the alveolar bone of the jaws by means of the periodontal
ligament (Higgins and Austin, 2013). The crown portion is covered by enamel, the hardest material in
the human body. Enamel consists of approximately 96% inorganic material by weight (around 90%
by volume), while the remaining 4% are made up by organic components and water (Boyde, 1989).
The primary component of the inorganic phase in teeth is a calcium-deficient form of hydroxyapatite
[Ca5(PO4)3(OH)] with substitutions of chemical groups, often referred to as biological apatite or
bioapatite (Elliott, 1994). The microstructure of enamel is formed of densely aligned enamel rods (6-
8μm in diameter), with a keyhole-like section, allowing only very small particles to permeate through
(Higgins and Austin, 2013, Meckel et al., 1965). In contrast to the enamel microstructure, the
arrangement of the underlying crystalline structure is still part of ongoing investigations (Al-Jawad et
al., 2012, Raue et al., 2012).
The root portion of a tooth is composed of dentine and is covered by cementum, which anchors it by
means of the periodontal ligament to the alveolus of the tooth socket. Dentine consists of
approximately 70% inorganic material, 20% organic material and 10% water by weight. The volume
ratio of dentine equals approximately 47% inorganic material, 32% organic material and 21% water
(Frank and Nalbandian, 1989). Similar to enamel, the inorganic phase is formed by biological apatite
crystals, which are arranged in a collagen matrix. Dentinal tubules, 1 to 3μm in diameter, span across
the entire dentine. The dentinal tubules are occupied by fluid and cellular processes of odontoblasts,
the cells responsible for dentine deposition.
3
The odontoblasts are located in the pulp cavity, a richly vascularised and innervated connective tissue
that also contains many other cell types, including fibroblasts, plasma cells, nerve fibres,
immunocompetent cells, and undifferentiated mensenchymal stem cells (Higgins and Austin, 2013).
The unique structure, composition and location within the body make teeth extremely durable, even if
the body is decomposed, exposed to trauma or high temperatures (Adams, 2003b). Tooth
development and alveolar eruption are frequently used to estimate the age of individuals.
Furthermore, over the course of a lifetime distinctive treatments and dental wear take place,
influencing the appearance of the dentition, which becomes an individual physical feature frequently
used in the determination of human identity in forensic contexts (AlQahtani et al., 2010).
1.2. The role of the dentition in the determination of human identity
1.2.1. Methods of human identification
The identification process of deceased individuals can be a major challenge, especially in mass
fatality incidents. Positive identification is important for various reasons and can be achieved by
forensic techniques such as fingerprints, deoxyribonucleic acid (DNA) and dental analysis. Besides
the need to reconstruct the circumstances of an accident, crime or natural disaster the positive
identification is of importance for criminal prosecutions and legal reasons such as inheritance,
insurance or contractual obligations (Anderson et al., 2007, Cordner et al., 2011, Pretty and Sweet,
2001). Moreover, identification of the deceased is important for relatives going through the process of
grieving, enabling closure in knowing that a loved one has been found (Berman et al., 2013).
According to Pretty et al. (2013) between 2000 and 2010 over 500,000 people died in mass fatality
incidents worldwide, caused intentionally (e.g. 9/11 in New York, 7/7 London terrorist attacks),
natural causes (e.g. the 2004 and 2011 tsunamis in South-East Asia, Victorian bushfires in Australia)
or accidental technical failures (e.g. Air France flight 447 in 2009) (Berman et al., 2013, Pretty et al.,
2013, Senn and Weems, 2013).
In general, distinctions are made between ‘open’ and ‘closed’ disasters. An open disaster is referred as
a ‘major catastrophic event resulting in the deaths of a number of unknown individuals for whom no

4
prior records or descriptive data are available’ (Interpol, 2009). The actual number of victims is
initially unknown; examples include the Kaprun cable car accident in 2000 (Meyer, 2003), the 2004
Boxing Day tsunami in South-East Asia (Schuller-Gotzburg and Suchanek, 2007) or the 1987 Kings
Cross Underground fire in London (Brough, 1991). In contrast, a closed disaster is defined as ‘a
major catastrophic event resulting in the deaths of number of individuals belonging to a fixed,
identifiable group (e.g. aircraft crash with passenger list)’ (Interpol, 2009). A combination of an open
and closed disaster can occur when airplanes crash into residential areas, as in the case of the
Concorde crash in 2000 (Air France flight 4590) or the Lockerbie bombing in 1988 (Pan Am flight
103) (Laborier et al., 2004, Moody and Busuttil, 1994).
According to the 2009 Interpol Disaster Victim Identification Guide, the primary and most reliable
means of victim identification are fingerprints, DNA and dental analysis. Secondary means of
identification include personal descriptions, medical findings/evidence (e.g. implanted surgical
devices or surgical/traumatic scars) and clothing (Interpol, 2009). However, personal description and
visual identification can lead to false positive or false negative identifications (Sweet, 2010).
Nonetheless, circumstantial evidence of an event (e.g. body found in the missing persons’ car),
individual jewellery or tattoos can help during the identification process (Cordner et al., 2011,
Dolinak and Matshes, 2005).
Fingerprints are unique soft tissue features and do not change throughout life, nonetheless skin
destructions affecting the papillary layer might alter their appearance (Interpol, 2013). The
identification by means of fingerprints requires antemortem records, often found in national and
international fingerprint databases (Senn and Weems, 2013). In cases involving charred, fragmented
or decomposed remains, fingerprint identification is often restricted or impossible (Adams, 2003b,
Berman et al., 2013).
The genetic information encoded in the DNA is assumed to be unique for every person, with the
exemption of identical twins. Investigators use primary DNA sources, such as blood or tissue samples
(i.e. pap-smear tests, tooth remnants or hair roots), but also DNA collected from secondary DNA

5
sources like clothing, toothbrushes or combs, can be used to produce an individuals’ record (Berman
et al., 2013, Interpol, 2009, Sweet et al., 1999). Comparative DNA analysis can be performed in cases
involving charred, fragmented or severely decomposed remains, to facilitate the identification of
individual body parts (Interpol, 2009, Williams et al., 2004).
1.2.2. Odontological identification of human remains
Identification using dental records is an efficient, reliable, rapid and economical procedure, often used
in combination with other means of identification (Schuller-Gotzburg and Suchanek, 2007, Senn and
Weems, 2013, Sweet, 2010).
The uniqueness of dental features has been known since Roman times, so that even single teeth could
be used for identification if containing sufficient unique features (Lipton et al., 2013, Sweet, 2010). If
only three possibilities (unrestored, filled, or missing) would be considered per tooth of the adult
dentition, the number of combinations would equal 332, or about 1.85×10¹⁵ (Clement, 1998). When
besides the two possibilities of unrestored or missing teeth, all possible combinations of filled surfaces
(mesial, occlusal, distal, facial, and/or lingual) are taken into account, there would be 3332, or about
3.91×1048 possible combinations (Adams, 2003a). However, those statistical values are hypothetical,
as they assume random occurrence and equal probability, whilst decay and treatment of teeth do not
occur randomly. For example dental records of young people often show similar treatment patterns
such as single-surface fillings of the first permanent molars (Clement, 1998). Adams (2003a, 2003b)
included the frequency of occurrence of dental treatments in a large population sample and reported
that even with a limited number of dental treatments a rare dental patterns can occur, comparable to
that of the variability of mitochondrial DNA observed in humans.

6
1.2.3. Comparative dental identification
The odontological identification of human remains is a comparative process, by matching antemortem
dental records and postmortem findings of the individual size, shape and acquired characteristics of
the dentition (Clement, 1998, Sweet, 2010). Dental records used to correlate antemortem and
postmortem findings can be obtained from written clinical notes, dental charts, dental radiographs,
plaster casts, clinical computed tomography (CT) scans or photographs (Berman et al., 2013).
The processes involved in comparative dental identification in routine cases and mass fatality
incidents are the same. Circumstances, personal belongings (e.g. passport, ID card, driving licence) or
missing persons databases allow presumptive or tentative identification and are commonly followed
by requests of dental records from the individuals’ dentist (Pretty, 2007).
Antemortem records are most often available for patients from developed countries that regularly
receive dental assessment, although the quality of such can play an important role in the comparison
process. The dentist should provide all original dental records available, as duplicates might miss
critical markers and notations (Sweet, 2010). The postmortem records normally consist of
photographs, radiographs and dental charts (Pretty and Sweet, 2001, Wood and Kogon, 2010).
Depending on the preservation of the body, the American Board of Forensic Odontologists (ABFO)
recommends to additionally take dental impressions (if applicable) and resection of the jaws (Berman
et al., 2013). The resection of the jaws allows replicating angles found in antemortem radiographs. In
general, the postmortem examination and comparative dental identification is performed by two
forensic odontologists, each performing the dental examination with subsequent discussion on any
unclear issues (Clement, 1998). In cases involving multiple fatalities, the dental team would normally
use computer assisted dental identification systems, such as WinID3 or DAVID, to cut down the
number of possible identification case. These software packages allow the entry of antemortem and
postmortem records combined with an automatic comparison and internal ranking system of possible
matches (Al-Amad et al., 2007).

7
In general, individuals with multiple dental restorations or rare features are easier to identify than
those with little or no dental treatment (Pretty and Sweet, 2001). With increasing trends in oral health,
growing numbers of patients have a low incidence of caries and consequently lack restorations which
can make the identification process more difficult (Bernstein, 1998, Sweet, 2000).
Even in identification cases of children and adolescents, where none or only very little treatments and
restorations are present, dental records should be collected and can still be of great value (Schuller-
Gotzburg and Suchanek, 2007). During orthodontic treatments, dental casts are created that can give
important information on the number and positions of teeth as well as on the morphology of the crown
(Johansen and Bowers, 2012). One major influence on the identification process can be the long
duration between the last antemortem visit to the dentist, additional dental treatment between two
records or dental wear over time, requiring the judgement of a trained forensic odontologists to
establish identification (Clement, 1998, Sweet, 2010). Nonetheless, even with incomplete dental
records (e.g. missing written records or radiographs), forensic odontologists are commonly able to
establish positive identifications as long as there are no unexplainable discrepancies (Table 1.1). For
example, a missing tooth noted in antemortem records, but present postmortem can also be used to
exclude a person (Pretty, 2007, Pretty and Sweet, 2001).
To enable a professional judgement of dental evidence, continuous professional training is necessary.
Over the course of the last decade, especially following the 2004 Boxing Day tsunami in South-East
Asia, international collaborations between forensic odontologists were established and
national/international standards and guidelines were developed (Interpol, 2009, Lain et al., 2011,
Schuller-Gotzburg and Suchanek, 2007, Senn and Weems, 2013, Sweet, 2010). The presence of
country-specific dental treatments, various dental abbreviation/notation systems and notes in foreign
languages also resulted in the creation of specialised national disaster victim identification (DVI)
teams (Clement, 1998). Generally, guidelines for the dental identification such as the ‘Manual of
Forensic Odontology’ are updated and adapted regularly and form the basis for the training of forensic
odontologists (Herschaft et al., 2006, Senn and Weems, 2013).

8
Table 1.1 Four conclusions reached when reporting a dental identification (Berman et al., 2013)
Positive identification
The antemortem and postmortem data match in sufficient detail, with no unexplainable discrepancies, to establish that they are from the same individual
Possible identification
The antemortem and postmortem data have consistent features but because of the quality of either the postmortem remains or the antemortem evidence, it is not possible to establish identity positively
Insufficient evidence
The available information is insufficient to form the basis for a conclusion
Exclusion The antemortem and postmortem data are clearly inconsistent

9
1.2.4. The role of imaging in dental identification
In 1897, a fire during a society charity event in Paris killed 126 people, and as the thermal damage
made visual identification impossible, dentists assisted in fire victim identification using dental
records (Botha, 1986). In 1943 the first use of dental radiography in a forensic identification case was
recorded. Since then, X-ray imaging played a vital role in the identification process due to the
accurate recording of dental features and anatomical landmarks (Andersen et al., 1995, Bernstein,
1998, Lipton et al., 2013, Pretty et al., 2013). Knight (1984) noted that ‘dental radiography is
probably the most important forensic use of radiography, measured in numbers of cases’. Currently,
most commonly bitewing, peri-apical and panorama radiographs are used for dental identification
(Beck, 2011, Pallagatti et al., 2011). Yet one of the main disadvantages of standard radiographs is
projection geometry causing distortion and magnification of the image (Berketa et al., 2010). In
general, the use of digital radiography and computer-based archives changed the process of
comparative dental identification, allowing the enhancement of radiographs and robust backup of
antemortem and postmortem data (Pretty et al., 2013).
Since the mid-1970s computer-aided identification systems are used to facilitate comparisons (Al-
Amad et al., 2007). Automated computer-assisted comparison of dental radiographic features has been
tested extensively but they are strongly dependent on the radiographs’ quality (Jain and Chen, 2004,
Lin et al., 2012, Nomir and Abdel-Mottaleb, 2007). Recent comparative approaches successfully used
three-dimensional (3-D) dental biometrics for comparative dental matching (Zhong et al., in press).
In the last decade, CT imaging became of increasing importance in forensic radiography (Bassed and
Hill, 2011, Silva et al., 2011, Thali et al., 2003). The CT approach provides non-invasive high-
resolution images that enable to create 3-D models of the human body. Besides virtual autopsies
(Baglivo et al., 2013), CT imaging has been effectively used for the identification of victims of the
2009 Victorian bushfires (Bassed et al., 2011, Bassed and Hill, 2011). Thali et al. (2006) and
Jackowski et al. (2006a) noted that clinical CT scans provide appropriated records for dental
identification, enabling the rapid creation of postmortem documentation of the dental structures.

10
More recently, cone-beam CT (CBCT, a high-resolution CT for craniofacial structures) has been used
for dental age estimation (Maret et al., 2011). In contrast to conventional radiography, CT technology
also allows the differentiation of filling materials (composite, amalgam, ceramic, temporary fillings)
based on their radiopacity (Jackowski et al., 2006b). However, the precise determination of the dental
restoration material, i.e. composition, is not possible at the current stage of research (Bassed and Hill,
2011). With a growing numbers of patients lacking dental restorations, other features, like the crown
and root morphology need to be considered in antemortem-postmortem comparisons (Bernstein, 1998,
Savio et al., 2006, Sweet, 2000). Current clinical CTs and CBCTs have a spatial resolution of
approximately 1mm and 0.1mm respectively, allowing the visualisation of the dental morphology and
structures. Although the resolution and quality of clinical CTs and CBCTs constantly evolve, when X-
rays interfere with metal-containing restorations streak artefacts occur, reducing the image quality
(Jackowski et al., 2006b, Thali et al., 2006). Beck (2011) noted that conventional intra-oral
radiographs are likely to remain the cornerstone of dental identification until significant improvement
of metal artefact reduction algorithms for the various CT systems are made. Such algorithms have
since been developed, and need to be integrated into the software of future imaging systems (Tohnak
et al., 2011).
1.3. Odontological identification of fire victims
Burned dental remains are frequently found after natural disasters, airplane crashes or house fires, as a
result of either direct contact with open flames or the exposure to high temperatures (Bush and Bush,
2011, Lain et al., 2011, Savio et al., 2006). Especially in cases of prolonged fires with temperatures
above 700°C, dental analysis stands alone as other materials used as primary (fingerprints and DNA)
or secondary (e.g. clothing) means of identification are often destroyed (Fairgrieve, 2008, Hill et al.,
2011a, 2011b).
Andersen et al. (1995) classified six grades of fire injuries to teeth and jaws: (0) no injury, (1) injury
to anterior teeth, (2) injury to anterior and posterior teeth (unilaterally), (3) injury to anterior and
posterior teeth (bilaterally), (4) fragments of jaw bone including teeth and/or roots, and (5) no dental

11
remains. In their review of 292 single fire cases, the authors stated that 25% of the cases led to severe
damage of the dentition (grade 2-5). Bohnert et al. (1998) listed the effects of fire on the skull more
specifically, based on observations of cremations carried out at 670° to 810°C. After 8 to 10 minutes,
the facial soft tissue is charred and only sparse soft tissue remains visible; after 20 minutes prominent
parts of the facial skull are destroyed. Similar observations were reported by other experimental
crematoria-based studies (Fairgrieve, 2008, Günther and Schmidt, 1953).
Posterior teeth tend to be better preserved than anterior teeth due to their size and the heat protection,
offered by the tongue, layers of skin, mucosa, muscle and adipose tissue and are therefore more likely
to be used in the odontological identification process (Berketa, 2013). During the cremation process in
modern crematoria, for the first 10 to 24 minutes, the soft tissue protection keeps the temperature
inside the oral cavity as low as 87°C, depending on the nutritional state of the body, age, temperature
and time of exposure (Schweitzer and Eichenhofer, 1980). Lain et al. (2011) and Bush and Bush
(2011) reported, that teeth shrink and are often removed from their anatomical position as an effect of
extensive heat exposure. Posterior teeth with multiple roots tend to remain in the alveolar bone
sockets, whilst single-rooted are mostly found isolated (Günther and Schmidt, 1953).
Currently, comparative dental identification is the most reliable and frequently applied identification
method in cases involving high temperature exposure (Bernstein, 1998, Jablonski and Shum, 1989,
Lain et al., 2011, Savio et al., 2006). The positive identification and investigation of severely burned
human remains requires careful examination, forensic experience and excellent skills in comparative
dental anatomy (Lain et al., 2011). Since the thermal stress or the surrounding environment (e.g.
destroyed airplane, collapsed building) can lead to extreme fragmentation of the skeletal remains,
investigators are often confronted with isolated teeth or fragments thereof (Hill et al., 2011b, Lain et
al., 2011). The dental remains should be photographed in situ and examined by a forensic
odontologist, before the body is moved. Great care is necessary to ensure a proper recovery to
eventually facilitate dental identification.

12
The use of clearly labelled padded containers is recommended after fixing the remains with clear
acrylic spray paint, hair spray or cyanoacrylate (Griffiths and Bellamy, 1993, Hill et al., 2011b,
Mincer et al., 1990, Schmidt, 2008).
Griffiths and Bellamy (1993) suggested that multiple radiographs should be taken to replicate possible
antemortem records. Whilst Bush and Bush (2011) noted that standard radiographs of isolated burned
dental remains (without structural relationship of the jaws) only provide little information for
comparative dental radiography, Hill et al. (2011b) emphasised that crucial evidence can still be
obtained from burned dental remains and a number of significant radiographic details are conserved.
Future investigations of fire victims are likely to involve CT imaging, as it allows the examination
without interference of the body and digital storage of information for later evaluation
(Woisetschlager et al., 2011).
The identification rate of fire victims in mass disasters can be highly successful. As early as 1949, 72
of the 119 victims of a fire on board of a steamship could be identified using dental radiographs
(Bernstein, 1998). All 155 victims of the Kaprun cable car fire were identified within 19 days, and
112 of the 113 victims of the Concorde disaster were identified by dental means (Laborier et al., 2004,
Meyer, 2003). In contrast, after the 1984 Victorian bushfires only 64% of the 22 victims could be
identified by dental means, as the access, presence or quality of patient records was limited (Bastiaan,
1984).
1.3.1. Dental restorative materials as an aid in fire victim identification
In general, skeletal hard tissue can endure temperatures of up to 1600°C, with dental remains often
being the only remnants (Clement, 1998, Holden et al., 1995). Besides dental remains, other medical
or dental artefacts (e.g. orthopaedic/prosthetic devices) can give additional information to provide
positive victim identification (Bonavilla et al., 2008, Matoso et al., 2013, Warren, 2008).
Metal implants and restorations can resist mechanical and thermal influences, and can aid in the
identification process (Berketa et al., 2011, Berketa et al., 2010, Berman et al., 2013).

13
The melting points of common dental restorative materials are given in Table 1.2, emphasising the
importance of dental restorative materials as an aid in identification cases involving temperatures
above 1000°C.
Merlati et al. (2002, 2004) observed that dental prostheses and dental restorations are able to resist
even higher temperatures than theoretically predicted and that the composition of fragments can be
identified using scanning electron microscopy (SEM). The composition and properties of metal alloys
of prosthetic work can also be used to determine the country of origin (Marella and Rossi, 1999).
Depending on their composition, dental braces used for orthodontic treatments can survive 700 to
980°C, making them also potentially useful for identification of adolescent individuals (Campobasso
et al., 2007). Additionally, marking of dentures and prostheses could facilitate and support the
matching process, however the prevalence of denture marking is generally low (Andersen et al., 1995,
Murray et al., 2007, Taylor et al., 2002). Besides metal-based materials, root canal filling materials
can survive prolonged heat exposure and may be used in the identification process (Campobasso et
al., 2007, Hill et al., 2011b). Although the high temperatures lead to altered colour and appearance of
the dental restorative materials, they are able to resist temperatures of up to 1200°C (Brandao et al.,
2007, Moreno et al., 2009, Patidar et al., 2010).
To classify and determine the composition of composite resins and root canal fillings mainly energy
dispersive X-ray spectroscopy (EDS) and X-ray fluorescence (XRF) have been used (Bonavilla et al.,
2008, Bush et al., 2006, Bush and Bush, 2010, 2011).
Aside from invasive analytical techniques, heat-induced alterations in dental materials have been
analysed with X-ray imaging, reporting the specific behaviour of filling materials and metal implants
including their changes in morphology and radiological appearance (Berketa et al., 2011, Rossouw et
al., 1999, Woisetschlager et al., 2011).

14
Table 1.2 Melting points of dental restorative materials [adapted from Berketa et al. (2010),
Berman et al. (2013), Norrlander (1995), and Purves (1975)]
Dental restorative material Melting point
Gold crown alloys 870-1090°C
Base metal alloys 1275-1500°C
Porcelain/metal alloys 1150-1260°C
Porcelain low fusing 760-980°C
Porcelain medium fusing 1090-1300°C
Porcelain high fusing 1300-1400°C
Chrome/cobalt alloy 1370-1570°C
Titanium implant > 1600°C
Silver amalgam Hg in silver amalgam begins to vaporise at 100°C.
Metals of the silver alloy (Ag, Cu, Zn and Sn)
melt over a wide range from 230-980°C.
Composite restorations Organic materials evaporate at relatively low
temperatures; inorganic components withstand
temperatures well over 1090°C.
Acrylic resins Melting at 110°C, incineration >540°C

15
1.4. Experimental approaches for the analysis of burned dental remains
When providing relevant information to support the identification process, it is essential to
characterise and comprehend any material and dental tissue changes that take place in high-
temperature conditions.
Burned dental remains found at crime scenes or as part of archaeological excavations might have been
exposed to a wide range of temperatures. Whilst the average temperature of a wooden campfire is in
the range of 400 to 700°C, house fires can reach around 700 to 900°C (Fairgrieve, 2008, Norrlander,
1995, Shipman et al., 1984). The temperatures of burning motor vehicles range between 800 and
1100°C, especially when involving petrol (Berketa et al., 2011, Merlati et al., 2002). Crematoria
operate between 900 and 1000°C, whilst natural fire storms were recorded to reach up to 2000°C
(Bastiaan, 1984, Hill et al., 2011b, Norrlander, 1995). The presence of combustible material and
oxygen availability determines the durations and peak temperatures of fires (Fairgrieve, 2008). Many
fires have been reported to smoulder for days or even weeks after the event. Examples include the
Victorian bushfires and the World Trade Centre after the 9/11 attacks (Berketa et al., 2011, Hill et al.,
2011b, Walker et al., 2008). The lab-based experimental approaches generally do not take the fire
behaviour into account, as the fire is often divided into multiple phases and can increase by 400 to
800°C within 5 minutes in house fires and ritual cremations (Dent et al., 1995, Dodwell, 2012,
Shipman et al., 1984).
McKinley (2000) and Symes et al. (2008) showed that there is also a great variation in peak
temperatures in different parts of the body depending on the placement of the body, topography of the
surrounding environment and presence of fire accelerants.
Mayne-Correira (1997) highlighted that the inconsistency in terminology and lab-based
experimentation with a variety of skeletal materials has produced disparate conclusions regarding the
analysis of burned human remains. This is also reflected by an evaluation of lab-based heating
regimes used to model thermal stress in human teeth and dental materials (Table 1.3). A constant

16
exposure to a temperature should be comparable to the sudden thermal shock generated by fires or
explosions, whilst an incremental temperature increase approach should model the slower increase in
temperature due to the presence of soft tissues (Bohnert et al., 1998, Muller et al., 1998). Most
research on dental tissues has been based on laboratory-based heating regimes that can be grouped
into these two ‘subtypes’. These are either constant exposure at a certain temperature for a fixed
duration or an incremental temperature increase to a specific target temperature. Moreover, there are
also differences regarding the cooling regime used, with the majority of publications stating the
immediate removal of the specimens from the heating device, or allowing cooling down overnight.
Nonetheless, the influence of the different heating and cooling regimes on the macroscopic,
compositional, structural and crystalline alterations of dental tissues has yet not been investigated.

17
Tab
le 1
.3
Com
paris
on o
f 17
lab-
base
d he
atin
g pr
otoc
ols
for
hum
an te
eth
and
dent
al r
esto
rativ
e m
ater
ials
. Typ
es o
f co
olin
g (T
ype
1: r
emov
ed f
rom
heat
ing
devi
ce a
nd c
oole
d in
air
to ro
om te
mpe
ratu
re (R
T); T
ype
2: le
ft ov
erni
ght t
o co
ol d
own)
St
udy
subj
ect
Tem
pera
ture
incr
ease
Tem
pera
ture
rang
e
Tim
e of
exp
osur
e T
ype
of c
oolin
g
Bea
ch e
t al.
(200
8)
32 so
und
teet
h (p
erm
anen
t den
titio
n)
N/A
20
4°C
to 5
93°C
30
/60m
in
N/A
Bon
avill
a et
al.
(200
8)
16 te
eth
(end
odon
tical
ly tr
eate
d)
N/A
90
0°C
30
min
N
/A
Bur
ns (1
987)
46
sam
ples
(man
dibl
es, p
erm
anen
t den
titio
n)
N/A
50
0°C
, 950
°C
90m
in
Type
1
Bus
h an
d B
ush
(201
0)
2 m
andi
bles
, 2 m
axill
ae
N/A
10
10°C
15
0min
Ty
pe 2
Bus
h et
al.
(200
6)
5 te
eth
(10
com
posi
te re
sins
) N
/A
900°
C
30m
in
N/A
Fere
ira
et a
l. (2
008)
30
soun
d te
eth
(per
man
ent d
entit
ion)
18
.8°C
/min
11
50°C
60
min
(RT-
1150
°C)
Type
1
Fere
ira
Paz
et a
l. (2
010)
14
0 so
und
teet
h (p
erm
anen
t den
titio
n)
18.8
°C/m
in
250°
C to
115
0°C
28
.5 m
in (1
3.5m
in to
250
°C, m
aint
aine
d 15
min
) to
77.2
min
(62.
2 m
in to
115
0°C,
mai
ntai
ned
15m
in)
Type
1
Kar
khan
is a
nd F
rank
lin (2
009)
90
hum
an te
eth
(dec
iduo
us d
entit
ion)
N
/A
100°
C to
110
0°C
30
min
Ty
pe 1
Mer
lati
et a
l. (2
002)
18
teet
h (1
2 tre
ated
, 6 c
ontro
l)
24 c
row
ns/b
ridge
s (18
fixe
d, 6
rem
ovab
le)
30°C
/min
20
0°C
to 1
100°
C
6.6
min
(RT-
200°
C) t
o 36
.6 m
in (R
T-11
00°C
) Ty
pe 1
Mer
lati
et a
l. (2
004)
10
0 te
eth
(75
with
rest
orat
ive
fillin
gs, 2
5 co
ntro
l) 30
°C/m
in
200°
C to
110
0°C
6.
6 m
in (R
T-20
0°C
) to
36.6
min
(RT-
1100
°C)
Type
1
Mor
eno
et a
l. (2
009)
20
0 hu
man
teet
h (1
50 w
ith re
stor
ativ
e fil
lings
, 50
cont
rol)
10°C
/min
20
0°C
to 1
200°
C
N/A
Ty
pe 1
Mul
ler
et a
l. (1
998)
58
soun
d te
eth
(per
man
ent d
entit
ion)
N
/A
150°
C to
115
0°C
60
min
Ty
pe 1
Mye
rs e
t al.
(199
9)
66 so
und
teet
h (p
erm
anen
t den
titio
n)
N/A
30
0°C
to 7
50°C
30
/60/
90m
in
Type
1
Patid
ar e
t al.
(201
0)
72 te
eth
(60
rest
orat
ive
fillin
gs, 1
2 co
ntro
l) 2
man
dibl
es
N/A
40
0°C
to 1
150°
C
5/15
/30m
in
N/A
Ros
souw
et a
l. (1
999)
28
sam
ples
(4 d
iffer
ent r
esto
rativ
e fil
lings
) N
/A
260°
C to
500
°C
5/15
/30m
in
N/A
Savi
o et
al.
(200
6)
90 te
eth
(60
endo
dont
ical
ly tr
eate
d, 3
0 co
ntro
l) 30
°C/m
in
200°
C to
120
0°C
6.
6 m
in (R
T-20
0°C
) to
36.6
min
(RT-
1100
°C)
Type
1
Woi
sets
chla
ger
et a
l. (2
011)
12
2 m
olar
s (w
ith 1
0 di
ffere
nt re
stor
ativ
e m
ater
ials
) N
/A
200°
C to
110
0°C
4.
0 m
in (R
T-20
0°C
) to
208.
2 m
in (R
T-11
00°C
) Ty
pe 1
18
1.5. Heat-induced alterations of skeletal hard tissue
Extensive research has been carried out on the effects of high temperatures on animal and human
bone, with the general assumption that heat-induced alterations of teeth were similar (Mayne-Correira,
1997, McKinley, 2000, Thompson, 2004, Ubelaker, 2009).
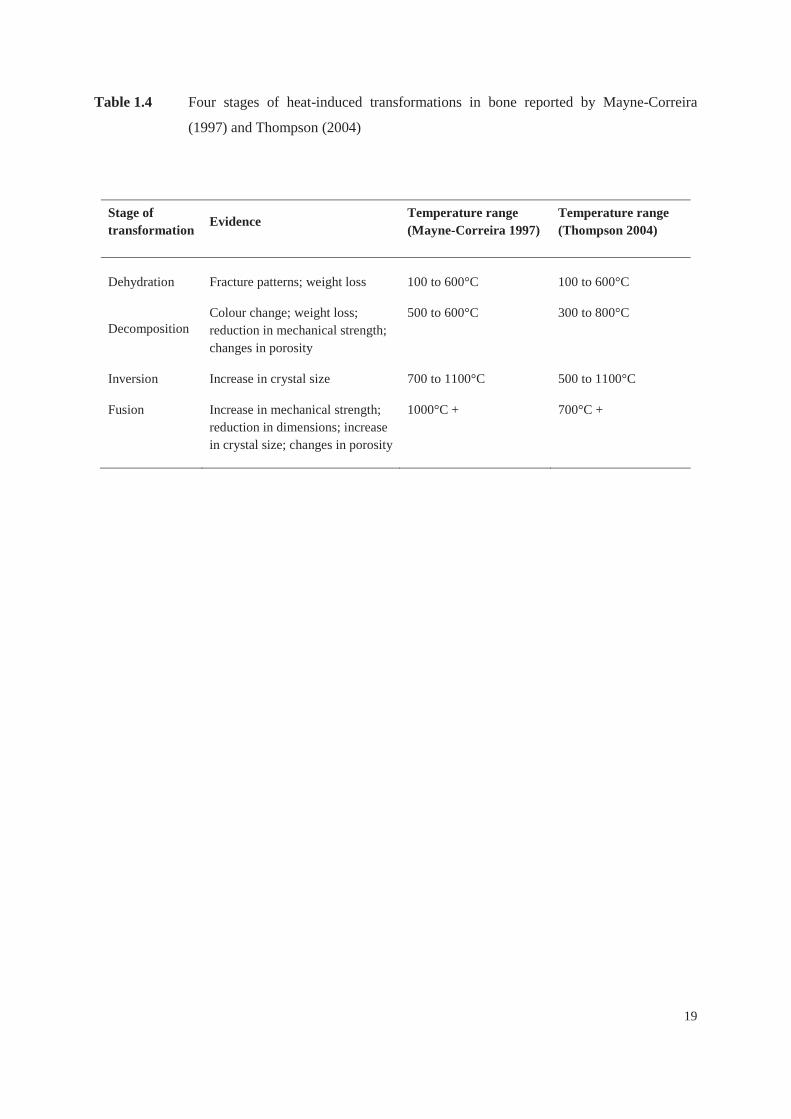
Mayne-Correira (1997) and Thompson (2004) categorized four transformation stages during the
cremation process of bone, and reported the major heat-induced alterations and corresponding
temperature ranges (Table 1.4). During the dehydration stage, water in the bone tissue is lost due to the
breaking of hydroxyl (OH-) bonds and also fracture patterns occur. During the decomposition stage
organic components are lost, leading to further weight loss as well as colour changes. Moreover, this
stage was associated with more brittle bone. During the inversion and fusion stages, the bone
crystalline structure changes lead to shrinkage. The temperature ranges in Table 1.4 result from lab-
based studies of bone, yet dental tissues are likely to react differently due to their morphological,
structural and compositional characteristics. Therefore, the present work aims to investigate and
clarify these differences.
19
Table 1.4 Four stages of heat-induced transformations in bone reported by Mayne-Correira
(1997) and Thompson (2004)
Stage of transformation
Evidence Temperature range (Mayne-Correira 1997)
Temperature range (Thompson 2004)
Dehydration Fracture patterns; weight loss 100 to 600°C 100 to 600°C
Decomposition Colour change; weight loss; reduction in mechanical strength; changes in porosity
500 to 600°C 300 to 800°C
Inversion Increase in crystal size 700 to 1100°C 500 to 1100°C
Fusion Increase in mechanical strength; reduction in dimensions; increase in crystal size; changes in porosity
1000°C + 700°C +

20
1.5.1. Macroscopic alterations of burned dental remains 1.5.1.1. Morphology In bone, heat-induced warping and deformation can occur at high temperatures, yet these
morphological changes have not been described for human teeth (Gonçalves et al., 2011, Karkhanis
and Franklin, 2009, Shipman et al., 1984, Thompson, 2005).
The crown tends to separate from the root and shatter at elevated temperatures, referred to as ‘popping
off’ due to the characteristic sound frequently encountered during experimental studies (Purves, 1975).
This phenomenon has been described in crematoria as well as lab-based experiments, at various
temperatures. Muller et al. (1998) and Beach et al. (2008) indicated that the crown becomes extremely
friable and likely to shatter after heating teeth for 30 to 60 minutes at around 450°C, whilst Merlati et
al. (2002) reported the shattering of the enamel at 800°C when heating up the teeth slowly.
The separation of the crown and shattering of the enamel has been explained by the different thermal
properties and shrinkage rates of dentine and enamel (Figure 1.1). This leads to heat-induced stress
along the dentine-enamel junction followed by the ‘popping off’ of the enamel (Brown et al., 1970,
Hughes and White, 2009, Lin et al., 2010a, Lin et al., 2010b). Besides the different thermal properties
of dentine and enamel, the boiling and steaming of water in the dentinal tubules has been considered to
be responsible for the ‘popping off’ phenomenon as well (Botha, 1986).
In contrast to the crown, the morphology of the root portion has been reported to not change
extensively (Endris and Berrsche, 1985). Superficial and internal cracks in the dentine start to appear
around 600°C, resulting in increased fragility (Muller et al., 1998). The increase of cracks at higher
temperatures has been shown in histological sections, dental radiographs and micro-computed
tomography (micro-CT) models (Fereira et al., 2008, Fereira et al., 2010, Sandholzer et al., 2014,
Savio et al., 2006).

21
Figure 1.1 Heat-induced failure of dentine-enamel junction
(A) Shattering of enamel at 450°C visualised in a tooth section heated over a Bunsen
burner flame
(B) Separation of complete crown from the root section after constant exposure for
30min at 500°C.

22
Scanning electron microscopy has been previously used to investigate the differences of heat- and
trauma-induced cracks, indicating that it is not possible to compile traumatic and heat-induced
fractures in dental tissues (Campbell and Fairgrieve, 2011). These cracks can be explained by the
dehydration and loss of organic matrix in the dentine, making the dentine more fragile. Hughes and
White (2009) indicate that cracks are likely to be caused by the intertubular tensile stress, but also a
spontaneous evaporation of water or rapid cooling could be responsible. Moreover, SEM studies found
that the dentinal tubules diameter is reduced as a consequence of high temperatures (Harsanyi, 1975,
Karkhanis and Franklin, 2009, Muller et al., 1998), whilst Shipman et al. (1984) found an enlargement
of tubules; a discrepancy that could be explained by the biological variation of tubule diameters, as
well as the number and location of SEM measurements. The typical keyhole-shaped section of enamel
prisms can still be identified in fragments of enamel that were heated at 1000°C, allowing the
microscopic identification as enamel (Yamamoto et al., 1990).
Generally, the knowledge on the preservation of distinct morphological features of the dentition such
as root curvature and pulp chamber morphology are important for fire victim identification, especially
in the absence of dental restorations or implants (Sweet, 2010). Most studies dealing with heat-induced
alterations of dental tissues reported none or only minimal morphological alterations for temperatures
up to 1100°C (Beach et al., 2008, Endris and Berrsche, 1985, Merlati et al., 2002). The melting of
teeth into atypical, globular formations has been reported between 1300 and 1600°C (Clement, 1998,
Harsanyi, 1975).
1.5.1.2. Surface colour The main macroscopic feature of burned dental remains is the gradual change in surface colour (Figure
1.2). Temperature-dependent shifts from the roots’ natural pale yellow colour to black, brown,
greyish-blue, chalky-white and finally white-pink have been reported (Fairgrieve, 2008, Karkhanis and
Franklin, 2009, Moreno et al., 2009). The surface colour changes in enamel are more subtle from
natural pale yellow colour to pale brown, light grey and white (Karkhanis and Franklin, 2009).

23
Figure 1.2 Heat-induced surface colour alterations of teeth
Progressive, temperature-dependent shift from the roots’ natural pale yellow colour to
black/dark brown (400°C), brown (500-600°C), greyish-blue (700°C), light grey
(800°C), chalky-white (900°C) and white/pink (1000°C).
This figure is reprinted from Sandholzer et al. ‘Radiologic evaluation of heat-induced shrinkage and
shape preservation of human teeth using micro-CT’ Journal of Forensic Radiology and Imaging 2013;
1(3), p.107-111, with permission from Elsevier.

24
The surface colour changes of burned teeth have been previously associated with the loss of organic
content (Endris and Berrsche, 1985, Merlati et al., 2002, Moreno et al., 2009). Moreover, the
combustion of chemical groups in the mineral phase and defects in the crystal lattice of biological
apatite can lead to alterations of the surface colour (Berzina-Cimdina and Borodajenko, 2012). In
general, colour changes help to deduce a temperature range to which skeletal remains have been
exposed, but were found to be influenced by temperature, duration, oxygen availability and other
external factors (Herrmann, 1972, Shipman et al., 1984, Walker et al., 2008).
Besides a simple description of colours (Muller et al., 1998), various researchers used the ‘Munsell
Soil colour chart’ or similar colour catalogues for the description of the root and enamel surface
colour, giving some limited selection of the colour variation that is present in heat-affected teeth
(Beach et al., 2008, Endris and Berrsche, 1985, Karkhanis and Franklin, 2009, Shipman et al., 1984).
In general, the description and determination of colours is highly subjective and also dependent on
various external factors, including the positioning of the observer or the illuminant (i.e. the light
source). Besides these aforementioned descriptive studies, flatbed scanners, digitalised photographs
and spectrophotometry have been used to document colour alterations of skeletal tissue (Beach et al.,
2008, Fereira et al., 2008, Walker et al., 2008). Quantitative colorimetric measurements would be
favourable to document colour alterations, however most of those previous approaches lacked
appropriate standardisation or system calibration.
Nonetheless, subjective descriptions of colours and inconsistency in experimental approaches have
resulted in highly disparate conclusions regarding colour alterations. Besides the duration of heat
exposure, the heating/cooling regime and presence of soft tissue might influence the colour alterations
of teeth, but this has not yet been investigated.

25
1.5.1.3. Shrinkage
In addition to surface colour changes, shrinkage is another aspect that has to be taken into account
when analysing burned dental remains. Heat-induced dimensional changes in animal and human bone
have been previously described, however very limited data is available on the heat-induced
dimensional changes of human teeth. The amount of bone shrinkage studied in laboratory and field
experiments, is reported to be in the range of 0.5 to 27% (Buikstra and Swegle, 1989, Großkopf, 2004,
Thompson, 2005, Ubelaker, 2009). Most of these studies evaluated shrinkage using calliper
measurements, with the shrinkage rate reported either as linear/two-dimensional (2-D) or
volumetric/three-dimensional (3-D) shrinkage, leading to this high variability of reported results.
Moreover, the experimental conditions as well as structural and mineral composition of the skeletal
material are the likely key variables determining the rate of shrinkage.
As early as 1875, heat-induced shrinkage of craniofacial structures has been mentioned in the literature
(von Hofmann, 1875). The experimental studies that followed were mainly descriptive, reporting that
teeth shrink considerably and are often found to be removed from their anatomical position
(Norrlander, 1995). In general, the rate of shrinkage of teeth has been assumed to be similar to that in
bone (Shipman et al., 1984).
A linear shrinkage of 1.4 to 2% was described for dentine when dried in nitrogen atmosphere at 60 to
100°C (van der Graaf and Ten Bosch, 1993). The linear shrinkage of dentine was reported to be 6%
after an experimental cremation, however no details about the experimental conditions were presented
(Dijkstra, 1938). Kindler was the first to specifically investigate the shrinkage of teeth over a larger
range of temperature, reporting a grading system of minimal, minor and definite shrinkage (Kindler
1978, cited by Großkopf 2004). An estimate of 20 to 25% heat-induced shrinkage of teeth was
reported by Maples and Browning (1995). Nevertheless, quantitative data on the heat-induced
shrinkage of human teeth has not yet been reported and would add relevant information for
comparative dental radiography of isolated teeth and fragments.

26
1.5.2. Destruction of organic components
Investigations on the effects of high temperatures on teeth also provide important information on the
preservation of organic components, such as the collagen matrix and DNA. The organic constituents
contribute to approximately 20% of the tooth weight, chemically predominately consisting of collagen
type 1, CO32-, NH, CH3-CH2, C=O, and C-H functional groups (Elliott, 1994, Reyes-Gasga et al.,
2008).
Fourier-transformed infrared spectroscopy (FTIR) can provide information on the thermal alterations
and destruction of organic constituents. This technique is based on the measurements of vibrations of
molecule bonds as an infrared (IR) beam is interfering with the sample. Each molecule bond shows
characteristic peaks or bands of absorbance at particular wavelengths within the IR spectrum that can
be compared with databases of known substances. For studies on heat-affected skeletal tissue, the mid-
IR region (4000 to 400 cm-1 wavelength) is normally used. This region contains the main peaks/bands
for phosphates (PO43-) of the mineral phase, as well as carbonates (CO3
2-) and other components of
the organic phase (Hollund et al., 2013, Thompson et al., 2009). Carbonates can be used to track the
loss of organic material during the heating process, as the peaks/bands decrease at elevated
temperatures. Whilst compositional alterations in burned animal and human bone have been
previously investigated using FTIR (Hollund et al., 2013, Mkukuma et al., 2004, Thompson et al.,
2009), there is only limited FTIR data available for heat-induced alterations up to 600°C in human
dental tissues (Reyes-Gasga et al., 2008). Additional FTIR studies, including real-time approaches,
could be used to further understand the heat-induced destruction of organic components.
Collagen is thought to have similar thermal properties as DNA, and has previously been used to
investigate DNA preservation at elevated temperatures (Mayne-Correira, 1997, Walker et al., 2008).
Whilst soft, non-mineralised collagen melts and forms gelatine when heated to 60°C, mineralised
collagen remains more or less unchanged at these low temperatures (Holden et al., 1995). Histological
sections of heat-affected bone showed some collagen structures were still present at 500°C, with

27
collagen fibres starting to denature and alter their appearance at 100°C (Fernandez Castillo et al.,
2013a, Fernandez Castillo et al., 2013b).
Several studies have been conducted on the extraction of DNA from heat-affected teeth, reporting
disparate results. Duffy et al. (1991) isolated dental pulp cells from dental remains, stating that teeth
exposed for 1h at 100°C could not be used for sex determination anymore. Exposing teeth for 2min to
a Bunsen burner flame (no temperature details reported) also led to the complete loss of high- and
low-molecular-weight DNA in teeth (Schwartz et al., 1991). With improvements in DNA analysis, and
the introduction of the polymerase chain reaction (PCR) amplification, pulpal DNA was successfully
extracted from isolated animal teeth that had been exposed at 525°C for 15min (Rees and Cox, 2010).
Although DNA preservation strongly depends on soft tissue protection, duration and temperature of
the fire, modern techniques generally enable sex determination for remains exposed up to 300 to
400°C (Barker et al., 2008, Williams et al., 2004). Von Wurmb-Schwark et al. (2005) do not
recommend post-cremation genetic analysis of modern cremations, as no DNA is preserved. Da Silva
et al. (2012) recently confirmed this recommendation, as extraction of genomic dental DNA using
PCR was not possible at any of the periods (10, 30 and 60 min) and temperatures (600, 800 and
1000°C) analysed.
1.5.3. Crystalline alterations
Whilst organic material denatures at elevated temperatures, mineral structures are generally well
preserved. By using high-magnification SEM or transmission electron microscopy (TEM)
morphological changes of the hydroxyapatite (HAp) crystals can be visualised (Reiche et al., 2002).
Shipman et al. (1984) categorised the changes in HAp morphology in dentine and enamel, indicating a
trend of increasing crystallite size and more smooth appearance at elevated temperatures. Similar
trends were also reported for heat-affected bone (Holden et al., 1995).
28
Unaltered bone tissue shows a low crystallinity with small HAp crystals and high lattice strain, whilst
heat-affected tissue shows an increase in HAp crystal size and lower lattice strains. The crystallinity
index (CI) is a ratio of two intensity peaks of HAp, and gives information about the mean changes in
crystal size and microscopic structural order of tissue (Hollund et al., 2013, Reiche et al., 2002,
Squires et al., 2011, Thompson et al., 2013, Thompson et al., 2011). The CI can be quantified by
FTIR, X-ray diffraction/scattering (XRD or wide angle X-ray scattering, WAXS) and Raman
spectroscopy, and is frequently reported in literature. However, the CI does not characterise individual
crystalline features (e.g. size, morphology) and may fail to describe adequately the complexity and
heterogeneity of heat-induced processes (Hollund et al., 2013, Piga et al., 2008, Piga et al., 2009,
Rogers et al., 2010).
Wide angle X-ray scattering analysis is capable of showing distinct differences in crystallite size,
enabling reliable cremation temperature estimations (Hollund et al., 2013, Piga et al., 2008, Shipman
et al., 1984). Most of the research to date has focused on the heat-induced compositional and structural
alterations of bone tissue (Beckett et al., 2011, Hiller et al., 2003), with only very limited data about
the changes in dental tissues (Piga et al., 2009). The XRD analysis of heat-affected human bone and
teeth showed that HAp derived from bone and teeth react differently to heat, implicating that those
tissues have to be separately investigated when a precise temperature estimation is desired (Piga et al.,
2009).
Small angle X-ray scattering (SAXS) can provide additional information about the mean crystallite
thickness, degree of alignment and shape of crystallites (Hiller and Wess, 2006). Lab-based SAXS
was successfully used to characterise the heat-induced alterations of crystallite size in archaeological
and experimentally altered bone (Etok et al., 2007, Hiller and Wess, 2006). However, there is no
SAXS data available for heat-affected dental tissues. Further analytical approaches, combining X-ray
scattering techniques could be used to investigate the heat-induced alterations of dentine and enamel,
in order to develop a structural reference for heat-affected dental tissues.

29
1.6. Aim and objectives
The overall aim of the present work was to investigate the influence of duration of heat exposure and
heating regimes regarding the macroscopic, compositional, structural and crystalline alterations of
dental tissues. This aim was addressed by means of the following objectives:
- Investigation of heat-induced destruction of organic structures using high-precision
measurements of weight loss (analytical scale, TGA) and compositional alterations (FTIR);
including a real-time FTIR approach (Chapter 3)
- Analysis of colour alterations using quantitative colorimetric measurements (Chapter 4)
- Quantification of heat-induced structural alterations using conventional radiography and
micro-CT imaging to characterize morphological preservation, shrinkage and fracture
formation (Chapter 5)
- Analysis of heat-induced crystalline alterations of dentine and enamel using synchrotron-based
X-ray scattering (SAXS/WAXS) analysis; including real-time approaches (Chapter 6).

30
Chapter 2 – Materials and Methods

31
2.1. Sample preparation
The sample material consisted of 215 freshly extracted premolars (n=90) and molars (n=125) that were
disinfected in 15mM sodium azide solution and washed under running water for 5 to 6 hours and then
mechanically cleaned to eliminate soft tissue residues. Teeth that showed signs of damage (e.g. broken
roots, visible cracks in enamel), endodontic treatments, restorations or caries were excluded from the
study. Before experimentation, the samples were stored in a freezer at -20°C for up to 4 weeks. The
teeth were taken out of the freezer 2 to 3 hours before the heating experiments and kept in phosphate
buffered saline (PBS) solution according to Jameson et al. (1993). Upon examination with X-ray
micro-computed tomography (Chapter 2.5.2) no cracks within the dental tissues were observed
previous to the experiments. Details such as age and sex of the patients from which the teeth were
obtained remained anonymous as part of confidentiality regulations as required by the ethical approval
from the National Research Ethics Committee (NHS-REC reference 09.H0405.33/ Consortium R&D
No. 1465).
The FTIR, TGA and X-ray scattering experiments required bucco-lingual cross-sections and cubic
samples. Therefore 1 to 3mm cross-sections were cut using an Isomet low speed diamond saw
(Buehler Ltd., Lake Bluff, Illinois, USA). Subsequently, a Phoenix Beta variable speed
grinding/polishing machine (Buehler Ltd., Lake Bluff, Illinois, USA) was used with a series of
grinding papers (P800 to P2400) to further polish the samples. A digital calliper (0.03mm precision)
was used to assess the dimensions of the specimens during the sample preparation.
To investigate the thermal alterations of the organic dental components using TGA, cubic dentine
samples (3×3×3mm) were placed in a rotating 10% formic acid bath for 14 days to eliminate the
mineral content.

32
2.2. Photography and video imaging
To document the sample preparation, experimental conditions and surface colour alterations, digital
photographs were taken with a Nikon D40 digital single-lens reflex (DSLR) camera (Nikon, Tokyo,
Japan), with a range of lenses (Nikkor AF-S DX 18-55mm 1:3.5-5.6; Nikkor 50mm 1:1.4; Sigma
105mm 1:2.8 DG Macro). The pictures were taken with a neutral colour setting in sRGB colour space
and saved by the camera in RAW (uncompressed) and JPG (1:4 compressed). For photographs of the
sample preparation and experimental setup the focus, shutter speed and aperture were adjusted
depending on the light situation. For the documentation of the surface colour alterations, the DSLR
was mounted on a camera stand and uniform lighting was created using two 50W spiral photo lamps
(Tabletop Lighting Kit, Smick Trading, UK). The samples were placed on a glass plate elevated 5cm
from a piece of green or black felt background. To reduce reflections of the glass surface, a Hoya
circular filter (Tokina Co., Ltd., Japan) was used. An elongated exposure time (1/10s) and low
aperture (f 16) ensured that the background appeared uniform and facilitated the subsequent image
analysis (Section 2.8.1). For colour and size calibration of the images, a Gretag Macbeth Color
Checker Chart (X-Rite Inc., Grand Rapids, USA) as well as a metric tape were used. The heat-induced
failure of the dentine-enamel junction was filmed at 24 frames per second with a Nikon P7000 digital
camera (Nikon, Tokyo, Japan) in AVI video mode.
2.3. Scanning electron microscopy (SEM)
Changes in the dental microstructure were analysed with scanning electron microscopy (SEM). The
samples were coated with a gold layer using an Emitech 550X sputter coater (Emitech Limited,
Ashford, UK) to make the sample conductive for electrons and prevent charging. A JEOL JSM-
5800LV (JEOL Ltd., Tokyo, Japan) operated in high-vacuum mode at 20kV accelerating voltage and a
Zeiss MA10 (Carl Zeiss AG, Munich, Germany) operated in high-vacuum mode at 10kV accelerating
voltage were used with variable working distances. The resulting images were captured on the
secondary electron (SE) detector and had at a range of magnifications (40 to 5000×).

33
2.4. Thermal treatment
2.4.1. Laboratory furnace
The laboratory furnace was used for experiments designated to evaluate the influence of duration of
heat exposure and heating regimes on shrinkage, morphology, weight loss and surface colour
alterations, using a total of 172 posterior teeth (81 premolars, 91 molars; Table 2.1). Teeth were put in
individual crucibles and placed in an ashing furnace (Carbolite AAF 11/3, Sheffield, United
Kingdom). The cooling phase was documented using the internal temperature probe of the furnace and
an infrared thermometer (Ebro TFI 650, Ebro Electronic GmbH, Ingolstadt, Germany) obtained thanks
to an American Board of Forensic Odontologists (ABFO) research grant. All specimens of the
experiments that involved the laboratory furnace were weighed before and after the thermal treatment
with a high-precision analytical scale (Ohaus TS400D, Pine Brook, USA). To determine the overall
dental weight loss, all fragments of dentine and enamel were collected from the crucible and included
in the weight measurements.
Fifty six teeth (28 premolars, 28 molars) were subdivided into seven temperature groups for 30min
constant exposure (400 to 1000°C, in steps of 100°C). The teeth were removed from the furnace after
the desired duration and left to cool down to room temperature (RT) (cooling from 900°C to RT in
40min). To investigate the influence of other heating regimens, this study focused on the three
temperature groups of 400°C, average temperature of a campfire (Shipman et al., 1984), 700°C,
average temperature of house fires (Fairgrieve, 2008), and 900°C, average temperature in modern
crematoria (Norrlander, 1995). Six additional groups (n=48, 24 premolars, 24 molars) for incremental
increase (samples removed as the desired temperature was reached) and cooling down overnight
(30min constant exposure and cooling overnight) at 400, 700 and 900°C were tested. The mean
temperature increase of the furnace was 20.75°C/min for the incremental increase group, resulting in a
total heat exposure time of 9.5, 25.5 and 42.5min for 400, 700 and 900°C respectively.

34
The influence of duration of heat exposure on the surface colour, nine additional duration groups
(n=63, 28 premolars, 35 molars; 5, 15 and 45min constant exposure at 400 to 1000°C in steps of
100°C) were studied. Additionally, ten teeth (5 premolars, 5 molars) were exposed for 30min at 900°C
to assess the shape alterations at high temperatures using digital radiographs. The influence of soft
tissue on surface colour alterations was investigated by placing nine teeth (4 premolars, 5 molars) into
individual 25g pieces of fresh chicken breast (30min constant exposure at 400, 700 and 900°C).
For the FTIR experiment (Section 2.5.1), a total of 40 cubic samples (36 experimental, 4 control) of
dentine and enamel (2×2×2mm) were prepared from nine freshly extracted molars. Two cubes each
were exposed for 30min to constant temperatures between 100 and 1000°C, in steps of 50°C. The first
(ex situ) X-ray scattering experiment (see section 2.6.1) involved 14 tooth sections (3×1×0.5mm; 12
experimental, 2 control) from four posterior teeth (2 premolars, 2 molars). Twelve tooth sections were
subdivided into six temperature groups for 30min constant exposure at 400 to 900°C, in steps of
100°C. After the heat exposure, all teeth and tooth sections were stored in padded containers as
suggested by Hill et al. (2011b). The fragile nature of heat-affected teeth required careful handling and
examination to reduce the risk of further fragmentation. Yet, to prevent interference with the colour
analysis, the teeth were not fixated with a cyanoacrylate adhesive or poly-methylmetacrylate (PMMA)
as proposed in literature (Fereira et al., 2008, Griffiths and Bellamy, 1993, Hill et al., 2011b).
2.4.2. Direct heating of tooth cross-sections
The heat-induced ‘popping off’ of the enamel (as described in 1.5.1.1) was investigated using video
imaging. In order to document this phenomenon, three 1mm thick bucco-lingual cross-sections from
three teeth (1 premolar, 2 molars) were used. The cross-sections were fixed using a small clamp 15cm
above the opening of a Bunsen burner. The flame was adjusted to a blue colour (~600°C) and
measured with a Type K thermocouple probe before placing the Bunsen burner underneath the cross-
section. An infrared thermometer (Ebro TFI 650, Ebro Electronic GmbH, Ingolstadt, Germany) was
used to continuously measure the tooth surface temperature during the heat exposure.

35
Tab
le 2
.1
Ove
rvie
w o
f hea
ting
expe
rimen
ts in
volv
ing
labo
rato
ry fu
rnac
e.Ty
pes o
f coo
ling
(Typ
e 1:
rem
oved
from
hea
ting
devi
ce a
nd c
oole
d in
air
to ro
om
tem
pera
ture
(RT)
; Typ
e 2:
left
over
nigh
t to
cool
dow
n to
RT)
St
udy
subj
ect
Tem
pera
ture
in
crea
se
Tem
pera
ture
r
ange
T
ime
of e
xpos
ure
Typ
e of
coo
ling
Con
stan
t exp
osur
e 56
teet
h (2
8 pr
emol
ars,
28 m
olar
s)
N/A
40
0 to
100
0°C
30
min
Ty
pe 1
Incr
emen
tal e
xpos
ure
24 te
eth
(12
prem
olar
s, 12
mol
ars)
20
.75°
C/m
in
400,
700
, 900
°C
9.5m
in (R
T to
400
°C),
25.5
min
(R
T to
700°
C)
and
42.5
min
(RT
to 9
00°C
) Ty
pe 1
Coo
ling
over
nigh
t 24
teet
h (1
2 pr
emol
ars,
12 m
olar
s)
N/A
40
0, 7
00 ,
900°
C
30m
in
Type
2
Ass
essm
ent o
f inf
luen
ce o
f
dura
tion
on c
olou
r 63
teet
h (2
8 pr
emol
ars,
35 m
olar
s)
N/A
40
0 to
100
0°C
5,
15,
45m
in
Type
1
Ass
essm
ent o
f sha
pe
alte
ratio
ns
10 te
eth
(5 p
rem
olar
s, 5
mol
ars)
N
/A
900°
C
30m
in
Type
1
Ass
essm
ent o
f inf
luen
ce o
f
soft
tiss
ue
9 te
eth
(4 p
rem
olar
s, 5
mol
ars)
N
/A
400,
700
, 90
0°C
30
min
Ty
pe 1
FTIR
exp
erim
ent
40 c
ubic
sam
ples
(9 m
olar
s)
N/A
40
0 to
100
0°C
30
min
Ty
pe 1
X-r
ay sc
atte
ring
exp
erim
ent
14 se
ctio
ns (2
prem
olar
s, 2m
olar
s)
N/A
40
0 to
900
°C
30m
in
Type
1

36
2.4.2. Synchrotron furnace setup
Three 1mm bucco-lingual cross-sections derived from three freshly extracted molars were heated in a
custom-built tube furnace as proposed by Dent et al. (1995) to evaluate the crystalline alterations in
real time using X-ray scattering. The ceramic sample chamber was heated by a system of heating wires
and two X-ray transmittant windows allowed the transmission of the X-ray beam. The temperature
was remotely controlled and an internal thermocouple provided the sample chamber temperature. The
experimental setup only allowed the simulation of incremental increase so, in order to study the
influence of the heating rate, the tooth cross-sections were heated at rates of 6, 12 and 24°C/min. The
heating process was stopped at 880 to 900°C and the cross-sections were removed after cooling down
to room temperature.
2.4.3. Thermogravimetry (TGA)
The influence of different heating regimes on the weight-loss over time was evaluated by
thermogravimetric analysis (TGA) on twenty cubic samples derived from five molars. The TGA
experiment was performed at the Department of Chemistry, University of Warwick, using a Mettler
Toledo DSC-1 Star (Mettler Toledo Ltd., Leicester, UK). Sixteen dentine samples (3×3×3mm; eight
normal, eight demineralised) and four enamel samples (2×2×2mm) were prepared as described in
Section 2.1. For each heating rate five cubic samples (two dentine, two demineralised dentine, and one
enamel) were analysed. To match the laboratory furnace incremental increase setup, the cubic samples
were heated at a rate of 20.75°C/min up to 900°C, whilst the three other groups were matched with the
heating regime of the synchrotron furnace setup at rates of 6, 12 and 24°C/min up to 900°C. By
calculating the first derivative of the weight loss curve (ΔMass/ΔTemperature) changes in the rate of weight
loss were investigated. Five additional dentine cubes were prepared to analyse percentage of absorbed
water. The freshly cut cubes were weighed in using the analytical scale and subsequently dried using a
series of increasing alcohol concentrations (70, 95, 99 and 100% ethanol for 30min each) and kept
overnight in a oven at 60°C (SI 20H, Stuart Scientific, UK) before a second weighing.

37
2.4.4. Fourier-transformed infrared spectroscopy (FTIR) heating stage
For the real-time analysis of the combustion of organic components, measurements were conducted on
three 10-15μm thin sections of three molars using a FTIR600 heating stage (Figure 2.1, kindly loaned
for one week by Linkam Scientific Instruments Ltd, Guildford, UK). The heating rate of 12°C/min
was matched with the TGA and synchrotron furnace setup. Due to equipment restrictions (water
circulator pump was not provided as part of loan), the sections could only be heated to 400°C, and
were removed as soon as 400°C was reached and subsequently cooled down to room temperature.
2.5. X-ray imaging
2.5.1. Digital radiographs
Digital radiographs were taken to document structural and dimensional changes of teeth in 2-D using a
customized Kodak 2100 intra-oral X-ray system setup (Carestream Health Inc., Rochester, NY, USA)
using 60kV voltage, 4μA current and 0.1s exposure time. The setup allowed a fixed object-detector
distance, minimizing geometric enlargement. Size calibration was performed using two grade 200
high-precision aluminium bearing balls (diameter: 1mm±5μm and 5mm±5μm; CCR Products, West
Hartford, USA).
2.5.2. X-ray micro-computed tomography (Micro-CT)
Micro-CT was used to investigate the structural and dimensional alterations of teeth in 3-D, as well as
to produce high-resolution planning models for the X-ray scattering experiments. All scans were
carried out with a SkyScan 1172 (Bruker SkyScan, Kontich, Belgium). A flat field correction was
taken on the day prior to scanning using the SkyScan control software to correct for variations in the
pixel sensitivity of the CCD detector. Teeth were scanned at 13.5μm camera pixel resolution using
80kV voltage, 100μA current and a 0.5mm Aluminium filter, resulting in 480 projection images.
Tooth sections were scanned at 0.5 to 2.9μm camera pixel resolution using 40 to 80kV voltage, 100 to
120μA current and a 0.5mm Aluminium filter, depending on the specimen size and thickness.
Subsequent reconstruction of the projection images and analysis are described in Section 2.7.2.

38
2.6. Fourier-transformed infrared spectroscopy (FTIR)
2.6.1. Attenuated Reflective Fourier-transformed infrared spectroscopy (ATR-FTIR)
FTIR measurements were used to provide information on heat-induced compositional changes of
dental tissue. The analysis was performed on a Nicolet 6700 FTIR machine (Thermo Scientific
Instruments Corp., Madison, USA). For the ATR-FTIR experiment, cubic samples were mechanically
crushed and sieved using a 105μm sieve to provide a homogenous grain size. The powdered samples
were analysed using the Smart Miracle ATR attachment (Figure 2.1A; PIKE Technologies, Madison,
USA) and Omnic 8 software suite (Thermo Scientific Instruments Corp., Madison, USA). Three
individual measurements per temperature group were performed. Each resulting spectrum represented
the average of 32 scans within the mid-IR spectrum (range: 4000 to 400 cm-1) at a resolution of 0.482
cm-1.
2.6.2. Real-time Fourier-transformed infrared spectroscopy
A FTIR600 heating stage (Figure 2.1B) was fitted into the Nicolet 6700 FTIR machine allowing real-
time measurements of the compositional changes in transmission mode. The cross-sections were
mounted in a sample chamber and KBr windows were fitted to optimise the transmission of the IR-
beam. The Linksys32 control software (Linkam Scientific Instruments Ltd, Guildford, UK) was used
to remotely adjust the heating rate. The real-time function of the Omnic 8 software suite was used for
continuous measurements of five individual values. These values included the carbonate (CO32-) group
peaks at 1415, 1460 and 1546cm-1, the organic tissue and water peak at 1640cm-1 as well as the overall
‘organic’ region between 1415 and 1650cm-1 (Thompson et al., 2013). A total of 1,002 measurements
were recorded for each value and sample during the heating from room temperature to 400°C.
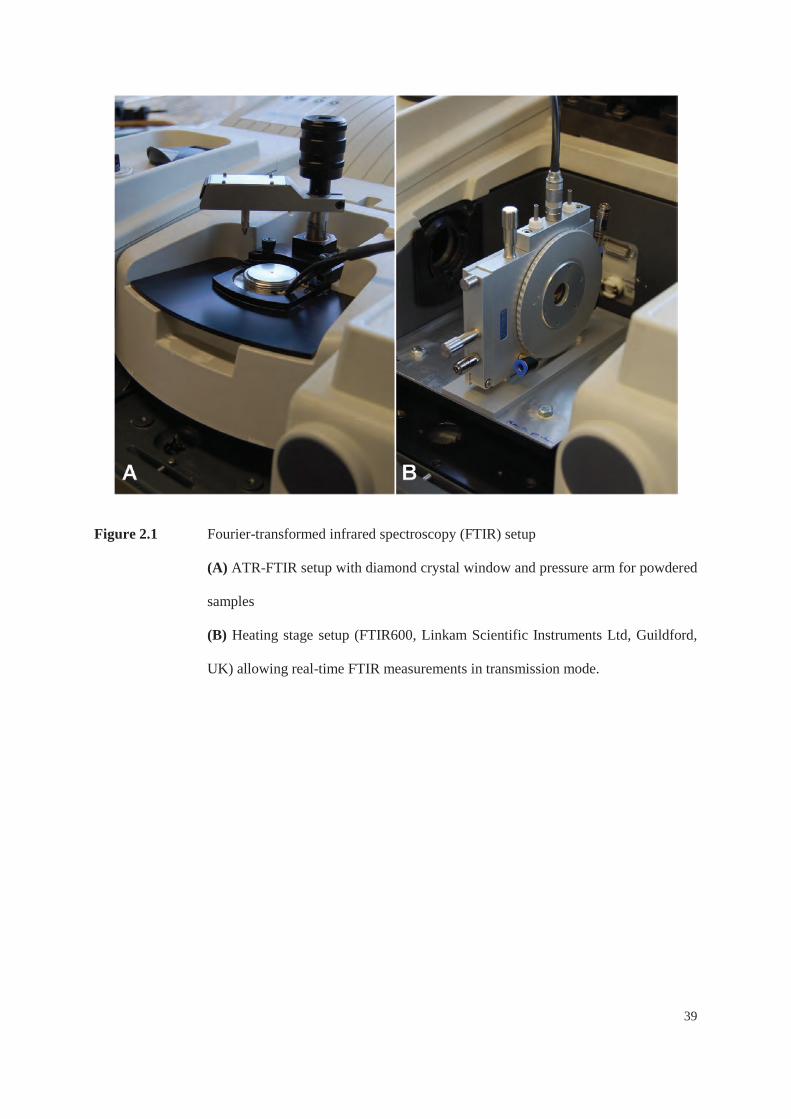
39
Figure 2.1 Fourier-transformed infrared spectroscopy (FTIR) setup
(A) ATR-FTIR setup with diamond crystal window and pressure arm for powdered
samples
(B) Heating stage setup (FTIR600, Linkam Scientific Instruments Ltd, Guildford,
UK) allowing real-time FTIR measurements in transmission mode.

40
2.7. Synchrotron X-ray scattering
2.7.1. X-ray scattering data acquisition
The electron density of a material causes an incident X-ray beam to be scattered in certain angles. The
wide-angle X-ray scattering (WAXS) patterns typically appear as separated rings with various width
and intensity levels. The rings contain information related to the material structure (e.g. HAp
crystallites and organic components in dental tissue; Figure 2.2.). Additionally, the small-angle X-ray
scattering (SAXS) patterns contain information on size, shape and alignment of a crystalline material.
Traditional lab-based X-ray scattering methods (e.g. XRD) analyse powdered samples, providing
averaged results of the entire sample. To investigate local characteristics of dental nanostructures,
synchrotron-based X-ray scattering experiments were conducted.
The ex situ synchrotron X-ray scattering experiment was carried out on the I22 SAXS beamline at the
Diamond Light Source (DLS) facility (Oxford Harwell Campus, Didcot, UK) and used sections that
were previously burned in the laboratory furnace (Section 2.4.1). A monochromatic 18keV X-ray
beam focused to a beam size of 14.5×19μm was used to analyse the samples. The sample-detector
distance was 1,040mm, enabling the entire SAXS and a partial WAXS pattern to be captured on a 2-D
Pilatus 2M detector (Dectris Ltd., Baden, Switzerland). A small tungsten structure (beamstop) was
positioned in front of the detector to prevent the incident X-ray beam from directly hitting the detector.
Two longitudinal line scans with 14 measurements each were collected in transmission mode from
fixed locations within all samples (scan step 100μm). Additionally, transverse line scans with six
measurements each were performed for selected samples exposed at 400, 600 and 800°C. In order to
further document spatial variation of the measurements, 0.6×0.6mm region of interests (ROIs) of all
samples including the dentine-enamel junction were mapped, resulting in a 15×15 grid of 225
scattering patterns (scan step 40μm).
The real-time synchrotron X-ray scattering experiment was also performed on the I22 SAXS beamline
at the DLS facility and used the synchrotron furnace setup described in Section 2.4.2.

41
A monochromatic 18keV X-ray beam was used to illuminate the samples with a focused beam of
65×120μm. The specific furnace design allowed the incident X-rays to be transmitted directly through
the tooth sample. The SAXS patterns were collected in enamel and dentine at four fixed locations
within the specimens. A Pilatus 2M detector (Dectris Ltd., Baden, Switzerland) was positioned at a
distance of 2,892mm for the SAXS measurements. A lightly compacted disk of National Institute of
Standards and Technology (NIST) silicon powder was used for the WAXS data calibration, and a disk
of silver behenate (AgC22H43O2) powder was used for the SAXS data calibration.

42
Figure 2.2 Representative small and wide-angle X-ray scattering (SAXS/WAXS) patterns
(A) Representative WAXS pattern of enamel. Separated rings with various width
and intensity levels indicating the underlying crystalline structure. The dark region
in the centre is the beamstop
(B) Representative SAXS pattern of enamel. The black lines are the borders of the
individual sections of the detector, and the dark spot in the centre is the beamstop.

43
2.8. Image processing and analysis
2.8.1. Photographic colour analysis
For colour calibration of the digital photographs, a Gretag Macbeth Color Checker Chart was used.
Image processing and analysis was done in Fiji (Schindelin et al., 2012) using ImageJ versions 1.45f
to 1.48c (Rasband, 1997-2013). Image calibration was performed using the ‘Chart White Balance’
plugin (van der Haeghen and Naeyaert, 2006). A macro was recorded in Fiji to produce a mask,
creating a uniform black background and facilitate the colour analysis (Figure 2.3, and Appendix
11.1). A selection of 6,000 pixels was cropped from each tooth of the different test groups, which was
equal to a root surface area of 23.6mm2. As the computing time to compare all colours of all
temperature groups was not justifiable, a colour reduction was performed. Wu’s colour reduction
algorithm implemented into the ‘3D Color Inspector’ plugin (Barthel, 2007) was used to reduce the
colour information of the previously calibrated digital photographs.
To evaluate the effects of reducing the number of colours, the colour entropy was calculated. Entropy
is a measure of uncertainty in the distribution of values within a defined space and is reported in units
called ‘bits’. Hence, colour entropy indicates how dispersedly/compactly distributed the colours of the
individual selections are within the three-dimensional RGB colour space (Sun et al., 2006). Entropy is
defined as the -∑ pi*log2(pi) , where pi is the probability of occurrence of a colour (i.e. counts for each
colour divided by the total number of pixels in an image), and log2 is the logarithm in base 2. An
image that contains just a single colour has the minimum entropy value of 0, whilst an image
containing equal proportions of each of the 16’777’216 colours of the RGB colour space has the
maximum entropy value of 24. For this study, the entropy of each cropped region containing 6,000
pixels was calculated using an ImageJ macro written by G. Landini (see Appendix 11.1).
Additional colour calculations were performed to evaluate the differences in surface colour alterations
between the individual experimental groups. In general, colours can be reported as spectra or
numerical values in colour spaces, with RGB and CIE L*a*b* being the most frequently used
44
numerical quantification systems. The RGB colour model indicates that red (R), green (G) and blue
(B) light is added together to produce a wide range of colours.
In order to determine colour changes and differences between two samples more precisely, the
Commission Internationale de L'éclairage (CIE) developed the ΔE (delta-E 1976) equation, which is
based on an alternative colour space called CIE L*a*b*. This colour space describes colour based on
the mixture of three metrics: L* is the lightness (white L=100, black L=0), a* indicates the colour
contents in a green (negative) and red (positive) axis, and b* values indicates the colour contents in a
blue (negative) and yellow (positive) axis. The ΔE 1976 equation between two colours L*1a*
1b*1 and
L*2a*
2b*2 is defined as the Euclidean distance √[(L*
2-L*1)2 + (a*
2-a*1)2 + (b*
2-b*1)2]. This enables the
comparison of colours by giving a single value proportional to the difference between two colours
(Lindbloom, 2009). ∆E values above 1 to 2.3 have been reported to be the just noticeable colour
differences distinguishable by normal human vision (Lindbloom, 2009, Mahny et al., 1994, van der
Haeghen and Naeyaert, 2006). Nonetheless, the ΔE value does not provide information on the colours
themselves.

45
Figure 2.3 Quantitative colorimetric analysis of surface colour alterations (A) Colour-calibrated image with original green felt background
(B) Creation of uniform black background using Fiji macro
(C) Background added to colour-calibrated image
(D) Colour-calibrated image and corresponding colours in RGB colour space
(E) Photograph after Wu-Chant colour reduction and corresponding colours in
RGB colour space.

46
2.8.2. X-ray micro-computed tomography (Micro-CT) data analysis
The micro-CT projection images were reconstructed using the SkyScan NRECON software suite
(Bruker SkyScan, Kontich, Belgium) with a uniform attenuation coefficient to produce cross-sectional
images of the dental samples. Subsequently, 3-D models were rendered using the Fiji ‘3D viewer’
plugin (Schmid et al., 2010).
To investigate the dentinal shrinkage, the cross-sectional images were converted into NRRD stack
files in Fiji and a 3-D fast rigid registration of pre- and post-scans was performed using 3D Slicer
version 3.6.4 (Fedorov et al., 2012) as described by Robinson et al. (2012). The pre- and post-scan
image stacks were loaded back into Fiji and after a manual determination of the region of interest
(ROI) the registered image stacks were cropped using the ‘Slice Remover’ tool. To prevent a false-
positive influence of broken coronal dentine on dentinal shrinkage the analysed ROI was limited to
non-fragmented dentine parts, with a minimum of 400 slices (equal to 5.4mm) included in the
analysis. Subsequently, the image stacks were binarised using the same thresholding values. The
resulting pre- and post-volume values were exported to SPSS version 19 (IBM SPSS Inc.,
Armonk, USA) for further statistical analysis.
2.9. X-ray scattering data analysis
The analysis of the X-ray scattering (SAXS/WAXS) data was conducted by Mrs. Tan Sui as part of an
ongoing collaborative project between the School of Dentistry (University of Birmingham) and the
Department of Engineering (University of Oxford) (Sandholzer et al., 2014, in press, Sui et al., 2014a,
Sui et al., 2013a, Sui et al., 2013b, Sui et al., 2014b).
2.9.1. Small-angle X-ray scatting (SAXS)
Small-angle X-ray scatting (SAXS) patterns provide information about the mean crystallite thickness,
degree of alignment and particle shape. For an initial quantitative analysis 2-D diffraction images were
converted into one-dimensional (1-D) intensity profiles and pre-processed using the Fit2D software

47
package (Hammersley, 1997). The mean crystallite thickness (T) was determined using established
methods (Fratzl et al., 1992). Frequently, T is used as the definition of the mean crystallite thickness
without any assumption of the particle shape (Hiller et al., 2003).
The crystallite shape in dental tissue is usually considered to be needle- or platelet-like (Marten et al.,
2010). For the special case of needle or platelet shaped particles T can be interpreted as an average
measurement of the smallest dimension of crystallite (i.e. mean crystallite thickness). By taking further
factors (e.g. the mineral volume fraction) into account, the actual thickness of the crystallite can be
calculated based on the mean thickness results (Glatter and Kratky, 1982, Tesch et al., 2001).
The crystallite orientation, referred to as the degree of alignment (ρ) is used to describe the percentage
of aligned particles in a sample. The crystalline degree of alignment was determined as explained and
illustrated in Sui et al. (2013b). The value for the crystalline degree of alignment ranges from 0 to 1,
with ρ=0 indicating no predominant orientation and ρ=1 corresponding to perfect alignment of all
crystallites (Rinnerthaler et al., 1999, Tesch et al., 2001).
As outlined by Sui et al. (2013b) the crystallite shape can be directly obtained from the logarithmic
format of the SAXS profile plot. If the absolute value of the slope of this plot is close to 1, the particle
has a needle-like shape, whilst if it is close to 2, the shape is platelet-like. Values above 2 correspond
to a more complex (polydisperse) crystal morphology (Hiller and Wess, 2006).
2.9.2. Wide-angle X-ray scatting (WAXS)
The analysis of WAXS patterns establishes the relationship between the spacing of atomic planes in
crystallites and the scattering angle at which these planes produce intense reflections (Hiller and Wess,
2006). Each intensity peak corresponds to a certain group of lattice planes within a certain
crystallographic phase of the mineral. Therefore, diffraction pattern analysis can be used to identify
and quantify the crystallographic phases and structure parameters (i.e. characteristic arrangement of
atoms). A strong and distinct ring obtained from HAp is that of the (002) lattice plane, which contains
information on the orientation of the principal axis (Deymier-Black et al., 2010).

48
The dimensions of the crystallites cause diffraction peak broadening that can be used to deduce the
particle size, by calculating the full width at half maximum (FWHM) variation ratio (Shipman et al.,
1984).
2.10. Statistical analysis
The statistical analysis was performed with SPSS versions 19 and 20 (IBM Co., Armonk, USA) and in
R v.3.0.2 (R Core Team, 2013). First, the measurements of weight loss and shrinkage as well as
SAXS/WAXS results were tested for normality using Shapiro-Wilk tests. Subsequently, the computed
differences of the weight loss, shrinkage and mean crystallite thickness were statistically analysed with
one-way analysis of variance (ANOVA) and post-hoc Least Significant Difference (LSD) tests. A
two-tailed independent sample t-test was used to evaluate the statistical difference in dentinal
shrinkage and weight loss between premolars and molars. Probability levels of p<0.05 (95%
confidence interval) were considered statistically significant. The Pearson’s correlation coefficient was
calculated to show the strength of the relationship between colour entropy and number of colours.
Hierarchical tree diagrams (dendrograms) based on the complete linkage (maximum) clustering
method were chosen to visualise trends in surface colour alterations. The colours grouped into the
earliest four to five clusters were used to evaluate whether particular colour groups could be related to
specific temperature regions.

49
Chapter 3 – Results: Heat-induced weight loss and compositional changes

50
High-precision analytical scale measurements and thermogravimetric analysis (TGA) were used to
evaluate the influence of duration of heat exposure and heating regimes on the weight loss of dental
tissues. Additionally, the destruction of organic components and lattice carbonates was documented
with attenuated total reflectance (ATR) and real-time Fourier-transformed infrared spectroscopy
(FTIR).
3.1. Weight loss of teeth
3.1.1. Analytical scale measurements
High-precision analytical scale measurements were made to provide information on the weight loss of
teeth. The enamel was fully preserved and attached in all 400°C groups and partially separated from
the coronal dentine or fragmented between 500 and 600°C. Complete separation and fragmentation of
the enamel was found in all teeth heated at and above 700°C (Figure 3.1). To determine the overall
weight loss, all fragments of dentine and enamel were collected from the crucibles and included in the
measurements. A two-tailed independent sample t-test found no significant difference between the
weight loss of premolars and molars (p=0.841). Burned soft tissue remains that were still present in the
crucibles made it difficult to determine the accurate rate of weight loss for the samples of the soft
tissue protection group.
3.1.2. Influence of duration of heat exposure and heating regimes on weight loss
The influence of duration was analysed by exposing teeth for 5, 15, 30 and 45min at 400°C to 1000°C.
Additionally, the influence of heating regimes (incremental increase as well as cooling overnight) was
tested for three temperatures (400, 700 and 900°C). To compare the weight loss of the individual
groups, a one-way ANOVA with a post-hoc least significant difference (LSD) test was performed to
identify significant differences in weight loss. The results of the mean weight loss and the significance
levels of mean weight loss differences are presented in Tables 3.1 and 3.2.

51
Figure 3.1 Fragmentation of enamel after 30min constant exposure at high temperatures
Preservation and attachment of enamel visible at 400°C, whilst fragmentation occurred
between 500 and 600°C. Complete separation and fragmentation of enamel at and
above 700°C. Scale bar = 10mm.

52
Table 3.1 Mean weight loss of teeth after exposure to elevated temperatures of 400 to 1000°C
(n=179). Values given as percentage weight loss ± 1 SD (standard deviation).
Temperature INC 5min CON
15min CON
30min CON
45min CON
ON
400°C 7.8 ± 0.5 11.4 ± 0.8 18.5 ± 1.5 16.1 ± 1.5 20.2 ± 0.8 18.0 ± 0.7
500°C - 16.0 ± 3.6 21.0 ± 2.4 20.0 ± 1.2 27.2 ± 2.1 -
600°C - 30.2 ± 0.9 26.6 ± 4.1 25.6 ± 3.6 32.0 ± 2.8 -
700°C 20.1 ± 1.9 28.9 ± 3.9 30.5 ± 4.0 27.1 ± 2.6 29.6 ± 2.9 29.3 ± 3.1
800°C - 27.7 ± 1.5 30.6 ± 1.9 30.0 ± 1.6 33.9 ± 3.9 -
900°C 27.1 ± 3.9 29.4 ± 3.3 34.0 ± 3.6 30.8 ± 3.4 33.5 ± 3.1 32.3 ± 2.0
1000°C - 34.0 ± 1.4 34.1 ± 2.4 32.9 ± 1.5 33.6 ± 1.9 -
INC Incremental increase, removed from furnace when temperature was reached CON Constant exposure for specified duration, removed from furnace when duration was reached ON Constant exposure for 30min, removed from furnace after cooling overnight.

53
Tab
le 3
.2
Sign
ifica
nce
leve
ls o
f mea
n w
eigh
t los
s diff
eren
ces.
Sta
tistic
al si
gnifi
canc
e w
as e
valu
ated
usi
ng a
n A
NO
VA
with
pos
t-hoc
LSD
test
, 95%
conf
iden
ce in
terv
al (n
o si
gnifi
cant
diff
eren
ce sh
own
in g
rey;
p<0
.05
indi
cate
d in
blu
e).
400/15
400/30
400/45
400/INC
400/ON
500/5
500/15
500/30
500/45
600/5
600/15
600/30
600/45
700/5
700/15
700/30
700/45
700/INC
700/ON
800/5
800/15
800/30
800/45
900/5
900/15
900/30
900/45
900/INC
900/ON
1000/5
1000/15
1000/30
1000/45
400/
5
400/
15
40
0/30
400/
45
40
0/IN
C
40
0/O
N
50
0/5
50
0/15
500/
30
50
0/45
600/
5
600/
15
60
0/30
600/
45
700/
5
700/
15
70
0/30
700/
45
70
0/IN
C
70
0/O
N
80
0/5
80
0/15
800/
30
80
0/45
900/
5
900/
15
90
0/30
900/
45
90
0/IN
C
90
0/O
N
10
00/5
1000
/15
10
00/3
0

54
Influence of duration of heat exposure
The statistical analysis of the various duration groups revealed trends in the amount of weight loss.
Whilst the duration of temperature exposure played a role in temperature groups at or below 600°C,
the weight loss was less variable in the groups exposed to ≥700°C. A maximum average weight loss of
33.9% was recorded for the group exposed constantly to 800°C for 45min. There was no statistical
difference in weight loss between the 15 and 45min constant exposure groups for all tested
temperature groups, apart from the 600°C groups (p=0.009; Table 3.2). When teeth were exposed for
only 5min, they showed a similar weight loss (p>0.05) to the subordinate 45min groups, with
exception of the 900°C 5min/800°C 45min pairing (p=0.021).
Influence of heating regimes
The 400 and 700°C incremental increase groups did significantly differ from all constant exposure
groups of the same temperature. Whilst the 400°C incremental increase group did not overlap with any
other tested temperature group, teeth of the 700°C incremental increase group lost a similar amount of
weight as the 500°C 30min constant exposure group (p=0.929). The weight loss of the 900°C
incremental group was similar to the 600°C 15min constant exposure group (p=0.973), and
significantly differed from all other 900°C constant exposure groups apart from the 5min constant
exposure group (p=0.079).
Cooling overnight after 30min constant exposure primarily affected the weight loss in the 400°C
group, and was comparable to the 500°C 30min constant exposure test group (p=0.913). The 700 and
900°C overnight cooling groups were similar to the constant exposure groups of the same temperature,
and only differed significantly from the respective incremental increase groups (p<0.0005).
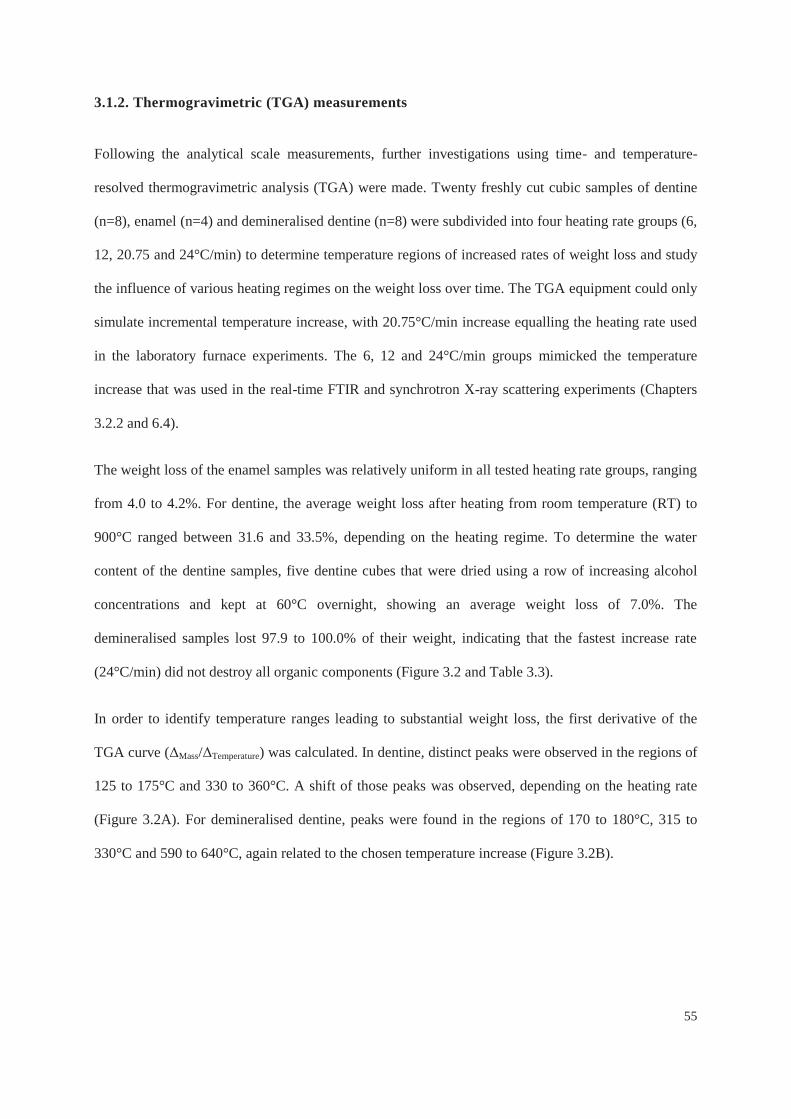
55
3.1.2. Thermogravimetric (TGA) measurements
Following the analytical scale measurements, further investigations using time- and temperature-
resolved thermogravimetric analysis (TGA) were made. Twenty freshly cut cubic samples of dentine
(n=8), enamel (n=4) and demineralised dentine (n=8) were subdivided into four heating rate groups (6,
12, 20.75 and 24°C/min) to determine temperature regions of increased rates of weight loss and study
the influence of various heating regimes on the weight loss over time. The TGA equipment could only
simulate incremental temperature increase, with 20.75°C/min increase equalling the heating rate used
in the laboratory furnace experiments. The 6, 12 and 24°C/min groups mimicked the temperature
increase that was used in the real-time FTIR and synchrotron X-ray scattering experiments (Chapters
3.2.2 and 6.4).
The weight loss of the enamel samples was relatively uniform in all tested heating rate groups, ranging
from 4.0 to 4.2%. For dentine, the average weight loss after heating from room temperature (RT) to
900°C ranged between 31.6 and 33.5%, depending on the heating regime. To determine the water
content of the dentine samples, five dentine cubes that were dried using a row of increasing alcohol
concentrations and kept at 60°C overnight, showing an average weight loss of 7.0%. The
demineralised samples lost 97.9 to 100.0% of their weight, indicating that the fastest increase rate
(24°C/min) did not destroy all organic components (Figure 3.2 and Table 3.3).
In order to identify temperature ranges leading to substantial weight loss, the first derivative of the
TGA curve (ΔMass/ΔTemperature) was calculated. In dentine, distinct peaks were observed in the regions of
125 to 175°C and 330 to 360°C. A shift of those peaks was observed, depending on the heating rate
(Figure 3.2A). For demineralised dentine, peaks were found in the regions of 170 to 180°C, 315 to
330°C and 590 to 640°C, again related to the chosen temperature increase (Figure 3.2B).
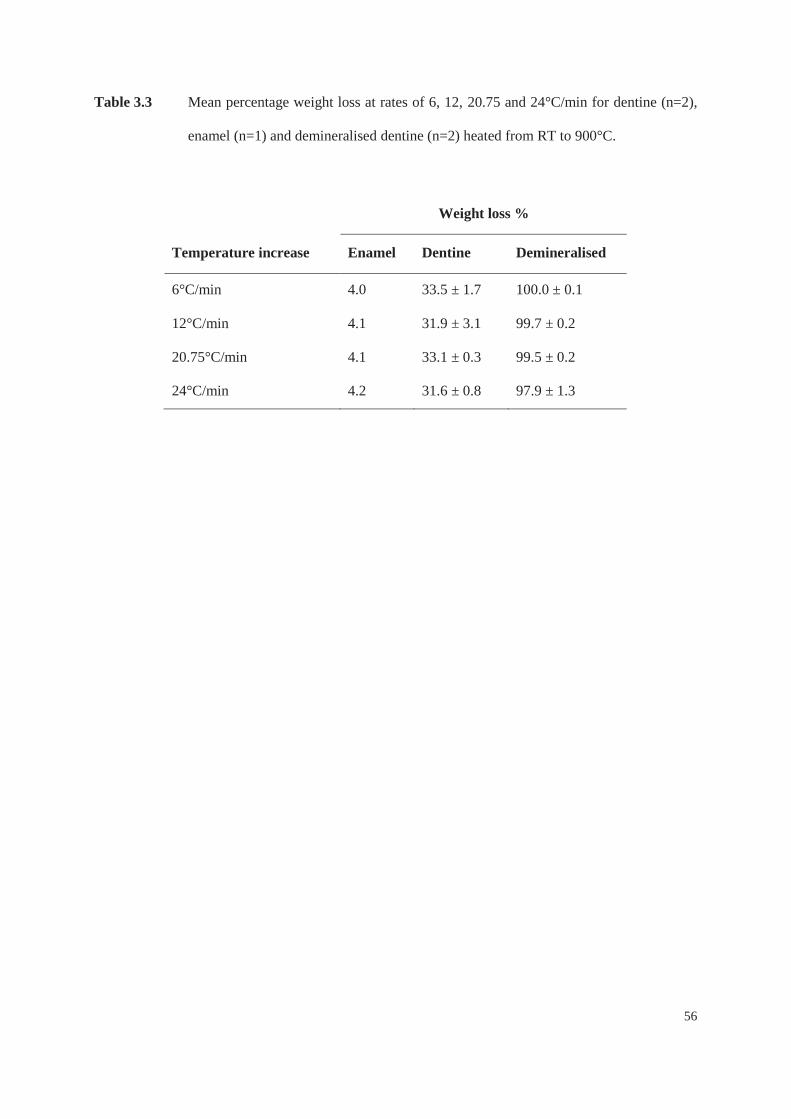
56
Table 3.3 Mean percentage weight loss at rates of 6, 12, 20.75 and 24°C/min for dentine (n=2),
enamel (n=1) and demineralised dentine (n=2) heated from RT to 900°C.
Weight loss %
Temperature increase Enamel Dentine Demineralised
6°C/min 4.0 33.5 ± 1.7 100.0 ± 0.1
12°C/min 4.1 31.9 ± 3.1 99.7 ± 0.2
20.75°C/min 4.1 33.1 ± 0.3 99.5 ± 0.2
24°C/min 4.2 31.6 ± 0.8 97.9 ± 1.3

57
Figu
re 3
.2
Ther
mog
ravi
met
ric p
lots
show
ing
the
aver
age
wei
ght l
oss a
t rat
es o
f 6, 1
2, 2
0.75
and
24°
C/m
in fo
r den
tine,
ena
mel
and
dem
iner
alis
ed
dent
ine
heat
ed fr
om R
T to
900
°C.

58
Figure 3.3 First derivative of TGA curves indicating regions of increased weight loss at heating
rates of 6, 12 and 24°C/min for (A) dentine and (B) demineralised dentine heated from
RT to 900°C.

59
3.2. Compositional alterations of teeth
To further understand the compositional alterations, an attenuated total reflectance (ATR-) FTIR
analysis was performed. Additionally, a real-time FTIR heating setup was used to investigate the time-
and temperature-resolved loss of organic components and lattice carbonates during the heating
process.
3.2.1. Attenuated Reflective Fourier-transformed infrared spectroscopy (ATR-FTIR) analysis
At room temperature dentine and enamel showed compositional differences, with organic components
and lattice carbonates more predominant in dentine (Figure 3.4). The peaks between 1400 and
1540cm-1 are associated with lattice carbonate (CO32-) substitutions of the phosphate (PO4
3-) or
hydroxyl (OH-) groups in hydroxyapatite. The peaks between 1540 and 1650cm-1 are associated with
chemical structures (amides) present in collagen and other proteins (Hollund et al., 2013, Mkukuma et
al., 2004). The height of the inorganic phosphate peak at 1030cm-1 appeared as not being influenced by
the heating process. With increasing temperature, the peaks in the 1400-1650cm-1 region began to
decrease in dentine around 250°C, with a clear loss seen at 400°C. At elevated temperatures, the peaks
of organic structures and apatite substitutions reduced further. Whilst the predominant loss of the
collagen-related peak (1640cm-1) was already seen at 700°C, a flat spectrum in the entire 1400 to
1650cm-1 region at 900°C indicated the principal loss of organic structures and lattice carbonates in
dentine (Figure 3.5).

60
Figure 3.4 FTIR spectra of dentine (blue) and enamel (red) at room temperature.
The phosphate peak at 1030cm-1 is linked to the mineral components of dental tissues.
Peaks between 1400 and 1540cm-1 are associated with lattice carbonates, peaks
between 1540 and 1650cm-1 are related to chemical structures (amides) present in
collagen and other proteins. In contrast to dentine, enamel showed no peaks in the
collagen/protein related region (1540 to 1650cm-1).

61
Figure 3.5 Changes of FTIR spectrum of dentine after 30min constant exposure to 400, 700 and
900°C compared to room temperature. Compared to RT (dark blue) the organic
component peaks (1400-1650cm-1) reduce between 400 (green) and 700°C (cyan). At
900°C (red) a flat line indicates the principal loss of the organic components in
dentine. The height of the inorganic phosphate peak (1030cm-1) was not influenced by
the heating process.

62
3.2.2. Real-time Fourier-transformed infrared spectroscopy measurements
The real-time FTIR heating equipment could only simulate incremental temperature increase up to
400°C. A 12°C/min temperature increase was selected to match the heating rates used in the TGA and
real-time synchrotron X-ray scattering experiments (Chapters 3.1.2 and 6.4).
The real-time FTIR measurements were used to further analyse the heat-induced destruction of the
organic components and lattice carbonates in dentine. The peaks at 1415, 1460, 1546 and 1640cm-1 as
well as the overall area between 1415 and 1650cm-1 were analysed (Figure 3.5). The area between
1415 and 1650cm-1 diminished by 35% after the dentine cross sections were heated from RT to 400°C.
The two analysed peaks associated with amide groups from collagen (1546 and 1640cm-1) lost 63 to
67% of their intensity (i.e. peak height), already starting at around 60°C. The two group peaks at 1415
and 1460cm-1 associated with lattice carbonates were less affected (12 to 22% decrease of peak
height), with the 1415cm-1 peak showing no changes up to 280°C.
Moreover, a temperature dependent discolouration of the tooth cross-section was observed during the
real-time FTIR experiment. The natural colour of dentine changed to dark yellow/light brown between
255 and 270°C, altering to a darker brown around 290 to 300°C and finally becoming black around
340°C.

63
Figure 3.6 Real-time FTIR measurements of the heat-induced destruction of organic components
and lattice carbonates in dentine heated from RT to 400°C. Peaks associated with
lattice carbonates (1415 and 1460cm-1) were less affected by elevated temperatures
than peaks associated with amide groups from collagen (1546 and 1640cm-1).

64
Chapter 4 – Results: Heat-induced surface colour alterations

65
As presented in the previous chapter, the duration of heat exposure and the heating regimes (constant
exposure, incremental increase, cooling overnight) influenced the weight loss and composition of
dental tissues. The destruction of organic material has previously been associated with the alterations
of surface colour, which is one of the main macroscopic feature of burned dental remains (Endris and
Berrsche, 1985, Shipman et al., 1984). Therefore, the influence of both, duration of heat exposure and
heating regimes on the surface colour changes was assessed by computational image analysis on
calibrated digital photographs.
4.1. Influence of duration of heat exposure on surface colour
The influence of four heating duration subgroups (5, 15, 30 and 45min) were tested for each of the
seven temperatures investigated (n=84; 400 to 1000°C, Figure 4.1). As the enamel was frequently
fragmented at elevated temperatures, the colorimetric analysis was limited to the root surface. A
progressive shift of the root surface colour from a natural pale yellow at room temperature to
predominantly dark yellow/black (400°C), brown (500 to 600°C), greyish-blue (700°C), light grey
(800°C), chalky-white (900°C) and patches of white, black and pink (1000°C) was observed.
The 500°C 5min group visually appeared similar to the 400°C 15 to 45min exposure groups, as did
the colours found for teeth of the 500°C 45min and the 600°C 5min group. Generally, with prolonged
exposure times, the colour difference between the duration groups was less apparent upon visual
examination.

66
Figure 4.1 Example of root surface colour alterations after exposure to various temperatures (A-
G: 400 to 1000°C). Groups: 5min (upper left), 15min (upper right), 30min (lower left)
and 45min (lower right). Scale bar = 5mm.

67
In addition to subjective visual examination, a quantitative approach was used to investigate the
surface colour alterations. Areas of interest of 6,000 pixels (60×100px, equalling to a root surface area
of 23.6mm2) were cropped from the calibrated digital photographs. These regions featured between
247 and 4,878 colours, adding up to a total of 99,631 colours for all 84 selections (Figure 4.2).
The colour entropies of the individual selections are shown in Figure 4.3A, indicating how
dispersedly/compactly distributed the colours of the individual selections are within the 3-D RGB
colour space. The Pearson’s correlation coefficient was calculated to assess the strength of the
relationship between colour entropy and number of colours present in the area of interest. As
expected, there was a positive correlation between the colour entropy and the number of colours
(r=0.780, n=84, p=0.0001). A plot of the colour entropy values of the individual duration groups
(Figure 4.3B) showed that the lowest colour entropy occurred in the 400°C 15, 30 and 45min and
500°C 5min groups. A strong decline in colour entropy was seen for the 400°C groups, indicating
more homogeneous colour alterations after prolonged exposure (15 to 45min). The low colour entropy
in the 500, 600 and 700°C 5min compared with the related 15, 30 and 45min groups showed that
colour changes were more heterogeneous with prolonged exposures. In contrast, the 800, 900 and
1000°C 5min groups had a higher entropy compared to the 15, 30 and 45min groups, indicating that
the colour appearance was more homogeneous with prolonged exposures. Overall, colour entropy
fluctuated less with prolonged exposures, pointing towards less variable and more comparable colour
appearance.

68
Figure 4.2 Root surface colour alterations after exposure to elevated temperatures (400 to
1000°C). Each row represents one temperature group, and column triplets indicate the
individual selections of the different duration groups (5, 15, 30 and 45min constant
exposure). The individual regions equal a root surface area of 23.6mm2.
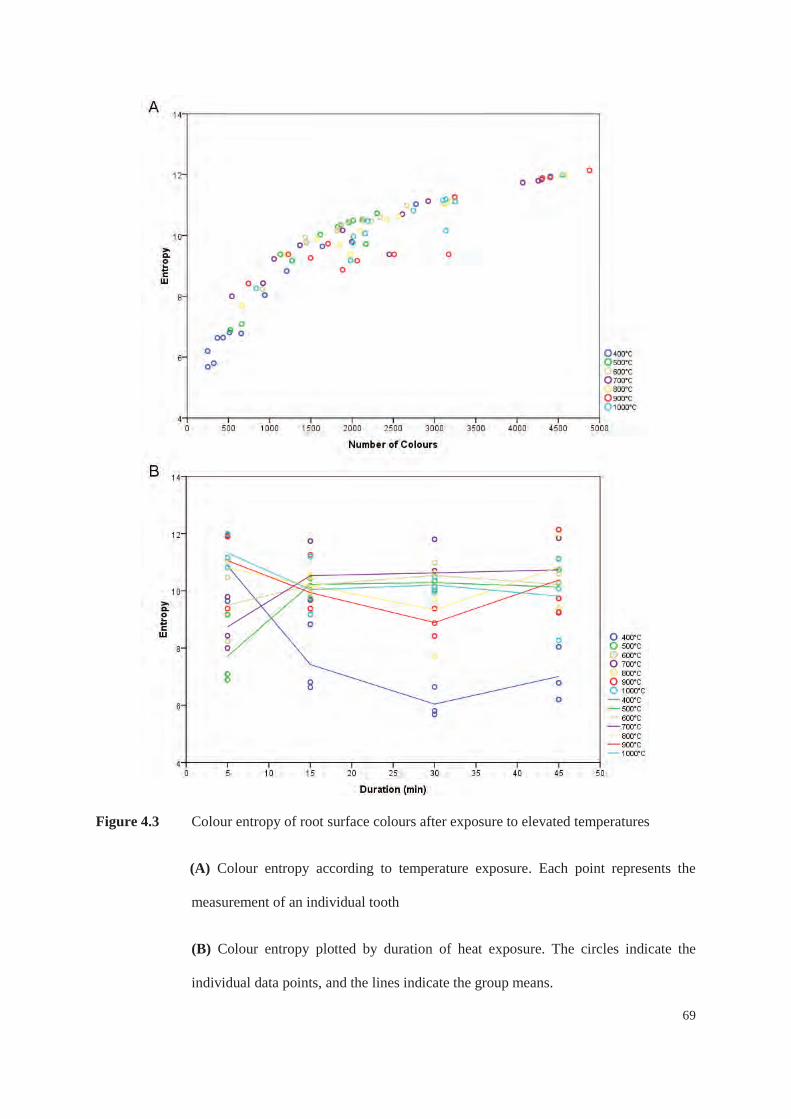
69
Figure 4.3 Colour entropy of root surface colours after exposure to elevated temperatures
(A) Colour entropy according to temperature exposure. Each point represents the
measurement of an individual tooth
(B) Colour entropy plotted by duration of heat exposure. The circles indicate the
individual data points, and the lines indicate the group means.

70
4.1.1. Colour reduction process
To reduce the colour information for each duration group (triplet of tiles) down to a palette of the
most representative colours, the Wu-Quant colour reduction algorithm implemented in the ‘3D Color
Inspector’ plugin was used (Barthel, 2007). To preserve less predominant colours (e.g. blue tinges in
the 700°C 30min group), the selections were reduced down to only 16 colours. A reduction to less
than 16 colours resulted in colour palettes that did not represent the colour diversity present in the
various temperature groups (Figures 4.4 and 4.5).
With each of the 28 duration groups reduced to 16 colours, a total of 434 colours were identified, with
14 colours (3%) overlapping between groups. Ten (62.5%) of those overlapping colours were from
the 15 to 45min 400 and 500°C 5min groups, the other six (37.5%) were from the 900 and 1000°C
groups. Due to the reduced number of colours, lower colour entropy values were computed. However,
the reduction to 16 colours showed similar entropy trends to the original images (Figure 4.6). Colour
palettes representing the individual duration and temperature groups, after the application of the Wu-
Chant colour reduction algorithm are shown in Figure 4.7.

71
Figure 4.4 Results of the Wu-Chant colour reduction algorithm. Original image (21,148 colours)
reduced to two to 24 colours with corresponding palettes. A minimum of 16 colours
was found to still represent the colour diversity of the individual test groups.

72
Figure 4.5 Root surface selections after applying the Wu-Chant colour reduction algorithm
(down to 16 colours) after 5, 15, 30 and 45min constant exposure to high
temperatures (400 to 1000°C). Each row represents one temperature group.

73
Figure 4.6 Colour entropy of root surface colours after exposure to elevated temperatures plotted
against the duration following the application of the Wu-Chant colour reduction
algorithm (16 colours). The circles indicate the individual entropy values of the
individual duration group triplets, connected by an interpolation line.
.

74
Figure 4.7 Palettes of root surface colour alterations after the application of the Wu-Chant colour
reduction algorithm. Each row represents 16 colours of an individual duration group.

75
4.1.2. Hierarchical cluster analysis of colour alterations
Hierarchical tree diagrams were computed to visualise trends in surface colour alterations and to
evaluate whether certain colours could be related to specific temperature regions. The distribution of
colours of the individual duration and temperature groups within the L*a*b* colour space are given in
Figure 4.8. A calculation of the Euclidean distances between each of the 448 colours provided the ΔE
for all possible 100,128 pairings. The ΔE was found to range between 0 (no colour difference) and
99.6 (highly different colours; Figure 4.9), with a mean ΔE of 31.6 ± 20.1. Only 174 pairings had a
ΔE of <1 (0.2%) and 1,026 pairings of <2.3 (1.0%), indicating that the vast majority of the colours
provided in the reduced colour palettes are distinguishable as distinct colours by normal human vision
(Lindbloom, 2009, Mahny et al., 1994, van der Haeghen and Naeyaert, 2006). Nonetheless, many
colours within a group and between groups might appear similar.
Since the ΔE values do not provide information on the actual surface colours, a hierarchical cluster
analysis of L*a*b* values was performed and visualised using dendrograms to investigate the
potential usefulness of colour palettes for a posteriori determination of temperature ranges.
To investigate how related the colours might be, the branches of the dendrograms were ‘cut’ at a
clustering distance that would provide the first five main clusters, containing between 11 and 175
colours (Figure 4.10). The earliest cluster of the dendrogram (Cluster 1) showed the highest level of
dissimilarity and only contained eleven colours (2.5% of all colours), all of them belonging to the
400°C 5min group (Figure 4.11). Cluster 2 consisted of 86 colours (19.2%), with all of them
associated with temperatures of 700°C or higher (Figure 4.12). The third cluster (Cluster 3, Figure
4.13) included 146 colours (32.6%) derived from 25 of the 28 duration groups (89%). Cluster 4
incorporated 29 colours (6.5%), mainly made up of colours from the 400°C 15 to 45min and 500°C
5min groups (86%; Figure 4.14). The fifth cluster (Cluster 5) consisted of 175 colours (39.1%)
derived from all duration groups (Figure 4.15).

76
Figu
re 4
.8
Col
our d
istri
butio
n of
the
indi
vidu
al d
urat
ion
grou
ps (t
op) a
nd te
mpe
ratu
re g
roup
s (bo
ttom
) with
in th
e L*
a*b*
col
our s
pace
.

77
Figure 4.9 ΔE value distribution between each of the 448 colours (100,128 pairings)
The ΔE ranged between 0 (no colour difference) and 99.6 (highly different colours).
The mean ΔE was 31.6 ± 20.1, with only 174 pairings having a ΔE of <1 (0.2%) and
1,026 pairings of <2.3 (1.0%), indicating that the vast majority of the colours
provided in the reduced colour palettes could be differentiated by the normal human
vision.
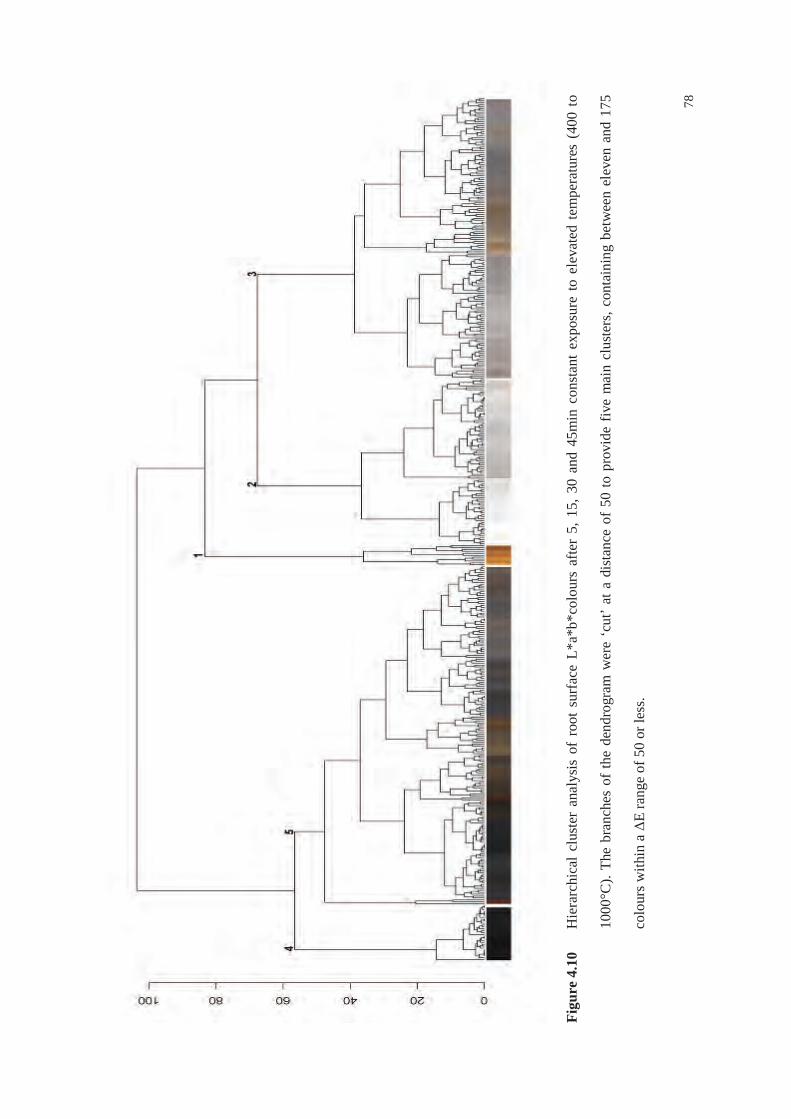
78
Figu
re 4
.10
Hie
rarc
hica
l clu
ster
ana
lysi
s of
roo
t sur
face
L*a
*b*c
olou
rs a
fter
5, 1
5, 3
0 an
d 45
min
con
stan
t ex
posu
re to
ele
vate
d te
mpe
ratu
res
(400
to
1000
°C).
The
bran
ches
of
the
dend
rogr
am w
ere
‘cut
’ at
a d
ista
nce
of 5
0 to
pro
vide
fiv
e m
ain
clus
ters
, con
tain
ing
betw
een
elev
en a
nd 1
75
colo
urs w
ithin
a Δ
E ra
nge
of 5
0 or
less
.

79
Figure 4.11 First cluster of root surface colour alterations. Dendrogram representing colours of
Cluster 1 (n=11, 2.5% of all colours) and corresponding chart indicating that all
colours of the cluster belong to the 400°C 5min group.

80
Figure 4.12 Second cluster of root surface colour alterations. Dendrogram representing colours of
Cluster 2 (n=86, 19.2% of all colours) and corresponding chart indicating that colours
of the cluster are associated with temperatures of 700°C or higher.

81
Figure 4.13 Third cluster of root surface colour alterations. Dendrogram representing colours of
Cluster 3 (n=146, 32.6% of all colours) and corresponding chart showing that colours
of the cluster are derived from 25 of the 28 duration groups.

82
Figure 4.14 Fourth cluster of root surface colour alterations. Dendrogram representing colours of
Cluster 4 (n=29, 6.5% of all colours) and corresponding chart presenting that this
cluster is mainly made up of colours from the 400°C 15 to 45min and 500°C 5min
groups.

83
Figure 4.15 Fifth cluster of root surface colour alterations. Dendrogram representing colours of
Cluster 5 (n=175, 39.1% of all colours) and corresponding chart showing that colours
of the cluster are derived from all tested duration groups.

84
4.2. Influence of the heating regimes and soft tissue protection on surface colour
The influence of heating regimes and soft tissue protection on the roots’ surface colour was tested
using 36 posterior teeth (400, 700 and 900°C; Figure 4.16).
The 400°C incremental increase group visually appeared similar to the 400°C 5min constant exposure
group, whilst teeth of the overnight cooling and soft tissue protection groups visually acquired similar
surface colours as teeth with 15 to 45min constant exposure at 400°C or 5min at 500°C. In the 700°C
groups, the heating regimes and soft tissue protection showed the biggest influence, with a variety of
colours found in these groups. With exposure to higher temperatures (900°C) however, the visual
colour difference between the individual groups was less apparent.
Similarly to the previous colour analysis, selections of 6,000 pixels (23.6mm2 root surface area) were
cropped from each tooth (n=36; Figure 4.17). The cropped regions had between 250 and 3,512
colours, adding up to a total of 47,064 colours for all 36 selections. Out of these 47,064 colours,
21,503 colours (45.7%) belonged to the 700°C groups. A colour reduction to 16 colours was
performed by using the Wu-Quant colour reduction algorithm for the individual test groups (triplet of
tiles; Figure 4.17). A total of 191 colours were found after the colour reduction, with one colour
(0.5%) of the 900°C groups overlapping.
In the subsequent hierarchical cluster analysis, the branches of the dendrogram were ‘cut’ at a
distance of 50 to provide four main clusters, containing between 15 and 85 colours (Figure 4.18 and
4.19). The first cluster contained 15 colours (7.8% of all colours), with 87% belonging to the 400°C
incremental group. The second cluster included 85 colours (44.3% of all colours), mainly associated
with the 700 and 900°C groups (89%). The third cluster consisted of 32 colours (16.7% of all colours)
derived from all treatment groups. The fourth cluster incorporated 60 colours (31.2% of all colours),
mainly made up of colours from the 400°C and 700°C groups.

85
Figure 4.16 Differences in colour alterations of human teeth at 400, 700 and 900ºC using various
heating regimes. (A) Incremental increase (B) 30min constant exposure (C) 30min
constant exposure with overnight cooling and (D) 30min constant exposure with soft
tissue protection.
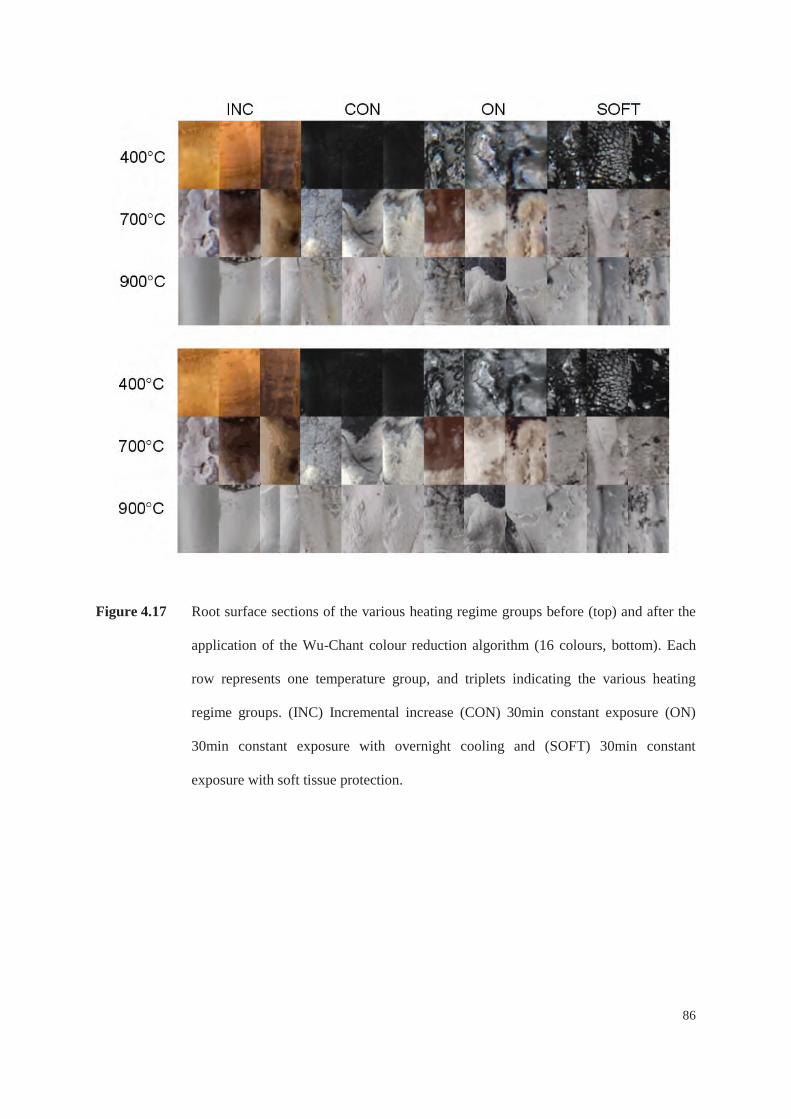
86
Figure 4.17 Root surface sections of the various heating regime groups before (top) and after the
application of the Wu-Chant colour reduction algorithm (16 colours, bottom). Each
row represents one temperature group, and triplets indicating the various heating
regime groups. (INC) Incremental increase (CON) 30min constant exposure (ON)
30min constant exposure with overnight cooling and (SOFT) 30min constant
exposure with soft tissue protection.

87
Figu
re 4
.18
Hie
rarc
hica
l clu
ster
ana
lysi
s of
roo
t sur
face
col
ours
afte
r ex
posu
re to
400
, 700
and
900
°C u
sing
var
ious
hea
ting
regi
mes
. The
bra
nche
s of
the
dend
rogr
am w
ere
‘cut
’ at a
dis
tanc
e of
50
to id
entif
y fo
ur m
ain
clus
ters
, con
tain
ing
betw
een
15 a
nd 8
5 co
lour
s.

88
Figu
re 4
.19
Com
posi
tion
of f
our
mai
n cl
uste
rs o
f ro
ot s
urfa
ce c
olou
rs a
fter
expo
sure
to
400°
C,
700°
C a
nd 9
00°C
usi
ng v
ario
us h
eatin
g re
gim
es.

89
Chapter 5 – Results: Heat-induced structural and dimensional alterations

90
The quantification of heat-induced structural alterations was made using video imaging and scanning
electron microscopy, whilst dimensional and morphological alterations were evaluated with
conventional radiography and micro-CT.
5.1. Failure of the dentine-enamel junction
A total of 104 teeth were used in the analysis of heat-induced structural alterations. The enamel
remained attached to the dentine in all teeth of the 400°C test groups, partially separated from the
coronal dentine or fragmented between 500 and 700°C and fully separated and fragmented in all teeth
at or above 800°C (Figure 3.1). The failure of the dentine-enamel junction was captured as a video
using a digital camera at 24 frames per second. Figure 5.1 shows subsequent still images of a video,
showing the spontaneous separation of dentine and enamel between two frames (within 0.04 seconds).
A discolouration of the adjacent coronal dentine was observed shortly before the initial failure.
Infrared thermometer measurements indicated a surface temperature between 380 and 450°C when the
initial shattering of the enamel occurred.
5.2. Cracks and fractures
Besides the separation and fragmentation of the enamel, heat-induced cracks and fractures were
observed at high temperatures. Multiple superficial cracks were visible in SEM images (Figure 5.2).
Fractures, referring to cracks that extended over an entire cross-section, could be visualised using
conventional radiographs and micro-CT imaging. Micro-CT sections of all teeth of the lower
temperature groups (≤ 600°C) showed multiple cracks in the apical dentine and cementum as well as
single larger longitudinal cracks. At higher temperatures (700 to 1000°C) multiple larger longitudinal
and numerous transversal fractures were visible in the dentine, originating from the root canals and
pulp cavity (Figure 5.3).

91
Figure 5.1 Separation of the enamel alongside the dentine-enamel junction
(A) Initial separation after 41 seconds exposure to a blue (Bunsen burner) flame
(~600°C). The tooth surface temperature was ~380°C, with a darkening of the adjacent
coronal dentine occurring shortly before shattering.
(B) Further separation of the enamel after 83 seconds heat exposure at a surface
temperature of ~450°C.

92
Figure 5.2 Visible cracks and fractures in scanning electron microscopic images
(A) Superficial cracks in the coronal dentine of a tooth from the 600°C 30min constant
exposure group. Individual fractures and separation of enamel visible at 40×
magnification
(B) Tooth fragment from the 900°C 30min constant exposure group showing the
failure of the dentine-enamel junction (arrows) and deep cracks in dentine (asterisks)
at 500× magnification.

93
Figure 5.3 Micro-CT cross-sections of premolars of the (A) 400, (B) 700 and (C) 900°C 30min
constant exposure group. Visualisation of the dentinal volume loss using the registered
pre- and post-scan sections (left) and cross-sections in the apical (middle) and coronal
dentine (right). The cross-sections showed multiple cracks in the apical and coronal
dentine and partial or full detachment and fragmentation of the crown. Scale bar =
1mm.
This figure is reprinted from Sandholzer et al. ‘Radiologic evaluation of heat-induced shrinkage and
shape preservation of human teeth using micro-CT’ Journal of Forensic Radiology and Imaging 2013;
1(3), p.107-111, with permission from Elsevier.

94
5.2. Shrinkage
In total, 104 teeth were included in the statistical data analysis of heat-induced volumetric shrinkage.
Due to the fragmentation and separation of enamel, the analysis primarily focused on the root and did
not include the measurement of specific tooth dimensions. To prevent a false-positive influence of
broken coronal dentine the analysed region of interest (ROI) was limited to non-fragmented dentine
and a minimum of 400 micro-CT cross-sections (i.e. 5.4 mm) of the corresponding pre- and post-
scans. A two-tailed independent sample t-test showed no statistical difference between the dentinal
shrinkage of premolars and molars (p=0.493). The mean volumetric shrinkage in the 30min constant
exposure groups was found to be between 4.8 (at 400°C) and 32.5% (at 1000°C, Table 5.1). The
results indicate that minor shrinkage already occurred at temperatures as low as 400°C (4.8%), with a
sharp increase between 700 and 800°C (11.5 to 24.2%). A one-way ANOVA with post-hoc LSD test
showed significant differences in the rate of shrinkage at higher temperatures, whereas no significant
differences were found between lower temperature groups (400 vs. 500°C (p=0.642); 500 vs. 600°C
(p=0.073); 600 vs. 700°C (p=0.060)).
Moreover, the statistical analysis revealed that the heating regime did not influence the volumetric
shrinkage at 400°C, however elongated exposure time to higher temperatures (700 and 900°C) was
found to significantly increase the rate of shrinkage (Table 5.2).
In order to relate volumetric shrinkage resulting from micro-CT measurements to conventional
radiographs, the rate of 2-D shrinkage was calculated. Assuming uniform shrinkage, the axonometric
relationship between 2-D and 3-D shrinkage can be calculated independently of the shape of the object
as: (ShrinkageVol)2/3. The 2-D shrinkage was found to range between 2.8% (at 400°C) and 10.2% (at
1000°C; Tables 5.1 and 5.2)

95
Table 5.1 Mean dentinal shrinkage after 30min constant exposure (n=56). Statistical significance
was evaluated using a one-way ANOVA with 95% confidence interval (significance
levels: * p<0.05, **p<0.005, ***p<0.0005).
Temperature (°C) 3-D Shrinkage (% ±1 SD) 2-D Shrinkage (%)
400 4.8 ± 0.8 2.8
500 5.9 ± 1.4 3.3
600 8.7 ± 0.8 4.2
700 11.5 ± 1.5 * 5.1
800 24.2 ± 4.2 *** 8.4
900 27.5 ± 4.4 * 9.1
1000 32.5 ± 5.4 ** 10.2

96
Table 5.2 Mean dentinal shrinkage using three different heating regimes (n=72). Statistical
significance was evaluated using a one-way ANOVA with 95% confidence interval
(significance levels: * p<0.05, **p<0.005, ***p<0.0005).
Temperature (°C) 3-D Shrinkage (% ±1 SD) 2-D Shrinkage (%)
400 INC 5.04 ± 0.91 2.94
400 CON 4.78 ± 0.80 2.84
400 ON 5.61 ± 0.75 3.16
700 INC 9.16 ± 1.91 4.38
700 CON 11.53 ± 1.53 5.10
700 ON 16.61 ± 3.60 ** 6.51
900 INC 25.47 ± 4.92 8.66
900 CON 27.50 ± 4.35 9.11
900 ON 31.14 ± 2.18 * 9.90
INC Incremental increase, removed from furnace when temperature was reached CON Constant exposure for 30min, removed from furnace when duration was reached ON Constant exposure for 30min, removed from furnace after cooling overnight.

97
Gro
up 1
: Inc
rem
enta
l inc
reas
e, re
mov
ed fr
om fu
rnac
e w
hen
tem
pera
ture
was
reac
hed
Gro
up 2
: Con
stan
t exp
osur
e fo
r 30m
in, r
emov
ed fr
om fu
rnac
e w
hen
dura
tion
was
reac
hed
Gro
up 3
: Con
stan
t exp
osur
e fo
r 30m
in, r
emov
ed fr
om fu
rnac
e af
ter c
oolin
g ov
erni
ght
Figu
re 5
.4
Mea
n vo
lum
etric
shr
inka
ge o
f hea
t-aff
ecte
d te
eth.
Sta
tistic
al s
igni
fican
ce w
as e
valu
ated
usi
ng a
one
-way
AN
OV
A w
ith 9
5% c
onfid
ence
inte
rval
(sig
nific
ance
lev
els:
* p
<0.0
5, *
*p<0
.005
, **
*p<0
.000
5).
(A)
Vol
umet
ric s
hrin
kage
afte
r 30
min
con
stant
exp
osur
e sh
owin
g st
atis
tical
ly
sign
ifica
nt d
iffer
ence
s in
hig
her
tem
pera
ture
gro
ups,
whi
lst
no s
igni
fican
t sta
tistic
al d
iffer
ence
was
fou
nd b
etw
een
low
er t
empe
ratu
re g
roup
s.
(B)
Influ
ence
of
the
heat
ing
regi
me
on v
olum
etric
shr
inka
ge p
rese
nt a
t hig
her
tem
pera
ture
s (7
00°C
and
900
°C),
whi
lst n
o in
fluen
ce f
ound
at
400°
C.

98
5.3. Morphological preservation
Shape preservation of the dentine was investigated using digital radiographs, cross-sectional micro-CT
images and 3-D models of the co-registered pre- and post-scans. Although fragmentation and cracks at
high temperatures often affected the morphology of the root canals and pulp cavity, visually the
shrinkage did not appear to influence tooth morphology.
The shrinkage can generally be described as uniform and the overall tooth morphology was well
preserved in premolars and molars (Figure 5.5). Minor heat-induced contraction of the distal (apical)
portions of the roots was found in the 3-D models of teeth heated at and above 800°C, but was not
identifiable on the standard digital radiographs (Figure 5.6).

99
Figure 5.5 Comparative 3-D models indicating shape preservation after exposure to elevated
temperatures (700 to 1000°C). Visualisation of dentinal volume loss using registered
micro-CT pre- and post-scans at (A) 700, (B) 900 and (C) 1000°C indicating good
preservation of tooth morphology.
This figure is reprinted from Sandholzer et al. ‘Radiologic evaluation of heat-induced shrinkage and
shape preservation of human teeth using micro-CT’ Journal of Forensic Radiology and Imaging 2013;
1(3), p.107-111, with permission from Elsevier.
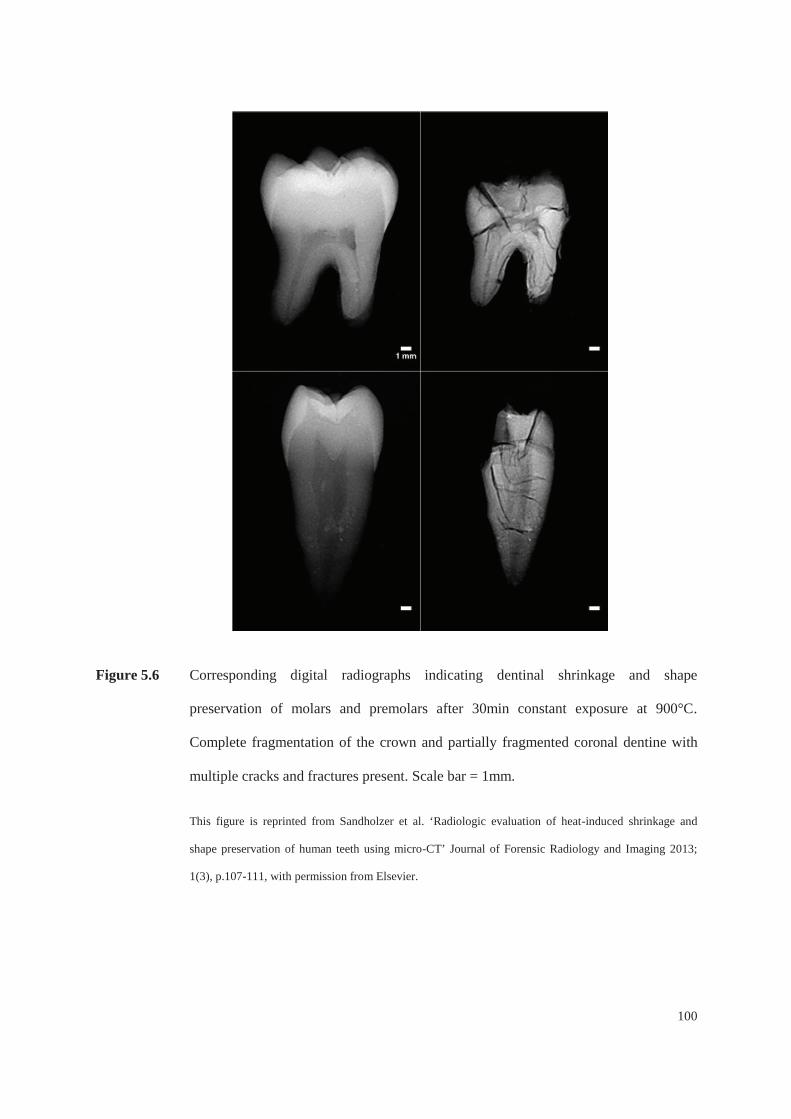
100
Figure 5.6 Corresponding digital radiographs indicating dentinal shrinkage and shape
preservation of molars and premolars after 30min constant exposure at 900°C.
Complete fragmentation of the crown and partially fragmented coronal dentine with
multiple cracks and fractures present. Scale bar = 1mm.
This figure is reprinted from Sandholzer et al. ‘Radiologic evaluation of heat-induced shrinkage and
shape preservation of human teeth using micro-CT’ Journal of Forensic Radiology and Imaging 2013;
1(3), p.107-111, with permission from Elsevier.

101
Chapter 6 – Results: Heat-induced crystalline alterations

102
The heat-induced crystalline alterations of dental tissues were analysed using synchrotron-based X-ray
scattering experiments. The small- and wide-angle X-ray scattering (SAXS/WAXS) patterns provided
information on crystallite dimensions, the degree of alignment and crystallite shape.
6.1. Macroscopic and microscopic alterations
Fourteen tooth sections (3×1×0.5mm) were analysed in the ex situ synchrotron X-ray scattering
experiment, and three 1mm bucco-lingual cross-sections were used in the real-time synchrotron X-ray
scattering experiment. The ex situ samples showed a progressive, temperature-dependent shift in
surface colours similar to the changes observed for entire teeth (Figure 6.1). Micro-CT revealed that in
all heated ex situ samples cracks were present in dentine, with multiple and larger cracks observed in
cross-sections at and above exposure to 700°C (Figure 6.1). Fragments of enamel remained attached
in samples up to 800°C in the ex situ experiment, enabling SAXS/WAXS analysis of enamel and
dentine. Due to setup restrictions of the real-time X-ray scattering experiments (i.e. radiation inside
the experimental hutch and limited size of observation window of furnace), colour alterations and
temperature of enamel separation could not be documented.

103
Figure 6.1 Documentation of tooth sections used for the ex situ synchrotron X-ray scattering
experiment
(A) Surface colour alterations of tooth sections (3×1×0.5mm) heated for 30min at 400
to 900°C (in steps of 100°C). Scale bars = 500μm. Please note that illumination varied
from previous surface colour photographs and colour calibration could not be
performed due to small specimen size.
(B) Micro-CT maximum-intensity projections of tooth sections (RT, 500 and 700°C)
used for the ex situ X-ray scattering experiment showing heat-induced cracks within
dentine and enamel.

104
6.2. Ex situ synchrotron small-angle X-Ray scattering (SAXS) measurements
Initially, two longitudinal line scans with 14 scattering patterns each were collected in transmission
mode from fixed locations within each sample (scan step 100μm). A total of 13 measurements (three
in enamel, ten in dentine) that could be clearly attributed to the respective tissue were included in the
statistical analysis. Additional transverse line scans with six scattering patterns each were performed
for sections of the 400, 600 and 800°C groups. To further document spatial variation of the
measurements for all samples, 0.6×0.6mm ROIs including the dentine-enamel junction were mapped
(scan step 40μm), resulting in a 15×15 grid containing 225 scattering patterns.
6.2.1. Mean crystallite thickness
The mean crystallite thickness nearly tripled in dentine from 2.01nm at room temperature to 5.58nm at
900°C (2.8-fold increase). Moreover, the mean crystallite thickness of dentine did not vary in the
transverse direction at any of the test temperatures (p=0.875 for 400°C; p=0.274 for 600°C; p=0.097
for 800°C). In contrast, the mean crystallite thickness of enamel only increased 1.4-fold from 3.93nm
at RT to 5.34nm at 800°C (Figure 6.2). Table 6.1 summarises the mean crystallite thickness variation
of all test groups (RT, 400 to 900°C). An overview of the variation of the mean crystallite thickness
variation in the 0.6×0.6mm ROIs is given in Figure 6.5, confirming that dentine and enamel could be
easily distinguished based on their mean crystallite thickness. Generally, the crystallite dimensions
within both tissues were lower around the dentine-enamel junction from room temperature up to
500°C. This trend could also be observed at higher temperatures (<700°C), although the difference of
the mean crystallite thickness in dentine and enamel was smaller.

105
Figure 6.2 Variation of the mean crystallite thickness in dentine and enamel determined by
SAXS
Thirteen longitudinal line measurements were included (three for enamel, ten for
dentine). The mean crystallite thickness of dentine increased from 2.01nm at RT to
5.58nm at 900°C, and the mean crystallite thickness of enamel increased from 3.93nm
at RT to 5.34nm at 800°C. Error bars ± 1SD.

106
6.2.2. Crystalline degree of alignment
The values for the crystalline degree of alignment can range between 0 and 1, where 0 describes no
predominant orientation with the plane of section whilst 1 indicates perfect alignment of all
crystallites. Figure 6.3 shows the average degree of alignment derived from ten scanning patterns in
dentine and three patterns in enamel of the individual test groups. The overall degree of alignment of
crystallites in dentine decreased from 0.27 at RT to 0.15 at 900°C, whilst the degree of alignment in
enamel dropped from 0.64 at RT to 0.36 at 800°C, indicating a more disordered orientation of the
crystallites as temperature increased (Table 6.1).
The main drop in alignment was seen in the dentine adjacent to the dentine-enamel junction when
plotting the individual values of the line measurements (Figure 6.4). In enamel and distant dentine the
degree of alignment appeared to be less variable throughout all test groups. Similar trends for the
degree of alignment variation were found in the 0.6×0.6mm ROIs (Figure 6.5). The lowest degree of
alignment was visible around the dentine-enamel junction, with a decreasing trend of alignment in
dentine towards the dentine-enamel junction.
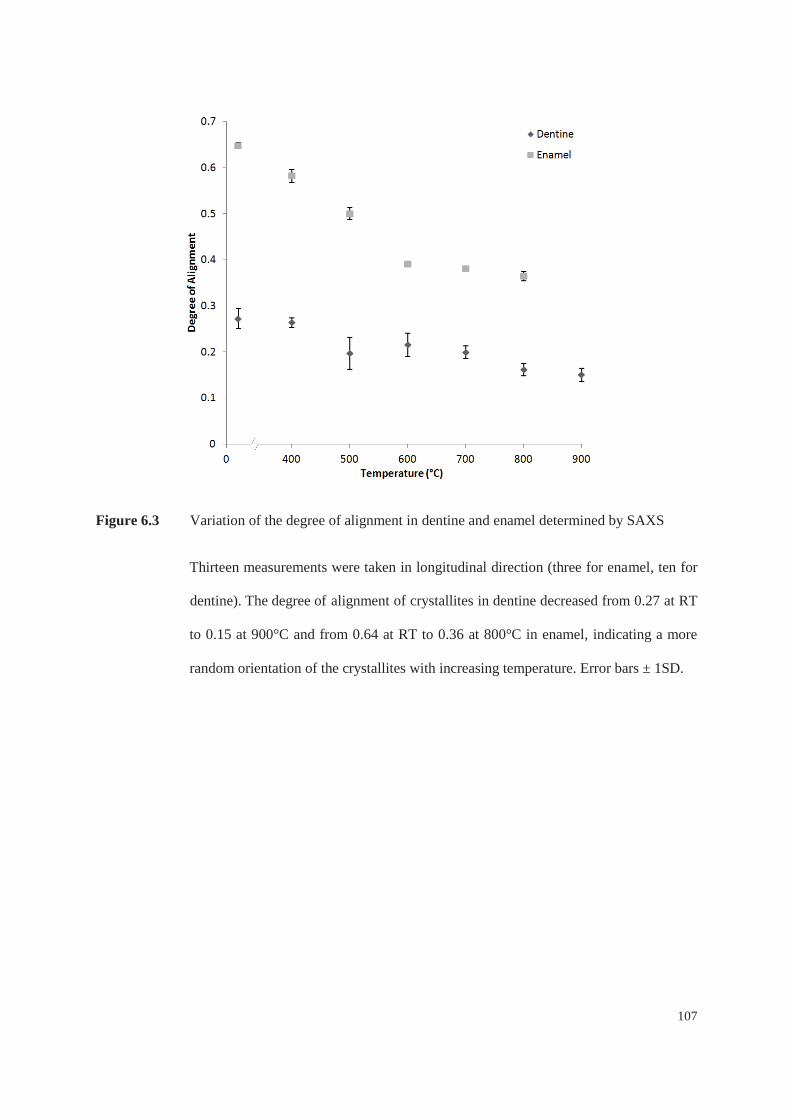
107
Figure 6.3 Variation of the degree of alignment in dentine and enamel determined by SAXS
Thirteen measurements were taken in longitudinal direction (three for enamel, ten for
dentine). The degree of alignment of crystallites in dentine decreased from 0.27 at RT
to 0.15 at 900°C and from 0.64 at RT to 0.36 at 800°C in enamel, indicating a more
random orientation of the crystallites with increasing temperature. Error bars ± 1SD.

108
Figure 6.4 Representative variation of degree of alignment in dentine and enamel at RT, 400 and
800°C
Thirteen measurements (step size: 100μm) were taken in longitudinal direction (three
for enamel, ten for dentine). A major drop in the degree of alignment was visible
around the dentine-enamel junction (Measurement point 4-6), whilst in the enamel
(Measurement points 1-3) and distant dentine (Measurement points 7-14) the degree
of alignment appeared less variable.

109
Figure 6.5 Regions of interest (0.6×0.6mm) of tooth section containing 225 SAXS patterns
(A-C) Micro-CT cross-section of the ROI at RT, 500 and 700°C; (D-F) Colour-coded
mean crystallite thickness (nm) map with crystallite orientation marked as a vector
field with black arrows; (G-I) Colour-coded degree of alignment map with crystallite
orientation marked as a vector field with black arrows.

110
6.2.3. Crystallite shape
The crystallite shape variation in dentine and enamel computed from the ex situ synchrotron SAXS
measurements is given in Figure 6.6. The dentine crystallites had a needle-like morphology at room
temperature (ρ=1.40), changing to a more platelet-like morphology at 400 to 500°C (ρ=2.03-2.19) and
finally to a polydisperse (i.e. complex) morphology at 600 to 900°C (ρ=3.22-3.53). The crystallite
shape of enamel was found to be polydisperse (ρ=2.77-3.27) in all test groups (Table 6.1).

111
Figure 6.6 Variations of crystallite shape in dentine and enamel determined by SAXS
Thirteen measurements were taken in longitudinal direction (three for enamel, ten for
dentine). The calculations indicate that a needle-like morphology (1.40) at RT,
changing to a more platelet-like morphology at 400 to 500°C (2.03-2.19) and finally
to a polydisperse morphology at 600 to 900°C (3.53-3.22). The shape of enamel
crystallites was found to be polydisperse (2.77-3.27) in all test groups. Error bars ±
1SD.

112
Tab
le 6
.1
Ove
rvie
w o
f ex
situ
sync
hrot
ron
SAX
S re
sults
on
mea
n th
ickn
ess,
degr
ee o
f alig
nmen
t and
shap
e of
den
tine
and
enam
el c
ryst
allit
es. T
hirte
en
mea
sure
men
ts w
ere
take
n in
long
itudi
nal d
irect
ion
(thre
e fo
r ena
mel
, ten
for
dent
ine)
, Mea
n th
ickn
ess
resu
lts fr
om tr
ansv
erse
line
sca
ns (t
rans
)
with
six
den
tine
scat
terin
g pa
ttern
s fo
r sel
ecte
d sa
mpl
es o
f 400
, 600
and
800
°C. S
tatis
tical
sig
nific
ance
was
eva
luat
ed u
sing
a o
ne-w
ay A
NO
VA
with
95%
con
fiden
ce in
terv
al fo
r the
mea
n th
ickn
ess r
esul
ts (S
igni
fican
ce le
vels
: * p
<0.0
5, *
*p<0
.005
, ***
p<0.
0005
).
This
tabl
e is
repr
inte
d fro
m S
andh
olze
r et a
l. ‘X
-ray
scat
terin
g ev
alua
tion
of u
ltras
truct
ural
cha
nges
of h
uman
den
tal t
issu
e w
ith th
erm
al tr
eatm
ent’
Jour
nal o
f For
ensi
c Sc
ienc
es 2
014;
59(
3) 7
69-7
74,
DO
I 10.
1111
/155
6-40
29.1
2400
, with
per
mis
sion
from
Wile
y-B
lack
wel
l
Tem
pera
ture
(°
C)
Den
tine
Mea
n T
hick
ness
(n
m ±
1 SD
) E
nam
el M
ean
Thi
ckne
ss
(nm
±1
SD)
Deg
ree
of A
lignm
ent
Den
tine
(± 1
SD)
Deg
ree
of A
lignm
ent
Ena
mel
(± 1
SD)
Cry
stal
lite
Shap
e D
entin
e (±
1SD
) C
ryst
allit
e Sh
ape
Ena
mel
(± 1
SD)
CTL
2.
01 ±
0.0
9 3.
93 ±
0.0
5 0.
27 ±
0.0
2 0.
65 ±
0.0
1 1.
40 ±
0.0
4 2.
77 ±
0.0
7
400
2.81
± 0
.10*
**
4.05
± 0
.01
0.26
± 0
.01
0.58
± 0
.01
2.03
± 0
.05
2.84
± 0
.03
500
3.90
± 0
.02*
**
5.08
± 0
.04*
**
0.20
± 0
.03
0.50
± 0
.01
2.20
± 0
.01
3.28
± 0
.01
600
4.90
± 0
.16*
**
5.07
± 0
.12
0.22
± 0
.03
0.39
± 0
.01
3.53
± 0
.08
3.16
± 0
.02
700
4.83
± 0
.06
5.19
± 0
.07
0.20
± 0
.01
0.38
± 0
.01
3.50
± 0
.06
3.14
± 0
.07
800
4.88
± 0
.16
5.34
± 0
.03
0.16
± 0
.01
0.36
± 0
.01
3.29
± 0
.04
3.09
± 0
.05
900
5.58
± 0
.08*
**
---
0.15
± 0
.01
---
3.22
± 0
.09
---
400t
rans
2.
83 ±
0.0
5
600t
rans
4.
89 ±
0.0
1
800t
rans
4.
80 ±
0.0
3

113
6.3. Ex situ synchrotron wide-angle X-Ray scattering (WAXS) measurements
Due to the limited size of the 2-D detector in the ex situ synchrotron experiment, only the (002) peak
could be captured and analysed. Figure 6.7 shows representative WAXS results for dentine from a
series of tooth sections (RT, 400, 700, 800 and 900°C) for the particular region of scattering angles
associated with the (002) peak (11.2-11.5°). After the disappearance of the organic components,
sintering of the hydroxyapatite crystallites led to grain growth and greater crystal perfection between
700 and 800°C, reflecting in a sharpening of the diffraction peaks (Figure 6.7). This indicated an
increased diffraction contribution from larger particles above 800°C as well as a peak separation
appearing at 900°C.
By fitting the peaks of the control and 900°C sample, a full width at half maximum (FWHM) variation
ratio of 0.13:0.039 (dentine) and 0.05:0.04 (enamel) was found. This ratio showed that the crystallites
appeared 3.3-fold larger in dentine (at 900°C) and 1.3-fold larger in enamel (at 800°C) compared to
the control sample.

114
Figure 6.7 WAXS results of the (002) reflection of dentine from a series of tooth sections for a
selected region of scattering angles (11.2-11.5°). A sharpening of the diffraction peak
at higher temperatures (800 to 900°C) was observed in comparison to the control
sample indicating an increased diffraction contribution from larger crystallites.

115
6.4. Real-time small-angle X-Ray scattering (SAXS) measurements In the real-time synchrotron X-ray scattering experiment, continuous SAXS measurements were
performed at three fixed locations within the dentine of 1mm bucco-lingual cross-sections (scan step
100μm) inside a remotely controlled furnace. In order to evaluate the influence of the heating regime
on the mean crystallite thickness and the degree of alignment, temperature increases of 6, 12 and
24°C/min were applied. Forty two to 148 patterns were collected between RT and 880 to 900°C,
depending on the heating regime.
6.4.1. Mean crystallite thickness
The mean crystallite thickness was calculated from the SAXS patterns, considering a constant volume
fraction of the mineral phase. During the heating process, a shoulder in the diagram was observed
between 325 and 375°C, depending on the heating regime (Figure 6.7). A steep increase of the mean
crystallite thickness started around 470 to 500°C, with the maximum mean crystallite thickness found
between 770 and 820°C, followed by a slight decrease towards 900°C. The standard deviation of
crystallite thickness values between the three measurement locations was found to be negligible (≤
±0.15nm).
6.4.2. Crystalline degree of alignment
As a consequence of the heating process, the crystalline degree of alignment in dentine decreased from
0.18 to 0.05 in the 12°C/min increase group (Figure 6.9). Similar trends were found in the other
heating regime groups as well (0.10 to 0.01 in 6°C/min group, 0.10 to 0.06 in 24°C/min group). Up to
280°C the crystallites had a relative stable degree of alignment, with an increase from 0.17 to 0.19
between 280 and 370°C. Between 370 and 700°C the degree of alignment decreased slowly from 0.19
to 0.14, whilst between 700 and 900°C the degree of alignment dropped from 0.14 to 0.05. The
standard deviation of the degree of alignment was found to be negligible (≤ ±0.02), indicating a
uniform behaviour of the crystallites from the different measurement locations.

116
Figure 6.8 In situ variation of mean crystallite thickness considering a constant volume fraction
of the mineral phase. Between 325 and 375°C a hump was present, followed by a
steep increase of the mean crystallite thickness starting around 470 to 500°C. The
maximum crystallite thickness was between 770 and 820°C, followed by a slight
decrease towards 900°C.

117
Figure 6.9 In situ variation of the crystalline degree of alignment in dentine (12°C/min increase
up to 880°C). Up to 280°C dentine had a relative stable degree of alignment, with an
increase from 0.17 to 0.19 at 280 to 370°C. Between 370 and 700°C the alignment
decreased slowly from 0.19 to 0.14, and a further drop (0.14 to 0.05) was observed
between 700 and 900°C.

118
Chapter 7 – Discussion

119
The overall aim of the present work was to investigate the influence of duration of heat exposure and
heating regimes regarding the macroscopic, compositional, structural and crystalline alterations of
dental tissues. A range of analytical approaches was used to evaluate the heat-induced alterations of
dentine and enamel. To ensure the comparability of the present work, the selected temperatures and
heating regimes of were matched to previous lab-based studies (Beach et al., 2008, Bonavilla et al.,
2008, Bush et al., 2006, Fereira et al., 2010, Karkhanis and Franklin, 2009, Merlati et al., 2002,
Merlati et al., 2004, Moreno et al., 2009, Myers et al., 1999, Patidar et al., 2010, Rossouw et al., 1999,
Savio et al., 2006, Woisetschlager et al., 2011).
7.1. Macroscopic alterations
7.1.1. Failure of the dentine-enamel junction
The fragmentation or ‘popping off’ of enamel was macroscopically observed in teeth heated at or
above 500°C, whilst the micro-CT analysis already revealed a partial de-bonding of the enamel in the
400°C groups. Moreover, tooth sections that were heated over a Bunsen burner flame showed initial
shattering of the enamel at a tooth surface temperature between 380°C and 450°C. This temperature
range is in accordance with previous studies that reported the ‘popping off’ of enamel after exposing
teeth between 400 and 500°C (Beach et al., 2008, Endris and Berrsche, 1985, Muller et al., 1998). The
slight temperature discrepancy of initial shattering between teeth and tooth sections may be explained
by the heating procedure as well as the tooth section dimensions allowing an accelerated heat transfer
(Lin et al., 2010a, Lin et al., 2010b, Myers et al., 1999). These factors would also explain the fact that
some studies reported shattering of the enamel between 650 and 800°C when using a slow incremental
increase heating regime (Merlati et al., 2002, Sandholzer et al., 2014).
The shattering of the enamel appeared to be a highly kinetic event (i.e. enamel fragments suddenly
shattered off) caused by a combination of factors discussed below. A discolouration of the enamel-
adjacent coronal dentine shortly before the initial shattering was observed during the heating of tooth
sections could be associated with the loss of organic components (Figure 5.1). The loss of organic
120
components has been shown to make dentine more brittle due to increased intertubular tensile stress
and the dentine-enamel junction weaker, allowing the propagation of cracks (Hughes and White,
2009). However, no significant increase of the weight loss (from the analytical scale measurements)
or rates of weight loss (from TGA) were found between 400 and 500°C, where the initial shattering
occurred. The boiling and steaming of the absorbed water were also thought to be responsible for an
initial separation of the dentine-enamel junction (Botha, 1986). However, FTIR experiments by
Reyes-Gasga et al. (2008) indicated that most of the absorbed water evaporates at around 200°C, and
therefore most likely does not directly influence the shattering process. Another factor could be the
high thermal expansion coefficient of the organic components (Lei et al., 2010). Computational
models of the in situ SAXS measurements by Sui et al. (Sui et al., 2014b) indicate that the HAp
crystallites are be put under stress by the surrounding organic components at temperatures between
300 and 400°C, with a release of this stress at around 500°C. Therefore, a differential expansion of the
denaturing organic material within dental tissues followed by a fast contraction might contribute to the
de-bonding of the enamel.
Besides dehydration and alterations of the organic components, the partial or full de-bonding of
enamel has also been associated with heat-induced dentinal shrinkage (Hughes and White, 2009). The
micro-CT analysis, although revealing initial de-bonding of the enamel at 400°C, showed no
significant increase in the dentinal shrinkage between 400 and 500°C (4.8 to 5.9%, 30min constant
exposure). Overall, the results of the current work indicate that the failure of the dentine-enamel
junction is most likely caused by a combination of dentinal shrinkage and denaturation-induced
expansion-contraction of organic structures in the enamel-adjacent coronal dentine.

121
7.1.2. Cracks and fractures
Heat-induced cracks and fractures in dental tissues have been previously investigated using histology,
dental radiographs and micro-CT (Fereira et al., 2008, Fereira et al., 2010, Sandholzer et al., 2014,
Savio et al., 2006). Based on microscopic examinations, Muller et al. (1998) found superficial and
internal cracks in dentine to appear at around 600°C. The micro-CT analysis revealed internal cracks
in dentine much earlier, at 400°C (Figure 5.3). The primary location of the cracks was near the pulp
chamber, with less cracks visible in the roots, confirming previous investigations (Sandholzer et al.,
2014). Hughes and White (2009) indicated that cracks and fractures are caused by the spontaneous
evaporation of absorbed water and the intertubular tensile stress, allowing the crack to propagate
through compositionally modified dentine and enamel. Most likely the dehydration and stress induced
by the loss of organic material supports the formation of these cracks and fractures (Rasmussen et al.,
1976). At the current stage of research it is suggested that heat transfers into the pulp chamber leading
to the destruction of the organic structures and subsequently to a temperature increase of the air within
the pulp chamber. As the air volume expands, cracks form and propagated through the structurally
modified dental tissues. Micro-CT imaging has proven to be a useful tool to document cracks in dental
tissues and could be used in combination with computational modelling to study crack formation
mechanisms. However, it is still unclear at what temperatures initial cracks form. One possible way to
explore this could be high-speed X-ray filming of a tooth placed in a furnace fitted with X-ray
transmittant windows (similar to the furnace used in the in situ synchrotron SAXS experiment).
7.1.3. Preservation of tooth morphology
The changes of root and pulpal morphology were visually assessed using 3-D micro-CT models and
digital radiographs. A minor contraction of the distal portions of the roots was visible in the micro-CT
models at high temperatures (≥800°C), whilst the resolution of digital radiographs from various angles
was not able to visualise the shape changes.

122
Moreover, the pulpal morphology, a distinct morphological feature important for fire victim
identification, did not seem to be influenced by cracks and fractures on the digital radiographs.
Overall, the good preservation of morphological features is somewhat different from observations
made for burned animal and human bone, where warping and severe deformation were reported
(Gonçalves et al., 2011, Shipman et al., 1984, Thompson, 2005). This could be due to the relatively
isotropic distribution of the organic matrix in teeth when compared to bone (Thompson, 2005). Since
root and pulpal morphology frequently need to be considered in comparative dental radiography, the
shape preservation after exposure to high temperature is crucial to allow positive forensic
identifications (Merlati et al., 2002).
7.2. Weight loss
The analytical scale measurements of weight loss (Chapter 3.1) ranged between 7.8 (400°C,
incremental heating) and 33.9% (800°C, 45min constant exposure). Beach et al. (2008) previously
reported a range between 13.1% (at 204°C, 60min constant exposure) and 36.0% (at 593°C, 30min
constant exposure). The higher variation in weight loss of the present work can be explained by a
higher sample size (n=179) compared to the study by Beach et al. (n=32). These results indicate that
especially during a short exposure at 400 and 500°C (i.e. incremental increase, 5 or 15min constant
heating), only a part of the tissue volume might have reached a temperature where weight loss could
occur (Endris and Berrsche, 1985, Lin et al., 2010b).
An increased rate of weight loss in dentine was found in the region of 125 to 175°C and 330 to 360°C,
depending on the heating protocol (Figure 3.2). The 125 to 175°C region was previously associated
with a predominant loss of absorbed water (e.g. trapped in the dentinal tubules) and organic material.
The weight loss between 330 and 360°C region was ascribed to the destruction of dentinal carbonates
and lattice water (Holager, 1970, Lim and Liboff, 1972). Additionally, a study by Reyes-Gasga et al.
(2008) showed that the peak around 200°C relates to the elimination of absorbed water and organic
material, whilst the peak around 350°C results from the expulsion of lattice water and carbonates.

123
Generally, the TGA measurements were in accordance with earlier studies of the thermal behaviour of
dental tissues, confirming that the overall weight loss in teeth is derived from dentine rather than
enamel. (Brown et al., 1970, Brown et al., 1972, Corcia and Moody, 1974, Holager, 1970, Reyes-
Gasga et al., 2008). To date, no TGA measurements have been reported for demineralised dentine. The
analysis of these samples showed a weight loss of 99.5 up to 100.0% for the 6, 12 and 20.75°C/min
increase groups, with the principal part (i.e. ≥99%) of organic structures destroyed between 660 and
825°C. Only the 24°C/min increase group showed some remnants (97.9% weight loss), most likely
due to the fast temperature increase or small mineral residues. Increased rates of weight loss occurred
in similar regions found in the dentine samples, with an additional peak in the region of 590 to 640°C
(Figure 3.2). This peak of increased weight loss might be due to the missing protective effect of the
mineral structures that may slow down the organic degradation process.
7.3. Destruction of organic components
The loss of the organic components and lattice carbonates was previously associated with major
macroscopic and microscopic changes like weight loss, surface colour and dimensional changes
(Fairgrieve, 2008, Mayne-Correira, 1997, Shipman et al., 1984, Thompson, 2005).
Attenuated total reflectance FTIR (ATR-FTIR) was performed in order to qualitatively confirm that
the weight loss found in the analytical scale and TGA measurements are caused by the loss of organic
components (Chapter 3.2.1). The related carbonate peaks between 1400 and 1650cm-1 diminished with
increasing temperature, and a principal loss of organic components and lattice carbonates in dentine
was seen at 900°C. These findings were found to be in accordance with previous studies related to
compositional alterations in burned animal and human bone (Hollund et al., 2013, Mkukuma et al.,
2004, Thompson et al., 2009).
In a novel approach, real-time FTIR allowed evaluating the destruction of the carbonates derived from
organic phase (e.g. collagen matrix, cell proteins) and lattice carbonates (i.e. carbonate substitutions in
the HAp structure) during the heating process up to 400°C. Peaks related to collagen and cell proteins

124
diminished by up to 67% during the heating process, with effects seen on these peaks as early as 60°C.
Denaturation and alterations of the collagen appearance between 60 and 100°C were previously
reported in heat-affected bone (Fernandez Castillo et al., 2013a, Fernandez Castillo et al., 2013b,
Holden et al., 1995). In contrast, peaks related to lattice carbonates were less affected by the heat
(maximum 22% decrease of peak height) and stable up to 280°C.
The possible preservation of DNA in heat-affected teeth has been previously studied, with the purpose
of supporting the fire victim identification process (Barker et al., 2008, da Silva et al., 2012, Duffy et
al., 1991, Rees and Cox, 2010). In the present work it was shown that small quantities of organic
components related to collagen and cell proteins were still present after the heating up to 400°C.
Nonetheless, the performed measurements of the present study can neither implicate the presence nor
the quality of DNA. As the knowledge on DNA preservation is crucial to eventually facilitate
comparative DNA analysis in cases involving burned and fragmented remains (Interpol, 2009,
Williams et al., 2004), further insight could be gained by using high-performance liquid
chromatography (HPLC) or TGA coupled mass-spectrometry (TGA-MS) approaches.
7.4. Surface colour alterations
Surface colour alterations, one of the most noticeable macroscopic feature of heat-affected teeth, has
been attributed to the loss of organic constituents in dental tissues and combustion of other chemical
groups of hydroxyapatite (Berzina-Cimdina and Borodajenko, 2012, Endris and Berrsche, 1985,
Fairgrieve, 2008, Herrmann, 1972, Mayne-Correira, 1997, Moreno et al., 2009, Shipman et al., 1984,
Thompson, 2005).
Discolouration towards dark brown and black was seen in the 400°C test groups, and after 5min
exposure at 500°C. Herrmann (1972) proposed that this initial black discolouration was due to the
degradation of carbonates. This could be confirmed by the ATR- and real-time FTIR measurements
that showed that the level of carbonates derived from organic structures decreased during the heating
process up to 400°C, accompanied by a black discolouration of the tooth cross-section around 340°C.

125
Between 500 and 600°C shades of brown were observed, which might be caused by further
degradation of organic constituents, combined with the combustion of other chemical groups of HAp
(Berzina-Cimdina and Borodajenko, 2012). The analytical scale, TGA and FTIR results all indicated
that the weight loss process and loss of organic constituents was still in progress around 600°C.
Light grey and white discolourations were observed in most test groups at and above 700°C and were
previously associated with the principal loss of organic constituents (Herrmann, 1972, Moreno et al.,
2009, Shipman et al., 1984). The analytical scale results of the present work showed that at a
temperature of ≥700°C, a plateau of maximum weight loss around 30.5% was reached (range: 27.1 to
34.1%). The dark grey patches present above 700°C did not appear as glossy as the discolourations
observed in the 400°C 15 to 45min and 500°C 5min groups, and are likely to be caused by organic
remnants, substitutions in the HAp structure, reduced oxygen availability or possible contaminants
inside the furnace.
The overall trends in surface colour alterations correspond with previous observations of isolated
human teeth exposed to incrementally increase or constant exposure to elevated temperatures (Beach
et al., 2008, Karkhanis and Franklin, 2009, Merlati et al., 2002, Moreno et al., 2009, Savio et al.,
2006). Nonetheless, a dependency of the surface colour alterations on the duration of heat exposure,
the heating regime and soft tissue protection was found. Particularly at temperatures below 800°C, the
duration of heat exposure and heating regime strongly influenced the colour changes, which would
lead to miss-classification using colour-chart based systems proposed by Shipman et al. (1984) and
Karkhanis and Franklin (2009). A constant exposure at 400°C for 5min and incremental increase to
400°C led to a dark yellow/brown discolouration of the root (7.8 to 11.4% weight loss). In contrast, all
other 400°C test groups (15, 30, 45min constant exposure, overnight cooling and soft tissue
protection) resulted in a glossy dark grey/black appearance (16.1 to 20.2% weight loss). Similar
observations were made for the 500 and 600°C 5min constant exposure groups, which appeared
similar in root surface colour to the subordinate 15 to 45min constant exposure groups (Figure 4.1).
But also at higher temperatures, surface colour alterations were very diverse, mainly reflected in the

126
weight loss data (e.g. 700°C groups, 20.1 to 30.5% weight loss). At and above 900°C, the weight loss
was less influenced by the heating regime, also resulting in more uniform colour appearance.
Quantitative colorimetric measurements using calibrated digital photographs provided a standardised
and objective way to document and compare these colour alterations. To evaluate whether certain
colours could be used to deduce a temperature range, hierarchical cluster analyses were performed. It
could be shown that 99% of colours present in the 28 duration test groups had a ΔE of more than 2.3,
and could theoretically be differentiated as separate colours by normal human vision. Nonetheless,
many colours within a group and between groups might appear very similar. By grouping the colours
of the 28 duration test groups into five clusters, overall trends in the surface colours could be
visualised (Figure 4.10). The majority (71.7%) of the colours were grouped into two big clusters.
These two clusters mainly incorporated tones of grey and brown that were present in 79 to 100% of
the 28 duration test groups and therefore could not be accurately associated with a distinct temperature
range. A separate cluster was formed by dark yellow/brown discolourations which were only present
in the 400°C 5min constant exposure group. The fact that this cluster only consists of one temperature
group can be ascribed to the short heat exposure and lack of experimental groups below 400°C. An
additional cluster including shades of dark grey and black consisted mainly of colours from the 400°C
15 to 45min and 500°C 5min groups (86%), associated with the degradation of carbonates. Light
grey/white discolourations made up another cluster, and were derived from temperature group of
700°C or above, linked to the predominant loss of organic constituents in dentine.
The hierarchical cluster analysis of the colours present in the test groups of the various heating
regimes and soft tissue protection revealed similar trends as the duration test groups (Figure 4.18).
Only one of the four clusters could be clearly associated with a distinct temperature range, containing
variations of light grey/white, predominantly derived from the 700 and 900°C test groups.
The hierarchical cluster analysis based on quantitative colorimetric measurements was intended to
evaluate whether information on the temperature could be elicited based on 16 representative colours

127
per experimental group. At the current stage of research the computational analysis only indicated
three main colour transition stages that can clearly be associated with temperature ranges.
At short exposures to 400°C or below, the root surface colour changed from the natural pale yellow
towards a dark yellow/brown. The analytical scale, TGA and FTIR results of the present study
indicated an initial loss of organic structures at this stage. With prolonged exposures (15 to 45min) at
400°C or 5min exposure at 500°C the root surface showed a glossy dark grey/black discolouration.
This stage can be associated with the degradation of carbonates. Finally, at prolonged exposures at and
above 700°C the root surface colour became predominantly light grey/white, which is related to the
principal loss of all organic material and lattice carbonates.
Besides a simple description of colours, various researchers used colour reference charts for the
documentation and description of surface colour alterations and estimation of temperature exposure
(Beach et al., 2008, Endris and Berrsche, 1985, Karkhanis and Franklin, 2009, Muller et al., 1998,
Shipman et al., 1984). The description and approach to determine matching colours is highly
subjective and dependent on various external factors, such as the positioning of the observer or the
illuminant. Therefore, a more standardised and objective way to document and compare these colour
alterations using quantitative colorimetric measurements of calibrated digital photographs was tested.
The usage of the Gretag Macbeth Color Checker Chart in combination with the ‘Chart White Balance’
plugin (van der Haeghen and Naeyaert, 2006) ensured an appropriate and repeatable calibration tool.
Nonetheless, shadows caused by the curvature of the tooth surface, reflections caused by glossy
surfaces, superficial cracks and fractures may also influence the colour analysis. A colour reduction of
the original images was necessary to facilitate the computational analysis of the images.
Representative colour palettes containing 16 colours per experimental group were computed, which
showed similar trends in colour entropy as the original images (Figures 4.6 and 4.7).
One of the aims of the quantitative colorimetric measurements was to create improved colour palettes
that could be used in daily forensic practice or as part of archaeological excavations to determine the

128
temperature range of heat-affected teeth. Analysing colours from calibrated photographs proved to be
a practical way of quantitatively determine heat-induced colour alterations; however the significant
influence due to duration heating regime did not allow clear distinction of temperatures. That indicates
temperature specific colour palettes should only be used with precaution. Although upon visual
inspection certain temperature-dependent trends in colour changes were observed, the currently used
computational analysis did not reveal these sufficiently (e.g. differences in brown tones at 500 and
600°C). Previous studies using the ‘Munsell Soil Colour Chart’ or similar colour catalogues, or other
colorimetric approaches (digitalised photographs, flatbed scanners, spectrophotometry) to correlate
surface colour alterations with temperature ranges were solely based on one duration at the individual
temperature steps (Beach et al., 2008, Endris and Berrsche, 1985, Fereira et al., 2008, Karkhanis and
Franklin, 2009, Shipman et al., 1984, Walker et al., 2008). The colour entropy in the 15 to 45min
constant exposure groups at and above 500°C indicated more homogeneous colour changes.
Nonetheless, only aforementioned general trends were found in the hierarchical cluster analysis
providing a rough estimation of a cremation temperature range, and are not suitable for precise
temperature estimation.
Overall, the observations of surface colour alterations indicate that the tissue temperature may play a
more important role than the temperature of the surrounding air. This would also explain why the
protection by oral soft tissue and the alveolar bone socket cause a non-uniform colour appearance of
the heat-affected teeth by hindering the heat transfer towards the dental tissue (Lain et al., 2011). In
order to further understand the influence of temperature, duration and heating regimes on surface
colour alterations, investigations using constant exposure times below 5min are proposed. Moreover,
the role of the furnace used (i.e. the size of the heating chamber), the presence of contaminants or fire
accelerants as well as other external factors (e.g. oxygen availability) and their influence on the surface
colours still needs further investigation. Advanced analytical approaches using more elaborate
methods of cluster analysis might additionally be useful to classify the colours in a different way,
revealing more specific colour patterns.

129
7.5. Shrinkage
In addition to morphological, compositional and colour alterations, heat-induced shrinkage has also
been previously reported for teeth (Maples and Browning, 1995, Norrlander, 1995, Shipman et al.,
1984). Whilst the rate of shrinkage for heat-affected bone has been previously investigated, no precise
quantitative data on the dimensional changes of human teeth has been available (Großkopf, 2004,
Wahl, 1982). The results regarding the volumetric shrinkage of dentine indicated that minor
dimensional changes already occurred at 400°C (4.8%), with a major increase between 700 and 800°C
(11.5 to 24.2%). The initial shrinkage at 400 and 500°C (4.8 to 5.9%) is possibly caused by the heat-
induced dehydration and initial loss of the organic matrix that contains the HAp crystals. Between 500
and 700°C (5.9 to 11.5%) the shrinkage is likely to be related to a combination of the destruction of
organic structures and dimensional changes of the crystalline structures, whilst above 700°C (24.2 to
32.5%) sintering and re-crystallisation of HAp crystallites leads to major dimensional changes
(Shipman et al., 1984, Thompson, 2005). Although the in situ X-ray scattering experiment indicated
that crystallite dimensions in dentine started to increase between 470 and 500°C, the effects only
became measurable at a microscopic level at higher temperatures. It could also be shown that in the
700 and 900°C overnight groups a prolonged exposure to elevated temperatures led to a significantly
increased rate of shrinkage (Figure 5.4). In contrast, at 400°C the overnight cooling did not lead to
changes in the shrinkage rate. Additional research is needed to clarify what influence prolonged
durations of heat exposure would have on the rate of shrinkage between 500 and 700°C.
Literature values on the heat-induced shrinkage of bone range between 0.5 and 27% (Buikstra and
Swegle, 1989, Großkopf, 2004, Thompson, 2005, Ubelaker, 2009). This large variation might be
possibly due to the fact that previous authors did not clearly disclose whether 3-D (volumetric) or 2-D
shrinkage had been reported. Whilst the volumetric shrinkage for teeth ranged from 4.8 to 32.5%, the
corresponding 2-D shrinkage was only between 2.8 and 10.2%. The documentation of dental
shrinkage at temperatures as low as 400°C can be attributed to the more precise nature of the micro-
CT approach, as earlier studies assessed shrinkage of bone only using calliper measurements (Shipman

130
et al., 1984, Thompson, 2005). Nevertheless, similar to bone (Thompson, 2005), major dimensional
changes were associated with temperatures around 800°C. In the last few years micro-CT has been
increasingly used in forensic sciences (Baglivo et al., 2013, Chang et al., 2000, Rutty et al., 2013,
Thali et al., 2003). Clinical CTs have been recently used by Bassed and Hill (2011) to estimate the
dental age of fire victims, however the current resolution (voxel size of 1mm) and the lack of metal
artefact reduction algorithms prevent a detailed analysis of dental morphology. Woisetschläger et al.
(2011) used a high-resolution CT (voxel size of 0.1mm) to analyse alterations in grey values of filling
materials and dental tissues of isolated human teeth. The findings of these two studies suggest that
high-resolution CTs could be useful for the identification of fire victims. Although high-resolution
CTs would also be able to detect dimensional changes at elevated temperatures, currently only micro-
CT offers a sufficient resolution to analyse the precise shrinkage rate and morphological alterations.
Nonetheless, the gold standard for fire victim identification remains comparative dental radiography
using panorama, bite wing or single radiographs. The intention of evaluating the rate of shrinkage was
also to clarify the implications for the daily forensic practice (Bernstein, 1998, Bush and Bush, 2011,
Chang et al., 2000, Hill et al., 2011b, Lain et al., 2011, Merlati et al., 2004, Savio et al., 2006).
Overall, the results of the present work show that shrinkage below 800°C is very small (2-D shrinkage
≤5.1%), and is unlikely to be detectable on standard digital radiographs. At temperatures associated
with predominant light grey/white discolouration (≥800°C), shrinkage becomes visible in digital
radiographs and should be implemented into the standard procedure for the identification of heat-
affected dental remains (Fairgrieve, 2008).

131
7.6. Crystalline alterations
The quantitative analytical approach based on synchrotron radiation, combining SAXS and WAXS
allowed the determination of the local crystalline alterations in a tooth cross-section rather than a
volume-weighted averaged measurement of pulverised samples. In general, the heating process led to
a variation in mean crystallite thickness, alignment and shape in dental tissues. Only a small variation
in the SAXS/WAXS measurements in longitudinal line scans as well as the grid mapping was found,
indicating a relatively uniform thermal behaviour of the samples. This may be attributed to the
dimensions of the tooth sections (0.5 to 1mm thickness) and chosen heating protocol. Entire teeth are
expected to exhibit a non-uniform thermal diffusion (i.e. temperature gradient from surface to pulp
cavity) and therefore may show spatial variation in heat-induced crystalline changes.
Due to the limited size of the detector used, only the (002) peak data could be interpreted, which has
been previously associated with the diffraction by HAp crystallites (Reyes-Gasga et al., 2008). At
lower temperatures (400 to 600°C) no significant changes in the (002) peak were observed in dentine.
The predominant loss of the organic matrix which supports the mineral phase led to a higher degree of
perfection of the HAp crystallites between 700 and 800°C, visible as sharper and stronger peaks. At
and above 800°C sintering of the crystallites led to a significant growth and sharpening of the WAXS
peaks. Similar phenomena have been reported for XRD heating experiments on animal bone and teeth
(Greenwood et al., 2012, Hiller et al., 2003, Piga et al., 2009, Rogers and Daniels, 2002, Shipman et
al., 1984).
Besides the sintering of the crystallites, a mineral phase change from HAp [Ca5(PO4)3(OH)] to TCP
[Ca3(PO4)2] has been reported in XRD studies of bone heated at 900°C (Beckett et al., 2011,
Herliansyah et al., 2009). The ex situ synchrotron X-ray scattering experiment did not reveal a mineral
phase change in dentine or enamel when heated for 30min at 900°C, possibly relating to the high
dependency of the mineral phase change on the sintering temperature and duration of heat exposure
(Hiller et al., 2003, Reyes-Gasga et al., 2008).

132
Crystalline degree of alignment
In accordance with earlier SAXS results, the control samples showed a more disordered orientation of
HAp crystallites in dentine than enamel (Jiang et al., 2005). The longitudinal line scans as well as the
grid mapping of the ex situ samples showed a tissue-dependent variation in the degree of alignment. A
major drop in the alignment was observed in the dentine adjacent to the dentine-enamel junction,
whilst in the deeper dentine, the degree of alignment appeared less variable. This observation can be
related to the gradient properties of dentine reported by Tesch et al. (2001) and can be explained as the
optimisation of the mechanical functions of dentine (Marten et al., 2010). The gradual disappearance
of the organic matrix may explain the decrease of the degree of alignment, where a trend towards more
random orientation with increasing temperatures was found in dentine and enamel. The overall
reduction of the degree of alignment in dental tissues during the heating process may be associated
with the arrangement of the crystallites, as well as the changes in crystallite dimensions and shape at
elevated temperatures (Greenwood et al., 2012, Hiller et al., 2003, Pramanik et al., 2013).
The real-time synchrotron SAXS experiments showed a stable degree of alignment ranging from room
temperature up to 280°C in dentine, corresponding to the absence of crystallite rotation or growth.
Once the organic components degraded (280 to 370°C), a small increase in the crystalline degree of
alignment was noted in dentine. This temperature range also reflected in a slight increase of mean
crystallite thickness, which may correspond to a gradual expansion of organic matrix leading to a
compression of the crystal structure (Sui et al., 2014b). Between 370 and 700°C the degree of
alignment decreased slowly, most likely due to the gradual loss of supporting organic components.
Above 700°C the predominant loss of the structural organic components caused the collapse and
rearrangement of crystallites, which might be associated with rotations and the anisotropic (i.e. non-
uniform) sintering of hydroxyapatite crystallites.

133
Crystallite shape
The changes of crystallite shape were determined using SAXS data interpretation. At room
temperature, dentine showed a needle-like morphology, gradually increasing to more platelet-like at
400 to 500°C and finally to a polydisperse morphology at 600 to 900°C. In contrast to dentine, enamel
showed polydisperse morphology in all test groups (RT to 800°C). The precise polydisperse crystallite
morphology that was found at elevated temperatures could be determined by the simplistic needle or
platelet model used in this study (Hiller et al., 2003). The heat-induced shape changes of HAp
crystallites were previously shown in a transmission electron microscopy (TEM) study by Reiche et al.
(2002). Although on a different scale, the shape alterations are also in accordance with SEM results
showing more complex appearance of the crystals and sintering of the mineral structure above 700°C
(Holden et al., 1995, Shipman et al., 1984).
Mean crystallite thickness
The mean crystallite thickness of the control samples is consistent with previously reported TEM and
XRD results (Piga et al., 2009, Reiche et al., 2002). The SAXS-derived increase of the mean crystallite
thickness was found to be 2.8-fold in dentine (RT to 900°C) and 1.4-fold (RT to 800°C) in enamel.
These results were emphasised by the corresponding WAXS data derived from the width at half
maximum (FWHM) variation ratio. This ratio indicated that crystallites appear 3.3-fold larger in
dentine (at 900°C) and 1.3-fold larger in enamel (at 800°C) compared to the control sample. In
general, the small increase in mean crystallite thickness for enamel may be due to a more dense
arrangement of hydroxyapatite crystallites compared to dentine, allowing only a limited increase in
size. A 3.7-fold increase of average crystallite size (RT to 900°C) was previously reported when
analysing pulverised teeth using XRD, however the independent contributions of dentine and enamel
were not taken into account (Piga et al., 2009). In bone, previous SAXS studies indicated a 5 to 10.7-
fold increase of mean crystallite thickness between room temperature and 900°C (Etok et al., 2007,
Hiller et al., 2003). These discrepancies may be related to the structural difference between bone and

134
dental tissues, prolonged heat exposure used in these studies (45min to 6h) as well as grinding as part
of the sample preparation process (Etok et al., 2007, Hiller et al., 2003, Piga et al., 2009).
The real-time synchrotron SAXS measurements provided a further understanding of the thermal
kinetics, as it allowed documenting a complete and continuous evolution of the crystalline structure
during the heating process. Moreover, the influence of the heating regime on the mean crystallite
thickness could be evaluated. A temporal increase of the mean crystallite thickness was observed
between 325 and 375°C which may be due to a gradual expansion of organic components leading to a
compression of the crystallites (Sui et al., 2014b). A steep increase in mean crystallite thickness was
observed between 470 and 500°C with maxima found between 770 and 820°C, which were
independent of the heating protocol. Overall, a 2.6 to 3.5-fold increase of the mean crystallite
thickness between RT and 900°C was observed, confirming the results of the ex situ synchrotron X-
ray scattering experiment. To keep the real-time results comparable to ex situ results, a constant
volume fraction was considered. The volume fraction describes the fraction of particles within the
volume created by the X-ray beam transmitting through the sample. However, as the TGA, FTIR and
micro-CT experiments indicate, the volume fraction is likely to change due to the loss of organic
constituents, sintering of the crystallites and overall shrinkage of dentine. By using a refined analytical
approach and advanced computational model, a more detailed understanding of the heat-induced
changes of the crystallite size could be computed which would lead to a creation of reference values
for heat-affected dental tissues(Sui et al., 2014b).
Overall, the synchrotron-based SAXS/WAXS experiments support previous lab-based studies that
characterised the heat-induced alterations of crystallite size in archaeological and experimentally
altered animal bone and teeth (Etok et al., 2007, Hiller and Wess, 2006, Piga et al., 2009). Moreover,
the results of the present work emphasise the need to investigate bone and dental tissues separately, as
they appear to react differently on a crystalline level (Greenwood et al., 2012, Hollund et al., 2013,
Piga et al., 2008, Shipman et al., 1984).

135
Chapter 8 - Conclusions

136
The overall aim of the present work was to investigate the influence of duration of heat exposure and
heating regimes regarding the macroscopic, compositional, structural and crystalline alterations of
dental tissues, which was addressed with a range of combined novel analytical approaches.
The investigation of heat-induced destruction of organic components using high-precision
measurements of weight loss and compositional alterations revealed a strong dependency on the
duration of heat exposure and the heating regime. This dependency was also reflected in the variation
of surface colour alterations. Below 800°C, the duration of heat exposure strongly influenced the
surface colour alterations. Walker et al. (2008) have previously showed that a combination of multiple
conditions in the cremation environment (e.g. duration, temperature and oxygen availability)
determine the extent of the surface colour alterations. Additional factors, such as the fast increase or
fluctuation of temperature as well as the presence of contaminants are likely to have effects on the
surface colour alterations of dental tissues. Overall, as established here by quantitative colorimetric
measurements, surface colour alterations are assumed to be of minor value for forensic investigations
as only rough estimations of the cremation temperature range can be achieved.
A more precise determination of the cremation temperature is possible using the analysis of crystalline
alterations of hydroxyapatite. A temperature-dependent increase of the mean crystallite thickness of
HAp in dentine and enamel was found to start around 500°C, independently of the chosen heating
regime. Whilst the access to synchrotron facilities is limited for routine forensic work, especially the
mean crystallite thickness results can also be utilised as reference values for the more commonly used
lab-based XRD and SAXS approaches. This would benefit the examination of isolated dental remains
to determine the circumstances of cremation during forensic investigations. For example, wooden
campfires do normally not reach more than 700°C, so if an increased crystallite size this could mean
that fire accelerants might have been used during the attempt to dispose a body.
The combination of real-time analytical approaches also gave an insight into the kinetics of the heating
process. The gradual degradation of carbonates derived from the structural organic components caused

137
a dark grey/black discolouration around 400°C and are also believed to cause some initial shrinkage.
Between 400 and 500°C the differential expansion of the denaturing organic material in combination
with initial shrinkage, is likely to lead to the failure of the dentine-enamel junction. Finally, the
combination of crystalline alterations and loss of organic constituents led to an increased rate of
shrinkage between 700 and 800°C.
The results of the present work also gave important implications for the daily forensic practice of fire
victim identification. The heat-induced dehydration and loss of organic constituents led to a fragile
nature of the teeth that required careful handling. It was found to be pivotal to follow the guidelines
given by Hill et al. (2011b) to preserve dental structures. The experimental results showed the
principal loss of organic constituents between 660 and 825°C, reinforcing the importance of
comparative dental radiography for fire victim identification. The ‘popping off’ of the enamel
necessitates focussing on other morphological features found in panorama, bite wing or single
radiographs. Although cracks and fractures occurred, the root curvature and pulpal morphology was
overall well preserved at elevated temperatures. Predominately light grey/white discolouration
(≥800°C) can also be associated with the visibility of shrinkage in digital radiographs. As comparative
radiography forms a cornerstone of fire victim identification, the rates of shrinkage should be kept in
mind when matching antemortem dental records and postmortem findings during forensic
investigations.
Overall, the findings resulting from the present work have to be considered in the fire victim
identification process and as they eventually facilitate the identification in cases where only dental
remains are present.

138
Chapter 9 - Future Work

139
In previous studies, factors such as the protection of soft and hard tissues, fast increase of temperature,
fast cooling due to fire extinguishing agents or the presence of contaminants have generally not been
taken into account by lab-based research and it is possible that they might have important effects on
the changes observed in dental tissues (Muller et al., 1998). Therefore, future research on this subject
should primarily focus on the influence of further heating regimes (e.g. short heat exposures) and the
presence of protective hard- and soft tissue to allow more precise conclusions regarding the
characterisation of the associated alterations.
Besides the investigation of the influence of external factors, further advances are likely to be made in
the documentation and recovery of heat-affected dental remains. Recent studies by Waterhouse
(2013a, 2013b) on the influences of weather factors on the post-burning fragmentation of skeletal
remains imply the necessity for a careful and prompt recovery of dental remains. Although recovery
protocols have been proposed, further studies on the optimisation of the stabilisation and
transportation process could help to preserve dental material. Portable handheld X-ray systems (e.g.
NOMAD Pro, Aribex Inc.) would be beneficial to document the dental remains already on-site.
Moreover, 3-D laser scanning could be used to document the location of dental remains at crime
scenes in order to reconstruct the circumstances of the heating event (Sandholzer et al., 2013). Due to
the wide availability, conventional radiography will always be a cornerstone of dental identification,
nonetheless over the next decades CT imaging is likely to gain importance for the dental identification
of fire victims. Mobile CT scanner units, which already form part of the equipment of disaster victim
identification teams, could additionally help to document human remains and support the
identification process (Bassed et al., 2011, Bassed and Hill, 2011, O'Donnell et al., 2011, Rutty et al.,
2009). With an increasing number of medical and dental CT scans performed during the life time,
computer assisted systems are likely to be used after disasters to facilitate victim identification
(Campobasso et al., 2007).
Technical innovations will further shed light on the heat-induced alterations in dental tissues and
dental materials. A database of dental materials based on XRF and EDS measurements, as proposed
140
by Bush and Bush (2011), could support the identification process by providing reference values for
dental materials used worldwide. Future research to study the preservation of proteins related to DNA,
could be carried out by using HPLC or TGA-MS. These techniques would allow an insight into the
components that are destroyed during the heating process and give a more detailed idea of DNA
preservation.
Moreover, synchrotron-based X-ray scattering has shown to be a viable approach to support the
estimation of the cremation temperature. Lab-based SAXS/WAXS investigations using heating
chambers would allow the usage of a larger sample size and provide an improved understanding on the
effects of heat on the crystalline structures. Additionally, future developments in the setup for
synchrotron-based investigations would allow further investigating of thermal crystallisation kinetics
of dental tissues. For example, 3-D SAXS tomography could provide a more precise indication of the
changes in crystal dimension, orientation and morphological alterations.
Finally, future research should include the investigation of various external factors (e.g. soft and hard
tissue protection, contaminants) and perform additional analytical experiments (e.g. high-speed X-ray
filming, HPLC, MS-TGA, in situ SAXS/WAXS) to further understand the macroscopic,
compositional, structural and crystalline alterations of heat-affected dental tissues. Such lab-based
results should ideally be compared to dental remains derived from other experimental (e.g. crematoria-
based) studies and forensic settings. Ultimately, it is hoped that this will allow reconstructing the
circumstances of the heating event and further facilitate the odontological identification process of fire
victims.

141
Chapter 10 - References

142
ADAMS, B. J. 2003a. The diversity of adult dental patterns in the United States and the implications for personal identification. J Forensic Sci, 48, 497-503.
ADAMS, B. J. 2003b. Establishing personal identification based on specific patterns of missing, filled,
and unrestored teeth. J Forensic Sci, 48, 487-496. AL-AMAD, S. H., CLEMENT, J. G., MCCULLOUGH, M. J., MORALES, A. & HILL, A. J. 2007.
Evaluation of two dental identification computer systems: DAVID and WinID3. J Forensic Odontostomatol, 25, 23-29.
AL-JAWAD, M., ADDISON, O., KHAN, M. A., JAMES, A. & HENDRIKSZ, C. J. 2012. Disruption
of enamel crystal formation quantified by synchrotron microdiffraction. J Dent, 40, 1074-1080.
ALQAHTANI, S. J., HECTOR, M. P. & LIVERSIDGE, H. M. 2010. Brief communication: The
London atlas of human tooth development and eruption. Am J Phys Anthropol, 142, 481-490. ANDERSEN, L., JUHL, M., SOLHEIM, T. & BORRMAN, H. 1995. Odontological identification of
fire victims--potentialities and limitations. Int J Legal Med, 107, 229-234. ANDERSON, S. G. S., BERNSTEIN, M., BERRYMAN, H. E. & BOWERS, C. M. 2007. Human
identification. In: HERSCHAFT, E. E., ALDER, M. E., ORD, D. K., RAWSON, R. D. & SMITH, E. S. (eds.) Manual of Forensic Odontology. 4th ed. Boca Raton: CRC Press.
BAGLIVO, M., WINKLHOFER, S., HATCH, G. M., AMPANOZI, G., THALI, M. J. & RUDER, T.
D. 2013. The rise of forensic and post-mortem radiology - Analysis of the literature between the year 2000 and 2011. J Forensic Radiol Imaging, 1(1), 3-9.
BARKER, C., COX, M., FLAVEL, A., LAVER, J., LEWIS, M. & MCKINLEY, J. I. 2008. Mortuary
procedures III - Skeletal analysis 2: Techniques for determining identity. In: COX, M., FLAVEL, A., HANSON, I., LAVER, J. & WESSLING, R. (eds.) The Scientific Investigation of Mass Graves: Towards Protocols and Standard Operating Procedures. Cambridge: Cambridge University Press.
BARTHEL, K. U. 2007. 3D Color Inspector/Color Histogram [Online]. Available:
http://rsb.info.nih.gov/ij/plugins/color-inspector.html [Accessed 15.09.2013]. BASSED, R. B., BRIGGS, C. A. & DRUMMER, O. H. 2011. Age estimation using CT imaging of the
third molar tooth, the medial clavicular epiphysis, and the spheno-occipital synchondrosis: A multifactorial approach. Forensic Sci Int, 212, 273.e1-273.e5.
BASSED, R. B. & HILL, A. J. 2011. The use of computed tomography (CT) to estimate age in the
2009 Victorian Bushfire Victims: A case report. Forensic Sci Int, 205, 48-51. BASTIAAN, R. J. 1984. Dental identification of the Victorian bushfire victims. Aust Dent J, 29, 105-
110. BEACH, J. J., PASSALACQUA, N. V. & CHAPMAN, E. N. 2008. Heat-related changes in tooth
color: Temperature versus duration of exposure. In: SCHMIDT, C. & SYMES, S. (eds.) The Analysis of Burned Human Remains. 1st ed. San Diego: Academic Press.
BECK, J. J. W. 2011. What is the future of imaging in forensic practice? Radiography, 17, 212-217.

143
BECKETT, S., ROGERS, K. D. & CLEMENT, J. G. 2011. Inter-Species Variation in Bone Mineral Behavior upon Heating. J Forensic Sci, 56, 571-579.
BERKETA, J. 2014. Maximizing postmortem oral-facial data to assist identification following severe
incineration. Forensic Sci Med Pathol, 10(2), 208-216. BERKETA, J., JAMES, H. & MARINO, V. 2011. Dental implant changes following incineration.
Forensic Sci Int, 207, 50-54. BERKETA, J. W., HIRSCH, R. S., HIGGINS, D. & JAMES, H. 2010. Radiographic Recognition of
Dental Implants as an Aid to Identifying the Deceased. J Forensic Sci, 55, 66-70. BERMAN, G. M., BUSH, M. A., BUSH, P. J., FREEMAN, A. J., LOOMIS, P. W. & MILLER, R. G.
2013. Dental Identification. In: SENN, D. R. & WEEMS, R. A. (eds.) Manual of Forensic Odontology. 5th ed. Boca Raton, FL, USA: CRC Press.
BERNSTEIN, M. 1998. Radiologic Applications in Forensic Dentistry. In: BROGDON, B. (ed.)
Forensic Radiology. 1st ed. Boca Raton: CRC Press. BERZINA-CIMDINA, L. & BORODAJENKO, N. 2012. Research of Calcium Phosphates Using
Fourier Transform Infrared Spectroscopy. In: THEOPHANIDES, T. (ed.) Infrared Spectroscopy - Materials Science, Engineering and Technology. InTech.
BOHNERT, M. 2007. Kraftfahrzeugbrand. Rechtsmedizin, 17, 175-186. BOHNERT, M., ROST, T. & POLLAK, S. 1998. The degree of destruction of human bodies in
relation to the duration of the fire. Forensic Sci Int, 95, 11-21. BONAVILLA, J. D., BUSH, M. A., BUSH, P. J. & PANTERA, E. A. 2008. Identification of
incinerated root canal filling materials after exposure to high heat incineration. J Forensic Sci, 53, 412-418.
BOTHA, C. T. 1986. The dental identification of fire victims. J Forensic Odontostomatol, 4, 67-75. BOYDE, A. 1989. Enamel. In: BERKOVITZ, B. K. B., BOYDE, A., FRANK, R. M., HÖBLING, H.
J., MOXHAM, B. J., NALBANDIAN, J. & TOGE, C. H. (eds.) Teeth. 1 ed. Berlin: Springer. BRANDAO, R. B., MARTIN, C. C., CATIRSE, A. B., DE CASTRO, E. S. M., EVISON, M. P. &
GUIMARAES, M. A. 2007. Heat induced changes to dental resin composites: a reference in forensic investigations? J Forensic Sci, 52, 913-919.
BROUGH, M. D. 1991. The king's cross fire. Part 1: the physical injuries. Burns, 17, 6-9. BROWN, W. S., DEWEY, W. A. & JACOBS, H. R. 1970. Thermal properties of teeth. J Dent Res,
49, 752-755. BROWN, W. S., JACOBS, H. R. & THOMPSON, R. E. 1972. Thermal fatigue in teeth. J Dent Res,
51, 461-467. BUIKSTRA, J. E. & SWEGLE, M. 1989. Bone modification due to burning: experimental evidence.
In: BONNISCHEN, R. & SORG, M. H. (eds.) Bone Modification. Orono: Peopling of the Americas Publications, University of Maine.

144
BUSH, M. A. & BUSH, P. J. Dental materials as an aid for victim identification: examination of calcined remains by SEM/EDS. In: POSTEK, M. T., NEWBURY, D. E., PLATEK, S. F. & JOY, D. C., eds., 2010. SPIE, 772914.
BUSH, M. A., BUSH, P. J. & MILLER, R. G. 2006. Detection and classification of composite resins
in incinerated teeth for forensic purposes. J Forensic Sci, 51, 636-642. BUSH, P. J. & BUSH, M. A. 2011. The Next Level in Victim Identification: Materials Properties as
an Aid in Victim Identification. In: BOWERS, C. (ed.) Forensic Dental Evidence. 2nd ed. Amsterdam: Elsevier Academic Press.
CABRERA, J. E. 2013. Texture Analyzer [Online]. Available:
http://rsbweb.nih.gov/ij/plugins/texture.html [Accessed 24/12/2013]. CAMPBELL, M. N. & FAIRGRIEVE, S. I. 2011. Differentiation of traumatic and heat-induced dental
tissue fractures via SEM analysis. J Forensic Sci, 56, 715-719. CAMPOBASSO, C. P., DELL'ERBA, A. S., BELVISO, M. & DI VELLA, G. 2007. Craniofacial
Identification by Comparison of Antemortem and Postmortem Radiographs: Two Case Reports Dealing with Burnt Bodies. Am J Forensic Med Path, 28, 182-186.
CHANG, Y. L., STANFORD, C. M. & KELLER, J. C. 2000. Calcium and phosphate supplementation
promotes bone cell mineralization: Implications for hydroxyapatite (HA)-enhanced bone formation. J Biomed Mat Res, 52, 270-278.
CLEMENT, J. G. 1998. Dental identification. In: CLEMENT, J. G. & RANSON, D. L. (eds.)
Craniofacial identification in forensic medicine. London: Arnold. CORCIA, J. T. & MOODY, W. E. 1974. Thermal Analysis of Human Dental Enamel. J Dent Res, 53,
571-580. CORDNER, S. M., WOODFORD, N. & BASSED, R. 2011. Forensic aspects of the 2009 Victorian
Bushfires Disaster. Forensic Sci Int, 205, 2-7. DA SILVA, R. H. A., QUIEZI, R., BERTOLACINI, C. D. P., CARVALHO, S. P. M., DA
SILVAGASQUE, K. C., DE ALMEIDA-E.-SILVA, C. T. & BICUDO, L. A. R. 2012. Human identification analysis using PCR from the root portion of dental elements under different conditions of temperature and exposure time. RSBO, 9, 67-73.
DENT, A. J., GREAVES, G. N., ROBERTS, M. A., SANKAR, G., WRIGHT, P. A., JONES, R. H.,
SHEEHY, M., MADILL, D., CATLOW, C. R. A., THOMAS, J. M. & RAYMENT, T. 1995. A New Furnace Design for Use in Combined X-Ray-Absorption and Diffraction of Catalysis and Ceramics Studies - Formation from Carbonate Precursors of Cu, Co, Mn Spinels for the Oxidation of Co and the Formation of Plzt, a Piezoelectric Ceramic. Nucl Intstrum Meth B, 97, 20-22.
DEYMIER-BLACK, A. C., ALMER, J. D., STOCK, S. R., HAEFFNER, D. R. & DUNAND, D. C.
2010. Synchrotron X-ray diffraction study of load partitioning during elastic deformation of bovine dentin. Acta Biomater, 6, 2172-2180.
DIJKSTRA, B. K. S. 1938. Die Skelettreste aus dem Kreisgrabenfriedhof von Sleen, Provinz Drente.
Mannus, Zeitschrift fur Vorgeschichte, 30, 548-561.

145
DODWELL, N. 2012. Early Bronze Age Busta in Cambridgeshire? On-Site experiments to investigate the effects of fires and pryes on pits. In: MITCHELL, P. D. & BUCKBERRY, J. (eds.) Proceedings of the Twelfth Annual Conference of the British Association for Biological Anthropology and Osteoarchaeology. Department of Archaeology and Anthropology University of Cambridge 2010. Oxford: Archaeopress.
DOLINAK, D. & MATSHES, E. 2005. Identification. In: MATSHES, E., LEW, E. & DOLINAK, D.
(eds.) Forensic Pathology: Principles and Practice. Amsterdam: Elsevier Academic Press. DUFFY, J. B., WATERFIELD, J. D. & SKINNER, M. F. 1991. Isolation of tooth pulp cells for sex
chromatin studies in experimental dehydrated and cremated remains. Forensic Sci Int, 49, 127-141.
ELLIOTT, J. C. 1994. Structure and Chemistry of the Apatites and Other Calcium Orthophosphates,
Amsterdam: Elsevier. ENDRIS, R. & BERRSCHE, R. 1985. Farbenwandel der Zahnhartgewebe als Zeichen thermischer
Schädigung. Z Rechtsmed, 94, 109-120. ETOK, S., VALSAMI-JONES, E., WESS, T. J., HILLER, J. C., MAXWELL, C., ROGERS, K. D.,
MANNING, D., WHITE, M., LOPEZ-CAPEL, E., COLLINS, M. J., BUCKLEY, M., PENKMAN, K. & WOODGATE, S. 2007. Structural and chemical changes of thermally treated bone apatite. J Mater Sci, 42, 9807-9816.
FAIRGRIEVE, S. 2008. Forensic Cremation: Recovery and Analysis, 1st ed. Boca Raton: CRC Press. FEDOROV, A., BEICHEL, R., KALPATHY-CRAMER, J., FINET, J., FILLION-ROBIN, J. C.,
PUJOL, S., BAUER, C., JENNINGS, D., FENNESSY, F., SONKA, M., BUATTI, J., AYLWARD, S. R., MILLER, J. V., PIEPER, S. & KIKINIS, R. 2012. 3D Slicer as an Image Computing Platform for the Quantitative Imaging Network. July PMID: 22770690. Magn Reson Imaging, 30, 1323-1341.
FEREIRA, J. L., DE FEREIRA, A. E. & ORTEGA, A. I. 2008. Methods for the analysis of hard
dental tissues exposed to high temperatures. Forensic Sci Int, 178, 119-124. FEREIRA, J. L., ORTEGA, A. I., BARRIOS, F. A. & ESPINA-FEREIRA, A. I. 2010. Structural
analysis of the indicators of dental age in hard dental tissues submitted to high temperatures. Acta Microsc, 19, 291-304.
FERNANDEZ CASTILLO, R., UBELAKER, D. H., ACOSTA, J. A. L. & DE LA FUENTE, G. A. C.
2013a. Effects of temperature on bone tissue. Histological study of the changes in the bone matrix. Forensic Sci Int, 226, 33-37.
FERNANDEZ CASTILLO, R., UBELAKER, D. H., ACOSTA, J. A. L., DE LA ROSA, R. J. E. &
GARCIA, I. 2013b. Effect of Temperature on Bone Tissue: Histological Changes. J Forensic Sci, 58, 578-582.
FRANK, R. M. & NALBANDIAN, J. 1989. Structure and Ultrastructure of Dentine. In:
BERKOVITZ, B. K. B., BOYDE, A., FRANK, R. M., HÖBLING, H. J., MOXHAM, B. J., NALBANDIAN, J. & TOGE, C. H. (eds.) Teeth. 1 ed. Berlin: Springer.

146
FRATZL, P., GROSCHNER, M., VOGL, G., PLENK, H., ESCHBERGER, J., FRATZL-ZELMAN, N., KOLLER, K. & KLAUSHOFER, K. 1992. Mineral crystals in calcified tissues: a comparative study by SAXS. J Bone Miner Res, 7, 329-334.
GLATTER, O. & KRATKY, O. 1982. Small angle x-ray scattering, 1st ed. London: Academic Press. GONÇALVES, D., THOMPSON, T. J. U. & CUNHA, E. 2011. Implications of heat-induced changes
in bone on the interpretation of funerary behaviour and practice. J Archaeol Sci, 38, 1308-1313.
GREENWOOD, C., ROGERS, K., BECKETT, S. & CLEMENT, J. 2012. Bone mineral
crystallisation kinetics. J Mater Sci Mater Med, 23, 2055-2060. GRIFFITHS, C. J. & BELLAMY, G. D. 1993. Protection and radiography of heat affected teeth.
Forensic Sci Int, 60, 57-60. GROßKOPF, B. 2004. Leichenbrand. Biologisches und kulturhistorisches Quellenmaterial zur
Rekonstruktion vor- und frühgeschichtlicher Population und ihrere Funeralpraktiken. Disseration, University of Leipzig.
GÜNTHER, H. & SCHMIDT, O. 1953. Die Zerstörung des menschlichen Gebisses im Verlauf der
Einwirkung hoher Temperaturen. Deut Z gerichtl Med, 42, 108-188. HAMMERSLEY, A. P. 1997. FIT2D: An Introduction and Overview [Online]. Available:
http://www.esrf.eu/computing/scientific/FIT2D/FIT2D_INTRO/fit2d.html [Accessed 20/09/2013].
HARSANYI, L. 1975. Scanning eletron microscopic investigation of thermal damage of the teeth.
Acta Morphol Acad Sci Hung, 23, 271-281. HERLIANSYAH, M. K., HAMDI, M., IDE-EKTESSABI, A., WILDAN, M. W. & TOQUE, J. A.
2009. The influence of sintering temperature on the properties of compacted bovine hydroxyapatite. Materials Science & Engineering C-Biomimetic and Supramolecular Systems, 29, 1674-1680.
HERRMANN, B. 1972. Zur Beurteilung von Kohlenstoffverfärbungen bei Leichenbränden.
Ausgrabungen Funde, 17, 275-277. HERSCHAFT, E. E., ALDER, M. E., ORD, D. K., RAWSON, R. D. & SMITH, E. S. 2006. Manual
of Forensic Odontology, 4th ed. Albany: Impress Printing & Graphics. HIGGINS, D. & AUSTIN, J. J. 2013. Teeth as a source of DNA for forensic identification of human
remains: A Review. Sci Justice, 53(4), 433-441. HILL, A. J., HEWSON, I. & LAIN, R. 2011a. The role of the forensic odontologist in disaster victim
identification: Lessons for management. Forensic Sci Int, 205, 44-47. HILL, A. J., LAIN, R. & HEWSON, I. 2011b. Preservation of dental evidence following exposure to
high temperatures. Forensic Sci Int, 205, 40-43. HILLER, J. C., THOMPSON, T. J. U., EVISON, M. P., CHAMBERLAIN, A. T. & WESS, T. J.
2003. Bone mineral change during experimental heating: An X-ray scattering investigation. Biomater, 24, 5091-5097.

147
HILLER, J. C. & WESS, T. J. 2006. The use of small-angle X-ray scattering to study archaeological and experimentally altered bone. J Archaeol Sci, 33, 560-572.
HILLSON, S. 1996. Dental anthropology, 1st ed. Cambridge: Cambridge University Press. HOLAGER, J. 1970. Thermogravimetric examination of enamel and dentin. J Dent Res, 49, 546-548. HOLDEN, J. L., PHAKEY, P. P. & CLEMENT, J. G. 1995. Scanning electron microscope
observations of heat-treated human bone. Forensic Sci Int, 74, 29-45. HOLLUND, H. I., ARIESE, F., FERNANDES, R., JANS, M. M. E. & KARS, H. 2013. Testing an
alternavite high-throughput tool for investigating bone diagenesis: FTIR in attenuated total reflection (ATR) mode. Archaeometry, 55, 507-532.
HUGHES, C. E. & WHITE, C. A. 2009. Crack Propagation in Teeth: A Comparison of Perimortem
and Postmortem Behavior of Dental Materials and Cracks. J Forensic Sci, 54, 263-266. INTERPOL. 2009. Disaster Victim Identification Guide [Online]. Available:
http://www.interpol.int/INTERPOL-expertise/Forensics/DVI-Pages/DVI-guide [Accessed 15/07/2013].
INTERPOL. 2013. Fingerprints [Online]. Available: http://www.interpol.int/INTERPOL-
expertise/Forensics/Fingerprints [Accessed 15/07/2013]. JABLONSKI, N. G. & SHUM, B. S. 1989. Identification of unknown human remains by comparison
of antemortem and postmortem radiographs. Forensic Sci Int, 42, 221-30. JACKOWSKI, C., AGHAYEV, E., SONNENSCHEIN, M., DIRNHOFER, R. & THALI, M. 2006a.
Maximum intensity projection of cranial computed tomography data for dental identification. Int J Legal Med, 120, 165-167.
JACKOWSKI, C., LUSSI, A., CLASSENS, M., KILCHOER, T., BOLLIGER, S., AGHAYEV, E.,
CRISTE, A., DIRNHOFER, R. & THALI, M. J. 2006b. Extended CT scale overcomes restoration caused streak artifacts for dental identification in CT-3D color encoded automatic discrimination of dental restorations. J Comput Assist Tomo, 30, 510-513.
JAIN, A. K. & CHEN, H. 2004. Matching of dental X-ray images for human identification. Pattern
Recogn, 37, 1519-1532. JAMESON, M. W., HOOD, J. A. A. & TIDMARSH, B. G. 1993. The Effects of Dehydration and
Rehydration on Some Mechanical-Properties of Human Dentin. J Biomech, 26, 1055-1065. JIANG, H. D., LIU, X. Y., LIM, C. T. & HSU, C. Y. 2005. Ordering of self-assembled
nanobiominerals in correlation to mechanical properties of hard tissues. Appl Phys Lett, 86, 163901.
JOHANSEN, R. J. & BOWERS, C. 2012. Positive Dental Identification Using Tooth Anatomy and
Digital Superimposition. J Forensic Sci, 58(2), 534-536. KARKHANIS, S. & FRANKLIN, D. 2009. Macroscopic and microscopic changes in incinerated
deciduous teeth. J Forensic Odontostomatol, 27, 9-19. KNIGHT, B. 1984. How radiography aids forensic medicine. Radiography, 50, 5-10.

148
LABORIER, C., BONNETAIN, J. C. & RÖTZSCHER, K. 2004. Das Concorde-Flugzeug-Unglück. Rechtsmed, 14, 11-13.
LAIN, R., TAYLOR, J., CROKER, S., CRAIG, P. & GRAHAM, J. 2011. Comparative dental
anatomy in Disaster Victim Identification: Lessons from the 2009 Victorian Bushfires. Forensic Sci Int, 205, 36-39.
LEI, H. J., LIU, B. & FANG, D. N. 2010. The coefficient of thermal expansion of biomimetic
composite. Frontiers of Materials Science in China, 4, 234-238. LIM, J. J. & LIBOFF, A. R. 1972. Thermogravimetric Analysis of Dentin. J Dent Res, 51, 509-514. LIN, M., LIU, Q. D., KIM, T., XU, F., BAI, B. F. & LU, T. J. 2010a. A new method for
characterization of thermal properties of human enamel and dentine: Influence of microstructure. Infrared Phys Techn, 53, 457-463.
LIN, M., XU, F., LU, T. J. & BAI, B. F. 2010b. A review of heat transfer in human tooth-
Experimental characterization and mathematical modeling. Dent Mater, 26, 501-513. LIN, P. L., LAI, Y. H. & HUANG, P. W. 2012. Dental biometrics: Human identification based on
teeth and dental works in bitewing radiographs. Pattern Recogn, 45, 934-946. LINDBLOOM, B. 2009. Delta E (CIE 2000) [Online]. Available: http://www.brucelindbloom.com/
[Accessed 17/09/2013]. LIPTON, B. E., MURMANN, D. C. & PAVLIK, E. J. 2013. History of Forensic Odontology. In:
SENN, D. R. & WEEMS, R. A. (eds.) Manual of Forensic Odontology. 5th ed. Boca Raton: CRC Press.
MAHNY, M., VANEYCKEN, L. & OOSTERLINCK, A. 1994. Evaluation of Uniform Color Spaces
Developed after the Adoption of Cielab and Cieluv. Color Res Appl, 19, 105-121. MAPLES, W. R. & BROWNING, M. 1995. Dead Men Do Tell Tales: The Strange and Fascinating
Cases of a Forensic Anthropologist, 1st ed. New York: Broadway Books. MARELLA, G. L. & ROSSI, P. 1999. An approach to person identification by means of dental
prostheses in a burnt corpse. J Forensic Odontostomatol, 17, 16-19. MARET, D., PETERS, O. A., DEDOUIT, F., TELMON, N. & SIXOU, M. 2011. Cone-Beam
Computed Tomography: A useful tool for dental age estimation? Med Hypotheses, 76, 700-702.
MARTEN, A., FRATZL, P., PARIS, O. & ZASLANSKY, P. 2010. On the mineral in collagen of
human crown dentine. Biomater, 31, 5479-5490. MATOSO, R. I., BENEDICTO, E. N., DE LIMA, S. H. R., PRADO, F. B., DARUGE, E. &
DARUGE JUNIOR, E. 2013. Positive identification of a burned body using an implanted orthopedic plate. Forensic Sci Int, 229, 168.e1-168.e5.
MAYNE-CORREIRA, P. M. 1997. Fire Modification of Bone: A review of the Literature. In:
HAGLUND, W. D. & SORG, M. H. (eds.) Forensic Taphonomy: The Postmortem Fate of Human Remains. 1st ed. Boca Raton: CRC Press.

149
MCKINLEY, J. I. 2000. The analysis of cremated bone. In: COX, M. & MAYS, S. (eds.) Human Osteology in Archaeology and Forensic Science. 1st ed. London: Greenwich Medical Media.
MECKEL, A. H., GRIEBSTEIN, W. J. & NEAL, R. J. 1965. Structure of mature human dental
enamel as observed by electron microscopy. Arch Oral Biol, 10, 775-783. MERLATI, G., DANESINO, P., SAVIO, C., FASSINA, G., OSCULATI, A. & MENGHINI, P. 2002.
Observations on dental prostheses and restorations subjected to high temperatures: experimental studies to aid identification processes. J Forensic Odontostomatol, 20, 17-24.
MERLATI, G., SAVLO, C., DANESINO, P., FASSINA, G. & MENGHINI, P. 2004. Further study of
restored and un-restored teeth subjected to high temperatures. J Forensic Odontostomatol, 22, 34-39.
MEYER, H. J. 2003. The Kaprun cable car fire disaster - aspects of forensic organisation following a
mass fatality with 155 victims. Forensic Sci Int, 138, 1-7. MINCER, H. H., BERRYMAN, H. E., MURRAY, A. & DICKENS, R. L. 1990. Methods for Physical
Stabilization of Ashed Teeth in Incinerated Remains. J Forensic Sci, 35, 971-974. MKUKUMA, L. D., SKAKLE, J. M., GIBSON, I. R., IMRIE, C. T., ASPDEN, R. M. & HUKINS, D.
W. 2004. Effect of the proportion of organic material in bone on thermal decomposition of bone mineral: an investigation of a variety of bones from different species using thermogravimetric analysis coupled to mass spectrometry, high-temperature X-ray diffraction, and Fourier transform infrared spectroscopy. Calcif Tissue Int, 75, 321-328.
MOODY, G. H. & BUSUTTIL, A. 1994. Identification in the Lockerbie Air Disaster. Am J Forensic
Med Path, 15, 63-69. MORENO, S., MERLATI, G., MARIN, L., SAVIO, C. & MORENO, F. 2009. Effects of high
temperatures on different dental restorative systems: Experimental study to aid identification processes. J Forensic Dent Sci, 1, 17-23.
MULLER, M., BERYTRAND, M. F., QUATREHOMME, G., BOLLA, M. & ROCCA, J. P. 1998.
Macroscopic and microscopic aspects of incinerated teeth. J Forensic Odontostomatol, 16, 1-7.
MURRAY, C. A., BOYD, P. T., YOUNG, B. C., DICKSON, S. D. M. & CURRIE, J. N. W. 2007. A
survey of denture identification marking within the United Kingdom. Brit Dent J, 203, E24. MYERS, S. L., WILLIAMS, J. M. & HODGES, J. S. 1999. Effects of extreme heat on teeth with
implications for histologic processing. J Forensic Sci, 44, 805-809. NOMIR, O. & ABDEL-MOTTALEB, M. 2007. Human Identification From Dental X-Ray Images
Based on the Shape and Appearance of the Teeth. IEEE T Inf Foren Security, 2, 188-197. NORRLANDER, A. L. 1995. Burned and incinerated remains. In: BOWERS, C. M. & BELL, G.
(eds.) Manual of Forensic Odontology. 3rd ed. Ann Arbor: Forensic Press. O'DONNELL, C., IINO, M., MANSHARAN, K., LEDITSCKE, J. & WOODFORD, N. 2011.
Contribution of postmortem multidetector CT scanning to identification of the deceased in a mass disaster: Experience gained from the 2009 Victorian bushfires. Forensic Sci Int, 205, 15-28.

150
PALLAGATTI, S., SHEIKH, S., AGGARWAL, A., GUPTA, R. S. D. & KAUR, A. 2011. Maxillofacial Radiology in Forensic Science. J Forensic Res, 2, 100134.
PATIDAR, K. A., PARWANI, R. & WANJARI, S. 2010. Effects of high temperature on different
restorations in forensic identification: Dental samples and mandible. J Forensic Dent Sci, 2, 37-43.
PIGA, G., MALGOSA, A., THOMPSON, T. J. U. & ENZO, S. 2008. A new calibration of the XRD
technique for the study of archaeological burned human remains. J Archaeol Sci, 35, 2171-2178.
PIGA, G., THOMPSON, T. J. U., MALGOSA, A. & ENZO, S. 2009. The Potential of X-Ray
Diffraction in the Analysis of Burned Remains from Forensic Contexts. J Forensic Sci, 54, 534-539.
PRAMANIK, S., HANIF, A. S. M., PINGGUAN-MURPHY, B. & ABU OSMAN, N. A. 2013.
Morphological Change of Heat Treated Bovine Bone: A Comparative Study. Materials, 6, 65-75.
PRETTY, I. A. 2007. Forensic dentistry: 1. Identification of human remains. Dent Update, 34, 621-
630. PRETTY, I. A., BARSLEY, R. E., BOWERS, C. M., BUSH, M. A., BUSH, P., CLEMENT, J.,
DORION, R., FREEMAN, A. J., LEWIS, J., SENN, D. R. & WRIGHT, F. A. 2013. Odontology - dentistry's contribution to truth and justice. In: UBELAKER, D. H. (ed.) Forensic Science: Current Issues, Future Directions. 1st ed. Hoboken: Wiley-Blackwell.
PRETTY, I. A. & SWEET, D. 2001. A look at forensic dentistry--Part 1: The role of teeth in the
determination of human identity. Brit Dent J, 190, 359-366. PURVES, J. D. 1975. Dental identification of fire victims. Forensic Sci, 6, 217-219. R CORE TEAM. 2013. R: A language and environment for statistical computing [Online]. Available:
http://www.R-project.org/ [Accessed 15/10/2013]. RASBAND, W. S. 1997-2013. ImageJ, U.S. National Institutes of Health, Bethesda, Maryland, USA
[Online]. Available: http://imagej.nih.gov/ij/ [Accessed 12/09/2013]. RASMUSSEN, S. T., PATCHIN, R. E., SCOTT, D. B. & HEUER, A. H. 1976. Fracture Properties of
Human Enamel and Dentin. J Dent Res, 55, 154-164. RAUE, L., GERSDORFF, N., RÖDIGER, M. & KLEIN, H. 2012. New insights in prism orientation
within human enamel. Arch Oral Biol, 57, 271-276. REES, K. A. & COX, M. J. 2010. Comparative Analysis of the Effects of Heat on the PCR-
Amplification of Various Sized DNA Fragments Extracted from Sus Scrofa Molars*. J Forensic Sci, 55, 410-417.
REICHE, I., VIGNAUD, C. & MENU, M. 2002. The crystallinity of ancient bone and dentine: new
insights by transmission electron microscopy. Archaeometry, 44, 447-459.

151
REYES-GASGA, J., GARCÍA-GARCÍA, R., ARELLANO-JIMÉNEZ, M. J., SANCHEZ-PASTENES, E., TIZNADO-OROZCO, G. E., GIL-CHAVARRIA, I. M. & GÓMEZ-GASGA, G. 2008. Structural and thermal behaviour of human tooth and three synthetic hydroxyapatites from 20 to 600 °C. J Phys D Appl Phys, 41, 225407.
RINNERTHALER, S., ROSCHGER, P., JAKOB, H. F., NADER, A., KLAUSHOFER, K. &
FRATZL, P. 1999. Scanning small angle X-ray scattering analysis of human bone sections. Calcif Tissue Int, 64, 422-429.
ROBINSON, J. P., LUMLEY, P. J., CLARIDGE, E., COOPER, P. R., GROVER, L. M., WILLIAMS,
R. L. & WALMSLEY, A. D. 2012. An analytical Micro CT methodology for quantifying inorganic dentine debris following internal tooth preparation. J Dent, 40, 999-1005.
ROGERS, K., BECKETT, S., KUHN, S., CHAMBERLAIN, A. & CLEMENT, J. 2010. Contrasting
the crystallinity indicators of heated and diagenetically altered bone mineral. Palaeogeogr Palaeocl, 296, 125-129.
ROGERS, K. D. & DANIELS, P. 2002. An X-ray diffraction study of the effects of heat treatment on
bone mineral microstructure. Biomater, 23, 2577-2585. ROSSOUW, R. J., GROBLER, S. R., PHILLIPS, V. M. & VAN, W. K. T. J. 1999. The effects of
extreme temperatures on composite, compomer and ionomer restorations. J Forensic Odontostomatol, 17, 1-4.
RUTTY, G. N., BROUGH, A., BIGGS, M. J. P., ROBINSON, C., LAWES, S. D. A. &
HAINSWORTH, S. V. 2013. The role of micro-computed tomography in forensic investigations. Forensic Sci Int, 225, 60-66.
RUTTY, G. N., ROBINSON, C., MORGAN, B., BLACK, S., ADAMS, C. & WEBSTER, P. 2009.
Fimag: The United Kingdom Disaster Victim/Forensic Identification Imaging System. J Forensic Sci, 54, 1438-1442.
SANDHOLZER, M. A., BARON, K., HEIMEL, P. & METSCHER, B. D. 2014. Volume analysis of
heat-induced cracks in human molars: A preliminary study. J Forensic Dent Sci, 6, 53-58. SANDHOLZER, M. A., ERRICKSON, D. & WALTER, B. S. 2013. AAFS 2013: Current issues and
future trends in forensic radiology and imaging. J Forensic Radiol Imaging, 1, 88-90. SANDHOLZER, M. A., SUI, T., KORSUNSKY, A. M., WALMSLEY, A. D., LUMLEY, P. J. &
LANDINI, G. 2014, in press. X-ray scattering evaluation of ultrastructural changes of human dental tissue with thermal treatment J Forensic Sci.
SAVIO, C., MERLATI, G., DANESINO, P., FASSINA, G. & MENGHINI, P. 2006. Radiographic
evaluation of teeth subjected to high temperatures: experimental study to aid identification processes. Forensic Sci Int, 158, 108-16.
SCHINDELIN, J., ARGANEDA-CARRERAS, I., FRISE, E., KAYNIG, V., LONGAIR, M.,
PIETZSCH, T., PREIBISCH, S., RUEDEN, C., SAALFELD, S., SCHMID, B., TINEVEZ, J. Y., WHITE, D. J., HARTENSTEIN, V., ELICEIRI, K., TOMANCAK, P. & CARDONA, A. 2012. Fiji: an open-source platform for biological-image analysis. Nat Methods, 9, 676-682.
SCHMID, B., SCHINDELIN, J., CARDONA, A., LONGAIR, M. & HEISENBERG, M. 2010. A
high-level 3D visualization API for Java and ImageJ. BMC Bioinformatics, 11, 274.

152
SCHMIDT, C. 2008. The recovery and study of burned human teeth. In: SCHMIDT, C. & SYMES, S. (eds.) The Analysis of Burned Human Remains. 1st ed. San Diego: Academic Press.
SCHULLER-GOTZBURG, P. & SUCHANEK, J. 2007. Forensic odontologists successfully identify
tsunami victims in Phuket, Thailand. Forensic Sci Int, 171, 204-207. SCHWARTZ, T. R., SCHWARTZ, E. A., MIESZERSKI, L., MCNALLY, L. & KOBILINSKY, L.
1991. Characterization of deoxyribonucleic acid (DNA) obtained from teeth subjected to various environmental conditions. J Forensic Sci, 36, 979-990.
SCHWEITZER, H. & EICHENHOFER, W. 1980. Temperaturen in der Mundhöhle bei
Verbrennungen mit hohen Temperaturen. Zbl Rechtsmed, 20, 38. SENN, D. R. & WEEMS, R. A. 2013. Manual of Forensic Odontology, 5th ed. Boca Raton: CRC
Press. SHIPMAN, P., FOSTER, G. & SCHOENINGER, M. 1984. Burnt bones and teeth: an experimental
study of color, morphology, crystal structure and shrinkage. J Archaeol Sci, 11, 307-325. SILVA, R., BOTELHO, T., PRADO, F., KAWAGUSHI, J., DARUGE JÚNIOR, E. & BÉRZIN, F.
2011. Human identification based on cranial computed tomography scan — a case report. Dentomaxillofacial Radiology, 40, 257-261.
SQUIRES, K. E., THOMPSON, T. J. U., ISLAM, M. & CHAMBERLAIN, A. 2011. The application
of histomorphometry and Fourier Transform Infrared Spectroscopy to the analysis of early Anglo-Saxon burned bone. J Archaeol Sci, 38, 2399-2409.
SUI, T., SANDHOLZER, M. A., BAIMPAS, N., DOLBNYA, I. P., LANDINI, G. & KORSUNSKY,
A. M. 2013a. Hierarchical modelling of elastic behaviour of human enamel based on synchrotron diffraction characterisation. J Struct Biol, 184, 136-146.
SUI, T., SANDHOLZER, M. A., BAIMPAS, N., DOLBNYA, I. P., WALMSLEY, A., LUMLEY, P.
J., LANDINI, G. & KORSUNSKY, A. M. 2013b. Multiscale modelling and diffraction-based characterization of elastic behaviour of human dentine. Acta Biomater, 9, 7937-7947.
SUI, T., LUNT, A. J., BAIMPAS, N., SANDHOLZER, M. A., HU, J., DOLBNYA, I. P., LANDINI,
G. & KORSUNSKY, A. M. 2014a. Hierarchical modelling of in situ elastic deformation of human enamel based on photoelastic and diffraction analysis of stresses and strains. Acta Biomater, 10, 343-354.
SUI, T., SANDHOLZER, M. A., LUNT, A. J., BAIMPAS, N., SMITH, A., LANDINI, G. &
KORSUNKSY, A. 2014b. In-situ X-ray scattering evaluation of heat-induced ultrastructural changes in dental tissues and synthetic hydroxyapatite. J R Soc Interf, 11, 20130928
SUN, J., ZHANG, X., CUI, J. & ZHOU, L. 2006. Image retrieval based on color distribution entropy.
Pattern Recogn Lett, 27, 1122-1126. SWEET, D. 2000. Dental DNA Evidence. In: WILLEMS, G. (ed.) Forensic Odontology: Proceedings
of the European Iofos Millennium Meeting Leuven, Belgium August 23-26, 2000. Leuven: Leuven University Press.
SWEET, D. 2010. Forensic dental identification. Forensic Sci Int, 201, 3-4.

153
SWEET, D., HILDEBRAND, D. & PHILLIPS, D. 1999. Identification of a skeleton using DNA from teeth and a PAP smear. J Forensic Sci, 44, 630-633.
SYMES, S. A., RAINWATER, C. W., CHAPMAN, E. N., GIPSON, D. R. & PIPER, A. L. 2008.
Patterned Thermal Destruction of Human Remains in a Forensic Setting. In: SCHMIDT, C. W. & SYMES, S. A. (eds.) The Analysis of Burned Human Remains. 1st ed. San Diego: Academic Press.
TAYLOR, P. T., WILSON, M. E. & LYONS, T. J. 2002. Forensic odontology lessons: multishooting
incident at Port Arthur, Tasmania. Forensic Sci Int, 130, 174-182. TESCH, W., EIDELMAN, N., ROSCHGER, P., GOLDENBERG, F., KLAUSHOFER, K. &
FRATZL, P. 2001. Graded microstructure and mechanical properties of human crown dentin. Calcif Tissue Int, 69, 147-157.
THALI, M. J., MARKWALDER, T., JACKOWSKI, C., SONNENSCHEIN, M. & DIRNHOFER, R.
2006. Dental CT imaging as a screening tool for dental profiling: Advantages and limitations. J Forensic Sci, 51, 113-119.
THALI, M. J., TAUBENREUTHER, U., KAROLCZAK, M., BRAUN, M., BRUESCHWEILER, W.,
KALENDER, W. A. & DIRNHOFER, R. 2003. Forensic microradiology: micro-computed tomography (Micro-CT) and analysis of patterned injuries inside of bone. J Forensic Sci, 48, 1336-1342.
THOMPSON, T. J. U. 2004. Recent advances in the study of burned bone and their implications for
forensic anthropology. Forensic Sci Int, 146 Suppl, S203-5. THOMPSON, T. J. U. 2005. Heat-induced dimensional changes in bone and their consequences for
forensic anthropology. J Forensic Sci, 50, 1008-1015. THOMPSON, T. J. U., GAUTHIER, M. & ISLAM, M. 2009. The application of a new method of
Fourier Transform Infrared Spectroscopy to the analysis of burned bone. J Archaeol Sci, 36, 910-914.
THOMPSON, T. J. U., ISLAM, M. & BONNIERE, M. 2013. A new statistical approach for
determining the crystallinity of heat-altered bone mineral from FTIR spectra. J Archaeol Sci, 40, 416-422.
THOMPSON, T. J. U., ISLAM, M., PIDURU, K. & MARCEL, A. 2011. An investigation into the
internal and external variables acting on crystallinity index using Fourier Transform Infrared Spectroscopy on unaltered and burned bone. Palaeogeogr Palaeocl, 299, 168-174.
TOHNAK, S., MEHNERT, A. J., MAHONEY, M. & CROZIER, S. 2011. Dental CT metal artefact
reduction based on sequential substitution. Dentomaxillofac Radiol, 40, 184-190. UBELAKER, D. H. 2009. The forensic evaluation of burned skeletal remains: A synthesis. Forensic
Sci Int, 183, 1-5. VAN DER GRAAF, E. R. & TEN BOSCH, J. J. 1993. Changes in dimensions and weight of human
dentine after different drying procedures and during subsequent rehydration. Arch Oral Biol, 38, 97-99.

154
VAN DER HAEGHEN, Y. & NAEYAERT, J. M. 2006. Consistent cutaneous imaging with commercial digital cameras. Arch Dermatol, 142, 42-46.
VON HOFMANN, E. 1875. Beobachtungen an verbrannten Leichentheilen. Wien Med Wochenschr,
25. VON WURMB-SCHWARK, N., RINGLEB, A., GEBUHR, M. & SIMEONI, E. 2005. Genetic
analysis of modern and historical remains. Anthropol Anz, 63, 1-12. WAHL, J. 1982. Leichenbranduntersuchungen. Ein Überblick über die Bearbeitungs- und
Aussagemöglichkeiten von Brandgräberen. Prähistorische Z, 57, 2-125. WALKER, P. L., MILLER, K. W. P. & RICHMAN, R. 2008. Time, temperature and oxygen
availability: an experimental study of the effects of environmental conditions on the color and organic content of cremated bone. In: SCHMIDT, C. & SYMES, S. (eds.) The Analysis of Burned Human Remains. 1st ed. San Diego: Academic Press.
WARREN, M. 2008. Detection of Commingling in Cremated Human Remains. In: ADAMS, B. J. &
BYRD, J. E. (eds.) Recovery, Analysis, and Identification of Commingled Human Remains. Totowa: Humana Press.
WATERHOUSE, K. 2013a. The effect of weather conditions on burnt bone fragmentation. J Forensic
Leg Med, 20, 489-495. WATERHOUSE, K. 2013b. Post-burning fragmentation of calcined bone: Implications for remains
recovery from fatal fire scenes. J Forensic Leg Med, 20, 1112-1117. WILLIAMS, D., LEWIS, M., FRANZEN, T., LISSETT, V., ADAMS, C., WHITTAKER, D.,
TYSOE, C. & BUTLER, R. 2004. Sex determination by PCR analysis of DNA extracted from incinerated, deciduous teeth. Science & Justice, 44, 89-94.
WOISETSCHLAGER, M., LUSSI, A., PERSSON, A. & JACKOWSKI, C. 2011. Fire victim
identification by post-mortem dental CT: radiologic evaluation of restorative materials after exposure to high temperatures. Eur J Radiol, 80, 432-440.
WOOD, R. E. & KOGON, S. L. 2010. Dental radiology considerations in DVI incidents: A review.
Forensic Sci Int, 201, 27-32. YAMAMOTO, K., OHTANI, S., KATO, S., SUGIMOTO, H., MIAKE, K. & NAKAMURA, T. 1990.
Morphological Changes in Human and Animal Enamel Rods with Heating - Especially Limits in Temperature Allowing Discrimination between Human and Animal Teeth. Bull Kanagawa Dental College, 18, 55-61.
ZHONG, X., YU, D., WONG, Y. S., SIM, T., LU, W. F., FOONG, K. W. C. & CHENG, H. L. in
press. 3D dental biometrics: Alignment and matching of dental casts for human identification. Comput Ind.

155
Chapter 11 - Appendix

156
11. 1. ImageJ/Fiji macros
11.1.1. Create mask for uniform black background
This Fiji macro creates a uniform black background to facilitate colorimetric image analysis. The
original picture had a green background, a colour that was not present in the surface colour alterations
and therefore could be used to produce a binary (i.e. black and white) mask (Figure 2.3).
min=newArray(3); max=newArray(3); filter=newArray(3); a=getTitle(); run("HSB Stack"); run("Convert Stack to Images"); selectWindow("Hue"); rename("0"); selectWindow("Saturation"); rename("1"); selectWindow("Brightness"); rename("2"); min[0]=48; max[0]=130; filter[0]="pass"; min[1]=0; max[1]=255; filter[1]="pass"; min[2]=0; max[2]=255; filter[2]="pass"; for (i=0;i<3;i++){ selectWindow(""+i); setThreshold(min[i], max[i]); run("Convert to Mask"); if (filter[i]=="stop") run("Invert"); } imageCalculator("AND create", "0","1"); imageCalculator("AND create", "Result of 0","2"); for (i=0;i<3;i++){ selectWindow(""+i); close(); } selectWindow("Result of 0"); close(); selectWindow("Result of Result of 0"); run("Erode"); run("Fill Holes"); rename(a);

157
11.1.2. Create colour palettes from *.txt files
The following Fiji macro produces colour palettes based on a list of RGB values (saved as a tab-
delimited *.txt file). A set number (maximum: 256) of 8-bit images are created, and put together as a
montage with parameters (e.g. number of columns/rows, size, border) as desired. Subsequently, the
*.txt file is selected and the RGB values get set as colours for the individual tiles of the montage using
the lookup table (LUT) function.
newImage("Untitled", "8-bit Black", 300, 300, 6); for (i=1;i<=nSlices;i++){ setSlice(i); run("Set...", "value="+i-1+" slice"); } run("Make Montage...", "columns=1 rows=6 scale=1 first=1 last=6 increment=1 border=1 font=12"); getLut(reds, greens, blues); text = File.openAsString(""); lines = split(text,"\n"); text = ""; nl=lines.length; for (i=1;i<nl;i++){ rgb= split(lines[i], "\t"); reds[i]=rgb[0]; greens[i]=rgb[1]; blues[i]=rgb[2]; } setLut(reds, greens, blues);
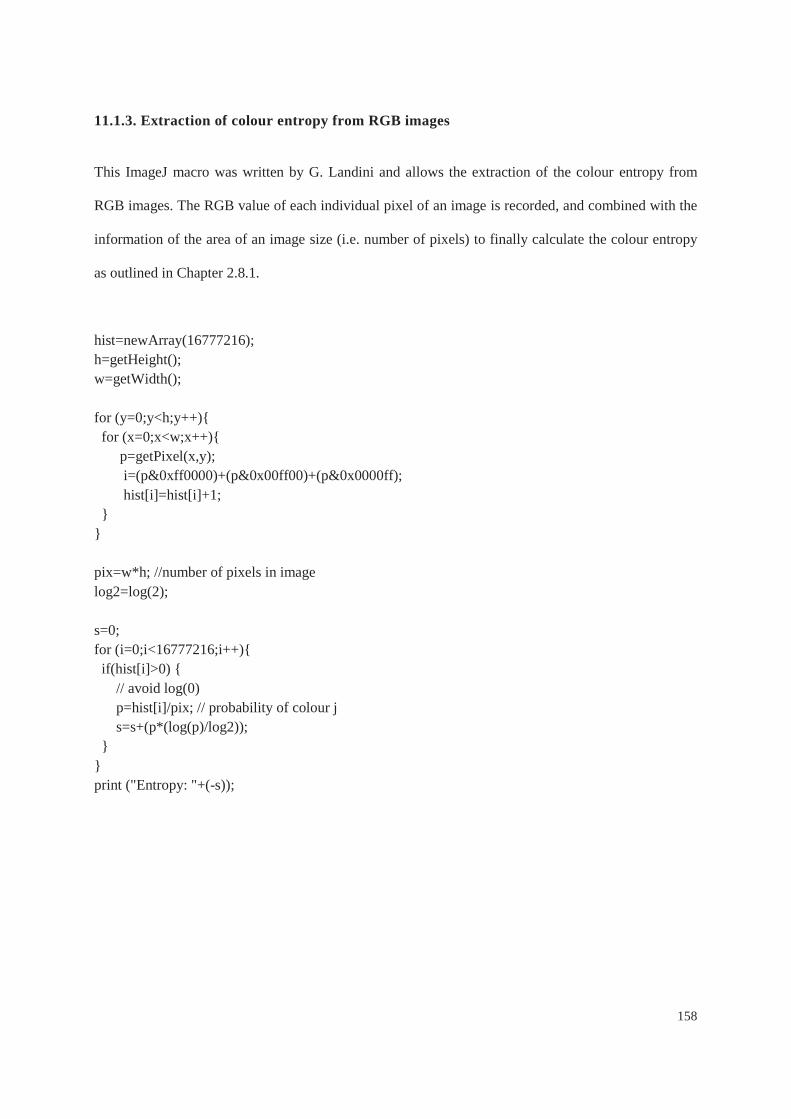
158
11.1.3. Extraction of colour entropy from RGB images
This ImageJ macro was written by G. Landini and allows the extraction of the colour entropy from
RGB images. The RGB value of each individual pixel of an image is recorded, and combined with the
information of the area of an image size (i.e. number of pixels) to finally calculate the colour entropy
as outlined in Chapter 2.8.1.
hist=newArray(16777216); h=getHeight(); w=getWidth(); for (y=0;y<h;y++){ for (x=0;x<w;x++){ p=getPixel(x,y); i=(p&0xff0000)+(p&0x00ff00)+(p&0x0000ff); hist[i]=hist[i]+1; } } pix=w*h; //number of pixels in image log2=log(2); s=0; for (i=0;i<16777216;i++){ if(hist[i]>0) { // avoid log(0) p=hist[i]/pix; // probability of colour j s=s+(p*(log(p)/log2)); } } print ("Entropy: "+(-s));

159
11.2. Reprints of peer-reviewed publications
Publication 1: Sandholzer MA, Walmsley AD, Lumley PJ, Landini G. Radiologic evaluation of heat-induced shrinkage and shape preservation of human teeth using micro-CT. Journal of Forensic Radiology and Imaging 2013; 1(3) 107-111, DOI 10.1016/j.jofri.2013.05.003. Publication 2: Sandholzer MA, Sui T, Korsunsky A, Walmsley AD, Lumley PJ, Landini G. X-ray scattering evaluation of ultrastructural changes of human dental tissue with thermal treatment Journal of Forensic Sciences 2014; 59(3) 769-774, DOI 10.1111/1556-4029.12400. Publication 3: Sui T, Sandholzer MA, Le Bourhis E, Baimpas N, Landini G, Korsunsky AM. Structure-mechanical function relations at nano-scale in heat-affected human dental tissue.Journal of the Mechanical Behavior of Biomedical Materials 2014, 32 113-124, DOI 10.1016/j.jmbbm.2013.12.014. Publication 4: Sui T, Sandholzer MA, Lunt AJG, Baimpas N, Smith A, Landini G, Korsunsky AM. In-situ X-ray scattering evaluation of heat-induced ultrastructural changes in dental tissues and synthetic hydroxyapatite Journal Royal Society Interface 2014, 11(95), 20130928, DOI 10.1098/rsif.2013.0928 Publication 5: Sui T, Lunt A, Baimpas N, Sandholzer MA, Hu J, Dolbnya IP, Landini G, Korsunsky AM. Hierarchical modelling of in situ elastic deformation of human enamel based on photoelastic and diffraction analysis of stresses and strains. Acta Biomaterialia 2014, 10(1) 343-354, DOI 10.1016/j.actbio.2013.09.043. Publication 6: Sui T, Sandholzer MA, Baimpas N, Dolbnya IP, Landini G, Korsunsky AM. Hierarchical modelling of elastic behaviour of human enamel based on synchrotron diffraction characterization. Journal of Structural Biology 2013; 184(2) 136-146, DOI 10.1016/j.jsb.2013.09.023. Publication 7: Sui T, Sandholzer MA, Baimpas N, Dolbnya IP, Walmsley AD, Lumley PJ, Landini G, Korsunsky AM. Multi-scale modelling and diffraction-based characterization of elastic behaviour of human dentine Acta Biomaterialia 2013; 9(8) 7937-7947, DOI 10.1016/j.actbio.2013.04.020.

Radiologic evaluation of heat-induced shrinkage and shapepreservation of human teeth using micro-CT
Michael A. Sandholzer n, Anthony D. Walmsley, Philip J. Lumley, Gabriel LandiniSchool of Dentistry, College of Medical and Dental Sciences, University of Birmingham, St Chads Queensway, Birmingham B4 6NN, United Kingdom
a r t i c l e i n f o
Article history:Received 3 March 2013Received in revised form15 April 2013Accepted 17 May 2013Available online 1 July 2013
Keywords:X-ray microtomographyForensic dentistryVictim identificationHeat-induced alterationsBurned teethCremains
a b s t r a c t
Introduction: The most reliable and frequently applied method for identification of fire victims iscomparative dental radiography. Forensic investigators are often confronted with fragmented andisolated remains, frequently removed from their anatomical position. Whilst the heat-induced dimen-sional and morphological changes in bone have been previously studied, precise data for heat-inducedchanges of human teeth is still lacking.Objective: The aim of this study was to obtain quantitative micro-CT data to evaluate the three-dimensional shrinkage and shape preservation of human teeth to provide an improved understanding onheat-induced alterations of dental tissues.Materials and methods: High-resolution micro-CT scans and digital radiographs were carried out on 66freshly extracted human teeth before and after 30 min exposure to temperatures of 400–1000 1C. Imageanalysis was performed using 3D Slicer and Fiji imaging packages.Results: The average volumetric shrinkage ranged between 4.78% (at 400 1C) and 32.53% (at 1000 1C).A major increase in shrinkage occurs between 700 1C and 800 1C, while no significant statisticaldifference (ANOVA post-hoc LSD, αo0.05) was found between lower temperature groups. Toothmorphology was generally well preserved even at high temperatures, in contrast to observation madefor burned bone, where warping and strong deformation can occur.Conclusions: The results of this micro-CT study add relevant information on shape preservation andallow forensic investigators to account for heat-induced alterations of size, eventually facilitating theodontological identification process in cases where only isolated teeth or dental fragments are present.
& 2013 Elsevier Ltd. All rights reserved.
1. Introduction
Radiological imaging plays a vital role in the identificationprocess of deceased persons [1–4]. The most reliable and fre-quently applied radiologic method for identification in casesinvolving high temperature exposure is comparative dental radio-graphy, which compares features of the dentition (e.g. missingteeth, pathologies and restorations) between ante-mortem andpost-mortem dental radiographs [5–7]. Burned human remains areoften found after natural disasters, airplane crashes or house fires,as a result of either direct contact with open flames or theexposure to high temperatures [5,6,8]. The positive identificationand investigation of severely burned human remains requirescareful examination, forensic experience and excellent skills incomparative dental anatomy [5].
Since the thermal stress or the surrounding environment(e.g. destroyed airplane, collapsed building) can lead to extremefragmentation of the skeletal remains, forensic investigators areoften confronted with isolated teeth or fragments thereof [5,9].Posterior teeth tend to be better preserved than anterior teethdue to their size and the heat protection, offered by layers ofskin, mucosa, muscle and fatty tissue and are therefore morelikely to be used in the odontological identification process [6].It has been reported that teeth shrink due to the heat exposureand are therefore often removed from their anatomical position[5,8]. However, whilst heat-induced dimensional changes inanimal and human bone have been previously studied, there isno precise data available for the heat-induced dimensionalchanges of human teeth [10,11]. Therefore, the first aim of thisstudy was to evaluate the volumetric heat-induced shrinkagefor a variety of temperatures found in possible archaeologicaland forensic scenarios by means of quantitative X-ray micro-tomography (micro-CT).
High-resolution CT imaging has become of increasing impor-tance in forensic radiography [1,12–14]. Recently, Woisetschlä-ger et al. reported on the specific heat-induced alterations of HU
Contents lists available at SciVerse ScienceDirect
journal homepage: www.elsevier.com/locate/jofri
Journal of Forensic Radiology and Imaging
2212-4780/$ - see front matter & 2013 Elsevier Ltd. All rights reserved.http://dx.doi.org/10.1016/j.jofri.2013.05.003
n Corresponding author. Tel.: +44 121 4665527; fax: +44 121 625 8815.E-mail addresses: [email protected],
[email protected] (M.A. Sandholzer).
Journal of Forensic Radiology and Imaging 1 (2013) 107–111

values in dental tissues and a number of restoration materialsanalysed with high-resolution CT, providing important informa-tion on the characterisation of filling materials exposed to heat[15]. However, with increasing trends in oral health, growingnumbers of patients have low incidence of caries and conse-quently lack restorations, so other features, like the externalenamel shape and root morphology need to be considered in theante-mortem–post-mortem comparison [6,7]. Merlati et al. [16]indicated the importance of qualitative aspects of structuralfeatures for positive dental identification, emphasising toothmorphology as a very significant characteristic. In animal andhuman bone heat-induced warping and deformation can occurat higher temperatures, whilst the extent of morphologicalchanges in human teeth over a large range of temperatureshas not been previously evaluated [10,11,16–18]. Therefore, thesecond aim of this study was to look at shape preservation ofdental tissues after exposure to high temperatures, which canadd relevant information for comparative dental radiography ofisolated teeth and fragments.
2. Material and methods
2.1. Human teeth sampling and preparation
A total of 66 (33 premolars, 33 molars) freshly extracted soundhuman teeth (ethical approval obtained from the NationalResearch Ethics Committee; NHS-REC reference 09.H0405.33/Consortium R&D No. 1465) were disinfected and cleaned toeliminate residues. Fifty-six teeth were subdivided into sevendifferent temperature groups (400 1C–1000 1C in steps of 100 1C),with 8 teeth each (4 PM, 4 M). Ten teeth (5 PM, 5 M) were burnedat 900 1C for further analysing shape alterations at high tempera-tures. A Carbolite ashing furnace AAF 11/3 (Carbolite, Sheffield,United Kingdom) was used to simulate the thermal stress. Theteeth were exposed to the various high temperatures for 30 minand subsequently cooled down to room temperature according toearlier publications [17,18].
2.2. Standard X-ray protocol
Digital radiographs were taken of 10 teeth before and after heatexposure at 900 1C using a customised Kodak 2100 Intraoral X-raysystem (Carestream Health Inc., Rochester, NY, USA) using 60 kVvoltage, 7 mA current and 0.1 s exposure time. The setup allowedfixed object-detector distance and size calibration was performedusing high-precision ball bearings.
2.3. Micro-CT protocol
The pre- and postscans of 56 teeth were carried out with aSkyScan 1172 micro-CT scanner (SkyScan, Kontich, Belgium) at13.5 mm resolution using 80 kV voltage, 100 mA current and a0.5 mm Aluminium filter. The resulting slices were reconstructedwith SkyScan's NSRECON package using a uniform attenuationcoefficient.
2.4. Image analysis
Following the reconstruction the micro-CT image stacks wereconverted and a 3-D fast rigid registration of pre- and postscans wasperformed using 3D Slicer version 3.6.4 (available online: http://www.slicer.org) [19]. After the manual determination of the region ofinterest (ROI) the registered image stacks were cropped, the imagesbinarised by using the same thresholding values [20] and theresulting values exported to SPSS version 19 (IBM SPSS Inc., Chicago,USA) for further statistical analysis. Three-dimensional models wereproduced using the Fiji imaging package [20].
2.5. Statistical analysis
The computed differences of the pre- and postscan volumeswere statistically analysed with a student t-test, a one-wayanalysis of variance (ANOVA) and post-hoc Least SignificantDifference (LSD) tests using SPSS version 19. Significance levelsof po0.05 (95% confidence interval) were used as an index ofstatistical significance.
3. Results
3.1. Macroscopic evaluation
A progressive, temperature-dependent shift from a naturalcolour to predominantly black/dark brown (400 1C), brown (500–600 1C), greyish-blue (700 1C), light grey (800 1C), chalky-white(900 1C) and patches of white, black and pink (1000 1C) wasobserved (see Fig. 1).
The enamel was fully preserved and attached to the dentine inthe 400 1C group, partially separated from the coronal dentine orfragmented between 500 1C and 700 1C and fully separated andfragmented in all teeth ≥800 1C. At temperatures ≥500 1C, theteeth became more fragile, with visible crack formation andfragmentation within the dentine.
3.2. Radiological evaluation
In all teeth of the lower temperature groups (≤600 1C) themicro-CT sections showed multiple small cracks in the apical
Fig. 1. Heat-induced colour alterations. Progressive, temperature-dependent shifts from a natural colour to black/dark brown (400 1C), brown (500–600 1C), greyish-blue(700 1C), light grey (800 1C), chalky-white (900 1C) and white/pink (1000 1C). (For interpretation of the references to colour in this figure legend, the reader is referred to theweb version of this article.)
M.A. Sandholzer et al. / Journal of Forensic Radiology and Imaging 1 (2013) 107–111108

dentine and cementum as well as single larger longitudinal cracks.At higher temperatures (700 1C–1000 1C) multiple larger long-itudinal and numerous transversal cracks were visible in thedentine, mainly deriving from the canals and the pulp chamber(see Fig. 2).
3.3. Shape preservation
Shape preservation of the dentine was investigated usingdigital radiographs, cross-sectional micro-CT images and 3D mod-els of the co-registered pre- and postscans. Although fragmenta-tion and cracks at elevated temperatures often affected the pulpchamber and root canals, the shrinkage can be described asuniform and overall tooth morphology was well preserved (seeFigs. 3 and 4, Electronic Supplementary Material 1). Minor heat-induced contraction ≥800 1C of the distal portions of the roots wasfound in the micro-CT models, but was generally not identifiableon the standard digital radiographs.
Supplementary material related to this article can be foundonline at http://dx.doi.org/10.1016/j.jofri.2013.05.003.
3.4. Shrinkage evaluation
In total, 56 teeth were included in the statistical data analysis(Table 1). A student's t-test showed no statistical difference betweenthe dentinal shrinkage of premolars and molars (p¼0.737).
To prevent a false-positive influence of broken coronaldentine on dentinal shrinkage the analysed ROI was limited tonon-fragmented dentine parts. A minimum of 400 slices (equalto 5.4 mm) of the corresponding pre- and postscans wereincluded in the analysis and no statistical difference betweennumber of analysed slices and dentinal shrinkage was found(p¼0.396). Pearson's correlation coefficient demonstrated aclear correlation between temperature and dentinal shrinkageat the 0.01 level (adjusted R2¼0.859). The average shrinkageranged between 4.78% (at 400 1C) and 32.53% (at 1000 1C) (seeTable 1).
Fig. 2. Micro-CT cross-sections of premolars of the 400,700 and 900 1C group. Visualisation of the dentinal volume loss using the registered pre- and postscans sections(left) and cross-sections in the apical (middle) and coronal dentine (right). (A) 400 1C: cross-sections of the root show multiple small cracks in the dentine andcementum. Single bigger cracks in the crown region and detachment of the crown alongside the dentine–enamel border. Shrinkage: 4.7870.80%, (B) 700 1C: cross-sections of the root show multiple bigger longitudinal small cracks in the dentine and cementum as well as multiple transversal cracks coming from the canals andpulp chamber. Partial or full detachment and fragmentation of the crown. Shrinkage: 11.5371.53%, and (C) 900 1C: cross-sections of the root show multiple cracks andlongitudinal fractures in the dentine and multiple transversal cracks coming from the canals and pulp chamber. Full detachment and fragmentation of the crown.Shrinkage: 27.5074.35%.
M.A. Sandholzer et al. / Journal of Forensic Radiology and Imaging 1 (2013) 107–111 109

Highly significant differences in the dentinal shrinkage werepresent in higher temperature groups, whilst no significant statisticaldifference was found between lower temperature groups (400 1C vs.500 1C (p¼0.642); 500 1C vs. 600 1C (p¼0.073); 600 1C vs. 700 1C(p¼0.060)).
4. Discussion
4.1. Macroscopic results
Factors such as the presence of soft tissue, fast increase oftemperature, fast cooling due to fire extinguishing agents or thepresence of contaminants have generally not been taken intoaccount by lab-based research, although they might also haveimportant effects on the appearance of hard tissues [6,10]. Toensure the comparability of the results, the selected temperatures,heating regimes and durations were matched to previous studies[17,18]. The macroscopic results, i.e. surface colour alteration and
Fig. 3. Comparative 3-D models indicating shape preservation after exposure to elevated temperatures (700–1000 1C). Visualisation of dentinal volume loss using registeredmicro-CT pre-and postscans at 700 1C (A), 900 1C (B) and 1000 1C (C) indicating good preservation of tooth morphology.
Fig. 4. Corresponding digital radiographs indicating dentinal shrinkage and shapepreservation of molars and premolars. Complete fragmentation of the crown andpartially broken dentine with multiple cracks present after constant exposure at900 1C for 30min.
Table 1Mean dentinal volume shrinkage at seven temperatures (400 1C–1000 1C) afterconstant exposure of 30 min. The mean difference of dentinal shrinkage issignificant for higher temperatures (ANOVA post-hoc LSD test, 95% confidenceinterval).
Temperature (1C) Shrinkage (% 71 SD)
400 4.7870.80500 5.9471.36600 8.6670.83700 11.5371.53n
800 24.2074.23nnn
900 27.5074.35n
1000 32.5375.35nn
n po0.05.nn po0.005.nnn po0.0005.
M.A. Sandholzer et al. / Journal of Forensic Radiology and Imaging 1 (2013) 107–111110

crown detachment, correspond with previous observations ofisolated unrestored human teeth exposed to high temperatures[6,8,15–18].
4.2. Radiological results
As the enamel was partially or fully fragmented in the majorityof the teeth, this study has primarily focused on the shapepreservation and shrinkage of dentine.
A minor contraction of the distal portions of the roots is visiblein the high-resolution CT images at elevated temperatures(≥800 1C), whilst the resolution of digital radiographs from variousangles has shown to be not sufficient to visualise those smallshape changes. The good preservation of the tooth morphology issomewhat different from the observation made for severelyburned bone, where warping and strong deformation can occur[10,11]. This could be ascribed to the relatively isotropic distribu-tion of the collagen matrix within teeth in comparison to bone[10]. As the root morphology needs to be frequently considered incomparative dental radiography, the good shape preservation afterexposure to high temperature could proof to be crucial for positiveidentification [16].
A summary of grouped results (Table 1) indicate a majorincrease in shrinkage between 700 1C and 800 1C, which isexpected to be due to the complete loss of the organic content,facilitating the sintering and recrystallisation of the hydroxyapa-tite crystals [10,11]. Major dimensional changes in bone have alsobeen associated with temperatures around 800 1C, which corre-spond with the results of this study [10]. The micro-CT resultsindicate that volumetric shrinkage can already be documented attemperatures as low as 400 1C, but this can be ascribed to themore precise nature of the approach used, whilst earlier studiesassessed shrinkage of bone using calliper measurements [10,11].
In the last few years micro-CT has been increasingly used inforensic sciences [2,3,12]. Although micro-CT provides high-resolution data for image analysis, allowing the visualisation ofalterations of internal structures, teeth fillings with metal compo-nents are expected to lead to artefacts influencing the imageanalysis [2]. Computed tomography has been recently used byBassed and Hill to estimate the dental age of fire victims, howeverits current resolution (voxel size of 1 mm) and metal artefactreduction algorithms prevent a detailed analysis of morphology[13]. Woisetschläger et al. used high-resolution CT (voxel size of0.1 mm) to analyse alterations in HU values of filling materials anddental tissues of isolated human teeth [15]. The findings of thosetwo studies suggest that high-resolution CTs could be used in thefuture for the purpose of identification of fire victims. Those high-resolution CTs would also be able to detect changes at highertemperatures; nevertheless micro-CT was chosen in this study todetermine the precise rate of shrinkage and analysis of shapechanges over a large range of temperatures in sufficient resolution.
However, the gold standard still remains comparative dentalradiography using panorama radiographs, bite wing or single x-rayimages and therefore the intentionwas to produce results that can betranslated into daily forensic practice [2,5–9,18]. The results of thisstudy implicate that shrinkage below 800 1C is practically negligible,as it cannot or only hardly be detected in standard digital radio-graphs. However, at higher temperatures which can be associatedwith light grey and white discolouration (see Fig. 1 and [17]),shrinkage is clearly visible in digital radiographs and this should bevigilantly implemented into the standard procedure for the identi-fication of burned dental remains proposed by Fairgrieve [21].
In conclusion, the findings of this study support earlier findingson the macroscopic changes (surface colour alteration and crowndetachment), adding information on the specific dentinal shrink-age and shape preservation over a large range of temperaturesfound in possible archaeological and forensic scenarios. Thecombination of knowledge on the progressive colour changesand the results of micro-CT evaluation on the specific dentinalshrinkage and shape preservation eventually facilitate the odon-tological identification process of fire victims in cases where onlyisolated teeth are present.
References
[1] M.J. Thali, T. Markwalder, C. Jackowski, M. Sonnenschein, R. Dirnhofer, DentalCT imaging as a screening tool for dental profiling: advantages and limitations,Journal of Forensic Sciences 51 (1) (2006) 113–119.
[2] J.J.W. Beck, What is the future of imaging in forensic practice? Radiography 17(3) (2011) 212–217.
[3] M. Baglivo, S. Winklhofer, G.M. Hatch, G. Ampanozi, M.J. Thali, T.D. Ruder, Therise of forensic and post-mortem radiology—analysis of the literature betweenthe year 2000 and 2011, Journal of Forensic Radiology and Imaging 1 (1)(2013) 3–9.
[4] G.N. Rutty, A. Brough, M.J.P. Biggs, C. Robinson, S.D.A. Lawes, S.V. Hainsworth,The role of micro-computed tomography in forensic investigations, ForensicScience International 225 (1–3) (2013) 60–66.
[5] R. Lain, J. Taylor, S. Croker, P. Craig, J. Graham, Comparative dental anatomy inDisaster Victim Identification: lessons from the 2009 Victorian Bushfires,Forensic Science International 205 (1–3) (2011) 36–39.
[6] C. Savio, G. Merlati, P. Danesino, G. Fassina, P. Menghini, Radiographicevaluation of teeth subjected to high temperatures: experimental study toaid identification processes, Forensic Science International 158 (2–3) (2006)108–116.
[7] M. Bernstein, Radiologic applications in forensic dentistry, in: B. Brogdon (Ed.),Forensic Radiology, CRC Press, Boca Raton, FL, 1998, pp. 98–140.
[8] P.J. Bush, M.A. Bush, The next level in victim identification: materials proper-ties as an aid in victim identification, in: C. Bowers (Ed.), Forensic DentalEvidence, Elsevier Academic Press, London, 2011, pp. 55–72.
[9] A.J. Hill, R. Lain, I. Hewson, Preservation of dental evidence following exposureto high temperatures, Forensic Science International 205 (1–3) (2011) 40–43.
[10] T.J.U. Thompson, Heat-induced dimensional changes in bone and their con-sequences for forensic anthropology, Journal of Forensic Sciences 50 (5)(2005) 1008–1015.
[11] P. Shipman, G. Foster, M. Schoeninger, Burnt bones and teeth: an experimentalstudy of color, morphology, crystal structure and shrinkage, Journal ofArchaeological Science 11 (4) (1984) 307–325.
[12] M.J. Thali, U. Taubenreuther, M. Karolczak, et al., Forensic microradiology:micro-computed tomography (Micro-CT) and analysis of patterned injuriesinside of bone, Journal of Forensic Sciences 48 (6) (2003) 1336–1342.
[13] R.B. Bassed, A.J. Hill, The use of computed tomography (CT) to estimate age inthe 2009 Victorian Bushfire Victims: a case report, Forensic Science Interna-tional 205 (1–3) (2011) 48–51.
[14] R. Silva, T. Botelho, F. Prado, J. Kawagushi, E. Daruge Júnior, F. Bérzin, Humanidentification based on cranial computed tomography scan—a case report,Dentomaxillofacial Radiology 40 (4) (2011) 257–261.
[15] M. Woisetschläger, A. Lussi, A. Persson, C. Jackowski, Fire victim identificationby post-mortem dental CT: radiologic evaluation of restorative materials afterexposure to high temperatures, European Journal of Radiology 80 (2) (2011)432–440.
[16] G. Merlati, P. Danesino, C. Savio, G. Fassina, A. Osculati, P. Menghini, Observa-tions on dental prostheses and restorations subjected to high temperatures:experimental studies to aid identification processes, Journal of ForensicOdonto-Stomatology 20 (2) (2002) 17–24.
[17] S. Karkhanis, D. Franklin, Macroscopic and microscopic changes in incinerateddeciduous teeth, Journal of Forensic Odonto-Stomatology 27 (2) (2009) 9–19.
[18] G. Merlati, C. Savio, P. Danesino, G. Fassina, P. Menghini, Further study ofrestored and un-restored teeth subjected to high temperatures, Journal ofForensic Odonto-Stomatology 22 (2) (2004) 34–39.
[19] J.P. Robinson, P.J. Lumley, E. Claridge, P.R. Cooper, L.M. Grover, R.L. Williams,et al., An analytical Micro CT methodology for quantifying inorganic dentinedebris following internal tooth preparation, Journal of Dentistry 40 (11) (2012)999–1005.
[20] K.W. Eliceiri, M.R. Berthold, I.G. Goldberg, L. Ibanez, B.S. Manjunath, M.E. Martone, et al., Biological imaging software tools, Nature Methods 9 (7)(2012) 697–710.
[21] S. Fairgrieve, Forensic Cremation: Recovery and Analysis, 1st ed., CRC Press,Boca Raton, FL, 2008.
M.A. Sandholzer et al. / Journal of Forensic Radiology and Imaging 1 (2013) 107–111 111

X-ray scattering evaluation of ultrastructural changes of human dental tissues with
thermal treatment*
Michael A. Sandholzer M.Sc. 1, Tan Sui B.Sc. 2, Alexander M. Korsunsky Ph.D. 2, A. Damien
Walmsley Ph.D. BDS 1, Philip J. Lumley Ph.D. BDS 1, Gabriel Landini Ph.D. DrOdont 1
1 School of Dentistry, College of Medical and Dental Sciences, University of Birmingham, St Chad’s Queensway,
Birmingham B4 6NN, United Kingdom
2 Department of Engineering Science, University of Oxford, Parks Road, Oxford OX1 3PJ, United Kingdom
*Presented at the 19th European Meeting of the Paleopathology Association, August 27-29 2012, in Lille, France.
Abstract
Micro- and ultrastructural analysis of burned skeletal remains is crucial for obtaining a reliable
estimation of cremation temperature. Earlier studies mainly focused on heat-induced changes in bone
tissue, whilst this study extends this research to human dental tissues using a novel quantitative
analytical approach. Twelve tooth sections were burned at 400-900°C (30min exposure, increments of
100°C). Subsequent combined small and wide angle X-ray scattering (SAXS/WAXS) experiments
were performed at the Diamond Light Source synchrotron facility, where 28 scattering patterns were
collected within each tooth section. In comparison with the control sample, an increase of mean
crystal thickness was found in burned dentine (2.8-fold) and enamel (1.4-fold), however at a smaller
rate than reported earlier for bone tissue (5 -10.7-fold). The results provide a structural reference for
traditional X-ray scattering methods and emphasize the need to investigate bone and dental tissues
separately to obtain a reliable estimation of cremation temperature.
Keywords
Forensic Science, Cremated Remains, Burned bones and teeth, Heat-induced changes, X-ray
microtomography, X-Ray Diffraction, Small Angle Scattering, Forensic Odontology, Forensic
Anthropology

Introduction
Burned human remains are frequently recovered from forensic settings and archaeological sites as a
result of ritual cremations, natural disasters, accidents or crime (1-3). In general, skeletal hard tissues
undergo macroscopic and microscopic alterations (2, 4), and a variety of factors (e.g. duration,
temperature and oxygen availability) in the cremation environment determine the extent of those
alterations (5). A fire can cause a number of substantial alterations within skeletal hard tissues, but
forensic analysis of burned human remains can give important information about the context and
conditions of a fire (e.g. fire temperature, fire position or presence of fire accelerants) and eventually
facilitates victim identification (6). While macroscopic alterations (e.g. surface colour) can be used to
deduce an approximate temperature range, the investigation of the micro- and ultrastructural
alterations of skeletal hard tissue exposed to high temperatures has proven to be crucial to get a
reliable estimation of temperature (2, 6, 7).
Multiple techniques have been used to investigate the micro- and ultrastructural heat-induced
alterations of skeletal hard tissue, where the most frequently applied techniques are based on the
absorbance spectra of infrared radiation (Fourier transform infrared spectroscopy, FTIR) or X-ray
diffraction (XRD) (3, 6, 8-10). The crystallinity index (CI), frequently reported in literature and
quantified by FTIR, XRD or Raman Spectroscopy, gives information about the mean changes in
hydroxyapaptite (HAp) crystal size and microscopic structural order of tissue (7-9, 11, 12). However,
the CI does not characterise individual crystal features (e.g. size, morphology) and may fail to
describe adequately the complexity and heterogeneity of heat-induced processes. In particular, CI
values can be influenced by sample preparation (10, 13, 14). Although recently improved FTIR
approaches (9) and statistical methods for the comparability of CI results have been established (7),
there have been ongoing debates on the general limitations and validity of CI measurements (6, 9, 10,
14).

X-ray diffraction/scattering (XRD or wide angle X-ray scattering, WAXS) of crystals is capable of
showing distinct differences in crystal size and a sharpening of diffraction peaks at higher
temperatures, enabling reliable temperature estimations (3, 9, 14).
Beckett et al. (15) and Rogers et al. (10) reported a significant difference in HAp characteristics
between animal and human bone mineral upon heating analysed with XRD, however those results
have recently been contested (16). In general, XRD involves the grinding and chemically altering of a
sample and subsequently obtaining a volume-weighted average result that does not provide local fine-
scale changes of skeletal ultrastructure (13).
Most of the research to date has focused on the heat-induced compositional and structural alterations
of bone tissue (13, 15), and there is only limited data about the changes in hard dental tissues (6). The
ultrastructural changes of human bone and teeth using XRD, showed that crystallites derived from
bone and dental tissue react differently to heat, implicating that those tissues have to be separately
investigated when precise temperature estimation is desired (6). However, Piga et al. (6) pulverised
entire teeth, neither taking into account a possibly non-uniform thermal treatment nor the
ultrastructural differences of dentine and enamel (17).
Small angle X-ray scattering (SAXS) provides information about the thickness, degree of alignment
and shape of crystallites (18). Synchrotron-based SAXS/WAXS have been used for the investigation
of local mineralized tissue ultrastructure, providing nano- and sub-nano-scale information at the
spatial resolution required to simultaneously characterize and understand the internal architecture and
hierarchical properties of materials (19). Synchrotron facilities allow simultaneous SAXS/WAXS data
collection, whereas the combined approach allows a high throughput of samples within a short time of
analysis and the identification of local ultrastructural alterations without grinding or chemically
altering the sample. The obtained quantitative X-ray scattering information is the precise average
within the illuminated volume projected along the X-ray beam direction, allowing more sensitive
measurements of crystalline size, shape and orientation when compared with traditional XRD (18, 20).
Hiller and Wess (18) and Etok et al. (4) successfully applied lab-based SAXS to characterise the heat-
induced alterations of crystalline size in archaeological and experimentally altered bone, however
there is no SAXS data available for hard dental tissues. In this study an analytical approach,

combining SAXS and WAXS is used to investigate the heat-induced alterations of dentine and
enamel, in order to develop a structural reference for heat-affected dental tissues that can be useful in
forensic investigations involving traditional methods.
Material and Methods
Four freshly extracted healthy posterior human teeth (ethical approval obtained from the National
Research Ethics Committee; NHS-REC reference 09.H0405.33/ Consortium R&D No. 1446) were
used to prepare 14 tooth sections according to Marten et al. (21), with the individual section
dimensions of 3×1×0.5mm. Teeth were excluded from the study because of apparent damages (e.g.
broken roots), endodontic treatments, dental restorations or caries. Twelve tooth sections were
subdivided into six temperature groups for 30min constant exposure at 400°C-900°C (increments of
100°C) in an ashing furnace (Carbolite AAF 11/3, Sheffield, United Kingdom), and two additional
unheated sections were used as controls. The teeth were removed as the desired duration was reached
and subsequently cooled down to room temperature.
For the purpose of planning the exact measuring positions of the SAXS/WAXS, micro-CT scans of
the samples were performed with a SkyScan 1172 scanner (SkyScan, Kontich, Belgium) at 1.9μm
resolution using 80kV voltage, 120uA current and a 0.5mm Aluminium filter. The resulting slices
were reconstructed with SkyScan NSRECON package and subsequently 3-D planning models were
created with Fiji imaging software (22).
The X-ray scattering experiment was carried out on the I22 microfocus SAXS beamline at Diamond
Light Source (Oxford Harwell Campus, Didcot, UK) using a monochromatic beam (18keV) focused
down to beam size of 14.5×19μm. The sample-detector distance was 1040mm, enabling the entire
SAXS and a partial WAXS pattern to be captured on a 2-D Pilatus 2M detector (Dectris Ltd., Baden,
Switzerland). Two longitudinal line scans with 14 scattering patterns each (3 in enamel, 11 for
dentine) were collected in transmission mode from fixed locations within each sample (scan step
100μm).
Additionally, transverse line scans with 6 scattering patterns each were performed for selected
samples of 400°C, 600°C and 800°C.

SAXS data analysis
SAXS data provides information about crystallite thickness, degree of alignment and shape. For an
initial quantitative analysis 2-D diffraction images are converted into 1-D intensity profiles and pre-
processed using the Fit2D software package (23).
Crystallite thickness
In order to determine the mean crystal thickness, the scattering intensity ( , )I q was radially
integrated around the entire range of the azimuthal angle to obtain the function of ( )I q , where q is
the scattering vector.
Based on Porod’s law, which is valid in a two-phase system, the Porod chord length T is defined as:
4 QT
P (Eq. 1)
where P is the Porod constant given by 4( )I q Pq (Porod’s law at large q range), which can be
determined from the 4 4~Iq q plot, and Q representing the area integration of the 2 ~Iq q plot. T is
used as the definition of mean thickness without any assumption of the particle shape (13). However,
for the special case of needle/platelet shape, T can be interpreted as an average measurement of the
smallest dimension of crystallites. By taking further factors (e.g. volume fraction) into account, the
actual thickness of the crystals can be calculated using the mean thickness results (24).
Degree of alignment
For evaluating particle orientation, the degree of alignment is used to describe the percentage of the
aligned particles. In order to quantify the degree of alignment, the SAXS patterns were integrated
along all concerned scattering vectors q.
This results in a function ( )I with the azimuthal angle , normally with two peaks upon a constant
background (24, 25). The definition for the degree of alignment is:
oriented
oriented unoriented
AA A
(Eq. 2)

where unorientedA is the area of the constant background area accounting for the scattering from
unoriented particles and orientedA (resulting from scattering of oriented particles) depicts the total area
of ( )I ~ subtracting unorientedA . The value of ranges from 0 to 1, with 0 indicating no
predominant orientation within the plane of the section and 1 corresponding to a perfect alignment
of all crystals (24, 25).
Crystalline Shape
In dental tissue two typical shapes of HAp are usually considered, needle-like shape and platelet-like
shape (21). In a monodisperse system, the determination of crystalline shape can be directly obtained
from the ( ) ~I q q plot. The shape calculation is based on the cylindrical shapes (radius R and height
H) assumption in random distribution, taking all orientations with equal probability (26). Especially
for needle-like particles with infinitesimal transverse dimensions (R<<H), and for platelet-like shape
particles with infinitesimal thickness (R>>H), the intensity can be simplified, as 1( ) ~avI q q (for
needle-like), and 2( ) ~avI q q (for platelet-like). Therefore, if the absolute value of the slope in the
logarithmic format of ~I q plot is close to 1, the particle has needle-like shape, whilst if it is close to
2, the shape is platelet-like. Values >2 correspond to a more polydisperse crystal morphology (18).
WAXS data analysis
Identical to XRD, the peaks in WAXS patterns are represented by separated rings with various width
and intensity levels, containing characteristic information related to the crystal structure. The analysis
of wide angle scattering patterns is performed using Bragg’s law, which establishes the relationship
between the spacing of atomic planes in crystals and the scattering angle at which these planes
produce intense reflections.
2 sinhkln d (Eq. 3)
where λ is the wavelength, hkld is the interplanar distance between planes with Miller indices (hkl), θ
is one half of the scattering angle and n is the order of the reflection. Each peak corresponds to a

certain family of lattice planes within a certain crystallographic phase. Therefore, diffraction pattern
analysis can be used to identify and quantify the crystallographic phases and structure parameters.
A strong and distinct ring obtained from HAp (the main inorganic component of hard dental tissues) is
that of the (002) lattice planes. The (002) reflection contains the information on the orientation of the
principal axis (hexagonal c-axis) as well as the fibril orientation due to their parallel orientation (27).
Based on the Scherrer Equation, the width of the peaks in the diffraction pattern is related to the
mineral crystal, thus the length of the mineral particles can be derived from the WAXS patterns.
coskL
B (Eq. 4)
where L is the particle length, B is the full-width at half maximum (FWHM) of (002) peaks, which is
contributed from both mineral structure, and instrument broadening. The factor k is a constant related
to the crystalline shape while and have the same as meaning as described above.
Statistical Analysis
The computed mean crystalline thickness were statistically analysed with two-tailed paired sample t-
tests using SPSS version 19 (IBM SPSS Inc., Chicago, USA). Probability levels of p<0.05 (95%
confidence interval) were considered statistically significant.
Results and Discussion
Macroscopic and microscopic alterations
To ensure the comparability of our results, the selected temperature range (400°C-900°C) and
duration were matched to previous studies to include possible forensic and archaeological scenarios
(6, 28).
Additional factors such as the presence of soft tissues, fast increase or fluctuation of temperature or
the presence of contaminants, have generally so far not been taken into account in lab-based research
but they might also have some effects on skeletal hard tissues. Progressive, temperature-dependent
shifts in colour from a yellowish/white (control) to dark brown (400°C), brown (500-600°C), dark
grey (700°C), light greyish-blue (800°C) and chalky-white (900°C) in dentine were observed. In all

burned samples the micro-CT models showed small cracks within the dental slices, while in groups
treated at ≥700°C additional multiple larger longitudinal and numerous transversal cracks were visible
in the dentine too. In contrast to observations made on entire teeth (6), where the enamel entirely lifted
off at the dentine-enamel junction (DEJ) at ~700°C, the enamel was preserved in all our samples
treated at ≤800°C, enabling the combined analysis of enamel and dentine. Although the exact
mechanisms of the enamel shattering in teeth are unclear, the preservation in our samples can be
ascribed to the small slice dimensions which might minimise heat-induced stress around the DEJ.
Wide-angle X-ray scattering (WAXS)
Due to the limited size of the 2D detector, only the (002) peak could be captured and analysed, which
result from the diffraction by HAp crystallites. WAXS measurements revealed a variation of the peaks
and Fig. 1 shows the results of the (002) reflection of dentine from a selected series of burned dental
slices (400°C-900°C) as well as the control sample for a selected region of scattering angles (11.2-
11.5°). Increasing temperature leads to the disappearance of the organic components in between the
mineral phase and a higher degree of perfection of the HAp crystallite can be observed, accompanied
by further crystallisation of the amorphous part (3). In general, a sharpening of diffraction peaks at
higher temperatures (800°C-900°C) can be observed in comparison to the control sample, indicating
an increased diffraction contribution from larger particles as well as a peak separation appearing at
900°C. Finally, at high temperatures (≥800°C) sintering of HAp crystallites leads to grain growth and
improved crystal quality, resulting in significant growth and sharpening of the diffraction peaks (13).
By fitting the peaks of the control and 900°C sample, a FWHM variation ratio of 0.13/0.039 (dentine)
and 0.05/0.04 (enamel) could be shown; indicating in Eq.4 that the crystals appear 3.3-fold larger in
dentine (at 900°C) and 1.3-fold larger in enamel (at 800°C) compared to the control sample.
Small-angle X-ray scattering (SAXS)
Table 1 summarises the mean crystalline thickness variation from a series of burned dental slices
(400°C -900°C) and the control group. Fig. 2 shows the average value of 10 scanning patterns in
dentine and 3 patterns in enamel. The mean crystalline thickness (T) of the control samples (2.01 ±
0.09 nm) is consistent with earlier transmission electron microscopy (TEM) studies and XRD data (6,
11). Whilst the SAXS-derived increase of the mean crystalline thickness in bones was reported earlier

to be 5 to 10.7-fold at 900°C compared to the original crystal size (4, 13), it was found to be 2.8-fold
in dentine (2.01nm (RT) to 5.58nm (900°C)) and only 1.4-fold (3.93nm (RT) to 5.34nm (800°C)) in
enamel (for additional values see Table 1). Therefore, our results emphasize the need to separately
investigate bone and dental tissues when precise temperature estimation is desired.
A 3.7-fold increase of average crystalline size (RT to 900°C) was reported when analysing pulverised
teeth with XRD (6), however the independent contributions of dentine and enamel were not taken into
account.
In general, the small increase in crystal size for enamel may be due to a more dense arrangement of
HAp compared with dentine, allowing only a limited size increase. Overall, the results of mean
crystalline thickness indicate the most influential structural changes occurred in dentine. The SAXS
results reinforce a comparable increase of particle thickness, supporting the WAXS analysis derived
FWHM variation ratio.
Moreover, the mean crystalline thickness of dentine does not significantly vary in the transverse
direction at any of the temperatures tested here, indicating a relatively uniform thermal treatment
(p=0.875 for 400°C; p=0.274 for 600°C; p=0.097 for 800°C). The analysis of an intact dental slice
enabled us to study possible local variations, however the analysis of variation in longitudinal and
transverse direction indicating a uniform thermal treatment and behaviour of the samples. Teeth
derived from a forensic setting or archaeological site are expected to have a non-uniform thermal
treatment and show spatial variation in ultrastructural changes. This will likely affect the results of
traditional X-ray scattering measurements, where a relatively large amount of powder is needed for
analysis (6, 13). In order to document the spatial variation multiple measurements on a thin cross-
section of an entire tooth, ideally 2D SAXS/WAXS mapping, would be necessary. To overcome the
issue of spatial variation within the sample and more accurately determine the maximum cremation
temperature, XRD/SAXS/FTIR samples should generally be taken from the hard tissue surface.
Fig. 3 and Fig. 4 show the variation in the degree of alignment determined by SAXS within the burned
dental slices (400°C -900°C) as well as the control group, which is the average value of 10 scanning
patterns in dentine and 3 patterns in enamel.

The degree of alignment values range between 0 and 1, where 0 describes no predominant orientation
with the plane of section whilst 1 indicates perfect alignment of all crystals (24). In the control sample,
dentine (0.27) shows a more random orientation of HAp crystals than in enamel (0.64), consistent
with earlier SAXS results of dental tissues (29). The overall degree of alignment of crystals in dentine
decreases from 0.27 at RT to 0.15 at 900°C, while the degree of alignment in enamel dropped from
0.64 at RT to 0.36 at 800°C indicating a more random orientation of the crystals as temperature
increases (see Table 1). Gradual disappearance of the structural organic components may explain the
decrease of the degree of alignment, where a trend towards more random orientation can be found in
dentine and enamel as temperature increases.
The degree of alignment might vary depending on the measurement location, and in order to obtain
the complete three-dimensional information of the nanostructure multiple measurements, ideally under
various rotation angles, would be necessary (20). A major drop in alignment is visible in the zone
around the dentine-enamel junction (DEJ), whilst in the enamel and distant dentine the degree of
alignment appeared less variable throughout all test groups (Fig. 3). This observation is in accordance
with the gradient properties of human dentine reported by Tesch et al. (24) and can be explained as the
optimization of the mechanical functions of dentine, which serves as a functional material (21).
Fig. 5 shows the shape variation of the crystals within dentine and enamel determined by SAXS, and
the absolute value of the slope in the logarithmic form of ( ) ~I q q plot for dentine indicates a needle-
like morphology at RT (1.40), changing to a more platelet-like morphology at 400-500°C (2.03-2.19)
and finally to a more complex (polydisperse) morphology at 600-900°C (3.53-3.22).
The variation of the absolute value of the slope for enamel is limited, with the scattering results
appearing polydisperse (2.77-3.27) in all test groups (see Table 1). The precise polydisperse crystallite
morphology identified at higher temperatures cannot be determined by the simplistic needle or platelet
model used in this study (13). Although on a different scale, the ultrastructural shape alterations are in
accordance with electron microscopic results showing only small structural variance at lower
temperatures and more a complex appearance >700°C (3).

Conclusions
A quantitative analytical approach based on synchrotron radiation, combined small and wide angle X-
ray scattering (SAXS/WAXS), was used to investigate the heat-induced ultrastructural alterations of
dentine and enamel. In contrast to other previously used methods, this approach allows a non-
destructive analysis of entire samples to determine local alterations rather than a volume-weighted
averaged measurement used in traditional X-ray scattering methods.
The results indicate a specific temperature-dependent increase of the mean thickness of HAp crystals
in dentine and enamel that can be used to determine a temperature range. Moreover, a decrease of the
degree of alignment and change of crystalline shape, as well as greater crystal perfection with larger
grain growth could be documented. Whilst the access to synchrotron facilities is limited for routine
forensic work, the results of this study, especially the mean crystalline thickness, can be utilised in the
more commonly used lab-based X-ray scattering analysis of burned human remains. Overall, a
structural reference was developed for heat-affected dental tissues that can be useful in investigations
of forensic and archaeological samples, once again emphasizing the need to separately investigate
bone and dental tissues when precise temperature estimation is desired.
Acknowledgments
The authors would like to thank Nikos Baimpas (Department of Engineering Science, University of
Oxford) and Dr. Jen Hiller (Diamond Light Source, Oxford) for helpful instructions regarding the
beamline setup. Diamond Light Source is acknowledged for provision of synchrotron beamtime
through allocation SM7919.

References
1. Gonçalves D, Thompson TJU, Cunha E. Implications of heat-induced changes in bone on the
interpretation of funerary behaviour and practice. Journal of Archaeological Science 2011;38(6):1308-
13.
2. Thompson TJU. Heat-induced dimensional changes in bone and their consequences for forensic
anthropology. Journal of Forensic Sciences 2005;50(5):1008-15.
3. Shipman P, Foster G, Schoeninger M. Burnt bones and teeth: an experimental study of color,
morphology, crystal structure and shrinkage. Journal of Archaeological Science 1984;11(4):307-25.
4. Etok S, Valsami-Jones E, Wess TJ, Hiller JC, Maxwell C, Rogers KD, et al. Structural and
chemical changes of thermally treated bone apatite. Journal of Materials Science 2007;42(23):9807-
16.
5. Walker P, Miller K, Richman R. Time, temperature and oxygen availability: an experimental study
of the effects of environmental conditions on the color and organic content of cremated bone. In:
Schmidt CW, Symes SA, editors. The Analysis of Burned Human Remains. London: Academic Press,
2008:129-35.
6. Piga G, Thompson TJU, Malgosa A, Enzo S. The Potential of X-Ray Diffraction in the Analysis of
Burned Remains from Forensic Contexts. Journal of Forensic Sciences 2009;54(3):534-9.
7. Thompson TJU, Islam M, Bonniere M. A new statistical approach for determining the crystallinity
of heat-altered bone mineral from FTIR spectra. Journal of Archaeological Science 2013;40(1):416-
22.
8. Squires KE, Thompson TJU, Islam M, Chamberlain A. The application of histomorphometry and
Fourier Transform Infrared Spectroscopy to the analysis of early Anglo-Saxon burned bone. Journal
of Archaeological Science 2011;38(9):2399-409.
9. Hollund HI, Ariese F, Fernandes R, Jans MME, Kars H. Testing an alternavite high-throughput tool
for investigating bone diagenesis: FTIR in attenuated total reflection (ATR) mode. Archaeometry
2013;55(3) 507-32.
10. Rogers K, Beckett S, Kuhn S, Chamberlain A, Clement J. Contrasting the crystallinity indicators
of heated and diagenetically altered bone mineral. Palaeogeography, Palaeoclimatology,
Palaeoecology 2010;296(1-2):125-9.
11. Reiche I, Vignaud C, Menu M. The crystallinity of ancient bone and dentine: new insights by
transmission electron microscopy. Archaeometry 2002;44(3):447-59.
12. Thompson TJU, Islam M, Piduru K, Marcel A. An investigation into the internal and external
variables acting on crystallinity index using Fourier Transform Infrared Spectroscopy on unaltered
and burned bone. Palaeogeography, Palaeoclimatology, Palaeoecology 2011;299(1-2):168-74.
13. Hiller JC, Thompson TJU, Evison MP, Chamberlain AT, Wess TJ. Bone mineral change during
experimental heating: An X-ray scattering investigation. Biomaterials 2003;24(28):5091-7.

14. Piga G, Malgosa A, Thompson TJU, Enzo S. A new calibration of the XRD technique for the
study of archaeological burned human remains. Journal of Archaeological Science 2008;35(8):2171-8.
15. Beckett S, Rogers KD, Clement JG. Inter-Species Variation in Bone Mineral Behavior upon
Heating. Journal of Forensic Sciences 2011;56(3):571-9.
16. Piga G, Solinas G, Thompson TJU, Brunetti A, Malgosa A, Enzo S. Is X-ray diffraction able to
distinguish between animal and human bones? Journal of Archaeological Science 2013;40(1):778-86.
17. Kugler M. X-ray diffraction analysisin the forensic science: The last resort in many criminal cases.
Advances in X-Ray Analysis 2003;46:1-16.
18. Hiller JC, Wess TJ. The use of small-angle X-ray scattering to study archaeological and
experimentally altered bone. Journal of Archaeological Science 2006;33(4):560-72.
19. Daniels JE, Pontoni D, Hoo RP, Honkimaki V. Simultaneous small- and wide-angle scattering at
high X-ray energies. Journal of Synchrotron Radiation 2010;17:473-8.
20. Gaiser S, Deyhle H, Bunk O, White S, Müller B. Understanding Nano-Anatomy of Healthy and
Carious Human Teeth: a Prerequisite for Nanodentistry. Biointerphases 2012;7(1):1-14.
21. Marten A, Fratzl P, Paris O, Zaslansky P. On the mineral in collagen of human crown dentine.
Biomaterials 2010;31(20):5479-90.
22. Eliceiri KW, Berthold MR, Goldberg IG, Ibanez L, Manjunath BS, Martone ME, et al. Biological
imaging software tools. Nature Methods 2012;9(7):697-710.
23. Hammersley AP. FIT2D: An Introduction and Overview. ESRF Internal Report, ESRF97HA02T
1997.
24. Tesch W, Eidelman N, Roschger P, Goldenberg F, Klaushofer K, Fratzl P. Graded microstructure
and mechanical properties of human crown dentin. Calcified Tissue International 2001;69(3):147-57.
25. Rinnerthaler S, Roschger P, Jakob HF, Nader A, Klaushofer K, Fratzl P. Scanning small angle X-
ray scattering analysis of human bone sections. Calcified Tissue International 1999;64(5):422-9.
26. Guinier A, Fournet G. Small-angle scattering of X-rays. New York: Wiley, 1955.
27. Deymier-Black AC, Almer JD, Stock SR, Haeffner DR, Dunand DC. Synchrotron X-ray
diffraction study of load partitioning during elastic deformation of bovine dentin. Acta Biomaterialia
2010;6(6):2172-80.
28. Myers SL, Williams JM, Hodges JS. Effects of extreme heat on teeth with implications for
histologic processing. Journal of Forensic Sciences 1999; 44(4):805-9.
29. Jiang HD, Liu XY, Lim CT, Hsu CY. Ordering of self-assembled nanobiominerals in correlation
to mechanical properties of hard tissues. Applied Physics Letters 2005; 86(16): 163901.

FIG. 1 WAXS results of the (002) reflection of dentine from a series of burnt dental slices
(control, 400°C-900°C) for a selected region of scattering angles (11.2-11.5°). In general, a
sharpening of peaks at higher temperatures (800°C-900°C) can be observed in comparison to
the control sample, indicating an increased diffraction contribution from larger particles. The
peaks at low temperatures appear not as smooth due to the influence from an organic phase,
gradually decreasing and completely disappearing at between 700° and 800°C.

FIG. 2 Variation of the mean crystal thickness in enamel and dentine determined by SAXS.
Multiple measurements were taken in longitudinal direction, averaging the values of 10
scanning patterns in dentine and 3 patterns in enamel. The mean crystalline thickness of
dentine increases from 2.01nm at room temperature (RT) to 5.58nm at 900°C, and the mean
crystalline thickness of enamel increases from 3.93nm at RT to 5.34nm at 800°C. Error bars ±
1SD.

FIG. 3 Representative variation of degree of alignment in enamel and dentine at room
temperature (RT), 400° and 800°C. Longitudinal line scans with 13 scattering patterns each
(3 in enamel, 10 for dentine) were collected in transmission mode from fixed locations within
each sample (scan step 100 μm). A major drop in alignment is visible around the dentine-
enamel junction (DEJ, Measurement point 4-6), whilst in the enamel (Measurement points 1-
3) and distant dentine (Measurement points 7-14) the degree of alignment appeared less
variable.

FIG. 4 Variation of degree of alignment in enamel and dentine determined by SAXS.
Multiple measurements were taken in longitudinal direction, averaging the values of 10
scanning patterns in dentine and 3 patterns in enamel. The overall degree of alignment of
crystals in dentine decreases from 0.27 at RT to 0.15 at 900°C, and the degree of alignment in
enamel dropped from 0.64 at RT to 0.36 at 800°C indicating a more random orientation of the
crystals as temperature increases. Error bars ± 1SD.

FIG. 5 Variations of crystalline shape in enamel and dentine with increasing temperature
determined by SAXS. The absolute value of the slope for dentine indicates a needle-like
morphology at RT (1.40), changing to a more platelet-like morphology at 400-500°C (2.03-
2.19) and finally to a more complex (polydisperse) morphology at 600-900°C (3.53-3.22).
Error bars ± 1SD.

Tab
le 1
Ove
rvie
w o
f SA
XS
mea
sure
men
t res
ults
. Mea
n th
ickn
ess,
degr
ee o
f alig
nmen
t and
shap
e of
den
tine
and
enam
el c
ryst
allit
es c
olle
cted
from
long
itudi
nal
line
scan
s w
ith 1
3 sc
atte
ring
patte
rns
each
(10
for
den
tine,
3 in
ena
mel
). M
ean
thic
knes
s re
sults
fro
m tr
ansv
erse
line
sca
ns (
trans
) w
ith 6
den
tine
scat
terin
g
patte
rns
for
sele
cted
sam
ples
of
400°
C, 6
00°C
& 8
00°C
. Sta
tistic
al s
igni
fican
ce w
as e
valu
ated
usi
ng tw
o-ta
iled
paire
d sa
mpl
e t-t
ests
with
95%
con
fiden
ce
inte
rval
for t
he m
ean
thic
knes
s res
ults
(*p<
0.05
, **p
<0.0
05, *
**p<
0.00
05).
Tem
pera
ture
(°C
)
Den
tine
Mea
n
Thi
ckne
ss (n
m ±
1 SD
)
Ena
mel
Mea
n
Thi
ckne
ss (n
m ±
1 SD
)
Deg
ree
of A
lignm
ent
Den
tine
(± 1
SD)
Deg
ree
of A
lignm
ent
Ena
mel
(± 1
SD)
Cry
stal
line
Shap
e
Den
tine
(± 1
SD)
Cry
stal
line
Shap
e
Ena
mel
(± 1
SD)
CTL
2.
01 ±
0.0
9 3.
93 ±
0.0
5 0.
27 ±
0.0
2 0.
65 ±
0.0
1 1.
40 ±
0.0
4 2.
77 ±
0.0
7
400
2.81
± 0
.10*
**
4.05
± 0
.01
0.26
± 0
.01
0.58
± 0
.01
2.03
± 0
.05
2.84
± 0
.03
500
3.90
± 0
.02*
**
5.08
± 0
.04*
**
0.20
± 0
.03
0.50
± 0
.01
2.20
± 0
.01
3.28
± 0
.01
600
4.90
± 0
.16*
**
5.07
± 0
.12
0.22
± 0
.03
0.39
± 0
.01
3.53
± 0
.08
3.16
± 0
.02
700
4.83
± 0
.06
5.19
± 0
.07
0.20
± 0
.01
0.38
± 0
.01
3.50
± 0
.06
3.14
± 0
.07
800
4.88
± 0
.16
5.34
± 0
.03
0.16
± 0
.01
0.36
± 0
.01
3.29
± 0
.04
3.09
± 0
.05
900
5.58
± 0
.08*
**
---
0.15
± 0
.01
---
3.22
± 0
.09
---
400t
rans
2.
83 ±
0.0
5
600t
rans
4.
89 ±
0.0
1
800t
rans
4.
80 ±
0.0
3

www.elsevier.com/locate/jmbbm
Available online at www.sciencedirect.com
Research Paper
Structure-mechanical function relations atnano-scale in heat-affected human dental tissue
Tan Suia,n, Michael A. Sandholzerb, Eric Le Bourhisc, Nikolaos Baimpasa,Gabriel Landinib, Alexander M. Korsunskya
aDepartment of Engineering Science, University of Oxford, Parks Road, Oxford OX1 3PJ, United KingdombSchool of Dentistry, College of Medical and Dental Sciences, University of Birmingham, St Chad0s Queensway,Birmingham B4 6NN, United KingdomcInstitut P’,CNRS UPR 3346, University of Poitiers, SP2MI, BP 30179, F86962 Futuroscope Chasseneuil Cedex, France
a r t i c l e i n f o
Article history:
Received 15 August 2013
Received in revised form
30 November 2013
Accepted 14 December 2013
Available online 20 December 2013
Keywords:
Dental tissue
Thermal treatment
SAXS/WAXS
Nanoindentation
Mechanical-structural correlation
a b s t r a c t
The knowledge of the mechanical properties of dental materials related to their hierarch-
ical structure is essential for understanding and predicting the effect of microstructural
alterations on the performance of dental tissues in the context of forensic and archae-
ological investigation as well as laser irradiation treatment of caries. So far, few studies
have focused on the nano-scale structure-mechanical function relations of human teeth
altered by chemical or thermal treatment. The response of dental tissues to thermal
treatment is thought to be strongly affected by the mineral crystallite size, their spatial
arrangement and preferred orientation. In this study, synchrotron-based small and wide
angle X-ray scattering (SAXS/WAXS) techniques were used to investigate the micro-
structural alterations (mean crystalline thickness, crystal perfection and degree of align-
ment) of heat-affected dentine and enamel in human dental teeth. Additionally, nanoin-
dentation mapping was applied to detect the spatial and temperature-dependent nano-
mechanical properties variation. The SAXS/WAXS results revealed that the mean crystal-
line thickness distribution in dentine was more uniform compared with that in enamel.
Although in general the mean crystalline thickness increased both in dentine and enamel
as the temperature increased, the local structural variations gradually reduced. Meanwhile,
the hardness and reduced modulus in enamel decreased as the temperature increased,
while for dentine, the tendency reversed at high temperature. The analysis of the
correlation between the ultrastructure and mechanical properties coupled with the effect
of temperature demonstrates the effect of mean thickness and orientation on the local
variation of mechanical property. This structural–mechanical property alteration is likely
to be due to changes of HAp crystallites, thus dentine and enamel exhibit different
responses at different temperatures. Our results enable an improved understanding of the
mechanical properties correlation in hierarchical biological materials, and human dental
tissue in particular.
& 2013 Elsevier Ltd. All rights reserved.
1751-6161/$ - see front matter & 2013 Elsevier Ltd. All rights reserved.http://dx.doi.org/10.1016/j.jmbbm.2013.12.014
nCorresponding author. Tel.: þ44 18652 83447; fax: þ44 18652 73010.E-mail address: [email protected] (T. Sui).
j o u r n a l o f t h e m e c h a n i c a l b e h a v i o r o f b i o m e d i c a l m a t e r i a l s 3 2 ( 2 0 1 4 ) 1 1 3 – 1 2 4

1. Introduction
The bulk of human teeth consists of two main mineralisedtissues, collagen-rich dentine and highly mineralised enamel.They join forming a complex and mechanically durabledentine–enamel junction (DEJ) that contributes to the life-long success of the tooth structure under thermo-mechanicalloadings encountered in the oral cavity under the conditionssuch as mastication, chemically active environment andthermal shock (He and Swain, 2009; Marshall et al., 1998;Ten Cate, 1998). This remarkable performance provides themotivation for numerous investigations into the detail of themicro- and nano-structure of enamel, dentine and the DEJ.The knowledge of the mechanical properties related to thehierarchical structure of dentine, enamel and the DEJ isessential for understanding and predicting the effects ofmicrostructural alterations due to disease, treatment, orenvironmental or thermal exposure on the performance ofdental tissues and their artificial replacements.
The use of advanced high-energy techniques is increasingin modern dentistry. With the advent of a variety of new lasersystems spanning by a range of energy densities and pulsedurations, clinical treatments such as laser-assisted cariesprotection were proposed and developed. Local temperatureinduced by laser as high as 1000 1C may be achieved duringlaser treatment (Fried et al., 2002; Zuerlein et al., 1999).Improved caries prevention is surmised to be associated withincreased mineralisation and HAp crystallite sintering thatleads to the sealing of dentinal tubules. However, the con-firmation of this by direct microscopic characterisation of thevery thin surface layer affected by laser therapies is anextremely challenging experimental task. In addition, in thecontext of archaeological and forensic investigations, themacroscopic alterations (e.g. surface colour) can be used todeduce an approximate temperature range, while the inves-tigation of the micro- and ultrastructural alterations ofskeletal hard tissues exposed to high temperatures turnedout to be an excellent means of obtaining reliable estimatesof the temperatures of exposure (Piga et al., 2009; Thompson,2005; Thompson et al., 2011). The above considerationsprovide a strong motivation for a detailed study into theeffect of thermal exposure on the nano-structure propertiesof human dental tissue. In order to understand and quantifymore precise information about the evolution of the hier-archical nano/micro-structure under in situ thermal expo-sure, the application of advanced non-destructive techniquesoffers an appropriate route.
Synchrotron based X-ray diffraction, small- and wideangle X-ray scattering (SAXS and WAXS, respectively), areadvanced non-destructive techniques that enable character-ising the ultrastructure, mechanical property and textureevaluation of mineralised tissues (Al-Jawad et al., 2007;Daniels et al., 2010; Deymier-Black et al., 2010). WAXS (XRD)has been proved to be capable of showing the distinctdifferences of HAp of animal and human bone mineral uponheating (Beckett et al., 2011; Piga et al., 2008; Piga et al., 2013;Rogers et al., 2010), however most lab-based XRD usuallyinvolves the mechanical destruction of a sample and estima-tion of a subsequent volume-weighted averaged result,
without providing local fine-scale changes of ultrastructure(Hiller et al., 2003). Compared with conventional high-magnification microscopic methods, SAXS allows a far higherthroughput of samples with shorter time of analysis and non-destructive identification of local structural alterations at thenano-scale. However, the investigation of thermal treatedmineralised tissues using SAXS technique is still lacking, andonly recently, lab-based SAXS was used to characterize thestructural changes in human bone for forensic and archae-ological purposes (Hiller et al., 2003), but few in the corre-sponding SAXS data analysis on human dental tissues inparticular.
Nanoindentation has recently emerged as a powerful toolfor measuring the nano-scale mechanical properties in bio-materials (Ebenstein and Pruitt, 2006). Nanoindentation inmineralised tissues have been extensively studied andreviewed by Kinney et al. (Kinney et al., 2003) and Haqueset al. (Haque, 2003). In teeth, a primary focus has been to mapmechanical properties across the normal dental tissues tounderstand the role of local properties and hierarchicalstructure, and has also been coupled with chemical mapping(Fong et al., 2000; Marshall et al., 2001; Roy and Basu, 2008).However, to date, no studies have been reported on theinvestigation of the variation of mechanical properties onthermally treated dental tissues. Tesch et al. (Tesch et al.,2001) successfully applied SAXS and nanoindentation tocharacterize non-treated dentine and observed variations ofmechanical and structural properties in correlations but theresolution is low. In the present investigation of heat-inducedalterations of hard dental tissues with high resolution, aSAXS mapping setup was combined with nanoindentationmapping. The results obtained here are likely to help in abetter understanding of the internal architecture alterationsand hierarchical properties changes due to heat exposure. Inaddition, the effect of exposure of human skeletal hardtissues to high temperatures is an important topic of studyin the context of forensic investigations and archaeologicalanalysis (Beckett et al., 2011; Enzo et al., 2007; Piga et al., 2009;Rogers and Daniels, 2002; Shipman et al., 1984).
The aim of this study was to have a medium resolutionmapping using synchrotron-based SAXS/WAXS technique tocharacterise the structural features both in dentine andenamel, as well as in the region near the DEJ of human teethsamples with various thermal treatments in order to analysethe ultrastructural variation (mean crystalline thickness,crystal perfection, orientation and degree of alignment) andtheir correlation with the reduced modulus and hardnessproperties (measured by nanoindentation).
2. Materials and methods
2.1. Sample preparation
Four freshly extracted intact human molars (ethical approvalobtained from the National Research Ethics Committee; NHS-REC reference 09.H0405.33/ Consortium R&D No. 1446) weredisinfected in 15 mM sodium azide solution and washedunder running water for 5–6 h before mechanically cleanedto eliminate residues. Teeth were excluded from the study
j o u r n a l o f t h e m e c h a n i c a l b e h a v i o r o f b i o m e d i c a l m a t e r i a l s 3 2 ( 2 0 1 4 ) 1 1 3 – 1 2 4114

because of damage (e.g. broken roots), endodontic treatment,dental restorations or caries. Details such as age, sex andpatients ethnic background remained anonymous as part ofpatient confidentiality regulations. In total, twelve teethsections (3�1�0.5 mm3) were prepared and kept in ahydrated state in Phosphate Buffer Solution (PBS) at 4 1Cbefore the experiment (Marten et al., 2010). Of these, 10sections were allocated into five temperature groups for30 min constant exposure at 400 1C–800 1C (in steps of100 1C), and two additional unheated sections were used ascontrols. An ashing furnace (Carbolite AAF 11/3, Sheffield,United Kingdom) was used to generate the thermal treat-ment. Each tooth sample was then subjected to a thermalhistory that heated the sample to the final (maximum)temperature (constant exposure) and were then removedfrom the furnace after the desired duration of exposure wasreached, and subsequently cooled down in the crucibles toroom temperature and stored in padded containers.
For the purpose of planning the measuring positions andRegion of Interests (ROIs) of the SAXS/WAXS mapping, micro-CT scans of the samples were performed with a SkyScan 1172scanner (SkyScan, Kontich, Belgium) at 1.9 mm resolutionusing 80 kV voltage, 120 mA current and a 0.5 mm Aluminiumfilter (Fig. 2a–c). The resulting data were reconstructed withSkyScan NRECON package and subsequent models wererecreated with Fiji imaging software (Eliceiri et al., 2012). Inaddition, it should be noted that the micro-CT scan was alsoused on the selection of samples in order to largely guaranteethat the DEJ plane of the selected samples was almost parallelto the X-ray beam.
The nanoindentation measurements were performed onthe same teeth sections after embedding in Epoxy resin(Buehler Epo-Kwick, Buehler Ltd., Lake Bluff, IL) to preservetheir integrity and were analysed in the dry condition. Themaximum peak temperatures of the epoxy during curing themanufacturer is 145 1C with a short period of time, which theinfluence on the sample is thought to be limited. Further-more, the sections are carefully ground with a series ofgrinding papers (P800-P4000) to expose the surface and finallypolished with 3 mm diamond polishing compound. This way,it was made sure that properties of the tissue were measured,and not properties of the epoxy resin.
In summary, six samples (RT, 400 1C, 500 1C, 600 1C, 700 1Cand 800 1C) were used for the SAXS/WAXS mapping measure-ments and three out of those six samples including RT, 500 1Cand 700 1C were further selected for the nano-indentationmapping, since these temperatures were representatives ofmajor compositional changes and weight loss (Pramaniket al., 2013).
2.2. Micro-focus small angle X-ray scattering experiment
Micro-focus SAXS experiments were performed on the I22beamline at Diamond Light Source (DLS, Oxford, UK) usingmonochromatic 18 keV X-rays. The distance between detec-tor and sample was 1040 mm, guaranteeing that clear andcomplete SAXS patterns and a partial WAXS pattern could becaptured on the 2D detector (Pilatus 2 M, Dectris Ltd., Baden,Switzerland) positioned downstream of the sample. The useof the incident X-ray beam focused down to the spot size of
14.5�19 mm2 allowed the achievement of the required spatialresolution. Each sample was mounted upright in air andscattering patterns were collected in transmission modewhile the sample was repeatedly shifted in the planeperpendicular to the X-ray incident beam travelling in thez-direction to collect the map of SAXS patterns. The mappingarea of region of interest (ROI) for the control sample andsamples from 400 1C to 800 1C was 0.6�0.6 mm2. The spacingbetween each two measurement points of the mapping scanswas 40 mm both in longitudinal (y-direction) and transverse(x-direction) directions, resulting in a total of 225 scatteringpatterns per sample (see Fig. 1a).
The experiment allows us to consider the DEJ a function-ally and structurally gradient layer – a common approxima-tion that is used with considerable success in the study ofinhomogeneous materials, interfaces, surface treated sys-tems, etc. Since the main interest is in-plane variation,therefore, all possible efforts have been made to ensure thatthe X-ray beam travelling through the sample is close toparallel to the DEJ and the beam size (14.5�19 mm2) is able toprovide a result averaged over the gauge volume that movesacross the DEJ. Samples of the thickness �500 mm representthe practical limit in terms of survival of thermal exposure.As for the SAXS measurements conducted in transmissionmode in these experiments, sample thinner than that is likelyto result in low intensity of the SAXS signal.
2.3. Scattering data analysis
2.3.1. SAXSQuantitative interpretation of SAXS patterns provides insightinto the mean thickness, orientation and degree of align-ment of dense particles. For initial quantitative analysis,2-D diffraction images were converted into 1-D intensityprofiles and pre-processed using the Fit2D software package(Hammersley, 1997).
a) Mean crystalline thicknessThe scattering intensity Iðq;φÞ was radially integrated overthe entire range of the azimuthal angle φ to obtain afunction of IðqÞ, where q represents the scattering vector.The crystal mean thickness T is defined as the Porod chordlength based on Porod0s law valid in a two-phase system
T¼ 4
π QP
ð1Þ
where P is the Porod constant given by IðqÞ ¼ Pq�4 (Porod0slaw at large q range), which can be determined from theIq4 � q4 plot, and Q is the integrated area of the Iq2 � q plot.Note that the definition of T was used without anyassumption of the particle shape. However, for specificcases of needle or platelet shape, T can be interpreted asan average measurement of the smallest dimension ofcrystallites. The actual mean crystalline thickness can befurther calculated based on T and other factors likevolume fraction (Fratzl et al., 1996).
b) Orientation and degree of alignmentThe degree of alignment (ρ) of HAp crystalline particles isused to describe the percentage of aligned particles. Toquantify it as well as the preferred orientation, the SAXS
j o u r n a l o f t h e m e c h a n i c a l b e h a v i o r o f b i o m e d i c a l m a t e r i a l s 3 2 ( 2 0 1 4 ) 1 1 3 – 1 2 4 115

patterns were integrated over all the available scatteringvectors q, resulting in a function IðφÞ with the azimuthalangle φ (Rinnerthaler et al., 1999; Tesch et al., 2003), whichis shown in Fig. 1b. The Gauss fit is also shown in thefigure (red line). In the plot of IðφÞ, the average position ofthe two peaks determines the predominant orientation φ0,and the degree of alignment is defined as the ratio
ρ¼ Aoriented
Aoriented þ Aunorientedð2Þ
where Aunoriented is the area of the constant backgroundlevel and Aoriented is the overall area under the curve of IðφÞsubtracting the background. The value of the degree ofalignment ranges from 0 to 1, where ρ¼ 0 indicates nopredominant orientation within the plane of the section
and ρ¼ 1 indicates a perfect alignment of all crystallites(Rinnerthaler et al., 1999; Tesch et al., 2003).
2.3.2. WAXSWAXS patterns are represented by separated diffractionrings, containing characteristic information related to thecrystal structure. The analysis of WAXS patterns is performedusing the Bragg0s law, which establishes the relationshipbetween the spacing of atomic planes in crystals and thescattering angle at which these planes produce intensereflections (Bragg and Bragg, 1933). The (002) lattice planereflection ring from HAp contains the information on theorientation of the c-axis of the crystals as well as the fibrilorientation due to their parallel orientation, which is strong
Fig. 1 – Schematic diagram of the experimental setup. (a) micro-focus SAXS setup, WAXS patterns can also be partly obtainedon the SAXS-Pilatus detector, (b) A plot of the integrated curve IðφÞ (black points). The Gauss fit is also shown in the figure (redline). The predominant orientation φ0is the average position of the two peaks. The ratio Aoriented=ðAoriented þAunorientedÞ gives thedegree of alignment and (c) nanoindentation profile showing the quantities used in the analysis. (For interpretation of thereferences to color in this figure legend, the reader is referred to the web version of this article).
j o u r n a l o f t h e m e c h a n i c a l b e h a v i o r o f b i o m e d i c a l m a t e r i a l s 3 2 ( 2 0 1 4 ) 1 1 3 – 1 2 4116

Fig. 2 – Region of interest (0.6�0.6 mm2) of dental slice mapped with SAXS and nanoindentation techniques. Each columnrepresents the results within the same area under a certain temperature as labelled. (a–c) ROI of RT (room temperature), 500 1Cand 700 1C samples revealed by Micro-CT; 2D colour coded of SAXS results: (d–f) mean thickness (nm) and (g–i) degree ofalignment of HAp crystallites, with the crystal orientation marked by the black lines. The mean thickness of the crystallites inboth dentine and enamel increases as the temperature increases (from light blue to red for enamel and from dark blue to redfor dentine). However, the spatial difference between dentine and enamel decreases with temperature. The degree ofalignment drops as the temperature increases (from red to yellow for enamel and from yellow to blue for dentine); 2D colourcoded of nanoindentation results: (j–l) reduced modulus (GPa) and (m–o) hardness (GPa); The reduced modulus and hardnessof enamel is observed to decrease significantly with the increasing temperature (from yellow–red mixture to light blue). (Forinterpretation of the references to color in this figure legend, the reader is referred to the web version of this article).
j o u r n a l o f t h e m e c h a n i c a l b e h a v i o r o f b i o m e d i c a l m a t e r i a l s 3 2 ( 2 0 1 4 ) 1 1 3 – 1 2 4 117

and distinct (Deymier-Black et al., 2010) Therefore, only the(002) peak of interest is selected for interpretation.
2.4. Nanoindentation experiment
A nanohardness tester (NHT) with a Berkovich diamondprobe from CSM (CSM, Neuchatel, Switzerland) was utilisedto perform nanoindentation on the thermally treatedsamples. The calibration was done by fused silica and theprocedure suggested by Oliver and Pharr (Oliver and Pharr,1992) was used to correct for the load-frame compliance ofthe apparatus and the imperfect shape of the indenter tip.The tests were performed at room temperature under forcecontrol feedback mode to a peak force of 2 mN. A loadfunction composed of 30 s loading, followed by 30 s holdingand 30 s unloading was used (Le Bourhis et al., 2004;Patriarche et al., 2004). The hold period at maximum load(30 s) is used to limit creep upon unloading, and thereby allowfor a more reliable extraction of mechanical properties fromthe unloading curve (Angker et al., 2005). The contact depthwas between 100 and 400 nm that is much lower than thetooth sample thickness (0.5 mm), so that the propertiesobtained can be confidently assigned to the bulk. Maps ofindents were performed along the same ROI used for thescattering experiment. The indents were spaced approxi-mately 60 mm apart both in the x- and y-directions andperformed using automation.
Nanoindentation tests are widely used to determine somematerial properties. Every nano-indent operation involves aloading and unloading process, and the indentation load-depth data is recorded for each operation (Hsu et al.). Aschematic diagram of nanoindentation process (Fig. 1c) isshown, where indentation depth h is the summation of hs(displacement due to elastic deformation) and hc (contactdepth). S is the contact stiffness at maximum penetrationand is the initial slope of the unloading curve. Using thecompliance method, the hardness H and reduced modulus Ercan be determined directly from analysis of load-displacement data (Ebenstein and Pruitt, 2006). The hardnessof the sample can be obtained by dividing the load by theprojected area of indentation
H¼ FmAc
ð3Þ
where Ac (Ac ¼ 24:5h2c for a perfect tip) is the contact area, Fm
is the force at maximum load. The composite modulus En
(sample and diamond) is extracted from
1En
¼ 2βS
ffiffiffiffiffiffiAc
π
rð4Þ
where β is a correction factor depending on the rip geometry(β¼ 1:034 for a Berkovich one). The relation with diamondand sample properties is given by
1En
¼ 1�ν2DED
þ 1�ν2SES
ð5Þ
where E and ν are Young0s modulus and Poisson ratio and thesubscripts D and S are for diamond and sample respectively
(ED¼1141 GPa, νD¼0.07). The reduced modulus is referred to as
1Er
¼ 1�ν2sEs
ð6Þ
which is reported in (Le Bourhis and Patriarche, 2007;Lim et al., 2005; Oliver and Pharr, 1992).
2.5. Statistical analysis
The calculated mean crystalline thickness values were sta-tistically analysed with two-tailed paired sample t-tests usingSPSS version 19 (IBM SPSS Inc., Chicago, USA). Probabilitylevels of po0.05 (95% confidence interval) were consideredstatistically significant.
3. Results
Colour coded 2D mapping provides a general qualitativeunderstanding of the spatial distribution of the ultrastruc-tural and mechanical properties and their variations withtemperature. It also offers a validation on extracting the linemeasurements or 1D plot with the detailed quantitativeinformation of the changes and correlation of the results.For reasons of consistency, the central line values werechosen in all samples and no dependency of the measure-ment results on the line position was found. In this section,both the 2D mapping results and the line plot were presented.
3.1. Ultrastructural observations
3.1.1. Mean crystalline thicknessThe spatial mean thickness variations of HAp crystallites inthe control sample (RT, room temperature), samples heattreated at 500 1C and 700 1C were visualized in Fig. 2d–f ascolour coded 2D-plot. Similar features from the three sampleswere observed, of which the mean crystalline thicknessdecreased from enamel to DEJ, and further down throughdeeper dentine. From Fig. 2d–f, it was found that the meanthickness of HAp crystallites increases with temperature,which was reflected through the 2D colour changes (enamelfrom blue in Fig. 2d to red in Fig. 2f, while dentine from darkblue to red). In addition, the spatial difference of the crystal-line thickness between enamel and dentine was found togradually decrease with temperature since in Fig. 2f, enameland dentine almost shared the same colour.
In order to trace the average mean crystalline thicknessalteration with increasing temperature, the thickness valuesalong the central line of dentine and enamel in the mappingarea were extracted from the 2D mapping results, which areshown in Fig. 3a. The variation of the averaged mean crystal-line thickness of the central line of dentine and enamel withincreasing temperature are illustrated in Fig. 4a and b, fromwhich the crystallites in dentine is nearly tripled from1.94 (SD: 0.06) nm at room temperature (RT) to 5.16 (SD:0.06) nm at 800 1C, while that of crystallites in enamelincreased from 3.81 (SD: 0.28) nm at RT to 4.90 (SD: 0.04) nmat 800 1C (for additional values see Table 1).
j o u r n a l o f t h e m e c h a n i c a l b e h a v i o r o f b i o m e d i c a l m a t e r i a l s 3 2 ( 2 0 1 4 ) 1 1 3 – 1 2 4118

3.1.2. Orientation and degree of alignmentThe 2D maps of the degree of alignment variation of the samethree samples (RT, 500 1C and 700 1C) within the interestedregion were shown respectively in Fig. 2g–i. The enamel anddentine show distinctive results visualized by the colourcoding. Similar gradient features as the mean thicknessresults were observed. Generally, enamel has higher degreeof alignment than dentine. However, it was found that thedegree of alignment of both enamel and dentine decreasedwith temperature as the colour changed mostly from red toyellow in enamel and yellow to blue in dentine.
The angular orientation of the mineral particles in the 2Dteeth slices is depicted by the small black lines superimposedon the degree of alignment mapping (shown in Fig. 2g–i). Inenamel, all the particles are almost orthogonal to the DEJplane. Same features can be observed for the particles indentine but only for the region far beneath the transition areaof the DEJ. It appears that mineral particles gradually becomeparallel to the DEJ plane through the region near DEJ.
The same central line of dentine and enamel as presented inthe mean thickness visualization were selected from 2D map-ping results. Only the line variation of the result in dentine is ofthe most interest and is shown in Fig. 3b. It is found that in thespecific area in dentine just beneath the DEJ, the degree ofalignment is relatively higher than the area far away from DEJ,shown as a bump in Fig. 3b. However, the overall degree ofalignment of crystals in dentine decreased (also see Fig. 4c and d)and the bump gradually disappeared with increasing tempera-ture. This indicates a tendency towards more random distribu-tion of crystals as the temperature increased (see Table 1).
3.2. Mechanical properties characterization
3.2.1. Reduced modulusFig. 2j–l demonstrate the results of the spatial distribution ofreduced modulus within the 2D interested area of the three
samples (RT, 500 1C and 700 1C). The DEJ is clearly visiblewhereas the distribution inside the enamel and dentine islimited. It was found that only enamel has a pronouncedcolour change (from yellow–red in Fig. 2j to light blue inFig. 2l), indicating a significant decrease of reduced modulusin enamel with temperature.
The variations of the averaged reduced modulus of thecentral line of dentine and enamel with respect to all thetested temperatures are illustrated in Fig. 4a and c. From thefigure, it is found that the averaged reduced modulus ofdentine decreased from 20 (SD: 6) GPa at RT to 15 (SD: 2) GPaat 500 1C and then increased to 29 (SD: 10) GPa at 800 1C, whilein enamel it decreased from 70 (SD: 17) GPa at RT to 56 (SD:17) GPa at 500 1C, and then further down to 47 (SD: 18) GPa at800 1C (see Table 1).
3.2.2. HardnessThe overall spatial distribution of hardness of the three samples(RT, 500 1C and 700 1C) in the ROI can be observed in Fig. 2m–o.The DEJ is still recognisable, but the spatial changes are not asclearly shown as in the structural mapping of thickness anddegree of alignment. Similar tendency as the reduced moduluswas found that the hardness of enamel dropped significantlywith temperature, which is reflected from the pronouncedcolour change.
The detailed alteration of the hardness with increasingtemperature is also reflected in the variation of the averagedhardness of the selected central line of dentine and enamel(Fig. 4b and d). It was found that the averaged hardnessvariations have the similar tendency of variation as that ofthe averaged reduced modulus both in dentine and enamel.The averaged hardness in dentine decreased from 0.7 (SD:0.1) GPa at RT down to 0.4 (SD: 0.1) GPa at 500 1C and thenincreased to 0.8 (SD: 0.3) GPa at 800 1C, while in enamel theaveraged hardness decreased from 3.0 (SD: 1.3) GPa at RT to
Fig. 3 – Ultrastructural variations along the central line from the 2D mapping result of ROI as a function of temperature anddistance from DEJ. (a) results of the mean thickness of HAp. The first three measurement points (with minus distances fromDEJ) represent the results in enamel; (b) results of the degree of alignment of HAp. Only the results of crystals in dentine areshown due to the complex variation happened beneath the DEJ.
j o u r n a l o f t h e m e c h a n i c a l b e h a v i o r o f b i o m e d i c a l m a t e r i a l s 3 2 ( 2 0 1 4 ) 1 1 3 – 1 2 4 119

Fig. 4 – Correlation analysis between structural–mechanical parameters coupled with increasing temperature (“E” meansenamel while “D” means dentine). All the results are the averaged values of different regions along the selected central line inROI. (a) mean thickness vs. reduced modulus; (b) mean thickness vs. hardness; (c) degree of alignment vs. reduced modulus;(d) degree of alignment vs. hardness. Error bars71 SD. (For interpretation of the references to color in this figure, the reader isreferred to the web version of this article).
Table 1 – Overview of SAXS and nanoindentation measurement results collected from central line from 2D mappingresults. Statistical significance was evaluated using two-tailed paired sample t-tests with a 95% confidence interval for themean thickness results (npo0.05, nnpo0.005, nnnpo0.0005).
Temperature (1C) Mean crystalline thickness (nm) Degree of alignment Hardness (GPa) Reduced modulus (GPa)
RT Enamel 3.81(SD: 0.28) 0.50(SD: 0.02) 3.0(SD: 1.3) 70(SD:17)400 4.07(0.02) 0.53(0.01)500 4.73(0.16)n 0.48(0.02) 2.9(1.5) 56(17)600 4.79(0.06) 0.31(0.05)700 4.93(0.09) 0.28(0.03) 2.6(0.7) 51(11)800 4.90(0.04) 0.28(0.01) 2.0(0.1) 47(18)
RT Dentine 1.94(0.06) 0.23(0.03) 0.7(0.1) 20(6)400 3.09(0.09)nnn 0.29(0.06)500 4.05(0.02)nnn 0.26(0.03) 0.4(0.1) 15(2)600 5.16(0.12)nnn 0.17(0.03)700 4.96(0.03)nnn 0.15(0.02) 0.6(0.3) 18(6)800 5.16(0.06) 0.17(0.01) 0.8(0.3) 29(10)
j o u r n a l o f t h e m e c h a n i c a l b e h a v i o r o f b i o m e d i c a l m a t e r i a l s 3 2 ( 2 0 1 4 ) 1 1 3 – 1 2 4120

2.9 (SD:1.5) GPa at 500 1C and then to 2.0 (SD:0.1) GPa at 800 1C(see Table 1).
3.3. Crystal perfection
The WAXS patterns diffracted from HAp crystals in both theenamel and dentine provide information about the crystal-line perfection difference in different regions. Due to thelimited size of the 2D detector, only the (002) peak could becaptured and analyzed. Fig. 5 shows the diffraction intensityvariation of (002) peak for a selected region of scatteringangles (11.21–11.51) with the temperature change. A sharpen-ing of the peak at higher temperatures was observed, com-pared to the broad one of the control sample at lowertemperature. This represents an increased diffraction con-tribution from HAp crystals within this scattering angle rangeas the temperature increased, which indicates that thecrystal perfection increased remarkably during the heating.Note that the peak sharpening in dentine is more obviousthan that in enamel.
4. Discussion
The ultrastructural alteration of skeletal hard tissues exposedto the thermal treatment process developed in the presentstudy provides a better, more reliable basis for deducing theheating history, compared with the conventional methodsbased on monitoring the macro- and microstructural colour(Piga et al., 2009; Thompson, 2005; Thompson et al., 2013) inthe forensic and archaeological investigation. In the clinicalapplication like caries prevention, the present study offers anopportunity to characterise the microstructural featuresaffected by laser therapies.
The previous analysis of the entire powdered tooth ana-lysis obscures the sharpness of ultrastructural variationsin dentine and enamel (Kugler, 2003; Piga et al., 2009). The
present study clearly illustrates how the observed evolutionof ultrastructure reflects the differences between dentine andenamel, suggesting that enamel and dentine must be inves-tigated separately in order to evaluate the exposure tempera-ture precisely in the forensic cases as well as optimise laser-assistant treatment in clinical application.
The structural–mechanical properties correlation to thetemperature provides an additional guidance to track theheating history in the forensic study. In addition, for cariesprevention, it provides the evidence that the alteration ofmechanical properties should also be taken into accountduring the sintering process, since the decreased hardnessmay induce micro-cracks with increasing temperature.
4.1. Ultrastructural observations
4.1.1. Mean crystalline thicknessOverall the mean crystalline thickness distribution in dentinewas more uniform compared with that in enamel. The meancrystalline thickness was observed to obviously decrease inenamel and slightly increase in dentine towards DEJ at lowtemperature, which may be ascribed to the gradient proper-ties of human dental slice (Jacobs et al., 1973) as illustrated inFig. 3a. However, as temperature increases, this gradientbecomes smaller, which can be clearly seen in Fig. 3a. Besidesthe visible gradient features, the major drop was visible nearthe transition area around the DEJ, indicating the spatialstructural variation in the human dental slice.
The mean crystalline thickness of the control sample(3.81 (SD: 0.28) nm in dentine and 1.94 (SD: 0.06) nm inenamel) is consistent with the earlier transmission electronmicroscopy (TEM) studies and XRD data (Marten et al., 2010;Reiche et al., 2002). The increase of mean crystalline thick-ness happened after 400 1C which implied the HAp crystal-lites starting to sinter, leading to grain size growth. Thisprocess becomes dramatic after 600 1C, as can be confirmedby tracking the WAXS peak variation as illustrated in the
Fig. 5 – Intensity variation of the (002) reflection in the WAXS patterns of different regions at different temperatures: (a) enameland (b) dentine. The observed peak sharpening and higher intensity at higher temperatures compared with the controlsample indicates an increased diffraction contribution from HAp crystallites.
j o u r n a l o f t h e m e c h a n i c a l b e h a v i o r o f b i o m e d i c a l m a t e r i a l s 3 2 ( 2 0 1 4 ) 1 1 3 – 1 2 4 121

Fig. 5 (Pramanik et al., 2013). In addition, the small increase incrystallite size for enamel with increasing temperature islikely to be related to the denser arrangement of HAp crystal-lites compared with dentine.
4.1.2. Orientation and degree of alignmentThe local structural variation of the degree of alignment indentine with distance from DEJ (Fig. 3b) represents an inter-nal ultra- and micro-structural adaptation matching thegeometry of the human tooth. The higher degree of align-ment of HAp crystallites near DEJ is expected to stiffen thedentine. Thus the higher mineral particle co-alignmentsbeneath the chewing surface cusps may be important forthe transfer or the redistribution of mastication loads fromthe much harder, highly mineralised enamel deep into bulkdentine (Eliceiri et al., 2012).
The degree of alignment in dentine (0.23 (SD: 0.03)) fromthe control sample (room temperature, Fig. 4c and d) showsan almost random orientation of HAp crystallites, while theresult in enamel indicates a stronger textured orientation(0.50 (SD: 0.02)). This is consistent with earlier SAXS resultsfor dental tissue (Eliceiri et al., 2012; Jiang et al., 2005), wherethe internal architecture in dentine was observed to be net-like fibrils wound around tubules with decorated HAp crystal-lites. If it is observed along tubule direction, the fibrils willdisplay an almost random distribution (Bozec et al., 2005).Therefore, when the beam illuminates perpendicular to thedental slice, i.e. perpendicular to the cross section of tubule,the HAp crystallites will have a much lower degree ofalignment than that of well-packed HAp crystallites inenamel, which crystallites partially aligned along the prisms(or rods) (Macho et al., 2003). It is noted that in both dentineand enamel, there is a reduction in the degree of alignmentas the temperature increased. The reduction of the overalldegree of alignment as well as the bump gradient of thecentral line observed in Fig. 3b with increasing temperature
may be explained by the burning-off or gradual disappear-ance of the organic phase most of which is collagen. Since theorganic phase serves as the support of the structure, suchdisappearance may lead to the rearrangement of crystallitesassociated with rotation or anisotropic sintering. In addition,the rearrangement of crystallites may increase the crystalperfection, especially in dentine (Fig. 5), due to its largeramount of organic phase than in enamel.
4.2. Mechanical properties characterization
Both hardness and reduced modulus mapping showedthe obvious contrast of properties between the dentine andenamel. The boundary between dentine and enamel is clearlyshown in Fig. 2j–o and regions with large reduced modulusand hardness match very well as expected. However, it wasfound that the transition feature of mechanical properties indentine was not as clear as the ultrastructural visualization,which was partly due to the low resolution of nanoindenta-tion compared with SAXS/WAXS and the mechanical-response dispersion of both enamel and dentine. In addition,the existing cracks or surface defects in all the samples mayaffect the indentation results, and increase the relativelylarge error bounds in Fig. 4.
The hardness (0.7 (SD: 0.1) GPa in dentine and 3.0 (SD:1.3) GPa in enamel) and reduced modulus (20 (SD: 6) GPa indentine and 70 (SD: 17) GPa in enamel) of the control samplewere consistent with the earlier nanoindentation studies ondental tissues (Roy and Basu, 2008; Tesch et al., 2001). Thedifferent behaviours of dentine and enamel might result fromtheir different mineral contents. The initial reduction of themechanical properties in dentine might be due to the gradualdisappearance of collagen and the subsequent increase athigher temperatures might be explained by the occurrence ofsintering and significantly increased crystal perfection, which
Fig. 6 – Crack development revealed by micro-CT cross-sectional images. The control sample (a) shows no cracks around theDEJ; whilst an increase in number of cracks and lifting of the enamel can be seen at 500 1C (b) and 700 1C (c).
j o u r n a l o f t h e m e c h a n i c a l b e h a v i o r o f b i o m e d i c a l m a t e r i a l s 3 2 ( 2 0 1 4 ) 1 1 3 – 1 2 4122
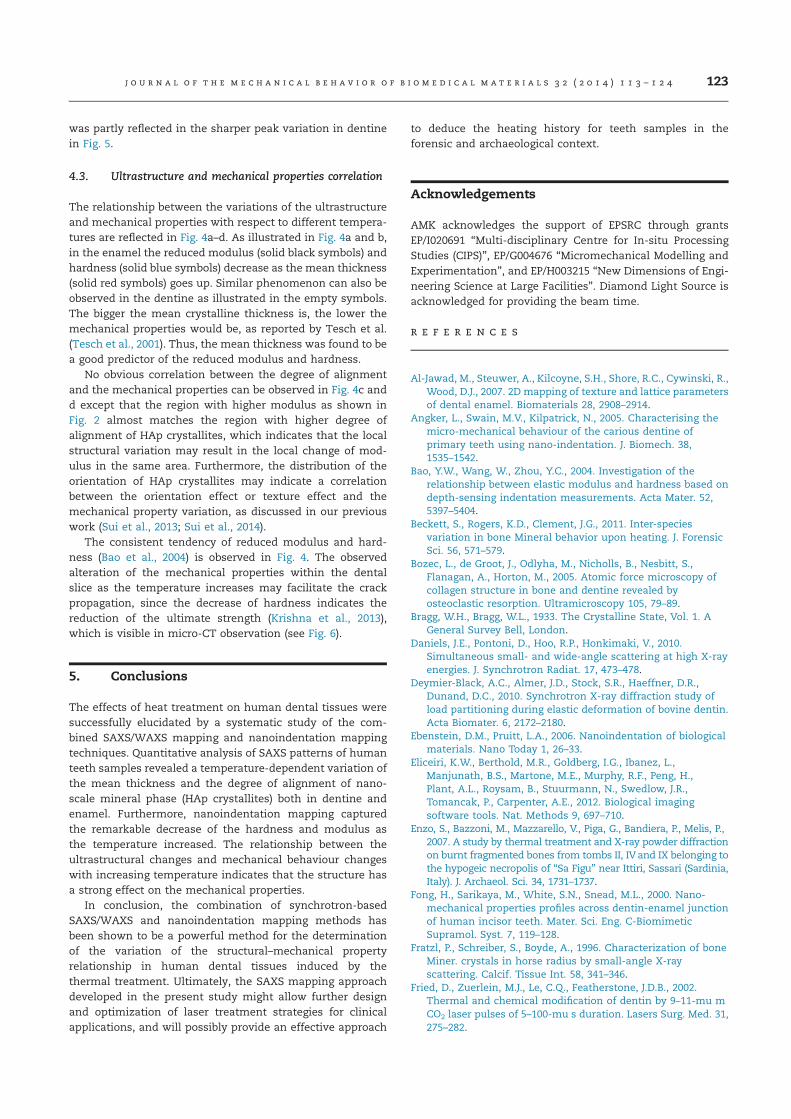
was partly reflected in the sharper peak variation in dentinein Fig. 5.
4.3. Ultrastructure and mechanical properties correlation
The relationship between the variations of the ultrastructureand mechanical properties with respect to different tempera-tures are reflected in Fig. 4a–d. As illustrated in Fig. 4a and b,in the enamel the reduced modulus (solid black symbols) andhardness (solid blue symbols) decrease as the mean thickness(solid red symbols) goes up. Similar phenomenon can also beobserved in the dentine as illustrated in the empty symbols.The bigger the mean crystalline thickness is, the lower themechanical properties would be, as reported by Tesch et al.(Tesch et al., 2001). Thus, the mean thickness was found to bea good predictor of the reduced modulus and hardness.
No obvious correlation between the degree of alignmentand the mechanical properties can be observed in Fig. 4c andd except that the region with higher modulus as shown inFig. 2 almost matches the region with higher degree ofalignment of HAp crystallites, which indicates that the localstructural variation may result in the local change of mod-ulus in the same area. Furthermore, the distribution of theorientation of HAp crystallites may indicate a correlationbetween the orientation effect or texture effect and themechanical property variation, as discussed in our previouswork (Sui et al., 2013; Sui et al., 2014).
The consistent tendency of reduced modulus and hard-ness (Bao et al., 2004) is observed in Fig. 4. The observedalteration of the mechanical properties within the dentalslice as the temperature increases may facilitate the crackpropagation, since the decrease of hardness indicates thereduction of the ultimate strength (Krishna et al., 2013),which is visible in micro-CT observation (see Fig. 6).
5. Conclusions
The effects of heat treatment on human dental tissues weresuccessfully elucidated by a systematic study of the com-bined SAXS/WAXS mapping and nanoindentation mappingtechniques. Quantitative analysis of SAXS patterns of humanteeth samples revealed a temperature-dependent variation ofthe mean thickness and the degree of alignment of nano-scale mineral phase (HAp crystallites) both in dentine andenamel. Furthermore, nanoindentation mapping capturedthe remarkable decrease of the hardness and modulus asthe temperature increased. The relationship between theultrastructural changes and mechanical behaviour changeswith increasing temperature indicates that the structure hasa strong effect on the mechanical properties.
In conclusion, the combination of synchrotron-basedSAXS/WAXS and nanoindentation mapping methods hasbeen shown to be a powerful method for the determinationof the variation of the structural–mechanical propertyrelationship in human dental tissues induced by thethermal treatment. Ultimately, the SAXS mapping approachdeveloped in the present study might allow further designand optimization of laser treatment strategies for clinicalapplications, and will possibly provide an effective approach
to deduce the heating history for teeth samples in theforensic and archaeological context.
Acknowledgements
AMK acknowledges the support of EPSRC through grantsEP/I020691 “Multi-disciplinary Centre for In-situ ProcessingStudies (CIPS)”, EP/G004676 “Micromechanical Modelling andExperimentation”, and EP/H003215 “New Dimensions of Engi-neering Science at Large Facilities”. Diamond Light Source isacknowledged for providing the beam time.
r e f e r e n c e s
Al-Jawad, M., Steuwer, A., Kilcoyne, S.H., Shore, R.C., Cywinski, R.,Wood, D.J., 2007. 2D mapping of texture and lattice parametersof dental enamel. Biomaterials 28, 2908–2914.
Angker, L., Swain, M.V., Kilpatrick, N., 2005. Characterising themicro-mechanical behaviour of the carious dentine ofprimary teeth using nano-indentation. J. Biomech. 38,1535–1542.
Bao, Y.W., Wang, W., Zhou, Y.C., 2004. Investigation of therelationship between elastic modulus and hardness based ondepth-sensing indentation measurements. Acta Mater. 52,5397–5404.
Beckett, S., Rogers, K.D., Clement, J.G., 2011. Inter-speciesvariation in bone Mineral behavior upon heating. J. ForensicSci. 56, 571–579.
Bozec, L., de Groot, J., Odlyha, M., Nicholls, B., Nesbitt, S.,Flanagan, A., Horton, M., 2005. Atomic force microscopy ofcollagen structure in bone and dentine revealed byosteoclastic resorption. Ultramicroscopy 105, 79–89.
Bragg, W.H., Bragg, W.L., 1933. The Crystalline State, Vol. 1. AGeneral Survey Bell, London.
Daniels, J.E., Pontoni, D., Hoo, R.P., Honkimaki, V., 2010.Simultaneous small- and wide-angle scattering at high X-rayenergies. J. Synchrotron Radiat. 17, 473–478.
Deymier-Black, A.C., Almer, J.D., Stock, S.R., Haeffner, D.R.,Dunand, D.C., 2010. Synchrotron X-ray diffraction study ofload partitioning during elastic deformation of bovine dentin.Acta Biomater. 6, 2172–2180.
Ebenstein, D.M., Pruitt, L.A., 2006. Nanoindentation of biologicalmaterials. Nano Today 1, 26–33.
Eliceiri, K.W., Berthold, M.R., Goldberg, I.G., Ibanez, L.,Manjunath, B.S., Martone, M.E., Murphy, R.F., Peng, H.,Plant, A.L., Roysam, B., Stuurmann, N., Swedlow, J.R.,Tomancak, P., Carpenter, A.E., 2012. Biological imagingsoftware tools. Nat. Methods 9, 697–710.
Enzo, S., Bazzoni, M., Mazzarello, V., Piga, G., Bandiera, P., Melis, P.,2007. A study by thermal treatment and X-ray powder diffractionon burnt fragmented bones from tombs II, IVand IX belonging tothe hypogeic necropolis of “Sa Figu” near Ittiri, Sassari (Sardinia,Italy). J. Archaeol. Sci. 34, 1731–1737.
Fong, H., Sarikaya, M., White, S.N., Snead, M.L., 2000. Nano-mechanical properties profiles across dentin-enamel junctionof human incisor teeth. Mater. Sci. Eng. C-BiomimeticSupramol. Syst. 7, 119–128.
Fratzl, P., Schreiber, S., Boyde, A., 1996. Characterization of boneMiner. crystals in horse radius by small-angle X-rayscattering. Calcif. Tissue Int. 58, 341–346.
Fried, D., Zuerlein, M.J., Le, C.Q., Featherstone, J.D.B., 2002.Thermal and chemical modification of dentin by 9–11-mu mCO2 laser pulses of 5–100-mu s duration. Lasers Surg. Med. 31,275–282.
j o u r n a l o f t h e m e c h a n i c a l b e h a v i o r o f b i o m e d i c a l m a t e r i a l s 3 2 ( 2 0 1 4 ) 1 1 3 – 1 2 4 123
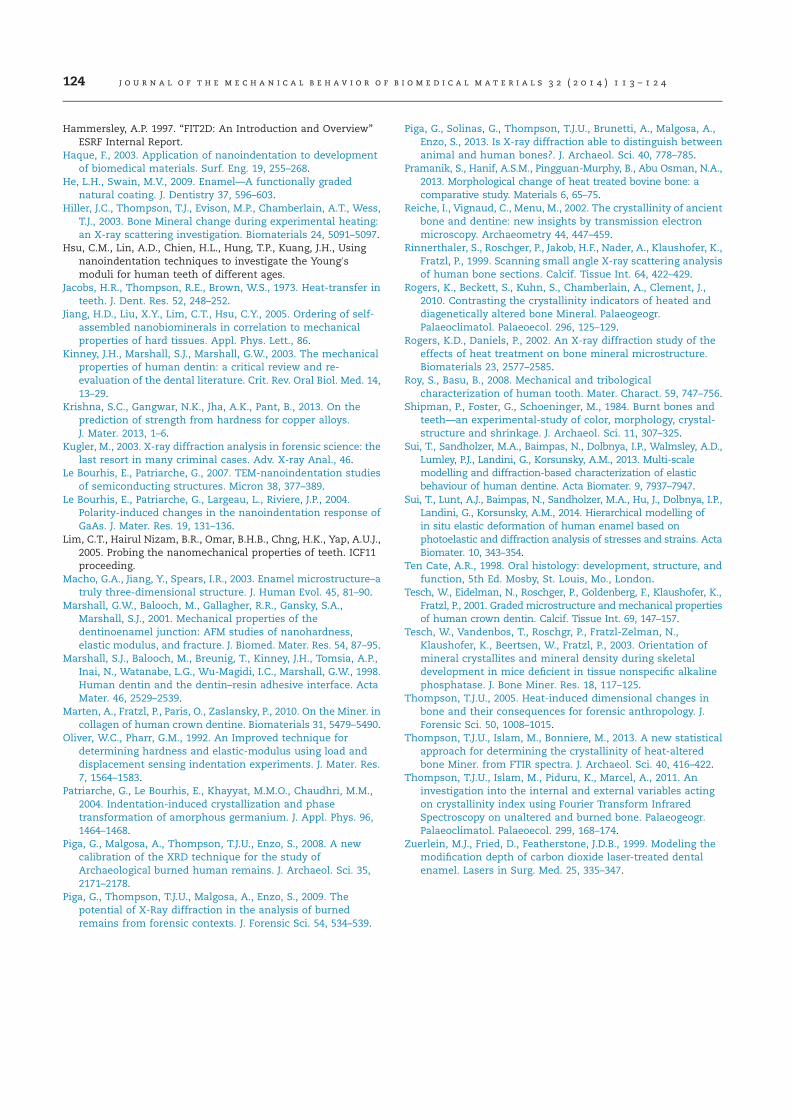
Hammersley, A.P. 1997. “FIT2D: An Introduction and Overview”ESRF Internal Report.
Haque, F., 2003. Application of nanoindentation to developmentof biomedical materials. Surf. Eng. 19, 255–268.
He, L.H., Swain, M.V., 2009. Enamel—A functionally gradednatural coating. J. Dentistry 37, 596–603.
Hiller, J.C., Thompson, T.J., Evison, M.P., Chamberlain, A.T., Wess,T.J., 2003. Bone Mineral change during experimental heating:an X-ray scattering investigation. Biomaterials 24, 5091–5097.
Hsu, C.M., Lin, A.D., Chien, H.L., Hung, T.P., Kuang, J.H., Usingnanoindentation techniques to investigate the Young0smoduli for human teeth of different ages.
Jacobs, H.R., Thompson, R.E., Brown, W.S., 1973. Heat-transfer inteeth. J. Dent. Res. 52, 248–252.
Jiang, H.D., Liu, X.Y., Lim, C.T., Hsu, C.Y., 2005. Ordering of self-assembled nanobiominerals in correlation to mechanicalproperties of hard tissues. Appl. Phys. Lett., 86.
Kinney, J.H., Marshall, S.J., Marshall, G.W., 2003. The mechanicalproperties of human dentin: a critical review and re-evaluation of the dental literature. Crit. Rev. Oral Biol. Med. 14,13–29.
Krishna, S.C., Gangwar, N.K., Jha, A.K., Pant, B., 2013. On theprediction of strength from hardness for copper alloys.J. Mater. 2013, 1–6.
Kugler, M., 2003. X-ray diffraction analysis in forensic science: thelast resort in many criminal cases. Adv. X-ray Anal., 46.
Le Bourhis, E., Patriarche, G., 2007. TEM-nanoindentation studiesof semiconducting structures. Micron 38, 377–389.
Le Bourhis, E., Patriarche, G., Largeau, L., Riviere, J.P., 2004.Polarity-induced changes in the nanoindentation response ofGaAs. J. Mater. Res. 19, 131–136.
Lim, C.T., Hairul Nizam, B.R., Omar, B.H.B., Chng, H.K., Yap, A.U.J.,2005. Probing the nanomechanical properties of teeth. ICF11proceeding.
Macho, G.A., Jiang, Y., Spears, I.R., 2003. Enamel microstructure–atruly three-dimensional structure. J. Human Evol. 45, 81–90.
Marshall, G.W., Balooch, M., Gallagher, R.R., Gansky, S.A.,Marshall, S.J., 2001. Mechanical properties of thedentinoenamel junction: AFM studies of nanohardness,elastic modulus, and fracture. J. Biomed. Mater. Res. 54, 87–95.
Marshall, S.J., Balooch, M., Breunig, T., Kinney, J.H., Tomsia, A.P.,Inai, N., Watanabe, L.G., Wu-Magidi, I.C., Marshall, G.W., 1998.Human dentin and the dentin–resin adhesive interface. ActaMater. 46, 2529–2539.
Marten, A., Fratzl, P., Paris, O., Zaslansky, P., 2010. On the Miner. incollagen of human crown dentine. Biomaterials 31, 5479–5490.
Oliver, W.C., Pharr, G.M., 1992. An Improved technique fordetermining hardness and elastic-modulus using load anddisplacement sensing indentation experiments. J. Mater. Res.7, 1564–1583.
Patriarche, G., Le Bourhis, E., Khayyat, M.M.O., Chaudhri, M.M.,2004. Indentation-induced crystallization and phasetransformation of amorphous germanium. J. Appl. Phys. 96,1464–1468.
Piga, G., Malgosa, A., Thompson, T.J.U., Enzo, S., 2008. A newcalibration of the XRD technique for the study ofArchaeological burned human remains. J. Archaeol. Sci. 35,2171–2178.
Piga, G., Thompson, T.J.U., Malgosa, A., Enzo, S., 2009. Thepotential of X-Ray diffraction in the analysis of burnedremains from forensic contexts. J. Forensic Sci. 54, 534–539.
Piga, G., Solinas, G., Thompson, T.J.U., Brunetti, A., Malgosa, A.,Enzo, S., 2013. Is X-ray diffraction able to distinguish betweenanimal and human bones?. J. Archaeol. Sci. 40, 778–785.
Pramanik, S., Hanif, A.S.M., Pingguan-Murphy, B., Abu Osman, N.A.,2013. Morphological change of heat treated bovine bone: acomparative study. Materials 6, 65–75.
Reiche, I., Vignaud, C., Menu, M., 2002. The crystallinity of ancientbone and dentine: new insights by transmission electronmicroscopy. Archaeometry 44, 447–459.
Rinnerthaler, S., Roschger, P., Jakob, H.F., Nader, A., Klaushofer, K.,Fratzl, P., 1999. Scanning small angle X-ray scattering analysisof human bone sections. Calcif. Tissue Int. 64, 422–429.
Rogers, K., Beckett, S., Kuhn, S., Chamberlain, A., Clement, J.,2010. Contrasting the crystallinity indicators of heated anddiagenetically altered bone Mineral. Palaeogeogr.Palaeoclimatol. Palaeoecol. 296, 125–129.
Rogers, K.D., Daniels, P., 2002. An X-ray diffraction study of theeffects of heat treatment on bone mineral microstructure.Biomaterials 23, 2577–2585.
Roy, S., Basu, B., 2008. Mechanical and tribologicalcharacterization of human tooth. Mater. Charact. 59, 747–756.
Shipman, P., Foster, G., Schoeninger, M., 1984. Burnt bones andteeth—an experimental-study of color, morphology, crystal-structure and shrinkage. J. Archaeol. Sci. 11, 307–325.
Sui, T., Sandholzer, M.A., Baimpas, N., Dolbnya, I.P., Walmsley, A.D.,Lumley, P.J., Landini, G., Korsunsky, A.M., 2013. Multi-scalemodelling and diffraction-based characterization of elasticbehaviour of human dentine. Acta Biomater. 9, 7937–7947.
Sui, T., Lunt, A.J., Baimpas, N., Sandholzer, M.A., Hu, J., Dolbnya, I.P.,Landini, G., Korsunsky, A.M., 2014. Hierarchical modelling ofin situ elastic deformation of human enamel based onphotoelastic and diffraction analysis of stresses and strains. ActaBiomater. 10, 343–354.
Ten Cate, A.R., 1998. Oral histology: development, structure, andfunction, 5th Ed. Mosby, St. Louis, Mo., London.
Tesch, W., Eidelman, N., Roschger, P., Goldenberg, F., Klaushofer, K.,Fratzl, P., 2001. Graded microstructure and mechanical propertiesof human crown dentin. Calcif. Tissue Int. 69, 147–157.
Tesch, W., Vandenbos, T., Roschgr, P., Fratzl-Zelman, N.,Klaushofer, K., Beertsen, W., Fratzl, P., 2003. Orientation ofmineral crystallites and mineral density during skeletaldevelopment in mice deficient in tissue nonspecific alkalinephosphatase. J. Bone Miner. Res. 18, 117–125.
Thompson, T.J.U., 2005. Heat-induced dimensional changes inbone and their consequences for forensic anthropology. J.Forensic Sci. 50, 1008–1015.
Thompson, T.J.U., Islam, M., Bonniere, M., 2013. A new statisticalapproach for determining the crystallinity of heat-alteredbone Miner. from FTIR spectra. J. Archaeol. Sci. 40, 416–422.
Thompson, T.J.U., Islam, M., Piduru, K., Marcel, A., 2011. Aninvestigation into the internal and external variables actingon crystallinity index using Fourier Transform InfraredSpectroscopy on unaltered and burned bone. Palaeogeogr.Palaeoclimatol. Palaeoecol. 299, 168–174.
Zuerlein, M.J., Fried, D., Featherstone, J.D.B., 1999. Modeling themodification depth of carbon dioxide laser-treated dentalenamel. Lasers in Surg. Med. 25, 335–347.
j o u r n a l o f t h e m e c h a n i c a l b e h a v i o r o f b i o m e d i c a l m a t e r i a l s 3 2 ( 2 0 1 4 ) 1 1 3 – 1 2 4124

In situ X-ray scattering evaluation of heat-induced ultrastructural changes in
dental tissues and synthetic hydroxyapatite
Tan Sui1, Michael A. Sandholzer2, Alexander J.G. Lunt1, Nikolaos Baimpas1, Andrew Smith3, Gabriel Landini2, Alexander M. Korsunsky1
1 Department of Engineering Science, University of Oxford, Parks Road, Oxford OX1 3PJ, United Kingdom
2 School of Dentistry, College of Medical and Dental Sciences, University of Birmingham, St. Chad’s Queensway, Birmingham B4 6NN, United Kingdom
3Diamond Light Source Ltd, Harwell Science and Innovation Campus, Didcot OX11 0DE, United Kingdom
Abstract
Human dental tissues consist of inorganic constituents (mainly crystallites of
hydroxyapatite, HAp) and organic matrix. In addition, synthetic HAp powders are frequently
used in medical and chemical applications. Insight into the ultrastructural alterations of
skeletal hard tissues exposed to thermal treatment is crucial for the estimation of temperature
of exposure in forensic and archaeological studies. However, at present only limited data exist
on the heat-induced structural alterations of human dental tissues. In this paper, advanced
non-destructive Small- and Wide Angle X-ray Scattering (SAXS/WAXS) synchrotron
techniques were used to investigate the in situ ultrastructural alterations in thermally treated
human dental tissues and synthetic HAp powders. The crystallographic properties were
probed by WAXS, whilst HAp grain size distribution changes were evaluated by SAXS. The
results demonstrate the important role of the organic matrix that binds together the HAp
crystallites in responding to heat exposure. This is highlighted by the difference in the thermal
behaviour between human dental tissues and synthetic HAp powders. The X-ray analysis
results are supported by thermogravimetric analysis (TGA). The results concerning the HAp
crystalline architecture in natural and synthetic HAp powders provide a reliable basis for
deducing the heating history for dental tissues in the forensic and archaeological context, and
the foundation for further development and optimization of biomimetic material design.
Keywords: in situ thermal treatment; dental tissue; hydroxyapatite; SAXS/WAXS

1. Introduction Hydroxyapatite (HAp) crystallites that are closely integrated in the organic matrix at the
nano-scale are the main inorganic constituents of the hierarchical mineralized human dental
tissues, namely, enamel and dentine. Such natural HAp crystallites are understood to be
crucial to the physiology and function of dental tissues [1]. In parallel, recent developments in
synthetic biomineralization have demonstrated that synthetic HAp powders can play an
important role for medical applications, especially for the replacement or treatment of dental
tissues [2].
Advanced high-energy treatment techniques are finding increasing use in modern dentistry.
In the early 1970s, Kantola et al. [3] showed that laser treatment of dental tissues can be used
to increase the mineral content and crystallinity of dentine by preferential removal of the
inherent water and protein. With the advent of a variety of new laser systems spanning a range
of energy densities and pulse durations, clinical treatments such as laser-assisted caries
protection were proposed and developed. Local temperature induced by short pulse laser
treatment leads to local heating to temperatures between several hundred °C to over 1000°C.
The alteration of dental tissue remains highly localised and improved caries prevention is
surmised to be associated with increased mineralisation and HAp crystallite sintering that
leads to the sealing of dentinal tubules, whilst leaving the remaining tissues intact due to the
confined effect of less than 10 μm in depth (at the fluence of 2 J/cm2)[4, 5].
Any change in the local environment of HAp crystallites, e.g. through laser illumination or
direct heating, is bound to affect the mineral ultrastructure. In the context of archaeological
and forensic investigations, while macroscopic alterations (e.g. surface colour) can be used to
deduce an approximate temperature range, the investigation of the micro- and ultrastructural
alterations of skeletal hard tissue to high temperatures has proven to be crucial to obtain a
reliable estimation of the temperature of exposure [6-8]. This, in turn, sheds light on the
attendant circumstances, e.g. the presence and nature of combustible agent used. Dental
tissues, being the most highly mineralised part of the human body, can withstand longer

thermal exposure and survive higher temperatures, thus offering the possibility of extending
the range of applicability of this technique [9].
The above considerations provide strong motivation for a detailed study into the effect of
thermal exposure on the nano-structure (the arrangement of HAp crystallites) of human dental
tissue, as well as the role of the organic phase. Whilst much research has been carried out into
the heat-induced changes that occur in bone, in connection with human remains studied in the
context of archaeology, anthropology and paleontology [10-13], the corresponding range and
depth of study of the thermal response of dental tissues remains lacking [6, 14].
Multiple techniques have been used to study heat-induced ultrastructural alterations of
skeletal hard tissues. Most widely applied techniques are based on the absorption spectra of
infrared radiation (Fourier transform infrared spectroscopy, FTIR), or lab-based X-ray powder
diffraction (XRD) and lab-based small angle X-ray scattering (SAXS) [6, 10, 15-17].
However, there has been on-going debate regarding the general limitations and validity of the
results quantified by FTIR [6, 15, 16]. Lab-based XRD has been shown to be capable of
showing the distinct differences in the response of HAp crystallites to heating between animal
and human bone [6, 16, 18]. As a complementary method, lab-based SAXS allows the
identification of local structural alterations at the nano-scale, and is also capable of a fast
throughput of samples [19]. However, both methods usually involve the grinding of a sample
into powder to obtain volume-averaged results that do not provide appropriately spatially
resolved information on the local changes of skeletal ultrastructure within the tissue [19, 20].
In order to understand and quantify more precisely the mechanism of such ultrastructural
alterations with temperature, the application of advanced non-destructive techniques offers an
appropriate route. One of the most advanced non-destructive techniques is synchrotron based
X-ray diffraction, namely, WAXS and SAXS. These methods have been used to characterise
human dental tissues [21, 22], which enabled the characterisation of the ultrastructure of
mineralized tissue using intact (not ground) samples, rather than powdered samples used with
lab-based techniques.

Recently, the non-destructive synchrotron based techniques (WAXS/SAXS) have been
applied to the study of previously thermally treated human dental tissues [9]. However, these
tests were conducted ex situ, where it was possible to consider only a limited number of
samples after exposure to temperatures in the range in 400°C -900°C. In addition, by
necessity, different samples were used for each measurement and thus the sample-to-sample
ultrastructure variation could not be excluded. This aspect may weaken the reliability of the
conclusions drawn regarding the mechanism of local ultrastructural changes. Furthermore, the
ex situ mode of sample characterisation is only applied after heating and cooling the samples
to/from different temperatures. Obviously, no information is available on the structure
evolution during heating, nor cooling. To the best of our knowledge no results have been
reported on monitoring heat-induced ultrastructural changes of HAp crystallites using an in
situ experimental protocol spanning the entire relevant range of heating and cooling, nor has
the comparison been made between the naturally occurring HAp crystallites within human
dental tissues and synthetic HAp powders. Thus in situ thermal measurement will help to
understand the internal architecture of complex natural materials (highly mineralised human
tissues), and its evolution during thermal exposure.
In this paper we report the evaluation of the crystallographic properties (d-spacing and
crystal perfection and size) and the nano-structure (thickness, orientation and degree of
alignment) of HAp crystallites embedded within the dental-tissue, as well as synthetic HAp
powders subjected to in situ thermal treatment. The combination of synchrotron X-ray
scattering techniques (WAXS/SAXS) was employed. The results were analysed in order to
understand how the internal ultrastructure within the human dental tissues and the synthetic
HAp powders evolves during the heating and cooling schedule.

2. Materials and methods 2.1. Sample preparation
Freshly extracted intact human third molars (ethical approval obtained from the National
Research Ethics Committee; NHS-REC reference 09.H0405.33/ Consortium R&D No. 1465)
were washed and cleaned in distilled water to eliminate residues so that the possibility of
contamination or other chemical effects was excluded. The samples were cut into 1mm-thick
cross-sectional slices in the bucco-lingual orientation including dentine and enamel (see
Figure 1a) using a low speed diamond saw (Isomet Buehler Ltd., Lake Bluff, Illinois, USA)
and polished using a sequence of grit papers to minimise the induced residual strain. In total,
four cross-sections were prepared and were kept in distilled water in a commercial fridge at
4°C until the experiment was performed. Low temperature storage conditions ensured
relatively low diffusion rates so as to impede or exclude any possibility of superficial
demineralization effect of water.
A mould was filled with 100mg of commercially available HAp powder (Hydroxyapatite
HTP powder, Bio-Rad, Hercules, CA, USA) and compacted with using an Instron 5544
machine (Instron Ltd., Bucks, United Kingdom) at 1.8kN force. The resulting disk was
1.2mm thick and 8 mm in diameter, with an approximate density of 1150 mg/cm3.
The weight-loss over time was additionally evaluated using Thermogravimetry (TGA) at a
rate of 12˚C/min using three cube-shaped dental samples (3×3×3mm) extracted from two
molars. The weight fraction of the organic component was determined with TGA using one
cubic dentine sample that was placed in a rotating 10% formic acid bath for 14 days to
eliminate the mineral content, thus producing a purely organic sample.
2.2. In-situ scattering measurements
2.2.1. Thermal treatment setup
In situ thermal treatment of the samples was performed using a remotely operated and
monitored furnace that allows collection of SAXS/WAXS data at temperatures up to 1000˚C.
This furnace is a modification of the design used at Daresbury laboratory [23]. The samples
were fixed in specially designed ceramic sample holders. A Kapton window in the furnace

allowed a high-energy X-ray transmission setup to be used, as illustrated in Figure 1a. The
heating and cooling protocols were controlled using a Eurotherm controller. The protocols
incorporated ramps at 12oC/min, and constant temperature holds of 200 seconds for each
temperature level within dental slice samples studied (enamel and dentine in Figure 1d). The
protocol for synthetic HAp powders is also shown in Figure 1e. Slightly different thermal
protocols were used for natural and synthetic materials due to the limitations of the
experimental set-up (furnace heating rates accessible for different samples). However,
preliminary measurements carried out showed that, within the range of heating rates
considered, the resulting differences were negligible. The temperature output by the furnace
controller and thermocouple was of high accuracy (one decimal point, approximately 0.1°
nominal precision). Overall, the measurements were conducted at three different points in
dentine, one measurement point in enamel and one point in the synthetic HAp sample. Larger
number of data sets would improve the quality of data and provide better statistical
information on data quality. However, due to the limited availability of synchrotron beamtime,
the collection of additional datasets was not possible. The statistical error analysis of dentine
has been included in the results, and is reported below.
2.2.2. Beamline experimental setup
The experiment was carried out on the I22 experimental beamline at Diamond Light
Source, Oxford Harwell Campus, Didcot, UK. A monochromatic X-ray beam (photon energy
of 18keV) was used to illuminate the samples with the beam size of 65×120μm2 as illustrated
schematically in Figure 1a. At each heating or cooling step, WAXS and SAXS patterns were
simultaneously collected at consecutive heating and cooling increments at enamel and dentine
or synthetic HAp crystallite across the specimens. A lightly compacted disk of NIST standard
silicon powder was used for the WAXS data calibration and a disk of Silver Behenate (AgBe)
powder was used for the SAXS data calibration [24].
WAXS diffraction patterns (Figure 1b) were recorded using a Pilatus 100K detector
(Dectris, Baden, Switzerland) placed at a sample-to-camera distance of 275.55mm (Figure 1a).
Further downstream of the beam a Pilatus 2M detector (Dectris, Baden, Switzerland) was

positioned at a distance of 2892mm to collect the SAXS patterns (Figure 1c). In order to
record simultaneously the WAXS and SAXS patterns at each scanning location, the WAXS
detector was titled and offset at 11.5o to the incident beam.
2.3. X-ray scattering data analysis
2.3.1. WAXS data analysis
WAXS patterns appear graphically as separated rings with different widths and intensity
levels, which contain characteristic information related to the crystalline structure. The
analysis of WAXS patterns is performed using Bragg’s law, which establishes the relationship
between the spacing of atomic planes in crystals and the scattering angle at which these
planes produce intense reflections.
2 sinhklspacingn d (Eq. 1)
where λ is the wavelength, hklspacingd (d-spacing) is the interplanar distance between planes
with Miller indices {hkl}, θ is one half of the scattering angle and n is the order of the
reflection. Each peak corresponds to a certain family of lattice planes within a certain
crystallographic phase. The changes of d-spacing could be utilized to examine the residual
lattice strain and trace the phase transformation. Therefore, diffraction pattern analysis can be
used to identify and quantify the crystallographic phases and structure parameters. The typical
WAXS pattern is shown in Figure 1b can be used to extract and compare the crystallographic
properties (e.g. degree of crystal perfection) between different samples or the same samples at
different stages of its evolution [20].
In Figure 1b, the ring with the strongest intensity represents the diffraction from the (002)
family of lattice planes. Moreover, the (002) lattice plane reflection is the most distinct ring
that is reliably present in all three materials studied (dentine, enamel, synthetic HAp). WAXS
data can be interpreted in terms of the shift of the diffraction peak obtained from a cluster of
HAp crystallites. The variation of interplanar spacing (d-spacing) with respect to the
temperature between the corresponding lattice planes was captured using WAXS. The (002)
peak represents the orientation of the scattering vector along the hexagonal c-axis (parallel to

the long direction) within the HAp crystallites. It also corresponds to the organic fibril
orientation due to the parallel orientation of fibrils to the long direction in HAp crystallites.
The (002) peak is frequently used in determining the crystalline length in the bio-apatite and
thus was chosen as the principal peak considered in the present study [25]. In detail, each 2D
diffraction image was firstly pre-processed using Fit2D [26]. The (002) peak of interest from
each pattern was “caked” (i.e. binned in the radial-azimuthal coordinates) within the range of
20o in the y direction (Figure 1b). Subsequently the (002) peak was fitted with the Gaussian
curve to obtain the peak centre position of002spacingd . Finite dimensions of the scattering volumes
(crystallites) cause diffraction peak broadening that can be used to deduce the particle size.
Diffraction peak width is related to the grain size (e.g. HAp crystallite) by the Scherrer
equation that is widely used for the characterisation of heat-treated mineralised tissues [9, 10].
coshkl
kLB
(Eq. 2)
where L is the particle dimension in the direction of the {hkl} crystallographic plane normal,
and hklB is the full-width at half maximum (FWHM) of the (hkl) peak. The (002) peak width
is associated with the crystallite length and thus L deduced from the above equation of (002)
peak could be used to estimate the average length of HAp crystallites [25]. The factor k is a
constant related to the crystallite shape, while and have their usual meaning in Bragg’s
law. By monitoring the variation of FWHM during different heating-cooling procedures, the
normalized length of the HAp crystallites was deduced.
2.3.2. SAXS data analysis
Quantitative interpretation of SAXS patterns provides insight into the mean thickness and
degree of alignment of HAp crystallites. 2-D diffraction images were initially converted into
1-D intensity profiles and processed using Fit2D software package [26].
a) Mean thickness

In order to determine the mean crystal thickness, the scattering intensity ( , )I q was
radially integrated around the entire range of the azimuthal angle to obtain the function
( )I q , where q is the scattering vector. Based on Porod’s law, which is valid in a two-phase
system, the Porod chord length T is defined as:
4 QTP
(Eq. 3)
where P is the Porod constant given by 4( )I q Pq (Porod’s law describes the decay of
intensity for large values of q), and Q represents the integrated area under the 2 ~Iq q plot.
Here T is used as the definition of the mean crystal thickness without any assumption of the
particle shape. Based on this, the actual thickness of the crystals can be calculated by taking
further factors (e.g. volume fraction) into account. The length (period) of the scattering
objects forming phase 1 ( 1l ) and of phase 2 ( 2l ) in a two-phase system is defined as [27]
11(1 )
Tl
and 2
1
Tl (Eq. 4)
where 1 is the volume fraction of the scattering object. T can be interpreted as an average
measure of the thickness and is close to the smaller dimension of the two phases. With the
knowledge of 1 , T can be used to deduce the thickness of the scattering objects, with 1l or
2l used as the guideline values for the mean thickness of crystallites.
b) Degree of alignment
The degree of alignment ( ) of HAp crystallites (percentage of aligned particles) can also
be determined from the SAXS patterns. It should be noted that for the enamel, due to the
dense distribution of crystals, the shortest range electron density changes occur in the gaps
between crystalline particles, giving rise to the scattering signal [28]. The high volume
fraction of HAp crystallites in enamel implies highly aligned tight packing, so that the
orientation of the gaps between HAp crystallites corresponds closely to that of the HAp

crystallites within the rods [28]. Thus, the information obtained from the value of that
describes the degree of alignment of the inter-crystallite gaps can be used to deduce the
degree of alignment of HAp crystallites in enamel.
Figure 1c gives an example SAXS pattern of enamel at room temperature. In order to
quantify the degree of alignment, SAXS patterns were integrated over all spanned scattering
vectors q, resulting in a function ( )I that depends on the azimuthal angle [29, 30]. The
degree of alignment was determined as the ratio of the peak area to the overall area under the
curve of ( )I , as has been explained and illustrated in previously published work [21]. The
value of the degree of alignment ranges from 0 to 1, where 0 indicates no predominant
orientation within the plane of the section (normal to the beam) and 1 indicates a perfect
alignment of all crystallites [29, 30].
c) Scattering object analysis
The scattering contrast in SAXS arises mainly due to the fluctuation of electron density.
The intensity of SAXS signal is proportional to the square of the difference of electron
density between the scattering object(s), as well as the volume fraction of the scattering
object(s) [27]
21 2 1 1( ) (1 )
(Eq. 5)
where is the mean square fluctuation of electron density, 1 and 2 are the electron
densities of the two scattering phases, and 1 is the volume fraction of the scattering object(s)
as defined in Eq. 4. According to the Babinet principle [27], in terms of scattering a system
with a relatively low volume fraction of particles is equivalent to the dense system filled with
particles but having the same volume fraction and arrangement of voids (i.e. the low density
phase). In the former system, the particles act as scattering objects, whereas in the latter it is
the voids.

3. Results 3.1. WAXS data
3.1.1. d-spacing variation
The thermally induced variation of d-spacing of HAp crystallites in human dentine and
enamel samples is illustrated in Figures 2a & b. This is observed to be almost reversible
during heating and cooling, although a visible drop at ~200oC is seen in the plot for dentine.
In contrast, the synthetic HAp powders display a distinct irreversible change of d-spacing (see
Figure 2c).
3.1.2 Crystal perfection
The sharp diffraction peaks of the natural enamel and the synthetic HAp powders show
very small changes during the heating process (Figures 2d & f). In contrast, the diffraction
peaks of natural HAp crystallites in dentine are broad as shown in Figure 2e. Furthermore, it
is obvious that the peaks start to split and sharpen as temperature increases, which indicates
that the perfection increases remarkably during the heating, similar to the behaviour found in
human bone [16, 20]. During cooling the degree of crystal perfection remained unchanged for
all three materials. The peaks were indexed by reference to standard HAp patterns (JCPDS 9-
432) [31].
3.1.3. Crystalline length
The interpretation of the (002) peak width provides information on the evolution of the
crystallite length. Figures 3a-c demonstrate the variation of the normalized crystallite length
of HAp crystallites in dentine and enamel and in synthetic HAp powders, with the value at the
initial temperature serving as the reference (unity). Overall, not much change is observed in
the HAp crystallite length in the enamel, although some oscillation is seen at medium
temperatures (from ~300oC to ~600oC). In dentine, the HAp crystalline length remains almost
constant until above ~600oC. Upon further heating, a significant length increase occurs,
followed by the size remaining almost constant during cooling. In synthetic HAp powders,
however, an apparent change of crystallite length occurs above ~500oC. The thermal history is

different from that in dentine, with the crystallite length continuing to grow even during the
cooling process (see Figure 3c).
3.2. SAXS data
3.2.1. Scattering intensity and volume fraction variation
In the context of the Babinet principle, initially the scattering objects in the dentine and
synthetic HAp polycrystalline samples are the HAp crystallites. In contrast, in the enamel,
initially the scattering objects are the gaps between HAp crystallites filled with organic matter.
However, due to the gradual denaturing and disappearance of the organic matrix as well as the
accompanying process of crystal growth, the scattering objects in the dentine and HAp
polycrystalline samples may also change to gaps. In order to verify the hypothesis that such
change in the nature of the scattering objects in human dentine and synthetic HAp
polycrystalline samples indeed takes place, the overall intensity variations from the SAXS
patterns of the human dentine, enamel and synthetic HAp polycrystalline samples are plotted
in Figures 4 a-c using open markers. The overall low intensity for the enamel sample indicates
that the volume fraction of the scattering objects (gaps between crystallites) remains low. As
for dentine and synthetic HAp crystallites, the observed large increase in the intensity
coincides with the stage at which the HAp crystallites undergo fast growth, as reflected in the
crystalline mean thickness plots in Figures 3 e and f.
Meanwhile, the volume fraction of the scattering objects, the HAp crystallites also
increases until the transition temperature (~612oC for dentine and ~745oC for synthetic HAp
powders). At this point the increased volume fraction of particles (and the reduced volume
fraction of gaps) leads to the gaps between particles becoming the principal scattering objects,
resulting in the dramatic decrease of intensity.
3.2.2. Crystalline mean thickness with constant volume fraction
The normalized crystallite mean thickness results for samples was calculated by SAXS
interpretation using constant volume fraction of constituent phases (Figures 3d-f). During the
heating process, a hump is observed in Figure 3e for dentine at ~300oC. Upon further heating,
the mean thickness starts to increase in the range from ~500oC to ~700oC. This is followed by

a slight decrease up to ~900oC. The mean thickness remains almost constant during cooling.
The variation for the synthetic HAp powders (Figure 3f) is similar, but appears smoother
compared with that of HAp crystallites in dentine (Figure 3e). Crystal growth in dentine
appears to be faster than in the synthetic HAp powders. In addition, no obvious hump is
observed at low temperature in the graph of the synthetic HAp powders (Figure 3f). As for the
mean thickness variation of HAp crystallites in the enamel, a drop is visible at low
temperature (Figure 3d). Beyond this drop, the overall variation is much smaller compared to
the results for dentine and synthetic HAp crystallites.
3.2.3. Crystalline mean thickness with varied volume fraction
Based on the above analysis of the scattering objects, we postulate the variation of the
volume fraction during heating and cooling as shown in Figure 4, starting with the initial
volume fraction obtained by TGA analysis. The volume fraction is assumed to remain
constant during cooling. Note that the dramatic changes of intensity observed are associated
with the change of the principal scattering objects that occurs when the volume fraction
passes 50%. By taking the volume fraction variation of HAp crystallites in dentine, enamel
and the synthetic HAp polycrystalline sample into account, the updated results of the
crystalline mean thickness based on Eq. 4 are shown in Figures 3 g-i.
3.2.4. Degree of alignment
Since the synthetic HAp powders were produced from powdered HAp crystallites, they
show an orientation distribution that is close to random at all temperatures. Thus, only the
evolution of the degree of alignment of HAp crystallites in dentine and enamel is presented
(Figure 5). During heating, the overall degree of alignment of HAp crystallites decreases from
0.75 to 0.29 in the enamel, and from 0.17 to 0.05 in dentine. In more detail, in enamel the
degree of alignment remains almost constant at very low (~0-100oC) and very high
temperatures (~800-900oC), while an increase occurs above ~300-400oC, followed by the
decrease up to ~800oC. Contrary to the result for the enamel, dentine exhibited a longer low
temperature range (~0-300oC) with constant degree of alignment. Afterwards, the evolution
follows a similar trend to that in the enamel, with an increase from ~300-400oC and a

decrease from ~400-800oC. However, a more dramatic decrease occurred at ~800-900oC
compared with that in the enamel at the same temperature range. The degree of alignment
remained unchanged during cooling.
3.3. TGA
Figure 6a shows the weight loss of dentine, enamel and the organic tooth sample (with
most mineral content removed chemically) with increasing temperature. Two dramatic drops
are visible in the pure organic tissue, at ~300oC and ~650oC respectively. Around 750oC the
organic phase in the tooth almost completely disappears. As for dentine and enamel, the
weight loss is observed to be less significant than in the pure organic tooth tissue. A dramatic
drop is still apparent at ~350oC, and the rate of weight loss continues to decrease slowly at
high temperature after ~750oC. The initial weight fraction of HAp crystallites in dentine and
enamel can be calculated by monitoring the weight remaining at 750oC in dentine (70.3%)
and enamel (95.8%), since the weight loss up to this temperature corresponds to that of water
and the organic phase. Using the reported HAp density of 3.16 g/cm3 and the methods
described in the literature [25], the initial volume fractions of HAp crystallites were
calculated to be 45% (dentine) and 90% (enamel).

4. Discussion
The in situ thermal treatment in the current study revealed the complete history of the
evolution of the ultrastructure of bio-apatite samples during a continuous heating-cooling
schedule. In a previous ex situ study [9], only point-wise (in terms of temperature) and post-
treatment data could be collected. This led to a fragmented and incomplete picture of the
process. In comparison, the present study provides reliable information on the sample heating
history and ultrastructural response, with the consistency between samples assured by a
degree of cross-comparison, full coverage of the entire temperature range, and complete
observation of the cooling procedure.
In general, SAXS patterns are more sensitive to the nano-scale structure, allowing the
determination of the mean thickness of the crystallites by considering the scattering from two-
phase systems [19]. The precise nature of the particles involved (e.g. amorphous vs.
crystalline) is not important in this instance. In contrast, WAXS information is extracted from
crystal lattice diffraction, and its clarity depends on the degree of perfection of the crystallites.
The principal outcome of quantitative analysis of SAXS and WAXS patterns was to reveal
the temperature-dependent variation of the nano-structure (thickness, orientation and degree
of alignment) of HAp crystallites, as well as the crystallographic properties (d-spacing, crystal
perfection and length) variation during the heating and cooling processes. It is interesting to
note how the observed evolution reflects the differences between dentine and enamel, and
also the differences between the natural HAp crystallites embedded within organic matrix in
human dental tissues, on the one hand, and synthetic HAp powders on the other. The role
played by the organic matrix during heating is particularly important, as it turns out to govern
the evolution of size and strain of HAp crystallites. It is also important to draw the conclusion
that in order to evaluate the exposure temperature precisely (e.g. in forensic cases), enamel
and dentine must be investigated separately: the analysis of the entire powdered tooth
obscures the sharpness of ultrastructural variations in dentine and enamel [6, 32].
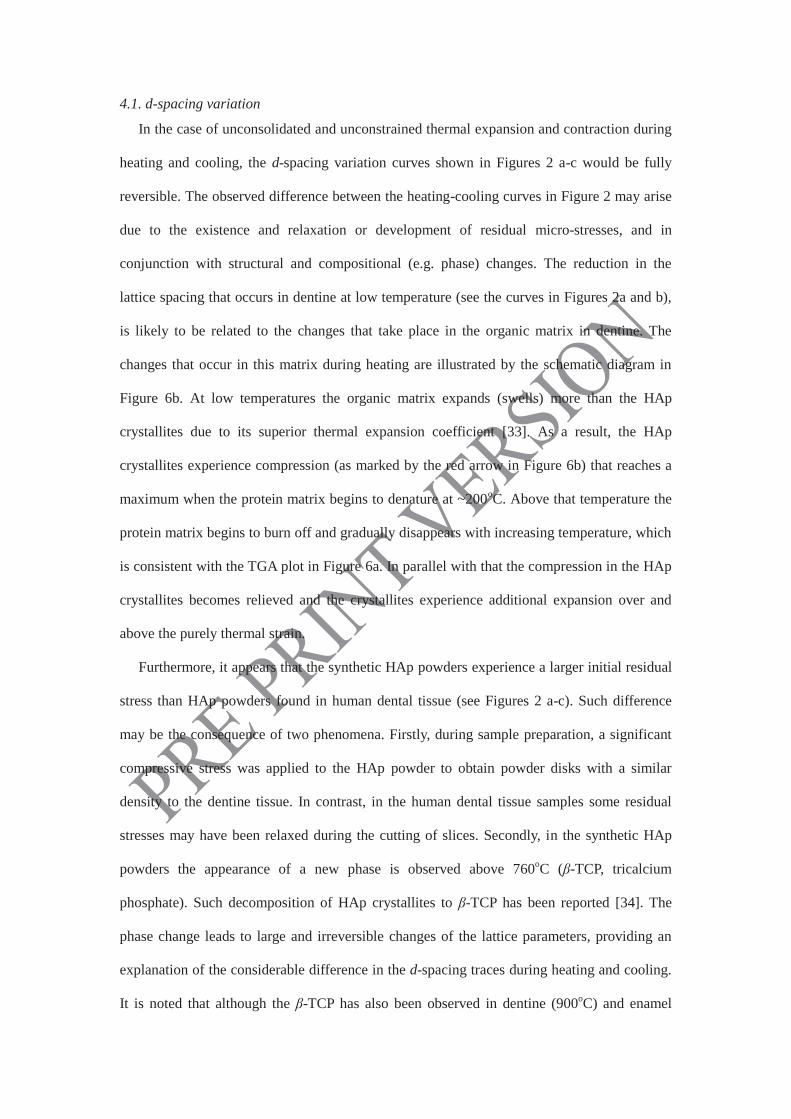
4.1. d-spacing variation
In the case of unconsolidated and unconstrained thermal expansion and contraction during
heating and cooling, the d-spacing variation curves shown in Figures 2 a-c would be fully
reversible. The observed difference between the heating-cooling curves in Figure 2 may arise
due to the existence and relaxation or development of residual micro-stresses, and in
conjunction with structural and compositional (e.g. phase) changes. The reduction in the
lattice spacing that occurs in dentine at low temperature (see the curves in Figures 2a and b),
is likely to be related to the changes that take place in the organic matrix in dentine. The
changes that occur in this matrix during heating are illustrated by the schematic diagram in
Figure 6b. At low temperatures the organic matrix expands (swells) more than the HAp
crystallites due to its superior thermal expansion coefficient [33]. As a result, the HAp
crystallites experience compression (as marked by the red arrow in Figure 6b) that reaches a
maximum when the protein matrix begins to denature at ~200oC. Above that temperature the
protein matrix begins to burn off and gradually disappears with increasing temperature, which
is consistent with the TGA plot in Figure 6a. In parallel with that the compression in the HAp
crystallites becomes relieved and the crystallites experience additional expansion over and
above the purely thermal strain.
Furthermore, it appears that the synthetic HAp powders experience a larger initial residual
stress than HAp powders found in human dental tissue (see Figures 2 a-c). Such difference
may be the consequence of two phenomena. Firstly, during sample preparation, a significant
compressive stress was applied to the HAp powder to obtain powder disks with a similar
density to the dentine tissue. In contrast, in the human dental tissue samples some residual
stresses may have been relaxed during the cutting of slices. Secondly, in the synthetic HAp
powders the appearance of a new phase is observed above 760oC (β-TCP, tricalcium
phosphate). Such decomposition of HAp crystallites to β-TCP has been reported [34]. The
phase change leads to large and irreversible changes of the lattice parameters, providing an
explanation of the considerable difference in the d-spacing traces during heating and cooling.
It is noted that although the β-TCP has also been observed in dentine (900oC) and enamel

(800oC) as shown in Figure 2 d & e, its concentration is very low, and its effect on d-spacing
variation can be ignored within the bounds of experimental accuracy, so that the curves
appear reversible. The different transformation temperatures indicate an intrinsic difference in
the characteristics between the bio-apatites (like the HAp crystallites in dentine and enamel)
and the pure synthetic hydroxyapatites.
4.2. Crystal perfection
A high degree of crystal perfection is observed in the enamel and synthetic HAp
crystallites compared to dentine, as shown in Figures 2d-f. The difference arises from the
different micro-morphology of HAp crystallites between the three materials studied. The
improved perfection (sharper and stronger peaks) in the dentine with increasing temperature
(see Figure 2e) is due to the sintering of HAp crystallites that takes place at high temperatures
(above ~800oC). During the heating process, as the organic matrix is gradually burnt off, the
interlayers of adjacent HAp crystallites disappear. Further heating leads to crystal growth and
annealing of crystal defects, resulting in the significant peak sharpening. Further
crystallization of the amorphous part observed in bone alteration [16, 20] may also contribute
to this effect.
4.3. Degree of alignment
The overall reduction of the degree of alignment in enamel and dentine during heating
may be associated with the polydisperse distribution of the particles associated with the
changes of crystalline size or shape at high temperature [20]. The initial stage of constant
degree of alignment observed both in the enamel (RT-100oC) and dentine (RT-300oC) in
Figure 5b may correspond to the absence of crystallite rotation or growth. Once the organic
matrix begins to denature, a slight increase in the degree of alignment is noted at ~300-400oC
for both dentine and enamel. Such increase corresponds to the gradual disappearance of the
organic matrix accompanied by the relaxation of the residual strain. The greater reduction in
the degree of alignment observed in dentine compared to enamel in the ~800-900oC range
reflects the difference in the composite structures. At very high temperatures the degree of
alignment in the enamel remains high, due to the highly directional structure of long prismatic

HAp crystallites that remain aligned even after the organic matrix has been fully burnt off. In
contrast, in dentine the disappearance of the large amount (~45% by volume) of organic
matrix is likely to correspond to the loss of the supporting structure, causing the collapse and
rearrangement of HAp crystallites that is associated with large rotation and anisotropic
sintering.
4.4. Intensity variation
In the analysis of synchrotron-based SAXS data that has so far been reported in the
literature, the volume fraction of HAp crystallites was always assumed to remain constant
during heating [20]. However, the volume fraction in fact varies due to the burning off of the
protein matrix, and the sintering of crystallites during heating (that influences the calculation
of the mean crystallite thickness). The overall low intensity change indicates a small
ultrastructural alteration, which may reflect the limited space for crystal expansion and
growth within the enamel sample. The difference between the dentine sample and synthetic
HAp powders is also reflected in the scattering behavior, where the comparatively lower
value of intensity for dentine at low temperatures is likely to be associated with the presence
of the protein matrix in dentine. Given the similar volume fractions of HAp crystallites in the
two materials and close initial density values, the difference in the intensity is ascribed to the
electron density contrast between the protein matrix and the crystals, which is smaller than
that between gaps and the crystals (see Eq.5).
4.5. Crystallite size determined by SAXS/WAXS
Combined with the WAXS characterization on the length calculation of HAp crystallites, a
schematic illustration of how the crystallite dimensions change in the dentine and enamel
during heating is depicted in Figure 7. Two temperature ranges are identified based on the
processes taking place in the organic matrix (the separation temperature is around 500oC). As
the organic phase gradually disappears, in “temperature range II”, crystal growth becomes
unconstrained. Unlike the crystals in enamel, it is also observed that the crystallites in dentine
gradually become misaligned, as indicated by the drop in the degree of alignment. Similar
phenomena have been observed in ex-situ bone characterization [35].

It is interesting to observe that in the synthetic HAp powders, continued sintering takes
place during high temperature hold and even continues during cooling. This is probably due
to the fact that sintering is driven by the overall change in the free energy of the system [36].
5. Conclusions
The effects of in situ heat treatment on the hydroxyapatite (HAp) crystallites (human
dental tissues) and synthetic HAp crystallites were explored using combined synchrotron
based small/wide angle X-ray scattering (SAXS/WAXS) techniques. From the quantitative
analysis of SAXS and WAXS patterns, multi-scale characterization of the hierarchical
structure of enamel and dentine allows establishing the temperature-dependent variation of
the nano-structural parameters (thickness, orientation and the degree of alignment) of HAp
crystallites from SAXS and crystallographic properties (d-spacing, crystal perfection and
length) from WAXS during the heating and cooling processes. The results generally reflect
the difference between dentine and enamel, natural and synthetic HAp crystallites. In the
analysis presented, the emphasis is placed on understanding the role of the organic matrix
during heating. An important observation is made of the fact that the scattering object may
change with the volume fraction variation of HAp crystallites during heating.
In conclusion, the synchrotron-based combined SAXS/WAXS analysis has been shown to
be a powerful method for the determination of nano-structure variation induced by thermal
treatment in human enamel and dentine, as well as in synthetic HAp crystallites. The in situ
thermal treatment conducted in the present study covered the entire relevant temperature
range and revealed the complete continuous history of ultrastructure evolution within a single
sample during a continuous heating-cooling schedule. It was clearly demonstrated that
insignificant structural changes occur during cooling, indicating that relevant conclusions can
be drawn when dental remains samples are analysed as part of archaeological or forensic
studies. The approach to the study of ultrastructural alteration in skeletal hard tissues exposed
to in situ thermal treatment developed in the present study provides a better, more reliable
basis for deducing the heating history compared with conventional methods based on the
monitoring the macro- and microstructural colour [6, 7, 37]. Furthermore, it allows the

interaction between the mineral crystallites and the organic phase during heating to be
captured. These advantages show the superior utility of in situ thermal treatment analysis over
previous ex situ tests. Statistical error analysis of multiple measurement points in dentine
confirmed the reliability of the conclusions drawn. The results of this work will also be
beneficial to the optimization of the laser fluence used in dental practice, and in the future
design of biomimetic materials.
Acknowledgement
AMK acknowledges the support of EPSRC through grants EP/I020691 “Multi-disciplinary
Centre for In-situ Processing Studies (CIPS)”, EP/G004676 “Micromechanical Modelling and
Experimentation”, and EP/H003215 “New Dimensions of Engineering Science at Large
Facilities”. Diamond Light Source is acknowledged for providing the beam time allocation
under experiment number SM7981.

References
1. Marshall SJ, Balooch M, Habelitz S, Balooch G, Gallagher R, Marshall GW. 2003 The dentin-enamel junction - a natural, multilevel interface. J Eur Ceram Soc. 23, 2897-2904. (Doi 10.1016/S0955-2219(03)00301-7) 2. Dorozhkin SV. 2010 Nanosized and nanocrystalline calcium orthophosphates. Acta Biomater. 6, 715-734. (DOI 10.1016/j.actbio.2009.10.031) 3. Kantola S. 1973 Laser-Induced Effects on Tooth Structure .8. X-Ray-Diffraction Study of Dentin Exposed to a Co2-Laser. Acta Odontol Scand. 31, 381-386. (Doi 10.3109/00016357309002525) 4. Fried D, Zuerlein MJ, Le CQ, Featherstone JDB. 2002 Thermal and chemical modification of dentin by 9-11-mu m CO2 laser pulses of 5-100-mu s duration. Laser Surg Med. 31, 275-282. (Doi 10.1002/Lsm.10100) 5. Zuerlein MJ, Fried D, Featherstone JDB. 1999 Modeling the modification depth of carbon dioxide laser-treated dental enamel. Laser Surg Med. 25, 335-347. (Doi 10.1002/(Sici)1096-9101(1999)25:4<335::Aid-Lsm8>3.0.Co;2-F) 6. Piga G, Thompson TJU, Malgosa A, Enzo S. 2009 The Potential of X-Ray Diffraction in the Analysis of Burned Remains from Forensic Contexts. J Forensic Sci. 54, 534-539. (DOI 10.1111/j.1556-4029.2009.01037.x) 7. Thompson TJU. 2005 Heat-induced dimensional changes in bone and their consequences for forensic anthropology. J Forensic Sci. 50, 1008-1015. 8. Thompson TJU, Islam M, Piduru K, Marcel A. 2011 An investigation into the internal and external variables acting on crystallinity index using Fourier Transform Infrared Spectroscopy on unaltered and burned bone. Palaeogeogr Palaeocl. 299, 168-174. (DOI 10.1016/j.palaeo.2010.10.044) 9. Sandholzer MA, Sui T, Korsunsky AM, Walmsley AD, Lumley PJ, Landini G. 2014 X-ray scattering evaluation of ultrastructural changes of human dental tissues with thermal treatment. 10. Shipman P, Foster G, Schoeninger M. 1984 Burnt Bones and Teeth - an Experimental-Study of Color, Morphology, Crystal-Structure and Shrinkage. J Archaeol Sci. 11, 307-325. (Doi 10.1016/0305-4403(84)90013-X) 11. Enzo S, Bazzoni M, Mazzarello V, Piga G, Bandiera P, Melis P. 2007 A study by thermal treatment and X-ray powder diffraction on burnt fragmented bones from tombs II, IV and IX belonging to the hypogeic necropolis of "Sa Figu" near Ittiri, Sassari (Sardinia, Italy). J Archaeol Sci. 34, 1731-1737. (DOI 10.1016/j.jas.2006.12.011) 12. Rogers KD, Daniels P. 2002 An X-ray diffraction study of the effects of heat treatment on bone mineral microstructure. Biomaterials. 23, 2577-2585. (Pii S0142-9612(01)00395-7; Doi 10.1016/S0142-9612(01)00395-7) 13. Beckett S, Rogers KD, Clement JG. 2011 Inter-Species Variation in Bone Mineral Behavior upon Heating. J Forensic Sci. 56, 571-579. (DOI 10.1111/j.1556-4029.2010.01690.x) 14. Reyes-Gasga J, Garcia-Garcia R, Arellano-Jimenez MJ, Sanchez-Pastenes E, Tiznado-Orozco GE, Gil-Chavarria IM, et al. 2008 Structural and thermal behaviour of human tooth and three synthetic hydroxyapatites from 20 to 600 degrees C. J Phys D Appl Phys. 41. (Artn 225407; Doi 10.1088/0022-3727/41/22/225407) 15. Hollund HI, Ariese F, Fernandes R, Jans MME, Kars H. 2013 Testing an Alternative High-Throughput Tool for Investigating Bone Diagenesis: Ftir in Attenuated Total Reflection (Atr) Mode. Archaeometry. 55, 507-532. 16. Rogers K, Beckett S, Kuhn S, Chamberlain A, Clement J. 2010 Contrasting the crystallinity indicators of heated and diagenetically altered bone mineral. Palaeogeogr Palaeocl. 296, 125-129. (DOI 10.1016/j.palaeo.2010.06.021) 17. Squires KE, Thompson TJU, Islam M, Chamberlain A. 2011 The application of histomorphometry and Fourier Transform Infrared Spectroscopy to the analysis of early Anglo-Saxon burned bone. J Archaeol Sci. 38, 2399-2409.

18. Piga G, Malgosa A, Thompson TJU, Enzo S. 2008 A new calibration of the XRD technique for the study of archaeological burned human remains. J Archaeol Sci. 35, 2171-2178. 19. Hiller JC, Wess TJ. 2006 The use of small-angle X-ray scattering to study archaeological and experimentally altered bone. J Archaeol Sci. 33, 560-572. 20. Hiller JC, Thompson TJ, Evison MP, Chamberlain AT, Wess TJ. 2003 Bone mineral change during experimental heating: an X-ray scattering investigation. Biomaterials. 24, 5091-5097. (S0142961203004277 [pii]) 21. Sui T, Sandholzer MA, Baimpas N, Dolbnya IP, Walmsley AD, Lumley PJ, et al. 2013 Multi-scale modelling and diffraction-based characterization of elastic behaviour of human dentine. Acta Biomater. 9, 7937-7947. (DOI 10.1016/j.actbio.2013.04.020) 22. Sui T, Sandholzer MA, Baimpas N, Dolbnya IP, Landini G, Korsunsky AM. 2013 Hierarchical modelling of elastic behaviour of human enamel based on synchrotron diffraction characterization. J Struct Biol. In press. (DOI 10.1016/j.jsb.2013.09.023) 23. Dent AJ, Greaves GN, Roberts MA, Sankar G, Wright PA, Jones RH, et al. 1995 A New Furnace Design for Use in Combined X-Ray-Absorption and Diffraction of Catalysis and Ceramics Studies - Formation from Carbonate Precursors of Cu, Co, Mn Spinels for the Oxidation of Co and the Formation of Plzt, a Piezoelectric Ceramic. Nucl Instrum Meth B. 97, 20-22. (Doi 10.1016/0168-583x(94)00369-6) 24. Calibration DLS. 2013 Diamond Light Source Calibration. 25. Deymier-Black AC, Almer JD, Stock SR, Haeffner DR, Dunand DC. 2010 Synchrotron X-ray diffraction study of load partitioning during elastic deformation of bovine dentin. Acta Biomater. 6, 2172-2180. (DOI 10.1016/j.actbio.2009.11.017) 26. Hammersley AP. "FIT2D: An Introduction and Overview". ESRF Internal Report1997. 27. Glatter O, Kratky O. 1982 Small angle x-ray scattering. London ; New York: Academic Press. 28. Tanaka T, Yagi N, Ohta T, Matsuo Y, Terada H, Kamasaka K, et al. 2010 Evaluation of the Distribution and Orientation of Remineralized Enamel Crystallites in Subsurface Lesions by X-Ray Diffraction. Caries Res. 44, 253-259. (Doi 10.1159/000314672) 29. Tesch W, Vandenbos T, Roschgr P, Fratzl-Zelman N, Klaushofer K, Beertsen W, et al. 2003 Orientation of mineral crystallites and mineral density during skeletal development in mice deficient in tissue nonspecific alkaline phosphatase. J Bone Miner Res. 18, 117-125. (DOI 10.1359/jbmr.2003.18.1.117) 30. Tesch W, Eidelman N, Roschger P, Goldenberg F, Klaushofer K, Fratzl P. 2001 Graded microstructure and mechanical properties of human crown dentin. Calcified Tissue Int. 69, 147-157. (DOI 10.1007/s00223-001-2012-z) 31. Ooi CY, Hamdi M, Ramesh S. 2007 Properties of hydroxyapatite produced by annealing of bovine bone. Ceram Int. 33, 1171-1177. 32. Kugler M. 2003 X-ray diffraction analysis in forensic science: the last resort in many criminal cases. Advances in X-ray Analysis. 46. 33. Lei HJ, Liu B, Fang DN. 2010 The coefficient of thermal expansion of biomimetic composite. Front Mater Sci China. 4, 234-238. 34. Elliott JC. 1994 Structure and chemistry of the apatites and other calcium orthophosphates. Amsterdam ; London: Elsevier. 35. Pramanik S, Hanif ASM, Pingguan-Murphy B, Abu Osman NA. 2013 Morphological Change of Heat Treated Bovine Bone: A Comparative Study. Materials. 6, 65-75. (Doi 10.3390/Ma6010065) 36. Kingery WD, Bowen HK, Uhlmann DR. 1976 Introduction to ceramics. 2nd ed. New York ; London: Wiley. 37. Thompson TJU, Islam M, Bonniere M. 2013 A new statistical approach for determining the crystallinity of heat-altered bone mineral from FTIR spectra. J Archaeol Sci. 40, 416-422. (DOI 10.1016/j.jas.2012.07.008)

Figures
Figure 1 (a) Schematic illustration of the in situ SAXS/WAXS experimental set-up that ensured that the WAXS and SAXS patterns were collected simultaneously. (b) A representative WAXS pattern showing the Debye-Sherrer ring corresponding to the (002) peak indicated by the red arrow. On the ring, the section along the y-axis in (a) was “caked” (see text) with a 20o range in order to capture the peak shift upon heating and cooling process. (c) A representative SAXS pattern. The dark region in the middle is the beamstop. The ellipsoidal shape of the pattern indicates a partial alignment of HAp crystallites. The pattern for randomly distributed crystals is a round disc with the outline marked with red dashed circle. (d) and (e) illustrate the different heating and cooling protocols used for the human dental slice samples and the synthetic HAp powders sample.

Figure 2 (a)-(c) The changes in the d002-spacing of HAp crystallites in enamel, dentine and synthetic HAp powders samples, respectively, during heating and cooling stages (heating: red points; cooling: blue points). Intensity variation upon heating and cooling, caused by (d) HAp crystallites in enamel; (e) HAp crystallites in dentine and (f) synthetic HAp powders. The red marks in (f) indicate the occurrence of two new peaks.

Figure 3 (a)-(c) The variation of the normalized length of HAp crystallites in human enamel, dentine and synthetic HAp powders (red points for heating and blue points for cooling). (d)-(f) The normalized mean thickness (with constant volume fraction) of HAp crystallites in enamel, dentine and synthetic HAp powders. (g)-(i) The normalized mean thickness accounting for the mineral volume fraction variation of HAp crystallites in enamel, dentine and synthetic HAp powders.
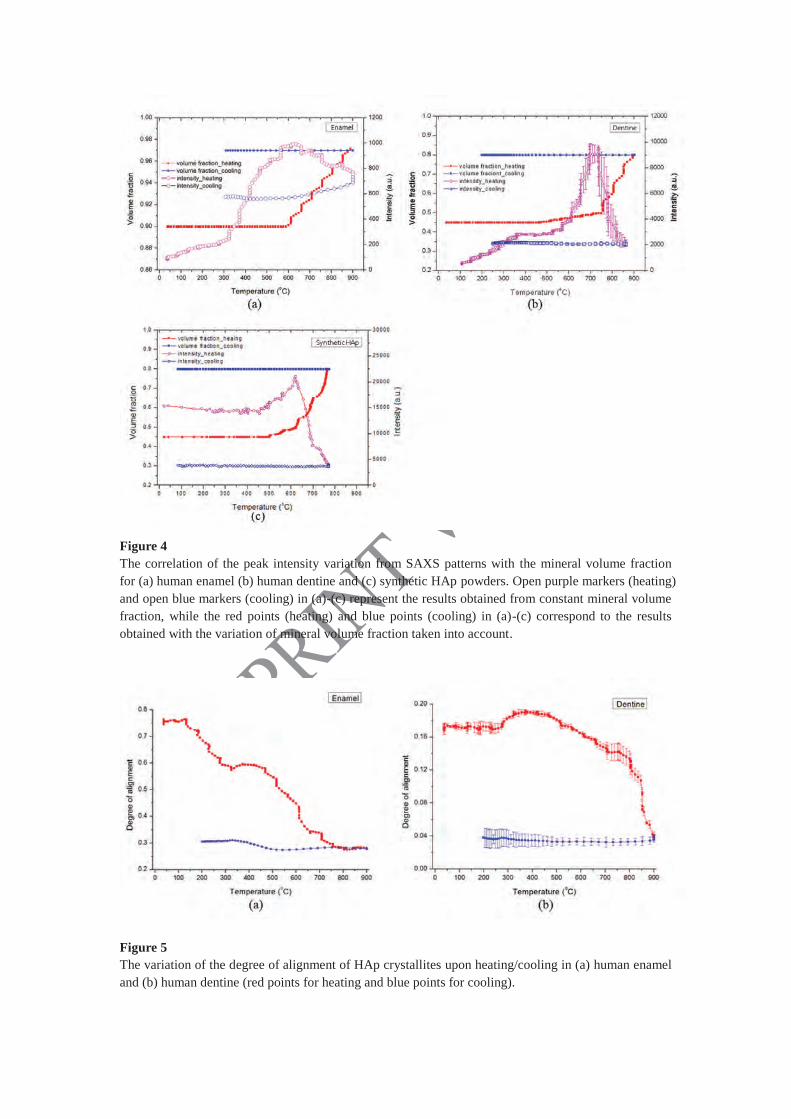
Figure 4 The correlation of the peak intensity variation from SAXS patterns with the mineral volume fraction for (a) human enamel (b) human dentine and (c) synthetic HAp powders. Open purple markers (heating) and open blue markers (cooling) in (a)-(c) represent the results obtained from constant mineral volume fraction, while the red points (heating) and blue points (cooling) in (a)-(c) correspond to the results obtained with the variation of mineral volume fraction taken into account.
Figure 5 The variation of the degree of alignment of HAp crystallites upon heating/cooling in (a) human enamel and (b) human dentine (red points for heating and blue points for cooling).

Figure 6 (a) TGA plot of weight loss of dental tissues: pure organic tooth with the inorganic content removed (black line), dentine (red line) and enamel (blue line). (b) A schematic diagram of the ultrastructural alteration of organic matrix and HAp crystallites in human dentine upon heating. The process begins with the superior thermal expansion of the organic matrix compared with the HAp crystallites, resulting in compression of HAp during heating (red arrow). The compression will relaxes gradually as the organic matrix begins to denature and burn off, leading to the additional expansion in the HAp crystallites in excess of the pure thermal strain.
Figure 7 A schematic illustration of the size variation of HAp crystals within human enamel and dentine upon heating. The crystals in enamel are needle-shaped while those in dentine are platelet-shaped. In temperature range I, the interaction between crystals and the protein matrix occurs, while in temperature range II, the protein matrix gradually disappears and the interaction is weakened.

Hierarchical modelling of in situ elastic deformation of human enamelbased on photoelastic and diffraction analysis of stresses and strains
Tan Sui a,⇑, Alexander J.G. Lunt a, Nikolaos Baimpas a, Michael A. Sandholzer b, Jianan Hu a,Igor P. Dolbnya c, Gabriel Landini b, Alexander M. Korsunsky a
aDepartment of Engineering Science, University of Oxford, Parks Road, Oxford OX1 3PJ, UKb School of Dentistry, College of Medical and Dental Sciences, University of Birmingham, St Chad’s Queensway, Birmingham B4 6NN, UKcBeamline B16, Diamond Light Source, Harwell Oxford Campus, Didcot OX11 0DE, UK
a r t i c l e i n f o
Article history:Received 27 May 2013Received in revised form 25 September 2013Accepted 30 September 2013Available online 9 October 2013
Keywords:EnamelWAXSPhotoelasticityMechanical behavioursEshelby model
a b s t r a c t
Human enamel is a typical hierarchical mineralized tissue with a two-level composite structure. To date,few studies have focused on how the mechanical behaviour of this tissue is affected by both the rodorientation at the microscale and the preferred orientation of mineral crystallites at the nanoscale. In thisstudy, wide-angle X-ray scattering was used to determine the internal lattice strain response of humanenamel samples (with differing rod directions) as a function of in situ uniaxial compressive loading.Quantitative stress distribution evaluation in the birefringent mounting epoxy was performed in parallelusing photoelastic techniques. The resulting experimental data was analysed using an advancedmultiscale Eshelby inclusion model that takes into account the two-level hierarchical structure of humanenamel, and reflects the differing rod directions and orientation distributions of hydroxyapatite crystals.The achieved satisfactory agreement between the model and the experimental data, in terms of thevalues of multidirectional strain components under the action of differently orientated loads, suggeststhat the multiscale approach captures reasonably successfully the structure–property relationshipbetween the hierarchical architecture of human enamel and its response to the applied forces. This noveland systematic approach can be used to improve the interpretation of the mechanical properties ofenamel, as well as of the textured hierarchical biomaterials in general.
� 2013 Acta Materialia Inc. Published by Elsevier Ltd. All rights reserved.
1. Introduction
The increasing need to understand and predict the effect ofstructural alterations on the performance of dental tissues andtheir artificial replacements arises both in the context of clinicaltreatment, and the development of novel dental prostheticmaterials [1]. The elucidation of the dependence of the mechanicalbehaviour of human enamel on its complex hierarchical structureremains a challenging task. Two different length scales dominatethe structure and the mechanical behaviour of the enamel: Atthe microscale, �5 lm diameter keyhole-like cross-section alignedprisms (or rods) are oriented towards the crown of the tooth [2]. Atthe nanoscale level, the rod is known to be a composite made fromneedle-like biological hydroxyapatite (HAp) crystals (�25–30 nmthick and of length known to be more than 1000 nm, or evenspanning the entire thickness of the enamel layer) [3,4], whichare held together by the protein matrix between the rods [5–7].The orientation of HAp needle-like crystals within the rod is known
to be a gradual variation on the length scale of the rod diameter[8,9].
The focus of most research to date has been on the mechanicalproperties of the enamel at the macroscale, with microstructuraleffects rarely taken into account [2,10]. Very few studies havefocused on the multiscale analyses required to determine theinfluence of the nanoscale structure on the macroscopic mechani-cal response [11]. In fact, both the crystal shape and orientation ofthe mineral phase nanocrystals have previously been shown tohave an effect on the anisotropy of overall stiffness and strength[12]. Therefore, in order to establish a firm understanding of thishierarchical structure–property relationship, further applicationof advanced nanoscale techniques and the formulation and refine-ment of systematic models are required.
Synchrotron-based wide-angle X-ray scattering (WAXS) is anon-destructive analytical technique used to quantify the internalstrain of atomic lattices on (poly)crystals, both residually stressedand subjected to external loading in situ [13,14]. In addition, WAXStechniques are able to reveal quantitative information about theorientation distribution of crystals (texture) [15]. For example,recent applications of WAXS include the determination of the
1742-7061/$ - see front matter � 2013 Acta Materialia Inc. Published by Elsevier Ltd. All rights reserved.http://dx.doi.org/10.1016/j.actbio.2013.09.043
⇑ Corresponding author. Tel.: +44 18652 83447; fax: +44 18652 73010.E-mail address: [email protected] (T. Sui).
Acta Biomaterialia 10 (2014) 343–354
Contents lists available at ScienceDirect
Acta Biomaterialia
journal homepage: www.elsevier .com/locate /actabiomat

mechanical behaviour of mineralized biological composites such asbone and bovine teeth [14,16–18] while simultaneously providinginsight into the crystallographic parameters and textures of suchmaterials [8]. The strain distribution across the amelo-dentinaljunction (ADJ) in bovine teeth was investigated by Almer and Stock[16]. However, this was limited to the strain in the loading direc-tion [16,19]. In practice, the external mastication load is not per-fectly aligned with the longitudinal direction due to the complextooth geometries (e.g. on transverse ridges and cusps in first mo-lars), and also due to the local orientation variation of HAp crystalswithin the rods. Therefore, the analysis of the relationship betweenthe orientation of the applied load and strain needs to be sought.Moreover, the studies reported earlier did not take into accountthe nanoparticle distribution effect on the mechanical response.In addition, very few studies devoted to human enamel have everbeen published [20]. It is therefore unsurprising that there is a lackof understanding of the effects of different growth histories, spe-cies or race on the mineralized tissue morphology, and the corre-sponding mechanical properties [21].
In order to carry out the in situ mechanical loading experimentsin a versatile manner, i.e. allowing different directions of loadingwith respect to the preferred directions of structural orientationwithin the tissue, the sample was embedded in a photoelasticepoxy disk. The enamel cubes studied in our preliminary experi-ments could not withstand high external load applied by directcompression between the platens. Without the protection of theepoxy disk, samples were likely to develop local stress concentra-tions and/or microcracks that reduce the accuracy of measuringthe mechanical behaviour of enamel. Furthermore, due to its bire-fringent properties, epoxy offers the possibility of deducing infor-mation about the stress distribution around the sample usingphotoelastic techniques. Photoelasticity is a non-destructive,whole-field method widely applied in stress distribution analysis.The fringe pattern arises when the sample is viewed betweencrossed polarizing plates, with the colour or brightness of thefringe being related to the difference between the principal stres-ses, which is in turn proportional to the maximum shear stress,or Tresca stress, in the material [22]. We combine the photoelasticanalysis technique with WAXS analysis during in situ loading inorder to establish the relationship between the external stress dis-tribution and the internal crystal lattice strain.
A number of different models of composite deformation havebeen previously used to describe the elastic response of mineral-ized biological tissues that arises through the interaction betweendifferent constituent phases [11]. This approach also allowed theunknown properties of the component phases to be determined[23]. However, these models mainly focused on the analysis ofdeformation in only one direction (loading direction) and thereforewere not able to provide adequate consideration of the elasticanisotropy. Recently, a multiscale Eshelby inclusion model hasbeen established and successfully applied for the evaluation ofthe mechanical response of human dentine [12] and of the enamelsubjected to compression along the longitudinal direction of therods [19] by capturing the relationship between the nanoscalestructure and the macroscopic loading. The multiscale modellingapproach was shown to capture the micromechanical responsereasonably well using the two-level hierarchical description ofthe structure of dentine and enamel, with each level consistingof an isotropic matrix and a group of anisotropic inclusions.
In this study, in situ photoelasticity and synchrotron WAXStechniques were applied simultaneously to measure the appliedstress, the internal HAp crystalline orientation distribution andthe elastic lattice strain for three samples of human enamel. Thesamples were prepared so that the primary rod direction was ata different orientation with respect to the external compressiveloading that was applied diametrically to the epoxy disk containing
the tissue sample (see Fig. 1). The multiscale Eshelby inclusionmodel was then applied to the analysis of the results, and thecapability of the model to capture the relationship between thenanoscale structure and macroscopic loading was investigated.
2. Materials and methods
2.1. Sample preparation
Freshly extracted human third molars with no apparent dam-age, caries or other dental treatments were used for this study(ethical approval obtained from the National Research Ethics Com-mittee; NHS-REC reference 09.H0405.33/Consortium R&D No.1465). An enamel disk 2 mm thick was cut from the each toothusing a low-speed diamond saw (Isomet Buehler Ltd., Lake Bluff,IL, USA) and further prepared into smaller bars. A series of polish-ing papers were used to refine the final 2 mm � 2 mm � 2 mmcube of enamel. The cubes were placed in the centre of a 12 mmdiameter cylindrical mould and embedded in epoxy resin (BuehlerEpokwick, ITW Test & Measurement GmbH, Dusseldorf, Germany).The disks’ surfaces were subsequently polished to expose the en-amel surfaces.
In total, the three cubic enamel samples were prepared (desig-nated #6, #7 and #3) with different rod directions with respect tothe loading direction (x-direction in Fig. 1a). The predominantdirection of rods in sample #6 was parallel to the loading directionwith rods lying in the x–y plane, in sample #7 it was perpendicularto the loading direction with rods lying in the x–y plane, and insample #3 it was perpendicular to the loading direction with rodslying in the y–z plane.
2.2. In situ X-ray diffraction measurements
2.2.1. Photoelasticity setupA Sharples S-12 demonstration polariscope was used to collect
the in situ photoelastic images. The setup consisted of light source,polarizers, quarter-wave plates and a digital SLR camera as shownin Fig. 1. The quarter-wave plates remained crossed and polarizerswere aligned crossed to establish the dark field. A green-light filterwas also placed between the light source and the camera lens inorder to obtain monochromatic fringes to simplify the analysis. Asolid epoxy disk (without the sample in the centre) produced fromthe same batch of epoxy resin was used as a common calibrationspecimen.
2.2.2. Mechanical loading setupA schematic diagram of the experimental setup is shown in
Fig. 1a. The epoxy disk which contained the cubic sample of humanenamel was slowly deformed along the x-direction in laboratorycoordinates (Fig. 1a). Compressive loading was applied along thex-direction at the load levels from 0 to 400 N using a remotelyoperated and monitored compression rig (Deben, Suffolk, UK) witha 5 kN calibrated load cell. The rig was equipped with custom-made jaws, allowing a high-energy transmission X-ray setup tobe used. The load was incrementally increased (in 25 N steps anda loading rate of 3.8 N s�1) and held constant while the WAXSand photoelastic patterns were collected.
2.2.3. Beamline diffraction setupThe experiment was performed on the B16 test beamline at
Diamond Light Source (DLS, Oxford, UK). A monochromatic X-raybeam of 20 keV photon energy (wavelength: k = 0.062 nm) wascollimated by slits to a spot size of 0.5 mm � 0.5 mm. Radiographicimages of the samples were initially used to align the samples anddetermine the position of interest. The incident beam on the
344 T. Sui et al. / Acta Biomaterialia 10 (2014) 343–354

sample was perpendicular to the loading direction. Space restric-tions of the beamline meant that the sample had to be translatedlaterally from the WAXS configuration into the photoelastic setupat each consecutive loading increment. WAXS diffraction patternswere recorded using a Photonic Science Image Star 9000 detector(Photonic Science Ltd., UK) which was placed 177.33 mmdownstream of the sample. A lightly compacted disk of NISTstandard silicon powder was used for precise calibration of thesample-to-detector distance using diffraction pattern analysis [24].
2.3. Data analysis
2.3.1. Photoelasticity data analysis [22]The use of a diametrically loaded disk is a standard calibration
technique which can be used either to obtain the photoelasticproperties of the birefringent material, or to determine the calibra-tion constants if these properties are known. The fringe constant ofthe material is defined as:
f ¼ 8pD
PN1
; ð1Þ
where D is the diameter of the epoxy disk (12 mm), N1 is the num-ber of fringes for the calibration sample and P is the applied load(N). In order to obtain an estimate for f, a series of known loadswas applied to an empty epoxy disk and the corresponding fringenumbers recorded. An average value for f was then determined bytaking the mean of the f term calculated at each load.
The stress distribution in the disk is characterized in terms ofthe difference between the principal stresses (or Tresca shearstress) using the following expression:
r2 � r1 ¼ N2fh; ð2Þ
where h is the thickness of epoxy (2 mm), and N2 is the number offringes for the sample of interest. The deformation state of theplate-shaped epoxy corresponds closely to the plane stress stateapproximation in two-dimensional photoelasticity. Since theloading was applied along the x-axis, with the epoxy disk lying inthe x–y plane, the principal stresses were r1 < 0, r2 > 0 and r3 = 0.
2.3.2. WAXS data analysisWAXS analysis relies on interpreting the shift of the diffraction
peaks obtained from a bundle of HAp crystals, so that the averagelattice strain in the crystals can be deduced [13,25]. Typical WAXSpatterns of HAp are shown in Fig. 2a–c and only the peaks of inter-est were selected for interpretation (#6 (002) peak, #7 (002) peakand #3 (210) peak). For samples #6 and #7, the (002) lattice planereflection ring from HAp contains information on the orientation ofthe c-axis of the crystals as well as the fibril orientation. This is dueto the fact that the enamel structure has a characteristic strong anddistinct parallel orientation of needle-shaped crystals [14]. Forsample #3 the c-axes of the crystals lie perpendicular to the mea-surement plane, so that the (002) peak is absent or weak. There-fore, another peak (210) needed to be selected. At eachcompressive loading step, the X-ray eye detector was used to verifythe central position. The Deben compression rig applied the loadby displacing the two platens in a balanced way, so as to preservethe centre position approximately stationary. This ensured that aconsistent sample position in the centre of the sample was interro-gated throughout the WAXS data collection. The elastic lattice
Fig. 1. Schematic diagram of the experimental setup composed of (a) synchrotron beam setup and (b) photoelastic setup. The sample was subjected to uniaxial compressiveloading on the compression stage along the x direction. The monochromatic X-ray beam was collimated by slits and oriented perpendicular to the sample surface and theloading direction. An X-ray eye detector was used to ensure that the beam was illuminating the cetral position of the enamel specimen. At each detection point, followingcentring, the X-ray eye detector was translated laterally out of the beam to expose the WAXS detector. WAXS diffraction patterns were recorded at each loading step in threelocations on the sample. After each WAXS pattern collection, the compression stage was laterally translated to the photoelastic setup to collect the photoelastic patterns.
T. Sui et al. / Acta Biomaterialia 10 (2014) 343–354 345

Fig. 2. (a)–(c) Representative WAXS patterns of Debye–Scherrer rings with differing intensities corresponding to each of the three samples (#6, #7 and #3, respectively). Thedark region in the centre of the pattern is the beamstop. The direction with the red dashed double-arrow lines in (b) and (c) indicates the preferred orientation of HAp crystals.Multiple angles with respect to the x-axis were caked (within a 20� range) in order to examine the normal strain variation (red crosses). (d)–(f) The experimental diffractionpattern of integrated intensity vs. scattering angle 2h of the three samples (#6, #7 and #3, respectively); the peaks of interested are marked in red. (g)–(i) Schematicillustration of the first-level geometric model of aligned rods with embedded HAp crystals in the three samples with respect to the laboratory coordinate system; the loadingdirection is into the page. (j–l) Schematic illustration of the second-level geometric model of HAp crystals with different crystalline distributions viewed in the x–y plane (#6:with the preferred orientation at 8�; #7: with the preferred orientation at 91�; #3: random). (m, n) The intensity variation with the Gaussian fit (red curve) corresponding tothe orientation distribution of samples #6 and #7.
346 T. Sui et al. / Acta Biomaterialia 10 (2014) 343–354

strain of HAp crystals was calculated from the changes in theinterplanar spacing [26]:
e ¼ dhkl � d0hkl
d0hkl
; ð3Þ
where dhkl is the deformed d-spacing of the lattice planes with theMiller index {hkl}, and d0
hkl is the strain-free d-spacing value forthe same set of planes.
The data analysis procedure involved pre-processing the 2-Ddiffraction using Fit2D [27]. Initially the peak of interest on eachpattern was ‘‘caked’’ (a term used to refer to the selection of a sec-tor in the radial-azimuthal coordinates of each pattern, and bin-ning the data to obtain the equivalent 1-D radial pattern) withina range of 20�. The azimuthal angle is defined as the angle with re-spect to the x-axis in the x–y plane (perpendicular to the incidentbeam). For each specimen, a different azimuthal range was se-lected due to the preferred orientation of crystallites in the sample(for sample #6 between 0� and 45�, for sample #7 between 45� and90�, and for sample #3 the available range was between 0� and90�). This is indicated by the red crosses in Fig. 2a–c. The latticespacing value deduced for the centre direction of each caked sectorgives rise to the normal strain value for the corresponding orienta-tion (see Fig. 2a–c). To determine the lattice spacing, the experi-mental diffraction pattern was converted to integrated 1-D plotsof intensity vs. scattering angle. These plots for the three sampleswith peaks of interest are shown in Fig. 2d–f. The peaks of interestwere fitted with a Gaussian function in order to obtain the peakcentre. With increasing load, the peak centre position moved withrespect to the strain-free reference value. Finally, the calculation ofthe HAp elastic lattice strain was performed using Eq. (3).
The orientation of the HAp crystals was also carried out using asimilar ‘‘caking’’ approach. In this case, the 1-D intensity was plot-ted as a function of azimuthal angle IWAXS (u) � uWAXS (Fig. 2m andn). Gaussian fitting of the azimuthal centre position of these peaksof plots can then be used to define an associated orientation [8].
3. Modelling
3.1. Finite-element analysis
The finite-element package ABAQUS� v. 6.9 was used to simu-late the stress distributions and to obtain the associated photoelas-tic patterns. Direct comparison of photoelastic patterns betweenmodel and experiment provides a way of simultaneously verifyingthe correctness of the macroscopic properties (of epoxy and enam-el) as well as the mechanical model of the stress distribution with-in the epoxy disk around the enamel samples. In order to visualizethe photoelastic fringe patterns the ‘‘Tresca equivalent stress’’rTresca was selected as the output parameter. Initially a simulationof the solid photoelastic epoxy disk (the calibration specimen) wasdeveloped using a model of 12 mm diameter and 2 mm thickness.The elastic constants of the epoxy were identified by comparingrTresca contour plot with the fringe patterns observed at differentloads.
In order to model the enamel sample (2 mm � 2 mm � 2 mm),a cubic inclusion was introduced and embedded in the centre ofthe epoxy disk with the isotropic elastic constants obtained fromthe calibration. The experimentally applied loads were introducedon the edge of the epoxy model and the stress distribution aroundthe sample (in the x–y plane in global coordinates) was recorded.The tractions present at the boundary of the enamel inclusion ob-tained from this model were then used for the externally appliedstress values in the Eshelby model.
3.2. Geometrical assumptions
The geometrical assumptions used in the enamel model havebeen justified in our previous studies. An outline of these assump-tions at this stage is given here [19]. At the first structural level, thegeometric model of human enamel involves aligned rods with akeyhole-shaped cross-section. The second-level structural consistsof the bundles of HAp needle-shaped crystallites found within eachrod. These bundles are roughly aligned with the longitudinal direc-tion of the rods with some minor misorientations. The degree ofmisorientation can be determined from careful WAXS data inter-pretation. This analysis assumes that the peak intensity at a givenazimuthal angle is proportional to the number of HAp crystals ofthis orientation [28].
The orientation distributions of the rods in the enamel sampleswere derived from the analysis of experimental data and are illus-trated in Fig. 2g–i. Furthermore, the predicted distributions of nee-dle-shaped HAp crystals (in the measured cross-section,perpendicular to the beam direction) are shown in Fig. 2j–l inwhich the misorientation distribution is based on the intensityplots in Fig. 2m and n. The principal orientation of sample #3 isaligned so that orientation component is observed perpendicularto the beam, and therefore no equivalent plot is produced.
In the multiscale Eshelby model, both structural levels are con-sidered as non-dilute systems consisting of a number of inhomoge-neous inclusions (rods at the first level and HAp crystals at thesecond level). For simplicity, both rods and HAp crystals are as-sumed to be of cylindrical shape. Therefore, the classical solutionfor inclusion in the form of a cylinder is used to simulate boththe needle-shaped rods and the individual HAp crystals. In theEshelby approach, the cylinder is approximated by a prolate spher-oid described by the three dimensions, a1, a2 and a3, wherea1 = a2 � a3, i.e. the cross-section of the ellipsoid perpendicularto its longest axis is a circle [29]. The crystal c-axis (correspondingto the (002) peak) of the needle-shaped HAp crystals is normal tothis cross-section of the cylinder, i.e. is aligned with the a3 direc-tion [28]. In the next section a detailed derivation and discussionof the model formulation and implementation is introduced.
3.3. Multiscale Eshelby model
Based on the hierarchical structure of enamel, a two-levelEshelby inclusion model can be used to demonstrate how theHAp crystals respond to external macroscopic loading. The originalEshelby solution gives the analytical expressions for the elasticfields around an ellipsoidal inclusion embedded in an infinite iso-tropic matrix that has the same elastic properties as the inclusion,but there is a misfit or mismatch strain (eigenstrain) between theinclusion and the matrix [30].
Eshelby introduced a tensor S that only depends on the inclu-sion shape and the Poisson’s ratio of the matrix. For an inhomoge-neity with a different stiffness from the matrix, the elastic field canbe found using an equivalent inclusion method. This formulationregards the inhomogeneity as equivalent to an inclusion with anappropriate virtual misfit strain which needs to be determined.The function of the virtual misfit strain is to satisfy the equivalencewhere the elastic field of the inhomogeneity is identical to that ofthe equivalent inclusion. In this way the classical Eshelby theorycan be used to determine the elastic field of any kind of inhomoge-neity. This formulation has greater generality and includes the caseof rods or HAp needle-like crystals (long cylinders) embedded inthe isotropic protein matrix. In the next section, the multiscalemodel for enamel is briefly introduced, while a detailed derivationof the basic theory is given in the Appendix.
T. Sui et al. / Acta Biomaterialia 10 (2014) 343–354 347

3.3.1. First-level model: multiple aligned rod inclusions within theenamel sample
The purpose of the first-level model for human enamel, whichdescribes multiple aligned rod inclusions within enamel, is toestablish the elastic relationship between the externally appliedstress rA and the stress in the rod-like inclusions rinclusion = rrod.
According to the Eshelby model derivation [30], the stress in therods at the first structural level of consideration can be written as:
rinclusion ¼nT � ð1� f1ÞCmatrixðS1 � IÞ ðCmatrix � CrodÞ½S1 � f1ðS1 � IÞ�f
� Cmatrixg�1ðCmatrix � CrodÞT�TC�1matrix
orA
or, expressed more simply:
rinclusion ¼ HrA; ð4Þwhere f1 is the volume fraction of rods, S1 is the Eshelby tensor forthe long cylinder simulating the rod shape, Cmatrix and Crod are thestiffnesses of the protein matrix and the rod, and T is the tensortransformation (rotation) matrix. T encapsulates the effect of thethree Euler angles that define the orientation of the rods with re-spect to the fixed laboratory coordinate system. The stiffness ofthe rod in the simulation is initially unknown and is determinedfrom the second-level model.
3.3.2. Second-level model: partially aligned HAp inclusions within eachindividual rod
In the second-level model, the relationship between the averagestrain in the partially aligned HAp crystals (averaged within theconsidered gauge volume) and the external stress (the rod stressfrom the first-level model) can be established as follows:
heiHApaligned ¼ fðI�C�1
matrixhCiHApÞ�1½hS2i� f2ðhS2i� IÞ��1� Ig
�1T�T þT�T
� ��C�1
matrixrinclusion
or, expressed more simply:
rinclusion ¼ KalignedheiHApaligned; ð5Þwhere hCiHAp and hS2i are the average elastic stiffness tensor and theEshelby tensor for HAp crystals within the gauge volume, respec-tively, and f2 is the volume fraction of the HAp crystals with a cer-tain orientation THAp within the rods. The stiffness of a single HAphas been reported to be transversely isotropic [31]. In Eq. (5), differ-ent orientation angles (different THAp) would lead to different valuesof heiHAp
aligned.
In order to evaluate the multidirectional normal strain compo-nents, each azimuthal angle was taken to correspond to a group ofperfectly aligned HAp crystals, as illustrated by Eq. (5), with a cer-tain volume fraction f2 and orientation THAp, where f2 is determinedfrom the WAXS intensity plot (Fig. 2m and n). In other words, thebundled HAp crystals consist of a distribution of multiple groupswith different orientations and different volume fractions. Mean-while, for each group, all the crystals are perfectly aligned, thushCiHAp and hS2i can be represented by the single-crystal valueshCiHAp = hCiHAp, hS2i = S2. Note that a single HAp crystal in the sec-ond level can be regarded as a single inhomogeneity with nee-dle-like shape, thus the Eshelby tensor for a single HAp shouldbe the same as the rod inclusion (S2 = S1).
Further, the stiffness of rod is obtained from the followingequation:
Crod ¼ C�1matrix � f2fð~CHAp � CmatrixÞ½~S2 � f2ð~S2 � IÞ� þ Cmatrixg
�1n� ð~CHAp � CmatrixÞC�1
matrix
o�1; ð6Þ
where ~S2 ¼ TTHApS2T
�THAp is the transformed Eshelby tensor and
~CHAp ¼ T�1HApCHApT
�THAp is the transformed stiffness of aligned trans-
versely isotropic HAp crystals. Finally, the relationship betweenthe HAp strain and the overall external loading can be establishedby the combination of Eqs. 4 and 5 and simplified Eq. (6) to give:
rA ¼ H�1rrod ¼ H�1KalignedheiHAp ¼ KheiHAp: ð7Þ
4. Experimental results and modelling evaluation
4.1. Finite-element modelling of photoelastic patterns
The photoelastic fringe patterns of solid epoxy disks and epoxywith enamel embedded at the disk centre are shown in Fig. 3. Theresults for Tresca stress distribution simulated in ABAQUS areshown in Fig. 4. The stress variation along the edge of the samplessimulated in ABAQUS was not constant, but was concentratedespecially at the two corners. Direct comparison and matching ofthe model to the photoelastic patterns for solid epoxy disks leadto the isotropic elastic constants of epoxy disk being estimated tobe Eepoxy = 1.2 ± 0.015 GPa, tepoxy = 0.35 [32]. These parameterswere used for the samples with embedded enamel to calculatethe predicted normal stress distribution around the enamel inclu-sion illustrated in Fig. 5a that corresponds to the maximum exter-nal load of 400 N. At this applied load, the stress values were
Fig. 3. Photoelastic images of epoxy disks without (first row) and with embedded enamel (second row) under a series of loading conditions. The number of fringes can beseen to increase with load. The patterns on the first row of solid epoxy disks were used as calibration in order to determine epoxy properties. The patterns on the second rowof epoxy with enamel sample were further used for the determination of the stress distribution around the cubic enamel inclusion. The fringe number is marked.
348 T. Sui et al. / Acta Biomaterialia 10 (2014) 343–354

averaged over all the boundary nodes of each enamel cube sampleedge. This uniform traction was applied in order to eliminate theeffect of the singular points or stress oscillations at corners, withthe result of �54.1 MPa in the x-direction and 0.27 MPa in the y-direction. Therefore the sample loading condition was found tobe close to uniaxial. As expected, the average stress value appliedto the sample was also found to be linearly proportional to the va-lue of the externally applied load, as shown in Fig. 5b.
4.2. Nanoscale HAp distribution and mechanical response of enamel
Fig. 2a–c respectively represent the typical WAXS patterns ofsamples #6, #7 and #3, which consist of series of Debye–Scherrerrings (peaks). The textured nature of enamel meant that onlylimited azimuthal ranges within the rings could be captured insamples #6 and #7. In contrast, in sample #3 the crystals wereapproximately randomly distributed in the x–y plane, so thatcomplete rings were observed. Fig. 2m and n show the azimuthalintensity variation within the available azimuthal ranges in themeasurement plane (x–y plane) in samples #6 and #7,respectively. This provides information about the crystal orienta-
tion distribution, as described in Section 3.3. The preferred orienta-tion direction of the basal plane in HAp crystals in samples #6 and#7 is approximately perpendicular to the central bisector of the arcof the peak of interest (see Fig. 2b and c). The precise values aredetermined from the Gaussian fit in Fig. 2m and n (red line). Sincethe deformation considered is elastic, the assumption was madethat the crystal orientation remains unchanged, i.e. the peak cen-tres found from the plots shown in Fig. 2m and n remain the sameat all applied loads.
In order to obtain the variation of the average normal elastic lat-tice strain component of HAp crystals with applied load, the peakshifts at different azimuthal angles were obtained from the WAXSdata through caking each pattern into 20� sectors. The availablerange for each sample was different, as shown by the red marksin Fig. 2a–c: in sample #6 between 0� and 45�, in sample #7 be-tween 45� and 90�, and in sample #3 between 0� and 90�. For eachof the samples, the elastic lattice strain as a function of appliedstress is plotted as the argument against the applied stress for dif-ferent azimuthal angles in Fig. 6 (in which 0� represents the load-ing direction). The experimental results indicate that, as expected,there is an approximately linear relationship in each direction and
Fig. 4. ABAQUS simulation images of Tresca stress distribution of the epoxy disks without (first row) and with embedded enamel (second row) under a series of loadingconditions. The isotropic elastic constants of the epoxy together with the normal stress distribution around the enamel sample were determined by matching the ABAQUSimages with the photoelastic images in Fig. 3. The greyed regions represent the high stress concentration areas and were neglected in the images.
Fig. 5. (a) Normal stress distribution around the cubic enamel samples in the x- and y-directions (x–y plane is the measurement plane) at the maximum external loading of400 N. The averaged value of the stress distribution was extracted as �54.1 MPa along the x-direction (loading direction) and 0.27 MPa in the y-direction (transversedirection). (b) The external load vs. the averaged stress value applied to the sample in the y-direction.
T. Sui et al. / Acta Biomaterialia 10 (2014) 343–354 349

that each azimuthal angle corresponds to a different slope. This ra-tio between the applied uniaxial external stress and the averageHAp lattice strain gives the apparent modulus along differentdirections [33]. At this stage it is also relevant to mention thatthe initial residual strain in the samples was found to be negligible.
4.3. Evaluation of the multiscale Eshelby model
In setting up the multiscale Eshelby model, the average externalstress derived from the ABAQUS model was used as the inputexternal stress. The material properties and other parameters were
taken from the literature [11,31,34,35], and refined by fitting withthe experimental data of HAp crystal lattice strain. The initial vol-ume fraction of HAp crystals was taken from the previous analysisof the self-similar hierarchical two-level model of enamel, i.e.approximately 95% at both the microscale and nanoscale levels[11]. The needle-like HAp crystals in the enamel were also as-sumed to have a transversely isotropic stiffness with five indepen-dent elastic constants [31]. To describe the geometry of rod andHAp crystals, the cylinder Eshelby tensor was used and the lengthof elliptical axes a1 and a2 within the transverse cross-section wereexpected to be equal to each other, i.e. a1/a2 = 1. In addition,
Fig. 6. The experimental results of applied compressive stress vs. elastic lattice strain of HAp crystals for the three samples at different azimuthal angles (every 15�) withrespect to the loading direction. (a) Sample #6; due to symmetry, only the available angles from the (002) ring from 0� to 45� are selected. (b) Sample #7; due to symmetry,only the available angles from the (002) ring from 45� to 90� are selected. (c) Sample #3; due to the symmetry, only the available angles from the (210) ring from 0� to 90� areselected.
Table 1Preferred orientation and refined structural parameters of the enamel used in the two-level Eshelby model (values reported in the literature are also presented).
Parameter #6 #7 #3 Reference values
Preferred orientation 8� 91� –f1 = f2 93% 90% 95% 95% [11]Cmatix_1 = Cmatix_2 Em = 1 GPa, vm = 0.3 Eprotein = 1 GPa, vprotein = 0.3 [34]CHAp Exx = 132.1 ± 9 GPa,
Gxy = Gxz = 39.6 GPavxy = vxz = 0.33 ± 0.07,vyz = 0.31 ± 0.08Eyy = Ezz = 114.3 ± 6.5 GPa
Exx = 138.4 GPa,Gxy = Gxz = 39.6 GPavxy = vxz = 0.30,vyz = 0.2Eyy = Ezz = 114.3 GPa [31]
Scylinder_1 = Scylinder_2 a1/a2 = 1 [6]
350 T. Sui et al. / Acta Biomaterialia 10 (2014) 343–354

Young’s modulus of protein was set to 1 GPa (this does not takeinto account any effects from viscoelasticity or viscoplasticity[34,35]). The final refined parameters and reference values aresummarized in Table 1.
In Fig. 7, the comparison between the model prediction andexperimental data of the normal strain variation in the three sam-ples under the maximum external load of 400 N is shown as a plotagainst the azimuthal angle.
5. Discussion
The hierarchical nanostructure of human enamel may vary sig-nificantly between patients due to personal history, diet, ethnicorigin, etc. However, due to ethical legislation in the UK, it is notpossible to obtain or publish any further information on the med-ical history of the patients.
This study was conducted using the penetrating power of syn-chrotron X-rays to provide a bulk probe for structure and strainanalysis. Unlike the vast majority of studies that rely on the surfacecharacterization (scanning electron microscope, atom forcemicroscopy, nanoindentation, Raman, etc., and also the reflectionmode of X-ray diffraction), this WAXS study required less prepara-tion effort in terms of cutting and storage and surface conditioning.The use of much thicker samples and gauge volumes (�2 mm) thanthose for other methods (�0.05 mm) ensured that the bulk re-sponse investigated was not affected by minor surface changes.The combination of the data obtained using penetrating radiation(synchrotron X-ray) with model refinement offers the possibilityof identifying the nanoscale parameters of bulk enamel. Theparameter refinement and validation strategy employed in themodel adopted in the present study is particularly helpful in theidentification of nanoscale parameters that may be hard to
determine in the other experiments. The relationship betweenthe nanoscale structure and the macroscopic mechanical behav-iour established in our study improves the understanding of thenanoparticle distribution effects that was lacking in the earlierstudies [8,16,20].
5.1. Finite-element simulation
The high level of correlation seen between the finite-elementanalysis result (illustrated in Fig. 4) and the photoelastic patterns(shown in Fig. 3) suggests that the stress values extracted fromthe finite-element model are a good representation of the tractionsapplied to the enamel samples. In Fig. 4 the stress concentration re-gion has been shaded grey. As this region is far enough away fromthe enamel inclusion, it can be neglected. Only the patterns andstress distribution close to the enamel need to be considered.The plot of the normal stress distribution in Fig. 5 is likely to orig-inate from the frictional contact condition established between theenamel sample and epoxy in ABAQUS. However, the use of theaveraged value of the stress distribution will minimize the effectof this oscillation. In short, the finite-element results suggest anaccurate estimation of the input stress for the two-level Eshelbymodel.
5.2. Refined parameters of the two-level Eshelby model
The input from reference data on material parameters (HApstiffness, etc.) are only used as the starting guess for the optimiza-tion of the elastic constants in order to obtain the best fit to ourexperimental data. The final parameters used in the multiscaleEshelby model are outlined in Table 1 and were refined iteratively,starting from the values reported in the literature. Of the refinable
Fig. 7. Comparison of experimental data (black markers) and modelling results (solid black lines) for the variation of normal strain component with orientation distribution(azimuthal angle) at the maximum externally applied load of 400 N. (a) sample #6, from 0� to 45�; (b) sample #7, from 45� to 90�; (c) sample #3, from 0� to 90�.
T. Sui et al. / Acta Biomaterialia 10 (2014) 343–354 351

parameters, the key ones were the volume fraction of inhomogene-ities at each level and the elastic constants of a single HAp crystal.Among these parameters, the elastic constants, and the modulus inparticular, exert the most profound influence on the result. Thethree samples studied were cut from the same tooth. Thereforetheir properties, such as the degree of mineralisation, size of parti-cles, etc., can be assumed to be close and consistent, with theexception of the orientation distribution of nano-HAp crystalswhich is known to vary with location within the tooth. Model fit-ting was carried out so as to find the parameters that give the bestagreement for all three samples. The single-crystal elastic con-stants of HAp were assumed to be the same. In the model matching(optimization) process, within each specimen, the volume fractionof the rods in enamel and the HAp crystals in rod were assumed tobe the same. After the refinement of the elastic constants (withinthe range reported in the literature) the volume fraction was fur-ther refined. At this stage, further adjustments of other parameterswere also attempted and it was found that this only had a minoreffect. In order to estimate the error in our evaluation of parame-ters, we carried out a careful study of error propagation in ourmodel-fitting procedure following the error analysis methods inRef. [36]. The 95% confidence interval in the fitting results waspropagated back into elastic modulus uncertainty. The final resultwith description has been added to Table 1 Note that since the re-sults of our test are not sensitive to the shear modulus, the uncer-tainty of the shear modulus was not assessed.
The authors note that environmental and developmental factorsmay influence the mechanical behaviour of enamel [37]. Followingtooth eruption, the interaction of the enamel surface with ions insaliva leads to enamel maturation. This post-eruptive maturationmay affect the mechanical behaviour of enamel surface. For exam-ple, the incorporation of fluoride into enamel and the formation offluoroapatite may exert an influence on the superficial layer ofdental enamel. However, the transmission X-ray setup we em-ployed ensured that the bulk rather than the surface was charac-terized for the samples obtained from freshly extracted teethwith no apparent damage, caries or evidence of dental treatments.
5.3. Residual strain
During the preparation process, a low-speed diamond saw andpolishing papers were used to minimize the effect of inducedresidual strain. The other origin of residual strain may be the nat-ural growth of teeth. At low load values, there is a transition region
in the transversely loading samples (#7 and #3), which might re-sult from the residual tensile strain in the transverse direction.However, as also shown in Fig. 6b and c, the residual strain inthe enamel was found to be very small in magnitude and was re-lieved subsequently at higher loading values. Since the elastic re-sponse has been experimentally observed to be dominating afterthe transition (reflected in the linearity of the experimentalstress–strain curve), the presence of this initial residual strain onlyamounts to an initial offset. This means that there has been no im-pact from residual strain on the prediction of the elastic propertiesand that this offset can be neglected in the present analysis.
5.4. Normal strain components variation
In this experiment, the main difference between the three dif-ferent samples was the orientation of the rods with respect to theexternal loading direction. For sample #6 in Fig. 6b, in which theload was applied along the rod longitudinal direction, the crystallattice strain at a given stress was larger at 0� (i.e. along the load-ing direction) than at any other angles (which is a direct result ofthe Poisson effect). However, for the other two samples (#3 and#7), in which the rod orientation was perpendicular to the load-ing direction, the lattice strain was found to be larger at 90� thanat other angles. These plots also demonstrate that loading alongthe transverse direction of the rod induces higher levels in stressor strain in the HAp crystals. In addition, the deviation from lin-earity was found in the three samples (45� for samples #6 and#7, and all the orientation angles for sample #3). Such relativelylarge experimental errors may result from the relatively weakintensity at the edge of the rings for samples #6 and #7, whilefor sample #3, the whole ring demonstrates a relatively weakintensity.
The plots of applied stress against lattice strain also have a com-mon trend, in that the linear relationship starts only after a certainapplied stress has been reached, especially in samples #3 and #7(shown in Fig. 6a and c). This initial trend may demonstrate thatthe HAp crystals in the samples were initially subjected to a hydro-static stress condition. In any case, this effect appears to have onlyminor influence on the further response.
5.5. The elastic anisotropy of the HAp crystals
The different mechanical responses of HAp crystals with respectto the loading direction shown in Fig. 6 and 7 originate not only
Fig. 8. Transversely isotropic elastic modulus of HAp. (a) 3-D representation of directional dependency of HAp elastic modulus (unit: GPa). (b) The projections of directionallydependent modulus on the x–y plane (blue dashed line) and y–z plane (solid black line).
352 T. Sui et al. / Acta Biomaterialia 10 (2014) 343–354

from the different rod directions, but also in the strong anisotropicstiffness of HAp crystals. The 3-D directional modulus of a singleHAp crystal was calculated by transforming the transversely iso-tropic stiffness matrix of a single crystal with different rotationmatrices. The result is shown in Fig. 8a. The non-spherical shapecorresponds to the elastic anisotropy of the HAp crystal. InFig. 8a, the x-axis represents the longitudinal direction of the nee-dle-shaped HAp crystal. Fig. 8b demonstrates the projections of theresulting modulus on the x–y plane and y–z plane. The projectionon the x–y plane is similar to the cases of samples #6 and #7,and the circular projection on the y-z plane is similar to the caseof sample #3 in which an isotropic modulus is observed. The orien-tation with the largest stiffness is found to be along the x-axis, asexpected (longitudinal direction of the HAp crystal). However,the most compliant orientation observed in Fig. 8b is not at 90�,but rather around 60� due to the transverse isotropic stiffness ofHAp crystals.
6. Conclusions
In this study, the lattice strain variation related to the nanoscaleHAp distribution of human enamel was measured during in situelastic compression by the combination of synchrotron WAXSand photoelasticity techniques. This study of the nanoscale phe-nomena and their effect on the macroscopic and microscopicmechanical behaviour provided access to information on boththe structural and mechanical aspects of the sample, and allowedprogress to be made in understanding the structure–property rela-tionships in the hierarchical biomaterial of human enamel. In addi-tion, as an improvement to an earlier proposed composite model[38,39], a multiscale Eshelby inclusion model was establishedand modified by introducing the misorientation distribution ofHAp crystals at the nanoscale level. This second-level effect cannotbe ignored since the mechanical behaviour shows strong depen-dence on the crystallite orientation distribution. The models werevalidated by the good agreement observed between the measuredand calculated normal lattice strain component variation in differ-ent azimuthal directions.
This systematic experimental and modelling approach reportedhere is able to capture the complete picture of the multiscale struc-ture of human enamel and its evolution under loading. The param-eter refinement and validation in the modelling adopted in thepresent simulation offers the potential identification of nanoscaleparameters, which may be hard to determine otherwise. By com-bining the results with previous studies of human dentine and en-amel [12,19], an improved and comprehensive understanding ofthe multiscale structural-mechanical properties within humandental tissue can be achieved. Such information is essential fordeveloping better prosthetic materials and dental fillings and hasthe potential to shed light on the mechanical evolution associatedwith the multiscale structural changes induced in human teeth bydisease and treatment. Finally, this approach also enables the char-acterization of the structure–property relationship of other hardhierarchical biomaterials.
Acknowledgements
A.M.K. acknowledges the support of EPSRC through grants EP/I020691 ‘‘Multi-disciplinary Centre for In-situ Processing Studies(CIPS)’’, EP/G004676 ‘‘Micromechanical Modelling and Experimen-tation’’, and EP/H003215 ‘‘New Dimensions of Engineering Scienceat Large Facilities’’. Diamond Light Source is acknowledged for pro-viding the beam time.
Appendix A.
A short overview of the Eshelby general inclusion theory isintroduced, leading to the derivation of the constitutive law for anumber of non-dilute HAp crystals (inhomogeneities) embeddedin a finite protein matrix.
A.1. Dilute system
The general geometric structure for a dilute system is an ellip-soidal inclusion embedded in an infinite matrix. ‘‘Dilute’’ meansthat the volume fraction of the inclusion can be neglected. If thereis a mismatch between the inclusion and the matrix, i.e. a uniformmisfit strain et� in the inclusion, the Eshelby model shows that thetotal strain in the inclusion ei is related to et� by an Eshelby tensor Sthat only depends on the inclusion shape and the Poisson’s ratio ofthe matrix:
ei ¼ Set� : ðA1Þ
As a consequence, with the known stiffness tensor CM (the sameas the surrounding matrix) of the inclusion, the inclusion stress rI
can be calculated based on Hooke’s law:
rI ¼ CMðei � et� Þ ¼ CMðS� IÞet� : ðA2Þ
For an inhomogeneous inclusion (or an inhomogeneity) with adifferent stiffness CI, its elastic field is shown to be identical toan equivalent inclusion with an appropriate misfit strain et , whichis to be determined from the equivalence relation:
rI ¼ CIðei � et� Þ ¼ CMðei � etÞ: ðA3Þ
Finally the external load rA that results in the overall compositestrain eA can be added to Eq. (A3):
rI þ rA ¼ CIðei � et� þ eAÞ ¼ CMðei � et þ eAÞ; ðA4Þwhere rI here is the stress caused by the mismatch between theinhomogeneity and the matrix.
A.2. Non-dilute system
A non-dilute system represents the condition that multipleinhomogeneities are embedded in the matrix in which their vol-ume fraction cannot be neglected. To satisfy the boundary condi-tions at the external boundaries of the finite composite, Eshelbyintroduced the concept of a mean ‘‘image’’ stress, hriM ¼ CMheiMas an average of the stresses within each individual phase. Thenthe equivalence relation Eq. (A4) becomes:
hCiIðheii þ heiM þ eA � heit� Þ ¼ CMðheii þ heiM þ eA � heitÞ; ðA5Þwhere ‘‘h�i’’ means the mean value, heiM is the mean image strain inall the phases and hCiI is the average stiffness of the multiple inho-mogeneities. In a non-dilute system, the mean image stress hriMand the mean stress in the equivalent inclusions hriI due to the mis-fit strain can be expressed by [30,40]:
hriM ¼ CMheiM ¼ �fCMðhSi � IÞheit ðA6Þ
hriI ¼ ð1� f ÞCMðhSi � IÞheit ; ðA7Þwhere hSi is the average Eshelby tensor and f is the volume fractionof inclusions. Thus heit can be obtained as a function of the appliedstress:
heit ¼� ðCM �hCiIÞ½hSi� f ðhSi� IÞ��CM� ��1ðCM �hCiIÞC�1
M rA: ðA8Þ
T. Sui et al. / Acta Biomaterialia 10 (2014) 343–354 353

A.3. Enamel first-level model
The first-level model considers multiple aligned rods as theinhomogeneous inclusion and the protein as the surroundingmatrix. In an elastic problem, no misfit strain exists in the inhomo-geneity. Thus according to Eq. (A5):
Crod heii þ heimatrix þ eA� �
¼ Cmatrix heii þ heimatrix þ eA � heit� �
;
ðA9Þwhere Crod is the stiffness of the rods. Further, in terms of Eqs. (A6)–(A8), the rod stress can be determined as shown in Eq. 4, consistingof two parts, namely the contribution from the elastic anisotropyand that from the applied stress.
A.4. Enamel second-level model
The second-level model considers each rod as a composite andthe HAp crystals are multiply aligned inhomogeneous inclusions.The obtained rod stress serves as the external load in the secondlevel. Similar to Eq. (A9):
hCiHAp heii þ heimatrix þ eA� �
¼ Cmatrix heii þ heimatrix þ eA � heit� �
;
ðA10Þwhere hCiHAp is the average stiffness of the aligned HAp crystals. Theaverage lattice strain in HAp crystals consists of three parts:
heiHApaligned ¼ heii þ heimatrix þ eA; ðA11Þ
where heii is the contribution from the elastic anisotropy, heimatrix isdue to the finite matrix effect and eA is the contribution from theapplied load. The final expression in Eq. (5) is based on Eqs. (A6)–(A8), and Eqs. (A10) and (A11).
Appendix B. Figures with essential colour discrimination
Certain figures in this article, particularly Figs. 1–8 are difficultto interpret in black and white. The full colour images can be foundin the on-line version, at doi: http://dx.doi.org/10.1016/j.actbio.2013.09.043
References
[1] Zarone F, Russo S, Sorrentino R. From porcelain-fused-to-metal to zirconia:clinical and experimental considerations. Dent Mater 2011;27:83–96.
[2] Macho GA, Jiang Y, Spears IR. Enamel microstructure—a truly three-dimensional structure. J Hum Evol 2003;45:81–90.
[3] Gao HJ, Ji BH, Jager IL, Arzt E, Fratzl P. Materials become insensitive to flaws atnanoscale: lessons from nature. Proc Natl Acad Sci U S A 2003;100:5597–600.
[4] Ten Cate AR, Dale AC. Oral histology: development, structure, and function. St.Louis, MO: Mosby; 1980.
[5] Ang SF, Saadatmand M, Swain MV, Klocke A, Schneider GA. Comparison ofmechanical behaviors of enamel rod and interrod regions in enamel. J MaterRes 2012;27:448–56.
[6] He LH. Mechanical behavior of human enamel and the relationship to itsstructural and compositional characteristics. PhD thesis; 2008.
[7] Kerebel B, Daculsi G, Kerebel LM. Ultrastructural studies of enamel crystallites.J Dent Res 1979;58:844–51.
[8] Al-Jawad M, Steuwer A, Kilcoyne SH, Shore RC, Cywinski R, Wood DJ. 2Dmapping of texture and lattice parameters of dental enamel. Biomaterials2007;28:2908–14.
[9] Poole DFG, Brooks AW. The arrangement of crystallites in enamel prisms. ArchOral Biol 1961;5:14.
[10] Nakamura T, Lu C, Korach CS. Mechanical properties of tooth enamel:microstructural modeling and characterization. Conf Proc Soc Exp Mech Ser2011;9999:171–9.
[11] Bechtle S, Ozcoban H, Lilleodden ET, Huber N, Schreyer A, Swain MV, et al.Hierarchical flexural strength of enamel: transition from brittle to damage-tolerant behaviour. J R Soc Interface 2012;9:1265–74.
[12] Sui T, Sandholzer MA, Baimpas N, Dolbnya IP, Walmsley AD, Lumley PJ, et al.Multi-scale modelling and diffraction-based characterization of elasticbehaviour of human dentine. Acta Biomater 2013;9:7937–47.
[13] Young ML, DeFouw J, Almer JD, Dunand DC. Load partitioning duringcompressive loading of a Mg/MgB2 composite. Acta Mater 2007;55:3467–78.
[14] Deymier-Black AC, Almer JD, Stock SR, Haeffner DR, Dunand DC. SynchrotronX-ray diffraction study of load partitioning during elastic deformation ofbovine dentin. Acta Biomater 2010;6:2172–80.
[15] Giri B, Almer JD, Dong XN, Wang XD. In situ mechanical behavior of mineralcrystals in human cortical bone under compressive load using synchrotron X-ray scattering techniques. J Mech Behav Biomed 2012;14:101–12.
[16] Almer JD, Stock SR. High energy X-ray scattering quantification of in situ-loading-related strain gradients spanning the dentinoenamel junction (DEJ) inbovine tooth specimens. J Biomech 2010;43:2294–300.
[17] Singhal A, Almer JD, Dunand DC. Variability in the nanoscale deformation ofhydroxyapatite during compressive loading in bovine bone. Acta Biomater2012;8:2747–58.
[18] Almer JD, Stock SR. Internal strains and stresses measured in cortical bone viahigh-energy X-ray diffraction. J Struct Biol 2005;152:14–27.
[19] Sui T, Sandholzer MA, Baimpas N, Dolbnya IP, Landini G, Korsunsky AM.Hierarchical modelling of elastic behaviour of human enamel based onsynchrotron diffraction characterisation. J Struct Biol 2013; in press.
[20] Fujisaki K, Todoh M, Niida A, Shibuya R, Kitami S, Tadano S. Orientation anddeformation of mineral crystals in tooth surfaces. J Mech Behav Biomed2012;10:176–82.
[21] Nogueira BCL, Fernandes PM, Santana LNS, Lima RR. Ultrastructuralcharacterization of bovine and buffalo enamel through scanning electronmicroscopy. In: XXIII Congress of the Brazilian Society of Microscopy andMicroanalysis; 2011.
[22] Dally JW, Riley WF. Experimental stress analysis. 3rd ed. New York: McGraw-Hill; 1991.
[23] Xie ZH, Swain MV, Swadener G, Munroe P, Hoffman M. Effect of microstructureupon elastic behaviour of human tooth enamel. J Biomech 2009;42:1075–80.
[24] Berger MJ, Hubbell JH, Seltzer SM, Coursey JS, Zucker DS. XCOM: Photon CrossSection Database 1.2; 1999. Available from: http://physics.nist.gov/xcom.
[25] Young ML, Almer JD, Daymond MR, Haeffner DR, Dunand DC. Load partitioningbetween ferrite and cementite during elasto-plastic deformation of anultrahigh-carbon steel. Acta Mater 2007;55:1999–2011.
[26] Korsunsky AM, Baimpas N, Song X, Belnoue J, Hofmann F, Abbey B, et al. Straintomography of polycrystalline zirconia dental prostheses by synchrotron X-ray diffraction. Acta Mater 2011;59:2501–13.
[27] Hammersley AP. FIT2D: an introduction and overview. ESRF Internal Report;1997.
[28] Huang Z, Newcomb CJ, Bringas P, Stupp SI, Snead ML. Biological synthesis oftooth enamel instructed by an artificial matrix. Biomaterials 2010;31:9202–11.
[29] Mura T. Micromechanics of defects in solids. 2nd rev. ed. Dordrecht: MartinusNijhoff/Kluwer; 1987.
[30] Clyne TW, Withers PJ. An introduction to metal matrixcomposites. Cambridge: Cambridge University Press; 1993.
[31] Ochsner A, Ahmed W. Biomechanics of hard tissues. New York: John Wiley &Sons; 2011.
[32] McCrum NG, Buckley CP, Bucknall CB. Principles of polymer engineering. 2nded. Oxford: Oxford University Press; 1997.
[33] Powers JM, Farah JW. Apparent modulus of elasticity of dental amalgams. JDent Res 1975;54:902.
[34] Qin Q-H, Swain MV. A micro-mechanics model of dentin mechanicalproperties. Biomaterials 2004;25:5081–90.
[35] Huo B. An inhomogeneous and anisotropic constitutive model of humandentin. J Biomech 2005;38:587–94.
[36] Taylor JR. An introduction to error analysis: the study of uncertainties inphysical measurements. 2nd ed. Sausalito, CA: University Science Books; 1997.
[37] Takagi S, Liao H, Chow LC. Effect of tooth-bound fluoride on enameldemineralization/remineralization in vitro. Caries Res 2000;34:281–8.
[38] Bar-On B, Wagner HD. Elastic modulus of hard tissues. J Biomech2012;45:672–8.
[39] Jones RM. Mechanics of composite materials. 2nd edn. Philadelphia, PA,London: Taylor & Francis; 1999.
[40] Withers PJ, Stobbs WM, Pedersen OB. The application of the Eshelby method ofinternal-stress determination to short fiber metal matrix composites. ActaMetall Mater 1989;37:3061–84.
354 T. Sui et al. / Acta Biomaterialia 10 (2014) 343–354

Hierarchical modelling of elastic behaviour of human enamel basedon synchrotron diffraction characterisation
Tan Sui a,⇑, Michael A. Sandholzer b, Nikolaos Baimpas a, Igor P. Dolbnya c, Gabriel Landini b,Alexander M. Korsunsky a
aDepartment of Engineering Science, University of Oxford, Parks Road, Oxford OX1 3PJ, United Kingdomb School of Dentistry, College of Medical and Dental Sciences, University of Birmingham, St Chad’s Queensway, Birmingham B4 6NN, United KingdomcBeamline B16, Diamond Light Source, Harwell Oxford Campus, Didcot OX11 0DE, United Kingdom
a r t i c l e i n f o
Article history:Received 3 August 2013Received in revised form 20 September2013Accepted 26 September 2013Available online 7 October 2013
Keywords:EnamelWAXS/SAXSEshelbyMechanical properties
a b s t r a c t
Human enamel is a hierarchical mineralized tissue with a two-level composite structure. Few studieshave focused on the structure–mechanical property relationship and its link to the multi-scale architec-ture of human enamel, whereby the response to mechanical loading is affected not only by the rod dis-tribution at micro-scale, but also strongly influenced by the mineral crystallite shape, and spatialarrangement and orientation. In this study, two complementary synchrotron X-ray diffraction tech-niques, wide and small angle X-ray scattering (WAXS/SAXS) were used to obtain multi-scale quantitativeinformation about the structure and deformation response of human enamel to in situ uniaxial compres-sive loading. The apparent modulus was determined linking the external load and the internal strain inhydroxyapatite (HAp) crystallites. An improved multi-scale Eshelby model is proposed taking intoaccount the two-level hierarchical structure of enamel. This framework has been used to analyse theexperimental data for the elastic lattice strain evolution within the HAp crystals. The achieved agreementbetween the model prediction and experiment along the loading direction validates the model and sug-gests that the new multi-scale approach reasonably captures the structure–property relationship for thehuman enamel. The ability of the model to predict multi-directional strain components is also evaluatedby comparison with the measurements. The results are useful for understanding the intricate relationshipbetween the hierarchical structure and the mechanical properties of enamel, and for making predictionsof the effect of structural alterations that may occur due to the disease or treatment on the performanceof dental tissues and their artificial replacements.
� 2013 Elsevier Inc. All rights reserved.
1. Introduction
Enamel, a highly mineralized substance, is a hard and brittleouter layer above the amelo-dentinal junction (ADJ) that coversthe crown portion of the tooth, serving as an important stiff andwear-resistant part of teeth. It is a biological composite with acomplex hierarchical structure, mainly composed of high contentof inorganic biological hydroxyapatite (HAp) crystals (approxi-mately 25–30 nm of thickness). Enamel consists of 80–90% inor-ganic material by volume (around 96% by weight) (Bechtle et al.,2012) and relatively low content of organic globular protein (Anget al., 2012; He, 2008). At the macro-scale level, the enamel canbe seen as a continuum, while at the micro-scale some notable fea-tures are present, in particular, aligned long prisms (or rods) with aspecific ‘‘keyhole’’ shape, with the top oriented toward the crown
of the tooth (Macho et al., 2003). On the nano-scale level, enamelis modelled as a composite with ribbon-like HAp particles orga-nized and bundled together by globular protein (Kerebel et al.,1979).
Understanding the effect of microstructural alterations ofenamel on the performance of teeth requires the knowledge ofhow the mechanical properties are related to the complex hierar-chical structure. Over half a century, research has been carriedout on the mechanical properties of enamel, and on its macro-and micro-structure (He, 2008; Nakamura et al., 2011). However,few studies have focused on the influence of the nano-scale struc-ture (Bechtle et al., 2012; Habelitz et al., 2001), where the macro-scopic mechanical response can be considered to be a function ofcrystal shape and orientation of the mineral phase (Sui et al.,2013). Investigations at the nano-scale require the use of advancedtechniques and systematic models to establish a firm basis forunderstanding the hierarchical structure–property relationships.
One suitable technique for the study of nano-structure is smallangle X-ray scattering (SAXS), an advanced non-destructive
1047-8477/$ - see front matter � 2013 Elsevier Inc. All rights reserved.http://dx.doi.org/10.1016/j.jsb.2013.09.023
⇑ Corresponding author. Fax: +44 18652 73010.E-mail address: [email protected] (T. Sui).
Journal of Structural Biology 184 (2013) 136–146
Contents lists available at ScienceDirect
Journal of Structural Biology
journal homepage: www.elsevier .com/ locate/y jsbi

technique widely used to reveal quantitative information about theorientation and degree of alignment in crystalline and amorphousmaterials (Fratzl et al., 1996). Another X-ray technique, wide angleX-ray scattering (WAXS), is widely used to quantify the internalstrain in crystal lattices, including in response to external loading,e.g. in situ compression or tension (Young et al., 2007a,b). SAXS/WAXS have been applied only recently to the study of mineralizedbiological composites, such as bones and bovine teeth (Almer andStock, 2005, 2010; Deymier-Black et al., 2010; Singhal et al., 2012).Deymier-Black et al. (Deymier-Black et al., 2010) determined thelongitudinal apparent modulus of hydroxyapatite (HAp) in bovinedentine using synchrotron based WAXS, while strain distributionacross the ADJ in bovine teeth was investigated by Almer and Stock(Almer and Stock, 2010). None of these studies were performed onhuman enamel, in which different particularities of its morphologyare expected to result in differences in the mechanical properties(Nogueira et al., 2011). Moreover, very few studies devoted to hu-man enamel have been published (Fujisaki et al., 2012), and earlystudies did not take into account the nanoparticle shape, size andorientation distribution (Bechtle et al., 2012). Therefore, a deepunderstanding of the relationship between the nano-scale struc-ture and the macroscopic mechanical behaviour of human enamelis still lacking.
Many models of composite mechanical behaviour have beenproposed, notably the Voigt and Reuss bounds, as well as the Jones(Jones, 1999) and BW models (staggered microstructural model)(Bar-On and Wagner, 2012). Besides these, an improved multi-le-vel model, based on the original Eshelby inclusion model (Takaoand Taya, 1987; Withers et al., 1989) has been established and suc-cessfully applied in the evaluation of the mechanical response ofhuman dentine by capturing the relationship between the nano-scale structure and macroscopic loading (Sui et al., 2013).
In this study, the in situ synchrotron technique, simultaneousSAXS/WAXS, was used to measure the elastic crystallite strain(WAXS), the alterations in crystal orientation and the degree ofalignment of nano-scale HAp crystals (SAXS) in human enamelsubjected to an externally applied uniaxial compressive loadingalong the approximately longitudinal direction with respect tothe preferential rod orientation. The multi-scale Eshelby modelwas modified and extended to capture the hierarchical structureand properties of the human enamel. The model predictions wereverified by comparison with experimental data. The ability of themodel to capture the observed response is discussed.
2. Materials and method
2.1. Sample preparation
A freshly extracted normal human third molar (ethical approvalobtained from the National Research Ethics Committee; NHS-RECreference 09.H0405.33/Consortium R&D No. 1465) was washedand cleaned in distilled water to eliminate residues so that the pos-sibility of contamination or other chemical effect was excluded.The samples were kept for a maximum of 7 days in distilled waterin a commercial fridge at 4 �C until the experiment was performed,implying relatively low diffusion rates that impede or exclude anypossible superficial demineralization effect of water. It is alsoimportant to highlight that the technique we employed (X-ray dif-fraction in transmission) is a bulk, not a surface technique. As aconsequence, even if small superficial changes were to arise, theircontribution to the overall scattered signal would be negligible.Thus, the composition of the inorganic phase in the dental tissuewas well-represented by pure organically-derived HAp. The crownwas cut off below the ADJ using a low speed diamond saw (IsometBuehler Ltd., Lake Bluff, Illinois, USA) and further cut into smaller
cubes, and a series of polishing papers were used to produce thefinal 2 � 2 � 2 mm cube of enamel. Regarding the rod directionof the enamel sample, the cut in the prepared sample was closeto the region perpendicular to the occlusion surface. Therefore,the predominant rod direction was assumed to be in the longitudi-nal direction of the sample.
2.2. Micro-CT protocol and data processing
To determine the measuring positions and loading cross-sectionfor the SAXS/WAXS experiments, a micro-CT scan was carried outat 1.9 lm resolution using 40 kV voltage, 120 lA current and a0.5 mm Aluminium filter (SkyScan 1172, Bruker microCT, Kontich,Belgium). The resulting slices were reconstructed using the Sky-Scan NRECON software package, and subsequent 3-D planningmodels were created using Fiji imaging software (Eliceiri et al.,2012).
2.3. In situ scattering measurements
The experiment was performed on the B16 beamline at Dia-mond Light Source (DLS, Oxford, UK). A schematic diagram of theexperimental set-up is shown in Fig. 1a. The sample of human en-amel was slowly deformed in compression along the x-direction inthe laboratory coordinates (Fig. 1a) at the displacement rate of0.2 mm/min until failure, using a remotely operated and moni-tored compression rig (Deben, Suffolk, UK), with a 5kN calibratedload cell. The rig was equipped with custom-made jaws, allowinga high-energy transmission X-ray setup to be used.
The monochromatic X-ray beam at the photon energy of17.99 keV was used and collimated to the spot size of0.5 � 0.5 mm. The beam was incident at the sample in the direc-tion perpendicular to its loading direction. Two separate WAXSand SAXS detectors were alternately setup to collect the patternsat consecutive loading increments downstream of the beam. Theglobal Z-axis is along the beam direction; global X-axis correspondsto the horizontal (loading) direction, Y to the vertical. The X–Yplane is parallel to the detector plane. WAXS diffraction patternswere recorded using a Photonic Science Image Star 9000 detector(Photonic Science Ltd., UK) placed at a sample-to-camera distanceof 128.72 mm. Further downstream, a Pilatus 300 K detector (Dec-tris, Baden, Switzerland) was positioned at a distance of4358.47 mm to collect the SAXS patterns. In order to record boththe WAXS and SAXS patterns at each scanning location, the WAXSdetector was translated laterally to expose the SAXS detector aftereach WAXS exposure. A lightly compacted disk of standard siliconpowder and a dry chicken collagen sample inserted close to thesample position were used as calibration standards and to deter-mine the sample-to-detector distance with the required precision(Calibration, 2013).
2.4. Scattering data analysis
2.4.1. WAXS data analysisWAXS data can be interpreted in terms of the shift of the dif-
fraction peak obtained from a cluster of HAp crystals, so that theaverage micro-strain (lattice strain) in the crystals can be deduced(Young et al., 2007a,b). The typical WAXS pattern of HAp is shownin Fig. 2a (only the (002) peak is selected for interpretation). Ateach compressive load step, the beam was scanned between theloading platens, and only the results from the middle were selectedfor WAXS interpretation to guarantee that the same location wasstudied during compressive deformation. The elastic lattice strainof the HAp phase was computed by calculating the changes inthe inter-planar spacing between the crystal planes (Korsunskyet al., 2011):
T. Sui et al. / Journal of Structural Biology 184 (2013) 136–146 137

e ¼ d002 � d0002
d0002
ð1Þ
where d002 is the deformed d-spacing and d0002 is the reference
strain-free value. In detail, 2D diffraction images were firstly pre-processed using Fit2D (Hammersley, 1997). The (002) peak of inter-est from each pattern was ‘‘caked’’ (a professional jargon term usedto refer to the selection of a sector in the radial–azimuthal coordi-nates of each pattern, and binning the data to obtain the equivalent1D radial pattern) within the range of 20� around the loading direc-tion (Fig. 2a). The strain measurement needs high quality of peaksin order to determine the shift of the peak centre by Gaussian fit-ting. The smaller the angular width of the bin is, the lower (or nois-ier) the integrated (averaged) intensity will be. Since the crystallineperfection in biomaterials is not as good as that in the pure crystal,the binning angle of 20� is often used in order to guarantee the pro-nounced peak to fit. Furthermore, each pattern was ‘‘caked’’ withthe same width of 20� in the direction of �15�, 0�, 15�, 30� and45� of the (002) peak (see Fig. 2a). The normal strain componentalong the centre direction of each ‘‘cake slice’’ represents the straincomponent in the corresponding orientation. Subsequently the 1Dradial plot of each individual (002) peak within each sector was fit-ted with a Gaussian function to obtain the peak centre position. Thesample under strain-free condition (without any load) was charac-terised by WAXS and used as the reference state for strain measure-ment. As the load increased, the shift of the peak centre positionwith respect to the strain-free reference point allowed the calcula-tion of the HAp elastic lattice strain. In addition, the structural ori-entation angle was determined from the strain-free sample byazimuthal–radial ‘‘caking’’ of the (002) peak over the range of
available peak (�30� � 60�), and fitting the azimuthal centre posi-tion of the pronounced peaks of IWAXS(u)�u_WAXS plot (Fig. 2c)(Al-Jawad et al., 2007).
2.4.2. SAXS data analysisFor SAXS data analysis, the pattern from the strain-free enamel
sample was taken as a reference. Due to the dense packing of crys-tals in enamel, it is the electron density change occurring in thegaps between crystalline particles that gives rise to the scatteringsignal (Tanaka et al., 2010). It is also understood that the orienta-tion of the gaps between rods roughly coincides with the orienta-tion of the crystals within the rod (Tanaka et al., 2010). Thus, theinformation from gap scattering can be used to deduce the orienta-tion and degree of alignment (percentage of aligned particles) ofHAp crystals. To quantify it, the 2D SAXS patterns were processedby integrating over the entire relevant range of scattering vector q,resulting in a function ISAXS(u) of the azimuthal angle u_SAXS(Fig. 2d) (Tesch et al., 2001, 2003). The predominant orientation/0 SAXS of the mineral crystals is determined by the position ofthe two peaks in the plot of ISAXS(u) (e.g. /0 SAXS in Fig. 2d), whichis corresponding to the short axis of SAXS pattern. Further, the de-gree of alignment qwith respect to the predominant orientation ofHAp can be calculated by the ratio of the two areas under the curveof ISAXS(u):
q ¼ Aoriented
Aoriented þ Aunorientedð2Þ
where Aunoriented is the area of constant background level accountingfor the scattering from unoriented particles and Aoriented depicts thetotal area below the curve of ISAXS(u)�u_SAXS subtracting Aunoriented.
Fig.1. Schematic diagram of experimental setup and sample preparation; (a) the sample was under uniaxial compressive loading on the compression stage. Themonochromatic X-ray beam was directed perpendicular to the sample surface and the loading direction. WAXS and SAXS diffraction patterns were recorded at each loadingstep at three locations on the sample. The WAXS detector was translated laterally out of the beam to expose the SAXS detector after each collection of WAXS and (b) micro-CTbased models of the two preparation stages. (1) Cross-section of reconstructed human dental model with region to be cut marked by red square and (2) the final2 � 2 � 2 mm cubes of enamel. The red square in the middle indicates the central position of the X-ray beam. (For interpretation of the references to colour in this figurelegend, the reader is referred to the web version of this article.)
138 T. Sui et al. / Journal of Structural Biology 184 (2013) 136–146
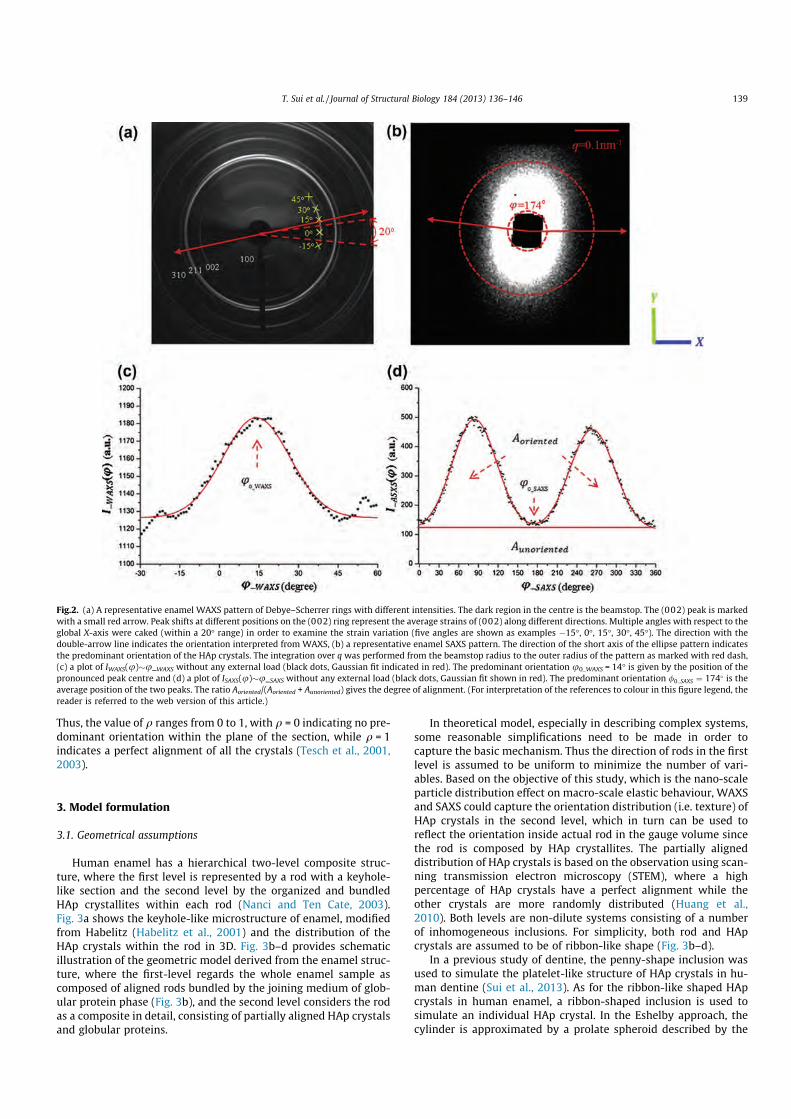
Thus, the value of q ranges from 0 to 1, with q = 0 indicating no pre-dominant orientation within the plane of the section, while q = 1indicates a perfect alignment of all the crystals (Tesch et al., 2001,2003).
3. Model formulation
3.1. Geometrical assumptions
Human enamel has a hierarchical two-level composite struc-ture, where the first level is represented by a rod with a keyhole-like section and the second level by the organized and bundledHAp crystallites within each rod (Nanci and Ten Cate, 2003).Fig. 3a shows the keyhole-like microstructure of enamel, modifiedfrom Habelitz (Habelitz et al., 2001) and the distribution of theHAp crystals within the rod in 3D. Fig. 3b–d provides schematicillustration of the geometric model derived from the enamel struc-ture, where the first-level regards the whole enamel sample ascomposed of aligned rods bundled by the joining medium of glob-ular protein phase (Fig. 3b), and the second level considers the rodas a composite in detail, consisting of partially aligned HAp crystalsand globular proteins.
In theoretical model, especially in describing complex systems,some reasonable simplifications need to be made in order tocapture the basic mechanism. Thus the direction of rods in the firstlevel is assumed to be uniform to minimize the number of vari-ables. Based on the objective of this study, which is the nano-scaleparticle distribution effect on macro-scale elastic behaviour, WAXSand SAXS could capture the orientation distribution (i.e. texture) ofHAp crystals in the second level, which in turn can be used toreflect the orientation inside actual rod in the gauge volume sincethe rod is composed by HAp crystallites. The partially aligneddistribution of HAp crystals is based on the observation using scan-ning transmission electron microscopy (STEM), where a highpercentage of HAp crystals have a perfect alignment while theother crystals are more randomly distributed (Huang et al.,2010). Both levels are non-dilute systems consisting of a numberof inhomogeneous inclusions. For simplicity, both rod and HApcrystals are assumed to be of ribbon-like shape (Fig. 3b–d).
In a previous study of dentine, the penny-shape inclusion wasused to simulate the platelet-like structure of HAp crystals in hu-man dentine (Sui et al., 2013). As for the ribbon-like shaped HApcrystals in human enamel, a ribbon-shaped inclusion is used tosimulate an individual HAp crystal. In the Eshelby approach, thecylinder is approximated by a prolate spheroid described by the
Fig.2. (a) A representative enamel WAXS pattern of Debye–Scherrer rings with different intensities. The dark region in the centre is the beamstop. The (002) peak is markedwith a small red arrow. Peak shifts at different positions on the (002) ring represent the average strains of (002) along different directions. Multiple angles with respect to theglobal X-axis were caked (within a 20� range) in order to examine the strain variation (five angles are shown as examples �15�, 0�, 15�, 30�, 45�). The direction with thedouble-arrow line indicates the orientation interpreted from WAXS, (b) a representative enamel SAXS pattern. The direction of the short axis of the ellipse pattern indicatesthe predominant orientation of the HAp crystals. The integration over q was performed from the beamstop radius to the outer radius of the pattern as marked with red dash,(c) a plot of IWAXS(u)�u_WAXS without any external load (black dots, Gaussian fit indicated in red). The predominant orientation u0_WAXS = 14� is given by the position of thepronounced peak centre and (d) a plot of ISAXS(u)�u_SAXS without any external load (black dots, Gaussian fit shown in red). The predominant orientation /0 SAXS ¼ 174 is theaverage position of the two peaks. The ratio Aoriented/(Aoriented + Aunoriented) gives the degree of alignment. (For interpretation of the references to colour in this figure legend, thereader is referred to the web version of this article.)
T. Sui et al. / Journal of Structural Biology 184 (2013) 136–146 139

three dimensions, a1, a2 and a3 in Fig. 3e. Normally a1 = a2 � a3, i.e.the cross section is a circle (Mura, 1987). The crystal c-axis (corre-sponding to the (002) peak) of ribbon-like shaped HAp crystals isnormal to the cross section of the cylinder, i.e. along a3 direction(Huang et al., 2010). In the next section, the model is briefly intro-duced, while a detailed derivation is shown in Appendix.
3.2. First-level model: multiple aligned rod inclusions within enamelsample
The purpose of the first-level model for human enamel, whichdescribes multiple aligned rod inclusions within enamel, is toestablish the elastic relationship between the externally appliedstress rA and the stress in the rod-like inclusions rinclusion = rrod.According to the Eshelby model derivation (Clyne and Withers,1995), the stress in the rod can be expressed as
rrod ¼ T � ð1� f1ÞCmatrixðS1 � IÞ ðCmatrix � CrodÞ½S1 � f1ðS1 � IÞ�ff�Cmatrixg�1ðCmatrix � CrodÞT�TC�1
matrix
orA
or; written more simply; rrod ¼ HrA ð3Þ
In the above expression, f1 is the volume fraction of rods in the en-amel, S1 is the Eshelby tensor for a cylinder that approximates therod shape, Cmatrix, Crod are the stiffness tensors of the globular pro-tein and rod respectively, and T is the tensor transformation (rota-tion) matrix that depends on the Euler angles (see Appendix) givingthe orientation of an individual rod with respect to the laboratorycoordinate system. In the present model, the laboratory coordinateswere fixed, and it was assumed that the rods were all aligned alongthe loading direction, thus T was constant. The rod stiffness remainsto be determined from the second level model.
3.3. Second-level model: partially aligned HAp inclusions within eachindividual rod
The purpose of the second-level model of enamel, which de-scribes partially aligned HAp inclusions within one rod, is to estab-lish the relationship between the rod inclusion stress and theaverage strain in the HAp crystals in rod heiHAp (rrod = K1heiHAp).The measured crystal strain corresponds to the mean strain valuefor all the crystals within the considered gauge volume (Chouet al., 2012). Due to the partial alignment of HAp crystals within
Fig.3. (a) A schematic 3D structure of enamel, showing keyhole-like rods aligned in parallel (modified from Habelitz (2001). The rods contain organized and bundled HApcrystals, (b) rods viewed along their longitudinal direction, (c) rods viewed along their transverse direction, (d) the structure of partial aligned ribbon-like HAp crystals viewedfrom the cross-section parallel to the rods direction. The alignment angle u with respect to the global X-axis is also shown and (e) a typical prolate spheroid inclusion modelwith principal half axis a1, a2 and a3.
140 T. Sui et al. / Journal of Structural Biology 184 (2013) 136–146

the rod, the real apparent stiffness K1 is to be given by the valuesbounded by the two extreme cases, namely that of fully randomdistribution and that of perfect alignment.
3.3.1. Multiple perfectly aligned HAp crystalsSupposing all the crystals are perfectly aligned and the align-
ment direction is described by the transformation matrix T, therelationship between the average HAp strain and the rod inclusionstress obtained from the first-level model can be established asfollows:
heiHApaligned ¼ I�C�1matrixhCiHAp
� ��1hS2i� f2ðhS2i� IÞ½ ��1� I
� ��1
T�T
(
þT�ToC�1matrixr
rod or expressedmore simply rrod ¼KalignedheiHApaligned ð4Þ
where hCiHAp and hS2i are the average stiffness and Eshelby tensor.Since all the crystals are perfectly aligned, hCiHAp and hS2i can berepresented by the single crystal values hCiHAp = CHAp, hS2i = S2. Notethat a single HAp crystal in the second level can be regarded as asingle inhomogeneity with ribbon-like shape, thus the Eshelby ten-sor for a single HAp should be the same as the rod inclusion (S2 = S1)and the stiffness of a single HAp has been reported to be trans-versely isotropic (Ochsner and Ahmed, 2011). In Eq. (4), differentorientation angles (different T) would lead to different values ofheiHApaligned .
3.3.2. Multiple randomly distributed HAp crystalsSupposing all the crystals are randomly distributed the relation-
ship between average HAp crystal strains and rod stress is inde-pendent of the transformation matrix in Eq. (4). Thus therelationship becomes
heiHAprandom ¼ I�C�1matrixhCiHAp
� ��1hS2i� f2ðhS2i� IÞ½ ��1� I
� ��1
þ I
( )
C�1matrixr
rod or expressedmore simply rrod ¼KrandomheiHAprandom ð5Þ
Different from perfectly aligned crystals, the average value ofhS2i can no longer be the value of a single crystal, but should be ob-tained by the volume average value of all the crystals. However, asan alternative, the averaging effect can be captured by using thesingle crystal relationship as Eq. (4) and averaging over all the val-ues with different Euler angles (see Appendix, averaging the resultsobtained from each single crystal relationship as Eq. (4) over allpossible orientations).
3.3.3. The combination of random and aligned HAp inclusionsIn order to model the observed preferred orientation of HAp
inclusions (Fig. 3d), we represent it as the combination of a randomdistribution with a volume fraction faligned of perfectly aligned par-ticles. In this case the overall apparent stiffness KHAp
partial aligned is givenby the rule of mixture between Krandom and Kaligned:
KHAppartial aligned ¼ ð1� falignedÞKrandom þ falignedKaligned ð6Þ
where (1 � faligned) now represents the volume fraction of the ran-domly distributed, and faligned corresponds to the degree of align-ment of crystals revealed by SAXS. Thus, the relationship betweenrod inclusion stress and average internal HAp lattice strain becomes
rrod ¼ KHAppartial alignedheiHAp ð7Þ
3.4. Determination of the rod stiffness
In Eq. (3), the stiffness of the rod Crod still remains to be deter-mined. Since the rod is regarded as a composite consisting of glob-ular protein and mineral HAp crystals, Crod can also be determinedusing the Eshelby inclusion model, taking into account the volume
fraction (f2), average Eshelby tensor (hS2i) and average stiffness(hCHApi) of HAp crystals in the second level. To simplify the deter-mination, it is assumed that all HAp crystals in the rods are alignedwith an angle with respect to the longitudinal direction of rod(thus hCiHAp = CHAp, hS2i = S2). Such orientation is the preferred ori-entation revealed by SAXS/WAXS and is reflected in the model by aunique transformation matrix THAp. The expression of the stiffnessof rod is given here without detailed derivation
Crod ¼ C�1matrix � f2 ð~CHAp � CmatrixÞ ~S2 � f2ð~S2 � IÞ
h iþ Cmatrix
n o�1�
~CHAp � CmatrixÞC�1matrix
� o�1ð8Þ
where ~S2 ¼ TTHApS2T
�THAp is the transformed Eshelby tensor and
~CHAp ¼ T�1HApCHApT
�THAp is the transformed stiffness of aligned trans-
versely isotropic HAp crystals. Further, the overall relationship be-tween the average HAp strain and the externally applied stresscan be established by combining Eqs. (3) and (7).
rA ¼ H�1rrod ¼ H�1KHAppartial alignedheiHAp ¼ KheiHAp ð9Þ
4. Experiment result and model evaluation
4.1. Nano-scale HAp distribution and mechanical response of enamel
The loading areas of the samples were accurately determined bymicro-CT measurement, which is 3.55 mm2. Fig. 2a shows a WAXSpattern of enamel consisting of a system of Debye–Scherrer rings(peaks). Since the enamel is textured, only limited range of ringscan be captured. The apparent radial shifts of the (002) peak inthe WAXS pattern were measured under uniaxial compressiveloading applied in longitudinal direction with respect to the roddirection. The preferential orientation of HAp crystals obtainedby WAXS pattern is shown to be roughly perpendicular to the arcof (002) peak and the detailed value is determined from thestress-free plot of IWAXS(u)�u (Fig. 2c) with the Gaussian fit (redline).
The SAXS pattern as shown in Fig. 2b contains the informationof orientation and degree of alignment of the gaps between theHAp crystals. As mentioned above, the information about HApcrystallites orientation distribution can be deduced by gap scatter-ing. The preferential orientation shown in Fig. 2b is roughly alongthe short axis of the elliptical pattern and the detailed value is alsodetermined from the stress-free plot of ISAXS(u)/u (Fig. 2d) with theGaussian fit (red line). The detailed values of the orientation anddegree of alignment obtained by WAXS and SAXS patterns arelisted in Table 1, from which these parameters were used in theEshelby model evaluation.
The shifts of (002) peak from WAXS along x-direction wereused to obtain the elastic lattice strain values. Fig. 4 shows theexperimental results of the applied stress vs. HAp lattice strain ofsample along the loading direction, indicating a linear increase asexpected. Two results are given respectively using the preferredorientation angles obtained by SAXS and WAXS but keeping theother parameters the same. The ratio of the uniaxial stress andthe average HAp lattice strain gives the apparent modulus (Powersand Farah, 1975), which is listed in Table 1. Meanwhile, the resid-ual (initial) strain was found to be quite small and can therefore beneglected. The shifts of (002) peak along other directions were alsomeasured, e.g. by caking each pattern with the width of 20� alongthe directions of �15�, 0�, 15�, 30� and 45� to determine the azi-muthal variation of the normal strain component. The result isshown as an azimuthal plot in Fig. 5a and b, where 0� representsthe loading direction. Note that the normal strain componentundergoes a transition from negative and to positive at around 25�.
T. Sui et al. / Journal of Structural Biology 184 (2013) 136–146 141

4.2. Evaluation and testing of multi-scale Eshelby model
In the model, the material properties and other parameters usedwere taken from the literature, and refined by fitting with theexperimental data. The average mineral concentration (HAp vol-ume fraction) has been reported to be �95% at each level of enamel(Bechtle et al., 2012). In detail, at the first level, 95% represents thevolume fraction of rods within the globular proteins, while at thesecond level, 95% represents the volume fraction of mineral withineach rod. This means that the overall volume fraction of mineral inthe enamel is 95% � 95% �90%. In general, Young’s modulus of1 GPa for globular protein is found in the literature, without takinginto account the viscoelasticity or viscoplasticity (Huo, 2005; Qinand Swain, 2004). Polycrystalline HAp is considered to be trans-versely isotropic with five independent elastic constants (Ochsnerand Ahmed, 2011). To represent the shape of the rod and of theHAp crystallites for each level, the Eshelby tensor for the cylinder(prolate spheroid) was used. The elliptical semi-axes a1 and a2
within the transverse cross-section were assumed to be the same,(a1/a2 = 1), but different from a3. The apparent modulus K was cal-culated based on the different preferred orientation angles of theHAp crystals obtained by both SAXS and WAXS. All the parametersrefined to obtain the best fit are listed in Table 1, as well as the ref-erence values from literature. A comparison of the stress/straincurve along the loading direction between the model predictionand the experiment is plotted in Fig. 4, where the Voigt and Reussbounds are also indicated. As expected, it is found that the modi-fied Eshelby model prediction lies between the two bounds andgives a satisfactory agreement with the experimental data. Mean-while, the comparison of normal strain variation with the azi-muthal angle is presented in Fig. 5a and b. Fig. 5a gives themodel prediction results using different preferred orientation an-gles of HAp crystals obtained by both SAXS and WAXS. It is appar-ent that the model prediction of the transverse tensile strain thatarises under compression (the Poisson effect) falls short of the ob-served strain. A satisfactory agreement can be achieved by adding atensile transverse strain component (along the global Y-axis inFig. 1) perpendicular to the rod and loading direction (the globalX-axis in Fig. 1). The updated result is illustrated in Fig. 5b. Thisremarkable effect deserves further detailed analysis anddiscussion.
5. Discussion
The Eshelby model can be constructed to simulate the hierar-chical structure. It has the strong physical significance in that itcaptures the interaction between two different phases (inhomoge-neity and matrix), compared with other simple models, like Voigtand Reuss. For the interface, the Eshelby model assumes fullycoherent interface, in line with the prevailing view in the litera-ture. The main shortcoming of the shear-lag model (Ji and Gao,2004) is that it does not consider the influence of the nanoparticledistribution within the enamel. This is the key aspect that Eshelbymodel allows deeper understanding of the relationship betweenthe nano-scale structure and mechanical behaviour, even thoughthe uniform Eshelby tensor is used to describe the monodispersedistribution of crystal size for the simplifications when developinga theoretical model. Furthermore, the key aspect of interest in thisstudy lies in the apparent modulus of enamel, i.e. the relationshipbetween the strain in the nano-crystallites and the macroscopicmaterial loading. The composite effect cannot be ignored. The wo-ven structure (Palmer et al., 2008) of blocking effect is expected tobe effective only during tensile loading rather than the uniaxial
Table 1Experimental results from SAXS/WAXS, and the refined structural parameters of the enamel used in the multi-scale Eshelby model (values reported in literature are alsopresented).
Parameter Enamel Reference values
Orientation (from SAXS) 174� N/AOrientation (from WAXS) 14� N/ADegree of alignment 0.6 N/AK_exp. 124.3 GPa N/Af1 = f2 95% 95% (Bechtle et al., 2012)Cmatix_1 Em = 1 GPa, vm = 0.3 Eprotein = 1 GPa, vprotein = 0.3
(Qin and Swain, 2004)Cmatix_2 Em = 1 GPa, vm = 0.3 Eprotein = 1 GPa, vprotein = 0.3
(Qin and Swain, 2004)CHAp Exx = 148.42 GPa, Gxy= Exx = 140 GPa, Gxy =
Gxz=39.6 GPa Gxz=39.6 GPavxy = vxz = 0.34, vyz = 0.21 vxy = vxz = 0.3, vyz = 0.2Eyy = Ezz = 114.26 GPa Eyy = Ezz = 114.26 GPa (Ochsner and Ahmed, 2011)
Scylinder1 ¼ Scylinder2 a1/a2 = 1 (He, 2008)K_model (from SAXS) 122.9 GPa N/AK_model (from WAXS) 120.4 GPa N/A
Fig.4. Comparison of experimental data and modelling results of the appliedcompressive stress vs. elastic lattice strain for HAp crystals. Experimental data(black points) and modelling results (orientation distributions determined by SAXSis in red line andWAXS in blue dash) with the compressive stress along longitudinaldirection with respect to the rod direction. The prediction results from models ofVoigt (upper line) and Reuss (lower line) are also shown. The stress at failure was53.5 MPa. (For interpretation of the references to colour in this figure legend, thereader is referred to the web version of this article.)
142 T. Sui et al. / Journal of Structural Biology 184 (2013) 136–146

compressive loading. It is considered particularly when investigat-ing the fracture mechanism of enamel rather than the elasticdeformation.
5.1. Refined parameters by Eshelby model
The refined parameters of the multi-scale Eshelby model arelisted in Table 1. Most of the values reported in the literature werefound to give satisfactory results. The key parameters varied in theanalysis were the volume fraction (the volume fraction of rods inthe enamel and of HAp crystallites within rods were assumed tobe the same) and the elastic constants of the HAp crystal. Amongthese parameters, the elastic constants have the most significantinfluence on the result. In the optimization process, the volumefraction was first fixed at the reported value (95%), and the elasticconstants, especially the Young’s modulus, were refined. Subse-quently, other parameters (e.g. the globular protein modulus) wererefined as well, although it was found that they have a minor effecton the apparent result. This leads to the conclusion that the elasticmodulus of soft globular protein phase, whether it be taken as iso-tropic or anisotropic, does not exert a large effect on the validationwithin the scope of model-experiment matching considered here.In addition, the refinement process also helps in the identificationof nano-scale parameters, which may be hard to determine directlyfrom the experiments. In addition, the model can be applied to dis-eased tissues as well, in which case, the model needs to be adjustedcorrespondingly, given different initial parameters to be refined.
5.2. Residual strain
During the preparation process using a low speed diamond sawand polishing papers, as even during the natural growth, a thinlayer of residual strain may be induced at the sample surface. How-ever, as shown in Fig. 4, the pre-existing residual strain is verysmall. Since only the linear elastic response of enamel is consid-ered in the experiment (reflected in the linearity of the experimen-tal stress–strain curve), the presence of initial residual strain onlyamounts to an offset that does not affect the parameters like theapparent modulus. Hence, the low level residual strain was ne-glected in the present analysis.
5.3. Gap scattering of SAXS
The good agreement between the apparent modulus K resultscalculated using different HAp preferential orientations deter-mined by SAXS and WAXS provides strong evidence and validatesthe argument that the SAXS pattern arising from gap scattering(Tanaka et al., 2010) can be used to deduce the HAp crystallite ori-entation distribution, i.e. the gaps are almost parallel to HAp crys-tals inside the rod. Therefore, we report direct confirmation thatSAXS data provides beneficial complimentary information fordetermining the crystal orientation distribution in enamel andother mineralized tissues.
5.4. Normal strain components variation
The normal strain components variation of the HAp crystalswith respect to different azimuthal angles (0–90�) is shown in
Fig.5. Comparison of experimental data (black markers) and modelling results for the variation of normal strain (NS) with orientation (azimuthal angle). (a) Zero pre-strainmodel predictions using the orientation distributions determined respectively by SAXS (red curve) and WAXS (blue dash) and (b) modified predictions by the modelincorporating tensile pre-strain using the orientation distributions determined respectively by SAXS (red curve) andWAXS (blue dash). (For interpretation of the references tocolour in this figure legend, the reader is referred to the web version of this article.)
Fig.6. Comparison between the predictions for normal strain variation with theazimuthal angle obtained using the combination of random and perfectly aligneddistributions (blue dashed curve) and using continuous orientation distributionmodelling (solid black curve). (For interpretation of the references to colour in thisfigure legend, the reader is referred to the web version of this article.)
T. Sui et al. / Journal of Structural Biology 184 (2013) 136–146 143

Fig. 5a. The excellent agreement in the azimuthal plot (shown inFig. 5b between the experimental data and the modified modelincorporating transverse strain) indicates that the deformationstate in the sample is likely to be multi-axial, with an additionaltensile strain component existing along the transverse direction.An explanation for this observation must lie in the fact that a dis-proportionately large transverse tensile strain is developed withinthe sample due to the interaction between the material structureand the loading arrangement. One possible mechanism to explainthis is the barrelling effect (mid-section expansion) in the enamelsample: the external uniaxial compression causes local locking ofthe enamel to the platen surface accompanied by the expansionof the sample perpendicular to the loading direction in the mid-section (where the measurements were performed). In addition,micro-cracks smaller than 2 lm (below the resolution of the mi-cro-CT scan) pre-existing in the enamel may result in the debond-ing between rods (Bajaj and Arola, 2009), and thus modify thetransverse strain. Such mechanisms are not captured by the mul-ti-scale Eshelby model and need to be introduced externally. Thevalidation of the precise mechanism needs direct observation usingadvanced ultra-high resolution (sub-micron) imaging and analysistechniques, e.g. digital volume correlation.
5.5. HAp crystals orientation distribution effects
The combination of random and perfectly aligned HAp inclu-sions (that can be referred to as ‘‘partially aligned’’) was describedin the previous section (Fig. 5). We note that this is an approxima-tion, since in practice the orientation distribution of HAp crystals isa continuous function of the angle between the c-axis of HAp crys-tals and a chosen direction (the global X-axis) in the laboratorycoordinate system. The WAXS intensity variation with the azi-muthal angle plotted in Fig. 2c allows us to extract the volumefraction of HAp crystals with different orientations. Based on this,continuous orientation distribution model can be carried out basedon the probability density function of finding crystals of given ori-entation. The result obtained using this approach is shown in Fig. 6.The comparison between this result and that obtained earlier usingthe combination of random and perfectly aligned crystallites indi-cates that the difference between the two approaches is negligiblein terms of the prediction of the apparent modulus. Thus, the angleof the preferred orientation has a dominant effect on the mechan-ical response.
5.6. The effects of preferred orientation of HAp crystals
The effect of the nano-scale structure (the HAp crystallite distri-bution) on the macroscopic mechanical response was furtherinvestigated by changing the preferential crystal orientations(changing the transformation matrix in Eq. (5)). A 3D model of per-fectly aligned crystals inside a rod is established (Fig. 7a) with theangle u describing the rotation of the alignment direction aroundthe global Z-axis. The local coordinate system with respect to theapatite has been designated x,y,z in Fig. 7a. When all HAp crystalsare aligned along the global X-axis, u equals to 0�. By changing therelative alignment direction, the variation of Kaligned with respect tothe loading direction can be calculated (Fig. 7b). From Fig. 7b, thecorresponding results using the real orientation angles found inthe experiment (174� from SAXS and 14� from WAXS) are foundto be Kaligned SAXS ¼ 138:1 GPa and Kaligned WAXS ¼ 131:8 GPa,i.e. closely similar values. Meanwhile, due to the high degree ofalignment of HAp crystals in the enamel, the value of the overallapparent modulus KHAp
partialaligned lies closer to Kaligned rather thanKrandom. The enamel displays strong microscopic elastic anisotropy.It is interesting to note that the orientation with the largest stiff-ness is found, as expected, around 0� with respect to the loadingdirection. However, the most compliant orientation observed isnot at 90� (perpendicular to the loading direction), but ratheraround 50� or 130�. This is due to the transversely isotropic stiff-ness of HAp crystals.
6. Conclusions
In this study, the longitudinal apparent modulus of human en-amel was measured during in situ elastic compression by the com-bination of synchrotron WAXS and SAXS. This is the first combinedSAXS/WAXS study on the nano-scale structure and its influence onthe macroscopic mechanical behaviour of human enamel. Thecoherent results obtained for both WAXS and SAXS indicates thatthe SAXS pattern arising from the inter-mineral gaps can be usedto reflect the HAp crystal orientation. This provided access to theinformation on both the structural and mechanical aspects of thesample and allowed us to make further progress compared withthe previous studies which only used WAXS (Almer and Stock,2005; Fujisaki et al., 2012). As an improvement of the earlier pro-posed composite model (Bar-On and Wagner, 2012; Jones, 1999), amulti-scale Eshelby inclusion model was established to estimatethe elastic properties of enamel, considering it as a two-level
Fig.7. (a) A simplified visualization of the alignment of HAp crystals. The beam direction is along the global Z-axis and the alignment here represents the angle between thelocal x-axis and global X-axis (initially the aligned angle u = 0�, i.e. the local x-axis of a ribbon-like shape is initially along the global X-axis) and (b) by changing the alignmentangle (0–180�), the average strain of the crystals along the loading direction can be obtained by the multi-scale Eshelby model, which then indicates that Kaligned varies withrespect to the preferential alignment angle.
144 T. Sui et al. / Journal of Structural Biology 184 (2013) 136–146

composite. Good agreement between the measured and calculatedlattice strains along the loading direction validates the model. Withrespect to the normal strain component in a general azimuthaldirection, the underestimation of the tensile strain by the modelrequired the introduction of additional transverse internal strain.The modified model result demonstrates that the deformationstate in the enamel sample may not have been fully uniaxial andmay have been caused by the barrelling effect or crystal de-bonding.
This systematic experimental and modelling approach reportedhere is able to capture the complete picture of the multi-scalestructure, material elastic properties and its evolution under load-ing. The parameter refinement and validation approach adopted inthe present study offers an important alternative route to the iden-tification of nano-scale parameters. Other established experimen-tal characterisation techniques, such as nanoindentation andmicroscopy, are confined to the sample surface, making overallbulk parameter identification difficult. Combining the present re-sults on enamel with previously published data on human dentine,an improved and comprehensive understanding of the multi-scalestructural–mechanical properties within human dental tissues canbe given. Besides the implications for the characterisation of thestructure–property relationship of other hierarchical biomaterials,this knowledge is essential for developing better prosthetic mate-rials and dental fillings, and could also shed light on the mechani-cal property evolution associated with the multi-scale structuralchanges within human teeth due to disease and treatment.
Acknowledgements
Acknowledgments
AMK acknowledges the support of EPSRC through grants EP/I020691 ‘‘Multi-disciplinary Centre for In situ Processing Studies(CIPS)’’, EP/G004676 ‘‘Micromechanical Modelling and Experimen-tation’’, and EP/H003215 ‘‘New Dimensions of Engineering Scienceat Large Facilities’’. Diamond Light Source is acknowledged for pro-viding the beam time.
Appendix A.
A short overview of the Eshelby inclusion theory is given in (Suiet al., 2013), which leads to the detailed model derivation for anon-dilute system of human dentine composite, with a populationof HAp crystals organised and bundled in a finite globular proteinphase. The modified Eshelby model for the similar two-level com-posite of human enamel is given here.
1. Enamel first-level model
The equivalent inclusion method for multiple inhomogeneitieswith the averaged stiffness hCiI in a non-dilute system during elas-tic deformation is
CM heii þ heiM þ heiA � heit� �
¼ hCiI heii þ heiM þ heiA� �
ðA1Þ
where CM is the isotropic stiffness of the globular protein, heii theaveraged total strain in the multiple inhomogeneities, heiM themean image strain in the whole material due to the non-dilute sys-tem, heiA the external strain caused by the applied stress and heit isthe average transformation strain for the equivalent inclusions to bedetermined. In a non-dilute system, the mean image stress hriM andthe mean stress in the equivalent inclusions hriI due to thetransformation strain can be expressed by (Clyne and Withers,1995; Withers et al., 1989)
hriM ¼ CMheiM ¼ �fCMðhSi � IÞheit ðA2Þ
hriI ¼ ð1� f ÞCMðhSi � IÞheit ðA3Þ
where hSi is the average Eshelby tensor and f is the volume fractionof inclusions. Thus heit can be obtained as a function of the appliedstress
heit ¼ � ðCM � hCiIÞ½hSi � f ðhSi � IÞ� � CM� ��1ðCM
� hCiIÞC�1M rA ðA4Þ
Therefore, in the first-level model of enamel, if CM and hCiI arerespectively the stiffness of globular protein and rod, f the volumefraction of rods (f = f1) and hSi is the average cylinder-like Eshelbytensor for rods (hSi = hS1i), with Eqs. (A3) and (A4), the total stressin rods can be obtained as the sum of hriI and rA.
2. Enamel second-level model
The second-level model considers the rods of the first-levelmodel to be a composite consisting of partially aligned HAp crys-tals and globular protein. In Eq. (A1), if we consider heiA as the aver-age strain in the globular protein in the second level, f the volumefraction of HAp crystals in rods (f = f2), and hSi and hCiI are the aver-age Eshelby tensor and average stiffness of HAp crystals in rods(hSi = hS2i, hCiI = hCHApi), the similar method as that in AppendixSection 1 can be used to determine the average strain and stressin HAp crystals. Here we focus on the average strain. The relation-ship between the strain in a single HAp crystallite and the rodstress can be established initially based on Eqs. (A1)–(A4)
eHApsingle ¼ TT I�C�1M CHAp
� ��1S2� f2ðS2� IÞ½ ��1� I
� ��1
T�T þT�T
( )C�1M rrod
¼Krrod
ðA5Þ
where T is the orientation matrix described by three Euler angles(h, u, w). The partial alignment is understood to be a combinationof perfect alignment and random distribution. The expression forthe average strain in multiple perfectly aligned HAp crystals is sim-ilar to Eq. (A5), as shown in Eq. (4), while that for the average strainin multiple randomly distributed HAp crystals needs to be obtainedby the volume average method, which is introduced here. Thepurpose of using volume average method is to avoid the complexcalculation of average Eshelby tensor and average stiffness ofrandomly distributed HAp crystals.
In a random distribution, each crystal follows the relationship ofEq. (A5) by an individual transformation matrix T. Crystals canhave any possible orientation in the space, thus the volume aver-age method is to calculate the mean strain value over all the crys-tals in the rod by averaging over all possible orientations based onEq. (A5).
eHAprandom
D E¼ 1
V
ZVeHApsingledV ¼
R 2p0
R p0
R 2p0 Ksinhd/dhdwR 2p
0
R p0
R 2p0 sinhd/dhdw
rrod
¼ rrod
2p2
Z 2p
0
Z p
0
Z 2p
0Ksinhd/dhdw ¼ hKirrod
ðA6Þ
References
Al-Jawad, M., Steuwer, A., Kilcoyne, S.H., Shore, R.C., Cywinski, R., Wood, D.J., 2007.2D mapping of texture and lattice parameters of dental enamel. Biomaterials28, 2908–2914.
Almer, J.D., Stock, S.R., 2005. Internal strains and stresses measured in cortical bonevia high-energy X-ray diffraction. J. Struct. Biol. 152, 14–27.
Almer, J.D., Stock, S.R., 2010. High energy X-ray scattering quantification of in situ-loading-related strain gradients spanning the dentinoenamel junction (DEJ) inbovine tooth specimens. J. Biomech. 43, 2294–2300.
T. Sui et al. / Journal of Structural Biology 184 (2013) 136–146 145

Ang, S.F., Saadatmand, M., Swain, M.V., Klocke, A., Schneider, G.A., 2012. Comparisonof mechanical behaviors of enamel rod and interrod regions in enamel. J. Mater.Res. 27, 448–456.
Bajaj, D., Arola, D., 2009. Role of prism decussation on fatigue crack growth andfracture of human enamel. Acta Biomater. 5, 3045–3056.
Bar-On, B., Wagner, H.D., 2012. Elastic modulus of hard tissues. J. Biomech. 45, 672–678.
Bechtle, S., Ozcoban, H., Lilleodden, E.T., Huber, N., Schreyer, A., Swain, M.V.,Schneider, G.A., 2012. Hierarchical flexural strength of enamel: transition frombrittle to damage-tolerant behaviour. J. R. Soc. Interface 9, 1265–1274.
Calibration, D.L.S., 2013. Diamond Light Source Calibration.Chou, T.W., Sun, C.T., 2012. Nanocomposites, In M. Hyer, W, (ed.). DEStech Inc.Clyne, T.W., Withers, P.J., 1995. An introduction to metal matrix composites. First
paperback edition. Cambridge University Press, Cambridge.Deymier-Black, A.C., Almer, J.D., Stock, S.R., Haeffner, D.R., Dunand, D.C., 2010.
Synchrotron X-ray diffraction study of load partitioning during elasticdeformation of bovine dentin. Acta Biomater 6, 2172–2180.
Eliceiri, K.W., Berthold, M.R., Goldberg, I.G., Ibanez, L., Manjunath, B.S., Martone,M.E., Murphy, R.F., Peng, H., Plant, A.L., Roysam, B., Stuurmann, N., Swedlow, J.R.,Tomancak, P., Carpenter, A.E., 2012. Biological imaging software tools. Nat.Methods 9, 697–710.
Fratzl, P., Schreiber, S., Klaushofer, K., 1996. Bone mineralization as studied bysmall-angle X-ray scattering. Connect Tissue Res. 35, 9–16.
Fujisaki, K., Todoh, M., Niida, A., Shibuya, R., Kitami, S., Tadano, S., 2012. Orientationand deformation of mineral crystals in tooth surfaces. J. Mech. Behav. Biomed.10, 176–182.
Habelitz, S., Marshall, S.J., Marshall, G.W., Balooch, M., 2001. Mechanical propertiesof human dental enamel on the nanometre scale. Arch. Oral Biol. 46, 173–183.
Hammersley, A.P. 1997. FIT2D: An Introduction and Overview ESRF Internal Report.He, L.H., 2008. Mechanical behavior of human enamel and the relationship to its
structural and compositional characteristics. PhD thesis.Huang, Z., Newcomb, C.J., Bringas, P., Stupp, S.I., Snead, M.L., 2010. Biological
synthesis of tooth enamel instructed by an artificial matrix. Biomaterials 31,9202–9211.
Huo, B., 2005. An inhomogeneous and anisotropic constitutive model of humandentin. J. Biomech. 38, 587–594.
Ji, B.H., Gao, H.J., 2004. Mechanical properties of nanostructure of biologicalmaterials. J. Mech. Phys. Solids 52, 1963–1990.
Jones, R.M., 1999. Mechanics of Composite Materials, second ed. Taylor & Francis,Philadelphia, Pa.; London.
Kerebel, B., Daculsi, G., Kerebel, L.M., 1979. Ultrastructural studies of enamelcrystallites. J Dental Res. 58, 844–851.
Korsunsky, A.M., Baimpas, N., Song, X., Belnoue, J., Hofmann, F., Abbey, B., Xie, M.Y.,Andrieux, J., Buslaps, T., Neo, T.K., 2011. Strain tomography of polycrystallinezirconia dental prostheses by synchrotron X-ray diffraction. Acta Mater. 59,2501–2513.
Macho, G.A., Jiang, Y., Spears, I.R., 2003. Enamel microstructure – a truly three-dimensional structure. J. Hum. Evol. 45, 81–90.
Mura, T., 1987. Micromechanics of Defects in Solids. In: second rev. ed. M. Nijhoff;Distributors the U.S. and Canada, Kluwer Boston.
Nakamura, T., Lu, C., Korach, C.S., 2011. Mechanical Properties of Tooth Enamel:Microstructural Modeling and Characterization. In: Conference Proceedings ofthe Society for Experimental Mechanics Series 9999, 171–179.
Nanci, A., Ten Cate, A.R., 2003. Ten Cate’s Oral Histology: Development, Structure,and Function, sixth ed. Mosby, St. Louis, Mo, London.
Nogueira, B.C.L., Fernandes, P.M., Santana, L.N.S., Lima, R.R., 2011. UltrastructuralCharacterization of Bovine and Buffalo Enamel Through Scanning ElectronMicroscopy. XXIII Congr. Brazilian Soc. Microsc. Microanal..
Ochsner, A., Ahmed, W., 2011. Biomechanics of hard tissues. John Wiley & Sons.Palmer, L.C., Newcomb, C.J., Kaltz, S.R., Spoerke, E.D., Stupp, S.I., 2008. Biomimetic
systems for hydroxyapatite mineralization inspired by bone and enamel. Chem.Rev. 108, 4754–4783.
Powers, J.M., Farah, J.W., 1975. Apparent modulus of elasticity of dental amalgams.J. Dental Res. 54, 902.
Qin, Q.-H., Swain, M.V., 2004. A micro-mechanics model of dentin mechanicalproperties. Biomaterials 25, 5081–5090.
Singhal, A., Almer, J.D., Dunand, D.C., 2012. Variability in the nanoscale deformationof hydroxyapatite during compressive loading in bovine bone. Acta Biomater. 8,2747–2758.
Sui, T., Sandholzer, M.A., Baimpas, N., Dolbnya, I.P., Walmsley, A.D., Lumley, P.J.,Landini, G., Korsunsky, A.M., 2013. Multi-scale modelling and diffraction-basedcharacterization of elastic behaviour of human dentine. Acta Biomater. 9, 7937–7947.
Takao, Y., Taya, M., 1987. The effect of variable fiber aspect ratio on the stiffness andthermal-expansion coefficients of a short fiber composite. J. Compos. Mater. 21,140–156.
Tanaka, T., Yagi, N., Ohta, T., Matsuo, Y., Terada, H., Kamasaka, K., To-o, K., Kometani,T., Kuriki, T., 2010. Evaluation of the distribution and orientation ofremineralized enamel crystallites in subsurface lesions by X-ray diffraction.Caries Res. 44, 253–259.
Tesch, W., Eidelman, N., Roschger, P., Goldenberg, F., Klaushofer, K., Fratzl, P., 2001.Graded microstructure and mechanical properties of human crown dentin.Calcified Tissue Int. 69, 147–157.
Tesch, W., Vandenbos, T., Roschgr, P., Fratzl-Zelman, N., Klaushofer, K., Beertsen, W.,Fratzl, P., 2003. Orientation of mineral crystallites and mineral density duringskeletal development in mice deficient in tissue nonspecific alkalinephosphatase. J. Bone. Miner. Res. 18, 117–125.
Withers, P.J., Stobbs, W.M., Pedersen, O.B., 1989. The application of the Eshelbymethod of internal-stress determination to short fiber metal matrix composites.Acta Metall Mater. 37, 3061–3084.
Young, M.L., DeFouw, J., Almer, J.D., Dunand, D.C., 2007a. Load partitioning duringcompressive loading of a Mg/MgB2 composite. Acta Mater. 55, 3467–3478.
Young, M.L., Almer, J.D., Daymond, M.R., Haeffner, D.R., Dunand, D.C., 2007b. Loadpartitioning between ferrite and cementite during elasto-plastic deformation ofan ultrahigh-carbon steel. Acta Mater. 55, 1999–2011.
146 T. Sui et al. / Journal of Structural Biology 184 (2013) 136–146

Multiscale modelling and diffraction-based characterization of elasticbehaviour of human dentine
Tan Sui a,⇑, Michael A. Sandholzer b, Nikolaos Baimpas a, Igor P. Dolbnya c, Anthony Damien Walmsley b,Philip J. Lumley b, Gabriel Landini b, Alexander M. Korsunsky a
aDepartment of Engineering Science, University of Oxford, Parks Road, Oxford OX1 3PJ, UKb School of Dentistry, College of Medical and Dental Sciences, University of Birmingham, St. Chad’s Queensway, Birmingham B4 6NN, UKcBeamline B16, Diamond Light Source, Harwell Oxford Campus, Didcot OX11 0DE, UK
a r t i c l e i n f o
Article history:Received 23 November 2012Received in revised form 10 April 2013Accepted 11 April 2013Available online 18 April 2013
Keywords:DentineWAXS/SAXSEshelby modelMechanical properties
a b s t r a c t
Human dentine is a hierarchical mineralized tissue with a two-level composite structure, with tubulesbeing the prominent structural feature at a microlevel, and collagen fibres decorated with hydroxyapatite(HAp) crystallite platelets dominating the nanoscale. Few studies have focused on this two-level struc-ture of human dentine, where the response to mechanical loading is thought to be affected not onlyby the tubule volume fraction at the microscale, but also by the shape and orientation distribution ofmineral crystallites, and their nanoscale spatial arrangement and alignment. In this paper, in situ elasticstrain evolution within HAp in dentine subjected to uniaxial compressive loading along both longitudinaland transverse directions was characterized simultaneously by two synchrotron X-ray scattering tech-niques: small- and wide-angle X-ray scattering (SAXS and WAXS, respectively). WAXS allows the evalu-ation of the apparent modulus linking the external load to the internal HAp crystallite strain, while thenanoscale HAp distribution and arrangement can be quantified by SAXS. We proposed an improved mul-tiscale Eshelby inclusion model that takes into account the two-level hierarchical structure, and validatedit with a multidirectional experimental strain evaluation. The agreement between the simulation andmeasurement indicates that the multiscale hierarchical model developed here accurately reflects thestructural arrangement and mechanical response of human dentine. This study benefits the comprehen-sive understanding of the mechanical behaviour of hierarchical biomaterials. The knowledge of themechanical properties related to the hierarchical structure is essential for the understanding and predict-ing the effects of structural alterations that may occur due to disease or treatment on the performance ofdental tissues and their artificial replacements.
� 2013 Acta Materialia Inc. Published by Elsevier Ltd. All rights reserved.
1. Introduction
Dentine is a hydrated biological mineral composite tissue with ahierarchical structure and versatile mechanical properties [1]. Atthe microscopic level, dentine has a well-oriented structure withan arrangement of dentinal tubules that extend throughout the en-tire dentine thickness, from the amelo-dentinal junction (ADJ) tothe pulp [1–3]. At the nanoscale, dentine is a composite of plate-like hydroxyapatite crystals (HAp) that have the shape of elongatedpancakes (�2–4 nm thick, �30 nm wide and up to 100 nm long)randomly embedded in a collagen matrix [4,5]. Characterizingthe mechanical properties of the tissue according to its complexhierarchical structure benefits the understanding of the internalarchitecture and hierarchical properties of materials.
Previously, most research in this area has concentrated on themechanical properties of dentine at the macro- and microscale,i.e. Young’s modulus, Poisson’s ratio, hardness and fracture proper-ties, using a variety of measurement methods [6]. However, fewstudies have focused on the nanoscale, where mechanical altera-tions can be considered to be a function of crystal shape and orien-tation of the mineral phase [7,8]. During elastic loading, stressesare expected to be transferred to the stiff HAp platelets from thesurrounding collagen matrix [7]. To investigate this, it is requiredto use techniques that allow in situ quantification of the mechan-ical response of nanoscale HAp phases to loading.
Synchrotron-based X-ray diffraction, and small- and wide-angleX-ray scattering (SAXS andWAXS, respectively), are advanced non-destructive techniques that enable characterization of the nano-scale and subnanoscale structure ofmaterials, and have beenwidelyused to study load transfer between two phases in matrix compos-ites [9–11]. In situ compression testing, in combination with theWAXS technique, has been used to quantify the internal strains of
1742-7061/$ - see front matter � 2013 Acta Materialia Inc. Published by Elsevier Ltd. All rights reserved.http://dx.doi.org/10.1016/j.actbio.2013.04.020
⇑ Corresponding author. Tel.: +44 18652 83447; fax: +44 18652 73010.E-mail address: [email protected] (T. Sui).
Acta Biomaterialia 9 (2013) 7937–7947
Contents lists available at SciVerse ScienceDirect
Acta Biomaterialia
journal homepage: www.elsevier .com/locate /actabiomat

the phase [9–11]. In addition, formineralized tissues, SAXS is able toreveal quantitative nanoscale information about the structure, ori-entation and degree of alignment of crystals [12]. Those parametershave been identified as critical for the mechanical properties andstability of the materials [13–15]. It is only recently that this tech-niquehas been applied to the study ofmechanical behaviour inmin-eralized biological composites such as bone [16–19] and teeth[7,8,20]. Deymier-Black et al. [7] determined the longitudinalapparent modulus of HAp in bovine dentine using synchrotron-basedWAXS,while strain distribution across the ADJ in bovine teethwas investigated by Almer and Stock [20]. A deep understanding ofthe relationship between the nanoscale structure and macroscopicmechanical behaviour is lacking. Earlier studies do not take into ac-count the nanoparticle distribution [7,20], which can be derivedfrom SAXS data. In addition, all these studies were carried on non-human samples, in which different particularities of the tubulestructure and morphology are expected to result in differences inthe mechanical properties [21].
In parallel, various analytical models of composites have beenproposed to describe the interaction of different mineral phasesand model the elastic properties of hard tissues (e.g. [22–24]).Besides these, one widely accepted model is the Eshelby inclusionmodel [25,26]. Recently, the Eshelby model has also been appliedin dental research based on nanoindentation and finite-elementmodel data [27–30] to explain and predict the elastic response of
dentine on the microscopic level. However, the models used in pre-vious simulationswere limited, inwhichno considerationwasgivento the nanoscale structure, and this led to discrepancies of overesti-mation between the predictions and experimental results [7].
In order to improve the understanding of the influence of thenanoscale structure variation of the two-level composite of humandentine on its mechanical response, in this study, the in situ syn-chrotron X-ray techniques (simultaneous SAXS/WAXS) were usedto measure the elastic strain (WAXS), alterations in crystal orienta-tion and degree of alignment of HAp phases (SAXS) in human den-tine under externally uniaxial compressive loading along twodirections, longitudinal as well as transverse with respect to thepreferential tubule direction. Meanwhile, an extended multiscaleEshelby model for a two-level composite was established. Thecapability of the model in capturing the relationship between thenanoscale structure and macroscopic loading was evaluated.
2. Materials and methods
2.1. Sample preparation
Two freshly extracted sound human third molars (ethical ap-proval obtained from the National Research Ethics Committee;NHS-REC reference 09.H0405.33/Consortium R&D No. 1465) were
Fig. 1. Schematic diagram of experimental setup and sample preparation. (a) Sample under uniaxial compressive loading on the compression stage. The monochromatic X-ray beam was directed perpendicular to the sample surface and the loading direction. WAXS and SAXS diffraction patterns were recorded at each loading step at threelocations on the sample. The WAXS detector was translated laterally out of the beam to expose the SAXS detector after each collection of WAXS. (b) Micro-CT-based models ofthe three preparation stages. (1) 2 mm thick dentine disk (coloured red) cut below the enamel–cement line and (2) further cut and polished to produce (3) the final2 mm � 2 mm � 2 mm cubes of dentine. The red square indicates the central position of the X-ray beam.
7938 T. Sui et al. / Acta Biomaterialia 9 (2013) 7937–7947

washed and cleaned in distilled water to eliminate residues andkept in a �20 �C freezer for a maximum of 14 days before theexperiment. The samples were rehydrated using distilled waterand 2 mm thick dentine disks were cut just below the enamel–cement line using a low-speed diamond saw (Isomet BuehlerLtd., Lake Bluff, IL, USA). The disks were further cut into smallerbars and a series of polishing papers was used to produce the final2 mm � 2 mm � 2 mm cubes of dentine (Fig. 1b). The sampleswere kept for a maximum of 7 days in distilled water in a commer-cial fridge at 4 �C until the experiment was performed.
2.2. In situ scattering measurements
2.2.1. Mechanical loading setupUniaxial compressive loading was carried out on two dentine
samples in the form of small 2 mm � 2 mm � 2 mm cubes. The
samples were designated HD2, for which the loading was appliedin the transverse direction, and HD3, for which the loading was ap-plied in the longitudinal direction with respect to the tubules,respectively. Loading was carried out using a remotely operatedand monitored compression rig (Deben, Suffolk, UK), with a 5 kNcalibrated load cell. The rig was equipped with custom-made jaws,allowing a high-energy transmission X-ray setup to be used, asillustrated in Fig. 1a. The samples were deformed at a displacementrate of 0.2 mmmin�1 up to 400 N (corresponding to �100 MPa forthe samples) along the x-direction. After each constant loadingincrements (HD2 50 N, HD3 100 N), the load was maintained andthe WAXS and SAXS patterns were collected.
2.2.2. Beamline diffraction setupThe experiment was carried out on B16 experimental beamline
at Diamond Light Source, Oxford Harwell Campus, Didcot, UK. A
Fig. 2. (a) A representative dentine WAXS pattern of Debye–Scherrer rings with different intensities. The dark region in the centre is the beam stop. The (002) peak is markedwith a red arrow. Peak shifts at different positions on the (002) ring represent the average strains of (002) along different directions. Multiple angles with respect to the x-axis were caked in order to examine the strain variation (seven angles are shown as an example: 0�, 15�, 30�, 45�, 60�, 75�, 90�). Each cake was with a 20� range. (b) Arepresentative dentine SAXS pattern of the HD2 sample. The q scale in the SAXS pattern is in reciprocal space, which is the inverse of d dimension in the real space. Therelation is q = 2p/d. If all the HAp platelets are oriented in the u direction parallel to their long dimension in the real space, q would be the smallest in the elliptical pattern ofthe SAXS. Thus the direction of the short axis of the ellipse pattern indicates the predominant orientation of the crystals. (c) A plot of IðuÞ of the HD2 sample without anyexternal load (black points). The Gauss fit is also shown in the figure (red line). The predominant orientation u0 ¼ 161
is the average position of the two peaks. The ratio
Aoriented=ðAoriented þ AunorientedÞ gives the degree of alignment.
T. Sui et al. / Acta Biomaterialia 9 (2013) 7937–7947 7939

monochromatic X-ray beam was used to illuminate the sample asillustrated schematically in Fig. 1a. The incident beam was mono-chromated to the photon energy of 17.99 keV, and collimated tothe spot size of 0.5 mm � 0.5 mm on the sample. WAXS and SAXSpatterns were alternately collected at three locations across thesample. A silicon powder was used for the WAXS data calibrationand dry chicken collagen was used for the SAXS data calibration[31].
WAXS diffraction patterns were recorded using a Photonic Sci-ence Image Star 9000 detector (Photonic Science Ltd., UK) placed ata sample-to-camera distance of 128.72 mm (Fig. 1a). Furtherdownstream of the beam a Pilatus 300K detector (Dectris, Baden,Switzerland) was positioned at a distance of 4358.47 mm to collectthe SAXS patterns (Fig. 1a). In order to record both the WAXS andSAXS patterns at each scanning location, the WAXS detector wastranslated laterally to expose the SAXS detector after each WAXScollection.
2.3. Micro-CT protocol and data processing
For the purpose of planning the measuring positions and deter-mination of the precise loading cross-sectional area of the dentinecubes, a commercial micro-computed tomography (micro-CT) sys-tem was used to scan the samples with a SkyScan 1172 scanner(SkyScan, Kontich, Belgium) at 1.9 lm isotropic resolution using40 kV voltage, 120 lA current and a 0.5 mm Al filter. The resulting
slices were reconstructed with the SkyScan NRECON package andsubsequent 3-D planning models were created with Fiji imagingsoftware [32].
2.4. Scattering data analysis
2.4.1. WAXS data analysisThe data analysis was done in accordance with previous studies
[9–11]. The WAXS data interpretation was limited to the (002)peak of Debye–Scherrer rings of the middle scanning location(see Fig. 2a), guaranteeing that the same position could be detectedduring the compressive deformation of the dentine. Changes in thed-spacing between the lattice planes in the HAp were used todetermine the elastic strain in the mineral HAp phase [33]. Theapparent lattice elastic strain e was computed from the definition:
e ¼ d002 � d0002
d0002
; ð1Þ
where d002 is the apparent strained d-spacing and d0002 is the refer-
ence strain-free value of the d-spacing.To determine the strain from the mineral HAp phase, 2-D dif-
fraction images were pre-processed into a 1-D intensity plot usingFit2D [34] by ‘‘caking’’ (a professional jargon term used to refer tothe selection of a sector in the radial–azimuthal coordinates ofeach pattern) each pattern with a step of 20� in the range of 0�–360� of the (002) peak under laboratory coordinates (Fig. 2a, only
Fig. 3. (a) SEM observation of the first-level tubule structure of human dentine. (b) A schematic structure of the random distribution of collagen fibrils (black lines) beside thetubules, viewed along the longitudinal direction of tubules. (c) Same as (b), viewed along the transverse direction of tubules. (d) The structure of the random distribution ofHAp crystals viewed from the cross-section parallel to the tubule direction. (e) The real structure of partial alignment, where the pennies having an alignment angle 161�(showing the example of HD2) with respect to the global x-axis are shown in blue.
7940 T. Sui et al. / Acta Biomaterialia 9 (2013) 7937–7947

0�–90� is shown). The normal strain component along the centredirection of each cake represents the strain distribution at the cor-responding orientation. Subsequently, the 1-D intensity plot ofeach cake (covering 20�) was obtained by the integration, with re-spect to the azimuthal angle, of the converted 2-D images. After-wards, the 1-D profiles of each individual (002) peak was fittedwith Gaussian curves to determine the centre position after thesubtraction of the linearly fitted background. To calculate theHAp lattice strain, the WAXS pattern of the unloaded conditionwas used as a strain-free reference point.
2.4.2. SAXS data analysisFor the SAXS data analysis, a reference pattern representing the
strain-free sample was used to determine the orientation and de-gree of alignment (q) of HAp crystalline particles, which describesthe percentage of aligned particles. Fig. 2b is an example referenceSAXS pattern of HD2. In order to quantify the orientation and de-gree of alignment, the SAXS patterns were integrated along allthe possible scattering vectors q to account for the main scatteringeffect (with the range selected from the outline of beamstop to theoutline of the pattern as marked with red dashes in Fig. 2b), whichresults in a function IðuÞ with the azimuthal angle u [35–37](Fig. 2c). The predominant orientation is determined by the aver-age position of two peaks in the plot of IðuÞ (e.g. u0 in Fig. 2c),while the degree of alignment with respect to the predominant ori-entation of HAp is defined as the ratio of peak area and the overallarea under the curve of IðuÞ:
q ¼ Aoriented
Aoriented þ Aunoriented; ð2Þ
where Aunoriented is the area of the constant background level andAoriented depicts the total area subtracting the background. The valueof degree of alignment ranges from 0 to 1, where q ¼ 0 indicates nopredominant orientation within the plane of the section and q ¼ 1indicates a perfect alignment of all crystals [35,37].
3. Model formulation
3.1. Geometrical assumptions
Human dentine has a hierarchical two-level composite struc-ture, where the first level is represented by the dentinal tubulesand the second level by the HAp crystals within a fibrous collagenmatrix. Fig. 3a–c are images of the first-level dentine structure,where Fig. 3a is obtained by scanning electron microscopy (SEM)and Fig. 3b,c show the random distribution of collagen fibrilviewed respectively along longitudinal and transverse directionof tubules as proposed by Bozec [38]. Fig. 3d,e are images of thesecond-level dentine structure, where a randomly distributedstructure of HAp crystals shown in Fig. 3d is to be combined witha fully aligned structure to determine the real structure of partialalignment (Fig. 3e for HD2), given the detailed information of
degree of alignment by SAXS interpretation. Both levels are non-di-lute systems consisting of a number of inhomogeneous inclusions.The multiscale Eshelby model for a non-dilute system is estab-lished and is used here to model the two-level composite of den-tine [39] (for details see Appendix). The first-level model regardsthe whole dentine sample as composed of aligned tubules withina matrix phase, while the second-level model considers the matrixof the first level as a composite in detail, consisting of HAp crystalsand a collagen matrix.
The shape of the HAp crystalline platelets in dentine is thoughtto correspond to elongated flagstone. In classical Eshelby model-ling, a very good approximation is to use a penny-shape inclusionto simulate an individual platelet, as the integrals can be readilywritten. The Eshelby penny-shaped tensor has two parameters,where a1 is the radius while a3 is half of the thickness of thepenny-shaped inclusion [40]. The thickness of the penny-shape istaken to be equal to the thickness of the dentine crystal platelet(2–4 nm). The diameter of the penny-shape is the average of thelength (100 nm) and width (30 nm) of HAp to guarantee the iden-tical cross-sectional area. The size of crystal platelet and theparameters of penny-shape tensor are listed in Table 1. The crystalc-axis (corresponding to the (002) peak) of the HAp crystallites isthought to be parallel to the long dimension of the platelet [41,42].Therefore, in the model, the c-axis lies along the radial directionwithin the penny and is in the x–y plane shown in Fig. 3e.
3.2. First-level model: multiple aligned tubule inclusions withindentine matrix
The purpose of the first-level model for human dentine is toestablish the elastic relationship between the external stress rA
and dentine matrix stress rM1; which will serve as the externalstress in the second level. Without any transformation strain in tu-bules, the Eshelby model for a non-dilute system (Appendix Eqs.(B1), (B2), (B3), (B4), (B5)) indicates that the mechanical responseof the tubules can be related to an equivalent inclusion with thesame property as the matrix:
hCitubuleðheii þ heiM1 þ eAÞ ¼ CM1ðheii þ heiM1 þ eA � heitÞ; ð3Þ
where ‘‘M1’’ means the first-level matrix, heii the average totalstrain in tubules, hCitubule the average stiffness matrix of tubules,eA ¼ CM1rA the external strain, CM1heiM1 ¼ hriM1 the ‘‘image’’ stressdefined to satisfy the boundary conditions at the external surface ofa finite composite [25,39] and heit is the average transformationstrain in the equivalent inclusion to be determined. Consideringthat the average stiffness of tubules is null hCitubule ¼ 0, the averagestress in the dentine first-level matrix can be expressed merely interms of the volume fraction of tubules f1 (for further details seeAppendix, Eqs. ((B7), (B8), (B9), (B10)), [25,39]):
rM1 ¼ rA þ hriM1 ¼ 11� f1
rA: ð4Þ
Table 1Experimental results from SAXS/WAXS and refined parameters in the Eshelby model of the two dentine samples.
Parameters HD2_value HD3_value Reference values
Orientation (degree) 161 78Degree of alignment 0.289 0.168K_exp. (GPa) 22.129 24.156f1 10% 10% 3.6 – 10.2% [45]f2 40% 38% 30.5%, 44.4% [46]CM1 ¼ CM2 Em = 1.1 GPa, vm = 0.3 Em = 0.8 GPa, vm = 0.27 Ecollagen = 1 GPa, vcollagen = 0.30 [27]CHAp EHAp = 90 GPa, vHAp = 0.32 EHAp = 90 GPa, vHAp = 0.32 EHAp = 40–117 GPa, vHAp = 0.27 [47]a1=a3 31 31 (2–4) � 30 � 100 nm3[4,5]K_model (GPa) 22.870 24.189
T. Sui et al. / Acta Biomaterialia 9 (2013) 7937–7947 7941

3.3. Second-level model: HAp inclusion of collagen matrix
The dispersion of multiple HAp crystals within the matrix ofcollagen forms the second hierarchical level model for dentine.The purpose of the second level model is to establish a relationshipbetween the first-level dentine matrix stress and the average strainin the HAp crystals heiHAp; and thereby to determine the apparentmodulus [43] between the global external load and local HAp crys-tal strain.
3.3.1. Multiple perfectly aligned HAp crystalsIf all HAp crystals are perfectly aligned described by an orienta-
tion matrix T, the relationship between the average Hap crystalstrain and the external load (here the first-level dentine matrixstress) can be expressed as [39] (Appendix Eq. (B11)):
heiHApaligned ¼ ffðI � C�1M2hCiHApÞ�1½hSi � f2ðhSi � IÞ��1 � Ig�1T�T
þ T�TgC�1M2rM1
or, expressed more simply
rM1 ¼ KalignedheiHApaligned; ð5Þ
where hCiHAp and hSi are the average stiffness and Eshelby tensor ofHAp crystals in the gauge volume [44], CM2 is the collagen stiffness,and f2 is the volume fraction of HAp with respect to the whole sec-ond-level structure. For perfectly aligned crystals, hCiHAp and hSi canbe represented by the value of a single crystal hCiHAp ¼ CHAp; hSi ¼ S:Note that different orientations (different transformation matrices)may result in different results of heiHApaligned: The variation of Kaligned
with different alignment angles of particles with respect to theloading direction can be calculated by changing the transformationmatrix in Eq. (5).
3.3.2. Multiple randomly distributed HAp crystalsIf HAp crystals have a random distribution, this group of crys-
tals will have an isotropic stiffness, as well as an isotropic Eshelbytensor, and thus the relationship between the average local Hapcrystal strain and external load is independent on the orientationmatrix in Eq. (5):
heiHAprandom ¼ ffðI � C�1M2hCiHApÞ�1½hSi � f2ðhSi � IÞ��1 � Ig�1 þ IgC�1
M2rM1
or, expressed more simply
rM1 ¼ KrandomheiHAprandom: ð6Þ
Fig. 4. Comparison of experimental data and modelling results of applied compressive stress vs. elastic lattice strain for HAp. (a) HD2 experimental data (error bar: 1 SD); (b)HD3 experimental data (error bar: 1 SD). (c) HD2 data (black points) and modelling results (red line: multiscale Eshelby model; blue line: Voigt bound; dark grey: Reussbound) with the compressive stress along transverse direction with respect to the tubules. (d) HD3 data (black points) and modelling results (red line: multiscale Eshelbymodel; blue line: Voigt bound; dark grey: Reuss bound) with the compressive stress along longitudinal direction with respect to the tubules. The compressive stresses of HD2and HD3 were uniformly selected under 100 MPa.
7942 T. Sui et al. / Acta Biomaterialia 9 (2013) 7937–7947

In contrast to perfectly aligned crystals, hSi and hCiHAp valueswere not those of the single crystal, but were obtained from thevolume average of all the randomly distributed crystals (seeAppendix, averaging the results obtained from each single-crystalrelationship as Eq. (5) over all possible orientations).
3.3.3. Multiple HAp inclusions with partial alignmentIn general, HAp crystals are partially aligned, thus KHAp
partial aligned isexpected to be between Krandom and Kaligned:
KHAppartial aligned ¼ ð1� falignedÞKrandom þ falignedKaligned; ð7Þ
where faligned is the volume fraction of aligned crystals with respectto all HAp crystals, i.e. the degree of alignment of crystals revealedby SAXS measurements.
4. Experimental results and model validation
4.1. Nanoscale HAp distribution and mechanical response of dentine
The loading areas of the samples were accurately determined bymicro-CT measurement. The loading areas were 4.466 mm2 (HD2)and 4.413 mm2 (HD3), respectively. Fig. 2a shows a WAXS patternof dentine consisting of a system of Debye–Scherrer rings (peaks).The apparent radial shifts of the (002) peak in the WAXS patternweremeasured under uniaxial compressive loading applied on bothlongitudinal and transverse directions with respect to the preferen-tial tubule direction. Values of the shifts along the x-direction wereused to obtain the elastic lattice strain variation along loading direc-tion. Fig. 4a,b show the experimental results of the applied stress vs.HAp lattice strain of samples HD2 and HD3, indicating a linearincreasing tendency as expected. The maximum load used in themodel of the two sampleswas limited to�100 MPa in the elastic re-gion. The ratio of the uniaxial stress and the average HAp latticestrain gives the apparent modulus, which is listed in Table 1. FromFig. 4, it is observed that the dentine sample loaded along the longi-tudinal axis (HD3) has a slightly higher apparent modulus than theone loaded transversally (HD2). The residual (initial) strains werefound to be quite small, namely, 205le (HD2) and�578.6le (HD3).
The (002) peak shifts along other directions were also mea-sured by caking each pattern with a step of 20� (in the range of0�–360�, Fig. 2a) to determine the normal strain component varia-tion. The result is shown in polar coordinate as an azimuthal plot inFig. 5a,b for HD2 and HD3, respectively, where 0� or 180� repre-sents the loading direction and 90� or 360� represents that perpen-dicular to the loading direction. Being symmetrical, the results inthe typical range of 0�–90� display a positive normal strain from60�–90� and a negative normal strain from 0�–60�.
Fig. 2b is one of the SAXS patterns of the HD2 sample. The pref-erential orientation of HAp crystals is shown in the figure to beroughly along the short axis of the elliptical pattern. Fig. 2c is theplot of IðuÞ of the HD2 sample without any external load. TheGauss fit is also shown in the figure (red line). The detailed valuesof the orientation and degree of alignment were obtained by exam-ining the plot of IðuÞ and are listed in Table 1. The degree of align-ment values for both samples are relatively small, indicating that,as expected, the distribution of HAp crystals in human dentine isclose to random, but nevertheless not entirely random.
4.2. Evaluation and testing of the multiscale Eshelby model
In themodel, thematerial properties and other parameters werederived from the literature and were refined by fitting with theexperimental data. It should be noted that a precise determinationof the volume fraction of tubules in the first level is not availablewith commercial micro-CT systems, due to the polychromatic nat-ure of the X-ray source and the limited resolution. Thus, the re-ported volume fraction of tubules between 3.6 and 10.2% wasused [45]. The average mineral concentration (HAp volume frac-tion) has been reported to be between 30.5% and 44.4% in humanthird molars, with a decreasing gradient towards the pulp [46]. Ingeneral, a Young’s modulus of 1 GPa and Poisson’s ratio is 0.30 forcollagen is given in the literature, without taking into account theviscoelasticity and viscoplasticity for human dentine [27,28]. Poly-crystalline HAp has a high Young’s modulus (40–117 GPa), whereasthe Poisson’s ratio is 0.27 [47]. However, these values of the HApYoung’s modulus were all from a single perfect crystal. In biologicalmineralized composites such as dentine, imperfectly shaped
Fig. 5. Comparison of experimental data and modelling results of normal strain component variation with orientation distribution (0�–360�) under polar coordinates. (a) HD2data (black points) and model fitting (red curve), with the compressive stress along transverse direction with respect to the tubules. (b) HD3 data (black points) and modelfitting (red curve), with the compressive stress along the longitudinal direction with respect to the tubules.
T. Sui et al. / Acta Biomaterialia 9 (2013) 7937–7947 7943

crystals are likely to exist, thus the high Young’s modulus may in-duce an error by overestimation [7]. In accordance with Qin andSwain, 40 GPawas chosen here as a combination of the intertubularmodulus (35.8 GPa) and peritubular modulus (66.76 GPa) in therespective volume fractions [27]. For the penny-shaped Eshelbytensor, only the ratio of radius and thickness (a1/a3) of the pennyis needed [4,5]. All the parameters refined to obtain a best fittingare listed in Table 1, also with the reported values from theliterature.
4.2.1. First-level modelThe dentine matrix stress for the first level is only dependent on
the volume fraction of tubules (see Eq. (4)). The same volume frac-tion of tubules was used for both samples, thus they have the samevalue of matrix stress, rM1 ¼ 1:09rA .
4.2.2. Second-level modelBased on the SAXS measurement of degree of alignment (Ta-
ble 1), the apparent moduli for each sample can be obtained fromEq. (7) with the values listed in Table 1. A comparison of the stress–strain curve along the loading direction between the experimentand model evaluation is shown in Fig. 4c,d, where the Voigt andReuss bound predictions are also given. It is found that the Eshelbymodel prediction lies between the two bound results and is closerto the experimental data, which also reflects the overestimation ofthe apparent modulus in previous investigation using the Voigtbound [7]. Meanwhile, the comparison of normal strain variationin the azimuthal plot is presented in Fig. 5a,b. Good agreementwas also observed.
5. Discussion
This is the first time that the combined SAXS/WAXS techniquehas been used to capture the nanoscale structure and its influenceon the macroscopic mechanical behaviour of human dentine.Moreover, it is important to emphasize that the study was con-ducted using penetrating radiation (synchrotron X-rays), i.e. aprobe for bulk structure and strain analysis. Unlike the vast major-ity of studies that rely on surface characterisation (SEM, atomicforce microscopy, nanoindentation, Raman, etc.), this ensures thatthe effects of sample preparation (e.g. cutting and storage) areminimal, since they typically affect depths not exceeding�0.05 mm out of the total sample thickness of 2 mm.
5.1. Refined parameters by the Eshelby model
The parameters refined by the multiscale Eshelby model, listedin Table 1, lie within the range of the values reported in literature.This indicates that the model can be used to predict the nanoscaleparameters which are hard to obtain by experiment. Of the five re-fined parameters, the three key parameters are two volume frac-tions and the Young’s modulus of the HAp crystal. Among thesethree parameters, the Young’s modulus exerts the most significantinfluence on the result. In the optimization process, the two vol-ume fractions were initially fixed at approximate values, and theYoung’s modulus was refined within the range reported in the lit-erature. The samples of dental tissue in this case were taken fromteeth extracted from young patients. Consequently, the volumefraction of tubules was expected to be high, and was assumed tobe 10% for both samples. For the same reasons, HAp crystals wereassumed to have a low volume fraction (�40%). Other reasons forthe small volume fraction of HAp crystals may include that thecubes were cut from a position near the pulp chamber where thevolume fraction is relatively small [46], and the possible superficialdemineralization effect of water storage [48]. Based on the above
assumption about the two volume fractions, the refined Young’smodulus of HAp crystal was found to be approximately 90 GPa.At this stage, other parameters were refined as well, although itwas found that they only had a minor effect on the apparent mod-ulus result. The influence of the thickness variation on the apparentmodulus is found to be small. For a crystal thickness of 2 nm, theK_model is respectively 22.87 GPa (HD2) and 24.189 GPa (HD3),while the K_model is 23.15 GPa (HD2) and 24.62 GPa (HD3) atfor a thickness of 4 nm. In order to get best fitting both along load-ing direction and for normal strain variation, 2 nm is the best re-fined parameter.
5.2. Residual strain
Indeed, a thin layer of initial residual strain may be induced atthe sample surface during cutting using a low-speed diamond saw.However, as clarified above, the effect of this step on the overallmeasurement will not exceed 5% overall. Initial strain may alsobe associated with the natural growth process of the tooth. Inany case, as shown in Section 4.1, the initial existing residual strainis quite small. Furthermore, our experiment only considered theelastic response. (This is reflected in the linearity of the experimen-tal stress–strain curve, and is an underlying assumption for theEshelby model.) The presence of initial strain amounts to an offsetthat does not affect such parameters as the apparent modulus. Inconclusion, the low-level residual strain can be ignored in the pres-ent analysis, as it does not influence the elastic mechanical behav-iour of the crystals.
5.3. Normal strain components variation
To characterize and validate the model of the strain compo-nents in different directions, the normal strain variation of theHAp crystals with respect to different azimuthal angles (0�–90�)is shown in Fig. 5. The ratio of the normal strain component at90� to that at 0� (absolute value) for each sample is almost thePoisson’s ratio of the HAp crystals, which is reasonable. Mean-while, it should be noted that HAp crystals oriented at around60� azimuthal angle exhibit no normal strain, i.e. no peak shift,which demonstrates that the HAp crystals at this correspondingposition are subjected to pure shear stress. From the model, sincethe first-level dentine matrix stresses are the same for the twosamples, the difference in the modulus as well as the normal straincomponent variation may result from different orientations anddegrees of alignment of HAp crystals (observed and measured bySAXS).
5.4. HAp crystal distribution effects
The extended multiscale Eshelby model established in the pres-ent analysis is able to capture the relationship between the func-tion of human dentine and its multiscale structure. Moreover, itis also capable of evaluating the effect of the nanoscale structure(e.g. HAp crystal distribution) on the macroscopic mechanical re-sponse, which was not included in earlier studies [7,20]. To dem-onstrate the detailed effect of crystal distribution on theapparent modulus, a schematic diagram of a 3-D model of perfectlyaligned crystals is selected (Fig. 6a) with only one angle freedom uaround the z-axis. All aligned HAp crystals are initially oriented at a90� angle to the platelet surface along the global y-direction, whichrepresents the position of u ¼ 0
. The variation of Kaligned along the
loading direction was calculated and visualized in Fig. 6b (only theresult of HD2 is shown since both samples have similar results).The larger the value of Kaligned, the smaller the average lattice strainof HAp crystals will be under a certain value of external load, i.e.the stiffer the HAp crystals will be. It is found that the value of
7944 T. Sui et al. / Acta Biomaterialia 9 (2013) 7937–7947

Kaligned along the loading direction is strongly dependent on thecrystal orientation direction. The orientations of HD2 and HD3 inour in situ loading experiments were 161� and 78�, respectively.Hence, from Fig. 6b, Kaligned HD3 > Kaligned HD2. However, sampleHD3 had a lower degree of alignment overall, so that overall theKHAp
partial aligned HD3 value lies closer to Krandom; which is the reason forthe similar results of the apparent moduli of the two samples(Table 1).
6. Conclusions
In this study, the relationship between the nanoscale crystal dis-tribution and macroscopic mechanical elastic response of humandentine was investigated for the first time using a combined in situsynchrotron SAXS/WAXS technique. This provided access to theinformation on both the structural and mechanical aspects of thesample that thus allowed us to make further progress compared toprevious studies that only used WAXS [49]. Moreover, an extendedmultiscale Eshelby inclusion model was established to estimateand evaluate the elasticmaterial properties of dentine as a two-levelcomposite in terms of its constituents, showing good agreementwith the experimental data both on lattice strain along loadingdirection and normal strain component in a general azimuthal plot,improving the Voigt composite model proposed earlier for bovinedentine [7]. The difference in the mechanical behaviour observedin the experimental results can be attributed to the second-levelmodel effects, i.e. the degree of alignment and orientation angles.
Through this systematic experiment andmodellingwork, we arecapable of observing the nanoscale structure, which is used to vali-date the model linking the nanoparticle arrangement and deforma-tion behaviour to themacroscopic loading response. In addition, theparameter refinement and validation in the model adopted in thepresent study offers a possibility to identify the nanoscale parame-ters. The usual limitations of experimental characterization tech-niques such as nanoindentation or microscopy, e.g. confinementto the sample surface, make parameter identification difficult. Wetherefore argue that our approach enables the general characteriza-tion of the structure–property relationship in hierarchicalbiomaterials. An improved understanding of the multiscale struc-tural–mechanical properties within human dentine is importantfor developing better prosthetic materials and dental fillings. Itmay also shed light on the mechanical property evolution due tomultiscale structural changes within dentine because of diseaseand treatment.
Acknowledgements
A.M.K. acknowledges the support of EPSRC through grants EP/I020691 ‘‘Multi-disciplinary Centre for In-situ Processing Studies(CIPS)’’, EP/G004676 ‘‘Micromechanical Modelling and Experimen-tation’’, and EP/H003215 ‘‘New Dimensions of Engineering Scienceat Large Facilities’’. Diamond Light Source is acknowledged for pro-viding the beam time.
Appendix A. Figures with essential colour discrimination
Certain figures in this article, particularly Figs. 1–6, are difficultto interpret in black and white. The full colour images can be foundin the on-line version, at http://dx.doi.org/10.1016/j.actbio.2013.04.020
Appendix B. Appendix
A short overview of the Eshelby inclusion theory is given, lead-ing to the derivation of the constitutive law for a non-dilute popu-lation of inhomogeneities (HAp crystals) embedded in a finitematrix.
B.1. Eshelby general theory
B.1.1. Dilute system
If a uniform transformation strain et� exists in an ellipsoidalinclusion embedded in an infinite matrix, the Eshelby model showsthat the total strain in the inclusion ei is related to et� by the Eshelbytensor S that depends on the inclusion shape and Poisson’s ratio:
ei ¼ Set�: ðB1ÞConsequently, Hooke’s law can be used to calculate the inclu-
sion stress rI in terms of the elastic strain and the inclusion stiff-ness tensor CM (which is the same as the surrounding isotropicmatrix):
rI ¼ CMðei � et�Þ ¼ CMðS� IÞet�: ðB2ÞIf an inhomogeneity with a different stiffness tensor CI is pres-
ent, then the equivalent inclusion method can be used by consid-ering the inhomogeneity as equivalent to an inclusion with anappropriate transformation strain et , to be determined from theequivalence relation:
Fig. 6. (a) A simplified example of the alignment of HAp crystals. The beam direction is along the global z-axis and the alignment here represents the angle between the localx-axis and global x-axis (initially aligned angle u ¼ 0
; i.e. the local x axis of a penny is initially along global x-axis). (b) By changing the alignment angle (0�–180�), the
average strain of the crystals along loading direction can be obtained by the multiscale Eshelby model, which then indicates that Kaligned varies with respect to the preferentialalignment angle.
T. Sui et al. / Acta Biomaterialia 9 (2013) 7937–7947 7945

rI ¼ CIðei � et�Þ ¼ CMðei � etÞ: ðB3ÞIf the material is subjected to an external load rA that results in
the overall composite strain eA; then using Eq. (B3) the inclusionstress can be written as:
rI þ rA ¼ CIðei � et� þ eAÞ ¼ CMðei � et þ eAÞ: ðB4Þ
B.1.2. Non-dilute system
If multiple inhomogeneities are embedded in a finite matrix sothat their volume fraction is not small, the composite is consideredto be a non-dilute system. To satisfy the boundary conditions at theexternal boundaries of the finite composite, Eshelby introduced theconcept of a mean ‘‘image’’ stress, hriM ¼ CMheiM as an average ofthe stresses within individual phases, in order to maintain the bal-ance of stress. The application of averaging to the linear Eq. (B4)gives:
CMðheii þ heiM þ heiA � heitÞ ¼ hCiIðheii þ heiM þ heiA � heit�Þ; ðB5Þwhere hCiI is the average stiffness of the inhomogeneities.
B.2. Dentine first-level model
The first-level model considers dentine as a composite consist-ing of aligned tubules within a finite matrix phase. According to Eq.(B5):
CM1ðheii þ heiM1 þ eA � heitÞ ¼ hCitubuleðheii þ heiM1 þ eA
� heit�Þ; ðB6Þwhere hCitubule is the average stiffness of the tubules, and CM1 is thestiffness of the isotropic matrix or the equivalent inclusion (‘‘M1’’means the first-level matrix). Note that hCitubule ¼ 0 andheii ¼ hSiheit , thus:heit ¼ ðI � hSiÞ�1ðeA þ heiM1Þ: ðB7Þ
In a non-dilute system, the mean image stress is related to thetransformation strain [39] by:
hriM1 ¼ �f1CM1ðhSi � IÞheit ; ðB8Þwhere f1 is the volume fraction of tubules with respect to the wholedentine. From Eq. (B7), considering that (hriM1 ¼ CM1heiM1),
heiM1 ¼ f11� f1
eA: ðB9Þ
Therefore, the stress in the matrix is the sum of the appliedstress and the image stress:
rM1 ¼ rA þ hriM1 ¼ 11� f1
rA: ðB10Þ
Eq. (B10) indicates that the stress in the first-level matrix isindependent on the direction and detailed shape (Eshelby tensor)of tubules.
B.3. Dentine second-level model
The second-level model considers the matrix of the first-levelmodel to be a composite consisting of partially aligned HAp crys-tals and a collagen matrix. The volume-average method is intro-duced to determine the relationship between the externalapplied stress and the local averaged total strain in multiple HApcrystals.
The relationship between the strain in a single crystallite andthe external stress can be established initially based on Eqs. (B1),(B2), (B3), (B4), (B5):
esingle ¼ ffðI � C�1M2CIÞ�1½S� f2ðS� IÞ��1 � Ig�1T�T
þ T�TgC�1M2r
A
¼ KrA; ðB11Þwhere ‘‘M2’’ means the second-level collagen matrix. CI; S are thestiffness matrix and the Eshelby tensor for a single crystal, f2 thevolume fraction of HAp crystals with respect to the second-levelcomposite and T is the orientation matrix described by three Eulerangles (h;/;w). For a group of perfectly aligned HAp crystals, therelationship between the strain of the group and the external stressis the same as Eq. (B11), with the averaged stiffness and Eshelbytensor hCiHAp ¼ CHAp; hSi ¼ S. As for a group of randomly distributedHAp crystals, hCiHAp; hSi are isotropic and the way is to average theresults of each single crystal (Eq. (B11)) within the group over allpossible orientations:
hesinglei ¼R 2p0
R p0
R 2p0 Ksinhd/dhdwR 2p
0
R p0
R 2p0 sinhd/dhdw
rA
¼ rA
2p2
Z 2p
0
Z p
0
Z 2p
0Ksinhd/dhdw ¼ hKirA: ðB12Þ
References
[1] Ten Cate AR, Dale AC. Oral histology: development, structure, and function. St.Louis, MO: Mosby; 1980.
[2] Petrovic LM, Spasic DT, Atanackovic TM. On a mathematical model of a humanroot dentin. Dent Mater 2005;21:125–8.
[3] Pashley DH, Ciucchi B, Sano H, Carvalho RM, Russell CM. Bond strength versusdentine structure: a modelling approach. Arch Oral Biol 1995;40:1109–18.
[4] Johansen E, Parks HF. Electron microscopic observations on the 3-dimensionalmorphology of apatite crystallites of human dentine and bone. J BiophysBiochem Cytol 1960;7:743–6.
[5] Voegel JC, Frank RM. Ultrastructural-study of apatite crystal dissolution inhuman dentin and bone. J Biol Buccale 1977;5:181–94.
[6] Kinney JH, Marshall SJ, Marshall GW. The mechanical properties of humandentin: a critical review and re-evaluation of the dental literature. Crit Rev OralBiol Med 2003;14:13–29.
[7] Deymier-Black AC, Almer JD, Stock SR, Haeffner DR, Dunand DC. SynchrotronX-ray diffraction study of load partitioning during elastic deformation ofbovine dentin. Acta Biomater 2010;6:2172–80.
[8] Deymier-Black AC, Almer JD, Stock SR, Dunand DC. Variability in the elasticproperties of bovine dentin at multiple length scales. J Mech Behav BiomedMater 2012;5:71–81.
[9] Young ML, Almer JD, Daymond MR, Haeffner DR, Dunand DC. Load partitioningbetween ferrite and cementite during elasto-plastic deformation of anultrahigh-carbon steel. Acta Mater 2007;55:1999–2011.
[10] Mueller R, Rossoll A, Weber L, Bourke MAM, Dunand DC, Mortensen A. Tensileflow stress of ceramic particle-reinforced metal in the presence of particlecracking. Acta Mater 2008;56:4402–16.
[11] Young ML, DeFouw J, Almer JD, Dunand DC. Load partitioning duringcompressive loading of a Mg/MgB2 composite. Acta Mater 2007;55:3467–78.
[12] Fratzl P, Schreiber S, Klaushofer K. Bone mineralization as studied by small-angle X-ray scattering. Connect Tissue Res 1996;35:9–16.
[13] Wagner HD, Weiner S. On the relationship between the microstructure of boneand its mechanical stiffness. J Biomech 1992;25:1311–20.
[14] Currey JD. The relationship between the stiffness and the mineral content ofbone. J Biomech 1969;2:477–80.
[15] Bonfield W, Grynpas MD. Anisotropy of Youngs modulus of bone. Nature1977;270:453–4.
[16] Deymier-Black AC, Yuan F, Singhal A, Almer JD, Brinson LC, Dunand DC.Evolution of load transfer between hydroxyapatite and collagen during creepdeformation of bone. Acta Biomater 2012;8:253–61.
[17] Singhal A, Almer JD, Dunand DC. Variability in the nanoscale deformation ofhydroxyapatite during compressive loading in bovine bone. Acta Biomater2012;8:2747–58.
[18] Almer JD, Stock SR. Internal strains and stresses measured in cortical bone viahigh-energy X-ray diffraction. J Struct Biol 2005;152:14–27.
[19] Almer JD, Stock SR. Micromechanical response of mineral and collagen phasesin bone. J Struct Biol 2007;157:365–70.
[20] Almer JD, Stock SR. High energy X-ray scattering quantification of in situ-loading-related strain gradients spanning the dentinoenamel junction (DEJ) inbovine tooth specimens. J Biomech 2010;43:2294–300.
[21] Lopes MB, Sinhoreti MA, Gonini Junior A, Consani S, McCabe JF. Comparativestudy of tubular diameter and quantity for human and bovine dentin atdifferent depths. Braz Dent J 2009;20:279–83.
[22] Katz JL. Hard tissue as a composite material. 1. Bounds on elastic behavior. JBiomech 1971;93:455–73.
7946 T. Sui et al. / Acta Biomaterialia 9 (2013) 7937–7947

[23] Hashin Z. Analysis of composite-materials—a survey. J Appl Mech T Asme1983;50:481–505.
[24] Gottesman T, Hashin Z. Analysis of viscoelastic behavior of bones on the basisof microstructure. J Biomech 1980;13:89–96.
[25] Withers PJ, Stobbs WM, Pedersen OB. The application of the Eshelby method ofinternal-stress determination to short fiber metal matrix composites. ActaMetall Mater 1989;37:3061–84.
[26] Takao Y, Taya M. The effect of variable fiber aspect ratio on the stiffness andthermal-expansion coefficients of a short fiber composite. J Compos Mater1987;21:140–56.
[27] Qin Q-H, Swain MV. A micro-mechanics model of dentin mechanicalproperties. Biomaterials 2004;25:5081–90.
[28] Huo B. An inhomogeneous and anisotropic constitutive model of humandentin. J Biomech 2005;38:587–94.
[29] Wang YN, Qin QH. A generalized self consistent model for effective elasticmoduli of human dentine. Compos Sci Technol 2007;67:1553–60.
[30] Huo B, Zheng QS. Effect of dentin tubules on the mechanical properties ofdentin. Part I Stress–strain relations and strength criterion. Acta Mech Sin1999;15:355–65.
[31] Diamond Light Source Calibration. 2013.[32] Eliceiri KW, Berthold MR, Goldberg IG, Ibanez L, Manjunath BS, Martone ME,
et al. Biological imaging software tools. Nat Methods 2012;9:697–710.[33] Korsunsky AM, Baimpas N, Song X, Belnoue J, Hofmann F, Abbey B, et al. Strain
tomography of polycrystalline zirconia dental prostheses by synchrotron X-ray diffraction. Acta Mater 2011;59:2501–13.
[34] Hammersley AP. FIT2D: an introduction and overview. ESRF Internal Report,1997.
[35] Rinnerthaler S, Roschger P, Jakob HF, Nader A, Klaushofer K, Fratzl P. Scanningsmall angle X-ray scattering analysis of human bone sections. Calcified TissueInt 1999;64:422–9.
[36] Tesch W, Vandenbos T, Roschgr P, Fratzl-Zelman N, Klaushofer K, Beertsen W,et al. Orientation of mineral crystallites and mineral density during skeletal
development in mice deficient in tissue nonspecific alkaline phosphatase. JBone Miner Res 2003;18:117–25.
[37] Tesch W, Eidelman N, Roschger P, Goldenberg F, Klaushofer K, Fratzl P. Gradedmicrostructure and mechanical properties of human crown dentin. CalcifiedTissue Int 2001;69:147–57.
[38] Bozec L, de Groot J, Odlyha M, Nicholls B, Nesbitt S, Flanagan A, et al. Atomicforce microscopy of collagen structure in bone and dentine revealed byosteoclastic resorption. Ultramicroscopy 2005;105:79–89.
[39] Clyne TW, Withers PJ. An introduction to metal matrix composites. 1st pbked. Cambridge: Cambridge University Press; 1995.
[40] Mura T. Micromechanics of defects in solids. 2nd rev. ed. Dordrecht: MartinusNijhoff; 1987.
[41] Stock SR, Veis A, Telser A, Cai Z. Near tubule and intertubular bovine dentinmapped at the 250 nm level. J Struct Biol 2011;176:203–11.
[42] Wenk HR, Heidelbach F. Crystal alignment of carbonated apatite in bone andcalcified tendon: results from quantitative texture analysis. Bone1999;24:361–9.
[43] Powers JM, Farah JW. Apparent modulus of elasticity of dental amalgams. JDent Res 1975;54:902.
[44] Chou TW, Sun CT. In: Hyer MW, editor. Nanocomposites. DEStech Inc.; 2012.[45] Dourda AO, Moule AJ, Young WG. A morphometric analysis of the cross-
sectional area of dentine occupied by dentinal tubules in human third molarteeth. Int Endod J 1994;27:184–9.
[46] Kinney JH, Habelitz S, Marshall SJ, Marshall GW. The importance ofintrafibrillar mineralization of collagen on the mechanical properties ofdentin. J Dent Res 2003;82:957–61.
[47] Marten A, Fratzl P, Paris O, Zaslansky P. On the mineral in collagen of humancrown dentine. Biomaterials 2010;31:5479–90.
[48] Habelitz S, Marshall Jr GW, Balooch M, Marshall SJ. Nanoindentation andstorage of teeth. J Biomech 2002;35:995–8.
[49] Daniels JE, Pontoni D, Hoo RP, Honkimaki V. Simultaneous small- and wide-angle scattering at high X-ray energies. J Synchrotron Radiat 2010;17:473–8.
T. Sui et al. / Acta Biomaterialia 9 (2013) 7937–7947 7947