Health impacts of free bus travel for young people: evaluation of a natural experiment in London
16
Health impacts of free bus travel 1 Health impacts of free bus travel for young people: evaluation of a natural experiment in London Phil Edwards 1, Rebecca Steinbach 2, Judith Green 2, Mark Petticrew 2, Anna Goodman 1, Alasdair Jones 2, Helen Roberts 3, Charlotte Kelly 4, John Nellthorp 4 , Paul Wilkinson 2 1 – Faculty of Epidemiology and Population Health, London School of Hygiene & Tropical Medicine, Keppel Street, London WC1E 7HT 2 – Faculty of Public Health and Policy, London School of Hygiene & Tropical Medicine, 15 – 17 Tavistock Place, London WC1H 9SH 3 – UCL Institute of Child Health, Guilford Street, London WC1N 1EH 4 – Institute for Transport Studies (ITS), 36-40 University Road, University of Leeds, Leeds LS2 9JT Correspondence to: Dr Phil Edwards, Faculty of Epidemiology and Population Health, London School of Hygiene & Tropical Medicine, Keppel Street, London WC1E 7HT Email: [email protected]. Tel: +44(0)20 7958 8112 Fax: +44(0)20 7299 4663 Note: this is a personal version, created by Anna Goodman, of the text of the accepted journal article. It reflects all changes made in the peer review process, but does not incorporate any minor modifications made at the proof stage. The’ in press’ citation for the journal article is as follows [please click on DOI hyperlink to update with the date, journal volume and page numbers]: Edwards P, Steinbach R, Green J, Petticrew M, Goodman A, Jones A, Roberts H, Kelly C, Nellthorp J, Wilkinson P. Health impacts of free bus travel for young people: evaluation of a natural experiment in London. Journal of Epidemiology and Community Health 2013 DOI:10.1136/jech-2012-202156 The Corresponding Author has the right to grant on behalf of all authors and does grant on behalf of all authors, an exclusive licence (or non exclusive for government employees) on a worldwide basis to the BMJ Publishing Group Ltd to permit this article (if accepted) to be published in JECH and any other BMJPGL products and sublicences such use and exploit all subsidiary rights, as set out in our licence (http://group.bmj.com/products/journals/instructions-for- authors/licence-forms).
Transcript of Health impacts of free bus travel for young people: evaluation of a natural experiment in London
Health impacts of free bus travel 1
Health impacts of free bus travel for young people: evaluation of a natural
experiment in London
Phil Edwards 1, Rebecca Steinbach 2, Judith Green 2, Mark Petticrew 2, Anna Goodman 1,
Alasdair Jones 2, Helen Roberts 3, Charlotte Kelly 4, John Nellthorp 4 , Paul Wilkinson 2
1 – Faculty of Epidemiology and Population Health, London School of Hygiene & Tropical
Medicine, Keppel Street, London WC1E 7HT
2 – Faculty of Public Health and Policy, London School of Hygiene & Tropical Medicine, 15 –
17 Tavistock Place, London WC1H 9SH
3 – UCL Institute of Child Health, Guilford Street, London WC1N 1EH
4 – Institute for Transport Studies (ITS), 36-40 University Road, University of Leeds, Leeds LS2
9JT
Correspondence to: Dr Phil Edwards, Faculty of Epidemiology and Population Health,
London School of Hygiene & Tropical Medicine, Keppel Street, London WC1E 7HT
Email: [email protected]. Tel: +44(0)20 7958 8112 Fax: +44(0)20 7299 4663
Note: this is a personal version, created by Anna Goodman, of the text of the accepted journal
article. It reflects all changes made in the peer review process, but does not incorporate any
minor modifications made at the proof stage. The’ in press’ citation for the journal article is as
follows [please click on DOI hyperlink to update with the date, journal volume and page
numbers]:
Edwards P, Steinbach R, Green J, Petticrew M, Goodman A, Jones A, Roberts H, Kelly
C, Nellthorp J, Wilkinson P. Health impacts of free bus travel for young people:
evaluation of a natural experiment in London. Journal of Epidemiology and Community
Health 2013
DOI:10.1136/jech-2012-202156
The Corresponding Author has the right to grant on behalf of all authors and does grant on behalf
of all authors, an exclusive licence (or non exclusive for government employees) on a worldwide
basis to the BMJ Publishing Group Ltd to permit this article (if accepted) to be published in
JECH and any other BMJPGL products and sublicences such use and exploit all subsidiary
rights, as set out in our licence (http://group.bmj.com/products/journals/instructions-for-
authors/licence-forms).

Health impacts of free bus travel 2
Abstract
Background: We used the introduction of free bus travel for young people in London in 2005 as
a natural experiment with which to assess its effects on active travel, car use, road traffic injuries,
assaults, and on one measure of social inclusion, total number of trips made.
Methods: A controlled before-after analysis was conducted. We estimated trips by mode and
distances travelled in the pre- and post-introduction periods using data from London Travel
Demand Surveys. We estimated rates of road traffic injury and assault in each period using
STATS19 data and Hospital Episode Statistics, respectively. We estimated the ratio of change in
the target age-group (12-17 years) to the change in adults (ages 25-59 years), with 95%
confidence intervals.
Results: The proportion of short trips travelled by bus by young people increased post-
introduction. There was no evidence for an increase in the total number of bus trips or distance
travelled by bus by young people attributable to the intervention. The proportion of short trips by
walking decreased, but there was no evidence for any change to total distance walked. Car trips
declined in both age groups, although distance travelled by car decreased more in young people.
Road casualty rates declined, but the pre-post ratio of change was greater in young people than
adults (ratio of ratios 0.84; 95% CI 0.82 to 0.87). Assaults increased and the ratio of change was
greater in young people (1.20; 1.13 to 1.27). The frequency of all trips by young people was
unchanged, both in absolute terms, and relative to adults.
Conclusion: The introduction of free bus travel for young people had little impact on active
travel overall and shifted some travel from car to buses that could help broader environmental
objectives.
Keywords: Natural experiment, Bus travel, Active travel, Road injuries, Social inclusion
What is already known on this subject?
Improved access to public transport can increase population levels of physical
activity through increases in the amounts of walking to public transport
Increased access to public transport can help to reduce levels of obesity
Free bus travel provides a benefit for the health of older people in the UK
What this study adds?
A natural experiment of free bus travel for young people was found to encourage
greater use of buses for shorter trips in place of walking, without reducing overall
walking distances
The evaluation found no negative effects of this policy on use of buses by older
people
Free bus travel can help to promote broader environmental objectives by shifting
some travel by car to public transport.

Health impacts of free bus travel 3
Introduction
Urban transport policies may have direct impacts on the health of the population,[1-3] as well as
on the economy,[4] and on the environment.[5] Modest gains in health can be achieved by
switching short trips by motorised transport to more active modes, such as walking and
cycling,[6] or by promoting public transport, due to increases in walking to bus stops or train
stations.[7]
We used the introduction of free bus travel for young people in London as a natural experiment
with which to evaluate its public health impacts. Theoretically, risks and benefits to health from
provision of free public transport are likely to accrue both from increased access to transport, as
well as from changes to travel modes used. In England, UK, free bus travel has been identified as
providing a benefit for the health of older people.[8, 9] However, it is possible that in cities such
as London, where dependence on private cars for travel is generally lower than in other cities,
improving access to affordable public transport might actually reduce the amount of active
travel, if it is used to replace walking or cycling, rather than to replace car use.
Shifts in modes of transport are also likely to change road traffic injury rates in the population, as
risk of injury varies by transport mode.[10] Young people are particularly at risk of assault,[11]
and greater access to public transport potentially increases this risk (e.g. by facilitating trips to
distant or unfamiliar areas, possibly increasing confrontation with gangs). More tangential
benefits that may result from increased access to public transport for young people include
increased social inclusion and potentially decreased future reliance on car travel. In addition to
benefits or costs for young people, there may also be consequent effects for older people,
possibly displaced from buses.
The introduction of free bus travel for young people in London was not primarily aimed at public
health, but it did aim to reduce social exclusion through reducing transport poverty, one
determinant of health and well-being.[12] Its introduction is a natural experiment that presents a
number of challenges for evaluation, both in analytical design, and in terms of attributing causal
effects.[13] In this paper, we assess its effects on active travel, road traffic injuries, assaults, one
measure of social inclusion (total number of trips made) and one measure of environmental
impact (car use).
Methods
Intervention
Transport for London, the local government body responsible for London’s transportation
system, introduced free bus travel for young people aged 12 to 16 years in September 2005.
Provision was extended in 2006 to people aged 17 years, if in full-time education or unwaged
training.

Health impacts of free bus travel 4
Hypotheses and outcomes
In line with recommendations for increasing confidence in causal attributions,[13-15] we pre-
specified our hypotheses and expected directions of change.[16] We hypothesised that
introduction of free bus travel for young people would be associated with:
increased bus travel by young people and reduced walking, cycling and car travel;
reduced bus use and fewer short bus trips (<1 km) by older people (60+ years), especially
when children travel after school;
fewer road traffic injuries to young people;
more injuries to young people due to assaults.
The hypothesised direct and indirect effects are summarised in figure 1.
Figure 1 Hypothesised pathways linking free bus travel for young people to health outcomes.

Health impacts of free bus travel 5
Data sources
Travel surveys
We estimated distances travelled by mode in the pre-intervention period (2001-2004) using data
from the 2001 London Area Transport Survey (LATS), and in the post-intervention period
(2006-2009) using data from the London Travel Demand Surveys (LTDS).[17,18] LATS and
LTDS used comparable survey methods to sample households and to collect data from every
person aged over 5 years using travel diaries. Journey distances are estimated using the start-
point, interchange and end-point of each trip made per person. Trips were defined by the main
mode of transport used (e.g. a bus trip is a journey where bus is the main mode used for that
journey). Although the data provided define each trip by the main mode of travel used, we
calculated total distance travelled by mode by disaggregating the individual stages of each trip
made. LATS sampled travel on weekdays during school term only and so our analysis is based
on school term-time only. Missing journey distances (0.2% of trip stage distances were missing)
were estimated using the median distance for each age group and travel mode. Information is
collected on the age, ethnicity, household income and census Lower Super Output Area (LSOA)
of residence of each participant. Ethnicity was coded using four categories: ‘White’, ‘Black’,
‘Asian’, and other. Household income was categorised as: <£15,000, £15,000 to £49,999, and
£50,000 or more. Using data from the 2004 Index of Multiple Deprivation (IMD) available at
LSOA level we assigned to each individual an area deprivation score based on the LSOA of their
residence. We also used LSOA of residence to assign inner/outer London status to each
individual. Survey weights (adjusted for non-response and scaled to mid-2007 population
projections for the LTDS) were used to ensure that the sample was representative of the London
population.
Road traffic injuries
We estimated road traffic injury rates by mode in the pre- and post- intervention periods using
STATS19, the official dataset of injuries from road traffic collisions on public highways in the
UK. The STATS19 data include information on age and ethnicity of casualties, which were used
to create similar categories as described above. STATS19 also include coordinates of the
location of collisions which were linked geographically to a LSOA, and through the LSOA code
to both an IMD deprivation score and inner/outer London status.
Assaults
We estimated rates of assaults in the pre- and post- intervention periods using an extract of
Hospital Episode Statistics data for England. We identified London and non-London residents
using LSOA code of residence. Hospital admissions due to assaults were identified by the
International Classification of Diseases (10th Revision) external cause of injury codes X85-Y09.
Hospital Episode Statistics data include age and ethnicity; they were also linked to a deprivation
score and inner/outer London status using LSOA.
Statistical analysis
We used change-on-change analysis to compare change in the outcomes in young people (the
targets of the policy) with change in the outcomes in adults aged 25-59 years (i.e. those adults

Health impacts of free bus travel 6
old enough to never have experienced free bus travel, and young enough not to qualify for an
older citizens’ free bus pass). This method controls for the effects of other changes to transport
provision within the study area which might be expected to have affected use of modes by all age
groups (e.g., congestion charging; expansion of the bus network).[19]
We estimated the ratio of the pre-post intervention change in the target age-group (ages 12-17
years) to that seen in adults (ages 25-59 years) and estimated 95% confidence intervals for the
ratio using bootstrap methods implemented in Stata statistical software (StataCorp, Texas 77845
USA). We conducted subgroup analyses according to: Area (inner vs. outer London; high take-
up vs. low take-up boroughs), Deprivation (most deprived population quintile vs. least deprived
80%), Household income (<£15k per year versus > £50k per year; possible for travel patterns
only), and Ethnicity (‘White’, ‘Black’, ‘Asian’, other). To explore whether people aged 60+
years were displaced from buses we compared the pre-post change in older peoples’ travel
during school commuting hours versus travel at other times. We also used STATS19 data and
Hospital Episode Statistics data for people aged 12-17 years living in England as a further
control with which to assess changes in road injuries and assaults in young people after
introduction of the scheme in London.
To assess impact of the scheme on social inclusion we fitted a regression model of distance
travelled according to journey purpose on deprivation (IMD as continuous variable) and tested
for interaction with pre-post intervention status (i.e. change of slope with IMD). To strengthen
any causal inference we used rate of uptake of free bus travel at borough level as a proxy for
‘dose’, with which to explore changes in outcome. To explore differential effects across the
population, we examined differences in travel modes used according to level of household
income and by ethnicity. Sample sizes for each data source analysed are summarized in the Web
Appendix Table A1.
Results
We present our results under five headings: bus use, active travel, safety, social inclusion, and
environmental impact. Results for travel mode are summarised in figure 2, safety in figure 3, and
socio-economic gradients in travel patterns by journey purpose in figure 4. Pre- and post-
intervention changes in people aged 60+ years are presented in Web Appendix Table A2.
Health impacts of free bus travel 7
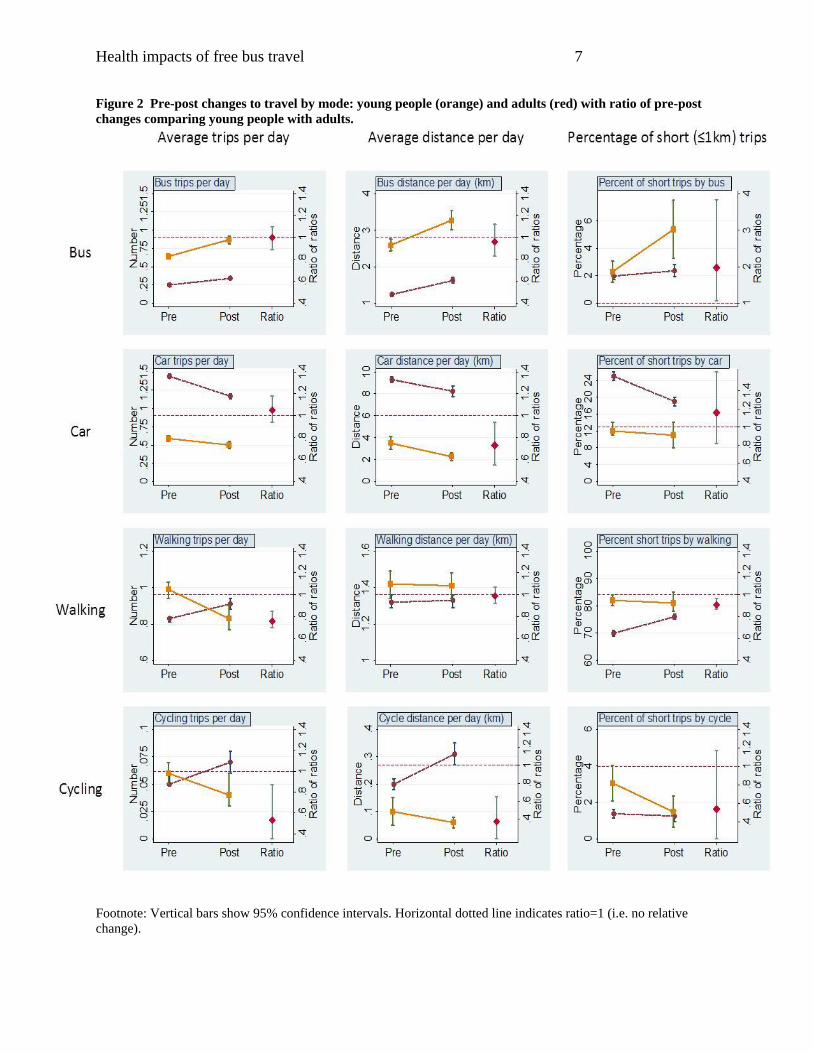
Figure 2 Pre-post changes to travel by mode: young people (orange) and adults (red) with ratio of pre-post
changes comparing young people with adults.
Footnote: Vertical bars show 95% confidence intervals. Horizontal dotted line indicates ratio=1 (i.e. no relative
change).

Health impacts of free bus travel 8
Figure 3 Annual rates of road traffic injuries and assaults in London (young people, black; adults, grey).

Health impacts of free bus travel 9
Figure 4 Distances travelled by young people according to journey purpose by decile of Index of Multiple
Deprivation (IMD), pre and post introduction of free bus travel.

Health impacts of free bus travel 10
Bus use
The introduction of the free bus travel scheme was associated with an increase in the proportion
of short trips travelled by bus by young people, from around 2% to around 5% of short trips
(figure 2). The proportion remained at around 2% pre- and post-intervention in the control group,
so there was therefore evidence for a doubling (relative change 1.97; 95% CI 1.07 to 3.84) of the
proportion of short trips by bus by young people attributable to the intervention. There was,
however, no evidence of change to the number of bus trips, or distance travelled by bus,
attributable to the intervention. There was a 35% (95% CI 25% to 47%) increase in the average
number of bus trips per day by young people, and a 36% (95% CI 25% to 46%) increase in the
control group (relative change 1.00; 0.89 to 1.10). There was a 26% (95% CI 13% to 41%)
increase in average distance travelled by bus by young people, and a 31% (95% CI 19% to 42%)
increase in the control group (relative change 0.96; 0.83 to 1.12).
Active travel
There was a decline in the number of walking trips per day by young people, both in absolute
terms and especially relative to the change in adults. There was, however, no appreciable impact
on the total distance walked, despite a decrease in the percentage of short trips made by walking
– largely a substitution by bus trips. There was clear evidence for a decrease in cycle trips and
distances cycled by young people, but the large estimated reduction in percentage of short trips
by bicycle was not statistically significant. However, these changes occurred from a low baseline
(e.g. mean distance cycled per person per day was under 0.1 km pre-intervention and the
percentage of short trips was 3% pre-intervention).
Safety
Road traffic casualty rates continued to decline after introduction of the scheme, but at a greater
rate in young people than adults (ratio of ratios 0.84; 95% CI 0.82 to 0.87). When compared with
the change in young people nationally the relative change was greater (0.70; 0.68 to 0.73). The
major contributors to this decline were reductions in car occupant casualties (ratio of ratios: 0.89;
0.84 to 0.95; and 0.65; 0.61 to 0.69, nationally) and cyclist casualties (ratio of ratios: 0.60; 0.55
to 0.66; and 0.81; 0.74 to 0.88, nationally). The change to pedestrian casualty rates was similar in
young people and adults (ratio of ratios: 0.98; 0.92 to 1.03; and 0.93; 0.88 to 0.98, nationally).
Hospital admission rates due to assaults had been rising in both age groups pre-2005 but reached
a relatively higher peak in young people. Although the pre-post ratio of change in assaults was
therefore greater in young people (ratio of ratios 1.20; 1.13 to 1.27), this reflects a larger increase
in assaults in young people occurring before introduction of the scheme. When compared with
the change in assaults to young people nationally, the relative change was marginally greater
(ratio of ratios 1.32; 1.25 to 1.4).
Health impacts of free bus travel 11
Social inclusion
In the absence of direct markers of social inclusion we examined journeys to/from school and
work and the socio-economic gradient in distance travelled (all modes) by journey purpose. The
frequency of journeys to/from school or work in young people was higher after introduction of
the scheme (relative change 1.09; 1.06 to 1.14), but was lower in adults. The ratio of change in
young people compared with adults was 1.19 (95% CI 1.13 to 1.25). In contrast, the frequency of
all journeys in young people was unchanged both in absolute terms and relative to that in adults
(ratio of ratios 1.00; 0.97 to 1.04). Plots of distance travelled by journey purpose against decile of
IMD (figure 4) show no clear evidence of diminution in socio-economic gradients following
introduction of the scheme. Nevertheless, the patterns were suggestive of a flattening in the
socio-economic gradient for travel ‘for shopping’ (a lower level post-intervention; p-value for
change of slope with IMD was p=0.024).
Environmental impact
The introduction of free bus travel was associated with a reduction in number of car trips per day
by young people (relative change 0.85, 0.77 to 0.95) and by adults (0.81; 0.77 to 0.85). There
was also a reduction in the average distance travelled by car each day by young people (0.65;
0.49 to 0.84) and by adults (0.89; 0.84 to 0.94), but the reduction was greater in young people
(relative change 0.73; 0.55 to 0.94).
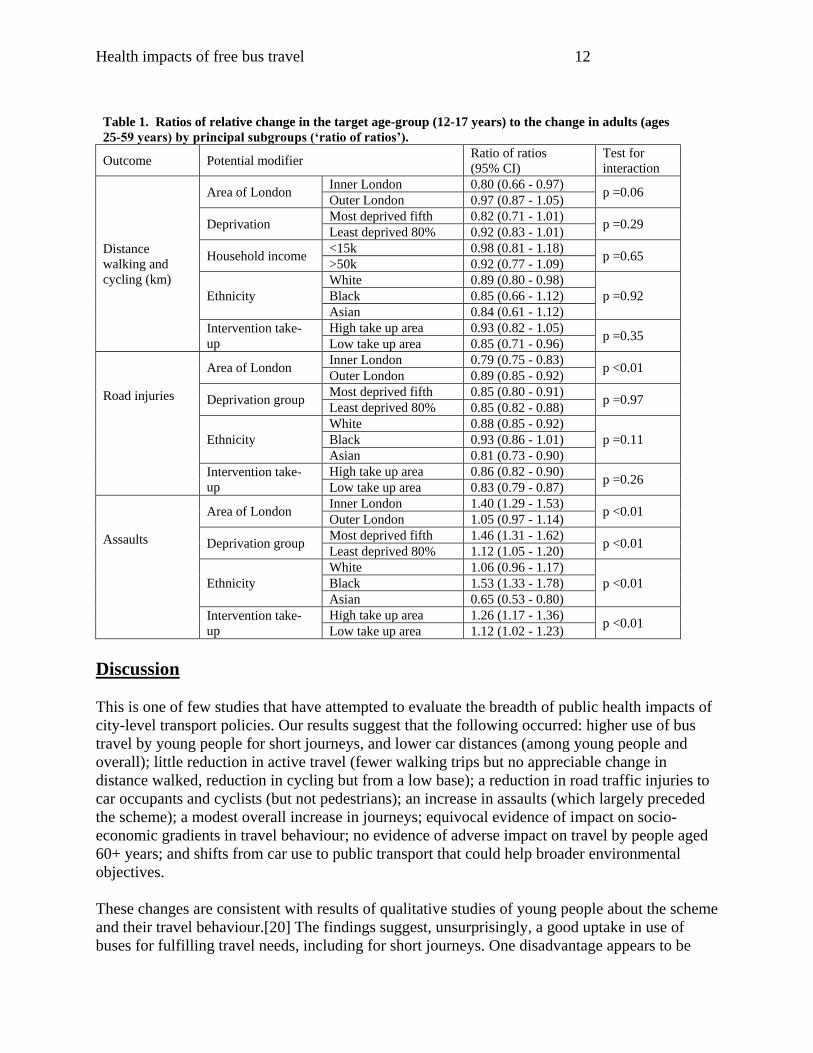
Subgroup analyses
Subgroup analyses provided weak evidence that the pre-post reduction in total distance walked
and cycled was greater in inner London compared with outer London, but less clear evidence that
it varied with socio-economic deprivation, household income, ethnicity, or area-level uptake
(table 1). Similarly, the relative reduction in road traffic injury was greater in inner London, but
there was no clear evidence of variation in relation to other potential modifiers. The pre-post
increase in assaults was higher in inner London, in the most deprived areas, in the ‘Black’ and
‘White’ populations relative to ‘Asian’, and higher in areas with a high level of uptake of free
bus travel. There was no evidence that introduction of the scheme appreciably affected travel by
those aged 60+ years, and specifically no indication of reduced bus use during peak times when
young people travel home after school (weekdays 3-4 pm); see Web Appendix Table A2.
Health impacts of free bus travel 12
Table 1. Ratios of relative change in the target age-group (12-17 years) to the change in adults (ages
25-59 years) by principal subgroups (‘ratio of ratios’).
Outcome Potential modifier Ratio of ratios
(95% CI)
Test for
interaction
Distance
walking and
cycling (km)
Area of London Inner London 0.80 (0.66 - 0.97)
p =0.06 Outer London 0.97 (0.87 - 1.05)
Deprivation Most deprived fifth 0.82 (0.71 - 1.01)
p =0.29 Least deprived 80% 0.92 (0.83 - 1.01)
Household income <15k 0.98 (0.81 - 1.18)
p =0.65 >50k 0.92 (0.77 - 1.09)
Ethnicity
White 0.89 (0.80 - 0.98)
p =0.92 Black 0.85 (0.66 - 1.12)
Asian 0.84 (0.61 - 1.12)
Intervention take-
up
High take up area 0.93 (0.82 - 1.05) p =0.35
Low take up area 0.85 (0.71 - 0.96)
Road injuries
Area of London Inner London 0.79 (0.75 - 0.83)
p <0.01 Outer London 0.89 (0.85 - 0.92)
Deprivation group Most deprived fifth 0.85 (0.80 - 0.91)
p =0.97 Least deprived 80% 0.85 (0.82 - 0.88)
Ethnicity
White 0.88 (0.85 - 0.92)
p =0.11 Black 0.93 (0.86 - 1.01)
Asian 0.81 (0.73 - 0.90)
Intervention take-
up
High take up area 0.86 (0.82 - 0.90) p =0.26
Low take up area 0.83 (0.79 - 0.87)
Assaults
Area of London Inner London 1.40 (1.29 - 1.53)
p <0.01 Outer London 1.05 (0.97 - 1.14)
Deprivation group Most deprived fifth 1.46 (1.31 - 1.62)
p <0.01 Least deprived 80% 1.12 (1.05 - 1.20)
Ethnicity
White 1.06 (0.96 - 1.17)
p <0.01 Black 1.53 (1.33 - 1.78)
Asian 0.65 (0.53 - 0.80)
Intervention take-
up
High take up area 1.26 (1.17 - 1.36) p <0.01
Low take up area 1.12 (1.02 - 1.23)
Discussion
This is one of few studies that have attempted to evaluate the breadth of public health impacts of
city-level transport policies. Our results suggest that the following occurred: higher use of bus
travel by young people for short journeys, and lower car distances (among young people and
overall); little reduction in active travel (fewer walking trips but no appreciable change in
distance walked, reduction in cycling but from a low base); a reduction in road traffic injuries to
car occupants and cyclists (but not pedestrians); an increase in assaults (which largely preceded
the scheme); a modest overall increase in journeys; equivocal evidence of impact on socio-
economic gradients in travel behaviour; no evidence of adverse impact on travel by people aged
60+ years; and shifts from car use to public transport that could help broader environmental
objectives.
These changes are consistent with results of qualitative studies of young people about the scheme
and their travel behaviour.[20] The findings suggest, unsurprisingly, a good uptake in use of
buses for fulfilling travel needs, including for short journeys. One disadvantage appears to be

Health impacts of free bus travel 13
some reduction in the proportion of short trips by walking, and in the (already) low level of
cycling; these might be detrimental to the establishment of future travel habits bringing regular
physical activity. On the other hand, the increase in use of public transport may help to establish
travel behaviour for later life that entails some physical activity, as well as helping to reduce car
use. The observed reduction in road traffic injuries, especially of cyclists, is consistent with the
substitution of walking, cycling and car journeys with (relatively safe) bus travel, although other
factors may also play a part in the selective improvement over time in road injuries among young
people. Although the observed increase in assaults among young people may partly be a
consequence of their increased use of bus travel, the temporal pattern of change might argue
against it being a major causal factor.
Our evidence on social inclusion is indirect: the frequency of school or work journeys for young
people was (relatively) higher after introduction of the scheme and there was weak evidence of a
flattening in the socio-economic gradients in travel for shopping (but not for education, personal
business or entertainment). While this is not strong evidence for a favourable influence on social
inclusion, the patterns suggest a helpful direction of change. There was no suggestion of negative
effects on bus use, or overall travel, by people aged 60+ years, indicating an absence of a
detrimental effect on the social inclusion of this group.
The assembly, analysis and interpretation of data for this study, relating to a population-level
intervention with multiple interconnected and often indirect effects, were inevitably complicated.
A strength was availability of large datasets relating to a range of population-level outcomes that
should demonstrate evidence of change, if the scheme did result in altered behaviours. On the
other hand, its main weakness is attribution, as it is impossible to eliminate or take account of the
influence of other factors that may have had a selective impact over time on some of the
measured outcomes for young people, including regional transport-related interventions and
national trends in travel modes and safety. A particular limitation with available travel survey
data was that this was limited to a single year pre-intervention. These data also only included
travel on weekdays during school term times. We attempted to minimise bias by comparing pre-
post changes in young people to changes in adults, but this is not a perfect control for temporal
changes that hypothetically have selective effects in young people. Furthermore, our subgroup
analyses by level of take-up of the intervention did not find evidence that higher ‘dose’ was
associated with a greater effect on most outcomes. Nonetheless, our results present a somewhat
coherent picture that is supported by qualitative evidence.[20, 21] While not all observed effects
may be attributable directly to the scheme, it seems probable that many of those effects were
partly influenced by it.
The implication of our evaluation for policy depends upon the value assigned to the attainment
of different objectives, and on the degree to which our results suggest causal influence. What
seems clear is that the scheme brought about a shift in travel behaviour among young people in
London, who now use buses more frequently in place of short walking trips and cycling, with
reduced car use, and little overall reduction in active travel. On the one hand it might be argued
that an increase in short journeys by bus should not necessarily be seen as a positive effect of the
intervention on active travel, as most young people can easily walk or cycle these distances,
some of whom might benefit from increased physical activity. On the other hand this shift
probably has consequential reductions in road injuries and changes in traffic overall that are
Health impacts of free bus travel 14
likely to be broadly positive from an environmental perspective. Beneficial effects on social
inclusion are uncertain but suggested. By most parameters these would be judged broadly
positive changes, not just for young people, but for the city as a whole.
Contributors
JG, PW, HR, MP, PE, RS conceived the study. PE is guarantor. PE, RS and PW obtained data
sets and carried out the analyses. JG, PW, PE, and RS wrote the manuscript with contributions
from HR, MP, CK, JN, AJ, and AG. The final version was approved by all authors.
Funding
This project was funded by the National Institute for Health Research Public Health Research
Programme (project number 09/3001/13). The views and opinions expressed herein are those of
the authors and do not necessarily reflect those of the Department of Health.
Competing Interest:
None
References
1. Zheng Y. The benefit of public transportation: Physical activity to reduce obesity and
ecological footprint. Preventive Medicine 2008;46(1):4-5.
2. Besser LM, Dannenberg AL. Walking to public transit: steps to help meet physical
activity recommendations. American Journal of Preventive Medicine 2005;29(4):273-80.
3. Edwards RD. Public transit, obesity, and medical costs: Assessing the magnitudes.
Preventive Medicine 2008;46(1):14-21.
4. Jarrett J, Woodcock J, Griffiths UK, et al. Effect of increasing active travel in urban
England and Wales on costs to the National Health Service. The Lancet 2012;379(9832):2198-
205.
5. Woodcock J, Edwards P, Tonne C, et al. Public health benefits of strategies to reduce
greenhouse-gas emissions: urban land transport. The Lancet 2009;374(9705):1930-43.
6. Rojas-Rueda D, de Nazelle A, Teixidó e O, et al. Replacing car trips by increasing bike
and public transport in the greater Barcelona metropolitan area: A health impact assessment
study. Environment International 2012;49:100–9.
7. Rissel C, Curac N, Greenaway M, et al. Physical Activity Associated with Public
Transport Use - A Review and Modelling of Potential Benefits. International Journal of
Environmental Research and Public Health 2012;9:2454-78.
8. Webb E, Netuveli G, Millett C. Free bus passes, use of public transport and obesity
among older people in England. Journal of Epidemiology and Community Health 2011.
doi:10.1136/jech.2011.133165
9. Coronini-Cronberg S, Millett C, Laverty AA, et al. The Impact of Free Older Persons’
Bus Pass on Active Travel and Regular Walking in England. American Journal of Public Health
2012:e1-e8.

Health impacts of free bus travel 15
10. Sonkin B, Edwards P, Roberts I, et al. Walking, cycling and transport safety: an analysis
of child road deaths. Journal of the Royal Society of Medicine 2006;99(8):402-5.
11. Bellis M, Hughes K, Wood S, et al. National five-year examination of inequalities and
trends in emergency admisssion for violence across England. Injury Prevention 2011;17:319-25.
12. SEU Social Exclusion Unit. Making the connections: Final report on transport and social
exclusion. London: Social Exclusion Unit; 2003.
13. Craig P, Cooper C, Gunnell D, et al. Using natural experiments to evaluate population
health interventions: new MRC guidance. Journal of Epidemiology and Community Health
2012:[Epub ahead of print].
14. Sun X, Briel M, Walter SD, et al. Is a subgroup effect believable? Updating criteria to
evaluate the credibility of subgroup analyses. BMJ 2010 2010-03-30 00:00:00;340.
15. Petticrew M, Cummins S, Ferrell C, et al. Natural experiments: an underused tool for
public health? Public Health 2005;119(9):751-7.
16. The health impact of free bus travel for young people in London: protocol for an
observational study [database on the Internet]. London, LSHTM 2011 [cited. Available from:
http://www.lshtm.ac.uk/php/hsrp/buses/publications/4wilkinson2011protocol.pdf.]
17. TfL Transport Data Library. http://romulus.tfl.gov.uk/webview (accessed 27 March
2013).
18. Travel in London, Supplementary Report: London Travel Demand Survey (LTDS).
London: Transport for London, 2011.
19. Jones A. Free for some? Setting the context for the 'On the Buses' study. London:
LSHTM, 2010.
20. Jones A, Steinbach R, Roberts H, et al. Rethinking passive transport: Bus fare
exemptions and young people's wellbeing. Health Place 2012 (Jan 25).
21. Green J, Jones A, Roberts H. More than A to B: the role of free bus travel for the
mobility and wellbeing of older citizens in London. Ageing & Society 2012 (in press).

Health impacts of free bus travel 16
Appendix Table A1 Sample sizes available from each data source in the pre- and post-intervention periods
Data source Age group
Intervention
period
Time period 12-17
years
25-59
years
60+ years
London Area Transport Survey Pre 2001 4,206 31,169 10,671
London Travel Demand Survey Post 2006 to 2008 2,024 14,085 5,033
STATS19 Pre 2001 to 2004 11,221 89,661 13,337
Post 2006 to 2009 6,657 65,542 9,283
Hospital Episode Statistics Pre 2001 to 2004 2,321 11,829 905
Post 2006 to 2009 3,322 14,641 959
Table A2. Pre-intervention (pre-2005) to post-intervention (2006 onwards) change in key outcome
measures, 60+ years.
Within travel from School
hours (3-4 pm, Mon to Fri,
in term time)
Other times Ratio of
ratios
Pre- Post- Ratio Pre- Post- Ratio
Bus
travel
Frequency
0.06
(0.06 -
0.07)
0.07
(0.06 -
0.08)
1.11
(0.92 -
1.32)
0.36
(0.34 -
0.37)
0.37
(0.35 -
0.4)
1.04
(0.94 -
1.18)
1.07
(0.91 - 1.21)
Distance
0.26
(0.23-
0.29)
0.25
(0.21-
0.28)
0.95
(0.80-
1.13)
1.19
(1.11-
1.26)
1.19
(1.09-
1.29)
1.00
(0.89-
1.14)
0.95
(0.80-1.11)
% of short distance
trips by bus
7.09
(5.73 -
9.46)
8.42
(4.4 -
11.71)
1.19
(0.53 -
1.65)
7.33
(6.23 -
8.53)
7.03
(5.74 -
8.53)
0.96
(0.80 -
1.14)
1.24
(0.52 - 1.69)
All
travel
Frequency
0.31
(0.29 -
0.32)
0.33
(0.31 -
0.35)
1.08
(0.97 -
1.17)
1.98
(1.94 -
2.02)
2.07
(2.01 -
2.13)
1.05
(0.99 -
1.12)
1.03
(0.94 - 1.10)
Distance
1.62
(1.44-
1.80)
1.90
(1.40-
2.40)
1.17
(0.91-
1.60)
8.09
(7.70-
8.49)
9.29
(8.46-
10.12)
1.15
(1.03-
1.27)
1.02
(0.80-1.30)
% of all trips which
are short distance
30.12
(27.47 -
33.95)
29.52
(26.38 -
33.38)
0.98
(0.85 -
1.12)
36.20
(34.12 -
39.05)
35.67
(33.57 -
37.93)
0.99
(0.93 -
1.04)
0.99
(0.88 - 1.16)