Health Effects of Children’s Work: Evidence from Vietnam
38
1. Health effects of children’s work: evidence from Vietnam O. O’Donnel E. Van Doorslaer F. C. Rosati April 2003 Understanding Children’s Work Project Working Paper Series, April 2003
-
Upload
mondodomani -
Category
Documents
-
view
0 -
download
0
Transcript of Health Effects of Children’s Work: Evidence from Vietnam
1.
Health effects of children’s work:evidence from Vietnam
O. O’DonnelE. Van Doorslaer
F. C. Rosati
April 2003
Und
erst
andi
ng C
hild
ren’
s Wor
k Pr
ojec
t Wor
king
Pap
er S
erie
s, A
pril
2003

Health effects of children’s work: evidence from Vietnam
O. O’Donnel*
E. Van Doorslaer** F. C. Rosati***
Working Paper April 2003
Understanding Children’s Work (UCW) Project University of Rome “Tor Vergata”
Faculty of Economics V. Columbia 2
00133 Rome Tor Vergata
Tel: +39 06.7259.5618 Fax: +39 06.2020.687
Email: [email protected]
As part of broader efforts toward durable solutions to child labor, the International Labour Organization (ILO), the United Nations Children’s Fund (UNICEF), and the World Bank initiated the interagency Understanding Children’s Work (UCW) project in December 2000. The project is guided by the Oslo Agenda for Action, which laid out the priorities for the international community in the fight against child labor. Through a variety of data collection, research, and assessment activities, the UCW project is broadly directed toward improving understanding of child labor, its causes and effects, how it can be measured, and effective policies for addressing it. For further information, see the project website at www.ucw-project.org.
This paper is part of the research carried out within UCW (Understanding Children's Work), a joint ILO, World Bank and UNICEF project. The views expressed here are those of the authors' and should not be attributed to the ILO, the World Bank, UNICEF or any of these agencies’ member countries. * University of Macedonia ** Erasmus University
*** UCW-Project and University of Rome “Tor Vergata”
Health effects of children’s work: evidence from Vietnam
Working Paper
April 2003
ABSTRACT
We test whether work in childhood impacts on health. We focus on agricultural work, the dominant form of child work worldwide. Data are from the Vietnam Living Standards Survey, 1992-93 and 1997-98. We correct for both unobservable heterogeneity and simultaneity biases. Instruments include small area labour market and education conditions obtained from community level surveys. We use three indicators of health: body mass index; reported illness; and, height growth. There is clear evidence of a healthy worker selection effect. We find little evidence of a contemporaneous impact of child work on health but work undertaken during childhood raises the risk of illness up to five years later and the risk is increasing with the duration of work. There is no evidence that work impedes the growth of the child. Acknowledgements: We are grateful to the Government of Vietnam for permission to use the data.


Health effects of children’s work: evidence from Vietnam
Working Paper
April 2003
CONTENTS
1. Introduction .................................................................................................................................... 1 2. Child work and health: Hypotheses and empirics ..................................................................... 3
2.1 Hypotheses ................................................................................................................................ 3 2.2 Empirics ..................................................................................................................................... 4
3. Data and descriptives ..................................................................................................................... 6
Table 1: Work participation rates of children 6-15 years, Vietnam 1993 and 1998 ............... 6 Table 2: Type, intensity and duration of children's work, Vietnam 1993 & 1998 .................. 7 Table 3: Health indicators by work status, rural Vietnam 1993-98 ......................................... 8 Table 4: Work and health by household consumption quintile, rural Vietnam 1993 & 1998 ..... 9
4. Econometric specification .......................................................................................................... 10
4.1 Model of contemporaneous relationship ........................................................................... 10 4.2 Models of the longer-term relationship .............................................................................. 11
5. Results ............................................................................................................................................ 14
5.1 Empirical specification .......................................................................................................... 14 5.2 Contemporaneous relationships .......................................................................................... 15 Table 5: Body mass index against current child work activity ................................................ 15 5.3 Longer-term relationships ..................................................................................................... 17 Table 6: IIlness/injury against past child work activity ............................................................ 18 Table 7: Average annual growth in height against past child work activity ........................... 18
6. Conclusion ..................................................................................................................................... 19 References ................................................................................................................................................... 21 Tables ……………………………………………………………………………………...25
1 UCW WORKING PAPER SERIES, APRIL 2003
1. INTRODUCTION 1. Child labour arouses widespread concern, not least because of potentially damaging effects on health. Categories of child labour to be abolished under the provisions of International Labour Office (ILO) Conventions 138 and 182 include hazardous work, defined as “labour that jeopardises the physical, mental or moral well-being of a child” (ILO, 2002, p. x). The ILO estimates that there are 171 million children worldwide engaged in hazardous work, of which nearly two-thirds are under the age of 15 years (ILO, 2002, Table 1). These estimates are extrapolated from data on the prevalence of child workers in activities considered to be potentially damaging to child well-being.2 There is remarkably little evidence on the actual health effects of child work. 2. To an extent, the lack of empirical evidence is not a major obstacle to policy formation. Children working with dangerous materials, such as asbestos or molten glass, in unhealthy environments, such as mines or quarries, or long hours in sweatshop conditions obviously place their health in serious jeopardy. There is little doubt about the wretchedness of children engaging in such activities even though it is difficult to accumulate evidence on the health effects, in part because such child labour is usually illegal. However, the vast majority of child work does not take these forms but comprises agricultural work, usually within a family context. The best available estimate is that 70 per cent of all child workers worldwide are in the agricultural sector (Ashagrie, 1998, Table 3). The health consequences of such work are not obvious. On the one hand, the toll of heavy labour on young bodies, use of dangerous tools and machinery, contact with fertilizers and pesticides, shear exhaustion and, in the long term, forgone schooling, may all impact negatively on health. There is some evidence from the Philippines that children working on family farms experience health problems as a result of exposure to infection, heavy lifting and lack of protective clothing (IPEC, 1997). Even in the United States, work-related deaths of young workers are highest in agriculture (Bureau of Labor Statistics, 2000). On the other hand, work in the open air under the supervision of parents might not be considered a particularly unhealthy environment. In addition, in very poor societies, the produce of the child’s work may be crucial to the maintenance of its own sustenance and health. 3. If there are significant negative effects of child work, including agricultural work, on health, then policies that reduce children’s work activity offer greater benefits and the case for such policies is strengthened. In the instance that economic circumstances and/or the structure of society make it extremely difficult to reduce child work, programmes to protect the health of child workers need to be considered. It is then important to know the types, intensity and duration of child work that are most damaging to health. The ILO desires better evidence on the health consequences of different types of child work in order to identify hazardous work, make effective its prohibition and offer rehabilitation to children withdrawn from such activities (ILO, 2002, p.12). If the health effects of the bulk of child economic activity – agricultural work – turn out to be modest, then policy should focus on other dimensions of the child labour problem, such as the implications for schooling. 4. While the health consequences of child work are largely unknown and deserving of empirical investigation, this is not an easy task. Work activity and health are jointly
2 All children aged 5-17 working (a) in mining or construction sectors or (b) in occupations or processes considered hazardous by their nature or (c) more than 43 hours per week are considered by the ILO to be engaged in hazardous work.
2 HEALTH EFFECTS OF CHILDREN’S WORK: EVIDENCE FROM
VIETNAM
determined. This is particularly true in poor countries and even more so among children in poor countries. Endogeneity may arise through common unobservables e.g. genetic health endowments and preferences, which influence both health and decisions to work. In addition, a two-way causal relationship might operate. While work conditions and experiences can impact on health, a sick child is simply incapable of work. Such endogeneity is suggested by simple descriptives that often show working children to be in better health than their non-working counterparts (Cigno, Rosati and Tzannatos, 2000; O’Donnell, Rosati and van Doorslaer, 2002, Table 1). 5. The purpose of this paper is to identify whether, in a rural setting, work in childhood does impact negatively on health, controlling for observable and unobservable confounding factors. This is the first attempt to move beyond a simple description of the child work–health relationship and to unravel its causal nature. This is made possible by the use a particularly rich two-wave panel data set – the 1992/3 and 1997/8 Vietnam Living Standards Surveys. The panel nature of the data and the availability of good instruments makes it possible to correct for potential endogeneity arising from both unobservable heterogeneity and simultaneity. Instruments for child work include small area labour market and education opportunities obtained from community surveys matched to individual records. For part of the analysis, a household level instrument – land holdings – is also used. A variety of estimators and identification strategies are employed. Three indicators of health – the body mass index, reported illness/injury and height growth – are examined. This allows us to test for varying degrees to which work may impact on health and to distingush between contemporaneous and longer-term effects. 6. The paper is structured as follows. In the next section, we identify the mechanisms through which child work is hypothesised to impact on health, we consider the problem of empirically testing such hypotheses and we review the rather limited existing evidence. In subsequent sections, we discuss the Vietnamese context and the dataset, the econometric specification and the results. In the conclusion we state the main findings, trace their policy implications and draw attention to some caveats.
3 UCW WORKING PAPER SERIES, APRIL 2003
2. CHILD WORK AND HEALTH: HYPOTHESES AND EMPIRICS
2.1 Hypotheses 7. Occupational hazards jeopardise the health of workers. Health risks faced by working children may be greater than those confronted by their adult counterparts. Physiological and psychological immaturity and the biological process of growth may leave children more vulnerable to abuse and to given health risks. Children are known to be more prone to injury through accidents and have been found to be more sensitive to noise, heat, lead and silica toxicity, and ionising radiation (Bequele and Myers, 1995; Forastieri, 1997; ILO, 1998; Fassa et al, 2000). The physical strain of work on growing bones and joints can lead to stunting and spinal injury (ILO, 2002, p.12). All these risks are increased for poorly fed children, whose physiology has already been weakened through malnourishment (ibid). 8. Child work tends to be concentrated in particularly dangerous industries. Agriculture, the dominant sector of child employment, is an industry with a very poor record of safety, with 1 in 8 child workers suffering illness or injury (Ashagrie, 1998, Table 6). A child working on a farm is exposed to dangerous tools and machinery, to chemicals, to water, soil and animal borne infection, to heavy lifting and poor posture, as well as to heatstroke and shear exhaustion. Fewer children are employed in the transport, construction and mining industries - 6.6% of all child workers (ibid) - but these industries have extremely poor records of child worker safety - illness/injury rates of 1/6 to 1/4 (ibid). The substantial number of children worldwide working in domestic services and the sex industry - 6.5% of all child workers (ibid)- face threats to their physical and psychological health through abusive treatment by employers and clients. 9. The difficulty of regulating child work environments that are invariably informal, small scale and illegal further raises the health risks faced by child workers (Fassa et al, 2000). Protective clothing, safety devices and minimum exposure levels, if available or enforced, are unlikely to be designed for children. Most child work is undertaken within the family unit. Perhaps surprisingly, this setting generally accounts for a disproportionately high percentage of all working children with health problems (O’Donnell et al, 2002). This relationship may reflect a number of confounding factors but, at a minimum, it suggests that the assertion that work within the family unit is innocuous with respect to child health requires empirical verification. 10. While child work has the potential to jeopardise health through occupational hazards, it may also have a beneficial effect through household income. In conditions of extreme poverty, a child’s labour can make an important contribution to the household’s living standards, which are known to be important determinants of health (Steckel, 1995; Appleton and Song, 1999; Smith 1999). At the household level, the proposition that child work has a positive impact on living standards is plausible, provided we rule out cases of abusive parents using their offspring to substitute for their own labour, which is not a convincing explanation of child labour as a widespread phenomenon (Basu, 1999). At the aggregate level, we should perhaps be more sceptical of the argument that child work raises living standards and consequently health. A large supply of child labour can be expected to reduce market wages and may leave the economy at a low level equilibrium with low wages, low education levels and poor health (Basu, 1999).
4 HEALTH EFFECTS OF CHILDREN’S WORK: EVIDENCE FROM
VIETNAM
11. While many of the health risks of child work threaten immediate damage to health, others are likely to develop over many years and might only become manifest in adulthood. Exposures to pesticides, chemicals, dusts and carcinogenic agents increase the risks of developing bronchial complaints, cancers and a wide variety of diseases (Forastieri, 1997; ILO, 1998; Fassa et al, 2000). Individuals working in childhood are doubly vulnerable to chronic health problems – they are exposed to risk factors for longer periods and the biological process of rapid cell growth reduces the latency period of some diseases (Fassa et al, 2000). 12. Child work may also have a long-term, indirect impact on health through forgone education. Lower educational attainment means less human capital, which can impact negatively on health both through lifetime earnings and knowledge of health production mechanisms (Grossman, 1972; Schultz, 1984). In a rigid system under which the child either goes to school or work, the latter must be at the expense of the former. It is more usual to find children combining work with school, although there is substantial variation across continents and countries (Patrinos and Psacharopoulos, 1995; Akabayashi and Psacharopoulos, 1999; Anker, 2000; Cigno and Rosati, 2001; Heady, 2001). Evidence on the trade-off between child work and schooling is mixed but, on balance, supports the crowding-out hypothesis (Rosenzweig and Evenson, 1977; Psacharopoulos, 1997; Grootaert and Patrinos, 1998; Cigno and Rosati, 2001). In addition, there is some evidence that child work is not only at the expense of time in the classroom but also educational achievement, as measured by test scores (Akabayashi and Psacharopoulos, 1999; Heady, 2001). So, the proposition of an indirect effect of child work on health, operating through forgone education, does appear to be well founded.
2.2 Empirics 13. We have identified three principal mechanisms through which child work may impact on health – occupational hazards, forgone education and household income. It is rather easier to hypothesise these pathways than it is to establish their empirical validity and significance. Observation of illness/injury prevalence rates among working children, as was made in the previous sub-section, does not constitute evidence on the health effects of child work. What is needed is some form of controlled comparison between the health of working and non-working children. Control needs to be made not only for observable confounding factors but also for correlation through unobservables. Both child work activity and health, at least to some extent, are the result of household decisions and reflect unobservable determinants of those decisions, such as health endowments and preferences. These common unobservables induce statistical association between the variables of interest even in the absence of causal relationships. 14. Bias may also arise from simultaneity. A child that experiences a severe negative shock to its health is simply not able to work. The health shock may itself derive from a workplace accident or the accumulated effect of past work experience. In such cases, the contemporaneous correlation between child work and health reveals little of the true impact of the former on the latter. Longitudinal, or at least retrospective, data are required to uncover the long-term health consequences of child work activity. 15. Unobservable heterogeneity, simultaneity and relationships that operate with lags combine to make the unravelling of the causal impact of child work on health a difficult empirical exercise. This is the first study that attempts to taken account of all of these complications.
5 UCW WORKING PAPER SERIES, APRIL 2003
16. One study in a rural region of India examined the growth of 410 boys from the age of 5 and below over 17 years into early adulthood (Satyanarayanan et al, 1986). Boys working for wages in agriculture, small-scale industry and services between the ages of 10-14 years were found to grow up shorter and lighter than those who attended school. But, with the exception of standardisation on nutritional status at the beginning of the observation period, no control was made for confounding factors, such as household income, that could be expected to influence both work and growth experiences. In rural Ghana, a study found no growth differences between children enrolled and not enrolled in school but did find that the latter group suffered greater morbidity of a nature apparently related to occupation specific hazards (Fentiman et al, 2001). Again, beyond age and sex, there was no control for observable or unobservable confounding factors. 17. There is some evidence from Brazil of a negative correlation between child work activity and health in adulthood (Kassouf et al, 2001; Guiffrida et al, 2001). Kassouf et al, using data covering both urban and rural areas, find an individual is more likely to report poor health in adulthood, the lower the age of entry into the labour force. Controlling for education, the correlation is weakened but remains significant for some age and sex groups. This is suggestive of an effect of child work on adult health, in part operating through forgone education, although the limited control for covariates makes it difficult to draw firm conclusions. Guiffrida et al, using a representative sample of the whole of Brazil, find that, controlling for age, education, wealth, housing conditions, unemployment status and race, entry into the labour force at or below the age of 9 has a statistically significant and substantial negative effect on health in adulthood. Given the inclusion of so many control variables, the result is highly suggestive of a negative effect of child work on adult health. But one should be hesitant about drawing such a causal inference given the lack of control for unobservable heterogeneity. It is not possible to rule out the possibility that unobservable characteristics of the individual raise the probability of working in childhood and reduce health in adulthood.
6 HEALTH EFFECTS OF CHILDREN’S WORK: EVIDENCE FROM
VIETNAM
3. DATA AND DESCRIPTIVES 18. In order to test for a causal impact of child work on health, accounting for endogeneity and the potentially lagged nature of the relationship, one needs a dataset with a longitudinal dimension and, preferably, good instruments for child work. For these reasons, we choose the Vietnam Living Standards Survey; a two-wave panel conducted in 1992-93 and again in 1997-98. This contains detailed information on work activity for all household members aged 6 and above, as well as self-reported and anthropometric indicators of health. Cluster sampling by communes was adopted and then exploited by conducting commune level surveys and matching these to the household survey records. Consequently, we have rich information on community level determinants of health, such as the availability and nature of health services, as well as potential instruments for child work in the form of conditions in the local labour market and the availability and quality of schools. In addition to these data advantages, Vietnam offers an interesting context. Child work activity is substantial and exhibited a significant decline between the two waves of the survey, which span a period of transition to a market economy and rapid economic growth (World Bank, 2000). 19. We define a child by the ages 6-15 years and work as unpaid work on the household farm or business and/or paid work outside of the household at any time in the past 12 months. According to this definition, the proportion of children working in Vietnam fell from roughly a third in 1993 to a quarter in 1998 (Table 1). This decline can be explained, primarily, by the impressive improvement in living standards that Vietnamese households have experienced (Edmonds, 2001; Edmonds and Turk, 2001). Work participation is very strongly correlated with age. In 1998, one in ten children aged 6-11 years were working but almost one in two kids aged 12-15 years were working (Table 1). The figures in Table 1 indicate little or no difference between the proportion of boys and of girls who are working but this understates gender differences in work activity since household chores, a more prevalent activity for girls, are not included in our definition of work. The exclusion is purposeful. We wish to reduce the heterogeneity of work captured by a binary indicator of participation and avoid dilution of any health effect through inclusion of work likely to be least threatening to health.3 To completely ignore household chores would, however, be ill advised since the distinction between work in the household business or farm and household chores is often arbitrary. We experimented with a separate dummy to indicate engagement in household chores for at least 7 hours per week but never found this to be significant.
Table 1: Work participation rates of children 6-15 years, Vietnam 1993 and 1998
20. Child work is much more prevalent in rural areas and the rate of decrease has been greater in the cities, such that, by 1998, the participation rate was more than four times greater in rural than in urban areas (Table 1). In the remainder of the analysis, we concentrate on the rural areas. This is, in part, driven by a desire to provide evidence on the health effects of the most common form of child work – household based agricultural work – but also by a data constraint. Commune level surveys where
3 There is also a pragmatic reason for the omission. The data on household chores refers only to the previous 7 days (not 12 months).
7 UCW WORKING PAPER SERIES, APRIL 2003
not conducted in urban areas, leaving us without instruments for child work in that part of the sample. Given most of the population is in rural areas and child work participation is much higher in these areas, our analysis covers the vast majority of child work that is undertaken in Vietnam.4 21. In Vietnam, as in most other countries, child work is predominantly agricultural within the household unit. Over 90% of all child workers, across both urban and rural sectors, were engaged in this form of activity in 1998 and, as would be expected, the predominance is even greater in rural areas (93% of total - Table 2). Such homogeneity allows us to focus attention on a single dummy for work participation and make limited control for variation in the type of work. Work for a household business is the second most popular form of child work. Relatively few – 6.5% – of rural child workers in 1998 were working for pay outside the household (Table 2). The domination of household agricultural among child work activity is mainly a reflection of the general structure of the Vietnamese economy but is also the outcome of legislation and cultural factors. As an early signatory to the International Convention on the Rights of the Child (1990) and the ILO Convention on the Worst forms of Child Labour (2000), Vietnam has enacted a series of legislation that restricts the conditions under which a child, at various ages, can work (Edmonds and Turk, 2001). In law, opportunities for a child to work outside of the household unit are more constrained than work on behalf of the household. The latter is legal provided it is not “harmful, dangerous or exploitative” (ibid, p. 15). Child work on behalf of the household has deep cultural roots and is often considered to have positive effects on the development of the child.
Table 2: Type, intensity and duration of children's work, Vietnam 1993 & 1998
22. A majority of working kids in Vietnam also attend school, the percentage doing so increasing from 60% in 1993 to over 70% in 1998 (Table 2). The large overlap between work and school reflects the predominance of household agricultural work - school enrolment rates are much lower among children doing paid work outside the household - and the fact that compulsory school hours are rather low (Edmonds and Turk, 2001). Although there are no tuition fees for primary education, other school costs are relatively high and represent an important constraint on a poor household’s decision to send a child to school (ibid). 23. Amongst rural working children, the average number of hours worked was around 17 hours per week in 1998 (Table 2). The fall in average hours shown in the table most probably understates the magnitude of the real decline due to an inconsistency between waves in the way hours are measured. The average time a working child has spent in its current main form of employment is around 2 years (Table 2). 24. We examine three indicators of health: height growth; body mass index (weight divided by the square of height); and, reported illness or injury. There is much evidence to support anthropometrics as good indicators of ill health and survival
4 With the exception of IV estimation, all the analysis reported in the paper has been duplicated for an urban sample but we do not report the results for reasons of space and those given in the text. The only significant result to emerge for the urban sample is that propensity to illness is positively correlated with current work status, controlling for many observablesand unobservable heterogeneity through a fixed effects logit estimator. This suggests a negative contemporaneous effect of child work on health in urban settings, although the sample is rather limited in size.

8 HEALTH EFFECTS OF CHILDREN’S WORK: EVIDENCE FROM
VIETNAM
probability (Waterlow et al, 1977; Martorell and Ho, 1984; Waaler, 1984; Fogel, 1993; de Onis and Habicht, 1996; World Health Organisation, 1995). We use height growth as an indicator of long-term health experience and the body mass index (BMI) as an indicator of short-term health and nutritional status. An impact of work on current height is implausible but it is possible that work induced illness and disease might impede the subsequent growth of the child. The nature of the contemporaneous relationship between child work and health is examined through BMI. While anthropometric indicators have the advantage of being objective, they tend to be more closely correlated with health at younger ages and also might be rather insensitive to some work related health problems, such as injury. For these reasons, we also examine the relation of child work to reported illness and/or injury. 25. Anthropometric indicators show marked improvements in the average health status of Vietnamese children between 1993 and 1998. In 1993, the mean height-for-age z-score of rural children was just less than –2 (Table 3), a conventional threshold used to define stunted growth attributable to long term malnourishment. 5 By 1998, the mean z-score for this population had increased to –1.7. The BMI tells the same story, only the across time differences are less marked. A binary indicator of reported illness or injury in the previous 4 weeks gives a different picture - apparently, rates of reported morbidity have increased over time. This increase is almost certainly attributable to a change in the questionnaire. In the first wave, individuals were asked whether they had experienced any illness or injury in the previous 4 weeks and were given a few examples of conditions that would be considered as illness. In the second wave, respondents were asked explicitly whether they had experienced each one of nine illnesses and/or an injury in the previous 4 weeks. There is good evidence that individuals are more likely to report illness when prompted to report specific conditions (Kooiker, 1995).
Table 3: Health indicators by work status, rural Vietnam 1993-98
26. Height-for-age z-scores, which make some control for age, show working children, on average, to be smaller (Table 3). Body mass scores are higher for working children but this comparison is limited by the positive correlation of both body mass and work status with age. In neither year is there a statistically significant difference in the rate of reported morbidity between working and non-working children, although the point estimates, particularly in 1998, show greater reported morbidity amongst non-working children. 27. Both child work status and health status are strongly correlated with living standards. Child work participation falls as household consumption per capita rises, such that participation amongst the poorest quintile of children was more than twice that of the richest quintile in 1998 (Table 4). Height-for-age z-scores and BMI both rise with consumption quintile, with some increase in the disparities over time (Table 4). Living standards related inequality is less apparent in the distribution of reported morbidity.
5 A z-score is a child’s height (or weight) expressed as a number of standard deviations below or above the mean height of children of the same age and gender in a well nourished population. The reference population used here is the (WHO recommended) US population.

9 UCW WORKING PAPER SERIES, APRIL 2003
Table 4: Work and health by household consumption quintile, rural Vietnam 1993 & 1998
28. It is clear that the simple bivariate relationship between child work and health reflects the confounding effects of a number of observable and unobservable factors and that a carefully specified econometric model is required in order to unravel the causal nature of the relationship. We now turn to this task.
10 HEALTH EFFECTS OF CHILDREN’S WORK: EVIDENCE FROM
VIETNAM
4. ECONOMETRIC SPECIFICATION
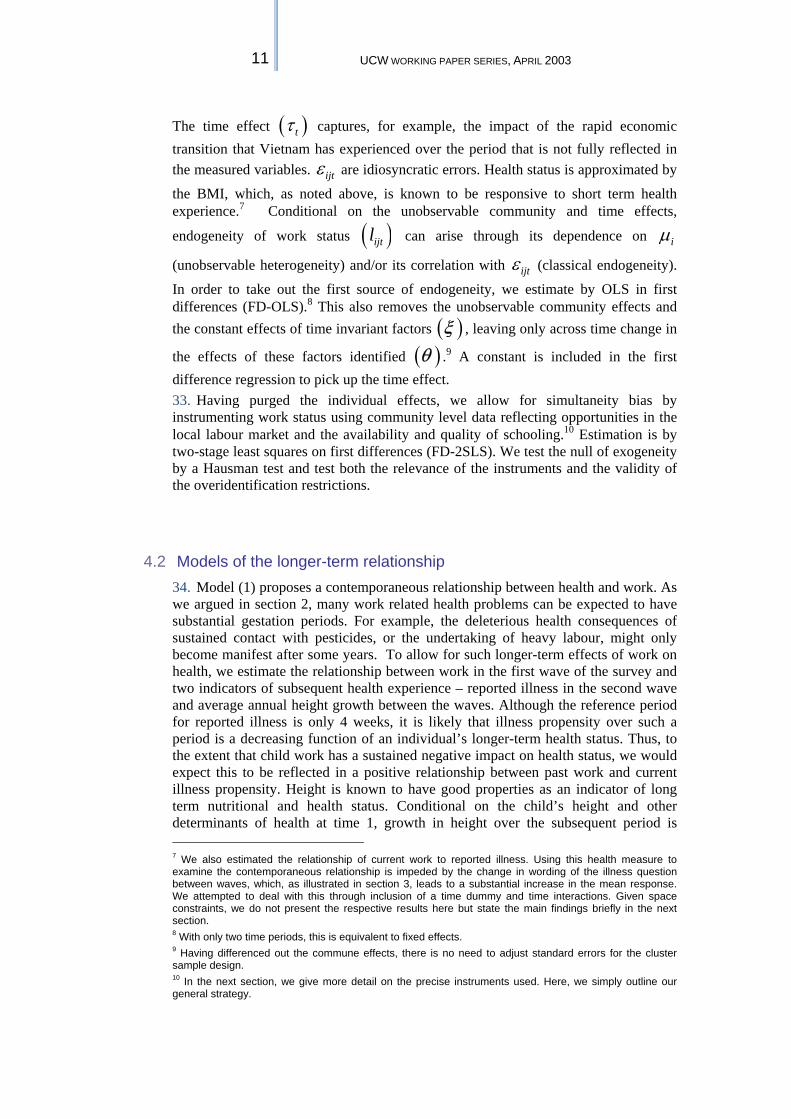
4.1 Model of contemporaneous relationship 29. We wish to identify the impact of child work on health, which may materialise in the short and/or longer term. Consider first the contemporaneous relationship. The main statistical issue is endogeneity, which may arise from both unobservable heterogeneity and simultaneity. In this context, unobservable heterogeneity refers to the joint dependence of both measured (transient) health and work activity on unobservable (permanent) health endowments and preferences. Assuming health is positively associated with labour market productivity, ceteris paribus, the inherently healthiest individuals are most likely to be available for employment and to be appointed. This healthy worker selection effect would tend to induce a positive statistical relationship between child health and work status. Other sources of unobservable heterogeneity may bias the relationship in the opposite direction. The more altruistic are parents vis-à-vis their child, the more they will invest in the health of the child and strive to keep it from working. Such a preference effect would create a negative statistical relationship between child health and work status. Simply regressing health outcomes on health inputs, such as work time, will not render unbiased estimates of the causal impact of the latter since both the inputs and the outcomes reflect the value of the unobservable health endowments and preferences. 30. Endogeneity can also arise through reverse causality - current work activity depends directly on the individual’s transient state of health. A temporary bout of illness (negative health shock) can leave the individual incapable of work for a period of time. Such simultaneity would induce a positive correlation between health and work status. We follow a variety of estimation and identification strategies in order to avoid or deal with the problems of unobservable heterogeneity and simultaneity. 31. Estimation of the contemporaneous relationship between health and work is based on the following empirical model of health determination,
( )ijt ijt ijt ij t ij jt t j i ijth l T= + + + + + + + +α τ λ µ εX V V Zβ ξ θ δ (1)
32. where ijth is health status of child i belonging to community j at time t, ijtl is a
binary indicator of work status, ijtX and ijV time varying and constant vectors of
health determinants defined at the individual / household level, jtZ is a vector of
time varying community level factors and tT is a time dummy.6 Individual specific
effects ( )iµ represent unobservable heterogeneity in health endowments and
preferences. Community effects ( )jλ capture unmeasured health determinants that
vary across location but not time, such as climate, infrastructure and public hygiene. 6 In the application, we also allow for time interactions with some of the time varying regressors but do not make this explicit in (1) to avoid too much clutter.
11 UCW WORKING PAPER SERIES, APRIL 2003
The time effect ( )tτ captures, for example, the impact of the rapid economic transition that Vietnam has experienced over the period that is not fully reflected in the measured variables. ijtε are idiosyncratic errors. Health status is approximated by
the BMI, which, as noted above, is known to be responsive to short term health experience.7 Conditional on the unobservable community and time effects,
endogeneity of work status ( )ijtl can arise through its dependence on iµ
(unobservable heterogeneity) and/or its correlation with ijtε (classical endogeneity).
In order to take out the first source of endogeneity, we estimate by OLS in first differences (FD-OLS).8 This also removes the unobservable community effects and the constant effects of time invariant factors ( )ξ , leaving only across time change in
the effects of these factors identified ( )θ .9 A constant is included in the first difference regression to pick up the time effect. 33. Having purged the individual effects, we allow for simultaneity bias by instrumenting work status using community level data reflecting opportunities in the local labour market and the availability and quality of schooling.10 Estimation is by two-stage least squares on first differences (FD-2SLS). We test the null of exogeneity by a Hausman test and test both the relevance of the instruments and the validity of the overidentification restrictions.
4.2 Models of the longer-term relationship 34. Model (1) proposes a contemporaneous relationship between health and work. As we argued in section 2, many work related health problems can be expected to have substantial gestation periods. For example, the deleterious health consequences of sustained contact with pesticides, or the undertaking of heavy labour, might only become manifest after some years. To allow for such longer-term effects of work on health, we estimate the relationship between work in the first wave of the survey and two indicators of subsequent health experience – reported illness in the second wave and average annual height growth between the waves. Although the reference period for reported illness is only 4 weeks, it is likely that illness propensity over such a period is a decreasing function of an individual’s longer-term health status. Thus, to the extent that child work has a sustained negative impact on health status, we would expect this to be reflected in a positive relationship between past work and current illness propensity. Height is known to have good properties as an indicator of long term nutritional and health status. Conditional on the child’s height and other determinants of health at time 1, growth in height over the subsequent period is 7 We also estimated the relationship of current work to reported illness. Using this health measure to examine the contemporaneous relationship is impeded by the change in wording of the illness question between waves, which, as illustrated in section 3, leads to a substantial increase in the mean response. We attempted to deal with this through inclusion of a time dummy and time interactions. Given space constraints, we do not present the respective results here but state the main findings briefly in the next section. 8 With only two time periods, this is equivalent to fixed effects. 9 Having differenced out the commune effects, there is no need to adjust standard errors for the cluster sample design. 10 In the next section, we give more detail on the precise instruments used. Here, we simply outline our general strategy.
12 HEALTH EFFECTS OF CHILDREN’S WORK: EVIDENCE FROM
VIETNAM
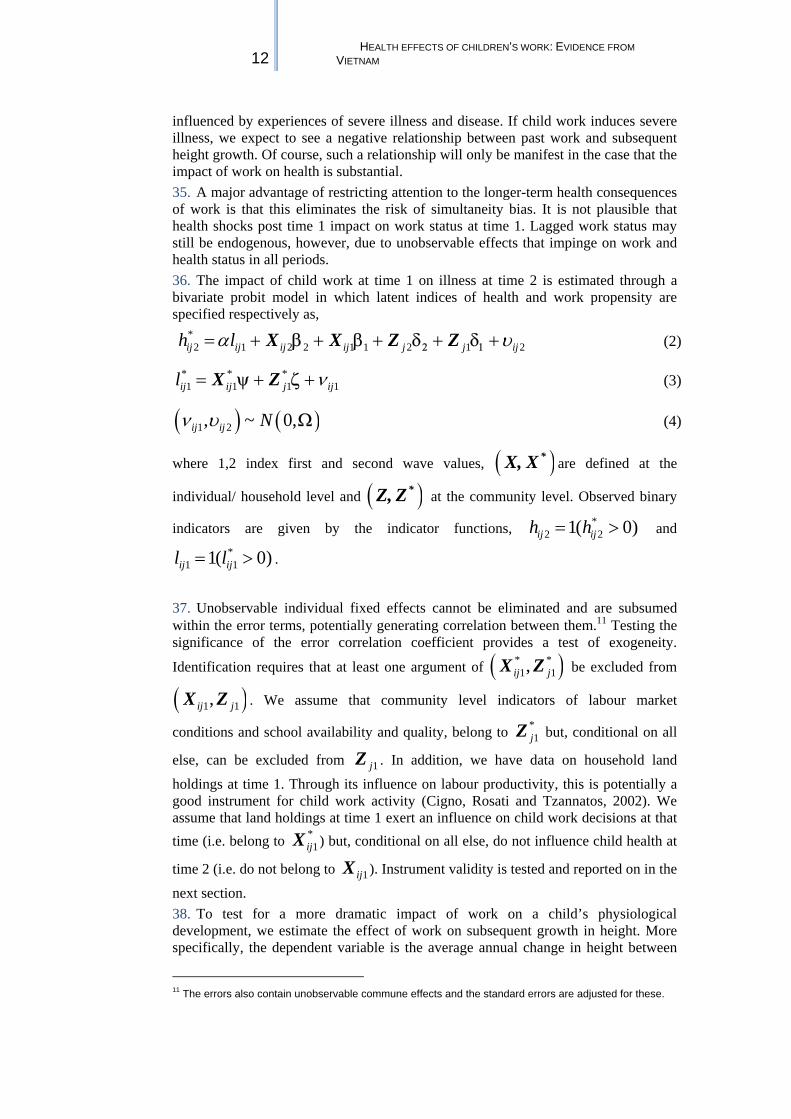
influenced by experiences of severe illness and disease. If child work induces severe illness, we expect to see a negative relationship between past work and subsequent height growth. Of course, such a relationship will only be manifest in the case that the impact of work on health is substantial. 35. A major advantage of restricting attention to the longer-term health consequences of work is that this eliminates the risk of simultaneity bias. It is not plausible that health shocks post time 1 impact on work status at time 1. Lagged work status may still be endogenous, however, due to unobservable effects that impinge on work and health status in all periods. 36. The impact of child work at time 1 on illness at time 2 is estimated through a bivariate probit model in which latent indices of health and work propensity are specified respectively as,
*2 1 2 2 1 1 2 1 2ij ij ij ij j j ijh lα υ= + + + + +2 1β β δ δX X Z Z (2)
* * *1 1 1 1ij ij j ijl ν= + +ψ ζX Z (3)
( ) ( )1 2, ~ 0,ij ij Nν υ Ω (4)
where 1,2 index first and second wave values, ( )*X, X are defined at the
individual/ household level and ( )*Z, Z at the community level. Observed binary
indicators are given by the indicator functions, *2 21( 0)ij ijh h= > and
*1 11( 0)ij ijl l= > .
37. Unobservable individual fixed effects cannot be eliminated and are subsumed within the error terms, potentially generating correlation between them.11 Testing the significance of the error correlation coefficient provides a test of exogeneity.
Identification requires that at least one argument of ( )* *1 1,ij jX Z be excluded from
( )1 1,ij jX Z . We assume that community level indicators of labour market
conditions and school availability and quality, belong to *1jZ but, conditional on all
else, can be excluded from 1jZ . In addition, we have data on household land
holdings at time 1. Through its influence on labour productivity, this is potentially a good instrument for child work activity (Cigno, Rosati and Tzannatos, 2002). We assume that land holdings at time 1 exert an influence on child work decisions at that time (i.e. belong to *
1ijX ) but, conditional on all else, do not influence child health at
time 2 (i.e. do not belong to 1ijX ). Instrument validity is tested and reported on in the
next section. 38. To test for a more dramatic impact of work on a child’s physiological development, we estimate the effect of work on subsequent growth in height. More specifically, the dependent variable is the average annual change in height between
11 The errors also contain unobservable commune effects and the standard errors are adjusted for these.
13 UCW WORKING PAPER SERIES, APRIL 2003
survey waves, denoted by ijh∆ . This is specified to be a function of initial work
status ( )1ijl and other determinants, as follows,
1 1 1 1 2 1ij ij ij ij ij ij ij ijh l hα θ β β ε∆ = + + + ∆ + + ∆ +X X Z Zδ δ (5)
where, again, X and Z regressors defined at the individual/household and community level respectively and ∆ indicates across wave differences.12 We
condition on initial height ( )1ijh since the growth potential of a child depends upon
its current height. The error term will include any unobservable individual specific permanent factors that govern potential growth at every point in time. Endogeneity is a problem in the instance that these factors are correlated with other unobservable determinants of initial work status and/or height. Such correlation is probably smaller than that between unobservable determinants of work status and the level of height but it cannot be ruled out. Consequently, we complete the model with equations for initial work status and height as follows,
( )* * * *1 1 1 1 1 1 1, 1 0ij ij ij j ij ij ijl h l lγ ν= + + + = ≥ψ ζX Z (6)
** **1 1 1 1ij ij j ijh υ= +X ξ + Ζ ς . (7)
39. According to this specification, the child’s height influences work decisions but height, as seems reasonable, is assumed to be unresponsive to current work status. 40. The model given by (5)-(7) is recursive. If the errors covariance matrix were diagonal, estimation of (5) in isolation by OLS would be consistent and efficient. But since we fear that the cross-equation errors may be correlated through unobservable heterogeneity, we consider two alternative estimators. First, since the model is recursive, seemingly unrelated regression (SUR) would be consistent and efficient if all dependent variables had been continuous (Lahiri and Schmidt, 1978). It is not clear how SUR estimates of the equation of central interest (5) will be affected by the binary nature of the dependent variable in one of the other equations in the system (6). Given this, we also estimate equation (5) by 2SLS, using the same general identification strategy as that outlined for the bivariate probit on reported illness and work status.
12 To begin with, we allow height growth to depend upon both the initial values and the change in all variables and then impose restrictions that appear to be supported by the data.
14 HEALTH EFFECTS OF CHILDREN’S WORK: EVIDENCE FROM
VIETNAM
5. RESULTS
5.1 Empirical specification
41. To recap, we examine the relationship of health to both current and past child work activity. For the contemporaneous relationship, the indicator of health is the body mass index (BMI). Estimation is by pooled OLS that takes no account of endogeneity, FD-OLS to purge unobservable heterogeneity bias and FD-2SLS to take care of both unobservable heterogeneity and simultaneity. For the longer-term relationship, the health proxies are reported illness and the average annual change in height between the survey waves (growth). Simultaneity is not an issue in this case but we allow for unobservable heterogeneity by estimating a bivariate probit model for binary illness and by using SUR and 2SLS estimators for height growth. 42. Definitions and descriptive statistics for all the regressors are provided in the Appendix - Tables A1 and A2. A major strength of the analysis is that we control for a multitude of health determinants at the individual, household and commune level. Individual level regressors are basic demographics (age, gender and minority), entered in a suitably flexible form. Indicators of school attendance and attainment are purposefully left out of the empirical specification since we wish to avoid having to deal with yet another potentially endogenous regressor. This means that the estimated effect of child work on health includes any indirect effect operating through schooling. We expect the contemporaneous effect of schooling on health during childhood to be negligible. In the longer-term, an indirect schooling effect is more plausible but the 5-year period we examine, spanning into early adulthood for only part of the sample, is unlikely to be sufficient to pick up much of the impact that education has on health. 43. At the household level, we include the age specific household composition, the (log) value of household consumption per capita (hhold_exp), the (log) quantity of rice consumption per capita (hhold_rice), mother’s age and education (mum_age, mum_diploma) and indicators of housing conditions (safedrink, sanitation, house_walls). By controlling for household consumption, we take out any (positive) indirect effect that child work has on health through the contribution to household living standards. Identification of this effect would require estimation of a structural model of the joint determination of child health, work and household consumption. With a suitably rich data set, this might be feasible but it is beyond the ambition of this paper, which is to determine whether child work has any negative impact on health. In the case that the data support such an impact, we need to bear in mind that it may be countered, at least in part, by an indirect effect of child work on health operating through household resources. Potential endogeneity of household consumption arising from unobservable heterogeneity is taken care of by our first difference estimators. To the extent that household expenditures respond to episodes of child ill health, simultaneity may also be a problem. On top of all else, we do not attempt to instrument household consumption. 44. At the commune level, we include a range of indicators of available health facilities and services, as well as the general infrastructure of the commune (see Table A1). Commune level indicators of labour market and schooling conditions are used as instruments for child work. The local demand for and returns to labour are expected to have an important influence on decisions to put a child to work. Likewise, the availability and quality of schooling are important determinants of child work

15 UCW WORKING PAPER SERIES, APRIL 2003
activity. Standard errors are made robust to heteroskedasticity and are adjusted for clustering at the commune level, unless commune effects are not differenced out. 45. For each dependent variable, we test down from a very general specification, sequentially removing variables of low significance, to arrive at the most appropriate empirical specification. Different health-work relationships by age and gender were tested for but never found significant and are omitted. Rather than present the coefficients on all regressors for a number of different models and estimators, we present only those of central interest - the work coefficients- along with model diagnostics.13
5.2 Contemporaneous relationships 46. Estimates of the contemporaneous relationship between children’s work status and their body mass are presented in Tables 5. Pooled OLS estimates, based on observations aged 6-15 years in either wave, show a clear, significantly positive relationship between child work participation and BMI. Suspicion that this reflects selection of the stronger kids into work is confirmed by the FD-OLS results, which show no significant relationship between child work status and BMI. The first difference estimates are derived from a sample aged 6-15 years in the first wave, still present, but possibly older than 15 years, in the second wave. Since we are interested in the relationship between work in childhood and health, we include a dummy to indicate that the observation is a child (6-15 years) and interact this with the work dummy. The sum of the coefficient on the work dummy and that on the work-child interaction gives the estimated difference in BMI between working and non-working children. This is the estimate we present in the table.
Table 5: Body mass index against current child work activity
47. We test for differential effects by type and duration of work by including, in addition to the dummy indicating any work, a dummy to indicate participation in paid work outside of the household and the number of months in the current job. All three variables are interacted with the child dummy. The insignificance of the coefficient labelled “child in work” suggests there is no significant difference in BMI between a child in unpaid, household-based work and a non-working child. The positive coefficient labelled “child in paid work” suggests that, after controlling for selection through unobservables, a child in paid work has a significantly greater BMI than a non-working child. The length of time the child has been working appears unrelated to its body mass. 48. The FD-OLS estimator takes care of endogeneity arising from unobservable heterogeneity but not simultaneity bias and so we proceed to FD-2SLS. Commune level indicators of labour market conditions and school quality provide instruments. Specifically, we use the commune relative price of rice (rice_price), which Edmonds and Pavcnik (2002), using the same data, find is a significant and substantial determinant of child work activity in Vietnam. In fact, they estimate that the rise in rice price, as a result of market liberalisation, was a major factor contributing to the 13 Full results are available from the authors.

16 HEALTH EFFECTS OF CHILDREN’S WORK: EVIDENCE FROM
VIETNAM
fall in child work activity between 1993 and 1998. The demand for labour in the commune is proxied through indicators of work related migration to and from the commune (emigration, migrants). Our final instrument is a proxy for such quality – the year in which the commune primary school was built (school_year). All five of the instruments are interacted with the child dummy, since work is interacted with this dummy in the illness equation. The relevance of these instruments to child work decisions is confirmed by significant rejection of their exclusion from the reduced form work regression (see Table 5). The identification restriction is that, conditional on all else including work itself; the instruments are not relevant determinants of illness. The validity of this assumption is not rejected by an overidentification test (see Table 5; Wooldridge, 2002, pp.122-4). 49. Conditional on the elimination of unobservable heterogeneity through first differencing, the Hausman test indicates rejection of the exogeneity of work status. Comparing the FD-OLS and FD-2SLS coefficients, we see that instrumentation strengthens the negative work effect and brings it to the margins of significance. This is the direction of change we would expect in the presence of simultaneity bias. Controlling for selection of the inherently more healthy and stronger kids into work and for the disrupting effect of illness, and related loss of strength, on work participation, the FD-2SLS results suggest that work itself has a negative effect on the body mass of the child. To the extent that health is increasing in body mass, this is evidence of a negative effect of work on health. However, the significance of the effect is marginal. In addition, the point estimate is sensitive to the instrument set. There is substantial variation in the magnitude of the coefficient using different sub-groups of the full instrument set.14 The effect is always negative, and greater in magnitude than the FD-OLS estimate, but is significant only when the full set of instruments is used. So, while the FD-2SLS results are consistent with reverse causality biasing the FD-OLS estimate toward zero, one cannot be too confident in the point estimate as an indication of the true effect of child work on body mass. 50. Adding a dummy to indicate paid work outside of the household and job tenure and instrumenting all of the work indicators, we see that the relationship of both unpaid and paid work to BMI is negative. However, the standard errors are very large and nothing approaches significance. The FD-OLS and FD-2SLS estimates of the paid work coefficient differ dramatically, the significant positive relationship under FD-OLS becoming a strong negative but insignificant relationship under FD-2SLS. The scale of the change is rather implausible and most probably reflects the difficulty of estimating the effect from relatively few observations in paid work. Despite the dramatic difference between FD-OLS and FD-2SLS estimates, the null of exogeneity is not rejected in this case. 51. In summary, the results are consistent with our preconceptions about the direction in which endogeneity may bias the estimated relationship between health and child work but, correcting for such bias, there is no robust evidence of a negative impact of child work on current health.15 There is strong evidence of a healthy worker selection effect. All else constant, stronger children are more likely to work and so cross-sectional correlations between child work status and BMI, or other anthropometric
14 We compared the results from instrumenting using rice_price alone, emigration and migrant alone and using school_year alone. In each case, interactions with the child dummy were also included. 15 Using reported illness as the indicator of health status and estimating by fixed effects logit to take out unobservable heterogeneity, there is no significant relationship to current work status. Correcting for both unobservable heterogeneity and simultaneity through linear FD-2SLS, which is not entirely appropriate for the binary dependent variable, we find the illness propensity to be lower for working children, at a 10% level of significance. However, this IV estimate is not robust to variations on the instrument set.
17 UCW WORKING PAPER SERIES, APRIL 2003
indicators of health, can tell us little or nothing about the impact of work on health. This is true even when, as here, one controls for a large number of covariates.
5.3 Longer-term relationships 52. The lack of robustness of the IV estimates reported above may reflect the sheer difficulty of disentangling the contemporaneous relationships between work and health, which are inherently interdependent. Identification of the impact of past work on current health is an easier task; simultaneity can be ruled out leaving unobservable heterogeneity as the only bias one has to deal with. 53. Estimates of the relationship between illness propensity in 1997/98 and child work activity up to five years earlier are presented in Table 6.16 The univariate probit suggests that current illness is positively related to past child work activity (10% significance). To allow for possible bias through unobservable heterogeneity, we turn to the bivariate probit model. Identification requires the exclusion of at least one determinant of work propensity from the illness propensity equation. We again use commune level indicators of labour market conditions (rice_price, emigration, migrants) and school quality. In this case, we have a better indicator of the latter – the pupil-teacher ratio in the secondary school (pupil_teacher).17 An additional, very useful instrument is whether there has been a natural disaster in the commune in the past year (disaster). Such shocks can be expected to influence the demand for labour, including that of children. We assume that, controlling for all else, there are no lasting effects of such disasters on health five years later. In addition to the commune level instruments, we use household holdings of agricultural land (land_any, land_size). There is evidence from India that the amount of land available to the household positively affects child work activity (Rosenzweig and Everson, 1977; Cigno, Rosati and Tzannatos, 2000). This is presumed to operate through a positive effect on the productivity of child workers. Using the same data as we do here, Edmonds and Pavcnik (2002) find that the propensity for a child to work in Vietnam increases slightly if the household has any land but, conditional on this, is decreasing with the size of the land holding. One interpretation of the latter result is that a wealth effect is outweighing a productivity effect. To minimise the risk that land holdings are endogenous, reflecting household decision making, we only count land allocated to households for long-term use by commune officials.18 All instruments are assumed to determine child work at the time of the first survey but, conditional on all else, not to impact on illness 5 years later. We confirm the significance of the instruments in the work equation and check the validity of the identification restrictions by testing the exclusion of each of the instruments from the illness equation under the assumption that the remaining instruments are valid. The exclusion restriction is not rejected in any case. 54. The positive estimated effect of past work activity on illness propensity increases substantially in magnitude and significance in moving from the univariate to bivariate probit. This is consistent with a healthy worker selection effect; the univariate model does not allow for the fact that the inherently more healthy individuals are more likely to have worked in the past. The negative correlation between the work and illness equation error terms is also consistent with selection into work on the basis of
16 Only reported illness in the second wave is used and so the change in the wording of the illness question is not an issue. 17 This could not be used in estimation of the contemporaneous relationships since it is not available in both waves. 18 In1992/93 most land was distributed in this way, land markets not yet having developed
18 HEALTH EFFECTS OF CHILDREN’S WORK: EVIDENCE FROM
VIETNAM
unobserved health endowments. This correlation is significant (5%) indicating superiority of the bivariate over the univariate probit.
Table 6: IIlness/injury against past child work activity
55. The estimates are robust to variations on the identification strategy. Dropping household land holdings from the model and so relying principally on commune level factors for identification, raises the coefficient on work from 0.6495 to 0.7162. The effect remains significant, as does the correlation of the errors. Omitting the commune labour market and education variables, and so relying more on household land holdings, results in a slight fall in the work effect to 0.6204, which is still significant. Commune level health services are included in the work equation since policies that reduce morbidity and mortality might be expected to raise the investment parents make in children and reduce the propensity to put children to work (Cigno, 1998; Cigno, Rosati and Tzannatos, 2000; Cigno, Rosati and Tzannatos, 2002). Omitting these commune level health service variables from the work equation results in a larger fall in the magnitude of the work effect, to 0.5350 (still significant). The estimate is of a similar magnitude if height at time 1 is excluded from both equations, on the grounds that it is potentially endogenous through unobservable heterogeneity in health endowments. We conclude that there is robust evidence that work in childhood raises the probability of illness approximately five years later. This is consistent with studies using Brazilian data that find health in adulthood to be lower, the younger the age at entry to the workforce (Guiffrida et al, 2001; Kassouf et al, 2001). Our evidence is stronger than that from these studies since we correct for unobservable heterogeneity and so rule out the possibility that the relationship is merely a statistical artefact, arising from correlation of both child work and health with common unobservables. 56. Adding past job tenure results in a fall in the magnitude and loss of significance of the work participation effect on illness propensity. The tenure effect itself is significant and non-linear, with illness propensity increasing with time in work up to a period of 29 months. As would perhaps be anticipated, the length of time engaged in child work appears to be a stronger determinant of subsequent illness propensity than participation itself.19 It should be acknowledged that no allowance is made for the potential endogeneity of job tenure. It is assumed that, conditional on past work participation, unobservable influences of current illness are orthogonal to unobservable determinants of past length of time in work.
Table 7: Average annual growth in height against past child work activity
57. In Table 7, we present estimates of the relationship between the average annual growth in height between the two waves of the survey and childhood work status at the beginning of the period. We control for height at the time of the first wave. There is no evidence of any significant relationship between work and subsequent growth,
19 A dummy for paid work had no significant effect.
19 UCW WORKING PAPER SERIES, APRIL 2003
irrespective of the choice of estimator. SUR estimates are little different from those of OLS and the null of independence between the errors is not rejected. Exogeneity of both past work and height is rejected, but only at 10% significance. The work coefficient switches to a negative sign when estimated by 2SLS but it remains insignificantly different from zero. So, while we do find that childhood work raises vulnerability to subsequent illness, it appears that the health impact is not sufficiently strong to impede the growth of the child. This is consistent with the evidence from rural Ghana, referred to above, showing differences in morbidity, but not in growth, between children enrolled and not enrolled in school (Fentiman et al, 2001).
6. CONCLUSION 58. Does agricultural work in childhood have a negative impact on health? The general conclusion emerging from our analysis is that such child work has little or no effect in the short-term but there is evidence of longer-term negative consequences for health. Controlling for a large number of observable determinants of health and for all sources of endogeneity, the body mass of working kids is lower than that of their non-working counterparts but the difference is only marginally significant and it derives from instrumental variables estimates that lack robustness. It would be rash to claim any contemporaneous impact of child work on health on the basis of these results. There is stronger evidence that health determines the selection of children into work. Even controlling for a large range of covariates, the simple cross-section relationship between child work participation and BMI is significantly positive. Differencing out fixed individual, and local, factors the relation weakens and becomes insignificant, suggesting that the initial positive relationship is attributable to selection of the inherently more healthy and stronger children into work. Allowing for simultaneity, through instrumentation, the work effect on BMI even becomes negative and marginally significant. This change is consistent with reverse causality – children that become sick, and weak, are not able to work. 59. In the longer-term, agricultural work in childhood does appear to damage health. Individuals working in childhood are significantly more likely to report illness up to five years later and the illness propensity is increasing with the duration of work. This is true after controlling for an extensive range of individual, household and community level covariates and for common unobservable determinants of past work and current illness. The result is robust to different empirical specifications and identification strategies and is consistent with evidence from Brazil (Guiffrida et al, 2001; Kassouf et al, 2001). While childhood work does appear to lead to future illness, the health impact is not sufficiently large to impede the growth of the child. 60. While it is comforting to learn that health does not appear to be damaged in the short-term by child work in rural areas, the longer-term impact is a cause for concern. There are two general mechanisms through which such a relation may materialise. First, it may be that a child suffers a workplace accident with long-term consequences for health. Second, it may be that there is a latency period in the development of child work related health problems. For example, long-term health problems related to the sustained exposure to chemicals, poor posture or heavy lifting. The finding that illness propensity is increasing with the length of time the child was working in the past is consistent with the latent development of health problems. These findings suggest the ILO is justified in expressing particular concern over extended periods of work by children (ILO, 2002).
20 HEALTH EFFECTS OF CHILDREN’S WORK: EVIDENCE FROM
VIETNAM
61. Some caveats need to be acknowledged. Child work is heterogeneous. So too, one would presume, are its health consequences. In this study, we have deliberately focused on the most common form of child work – household based agriculture. Within the Vietnamese context, there is a good deal of homogeneity in agricultural work – it mostly involves work in rice paddy fields. Such homogeneity is convenient since we can capture most of the variation in work through a simple dummy for work participation. But it does constrain the generalisations that can be drawn from our findings. Evidence needs to be accumulated about the health consequences of different types of child work carried out in rural parts of the Indian sub-continent, Africa and South America. We have already noted the consistency of findings with others from Brazil and Ghana. In addition, we need to know more about the, potentially severe, health effects of various types of child work undertaken in large urban centres.20 62. We have focussed on testing for a negative impact of child work on health. As argued in section 2, if the working child contributes positively to household resources, then, indirectly, there may be a beneficial effect on health. Identification of such an indirect income effect would be far from easy but information as to its magnitude is required in order to advise on the full health consequences of policies that change child work patterns. The health consequences of child work need not be confined to the child worker. There may be an indirect impact on the health of siblings operating through the intra-household allocation of resources. A welfare maximising family unit will direct disproportionate resources to maintaining the nutritional and health status of its productive members (Pitt et al, 1990). Consequently, notwithstanding the impact of health hazards confronted in the workplace, siblings might be expected to experience lower nutritional status and greater morbidity than working children themselves. There is empirical support for this hypothesis. A study in rural Guatemala found that while participation of school-age children in farm production was not associated with a reduction in their own growth and development, younger siblings did experience growth deficits (Immink and Payongayong, 1999). Ralston (1997), with data on calorie intakes from rural Indonesia, found the intra-household calorie allocation to be related to children’s labour contributions. In turn, lower calorie intake was associated with higher levels of morbidity. Unravelling of the causal nature of these relationships, through a joint model of work decisions, intra-household allocation and health, would be very useful for policy formulation.
20 In urban areas of Vietnam, we find that working kids are significantly more likley to report illness than their non-working counterparts (fixed effects logit estimator). Results available on request.
21 UCW WORKING PAPER SERIES, APRIL 2003
REFERENCES Akabayashi, H. and Psacharopoulos, G. 1999. The trade-off between child labour and human capital formation: A Tanzanian case study. The Journal of Development Studies, 35(5): 120-140. Anker, R. 2000. The economics of child labour: A framework for measurement. International Labour Review, 139(3): 257-280. Appleton, S. and Song, L. 1999. Income and human development at the household level: evidence from six countries. Mimeo, University of Oxford. Ashagrie, K. 1998. Statistics on Child labor and hazardous child labor in brief. Geneva, ILO. Basu, K. 1999. Child labor: Cause, consequence and cure with remarks on international labor standards. Journal of Economic Literature, 37: 1083-1119. Bequele A. and Myers W.E. 1995. First Things First in Child Labour: Eliminating work detrimental to children. Geneva, ILO. Bureau of Labor Statistics, 2000. Report on the youth labor force, Washington D.C., United States Department of Labor. Cigno, A. 1998. Fertility decisions when infant survival is endogenous, Journal of Population Economics 11: 21-28. Cigno, A. and Rosati, F.C. 2001. Child labour, education, fertility and survival in rural India. Pacific Economic Review. Cigno, A., F.C. Rosati and Z. Tzannotos, 2000. Child labor, nutrition and education in rural India: An empirical analysis of parental choice and policy options, World Bank working Paper, Washington D.C., The World Bank Cigno, A., F.C. Rosati and Z. Tzannotos, 2002. Child labor handbook, Social Protection Discussion Paper 0206, Washington D.C., The World Bank. Davidson, R. and MacKinnon, JG., 1993. Estimation and inference in econometrics, New York, Oxford University Press. de Onis, M. and Habicht, J.P. 1996 Anthropometric reference data for international use: Recommendations from a World Health Organization Expert Committee. American Journal Of Clinical Nutrition 64: 650-658. Edmonds, E., 2001. Will child labor decline with improvements in living standards? mimeo Dartmouth College.
22 HEALTH EFFECTS OF CHILDREN’S WORK: EVIDENCE FROM
VIETNAM
Edmonds, E. and N. Pavcnik, 2001. Does globalisation increase child labor? Evidence from Vietnam, NBER Working Paper 8760, Cambridge MA, NBER. Edmonds, E. and Turk, C. Child labor in transition in Vietnam, mimeo Dartmouth College. Fassa, A.G., Facchini L.A., Dall'Agnol M.M., Christiani D.C. 2000. Child labor and health: Problems and perspectives, International Journal of Occupational and Environmental Health, 6(1): 55-62. Fentiman, A. Hall, A. and Bundy, D. 2001. Health and cultural factors associated with enrolment in basic education: A study in rural Ghana. Social Science and Medicine, 52: 429-439. Forastieri V. 1997. Children at Work: Health and Safety Risks. Geneva, ILO. Grootaert, C. and H. Patrinos. 1999. The policy analysis of child labor: A comparative study, London, St. Martin’s Press. Grossman, M. 1972. On the concept of health capital and the demand for health. Journal of Political Economy, 80: 223- 55. Heady, C. 2001. What is the effect of child labour on learning achievement? Evidence from Ghana. Innocenti Working Paper No. 79. Florence, UNICEF Innocenti Research Centre. Immink, M.D.C. and Payongayong, E. 1999. Risk analysis of poor health and growth failure of children in the central highlands of Guatemala. Social Science and Medicine, 48: 997-1009. Fogel, R.W. 1993. New Sources and New Techniques for the Study of Secular Trends in Nutritional Status, Health, Mortality, and the Process of Aging, Historical Methods 26, 5-43 Guiffrida, A., Iunes, R.F. and Savedoff, W.D. 2001. Health and poverty in Brazil: Estimation by structural equation model with latent variables, October 2001, Mimeo, Washington D.C., Inter-American Development Bank. International Labour Organisation. 1998. Conference Report VI (1) Child labor: Targeting the intolerable. Geneva, ILO. International Labour Organisation, 2002. A future without child labour, Geneva, ILO. International Programme for the Elimination of Child Labour (IPEC), 1997. Defining hazardous undertakings for young workers below 18 years of age: A country report, Manila, ILO.
23 UCW WORKING PAPER SERIES, APRIL 2003
International Programme for the Elimination of Child Labour (IPEC), 2002. Every child counts: New global estimates on child labour, Geneva, ILO. Kassouf, A.L. McKee, M. and Mossialos, E. 2001. Early entrance to the job market and its effects on adult health: Evidence from Brazil. Health Policy and Planning, 16(1): 21-28. Klasen, S. 1996. Nutrition, Health and Mortality in Sub-Saharan Africa: Is There a Gender Bias?, Journal of Development Studies 32, 913-32 Kooiker, S.E. 1995. Exploring the iceberg of morbidity: a comparison of different survey methods for assessing the occurrence of everyday illness, Social Science and Medicine, 41(3): 317-32. Lahiri, S. and Schmidt, P. 1978. On the estimation of triangular structural systems, Econometrica, 46: 1217-1221. Martorell, R. and Ho, T.J. 1984. Malnutrition, morbidity and mortality, in W.H. Mosley and L.C. Chen Child survival: Strategies for research, Cambridge, Cambridge University Press. Pitt, M.M., Rosenzweig, M.R. and Nazmul Hassan, Md. 1990. Productivity, health and the intrahousehold distribution of food in the low-income countries. American Economic Review, 80, 1139-1156. Psacharopoulos, G. 1997. Child labor versus educational attainment: Some evidence from Latin America. Journal of Population Economics, 10(4): 377-86. Ralston, H. 1997. Health as an input to labour: Intrahousehold food distribution in rural Indonesia. Journal of Policy Modelling, 19(5): 567-86. Rosenzweig, M.R. and Evenson, R. 1977. Fertility, schooling and the economic contribution of children in rural India: an econometric analysis, Econometrica, 45(5): 1065-79. Satyanarayana, K. Krishna, T.P. and Rao, B.S. 1986. The effect of early childhood undernutrition and child labour on the growth and adult nutritional status of rural Indian boys around Hyderabad. Human Nutrition and Clinical Nutrition 40C: 131-9. Schultz, T.P. 1984. Studying the impact of household economic and community variables on child mortality. Population and Development Review, 10: 215-235. Smith, J. 1999 Healthy bodies and thick wallets: the dual relation between health and economic status. Journal of Economic Perspectives, 13(2): 145-166 Steckel, R. 1995. Stature and the standard of living. Journal of Economic Literature, 33: 1903-40.

24 HEALTH EFFECTS OF CHILDREN’S WORK: EVIDENCE FROM
VIETNAM
Waaler, H.Th., 1984. Height, Weight and Mortality: The Norwegian Experience, Acta Medica Scandinavica, Supplement 679 Wooldridge, J.M. 2002. Econometric analysis of cross section and panel data, Cambridge-MA, MIT Press. World Bank, 2000. Entering the 21st Century: Pillars of Development, Hanoi, World Bank World Health Organisation. 1995. Physical Status: Use and interpretation of anthropometry. Report of a WHO Expert Committee. WHO Technical Report 854. Geneva, WHO.
25 UCW WORKING PAPER SERIES, APRIL 2003
TABLES
1993 1998 1993 1998 1993 1998A ll 0.3747 0.2876 0.1630 0.0687 0.3395 0.2499
0.0163 0.0164 0.0310 0.0162 0.0145 0.0141
M ale 0.3646 0.2903 0.1599 0.0635 0.3317 0.25220.0180 0.0198 0.0348 0.0170 0.0161 0.0170
Fem ale 0.3852 0.2846 0.1660 0.0739 0.3476 0.24750.0175 0.0159 0.0309 0.0204 0.0154 0.0138
age 6-11 0.2012 0.1221 0.0575 0.0152 0.1782 0.10510.0176 0.0129 0.0217 0.0087 0.0153 0.0110
age 12-15 0.6742 0.5147 0.3249 0.1283 0.6126 0.44170.0225 0.0234 0.0523 0.0273 0.0202 0.0206
Sam ple size 5069 6274 1008 1484 6077 7758
stratification and cluster sam pling.
N otes: a. 1998 sam ple from both V ietnam Living Standards and M ulti-Purpose H ousehold
Standard errors of estim ates of population proportions in italics, adjusted for com ponents of survey. Sam ple w eights applied for 1998, 1993 survey is self-w eighting.
Table 1: W ork participation rates of children aged 6-15 years, V ietnam 1993 & 1998
Rural U rban Total
Sam ple - all children aged 6-15 years in cross-section a
Mean hours of Mean months in Samplepaid workb household household school work per week current job size
agriculturec businessd
1993 0.0845 0.9044 0.1420 0.6030 18.95 26.14 18940.0122 0.0153 0.0204 0.0215 0.724 0.696
1998 0.0650 0.9332 0.1100 0.7185 16.87 24.65 14870.0087 0.0120 0.0184 0.0247 0.897 0.757
Table 2: Type, intensity and duration of children's work, rural Vietnam 1993 & 1998a
Sample - working children aged 6-15 years in rural areas
Proportion in:
Notes: a. Notes to Table 1 apply. b. Working for pay outside of household.c. Working for household in agricultural activity.d. Working for household in business activity.
26 HEALTH EFFECTS OF CHILDREN’S WORK: EVIDENCE FROM
VIETNAM
mean SE mean SE mean SE
All -2.06 0.040 15.09 0.040 0.1969 0.0117
Not working -1.89 0.038 14.70 0.040 0.2012 0.0112
Working -2.08 0.042 15.97 0.075 0.1948 0.0139
All -1.70 0.036 15.24 0.046 0.3379 0.0130
Not working -1.50 0.033 15.04 0.046 0.3370 0.0120
Working -1.86 0.044 16.26 0.087 0.3186 0.0197
Table 3: Health indicators by work status, rural Vietnam 1993 & 1998a
Sample - children aged 6-15 years in rural areas
1993
height-for-age z-scoreb body mass indexc illness or injuryd
a. Notes to Table 1 apply.
c. weight / square(height)d. 1 if child reports illness or injury in previous 4 weeks.
b. (height - mean height at age-sex in healthy population)/std. deviation at age-sex in healthy population
1998
Notes:
mean SE mean SE mean SE mean SE
poorest 20% 0.4145 0.0227 -2.45 0.074 15.00 0.088 0.1955 0.0217
2nd poorest 0.4072 0.0238 -2.14 0.057 14.86 0.066 0.2137 0.0185
middle 20% 0.3826 0.0229 -2.07 0.042 15.05 0.065 0.2058 0.0196
2nd richest 0.3556 0.0204 -1.80 0.050 15.34 0.065 0.1803 0.0188
richest 20% 0.2678 0.0264 -1.65 0.067 15.36 0.097 0.1810 0.0185
poorest 20% 0.3262 0.0281 -1.98 0.065 15.04 0.092 0.3283 0.0242
2nd poorest 0.3115 0.0209 -1.76 0.046 15.13 0.065 0.3509 0.0191
middle 20% 0.2892 0.0245 -1.65 0.045 15.23 0.071 0.3526 0.0209
2nd richest 0.2655 0.0241 -1.53 0.041 15.42 0.079 0.3301 0.0224
richest 20% 0.1526 0.0221 -1.24 0.059 15.80 0.103 0.3087 0.0240
1993
1998
b. Notes to Tables 1 and 3 apply.
Table 4: Work and health by household consumption quintilea, rural Vietnam 1993 & 1998b
Sample - children aged 6-15 years in rural areas
height-for-age z-score body mass index illness or injury
a. Children ranked by value of real household consumption per capita.
Work participation
Notes:

27 UCW WORKING PAPER SERIES, APRIL 2003
coeff.a robust S.E.b coeff. robust S.E. coeff. robust S.E. coeff. robust S.E. coeff. robust S.E.
0.2696*** 0.0392 -0.0256 0.0508 0.0126 0.0693 -1.2806* 0.6944 -1.2772 1.65490.3786*** 0.1464 -5.8171 7.2666-0.0020 0.0021 -0.0235 0.0552
11430 3369 3355 3276 3262R2=0.4581 R2=0.3514 R2= 0.3527F=261.47 p=0.0000 F=49.63 p=0.0000 F=45.20 p=0.0000 F=32.24 p=0.0000 F=16.6 p=0.0000
F=4.96 p=0.0000
F(2,3233)=3.78 p=0.0228 F(6,3211)=1.54 p=0.1624
=7.93 p=0.2431 =2.71 p=0.2576
Notes:a.b.c.d.e.f.g.
h.i.j.
Instruments rice price, emmigration, migrants, school year plus interaction of each with child dummy.
child (+), age (-/**), age2 (+/***), age3 (-/***), female (+/**), age*female (-/***), age2*female (+/***), age3*female (-/***),age4*female (+/***), hhold exp (-/**), hhold exp2 (+/**), hhold exp3 (-/**), hhold rice (+), #infants (-/**), #kids (-/*),dad home (+), sanitation (+/*), house walls (+), homebirth (-), hospital (-), polyclinic (-/**), doctor (+), nurse (-), pharmacy (-/**), hospital dist (+), pharmacy dist (-/***), road (+), no electricity (+), region, season, time dummy (+). All time constant variables are interacted with time dummy.
Other regressorsj
Child in workc
Table 5: Body mass index against current child work activity - (dependent variable is weight/height2)
Pooled OLS First Difference OLS First Difference 2SLS6-15 yrs. in either wave 6-15yrs. in 1st wave Sample 6-15yrs. in 1st wave
Joint significancef
Hausman test of exogeneityh
Overidentificationi
IV exclusion from 1st stageg
Child in paid workd
Child's job tenure (months)e
Goodness of fitSample size
S.E. - standard error, robust to heteroskedasticity. Adjusted for clustering on multiple individual observations for Pooled OLS. *, ** and *** denote significance at 10%, 5% and 1% respectively.
For FD-OLS and FD-2SLS is sum of coefficients on work dummy and its interaction with child (6-15 yrs.) dummy.For FD-OLS and FD-2SLS is sum of coefficients on work dummy, a paid work dummy and interaction of each with child dummy.
Degrees of freedom are number of overidentification restrictions. Test robust to heteroskedasticity (Wooldridge,2002, p.p. 122-4).Specification , sign and significance level in parentheses for FD-OLS estimator (restricted specification excluding paid work and job tenure).
For FD-OLS and FD-2SLS is sum of coefficients on job tenure variable and its interaction with child (6-15 yrs.) dummy.F-test of null that all slopes equal to zero. F-test of exclusion of all 8 instruments from 1st stage reduced form work participation regression. Respective test statistics (p-values) for "paid work" and "job tenure" reduced form regressions are 1.77 (0.0772) and 3.61 (0.0003).
F-test of significance of reduced form residuals in "artificial regression" (Davidson and MacKinnon, 1993, pp. 237-242).
( )2 6χ ( )2 2χ
28 HEALTH EFFECTS OF CHILDREN’S WORK: EVIDENCE FROM
VIETNAM
coeff.a robust S.E.b coeff. robust S.E. coeff. robust S.E. 0.1232* 0.0706 0.6495** 0.2585 0.4150 0.3177
0.0197** 0.0093-0.0003** 0.0001
-0.3520 0.1558 -0.3388 0.1631=4.28 p=0.0386 =3.66 p=0.0556
3683 3091 3086-2108.48 -3063.75 -3053.96
Illness equation:
Work equation:
Identification:Notes:a.b.c.d. Specification, sign and significance level for bivariate probit without job tenure included.
Standard error corrected for heteroskedasticity and clustering at commune level. *, ** and *** denote significance at 10%, 5% and 1% respectively.
pupil teacher (+/***), disaster (-/*), no electricity (+), few electricity (+), homebirth (+/***),
pharmacy dist (-), region, season. All values at 1st wave.
Coefficient of correlation between errors of illness and work equations.
Variables in bold above plus across time variation in other regressors.
Table 6: Illness against past child work activity
Worked in wave 1
Sample: 6-15 years in wave 1
Bivariate ProbitUnivariate Probit
Other regressorsd:
Job tenure (months) in wave 1Job tenure squared
Wald test of rho=0Correlation of errors (rho)c
Sample sizeLog Likelihood
self report (+/***), height t1 (-/**), age (-), female (-), age*female (+),
height (+/***), age (+/***), female (-), age*female (+/*), minority (-),
minority (+/**), hhold exp t1 (+/**), hhold exp (+), hhold rice t1 (+), hhold rice (-), #infants (+), #kids (+), #adults (-/**), dad home (-), mum age (+), mum diploma (-/***), safedrink (-/**), sanititation (-), house walls (+), homebirth (+), hospital (-/**), polyclinic (+), health centre (+), doctor (+), nurse (-), pharmacy (-/***), hospital dist (-), pharmacy dist (-), cmhc toilet (-), cmhc chart (-/**), cmhc exam (+/***), no electricity (-/*), relief medical (-), relief food (-), region,
land any (-/***), land size (+/***), rice price (-), emmigration (-/***), migrants (-/***),
hospital (+), polyclinic (+), health centre (-), doctor (-), nurse (-), pharmacy (-), hospital dist (+),
season. All values at 2nd wave, except where indicated by " t1"=1st wave.
hhold exp (-/***), #infants (-), #kids (-), #adults (-), dad home (-), mum age (-), mum diploma (-),
( )2 1χ ( )2 1χ
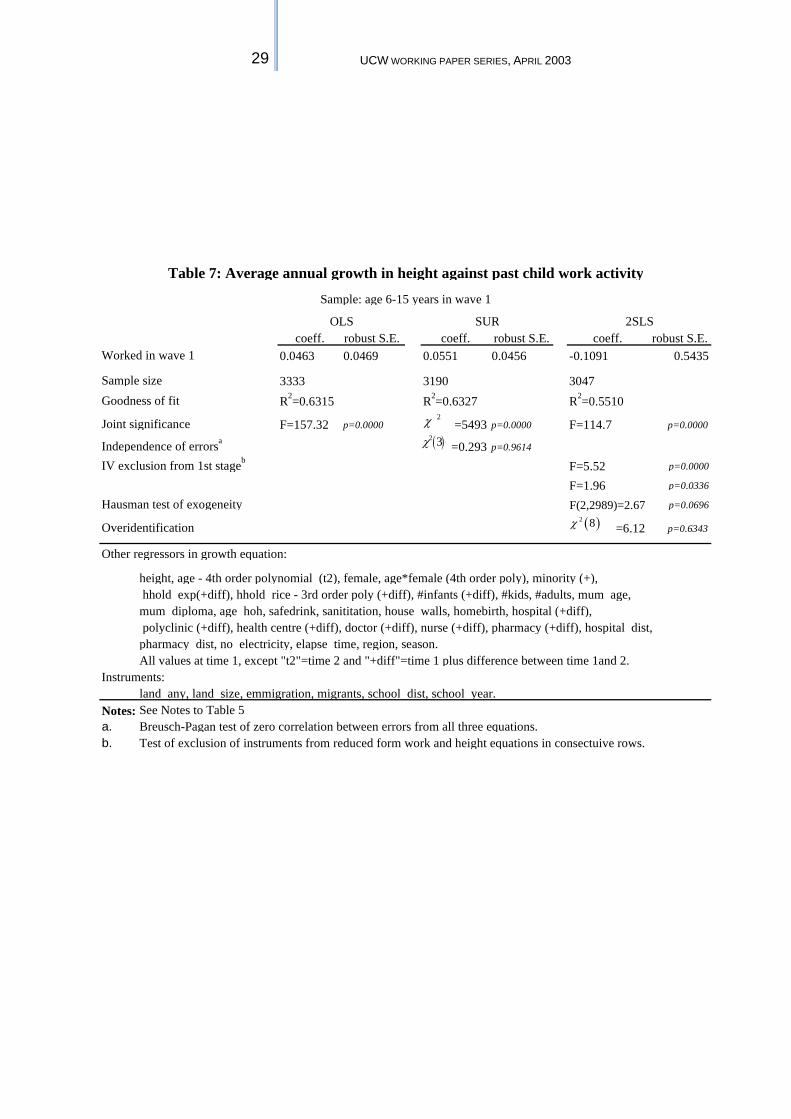
29 UCW WORKING PAPER SERIES, APRIL 2003
coeff. robust S.E. coeff. robust S.E. coeff. robust S.E.0.0463 0.0469 0.0551 0.0456 -0.1091 0.5435
3333 3190 3047R2=0.6315 R2=0.6327 R2=0.5510
F=157.32 p=0.0000 =5493 p=0.0000 F=114.7 p=0.0000
=0.293 p=0.9614
F=5.52 p=0.0000
F=1.96 p=0.0336
F(2,2989)=2.67 p=0.0696
=6.12 p=0.6343
Notes:a.b.
Goodness of fit
Instruments:land any, land size, emmigration, migrants, school dist, school year.
Overidentification
2SLS
Joint significance
SUR
Independence of errorsa
Breusch-Pagan test of zero correlation between errors from all three equations.Test of exclusion of instruments from reduced form work and height equations in consectuive rows.
polyclinic (+diff), health centre (+diff), doctor (+diff), nurse (+diff), pharmacy (+diff), hospital dist,
All values at time 1, except "t2"=time 2 and "+diff"=time 1 plus difference between time 1and 2.
Table 7: Average annual growth in height against past child work activity
Sample: age 6-15 years in wave 1
Hausman test of exogeneity
mum diploma, age hoh, safedrink, sanititation, house walls, homebirth, hospital (+diff),
height, age - 4th order polynomial (t2), female, age*female (4th order poly), minority (+),
Other regressors in growth equation:
OLS
Sample size
Worked in wave 1
IV exclusion from 1st stageb
hhold exp(+diff), hhold rice - 3rd order poly (+diff), #infants (+diff), #kids, #adults, mum age,
pharmacy dist, no electricity, elapse time, region, season.
See Notes to Table 5
2χ
( )2 3χ
( )2 8χ
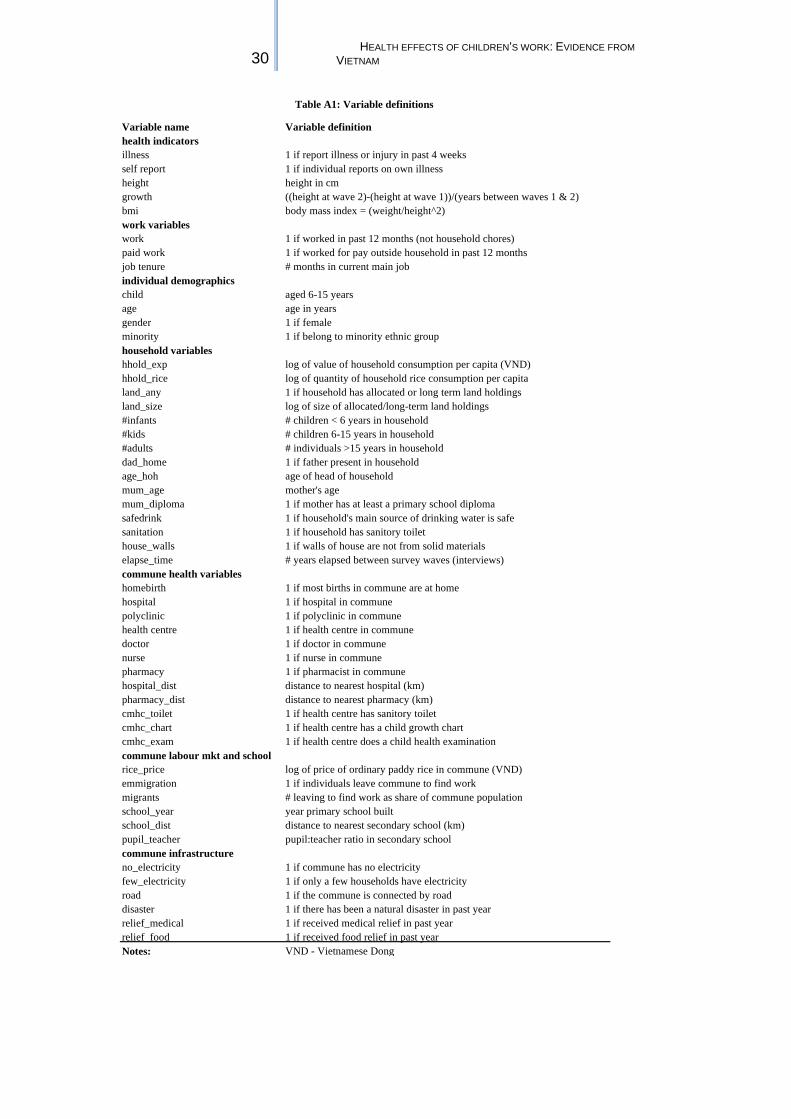
30 HEALTH EFFECTS OF CHILDREN’S WORK: EVIDENCE FROM
VIETNAM
Variable name Variable definitionhealth indicatorsillness 1 if report illness or injury in past 4 weeksself report 1 if individual reports on own illnessheight height in cmgrowth ((height at wave 2)-(height at wave 1))/(years between waves 1 & 2)bmi body mass index = (weight/height^2)work variableswork 1 if worked in past 12 months (not household chores)paid work 1 if worked for pay outside household in past 12 monthsjob tenure # months in current main jobindividual demographicschild aged 6-15 yearsage age in yearsgender 1 if femaleminority 1 if belong to minority ethnic grouphousehold variableshhold_exp log of value of household consumption per capita (VND)hhold_rice log of quantity of household rice consumption per capitaland_any 1 if household has allocated or long term land holdingsland_size log of size of allocated/long-term land holdings#infants # children < 6 years in household#kids # children 6-15 years in household#adults # individuals >15 years in householddad_home 1 if father present in householdage_hoh age of head of householdmum_age mother's age mum_diploma 1 if mother has at least a primary school diplomasafedrink 1 if household's main source of drinking water is safesanitation 1 if household has sanitory toilethouse_walls 1 if walls of house are not from solid materials elapse_time # years elapsed between survey waves (interviews)commune health variableshomebirth 1 if most births in commune are at homehospital 1 if hospital in communepolyclinic 1 if polyclinic in communehealth centre 1 if health centre in communedoctor 1 if doctor in communenurse 1 if nurse in communepharmacy 1 if pharmacist in communehospital_dist distance to nearest hospital (km)pharmacy_dist distance to nearest pharmacy (km)cmhc_toilet 1 if health centre has sanitory toiletcmhc_chart 1 if health centre has a child growth chartcmhc_exam 1 if health centre does a child health examinationcommune labour mkt and schoolrice_price log of price of ordinary paddy rice in commune (VND)emmigration 1 if individuals leave commune to find workmigrants # leaving to find work as share of commune populationschool_year year primary school builtschool_dist distance to nearest secondary school (km)pupil_teacher pupil:teacher ratio in secondary schoolcommune infrastructureno_electricity 1 if commune has no electricityfew_electricity 1 if only a few households have electricityroad 1 if the commune is connected by roaddisaster 1 if there has been a natural disaster in past yearrelief_medical 1 if received medical relief in past yearrelief_food 1 if received food relief in past yearNotes: VND - Vietnamese Dong
Table A1: Variable definitions
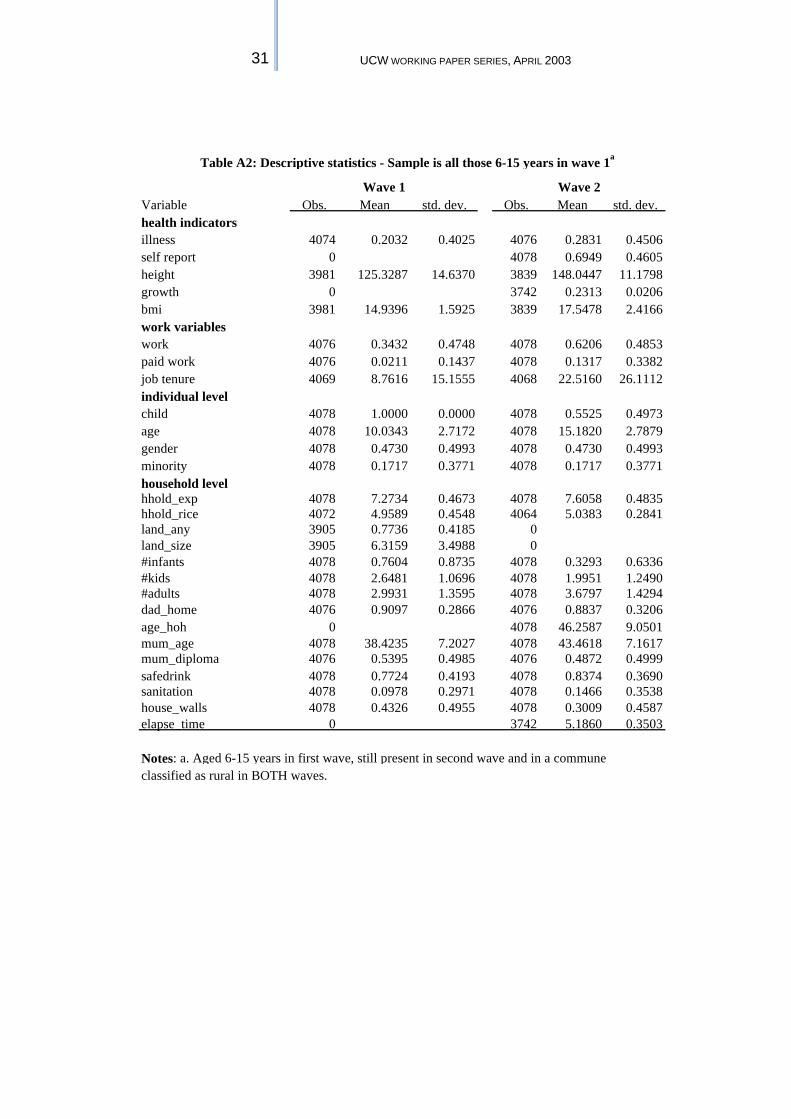
31 UCW WORKING PAPER SERIES, APRIL 2003
Variable Obs. Mean std. dev. Obs. Mean std. dev.health indicatorsillness 4074 0.2032 0.4025 4076 0.2831 0.4506self report 0 4078 0.6949 0.4605height 3981 125.3287 14.6370 3839 148.0447 11.1798growth 0 3742 0.2313 0.0206bmi 3981 14.9396 1.5925 3839 17.5478 2.4166work variableswork 4076 0.3432 0.4748 4078 0.6206 0.4853paid work 4076 0.0211 0.1437 4078 0.1317 0.3382job tenure 4069 8.7616 15.1555 4068 22.5160 26.1112individual levelchild 4078 1.0000 0.0000 4078 0.5525 0.4973age 4078 10.0343 2.7172 4078 15.1820 2.7879gender 4078 0.4730 0.4993 4078 0.4730 0.4993minority 4078 0.1717 0.3771 4078 0.1717 0.3771household levelhhold_exp 4078 7.2734 0.4673 4078 7.6058 0.4835hhold_rice 4072 4.9589 0.4548 4064 5.0383 0.2841land_any 3905 0.7736 0.4185 0land_size 3905 6.3159 3.4988 0#infants 4078 0.7604 0.8735 4078 0.3293 0.6336#kids 4078 2.6481 1.0696 4078 1.9951 1.2490#adults 4078 2.9931 1.3595 4078 3.6797 1.4294dad_home 4076 0.9097 0.2866 4076 0.8837 0.3206age_hoh 0 4078 46.2587 9.0501mum_age 4078 38.4235 7.2027 4078 43.4618 7.1617mum_diploma 4076 0.5395 0.4985 4076 0.4872 0.4999safedrink 4078 0.7724 0.4193 4078 0.8374 0.3690sanitation 4078 0.0978 0.2971 4078 0.1466 0.3538house_walls 4078 0.4326 0.4955 4078 0.3009 0.4587elapse_time 0 3742 5.1860 0.3503
Notes: a. Aged 6-15 years in first wave, still present in second wave and in a commune classified as rural in BOTH waves.
Table A2: Descriptive statistics - Sample is all those 6-15 years in wave 1a
Wave 1 Wave 2
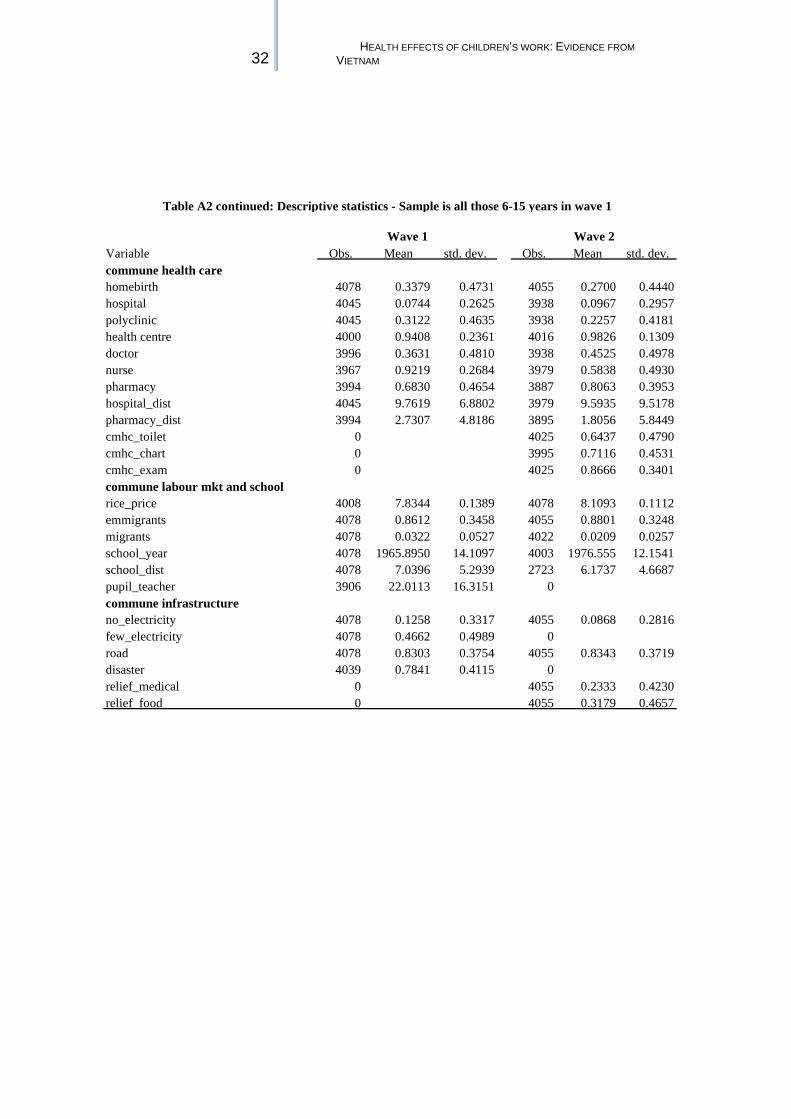
32 HEALTH EFFECTS OF CHILDREN’S WORK: EVIDENCE FROM
VIETNAM
Variable Obs. Mean std. dev. Obs. Mean std. dev.commune health carehomebirth 4078 0.3379 0.4731 4055 0.2700 0.4440hospital 4045 0.0744 0.2625 3938 0.0967 0.2957polyclinic 4045 0.3122 0.4635 3938 0.2257 0.4181health centre 4000 0.9408 0.2361 4016 0.9826 0.1309doctor 3996 0.3631 0.4810 3938 0.4525 0.4978nurse 3967 0.9219 0.2684 3979 0.5838 0.4930pharmacy 3994 0.6830 0.4654 3887 0.8063 0.3953hospital_dist 4045 9.7619 6.8802 3979 9.5935 9.5178pharmacy_dist 3994 2.7307 4.8186 3895 1.8056 5.8449cmhc_toilet 0 4025 0.6437 0.4790cmhc_chart 0 3995 0.7116 0.4531cmhc_exam 0 4025 0.8666 0.3401commune labour mkt and schoolrice_price 4008 7.8344 0.1389 4078 8.1093 0.1112emmigrants 4078 0.8612 0.3458 4055 0.8801 0.3248migrants 4078 0.0322 0.0527 4022 0.0209 0.0257school_year 4078 1965.8950 14.1097 4003 1976.555 12.1541school_dist 4078 7.0396 5.2939 2723 6.1737 4.6687pupil_teacher 3906 22.0113 16.3151 0commune infrastructureno_electricity 4078 0.1258 0.3317 4055 0.0868 0.2816few_electricity 4078 0.4662 0.4989 0road 4078 0.8303 0.3754 4055 0.8343 0.3719disaster 4039 0.7841 0.4115 0relief_medical 0 4055 0.2333 0.4230relief food 0 4055 0.3179 0.4657
Table A2 continued: Descriptive statistics - Sample is all those 6-15 years in wave 1
Wave 1 Wave 2