
Evaluation of Children’s Centres in England (ECCE). Strand 3: Parenting Services in Children’s...
146
Evaluation of Children’s Centres in England (ECCE) Strand 3: Parenting Services in Children’s Centres Research report June 2014 Maria Evangelou, Jenny Goff, James Hall, Kathy Sylva, Naomi Eisenstadt, Christine Paget, Susila Davis, Pam Sammons, Teresa Smith, Rebecca Tracz and Terri Parkin University of Oxford
Transcript of Evaluation of Children’s Centres in England (ECCE). Strand 3: Parenting Services in Children’s...
Evaluation of Children’s Centres in England (ECCE)
Strand 3: Parenting Services in Children’s Centres
Research report
June 2014
Maria Evangelou, Jenny Goff, James Hall, Kathy Sylva, Naomi Eisenstadt, Christine Paget, Susila Davis, Pam Sammons, Teresa Smith, Rebecca Tracz and Terri Parkin
University of Oxford

ii
Contents
Table of Tables v
Table of Figures viii
Acknowledgements ix
Evaluation of Children’s Centres in England: Research Team x
List of Abbreviations xi
Executive Summary xiv
1 Introduction [Paget, Evangelou, Eisenstadt and Goff] 1
1.1 Conceptualising Parenting Support in England 2
1.2 Parenting Support Evaluations in the United Kingdom 3
2 Method [Evangelou and Goff] 8
2.1 Sampling of Target Children’s Centres 8
2.2 Conceptualising Provision for Parents within Children’s Centres 8
2.3 Instrument Development 9
2.4 Data Collection 12
3 Delivery of Parenting Services [Hall, Davis, Goff and Evangelou] 14
Key Findings: 14
3.1 Introduction 15
3.2 What Parenting Services do Children’s Centres Offer? 15
3.3 Managing the Delivery of Parenting Services 22
3.4 Summary 26
4 Evidence-Based Practice [Sylva, Hall and Goff] 27
Key findings: 27
4.1 Introduction 28
4.2 What Programmes, Strategies or Interventions were Children’s Centres Offering in
2013? 29
iii
4.3 Changes in Programmes, Strategies or Interventions that were Offered between
2012 and 2013 31
4.4 Summary 35
5 Aims for Families and Parenting Services [Goff and Evangelou, with Parkin and Tracz] 36
Key Findings: 36
5.1 Introduction to the Interviews with Staff across the Sample of Children’s Centres in
2013 37
5.2 Data Collection and Analysis of Interview Scripts 37
5.3 The Characteristics of Families Attending Children’s Centres and their Needs 37
5.4 The Aims for Parenting Services in Children’s Centres 42
5.5 The Benefits of ‘Play and Learning’ Activities for Families (Children and Parents) 44
5.6 Summary 50
6 Strategies and Progression into the Future [Goff and Evangelou, with Tracz and Parkin] 51
Key Findings: 51
6.1 Introduction 52
6.2 Strategies for Working with Children 52
6.3 Strategies for Working with Parents 54
6.4 Centre Strategies 55
6.5 Children’s Centres’ Hopes and Plans for the Future 56
6.6 Summary 59
7 Parental Views and Experiences [Paget, Evangelou and Goff] 61
Key Findings: 61
7.1 Introduction 62
7.2 Parental Use of Children’s Centres 62
7.3 Reasons Parents Attend Children’s Centres 64
7.4 Parental Impressions of the Children's Centres 65
7.5 Summary 67

iv
8 Conclusions [Evangelou and Goff] 68
8.1 Introduction 68
8.2 Implementation of Services within Children’s Centres 69
8.3 Parental Views 70
8.4 Final Remarks 71
References 72
Appendices 76
Ap1: Chapter 1 – Conceptualising Parenting Support Internationally 76
Ap2: Chapter 2 – Method 79
Ap3: Chapter 3 – Delivery of Parenting Services 87
Ap4: Chapter 4 – Evidence-Based Practice 101
Ap5: Chapter 5 – Aims for Families and Parenting Services 114
Ap6: Chapter 6 – Strategies and Progression into the Future 118
Ap7: Chapter 7 – Parental Views and Experiences 124

v
Table of Tables
Table 2.1 A mixed methods design and its areas of data collection .............................................. 12
Table 2.2 Breakdown of visits to the 117 children’s centres visited in the parenting study (2013) in
terms of extent of data collection .................................................................................................. 13
Table 3.1 Induction procedures that were offered to new families on their first or second visit to a
children’s centre in 2013 ............................................................................................................... 16
Table 3.2 Services offered by children’s centres to support the personal needs of parents .......... 17
Table 3.3 Children’s centre self-assessment of the level of provision (from “very limited” to
“excellent”) with which their centre supported six areas of parental need ..................................... 18
Table 3.4 Children’s centre self-assessment of the level of provision (from “very limited” to
“excellent”) with which their centre supported seven areas of familial need .................................. 20
Table 3.5 The extent to which parent’s participated in the running of their children’s centre in 2013
and particular strategies used to encourage participation in the running of the centre .................. 21
Table 3.6 Reported spending of resources on target groups ........................................................ 23
Table 3.7 Provision of named parenting programmes and site locations ...................................... 24
Table 3.8 Strategies used by centre managers to encourage and maintain parents’ attendance .. 25
Table 3.9 Centre work focused on improving particular parent behaviours ................................... 25
Table 4.1 Twenty-three early interventions highlighted by Allen (2011) for families with children
aged between 0-5 years and their Standards of Evidence ............................................................ 29
Table 4.2 The top three most commonly offered well-evidenced programmes in 2013 ................. 30
Table 4.3 The top five additional programmes, strategies or interventions offered by children’s
centres in 2013 ............................................................................................................................. 31
Table 4.4 Statistical comparison of the change in whether programmes were being currently
implemented between 2012 and 2013 .......................................................................................... 32
Table 4.5 Statistical comparison of the Levels of Implementation of Evidence-Based Programmes
in 2012 and 2013 .......................................................................................................................... 34
Table 4.6 Statistical comparison of the numbers of programmes implemented in 2012 and 2013 35
Table 5.1 Types of families accessing children’s centre services, and their needs (as reported by
centre staff) .................................................................................................................................. 38
Table 5.2 Staff reported ‘Aims for Parenting Services’ against areas of parental need ................. 43

vi
Table 5.3 Examples of staff reported ‘benefits for children’ across the seven Early Years
Foundation Stage areas of learning .............................................................................................. 46
Table 5.4 Examples of staff reported ‘benefits for adults’ across the areas of parental need ........ 48
Table 6.1 Examples of strategies for children reported by staff in children’s centres .................... 52
Table 6.2 Strategies for parents reported by staff in children’s centres ......................................... 54
Table 6.3 Staff responses to how they would like their centre to change in the future................... 56
Table 7.1 Frequency of children's centre use ............................................................................... 62
Table 7.2 Reasons for attending other children's centres ............................................................. 63
Table 7.3 Length of time parents had been attending the centre .................................................. 64
Table 7.4 How parents heard about the centre ............................................................................. 64
Table 7.5 Reasons for attending the children's centres ................................................................ 65
Table 7.6 Summary of parents’ overall impressions of children's centres in terms of level of
satisfaction ................................................................................................................................... 66
Table Ap3.1 Measures describing who provided information on the provision of parenting services
..................................................................................................................................................... 87
Table Ap3.2 Measures created for use in ‘impact’ (Strand 4) – summarising the parenting services
offered by children’s centres ......................................................................................................... 89
Table Ap3.3 Six areas of parental need and the support that was offered by children’s centres ... 90
Table Ap3.4 Seven areas of familial need and the support that was offered by children’s centres 91
Table Ap3.5 Measures describing who provided information on centre support of Parenting
Services ....................................................................................................................................... 93
Table Ap3.6 Demographics describing children’s centres ............................................................. 94
Table Ap3.7 Measures created for use in ‘impact’ (Strand 4) – summarising the management
practices supportive of family services offered by children’s centres ............................................ 96
Table Ap3.8 Areas of staff training in children’s centres ............................................................... 98
Table Ap3.9 Managers’ perspectives of training, foci, and multiagency working in their centre (in
2013) ............................................................................................................................................ 99
Table Ap3.10 Children’s centre aims as reported by centre managers ......................................... 99
Table Ap3.11 Frequency of monitoring and feedback activities .................................................. 100

vii
Table Ap4.2 What evidence-based programmes were children’s centres offering in 2013? ........ 103
Table Ap4.3 What programmes, strategies or interventions were children’s centres offering in
2013? ......................................................................................................................................... 105
Table Ap4.4 Statistical comparison of the change in whether programmes were being currently
implemented between 2012 and 2013 ........................................................................................ 108
Table Ap4.5 Statistical comparison of the levels of implementation of evidence-based programmes
in 2012 and 2013 ........................................................................................................................ 111
Table Ap5.1 Areas of coding emphasised within staff descriptions of ‘the most disadvantaged
families’ ...................................................................................................................................... 114
Table Ap7.1 Age of the parent sample ....................................................................................... 124

viii
Table of Figures
Figure 1.1 ECCE study’s conceptualisation of parenting support, inspired by Moran et al. (2004) .. 3
Figure 1.2 Ecological framework adapted and utilised in the parenting study ................................. 7
Figure 2.1 Possible needs of parents that may be targeted by children’s centres ......................... 11
Figure Ap2.1 ECCE sample design .............................................................................................. 86

ix
Acknowledgements
The University of Oxford would like to thank the following colleagues for their contribution to the
project and the report: Naomi Eisenstadt, Christine Paget and Susila Davis for their input into this
report; Terri Parkin and Rebecca Tracz for contributions to the qualitative coding and report; and
the Evaluation of Children’s Centres in England (ECCE) regional researchers who were committed
to ensuring that we were able to return to the children’s centres visited in 2012 - Ana-Maria
Aricescu, Helen Mirelman, Jean Robinson, Clare Williams, Janice Woodcock and Lesley Zuke.
We also thank our partners at NatCen Social Research and Frontier Economics for their advice
and support with regards to this phase of the work.
We wish to thank the following people at the Department for Education for their guidance and
comments: Michael Dale, Steve Hamilton and Rebecca Leete. Finally, this research could not
have been possible without the support and co-operation of the children’s centre staff across the
117 centres that participated in this phase of our study. Our thanks and gratitude goes to all of the
staff who were very generous with their time, and assisted us in meeting with parents. Our thanks
also go to all of the families who were keen to speak with us during the visits.

x
Evaluation of Children’s Centres in England: Research Team
University of Oxford
Principal Investigators:
Kathy Sylva
Maria Evangelou
Pamela Sammons
Teresa Smith
Oxford-based Research Team:
James Hall
Naomi Eisenstadt
George Smith
Susila Davis
Christine Paget
Terri Parkin
Rebecca Tracz
Research Coordinator:
Jenny Goff Regional Researchers:
Ana-Maria Aricescu
Helen Mirelman
Jean Robinson
Clare Williams
Janice Woodcock
Lesley Zuke
NatCen Social Research
Jane O’Brien, Ruth Maisey, Emily Tanner, Svetlana Speight, Eloise Poole, Sarah Haywood,
Alexandra Fry, David Hussey
Frontier Economics
Gillian Paull, Ashley Kurtz, Matthew Bell

xi
List of Abbreviations
ADHD Attention Deficit Hyperactivity Disorder
ASD Autism Spectrum Disorder
BBEIP Bright Beginnings Early Intervention
BIS Department for Business, Innovation and Skills
BSFT Brief Strategic Family Therapy Program
CAB Citizens Advice Bureau
CAF Common Assessment Framework
CiN Child in Need
CP Child Protection
CUREC Central University Research Ethics Committee
DCSF Department for Children, Schools and Families
DfE Department for Education
DTBY DARE to be you: Decision-making; Assertiveness; Responsibility; and Esteem
EAL English as an Additional Language
EBP Evidence-Based Practice
ECAT Every Child A Talker
ECCE Evaluation of Children’s Centres in England
ECM Every Child Matters
ELLM Early Learning and Literacy Model
ELPP Early Learning Partnership Project
ESOL English for Speakers of Other Languages
EYFS Early Years Foundation Stage
FAST Families and Schools Together Programme
FLLN Family Literacy, Language and Numeracy
FNP Family Nurse Partnership (also known as NFP)

xii
FPI Family and Parenting Institute
FWA Family Welfare Association
HENRY Healthy Exercise Nutrition for the Really Young
HFA Healthy Families America
HFNY Healthy Families New York
HIPPY/HAETGAR Home Instruction Program for Pre-school Youngsters
ICPS I Can Problem Solve
ICT Information and Communication Technology
IT Information Technology
IDACI Income Deprivation Affecting Children Index
IY Incredible Years
LAs Local Authorities
LSOAs Lower Super Output Areas
Md Median
MOCEP Mother Child Education Program
MTFC Multidimensional Treatment Foster Care
n Total Number
NCH National Children's Homes
NCJW National Council of Jewish Women
NESS National Evaluation of Sure Start
NFER National Foundation for Educational Research
NFP Nurse Family Partnership (also known as FNP)
NHS National Health Service
Ofsted Office for Standards in Education
ORIM Opportunities, Recognition, Interaction and Model
PAFT Parents As First Teachers
xiii
PCIT Parent Child Interaction Therapy
PEAL Parents, Early years and Learning Programme
PEEP Peers Early Education Partnership (now known as Parents Early Education
Partnership)
PEKiP The Prager-Eltern-Kind-Programme (Prague Parent-Infant Program)
PICL Parents Involved in their Children’s Learning
PIPPIN Parents in Partnership Parent-Infant Network
PLA Pre-school Learning Alliance
PLMD Periodic Limb Movement Disorder
PPP Positive Parenting Programme (Triple P)
QED Quasi-Experimental Design
REAPPs Réseaux d’Ecoute, d’Appui, et d’Accompagnement des Parents
RCT Randomised Controlled Trial
SEN Special Educational Needs
SFP Strengthening Families Programme
SSCC Sure Start Children’s Centre
TCM Thurrock Community Mothers
UK United Kingdom
UNESCO The United Nations Educational, Scientific and Cultural Organization
WFL Wider Family Learning
xiv
Executive Summary
Introduction
This is the sixth report from the Evaluation of Children’s Centres in England (ECCE) project, which
is a six-year study commissioned by the Department for Education (DfE), and undertaken by
NatCen Social Research, the University of Oxford and Frontier Economics. ECCE aims to provide
an in-depth understanding of children’s centre services, including their effectiveness for children
and families and an assessment of their economic cost in relation to different types of services.
The DfE describes the core purpose of children’s centres as:
“The core purpose of children’s centres is to improve outcomes for young children and their
families and reduce inequalities between families in greatest need and their peers in:
child development and school readiness;
parenting aspirations and parenting skills; and
child and family health and life chances.”
Sure Start Children’s Centres Statutory Guidance (2013:7)
The ECCE evaluation is producing a very detailed picture of the first two phases of children’s
centres in England – those which are aimed at the most disadvantaged areas. The ECCE
evaluation aims to describe how effective centres are in terms of using different managerial
approaches, and the delivery of services and activities to families. ECCE also considers the cost
of delivering different types of services, and it will establish estimates of the impact of children’s
centres upon a range of child, parent, and family outcomes.
The fieldwork reported here presents one element of a multi-component longitudinal evaluation,
which utilises a nested design, with a sample of children’s centres participating in five different
strands of work. The findings presented here are from the second wave of detailed fieldwork
regarding the organisation and delivery of children’s centre services for parents. It was deemed
important to capture not only the views of the members of staff, but also of the parents who were
attending the centres to obtain a broader picture of centre provision.
Specifically, this study of parenting services aimed to collect information on:
the provision for parenting and services for parents across the sample;
staff perceptions on family needs;
the range of parenting programmes delivered by a named children’s centre and any associated
centres within their cluster;
how children’s centres manage their services;
staff perceptions of the benefits of services for parents and children; and
parental views of children’s centre services.
xv
Method (Chapter 2)
Fieldwork took place in 117 Phase 1 and Phase 2 children’s centres across England during 2013
and aimed to capture the diversity and range of provision available to parents. For further detail
on sampling design, please see Figure Ap2.1. The study used a mixed methods design, utilising
both quantitative and qualitative methodologies, including staff self-report questionnaires and face-
to-face interviews with both staff and parents.
Delivery of Parenting Services (Chapter 3)
This chapter reports on data collected from both managers of children’s centres and members of
staff responsible for family and parenting support. Staff were questioned about the provision of
parenting services and the provision available for parents’ personal and family needs; as well as
the level of parent’s participation in the running of the centre. The second questionnaire
addressed the ways and frequency to which the centre monitored attendance and encouraged
eligible families to attend.
What Parenting Services do Children’s Centres Offer?
Certain induction procedures were commonly reported across the children’s centres. The
most frequently reported procedures included: the distribution of timetabled activities, the
requirement of registration documents, and the recording of a family’s cultural background.
Staff reported variations in the type of support offered for particular services. Such services
were more likely to be run via a centre session (for example crèche) or were offered via
personalised support (for example, parental isolation and mental health).
Few centres offered services off-site. Up to 21% of centres offered services off-site which
could include any type of support.
Staff reported the offer of service provision for parents’ personal needs to be variable. Staff
rated their centre’s offer of service provision for helping parents to access childcare and improving
parental health and lifestyles as the highest, and accessing housing as the lowest. Staff rated
their offer of service provision for family needs as consistently higher than that for parents’
personal needs.
Half of the centres encouraged parents to get involved in the running of their centres.
Parents were encouraged to participate “a great deal” across 51% of centres, using strategies
such as crèche provision and advertising consultation sessions. Popular roles included
volunteering as a play worker or at community events, attending parent forums or advisory
board/governing bodies, and helping staff to choose which sessions are on offer.
Managing the Delivery of Parenting Services
Resources (both time and money) were reported to be mostly spent on targeting parents
and on work with younger age children.

xvi
The most popular strategy for encouraging and sustaining parents’ attendance was
developing relationships with parents. This strategy was reported by 99% of centres.
A strong focus of services was to improve parenting behaviours. Staff responses included
working with parents to: demonstrate modelling behaviours (100%), how to praise their children
(97%), how to increase interactions between adults and children (97%) and develop an increased
parental interest in their children’s lives (97%).
Evidence-Based Practice (Chapter 4)
This chapter considers the decisions that the centre management make regarding the use of
evidence-based practice, and particular programmes, strategies and interventions that have been
chosen for use with families. The chapter presents a snapshot of programmes that children’s
centres were offering to families in 2013 and reports how this picture differs from the programmes
offered in 2012. Evidence-based programmes are particularly pertinent given the large focus on
parenting within the programmes themselves.
Changes in Programmes, Strategies or Interventions that were offered between 2012 and 2013
There was a consistency in the number of programmes that centres offered in 2012 and
2013. Each centre was implementing an average of five programmes in both years, of which only
one was likely to have featured on the early years list of Evidence-Based Programmes by Allen
(2011).
There was a consistency in the most commonly used programmes offered in 2012 and
2013. The three most commonly used well-evidenced programmes were: ‘Family Nurse
Partnerships’, ‘Incredible Years’, and ‘Triple P’. The five most commonly used programmes which
were not included on Allen’s (2011) list of Evidence-Based Programmes were: ‘Every Child A
Talker’ (ECAT), ‘Freedom Programme’, ‘Infant/Baby Massage’, ‘Family Links Nurturing
Programme’, and the ‘Solihull Approach’.
Only two programmes showed a change in use across the two years; the Solihull Approach
(which increased) and Family Links Nurturing Programme (which decreased). The
implementation of ‘Family Links’ was reduced (by 5 centres, a reduction of 4.5%), although many
were still “in a position to implement”. The implementation of the ‘Solihull Approach’ was
increased (by 13 centres, an increase of 11.6%). Well-evidenced programmes showed little
change in implementation across 2012 and 2013.
Aims for Families and Parenting Services (Chapter 5)
Chapter 5 presents information collected from staff who were directly involved in the delivery of
parenting services, including those engaged in outreach and family support within homes. Three
areas of focus were explored in detail; these included the characteristics and needs of families

xvii
attending children’s centres; staff reported aims for parenting services and, staff reported benefits
for children and adults as a result of attending ‘play and learning’ activities at the centres.
The Characteristics of Families Attending Children’s Centres and their Needs
Staff were most likely to emphasise factors and needs of the whole family when describing
centre users, followed by parent factors/needs. Staff most frequently referred to types of
family structure (e.g. lone and young parent families) and the variety of family needs. References
were made to both the vulnerability (e.g. involvement of Social Care) and the variety of socio-
demographic characteristics of the participating families.
Definitions of the ‘most disadvantaged’ families were more likely to emphasise parent
factors or needs, followed by the needs of the family. Staff reported factors such as the
parents’ personal situation, poverty, inadequate housing and lack of socialisation; or factors
relating to their personal life skills.
Staff acknowledged three potential barriers which could pose a challenge to working with
the families: 1) parental relationships with staff, 2) staffing, including time allotted to
families, and 3) centre administration, resources, and finance.
The Aims for Parenting Services in Children’s Centres
Centre staff most commonly described aims for meeting the needs of the Parent-Child,
followed by the parents’ Personal Needs. Frequently reported aims included improving
parenting skills (73% of centres) and furthering parent knowledge about good parenting and child
development (40%), as well as improved child outcomes (58%) and experiences (45%).
The Benefits of ‘Play and Learning’ Activities for Families (Children and Parents)
Staff reported a number of benefits consistent with the EYFS areas of children’s
development as a result of attending ‘Play and Learning’ activities, including ‘Personal,
Social and Emotional Development’, ‘Physical Development’, and ‘Understanding of the
World’ (91%, 65% and 59% of centres respectively). School readiness was also listed as an
important benefit across 52% of centres, as well as providing an opportunity for children to interact
with others (32%).
Staff reported a number of benefits for adults which matched the commonly listed aims for
parenting services. The greatest benefits were reported for improving Parent-Child needs,
followed by the parents’ Personal Needs (95% and 87% respectively). Frequently reported
benefits included improved parenting skills, greater knowledge of child development, and
increased confidence in parenting.
Other benefits highlighted by staff included the supportive environment of the centre and
furthering parents’ knowledge through provision of advice and information (65% and 31%
respectively). It was interesting to note that, even when asked about benefits for adults, staff
reported benefits that addressed the Parent-Child relationship.

xviii
Strategies and Progression into the Future (Chapter 6)
Chapter 6 will describe the supportive strategies used with children and parents. General
strategies implemented by the children’s centre staff are also discussed, as well as staff hopes
and plans for future centre working.
Strategies for Working with Children
Staff reported using a number of strategies with children such as the provision of
Opportunities and Interactions (92% and 45% of centres respectively: strategies resembling the
‘Opportunities, Recognition, Interaction and Model’ framework known as ORIM [Hannon 1995]).
Other strategies described as being used with children included the development of school
readiness (47%), meeting individual needs (34%), and creating a supportive environment (33%).
Strategies for Working with Parents
Strategies used with parents could also be aligned with the ORIM framework, including the
provision of Opportunities, followed by Modelling, Interactions and Recognition (90%, 88%,
87% and 34% of centres respectively). In addition to this, staff reported a number of other
strategies, such as encouragement and empowerment (90% of centres), meeting individual needs
(85%), and providing information and knowledge (83%). Across the sample, all but one of the
aforementioned strategies were used to support parent-child needs (98%).
Centre Strategies
Staff also referred more generally to the importance of providing a multi-agency response,
a variety of service types, and promoting centre services (66%, 62% and 39% respectively).
Children’s Centres’ Hopes and Plans for the Future
The majority of staff reported that services and provision should be the key focus for future
working, particularly keeping the centre open and sustaining the current level of services
on offer, as well as providing additional services, and commenting on the focus of groups
and services that will be offered in the future (across 94% of the centres). Other areas of
focus for the future (in order of prevalence) included family involvement and engagement with the
centre (65%), organisation and management practices (64%), staffing (63%), family needs (50%),
and facilities and resources (44%).
Parental Views and Experiences (Chapter 7)
This chapter presents how parents perceive the support that they receive at children’s centres; the
frequency with which parents use their centre; motivations for attending centre sessions; and their
overall impressions of centre services. Background information on the parents was also collected.

xix
Parental Use of Children’s Centres
On average, parents visit their children's centre “at least once or twice a week”.
On average parents attend more than one children's centre, as it allows them to access a
wider variety of services. Parents indicated that the top three reasons to attend other children's
centres were: to attend a variety of sessions, to allow their children to play within a variety of
children's groups, and to attend a specific session.
Most parents have been attending their children's centre for less than three years (78%).
The majority of these parents have been attending their centre for one or two years.
Reasons Parents Attend Children’s Centres
Parents predominantly attended children’s centres for the benefit of their child. The most
frequently reported reasons for attending children’s centres were as follows: allowing children to
meet and play with other children (97% of parents); giving children access to a variety of activities
(95%); children’s enjoyment of centre sessions (93%); parents’ enjoyment of attending with their
children (92%); parents wanting to help their children learn (84%); and to help prepare children for
nursery or school (78%).
Parental Impressions of the Children’s Centres
The vast majority of parents indicated that they were “very happy” with the services provided to
them by children’s centres (92% of parents). No parents indicated that they were “very unhappy”
with any of the services offered.
Parents referred to a number of benefits for their children including improved personal, social,
and emotional development, as well as improved physical development, as a result of attending
centres.
Conclusions (Chapter 8)
This report detailed the delivery of parenting services across children’s centres. Centre
respondents’ concerns for the future reflect centres’ needs to respond to shifts in policy direction,
as well as financial reductions, workload, staffing pressures and managerial restructuring. The
shift from universal to more targeted provision (as observed in 2012 fieldwork) has had, and will
continue to have, direct implications on the engagement of families using children’s centres.
A large element of children's centre work appears to be catered towards working with the parent
and child together as a unit, and specifically the development of parenting skills. However, staff
also showed a dedicated focus on improving outcomes and experiences for children (when they
were referring to parenting). It was interesting to note an alignment between the benefits of
attending children’s centres, as reported by staff members and parents, with both identifying
benefits for the parent and child as a unit in terms of greater knowledge of child development and
increased confidence in parenting.

xx
This research has shown that children’s centres are continuing to offer a varied range of provision,
targeting all areas of parental and family needs. Children’s centre staff should be credited for
creating a welcoming and supporting environment for both parents and children (as reflected in the
findings of this parenting report) despite the many internal and external pressures that were driving
the evolution of centre services.

1
1 Introduction [Paget, Evangelou, Eisenstadt and Goff]
This report begins with the concluding remarks by Moran, Ghate, and Merwe (2004) in their review
of the international evidence of ‘What works in parenting support?’ which states:
“Research indicates that there are many families in the community who could benefit from
parenting support in one form or another, although attracting parents and engaging them with
programmes remains a challenge. Unfortunately, in the UK, the burgeoning number of parenting
support programmes in recent years has not been matched by a rise in the number of high quality
quantitative and qualitative studies carried out to evaluate them. Consequently, the evaluation
literature only provides us with a partial picture of ‘what works’, and only partial understanding of
why some programmes work better than others. Nevertheless, clear messages have emerged,
showing that provision of parenting programmes still represents an important pathway to helping
parents, especially when combined with local and national policies that address the broader
contextual issues that affect parents’ and children’s lives.”
Moran et al. (2004:10-11)
At the most general level, parenting support can be divided under four broad headings: socio-
cultural and economic support, community support, family (parent-child: parent-parent) support,
and individual parent support (Moran et al., 2004). Support offered in all four areas is often
referred to as ‘a holistic approach’ or ‘the ecological model’ (Bronfenbrenner, 1994, 1979), and
although it is considered ideal, Moran et al. (2004) suggest that addressing the needs and
concerns of parents in all four areas is a difficult task indeed. In addition to informing the broader
ECCE study, this report will add to the body of evidence that supports parenting interventions and
the ways they work with families and their children. This chapter offers a short background to the
area of parenting support on a national level as well as information on the evaluation of relevant
interventions and the conceptual model that frames this study’s design, instrument creation, and
data analysis.
For an international perspective of parenting support, see Appendix Ap1. Parenting support can
be tentatively defined as a range of measures which support parents in their efforts to socially and
culturally adjust to their surroundings, access appropriate economic resources and services,
understand the social, emotional, psychological, educational, and physical needs of themselves,
their children, and their families as a whole, and engage families with their communities (Smith,
1996).
The following chapter aims to conceptualise the term ‘parenting support’ in terms of the parenting
programmes and architecture available to families across England. The chapter will then focus
more deeply on three UK-based parenting support evaluations (the National Evaluation of Sure
Start; the National Evaluation of the Early Learning Partnership Project; and the Flying Start
Evaluation) to elicit some of the issues and considerations faced by similar studies, before
considering the Evaluation of Children’s Centres in England (ECCE) as reported here.

2
1.1 Conceptualising Parenting Support in England
Parenting and parent support in England has a long history1. Mainly delivered through the
voluntary sector and local government statutory services, Family Centres established in low-
income communities in the 1970s provided a wide range of parenting services. The central
Government’s interest in parents and parenting services can be dated back mainly to the early
days of the Labour Government. The intense efforts to reduce child poverty included a twin track
approach: affordable childcare to enable poorer parents to work, and community-based family
services to ensure children got the best start in life. The most ambitious of these community-
based services was Sure Start.
Sure Start, established in 1999, was area-based, that is, areas would be selected for Sure Start
funding based on poverty indicators, but once selected, all families with children under four years-
old in the area would be able to access Sure Start services. Each area was intended to reach
about 800 young children. The main aim of the programme was to narrow the gap in outcomes
between poor children and their more affluent peers. This would be done by providing new
services for families, as well as ensuring existing public services worked together to improve child
outcomes. In 2004, the Government published ‘Choice for Parents, the Best Start for Children: a
ten year strategy for childcare’ (Department for Education and Skills, 2004). This document
moved Sure Start from an area-based initiative to community-based provision for all, changing the
notion of a Sure Start Programme to a Sure Start Children's Centre (SSCC). The intention was for
the establishment of 3,500 children's centres in England.
The goal of children’s centres, like Sure Start, was to enhance the health and development of
children in England under the age of four years-old. This was undertaken with the understanding
that successful interventions in the earliest years offered the greatest potential benefits (Glass,
1999); that family support (including parenting support) could have positive and persistent effects
on both child development and families (Glass, ibid); and that parenting has a strong mediating
effect between the home and the services offered by the centres on children (Belsky, Melhuish,
Barnes, Leyland, Romaniuk, 2006). Parenting support therefore continued to be central to the
children’s centre programme goals.
SSCCs have a broad remit to include outreach/home services; support for good quality play,
learning, and childcare experiences for children; primary and community health care; advice to
parents about child and family development; and support for people with special needs including
access to specialised services (as also noted within Belsky et al., 2006). Parenting support in
England was then defined to be the coordinated and multi-disciplinary provision of health,
educational, and social services to families with children under the age of four years-old (Gray and
Francis, 2007). This parenting report focuses specifically on the parenting services that children’s
centres offer. A holistic model of parenting support (illustrated in Figure 1.1) was used in this
study, building upon Moran et al’s conceptualisation of parenting support (2004), and previous
pilot research carried out with managers of children’s centres which aimed to define how centre
staff conceptualise their work with families.
1 For an international contextualisation of parenting support, see Appendix Ap1.

3
Daly (2013) described England as having in place “the most elaborate architecture anywhere for
parenting support” (p.164) including, the existence of a national institute for family and parenting,
an academy specifically set up for the training and monitoring of the parenting workforce, and a
national network of children’s centres. Current Government policy has maintained the earlier
interest in parenting, both as an explanation for the social disparity in child outcomes, and as a
means to narrowing the gap in outcomes through improving parenting practices. This has been
accompanied by an emphasis on reaching the most disadvantaged (or neediest) families, and a
policy discourse about child poverty that has shifted the explanation for poor outcomes onto
inadequate parenting, rather than a lack of families’ financial resources (see Field, 2010; Allen,
2011). While parenting is clearly the main driver of child outcomes, research consistently
establishes a co-relation between family stress caused by low income, poor parenting capacity,
and adverse child outcomes (see Cooper and Stewart, 2013).
Figure 1.1 ECCE study’s conceptualisation of parenting support, inspired by Moran et al. (2004)
Recent ECCE research from the first ‘visits to children’s centres’ found that more informal open
access services are reducing, while more targeting on families with complex needs is increasing
(Goff, Hall, Sylva, Smith, Smith, Eisenstadt, Sammons, Evangelou, Smees and Chu, 2013).
These families require more specialist interventions and are significantly more costly to support
than the wider group of families with less severe problems. As detailed in the report of the first
‘visits to children’s centres’, while these well-researched programmes are being delivered with
fidelity, they reach very few families (perhaps 20 per year), and are expensive to run.
1.2 Parenting Support Evaluations in the United Kingdom
In order to contextualise the children’s centres evaluation within the United Kingdom (UK), a short
summary of other similar evaluations is offered here including the National Evaluation of Sure
Start (NESS) in England, the Early Learning Partnership Project (ELPP) in England, and the Flying

4
Start evaluation in Wales. This is by no means a comprehensive literature review; it is an attempt
to place the study into its relevant context.
1.2.1 National Evaluation of Sure Start (NESS) Impact Evaluation Summary
The National Evaluation of Sure Start (NESS) used an integrated cross-sectional, longitudinal
framework to examine the effects of SSCCs on children, families, and communities (Melhuish,
Belsky, and Leyland, 2012a). The centres aimed to support young children aged from birth to four
and their families, by integrating early education, childcare, healthcare, and family support
services in disadvantaged areas across England (Melhuish, Belsky, Macpherson, and Cullis,
2010). These support services were designed to enhance the health and wellbeing of children
and families, as well as to prepare them to be academically, socially, and occupationally
successful as they move through school into adulthood (Melhuish, Belsky, and Leyland, 2010).
NESS hoped to identify the conditions under which Sure Start was most effective in improving and
enhancing child, family, and community functioning (Melhuish et al., 2012a). The evaluation
consisted of a national survey of all 260 Sure Start programmes, an in-depth study of 26
programmes, and a series of themed evaluations (Melhuish et al., ibid).
While the NESS Impact Evaluation looked in detail at child outcomes across different age groups,
this short review focuses on parenting outcomes alone. With regards to parenting, a 2007
evaluation of parenting support programmes revealed wide variation of implementation across
SSCCs (Barlow, Kirkpatrick, Wood, Ball, and Stewart-Brown, 2007). The report suggested that
there was some evidence that the parenting support programmes were effective when ‘good
practice’ was apparent (Barlow et al., 2007); this concept of ‘good practice’ seemed to be directly
related to the knowledge and skills of the children’s centre workforce.
Overall, parents reported that the parenting programmes worked well for them, that they felt safe
in the centre’s environment, and that they liked the structured nature of the courses. The report
further stated that parents did regularly attend parenting support programmes and that they
attended these programmes for sustained periods. Central to parents attending the programmes
was the maintenance of trusting relationships with the centre staff including the promotion of a
non-judgemental, relaxed, and informal environment. Parents reported that the socialisation
opportunities, the skill building knowledge, and the opportunity to get out of the house for a ‘break’,
were major programme attendance motivators. It was suggested that there were very few
programmes for fathers in the centres and that more of these programmes were needed; also that
structured parenting support programmes should be provided alongside a broad range of
accessible family support services in the centres (Barlow et al., ibid).
1.2.2 Early Learning Partnership Project Evaluation (ELPP) Summary
The Early Learning Partnership Project (ELPP) was funded by the Department for Children
Schools and Families (DCSF) and spearheaded by the Family and Parenting Institute (FPI).
ELPP aimed to implement family-based educational support in an effort to address the cumulative
cycle between disadvantage and poverty in ‘at risk’ children aged one to three in England

5
(Evangelou, Sylva, Edwards, and Smith, 2008). ELPP involved nine voluntary sector agencies2
working with a combination of 12 approaches3.
The aim of the evaluation was to examine the processes and outcomes of implementation at an
organisational level in order to guide the development of further similar initiatives, and to gather
information on the extent to which these initiatives can and do support parents in their efforts to
support their children’s’ learning. The ELPP evaluation demonstrated that it is possible to reach
and engage vulnerable families in disadvantaged areas and help those families to support their
children as learners. Through qualitative analysis of interviews with parents, the evaluation further
suggested that there was improvement in parents’ relationships with their children, and that the
programmes helped parents to organise their child’s home environment and to provide more
opportunities for children to learn from day-to-day activities outside of the home. Many parents
reported that changes occurred in their attitudes towards discipline, their use of praise and their
emotional warmth. As a result of ELPP, parents reportedly felt more confident in their knowledge
to support their child and more aware of the need to give time and dedication to developing a
relationship with their child (Evangelou et al., ibid).
1.2.3 Flying Start Evaluation Summary
Flying Start Centres were launched in 2006/2007 in Wales, as an area-based programme aiming
to improve outcomes for families and children under the age of four, in some of the most
disadvantaged areas of Wales (Knibbs, Pope, Dobie, and D’Souza, 2013). The programme
focused on four key elements of support: enhanced health visiting, parenting support, support for
early language development, and free high-quality part-time childcare for two to three year-olds.
The Wave 2 evaluation on which this summary is based, was designed to estimate the impact of
the programme in terms of service outcomes, parent outcomes, and child outcomes (Knibbs et al.,
2013). The evaluation was carried out between 2007 and 2013 by Ipsos MORI (a market research
company) and SQW (an independent provider of research, analysis and advice in economic and
social development); and relied on a large-scale survey of 1,033 parents in Flying Start areas and
1,083 parents in selected comparison areas.
The results suggested that the Flying Start programme had been successful in bringing families in
the least disadvantaged areas of Wales up to the conditions experienced in the relatively less
disadvantaged comparison group of areas in Wales (Knibbs et al., 2013). More specifically, the
report showed that families in Flying Start areas had more contact with health visitors and had a
better awareness of parenting and language support programmes, as reflected in the take-up rate
of centre sessions (12.5% more of the Flying Start group reportedly attended at least one or more
sessions). Improved parenting behaviour was a medium to long-term aim of the Flying Start
Programme, yet, despite more health-visitor contact and a higher take-up of parenting
programmes, analysis showed no difference in parental self-confidence, mental health or home
2 Barnardo’s; ContinYou; Coram; the Family Welfare Association [FWA]; Home Start; National Children’s Homes
[NCH]; Pen Green; the Pre-school Learning Alliance [PLA]; and Thurrock Community Mothers [TCM] 3 Bookstart; Campaign for Learning; Home Start’s Listening and Learning with Young Children; I CAN; Newpin’s
Family Play Programme; One Plus One’s Brief Encounters; Parents As First Teachers [PAFT]; Parents, Early years and Learning Programme [PEAL]; Peers Early Education Partnership [now known as Parents Early Education Partnership: PEEP]; Parents Involved in their Children’s Learning [PICL]; SHARE; and Thurrock Community Mothers [TCM]

6
environment measures. Qualitative data from the same study, however, did show that Flying Start
parents reported how the programme helped them to become more confident as parents, with a
greater understanding of their child’s behaviour and educational developments.
1.2.4 Summary of Parenting Support Evaluations in the United Kingdom
This snapshot of relevant UK studies shows that evaluations of more complex service provision
tend to draw on both quantitative data (administrative data; primary large-scale survey data) and
qualitative data (interviews; focus groups; observations) and often adopt a longitudinal design with
follow-up visits to centres and families, assessing child functioning over time and measuring gains
in their development. These evaluations tend to use a range of well-established instruments to
measure parents’ skills and behaviour, child development, health and economic outcomes; utilise
research teams with diverse expertise; evaluate different aspects at different levels
(implementation, variation and impact); and draw data from different sources (policymakers, senior
managers, project workers, populations targeted by evaluation, users etc.). In addition, many of
the evaluations have used large samples by assessing multiple settings in various locations. The
common characteristics of these programmes are multifaceted; target many foci i.e. parenting
needs, child outcomes, implementation of delivery, economic factors; are multigenerational
(parents and children); and operate within a multi-agency context.
The three aforementioned UK studies all aimed to target or evaluate services aimed towards
families within less disadvantaged areas, and commonly sought to improve standards of health
and well-being for families, parents and children; significant improvements were noted across
these areas. While some programmes targeted school readiness (SureStart; Flying Start),
improved cognitive outcomes for children were not found within targeted intervention areas
(Melhuish et al., 2010; Knibbs et al 2013) although improved family functioning was frequently
reported. The three studies all found that working closely with parents through centre support and
services helped to educate them in a greater understanding of child behaviour and development.
Children’s centres are known to offer a range of varied support for parents, covering areas such as
those detailed by Moran et al. in 2004. The authors remind us however, that whilst an ecological
perspective to support is best practice, it is very difficult to maintain this support. The ECCE study
of children’s centres was designed to capture the holistic approach of children’s centres, whilst
keeping in mind other evaluations carrying out data collection from users of the service. In
particular, this element of the study focuses on parenting services within children’s centres, and
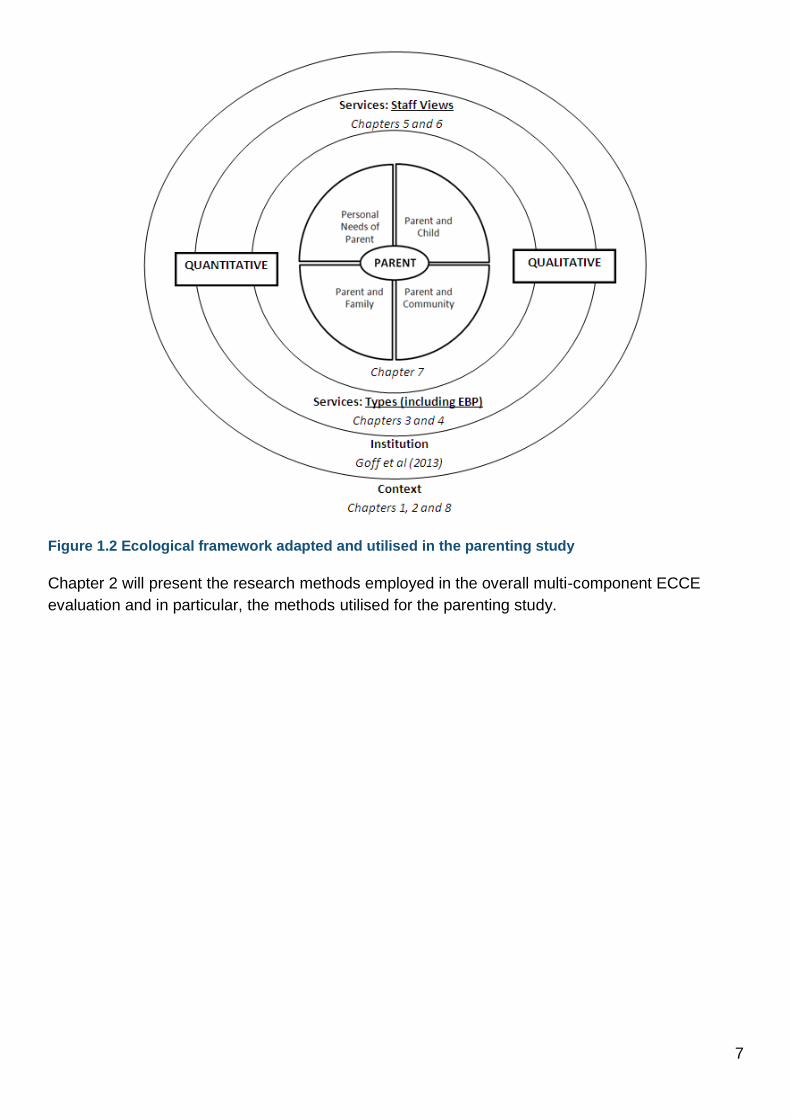
positions parents at the heart of the investigation: see Figure 1.2. The ecological framework of
Bronfenbrenner (1994, 1979) has inspired this study. The outer circle is the institutional context
that parental support is taking place within, namely the children’s centres (the first report of centre
visits: Goff et al., 2013). One layer closer to the parent are the types of services on offer (Chapter
3), including Evidence-Based Practice (Chapter 4). On the same level, there is evidence of the
staff views on service delivery (Chapters 5 and 6). Coming closer to the centre, there is a focus
on giving a ‘voice’ to the parents by asking them their views of the parenting services on offer at
the children’s centres they are attending (Chapter 7).
7
Figure 1.2 Ecological framework adapted and utilised in the parenting study
Chapter 2 will present the research methods employed in the overall multi-component ECCE
evaluation and in particular, the methods utilised for the parenting study.

8
2 Method [Evangelou and Goff]
This report presents findings from a study on children's centre provision for parenting services, as
collected in 2013. This is the sixth report4 drawn from a multi-component longitudinal evaluation
entitled the Evaluation of Children's Centres in England (ECCE). The data presented within this
report represents one element of the longitudinal study (parenting services) which falls into Strand
3 of the evaluation (full details of which are listed in Appendix 2.3), however from here on, it will be
referred to as the 'parenting services' study.
2.1 Sampling of Target Children’s Centres
The ECCE project utilises a nested design, with those children’s centres participating in Strands 2
to 5 having been selected from the larger pool of approximately 500 centres taking part in Strand 1
(details on the Strands can be found in Appendix 2.3). In total, 121 centres participated in the first
wave of Strand 3 ‘visits to children’s centres’ fieldwork in 2012. All 121 centres were again invited
to take part in the 2013 parenting services study discussed within this report, of which 117 centres
participated. Appendix 2.4 and Figure Ap2.1 in the Appendix provides further detail on the
sampling and stratification of target centres.
The achieved parenting study sample cannot be considered as representative of all children's
centres, as it did not contain any Phase 3 centres, known to provide access to services for those
families living in less disadvantaged and more affluent areas (DCSF, 2007). The sample are likely
to remain broadly representative of only those Phase 1 and 2 centres that were in existence and
operating in 2013. No definitive claims to generalisability can be made because the sample may
not be fully representative of the national picture.
2.2 Conceptualising Provision for Parents within Children’s Centres
Developing a coherent and encompassing conceptualisation of parenting support requires
recognition of all the components and actors of such a complex concept. Parenting support is a
major focus of the children’s centres programme; it is well established that child well-being is
largely determined by high quality parenting (Asmussen, Matthews, Weizel, Bebiroglu and Scott,
2012). To enhance high quality parenting, children’s centres services aim to develop knowledge,
skills, and confidence in parents. Evaluations of complex provisions, such as this children’s
centres evaluation, tend to draw on both quantitative and qualitative data. The parenting services
fieldwork aimed to capture the diversity and range of provision available to parents within
children’s centres in 2013. It was deemed important to capture not only the views of the members
of staff, but also of the parents who were attending the centres and participating in the study.
4 Other published ECCE reports:
Strand 1 - Tanner, Agur, Hussey and Hall with Sammons, Sylva, Smith, Evangelou and Flint (2012).
Strand 2 – Maisey, Speight, and Haywood with Hall, Sammons, Hussey, Goff, Evangelou and Sylva (2013).
Strand 3 – Goff, Hall, Sylva, Smith, Smith, Eisenstadt, Sammons, Evangelou, Smees and Chu (2013).
Smith, Noble, Smith, Plunkett, Field and Smith (in press).
Strand 5 - Briggs, Kurtz and Paull (2012).

9
The parenting fieldwork aimed to capture the integrated multi-agency practices and services
provided by children’s centres for parents, specifically:
the provision for parenting and services for parents across the sample;
staff perceptions on family needs;
the range of parenting programmes delivered by the named children’s centre and any
associated centres within their cluster;
how children’s centres manage their services;
staff perceptions of the benefits of centre services for parents and children; and
parental views of the children’s centres services.
2.3 Instrument Development
It was first necessary to develop research tools which would focus on the range of activities and
support available, centre priorities behind parenting support, assessment of family needs, and the
perception of outcomes for parents and children. During the development of research
instruments, it was of primary importance to keep in mind the revised ‘Core Purpose’ of children’s
centres as defined by the Department for Education in 2013:
“The core purpose of children’s centres is to improve outcomes for young children and their
families and reduce inequalities between families in greatest need and their peers in:
child development and school readiness;
parenting aspirations and parenting skills; and
child and family health and life chances.”
Sure Start Children’s Centres Statutory Guidance (2013:7)
The first research report on the ‘visits to children’s centres’ (Goff et al., 2013) showed that
children’s centres were offering a range of both child-centred and family-centred services, some
involving extended members of the family, some focusing explicitly on adults’ skills and needs,
some focusing more on the child, and other services and activities focusing more explicitly on
capacity-building in the community (such as working with volunteers or youth groups and
community groups). The five services most commonly reported by children’s centres in 2012 were
as follows: stay and play (n=119 children’s centres), evidence-based parenting programmes
(n=112), early learning and childcare (n=110), developing/supporting volunteers (n=110), and
breastfeeding support (n=109). The more frequent services therefore appeared to be aimed at the
parent, designed to either directly or indirectly benefit children.
Guided by the review of literature and lessons learned from 2012 fieldwork, ECCE researchers
conceptualised the issue of ‘parenting’ and ‘provision for parents’ within children’s centres. This
study took a holistic approach to parenting support; in making the parent the central focus their
various external needs can be represented as stemming outward from the individual’s immediate
situation to larger needs or societal demands. Ideally, children’s centres should provide a range of

10
services to address these needs and the researchers hope that the model is representative of the
way children’s centres approach their work with parents.
In addition, it was thought imperative to describe how parents view the support they receive from
children’s centres. It was not relevant to ask parents the same questions as those asked of staff,
however, the research team believed that including the parental voice was very important.
Many of the children’s centre services listed in Goff et al (2013) could be categorised into at least
one of four ‘areas of parental lives’. Two of these areas (displayed as quadrants within Figure 2.1)
represent needs which relate to individuals that are close to them, i.e. children and family/partners,
and two reflect the parent as an individual, i.e. in terms of their own personal needs and their
community:
1. Parent and Child: Stay and play was the most widely used service of all listed across the
sample of children’s centres in 2012. Centres also reported delivering evidence-based
parenting programmes (n=112), breastfeeding support (n=109), home-based outreach services
(n=102), and general home-based services (n=98).
2. Personal Needs of the Parent: In 2012, centres reported delivering services that targeted the
personal needs of parents, for example, adult learning (n=105), housing advice or information
(n=81), debt advice (n=80), English for Speakers of Other Language classes (ESOL, n=55),
basic ICT and job skills courses (n=52), peer support (n=39), and further education (n=39).
3. Parents and Family: Some centres in 2012 were offering specific services aimed at family
members, for example, father and male carer groups. Whilst members of the family were often
invited to many of the more generic centre services (such as stay and play sessions), other
services aimed to involve specific members of the family, including peer and family support,
parenting classes, or relationship support (n=107 centres). Domestic violence was reported by
many children’s centres as a problem associated with unemployment and poverty, and centres
reported running programmes such as the ‘Freedom Programme’ specifically for this purpose.
4. Parent and the Community: Centres in 2012 frequently gave parents opportunities to
volunteer within the centre or join a parent forum. Centre managers reported supporting
volunteers (n=110), working with community groups (n=78), and holding a parent forum (n=78)
- all of which can afford the parents the opportunity to become more involved in the community
as well as increase labour market participation.
Figure 2.1 displays how ECCE researchers chose to categorise the way children’s centres support
parents according to their needs, taking into consideration other individuals in their lives.
Fieldwork materials were developed to reflect this and information on these areas was elicited
both from staff and parents where possible.

11
Figure 2.1 Possible needs of parents that may be targeted by children’s centres
2.3.1 Instruments
A number of instruments were developed by the Oxford Research team in collaboration with other
members of the ECCE consortium (NatCen Social Research and Frontier Economics) and the DfE
to assess the centres’ provision for parents. The majority of the instruments were piloted in five
children’s centres between June and July 20115. The study used a mixed methods design and
collected data through both quantitative and qualitative techniques, as summarised in Table 2.1.
The quantitative data collected from the parenting fieldwork will be used in different ways: for the
needs of the current report, for the overall report on ‘visits to children’s centres’ (Strand 3, in the
summer of 2014), and for the upcoming ‘Impact’ report (Strand 4); summary variables were
created and can be found documented in Appendices Ap3.2 and Ap3.7.
This parenting report presents data collected at different time points. The majority of the data
reported here was collected in 2013 using questionnaires and interviews with staff and parents
(presented throughout Chapters 3-7). In addition, staff were asked to complete an almost identical
5 With the exception of the staff interviews which were piloted in a further two children’s centres in February 2013.
The initial five ‘pilot’ centres comprised of the same centres who took part in the piloting work for the first centre visits in 2012: these centres were then eliminated from the sampling procedures used for the main study. The remaining two pilot centres were chosen as a convenience sample after the main ECCE sample (discussed in Section 2.1) had been selected, and were already known not to be part of the ECCE study.

12
questionnaire to the one they had completed in 2012; the research team were then able to
compare responses across the two years (Chapter 4).
Table 2.1 A mixed methods design and its areas of data collection
Quantitative Components:
Whom Topic/Area
Centre managers (or those in a managerial capacity)
Questionnaire on parenting services
Member of staff leading family/parenting support
Questionnaire on parenting services
Member of staff most knowledgeable about the family and parenting interventions/ programmes run through the centre
Questionnaire on Programmes, Strategies and Interventions
Parents at the centre Questionnaire for Parents
Qualitative Components:
Whom Topic/Area
Centre managers (or those in a managerial capacity)
Questionnaire on parenting services
Centre session leader Semi-structured interview
Member of staff carrying out family support or outreach in homes
Semi-structured interview
Parents at the centre Section from Questionnaire for Parents – information about sessions
2.4 Data Collection
The researchers attended a training day with the research coordinator and principal investigators
at the University of Oxford in December 2012. The same six researchers recruited to work on the
first ‘visits to children’s centres’ in 2012 were trained to carry out return visits to children’s centres
for the parenting study in 2013. The research coordinator who led the pilot and field
implementation in 2012 led the fieldwork implementation in 2013.
2.4.1 Recruitment, Visit, and Completion Rate
Fieldwork was carried out between February and July 2013. An introductory letter was sent to all
121 children’s centres who had taken part in the first ‘visits to children’s centres' in 2013 (Appendix
2.1). Centres were preferentially allocated to those researchers who had completed the fieldwork
visit in 2012, and where this was not possible, the centres were reallocated to the geographically
nearest available researcher. Data6 was collected from a variety of individuals (through
interviews7 with practitioners and parents), questionnaires8, as well as details of the researcher’s
own perceptions of the children’s centre.
6 The study had approval from the Central University Research Ethics Committee (CUREC), see Appendix 2.2.
Further information on 'CUREC' is available through this link. 7 Interviews were conducted with up to five parents attending a stay and play session, a member of staff running
sessions at the centre, and a member of staff who carried out family support and/or outreach work in parents’ homes.

13
One hundred and seventeen centres agreed to take part in the parenting fieldwork. Whilst
managers were still feeling time-pressured, the majority were keen to continue supporting the
researchers with the evaluation, something for which the evaluation team is grateful. Some centre
visits in 2013 were classed as only “partially completed” as time constraints meant that a few
centre staff could not complete all of the questionnaires ahead of the visit. Of the four centres that
were unable to take part in the parenting fieldwork, three did not happen owing to reasons of
centre reorganisation and change rather than reluctance to support the ECCE study.
Visits were classified as either “partial” or “full” depending on how much of the research visit was
carried out in 2013. Partial visits were defined as those collecting at least some data on a few of
the fieldwork elements9. “Full visits” collected some data on all areas of interest. Overall, 97 per
cent of the original 121 centres visited in 2012 provided some information on all listed areas of
interest. Table 2.2 details the extent of data collection across the 117 centres visited in the
parenting study.
Table 2.2 Breakdown of visits to the 117 children’s centres visited in the parenting study (2013) in
terms of extent of data collection
Type of visit Total number % of completed visits
Full 103 88
Partial 14 12
TOTAL 117 100
The following chapters draw on the data collected from the 117 children’s centres visited in 2013.
Chapter 3 reports on the delivery of parenting services within children’s centres; Chapter 4 details
the use of evidence-based practice with particular reference to programmes, strategies and
interventions used within the sample; Chapter 5 presents information surrounding the families
accessing children’s centre services and centre aims for parenting services, along with the staff-
reported benefits of attending particular services; Chapter 6 presents the strategies that children’s
centres are using with parents and children and their hopes for the future; Chapter 7 describes the
views of the parents attending sessions at the centres and their experiences of using the centre;
and finally Chapter 8 concludes the report.
8 Questionnaires were sent to the centre ahead of the visit for completion by the manager and the person who lead
the family support work (in some cases the setup of the centre meant that this may also be the manager). 9 E.g. questionnaires for the manager; questionnaire for the lead of family/support and outreach at the centre;
interviews with the manager; interviews with parents; interviews with the person leading sessions; and/or interviews with the person carrying out family support or outreach in parents’ homes.

14
3 Delivery of Parenting Services [Hall, Davis, Goff and Evangelou]
Key Findings:
What parenting services do children’s centres offer?
Certain induction procedures were commonly reported across the children’s centres.
The most frequently reported procedures included: the distribution of timetabled activities, the
requirement of registration documents, and the recording of a family’s cultural background.
Staff reported variations in the type of support offered for particular services. Such
services were more likely to be run via a centre session (for example crèche) or were offered
via personalised support (for example, parental isolation and mental health).
Few centres offered services off-site. Up to 21% of centres offered services off-site which
could include any type of support.
Staff reported the offer of service provision for parents’ personal needs to be variable.
Staff rated their centre’s offer of service provision for helping parents to access
childcare and improving parental health and lifestyles as the highest, and accessing
housing as the lowest. Staff rated their offer of service provision for family needs as
consistently higher than that for parents’ personal needs. Regarding the offer of service
provision for parents’ personal needs, 79% of centres self-assessed their provision for
accessing childcare as “Good” or “Excellent”; 84% assessed provision for parental health and
lifestyles as “Good” or “Excellent”; and only 42% of centres assessed accessing housing
provision as “Good” or “Excellent”, with 26% assessing this provision as “Limited” or “Very
Limited”. In comparison, at least 44% of all centres rated their offer of service provision for
family needs as “good”, and the majority of services were rated as “adequate” or above.
Half of the centres encouraged parents to get involved in the running of their centres.
Parents were encouraged to participate “a great deal” across 51% of centres, using strategies
such as crèche provision and advertising consultation sessions. Popular roles included
volunteering as a play worker or at community events, attending parent forums or advisory
board/governing bodies, and helping staff to choose which sessions are on offer.
Managing the delivery of services
Resources (both time and money) were reported to be mostly spent on targeting parents
and on work with younger age children.
The most popular strategy for encouraging and sustaining parents’ attendance was
developing relationships with parents. This strategy was reported by 99% of centres.
A strong focus of services was to improve parenting behaviours. Staff responses included
working with parents to: demonstrate modelling behaviours (100%), how to praise their children
(97%), how to increase interactions between adults and children (97%) and develop an
increased parental interest in their children’s lives (97%).
15
3.1 Introduction
This chapter reports on quantitative data collected from both managers of children’s centres and
members of staff responsible for family and parenting support in their prospective centres (117
centres participated). Data was collected through two complementary questionnaires that were
sent prior to the researchers’ visit to the children’s centres; data from the two questionnaires
addressed two areas. The first was the provision of parenting services, which asked the heads of
family and parenting support about the provision available for parents within their centre
(education, employment advice, housing etc.); what provision was available for parents’ personal
needs and for family needs; and the level of parent participation in the running of the centre. The
second questionnaire, completed by centre managers, addressed the ways and frequency to
which the centre monitored attendance and encouraged eligible families to attend. Managers
were asked about the mechanisms in place to train and support their own staff for supporting
families (e.g. working in multi-agency teams; training). In particular, they were asked about the
programmes provided, strategies adopted, and allocation of resources.
3.2 What Parenting Services do Children’s Centres Offer?
The provision of parenting services that were offered to parents10 and families was the main focus
of this fieldwork. Unlike other elements of the fieldwork, the centre respondent was not limited to
the manager of a centre. Instead, centres were asked to identify a member of staff who had
relevant knowledge of parenting service provision (here termed the ‘parenting coordinator’):
Appendix Ap3.1 describes these individuals.
3.2.1 The Induction Procedures Offered to Parents and Families
The induction procedures that centres had in place for new families (on their first or second visit)
are summarised by eight questions presented in Table 3.111. Three induction procedures were
particularly common (i.e. offered by 85% or more of the sampled children’s centres): distribution of
activity timetables, the filling in of a registration document12, and the recording of a family’s cultural
background. Furthermore, the distribution of Welcome Packs and the recording of medical
requirements were induction procedures that were “always” carried out by approximately half of
the centres. In contrast, the provision of full tours of the centre, meeting key staff, and
introductions to parent advocates were less commonplace.
10
‘Parents’ being used as a shorthand to include mothers, fathers, carers, and other adults with responsibility for looking after a child, including looked after children. 11
In addition, with a variable that summarises the provision of all eight activities which is presented in Appendix Ap3.2. 12
For further information on registration procedures within children’s centres, see Smith et al., in press.

16
Table 3.1 Induction procedures that were offered to new families on their first or second visit to a
children’s centre in 2013
“Please indicate how frequently the procedures below are offered to families as part of their induction to your centre (during their first or second visit). Families...”
Never
(%)
Occasio
nall
y (
%)
Half
of
the t
ime (
%)
Usu
all
y (
%)
Alw
ays (
%)
Are asked to fill in a registration document (n=104) 1 0 0 4 95
Receive a timetable of activities (n=105) 0 0 0 12 88
Are asked to provide the centre with information about their cultural background (n=100) 0 2 1 12 85
Are asked to provide the centre with information about their medical requirements (n=93) 12 18 1 14 50
Receive a welcome pack (n=92 centres responded) 17 8 5 21 49
Have the opportunity to meet key staff (n=102) 0 13 10 42 35
Receive a full tour of the centre (n=102) 4 28 13 32 23
Are introduced to parent advocates/parent forum members (n=97) 16 53 12 13 6 Note: all percentages have been rounded up to the nearest whole
Centre respondents (those described in Appendix Ap3.1) were then asked to provide information
about the support that their centre offered to parents within three sets of questions covering:
Support for Parents’ Personal Needs, Support for the Needs of Families, and Parent Participation
in the Running of the Centre. These areas will now be discussed.
3.2.2 Supporting Parents’ Personal Needs
Regarding Support for Parents’ Personal Needs, ‘Parenting Coordinators’ were asked a wide
range of questions which covered:
Specific centre services (n=9 questions)
Six areas of parental-need (education, employment, housing, finance, childcare, health) and
how these were covered by the services that centres offered (n=34 questions)
Each respondent’s self-rating of their centre’s offer of provision in support of these six areas
(from “very limited” to “excellent” in five steps; n=6 questions)
Nine services for supporting the personal needs of parents were asked about (Table 3.2). The
most commonly provided service was translation (offered by 97% of responding centres), while
sign language services and on-site Internet access were the least commonly provided services
(offered by 22% and 25% of responding centres respectively). The nine service responses shown
in Table 3.2 were then summed to produce a scale that captured the amount of services offered to
families to support their personal needs. Scores could range from zero (i.e. answering “no” to all
nine questions) to eighteen (i.e. answering “yes” to all nine questions). The average centre score
(achieved for n=107 centres) was eleven with a standard deviation of three.

17
Table 3.2 Services offered by children’s centres to support the personal needs of parents
“Do you currently offer any of the services below for parents’ personal needs? (N.B. ‘Yes’ is allowable if you are reinstating the service within the next month)”
No (%) 0
Sometimes (%) 1
Yes (%) 2
Translation services available when needed for non-English speakers during sessions (n= 106)
0 3 97
Outreach health work (n= 98) 11 25 64
Book library for parents/carers (can be centre-based or mobile) (n= 104)
32 12 56
Leaflets on specific subjects (e.g. breastfeeding, weaning, diet) (n= 102)
11 34 55
On-site family kitchen or cafe/accessible communal area with hot drink facilities (n= 105)
20 28 52
On-site health visitor (n=104 ) 23 42 35
Leaflets in non-English languages (may be centre timetables) (n= 102)
14 55 31
On-site computer with Internet for parental use (n= 106 centres responded)
41 24 25
Sign language services available when needed for deaf families during sessions (N.B. does not include actions carried out during singing time) (n= 104)
47 31 22
Note: all percentages have been rounded up to the nearest whole
Considering next the six areas of parental need (education, employment, housing, finance,
childcare, health), these mirrored the needs specified in Chapter 2. The support that was offered
by children’s centres as summarised across thirty-four different areas is detailed in Appendix
Ap3.3.
There was substantial variation in the support that was offered by children’s centres in 2013 when
providing for the various needs of parents. All of the sampled centres said that they provided
support in the context of parental mental health and healthy eating. By contrast, there were other
services and areas of need that were more commonly unsupported (up to a figure of 19% of the
responding n=107 centres). These less well-supported areas of parental need included: guidance
over parental leave (maternal and paternal), council housing support, advice when family
members were in prison, guidance over child-contact visits (for separated parents), and centre
access to National Health Service (NHS) Direct.
In terms of the type of support offered to parents, four levels were considered (generalised
information13, personalised information14, personalised support15, and centre sessions16). There
was substantial variation in the type of support offered (depending on the parental need). For
example, crèche facilities were most commonly offered via centre sessions (85% of centres)17;
13
Generic information offered to all parents which may include leaflets with information, notice boards, or general information sessions. 14
Catered information and advice/recommendation based on personal family circumstances. 15
Directly helping and supporting parents to achieve their goals by implementing advice. 16
A specific session/workshop/drop-in/clinic carried out within or by the centre, advertised as dealing with this subject. 17
Centre staff ticked ‘crèche’ according to their personal understanding of the definition. The finding here reports to crèche held as a centre session. Respondents were asked to tick all applicable options and thus multiple options were possible. Table Ap3.3 in Appendix 3.3 shows that 18 of the 107 centres referred families to a crèche and 27 of the 107 signposted families to a crèche.

18
whereas parental isolation and parental mental health needs were most commonly approached via
personalised support (respectively offered this way by 81% and 74% of centres).
When it came to directing parents to services outside the centre, signposting18 was much more
common than referrals19. However, there were exceptions to this; referrals of parents and families
(rather than signposting) were more common in the context of work-related training and services
targeting parental mental health. The offering of services off- [centre] site, though infrequent (no
more than 21% of the 107 centres), was also apparent across all the support that centres offered
and all the areas of parental need. Furthermore, this was true in terms of both the services that
were offered in other centres20 as well as those offered in non-children’s centre sites.
Centre staff were asked to rate their centre’s offer of provision (from “very limited” to “excellent”)
within each of the six areas of parental need (education, employment, housing, finance, childcare,
health), presented in Table 3.3. The areas which centres reported to offer the highest level of
provision for, were accessing childcare and parental health and lifestyle. Seventy-nine per cent of
centres rated themselves as offering “good” or “excellent” provision when it came to helping
parents access childcare, with this figure rising to 84 per cent of centres in the context of parental
health and lifestyle. By contrast, 26 per cent of centres rated their support to accessing housing
as either “limited” or “very limited” (42% claiming “good” or “excellent”).
Table 3.3 Children’s centre self-assessment of the level of provision (from “very limited” to
“excellent”) with which their centre supported six areas of parental need
“Thinking about these aspects [of parental need] how would you rate your [centre’s] overall level of provision for...”
Very
lim
ited
(%
)
Lim
ited
(%
)
Ad
eq
uate
(%
)
Go
od
(%
)
Excell
en
t (%
) Parental health and lifestyle (n=102) 0 1 15 57 27
Accessing childcare (n=101) 0 4 17 54 25
Education for parents (n=86) 2 11 21 49 17
Financial assistance (n=99) 0 16 22 49 13
Accessing employment (n=104) 2 10 29 52 7
Accessing housing (n=97) 6 20 32 38 4
Note: all percentages have been rounded up to the nearest whole
3.2.3 Supporting the Needs of Families
Regarding how centres supported the needs of families, centre respondents were asked a similar
set of questions to those concerning how they supported the needs of parents. A wide range of
questions were asked (n=35) that covered:
18
Passing on information to families about other services. 19
Passing on family’s details to other agencies, usually with the family’s permission. 20
Service offered at a linked or clustered children’s centre.

19
Seven areas of familial-need (partner emotional support, improving home environment, child
services, parenting, child health, child development, family services) and how these were
covered by the services that centres offered (n=35 questions)
Each respondent’s self-rating of their centre’s offer of provision in support of these seven areas
(from “very limited” to “excellent” in five steps; n=7 questions)
The services that were offered to families are detailed in Appendix Ap3.4. As with the support that
was offered to parents (Appendix Ap3.3), substantial variation was observed between services
and between the ways that the services were offered. For example, all centres offered services
that targeted parenting or child development. Lower percentages of centres offered facilities for
the registration of new births (32%) and before/after school care for older children (43%). A
number of recent reports have recommended the integration of the registration of new births into
children’s centres in order to improve early engagement of families (4Children, 2013; Royston and
Rodrigues, 2013).
Substantial variation between services can also be observed in the types of support (general
information, personal information, personalised support, centre sessions) that were offered to
meet the familial needs shown in Appendix Ap3.4. Services not only differed from one another in
terms of how they were most commonly offered, but also in terms of the number of centres that
offered them at all. For example, support for the reduction of family arguments was more common
across centres offering personalised support (56%, total n=108), whereas women’s refuge was
most commonly supported by the provision of general information (53%, total n=108) as opposed
to personalised information (48%, total n=108). The most immediate observation that can be
made when considering the types of support offered in the context of familial needs was the near
ubiquity of centre sessions for stay and play (97%, total n=107) and messy play (96%, total
n=107).
The signposting of services in support of familial needs was more common than referrals.
Furthermore, this is the same observation that was made when considering the services offered in
support of parental needs; this is not unexpected given that referrals involve informing a service
about a family, whereas signposting merely involves making a family aware of a service. The
services which were most clearly an exception to this trend were those that dealt with domestic
violence, provided home outreach, and offered speech and language support for children.
Paralleling the services that were offered in support of parental needs, there was a consistent low-
level of service provision that were provided off-site (no more than 22% of centres). At least one
centre provided every service shown in Appendix Ap3.4 (as well as in Ap3.3) off-site: either via a
cluster centre, or at a location not run by a children’s centre.
Centre staff were asked to rate their centre’s offer of provision (from “very limited” to “excellent”)
within each of the seven areas of familial need (partner emotional support, improving home
environment, child services, parenting, child health, child development, family services), as
presented in Table 3.4. Those services rated as having “excellent” provision were those involving
child services and parenting. At least 44 per cent of all centres felt that they offered “good”
provision across the seven areas: family services (60%), improving the home environment (58%),
child development (54%), child health (50%), parenting (50%), child services (46%), and partner
and emotional support (44%). Four of the seven areas were rated as no lower than “adequate”

20
(child services, child development, improving home environment, parenting); this is quite different
to those services which were offered in support of the needs of parents (see Table 3.3).
Table 3.4 Children’s centre self-assessment of the level of provision (from “very limited” to
“excellent”) with which their centre supported seven areas of familial need
“Thinking about these aspects [of familial need] how would you rate your [centre’s] overall level of provision for...”
V
ery
lim
ited
(%
)
Lim
ited
(%
)
Ad
eq
uate
(%
)
Go
od
(%
)
Excell
en
t (%
)
Partner emotional support (n=104) 0 9 20 44 27
Improving home environment (n=103) 0 0 9 58 33
Child services (n=100) 0 0 8 46 46
Parenting (n=106) 0 0 5 50 43
Child health (n=95) 0 2 16 50 32
Child development (n=97) 0 0 5 54 41
Family services (n=99) 0 2 19 60 19
Note: all percentages have been rounded up to the nearest whole
3.2.4 Parent Participation in the Maintenance of the Centre
Understanding parental participation in the management and maintenance of the centre is
important for describing how much centre management see the families as collaborators within
their centre. The extent to which parents participated in the running of their children’s centre was
assessed using two groups of questions that were completed via six-point rating scales (from “not
at all” to “a great deal”). The first group of questions (n=15) asked about “the extent to which
parents participate...” while the second group of questions (n=12) asked about the “...strategies
[which] are used in this centre to encourage parent participation”. Responses to these 27
questions are presented in Table 3.5. As with the range of support services offered, substantial
variation was observed across the ways in which parents may have participated in the running of a
centre, with the most commonly mentioned being ‘volunteer as play worker during sessions’,
‘volunteer at community events’, ‘attendance on parent forum’, ‘attendance on advisory
board/governing body of the centre’, and ‘help staff to choose the sessions on offer’. Two other
areas of parent participation stood out: first, it was common for centres to encourage parental
participation in the running of the children’s centre by offering refreshments during parent forums
or consultation sessions (used “a great deal” in 51% of centres). Second, it was very uncommon
for parents to contribute either to the general maintenance of a children’s centre (“not at all” in
53% of centres) or to attend staff meetings (“not at all” in 73% of centres).

21
Table 3.5 The extent to which parent’s participated in the running of their children’s centre in 2013 and particular strategies used to encourage participation in the running of the centre
"Please indicate the extent to which..." Median response (Average)
No
t a
t a
ll (
%)
Ve
ry l
ittl
e (
%)
A l
ittl
e (
%)
Mo
de
rate
ly (
%)
A l
ot
(%)
A g
rea
t d
ea
l (%
)
"...parents participate in the running of your centre"
-- -- -- -- -- -- --
Volunteer as play worker during play sessions (n=105 centres)
Moderately 8 9 17 27 24 15
Volunteer at community events (n=106) Moderately 6 12 20 26 26 9
Attendance on parent forum (n=105) Moderately 4 6 15 27 31 18
Attendance on advisory board/governing body of the centre (n=104)
Moderately 4 9 12 32 31 12
Help staff to choose the sessions on offer (n=103) Moderately 3 12 15 33 27 10
Opportunity to run specialist groups with support from the centre (n=101)
A little 19 17 25 19 13 7
Take part in training sessions with staff (n=104) A little 29 18 16 18 15 3
Parent advocates as a ‘nominated voice of the centre’ (n=100)
A little 20 15 21 16 22 6
Centre fundraising (n=103) A little 34 11 14 19 17 5
Specialised point of advice or translator to other families (n=104)
Very little 36 18 20 18 7 1
Consulted during recruitment of new staff (n=102) Very little 45 15 6 14 15 5
Paid employment within the centre (n=102) Very little 47 8 14 17 11 3
Attendance in staff meetings (n=105) Not at all 73 11 6 6 5 0
General maintenance of centre behind the scenes (e.g. cooking, cleaning, fixing fittings) (n=104)
Not at all 53 14 14 12 6 1
"...the following strategies are used in this centre to encourage parent participation in the running of your centre"
-- -- -- -- -- -- --
Refreshments during parent forum/consultation sessions (n=107)
A great deal 5 1 3 12 28 51
Advertising of parents forum/consultation sessions (n=107)
A lot 3 0 3 19 30 45
Feedback to the parents on how their consultation has made a difference (n=105)
A lot 1 1 9 17 35 37
Crèche facilities during parent forum/consultation sessions (n=107)
A lot 10 3 7 15 26 39
Parent comment books/boxes (n=107) A lot 4 3 5 21 35 34
Formal recognition of parent participation by staff (n=103)
A lot 4 11 7 21 37 20
“You said, we did” boards (i.e. presenting actions on the basis of feedback) (n=101)
Moderately 5 6 11 30 20 28
Post-it note boards (n=104) Moderately 25 10 6 17 18 24
Incentives such as skill/job progression (n=103) Moderately 17 10 12 32 17 12
Including formal consultation of parents in everyday activities (n=106)
Moderately 5 10 12 26 32 15
Free transport facilities to parent forum/consultation sessions (n=104)
Very little 49 10 6 11 14 11
Note: all percentages have been rounded up to the nearest whole

22
3.3 Managing the Delivery of Parenting Services
The parenting study not only produced a description of services that were offered in children’s
centres (see Section 3.2), but also a complementary description of the supportive management
practices. The general management of the children’s centre is important for taking a holistic view
of how centre management perceive the priorities of parenting services, by prioritising their aims
and training. The management of parenting services is discussed in detail within Appendix Ap3.8.
3.3.1 Managing the Support Offered to Parents and Families
This section describes the management of support services for parents and families. The
percentages shown in Table 3.6 indicate the level of funding and amount of time spent on
resources for a variety of parent and family support services targeted at specific groups.
It was common for respondents to report greater spending on resources (time or money) that
targeted parents and younger aged children. For example, greater spending (marked “a lot” or “a
great deal”) was reported for ‘parents with new-borns and babies under 12 month[s]’, and ‘parents
with children aged between one and five years-old’. It was also more common for respondents to
indicate that “a lot” or ”a great deal” was spent on ‘parents with social or emotional difficulties’ and
‘lone parents’. Little or no resources were reported as being spent on groups that involve older
children, such as ‘parents with children aged between six and eight’ and ‘parents with children
aged between 9 and 19 years old’, although a recent children’s centre census by 4Children (2013)
reported that nearly 40 per cent of centres were regularly offering services for children over the
age of five. There was also comparatively little spending reported for ‘traveller communities’ and
‘parents whose children required wraparound care’. Lower spending for such groups may come
as less of a surprise given that they are in the minority of attendees at centres (see Chapter 5 for
the characteristics of families who attend children’s centres).
Whereas Table 3.6 presented information on the spending of resources on groups, Table 3.7
shows where particular named parenting programmes were said to be provided at the 107
children’s centres whose respondents answered this question. Overall, it appears that most of
these centres did not provide the parenting programmes named in Table 3.7. Over 90 per cent of
centres indicated that programmes were not provided on- or off-site (seven out of the 13
programmes), with a further three cases showed no provision for between 70-80 per cent of
centres. Between 40-50 per cent of centres reported providing the ‘Incredible Years’ and ‘Triple P’
programmes. It was more common for both of these programmes to be provided on-site (21% and
22% respectively, at least 8% higher than for any other programme). For more on the provision of
parenting programmes see Chapter 4 and the first report on ‘visits to children’s centres’ by Goff et
al. (2013).

23
Table 3.6 Reported spending of resources on target groups
“How much of your resources (money or time) did you spend on the following target groups last year?”
Median response (Average)
N
ot
at
all
(%
)
V
ery
lit
tle (
%)
A
lit
tle (
%)
A
mo
dera
te
Am
ou
nt
(%)
A
lo
t (%
)
A
gre
at
deal
(%)
Parents with children aged between 1 and 5 years old (n=106)
A lot 0 1 0 13 41 45
Parents with new-borns and babies under 12 month (n=106)
A lot 0 1 0 28 36 35
Parents with social or emotional difficulties (n=106)
A lot 0 2 3 29 37 29
Lone parents (n=107) A lot 1 3 6 26 38 26
Parents of children with behavioural problems (n=108)
A lot 0 3 7 28 40 23
Parents in workless households (n=103) A lot 0 1 10 30 38 21
Expectant mothers (n=106) A lot 0 5 16 28 34 17
Teenage mothers, pregnant teenagers, young mothers and fathers (n=107)
A lot 0 3 13 32 36 17
Black and Ethnic Minority (BME) communities (n=108)
A moderate amount 1 8 16 37 19 19
Parents with little or no English skills (n=107)
A moderate amount 1 13 26 27 15 18
Parents with mental health difficulties (n=108)
A moderate amount 2 7 18 30 30 15
Parents of children with Special Educational Needs (SEN) (n=108)
A moderate amount 0 2 14 35 38 11
Childminders (n=106) A moderate amount 4 10 29 32 15 9
Fathers (n=107) A moderate amount 0 2 14 52 22 9
Homeless families (n=104) A moderate amount 8 13 30 31 12 8
Parents with ill-health (n=106) A moderate amount 1 16 25 38 15 6
Parents of children with long-standing illnesses and disabilities (n=107)
A moderate amount 0 9 36 29 21 5
Parents with older siblings (n=99) A little 10 14 33 26 8 8
Parents with physical difficulties and impairments (n=106)
A little 3 16 35 33 9 5
Parents/carers of looked after children (children in care) (n=108)
A little 5 19 32 27 13 5
Parents with children aged between 6 and 8 years old (n=105)
A little 21 28 31 15 3 2
Parents whose children require wraparound care (n=107)
Very little 22 30 19 13 10 7
Travellers (e.g. children from traveller, Gypsy, Romany communities) (n=105)
Very little 24 31 24 11 8 3
Parents with children aged between 9 and 19 years old (n=104)
Very little 49 32 11 6 2 1
Note: all percentages have been rounded up to the nearest whole

24
Table 3.7 Provision of named parenting programmes and site locations
“Which of these named parenting programmes do you currently provide at your children's centre (or within the past 6 months)?”
Not provided (%)
On-site (%)
Off-site (%)
On and off-site (%)
Webster Stratton - Incredible Years 56 21 10 13
Triple P (PPP: Positive Parenting Programme) 54 22 14 9
Family Links Nurturing Programme 73 13 6 8
Peers/Parents Early Education Partnership (PEEP)
Learning Together Programme 83 8 6 4
Strengthening Families, Strengthening Communities 79 11 7 3
The 'Noughts to Sixes' Parenting Programme 98 0 1 1
Strengthening Families 79 10 11 0
Mellow Parenting 92 6 3 0
Mellow Babies 95 2 3 0
Parents as First Teachers - Born to Learn 97 0 3 0
Parents in Partnership Parent-Infant Network (PIPPIN) 98 0 2 0
Mellow Bumps 97 2 1 0
The 'Fives to Fifteens' Parenting Programme 99 0 1 0
Note: Total n=107
Note: all percentages have been rounded up to the nearest whole
Table 3.8 presents respondent views on whether particular strategies were used to encourage and
sustain parents’ attendance at their centre. Most respondents (99%) indicated that ‘developing a
supportive and encouraging relationship with the families’ was used for these purposes – the
strategy with the highest affirmative response rate. This was closely followed by ‘taking on board
parent feedback to ensure the timing and location of the course is convenient’ (96%). The third
most common strategy was ‘refreshments’ (86% of respondents). The least commonly reported
strategy was ‘the employment of information technology’; approximately 83 per cent of
respondents reported no use of ‘initiating and maintaining a support group on Facebook (or other
internet social networking site)’.
The percentages shown in Table 3.9 give an indication of the level of focus within centres to
improving parenting behaviours. All 110 respondents reported placing a strong focus on
‘modelling behaviours to children’. Over 90 per cent of centres reported giving a strong focus to
‘praise for children, increased interaction with children’, ‘increased parental interest in children’,
‘recognition of their children's achievements’, and ‘parental understanding of children’s
development’. A few centres provided no focus on ‘increased provision of toys available to
children’ (5% of respondents) and ‘increased provision of numerical resources available to
children’ (3%).

25
Table 3.8 Strategies used by centre managers to encourage and maintain parents’ attendance
“Do you use the following strategies to encourage and maintain attendance at parenting programmes?”
No
t o
ffere
d
(%)
So
meti
mes
(%)
Yes (
%)
Developing a supportive and encouraging relationship with the families (n=106)
0 1 99
Taking on board parent feedback to ensure the timing and location of the course is convenient (n=106)
1 3 96
Refreshments (n=104) 0 14 86
Crèche facilities (n=106) 0 19 81
Encouraging parents to promote courses to other parents (n=103) 3 18 79
Certificates and presentation ceremonies (n=103) 5 19 76
Calling/texting parents to remind them a day before each parenting programme session (n=105)
4 22 74
An initial home visit before the course if required (n=102) 15 34 51
End-of-course parties (n=101) 15 39 47
Subsidised childcare facilities or signposting to a local subsidised childcare facility (n=93)
39 34 27
Free transport facilities (n=101) 54 27 20
Meeting parents at a set place outside from the centre (n=99) 29 52 19
Initiating and maintaining a support group on Facebook (or other internet social networking site) (n=96)
83 3 14
Note: all percentages have been rounded up to the nearest whole
Table 3.9 Centre work focused on improving particular parent behaviours
“How much do you focus your work on improving the following parent behaviours within your centre?”
No focus (%)
Some focus (%)
A strong focus (%)
Modelling behaviours to children (n=110) 0 0 100
Praise for children (n=110) 0 3 97
Increased interaction with children (n=110) 0 3 97
Increased parental interest in children (n=109) 0 3 97
Recognition of their children's achievements (n=110) 0 6 94
Parental understanding of children's development (n=110) 0 8 92
Increased time spent with children (n=110) 0 11 89
Reduction in harsh punishment (n=110) 1 11 88
Greater variety of activities available to children (n=109) 0 20 80
Creation of safer home environments (n=109) 0 21 79
Increased provision of reading resources available to children (n=110)
0 22 78
Increased father involvement (n=110) 1 30 69
Increased provision of toys available to children (n=110) 5 38 57
Increased provision of numerical resources available to children (n=110)
3 46 52
Note: all percentages have been rounded up to the nearest whole

26
3.4 Summary
This chapter has documented the delivery of parenting services across the 117 centres
participating in the parenting services study. Certain induction procedures were commonly
reported across the children’s centres, which included: the distribution of timetabled activities,
the requirement of registration documents and the recording of a family’s cultural background.
Four levels of support were offered to parents (generalised information, personalised information,
personalised support, and centre sessions). Staff reported variations in the type of support
offered for particular services. For example, crèche facilities were most commonly offered via
centre sessions, whereas parental isolation and parental mental health needs were most
commonly approached via personalised support. Few centres offered services off -site which
could include any type of support.
Staff reported the offer of service provision for parents’ personal needs to be variable. Staff
rated their centre’s offer of provision for helping parents to access childcare and improving
parental health and lifestyles the highest, and accessing housing the lowest. Staff rated
their offer of service provision for family needs as consistently higher than the offer of
service provision for parents’ personal needs. Half of the centres encouraged parents to
get involved in the running of their centre. Parents were encouraged to participate “a great
deal” across half of the centres, using strategies such as crèche provision and advertising
consultation sessions. Popular roles included volunteering as a play worker or at community
events, attending parent forums or advisory board/governing bodies, and helping staff to choose
which sessions are on offer. This is important as it supports parental engagement with the
community and socialisation with other parents and children. The most popular strategy for
encouraging and sustaining parents’ attendance was developing relationships with
parents. This strategy was reported by nearly all centres.
Resources (both time and money) were reported to be mostly spent on targeting parents
and on work with young children. A strong focus of their work aimed to improve parenting
behaviours. Staff responses included working with parents to: demonstrate modelling
behaviours, how to praise, increase interactions and develop an increased parental interest in their
children’s lives.

27
4 Evidence-Based Practice [Sylva, Hall and Goff]
Key findings:
The delivery of evidence-based programmes is particularly important for a holistic
consideration of parenting services, given their prominent focus on parenting.
Changes in programmes, strategies or interventions that were offered between 2012
and 2013
There was a consistency in the number of programmes that centres offered in 2012 and
2013. Each centre was implementing an average of five programmes in both years, of which
only one was likely to have featured on the early years list of Evidence-Based Programmes by
Allen (2011).
There was a consistency in the most commonly used programmes offered in 2012 and
2013. The three most commonly used well-evidenced programmes were: ‘Family Nurse
Partnerships’, ‘Incredible Years’, and ‘Triple P’. The five most commonly used programmes
which were not included on Allen’s (2011) list of Evidence-Based Programmes were: ‘Every
Child A Talker’ (ECAT), ‘Freedom Programme’, ‘Infant/Baby Massage’, ‘Family Links Nurturing
Programme’, and the ‘Solihull Approach’.
Only two programmes showed a change in use across the two years; the Solihull
Approach (which increased) and Family Links Nurturing Programme (which decreased).
The implementation of ‘Family Links’ was reduced (by 5 centres, a reduction of 4.5%),
although many were still “in a position to implement”. The implementation of the ‘Solihull
Approach’ was increased (by 13 centres, an increase of 11.6%). Well-evidenced
programmes showed little change in implementation across 2012 and 2013.

28
4.1 Introduction
In order to conceptualise holistically the available provision for parenting, one must also consider
the decisions that the centre management make regarding the use of evidence-based practice,
and particular programmes, strategies, and interventions that have been chosen for use with
families. Evidence-based programmes are particularly pertinent given the large focus on
parenting within the programmes themselves.
This chapter explores the range and type of age-appropriate programmes, strategies, or
interventions which were on offer to families21 within the sample of 117 children’s centres visited in
2013. First, a picture of what was most commonly offered (and how) is described. Second, an
analysis is presented that considers the extent to which the implementation of age-appropriate
programmes, strategies, or interventions (including a set of evidenced-based programmes: EBPs)
had changed since the first ‘visits to children’s centres’ in 2012 (reported in Goff et al., 2013).
The extent to which children’s centres used programmes in 2013 (including well-evidenced
programmes as defined by Allen, 2011) was measured by their implementation of Evidence-Based
Practices, as driven by Evidence-Based Policies (see Goff et al., 2013 for more information on the
differences between these terms). However, underlying these terms is the notion that children’s
centres can provide parent, parenting, and child services with a level of effectiveness that is
supported by rigorous scientific research.
In 2011, Graham Allen MP and his Early Intervention Review Team were asked to identify
promising early interventions of “best” and “good enough” quality, listing a total of 72 well-
evidenced interventions for use with children/families between conception and secondary school
age (Allen, 2011). The ECCE team focused on 23 of these interventions as relevant to the birth to
five age-range (and therefore, possible to be implemented as part of a children’s centre offer);
these programmes were selected by Allen on the strength of their research evidence. As the
interventions target the Early Years they aim to intervene before life experiences can influence
child wellbeing or cause problems that can become resistant to change. The 23 programmes
shown in Table 4.1 are thus termed ‘early interventions’, although their use is not restricted to
populations of ‘children in-need’: they can be considered prime vehicles for use by children’s
centres when working with families. Table 4.1 contains the ‘most proven’ policies, programmes, or
practices in terms of Allen’s defined standards of evidence22, and each programme was given a
score by the Early Intervention Review Team to reflect the level of ‘standard’ (Allen, 2011).
This chapter explores the extent of the use of Allen’s (ibid) 23 well-evidenced programmes (Table
4.1) along with the use of 42 additional programmes, strategies, and interventions (‘programmes’
for brevity’s sake) that were known to researchers but were not present on Allen’s list of Evidence-
Based Programmes. These additional programmes were included after reviewing the relevant
literature, taking into consideration expert opinions and following the first ‘visits to children's
centres’ in 2012.
21
Families that were visited as part of the “survey of families” fieldwork (Strand 2: see Maisey et al., 2013). 22
Allen’s Standards of Evidence are presented in Appendix 4.1.

29
Information on children’s centres’ use of additional programmes was gathered via self-complete
questionnaires. These were completed by a member of staff judged to be knowledgeable about
centre provision of programmes aimed at parents, parenting, and children. One-hundred-and-
thirteen of the centres that were visited in 2013 completed the questionnaire.
Table 4.1 Twenty-three early interventions highlighted by Allen (2011) for families with children
aged between 0-5 years and their Standards of Evidence
Standard of Evidence (1=highest; 3=lowest)
Interventions for all children Interventions for children in need
1 Curiosity Corner -As part of ‘Success for All’ Incredible Years1 Let’s Begin with the Letter People Ready, Set, Leap! Success for All
Early Literacy and Learning Incredible Years1 Multidimensional Treatment Foster Care (MTFC) Nurse Family Partnership (NFP) Parent Child Home Programme
2 Bright Beginnings Parent Child Interaction Therapy (PCIT)
3 Al’s Pals Breakthrough to Literacy I Can Problem Solve Parents as Teachers Triple P 1
Brief Strategic family therapy Community Mothers DARE to be You Even Start Healthy Families America Healthy Families New York High/Scope Perry Pre-School Triple P1
Note: 1 Interventions printed in italics are intended ‘for all children’ as well as ‘for children in need’.
Table derived from the groupings of Allen (2011). See Appendix Ap4.1 for details on the “Standards of
Evidence”
4.2 What Programmes, Strategies or Interventions were Children’s Centres Offering in 2013?
For each programme listed on the questionnaire, staff gave answers to five questions concerning
implementation, five questions concerning who ran these programmes, and two questions
concerning the location from which these programmes were run. Questionnaire responses to the
12 questions are presented in two sections: Section 4.2.1 discusses centre responses to the 23
well-evidenced programmes, and Section 4.2.2 discusses centre responses to the 42 additional
programmes.
4.2.1 Well-evidenced programmes as listed by Allen (2011)
Responses to the questions concerning the 23 well-evidenced programmes from Allen’s (2011) list
are presented in Appendix Ap4.2 (full list) and in Table 4.2 (top three most commonly offered
programmes in 2013). A great deal of variation was observed between the programmes, and
some were much more commonly used than others. The three most commonly used programmes

30
were ‘Family Nurse Partnerships’, ‘Incredible Years’, and ‘Triple P’. These were the same three
most used programmes as noted in the first ‘visits to children’s centres’ conducted in 2012.
Table 4.2 The top three most commonly offered well-evidenced programmes in 2013
The three most commonly used well-evidenced programmes, from Allen’s list of 2011; and the number of centres who responded positively to each question (for a max n=113 centres)
Implementation Who ran these programmes? Where?
Follo
wed in f
ull
Substa
ntially
follo
wed
Inspired b
y o
r base
d u
po
n
Tra
ined t
o u
se,
but
not
curr
ently u
sin
g
Pla
nn
ing t
o s
tart
runnin
g w
ith s
ix m
onth
s
Run b
y t
his
ch
ildre
n's
ce
ntr
e s
taff
Run b
y s
taff
of
a lin
ked o
r clu
ste
red
centr
e
Run b
y s
taff
em
plo
yed b
y t
he c
luste
r
specific
ally
for
this
purp
ose
Run b
y s
taff
fro
m a
noth
er
ag
ency o
r
inde
pe
nde
nt
child
ren
's c
entr
e
Oth
er
Within
a c
hild
ren’s
centr
e b
uild
ing
At
anoth
er
bu
ildin
g o
r site
Family Nurse Partnership (FNP)
17 3 0 0 0 0 0 1 19 4 5 21
Incredible Years (Also known as Webster Stratton. Includes Babies and Toddlers; and BASIC Early Childhood programmes)
35 11 2 7 4 34 14 2 16 9 44 20
Triple P (Positive Parenting Programme)
38 3 1 6 2 32 8 6 10 3 40 11
4.2.2 Additional programmes
Responses to the questions concerning the 42 additional programmes23 are presented in
Appendix Ap4.3 (full list) and in Table 4.3, (top five most commonly offered programmes). A great
deal of variation was observed between the programmes; some were much more commonly used
than others. The five most commonly used were ‘Every Child A Talker’ (ECAT), ‘Freedom
Programme’, ‘Infant/ Baby Massage’, ‘Family Links Nurturing Programme’, and the ‘Solihull
Approach’. Other than the ‘Freedom Programme’, these were also amongst the most used
programmes in 2012. In the first ‘visits to children’s centres’ in 2012, respondents were given the
opportunity to list the names of any other popular programmes that were not listed by the
researchers’ pre-defined list. The ‘Freedom Programme’ was commonly listed as an additional
programme – one so common that it was added to the pre-defined list of named programmes for
the parenting study.
23
Although these ‘other’ programmes were not on Allen’s well-evidenced list in 2011, this was described by the author as being a living list. As such, some of these programmes may have since achieved standards of evidence (e.g. Randomised Control Trials: RCTs etc.) that would enable them to be included if Allen and colleagues were to revise their list.

31
Table 4.3 The top five additional programmes, strategies or interventions offered by children’s
centres in 2013
The five most commonly named additional programmes, strategies, and interventions, and the number of centres who responded positively to each question (for a max n=113 centres)
Implementation Who ran these programmes? Where?
Follo
wed in f
ull
Substa
ntially
follo
wed
Inspired b
y o
r base
d u
po
n
Tra
ined t
o u
se,
but
not
curr
ently
usin
g
Pla
nn
ing t
o s
tart
runnin
g w
ith s
ix
month
s
Run b
y t
his
ch
ildre
n's
ce
ntr
e s
taff
Run b
y s
taff
of
a lin
ked o
r
clu
ste
red c
entr
e
Run b
y s
taff
em
plo
yed b
y t
he
clu
ste
r specific
ally
for
this
purp
ose
Run b
y s
taff
fro
m a
noth
er
ag
ency
or
inde
pe
nde
nt
child
ren
's c
entr
e
Oth
er
Within
a c
hild
ren’s
centr
e b
uild
ing
At
anoth
er
bu
ildin
g o
r site
Every Child a Talker (ECAT)
32 17 8 3 2 42 4 2 8 2 47 17
Family Links Nurturing Programme (includes Parenting Puzzle)
21 0 2 4 3 23 2 0 7 0 25 11
Freedom Programme* 35 3 1 1 6 18 3 2 23 4 27 15
Infant Massage 73 5 3 4 1 68 7 6 6 4 72 23
Solihull Approach 23 9 7 5 0 34 3 1 5 2 32 18 Note: *Programme that managers were prompted about only in 2013 - not in 2012 (n=4)
Note: all percentages have been rounded up to the nearest whole
4.3 Changes in Programmes, Strategies or Interventions that were Offered between 2012 and 2013
The questionnaire was a repetition of the task that centre staff had been asked to complete in the
first ‘visits to children’s centres’ in 2012, in order to obtain longitudinal information. Administration
of the same questionnaire in 2012 and 2013 enabled ECCE researchers to investigate the stability
(or otherwise) of their offer through children’s centres. Sixty-one programmes were listed
consistently in the questionnaires in both 2012 and 201324. Twenty-three were well-evidenced
according to Allen (2011) and can therefore be considered as having the most secure research-
base. Concerning the total 61 programmes, centre staff were asked about whether, and how, they
implemented these25 (with 112 centres returning all of this information). A comparison of all the
programmes in 2012 and 2013 is now presented (excluding anything unique in either year) which
provides a broad picture of the nature of programme provision between 2012 and 2013:
24
The 2013 list featured four more programmes than did the list of 2012. These were added in response to 2012 comments, but the lack of prompting about these in both 2012 and 2013 years prevented a fair comparison over the two years. The four additional programmes added for 2013 were: Freedom Programme; Healthy Eating and Nutrition for the Really Young (HENRY); Infant Yoga; and Speak Easy. 25
1 “Followed in Full”; 2 “Substantially Followed”; 3 “Inspired or Based Upon”; 4 “Trained to use, but not currently using”; 5 “Planned to start running within six months”.

32
1. Change in whether each of the 61 named programmes were being “implemented”26 over the
years 2012 and 2013;
2. Change in the “level of implementation” of these 61 named programmes across the 2012 and
2013 period, between: 0) “not implemented”27; 1) “in a position to implement”28; and 2)
“implemented”;
3. Change in the number of programmes that were implemented over this period, broken down
into those that were on Allen’s list of Evidence-Based Programmes and those that were not.
4.3.1 Change in the Implementation of Programmes29
between 2012 and 2013
Table 4.4 presents the two statistically significant changes of programmes, strategies, and
interventions that were identified between 2012 and 201330. ‘The Family Links Nurturing
Programme’31 was implemented by significantly fewer centres in 2013 (change = -5 centres;
Z=2.2; r=0.2; p<0.05), whereas the ‘Solihull Approach’32 was implemented by significantly more
(change = 13 centres; Z=2.8; r=0.3; p<0.01). Overall, however, the results (shown in Appendix
Ap4.4) show little change in implementation of the 61 named programmes between 2012 and
2013.
Table 4.4 Statistical comparison of the change in whether programmes were being currently
implemented between 2012 and 2013
Note: * Effect sizes are interpreted as: 0.1 “small”; 0.3 “medium”; 0.5 “large”;
** Changes that were statistically significant (p<0.05)
26
Implementation options: 1, 2 or 3. 27
No implementation option selected. 28
Implementation options: 4 or 5. 29
‘Programmes’ here represents Programmes, Strategies, and Interventions 30
See Appendix Ap4.4 for Table 4.4 in full, with all the non-significant and no-change programmes and statistics. 31
Further information on the 'Family Links' programme is available through this link. 32
Further information on the 'Solihull Approach' is available through this link.
Named programmes, strategies or interventions that children’s centre managers were asked whether or not their centre implemented (n=61)
Implemented in 2012?
Implemented in 2013?
Statistical comparison of the change in implementation between 2012 and 2013 (in n=112 children’s centres)
n % of (n=
112) n % of (n=
112)
Overall ∆ (2013-2012)
Statistic (Wilcoxon
Z)
Effect Size* (r= Z/(n
1/2)) p
Family Links Nurturing Programme**
27 24.1% 22 19.6% -5 2.236 0.211 0.025
Solihull Approach** 26 23.2% 39 34.8% +13 2.837 0.268 0.005

33
Considering only Allen’s 23 well-evidenced programmes (Table 4.1), nine of these33 were not
implemented in either year. Furthermore, 13 of these programmes were offered by the same
number of centres in both years. This low level of change was likely influenced by the fact that
only ‘Family Nurse Partnership’ (FNP), ‘Incredible Years’ (IY), and ‘Triple P’ (PPP: Positive
Parenting Programme) were implemented by more than three centres in either 2012 or 2013 (as
documented in Section 4.2). It is possible that the stability of the programmes listed by Allen
(FNP, IY, and PPP in particular) may be due to greater start-up costs (as discussed in Goff et al.,
2013).
4.3.2 Change in the Level of Implementation of Programmes34
between 2012 and 2013
Table 4.5 displays the change that was identified in the level of implementation of the
programmes35 between 2012 and 2013. While the previous section considered whether or not the
named programmes were “implemented”, this section instead considers levels of implementation.
More specifically, the results shown in Tables 4.2 and 4.3 differentiated programmes that were
“not implemented” from those that were “in a position to be implemented” and from those
“currently implemented”. Overall, and consistent with the findings presented in Section 4.3.1, very
little evidence of change was found in “the level of implementation” of the named programmes
between 2012 and 2013. There was no change in the implementation of the 23 well-evidenced
programmes, i.e. they remained consistent across 2012-2013, but there were some changes in
the implementation of three programmes which were not included on Allen’s (2011) list of
Evidence-Based Programmes. The three exceptions that stand out when comparing the results
presented in Tables 4.4 and 4.5 are now discussed.
The ‘Family Links Nurturing Programme’ was implemented by significantly fewer centres in 2013
(5 less out of a sample of 112 centres), although more were “in a position [for it] to be
implemented” (4 more). A similar pattern was found for the ‘Parents, Early Years and Learning’
(PEAL) programme36: ten fewer centres either “implemented” or were “in a position [for it] to be
implemented” in 2013 - while ten more centres reported that it was “not implemented” (see Table
4.5). The ‘Solihull Approach’ was not only implemented by significantly more children’s centres in
2013 than in 2012, but this was also apparent when considering the subtler level of
implementation as well (Z=2.8; r=0.27; p<0.01).
33
‘Brief Strategic Family Therapy Programme (BSFT)’, ‘Bright Beginnings Early Intervention Programme (BBEIP)’, ‘Curiosity Corner (as part of the Success for All programme)’, ‘DARE to be you (DTBY: Decision-making; Assertiveness; Responsibility; and Esteem)’, ‘Healthy Families America (HFA: a programme of Prevent Child Abuse America)’, ‘Healthy Families New York (HFNY)’, ‘Let’s Begin with the Letter People’, ‘Multidimensional Treatment Foster Care (MTFC)’, ‘Ready, Set, Leap! (LeapFrog)’. 34
‘Programmes’ here represents Programmes, Strategies, and Interventions 35
See Appendix Ap4.5 for Table 4.5 in-full; with change statistics presented for all 61 programmes. 36
Further information on the PEAL programme is available through this link.

34
Table 4.5 Statistical comparison of the Levels of Implementation of Evidence-Based Programmes in
2012 and 2013
Note: *Effect sizes are interpreted as: 0.1 “small”; 0.3 “medium”; 0.5 “large”;
** Changes that were statistically significant (p<0.05)
4.3.3 Change in the Number of Programmes37
Implemented by Children’s Centres between 2012-2013
Table 4.6 presents the results of three statistical tests that compared the number of programmes,
strategies, and interventions that children’s centres implemented in 2012 to those implemented in
2013. Although the mean number of implemented programmes declined between 2013 and 2012,
this was only by a small average amount and there was no significant difference in the average
number of programmes that children’s centres were implementing. Furthermore, this was true for
both the programmes that featured on Allen’s list of Evidence-Based Programmes and for the
additional list of programmes. Across both lists of programmes, in both 2012 and 2013, centres
implemented an average of five programmes, strategies, or interventions, of which an average of
one was likely to be on the early years list of well-evidenced programmes compiled by Allen.
37
‘Programmes’ here represents Programmes, Strategies, and Interventions
Named programmes, strategies or interventions that children’s centre managers to report their level of implementation (n=61). Levels of Implementation were coded: not implemented (0); in a position to Implement (1); currently implementing (2)
Levels of Implementation in 2012
Levels of Implementation in 2013
Statistical comparison of the change in level of implementation (in n=112 children’s centres)
(0) (1) (2) (0) (1) (2) Statistic
(Wilcoxon Z)
Effect Size* (r= Z/(n1/2))
p
Family Links Nurturing Programme
83 2 27 84 6 22 1.513 -0.143 .130
Parents, Early Years and Learning programme (PEAL)**
96 6 10 106 1 5 2.368 -0.224 .018
Solihull Approach** 78 8 26 68 5 39 2.843 -0.269 .004

35
Table 4.6 Statistical comparison of the numbers of programmes implemented in 2012 and 2013
Category of programme
Number currently implemented in 2012
Number currently implemented in 2013
Statistical comparison of the change in the numbered of implemented programmes between 2012 and 2013 (in n=112 children’s centres)
Mean SD Mean SD
Overall Mean ∆ (2013-2012)
Statistic (t)
Effect Size
(Cohen’s d*) p
No category. Number of programmes from a list of 61
5.0 2.84 4.8 2.75 -1.5 0.47 0.05 0.638
Only those 23 that are on the Allen List (2011)
1.1 0.91 1.0 0.85 -0.06 0.53 0.07 0.601
Remaining 38 programmes not on the Allen List
3.9 2.38 3.8 2.30 -0.10 0.38 0.04 0.704
Note: Effect sizes are interpreted as: 0.2 “small”; 0.5 “medium”; 0.8 “large”
* Calculated based on the formulas for comparing repeated measures as described by Morris and DeShon
(2002)
4.4 Summary
This chapter has presented a snap-shot of programmes, strategies, and interventions that
children’s centres were offering to families in 2013, and how this picture differed from the previous
year during the first ‘visits to children’s centres’ in 2012. Centres typically reported offering the
same number of programmes in 2013 as in 2012. Each centre was implementing an average
of five programmes across both years, of which only one was likely to have featured on the early
years list of Evidence-Based Programmes by Allen (2011). It remains the case that Evidence-
Based Programmes are offered in children’s centres, but they are offered much less frequently
than programmes with a less secure evidence-base.
Not only was there consistency in the number of programmes that centres offered in 2012
and 2013, but there was also consistency in which named programmes were offered over
others. The three most commonly used well-evidenced programmes were: ‘Family Nurse
Partnerships’, ‘Incredible Years’, and ‘Triple P’. The five most commonly used programmes which
were not included on Allen’s (2011) list of Evidence-Based Programmes were: ‘Every Child A
Talker’ (ECAT), ‘Freedom Programme’, ‘Infant/Baby Massage’, ‘Family Links Nurturing
Programme’, and the ‘Solihull Approach’. Only two programmes showed a change in use
across the two years; the Solihull Approach (which increased) and Family Links Nurturing
Programme (which decreased). The implementation of ‘Family Links’ was reduced, although
many were still “in a position to implement”. The implementation of the ‘Solihull Approach’ was
increased. Well-evidenced programmes showed little change in implementation across 2012
and 2013.

36
5 Aims for Families and Parenting Services [Goff and Evangelou, with Parkin and Tracz]
Key Findings:
The characteristics of families attending children’s centres and their needs
Staff were most likely to emphasise factors and needs of the whole family when
describing centre users, followed by parent factors/needs. Staff most frequently referred
to types of family structure (e.g. lone and young parent families) and the variety of family
needs. References were made to both the vulnerability (e.g. involvement of Social Care) and
the variety of socio-demographic characteristics of the participating families.
Definitions of the ‘most disadvantaged’ families were more likely to emphasise parent
factors or needs, followed by the needs of the family. Staff reported factors such as the
parents’ personal situation, poverty, inadequate housing and lack of socialisation; or factors
relating to their personal life skills.
Staff acknowledged three potential barriers which could pose a challenge to working
with the families: 1) parental relationships with staff, 2) staffing, including time allotted
to families, and 3) centre administration, resources, and finance.
The aims for parenting services in children’s centres
Centre staff most commonly described aims for meeting the needs of the Parent-Child,
followed by the parents’ Personal Needs. Frequently reported aims included improving
parenting skills (73% of centres) and furthering parent knowledge about good parenting and
child development (40%), as well as improved child outcomes (58%) and experiences (45%).
The benefits of ‘play and learning’ activities for families
Staff reported a number of benefits consistent with the EYFS areas of children’s
development as a result of attending ‘Play and Learning’ activities, including ‘Personal,
Social and Emotional Development’, ‘Physical Development’, and ‘Understanding of the
World’ (91%, 65% and 59% of centres respectively). School readiness was also listed as an
important benefit across 52% of centres, as well as providing an opportunity for children to
interact with others (32%).
Staff reported a number of benefits for adults which matched the commonly listed aims
for parenting services. The greatest benefits were reported for improving Parent-Child
needs, followed by the parents’ Personal Needs (95% and 87% respectively). Frequently
reported benefits included improved parenting skills, greater knowledge of child development,
and increased confidence in parenting.
Other benefits highlighted by staff included the supportive environment of the centre
and furthering parents’ knowledge through provision of advice and information (65%
and 31% respectively). It was interesting to note that, even when asked about benefits for
adults, staff reported benefits that addressed the Parent-Child relationship.

37
5.1 Introduction to the Interviews with Staff across the Sample of Children’s Centres in 2013
A primary focus of the fieldwork in 2013 was the collection of information from staff who were
directly involved in the delivery of parenting services work. Researchers spoke with staff running
family sessions on the day of the visit, or those that were engaged in outreach and family support
work within homes. The interview schedule covered areas of interest arising from the first ‘visits to
children’s centres’ in 2012. This schedule took into account questionnaires that had been
successfully implemented in similar studies assessing family interventions (Evangelou, Coxon,
Sylva, Smith and Chan, 2013) and was guided by the parental needs presented in Chapter 2.
Detail on the content and development of this interview schedule can be found in Appendix 5.2.
Chapter 5 will focus on staff responses to the questions regarding the families who access
parenting services. The chapter begins with an introduction to the qualitative analysis used within
this study, followed by a discussion surrounding the families accessing children’s centre services
during the parenting fieldwork in 2013 (including the types of needs that they exhibit). The chapter
also introduces staff conceptualisations of a ‘most disadvantaged’ family, and touches upon some
of the areas of centre working which pose a challenge to parenting; before moving on to describe
the staff-reported ‘aim for parenting services’. The chapter also discusses staff-reported benefits
for children and adults as a result of attending ‘play and learning’ activities at the centre. The
chapter concludes with a summary of the findings.
5.2 Data Collection and Analysis of Interview Scripts
Up to two interviews were completed across all 117 centres. In total, 88 interviews were
completed with members of staff who carried out outreach or family support in the homes, 90
interviews were with members of staff running sessions at the centre, and 21 interviews with
members of staff fulfilling both of these centre roles. Researchers received training on how to take
accurate and detailed field notes and some verbatim quotes during the interview. All 199 fieldwork
notes were transcribed and imported into NVivo 10 for qualitative analysis. The Research Team
grouped staff responses into nodes in order to draw out the themes discussed by the respondents,
and all themes discussed from hereon have been drawn from the interview scripts with staff.
Further details on the qualitative analysis are presented in Appendix 5.2.
5.3 The Characteristics of Families Attending Children’s Centres and their Needs
Chapter 2 suggested that parental needs could be conceptualised in terms of four areas. Staff
responsible for running centre groups were asked the question: “What types of families attend the
sessions that you run e.g. focus on the one that you have just been running?” Comparatively, staff
carrying out outreach or home visits to parents’ houses were asked a complementary question:
“What types of families do the centre staff focus family support or outreach work on?” Any
additional reference to ‘types of family’ or ‘particular needs’ throughout the staff interviews were
also included in the qualitative analysis.

38
Qualitative analysis of the data suggested that centre staff framed their answers in terms of family
arrangement and need. The descriptors used resembled elements of the four areas of need
identified in Chapter 2: the child, the parent, the family, and the parent’s position as a member of
the community. Table 5.1 details the breakdown of staff responses from 116 of the 117 centres
against the type of family arrangement described within their answers.
Table 5.1 Types of families accessing children’s centre services, and their needs (as reported by
centre staff)
Aspects of family arrangements
No. centres
(%) Areas of coding
Family 115 99 Family situation or characteristics, family structure, parent and family needs, family location
Parent 110 95 Parents’ personal situation, parenting issues, life skills, life events.
Child 90 78 Child needs, child-related situation Community 70 60 Centre location and reach, parent and community needs
Total n= 116 centres responding to this question, all percentages have been rounded up to whole figures.
As might be predicted, centre staff most frequently considered elements of the family unit in their
descriptions of the characteristics of families accessing children’s centres and their needs (across
99%38 of the centres), followed by the parent, child and community. In particular, staff focused
their descriptions around the family situation, characteristics, and structure. Respondents were
also asked to define, in their own words, what they thought makes a family ‘the most
disadvantaged’. In total, staff from 71 of the 117 centres provided answers to this question (see
Table Ap5.1, in Appendix 5.1 for a breakdown of staff responses). Staff emphasised factors from
the parents’ personal lives within their definitions of the ‘most disadvantaged’ (67 out of 71
centres), with particular reference to parents’ personal situation, life skills, and parenting skills.
Next, staff spoke about family, community and child factors. Although staff were asked two
different sets of questions (in terms of what typifies the families attending the centre and who are
the most disadvantaged), their responses were highly complementary and will be discussed in
aggregate.
5.3.1 Families and their needs
Staff commonly described family factors in relation to the needs of centre recipients (across 99%
of the centres39). Staff mentioned the current family situation and family characteristics most
frequently across the centre sample (93% of centres). Next, staff referred to the family structure
(91% of centres), needs of the family (86%), and family location (57%). These four aspects of
family life will now be reported in turn.
Staff most frequently spoke about the current family situation and characteristics (across 93%
of the 116 centres). The responses staff gave were varied and showed that the centre was
reaching both extremely vulnerable and targeted families as well as less vulnerable families with
38
All percentages given in Section 5.3 have been rounded up to whole figures, and are out of total responses to the question, ‘What types of families attend the sessions that you run e.g. focus on the one that you have just been running?’ and ‘What types of families do the centre staff focus family support or outreach work on? n=116. 39
Forty-nine (of the 71 children’s centres answering the question) talked about the needs of the family within their definition of the ‘most disadvantaged’ families.

39
particular needs. Most commonly, staff spoke about the wide variety of families attending their
sessions (78% of centres). Just over half of the total sample reported that they cater for all
families, including those considered as ‘universal’. Staff frequently spoke about using universal
services to ‘get families in’ and support any, and all, families who have needs: ‘Will provide family
support for any family who feel they have a need’; ‘Work with everyone – all inclusive’; ‘We
wouldn’t turn away anyone’. However, just over half of the centres also reported reaching a vast
mixture of families in need of support, with varied backgrounds, ages and needs: ‘But also there
are needs in ALL areas and ‘type’ of people. We have target area/groups but could be anyone’;
‘Any family struggling and need[ing] advice’. One fifth of centres reported a spread of families
across different socio-demographics. While staff predominantly spoke of families from low socio-
economic groups, there was also a small mention of other parents, which shows the wide range of
families accessing children’s centre services.
Whilst catering for all families, staff also frequently spoke of reaching and serving very vulnerable
and needy families (74% of centres). Just under a quarter of the sample reported working with
families referred from social care, health visitors and other specialists, or self-referrals. Others
reported work targeting families (such as those on social care plans, family support, or those
monitored intensely through the Common Assessment Framework: CAF).
Next, staff spoke about a wide range of family structures (across 91% of the 116 centres40).
Lone parent families were reported most frequently (across nearly three quarters of the sample),
followed by young parents, fathers, minority ethnic families or those from other cultures, and
extended families/grandparents. Additional related factors were emphasised in definitions of
disadvantage, including lack of extended family or support, multiple changing partners, large
families (with many children), and traveller families.
The needs of families were detailed by staff across 86 per cent of the centres. A few needs were
reported more consistently, such as domestic abuse (highlighted in over 60% of the centres) and
additional needs (e.g. physical and mental health; in just under one third of the centres), for
example, parents or children with a disability, learning needs or difficulties, or other diagnosed
issues such as ‘Attention Deficit Hyperactivity Disorder’ (ADHD) or ‘Asperger’s Syndrome’.
Deprivation was reported by just under a fifth of centres41 as a frequent feature of family lives.
Living within the lowest 10, 20 and 30 per cent most deprived areas within the country (i.e. Lower
Super Output Areas: LSOAs) was also a factor considered by staff in their definitions of the ‘most
disadvantaged’. Individual family needs were considered by a fifth of centres within their
definitions of the ‘most disadvantaged’, with families facing a varied range of difficulties (some
multiple and very complex): ‘Can be a whole range of things that impact on parents ability to
achieve best outcomes for their children’; ‘high level of needs complex families that need family
therapy’.
Finally, staff spoke about the family location in their description of centre users (across 57% of
the 116 centres). The most commonly reported factor in terms of location was living in areas of
40
Staff from 39 of the 71 centres referred to the family structure within their definition of the ‘most disadvantaged families’. 41
Just over one quarter of the 71 centres referred to deprivation within their definition of the ‘most disadvantaged families’.

40
geographical isolation and experiencing a lack of socialisation (reported by over one third of
centres42). Staff described reduced support networks (‘Isolation and lack support network from
family as [they] are not local to the area so no family/friends’) and temporary accommodation or
transient populations escalating isolation issues (‘Temporary housing. Unable to establish [a]
network of friends and support’). Location was also reported in terms of the level of deprivation,
as well as other characteristics such as substance abuse, obesity, poor housing, mental health,
multi-culture, gang culture, rurality, and poor transport links. This echoes Royston and Rodrigues
(2013) finding that a quarter of their survey respondents found it difficult to use their children’s
centre, particularly due to problems with transport and the centre being too far away to walk.
5.3.2 Parents and their needs
Whilst staff most frequently spoke about recipients in terms of their needs as a family, they next
reported on the needs of the parents (in 95% of the 116 centres answering this question43). Staff
provided most detail on the parents’ personal situation (across 94% of centres), followed by
parenting issues (47% of centres), lacking life skills (36%), and finally major life events (20%).
Most prominently, the parents’ personal situation was noted as a key characteristic of families
(94%). Poverty and lack of finance was most frequently raised as a significant personal problem
faced by parents (across over two thirds of the 116 centres). Reasons given for such financial
difficulties included worklessness, no recourse to public funds, the need to claim benefits and the
recent benefit ‘cuts’, expensive childcare costs, and lack of budgeting skills. Staff from some
centres referred to families affected by debt and the impact that this has on both the availability of
resources (‘Not being able to put food on the table’) and general family life (‘Not experiencing
things a family with a good income would experience’).
Sixty per cent of centres thought that housing issues were prominent, including living in poor or
temporary accommodation and homelessness, threat of eviction, overcrowded housing, and
landlord or neighbour issues (‘Poor quality private landlords with very high rents’). Staff at times
described housing conditions: ‘House is in chaos’; ‘House is a mess’; ‘Home conditions are
unsafe, unhygienic’. Poor mental health was featured in nearly 60 per cent of the centre
responses including self-harming, eating disorders, agoraphobia, and stress and anxiety.
Next, unemployment and worklessness was noted by over half of the centres as an issue for
parents44. A handful of centres mentioned ‘generations where families have never worked’.
However, as noted by Royston and Rodrigues (2013), even those families with working parents
may be in need of support: “six in ten children living in poverty are in households where at least
one parent is working. Children in working families can frequently be excluded from support
offered to children in non-working households” (p.14). Educational needs, and specifically ‘English
as an Additional Language’ (EAL) needs, were fairly prominent (across over one third of the
42
Nearly half of the 71 centres referred to lack of socialisation and isolation within their definition of the ‘most disadvantaged families’. 43
The parents’ personal situation was emphasised by the majority of centres within their definition of the ‘most disadvantaged families’ (across 67 out of 71 centres). 44
Just over one third of the 71 centres referred to unemployment within their definition of the ‘most disadvantaged families’.

41
sample) with staff referring to language, literacy, and numeracy needs, and low qualification levels.
A number of other personal parent needs were mentioned by staff, including substance misuse,
poor health, food and diet, disabilities and learning difficulties, and parents needing practical help.
Coming second to the parent’s personal situation, parenting issues were reported by 47 per cent
of centres45. The majority of staff referred to parenting skills (just over one quarter) and a need to
develop confidence in their parenting ability (just under one fifth). Staff also highlighted parents
wanting further knowledge and advice in addition to an awareness of their child’s development.
Next, staff spoke about parents’ life skills (across 36% of the 116 centres); in particular
generational habits and past experiences affecting the parents’ current lives. Staff also spoke of
families relying heavily on extended families for advice (‘Generational/young parents rely on their
parents and grandparents for advice in parenting, which is out of date’) as well as lack of positive
role models and learned negative behaviours. A few other centres reported a lack of general life
skills, for example, the ability to deal with problems appropriately, to manage themselves and their
behaviour, to stay healthy, and to budget appropriately. Lastly, staff described the major life
events which families were facing (20% of centres). The majority of these related to issues with
immigration status, incarceration, bereavement, illness, and criminal activity.
5.3.3 Other characteristics of families attending the centre
Children and their specific needs were mentioned third most frequently across the sample of
children’s centres (78% of the 116 centres responding with this information46). Staff primarily
described children’s personal needs (66% of centres: for example, additional needs and
behavioural issues) and personal situations (47% of centres: including poor experiences and
personal situations such as social care, child neglect and child protection plans).
The least reported characteristic related to community needs (mentioned across 60% of
centres47). Staff highlighted centre location and reach as a factor in who attends the centre
(57% of centres: for example, isolation and lack of socialisation, issues related to the location such
as ‘housing estates’, obesity, and poverty), followed by needs of the parent and community
(15% of centres: including non-engagement). Further details are available in Appendix 5.3.
5.3.4 Areas of the Centre which Pose a Challenge to Improving Parenting
Staff members were not directly asked about the strengths of families within Section 5.3, but rather
about their needs (amongst other questions). In their responses, 69 per cent of centre staff
acknowledged challenges which were influencing the way that they interacted and worked with
families. Most particularly, parent and family barriers were reported widely across the centres
(54%), followed by challenges regarding staffing (27%), administration (9%), and finances
(7%). These areas will now be discussed in further detail.
45
Parenting issues were considered by staff from 29 centres within their definition of the ‘most disadvantaged families’. 46
Less than one third of the 71 centres, considered children as a factor within their definition of the ‘most disadvantaged families’ (21/71 centres). 47
Just over half of the centres (37 of the 71) considered the community within their definition of the ‘most disadvantaged families’.

42
Parent and Family Barriers were most frequently mentioned as a challenge to parenting capacity
(across 54%48 of centres), particularly with reference to building relationships with the staff
(47%). Most information provided by staff concerned difficulties in building up trust with the
families (as also echoed in the Royston and Rodrigues report, 2013; and Barlow et al., 2007), for
example: ‘Parents have to trust that you know what they are talking about and that they can share
personal information with you, that the work we do with them serves a purpose’. One fifth of
centres also mentioned parents’ worries about being judged by the staff and other parents at the
centre (‘Accept that parenting courses are to help, not because we think they are bad parents’;
‘Fear of mixing – being exposed, families fear’).
Staffing was mentioned as a challenge across 27 per cent of the centres. The majority of staff
spoke about issues with balancing their time, including when to schedule sessions, the timescale
for working with families, and the availability of centre staff (‘Families feel that they are not
supported long enough’; ‘Not enough time for all the families’). Other staffing issues included
shortages, low morale, high workload, and training needs (‘Everyone is very stretched’; ‘Need
more training to deal with complex cases, which in the past were handled by qualified social
workers’; ‘Need more staff to deal efficiently to level needed with complex cases’). Challenges
regarding centre administration were reported by nine per cent of the centres. In most cases
staff referred to issues with resources, including a lack of centre space: ‘Barriers to service
delivery. We can’t fit in enough people in Stay and Play’. Lastly, centre finances were reported
as a challenge (7%), such as reductions in budget and finances (‘Budget cuts. We always have to
find cheapest thing rather than best thing’; ‘Financial element – whether to charge for session’).
5.4 The Aims for Parenting Services in Children’s Centres
Centre staff were asked “what is the aim for parenting services in your centre?” In total staff from
113 of the 117 centres taking part in the parenting study provided information on this question.
Qualitative analysis of the data showed that the answers could be broadly mapped according to
parental needs. Centre staff placed the greatest importance on aims which met the needs of the
Parent and Child unit (99% of centres answering this question), followed by the Personal Needs
of the Parent (79%), Parent and Community (45%), and lastly Parent and Family (14%). The
breakdown of staff responses can be seen in Table 5.2, and will now be discussed.
5.4.1 Parent and Child Needs
Staff from nearly all of the 113 centres responding to this question (99%) reported that their centre
was aiming to provide services that were targeted towards the needs of the Parent and Child as a
unit. The majority of responses pertained to improving the parents’ ability to look after their child
(for example, in terms of their parental responsibility) and more specifically, the improvement of
skill, mental state, knowledge, and introspection which might directly influence their parenting
skills. Comments given by staff most commonly related directly to the improvement of parenting
48
Percentages in section 5.3.1 have been rounded up to whole figures, and are taken from the total responses to the questions, “1) What are the main ‘challenges to parenting’ for the families that you are working with? and 2) Are there any issues you have to work to resolve before helping families with their parenting? Can you give some examples?’ n=116.

43
skills (73%49 of centres) and included examples such as the following: ‘Providing tools in their
toolbox’; ‘Give parents strategies to deal with behavioural situations’; ‘Build parenting skills,
particularly around boundary setting and being consistent with children’.
Table 5.2 Staff reported ‘Aims for Parenting Services’ against areas of parental need
Areas of Parental Need
No. centres
(%) Areas of coding
Parent and Child 112 99
Parent aims (improved parenting skills, knowledge about child development, confidence in parenting, improvement of state for parents) Child aims (better outcomes, better experiences)
Personal Needs of the Parent
89 79
General life improvement (including drug and alcohol misuse), education, health (including mental health), employment, socialisation, financial situation, housing situation
Parent and Community
51 45 Engagement in the children’s centre, volunteering, reducing isolation, community involvement, trust
Parent and Family 16 14 Dealing with domestic abuse, relationship between parents Total n= 113 centres responding to this question, all percentages have been rounded up to whole figures
Staff also commonly described the aim of furthering parents’ knowledge and their
understanding of the importance of good parenting, with an emphasis on learning about child
development (40%): ‘Show parents how their behaviour affects their children’s behaviour’; ‘Helping
parents to learn how their child develops and how they can support it – massive at present’.
Developing confidence in parenting was mentioned as an aim across 37 per cent of centres.
Centre staff also reported on the improvement of state for the ‘parent’ and their parenting,
including the empowerment of parents and families (27%), general support (24%), and developing
independence and responsibility (17%).
Whilst the majority of staff responses regarding Parent and Child needs related to aims specifically
for the parents (93% of centres), a further 77 per cent described aims that directly affected
children, and more specifically their experiences and outcomes. Staff reported aims for improved
child outcomes in 58 per cent of centres. The Research Team grouped staff responses into
nodes in order to draw out the themes that were reported by respondents. Particular outcomes
arising from centre interviews which centres were working to achieve included (in order of most
common):
1. General ‘improved outcomes’ in terms of developmental capacity and life achievement
2. School readiness
3. Early intervention and prevention
4. Every Child Matters (ECM) outcomes
5. Access to two year-old funded childcare places and EYFS outcomes.
49
All percentages given in Section 5.4 have been rounded up to whole figures, and are out of total responses to the question, “what is the aim for parenting services in your centre?’ n=113.

44
Staff referred to children receiving better experiences in 45 per cent of the centres. The biggest
contributor of these answers was improved attachment between parent and child (noted by 27% of
centres). Other examples included (in order of most common):
1. Understanding of the importance of play opportunities
2. More varied and child-led experiences
3. Raising parents’ aspirations for their children.
5.4.2 Personal Needs of the Parent
After Parent and Child, the second most prominent family need targeted by centres was that of the
Personal Needs of the Parent. Staff from 79 per cent of the centres felt that their services were
aiming to target this element of family need. The majority of centres (38%) were reportedly aiming
for a more general life improvement including tackling issues such as alcohol and drug misuse,
applications for general support, and fostering a more positive personal outlook on life. Examples
given by staff included the following: ‘Trying to improve quality of life for parents’; ‘Fill in paper
work, support going to court, listening’; ‘Life coaching – do things in bite-size pieces’; ‘Need to
work on themselves first’; ’Make good of what got.’
Staff also reported aiming to support parents to get back into education, courses and training (with
particular reference to language and numeracy skills; 32%), the importance of improving general
health (specifically healthy eating, obesity, and oral health; 28%), and increasing employability
with the ultimate aim of getting parents back into work (27%). Staff also referred to improving
parent socialisation through building social networks (22%), improvement of mental and emotional
health of parents, reduction of parenting stress and depression (21%), relieving financial pressures
(including improving economic wellbeing and budgeting), and supporting access to benefits and
debt management help/advice (19%).
5.4.3 Other aims for the centre
Other aims for the centre are discussed in more detail in Appendix 5.4. These included aims
targeted towards the Parent and Community (across 45% of centres), such as engagement with
the centre, reduction in parent isolation and integration into the community, community
involvement, and increasing parental trust. Parent and Family needs were least reported as an
aim (by 14% of centres), for example, dealing with domestic abuse and improvement of parent-to-
parent relationships.
5.5 The Benefits of ‘Play and Learning’ Activities for Families (Children and Parents)
Staff who were involved in running sessions at the children’s centre were asked two questions
about particular activities: “what do you think the children get out of ‘play and learning’ activities in
centre sessions?” and “what do you think adults get out of ‘play and learning’ activities?” Staff
from 108 children’s centres provided responses to the questions about the benefits for children

45
and adults, now discussed in detail. For details on parents’ views regarding the benefits of centre
activities, see Chapter 7.
5.5.1 Benefits of ‘Play and Learning’ Activities for Children
Staff were asked specifically about the benefits of all ‘play and learning’ activities with children (as
opposed to early education or childcare provision). Data analysis showed that staff were aligning
their thinking about the benefits of ‘play and learning’ activities for children with categories from the
new EYFS framework. The current EYFS statutory framework was published in 2012 by the
Department for Education in order “to set standards for the development, learning and care of
children from birth to five” (Department for Education [DfE] and Standards Testing Agency [STA],
2013, p4). The EYFS Profile now specifies expected levels of achievement for children across
three prime areas of learning (i.e. ‘Communication and Language’; ‘Physical Development’; and
‘Personal, Social and Emotional Development’); and four specific areas of learning (Literacy;
Mathematics; Understanding the World; and Expressive Arts and Design). Staff responses will be
presented against the three prime and four specific areas of learning within the EYFS.
Table 5.3 shows the distribution of codes against the seven areas of learning within the EYFS
(2013). Whilst staff were asked about their understanding of the benefits of play and learning
activities for children, it is important to note that the questions did not directly interrogate staff on
their use of the EYFS with children. Researchers instead used the EYFS as a framework from
which codes could be organised, and a more direct questioning of using the EYFS for school
preparation would likely produce a different set of responses. The team informally recognised that
a number of centres integrated areas of the EYFS into their work with children. The area of
learning most widely reported by staff as a benefit of interacting with centre ‘play and learning’
activities was ‘Personal, Social and Emotional Development’ across 91%50 of centres. Next
followed ‘Physical Development (65%), then ‘Understanding the World (59%), ‘Communication
and Language’ (46%), ‘Expressive Art and Design’ (36%), ‘Literacy’ (11%), and ‘Mathematics’
(7%). Each area of the EYFS will now be discussed in turn with reference to staff responses.
Areas of the EYFS
1. ‘Personal, Social and Emotional Development’ was the most prominent of the EYFS
benefits listed by staff (91% of centres). The biggest contributing benefit, social development,
was widely reported (across 79% of centres). Typical responses ranged from the development
of specific social skills to the building of friendships and learning to interact with peers and
adults: ‘They learn to share, take turns’; ‘Helps them mix/share with other children. Develops
good manners’; ‘Increase social – self-esteem’.
The second largest contributor to ‘Personal, Social and Emotional Development’ was the
benefit of learning through play (32% of centres): ‘Opportunities to learn through new
experiences in play indoors and outdoors’; ‘Space – can run and play freely within the large
room’. Other major benefits for children included improvements to child behaviour (22%) and
improvement to levels of confidence (18%).
50
All percentages given in Section 5.5.1 have been rounded up to whole figures, and are out of total responses to the question, “what do you think children get out of ‘play and learning’ activities in centre sessions?’ n=108.

46
Table 5.3 Examples of staff reported ‘benefits for children’ across the seven Early Years Foundation
Stage areas of learning
EYFS Areas of Learning and Other themes
No. centres
(%) Areas of coding
Personal, Social and Emotional Development
98 91 Social development, learning through play, behaviour, confidence, independence, separation/school readiness, self-awareness, emotional development
Physical Development
70 65 Physical development, play, outdoor play, health
Understanding the World
64 59 Variety of learning experiences/resources, messy play, learning about the world/environment, new experiences, culture and the community, cookery, water and sand play
Communication and Language
50 46
Development of language, opportunity and development of interaction, communication and oral communication, development of vocabulary, listening, attention, understanding
Expressive Arts and Design
39 36 Expression, creativity and imagination, freedom and exploration, using media and materials
Literacy 12 11 Reading and book skills, writing skills, literacy
Mathematics 8 7 Numeracy, cookery OTHER SKILLS AND OUTCOMES
85 79 School readiness, child interactions
Total n= 108 centres responding to this question, all percentages have been rounded up to whole figures
2. The second EYFS area of learning mentioned by staff across 65 per cent of centres was
‘Physical Development’, of which there were two large contributors. The first of these was
physical development (32%), which encompassed references to physical activity, gross and
fine motor development, understanding of their body, and exercise (‘Connection to their
bodies’; ‘Exercise – encourage crawling and walking, physical exercise and coordination’). The
second was play (also reported across 32% of centres) which, although did not directly imply
an improvement in physical development, is known to contribute to the development of
physical skills (Maude, 2006).
3. The third EYFS area of learning most commonly referred to by centre staff was
‘Understanding the World’ (59% of centres). Benefits were complementary to the strategies
for supporting children (discussed in Chapter 6), particularly in terms of supporting
opportunities for children. Within this area of learning, there were two clear contributors, the
largest contributor by far being the benefit of accessing a variety of new learning experiences
or resources (61 out of 64 centres). Staff provided information about a range of new indoor
and outdoor experiences for children, including water and sand play, messy play, investigating
the outdoors, cookery, good quality resources and a number of other activities that children
cannot access at home: ‘Chance to learn new things and get new experiences’; ‘Opportunity to
try food they might not have at home (introduce different texture foods)’; ‘To play with quality
resources carefully matched to age and ability.’
The second largest contributor to ‘Understanding the World’ was the benefit of accessing
messy play activities at the centre. Nineteen per cent of centres who answered this question
felt that this was a primary benefit of engaging with children’s centre services, and something

47
which children frequently lacked within their home environment: ‘The experience of messy
activities, things they can’t do at home’; ‘Messy play...many (most) parents don't do at home.’
The remaining areas of EYFS learning were reported less frequently across the sample. The
fourth EYFS area of learning, ‘Communication and Language’, was reported by centre staff
as a benefit to children across 46 per cent of centres. The majority of benefits relating to this
area of learning were in reference to the child’s development of language (34%) and speech
(18%). Fifth came ‘Expressive Arts and Design’. This area of learning was reported by staff
across 36 per cent of the centres. Most of the benefits included methods of expression (such
as music and singing, drawing and dough making, and painting), and elements of creativity and
imagination. Fewer staff spontaneously reported the benefits of improved or developed
literacy and numeracy skills as a result of accessing play and learning activities. Reading
and general book skills were reported to be the biggest contributor along with writing skills and
literacy (11%). Mathematics was the least mentioned benefit of children’s centre use (7% of
centres). The benefits were described as a combination of numeracy skills and cookery.
Other benefits of attending play and learning activities offered by the children’s centre
Seventy-nine per cent of centres reported that children received other benefits (that did not appear
to clearly fit into the areas of learning within the EYFS). The biggest of these, was improved
school readiness and preparing children for progression into the nursery or primary school
(52%), which included improving child disposition for school, introducing routines (‘Gives structure
to their day’; ‘tidying up, snack, singing time’), general school or nursery readiness, and general
transition to nursery/primary school. Another reported benefit was an improvement in interactions
of/for the child (32%), including interactions with father figures and other adults. The bulk of this
benefit, however, was improvement of the parent-child relationship (27%), as demonstrated by the
following: ‘Bonding between parents and children; ‘Parent-child interaction, letting them develop in
a different environment’; ‘Quality time with their parents’.
5.5.2 Benefits of ‘Play and Learning’ Activities for Adults
Centre staff reported the greatest number of benefits for adults which met Parent and Child
needs (95% of centres out of the 108 centres who provided answers to this question), followed by
the Personal Needs of the Parent (87%), Parent and Community (66%), and lastly Parent and
Family (14% of centres). The breakdown of staff responses is shown in Table 5.4, and will be
discussed again in terms of parental needs.
Parent and child
The most widely mentioned benefits for parents and adults (95%51 of centres) related to Parent
and Child needs. As before, and mirroring the staff responses to the ‘Aims for Parenting
Services’ question in Section 5.4, staff framed their responses in terms of benefits to both parents
and children. The inclusion of ‘benefits to children’ within their responses to the parent-focused
question provides some affirmation that improving the outcomes for children was of prime
importance in their parent-focused work.
51
All percentages given in Section 5.5.2 have been rounded up to whole figures, and are out of total responses to the question, “what do you think adults get out of ‘play and learning’ activities in centre sessions?’ n=108.

48
Table 5.4 Examples of staff reported ‘benefits for adults’ across the areas of parental need
Areas of Parental Need
No. centres
% Areas of coding
Parent and Child
103 95 Child benefits (better outcomes). Parent aims (ability to care for child, parenting skills, knowledge of child development, confidence in parenting, modelling from staff and other parents)
Personal Needs of the Parent
94 87
Social interaction and socialisation, increased peer support, improved health, education, general life improvement, improved financial situation, seeking employment, improved mental health, improved housing
Parent and Community
71 66 Reducing isolation, community/centre engagement
Parent and Family
15 14 Individualisation of family needs, holistic approach, improved relationship between parents, reduced domestic abuse
Total n= 108 centres responding to this question, all percentages have been rounded up to whole figures
The majority of centre responses relating to Parent and Child needs (90%) referred to benefits
which directly influence the parents’ ability to appropriately care for their child (in terms of
improving their skills and ability, self-belief and mental state, knowledge, and introspection). The
top three benefits for parents followed the exact pattern of the responses given for ‘aims of
parenting services’, with improved parenting skills reportedly being of the greatest benefit to
parents (65%), followed by greater knowledge of child development (53%), and increased
confidence in parenting (27%). In terms of improved parenting skills, specific benefits included
learning about new activities or resources to use with their children at home, particularly resources
that are affordable or which they had originally thought were unsuitable to use with their child.
Staff spoke in detail about the benefits of developing and improving parenting skills, which often
included skills for behaviour (‘Build parenting skills’; ‘Learn skills from staff who model how to
talk/play with children which they can take home with them’). When considering how improved
knowledge about child development and understanding of the importance of parental involvement
can benefit parents, staff commented: ‘Get a better understanding of child development, of child
behaviour’; ‘Parents being aware of different activities to stimulate their child's development and
learning opportunities’; also allowing them to ‘See what is usual development of children.’
Staff remarked that there was an opportunity for families to learn from both the centre staff and
other parents through modelling of appropriate and positive behaviours (22%), for example, ‘Staff
model how to play with children and how to keep children engaged’; ‘Can see other parents role-
modelling, and watch them play with children’; ‘Pick up ideas from other parents’. This final
commonly mentioned benefit for parents had not previously been mentioned as an ‘Aim for
Parenting’ (see Section 5.4).
As already noted, a large number of staff responses across Parent and Child needs related to
benefits for children, despite the question specifically asking about benefits for adults (80%). As
was the case with the ‘Aim for Parenting’ question, the benefits for children could be divided into
two types: improved child experiences and improved child outcomes. Staff reported benefits
for improved child experiences in 54 per cent of the centres, the biggest contributors of which were
enhanced or improved play experiences with their parent (‘Parents learn how to engage with
children especially through messy play’; ‘[Parents] get time to play with their children without
housework, phones or other distractions’), followed by improved parent-child relationships (‘One-

49
to-one bonding with child’) and more varied child experiences (‘Good resources and well equipped
room and outside areas’). Staff described the benefits of improved child outcomes (28% of
centres) including the opportunity for parents to observe their child and monitor their progress
(‘Parents see the progress their children make’) and improving school readiness (‘Routines for
children – helps transition to school – example snack time, group story and song time)’.
Other benefits of ‘Play and Learning’ activities for adults
A number of other benefits were cited for adults, including improvements to the Parents’ Personal
Needs (87% of the centres: for example, social interaction and socialisation, peer support and
other outcomes listed in Appendix 5.5). Parent and Community benefits were the third most
commonly reported benefit (66% of centres: such as reducing isolation, community engagement).
Lastly, staff mentioned benefits related to the Family (14% of centres) for example,
individualisation to family needs and the benefits of a holistic approach.
5.5.3 Other Benefits of ‘Play and Learning’ Activities
When staff were asked to report on the benefits of play and learning activities for children and
adults a number of other features of the children’s centre service were described as beneficial.
The most prominent of these was the supportive environment of the centre (reported by 65%52 of
the centres), which included references to the following:
1. The general level of support offered, which often went a step beyond the scope of centre
sessions: ‘Reassurance and advice from staff’; ‘Help to do the shopping list –supporting them
to shop’; ‘Support and help when needed’.
2. The welcoming and comfortable environment within the centre: ‘It’s a cosy home environment,
which families relate to. It has a relaxed atmosphere’; ‘It’s really welcoming, a hub of the
community’. Royston and Rodrigues (2013) reported that this type of welcoming environment
was essential for the sustained engagement of families.
3. The enjoyment that families receive as a result of attending the centre: ’Children don’t want to
leave’; ‘Mums enjoy the activities’.
4. The accessibility of having a range of services together in one location, the physical
accessibility of the centre location, and the inclusivity for families who need special access:
‘Everything is under one roof making it easier to help families’; ‘The location – such a rural area
so very few services anyway, so having children centre at heart of community is beneficial for
families’; ‘Children with disabilities – Special Educational Needs [SEN] group supports parents
to access nursery and professionals’.
In addition to the supportive environment, staff felt that families benefited from furthered
knowledge resulting from their access to general information and advice at the children’s centre.
Thirty-one per cent of centres described benefits of families being able to ask questions and seek
52
All percentages given in Section 5.5.3 have been rounded up to whole figures, and are out of total responses to the two questions, ‘what do you think the children get out of ‘play and learning’ activities in centre sessions?’ and ‘what do you think adults get out of ‘play and learning’ activities in centre sessions?’ n=108.

50
advice on services, particular concerns to do with their child or parenting, or their own additional
needs: ‘Speak with workers if they have worries’; ‘Ask how do you do that?’; ‘Contact with workers
– offer informal advice and support’. Families were also noted to benefit from the wealth of
information available at the centre i.e. from centre staff, experts, or leaflets and tip sheets. Lastly,
centre staff reported: benefits for the parents, in terms of the integration of multi-agency services
and the opportunity for signposting and referrals to other sessions, services, or agencies (26% of
the centres); benefits of accessing a high quality service, including multi-agency teams, qualified
and passionate staff, and suitable buildings (20% of centres); benefits of having dedicated time to
spend with their children and to structure their day, as well as a dedicated place to take their child;
and the benefits of attending a free service.
5.6 Summary
Staff were most likely to emphasise whole family factors and needs in their general
descriptions of centre users, followed by parent factors/needs. Staff most frequently referred
to types of family structure (e.g. lone and young parent families) and the variety of family needs.
References were made to both the vulnerability (e.g. involvement of Social Care) and the variety
of socio-demographic characteristics of the participating families. Definitions of the ‘most
disadvantaged’ families were more likely to emphasise parent factors or needs, followed by
the needs of the family. Staff reported factors such as the parents’ personal situation, poverty,
inadequate housing and lack of socialisation; or factors relating to their personal life skills. Staff
acknowledged three potential barriers which could pose a challenge to working with the
families: 1) parental relationships with staff, 2) staffing, including time allotted to families, and 3)
centre administration, resources, and finance.
The aims for parenting services could also be broadly mapped onto areas of parental need.
Centre staff most commonly described aims for meeting the needs of the Parent-Child,
followed by the parents’ Personal Needs. Frequently reported aims included improving
parenting skills and furthering parent knowledge about good parenting and child development, as
well as improving child outcomes and experiences.
Staff reported a number of benefits consistent with the EYFS areas of children’s
development as a result of attending ‘Play and Learning’ activities, including ‘Personal,
Social and Emotional Development’, ‘Physical Development’, and ‘Understanding of the
World’. School readiness was also listed as an important benefit, as well as providing an
opportunity for children to interact with others. Staff reported a number of benefits for adults
which matched the commonly listed aims for parenting services.
The greatest benefits were reported for improving Parent-Child needs, followed by the
parents’ Personal Needs. Frequently reported benefits included improved parenting skills,
greater knowledge of child development, and increased confidence in parenting. Other benefits
highlighted by staff included the supportive, welcoming and comfortable environment of
the centre, the furthering of parental knowledge, and the integration of multi-agency
services.

51
6 Strategies and Progression into the Future [Goff and Evangelou, with Tracz and Parkin]
Key Findings:
Four areas of findings are presented within this chapter:
Strategies for working with children
Staff reported using a number of strategies with children such as the provision of
Opportunities and Interactions* (92% and 45% of centres respectively: strategies
resembling the ‘Opportunities, Recognition, Interaction and Model’ framework known as ORIM
[Hannon 1995]). Other strategies described as being used with children included the
development of school readiness (47%), meeting individual needs (34%) and creating a
supportive environment (33%).
Strategies for working with parents
Strategies used with parents could also be aligned with the ORIM framework, including
the provision of Opportunities, followed by Modelling, Interactions and Recognition
(90%, 88%, 87% and 34% of centres respectively). In addition to this, staff reported a number
of other strategies, including encouragement and empowerment (90% of centres), meeting
individual needs (85%), and providing information and knowledge (83%). Across the sample,
all but one of the aforementioned strategies were used to support parent-child needs (98%).
Centre strategies
Staff also referred more generally to the importance of providing a multi-agency
response, a variety of service types, and promoting centre services (66%, 62% and 39%
respectively).
Children’s centres’ hopes and plans for the future
The majority of staff reported that services and provision should be the key focus for
future working, particularly keeping the centre open and sustaining the current level of
services on offer, as well as providing additional services, and commenting on the
focus of groups and services that will be offered in the future (across 94% of the centres).
Other areas of focus for the future (in order of prevalence) included family involvement and
engagement with the centre (65%), organisation and management practices (64%), staffing
(63%), family needs (50%), and facilities and resources (44%).
*Interactions as listed here present both parent-to-child and other adult-to-child interactions, as
well as sharing with parents the importance of facilitating such experiences for the child.

52
6.1 Introduction
This chapter aims to look into further detail regarding staff responses to the interview described in
Chapter 5. The chapter begins with a discussion of the supportive strategies used with children
and parents at the centre, before moving on to general strategies implemented by the centre. The
chapter will then describe the changes which staff would like to see within the children’s centre
over the next year, before concluding with a summary of the findings. The authors will draw upon
the ‘Opportunities, Recognition, Interaction and Model’ (ORIM) framework developed by Hannon
(1995) to describe the supportive strategies used with families at the children’s centres.
The ORIM framework informs parents of ways that they can support their children’s learning:
Opportunities to learn
Recognition and valuing of their early achievements
Interaction with adults in learning situations
Modelling (of literacy and numeracy behaviours, learning strategies, and dispositions from
adults)
The ORIM framework positively recognises ways in which parents already support their children’s
learning and ways that staff might be working with the families to support child learning, and carry
out parenting support.
6.2 Strategies for Working with Children
In total, staff from 108 centres reported on strategies that they used with children at the centre.
Upon analysing staff responses it became clear that the strategies could be aligned to the ORIM
framework (Hannon, 1995). Table 6.1 shows the distribution of the ORIM framework along with
other prominent areas arising from staff responses.
Table 6.1 Examples of strategies for children reported by staff in children’s centres
Strategies used with children (and type)
No. Centres
% Areas of coding
Opportunities (ORIM)
99 92 Provision of learning experiences, experiences not available at home, provision of resources, opportunities for play, outdoor access
Interaction (ORIM) 49 45 Parent-Child relationship, other adults
Modelling (ORIM) 8 7 Role-modelling
Developing School Readiness (Other)
51 47 Preparing school readiness and early-education
Meeting Individual Needs (Other)
37 34 Individualised experiences and child-led play, assessment
Supportive Environment (Other)
36 33 Friendliness and accessibility
Total n= 108 centres responding to this question, all percentages have been rounded up to whole figures

53
In terms of the ORIM guidance, centres reported supporting parents through the use of the
following: provision of Opportunities (across 92% of centres), facilitating Interactions (45%), and
Modelling (7%); only one centre volunteered information about using Recognition as a supporting
strategy with children, and thus this is not reported here. Other centres spoke of using additional
supportive strategies, some of which may also be considered as aims for the centre. The most
widely reported of these were the development of school readiness (47%), meeting individual
needs (34%), and providing a supportive environment (33%). The most commonly reported of
these strategies will now be discussed.
6.2.1 ORIM Framework for Supporting Children
Ninety-two per cent53 of centres spoke about providing opportunities for children. In particular,
staff described the provision of learning experiences (58%), for example, messy play, cookery,
water and sand play, outdoor play, and tactile and sensory experiences. Staff reported providing
opportunities for children to be active and physical, creative, stimulated, and to develop
communication and social skills. Some centres specifically referred to providing opportunities for
children to access EYFS areas of learning within centre sessions. Next, half of the centres spoke
about providing children with experiences that they do not receive at home, particularly messy
play. Just over a third of centres spoke about the provision of resources; children were said to
have access to a wide range of toys, equipment, and quality learning materials through the
children’s centre. Just under a third of the centres provided play opportunities by giving children
the time and space to play with peers and parents. Outdoor experiences were specifically
highlighted as a supporting strategy by nearly a quarter of centres, especially as a number of
children do not have access to outdoor space or gardens within their everyday lives. Staff also
described other opportunities for children, including language development, freedom and
opportunity to explore a new environment, and the provision of space.
Forty-five per cent of centres referred to interaction as a supporting strategy for children. Staff
mostly mentioned enhancement of the parent-child relationship (30%) through increasing
opportunities for bonding and attachment, providing opportunities to interact, and allowing them to
spend quality time with their parent. Staff also described providing children with the opportunity to
interact with other adults aside from their own family (in just under one fifth of centres). In addition
to this, seven per cent of centres spoke about role modelling as a strategy for supporting children
(both in terms of learning from other children in the centre as well as directly from adults).
6.2.2 Additional Strategies for Supporting Children
Staff described a number of additional strategies that they used to support child development,
some of which could also be considered as aims for the centre itself. In their responses, 47 per
cent of centres spoke about the development of school readiness and early education,
including the development of early language skills, social skills (such as turn-taking and building
friendships), the development of appropriate behaviours (such as routines and boundaries),
adjusting to separation from parents, and transitioning.
53
The percentages reported throughout Section 6.2 have been rounded up to whole figures, and are based upon volunteered information regarding strategies (as opposed to all centres systematically answering a question). Percentages should therefore be interpreted with caution. n=108.

54
Thirty-four per cent of centres referred to meeting individual needs as a strategy for supporting
children. Nearly a quarter of centres referred to the provision of individualised experiences as a
strategy for children, including ensuring activities were age and ability appropriate, reflect child-
interests (e.g. child-led play), and ensure they were appropriately chosen to enable children to
meet their individualised outcomes. Twelve per cent of centres detailed assessment as a strategy
for meeting individual needs, which referred to a more detailed focus and observation of children’s
personal development and progress, and the assessment or monitoring for any delay in
development.
A third of centres reported the provision of a supportive environment in terms of ensuring that
the environment remained friendly and relaxing for the children (just under a fifth of centres). Staff
referred to creating a welcoming ‘Home from home for children’, using descriptors such as ‘open’,
‘cosy’, ‘fun’, ‘enjoy[able]’ and ‘happy’. Accessibility was also important for ensuring that children
with additional needs were able to access services, either at the centre or in their homes, and
referrals were made to appropriate professionals as required.
6.3 Strategies for Working with Parents
All 117 centres visited in the parenting study referred to a variety of strategies that they were using
to support parents at the centre. Qualitative analysis of the staff comments regarding the
strategies used with parents, showed clear similarities to the ORIM framework as well as areas of
parental need (see Table 6.2; for additional information see Chapter 2).
Table 6.2 Strategies for parents reported by staff in children’s centres
Strategies used with parents (and type) No. centres
%
Opportunities (ORIM) 105 90
Modelling (ORIM) 103 88
Interaction (ORIM) 102 87
Recognition (ORIM) 40 34
Encouragement and Empowerment (Other) 105 90
Meeting Individual Needs (Other) 100 85
Information and Knowledge Provision (Other) 97 83
Total n= 117 centres responding to this question, all percentages have been rounded up to whole figures
In terms of the ORIM framework, centres reported supporting parents through the provision of:
Opportunities (across 90% of centres), Modelling (88%), facilitating Interactions (87%), and
Recognition (34%). Other centres reported the use of additional supporting strategies, including
encouragement and empowerment (90%), meeting individual needs (85%), and information and
knowledge provision (83%). Across the sample all but one of the aforementioned strategies were
used to support Parent and Child needs as a unit (98%).

55
6.3.1 ORIM Framework for Supporting Parents
The strategies used for working with parents are discussed in depth in Appendix 6.1. The
provision of opportunities was mentioned most frequently as a supportive strategy across 90 per
cent of the sample, including the encouragement and provision of varied activities for children;
increasing parental awareness of new activities to be used at home; supporting parents to improve
their financial situation, and providing opportunities for work and employability; and opportunities
to access centre services in a variety of locations. The use of modelling as a supporting strategy
was reported by 88 per cent of the sample. Examples included the modelling of particular
parenting tools, skills, and strategies for use with the children; role modelling; working with families
on their skills for cookery, family diet, and breastfeeding; and provision of advice on a variety of
health issues such as smoking cessation, dental hygiene, and alcohol and substance misuse.
Interactions were reported as a supportive strategy by 87 per cent of the sample. Examples
included encouraging social interaction, relationship building and peer support networks;
developing trusting relationships with staff; giving parents the ‘freedom to talk’; encouraging parent
and child interactions and relationships; and providing group support. The least mentioned ORIM
strategy was recognition (reported by 34% of the sample). Staff reported using praising and
encouragement as a strategy, and encouraging parental reflection.
6.3.2 Additional Strategies for Supporting Parents
Encouragement was an additional strategy used by the majority of centres (90%). Responses
included general support; presenting a welcoming, supportive, accessible and inclusive
environment; developing parental confidence, self-esteem, and self-worth; encouraging parents to
develop independence, responsibility and participation (also within the community); general
parental empowerment; and promoting aspirations and self-esteem for the parents and their
children. Meeting individual needs was the next most commonly reported strategy (85% of the
centres). Examples included providing practical support; courses and education; targeting the
improvement of home lives; targeting the personal needs of the family, and maintaining a flexible
approach.
The provision of information and knowledge was the last main strategy highlighted (83% of
centres), which primarily referred to parental awareness of child development and the importance
of play; but also provision of information on parenting, child needs, and how children learn (to
name but a few examples). Further information on all strategies can be found in Appendix 6.1.
6.4 Centre Strategies
As well as listing strategies for use with children and parents, staff from 107 of the centres also
referred more generally to the way that their centre influences the delivery of services (further
detailed information on these centre strategies can be found in Appendix 6.2). Staff from two
thirds of the centres reported on the importance of providing a multi-agency response54
in terms
54
The percentages reported throughout Section 6.4 have been rounded up to whole figures, and are based upon volunteered information regarding strategies (as opposed to all centres systematically answering a question). Percentages should therefore be interpreted with caution. n=107.

56
of signposting and referrals to other agencies, and maintaining a good relationship with agencies.
A number of centres (62%) highlighted the importance of the types of services on offer (for
example, targeted versus universal provision, and variety). Many centres referred to promoting
their centre services to families (39%). The quality of the staff was also important (34%) in
terms of their role, nature, approachability, expertise and consistency. Centre provisions for
families were noted (21%) as was the centre being a safe place for families (14%).
6.5 Children’s Centres’ Hopes and Plans for the Future
Respondents were asked near the end of the interview to describe their hopes and plans for the
future of their centre. In particular, they were asked the question “how would you like it to change
or develop over the coming year?” In total, staff from 116 of the 117 centres provided answers to
this question.
Table 6.3 displays the breakdown of staff responses in terms of what they would like to change in
the future. Staff referred to their wishes in terms of 1) improved provision and experiences for the
families (including increased engagement and improved outcomes related to family needs), and 2)
centre-based outcomes such as management, staffing, and resources. Most importantly, staff
made comments about the ways that they would like their services and provision to move
forward in the future (94%55 of centres). Next (in order of frequency amongst the centres) staff
reported a future focus on family involvement and engagement with the centre (65%),
organisation and management practices (64%), staffing (63%), family needs (50%), and
facilities and resources (44%). These six areas of focus will be considered in turn.
Table 6.3 Staff responses to how they would like their centre to change in the future
What areas of centre focus would staff like to change
No. centres
% Areas of coding
Services and Provision 109 94 Staying open/sustaining services, additional services, focus of services, integration of centre into community, multi-agency approach
Family Involvement and Engagement
75 65 Increased engagement and attendance, increased numbers of families, improving reach and location
Organisation and Management Practices
74 64 Funding, organisation and management, data and registration
Staffing 73 63 Staffing issues and roles, job satisfaction
Family Needs 58 50 Parent and family needs, parent and child needs, personal needs of parents, parent and community needs
Facilities and Resources 51 44 Venue, space, facilities and resources Total n= 116 centres responding to this question, all percentages have been rounded up to whole figures
6.5.1 Services and Provision
Staff from the majority of the centres (94%) thought that services and provision should be a main
focus of centre work in the future, reflecting on five prominent issues: ensuring that the centre
55
All percentages given in Section 6.5 have been rounded up to whole figures, and are out of total responses to the question, ‘how would you like [your children’s centre] to change or develop over the coming year?’ n=116.

57
stays open and sustains services (in 68% of the centres), additional services (53%), focus of
groups and services (45%), integration of the centre into the community (44%), and
maintaining or developing a multi-agency approach (35%). These areas will now be
discussed in further detail.
The most commonly reported issue involved centres staying open and sustaining services
(reported by 68% of centres). Staff hoped for things such as: ‘Still to be here!’, ‘Not to stop all this
early intervention that we have been doing’, ‘Like to maintain at least a base level of what we can
provide (it’s under threat)’; ‘Ensure front line services [are] not affected.’ One respondent in
particular was concerned about losing current services: ‘I’m concerned about the impact on
families if there are further cutbacks because this can be a lifeline.’ The recent census by
4Children (2013) suggested that universal services were the most likely service to be cut back,
with the majority of centres citing a greater focus on targeted services, as driving these shifts.
Next, just over half of the centres (53%) felt that they would benefit from additional services.
Respondents described wanting more of the services that they were already implementing (‘To be
able to do more of what we are doing!’; ‘More universal services to get families in’; ‘The capacity to
deliver more courses/sessions’). They also described wanting new services such as parenting
programmes (‘Need parenting programmes – at [the] moment there are none running under new
lead body’; ‘Wants to offer baby massage but currently no time’), particular targeted groups (‘A
group/respite for children affected by domestic abuse’), and specialists who can help with services
on-site.
Forty-five per cent of the centres felt that the focus of groups and services was important to
their future. A vast range of foci were mentioned by staff, including supporting families,
universality of service, general parenting, solution skills, antenatal, healthy eating, budgeting,
individual needs, child development, and family intervention. A similar percentage of centres
(44%) recognised the need to integrate the centre into the community by building and
strengthening links with other organisations (such as schools, health centres and emergency
services), getting staff into the community, seeking out new community venues for services,
developing more outreach or family support work, developing more of a ‘community feel’ within the
centre, and encouraging the community into the centre through dedicated events (for example, “I
would like to see us out in the community more. There are so many families out there that don’t
even know we exist here. There is a good foundation but we need to build on it.”)
A further 35 per cent of the centres explained the importance of maintaining or developing a
multi-agency approach, particularly with health visitors and midwives, speech and language
therapists, schools, and social workers. Staff referred to developing work with professionals onsite
(‘Would like to have clinics onsite and a multidisciplinary team’; ‘Housing and benefits advisors
directly employed by children’s centres so that they are in-house – would be great’), improved data
sharing (’Further development in work with health, see them providing data they require’; ‘Sharing
knowledge’; ‘Social services issue – sharing information’), improved signposting and referrals to
other multi-agency partners (‘Make the referral process easier and support health visitors and
other professionals with this process’), and closer working in general between the centre and
multi-agency organisations (‘Building [a] more collaborative approach into our centre’; ‘More
working together with other agencies’). This finding is supported by Royston and Rodrigues

58
(2013) who describe effective partnership working as a particular difficulty with regards to data
sharing and understanding of the children’s centre role.
A wide range of other comments were made by respondents regarding the importance of future
services and provision of the centre, including the development of current work (28%), general
support for families, maintaining universal services, targeted services, ensuring quality and
appropriate services, broader services, and more outreach (amongst others).
6.5.2 Family Involvement and Engagement
The second most prominent area for change described by the staff was family involvement and
engagement (across 65% of centres). Staff reported three prominent issues: increased family
engagement and attendance (52%), more families (33%), and the importance of reach and
location (24%). These areas will now be discussed in further detail.
Just over half of the centres responding to this question (52%) reported on the importance of
increased family engagement and attendance. In particular, respondents spoke in detail about
meeting their targets and increasing the numbers of families accessing centre services.
Respondents particularly wanted to learn about how to engage with families, increase more
accessible universal work (‘Keep the ‘soft’ courses that attract people in so they can move on to
other training’), reach particular vulnerable target groups such as fathers, and Eastern European
families, use data to target new families, and lastly, to encourage registered families to use the
centre more. Next, staff referred to a wish to bring in more families (33% of centres): ‘If you
reach a point where people are not coming to you, you have to go to them, look at new ways of
“selling” yourself.’
Staff spoke about the importance of reach and location (24% of centres), and more specifically,
the emphasis on engaging particularly difficult areas of reach (‘They need an additional site in …
reach area’), improving their current percentage of ‘reach’, and revising how they work with the
local families and their needs. Other comments given by staff in relation to improved family
involvement and engagement included (in order of frequency): improved promotion of the centre
and services (in 17% of centres), encouraging specific vulnerable groups into the centre (11%),
increased parental involvement in centre work (for example, through volunteering, parent forums,
the advisory board, fundraising, and consultation), and increased access by hard to reach families.
6.5.3 Organisation and Management Practices
The third most frequently reported area of centre progression was organisation and management,
(64% of centres). Staff stressed three prominent issues: funding (37%), general organisation
and management (19%), and data and registration (10%). Most frequently, staff described the
issue of funding (37% of centres) and a wish for greater or sustained funding. Staff identified a
number of purposes towards which further funding would be targeted, including better staffing
levels, increased targeted and universal work, transporting families to the centre, the continuation
of more-expensive parenting programmes, better publicity, improved training opportunities, and
subsidising trips for families. Staff also wanted reassurance that future funding would not be

59
further reduced: ‘Unfortunately we see what we need to do but we are constrained by [the] current
economic climate’; ‘Would like finances not to drop’.
Next, staff spoke about general organisation and management (19% of centres) including
uncertainties regarding lead bodies and working with current or new managerial staff: ‘Worry is
that with [a] different lead body, may spend more time on the requirements of the
organisation/lead body as they will tender for cluster’. Lastly, staff mentioned a wish to resolve
data and registration issues (10% of centres). Respondents described the pressures of reaching
a set percentage of families (‘Service is about supporting families not data collection’), receiving
better data from other agencies (‘Stronger links with midwives to ensure even earlier registration’),
and improving their use of current data (‘Make use of data- target to encourage/get feedback to
see if there's anything they want’).
6.5.4 Other Hopes and Plans for the Future
The fourth most frequently described area for progression was staffing, as indicated across 63
per cent of the centres. Staff reported two prominent issues: staffing issues (53%: for example
staffing consistency; job security and issues with temporary staffing; workload and needing
additional staff; tensions in relying on volunteers; and requesting defined job roles) and job
satisfaction (19%: wishing to stay employed and remaining positive).
Half of the centres wanted to see a focus on family needs in the future. Staff reported wishing to
see changes related to the family (26% of centres: for example positive outcomes for families,
providing for individual needs, and better monitoring of family progress). Staff also talked about
wanting to see changes related to Parent and Child needs (25%: examples included improved or
maintained early intervention and prevention, greater work surrounding parenting skills, and a
greater focus on narrowing the child attainment gap, amongst others). Parent’s personal needs
were a focus for fifteen per cent of the centres (e.g. reducing worklessness, providing
opportunities for parental interaction, improving mental health, education, etc.) and ten per cent of
centres wanted to see changes for the community (e.g. community projects and volunteering
opportunities).
The sixth and final area for change described by staff regarded facilities and resources (across
44% of the centres). Two main issues arose from the respondent answers: improvement in venue
and space (in 29% of centres: for example, availability in outreach areas; improvement in outdoor
space; wishing for further space in the centre and utilising current facilities; changing centre
ambience), and facilities and resources (19%: such as new facilities in the centre, modernising
systems and providing further resources). These areas are discussed in more detail in Appendix
6.3.
6.6 Summary
This chapter has documented strategies for children, parents, and children’s centre working that,
at the point of data collection, were utilised or proposed for future service implementation. The
current data demonstrates the substantial variation of children’s centre provision across the
different categorisations of the ORIM framework. Staff reported using a number of ORIM

60
strategies with children such as the provision of Opportunities and Interactions. Ninety-two
per cent of children’s centres provided Opportunities for children through the provision of learning
experiences, outdoor experiences, play opportunities, and experiences not received at home such
as messy play. Forty-five per cent of children’s centres used Interactions as a strategy for working
with children, building upon the parent-child relationship through the encouragement of bonding
and attachment and the provision of socially interactive opportunities, for example, with other
children and adults within the centre. Other strategies described as being used with children
included the development of school readiness, meeting individual needs, and creating a
supportive environment.
Strategies used with parents could also be aligned with the ORIM framework, including the
provision of Opportunities, Modelling, Interactions and Recognition. The most widely
reported strategy, provision of Opportunities included the encouragement and provision of varied
activities. This was followed by the modelling of parenting tools, skills and strategies and
encouraging social interaction. In addition to this, staff reported a number of other strategies,
including encouragement and empowerment, meeting individual needs, and providing information
and knowledge. Across the sample, all but one of the aforementioned strategies were used to
support parent-child needs. Staff also talked more generally about the importance of
providing a multi-agency response, a variety of service types, and promoting centre
services.
Children’s centres were questioned as to their hopes and plans for the future of their centres, both
in terms of their work with families and also in their plans for centre-based outcomes, such as
management, staffing, and resources. The majority of staff reported that services and
provision should be the key focus for the future, particularly regarding keeping the centre
open and sustaining services, providing additional services, and the focus of groups and
services in the future. Other areas of focus for the future (in order of prevalence) included family
involvement and engagement with the centre (e.g. attendance, more families, reach and location),
organisation and management practices (e.g. funding, organisation and management, data and
registration), staffing (e.g. staffing issues, roles and job satisfaction), family needs, and facilities
and resources.

61
7 Parental Views and Experiences [Paget, Evangelou and Goff]
Key Findings:
Three areas of findings are presented within this chapter:
Parental use of children’s centres
On average, parents visit their children's centre “at least once or twice a week”.
On average parents attend more than one children's centre, as it allows them to access a
wider variety of services. Parents indicated that the top three reasons to attend other
children's centres were: to attend a variety of sessions, to allow their children to play within a
variety of children's groups, and to attend a specific session.
Most parents have been attending their children's centre for less than three years (78%).
The majority of these parents have been attending their centre for one or two years.
Reasons parents attend children’s centres
Parents predominantly attended children’s centres for the benefit of their child. The
most frequently reported reasons for attending children’s centres were as follows: allowing
children to meet and play with other children (97% of parents); giving children access to a
variety of activities (95%); children’s enjoyment of centre sessions (93%); parents’ enjoyment
of attending with their children (92%); parents wanting to help their children learn (84%); and to
help prepare children for nursery or school (78%).
Parental impressions of the children’s centres
The vast majority of parents indicated that they were “very happy” with the services provided to
them by children’s centres (92% of parents). No parents indicated that they were “very
unhappy” with any of the services offered.
Parents referred to a number of benefits for their children including improved personal,
social, and emotional development, as well as improved physical development as a result of
attending centres.
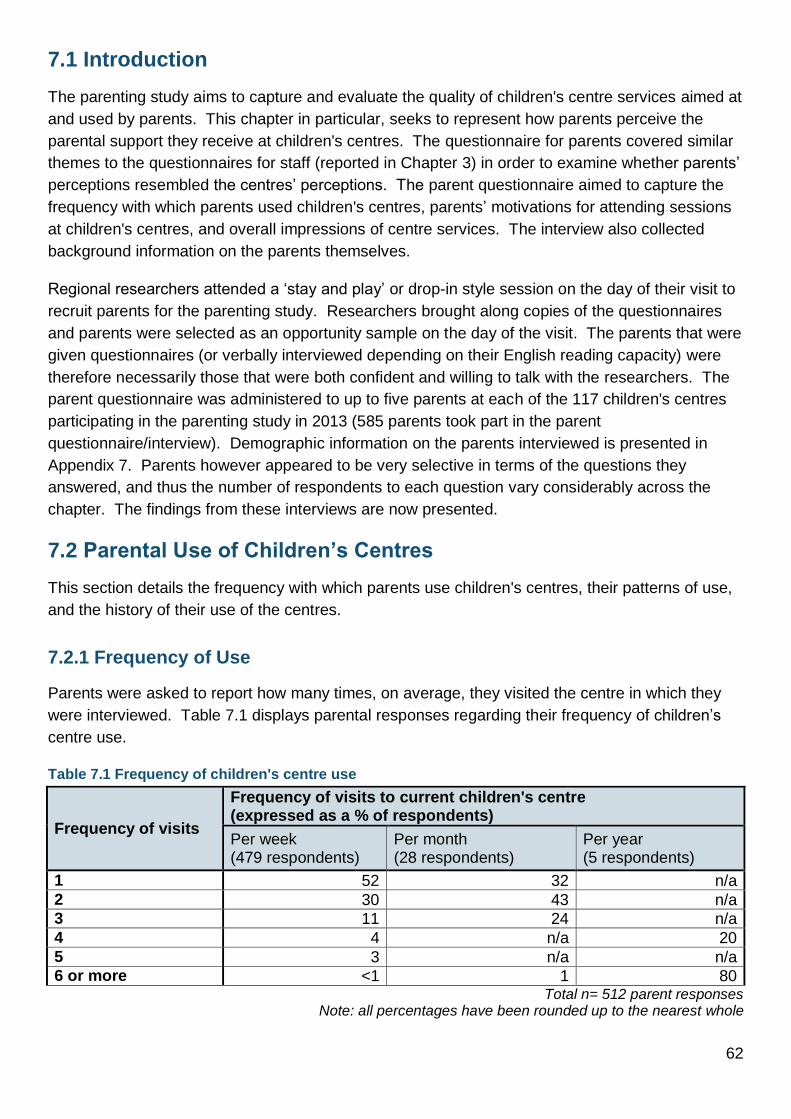
62
7.1 Introduction
The parenting study aims to capture and evaluate the quality of children's centre services aimed at
and used by parents. This chapter in particular, seeks to represent how parents perceive the
parental support they receive at children's centres. The questionnaire for parents covered similar
themes to the questionnaires for staff (reported in Chapter 3) in order to examine whether parents’
perceptions resembled the centres’ perceptions. The parent questionnaire aimed to capture the
frequency with which parents used children's centres, parents’ motivations for attending sessions
at children's centres, and overall impressions of centre services. The interview also collected
background information on the parents themselves.
Regional researchers attended a ‘stay and play’ or drop-in style session on the day of their visit to
recruit parents for the parenting study. Researchers brought along copies of the questionnaires
and parents were selected as an opportunity sample on the day of the visit. The parents that were
given questionnaires (or verbally interviewed depending on their English reading capacity) were
therefore necessarily those that were both confident and willing to talk with the researchers. The
parent questionnaire was administered to up to five parents at each of the 117 children's centres
participating in the parenting study in 2013 (585 parents took part in the parent
questionnaire/interview). Demographic information on the parents interviewed is presented in
Appendix 7. Parents however appeared to be very selective in terms of the questions they
answered, and thus the number of respondents to each question vary considerably across the
chapter. The findings from these interviews are now presented.
7.2 Parental Use of Children’s Centres
This section details the frequency with which parents use children's centres, their patterns of use,
and the history of their use of the centres.
7.2.1 Frequency of Use
Parents were asked to report how many times, on average, they visited the centre in which they
were interviewed. Table 7.1 displays parental responses regarding their frequency of children’s
centre use.
Table 7.1 Frequency of children's centre use
Frequency of visits
Frequency of visits to current children's centre (expressed as a % of respondents)
Per week (479 respondents)
Per month (28 respondents)
Per year (5 respondents)
1 52 32 n/a 2 30 43 n/a 3 11 24 n/a 4 4 n/a 20 5 3 n/a n/a 6 or more <1 1 80
Total n= 512 parent responses Note: all percentages have been rounded up to the nearest whole

63
The majority of parents visited the target children's centre (i.e. the one in which they were
interviewed) “at least once or twice a week”. Eighty-two per cent of those parents (who visited the
centres on a weekly basis) did so once or twice per week. In addition, many parents indicated that
they would visit other children's centres as well as their own.
7.2.2 Patterns of Use
Parents were asked how many children's centres they attended and their reasons for attending
different centres. On average, parents attended 1.38 centres56. Parents’ answers ranged from a
minimum of one centre to a maximum of seven centres. Table 7.2 outlines parents’ reasons for
attending different centres. It is, however, possible that parents did not have in mind the set-up of
a cluster arrangement of centres (see Goff et al. 2013 for definitions of a cluster). Parents may
therefore have reported using different centres for various services that might have in fact been
part of the same cluster, or may have been satellite sites for the same centre.
Table 7.2 Reasons for attending other children's centres
Reasons for attending other children's centres Rank order of reasons (% of parent responses)
Services – To attend a variety of sessions 26
For a variety of children's groups 16
Services – To attend specific sessions 15
Services – Schedules and timing 12
Proximity to home 10
For a variety of parent’s groups 7
For a variety in atmosphere/location/staff/toys 6
Services – Location: whatever works with parent schedule and routine 5
Services – Service unavailability due to overcrowding/service cuts 2
Services – Health services/child weighing 2
Services – Costs associated with services/avoidance of costs 1
Volunteering at a different centre 1 Total n= 198 parent responses
Note: all percentages have been rounded up to the nearest whole
The top five reasons for parents attending different children's centres were: to attend a variety of
sessions, to include their children in a variety of children's groups, to attend specific sessions
offered by specific centres, to attend sessions at a time most convenient for the parent and child,
and the proximity of the children's centre to the family’s home. The desire for children to attend a
variety of sessions was the strongest motivator of parents to move between centres, with over one
quarter of respondents including this response in their answers.
7.2.3 History of Use
Parents were asked how long they had been using the target children's centre for, and how they
had first heard about it. Table 7.3 outlines the length of time parents had been using this centre
and Table 7.4 details how parents first came to hear about the centre.
56
Standard deviation of 0.73.

64
Table 7.3 Length of time parents had been attending the centre
Length of time parents had been attending the centre % of the parent responses
1st month 8
Less than 6 months 16
6 months – 11 months 16
1 year to 1 year 11 months 23
2 years to 2 years 11 months 15
3 years to 3 years 11 months 10
4 years to 4 years 11 months 6
5 years to 5 years 11 months 3
6 years or more 3 Total n= 468 parent responses
Note: all percentages have been rounded up to the nearest whole
Seventy-eight per cent of parents had been attending the target centre for three years or less. Of
these parents, the majority had been attending for one or two years.
Table 7.4 How parents heard about the centre
How parents first heard about the centre
Rank order of responses (% of the parent responses)
Health Visitor 23 Friend/Family 22 Searched for it myself 21 Leaflets/Centre Staff 13 Midwife/Doctor 12 Antenatal group 6 Clinic/Health Centre 3
Total n= 518 parent responses Note: all percentages have been rounded up to the nearest whole
Most parents (66%) heard about the target children's centre through contact with their health
visitors, a friend or family member, or they had searched for the centre themselves.
7.3 Reasons Parents Attend Children’s Centres
Parents were asked to outline their motivations for attending children's centres in the
questionnaire, according to a list of options. Table 7.5 outlines the reasons given by parents (in
rank order). A number of the reasons listed in Table 7.5 have been mentioned in staff reports of
the aims and benefits of children’s centre work (Chapter 5). Other responses (comprising 1% or
less of the respondents’ affirmative answers) included professionals encouraging the parent to
attend the centre (for example a counsellor, health visitor, speech and language therapist, social
worker, or centre outreach worker), and attending centres to help parents find employment.
Motivations to attend centres (outside of the list presented within the questionnaire) that were
explicitly given by parents included: meeting other parents for support and socialisation, the centre
and its staff being friendly and supportive, and children learning to share and socialise. Parents
were also asked to pick their top three reasons for attending children’s centres from the list. Six of
these came out as most popular, and matched directly the six most reported reasons listed within
Table 7.5.

65
Table 7.5 Reasons for attending the children's centres
Reasons parents come to the centre
Rank order of reasons (% of the parent respondents)
It allows my child to meet and play with other children 97
It gives my child variety in the activities they do 95
My child enjoys coming here 93
I enjoy coming here with my child 92
I want to help my child’s learning 84
It helps my child to prepare for nursery or school 78
It breaks up my child’s week 71
It gives my child some structure to their week/day 70
It is free/cheap 70
I want to make new friends 63
I want to learn how my child develops 55
I am supported by staff at the centre 55
My child can play with “mess” and I don’t have to clean up 53
This centre has a specific session that I like to attend 45
This centre is open during summer holidays when other places are not 43
I want to know how to better my parenting 40
It is somewhere to take my child in-between other activities (such as childcare)
39
I can bring both my young children and older siblings 34
I used to come here for other siblings/children and have decided to come again
29
One of my friends recommended that I should come here 28
I go to a health session (e.g. health visitor drop-in, dentist, nutritionist etc.)
22
I come to a course here 21
Food or lunch is provided for my child 16
My child goes to childcare here 11 Total n= 522 parent responses
Note: all percentages have been rounded up to the nearest whole
7.4 Parental Impressions of the Children's Centres
This section of the Parent Questionnaire was designed to capture the impressions of parents
regarding children’s centre services. Parents were asked about their overall impressions, their
views of the services offered for their children, the services offered to them as a parent, and the
services offered to them as a family. Table 7.6 summarises parents’ views of their children's
centre services.
The majority of parents were “very happy” with the services provided by the centres, and no
parents indicated that they were “very unhappy” with any of the services provided; of the 500+
parents who responded to these items, only one per cent were “slightly unhappy” with any of the
services offered to them by the centres. Parents were also asked to articulate their impressions of
the two sessions that they most regularly attended at the centre - they were asked what they liked
about the session, why they thought the session was helpful to either themselves or their child,
what they as parents do differently after having attended the session, what changes they have

66
noticed in their child/children since coming to the session, and what they would wish to change
about the session. The parent responses varied widely, however, the responses most frequently
cited can be categorised, generally, into ‘Benefits for Children’ and ‘Benefits for Parents’.
Table 7.6 Summary of parents’ overall impressions of children's centres in terms of level of
satisfaction
Parents’ views of the services offered
Overall % satisfaction (n=518)
% Satisfaction with child/Children Services (n=514)
% Satisfaction with parent services (n=511)
% Satisfaction with family/partner services (n=514)
Very happy 92 71 44 42
Slightly happy 6 5 6 5
Neither happy nor unhappy 1 1 3
3
Slightly unhappy 1 1 1 1
Very unhappy 0 0 0 0
Not applicable n/a 23 46 49 Note: all percentages have been rounded up to the nearest whole
Total n=500+ respondents
7.4.1 Benefits for Children
Parents cited many different benefits for their children. Similarly to the benefits and strategies
described by staff (Chapters 5 and 6 respectively), parents’ answers could be framed in terms of
both the EYFS and ORIM models. The first two benefits most reported by parents matched
exactly the most frequently mentioned benefits for children that were reported by staff (Chapter 5):
‘Personal, Social and Emotional Development’ and ‘Physical Development’. Specifically, parents
cited improvements in the behaviour, confidence, independence, and social development of their
child/children. The physical development of their child/children was also mentioned often, most
frequently in references to play space, outdoor play, and physical development (including fine
motor skills). Changes to their child’s communication and language skills were noted (see also
Chapter 5 for this as a benefit for children), including interaction and speaking with other
children/adults and improvements to speech (usually through singing).
Parents also spoke of benefits which reflected two of the most common strategies for supporting
children (noted in Chapter 6). In particular, they spoke of Opportunities, for example, parents
emphasised positivity towards the opportunity for their child to engage in messy play and to be
exposed to a variety of new learning experiences and activities. Centre sessions reportedly
provided their child/children with opportunities to explore personal interests. Parents also spoke of
development of school readiness, and in particular the ability to practice skills that would improve
school readiness.
7.4.2 Benefits for Parents
Parents who responded to this section of the questionnaire again gave varied responses
concerning what they liked about the sessions, why they thought the sessions were helpful, and
what they have done differently since coming to the sessions. The majority of parent responses
were concerned with improvements and changes to the parent-child relationship; they specifically
cited that the session provided them with an opportunity to bond and spend time with their child.
In addition to improvements that the sessions made to their everyday life and relationship with

67
their child, parents also listed confidence in parenting, new ideas for activities, activities to take
home, and parenting skills for behaviour. Parents recognised other benefits related to their own
personal needs, including general life improvements since coming to the sessions (specifically in
terms of improvements to educational levels and ambitions), their health (for example, eating more
nutritious food at home), and improvements to their mental health (for example, opportunities to
relax, socialise, and find support). Parents also frequently noted that the centres helped to
improve their relationships with their community, frequently citing a reduction in isolation and an
increase in community involvement.
Some of the most commonly listed benefits by parents were similar to the staff-reported benefits
for adults attending ‘Play and Learning’ activities (Chapter 5). However, parents placed a greater
emphasis on the benefits of the parent-child relationship and increased confidence than of the
development of their parenting skills, and understanding their child’s development, although they
did recognise the benefit of improved parenting skills as a result of attending sessions.
7.4.3 Suggested Changes to the Sessions
When parents were asked about the sessions that they most frequently attended, there were few
suggestions for improvements beyond the centres offering more sessions, more space, fewer
holiday closing periods, and a place to have tea or coffee (some of which were points also
recognised by staff as a progression for the future: see Chapter 6).
7.5 Summary
On average, parents visit their target children's centre once or twice a week, and a number
often attend more than one children's centre, as it allows them and their children access to
a wider variety of services. The most frequently cited reasons for visiting another children's
centre were: to attend a variety of sessions, children's groups, or a particular session. Most
parents had been attending their children's centre for less than three years. The majority of
these parents had been attending their centre for one or two years.
Parents predominantly attended children’s centres for the benefit of their child. The most
frequently reported reasons for attending children’s centres were as follows: allowing children to
meet and play with other children; giving children access to a variety of activities; children’s
enjoyment of centre sessions; parents’ enjoyment of attending with their children; parents wanting
to help their children learn and also to help children prepare for nursery or school.
The vast majority of parents indicated that they were “very happy” with the services
provided to them by children’s centres. No parents indicated that they were “very unhappy”
with any of the services offered. Parents referred to a variety of benefits for their children
including improved personal, social, and emotional and physical development. Parents also
frequently mentioned benefits to their parent-child relationships and to themselves. The
majority of parent responses were addressing improvements and changes to their parent-child
relationship. Additional benefits included confidence in parenting, new ideas for activities, activities
to take home, and parenting skills for behaviour.

68
8 Conclusions [Evangelou and Goff]
8.1 Introduction
This report aimed to capture the provision of services that were specifically offered to parents. It
was deemed important to capture not only the views of the members of staff but also of the
parents who were attending the centres, in order to obtain a broader picture of centre provision.
The Parenting Services study did not look at potential user-outcomes of attending centre services,
which will be considered in more detail in the ‘Impact’ strand of the evaluation.57
Children’s centres are known to offer a range of varied support for parents, covering areas such as
those detailed by Moran et al. in 2004. This report adopted a ‘holistic’ model of parenting support,
and services offered by children’s centres have been presented using this as a frame of reference,
as inspired by the ecological model of Bronfenbrenner (1994). Given the wide range of services
on offer within children’s centres, the report categorised services into four areas of parental need
(Personal Needs of the Parent; Parent and Child; Parent and Family; and Parent and Community).
These broad categorisations represent both the needs of parents in relation to those who are
close to them (i.e. children and family/partners) and to themselves as individuals (in terms of their
own personal needs and their engagement with the community). As explained by Moran et al
(2004), it is important to remember that, whilst an ecological perspective to support (such as the
one seemingly provided by children’s centres) can be considered best practice, it is very difficult to
maintain this support. The ECCE study of children’s centres was therefore designed to capture
the holistic approach of children’s centres, whilst keeping in mind other evaluations carrying out
data collection from users of the service.
In particular, the report explored:
the provision for parenting and services for parents across the sample;
staff perceptions of family needs;
the range of parenting programmes delivered by a named children’s centre and any associated
centres within their cluster;
how children’s centres manage their services;
staff perceptions of the benefits of centre services for parents and children; and
parental views of children’s centre services and their benefits.
A mixed methods design was adopted using questionnaires and interviews as methods of data
collection, from both children’s centre staff and parents. The framework adapted from
Bronfenbrenner’s model is used to present two key areas when drawing conclusions within this
report:
57 Strand 4 of the evaluation aims to answer the question: “What aspects of children’s centres (management, working
practices, services offered, services used) affect family, parent and child outcomes when their child is aged three?” This question will be explored by examining the information gathered from Strands 1 to 3. Subsequently, these children’s Foundation Stage Profiles will be used to explore the impact of children’s centres on child school readiness at age five.

69
a) the implementation of services within the children’s centres context (services on offer and
views of members of staff); and
b) the parental context (their views of services).
8.2 Implementation of Services within Children’s Centres
Conclusions to the implementation of services were drawn from four consecutive chapters of this
report (chapters 3, 4, 5, and 6): the Delivery of Parenting Services; the use of Evidence-Based
Practice; the Children’s Centres Aims for Families and Parenting Services, and the Strategies and
Progression into the Future. The four chapters present data that has been seen to reflect the
second layer of the Bronfenbrenner model which has been adopted throughout this report.
It was evident that children’s centres were offering a wide range of parenting services in 2013.
Staff reported tailoring different levels of support to the needs of parents and families through
generalised information, personalised information, personalised support and centre sessions.
Staff reported that their greatest offer of service was for accessing childcare and health and
lifestyle services. Staff members ranked their greatest emphasis for work as being on
parents/carers and parenting services, followed by education, health/social care, and daycare.
Improving enjoyment and achievement, narrowing the educational gap, reducing child protection
cases and disadvantage were four common aims reported across children’s centres.
When it comes to the provision of Evidence-Based Practice (a policy priority from 2012), children’s
centres typically reported offering the same amount of programmes in 2013 as they did when they
were visited in 2012. The earlier report on ‘visits to children’s centres’ (Goff et al., 2013) found
that, on average, fewer than 20 parents attended the ‘Incredible Years’ programme each year in a
centre. This might seem disappointing in that very few registered parents had access to a
parenting programme with a secure evidence base. On the other hand, if programme participants
succeed in managing their child’s behaviour better and in improving the parent-child relationship -
then ‘at risk’ children may have no need for further expensive services and so save money
downstream. It all depends on effective targeting of children most at risk. We know that centres
attempt just this.
Children’s centre staff were asked to reflect on the needs of the families that they were working
with; their responses were broadly categorised into areas of parental need. This categorisation
has been used throughout the report to highlight the different elements of children’s centre work,
which supports the diverse areas of parent lives. Centre staff placed the greatest emphasis on
aims which met the needs of the Parent and Child unit followed by the Personal Needs of the
Parent, Parent and Community, and lastly Parent and Family. When asked about the benefits of
‘Play and Learning’ activities for children, staff responses were consistent with categories of the
EYFS framework. Other listed benefits included improved school readiness and improvement in
child interactions (with both adults and other children).
Strategies used with children were observed to follow the ‘Opportunities, Recognition, Interaction
and Model’ framework (ORIM; Hannon, 1995). The most widely reported ORIM strategies for
working with children were: Opportunities, Interactions, and Modelling - very few examples that
70
could be coded as Recognition were reported. It is worth noting that staff were not directly asked
about the ORIM framework and how their work mirrors the four areas of support; it was the
research team’s decision to use the ORIM framework to analyse their answers. Staff referred to
developing school readiness, meeting the individual needs of the children and providing a
supportive environment as additional key strategies for working with children.
Centres were using a rich repertoire of strategies when working with parents, providing support
across all areas of parental need. Strategies used with parents also followed the ORIM
framework; the most widely reported strategy was Opportunities, followed by Modelling,
Interaction, and Recognition. In addition, staff reported a number of other strategies, including:
encouragement and empowerment, meeting individual needs, and providing information and
knowledge. Across the sample all but one of the aforementioned strategies were used to support
Parent and Child needs as a unit (98%).
Children’s centre staff were questioned regarding their hopes and plans for the future of their
centre, both in terms of their work with parents and families and also their plans for centre-based
outcomes (such as management, staffing, and resources). Responses, in order of prominence,
detailed the importance of: services and provision (hours of opening, focus of groups, integration
of the centre within the community); family involvement and engagement (attendance, more
families, reach and location); organisation and management practices (funding, organisation and
management, data and registration); staffing (staffing issues, roles and job satisfaction); family
needs (Parent and Family, Parent and Child, Personal Needs of the Parent and Parent and Child);
and finally, facilities and resources (venues, space, facilities and resources).
It is encouraging to see that many children’s centres seek to deliver services which target all four
areas of parental need. It is not surprising that as children’s centre staff and managers reflect
upon the different areas of their work, they assign different priorities to the four areas of parental
need. This may be due to the changing and complex situation of family needs to which children’s
centre staff are expected to respond.
8.3 Parental Views
Data from Chapter 7 returned the attention of the report to the parents, who were attending the
117 children’s centres that participated in the study, about their personal use of services.
Information was collected from more than 550 parents in reference to why they and their families
attended children’s centres and their opinion of the benefits of attendance. It must be noted that
these were parents present on the day of the fieldwork and ‘confident’ enough to respond to our
short questionnaire/interview.
The views expressed were overwhelmingly positive; parents indicated that they were ‘very happy’
with the services offered by the children's centres, most often citing benefits to their children's
personal, social, and emotional development. Parents also noted many benefits to their parent-
child relationship (among other varied responses). Five out of the six most frequently cited
reasons for parents to attend a children's centre were predominantly because of their children:

71
allowing their child to meet and play with other children;
giving their child a variety of activities to do;
acknowledging their child’s enjoyment of the centre;
wishing to help their child’s learning; and
acknowledging that attending the children’s centre can aid their child’s preparation for
preschool.
The other most frequently cited reason for attending a children’s centre was that parents enjoyed
going to the centres.
8.4 Final Remarks
This report detailed the delivery of parenting services across children’s centres. Centre
respondents’ concerns for the future reflect centres’ needs to respond to shifts in policy direction,
as well as financial reductions, workload and staffing pressures, and managerial restructuring.
The shift from universal to more targeted provision (as observed in 2012 fieldwork) has had, and
will continue to have, direct implications on the engagement of the families using children’s
centres.
A large element of children's centre work appears to be catered towards working with the parent
and child together, specifically with the development of parenting skills. Staff also showed a
dedicated focus on improving outcomes and experiences for children as an indirect result of
parenting work. It was interesting to note an alignment between the benefits of attending
children’s centres as reported by staff members and parents; staff predominantly described
benefits for the parents that addressed the parent and child as a unit (for example, improved
parenting skills, greater knowledge of child development, and increased confidence in parenting).
Similarly, the parents primarily reported that the main reason for attending children’s centres was
about understanding child development, and they see benefits of attending the centre, for
example, leading to increased confidence in parenting.
Despite the difficulties proposed by Moran et al (2004) to maintaining a holistic level of support,
this research has shown that children’s centres are continuing to offer a varied range of provision,
targeting all areas of parental and family needs. This research indicates that children’s centre’s
staff should be credited for creating a welcoming and supporting environment for both parents and
children (as reflected in the findings of this report), despite the many internal and external
pressures that were driving the evolution of centre services.

72
References
4Children. (2013). Children’s Centre Census 2013. London: 4Children.
Allen, G. (2011). Early Intervention: The Next Steps. An Independent Report to Her Majesty’s
Government. London: HM Government.
Asmussen, K.A., Matthews, T., Weizel, K., Bebiroglu, N and Scott, S. (2012). Evaluation of the
National Academy of Parenting Practitioners’ Training Offer in evidence based parenting
programmes. [online] London: DfE. Asmussen et al. (2012) paper available through this link
[Accessed 04 Feb 2014].
Barlow, J., Kirkpatrick, S., Wood, D., Ball, M., and Stewart-Brown, S. (2007). Family and
Parenting Support in Sure Start Local Programmes. [online] London: DCSF. Barlow et al. (2007)
paper available through this link [Accessed 07 Feb 2014].
Belsky, J., Melhuish, E., Barnes, J., Leyland, A., Romaniuk, H., National Evaluation of Sure Start
Research Team, and Team, of S. S. R. (2006). Effects of Sure Start local programmes on
children and families: early findings from a quasi-experimental, cross sectional study. British
Medical Journal. doi:10.1136/bmj.38853.451748.2F
Boddy, J., Statham, J., Smith, M., Ghate, D., Wigfall, V., and Hauari, H. (2009). International
Perspectives on Parenting Support: Non-English Language Sources. [online] DCSF Research
Report DCSF-RR114. Boddy et al. (2009) paper available through this link [Accessed 06 Feb
2014].
Bornstein, M. H., Cote, L. R., Haynes, O. M., Hahn, C.S., and Park, Y. (2010). Parenting
knowledge: experiential and sociodemographic factors in European American mothers of young
children. Developmental Psychology. Vol. 46(6), pp.1677–1693.
Briggs, N., Kurtz, A., and Paull, G. (2012). Evaluation of Children's Centres in England (ECCE):
Strand 5: Case studies on the costs of centres in the most deprived areas. [online] DfE Report No.
DFE-RR256. Briggs et al. (2012) paper available through this link [Accessed 06 Feb 2014].
Bronfenbrenner, U. (1994). Ecological models of human development. In: International
Encyclopaedia of Education, Vol. 3, 2nd ed. Oxford: Elsevier. Cited in: Gauvain, M. and Cole, M.
(Eds.), Readings on the development of children, 2nd ed [online]. New York: Freeman, pp.37-43.
Paper available through this link [Accessed 12 May 2014].
Bronfenbrenner, U. (1979). The ecology of human development: Experiments by Nature and
Design. Cambridge, MA: Harvard University Press.
Cooper, K. and Stewart, K. (2013). Does Money Affect Children’s Outcomes? A Systematic
Review. [online]. Joseph Rowntree Foundation (2013) report. Cooper and Stewart (2013) paper
available through this link [Accessed 01 May 2014].

73
Daly, M. (2013). Parenting support policies in Europe. Families, Relationships and Societies. Vol.
2(2), pp.159-174.
Department for Children, Schools and Families. (2007). Sure Start Children’s Centres: Phase 3
Planning and Delivery. [online] Department for Children, Schools and Families (2007) report
available through this link [Accessed 12 May 2014].
Department for Education. (2013). Sure Start children’s centres statutory guidance: For local
authorities, commissioners of local health services and Jobcentre Plus. [online] Department for
Education (2013) report available through this link [Accessed 30 Apr 2014].
Department for Education. (2014). Sure Start children’s centres: local authorities’ duties. [online]
Department for Education (2014) report available through this link [Accessed 04 Feb 2014].
Department for Education and Skills. (2004). Choice for parents, the best start for children: a ten
year strategy for childcare. [online] London: The Stationary Office. Department for Education and
Skills (2004) report available through this link [Accessed 06 Feb 2014].
Department for Education and Standards Testing Agency. (2013). Early years foundation stage
profile: handbook 2014. [online] Department for Education and Standards Testing Agency.
Department for Education and Standards Testing Agency (2013) report available through this link
[Accessed 07 Feb 2014].
Evangelou, M., Coxon, K., Sylva, K., Smith, S., and Chan, L.S.S. (2013). Seeking to Engage
‘Hard-to-Reach’ Families: Towards a Transferable Model of Intervention. Children and Society.
Vol. 27(2), pp.127-138.
Evangelou, M., Sylva, K., Edwards, A., and Smith, T. (2008). Supporting Parents in Promoting
Early Learning: The Evaluation of the Early Learning Partnership Project (ELPP). [online]
Nottingham: DCSF. Evangelou et al. (2008) paper available through this link [Accessed 06 Feb
2014].
Field, F. (2010). The Foundation Years: preventing poor children becoming poor adults [online]
London: HM Government. Available from: Field (2010) paper available through this link [Accessed
07 Feb 2014]
Garbers, S. (2008). Parenting support in Germany. Unpublished Report on Germany for
International Perspectives on Parenting Support project. Lüneberg: Institüt für Sozialpädagogik,
Universität Lüneberg.
Glass, N. (1999). Sure Start: the development of an early intervention programme for young
children in the United Kingdom. Children & Society. Vol. 13(4), pp.257-264.
Goff, J., Hall, J., Sylva, K., Smith, T., Smith, G., Eisenstadt, N., Sammons, P., Evangelou, M.,
Smees, R., and Chu, K. (2013). Evaluation of Children’s Centre’s in England (ECCE) – Strand 3:
Delivery of Family Services by Children’s Centre’s Research Report. [online] DfE Research Report
No. DFE-RR297. Goff et al. (2013) report available through this link [Accessed 06 Feb 2014].

74
Gray, R. and Francis, E. (2007). The implications of US experiences with early childhood
interventions for the UK Sure Start Programme. Childcare, health and development. Vol. 33(6).
pp.655–663.
Grevot, A. (2006). The plight of paternalism in French child welfare and protective policies and
practices. In N. Freymond and G. Cameron (Eds.). Towards positive systems of child and family
welfare. Toronto: University of Toronto Press.
Grimshaw, R. and McGuire, C. (1998). Evaluating Parenting Programmes. London: National
Children’s Bureau Enterprises.
Hannon, P. (1995). Literacy, Home and School Research and Practice in Teaching Literacy with
Parents. London: The Falmer Press.
House of Commons. (2010). The development of Children's Centres. [online] London: House of
Commons. House of Commons (2010) report available through this link [Accessed 04 Feb 2014].
Kennett, D. J., and Chislett, G. (2012). The benefits of an enhanced Nobody’s Perfect Parenting
Program for child welfare clients including non-custodial parents. Children and Youth Services
Review. Vol. 34(10), pp.2081–2087.
Knibbs, S., Pope, S., Dobie, S., and D’Souza, J. (2013). National Evaluation of Flying Start:
Impact Report. [online] Cardiff: Welsh Government Social Research. Knibbs et al. (2013) paper
available through this link [Accessed 07 Feb 2014].
MacLeod, J. and Nelson, G. (2000). Programs for the promotion of family wellness and the
prevention of child maltreatment: a meta-analytic review. Child abuse & neglect. Vol. 24(9),
pp.1127–1149.
Maisey, R., Speight, S., and Haywood, S., with Hall, J., Sammons, P., Hussey, D., Goff, J.,
Evangelou, M., and Sylva, K. (2013). Evaluation of Children’s Centres in England (ECCE) -
Strand 2: Baseline Survey of Families Using Children’s Centres in the Most Disadvantaged Areas
Research Report. [online] DfE Research Report No. DFE-RR260. Maisey et al. (2013) paper
available through this link [Accessed 07 Feb 2014].
Maude, P. (2006). ‘How do I do this better?’ from movement development to physical literacy. In
Whitebread, D. (2006). Teaching and learning in the early years (2nd Ed). London:
RoutledgeFalmer.
Melhuish, E., Belsky, J., and Leyland, A. (2010). The impact of Sure Start Local Programmes on
five year olds and their families. [online] DfE Research Report No. DFE-RR067. Melhuish et al.
(2010) paper available through this link [Accessed 06 Feb 2014].
Melhuish, E., Belsky, J., and Leyland, A. (2012a). National Evaluation of Sure Start –
Methodology Report. [online] London: Birkbeck University of London. Melhuish et al. (2012a)
paper available through this link [Accessed 04 Feb 2014].

75
Melhuish, E., Belsky, J., and Leyland, A. (2012b). The impact of Sure Start Local Programmes on
seven year olds and their families. [online] DfE Research Report No. DFE-RR220. Melhuish et al.
(2012b) paper available through this link [Accessed 06 Feb 2014].
Melhuish, E., Belsky, J., Macpherson, K., and Cullis, A. (2010). The quality of group childcare
settings used by 3-4 year old children in Sure Start local programme areas and the relationship
with child outcomes. [online] London: DfE. Melhuish et al. (2010) paper available through this link
[Accessed 06 Feb 2014].
MOCEP. (2006). MOCEP: The Mother-Child Home Education Programme. [online].
Moran, P., Ghate, D., and Merwe, A. Van Der. (2004). What Works in Parenting Support? A
Review of the International Evidence. [online] London: Policy Research Bureau. Nottingham:
DfES. Moran et al. (2004) paper available through this link [Accessed 06 Feb 2014].
Morris, S.B. and DeShon, R.P. (2002). Combining Effect Size Estimates in Meta-Analysis with
Repeated Measures and Independent-Groups Designs. Psychological Methods. Vol. 7(1),
pp.105-125.
NCJW Research Institute for Innovation in Jerusalem. (2013). Hippy International. [online]
Jerusalem: NCJW Research Institute for Innovation.
Royston, S. and Rodrigues, L. (2013). Breaking Barriers: How to help children’s centres reach
disadvantaged families. London: The Children’s Society.
Skrypnek, B. J., and Charchun, J. (2009). An Evaluation of the Nobody’s Perfect Parenting
Program. [online] Edmonton: University of Alberta Department of Human Ecology.
Smith, C. (1996). Developing Parenting Programmes. London: National Children’s Bureau.
Smith, G. Noble, S., Smith, T., Plunkett, E., Field, K and Smith, T. (in press). Children’s centres in
Disadvantaged Areas: Assessing ‘Reach’, Neighbourhoods and Usage.
Tanner, E., Agur, M., Hussey, D., and Hall, J., with Sammons, P., Sylva, K., Smith, T., Evangelou,
M. and Flint, A. (2012). Evaluation of Children’s Centres in England (ECCE) - Strand 1: First
Survey of Children’s Centre Leaders in the Most Deprived Areas. [online] DfE Research Report
No. DFERR230. Tanner et al. (2012) report available through this link [Accessed 06 Feb 2014].
UNESCO: Institute for Lifelong Learning. (2013). The Mother-Child Home Education Programme
(MOCEP). [online]. The Mother-Child Home Education Programme website available through this
link [Accessed 06 Feb 2014].

76
Appendices
Ap1: Chapter 1 – Conceptualising Parenting Support Internationally
Developing a coherent and encompassing conceptualisation of parenting support requires
recognition of the wide diversity in assumptions about parenting; political, financial, cultural, and
geographical programme development conditions; the complexity and dynamic nature of
communities; and the varied conditions of programme implementation (MacLeod and Nelson,
2000). The intersections and relationships between children, educators, communities,
policymakers, and parents make it difficult to be categorical about what qualifies as a parenting
programme internationally (Grimshaw and McGuire, 1998). A brief examination of a selection of
international parenting support programmes reveals some more or less foundational concepts of
what support parents might need, although the extent to which they are emphasised and
implemented varies greatly. Daly (2013) offered a new definition of parenting support, as
differentiated from other services such as childcare, family wellbeing and child welfare: ‘organised
services/provisions oriented to affect how parents execute their role as parents by giving them
access to a range of resources that service to increase their competence in childrearing’ (p.162).
The extent to which each programme supports the needs of parents reveals the complex set of
restraints and opportunities that each nation and community face, as well as the influence of their
academic and cultural leaders. Canadian programmes such as ‘Nobody’s Perfect’58 are focused
on providing parenting knowledge and skills specifically, and neither community nor socio-cultural
supports appear to be offered to any great degree (Kennett and Chislett, 2012). For example,
‘Nobody’s Perfect’ was developed by Health Canada and targets parents who are young, single,
socially isolated, geographically isolated, or who have limited formal education or income. The
programme, designed for parents of children up to five years of age, is designed to promote
positive parenting, increase parents’ understanding of children’s health, safety and behaviour, help
parents build on the skills they have and learn new ones, improve parents’ self-esteem and coping
skills, increase self-help and mutual support, bring parents into contact with community services
and resources, and prevent family violence (Kennett and Chislett, 2012; Skrypnek and Charchun,
2009). Bornstein, Cote, Hayes, Hahn and Park (2010) also highlight the importance of parenting
knowledge of child rearing and child development in American practice; this they define as
developing parents’ knowledge of appropriate approaches to identifying and addressing the
biological, physical, and socio-emotional needs of their children.
In contrast, Danish parenting support is primarily conceptualised as universal rather than targeted
interventions. Embedded in universally accessible services, (such as early childhood care and
education centres, schools, and health services), local Danish authorities are required to provide;
free group, one-on-one, and anonymous services, to all parents in areas ranging from specific
parenting knowledge, counselling, community involvement, and socio-economic issues like
housing, health and employment (Boddy, Statham, Smith, Ghate, Wigfall, and Hauari, 2009). This
system is designed to be based on structured approaches to all parenting support through inter-
professional teams rather than on specific, targeted, structured programmes.
58
Further information on the 'Nobody's Perfect parenting education and support program is available through this link.

77
France and Italy were similar in the substantial local development of programmes and the ensuing
diversity in services offered. Few standardised parenting programmes are offered; instead local
communities are given the flexibility to meet the specific demands of their communities with their
own prescribed use of standardised intervention programmes and locally developed programmes
(Boddy et al., 2009). France utilises a peer support model of ‘Parental Support and Guidance
Networks’ as their main parenting strategy, entitled ‘REAPPS’ (Réseaux d’Ecoute, d’Appui, et
d’Accompagnement des Parents). REAPP activities are established by all local authorities, and
are focused on parents meeting in different places to engage together in different activities such
as discussions or parent-child interactions (Daly, 2013). Grevot (2006) noted a policy and practice
emphasis on parenting knowledge, skills, and family education responsibility skills over social and
economic support in France, whereas the emphasis in Italy was on parent-child relationships, and
basic health and welfare provisions (Boddy et al., ibid). According to Daly (2013), parenting
support appeared to be the least developed in Italy, with no central body promoting such support,
no designated funding and varied availability of support between different areas.
Germany is said to have a wide range of services available for parents, however, parenting
support is driven by legislation, linked with established institutions, and less concerned with
competence in parenting (Daly, 2013). Garbers (2008) identified three principal approaches to
parenting support in Germany: parent financial/basic health and welfare resource support,
community engagement and mobilisation, and parental-knowledge support and development. The
PEKiP59 in Germany (which is based on the work of a Czech psychologist, Jaroslav Koch) is
provided through family centres and aims to support children’s physical and cognitive development
in their first year, while fostering the development of parent-child interaction (Boddy et al., 2009).
Two other programmes employed in Germany include Familienteam (Family Team) and KESS
Erziehen (cooperative, encouraging, social, and situation-oriented upbringing), both of which focus
on improving social and emotional relationships between parents and children. Of the countries
examined here, Germany was the most likely to use standardised parental support interventions,
such as the international programme referred to as ‘Triple P’ (PPP)60, the Israeli HIPPY (discussed
in the following paragraph), and the German PEKiP programme.
Israel is the development ground for the Home Instruction Programme for Pre-school Youngsters
(HIPPY/HAETGAR), which is one of the most widely recognised parent support intervention
programmes in Europe. The HIPPY programme focuses on the pre-school years and targets
socio-economically disadvantaged populations. There is considerable emphasis on community
involvement and activity, with parents being encouraged to reach out to other parents in their
communities. The programme focuses on four main areas of support: to prepare children for the
elementary school and the classroom context; to provide instruction on parenting skills and child
development to mothers of pre-school children; to increase the involvement of mothers in the
intellectual development of their children; and to demonstrate to the mothers the importance of
their role in the development process (National Council of Jewish Women [NCJW] Research
Institute for Innovation in Jerusalem, 2013).
59
Further information on the 'Prague Parent-Infant Program' is available through this link. 60
Further information on the 'Positive Parenting Program' is available through this link.

78
Developed in Turkey and subsequently in Bahrain, the Mother Child Education Programme
(MOCEP) is a home-based programme designed to support mothers of five and six year old
children without access to pre-school. Based on the Israeli HIPPY programme, the aim of
MOCEP61 is to promote children’s psychosocial and cognitive development, and to prepare them
for the classroom context. The programme also aims to empower mothers with literacy skills,
parenting skills and knowledge, and community networks. More specifically, MOCEP addresses
the lack of access to pre-school or early childhood education in socio-economically disadvantaged
areas; supports the development of literacy skills for mothers in order to allow them to support the
learning of their children at home; improves child-rearing knowledge and skills; and uses
educational training to empower communities to face their socio-economic challenges. The
MOCEP programme was adapted to the local social systems of Bahrain and to support families
and parenting primarily through mothers (MOCEP, 2006; UNESCO: Institute for Lifelong Learning,
2013).
61
Further information on the 'Mother Child Education Program' is available through this link.

79
Ap2: Chapter 2 – Method
Ap2.1 Introductory Letter to the Parenting Study
Thank you for your continued participation in the Evaluation of Children’s Centres in England
(ECCE) commissioned by the Department for Education. This evaluation is being conducted by
NatCen Social Research in collaboration with the University of Oxford and Frontier Economics.
We are now writing to ask for your help with the University of Oxford element of the study, which is
exploring the services you provide for parents. The Oxford team would like to visit your children’s
centre for one final day at some point over the next few months and meet with yourself and some
of the parents who benefit from the work of your centre. You will shortly be contacted by a
member of our team about your participation in this vital element of the evaluation.
This part of the research is crucial to the evaluation as it links the experiences of centre users with
the different elements of children’s centre provision. With your help, we aim to show how the work
of children’s centres affects the lives of different families. We appreciate the commitment of your
time in helping us with this. It is only by working with you and learning about the work being
carried out in your centre that we can reliably demonstrate what is actually happening in Sure Start
Children’s Centres and give an account of how much services benefit the families they serve.
If you have any queries or concerns, please do not hesitate to contact the Evaluation of Children’s
Centres in England research team. Please have your 9-digit reference number to hand when you
call or email (shown at the top of this letter). Please see overleaf for further information.
Many thanks again for your valuable help. We look forward to hearing from you.
What will I need to do during this visit?
Our researcher would like to speak with the centre manager for a couple of hours, to discuss
whether there have been any changes since our first visit in 2012 and to learn about your centre’s
service delivery and outreach. We would then like to visit a ‘Stay and Play’ type session and talk
with a couple of your families to find out what they think about the centre services. During the day
it would also be really helpful if we could spend some time talking with the member of staff running
this session with parents, and perhaps another member of staff who carries out the family support
or outreach work in homes.
Finally, there are also a couple of questionnaires that we hope can be filled out by key members of
your team, preferably in advance so as to minimise the time required by our visit.
What will happen to the information that I/colleagues/parents provide?
We will ensure that these visits are as unobtrusive as possible, and our experienced researchers
will work closely with you to find the most convenient date and time. At no point is the ECCE
project identifying or reporting on any individual family or children’s centre. Any information that is
collected on an individual centre or from an individual family will be reported in a grouped way
across all children’s centres in the sample, and used to describe the forms and practices of
children’s centres across England.

80
We can reassure you that any information that we collect regarding your children’s centre will be
kept securely, confidentially, and used only for research purposes. Moreover, all the information
we collect will remain completely anonymous and will be destroyed once all research has ceased.
We can offer you two further reassurances: First, that ECCE has received informed ethical
clearance from the University of Oxford's Research Ethics Committee; Second, that ECCE is
carried out in accordance with both the Freedom of Information and Data Protection Acts.
Ap2.2 Written consent forms for the Parenting Study (Staff and Parent) and Parent information sheet
Evaluation of Children’s Centres in England (ECCE)
Staff Consent
The purpose of this project has been explained to me, and I have had the opportunity to ask any
questions. I am happy to take part in the above project and I understand that my name and the
name of my Children’s Centre will be changed so that my identity will be kept anonymous
throughout the research and in any publications.
I understand that I can withdraw at any time and without needing to give a reason.
The project has been reviewed by, and received ethics clearance from the University of Oxford
Research Ethics Committee. The study is carried out in accordance with the Freedom of
Information Act. All data collected will remain completely anonymous; no personal information on
practitioners or children’s centres will be stored electronically and unique identifiers will be used for
the purpose of data storage. Electronic documents containing data will be password-protected on
a password-protected computer, accessible only to members of the research team. All raw data
(including handwritten notes from fieldworkers and questionnaires) will be used only for this
research and will be destroyed when not needed. Anonymised data (with no identifiable personal
information) will be held indefinitely for research purposes to be accessible only to appropriate
researchers, and this again will be destroyed when not needed.
Name:
Signature:
Date:
Contacting Us
If you wish to know more about the project, please contact: xxx

81
Parent Consent Form
Evaluation of Children’s Centres in England (ECCE)
The purpose of this study has been explained to me and I have had the opportunity to ask
questions.
I understand how the information will be kept, who will have access to it, and what will happen to it
at the end of the study.
I agree to take part in the study.
Name (parent):
Date:
Signature:
Name (member of research team):
Date:
Signature:
For more information contact: xxx
(For researcher use only) Parenting Services Questionnaire (Parent respondent)
Centre ID Number:
Parent number
Researcher:

82
Information Sheet for Parents
Thank you for helping us by taking the time to fill in this questionnaire.
The Evaluation of Children’s Centres in England (ECCE) is a six year study funded by the
Department for Education. The study looks at how different Sure Start Children’s Centres work.
We are currently visiting Sure Start Children’s Centres across England to find out what they do for
families and whether they meet your needs. We have also visited a number of families such as
yourselves to talk in more detail about the way that you use your Children’s Centre. We are now
visiting your centres to learn more about the services that you use.
This short interview asks questions about you and your Sure Start Children’s Centre. We will only
take ten minutes of your time, and would like to find out about how you use this centre. Your
responses will be entirely confidential, and the privacy of everyone who speaks to us will be fully
respected. We will not identify you, your family, centre, or centre staff in any report. You would of
course also have the right to withdraw from the research at any time.
Contacting us
If you have any queries or wish to learn more about this research, please contact: xxxxx
The project has been reviewed by, and received ethics clearance from the University of Oxford
Research Ethics Committee. The study is carried out in accordance with the Freedom of
Information Act. All data collected will remain completely anonymous and will be destroyed when
not needed.
How will the information I provide be used?
The results of the study will help the government make decisions about children’s centres and
whether the services they provide meet the needs of families with young children. Your answers
would be treated in strict confidence, unless you tell us something that indicates that you or
someone else is at risk of harm (we would discuss this with you before telling anyone else). The
research procedures used are fully compliant with the Data Protection Act 1998. Anything you say
in the interview would not be linked to you individually in any report. Rather, the results of the
study will be reported in general terms – for example, the report might say “60% of parents said…”
and so on. For more detail on how your information will be used please see the following web
page xxx

83
Ap2.3 Evaluation Methodology
The six-year study aims to provide an in-depth understanding of children’s centre services,
including their effectiveness for children and families and an assessment of their economic cost in
relation to the different types of services offered.
The ECCE study is being carried out by a consortium of three organisations: NatCen Social
Research, the University of Oxford, and Frontier Economics. The ECCE consortium were
commissioned by the Department for Children, Schools and Families (DCSF: now Department for
Education: DfE) to evaluate the Sure Start Children’s Centre (SSCC) programme. Each
organisation is responsible for one or two strands of the evaluation, as described next.
The data presented within this report on parenting represents one element of the longitudinal
study. It falls into ‘Strand 3’ of the evaluation, however, from here on it will be referred to as the
'parenting services' study. The evaluation comprises of a number of different elements organised
into five strands of work that will run until 2017.
Strand 1: Survey of children’s centre leaders (led by NatCen Social Research)
The first part of the evaluation collected information on the range of family services delivered by
children’s centres. Leaders from a sample of approximately 500 centres62 were interviewed on
key aspects of service provision, including management, staffing, services, users, and finance.
For further information on the first survey, see Tanner et al., (2012).
Strand 2: Survey of families using children’s centres (led by NatCen Social Research)
The second part of the evaluation collected information from approximately 5,700 families (with
children aged between 9-18 months) registered at 12863 of the children’s centres included in
Strand 1. Respondents provided information on their service use, family demographics, health,
and wellbeing. Further information on the first survey is available in the report by Maisey et al.,
(2013). Three-thousand-six-hundred families from the original set of 5,700 were surveyed again
via telephone when their child reached the age of two years. A final survey of the families will be
carried out in early 2014 when the child reaches the age of three years in order to profile their
development (via child assessments of cognitive and social development). This follow up survey
will investigate families’ use of children’s centre services over time.
Strand 3: Visits to children’s centres (led by the University of Oxford)
The third element of the evaluation involved visits to 121 of the 128 children’s centres sampled as
part of Strand 2. The first of two waves of fieldwork was carried out by the research team in 2012.
The visits took place over two days in order to assess the range of activities and services that
centres delivered, partnership working methods, leadership and management, and Evidence-
Based Practice (EBP). Further information on the first wave of fieldwork is available from the
report by Goff et al., (2013).
Of the 121 children’s centres participating in the first wave of fieldwork, 117 continued to
participate in the Parenting Services study (completed in 2013). Day visits were carried out by the
62
Representative of all Phase 1 and Phase 2 children’s centres in the most disadvantaged areas across England. 63
These 128 centres were taken from a core sub-sample of 120 centres, plus an extra sub-sample of eight centres which had successfully recruited users for the evaluation. For more information, refer to Maisey et al., (2013).
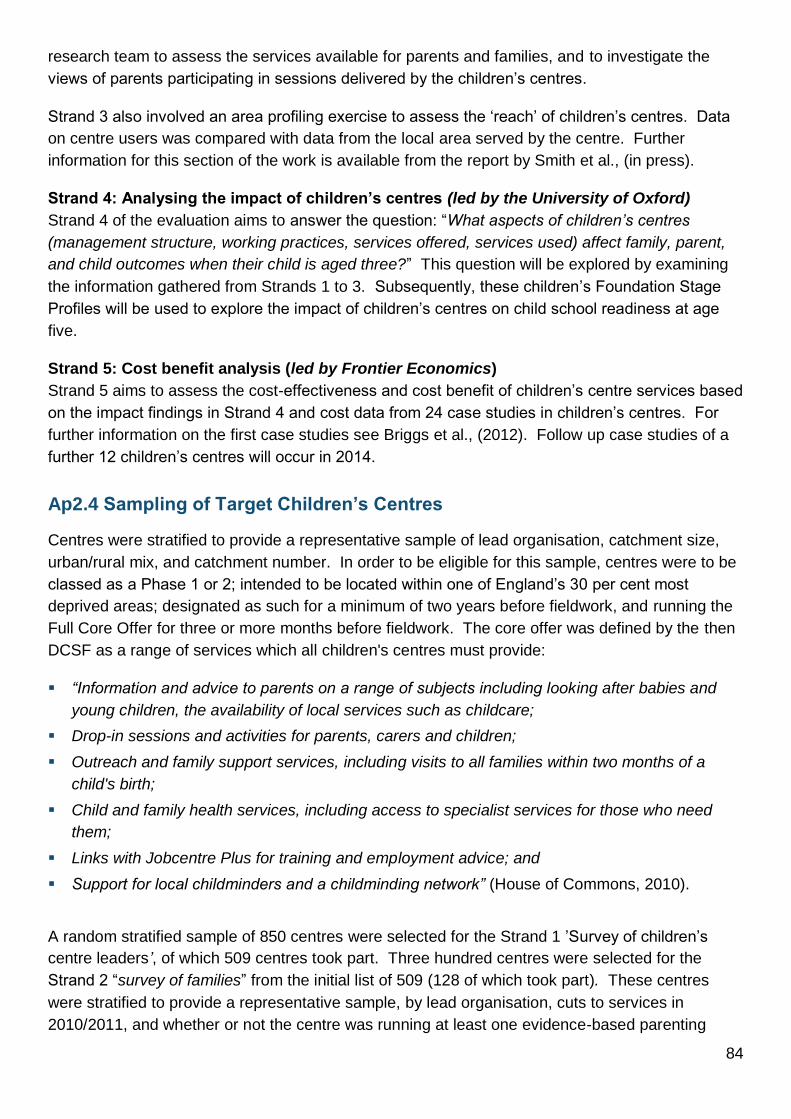
84
research team to assess the services available for parents and families, and to investigate the
views of parents participating in sessions delivered by the children’s centres.
Strand 3 also involved an area profiling exercise to assess the ‘reach’ of children’s centres. Data
on centre users was compared with data from the local area served by the centre. Further
information for this section of the work is available from the report by Smith et al., (in press).
Strand 4: Analysing the impact of children’s centres (led by the University of Oxford)
Strand 4 of the evaluation aims to answer the question: “What aspects of children’s centres
(management structure, working practices, services offered, services used) affect family, parent,
and child outcomes when their child is aged three?” This question will be explored by examining
the information gathered from Strands 1 to 3. Subsequently, these children’s Foundation Stage
Profiles will be used to explore the impact of children’s centres on child school readiness at age
five.
Strand 5: Cost benefit analysis (led by Frontier Economics)
Strand 5 aims to assess the cost-effectiveness and cost benefit of children’s centre services based
on the impact findings in Strand 4 and cost data from 24 case studies in children’s centres. For
further information on the first case studies see Briggs et al., (2012). Follow up case studies of a
further 12 children’s centres will occur in 2014.
Ap2.4 Sampling of Target Children’s Centres
Centres were stratified to provide a representative sample of lead organisation, catchment size,
urban/rural mix, and catchment number. In order to be eligible for this sample, centres were to be
classed as a Phase 1 or 2; intended to be located within one of England’s 30 per cent most
deprived areas; designated as such for a minimum of two years before fieldwork, and running the
Full Core Offer for three or more months before fieldwork. The core offer was defined by the then
DCSF as a range of services which all children's centres must provide:
“Information and advice to parents on a range of subjects including looking after babies and
young children, the availability of local services such as childcare;
Drop-in sessions and activities for parents, carers and children;
Outreach and family support services, including visits to all families within two months of a
child's birth;
Child and family health services, including access to specialist services for those who need
them;
Links with Jobcentre Plus for training and employment advice; and
Support for local childminders and a childminding network” (House of Commons, 2010).
A random stratified sample of 850 centres were selected for the Strand 1 ’Survey of children’s
centre leaders’, of which 509 centres took part. Three hundred centres were selected for the
Strand 2 “survey of families” from the initial list of 509 (128 of which took part). These centres
were stratified to provide a representative sample, by lead organisation, cuts to services in
2010/2011, and whether or not the centre was running at least one evidence-based parenting

85
programme. This was to ensure that the sample contained proportionate numbers of centres
displaying such characteristics to reflect the population of centres. All 128 centres that took part in
the Strand 2 ‘survey of families’ were invited to take part in the first wave of Strand 3 ‘visits to
children’s centres’ fieldwork in 2012 (of which 121 centres participated).
All 121 centres that took part in the first wave of ‘visits to children’s centres’ were again invited to
take part in the parenting services study (of Strand 3) discussed within this report. Of those 121
centres that were approached, 117 centres agreed to take part. Figure Ap2.1 details this sampling
strategy.

86
Figure Ap2.1 ECCE sample design 1 Note: Extra centres were allocated to allow for potential attrition.
2 Users were drawn from the same 128 centres allocated to Strand 3 fieldwork.
1,721 eligible children’s
centres nationally
To be eligible: Phase 1 or 2 centre; intended to be located in a 30% most
deprived areas; designated for min. Two
years before fieldwork; running Full Core
Offer for 3+ months before fieldwork
5,717 users achieved from first wave of user
survey2 (Maisey et al., 2013)
Sub-sample
60% eligibility rate
Sub-sample
Sub-sample
1,648 eligible children’s
centres post piloting
850 issued for children’s
centre manager survey
509 achieved and eligible
from children’s centre
manager survey
(Tanner et al., 2012)
300 issued for user
sampling
167 achieved and eligible
from user sampling
A core 120 that form the
basis of strands 2, 3 & 4
56% eligibility rate
10,187 users issued for user survey2
21 achieved but quite incomplete 5 achieved too late
14 achieved but too small
8 achieved too late
73 children’s centres used for
piloting
12 centres achieved for Strand 5
(Briggs et al., 2012)
Stratified by: Lead Organisation;
Catchment size quintile; Urban/rural;
Catchment number
Stratified by: Lead Organisation; 2010/11
cuts to children’s services; Runs 1+
Evidence-Based Programme
+ selected all 28 NHS led centres (either
solely or in combination)
+ 8 extras1 for Strands 2, 3, 4 & 5
+ 22 extras1 for strand 5
95% completion rate
97% completion rate
3,600 users achieved from follow-up wave of
user survey
72 Local Authorities (LAs) containing one or more of the 128 centres surveyed for Reach Study.
Follow-up survey of 65 eligible LAs
(Smith et al., in press
72% response rate
93% response rate
128 centres issued for Strand 3
users
128 centres issued for Strand 3
users
117 centres achieved for Strand
3 visits (This report)
121 centres achieved for Strand 3 visits (Goff et al.,
2013)

87
Ap3: Chapter 3 – Delivery of Parenting Services
Ap3.1 Demographic Characteristics of Staff Responsible for Leading Family/Parenting Support
Table Ap3.1 describes the demographic characteristics of those members of children’s centre staff
who provided information on the delivery of parenting services within the ECCE sample of
children’s centres in 2013 (i.e. the ‘Parenting Coordinators’). According to data collected by ECCE
researchers, respondents tended to be women, aged between 41-45 years, and were likely to hold
Bachelor degrees with additional training for the delivery of family services. They were likely to be
on permanent contracts at their children’s centre, to have previously worked within the education
sector, and to have been at their centre for an average of five and a half years. Finally, the most
common job title held by those who provided information on the provision of parenting services
within a children’s centre was ‘Family Support Worker’.
Table Ap3.1 Measures describing who provided information on the provision of parenting services
Measure (n) % or Mean ± SD
Gender 101 --
Female 98 97
Male 3 3.0
Age (years) 102 Median: 41-45
30 or under 9 8.8
31-35 26 25.5
36-40 9 8.8
41-45 14 13.7
46-50 20 19.6
51-55 13 12.7
56-60 9 8.8
61-65 1 1.0
Over 65 1 1.0
Highest Level of Qualification 100 Median: Bachelors
Below NVQ level 1 2 2.0
NVQ level 1 equivalent (e.g. 5 GCSEs grades D-E) 1 1.0
NVQ level 2 equivalent (e.g. 5 GCSEs grades A-C) 0 0.0
NVQ level 3 equivalent (e.g. A Levels) 20 20.0
NVQ level 4 equivalent 11 11.0
NVQ level 5 equivalent (e.g. Foundation Degree) 9 9.0
Honours/Bachelor’s Degree (or equivalent) 28 28.0
Master’s Degree (or equivalent; inc. PGCE) 28 28.0
Doctorate Degree or Equivalent 1 1.0
Received any training for the delivery of parenting services?1
96 --
Yes 93 96.9
No 3 3.1

88
Measure (n) % or Mean ± SD
Sector of Previous post? 100 --
Social Work 15 15.0
Education 36 36.0
Health 10 10.0
Voluntary 14 14.0
Service 4 4.0
Other 21 21
Years and Months worked in children's centre (Year; Month)2 97 5;5 ± 3;8
Permanent Contract? 100 --
Yes 89 89.0
No (Temporary) 11 11.0
Job Title1 93 --
Centre Manager 23 24.7
Centre Deputy Manager 6 6.5
Family Support Coordinator 17 18.3
Deputy Centre Manager and Family Support Coordinator 4 4.3
Family Support Worker 28 30.1
Outreach Coordinator 3 3.2
Outreach Worker 6 6.5
Family Support and Outreach Worker 3 3.2
Family Support and Outreach Coordinator 3 3.2
Notes: 1. Coded from open-ended self-reports; 2. Includes responses that extended back to before
children’s centre existed (e.g. 20 years ago). These are assumed to reflect children’s centres that used to
be another form of provision (e.g. Local Authority nursery schools)
Ap3.2 Summarising Parenting Services Offered by Centres – Measures for Future ‘Impact’ Analyses
Twelve measures were created to broadly summarise the parenting services that were offered by
children’s centres; these are presented in Table Ap3.2. The purpose behind the creation of these
measures was their use in the future analyses of ‘Children’s Centres Impact on Child and Parent
Outcomes’ (Strand 4).
Children’s centres were asked whether they offered any of eight induction procedures to new
families; the responses to these questions were summed to produce an ‘Induction Activities
Scale’. Scores could range from zero (“never” in response to all eight questions) to thirty-two
(“always” in response to all eight questions). The average centre score (achieved for n=105
centres) was twenty-three, with a standard deviation of five. Similarly, children’s centres were also
asked about nine activities offered to support parents’ personal needs (listed in Table 3.2, Chapter
3). Again, responses to these questions were summed to produce a scale containing scores that
ranged from zero (“no” to the offer of all nine services) to eighteen (“yes” to the offer of all nine
services). The average score on this ‘Supporting Parents’ Personal Needs Scale’ (achieved for
107 centres) was eleven, with a standard deviation of three.

89
Table Ap3.2 Measures created for use in ‘impact’ (Strand 4) – summarising the parenting services
offered by children’s centres
Measure (n) Mean ± SD
Induction activities for parents (higher score=more activities and/or done more frequently; 0-32)
105 23 ± 5
Number of services offered to support parents' personal needs (0-18) 107 11 ± 3
Supporting the needs of parents... -- --
Areas of parental need met by parenting services (0-34) 107 31 ± 3
Mean number of support types offered (0-4) 107 1 ± 1
Total number of services that referrals and signposting are used with (0-34) 104 21 ± 8
Total number of services provided offsite (0-34) 69 10 ± 9
Median level of provision across all areas of need (0-4) 106 3 ± 1
Supporting the needs of families... -- --
Areas of familial need met by parenting services (0-44) 108 40 ± 4
Mean number of support types offered (0-4) 108 2 ± 1
Total number of services that referrals and signposting are used with (0-44) 104 21 ± 11
Total number of services provided offsite (0-44) 72 13 ± 12
Median level of provision across all areas of need (0-4) 108 3 ± 1
A total of seventy-eight different areas of parental and familial need were presented to centre staff,
who provided information on levels of provision. Table Ap3.2 presents the ten measures that were
created to broadly summarise the responses. Five measures were created twice: once for the
thirty-four parental needs, and once for the forty-four family needs. The first pair of measures
created was simply the sum totals of the numbers of areas of need that centres provided support
for: 0-34 for parental; 0-44 for family. Table Ap3.2 shows high average responses for both of
these areas of need: an average of thirty-one areas of parental need were supported. This figure
rose to forty areas of parental need when providing support for family needs. The second pair of
measures that were created was the mean number of support types that a centre offered across
all its areas of support. The four areas of support were general information, personalised
information, personalised support, and centre sessions. Table Ap3.2 shows that centres offered
(on average) a greater range of support activities for family needs (two) than they did for parent
needs (one).
The third pair of measures that were created counted the number of areas of need that were met
by support in the form of centre referrals (passing on family’s details to other agencies) and
signposting (passing on information to families about other services). Interestingly, there were an
equal average number of parent and family areas of need supported by these two procedures,
despite more areas of family need being asked about and supported. Thus, parent needs were
more commonly met by referrals and signposting (21 of 34, 62%) than were family needs (21 of
44, 47%). The fourth pair of measures that were created counted the average number of services
that a centre provided off-site. An equal percentage of the services that were provided to support
parent as well as family needs were met in this way (parent: on average 10 of 34, 29%; family: on
average 13 of 44, 29%). This equality in the use of services that were provided off-site also
reflects the unequal percentages of services over which referrals and signposting were used when

90
comparing how centres met parental needs rather than family needs. Centres were more likely to
meet parental needs with referrals and signposting, and with a smaller range of services.
The fifth and final pair of measures averaged how well centres provided support in the context of:
1) the needs of parents, and 2) the needs of families (based on centre-respondent self-reports;
see Chapter 3). With the presentation of five response options (from 0=”very limited” to
4=”excellent”), centre staff reported the same average level of support, i.e. “good”, however, the
potential for bias and/or the provision of inaccurate knowledge in these self-reports must be kept in
mind.
Ap3.3 Children’s Centre Support for the Needs of Parents
Table Ap3.3 Six areas of parental need and the support that was offered by children’s centres
Parental needs and the support offered by children’s centres in 2013 (information returned from n=107 centres)
Nu
mb
er
no
t
pro
vid
ing
Gen
era
l
info
rmati
on
Pers
on
ali
sed
info
rmati
on
Pers
on
ali
sed
su
pp
ort
Cen
tre s
essio
n
Refe
rral
Sig
np
osti
ng
Off
sit
e-c
luste
r
cen
tre
Off
sit
e-O
ther
Area of Need: Education for Parents
Adult education for parents/carers (formal or informal) e.g. NIACE
2 56 38 46 73 53 76 23 23
Training for work-related skills such as literacy, language, numeracy and IT skills
1 47 37 39 81 68 20 20 20
Access to computers for online learning 15 34 17 31 38 21 56 10 17
Area of Need: Accessing Employment
CV writing 6 30 24 50 40 31 54 14 19
Job applications 5 30 32 51 34 28 51 10 16
Job vacancy lists 7 63 18 27 23 19 46 7 13
Employment information 3 63 29 34 30 21 52 10 13
Individual work-focused interviews 18 14 12 24 20 28 46 5 16
Direct communication link to local JobCentre Plus or Jobseeker service
11 40 15 23 33 28 57 5 15
Confidence building 9 28 31 50 56 33 43 11 14
Maternity leave guidance 19 41 16 21 11 18 57 4 9
Paternity leave guidance 19 43 13 20 8 18 57 4 9
Area of Need: Accessing Housing
Housing information clinic 13 39 32 39 17 48 69 11 22
County Council / District Council support 21 26 18 24 6 38 64 4 18
Housing Support Officer 16 26 21 29 7 52 61 8 19
Area of Need: Financial Assistance
Financial education 5 44 30 39 25 40 59 10 15
Debt advice service 2 47 36 45 30 50 71 14 20
Citizens Advice Bureau 11 41 32 33 30 45 67 13 16
Benefits advice service 3 50 40 47 39 54 69 13 15

91
Parental needs and the support offered by children’s centres in 2013 (information returned from n=107 centres)
Nu
mb
er
no
t
pro
vid
ing
Gen
era
l
info
rmati
on
Pers
on
ali
sed
info
rmati
on
Pers
on
ali
sed
su
pp
ort
Cen
tre s
essio
n
Refe
rral
Sig
np
osti
ng
Off
sit
e-c
luste
r
cen
tre
Off
sit
e-O
ther
Tax credits 4 51 37 46 27 47 62 12 14
Area of Need: Accessing Childcare
Childcare service e.g. daycare, nursery 7 51 45 48 48 41 62 15 16
Family Information Service (FIS) 4 59 27 29 18 27 72 5 13
Childminding service (e.g. NCMA, drop-in service to meet childminders)
6 48 33 34 41 20 57 7 8
Crèche 3 32 26 41 91 18 27 10 6
Area of Need: Parental health and lifestyle
Parental isolation 1 42 49 87 44 57 53 12 14
Parental mental health 0 47 43 79 44 73 60 11 17
Parental antenatal and postnatal health 1 61 42 67 79 44 52 15 12
Family members in prison 20 31 28 51 3 28 42 4 8
Drug dependency 5 40 41 57 11 75 74 6 18
Alcohol dependency 5 42 41 59 7 75 72 6 18
“Contact” visits (where children of separated families can spend time with one or both parents)
19 19 22 33 61 23 29 11 7
NHS Direct (use of phone/ Internet access/ link to NHS Direct personnel)
19 46 23 31 14 14 34 5 4
Healthy eating 0 73 55 70 91 46 51 12 13
Exercise 2 62 32 47 52 38 56 16 18
Ap3.4 Children’s Centre support for the needs of families
Table Ap3.4 Seven areas of familial need and the support that was offered by children’s centres
Familial needs and the support offered by children’s centres in 2013 (information returned from between n=106 to n=108 centres)
Nu
mb
er
no
t
pro
vid
ing
Gen
era
l in
form
ati
on
Pers
on
ali
sed
info
rmati
on
Pers
on
ali
sed
su
pp
ort
Cen
tre s
essio
n
Refe
rral
Sig
np
osti
ng
Off
-Sit
e-c
luste
r
cen
tre
Off
-Sit
e-O
ther
Area of Need: Partner Emotional Support (n=108)
Separation and divorce 5 56 43 59 9 48 66 8 12
Dealing with domestic violence 0 65 64 83 46 81 74 19 24
Women’s refuge/Women’s Aid group 3 57 52 52 17 72 72 11 22
Family arguments 9 39 45 61 8 36 52 6 8
Bereavement 5 45 43 54 4 61 67 8 13
Sexual health for teenagers 10 52 35 41 24 43 65 13 17
Counselling 4 45 37 44 32 63 66 6 16

92
Familial needs and the support offered by children’s centres in 2013 (information returned from between n=106 to n=108 centres)
Nu
mb
er
no
t
pro
vid
ing
Gen
era
l in
form
ati
on
Pers
on
ali
sed
info
rmati
on
Pers
on
ali
sed
su
pp
ort
Cen
tre s
essio
n
Refe
rral
Sig
np
osti
ng
Off
-Sit
e-c
luste
r
cen
tre
Off
-Sit
e-O
ther
Signposting (and/or access to) relevant help lines (n=107)
0 59 41 42 9 41 78 8 11
Area of Need: Improving Home Environment (n=108)
Home safety 1 71 65 77 52 44 49 13. 13
Toys and activities suitable for the child 1 54 60 74 77 23 28 10 10
Home outreach 1 44 57 94 34 50 38 14 16 Area of Need: Child Services (n=107)
Stay and Play groups 1 47 33 37 104 15 32 20 18
Music and Movement groups (e.g. Tumble Tots)
4 43 23 27 86 12 35 16 11
Stories and rhymes 1 43 28 33 95 14 34 17 14
Physical soft play 7 28 19 20 73 10 33 13 15
Messy play 0 37 31 29 103 13 27 17 9
Baby massage 4 38 29 41 89 25 32 17 12
Breast feeding 0 55 47 56 92 33 46 21 12
Antenatal 4 47 36 43 79 29 40 17 13
Post-natal 1 46 33 39 75 31 45 15 12
Children with additional needs (n=106) 1 48 51 59 66 45 55 22 17
Lone parents 1 48 47 63 30 29 46 10 9
Young parents 1 50 45 62 61 46 51 21 17
Area of Need: Parenting (n=107)
Parent-child interaction and communication 0 58 66 90 88 35 37 19 17
Managing children’s behaviour (e.g. tantrums)
0 55 69 93 86 46 38 18 14
Attachment with child 0 51 65 92 71 46 42 14 14
Children’s play and learning 0 57 65 85 98 37 37 15 13 Area of Need: Child Health (n=107)
Healthy or budget lunches 3 62 51 62 71 20 42 20 7
Parent cookery sessions 11 46 39 52 78 22 40 20 6
Baby clinics with a Health Visitor 6 46 36 39 85 23 44 20 17 Area of Need: Child Development (n=107)
Children’s physical development 0 55 60 73 90 33 40 13 13
Children’s emotional and social development 0 54 64 84 83 39 37 15 11
Children’s behavioural development 0 53 64 89 85 45 42 12 15
Workshops to help with specific child issues 0 56 55 69 84 38 44 20 13
Speech and language support for children 0 51 55 71 85 76 59 12 17 Area of Need: Family Services (n=107)
Facilities for the registration of births 73 10 4 13 8 4 31 3 3
Before/after school care for older children 61 10 8 8 17 5 30 6 9
Dedicated key-worker for each child to speak about child’s education
28 19 26 47 31 12 17 5 3
Outreach or home-based services in the primary language of the family when required (n=106)
22 19 33 60 18 27 31 7 11
Father/male-carer groups 12 30 23 30 76 11 32 20 7

93
Familial needs and the support offered by children’s centres in 2013 (information returned from between n=106 to n=108 centres)
Nu
mb
er
no
t
pro
vid
ing
Gen
era
l in
form
ati
on
Pers
on
ali
sed
info
rmati
on
Pers
on
ali
sed
su
pp
ort
Cen
tre s
essio
n
Refe
rral
Sig
np
osti
ng
Off
-Sit
e-c
luste
r
cen
tre
Off
-Sit
e-O
ther
Sensory room 33 22 22 26 48 12 27 20 8
Early years education 0 52 52 59 82 18 35 13 9
Book library for children (n=105) 19 31 20 25 57 11 40 12 11
Toy library (n=106) 30 32 18 27 45 11 30 11 8
Ap3.5 Describing those who Informed on Management Practices in Support of Family Services
64
Mirroring the characteristics that are summarised in Table Ap3.1 for the ‘Parenting Coordinators’,
Table Ap3.5 describes those who informed on management practices in support of families
services (commonly ‘Centre Managers’). As with ‘Parenting Coordinators’, respondents to the
management questions were more likely to be women. However, in contrast to the group of
people described in Table Ap3.1, Centre Managers (those in Table Ap3.5) were most often aged
between 51 and 55 years and were more likely to hold Masters Degrees. Just over ninety-six per
cent of managers reported receiving training for the delivery of parenting services and they were
likely to be on permanent contracts at their children’s centre, to have previously worked in the
education sector, and to have been at their centre for an average period of about five years.
Table Ap3.5 Measures describing who provided information on centre support of Parenting
Services
Measure (n) % or Mean ± SD
Gender 108 --
Female 101 93.5
Male 7 6.5 Age (years) 109 Median: 46-50
30 or under 3 2.8
31-35 8 7.3
36-40 7 6.4
41-45 18 16.5
46-50 19 17.4
51-55 30 27.5
56-60 17 15.6
61-65 3 2.8
Over 65 4 3.7
Job Title1 96 --
Centre Manager or Coordinator 68 70.8
Centre Deputy Manager or Coordinator 3 3.1
Services Manager or Coordinator 8 8.3
Cluster or District Leader or Coordinator 6 6.3
Other 11 11.5
Highest Level of Qualification 108 Median: Masters
64
Not necessarily those who self-identified as being in charge of Family/Parenting Support (‘Parenting Coordinators’).

94
Measure (n) % or Mean ± SD
Below NVQ level 1 2 1.6
NVQ level 1 equivalents (e.g. 5 GCSES grades D-E) 0 0.0
NVQ level 2 equivalents (e.g. 5 GCSES grades A-C) 0 0.0
NVQ level 3 equivalents (e.g. A Levels) 2 1.6
NVQ level 4 equivalents 2 1.6
NVQ level 5 equivalents (e.g. Foundation Degree) 5 3.9
Honours/Bachelor’s Degree (or equivalent) 18 14.1
Master’s Degree (or equivalent; including PGCE) 79 61.7
Doctorate Degree or Equivalent 0 0.0 Received any sort of training for the delivery of parenting services?
107 --
Yes 103 96.3
No 4 3.7
Sector of Previous post? 109 --
Social Work 14 12.8
Education 43 39.4
Health 11 10.1
Voluntary 15 13.8
Service 7 6.4
Other 19 17.4
Years and Months worked in children's centre (Years; Months)2 103 5;1 ± 3;9
Permanent Contract? 107 --
Yes 104 97.2
No (Temporary) 3 2.8 Note: 1. Coded from open-ended self-reports; 2. Includes responses that extended back to before
children’s centre existed (e.g. 20 years ago). These are assumed to reflect children’s centres that used to
be another form of provision (e.g. Local Authority nursery schools)
Ap3.6 Centre Manager Descriptions of their Centre
Table Ap3.6 Demographics describing children’s centres
Measure (n) % or Mean ±
SD
“How many leaders has this centre had since opening?” 104 Median (Md): 2
0 1 1
1 32 30.8
2 41 39.4
3 18 17.3
4 8 7.7
5 2 1.9
6 1 1
7 1 1
“Do you offer all four of the 'core services' on-site or provide direct access to these (i.e. childcare, health services, employment services, and parenting support)?”
104 --
No 22 21.2
Yes 82 78.8
“Please rank (1-5) the order in which each of the following are an emphasis (1 being greatest emphasis)”
-- --
Parents/carers and parenting services 96 Md: first (most)
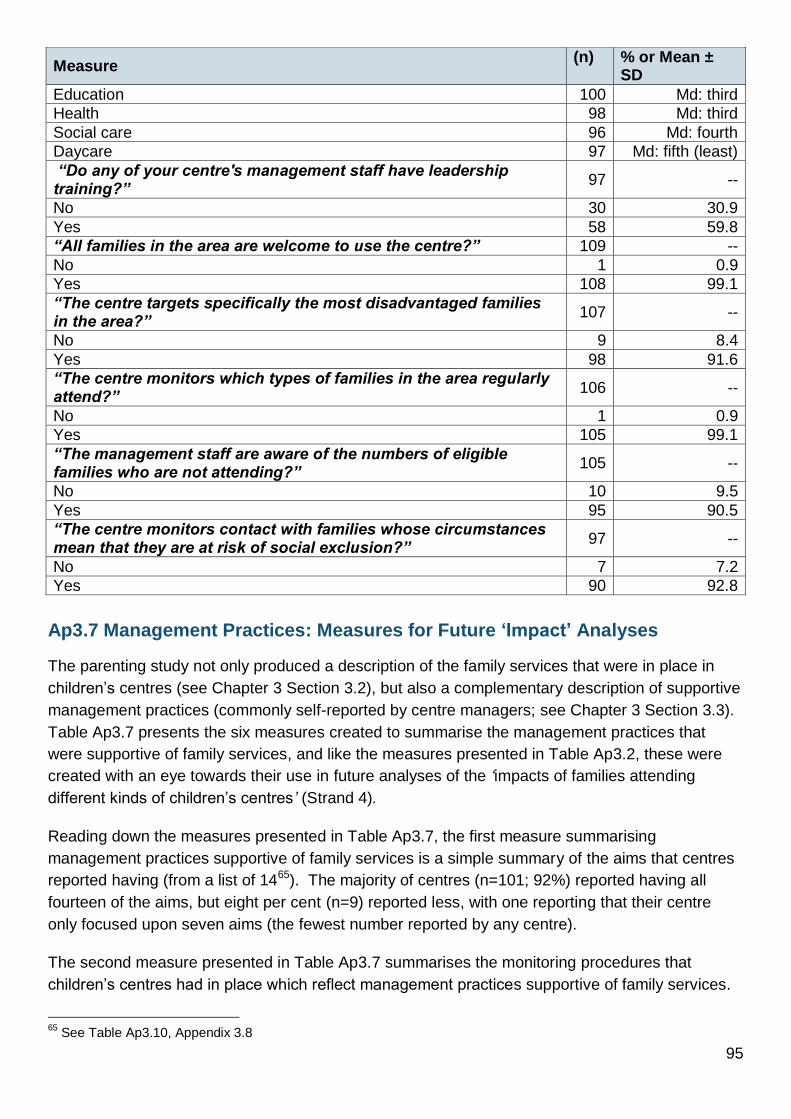
95
Measure (n) % or Mean ±
SD
Education 100 Md: third
Health 98 Md: third
Social care 96 Md: fourth
Daycare 97 Md: fifth (least)
“Do any of your centre's management staff have leadership training?”
97 --
No 30 30.9
Yes 58 59.8
“All families in the area are welcome to use the centre?” 109 --
No 1 0.9
Yes 108 99.1
“The centre targets specifically the most disadvantaged families in the area?”
107 --
No 9 8.4
Yes 98 91.6
“The centre monitors which types of families in the area regularly attend?”
106 --
No 1 0.9
Yes 105 99.1
“The management staff are aware of the numbers of eligible families who are not attending?”
105 --
No 10 9.5
Yes 95 90.5
“The centre monitors contact with families whose circumstances mean that they are at risk of social exclusion?”
97 --
No 7 7.2
Yes 90 92.8
Ap3.7 Management Practices: Measures for Future ‘Impact’ Analyses
The parenting study not only produced a description of the family services that were in place in
children’s centres (see Chapter 3 Section 3.2), but also a complementary description of supportive
management practices (commonly self-reported by centre managers; see Chapter 3 Section 3.3).
Table Ap3.7 presents the six measures created to summarise the management practices that
were supportive of family services, and like the measures presented in Table Ap3.2, these were
created with an eye towards their use in future analyses of the ‘impacts of families attending
different kinds of children’s centres’ (Strand 4).
Reading down the measures presented in Table Ap3.7, the first measure summarising
management practices supportive of family services is a simple summary of the aims that centres
reported having (from a list of 1465). The majority of centres (n=101; 92%) reported having all
fourteen of the aims, but eight per cent (n=9) reported less, with one reporting that their centre
only focused upon seven aims (the fewest number reported by any centre).
The second measure presented in Table Ap3.7 summarises the monitoring procedures that
children’s centres had in place which reflect management practices supportive of family services.
65
See Table Ap3.10, Appendix 3.8

96
The zero to twenty-five point scale takes into consideration two pieces of information: five areas of
parental monitoring and six levels of frequency (from “once a year” to “every day”)66. Perhaps
unsurprisingly a wider variety of responses were acquired from centres concerning their
monitoring practices rather than their aims. Although the mean score was twenty, this was
achieved by only thirteen children’s centres and there was substantial variation around this. For
example, four children’s centres responded with the highest score of twenty-five (they claimed to
use all five monitoring activities and to use them every day), whereas three children’s centres
responded with the lowest score of fourteen.
Table Ap3.7 Measures created for use in ‘impact’ (Strand 4) – summarising the management
practices supportive of family services offered by children’s centres
Measure (n) Mean ± SD
How many aims does the centre have? (0-14) 110 14 ± 1
Children’s centre monitoring procedures (higher scores = more frequently and over more areas; 0-25)
90 20 ± 3
How many user groups are targeted with centre resources? (0-24) 108 15 ± 4
Strategies for encouraging attendance at parenting programmes (higher scores = more strategies used more frequently; 0-26)
80 18 ± 3
Centre focus on improving parenting behaviour (higher scores = greater focus and more areas of parenting; 0-28)
107 26 ± 2
Staff training (higher scores = training in more areas, more frequently; 0-24) 83 18 ± 4
The third measure shown in Table Ap3.7 is a simple summation of the number of groups of users
that were targeted by a centre in terms of expended resources (time and/or money). Up to twenty-
four groups were asked about this individually67, and these were concluded to be “targeted” by
centres if money and/or time had been spent on them, “a moderate amount”, “a lot” or “a great
deal”. The average number of user groups targeted in this way was fifteen, though there was
substantial variation. For example, one centre self-reported targeting only two groups of users
(fathers and childminders), while another targeted all twenty-four.
The fourth measure that was created to summarise the management practices supportive of family
services was a reflection of the number of strategies used to encourage attendance at parenting
programmes. Up to thirteen strategies were presented to centre respondents along with three
response options concerning their use: “No”, “Sometimes”, and “Yes”68. With these response
options (coded zero to two), higher scores on this measure (up to 26) captured centres that used
more strategies (more frequently) to encourage parental attendance at parenting programmes.
Table Ap3.7 shows the mean average score on this measure to eighteen, though this was
achieved for only ten centres. As with the other measures shown in Table Ap3.7 however, there
was a good deal of variation between centres with scores ranging from nine to twenty-six (all
thirteen strategies used consistently).
The fifth measure presented in Table Ap3.7 summarises the number of parenting behaviours that
a centre might focus upon (up to fourteen69) and whether these were done with: “Some focus”
66
See Table Ap3.11, Appendix 3.8 67
See Chapter 3 Table 3.6. 68
See Chapter 3 Table 3.8. 69
See Chapter 3 Table 3.9.

97
(coded 1) or “a strong focus” (coded 2). A high mean was reported by centre respondents (26 out
of 28) along with less variation than was achieved for the other measures that were created to
summarise the management practices supportive of family services. For example, thirty-three per
cent of the centres that responded to the focus questions (n=35) claimed to have “A strong focus”
upon all fourteen areas of parent behaviour. It seems sensible to reflect upon the potential bias
from self-report here, however. Though this is what centre respondents reported, there remain
questions concerning the accuracy of these. ECCE however does not rely solely on centre self-
reports. The ‘visits to children’s centres’ fieldwork (Strand 3) also includes direct fieldworker
ratings of centre practice (Goff et al., 2013) and there are plans for ‘impact’ analyses (Strand 4) to
make use of Ofsted ratings.
The sixth and final measure shown in Table Ap3.7 is a summation of the types and frequencies of
formal training that centres put in place for their staff (up to twelve different types70). Though a
mean score of eighteen (out of 24 was achieved), the higher degree of variation between centres
was again apparent. Only fifteen per cent of centres (n=12) actually reported this mean score,
with five centres (6% of n=83) reporting the maximum score of twenty-four (all 12 areas of training
offered in an ongoing fashion). Again however, if these self-reported scores are biased or
inaccurate, then there will be consequences for the use of this measure in the ‘centre impact’
analyses (Strand 4); the consequence will be that this measure (and all other self-report
measures) will be insensitive to any true differences between centres in terms of the
consequences that better management practices can have for fostering improved family
outcomes. However, because ECCE uses a range of sources of information on children’s centres,
any disparities that are linked to self-report measures (such as those shown in Table Ap3.7) are
likely to be apparent via inconsistent results.
Ap3.8 Managing the Delivery of Parenting Services
Staff Training
Centre managers (described in Appendix Ap3.5) were asked to indicate whether staff at their
children’s centre had received “some” specific training, “ongoing” training, or “no” training in a
range of areas (see Table Ap3.8). The top three areas where training was reported as “ongoing”
were: children’s learning and development (81% of respondents), child protection and
safeguarding (77%), and children’s play (73%). Managers also indicated that staff received
“some” specific training in: dealing with drug dependency (74%), dealing with alcohol dependency
(72%), and dealing with domestic violence (60%).
Centre managers also provided a description of children’s centres in 2013 (tabulated results can
be found in Appendix Ap3.6). Managers most frequently cited their centre as having had two
leaders since its opening (39%) and the majority of centres (79%) reported offering all four ‘core
services’71 on-site or via direct access. Respondents ranked parents/carers and parenting
services as being given the greatest emphasis at their centre, followed by education and health
(joint ranked third), social care (fourth), and daycare (fifth). Just less than two thirds of
70
See Appendix 3.8, Table Ap3.8. 71
Note ‘core services’ were not specifically defined within the questionnaire and this finding presents the respondent’s understanding of the phrase.

98
respondents (60%) reported that their management staff were trained in leadership. In terms of
how families used centres:
All managers bar one (99%, total n=109) reported that all families in the local area were
welcome to use their centres (for more information on reach see the upcoming ECCE Report
by Smith et al., in press)
Most centres reported specifically targeting the most disadvantaged families in their area (92%,
total n=107)
All but one manager monitored which types of families in their area attended their centre (99%,
total n=106)
Most managers reported that the centre management were aware of the numbers of eligible
families that were not attending their centre (91%, total n=105)
Most managers reported that their centre monitored contact with families whose circumstances
may mean that they are at risk of social exclusion (90 out of 97).
Table Ap3.8 Areas of staff training in children’s centres
“What formal training do staff receive on the following subjects?”
None (%)
Some specific training (%)
Ongoing training (%)
Children's learning and development (n=99) 0 19 81
Child protection/safeguarding (n=98) 0 24 77
Children's play (n=97) 2 25 73
Confidentiality procedures (n=102) 6 35 59
Health and safety within this centre (n=98) 0 45 55
Protocols describing interactions with parents for members of staff involved in providing outreach and home visiting (n=101)
5 41 55
Lone working safety training (for outreach and home visiting) (n=101)
7 41 53
Parent and family relationships (n=98) 2 48 50
Family risk assessment (n=93) 8 48 44
Dealing with domestic violence (n=99) 2 60 38
Dealing with alcohol dependency (n=99) 13 72 15
Dealing with drug dependency (n=99) 13 74 13 Note: all percentages have been rounded up to the nearest whole
Manager Perspectives of their Centre
The next two tables (Table Ap3.9 and Table Ap3.10) present manager descriptions of their
children’s centres. Table Ap3.9 shows manager agreement to a series of statements (from
“strongly disagree” to “strongly agree”). The top three statements that drew strong agreement (out
of 110 responses) were that: staff understand and implement child protection procedures (96%),
all new staff working with families receive initial training and support (83%), and staff are well
trained to support ‘at-risk’ children and families (76%; see Table Ap3.9 for further detail). One
statement was more skewed towards the “moderately agree” or “strongly agree” end, i.e. the multi-
agency focus and partnership needs further development. Only 11 per cent of managers strongly
disagreed with that statement. However, responses were more evenly distributed at the other end
(26% “slightly agreed”, 30% “moderately agreed” and 23% “strongly agreed”) compared to other
statements where responses were more heavily skewed towards the “strongly agree” end. This
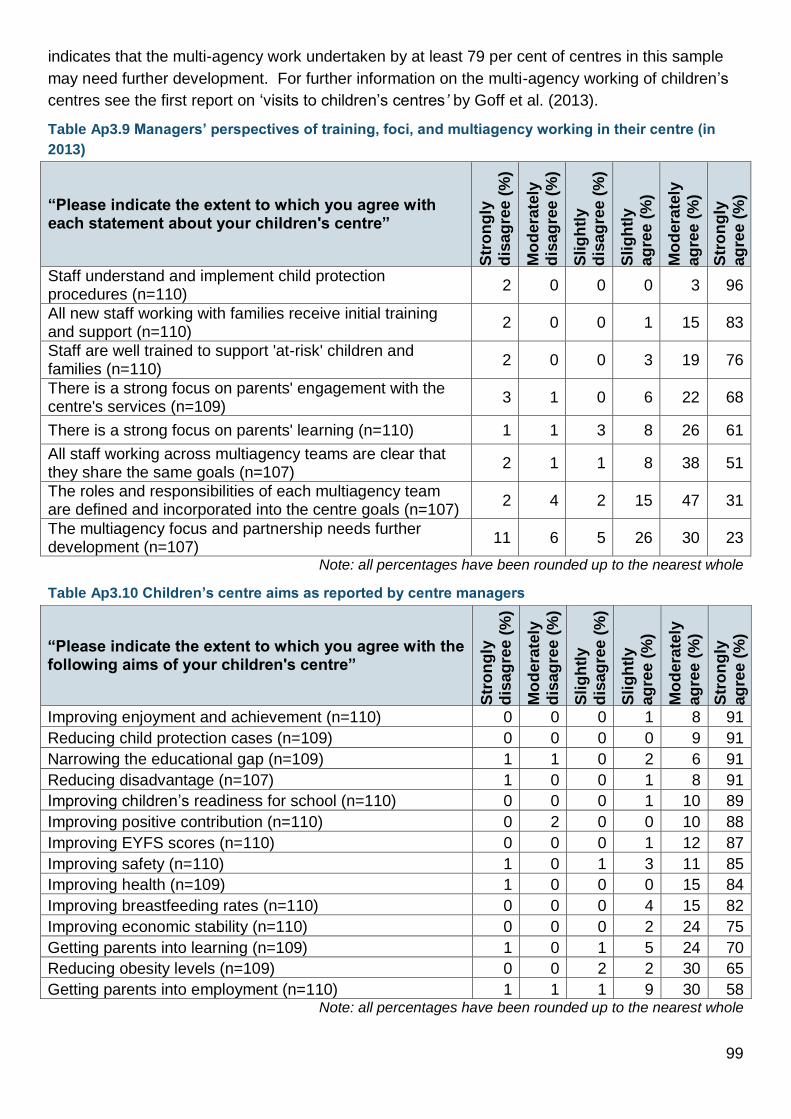
99
indicates that the multi-agency work undertaken by at least 79 per cent of centres in this sample
may need further development. For further information on the multi-agency working of children’s
centres see the first report on ‘visits to children’s centres’ by Goff et al. (2013).
Table Ap3.9 Managers’ perspectives of training, foci, and multiagency working in their centre (in
2013)
“Please indicate the extent to which you agree with each statement about your children's centre”
Str
on
gly
dis
ag
ree (
%)
Mo
dera
tely
d
isag
ree (
%)
Sli
gh
tly
dis
ag
ree (
%)
Sli
gh
tly
ag
ree (
%)
Mo
dera
tely
ag
ree (
%)
Str
on
gly
ag
ree (
%)
Staff understand and implement child protection procedures (n=110)
2 0 0 0 3 96
All new staff working with families receive initial training and support (n=110)
2 0 0 1 15 83
Staff are well trained to support 'at-risk' children and families (n=110)
2 0 0 3 19 76
There is a strong focus on parents' engagement with the centre's services (n=109)
3 1 0 6 22 68
There is a strong focus on parents' learning (n=110) 1 1 3 8 26 61
All staff working across multiagency teams are clear that they share the same goals (n=107)
2 1 1 8 38 51
The roles and responsibilities of each multiagency team are defined and incorporated into the centre goals (n=107)
2 4 2 15 47 31
The multiagency focus and partnership needs further development (n=107)
11 6 5 26 30 23
Note: all percentages have been rounded up to the nearest whole
Table Ap3.10 Children’s centre aims as reported by centre managers
“Please indicate the extent to which you agree with the following aims of your children's centre”
Str
on
gly
d
isag
ree (
%)
Mo
dera
tely
dis
ag
ree (
%)
Sli
gh
tly
dis
ag
ree (
%)
Sli
gh
tly
ag
ree (
%)
Mo
dera
tely
ag
ree (
%)
Str
on
gly
ag
ree (
%)
Improving enjoyment and achievement (n=110) 0 0 0 1 8 91
Reducing child protection cases (n=109) 0 0 0 0 9 91
Narrowing the educational gap (n=109) 1 1 0 2 6 91
Reducing disadvantage (n=107) 1 0 0 1 8 91
Improving children’s readiness for school (n=110) 0 0 0 1 10 89
Improving positive contribution (n=110) 0 2 0 0 10 88
Improving EYFS scores (n=110) 0 0 0 1 12 87
Improving safety (n=110) 1 0 1 3 11 85
Improving health (n=109) 1 0 0 0 15 84
Improving breastfeeding rates (n=110) 0 0 0 4 15 82
Improving economic stability (n=110) 0 0 0 2 24 75
Getting parents into learning (n=109) 1 0 1 5 24 70
Reducing obesity levels (n=109) 0 0 2 2 30 65
Getting parents into employment (n=110) 1 1 1 9 30 58 Note: all percentages have been rounded up to the nearest whole

100
The percentages shown in Table Ap3.10 illustrate the extent to which managers agreed with a list
of aims that their children’s centre may have held. Four aims drew strong agreement from at least
90 per cent of responses: ‘improving enjoyment and achievement’, ‘narrowing the educational
gap’, ‘reducing child protection cases’, and ‘reducing disadvantage’. The aim that saw the lowest
percentage of strong agreement was ‘getting parents into employment’ (58% of responses).
Some of the features around children’s centres’ work on monitoring and feedback are explored
next. Table Ap3.11 illustrates responses indicative of the frequencies of a number of feedback
activities. Over 50 per cent of managers reported that the following were carried out at their
centres “every day”: ‘keeping a record of children’s learning and development within sessions’;
‘taking action to improve outcomes for children who are struggling to meet expected targets ’, and
‘observing regularly-attending children to identify concerns about special needs and to inform
parents’. Most activities listed were reported as being carried out more towards the “every month”,
“every week” and “every day” ends of the scale, except one, which was monitor which family
members are using services. This was most frequently reported as being carried out “every three
months” (44%, total n=103).
Table Ap3.11 Frequency of monitoring and feedback activities
“How frequently does your children's centre...?” O
nce a
year
(%)
Every
6
mo
nth
s (
%)
Every
3
mo
nth
s (
%)
Every
mo
nth
(%)
Every
we
ek
(%)
Every
da
y (
%)
Observe regularly-attending children to identify concerns about special needs and to inform parents (n=106)
0 0 2 2 37 59
Keep a record of children's learning and development within sessions (n=103)
0 0 7 6 36 52
Take action to improve outcomes for those children who are struggling to meet expected targets (n=105) 0 0 5 16 29 51
Assess whether a family needs further support (n=101) 0 0 4 28 31 38
Monitor which family members are using services (n=103) 1 3 44 32 6 15
Note: all percentages have been rounded up to the nearest whole
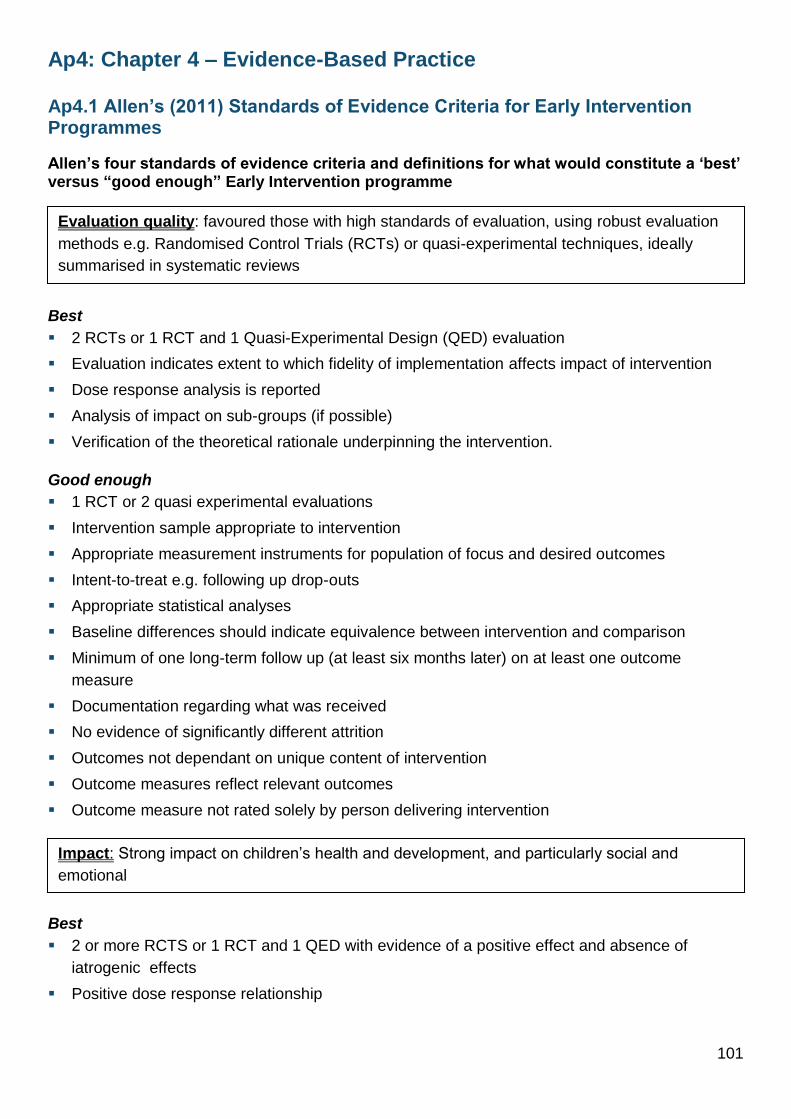
101
Ap4: Chapter 4 – Evidence-Based Practice
Ap4.1 Allen’s (2011) Standards of Evidence Criteria for Early Intervention Programmes
Allen’s four standards of evidence criteria and definitions for what would constitute a ‘best’ versus “good enough” Early Intervention programme
Best
2 RCTs or 1 RCT and 1 Quasi-Experimental Design (QED) evaluation
Evaluation indicates extent to which fidelity of implementation affects impact of intervention
Dose response analysis is reported
Analysis of impact on sub-groups (if possible)
Verification of the theoretical rationale underpinning the intervention.
Good enough
1 RCT or 2 quasi experimental evaluations
Intervention sample appropriate to intervention
Appropriate measurement instruments for population of focus and desired outcomes
Intent-to-treat e.g. following up drop-outs
Appropriate statistical analyses
Baseline differences should indicate equivalence between intervention and comparison
Minimum of one long-term follow up (at least six months later) on at least one outcome
measure
Documentation regarding what was received
No evidence of significantly different attrition
Outcomes not dependant on unique content of intervention
Outcome measures reflect relevant outcomes
Outcome measure not rated solely by person delivering intervention
Best
2 or more RCTS or 1 RCT and 1 QED with evidence of a positive effect and absence of
iatrogenic effects
Positive dose response relationship
Evaluation quality: favoured those with high standards of evaluation, using robust evaluation
methods e.g. Randomised Control Trials (RCTs) or quasi-experimental techniques, ideally
summarised in systematic reviews
Impact: Strong impact on children’s health and development, and particularly social and
emotional

102
Good enough
Positive impact on a relevant outcome
A positive and statistically significant effect size or a reported sample size weight mean effect
size of .2 with a sample of over 500 people.
Absence of iatrogenic effects for intervention group
Best
Research base summarising the prior empirical evidence to support the causal mechanisms
(risk and protective factors) that underlie the change in outcomes
Good enough
Intended population of focus is clearly defined
Outcomes of intervention are clearly specified and meet one of the relevant outcomes
Identifies risk and promotive factors that the programme seeks to change using logic model or
theory – explaining why the intervention may lead to better outcomes
Documentation about what the intervention comprises
Best
The programme is currently being widely disseminated
It has been tested in ‘real world’ conditions
Technical support is available to help implement the programme in new settings
Absolute investment is stated
There is a fidelity protocol or assessment checklist to accompany the programme
Good enough
Explicit process for ensuring that the intervention gets to the right people
Training materials and implementation procedures
A manual detailed the intervention
Reported information on the financial resources required to deliver the intervention.
Reported information on the human resources required
Programme that was evaluated is still available
Intervention specificity: clear about what they are intending to achieve, for whom, why, how
and where – this has been shown as key to successful interventions
System readiness: favouring those that can be effectively integrated in the wider public service
infrastructure and are supported by a strategy for ensuring that potential economic benefits can
be realised

103
Ap4.2 Evidence-Based Programmes Offered by Children’s Centres in 2013 (Allen’s list)
Table Ap4.2 What evidence-based programmes were children’s centres offering in 2013?
Twenty three named well-evidenced programmes from Allen’s list of 2011, and the number of centres who responded positively to each question (for a max n=113 centres)
Implementation Who ran these programmes?
Where?
Follo
we
d in f
ull
Substa
ntia
lly f
ollo
we
d
Inspired b
y o
r b
ased u
pon
Tra
ined t
o u
se,
but
not
curr
ently
usin
g
Pla
nnin
g t
o s
tart
runnin
g w
ith s
ix
month
s
Run b
y t
his
child
ren's
centr
e s
taff
Run b
y s
taff
of
a lin
ked o
r
clu
ste
red c
entr
e
Run b
y s
taff
em
plo
ye
d b
y t
he
clu
ste
r specific
ally
for
this
purp
ose
Run b
y s
taff
fro
m a
noth
er
age
ncy
or
indep
en
dent
child
ren's
ce
ntr
e
Oth
er
Within
a c
hild
ren
’s c
entr
e b
uild
ing
At
anoth
er
build
ing o
r site
Al’s Pals 0 1 1 0 0 0 0 1 0 1 2 0
Breakthrough to Literacy 0 1 0 0 0 1 1 0 0 0 1 0
Brief Strategic Family Therapy Programme (BSFT)
0 0 0 0 0 0 0 0 0 0 0 0
Bright Beginnings Early Intervention Programme (BBEIP)
0 0 0 0 0 0 0 0 0 0 0 0
Community Mothers Programme
1 0 0 0 0 0 0 1 1 0 0 0
Curiosity Corner (as part of the Success for All programme)
0 0 0 0 0 0 0 0 0 0 0 0
DARE to be you (DTBY: Decision-making; Assertiveness; Responsibility; and Esteem)
0 0 0 0 0 0 0 0 0 0 0 0
Early Literacy and Learning Model (ELLM)
0 0 0 0 0 0 0 0 0 0 0 0
Even Start (Family Literacy Programme)
2 0 1 0 0 1 0 0 2 0 3 1
Family Nurse Partnership (FNP)
17 3 0 0 0 0 0 1 19 4 5 21
Healthy Families America (HFA: a programme of Prevent Child Abuse America)
0 0 0 0 0 0 0 0 0 0 0 0
Healthy Families New York (HFNY)
0 0 0 0 0 0 0 0 0 0 0 0
High/Scope Perry Pre-School
0 0 0 0 0 0 0 0 0 0 0 0

104
Twenty three named well-evidenced programmes from Allen’s list of 2011, and the number of centres who responded positively to each question (for a max n=113 centres)
Implementation Who ran these programmes?
Where?
Follo
we
d in f
ull
Substa
ntia
lly f
ollo
we
d
Inspired b
y o
r b
ased u
pon
Tra
ined t
o u
se,
but
not
curr
ently
usin
g
Pla
nnin
g t
o s
tart
runnin
g w
ith s
ix
month
s
Run b
y t
his
child
ren's
centr
e s
taff
Run b
y s
taff
of
a lin
ked o
r
clu
ste
red c
entr
e
Run b
y s
taff
em
plo
ye
d b
y t
he
clu
ste
r specific
ally
for
this
purp
ose
Run b
y s
taff
fro
m a
noth
er
age
ncy
or
indep
en
dent
child
ren's
ce
ntr
e
Oth
er
Within
a c
hild
ren
’s c
entr
e b
uild
ing
At
anoth
er
build
ing o
r site
I Can Problem Solve (ICPS)
0 1 0 0 0 1 0 0 0 0 0 0
Incredible Years (Also known as Webster Stratton. Includes Babies and Toddlers; and BASIC Early Childhood programmes)
35 11 2 7 4 34 14 2 16 9 44 20
Let’s Begin with the Letter People (Led by Abram’s Learning Trends)
0 0 0 0 0 0 0 0 0 0 0 0
Multidimensional Treatment Foster Care (MTFC)
0 0 0 0 0 0 0 0 0 0 0 0
Parent Child Home Programme
0 1 0 0 0 0 0 0 0 0 0 0
Parent Child Interaction Therapy (PCIT)
0 0 1 0 0 1 0 0 0 0 1 0
Parents as Teachers (PAT)
0 0 0 1 0 0 0 0 0 0 0 0
Ready, Set, Leap! (LeapFrog)
0 0 0 0 0 0 0 0 0 0 0 0
Success for All programmes (Other)
0 0 0 0 0 0 0 0 0 0 0 0
Triple P (Positive Parenting Programme)
38 3 1 6 2 32 8 6 10 3 40 11

105
Ap4.3 Programmes72
, Offered by Children’s Centres in 2013 (not included in Allen’s list)
Table Ap4.3 What programmes, strategies or interventions were children’s centres offering in 2013?
Forty two additional named programmes, strategies, and interventions, and the number of centres who responded positively to each question (for a max n=113 centres)
Implementation Who ran these programmes?
Where?
Follo
we
d in f
ull
Substa
ntia
lly f
ollo
we
d
Inspired b
y o
r b
ased u
pon
Tra
ined t
o u
se,
but
not
curr
ently
usin
g
Pla
nnin
g t
o s
tart
runnin
g w
ith s
ix
month
s
Run b
y t
his
child
ren's
centr
e s
taff
Run b
y s
taff
of
a lin
ked o
r clu
ste
red
centr
e
Run b
y s
taff
em
plo
ye
d b
y t
he c
luste
r specific
ally
for
this
purp
ose
Run b
y s
taff
fro
m a
noth
er
age
ncy o
r
indep
en
dent
child
ren's
ce
ntr
e
Oth
er
Within
a c
hild
ren
’s c
entr
e b
uild
ing
At
anoth
er
build
ing o
r site
4 Children, Children’s Centre Approach
0 0 0 0 0 0 0 0 0 0 1 1
Early Support Programme (for disabled children)
12 6 1 2 0 14 0 1 7 2 13 10
Enhanced Triple P-Positive Parenting Programme
13 1 1 1 0 13 4 4 2 0 15 7
Every Child a Talker (ECAT) 32 17 8 3 2 42 4 2 8 2 47 17
Families and Schools Together Programme (FAST Programme)
5 0 0 1 0 6 0 0 1 0 5 2
Family Links Nurturing Programme (includes Parenting Puzzle)
21 0 2 4 3 23 2 0 7 0 25 11
Family Literacy, Language and Numeracy (FLLN - funded by BIS)
6 2 1 0 0 1 0 0 8 2 8 3
Fives to Fifteens basic Parenting Programme (Using the What Can a Parent Do? book)
0 0 0 0 0 0 0 0 0 0 0 1
Freedom Programme* 35 3 1 1 6 18 3 2 23 4 27 15
Healthy Eating and Nutrition for the Really Young (HENRY)*
18 8 6 6 0 28 3 0 6 2 23 9
Hit the Ground Crawling 0 0 0 0 0 0 0 0 0 0 0 0
ICAN 14 5 6 2 2 18 2 1 4 1 19 7
Infant massage 73 5 3 4 1 68 7 6 6 4 72 23
72
‘Programmes’ here represent s Programmes, Strategies, and Interventions

106
Forty two additional named programmes, strategies, and interventions, and the number of centres who responded positively to each question (for a max n=113 centres)
Implementation Who ran these programmes?
Where?
Follo
we
d in f
ull
Substa
ntia
lly f
ollo
we
d
Inspired b
y o
r b
ased u
pon
Tra
ined t
o u
se,
but
not
curr
ently
usin
g
Pla
nnin
g t
o s
tart
runnin
g w
ith s
ix
month
s
Run b
y t
his
child
ren's
centr
e s
taff
Run b
y s
taff
of
a lin
ked o
r clu
ste
red
centr
e
Run b
y s
taff
em
plo
ye
d b
y t
he c
luste
r specific
ally
for
this
purp
ose
Run b
y s
taff
fro
m a
noth
er
age
ncy o
r
indep
en
dent
child
ren's
ce
ntr
e
Oth
er
Within
a c
hild
ren
’s c
entr
e b
uild
ing
At
anoth
er
build
ing o
r site
Infant Yoga* 11 0 1 0 0 8 1 0 3 2 13 7
Mellow babies 11 0 1 0 0 8 1 0 3 2 13 7
Mellow bumps 3 0 0 0 0 2 0 0 0 1 1 0
Mellow parenting 8 1 0 7 3 10 1 1 3 2 13 4
New Forest Parenting Programme
0 0 0 0 0 0 0 0 0 0 0 0
Noughts to Sixes Parenting Programme (Using the From Pram to Primary book)
1 0 1 1 2 1 0 0 0 0 0 0
Parent Infant Project (The Anna Freud Centre)
0 0 0 0 0 0 0 0 0 0 0 0
Parents as First Teachers - Born to Learn (PAFT)
2 0 0 2 0 2 0 0 0 0 2 1
Parents, Early Years and Learning programme (PEAL)
4 0 1 1 0 6 1 0 0 0 5 3
Parents in Partnership Parent-Infant Network (PIPPIN)
0 0 0 0 0 0 0 0 0 0 0 0
Parenting Matters 1 0 0 0 0 0 0 0 1 0 1 0
Parents Involved in their Children’s Learning (PICL)
4 1 1 1 0 6 0 0 0 1 4 1
Parents Plus Early Years Programme
0 0 0 0 0 0 0 0 0 0 0 0
Pathways Triple P-Positive Parenting Programme
5 1 0 2 1 5 3 2 0 0 3 3
Peers Early Education Partnership (PEEP) Learning Together Programme
13 5 2 5 0 18 2 1 3 0 19 7
Positive Parenting - Time out for Parents (Led by Care for the Family)
6 0 0 1 1 4 1 1 2 0 5 1
Pregnancy Birth and Beyond 12 3 3 0 2 10 0 2 9 2 15 4
Preparation for Birth and Beyond
8 1 3 0 2 8 0 2 5 1 10 2
Promotional Interviewing 1 0 0 0 0 0 0 0 1 1 0 0

107
Forty two additional named programmes, strategies, and interventions, and the number of centres who responded positively to each question (for a max n=113 centres)
Implementation Who ran these programmes?
Where?
Follo
we
d in f
ull
Substa
ntia
lly f
ollo
we
d
Inspired b
y o
r b
ased u
pon
Tra
ined t
o u
se,
but
not
curr
ently
usin
g
Pla
nnin
g t
o s
tart
runnin
g w
ith s
ix
month
s
Run b
y t
his
child
ren's
centr
e s
taff
Run b
y s
taff
of
a lin
ked o
r clu
ste
red
centr
e
Run b
y s
taff
em
plo
ye
d b
y t
he c
luste
r specific
ally
for
this
purp
ose
Run b
y s
taff
fro
m a
noth
er
age
ncy o
r
indep
en
dent
child
ren's
ce
ntr
e
Oth
er
Within
a c
hild
ren
’s c
entr
e b
uild
ing
At
anoth
er
build
ing o
r site
Relationship support programmes
3 0 0 1 0 2 0 0 2 0 3 2
Solihull Approach 23 9 7 5 0 34 3 1 5 2 32 18
Speak Easy* 6 0 0 3 1 6 1 0 4 2 9 2
Springboard Project 0 0 0 0 0 0 0 0 0 0 0 0
Stepping Stones Triple P-Positive Parenting Programme
5 1 0 0 0 4 4 3 1 1 5 4
Strengthening Families Programme (SFP)
7 1 0 2 1 4 1 1 3 0 9 6
Strengthening Families, Strengthening Communities
17 2 0 7 1 8 3 4 5 1 18 5
Targeted Family Support (Action for Children)
7 2 1 0 0 6 1 0 1 1 7 3
Video Interactive Guidance 6 0 1 2 0 4 0 1 3 0 4 4
Wider Family Learning (WFL)
5 2 0 0 0 2 0 1 3 1 6 3
Notes: *Programme that managers were prompted about only in 2013 - not in 2012 (n=4)

108
Ap4.4 Change in whether Programmes were being Currently Implemented between 2012 and 2013
Table Ap4.4 Statistical comparison of the change in whether programmes were being currently
implemented between 2012 and 2013
Named programmes, strategies or interventions that children’s centre managers were asked whether or not their centre implemented (n=61)
Implement 2012?
Implement 2013?
Statistical comparison of the change in implementation between 2012 and 2013 (in n=112 children’s centres)
n % of
n= 112 n % of
n= 112
Overall ∆ (2013-2012)
Statistic (Wilcoxon
Z)
Effect Size* (r=
Z/(n1/2)) p
Al’s Pals 0 0.0 2 1.8 +2 1.414 0.134 0.157
Breakthrough to Literacy 1 0.9 1 0.9 No change
-- -- --
Brief Strategic Family Therapy Programme (BSFT)
0 0.0 0 0.0 No change
-- -- --
Bright Beginnings Early Intervention Programme (BBEIP)
0 0.0 0 0.0 No change
-- -- --
Community Mothers Programme
1 0.9 1 0.9 No change
-- -- --
Curiosity Corner (as part of the Success for All programme)
0 0.0 0 0.0 No change
-- -- --
DARE to be you (DTBY: Decision-making; Assertiveness; Responsibility; and Esteem)
0 0.0 0 0.0 No change
-- -- --
Early Literacy and Learning Model (ELLM)
2 1.8 0 0.0 -2 1.414 0.134 0.157
Even Start (Family Literacy Programme)
0 0.0 3 2.7 +3 1.732 0.164 0.083
Family Nurse Partnership (FNP)
25 22.3 20 17.9 -5 .962 0.091 0.336
Healthy Families America (HFA)
0 0.0 0 0.0 No change
-- -- --
Healthy Families New York (HFNY)
0 0.0 0 0.0 No change
-- -- --
High/Scope Perry Pre-School 1 0.9 0 0.0 -1 1.000 0.094 0.317
I Can Problem Solve (ICPS) 0 0.0 1 0.9 +1 1.000 0.094 0.317
Incredible Years 47 42.0 46 41.1 -1 .229 0.022 0.819
Let’s Begin with the Letter People
0 0.0 0 0.0 No change
-- -- --
Multidimensional Treatment Foster Care (MTFC)
0 0.0 0 0.0 No change
-- -- --
Parent Child Home Programme
1 0.9 1 0.9 No change
-- -- --

109
Named programmes, strategies or interventions that children’s centre managers were asked whether or not their centre implemented (n=61)
Implement 2012?
Implement 2013?
Statistical comparison of the change in implementation between 2012 and 2013 (in n=112 children’s centres)
n % of
n= 112 n % of
n= 112
Overall ∆ (2013-2012)
Statistic (Wilcoxon
Z)
Effect Size* (r=
Z/(n1/2)) p
Parent Child Interaction Therapy (PCIT)
0 0.0 1 0.9 +1 1.000 0.094 0.317
Parents as Teachers (PAT) 2 1.8 0 0.0 -2 1.414 0.134 0.157
Ready, Set, Leap! (LeapFrog) 0 0.0 0 0.0 No change
-- -- --
Success for All programmes (Other)
2 1.8 0 0.0 -2 1.414 0.134 0.157
Triple P (Positive Parenting Programme)
41 36.6 41 36.6 No change
-- -- --
4 Children, Children’s Centre Approach
0 0.0 0 0.0 No change
-- -- --
Early Support Programme (for disabled children)
21 18.8 19 17.0 -2 0.408 0.039 0.683
Enhanced Triple P-Positive Parenting Programme
7 6.3 15 13.4 +8 1.886 0.178 0.059
Every Child a Talker (ECAT) 65 58.0 56 50.0 -9 1.372 0.130 0.170
Families and Schools Together Programme (FAST)
5 4.5 5 4.5 No change
-- -- --
Family Links Nurturing Programme (includes Parenting Puzzle)**
27 24.1 22 19.6 -5 2.236 0.211 0.025
Family Literacy, Language and Numeracy (FLLN)
9 8.0 9 8.0 No change
-- -- --
Fives to Fifteens basic Parenting Programme
1 0.9 0 0.0 -1 1.000 0.094 0.317
Hit the Ground Crawling 0 0.0 0 0.0 No change
-- -- --
ICAN 21 18.8 25 22.3 +4 0.756 0.071 0.450
Infant massage 79 70.5 80 71.4 +1 0.180 0.017 0.857
Mellow babies 6 5.4 3 2.7 -3 1.134 0.107 0.257
Mellow bumps 3 2.7 3 2.7 No change
-- -- --
Mellow parenting 10 8.9 9 8.0 -1 0.258 0.024 0.796
New Forest Parenting Programme
2 1.8 0 0.0 -2 1.414 0.134 0.157
Noughts to Sixes Parenting Programme
4 3.6 2 1.8 -2 1.414 0.134 0.157
Parent Infant Project (The Anna Freud Centre)
0 0.0 0 0.0 No change
-- -- --
Parents, Early Years and Learning programme (PEAL)
10 8.9 5 4.5 -5 1.667 0.158 0.096

110
Named programmes, strategies or interventions that children’s centre managers were asked whether or not their centre implemented (n=61)
Implement 2012?
Implement 2013?
Statistical comparison of the change in implementation between 2012 and 2013 (in n=112 children’s centres)
n % of
n= 112 n % of
n= 112
Overall ∆ (2013-2012)
Statistic (Wilcoxon
Z)
Effect Size* (r=
Z/(n1/2)) p
Parents as First Teachers - Born to Learn (PAFT)
3 2.7 2 1.8 -1 1.000 0.094 0.317
Parents in Partnership Parent-Infant Network (PIPPIN)
0 0.0 0 0.0 No change
-- -- --
Parenting Matters 2 1.8 1 0.9 -1 0.577 0.055 0.564
Parents Involved in their Children’s Learning (PICL)
8 7.1 6 5.4 -2 0.707 0.067 0.480
Parents Plus Early Years Programme
3 2.7 0 0.0 -3 1.732 0.164 0.083
Pathways Triple P-Positive Parenting Programme
6 5.4 5 4.5 -1 0.378 0.036 0.705
Peers Early Education Partnership (PEEP) Learning Together Programme
19 17.0 20 17.9 +1 0.333 0.031 0.739
Positive Parenting - Time out for Parents
6 5.4 6 5.4 No change
-- -- --
Pregnancy Birth and Beyond 14 12.5 18 16.1 +4 0.943 0.089 0.346
Preparation for Birth and Beyond
13 11.6 12 10.7 -1 0.277 0.026 0.782
Promotional Interviewing 2 1.8 1 0.9 -1 0.577 0.055 0.564
Relationship support programmes
7 6.3 3 2.7 -4 1.633 0.154 0.102
Solihull Approach** 26 23.2 39 34.8 +13 2.837 0.268 0.005
Springboard Project 1 0.9 0 0.0 -1 1.000 0.094 0.317
Stepping Stones Triple P-Positive Parenting Programme
5 4.5 6 5.4 +1 0.378 0.036 0.705
Strengthening Families Programme (SFP)
9 8.0 8 7.1 -1 0.243 0.023 0.808
Strengthening Families, Strengthening Communities
17 15.2 19 17.0 +2 0.577 0.055 0.564
Targeted Family Support (Action for Children)
8 7.1 10 8.9 +2 0.535 0.051 0.593
Video Interactive Guidance 4 3.6 7 6.3 +3 1.134 0.107 0.257
Wider Family Learning (WFL - Funded by BIS)
11 9.8 7 6.3 -4 1.265 0.120 0.206
Notes: * Effect sizes are interpreted as: 0.1 “small”; 0.3 “medium”; 0.5 “large”;
** Changes that were statistically significant (p<0.05)

111
Ap4.5 Change in the Level of Implementation of Programmes between 2012 and 2013
Table Ap4.5 Statistical comparison of the levels of implementation of evidence-based programmes
in 2012 and 2013
Named programmes, strategies or interventions that children’s centre managers to report their level of implementation of (n=61). Levels of Implementation were coded: Not implemented (0); In a position to Implement (1); Currently implementing (2)
Levels of implementation in 2012
Levels of implementation in 2013
Statistical comparison of the change in level of implementation (in n=112 children’s centres)
(0) (1) (2) (0) (1) (2)
Sta
tistic
(Wilc
oxon
Z)
Eff
ect
Siz
e*
(r=
Z/(
n1/2))
p
Al’s Pals 112 -- -- 110 -- 2 1.414 -0.134 .157
Breakthrough to Literacy 111 -- 1 111 -- 1 No change
-- --
Brief Strategic Family Therapy Programme (BSFT)
112 -- -- 112 -- -- No change
-- --
Bright Beginnings Early Intervention Programme (BBEIP)
112 -- -- 112 -- -- No change
-- --
Community Mothers Programme 111 -- 1 111 -- 1 No change
-- --
Curiosity Corner (as part of the Success for All programme)
112 -- -- 112 -- -- No change
-- --
DARE to be you (DTBY: Decision-making; Assertiveness; Responsibility; and Esteem)
112 -- -- 112 -- -- No change
-- --
Early Literacy and Learning Model (ELLM)
110 -- 2 112 -- -- 1.414 -0.134 .157
Even Start (Family Literacy Programme)
112 -- -- 112 -- -- 1.732 -0.164 .083
Family Nurse Partnership (FNP) 85 2 25 92 -- 20 .998 -0.094 .318
Healthy Families America (HFA: a programme of Prevent Child Abuse America)
112 -- -- 112 -- -- No change
-- --
Healthy Families New York (HFNY)
112 -- -- 112 -- -- No change
-- --
High/Scope Perry Pre-School 111 -- 1 112 -- -- 1.000 -0.094 .317
I Can Problem Solve (ICPS) 111 -- 1 111 -- 1 .447 -0.042 .655
Incredible Years 57 8 47 59 7 46 .380 -0.036 .704
Let’s Begin with the Letter People
112 -- -- 112 -- -- No change
-- --
Multidimensional Treatment Foster Care (MTFC)
112 -- -- 112 -- -- No change
-- --
Parent Child Home Programme 110 1 1 111 -- 1 .272 -0.026 .785
Parent Child Interaction Therapy (PCIT)
112 -- -- 111 -- 1 1.000 -0.094 .317
Parents as Teachers (PAT) 110 -- 2 111 1 -- 1.089 -0.103 .276
Ready, Set, Leap! (LeapFrog) 112 -- -- 112 -- -- No change
-- --

112
Named programmes, strategies or interventions that children’s centre managers to report their level of implementation of (n=61). Levels of Implementation were coded: Not implemented (0); In a position to Implement (1); Currently implementing (2)
Levels of implementation in 2012
Levels of implementation in 2013
Statistical comparison of the change in level of implementation (in n=112 children’s centres)
(0) (1) (2) (0) (1) (2)
Sta
tistic
(Wilc
oxon
Z)
Eff
ect
Siz
e*
(r=
Z/(
n1/2))
p
Success for All programmes (Other)
110 -- 2 112 -- -- 1.414 -0.134 .157
Triple P (Positive Parenting Programme)
63 8 41 64 7 41 .156 -0.015 .876
4 Children, Children’s Centre Approach
112 -- -- 112 -- -- No change
-- --
Early Support Programme (for disabled children)
86 5 21 91 2 19 .512 -0.048 .609
Enhanced Triple P-Positive Parenting Programme
103 2 7 96 1 15 1.626 -0.154 .104
Every Child a Talker (ECAT) 42 5 65 51 5 56 1.437 -0.136 .151
Families and Schools Together Programme (FAST Programme)
107 -- 5 106 1 5 .333 -0.031 .739
Family Links Nurturing Programme (includes Parenting Puzzle)
83 2 27 84 6 22 1.513 -0.143 .130
Family Literacy, Language and Numeracy (FLLN)
103 -- 9 103 -- 9 No change
-- --
Fives to Fifteens basic Parenting Programme
110 1 1 112 -- -- 1.342 -0.127 .180
Hit the Ground Crawling 111 1 -- 112 -- -- 1.000 -0.094 .317
ICAN 88 3 21 83 4 25 .684 -0.065 .494
Infant massage 31 2 79 29 3 80 .206 -0.019 .837
Mellow babies 105 1 6 107 2 3 .921 -0.087 .357
Mellow bumps 107 2 3 109 -- 3 .552 -0.052 .581
Mellow parenting 97 5 10 94 9 9 .386 -0.036 .700
New Forest Parenting Programme
109 1 2 112 -- -- 1.633 -0.154 .102
Noughts to Sixes Parenting Programme
107 1 4 108 2 2 .966 -0.091 .334
Parent Infant Project (The Anna Freud Centre)
112 -- -- 112 -- -- No change
-- --
Parents as First Teachers - Born to Learn (PAFT)
109 -- 3 108 2 2 No change
-- --
Parents, Early Years and Learning programme (PEAL)**
96 6 10 106 1 5 2.368 -0.224 .018
Parents in Partnership Parent-Infant Network (PIPPIN)
112 -- -- 112 -- -- No change
-- --
Parenting Matters 110 -- 2 111 1 -- .577 -0.055 .564
Parents Involved in their Children’s Learning (PICL)
102 2 8 105 1 6 1.008 -0.095 .313

113
Named programmes, strategies or interventions that children’s centre managers to report their level of implementation of (n=61). Levels of Implementation were coded: Not implemented (0); In a position to Implement (1); Currently implementing (2)
Levels of implementation in 2012
Levels of implementation in 2013
Statistical comparison of the change in level of implementation (in n=112 children’s centres)
(0) (1) (2) (0) (1) (2)
Sta
tistic
(Wilc
oxon
Z)
Eff
ect
Siz
e*
(r=
Z/(
n1/2))
p
Parents Plus Early Years Programme
108 1 3 112 -- -- 1.890 -0.179 .059
Pathways Triple P-Positive Parenting Programme
103 3 6 104 3 5 .368 -0.035 .713
Peers Early Education Partnership (PEEP) Learning Together Programme
88 5 19 87 5 20 .404 -0.038 .686
Positive Parenting - Time out for Parents (Led by Care for the Family)
105 1 6 105 1 6 No change
-- --
Pregnancy Birth and Beyond 98 -- 14 92 2 18 1.003 -0.095 .316
Preparation for Birth and Beyond 98 1 13 98 2 12 .221 -0.021 .825
Promotional Interviewing 110 -- 2 111 -- 1 .577 -0.055 .564
Relationship support programmes
103 2 7 108 1 3 1.718 -0.162 .086
Solihull Approach** 78 8 26 68 5 39 2.843 -0.269 .004
Springboard Project 111 -- 1 112 -- -- 1.000 -0.094 .317
Stepping Stones Triple P-Positive Parenting Programme
106 1 5 106 -- 6 .090 -0.009 .928
Strengthening Families Programme (SFP)
100 3 9 102 2 8 .165 -0.016 .869
Strengthening Families, Strengthening Communities
92 3 17 86 7 19 1.010 -0.095 .312
Targeted Family Support (Action for Children)
103 1 8 102 -- 10 .503 -0.048 .615
Video Interactive Guidance 107 1 4 103 2 7 1.206 -0.114 .228
Wider Family Learning (WFL) 100 1 11 105 -- 7 1.312 -0.124 .190
Notes: * Effect sizes are interpreted as: 0.1 “small”; 0.3 “medium”; 0.5 “large”;
** Changes that were statistically significant (p<0.05)

114
Ap5: Chapter 5 – Aims for Families and Parenting Services
Ap5.1: Areas of coding emphasised within staff descriptions of ‘the Most Disadvantaged Families’
Table Ap5.1 Areas of coding emphasised within staff descriptions of ‘the most disadvantaged
families’
Aspects of family arrangements
Number of centres
Areas of coding
Parent 67 Parents’ personal situation, life skills, parenting issues, life events
Family 61 Family needs, family structure, location
Community 37 Social isolation and centre engagement Child 21 Needs of the child, attachment, neglect/child protection
Ap5.2: Development and analysis of the staff interview
An interview schedule of 97 questions was devised and ordered in terms of applicability to the
interviewees’ role at the centre (i.e. whether they classified themselves as a person who runs
sessions, as a person who carried out outreach or family support work in homes, or whether they
fulfilled both of these roles). The interview questions included the respondent’s background,
staffing within the children’s centre, aims and objectives of the session (for staff members running
sessions), aims and objectives of family support/outreach work (for staff members carrying out
outreach or family support in the home), target groups for the children’s centre, the relationship
between the centre and other agencies, and the centre’s hopes and plans for the future. The
interview schedule was piloted in two children’s centres (which were known not to be part of the
ECCE study), with each interview lasting approximately one hour. It was deemed appropriate to
highlight a core set of 27 key questions on which the fieldworkers would focus should the
interviewee be limited by time constraints.
The interview scripts underwent a number of stages of analysis. Before importing them into
NVivo, an initial data cleaning process ensured that the scripts were accurate and contained full
information surrounding acronyms and locally-specific interventions or terminology. In addition to
this, all information specific to individual centres or their location was removed to ensure full
anonymity. Next, data reduction was implemented to ensure that data could be grouped
according to areas of interest and particular question-related responses. Lastly, a team of four
coders worked closely together to produce emergent nodes based on the statements made by
interviewees. The nodes were then grouped into themes through the iterative process of detailed
reflective discussions. Data were re-coded according to the finalised parent and child nodes.
Matrix coding processes were employed to report total numbers of centres reflecting on each area.
Ap5.3 Lesser-mentioned characteristics of families attending the centre
Families and their needs
Other family structures noted included child-minders, nannies or carers, separated families, foster
families, and couples. One staff member explained the importance of focusing on the family
specifically: ‘We need to support whatever their needs are e.g. single parent in one bedroom

115
versus [a] family in [a] better part of [the] local authority in a 4 bed house. If both mums have
postnatal depression, would support them in the same way.’ Staff also noted a variety of other
family needs, including emotional instability, lack of support, pregnancy and very young babies,
special needs, cultural issues, chaotic lifestyles, extended family disagreements, and lack of
provisions or resources belonging to the family.
Children and their needs
Children and their specific needs were mentioned third most frequently across the sample of
children’s centres (78% of the 116 centres responding with this information73). Staff primarily
described a child’s personal needs (across 66% of centres) and their personal situation (47%
of centres). These two elements of children’s lives will now be discussed.
Staff mostly referred to the child’s personal needs and particularly, any additional needs (across
just over 45% of centres). Additional needs included: childhood disabilities such as physical
difficulties, developmental disorders such as Autism Spectrum Disorder (ASD) and Asperger’s
Syndrome, behavioural difficulties such as ADHD, health needs such as Periodic Limb Movement
Disorder (PLMD), developmental delay, and learning needs such as communication and speech
and language. Issues with children’s behaviour were also reported across just over one third of
the centres, especially with reference to parents who are struggling to manage behaviour at home
and wanting to learn about setting boundaries for their children (for example: ‘Have difficulties
coping with their perception of challenging behaviour’ and ‘Behaviour strategies, routines and
boundaries’).
Staff from one fifth of centres mentioned poor experiences for the children, referring most
frequently to a lack of attachment and engagement from the parent: ‘Relationship with the child
may be weak’; ‘Often they sit on benches rather than playing with children on the floor’. Some
centres also noted a lack of stimulation and resources at home (‘Under stimulated children’;
‘Limited/no finance and equipment for new baby’). Staff from just under half of the centres
reported on child-related situations; commonly higher-end social care families, child neglect
issues, or those on Child Protection (CP) and Child in Need (CiN) plans.
Parent and Community needs
The least reported characteristic of families related to parent and the community needs
(mentioned across 60% of centres74). Staff highlighted the centre’s location and reach as a
factor in who attends the centre (mentioned by 57% of centres), followed by needs of the parent
and community (15% of centres).
Location and reach was the most frequently mentioned characteristic, with particular reference to
isolation and lack of socialisation (across nearly two fifths of centres: ‘those with no family/friend
network’). Staff spoke about the location of the family, particularly those new to the area (in just
over one third of centres). More specific locality issues were described, including targeted
housing estates, obesity levels, high unemployment and low income levels (‘Fourth highest area
73
Less than one third of the 71 centres, considered children as a factor within their definition of the ‘most disadvantaged families’ (21/71 centres). 74
Just over half of the centres (37 of the 71) considered the community within their definition of the ‘most disadvantaged families’.
116
for worklessness in the country’), rurality and lack of transport (‘The rurality means that parents
getting to the centre is a huge barrier’), substance misuse, violence and crime, poor housing, poor
mental health, high levels of minority ethnicities and multiple languages (‘Language barriers that
isolate people’; ‘social/cultural issues’), and high conception rates (‘Three to four children per
family’). Areas of poverty and deprivation were mentioned as a primary issue for families (nearly
one fifth of centres), for example, areas considered as having a ‘high poverty index’, being in the
‘top ten per cent most deprived’, the lowest ‘20% and 30% most deprived in reach’, and ‘low
Income Deprivation Affecting Children Index (IDACI) areas’.
Staff lastly spoke of parent and community needs (15% of centres), including issues around
families not wishing to engage with services at the centre, those needing general support, and
learning to trust the children’s centre team (‘Parents accepting us, after past experiences with
professionals that have been negative’).
Ap5.4 Lesser-mentioned aims for parenting services in children’s centres
Parent and Community Needs
Aims targeted towards Parent and Community were of third most importance to staff (across 45%
of centres). Staff responses frequently referred to engaging families with the children’s centre
both through attending a physical centre and reaching out through home visits, as well as
engaging them through volunteering (25%). Centre staff gave examples including: ‘Getting them
actively involved in the centre’; ‘Will do anything to get parent out of house and engaging’; ‘For
parents to come out more, be aware of what’s available for them.’
The next aim was reduction in parent isolation and integration into the community (15% of
centres), for example: ‘Socially integrate into community’. Centre staff also referred to the
importance of community involvement (‘Work towards sharing [a] vision with family and
community’; ‘Engaging community – work together’; ‘Getting parents to be part of the community’).
Lastly, increasing the parent’s trust of the children’s centre was a strategy to engage them in
further involvement.
Parent and Family Needs
Parent and Family needs were least reported as an aim (by 14% of centres). Staff referred to only
two areas: dealing with domestic abuse and improvement of parent-to-parent relationships.
Ap5.5 Lesser-mentioned benefits of ‘play and learning’ activities for adults
Personal needs of the parent
As before with the ‘Aim for Parenting Services’ question in Section 5.4, the Personal Needs of the
Parent was the second most commonly reported benefit (across 87% of the centres). The majority
of responses regarding this area of need related to the benefits of increased social interaction and
socialisation for the parents (78%): ‘Meet other people in similar situations’; ‘Making friends’;
‘Interact with other parents’. Staff also felt that the opportunity to share experiences through peer-
to-peer support was beneficial (30%): ‘Parents get chance to compare notes with other mums and
dads’; ‘Helps them to realise that they are not the only ones experiencing this’; ‘Support from other
parents and from us’.

117
Similar to the ‘Aim for Parenting’ question in Section 5.4, a variety of other benefits were reported,
including (in order of most commonly reported) improved healthy lifestyles (such as oral health,
nutrition and cookery; 16%), improved education (for example English as a Second Language,
English, Mathematics or other adult learning; 14%), general life improvement (including practical
skills, life skills and applications for benefits or further help), improved financial situations (through
accessing benefits and additional support), improved employment situation, and improved mental
health and housing.
Parent and community needs
Parent and Community benefits were the third most commonly reported benefit (66% of centres).
The majority of responses referred to reducing isolation (56%): ‘Isolated families can meet others;
make friends’; ‘Chance to make friends with other parents’. Centre staff also sometimes
mentioned the benefit of community or centre engagement, for example ’Meeting/making links in
community’; ‘Increased sense of community’; ‘Encourage them to attend sessions as well as
following outreach times.’
Parent and family needs
As was the case for the ‘Aim for Parenting’ question in Section 5.4, the least mentioned benefits
related to the needs of the Parent and Family (14% of centres). The greatest benefit mentioned
by staff was individualisation to the needs of the family, reported by ten per cent of centres.
Examples given included: ‘Listen to family and help them identify what the family needs, a work
plan’; ‘Try to take personal caring interest. Not box ticking’. Staff also referred to the benefits of a
holistic approach to the family, benefits of improved parent relationships, and outcomes regarding
domestic abuse.

118
Ap6: Chapter 6 – Strategies and Progression into the Future
Ap6.1: Strategies for Working with Parents
Ap6.1.1 ORIM Framework for Supporting Parents
Opportunities
All answers were analysed in terms of the four areas of parental needs listed in Chapter 2. A
number of staff talked about providing opportunities for the parents. The provision of opportunities
was mentioned frequently as a supportive strategy across 90 per cent of the sample. The majority
were aimed at the needs of the parent and child unit (71% of centres reporting on the parent and
child unit), including encouragement and provision of varied and new activities for the children
(44%) and increasing parental awareness of activities that can be used at home (32%). Particular
examples included showing parents how to make use of common household materials as play
resources (‘Make things at home for cheap/free e.g. shakers and natural things like odd socks,
sew buttons and fill with pasta etc.’) and ‘allowing’ the child to carry out different activities, such as
messy play. Other opportunities relating to parent and child needs included the opportunity to
work on speech and language and early intervention and prevention.
Fifty-four per cent of the centres reported targeting personal parent needs, for example,
supporting parents to access benefits and improve their financial situation, helping families to
budget and manage their debts, providing advice and support to access benefits, and helping with
funding applications. Twenty-one per cent of staff reported providing opportunities for work and
employability, such as helping adults to improve their employability skills, integrating JobCentre
Plus/job-clubs into the children’s centre, and supporting parents to get back into the job market.
A further 46 per cent of centres reporting on how they support community needs referred to the
provision of opportunities in terms of accessing centre services through home visits and one-to-
one support. Other centres described using outreach locations or mobile centre services such as
play-buses (‘Taking services to the community’).
Modelling
The use of modelling as a supporting strategy was reported by 88 per cent of the sample.
Seventy-three per cent of centres (when discussing parent and child needs as a unit) reported
providing modelling as a strategy. The vast majority of these (62%) highlighted the modelling of
particular parenting tools, skills, and strategies for use with the children. A couple of examples
included behaviour management techniques, setting boundaries, promoting parenting consistency,
and basic skills such as using suitable language and nursery rhymes (‘Give them toolkit/ideas to
manage their own issues so they can parent their child. It’s about empowering and equipping
people’.) Just under a third of centres reported role modelling with families, for example, showing
parents how to manage behaviour, interact or play with their child, and which activities to choose
(‘Staff model to parents and then [we] see that coming through with the parents’).
When providing information on parent’s personal needs, 51 per cent of centres reported using
modelling as a supportive strategy, and a further 34 per cent used this strategy when reporting on
parent and family needs. Staff reported working with families on their cookery skills, family diet

119
and obesity, and breastfeeding skills, as well as providing advice on a variety of other health
issues such as smoking cessation, dental hygiene, and alcohol and substance misuse.
Interactions
Interactions were reported as a supportive strategy by 87 per cent of the sample. This was the
most commonly reported strategy for supporting parents’ personal needs (79% of centres), for
example, encouraging social interaction (61%), which aimed to develop parental support networks
and reduce isolation. Staff referred to helping parents build relationships with other families
through the provision of centre services (‘This is an easy group for people to make friends’),
encouraging parents to interact during the sessions (‘They tend to focus on their child so getting
them to socialise also with each other’), helping parents to develop socially (‘Support their social
skills’), and encouraging ‘buddying’ or befriending services. Others thought that it was important
to encourage peer support networks as they allow parents to learn from each other. In addition,
44 per cent of centres highlighted the importance of developing a trusting relationship with staff,
for example, through a non-judgemental atmosphere (something also recognised by centre staff
as a challenge; for more information on this see Chapter 5). Staff described providing parents with
the ‘freedom’ to talk and ask questions, and concurrently, performed a listening role.
Fifty-seven per cent of the centres (reporting on strategies used to support parent and child
needs) referred to interactions, particularly in terms of encouraging the parent and child
relationship through increasing interaction, affording opportunities to spend focused time together,
and encouraging bonding and attachment (31% of centres discussing parent and child needs).
The provision of group support was considered as another supportive strategy for encouraging
interactions; this was presented across a number of parental needs, including supporting parents
personal needs, parent and child needs as a unit, and parent and family needs. Staff
highlighted groups for specific families, such as fathers, domestic violence support, English as a
Second Language, groups run for a specific purpose (e.g. keeping fit classes and parental
wellbeing groups), and parenting programmes (including some of those listed in Chapter 4) with a
focus on strategies for parent-child interaction.
Recognition
The least mentioned ORIM strategy was recognition (reported by 34% of the sample). Thirty-two
per cent of the centres reporting on parent and child needs as a unit described praising and
encouraging parents (‘Allowing them to progress and have something to be proud of’) and
encouraging parents to be reflective, for example, through understanding their past experiences
and their responsibilities as a parent (‘Get parents to understand they have parenting issues’).
Very few centres reporting on parents’ personal needs (3%) used recognition as a strategy.
Ap6.1.2 Additional Strategies for Supporting Parents
Encouragement and empowerment
Encouragement was the most used additional strategy across the whole sample (90% of the
centres). This was most commonly reported for supporting parent and child needs (76% of
centres) and parents personal needs (68% of centres). The majority of responses regarded the
general support of parents and children (for example, ‘to support the families to make life better for
them’; ‘Setting goals for them, break it down to small manageable things’) and the availability of
staff to give advice or to accompany parents to appointments. Centres recognised the provision of

120
a supportive environment, ensuring that the centre remained welcoming and comfortable for
families. The development of parental confidence, self-esteem, and self-worth, as well as the
encouragement of independence and responsibility, were also recognised as strategies for
supporting both parent and child and personal needs of the parent. A number of centres
championed the general empowerment of parents in order to support them to take responsibility of
their lives and become independent (‘Empowering parents to deal with things themselves and
make changes in their lives’). Staff also highlighted promoting aspirations and self-esteem both
for the parents (‘Helping them see a future and have aspirations’) and their children (‘Make them
aware that [the] aim [is] to achieve better outcomes for [their] child and the importance of this’).
Sixty-four per cent of the centres reported on ways to support parent and community needs in
terms of encouragement, specifically the encouragement of families’ participation in centre
activities and attendance. In addition to this, staff described techniques such as being welcoming,
‘breaking down the barriers’; and ‘coaxing’ families in with services such as midwives and on-site
cafes, home visiting, and using outreach locations. A quarter of the centres reporting parent and
community needs referred to their services being accessible and inclusive, particularly in terms
of location, provision of services in one place, and an inclusive ethos. Other centres used the
expression of ‘hand-holding’, welcoming strategies, and funding transport to ensure parents’
attendance, as well as personally ‘reaching out’ to families through home visits, visiting local
communities, and regular personal communication. Encouraging engagement with the community
was also seen as important, including providing trips out for the families, positioning centre
workers and services within the local community, and making families aware of local activities and
events.
Meeting individual needs
The next most commonly reported strategy for supporting parents’ personal needs was targeting
the individual needs of parents (85% of the whole sample). Seventy-three per cent of the centres
reporting on how they support the personal needs of the parent referred to meeting individual
needs, including practical help for families and helping them to fulfil basic needs (37%); helping
parents’ to arrange and attend appointments; helping families to fill out forms, write letters or
phone other organisations; and accessing food parcels. Additionally, just under a third of these
centres provided courses and education with a focus on adult education, ESOL courses, and
training. Twenty-eight per cent targeted the improvement of parents’ home lives, for example,
housing conditions, providing housing advice and support, and working alongside housing
organisations. Staff also reported the use of individualised support for mental health needs (23%)
and for families speaking other languages or coming from other cultures (21%).
Sixty-seven per cent of centres used the strategy of meeting individual needs for the parent and
family, with the majority of them targeting family need (64%): ‘Initially [the] aim is to assess the
family, identify [their] needs and empower’. Next, and related to the first point, nearly a quarter of
centres reported focusing on individualised outcomes and plans to suit specific families. Staff also
highlighted the importance of having personal discussions with families to identify what they would
like support with (‘Parent may have different priorities than the professional’) and maintaining a
flexible approach to working with the families (‘Sometimes you have to try different things’).

121
Provision of information and knowledge
The provision of information and knowledge as a strategy was only highlighted by centres
referencing parent and child needs (83% of these centres). Staff primarily referred to two areas:
firstly, the role of parental awareness of child development both in terms of skills and how they can
support those (44%; ‘Helping parents to see what behaviour is appropriate [for their child’s] age
and that it is to do with their age’), and secondly, the importance of play (44%; ‘Learn that play is
important part of child’s development’) and how to incorporate it into their everyday lives. More
generally, a number of centres provided information about parenting, child needs, knowledge
regarding how children learn, how to prioritise and support learning opportunities in the home, and
general information regarding family health.
Ap6.2: Centre strategies
As well as listing strategies for use with children and parents, staff from 107 of the centres also
referred more generally to the way that their centre influences the delivery of services. Staff from
two thirds of the centres spoke about the importance of providing a multi-agency response75.
This frequently referred to the signposting and referral of families to other agencies as relevant to
their needs, maintaining a general link with other agencies so that they can better meet families’
needs (‘We are trying to be as innovative as possible. Pool together resources with other
agencies to ensure services continue’), sharing information and advice as appropriate and
attending meetings with other multi-agency partners. Staff referred to multi-agency partners
running or attending services as part of the centre offer (in 15% of centres). In contrast, five per
cent of centres mentioned challenges or a lack of multi-agency working with particular partners.
A number of centres (62%) highlighted the importance of the types of services on offer,
particularly with regards to targeted versus universal provision, and the variety of services. Staff
spoke both about universal provision (for example, provision aimed at all families regardless of
need) and targeted provision (for example, targeted groups, targeting particular geographical
areas or services aimed at particularly vulnerable families and needs). Whilst a few centres
reported a move towards more targeted work (in line with the findings in the first ‘visits to children’s
centres’; Goff et al., 2013), other centres reported a general mix of universal and targeted
provision. A selection of centres noted the importance of maintaining universal provision for
engaging families, a thought echoed within the most recent 4Children Children’s Centre Census
report in 2013, (‘Parents [are] less willing to attend targeted groups as [they] see this as a failure
on their parenting skills’; ‘Mix [of] universal and targeted families – it works better with mixed
groups of parents as the less able parents learn from watching [the] more capable’).
Many centres referred to promoting their centre services to families (39%). A recent survey by
the Children’s Society in 2013 reported that 73 per cent of families who were surveyed as current
non-users of children’s centre services were not aware of the services offered (Royston and
Rodrigues 2013), thus promoting services as a strategy would be important. The quality of the
staff was also noted by 34 per cent of the centres, particularly in terms of their specific training or
role (for example, dedicated fathers workers and multi-lingual workers), their supportive nature
75
The percentages reported throughout Section 6.4 in Chapter 6, and Ap6.2 have been rounded up to whole figures, and are based upon volunteered information regarding strategies (as opposed to all centres systematically answering a question). Percentages should therefore be interpreted with caution. n=107.

122
towards each other (‘It’s about everyone working together for one aim’), their approachability and
welcoming ethos, their range of expertise and qualifications, and their consistency and regularity
as a staff team. Providing for families was another strategy (21% of centres) in which staff
reported providing spaces for families to use, and dedicated time during which families could be
together (‘One-to-one time to just play with their child without distraction’). Lastly, 14 per cent of
centres highlighted the provision of a safe place for families, something which they may be
unable to access elsewhere.
Ap6.3: Other Hopes and Plans for the Future
Staffing
The fourth most frequently described area for centre progression was staffing, as indicated across
63 per cent of the centres. Staff reported two prominent issues: staffing issues including staff
roles (53%) and job satisfaction (19%). Issues were reported around maintaining staff
consistency and job security (‘Have had many staff changes during cluster process’; ‘Maintaining
[a] consistent staff team is very important’) and permanent versus temporary staff (‘More
permanent staff not supply – own workers feel part of team and improve quality for children’).
Staff also reported wanting to employ additional staff (‘Here staffing very low – only four – so
centre only opens when they have a session or when parents are expected’) and noted the
tensions between increasing volunteer capacity against relying too heavily on volunteers (’Not
want to have to rely on volunteers’). There was a need for reduced workload, as well as more
defined job descriptions and roles (‘Have more available staff. I have to be very limited in what I
can do. We have to cut short because number and level of work’ and ‘A more defined role for
outreach workers rather than a ‘jack of all trades’). Lastly, staff spoke of a need for better staff
management (‘Need two full time managers’).
Job satisfaction was mentioned less across centres (19%). Staff reported a wish to keep their
jobs and stay positive (‘Hope remaining staff will remain positive to the changes’) as well as low
morale (‘We’ve felt under the spotlight and pushed from pillar to post’; ‘Would like the uncertainty
to go’).
Family Needs
Fifty per cent of the centres reported wanting to see a future change in relation to family needs.
The answers provided could be broadly mapped onto the areas of parental need described in
Chapter 2 of this report. In order of prominence, staff reported wishing to see changes related to
the Parent and Family unit (26% of the centres answering the question), followed by Parent and
Child needs (25%), Personal Needs of the Parent (15%), and Parent and Community (10%).
These areas will now be discussed in further detail.
Staff most commonly reported wanting to see general positive outcomes for the Parent and
Family unit in the future (26% of centres): ‘Be able to make a difference to them’; ‘Everyone to live
happily ever after – put ourselves out of a job, get families to see what they can achieve, make
educated choices’. Staff also noted the importance of continuing to provide for individual family
needs by focusing on the families in the area, and through offering both universal and specific
support (e.g. ‘Be more flexible according to type of community [they are] based in’). Lastly, staff
mentioned monitoring family progress as an important change for the future.

123
Next, staff wanted to a see a future change relating to Parent and Child needs (25%). The
majority of these staff referred specifically to improved or maintained early intervention and
prevention (13%): ‘Link up with families antenatally’; ‘Would like to do more early intervention but
not possible at moment – we are working much further up the scale’. Other staff members
described a need for greater work surrounding parenting skills and a greater focus on narrowing
the child attainment gap, building parent independence, and speech and language.
Thirdly, staff reported wishing to see a change in relation to the Personal Needs of the Parent
(15%). Staff presented a range of responses related to parents’ personal needs, including
reducing worklessness within families, providing opportunities for parental interaction, and
improving mental health, education, finances, and health for families. Lastly, Parent and
Community needs were a focus for ten per cent of the centres, specifically community projects
(for example, the provision of trips for families and events to bring the community into the centre)
and opportunities for families to volunteer at the centre.
Facilities and Resources
The sixth and final area for change described by staff regarded facilities and resources (across
44% of the centres). Two main issues arose from the respondent answers: improvement in venue
and space (in 29% of the centres), and facilities and resources (19%). These areas will now be
discussed in further detail.
Staff mainly spoke about current issues with, and improvements to, centre venues (across 22%
of centres). Staff mentioned a number of issues with venues which they were hoping could be
improved in the future; the first was to ensure that services were available in outreach areas within
the community, and the second referred to outdoor space being utilised wherever possible, for
example: ‘Working in community centres and halls right in the heart of the community’; ‘More
outdoor community-based parks and library. Use these spaces to deliver sessions’). Staff
frequently noted that they wanted more space at the centre and were trying to make good of the
facilities available to them, for example: ‘Like to develop the outside space, build a roof and protect
from the weather’ and ‘Would like centre to grow, but no space’. Staff also frequently described
needing to change the ambience of the centre in order for it to feel friendlier and more relaxed, for
example: ‘To develop more of a community feel’.
Next, staff in 19 per cent of centres spoke about improvements in facilities and resources. It
was felt by some that new or improved facilities within the building were required, including cafes
for families, staff rooms, larger office spaces, and washing areas. Staff also detailed a need to
modernise systems and to make more appropriate investments in technology. Staffing resources
were wanted, including reinstating professionals that used to be co-located at the centre.

124
Ap7: Chapter 7 – Parental Views and Experiences
Background Information about Parents
The vast majority of parents interviewed were female (92%). Of the 519 respondents, 92 per cent
indicated that they were the parents of the children and an additional four per cent of respondents
were the grandparents of the children attending the centre. Seventy-seven per cent of the
respondents indicated that they currently lived with their husband, wife, or partner. Table Ap7.1
illustrates the ages of the respondents.
Table Ap7.1 Age of the parent sample
Parent age % of the parent responses
Under 21 2 21-25 14 26-30 27 31-35 27 36-40 15 41-45 8 46-50 1 Over 50 6
Total n= 517 parent responses
Note: all percentages have been rounded up to the nearest whole
Eighty-three per cent of respondents interviewed were between the ages of 21 and 40, with 54 per
cent being between the ages of 26 and 35. Seventy-four per cent of respondents indicated that
they lived in a house, with an additional 24 per cent living in a flat. Fifty-one per cent rented their
accommodation and 45 per cent of respondents owned their place of residence. The majority of
respondents were of “White” ethnicity (80%), with “Asian or Asian British” making up another nine
per cent of respondents, and “Black or British Black” making up seven per cent.
The data collected showed that most parents (59%) brought only one child to the children's centre,
32 per cent indicated that they brought two children to the centre, seven per cent brought three,
and very few parents brought more than three children (<2%).
Ninety-five per cent of respondents indicated that they spoke English at home and 79 per cent of
respondents listed English as the only language at home; an additional 16 per cent of respondents
cited that English and one other language were spoken regularly at home.
The majority of respondents reported their occupation to be a full-time carer of their child (47% of
respondents). The second most common employment status was reportedly “employed part-time”
(21%). An additional 11 per cent of respondents worked “full time” outside of the home and eight
per cent were “self-employed”. Five per cent of respondents were “unemployed but looking for
work” and two per cent were “unemployed and not looking for work”. Finally, two per cent of
respondents were “full time students” and another two per cent were “retired”. The “other”
employment statuses made up just less than two per cent of the respondents.
The 500 respondents reported a wide variety of academic qualifications, including: a Level 0
academic qualification (10%), Level 1 (10%), Level 2 (19%), Level 3 (11%), Level 4 (7%), Level 5

125
(3%), Level 6 (21%), Level 7 (10%), Level 8 (1%), and a further eight per cent indicated that they
had achieved another academic qualification not listed in the scale. The 521 respondents also
reported a wide variety of other educational/professional qualifications ranging from: no additional
qualifications (44%), Level 1 (9%), Level 2 (16%), Level 3 (20%), Level 4 (2%), Level 5 (2%),
either Level 6 or Level 7 (less than 2% achieving), and finally, six per cent achieving another
vocational qualification not listed in the scale.
Of the 522 respondents who answered questions concerning the benefits they receive, 49 per cent
reported receiving a Child Tax Credit, 22 per cent received a Housing Benefit, 17 per cent
received a Council Tax Benefit, 16 per cent received Income Support, 16 per cent received a
Working Tax Credit, and eight per cent received a Healthy Start Benefit. Very few respondents
indicated that they received other benefits. Five per cent of respondents received a Disability
Living Allowance or equivalent, and three per cent received a Childcare Tax Credit. Less than one
per cent of respondents received any other benefit.

126
© University of Oxford
Reference: DfE RR 368
ISBN: - 978-1-78105-395-9
This research report was commissioned before the current UK Government took office on 11 May
2010. As a result the content may not reflect current Government policy and may make reference
to the Department for Children, Schools and Families (DCSF) which has now been replaced by
the Department for Education (DFE).
The views expressed in this report are the authors’ and do not necessarily reflect those of the
Department of Education
Any enquiries regarding this publication should be sent to us at:
[email protected] or www.education.gov.uk/contactus
This document is available for download at www.gov.uk/government/publications