Harry Clever Field Airport (PHD) Master ... - New Philadelphia
121
-
Upload
khangminh22 -
Category
Documents
-
view
0 -
download
0
Transcript of Harry Clever Field Airport (PHD) Master ... - New Philadelphia
HARRY CLEVER FIELD AIRPORT PHDMASTER PLAN UPDATEFINAL REPORT MARCH Prepared for: City of New Philadelphia, Ohio
Prepared by: Michael Baker International, Inc.

Harry Clever Field Airport Master Plan Update
i
Table of Contents
1.0 Inventory of Existing Conditions ........................................................................................ 1
1.1 Master Plan Overview ..................................................................................................... 1
1.2 Key Issues ........................................................................................................................ 1
Figure 1-1 Key Elements of Airport Master Plan .............................................................. 3
1.3 Airport Location, Ground Access, and Parking .............................................................. 4
1.4 Airport Management Structure ....................................................................................... 4
Figure 1-2 Location / Vicinity Map .................................................................................... 5
Figure 1-3 Surrounding Airports ........................................................................................ 6
1.5 Airport History .................................................................................................................. 7
1.6 Previous Studies for PHD ................................................................................................ 7
1.7 Airport Role/User Profile ................................................................................................. 8
Table 1-1 FAA NPIAS Service Level ....................................................................................... 8
Table 1-2 FAA ASSET 1 Categories ....................................................................................... 9
Table 1-3 Ohio Airports Focus Study Classifications ........................................................... 9
Figure 1-4 NPIAS Airports ................................................................................................ 10
1.8 Airfield Overview ............................................................................................................ 11
1.9 Landside Overview ........................................................................................................ 11
Figure 1-5 Existing Facilities ............................................................................................ 12
Figure 1-6 Pavement Condition Index (PCI) ................................................................... 13
Figure 1-7 Existing Airport-Runway Information............................................................. 14
Figure 1-8 Existing Building Information ........................................................................ 15
1.10 Airspace Environment ............................................................................................... 16
1.11 Instrument Approaches and Navigational Aids ....................................................... 16
Table 1-4 PHD Approach Procedures ................................................................................. 16
Figure 1-9 Sectional Aeronautical Chart ........................................................................ 17
1.12 Historical Weather Conditions .................................................................................. 18
Table 1-5 Average Temperature & Precipitation Normals (PHD ASOS) ........................... 18
Figure 1-10 Average Temperature (° F) Normals (PHD ASOS) ..................................... 18
1.13 Land Use Considerations .......................................................................................... 19
1.14 Land Holdings ............................................................................................................ 19
Figure 1-11 Surrounding Land Uses ............................................................................... 20
2.0 Aviation Activity Forecasts ............................................................................................... 21
Harry Clever Field Airport Master Plan Update
ii
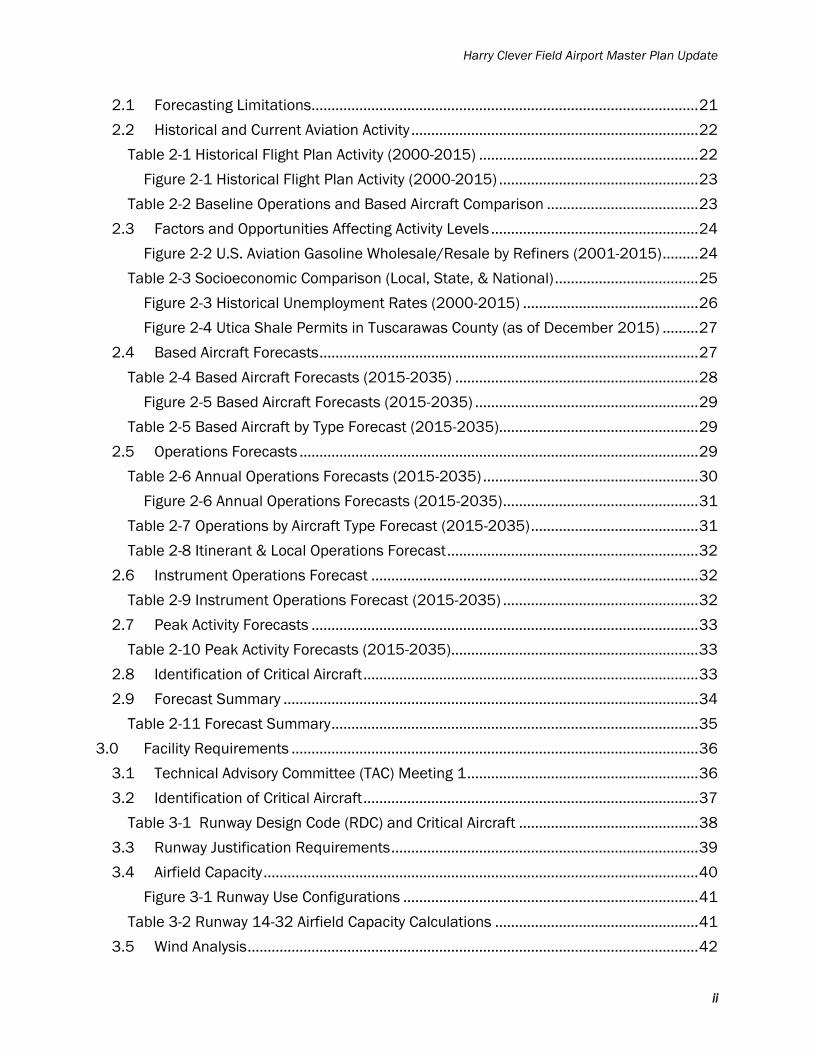
2.1 Forecasting Limitations ................................................................................................. 21
2.2 Historical and Current Aviation Activity ........................................................................ 22
Table 2-1 Historical Flight Plan Activity (2000-2015) ....................................................... 22
Figure 2-1 Historical Flight Plan Activity (2000-2015) .................................................. 23
Table 2-2 Baseline Operations and Based Aircraft Comparison ...................................... 23
2.3 Factors and Opportunities Affecting Activity Levels .................................................... 24
Figure 2-2 U.S. Aviation Gasoline Wholesale/Resale by Refiners (2001-2015) ......... 24
Table 2-3 Socioeconomic Comparison (Local, State, & National) .................................... 25
Figure 2-3 Historical Unemployment Rates (2000-2015) ............................................ 26
Figure 2-4 Utica Shale Permits in Tuscarawas County (as of December 2015) ......... 27
2.4 Based Aircraft Forecasts ............................................................................................... 27
Table 2-4 Based Aircraft Forecasts (2015-2035) ............................................................. 28
Figure 2-5 Based Aircraft Forecasts (2015-2035) ........................................................ 29
Table 2-5 Based Aircraft by Type Forecast (2015-2035) .................................................. 29
2.5 Operations Forecasts .................................................................................................... 29
Table 2-6 Annual Operations Forecasts (2015-2035) ...................................................... 30
Figure 2-6 Annual Operations Forecasts (2015-2035) ................................................. 31
Table 2-7 Operations by Aircraft Type Forecast (2015-2035) .......................................... 31
Table 2-8 Itinerant & Local Operations Forecast ............................................................... 32
2.6 Instrument Operations Forecast .................................................................................. 32
Table 2-9 Instrument Operations Forecast (2015-2035) ................................................. 32
2.7 Peak Activity Forecasts ................................................................................................. 33
Table 2-10 Peak Activity Forecasts (2015-2035).............................................................. 33
2.8 Identification of Critical Aircraft .................................................................................... 33
2.9 Forecast Summary ........................................................................................................ 34
Table 2-11 Forecast Summary ............................................................................................ 35
3.0 Facility Requirements ...................................................................................................... 36
3.1 Technical Advisory Committee (TAC) Meeting 1 .......................................................... 36
3.2 Identification of Critical Aircraft .................................................................................... 37
Table 3-1 Runway Design Code (RDC) and Critical Aircraft ............................................. 38
3.3 Runway Justification Requirements ............................................................................. 39
3.4 Airfield Capacity ............................................................................................................. 40
Figure 3-1 Runway Use Configurations .......................................................................... 41
Table 3-2 Runway 14-32 Airfield Capacity Calculations ................................................... 41
3.5 Wind Analysis ................................................................................................................. 42

Harry Clever Field Airport Master Plan Update
iii
Table 3-3 Wind Coverage Analysis (2006-2015) .............................................................. 42
Figure 3-2 All Weather Wind Direction Analysis (2006-2015) ...................................... 43
3.6 2014 Ohio Airports Focus Study .................................................................................. 43
3.7 Runway Length Analysis ............................................................................................... 44
3.8 Runway Strength Analysis ............................................................................................. 45
Figure 3-3 Aircraft Wheel Configurations ....................................................................... 45
3.9 Airfield Design Standards Analysis ............................................................................... 45
Table 3-4 Runway 14-32 Design Standards Evaluation .................................................. 47
Table 3-5 Runway 11-29 Design Standards Evaluation ................................................... 48
3.10 Other Airfield Considerations .................................................................................... 50
3.11 Airfield Lighting, Markings, Signage, and Navigational Aids ................................... 50
Figure 3-5 Signing Example for an Airport with a Single Runway ................................. 52
3.12 Transient Apron and Based Aircraft Storage ........................................................... 53
Table 3-6 2035 Based Aircraft Storage Requirements ..................................................... 54
3.13 Airport Support Facilities ........................................................................................... 55
3.14 Land Acquisition Requirements ................................................................................ 56
3.15 Airport Security Analysis ............................................................................................ 56
Table 3-7 PHD Security Features ....................................................................................... 57
3.16 Summary .................................................................................................................... 58
Table 3-8 Summary of Facility Requirements .................................................................... 58
4.0 Preliminary Alternatives ................................................................................................... 59
4.1 Instrument Approaches ................................................................................................ 60
4.2 Parallel Taxiway Alternatives ........................................................................................ 61
Figure 4-1 Runway 14-32 Approach Analysis ................................................................ 63
Figure 4-2 Runway 11-29 Approach Analysis ................................................................ 64
Figure 4-3 Parallel Taxiway Alternatives ......................................................................... 65
4.3 Airfield Design Standards Alternative .......................................................................... 66
Figure 4-4 Design Standards Alternative ....................................................................... 68
4.4 Land Use Analysis ......................................................................................................... 69
Figure 4-5 Land Use Analysis .......................................................................................... 70
Table 4-1 Land Use Analysis ............................................................................................... 71
4.5 Landside Alternatives .................................................................................................... 72
Figure 4-6 Development Alternative 1 ............................................................................ 73
Figure 4-7 Development Alternative 2 ............................................................................ 74
4.6 Support Facilities ........................................................................................................... 75

Harry Clever Field Airport Master Plan Update
iv
5.0 Preferred Alternative ........................................................................................................ 76
5.1 Introduction ................................................................................................................... 76
5.2 Properties Analysis ........................................................................................................ 77
Table 5-1 FAA Land Project Checklist ................................................................................. 78
Table 5-2 Properties Analysis by Priority ............................................................................ 79
Figure 5-1 Properties Analysis ........................................................................................ 80
5.3 Runway Protection Zone (RPZ) Properties Analysis .................................................... 81
Figure 5-2 RPZ Properties Analysis ................................................................................. 82
Figure 5-3 Part 77 Airspace Drawing .............................................................................. 83
5.4 Summary of Preferred Alternative ................................................................................ 84
Figure 5-4 Preferred Alternative ...................................................................................... 86
Figure 5-5 Preferred Alternative (South Development Area) ........................................ 87
5.5 Noise Contours .............................................................................................................. 88
Table 5-3 Noise Inputs (2015 & 2035) .............................................................................. 88
Figure 5-6 Noise Contours ............................................................................................... 89
5.6 Environmental Review .................................................................................................. 90
Table 5-4 Environmental Review of Preferred Alternative ................................................ 92
6.0 Implementation Plan ....................................................................................................... 93
6.1 Introduction ................................................................................................................... 93
6.2 Federal and State Funding Eligibility ........................................................................... 93
Table 6-1 Examples of Eligible vs. Ineligible AIP Projects ................................................. 94
6.3 Project Costs & Phasing ................................................................................................ 95
Table 6-2 Capital Improvement Program (2017-2035+) .................................................. 97
6.4 Airport Financial Structure ............................................................................................ 98
6.5 Cash Flow Analysis ........................................................................................................ 98
Table 6-3 Historical Revenues and Expenses (2015-2016) ............................................ 99
Table 6-4 Potential Cash Flow Analysis (2017-2022) .................................................... 100
7.0 Airport Layout Plan ........................................................................................................ 101
7.1 Introduction ................................................................................................................ 101
7.2 Title Sheet (Sheet 1) .................................................................................................. 101
7.3 Airport Data Sheet (Sheet 2) ..................................................................................... 102
7.4 Airport Layout Plan Drawing (Sheet 3) ...................................................................... 102
7.5 Airport Airspace Drawings (Sheets 4 and 5) ............................................................ 102
7.6 Inner Portion of the Approach Surface Drawings (Sheets 6 and 7) ........................ 103
7.7 Runway Departure Surface Drawing (Sheet 8) ........................................................ 103

Harry Clever Field Airport Master Plan Update
v
7.8 Terminal Area Drawing (Sheet 9) .............................................................................. 103
7.9 Land Use Drawing (Sheet 10) ................................................................................... 104
7.10 Airport Property Map (Sheet 11) ............................................................................ 104
Harry Clever Field Airport Master Plan Update
1
1.0 Inventory of Existing Conditions
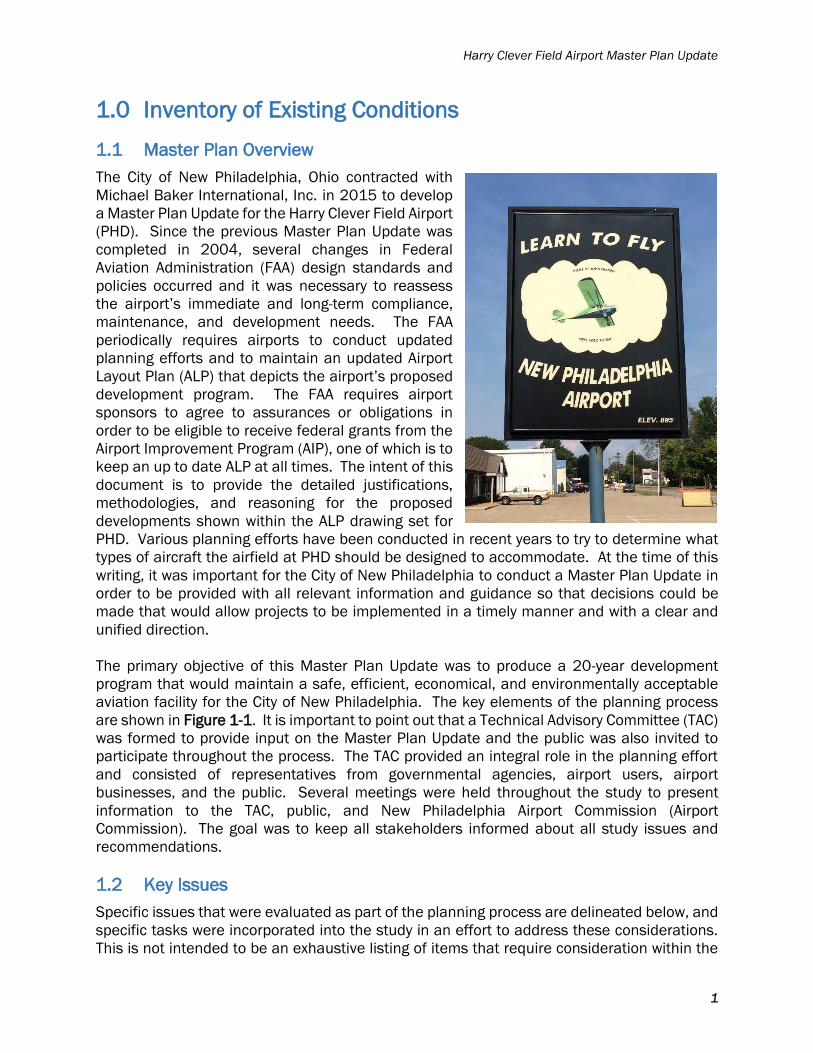
1.1 Master Plan Overview
The City of New Philadelphia, Ohio contracted with
Michael Baker International, Inc. in 2015 to develop
a Master Plan Update for the Harry Clever Field Airport
(PHD). Since the previous Master Plan Update was
completed in 2004, several changes in Federal
Aviation Administration (FAA) design standards and
policies occurred and it was necessary to reassess
the airport’s immediate and long-term compliance,
maintenance, and development needs. The FAA
periodically requires airports to conduct updated
planning efforts and to maintain an updated Airport
Layout Plan (ALP) that depicts the airport’s proposed
development program. The FAA requires airport
sponsors to agree to assurances or obligations in
order to be eligible to receive federal grants from the
Airport Improvement Program (AIP), one of which is to
keep an up to date ALP at all times. The intent of this
document is to provide the detailed justifications,
methodologies, and reasoning for the proposed
developments shown within the ALP drawing set for
PHD. Various planning efforts have been conducted in recent years to try to determine what
types of aircraft the airfield at PHD should be designed to accommodate. At the time of this
writing, it was important for the City of New Philadelphia to conduct a Master Plan Update in
order to be provided with all relevant information and guidance so that decisions could be
made that would allow projects to be implemented in a timely manner and with a clear and
unified direction.
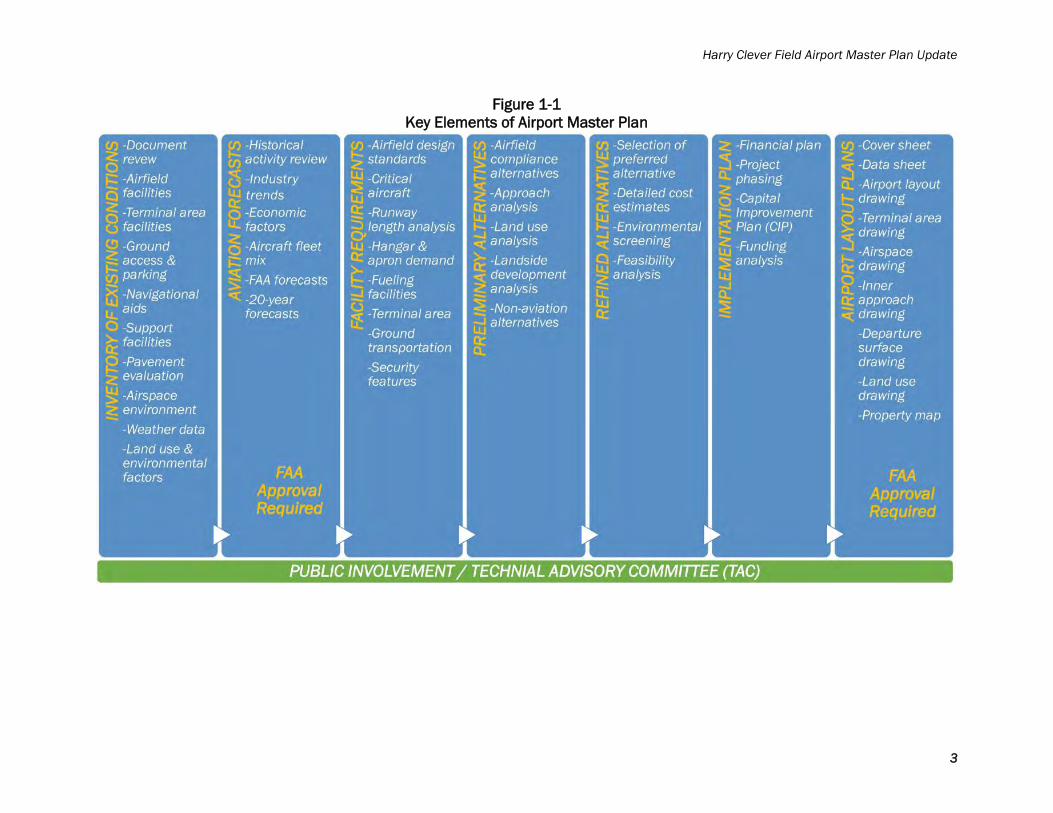
The primary objective of this Master Plan Update was to produce a 20-year development
program that would maintain a safe, efficient, economical, and environmentally acceptable
aviation facility for the City of New Philadelphia. The key elements of the planning process
are shown in Figure 1-1. It is important to point out that a Technical Advisory Committee (TAC)
was formed to provide input on the Master Plan Update and the public was also invited to
participate throughout the process. The TAC provided an integral role in the planning effort
and consisted of representatives from governmental agencies, airport users, airport
businesses, and the public. Several meetings were held throughout the study to present
information to the TAC, public, and New Philadelphia Airport Commission (Airport
Commission). The goal was to keep all stakeholders informed about all study issues and
recommendations.
1.2 Key Issues
Specific issues that were evaluated as part of the planning process are delineated below, and
specific tasks were incorporated into the study in an effort to address these considerations.
This is not intended to be an exhaustive listing of items that require consideration within the

Harry Clever Field Airport Master Plan Update
2
study, but rather identifies major concerns or issues that should be addressed in support of
the City of New Philadelphia’s long-term goals for PHD.
• Assess the operational efficiency, effectiveness, and safety of the airport.
• Evaluate the airport facility layout for conformance with FAA guidance and regulations.
This includes some of the non-compliant features such as the Runway Safety Areas
(RSAs) and Runway Protection Zones (RPZs).
• Evaluate and incorporate the aviation needs of both the community and users.
• Assess the needs of current tenants and requirements identify what may be necessary
to attract new tenants and/or to expand facilities. For example, a medical flight
organization recently left PHD. The Master Plan Update evaluates the needs of such
organizations in terms of services and facilities that are offered at the airport.
• Assist the airport in supporting aviation demand within the region. PHD is located in
an area where natural gas exploration and mining is growing and many airports are
experiencing operational growth from the businesses that support that activity. Those
types of trends are considered as part of the planning effort.
• Identify existing and alternative funding sources for airport development.
• Identify areas of environmental concern and provide mitigation options for future
development. Because the airport is surrounded by historic sites, cemeteries,
residential development, and roads, it will be necessary to fully understand the impacts
associated with development proposals.
• Evaluate long-term development options for general aviation and airport support
facilities.
• Review the airport’s existing and ultimate runway length requirements to identify any
improvements necessary to meet demand and/or to entice additional traffic to the
airport in the future.
• Identify vertical obstructions and investigate the associated impacts and/or mitigation
options. Furthermore, determine if local land use controls need to be implemented or
revised to protect the airspace around PHD.
• Focus on building a consensus regarding the future development of PHD so that critical
projects can move forward in a timely manner.
The remaining sections of this chapter present the inventory of existing conditions for PHD.
Harry Clever Field Airport Master Plan Update
3
Figure 1-1
Key Elements of Airport Master Plan

Harry Clever Field Airport Master Plan Update
4
1.3 Airport Location, Ground Access, and Parking
The airport is located in and owned by the City of New Philadelphia, Ohio. As shown in Figure
1-2, PHD is located to the southeast of downtown New Philadelphia along East High Avenue.
Many of the airport’s landside facilities (e.g., hangars) have paved automobile parking areas
that are adjacent to East High Avenue. Some airport tenants also park their automobiles at
their respective hangar facility (e.g., at the T-hangars located off of Delaware Drive Southeast
and the southernmost hangars located along East High Avenue). U.S. Interstate 77 is less
than four miles to the west of PHD, which runs from Columbia, South Carolina to the south to
Cleveland, Ohio to the north. From U.S. Interstate 77, PHD can either be accessed by
travelling through city streets (West High Avenue to East High Avenue) or by taking U.S. Route
250 which primarily runs to the south of the Tuscarawas River. By car, PHD is located
approximately 1.5 hours
south of Cleveland and
less than one hour south
of Akron. The airport is
also less than a two hour
drive from both Columbus
and Pittsburgh. New
Philadelphia is the county
seat for Tuscarawas
County. Within the county,
PHD is the only public use
airport and the only airport
with a paved runway (refer
to Figure 1-3).
1.4 Airport Management Structure
As the airport owner/sponsor, it is the City of New Philadelphia’s responsibility to determine
the ultimate recommendations and long-term development objectives for PHD. Therefore, city
council has the ultimate approval authority for the airport. The New Philadelphia Airport
Commission (Commission) consists of appointed members, meets the
second Tuesday of each month, and serves in an advisory capacity to
city council (i.e., many of the Commission’s recommendations must be
approved by city council). At the time of this writing, the designated
airport manager worked for the privately-owned Fixed Base Operator
(FBO) at PHD. The airport manager reports to city staff and handles
the day-to-day operations at the airport. Maintenance of the airport
property and facilities is provided by city staff and authorized
contractors.
Terminal Building along East High Avenue Source: Google Earth.

Harry Clever Field Airport
Figure 1-2 Location / Vicinity Map
Tuscarawas County, Ohio
PHD
INTE
RSTA
TE 7
7
4TH
ST N
W
N BR
OADW
AY S
TBEAVER AVE NE
E HIGH AVE
250
250
S BR
OAD
WAY
ST
TUSCARAWAS AVE NW
W HIGH AVE
N
Not toScale
New Philadelphia

PHD
45OI10G
BJJCAK
TSO
8G6
6G5CDIZZV
I4O57OH
3OH8OA14
Summit
Wayne
Carroll
Harrison
Holmes
Coshocton
Muskingum
GuernseyBelmont
Tuscarawas
Stark
LegendTuscarawas County
Harry Clever Field Airport
Figure 1-3 Surrounding Airports
Surrounding Counties PHDPublic AirportPrivate AirportCommercial Airport
Airport Code Airport Name Longest Runway Surface Type Use Drive Time From PHD NM Distance From PHDPHD Harry Clever Field 3,951' Asphalt Public N/A N/AOA14 Roxford 2,300' Turf Private 15 Minutes 5.5 SE3OH8 Gnadenhutten 2,300' Turf Private 18 Minutes 6.6 S57OH Fillmans Farms Field 2,300' Turf Private 25 Minutes 8.7 S45OI Plane Country 2,100' Turf Private 26 Minutes 7.9 NWTSO Carroll County-Tolson 4,300' Asphalt Public 44 Minutes 16.5 EI40 Richard Downing 5,001' Asphalt Public 46 Minutes 22.0 SWCAK Akron-Canton Regional 8,204' Asphalt Public 53 Minutes 26.7 N8G6 Harrison County 4,154' Asphalt Public 57 Minutes 23.2 SE10G Holmes County 4,400' Asphalt Public 61 Minutes 24.8 WBJJ Wayne County 5,189' Asphalt Public 69 Minutes 32.3 NWCDI Cambridge Municipal 4,298' Asphalt Public 74 Minutes 30.6 S6G5 Barnesville-Bradfield 4,004' Asphalt Public 74 Minutes 29.9 SZZV Zanesville Municipal 5,000' Asphalt Public 79 Minutes 38.2 SW
Ohio Key Map
N
Not toScale

Harry Clever Field Airport Master Plan Update
7
1.5 Airport History
Although initial discussions about an airport in New Philadelphia began in 1927 to fulfill the
need for airmail service between New York, Cleveland, and Chicago, construction was
completed in 1929 in a hayfield near the Historic Schoenbrunn Village. The list below
identifies various historical events pertaining to PHD as determined from the 2004 Master
Plan Update, newspaper articles, and information provided by the City of New Philadelphia:
• In 1929, a flying club leased farmland to begin
construction of the airport (referred to as
Schoenbrunn Field at the time).
• The airport was originally constructed with two
turf runways: a 2,200 foot long east-west
runway and a 1,600 foot long north-south
runway.
• Also in 1929, Harry Clever was named the field
superintendent and mail delivery began.
• Passenger service also began in 1929.
• In the 1930s, the airport held an airshow for
the local community.
• In 1934, the City of New Philadelphia took over
the airport lease and constructed a
maintenance hangar.
• During World War II, the airport established a
civilian pilot training program to meet the
growing demands for new pilots. One of the
students to enroll in the program was John
Glenn (the first American to orbit the Earth).
• After World War II, the city constructed a 3,950
foot long paved runway with lights.
• In 1953, Lake Central Airlines began service
and continued for eight years.
• In 1969, the airport was renamed Harry Clever Field.
• In 1972, the New Philadelphia Airport Commission was created.
• Today, the airport serves the general aviation needs of New Philadelphia and
Tuscarawas County with a two-runway airfield configuration.
1.6 Previous Studies for PHD
A diverse history of planning efforts have been conducted to evaluate the long-term
development objectives for PHD. Some studies have recommended an airfield configuration
that would primarily accommodate small piston-powered aircraft and others have
recommended a configuration that would be more capable of accommodating small corporate
aircraft. The 2004 Master Plan Update recommended a complete realignment and extension
of the runway to a length of 4,400 feet in order to better accommodate larger corporate
aircraft traffic and to comply with FAA airfield design standards. That project would
necessitate the acquisition of several properties around the airport, road relocations, and
Harry Clever Field Airport Master Plan Update
8
potential grave relocations. Since the 2004 Master Plan Update was completed, additional
planning efforts have been completed that suggest that the airport should remain in its
current alignment. Today, several paved surfaces at PHD are in need of maintenance. A key
purpose of this Master Plan Update was to develop a detailed capital improvement program
that would allow critical projects to be conducted in a timely manner, thereby improving the
safety, efficiency, and appeal of the airport for existing and potential users.
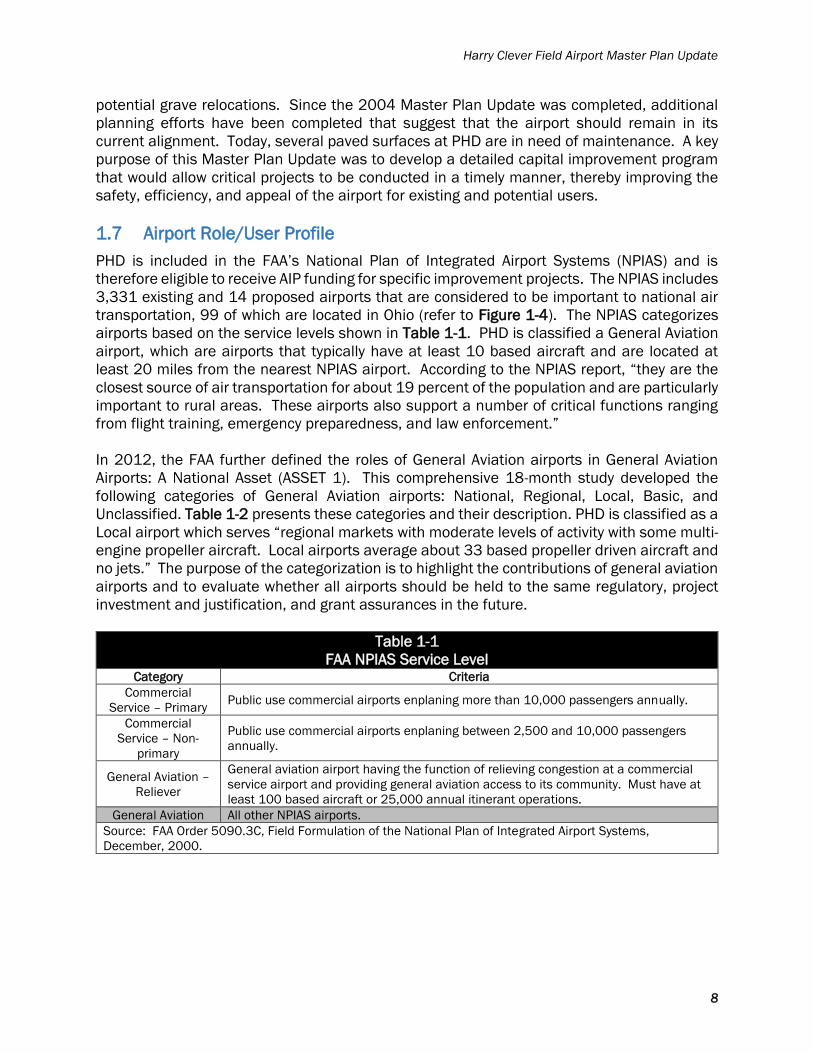
1.7 Airport Role/User Profile
PHD is included in the FAA’s National Plan of Integrated Airport Systems (NPIAS) and is
therefore eligible to receive AIP funding for specific improvement projects. The NPIAS includes
3,331 existing and 14 proposed airports that are considered to be important to national air
transportation, 99 of which are located in Ohio (refer to Figure 1-4). The NPIAS categorizes
airports based on the service levels shown in Table 1-1. PHD is classified a General Aviation
airport, which are airports that typically have at least 10 based aircraft and are located at
least 20 miles from the nearest NPIAS airport. According to the NPIAS report, “they are the
closest source of air transportation for about 19 percent of the population and are particularly
important to rural areas. These airports also support a number of critical functions ranging
from flight training, emergency preparedness, and law enforcement.”
In 2012, the FAA further defined the roles of General Aviation airports in General Aviation
Airports: A National Asset (ASSET 1). This comprehensive 18-month study developed the
following categories of General Aviation airports: National, Regional, Local, Basic, and
Unclassified. Table 1-2 presents these categories and their description. PHD is classified as a
Local airport which serves “regional markets with moderate levels of activity with some multi-
engine propeller aircraft. Local airports average about 33 based propeller driven aircraft and
no jets.” The purpose of the categorization is to highlight the contributions of general aviation
airports and to evaluate whether all airports should be held to the same regulatory, project
investment and justification, and grant assurances in the future.
Table 1-1
FAA NPIAS Service Level Category Criteria
Commercial
Service – Primary Public use commercial airports enplaning more than 10,000 passengers annually.
Commercial
Service – Non-
primary
Public use commercial airports enplaning between 2,500 and 10,000 passengers
annually.
General Aviation –
Reliever
General aviation airport having the function of relieving congestion at a commercial
service airport and providing general aviation access to its community. Must have at
least 100 based aircraft or 25,000 annual itinerant operations.
General Aviation All other NPIAS airports.
Source: FAA Order 5090.3C, Field Formulation of the National Plan of Integrated Airport Systems,
December, 2000.

Harry Clever Field Airport Master Plan Update
9
Table 1-2
FAA ASSET 1 Categories Category Criteria
National
Serves national – global markets with very high levels of activity with many jets and multi-
engine propeller aircraft. National airports average about 200 total based aircraft, including
30 jets.
Regional
Serves regional – national markets with high levels of activity with some jets and multi-
engine propeller aircraft. Regional airports average about 90 total based aircraft, including 3
jets.
Local Serves local – regional markets with moderate levels of activity with some multi-engine
propeller aircraft. Local airports average about 33 based propeller driven aircraft and no jets.
Basic Often serves critical aeronautical functions within local and regional markets with moderate
to low levels of activity. Basic airports average about 10 propeller-driven aircraft and no jets.
Unclassified Airports that do not fit into any other category.
Source: General Aviation Airports: A National Asset, May, 2012.
As shown in Table 1-3, the 2014 Ohio Airports Focus Study (OH Focus Study) also assigns
specific classifications to the airports in the state and has a goal of Optimizing Investment in
a Diverse Airport System. PHD is classified as a General Aviation Level 2 airport that “meets
the needs of smaller corporate aircraft.” The OH Focus Study identifies specific facility
requirements for each of the airport categories and also describes services that should be
available at the airports, which are evaluated later in this Master Plan Update as part of the
facility requirements. This discussion has revealed that the FAA and state each categorize
PHD in different ways that may suggest different facility design requirements, which has also
been identified through previous planning efforts. This Master Plan Update was conducted to
reassess the role of PHD and to provide a clear direction moving forward. For comparative
purposes, Figure 1-3 summarizes the characteristics of airports located in the counties
adjacent to Tuscarawas County.
Table 1-3
Ohio Airports Focus Study Classifications Category Criteria
Air Carrier Support commercial airline activities.
Level 1 Meet the needs of nearly all GA corporate jet traffic.
Level 2 Meet the needs of smaller corporate aircraft.
Level 3 Serves light SEP and MEP for business, recreation, and training.
Level 4 Serves small GA pistons and requires basic support facilities and services.
Source: 2014 Ohio Airports Focus Study.
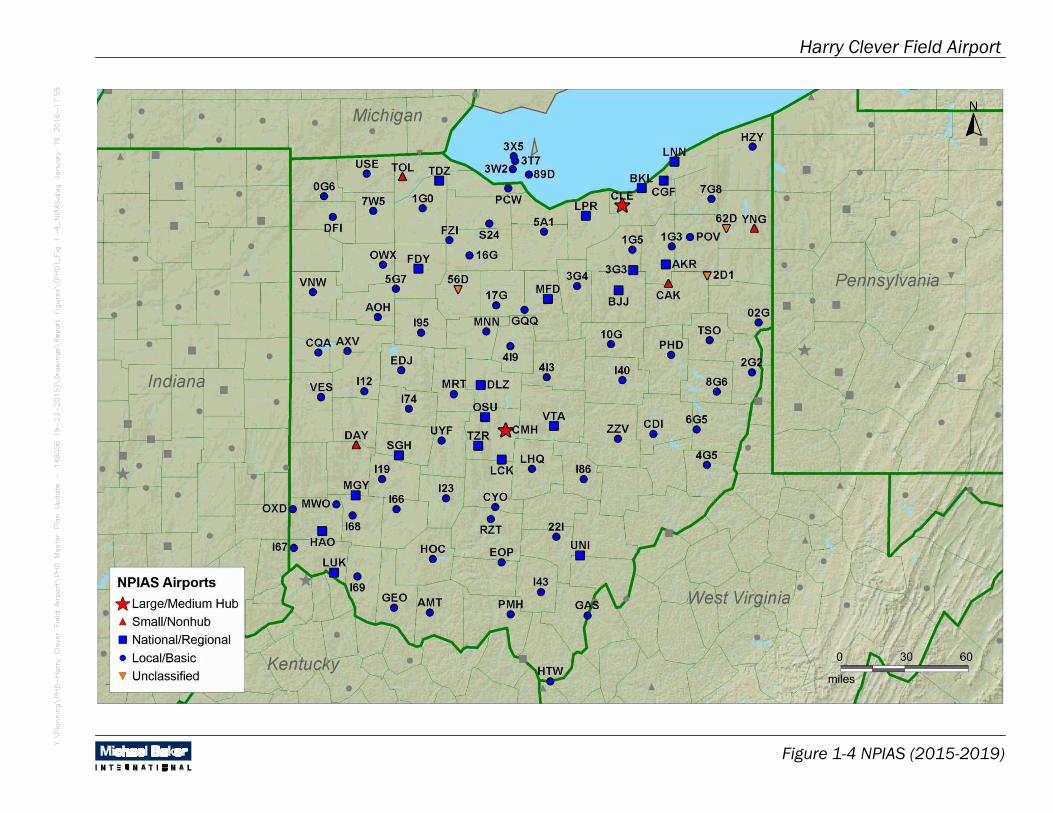
Figure 1-4 NPIAS (2015-2019)
Harry Clever Field Airport
Harry Clever Field Airport Master Plan Update
11
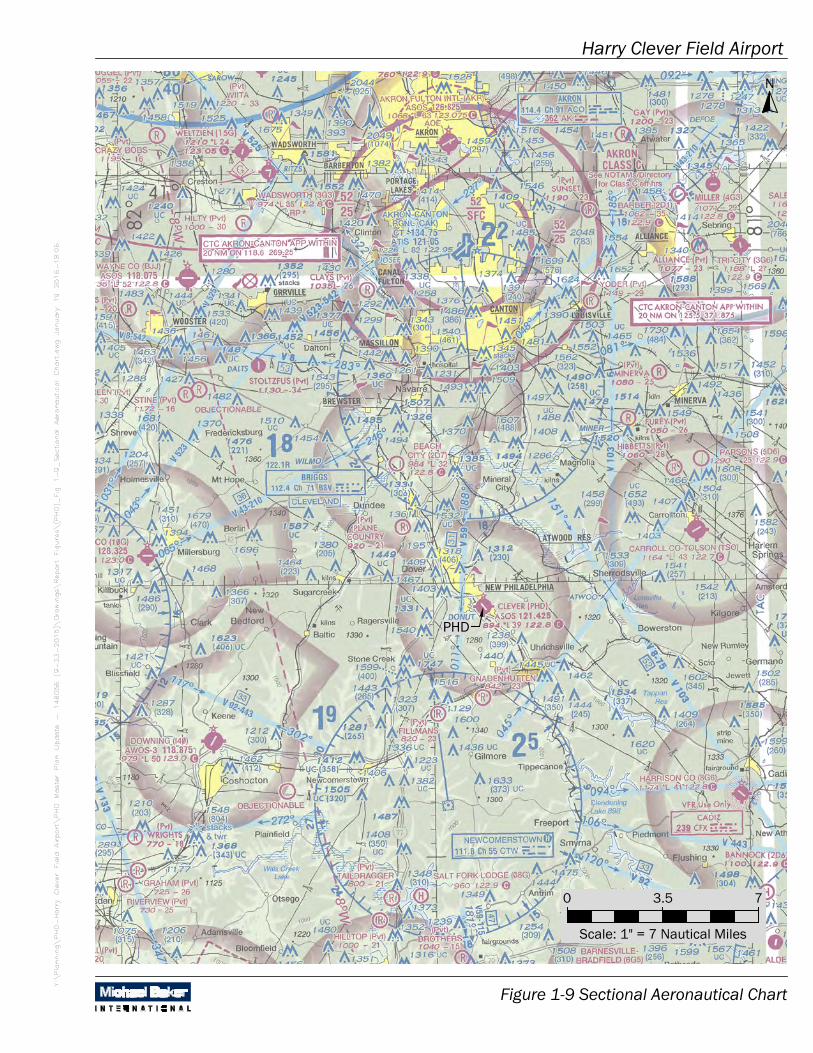
1.8 Airfield Overview
At PHD, the airfield consists of the two runways, taxiways, and their associated markings and
lighting features. As illustrated in Figure 1-5, Runway 14-32 is the primary runway at PHD and
consists of a paved asphalt surface measuring 3,951 feet in length and 100 feet in width.
There is a 330 foot long displaced threshold on the west end of the runway which is unusable
for landings on Runway 14. Both ends of Runway 14-32 have non-precision markings and
there are Medium Intensity Runway Lights (MIRLs) along the edges of the runway. Parallel
Taxiway A runs along the north side of Runway 14-32 and provides access to the terminal
apron and most of the aircraft hangars at PHD. Taxiway B branches directly off of Runway 14-
32 and provides access to the T-hangars on the south side of the airport. Runway 11-29 is
the turf runway at PHD and measures 1,907 feet in length and 70 feet in width. Figure 1-6
documents the approximate conditions of the paved surfaces at PHD along with the date of
the last project that was conducted for each surface, all of which will be reevaluated as part
of this planning effort. Figure 1-7 provides some of the detailed information pertaining to the
airport and runways such as coordinates, elevations, pavement strengths, and wind coverage
percentages. The rotating beacon is located approximately 1,935 north of the runway
centerline.
Note: During the development of this Master Plan Update, the need to renumber the runways
to Runways 15-33 and 12-30 was identified due to changes in the magnetic headings over
the years. As a result, the runways were renumbered near the end of the planning process.
That change is reflected as an existing condition within the ALP drawing set, but no changes
to the study text and graphics were conducted because they were developed prior to the
implementation of the renumbering project.
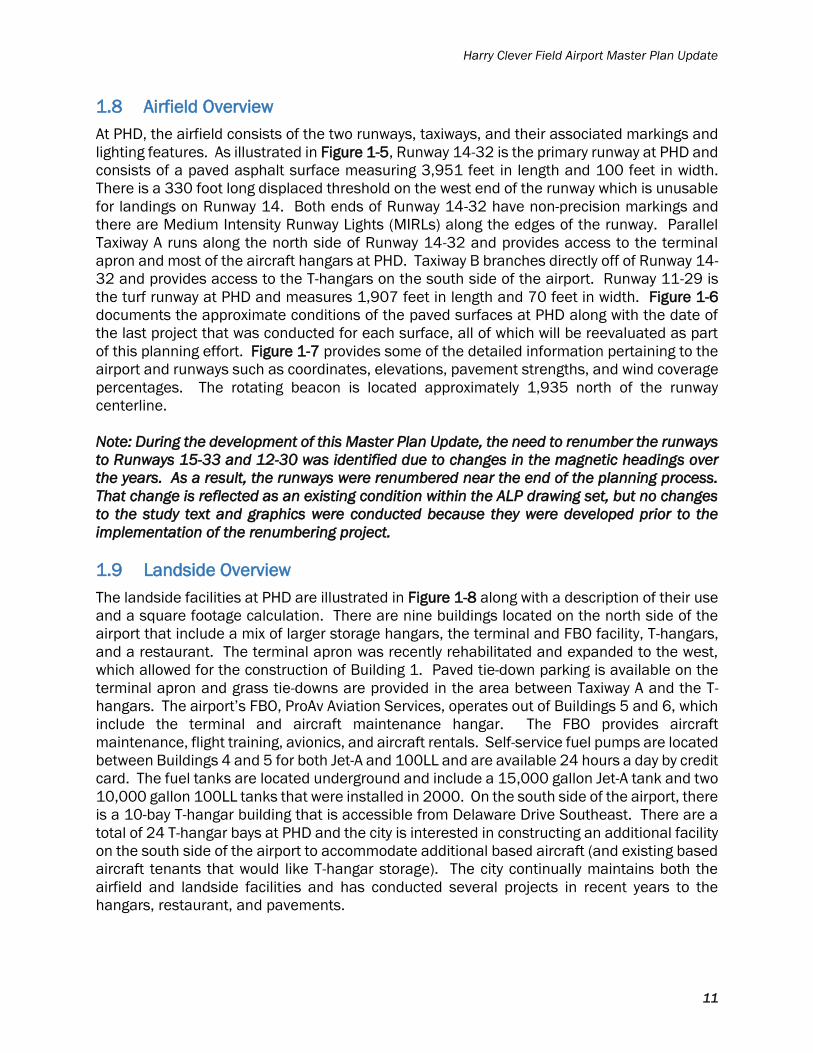
1.9 Landside Overview
The landside facilities at PHD are illustrated in Figure 1-8 along with a description of their use
and a square footage calculation. There are nine buildings located on the north side of the
airport that include a mix of larger storage hangars, the terminal and FBO facility, T-hangars,
and a restaurant. The terminal apron was recently rehabilitated and expanded to the west,
which allowed for the construction of Building 1. Paved tie-down parking is available on the
terminal apron and grass tie-downs are provided in the area between Taxiway A and the T-
hangars. The airport’s FBO, ProAv Aviation Services, operates out of Buildings 5 and 6, which
include the terminal and aircraft maintenance hangar. The FBO provides aircraft
maintenance, flight training, avionics, and aircraft rentals. Self-service fuel pumps are located
between Buildings 4 and 5 for both Jet-A and 100LL and are available 24 hours a day by credit
card. The fuel tanks are located underground and include a 15,000 gallon Jet-A tank and two
10,000 gallon 100LL tanks that were installed in 2000. On the south side of the airport, there
is a 10-bay T-hangar building that is accessible from Delaware Drive Southeast. There are a
total of 24 T-hangar bays at PHD and the city is interested in constructing an additional facility
on the south side of the airport to accommodate additional based aircraft (and existing based
aircraft tenants that would like T-hangar storage). The city continually maintains both the
airfield and landside facilities and has conducted several projects in recent years to the
hangars, restaurant, and pavements.

Delaware Drive SE
1 2 3 4 7 8 96
10
E High Avenue
Univers
ity D
rive N
E
Skinner Drive SE
US 250
E High Avenue
Delaware Drive SE
Delaware Drive SE
5
Fuel Pumps
EvergreenBurial Park
Airport Beacon≈ 1,935' FromRunway Centerline
Terminal Apron
Runway 14-32 (3,951' x 100')
PAPI-4 (Typ.)
REIL (Typ.)
ASOS
Lighted Wind ConeWind Tee
Segmented Circle
CalvaryCemetery
SchoenbrunnVillage
TWY A TWY ATWY D
TWY B
TWY B TWY C
ASOS ClearanceArea 500' Radius
Exist. Runway 11-29 (1,907' x 7
0')
East AvenueCemetery
R.J. Corman Railroad
330'
11
29
State Of Ohio PropertyLeased To City
Harry Clever Field Airport
Figure 1-5 Existing Facilities
Scale: 1" = 450 Feet
0 450' 900'0
N
Building ID Description1 Hangar2 Hangar3 Hangar4 Restaurant5 Terminal / FBO6 Hangar7 T-Hangar (14-Unit)8 Hangar9 Hangar
10 T-Hangar (10-Unit)
LegendProperty LineNavigational AidsBuildings

11
29
32
14
State Of Ohio PropertyLeased To City
Property Line
Harry Clever Field Airport
Figure 1-6 Pavement Conditions Index (PCI)
Scale: 1" = 450 Feet
0 450' 900'0
PCI Legend (Estimated)Good-Preventative MaintenanceSatisfactory-Preventative MaintenanceFair-Preventative Maintenance/Overlay
N
Poor-Overlay/ReconstructiveVery Poor-ReconstructiveSerious-ReconstructiveFailed-Reconstructive
100-8685-7170-5655-4140-2625-1110-0
Note: The PCI values indicated were obtainedfrom an inspection report dated 12/27/2016.

Delaware Drive SE
Terminal Apron
11
29
Property Line
State Of OhioProperty Leased To City
Harry Clever Field Airport
Figure 1-7 Existing Airport-Runway Information
N
Key Map
RUNWAY DATA TABLERUNWAY 11-29 RUNWAY 14-32
RUNWAY LENGTH 1,907' 3,951' RUNWAY WIDTH 70' 100'
RUNWAY WIND COVERAGE % (ALL WEATHER): 10.5KTS / 12MPH 98.39% 98.98% 13KTS / 15MPH 99.32% 99.54% 16KTS / 18MPH 99.92% 99.92% 20KTS / 23MPH 99.99% 99.99%
RUNWAY LIGHTING N/A MIRL PAVEMENT STRENGTH:
SINGLE WHEEL GEAR (LBS) N/A 52.5 DUAL WHEEL GEAR (LBS) N/A 67.5
DUAL TANDEM WHEEL GEAR (LBS) N/A 140.0 SURFACE COMPOSITION TURF ASPHALT VISIBILITY MINIMUMS VISUAL / VISUAL 1-MILE / VISUAL
RUNWAY 11 RUNWAY 29 RUNWAY 14 RUNWAY 32 RUNWAY END COORDINATES:
LATITUDE (NAD 83) 40° 28' 09.9427" 40° 28' 04.0341" 40° 28' 30.0514" 40° 28' 00.4602" LONGITUDE (NAD 83) 81° 25' 24.7218 " 81° 25' 01.5849" 81° 25' 27.7590" 81° 24' 54.4299"
RUNWAY END ELEVATION (NAVD 88) 891.1' 886.0' 894.4' 886.1' RUNWAY MARKINGS N/A N/A NON-PRECISION NON-PRECISION
VISUAL AND INSTRUMENT NAVAIDS NONE NONE PAPI-4, REIL PAPI-4, REIL DISPLACED THRESHOLD ELEVATION N/A N/A 894.1' N/A DISPLACED THRESHOLD DISTANCE N/A N/A 330' N/A
AIRPORT DATA TABLEDESCRIPTION EXISTING FUTURE
SERVICE LEVEL (NPIAS) GENERAL AVIATION SAMESTATE EQUIVALENT SERVICE ROLE LEVEL 2 GENERAL AVIATION SAMEAIRPORT REFERENCE CODE (ARC) B-I (SMALL AIRCRAFT) SAME
CRITICAL AIRCRAFT BEECHCRAFT BARON 58 SAMEAIRPORT ELEVATION (AMSL) (NAVD88) 894.6' SAMEMEAN MAX. TEMP. (HOTTEST MONTH) 83.4° (JULY) SAMEAIRPORT REFERENCE POINT (NAD 83)
LATITUDE 40°28' 11.73" SAMELONGITUDE 81°25' 10.83" SAME
MAGNETIC DECLINATION 8°19' W ± 0° 22' (JUNE 2017) 0°2' W PER YEARAIRPORT NAVIGATIONAL AIDS BEACON SAMEMISCELLANEOUS FACILITIES AIRFIELD LIGHTING, LIGHTED WIND CONE, ASOS SAME
Delaware Drive SE
Terminal Apron
10
1
11
29
2 3 4 5 6 7 8 9Fuel Pumps
Property Line
State OfOhio PropertyLeased To City
Harry Clever Field Airport
Figure 1-8 Existing Building Information
Building ID Description1 Hangar2 Hangar3 Hangar4 Restaurant5 Terminal / FBO6 Hangar7 T-Hangar (14-Unit)8 Hangar9 Hangar
10 T-Hangar (10-Unit)
N
Key Map
Building 8 Building 9 Building 10
Building 7
Building 7
Building 5 Building 6
Building 3 Building 4Building 1 Building 2

Harry Clever Field Airport Master Plan Update
16
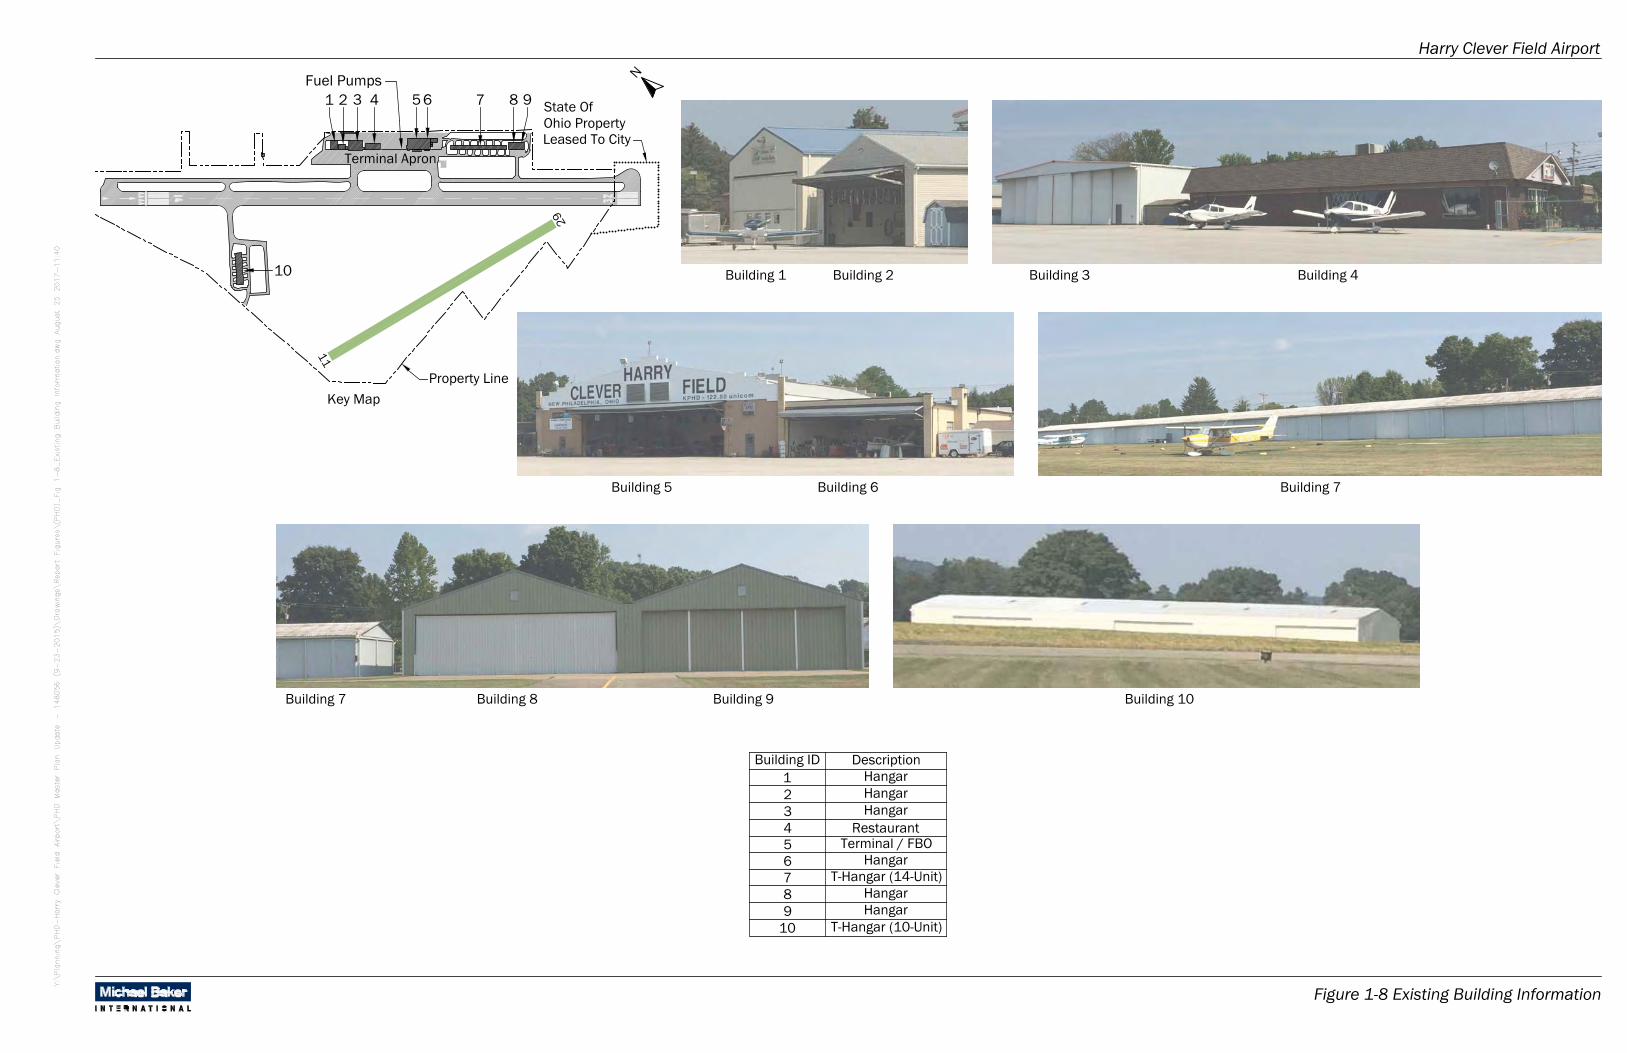
1.10 Airspace Environment
As shown in Figure 1-9, The airport is surrounded by Class G uncontrolled airspace which
extends from the surface up to but not including 1,200 feet Above Ground Level (AGL). Class
E controlled airspace is located above the Class G airspace and extends up to not including
18,000 feet Above Mean Sea Level (AMSL). Within Class G airspace and Class E airspace,
there are no requirements for notifying Air Traffic Control (ATC) when aircraft are flying under
Visual Flight Rule (VFR) conditions. However, aircraft flying Instrument Flight Rule (IFR)
approaches and departures at PHD must contact Akron-Canton Approach/Departure Control
for clearance. When Akron-Canton Approach/Departure Control is closed, aircraft must
receive clearance from the Cleveland Air Route Traffic Control Center (ARTCC).
1.11 Instrument Approaches and Navigational Aids
Runway 14 is the only runway end with published instrument approach procedures at PHD.
There are two non-precision straight-in approaches published to Runway 14 that provide
horizontal guidance to aircraft via satellite-based Global Positioning System (GPS) equipment.
Those approaches can be flown when horizontal visibility minimums are as low as one mile.
Both ends of Runway 14-32 are supported by four-light Precision Approach Path Indicators
(PAPI-4) and Runway End Identifier Lights (REILs). The PAPIs provide visual approach slope
guidance to the pilot and the REILs help identify the runway ends and are particularly
beneficial during poor visibility conditions and for the circling approaches. The approach to
Runway 32 as well as the approaches to both ends of turf Runway 11-29 are visual only. A
summary of the approach procedures at PHD is provided in Table 1-4.
Table 1-4
PHD Approach Procedures Runway Approach Type Horizontal Minimums Vertical Minimums
Runway 14 LP MDA 1 Mile 1,580’
Runway 14 LNAV MDA 1 Mile 1,640’
Runway 14 Circling 1 Mile 1,640’
Runway 32 Visual Visual Visual
Runway 11 Visual Visual Visual
Runway 29 Visual Visual Visual
Circling Circling VOR-A 1 ¼ Miles 1,720’
Source: U.S. Terminal Procedures Publication (TPP), effective January 7, 2016 to February 4, 2016.
Harry Clever Field Airport
Figure 1-9 Sectional Aeronautical Chart
PHD
Scale: 1" = 7 Nautical Miles
0 3.5 7

Harry Clever Field Airport Master Plan Update
18
1.12 Historical Weather Conditions
Local weather conditions have the ability to affect aircraft activity and runway utilization.
Runways are ideally positioned in the direction of prevailing winds to maximize wind coverage
for aircraft operations. PHD is equipped with an Automated Surface Observing System (ASOS)
which monitors surface weather conditions (wind direction and speed, precipitation, visibility,
etc.) and digitally relays the information to pilots. For visual reference from the air, the airport
also has a lighted wind cone and a wind tee that are located within a segmented circle
between the two runways. According to historical information from the National Oceanic and
Atmospheric Administration (NOAA), on average in New Philadelphia, the warmest month is
July with an average high of 83.4° Fahrenheit and the coolest month is January with an
average low of 20.9° Fahrenheit (refer to Table 1-5 and Figure 1-10). The most precipitation
typically occurs during the month of May. A detailed assessment of wind patterns is presented
as part of the facility requirements.
Table 1-5
Average Temperature & Precipitation Normals (PHD ASOS) Variable JAN FEB MAR APR MAY JUN JUL AUG SEP OCT NOV DEC
Low Temp (° F) 20.9 22.2 28.9 38.6 47.7 57.0 61.5 59.9 52.2 40.7 33.3 24.5
High Temp (° F) 37.4 41.0 50.9 63.2 72.1 80.2 83.4 82.7 75.8 64.5 52.8 40.8
Precipitation (In.) 2.60 2.36 3.04 3.43 4.17 3.73 4.03 3.59 3.26 2.75 3.27 2.67
Source: NOAA climate normals generated from the average of PHD ASOS records from 1981 to 2010.
Figure 1-10
Average Temperature (° F) Normals (PHD ASOS)
Source: NOAA climate normal generated from the average of PHD ASOS records from 1981 to 2010.
20
.9
22
.2
28
.9
38
.6
47
.7
57
.0 61
.5
59
.9
52
.2
40
.7
33
.3
24
.5
37
.4 41
.0
50
.9
63
.2
72
.1
80
.2 83
.4
82
.7
75
.8
64
.5
52
.8
40
.8
J A N F E B M A R A P R M A Y J U N J U L A U G S E P O C T N O V D E C

Harry Clever Field Airport Master Plan Update
19
1.13 Land Use Considerations
The following section identifies baseline information related to existing land uses in the vicinity
of PHD. Tuscarawas County is vastly made up of forestland, with the exception of some
residential settlements throughout the county. Land uses within and surrounding PHD’s
property consists of transportation-related infrastructure, commercial and industrial
developments, residential, agricultural, undeveloped land, and wetlands. As shown in Figure
1-11, sensitive features around the airport include cemeteries to the west and south (East
Avenue Cemetery, Evergreen Burial Park, and Cavalry Cemetery), a historic site to south
(Shoenbrunn Village), public roads, and residential development.
The current land use policy for properties in the vicinity of PHD is defined in Codified
Ordinances of the City of New Philadelphia. Height restrictions are necessary to ensure
objects will not impair with flight safety and are required to protect airspace in the State of
Ohio. Within the city, buildings located within residential districts are not permitted to exceed
a height of 45 feet above grade and buildings within the Central Business District may not
exceed 60 feet. However, the city ordinance does not have specific height restrictions related
to the airport. Therefore, a key recommendation of this Master Plan Update is for the City of
New Philadelphia to adopt zoning regulations to protect the airspace surrounding PHD in
accordance with Ohio law and Federal Aviation Regulation (FAR) Part 77, Safe, Efficient Use,
and Preservation of the Navigable Airspace.
1.14 Land Holdings
As part of this Master Plan Update, an Exhibit ‘A’ Airport Property Inventory Map was developed
in accordance with FAA Standard Operating Procedure (SOP) 3.00, SOP for FAA Review of
Exhibit ‘A’ Airport Property Inventory Maps. The detailed Exhibit ‘A’ identifies all past, current,
and proposed land holdings associated with the airport. As shown in Figure 1-11, the airport
facilities are located on a combination of land owned by the City of New Philadelphia (95.4
acres) and leased property owned by the State of Ohio (4.1 acres). Future property acquisition
may be needed to bring the airport into compliance with FAA design standards and to improve
the airport’s compatibility with surrounding land uses.

Delaware Drive SE
E High Avenue
Univers
ity D
rive N
E
Skinner Drive SE
Delaware Drive SE
US 250
E High Avenue
Delaware Drive SE
Delaware Drive SE
Schoenbrunn Village(Listed on the National Register
of Historic Places)
Beaverdam Creek
Mount View Park
Tuscarawas River
EvergreenBurial Park
CalvaryCemetery
East AvenueCemetery
R.J. Corman Railroad
11
29
State Of OhioProperty Leased ToCity (4.1 Acres)(95.4 Acres)
Harry Clever Field Airport
Figure 1-11 Surrounding Land Uses
Scale: 1" = 450 Feet
0 450' 900'0
LegendProperty LineWetlandsCemetery
N

Harry Clever Field Airport Master Plan Update
21
2.0 Aviation Activity Forecasts
This aviation forecasting effort was conducted in 2015 as a component of the Master Plan
Update for the Harry Clever Field Airport (PHD). The forecasts were developed based on the
most recent information available at the time and are utilized in later sections of this study to
determine immediate and long-term facility requirements and to identify the justification for
various development alternatives and recommendations. The forecasts are presented over a
20-year planning period that extends from 2015 through 2035. This is the first detailed
forecasting effort that has been conducted for PHD since the previous Master Plan Update
was completed in 2004. At that time, there was a jet based at the airport, and as discussed
in this chapter, the aviation climate throughout the country had not yet been impacted by
events such as Hurricane Katrina in 2005 and the economic recession of the late 2000s.
Those types of events and other local factors have the potential to affect the activity that is
experienced at airports over time and are explored as part of this forecasting effort to illustrate
how they can both negatively and positively influence aviation activity.
• Forecasting Limitations
• Historical and Current Aviation Activity
• Factors and Opportunities Affecting Activity Levels
• Based Aircraft Forecasts
• Operations Forecast
• Instrument Operations Forecast
• Peak Activity Forecasts
• Identification of Critical Aircraft
• Forecast Summary
2.1 Forecasting Limitations
Forecasting aviation activity is a complex process that considers a multitude of factors, both
controllable and beyond an airport’s control. Forecasts are not to be construed with
predictions of the future, but rather an educated guess of future activity based on a variety of
predictors, calculations, assumptions, and subjective judgment. The accuracy of the
estimates decline as the planning term is extended, potentially as a result of unforeseen local
or geo-political events, natural disasters, and/or climatological events.
The FAA’s forecast approval process typically constitutes an approval for planning purposes
only, which allows the airport sponsor to depict projects that are consistent with the long-term
growth expectations on the Airport Layout Plan (ALP). In most cases, prior to issuing a grant,
the FAA will require updated information demonstrating that a proposed project is justified by
activity at the time, or by activity that would directly result from the implementation of the
proposed project. This policy helps to ensure that funding is directed towards critical projects
throughout the U.S.

Harry Clever Field Airport Master Plan Update
22
2.2 Historical and Current Aviation Activity
Many elements compose the broad definition of general aviation activity. In simplest terms,
general aviation includes all segments of the aviation industry except those conducted by
scheduled air carriers and the U.S. military. General aviation activities may include pilot
training, sightseeing, aerial photography, law enforcement, and medical flights, as well as
business, corporate, and personal travel. General aviation operations are divided into the
categories of local or itinerant. Local operations are arrivals or departures performed by
aircraft that remain within the airport traffic pattern, or those that occur within sight of the
airport. Local operations are most often associated with training activity and flight instruction
(e.g., touch-and-goes). Itinerant operations are arrivals or departures that do not remain
within the airport traffic pattern and/or that originate from another airport. The FAA defines
an operation as either a single aircraft landing or takeoff. Under this definition, touch-and-
goes are considered two operations (one takeoff plus one landing) and are deemed local
operations. Itinerant operations are typically comprised of private, business/corporate, and
air taxi flight activity, but may also include law enforcement and medical flights. A summary
of the historical flight plan activity data, or data that is filed with the FAA when an aircraft
intends to fly within Instrument Flight Rules (IFR) controlled airspace, is summarized in Table
2-1 and Figure 2-1. Flight plan activity data only represents a small percentage of the total
activity that occurs at PHD, but it captures nearly every jet and turboprop operation because
those aircraft typically fly within IFR controlled airspace. Of the years shown, PHD experienced
the lowest number of jet operations in 2015 and the second lowest number of turboprop
operations. The decline in turboprop operations in recent years was associated with a local
company (Lauren Manufacturing) no longer having a based aircraft at PHD.
Table 2-1
Historical Flight Plan Activity (2000-2015) Year Total Jet Turboprop Piston
2000 1,108 148 504 456
2001 947 128 335 484
2002 847 93 349 405
2003 930 91 375 464
2004 1,010 98 306 606
2005 913 95 281 537
2006 1,103 109 172 822
2007 1,094 74 342 678
2008 1,077 81 225 771
2009 973 74 138 761
2010 784 52 116 616
2011 615 38 108 469
2012 686 42 114 530
2013 727 36 103 588
2014 828 35 61 732
2015 773 22 77 674
2000-2015 -2.37% -11.93% -11.77% 2.64%
Sources: FAA Traffic Flow Management System Counts and Michael Baker International, Inc., 2015.

Harry Clever Field Airport Master Plan Update
23
Figure 2-1
Historical Flight Plan Activity (2000-2015)
Sources: FAA Traffic Flow Management System Counts and Michael Baker International, Inc., 2015.
The baseline 2015 operations and based aircraft information for PHD is presented in Table
2-2 along with a comparison of the activity from the 2004 Master Plan Update. Because PHD
is a non-towered airport, the number of total operations must be estimated. The 2014 Ohio
Airports Focus Study (OH Focus Study) contains the most recent estimate of total operations
for PHD, which is 16,650 annual operations. That was considered the baseline 2015
operations number for this planning effort. The number of based aircraft was determined
through coordination with the City of New Philadelphia and includes 44 single-engine pistons.
Table 2-2
Baseline Operations and Based Aircraft Comparison Year Total SEP MEP Turboprop Jet Helicopter
Operations
2003 (2004 Master Plan) 20,000 18,300 434 375 91 800
2015 16,650 15,238 1,147 77 22 167
Based Aircraft
2003 (2004 Master Plan) 51 46 2 0 1 2
2015 44 44 0 0 0 0
Other Baseline 2015 Factors
Itinerant Operations / % 2,650 / 15.92% of Total Operations
Local Operations / % 14,000 / 84.08% of Total Operations
Instrument Operations / % 773 / 4.64% of Total Operations
OPBA 378 Operations Per Based Aircraft (OPBA)
Source: Michael Baker International, Inc., 2015.
Note: Numbers may not add correctly due to rounding.
1,1
08
94
7
84
7
93
0
1,0
10
91
3
1,1
03
1,0
94
1,0
77
97
3
78
4
61
5 68
6 72
7
82
8
77
3
20
00
20
01
20
02
20
03
20
04
20
05
20
06
20
07
20
08
20
09
20
10
20
11
20
12
20
13
20
14
20
15

Harry Clever Field Airport Master Plan Update
24
2.3 Factors and Opportunities Affecting Activity Levels
This section describes past and present trends that may influence PHD’s operations and
based aircraft levels. As part of any forecasting effort, the FAA recommends the identification
of historical factors that represented turning points for the U.S. aviation industry such as the
terrorist attacks on September 11, 2001, sharp fuel price increases after Hurricane Katrina
damaged Gulf Coast refineries in August 2005 (refer to Figure 2-2), and the economic
recession of the late 2000s. Although some of those events were impossible to predict, their
resulting consequences had considerable impacts on aviation activity throughout the U.S.
Local trends are also important because they provide airport-specific information that can be
used to support the selection of preferred forecasts. Trends evaluated include economic
conditions, airport-specific factors, and the FAA Next Generation Air Transportation System
(NextGen).
Figure 2-2
U.S. Aviation Gasoline Wholesale/Resale by Refiners (2001-2015)
Sources: U.S. Energy Information Administration and Michael Baker International, Inc., 2015.
2.3.1 Economic Conditions
The economic conditions surrounding an airport have the potential to influence activity levels.
For example, the growth or decline in a local population may correlate to the growth or decline
in operations and based aircraft levels at an airport. Table 2-3 summarizes historical and
forecast population, households, median age, and per capita income statistics for the U.S.,
Ohio, Tuscarawas County, and the City of New Philadelphia. As shown, the population and
income characteristics for the local area are lower than those for the state and nation. The
local area also has a higher median age than the state and nation. It is important to highlight
such factors because they are important considerations when conducting a forecasting effort
that must be based on realistic and substantiated growth assumptions.
$0.00
$0.50
$1.00
$1.50
$2.00
$2.50
$3.00
$3.50
$4.00
$4.50
01
-20
01
07
-20
01
01
-20
02
07
-20
02
01
-20
03
07
-20
03
01
-20
04
07
-20
04
01
-20
05
07
-20
05
01
-20
06
07
-20
06
01
-20
07
07
-20
07
01
-20
08
07
-20
08
01
-20
09
07
-20
09
01
-20
10
07
-20
10
01
-20
11
07
-20
11
01
-20
12
07
-20
12
01
-20
13
07
-20
13
01
-20
14
07
-20
14
01
-20
15
07
-20
15
AVGAS JET A

Harry Clever Field Airport Master Plan Update
25
Table 2-3
Socioeconomic Comparison (Local, State, & National) Variable New Philadelphia Tuscarawas Ohio Entire US
Population
2000 17,236 90,915 11,353,249 281,422,025
2010 17,272 92,582 11,536,504 308,745,538
2015 17,119 92,643 11,599,932 319,507,044
2020 17,113 93,825 11,815,827 332,559,851
AAGR 2000-2010 0.02% 0.18% 0.16% 0.93%
AAGR 2010-2015 -0.18% 0.01% 0.11% 0.69%
AAGR 2015-2020 -0.01% 0.25% 0.37% 0.80%
Median Age
2000 39.4 37.8 36.3 35.5
2010 40.9 40.9 38.7 37.1
2015 41.3 41.6 39.3 37.5
2020 41.6 42.4 39.8 38.2
AAGR 2000-2010 0.37% 0.80% 0.64% 0.44%
AAGR 2010-2015 0.19% 0.34% 0.28% 0.22%
AAGR 2015-2020 0.16% 0.35% 0.26% 0.35%
Average Household Income
2000 $41,592 $43,545 $52,846 $56,675
2010 $52,038 $52,724 $63,908 $73,387
2015 $56,435 $56,784 $67,386 $76,502
2020 $65,604 $65,480 $77,942 $87,705
AAGR 2000-2010 2.27% 1.93% 1.92% 2.62%
AAGR 2010-2015 1.64% 1.49% 1.07% 0.83%
AAGR 2015-2020 3.06% 2.89% 2.95% 2.77%
Median Household Income
2000 $32,594 $35,509 $41,066 $42,257
2010 $40,001 $41,930 $46,454 $51,362
2015 $43,433 $46,276 $49,573 $53,423
2020 $52,310 $53,991 $58,247 $62,096
AAGR 2000-2010 2.07% 1.68% 1.24% 1.97%
AAGR 2010-2015 1.66% 1.99% 1.31% 0.79%
AAGR 2015-2020 3.79% 3.13% 3.28% 3.05%
Per Capita Income
2000 $17,755 $17,077 $20,694 $21,242
2010 $22,104 $21,217 $25,819 $28,088
2015 $23,918 $22,790 $27,192 $29,272
2020 $27,839 $26,420 $31,570 $33,657
AAGR 2000-2010 2.22% 2.19% 2.24% 2.83%
AAGR 2010-2015 1.59% 1.44% 1.04% 0.83%
AAGR 2015-2020 3.08% 3.00% 3.03% 2.83%
Source: Alteryx, Inc.
According to the Economic Development & Finance Alliance of Tuscarawas County, leading
employers in the county include those listed below. Figure 2-3 presents a graph depicting the
historical unemployment rates for the county, state, and nation. During the economic
recession of the late 2000s, the county experienced high unemployment levels, but has since
recovered to an unemployment rate that is similar to that of the state and nation. This
information not only illustrates the ability of individuals to afford aviation services, but also
the business growth that has occurred in recent years in Tuscarawas County and the
important role an airport can play in encouraging that growth.

Harry Clever Field Airport Master Plan Update
26
• Alamo Group / Gradall Industries (manufacturing)
• Allied Machine & Engineering (manufacturing)
• Arizona Chemical (manufacturing)
• Dover Chemical (manufacturing)
• Dover City Schools (government / education)
• Lauren International (manufacturing / research and development)
• Marlite, Inc. (manufacturing)
• New Philadelphia City Schools (government / education)
• Schlumberger North America (energy)
• Union Hospital (health services)
• Walmart (retail)
• Zimmer Orthopedic (manufacturing)
Figure 2-3
Historical Unemployment Rates (2000-2015)
Sources: U.S. Bureau of Labor Statistics and Michael Baker International, Inc., 2015.
2.3.2 Other Local Factors
According to the U.S. Energy Information Administration Annual Outlook 2015 with Projections
to 2040, Lower 48 shale natural gas production is projected to grow from 11.3 trillion cubic
feet (Tcf) in 2013 to 19.6 Tcf by 2040, which represents an average annual increase of 2.06
percent over the course of the 27-year period. As shown in Figure 2-4, several Utica Shale
permits have been issued in Tuscarawas County to different companies. This type of activity
often generates aviation activity for both personnel transport and reconnaissance, particularly
at airports in states like Ohio, Pennsylvania, West Virginia, and New York where natural gas
reserves are located. Not only is there a noticeable increase in the mining of natural gas in
these areas, but additional jobs are often created by businesses that support that activity.
0.0%
2.0%
4.0%
6.0%
8.0%
10.0%
12.0%
14.0%
16.0%
20
00
20
01
20
02
20
03
20
04
20
05
20
06
20
07
20
08
20
09
20
10
20
11
20
12
20
13
20
14
20
15
County State U.S.

Harry Clever Field Airport Master Plan Update
27
Although Tuscarawas County has not experienced a large amount of growth from this activity,
there may be a potential for the area to benefit from it during the forecast period.
Figure 2-4
Utica Shale Permits in Tuscarawas County (as of December 2015)
Sources: Ohio Department of Natural Resources and Michael Baker International, Inc., 2015.
2.3.3 FAA Next Generation Air Transportation System (NextGen)
NextGen includes a series of improvements to the national aviation system that are intended
to make air travel more safe, convenient, and dependable. By investing in new technologies
and replacing aging systems, NextGen initiatives are focused on improving schedule
predictability, reducing environmental impacts, flying more direct routes, limiting ground
holding, better circumventing poor weather, providing better approaches and access to
airports, and improving safety for accident avoidance. The FAA’s investment in NextGen
initiatives should help to improve access and approach capability for airports around the U.S.
At many general aviation airports, the benefits of NextGen technologies are becoming more
and more apparent with the rollout of Localizer Performance with Vertical Guidance (LPV)
approaches that provide horizontal and vertical course guidance to aircraft via Global
Positioning System (GPS). Through the recommendations of this study and the FAA’s ongoing
NextGen initiatives, it is anticipated that PHD will continue to become more accessible for
instrument flight operations.
2.4 Based Aircraft Forecasts
The total based aircraft forecast was developed by reviewing growth rates from various
sources and applying them to the 2015 baseline number of 44 based aircraft at PHD. As
shown in Table 2-4 and Figure 2-5, five separate growth rates were reviewed for PHD that
were obtained from the following local, state, and national trend data:
• BA-1 – The growth rate for Based Aircraft Forecast 1 (BA-1) was obtained from the
FAA’s 2014 Terminal Area Forecast (TAF) for PHD. Each year, the FAA develops a TAF
for airports that is used to determine long-term budgeting and staffing needs for the
national aviation system.

Harry Clever Field Airport Master Plan Update
28
• BA-2 – This growth rate was obtained from the OH Focus Study and was based on
population growth forecast.
• BA-3 – Based on the previously identified growth rate for natural gas production.
• BA-4 – Assumes that PHD will have as many based aircraft as it did in 2003 by 2035
(51 based aircraft).
• BA-5 – Based on the projected population growth rate for Tuscarawas County between
2015 and 2020.
An average of all five based aircraft forecasts was calculated as well as an average without
the lowest overall forecast (BA-1). Because the forecasts apply various local, state, and
national growth trends, it was determined that an average forecast would portray a realistic
growth scenario for PHD that was inclusive of multiple trends. However, because BA-1 only
accounted for one additional based aircraft over the 20-year period, the recommended
forecast for this planning effort was selected as the average of all forecasts except for BA-1.
However, during the course of the planning process, it was determined that a new medical
flight organization was planning to relocate to PHD in 2016 with one based helicopter and
there was also a potential for 10 additional aircraft to base at PHD after a 10-unit T-hangar is
constructed in 2017. The airport has a waiting list with at least 10 aircraft owners looking for
space, and therefore, it was assumed that such a new T-hangar could be filled immediately
following construction. Consequently, the recommended forecast was adjusted to reflect
those anticipated increases and results in based aircraft increasing from 44 in 2015 to 64 by
2035. This adjustment was only applied to the recommended forecast and not to the other
forecasts. The based aircraft forecast by aircraft type is presented in Table 2-5. For an airport
such as PHD, it is difficult to determine the future based aircraft mix without known demands.
Therefore, the identified future mix represents a cross section of what an airport such as PHD
would likely accommodate based on its design, location, available facilities, and capabilities.
Table 2-4
Based Aircraft Forecasts (2015-2035)
Year BA-1 BA-2 BA-3 BA-4 BA-5 Average
(All)
Average
(Without BA-1)
2015 44 44 44 44 44 44 44
2020 44 45 49 46 45 46 57
2025 45 46 54 47 45 47 59
2030 45 47 60 49 46 49 61
2035 45 48 66 51 46 51 64
AAGR 2015-
2035 0.14% 0.40% 2.06% 0.74% 0.25% 0.77% 1.87%
Recommended No No No No No No Yes
Source: Michael Baker International Inc., 2015.
Note: The Average (Without BA-1) forecast was adjusted to account for the based aircraft growth that is
expected immediately following the construction of a new T-hangar. This adjustment was not applied to the
other forecasts.

Harry Clever Field Airport Master Plan Update
29
Figure 2-5
Based Aircraft Forecasts (2015-2035)
Source: Michael Baker International Inc., 2015.
Note: The Average (Without BA-1) forecast was adjusted to account for the based aircraft growth that is
expected immediately following the construction of a new T-hangar. This adjustment was not applied to the
other forecasts.
Table 2-5
Based Aircraft by Type Forecast (2015-2035) Year Total SEP MEP Turboprop Jet Helicopter
2015 44 44 0 0 0 0
2020 57 54 1 1 0 1
2025 59 54 2 1 0 2
2030 61 56 2 1 0 2
2035 64 59 2 1 0 2
2015-2035 1.87% 1.46% N/A N/A N/A N/A
Source: Michael Baker International, Inc., 2015.
Note: Numbers may not add correctly due to rounding.
2.5 Operations Forecasts
Similar to the based aircraft forecasts, the operations forecast was developed by reviewing
growth rates from various sources and applying them to the 2015 baseline number of 16,650
operations at PHD. As shown in Table 2-6 and Figure 2-6, five separate growth rates were
reviewed for PHD that were obtained from the following local, state, and national trend data:
• OP-1 – The growth rate for Operations Forecast 1 (OP-1) was obtained from the OH
Focus Study and was based on an Operations Per Based Aircraft (OPBA) ratio.
40
45
50
55
60
65
70
20
15
20
20
20
25
20
30
20
35
BA-1 BA-2 BA-3 BA-4 BA-5 All All-Low

Harry Clever Field Airport Master Plan Update
30
• OP-2 – This growth rate was obtained from the OH Focus Study and was based on an
FAA forecast for general aviation hours flown.
• OP-3 – Based on the projected population growth rate for Tuscarawas County between
2015 and 2020.
• OP-4 – Obtained from the 2014 TAF for PHD.
• OP-5 – Assumes that PHD will have as many operations as it did in 2003 by 2035
(20,000 operations).
• OP-6 – Based on the previously identified growth rate for natural gas production.
An average of all five operations forecasts was calculated as well as an average without the
lowest overall forecast (OP-3). Because the forecasts apply various local, state, and national
growth trends, it was determined that an average forecast would portray a realistic growth
scenario that was inclusive of multiple trends. However, because OP-3 only accounted for
limited growth (i.e., an annual growth rate of 0.25 percent), the recommended forecast for
this planning effort was selected as the average of all forecasts except for OP-3. This was
considered an outlier because it produced significantly lower growth than the other forecasts
and was therefore excluded from the average. In order to account for the additional
operations associated with the new based aircraft in 2016 and 2017 (i.e., one medical flight
helicopter and 10 new T-hangar tenants), adjustments were made to the recommended
operations forecasts in those years using typical OPBA ratios. This resulted in operations
increasing from 16,650 in 2015 to 25,532 by 2035. The operations forecast by aircraft type
is presented in Table 2-7. The forecast in operations for turboprops, jets, and helicopters was
calculated using projected growth rates from the FAA Aerospace Forecast Fiscal Years 2015-
2035 for general aviation hours flown, whereas the forecast for piston-powered operations
was calculated based on their current share of total annual operations. Table 2-8 includes
the forecast of itinerant and local operations. The share of itinerant operations was increased
at the anticipated growth for IFR general aviation aircraft handled at en route traffic control
centers from the FAA Aerospace Forecast, which increases the itinerant share from 15.92
percent of operations in 2015 to 18.67 percent by 2035.
Table 2-6
Annual Operations Forecasts (2015-2035)
Year OP-1 OP-2 OP-3 OP-4 OP-5 OP-6 Average
(All)
Average
(Without OP-3)
2015 16,650 16,650 16,650 16,650 16,650 16,650 16,650 16,650
2020 17,264 17,849 16,859 17,916 17,431 18,437 17,626 21,563
2025 17,924 19,133 17,071 19,278 18,248 20,416 18,678 22,904
2030 18,633 20,511 17,285 20,744 19,104 22,607 19,814 24,104
2035 19,396 21,987 17,503 22,321 20,000 25,034 21,040 25,532
AAGR 2015-
2035 0.77% 1.40% 0.25% 1.48% 0.92% 2.06% 1.18% 2.16%
Recommended No No No No No No No Yes
Source: Michael Baker International, Inc., 2015.
Note: The Average (Without OP-3) forecast was adjusted to account for the operational growth that is
expected immediately following the construction of a new T-hangar. This adjustment was not applied to the
other forecasts.

Harry Clever Field Airport Master Plan Update
31
Figure 2-6
Annual Operations Forecasts (2015-2035)
Source: Michael Baker International Inc., 2015.
Note: The Average (Without OP-3) forecast was adjusted to account for the operational growth that is expected
immediately following the construction of a new T-hangar. This adjustment was not applied to the other
forecasts.
Table 2-7
Operations by Aircraft Type Forecast (2015-2035) Year Total SEP MEP Turboprop Jet Helicopter
2015 16,650 15,238 1,147 77 22 167
2020 21,563 19,535 1,470 204 26 328
2025 22,904 20,600 1,551 222 31 500
2030 24,104 21,618 1,627 241 37 580
2035 25,532 22,834 1,719 262 45 672
2015-2035 2.16% 2.04% 2.04% 6.32% 3.60% 7.23%
Source: Michael Baker International, Inc., 2015.
Note: Numbers may not add correctly due to rounding.
15,000
17,000
19,000
21,000
23,000
25,000
27,000
20
15
20
20
20
25
20
30
20
35
OP-1 OP-2 OP-3 OP-4 OP-5 OP-6 All All-Low

Harry Clever Field Airport Master Plan Update
32
Table 2-8
Itinerant & Local Operations Forecast Year Total Itinerant % Itinerant Local % Local
2015 16,650 2,650 15.92% 14,000 84.08%
2020 21,563 3,572 16.56% 17,992 83.44%
2025 22,904 3,948 17.24% 18,956 82.76%
2030 24,104 4,323 17.94% 19,781 82.06%
2035 25,532 4,766 18.67% 20,766 81.33%
2015-2035 2.16% 2.98% 0.80% 1.99% -0.17%
Source: Michael Baker International, Inc., 2015.
Note: Numbers may not add correctly due to rounding.
2.6 Instrument Operations Forecast
According to the FAA report, Forecasting Aviation Activity by Airport, instrument operations
consist of “arrivals, departures, and overflights conducted by an FAA approach control facility
for aircraft with an Instrument Flight Rule (IFR) flight plan or special Visual Flight Rule (VFR)
procedures.” At PHD, IFR operations generally consist of approaches and departures by
aircraft filing flight plans with the FAA, which included a total of 773 operations in 2015 or
4.64 percent of all operations (refer to Table 2-9). For this forecasting effort, it was assumed
that the percentage of instrument operations would increase at an average annual growth
rate of 0.80 percent per year in accordance with the FAA’s forecast of IFR general aviation
aircraft at en route traffic control centers from the FAA Aerospace Forecast. As shown in Table
2-9, this forecast results in instrument operations increasing from 773 operations in 2015 to
1,390 operations by 2035. It is anticipated that this forecast is consistent with the FAA’s
ongoing NextGen improvements that are being conducted to improve access to airports and
efficiency within the nation’s airspace system.
Table 2-9
Instrument Operations Forecast (2015-2035) Year Total Instrument % Instrument
2015 16,650 773 4.64%
2020 21,563 1,042 4.83%
2025 22,904 1,152 5.03%
2030 24,104 1,261 5.23%
2035 25,532 1,390 5.44%
2015-2035 2.16% 2.98% 0.80%
Source: Michael Baker International, Inc., 2015.
Note: Numbers may not add correctly due to rounding.

Harry Clever Field Airport Master Plan Update
33
2.7 Peak Activity Forecasts
Peak activity was calculated for various factors at PHD by reviewing historical flight plan
activity records. Peaking forecasts are conducted so that airports can plan for times when
the highest concentration of activity occurs. Table 2-10 presents the peak activity forecasts
for PHD and the methodology for each component is detailed below.
• Average Peak Month (APM) – Through a review of historical flight plan data from 2010
to 2014, the APM was calculated at 12.13 percent of annual flight plan activity.
• Average Day Peak Month (ADPM) – An average month contains 30.42 days (365 ÷
12). The ADMP was calculated by dividing the APM by 30.42.
• Average Day Peak Hour (ADPH) – The ADPH at PHD can include a combination of touch-
and-go training operations and itinerant activity and was estimated at 17.50 percent
of the ADPM. The itinerant and local peak hours were calculated based on the
percentages shown in Table 2-8.
• Average Peak Hour Passengers – This was calculated by multiplying the number of
itinerant peak hour operations by four passengers. Because the local peak hour
operations are mostly training and maintenance flights, they were not included in the
passenger calculations.
Table 2-10
Peak Activity Forecasts (2015-2035)
Year Total Average Peak Average Peak Hour
Month Day Hour Itinerant Local Passengers
2015 16,650 2,020 66 12 2 10 7
2020 21,563 2,616 86 15 2 13 10
2025 22,904 2,778 91 16 3 13 11
2030 24,104 2,924 96 17 3 14 12
2035 25,532 3,097 102 18 3 14 13
2015-2035 2.16% 2.16% 2.16% 2.16% 2.98% 1.99% 2.98%
Source: Michael Baker International, Inc., 2015.
Note: Numbers may not add correctly due to rounding.
2.8 Identification of Critical Aircraft
FAA Advisory Circular (AC) 150/5000-17, Critical Aircraft and Regular Use Determination,
“provides guidance on the use of critical aircraft in the conduct of facility planning studies for
federally obligated airports” and also defines the term regular use. The AC defines the critical
aircraft as “the most demanding aircraft type, or grouping of aircraft with similar
characteristics, that make regular use of the airport. Regular use is 500 operations, excluding
touch-and-go operations. An operation is either a takeoff or landing.” The existing critical
aircraft must be identified based on documented aeronautical activity, typically for the most
recent 12-month period that is available. The future critical aircraft is based on an FAA-
approved forecast and any change to the existing critical aircraft must be supported by a
credible forecast. Following the review of this forecasting effort, the existing and future critical
aircraft were determined in conjunction with the Technical Advisory Committee (TAC) and the
City of New Philadelphia and are identified as part of the facility requirements.

Harry Clever Field Airport Master Plan Update
34
2.9 Forecast Summary
Table 2-11 presents a summary of the forecasts for PHD. According to the FAA’s June 2008
Review and Approval of Aviation Forecasts guidance, total operations and based aircraft
forecasts are considered consistent with the TAF if they differ by less than 10 percent in the
five-year forecast period and 15 percent in the 10-year forecast period. At the time, the
numbers in the TAF did not accurately reflect the actual number of operations and based
aircraft at PHD (which were identified as part of this Master Plan Update). Therefore, the
forecasts herein were considered acceptable for long-term planning purposes and the
comparisons to the TAF (as shown in red in the table) were provided for FAA evaluation
purposes only. Overall, the forecasts were developed in order to allow the airport to plan for
facility improvements that are typical of an airport such as PHD, if and when they may be
needed in the future.

Harry Clever Field Airport Master Plan Update
35
Table 2-11
Forecast Summary Harry Clever Field Airport, New Philadelphia, Ohio
Base Year: 2015 Average Annual Compound Growth Rates Base Yr. Level Base Yr. + 1Yr. Base Yr. + 5Yrs. Base Yr. + 10Yrs. Base Yr. + 15Yrs. Base Yr. + 20Yrs. Base Yr. to +1 Base Yr. to +5 Base Yr. to +10 Base Yr. to +15 Base Yr. to +20 2015 2016 2020 2025 2030 2035 2016 2020 2025 2030 2035
Itinerant and Local Operations
Itinerant Operations 2,650 2,726 3,572 3,948 4,323 4,766 2.85% 6.15% 4.07% 3.32% 2.98%
Itinerant % 15.92% 16.04% 16.56% 17.24% 17.94% 18.67% 0.80% 0.80% 0.80% 0.80% 0.80%
Local Operations 14,000 14,263 17,992 18,956 19,781 20,766 1.88% 5.15% 3.08% 2.33% 1.99%
Local % 84.08% 83.96% 83.44% 82.76% 82.06% 81.33% -0.15% -0.15% -0.16% -0.16% -0.17%
Total Operations 16,650 16,989 21,563 22,904 24,104 25,532 2.04% 5.31% 3.24% 2.50% 2.16%
2014 TAF Operations 56,674 57,571 61,169 65,744 70,665 75,978 1.58% 1.54% 1.50% 1.48% 1.48%
Difference from TAF -70.62% -70.49% -64.75% -65.16% -65.89% -66.40%
Operations by Aircraft Type and Critical Aircraft
Single-Engine Piston 15,238 15,435 19,535 20,600 21,618 22,834 1.29% 5.09% 3.06% 2.36% 2.04%
Multi-Engine Piston 1,147 1,162 1,470 1,551 1,627 1,719 1.29% 5.09% 3.06% 2.36% 2.04%
Turboprop 77 78 204 222 241 262 1.70% 21.49% 11.15% 7.91% 6.32%
Jet 22 23 26 31 37 45 3.60% 3.60% 3.60% 3.60% 3.60%
Rotorcraft 167 291 328 500 580 672 75.07% 14.53% 11.63% 8.68% 7.23%
IFR Operations
IFR Operations 773 795 1,042 1,152 1,261 1,390 2.85% 6.15% 4.07% 3.32% 2.98%
IFR % 4.64% 4.68% 4.83% 5.03% 5.23% 5.44% 0.80% 0.80% 0.80% 0.80% 0.80%
Peak Operations
Average Peak Month (APM) 2,020 2,061 2,616 2,778 2,924 3,097 2.04% 5.31% 3.24% 2.50% 2.16%
Average Day Peak Month (ADPM) 66 68 86 91 96 102 2.04% 5.31% 3.24% 2.50% 2.16%
Itinerant Peak Hour 2 2 2 3 3 3 2.85% 6.15% 4.07% 3.32% 2.98%
Local Peak Hour 10 10 13 13 14 14 1.88% 5.15% 3.08% 2.33% 1.99%
Based Aircraft
Single-Engine Piston 44 44 54 54 56 59 0.86% 4.16% 2.08% 1.66% 1.46%
Multi-Engine Piston 0 0 1 2 2 2 N/A N/A N/A N/A N/A
Turboprop 0 0 1 1 1 1 N/A N/A N/A N/A N/A
Jet 0 0 0 0 0 0 N/A N/A N/A N/A N/A
Rotorcraft 0 1 1 2 2 2 N/A N/A N/A N/A N/A
Total Based Aircraft 44 45 57 59 61 64 3.14% 5.30% 2.99% 2.24% 1.87%
2014 TAF Based Aircraft 36 36 37 37 37 37 0.00% 0.55% 0.27% 0.18% 0.14%
Difference from TAF / 2012 Baseline 22.22% 26.05% 53.93% 59.61% 65.74% 72.34%
Operational Factors
Total Ops Per Based Aircraft 378 374 379 388 393 400 -1.07% 0.01% 0.25% 0.25% 0.28%
Local Ops Per Based Aircraft 318 314 316 321 323 326 -1.22% -0.14% 0.09% 0.09% 0.12%
Source: Michael Baker International, Inc., 2015.
Note: Numbers may not add correctly due to rounding.

Harry Clever Field Airport Master Plan Update
36
3.0 Facility Requirements
The facility requirements include an assessment of both the aviation and non-aviation
components of the Harry Clever Field Airport (PHD) including the runways and taxiways,
aircraft storage facilities, and supporting infrastructure (e.g., roadways and parking). The
airport provides various opportunities for general aviation activity, is part of the Federal
Aviation Administration’s (FAA’s) National Plan of Integrated Airport Systems (NPIAS), and
must therefore comply with FAA design standards. The facilities that would be needed to meet
the FAA-approved forecasts of aviation demand are also identified in this chapter. The goal
was to identify improvements that would be needed over the course of the 20-year planning
period that extends from 2015 to 2035. An analysis of the following airport components is
presented herein:
• Technical Advisory Committee (TAC) Meeting 1
• Identification of Critical Aircraft
• Runway Justification Requirements
• Airfield Capacity
• Wind Analysis
• 2014 Ohio Airports Focus Study
• Runway Length Analysis
• Runway Strength Analysis
• Airfield Design Standards Analysis
• Other Airfield Considerations
• Airfield Lighting, Markings, Signage, and Navigational Aids
• Transient Apron and Based Aircraft Storage
• Airport Support Facilities
• Land Acquisition Requirements
• Airport Security Analysis
• Summary
3.1 Technical Advisory Committee (TAC) Meeting 1
During the first TAC meeting on January 21, 2016, a Strengths, Weaknesses, Opportunities,
and Threats (SWOT) exercise was conducted to obtain the TAC’s perspectives on what the
short-term and long-term potential is for PHD and what types of unique opportunities should
be explored as part of the Master Plan Update. The TAC members were split into two groups
to produce a list of items that should be considered for PHD. When the groups returned, the
following discussion occurred:
• Weaknesses include the short runway length, the loss of two major tenants (Schwab
Industries and Lauren International), the loss of MedFlight, lack of rental cars and
adequate public transportation (bus, taxi, etc.), the airport location, use of the frontage
property along East High Avenue, the surrounding cemeteries, and that a portion of the
paved runway is on property leased from the state. The TAC felt that a business plan
should be conducted to determine methods and policies to retain tenants and to
further plan for the future growth of PHD.

Harry Clever Field Airport Master Plan Update
37
• Strengths include the strong city support for the airport and its importance as a site for
continued economic development opportunities, the potential to build a relationship
with Kent State University (particularly with the university’s expanding Tuscarawas
Campus and Aeronautics Program), the strong Fixed Base Operator (FBO), the land
that may be available for future development and/or redevelopment, the Experimental
Aircraft Association (EAA), and the restaurant.
• Businesses that may benefit from PHD include The Timken Company, Gradall
Industries, Freeport Press, Kimble Manufacturing Company, Lauren International,
Menards, and Chevron.
• Local events/attractions that bring visitors to New Philadelphia include the Christian
Music Festival, Historic Schoenbrunn Village, the Performing Arts Center at Kent State
University at Tuscarawas, and the Pro Football Hall of Fame in Canton.
• Major projects at the Pro Football Hall of Fame, Kent State University at Tuscarawas,
and for Menards will create additional jobs, population, etc. within the local area and
may induce growth in activity, based aircraft, and development at PHD.
• Threats include the loss of previous corporate tenants, declining oil prices, ability to
obtain public consensus for the Master Plan Update, and the potential for changes in
state and FAA funding levels.
• Some ‘niche’ opportunities were discussed for PHD such as the potential to be a site
for drones if acceptable to the public, city, state, and FAA. The possibility for a ‘fly and
bike’ concept was also discussed, whereby bike rentals would be available for visiting
nearby trails and attractions.
This chapter builds upon the discussions that occurred during the first TAC meeting and
identifies what is required to meet the short-term and long-term aviation demands for PHD.
There were also discussions about the cemeteries surrounding the airport (East Avenue
Cemetery, Evergreen Burial Park, and Cavalry Cemetery) and the potential to utilize a portion
of the airport property for future burial plots. The cemeteries are nearing capacity and there
is a demand to provide future burial plots due to the historic nature of the area. The potential
to utilize a portion of the airport property for that purpose is addressed within this chapter.
3.2 Identification of Critical Aircraft
As mentioned in the forecast chapter, AC 150/5000-17, Critical Aircraft and Regular Use
Determination, “defines the critical aircraft as “the most demanding aircraft type, or grouping
of aircraft with similar characteristics, that make regular use of the airport. Regular use is
500 operations, excluding touch-and-go operations. An operation is either a takeoff or
landing.” The existing critical aircraft must be identified based on documented aeronautical
activity, typically for the most recent 12-month period that is available. The future critical
aircraft is based on an FAA-approved forecast and any change to the existing critical aircraft
must be supported by a credible forecast.
During the first TAC meeting, the forecasts of aviation demand were presented which
indicated that total operations will increase from 16,650 in 2015 to 25,532 by 2035. The
most demanding aircraft type that currently and is forecast to conduct 500 or more operations
is a multi-engine piston such as the Beechcraft Baron 58. Multi-engine piston operations are
forecast to increase from 1,147 in 2015 to 1,719 by 2035. FAA airfield design criteria (e.g.,

Harry Clever Field Airport Master Plan Update
38
required separations and safety area dimensions) is determined based on the approach
speed and wingspan of the identified critical aircraft. As shown in Table 3-1, each runway is
assigned a Runway Design Code (RDC) that is a function of the critical aircraft’s Aircraft
Approach Category (AAC) or approach speed in knots and Airplane Design Group (ADG) or
wingspan in feet. The Beechcraft Baron 58 has an RDC of B-I and is a small aircraft because
it has a Maximum Takeoff Weight (MTOW) that 12,500 pounds or less. Therefore, RDC B-I
(small aircraft) design standards were reviewed for both runways at PHD.
It is noted that the 2004 Master Plan Update for PHD identified an RDC of B-II for Runway 14-
32 and recommendations that included changing the orientation of the runway, conducting
property acquisition around the airport, and removing grave sites. Today, the existing and
forecast activity at PHD no longer justifies conducting those actions and the position of the
city and TAC is to maintain Runway 14-32 for small aircraft and to correct any non-standard
airfield conditions associated with an RDC of B-I (small aircraft).
Table 3-1
Runway Design Code (RDC) and Critical Aircraft Aircraft Approach Category (AAC) Airplane Design Group (ADG)
Category Approach Speed
(Knots) Group
Tail Height
(Feet)
Wingspan
(Feet)
A <91 I <20 <49
B 91 to <121 II 20 to <30 49 to <79
C 121 to <141 III 30 to <45 79 to <118
D 141 to <166 IV 45 to <60 118 to <171
E >166 V 60 to <66 171 to <214
VI 66 to <80 214 to <262
Critical Aircraft Beechcraft Baron 58
Aircraft Type Twin-Engine Piston
Aircraft Approach Category/Approach Speed B / 96 Knots
Airplane Design Group/Wingspan I / 37 Feet 10 Inches
Runway Design Code (RDC) RDC B-I (Small Aircraft)
Tail Height 9.9 Feet
Taxiway Design Group (TDG) TDG-1A
Max Takeoff Weight (MTOW) 5,500 Pounds
Max Landing Weight (MLW) 5,400 Pounds
Max Passengers 6
Sources: FAA AC 150/5300-13A, Airport Design, Aircraft Performance Manual, and Michael Baker
International, Inc., 2016.

Harry Clever Field Airport Master Plan Update
39
3.3 Runway Justification Requirements
The need for additional runways is primarily based on two factors--airfield capacity and wind
coverage. FAA Order 5100.38D, Airport Improvement Program (AIP) Handbook, identifies
what types of projects are eligible for AIP funding and contains the policy below for the
justification of runways. As explained in this chapter, because Runway 14-32 alone provides
sufficient wind coverage and airfield capacity for the aircraft operating at PHD, the FAA would
fund any improvements to the turf runway (Runway 11-29). Turf runways require occasional
maintenance to correct bumps, ruts, and other issues. Both the 2004 Master Plan Update
and the 2013 Airport Layout Plan (ALP) Update illustrated the closure of the turf runway in the
future. However, during the TAC meeting on May 4, 2016, several members of the TAC
indicated that the turf runway is popular, attracts niche flyers, is in good condition, and
requires minimal maintenance. Therefore, unlike previous studies, this Master Plan Update
is showing preservation of the turf runway throughout the duration of the planning period.
FAA Policy on Secondary, Crosswind, and Additional Runways (FAA Order 5100.38D)
Per FAA policy, the ADO [FAA Airports District Office) can only fund a single runway at an airport unless
the ADO has made a specific determination that an additional runway is justified. The requirements,
justification and eligibility for runways are listed in Table 3-7 [see below].
Before planning a project on a runway, the ADO must determine the type of runway (primary,
secondary, or additional).
A runway that is not a primary runway, a secondary runway, or a crosswind runway is considered to
be an additional runway. It is not unusual for a two-runway airport to have a primary runway and an
additional runway, and no secondary or crosswind runway. That is because the ADO can only
designate a runway as a secondary or crosswind runway if it meets the specific operating and
justification parameters in Table 3-7.
Additional runways are not eligible. Any development such as marking, lighting, or maintenance
projects on an additional runway is also ineligible.

Harry Clever Field Airport Master Plan Update
40
3.4 Airfield Capacity
The FAA defines airfield capacity as an estimate of aircraft that can be processed through the
airfield system during a specific period with acceptable levels of delay. This section evaluates
whether the existing airfield configuration of PHD is capable of accommodating forecast levels
of demand during the planning period. Estimates of airfield capacity were developed in
accordance with the methods presented in FAA AC 150/5060-5, Airport Capacity and Delay
(Capacity AC). This methodology does not account for every possible situation at an airport,
but rather the most common situations observed at U.S. airports when the Capacity AC was
adopted. The Capacity AC provides a methodology for determining the hourly capacity, Annual
Service Volume (ASV), and aircraft delay, which are defined below. Each of these factors was
calculated for existing conditions and for the last year of the planning period at PHD. The
results are used for planning purposes to determine if airfield improvements are needed.
• Hourly Airfield Capacity – An airport’s hourly airfield capacity represents the maximum
number of aircraft that can be accommodated under conditions of continuous demand
during a one-hour period. Using peak hour forecasts, the hourly airfield capacity is
determined for both Visual Flight Rules (VFR) and Instrument Flight Rules (IFR) activity.

Harry Clever Field Airport Master Plan Update
41
• Annual Service Volume (ASV) – The ASV estimates the annual number of operations
that the airfield configuration should be capable of handling with minimal delays. The
ASV accounts for peaking characteristics in its calculation of 12-month demand as well
as periods of low-volume activity.
• Delay – The average anticipated delay is based on a ratio of forecast demand to the
calculated ASV. According to the Capacity AC, “as demand approaches capacity,
individual aircraft delay is increased. Successive hourly demands exceeding the hourly
capacity result in unacceptable delays.”
FAA Order 5090.3C, Field Formulation of the National Plan of Integrated Airport Systems,
states that Chapter 2 of the Capacity AC (Capacity and Delay Calculations for Long-Range
Planning) should be used for most airports. As shown in Figure 3-1, three airfield
configurations were reviewed as it pertains to the capacity assessment for PHD. The first one
is a single runway configuration, which is most applicable to how aircraft operate on a regular
basis at PHD. The other two runway configurations would only apply if both runways at PHD
were utilized in a similar manner. Therefore, airfield capacity was only evaluated for Runway
14-32 because of the limited and specialty use of the turf runway (Runway 11-29). Based on
the information in the Capacity AC, Runway 14-32 has an ASV of 230,000 operations, a VFR
hourly capacity of 98 operations, and an IFR hourly capacity of 59 operations. Table 3-2
presents the results of the airfield capacity calculations for Runway 14-32. By 2035, the
number of annual operations is expected to reach 11.10 percent of ASV, VFR peak hour
operations may reach 14.29 percent of capacity, and IFR peak hour operations may reach
5.08 percent of capacity. Those percentages are too low to warrant any capacity-enhancing
improvements for Runway 14-32.
Figure 3-1
Runway Use Configurations
Source: FAA AC 150/5060-5, Airport Capacity and Delay.
Table 3-2
Runway 14-32 Airfield Capacity Calculations
Year
Annual Hourly
Operations % ASV
(230,000)
VFR Peak
Hour
% VFR
Capacity (98) IFR Peak Hour
% IFR
Capacity (59)
2015 16,650 7.24% 10 10.20% 2 3.39%
2035 25,532 11.10% 14 14.29% 3 5.08%
Source: Michael Baker International, Inc., 2016.

Harry Clever Field Airport Master Plan Update
42
3.5 Wind Analysis
According to FAA AC 150/5300-13A, Airport Design, a crosswind runway is recommended
when the primary runway orientation provides less than 95 percent wind coverage. It is
important for aircraft to takeoff and land into the wind and runways should be oriented to
provide the maximum wind coverage for operations. At PHD, Runway 14-32 provides greater
than 95 percent wind coverage under the 10.5 knot crosswind component for an RDC of B-I
(small aircraft). Therefore, no additional runways are needed to provide crosswind coverage
at the airport nor would the FAA be likely to fund improvements to the turf runway (Runway
11-29). The results of the wind coverage analysis are provided in Table 3-3. The historical
wind records were obtained from the Automated Surface Observing System (ASOS) that is
located at PHD. Figure 3-2 illustrates the percentage of time all wind observations were
coming from each direction (averaged during the period from 2006 to 2015), with each circle
representing a one percent interval. As shown, Runway 14-32 is ideally oriented to
accommodate takeoffs and landings into the wind the majority of the time at PHD.
Table 3-3
Wind Coverage Analysis (2006-2015) Runway
(True Bearing)
All Weather
(10.5 Knots)
VFR
(10.5 Knots)
IFR
(10.5 Knots)
14-32
(139.29 / 319.30) 98.44% 98.28% 98.98%
11-29
(108.54 / 288.54) 98.39% 98.29% 98.72%
Combined 99.28% 99.20% 99.56%
Conditions
Ceiling = All
Visibility = All
116,357 Observations
Ceiling ≥ 1,000’
Visibility ≥ 3 Miles
88,883 Observations
Ceiling < 1,000’ and ≥ 200’
Visibility < 3 Miles and ≥ ½-Mile
28,335 Observations
Source: Station 725224, New Philadelphia, Ohio (2006-2015).

Harry Clever Field Airport Master Plan Update
43
Figure 3-2
All Weather Wind Direction Analysis (2006-2015)
Source: Station 725224, New Philadelphia, Ohio (2006-2015).
Note: This graph illustrates the percentage of time all wind observations were coming from each direction from
2006 to 2015. The circles are shown in 1% intervals.
3.6 2014 Ohio Airports Focus Study
As described in the inventory chapter, the 2014 Ohio Airports Focus Study classifies airports
in the State of Ohio and identifies specific facility requirements that are intended to prioritize
key improvements in Ohio’s airport system in an effort to promote safety, efficiency, and
economic growth. The study identifies PHD as a Level 2 airport “that is intended to support
smaller corporate aircraft, such as small jets and turboprop aircraft, and meet many, but not
necessarily all, of their needs. This classification is intended to support a variety of uses
(business, pleasure, and training).” For a Level 2 airport, the study identifies a minimum
runway length requirement of 4,000 feet, GPS-based approach procedures with vertical
guidance (i.e., LPV), standard Runway Safety Areas (RSAs), fully-controlled Runway Protection
Zones (RPZs), fencing around the airfield, as well as other features that are currently available
at PHD. The requirements of the 2014 Ohio Airports Focus Study were reviewed as part of
this Master Plan Update and compared to the FAA procedures for determining facility
requirements; however, because this planning effort identified an existing and future critical
aircraft with an RDC of B-I (small aircraft), the study recommendations may not fully achieve
the requirements of the 2014 Ohio Airports Focus Study particularly when it comes to runway
length. This is primarily due to three factors: 1) the FAA guidelines may not justify the same
requirements, 2) there are various sensitive land uses, historic sites, and other constraints
that limit the ability to implement certain recommendations, and 3) the direction of the city
0°10°
20°30°
40°
50°
60°
70°
80°
90°
100°
110°
120°
130°
140°
150°160°
170°180°
190°200°
210°
220°
230°
240°
250°
260°
270°
280°
290°
300°
310°
320°
330°340°
350°
14
32

Harry Clever Field Airport Master Plan Update
44
and TAC at this time is to maintain the airport for small aircraft activity and to satisfy the
associated FAA requirements.
3.7 Runway Length Analysis
Runway length requirements were evaluated in accordance with FAA AC 150/5325-4B,
Runway Length Requirements for Airport Design (Runway Length AC). The Runway Length AC
presents methodologies for determining runway length requirements by aircraft type. Multiple
variables affect takeoff and landing length calculations including field elevation, average
maximum temperature during the hottest month, runway conditions (e.g., wet runway), takeoff
weight, and differences in runway end elevations. As previously shown in Table 1-5 and Figure
1-10, the average maximum temperature during the hottest month is 83.4° Fahrenheit and
occurs in July. Aircraft takeoff performance is maximized at lower elevations and colder
temperatures. The field elevation of PHD is 894.4 feet Above Mean Sea Level (AMSL) and
runway length requirements were only calculated for Runway 14-32 because it is the only
runway that is eligible for FAA funding at PHD. The turf runway (Runway 11-29) is used at the
discretion of pilots and its current length of 1,907 feet is unlikely to be extended during the
planning period.
The Runway Length AC contains various methodologies for determining recommended runway
lengths that are based on the type of aircraft utilizing the runway (e.g., small aircraft with less
or more than 10 passenger seats, corporate aircraft weighing more than 12,500 pounds but
less than 60,000 pounds, and large aircraft weighing more than 60,000 pounds and regional
jets). The category that is applicable to PHD is for small aircraft with less than 10 passenger
seats. The Runway Length AC identifies two different runway length requirement curves for
those airports based on the characteristics of the local area and the airport activity—the ‘95
Percent of Fleet Curve’ and the ‘100 Percent of Fleet Curve.’
The ‘95 Percent of Fleet Curve’ “applies to airports that are primarily intended to serve
medium size population communities with a diversity of usage and a greater potential for
increased aviation activities. Also included in this category are those airports that are
primarily intended to serve low-activity locations, small population communities, and remote
recreational activities. Their inclusion recognizes that these airports in many cases develop
into airports with higher levels of aviation activity. For PHD, the ‘95 Percent of Fleet Curve’
runway length requirement is 3,200 feet. The ‘100 Percent of Fleet Curve’ is for an airport
that “is primarily intended to serve communities on the fringe of a metropolitan area or a
relatively large population remote from a metropolitan area.” For PHD, the ‘100 Percent of
Fleet Curve’ runway length requirement is 3,900 feet.
Based on the airport’s classification in the 2014 Ohio Airports Focus Study, the diversity of
aircraft activity, and the location in the City of New Philadelphia, the ‘100 Percent of Fleet
Curve’ and a runway length requirement of 3,900 feet are viewed as more appropriate for
PHD. The 2014 Ohio Airports Focus Study conducted a comprehensive evaluation of every
public airport in Ohio and determined that a similar runway length was appropriate for PHD to
serve the community and statewide airport system. Therefore, a runway length of 3,900 feet
is recommended for both takeoff and landing procedures at PHD, which is not currently
provided for all operations in all directions on Runway 14-32 due to the 330-foot-long
displaced threshold on the Runway 14 end that reduces the landing length on Runway 14 to

Harry Clever Field Airport Master Plan Update
45
3,621 feet (as opposed to the full runway length of 3,951 feet). Other RSA and Runway Object
Free Area (ROFA) issues need to be addressed beyond the ends of Runway 14-32, which may
further reduce the available runway length if corrective projects cannot be conducted.
3.8 Runway Strength Analysis
One of the most important features of airfield pavement is its ability to withstand repeated
use by the most weight-demanding aircraft operating at the airport. The current weight
bearing capacity of Runway 14-32 is 52,500 pounds for aircraft with a single-wheel
configuration, 67,500 pounds for aircraft with a dual-wheel configuration, and 140,000
pounds for aircraft with a dual tandem wheel configuration (refer to Figure 3-3). Therefore,
the runway pavement strength is sufficient for the critical aircraft. The actual pavement
strength requirements will be evaluated on a project-by-project basis as rehabilitation
becomes necessary and is determined during the design phase through a review of recent
and anticipated aircraft activity.
Figure 3-3
Aircraft Wheel Configurations
Single-Wheel (S) Dual-Wheel (D) Dual Tandem (2D)
Source: FAA Order 5300.7, Standard Naming Convention for Aircraft Landing Gear Configurations.
3.9 Airfield Design Standards Analysis
The runways, taxiway and aircraft parking aprons at PHD were analyzed for compliance with
FAA design standards and the ability to handle existing and forecast levels of demand. The
FAA defines the requirements for airfield design standards in AC 150/5300-13A, Airport
Design. These include numerous safety area and separation standards that must be followed
to ensure that aircraft have adequate wingtip-to-wingtip clearances, overrun protection, and
obstruction-free movement areas. Tables 3-4 and 3-5 summarize the airfield design
standards for existing conditions at PHD, with non-standard or non-preferential conditions
identified in red. Although many of the airfield design standards are self-explanatory,
important features such as the RSA, ROFA, and RPZ may require further definition. These
important features are discussed below and illustrated in Figure 3-4.
• Runway Safety Area (RSA) – The RSA is a rectangular surface that is centered on the
runway. The FAA dictates that RSAs shall be: “1) cleared and graded and have no
potentially hazardous ruts, humps, depressions, or other surface variations; 2) drained
by grading or storm sewers to prevent water accumulation; 3) capable, under dry
conditions, of supporting snow removal equipment, aircraft rescue and firefighting
equipment, and the occasional passage of aircraft without causing structural damage
to the aircraft; and 4) free of objects, except for objects that need to be located in the

Harry Clever Field Airport Master Plan Update
46
RSA because of their function.” As shown in Figure 3-4, the RSA beyond the west end
of Runway 14-32 (Runway 14 end) extends outside the airport property over Delaware
Drive Southeast and into East Avenue Cemetery. The RSA beyond the south end of
Runway 11-29 (Runway 11 end) also extends over Delaware Drive Southeast and into
Evergreen Burial Park. It will be necessary to provide resolutions for the non-standard
RSAs at PHD in accordance with FAA Order 5200.8, Runway Safety Area Program.
Alternatives may include the application of declared distances in order to publish what
runway lengths are available for takeoff and landing calculations, threshold
relocations, runway length reductions, and others to comply with FAA criteria.
Furthermore, the RSA beyond the Runway 29 end extends over the Runway 14-32 RSA,
which is often viewed as a non-preferential scenario. In such cases, the FAA may
recommend that the portion of the RSA beyond the runway end be corrected so that it
no longer overlaps the RSA of the other runway.
• Runway Object Free Area (ROFA) – The ROFA must be clear of ground objects
protruding above the RSA edge elevation and is a rectangular surface that is centered
on the runway. The ROFA is intended to “enhance the safety of aircraft operations by
having the area free of objects, except for objects that need to be located in the ROFA
for air navigation or aircraft ground maneuvering purposes.” The ROFAs beyond the
ends of Runways 11 and 14 are non-standard because they extend off the airport
property and over roads and cemeteries. Opportunities for correcting those non-
compliant ROFAs will also be explored as part of this Master Plan Update.
• Runway Protection Zone (RPZ) – The RPZs extend off the airport property beyond all
four runway ends at PHD. “The RPZ’s function is to enhance the protection of people
and property on the ground. This is achieved through airport owner control over RPZs.
Such control includes clearing RPZ areas (and maintaining them clear) of incompatible
objects and activities. Control is preferably exercised through the acquisition of
sufficient property interest in the RPZ.” In 2012, the FAA issued a memorandum on
Interim Guidance on Land Uses Within a Runway Protection Zone. The information in
the memorandum will be used to coordinate any potential changes to the RPZs with
the FAA. For the RPZs that currently extend off the airport property, some degree of
control should be implemented (e.g., acquisition, easement, or zoning) in order to
maintain land use compatibility within the vicinity of PHD and to allow the airport to
remove obstructions beyond the runway ends. As mentioned in the inventory chapter,
a key recommendation of this Master Plan Update is for the City of New Philadelphia
to adopt zoning regulations to protect the airspace surrounding PHD in accordance
with Ohio law and Federal Aviation Regulation (FAR) Part 77, Safe, Efficient Use, and
Preservation of the Navigable Airspace.
• Runway Centerline to Parallel Taxiway Centerline Separation – For RDC B-I (small
aircraft) runways, the standard runway centerline to parallel taxiway centerline
separation is 150 feet. The current separation between Runway 14-32 and Taxiway A
is 134 feet. Because of the non-standard separation, Taxiway A is closed when aircraft
are utilizing Runway 14-32. Therefore, alternatives to correct the non-standard
separation are evaluated in the next chapter of this Master Plan Update.

Harry Clever Field Airport Master Plan Update
47
Table 3-4
Runway 14-32 Design Standards Evaluation Design Standard Required Dimension Runway 14 Evaluation Runway 32 Evaluation
Runway Design Code (RDC) B-I (Small Aircraft)
Runway (RW) Approach Visibility Minimums Varies by End 1-Mile Visual
RW Width 60 Feet Meets Standards
RW Safety Area (RSA) Width 120 Feet 14 (Extends Off Airport Over Road and Cemetery)
32 (Meets Standards) RSA Length Beyond RW End 240 Feet
RW Object Free Area (ROFA) Width 250 Feet 14 (Extends Off Airport Over Road and Cemetery)
32 (Meets Standards) ROFA Length Beyond RW End 240 Feet
RW Obstacle Free Zone (ROFZ) Width 250 Feet 14 (Extends Off Airport Over Road and Cemetery)
32 (Meets Standards) ROFZ Length Beyond RW End 200 Feet
RW Protection Zone (RPZ) Inner Width 250 Feet 14 (Extends Off Airport Over Incompatible Land Uses)
32 (Extends Off Airport Over Incompatible Land Uses) RPZ Outer Width 450 Feet
RPZ Length 1,000 Feet
RW Blast Pad Width 80 Feet Meets Standards (Turf is Acceptable for ADG I)
RW Blast Pad Length 60 Feet
RW Shoulder Width 10 Feet Meets Standards (Turf is Acceptable for ADG I)
Taxiway (TW) Width (TDG-1A) 25 Feet Fillet Improvements to be Evaluated
TW Safety Area (TSA) Width 49 Feet Meets Standards
TW Object Free Area (TOFA) Width 89 Feet Meets Standards
Taxilane (TL) Object Free Area Width 79 Feet Meets Standards
TW Shoulder Width (TDG) 12.5 Feet Meets Standards
RW Centerline to Parallel TW Centerline 150 Feet 135 Feet
RW Centerline to Holdline 125 Feet Meets Standards
RW Centerline to Aircraft Parking Area 125 Feet Meets Standards
TW Centerline to Parallel TW/TL Centerline 70 Feet Meets Standards
TW Centerline to Fixed or Movable Object 44.5 Feet Meets Standards
TL Centerline to TL Centerline 64 Feet N/A
TL Centerline to Fixed or Movable Object 39.5 Feet Meets Standards
RW Surface Gradient and Line of Sight Maximum 2.0% Grade Meets Standards
Source: Michael Baker International, Inc., 2016.
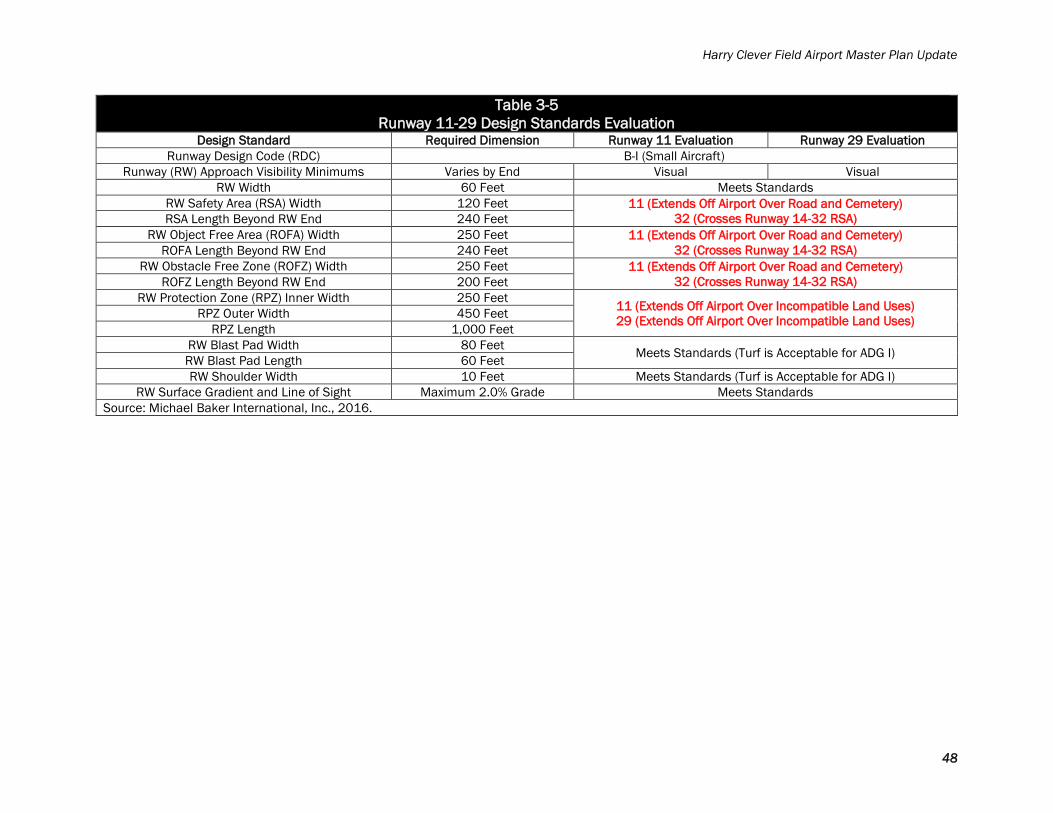
Harry Clever Field Airport Master Plan Update
48
Table 3-5
Runway 11-29 Design Standards Evaluation Design Standard Required Dimension Runway 11 Evaluation Runway 29 Evaluation
Runway Design Code (RDC) B-I (Small Aircraft)
Runway (RW) Approach Visibility Minimums Varies by End Visual Visual
RW Width 60 Feet Meets Standards
RW Safety Area (RSA) Width 120 Feet 11 (Extends Off Airport Over Road and Cemetery)
32 (Crosses Runway 14-32 RSA) RSA Length Beyond RW End 240 Feet
RW Object Free Area (ROFA) Width 250 Feet 11 (Extends Off Airport Over Road and Cemetery)
32 (Crosses Runway 14-32 RSA) ROFA Length Beyond RW End 240 Feet
RW Obstacle Free Zone (ROFZ) Width 250 Feet 11 (Extends Off Airport Over Road and Cemetery)
32 (Crosses Runway 14-32 RSA) ROFZ Length Beyond RW End 200 Feet
RW Protection Zone (RPZ) Inner Width 250 Feet 11 (Extends Off Airport Over Incompatible Land Uses)
29 (Extends Off Airport Over Incompatible Land Uses) RPZ Outer Width 450 Feet
RPZ Length 1,000 Feet
RW Blast Pad Width 80 Feet Meets Standards (Turf is Acceptable for ADG I)
RW Blast Pad Length 60 Feet
RW Shoulder Width 10 Feet Meets Standards (Turf is Acceptable for ADG I)
RW Surface Gradient and Line of Sight Maximum 2.0% Grade Meets Standards
Source: Michael Baker International, Inc., 2016.

Delaware Drive SE
E High Avenue
Univers
ity D
rive N
E
Skinner Drive SE
US 250
E High Avenue
Delaware Drive SE
EvergreenBurial Park
Terminal Apron
Runway 14-32 (3,951' x 100')
CalvaryCemetery
SchoenbrunnVillage
Taxiway A
Exist. Runway 11-29 (1,907' x 7
0')
East AvenueCemetery
R.J. Corman Railroad
11
29
B C D
330'DisplacedThreshold
B
240'240'
85.1'
240'
120'
250'
120'
250'
Taxiway A
Off-AirportApproach RPZ(8.035 Acres)
Off-AirportApproach RPZ(3.855 Acres)
Off-AirportApproach RPZ(8.035 Acres)
Off-AirportApproach RPZ(5.765 Acres)
Off-AirportDeparture RPZ(7.699 Acres)
21.7'
Non-StandardRSA / ROFA (Typ.)
134'
State Of OhioProperty LeasedTo City (4.1 Acres)
Property Line
Harry Clever Field Airport
Figure 3-4 Airfield Design Standards Analysis
Scale: 1" = 450 Feet
0 450' 900'0
N

Harry Clever Field Airport Master Plan Update
50
3.10 Other Airfield Considerations
FAA Engineering Brief 75 (EB-75), Incorporation of Runway Incursion Prevention into Taxiway
and Apron Design, provides guidance on design strategies of taxiways and aprons to help
prevent runway incursions (the FAA defines a runway incursion as any unauthorized intrusion
onto a runway, regardless of whether or not an aircraft presents a potential conflict).
According to EB-75, “these design strategies are only recommendations. They are not a set
of standards that must be followed whenever possible. Airfield design is often a process that
must balance safety, efficiency, capacity, and other factors. There will be cases where the
strict application of these recommendations is unjustified and unwise. Instead, use the
recommendations as a checklist to insure the runway incursion aspects of any design
proposal are properly considered.” Many of these recommendations have also been
incorporated into FAA AC 150/5300-13A, Airport Design.
• Limit the number of aircraft crossing an active runway
o The preference is for aircraft to cross in the last third of the runway whenever
possible, since within the middle third of the runway the arriving/departing
aircraft is usually on the ground and traveling at a high rate of speed
• Optimize pilots’ recognition of entry to the runway (increase situational awareness)
through design of taxiway layout, for example:
o Use a right angle for taxiway-runway intersections (except for high speed exits)
o Limit the number of taxiways intersecting in one spot
o Avoid wide expanses of pavement at runway entry
• Insure the taxiway layouts take operational requirements and realities into account to:
o Safely and efficiently manage departure queues
o Avoid using runways as taxiways
o Use taxiway strategies to reduce the number of active runway crossings
o Correct runway incursion “hot spots”
EB-75 presents several additional design recommendations for preventing runway incursions
such as avoiding taxiways that provide direct access between a runway and aircraft parking
area. At PHD, Taxiways C and D provide direct access between Runway 14-32 and the
terminal apron. The direct connections should be removed in order to reduce the potential
for a runway incursion to occur at PHD. The wide expanses of taxiway pavement at each end
of Runway 14-32 should also be corrected for the same reason.
It is also noted that FAA AC 150/5300-13A, Airport Design, contains new taxiway fillet
geometry that now calls for additional pavement at taxiway turns. The taxiway fillet geometry
is reviewed in conjunction with the alternatives analysis.
3.11 Airfield Lighting, Markings, Signage, and Navigational Aids
Based on the findings from the inventory of existing conditions, the following sections describe
the requirements for airfield lighting, markings, signage, and navigational aids at PHD.
Harry Clever Field Airport Master Plan Update
51
3.11.1 Airfield Lighting
The airfield lighting at PHD consists of Medium Intensity Runway Lights (MIRLs) along the
edges of Runway 14-32, which is recommended for the non-precision approach to Runway
14, as well as Runway End Identifier Lights (REILs) beyond each runway end. The turf runway
(Runway 11-29) is not equipped with runway lighting and is strictly for visual operations.
Medium Intensity Taxiway Lights (MITLs) are provided along the taxiway edges.
3.11.2 Airfield Markings
Pavement markings are designed according to the FAA AC 150/5340-1L, Standards for
Airport Markings (Markings AC). Both ends of Runway 14-32 have non-precision markings
that conform to what is required for runways less than 4,200 feet in length. At this time, visual
markings would be the standard marking for the Runway 32 end because it does not have
any published instrument approach procedures. The Markings AC contains the policy
identified below for runway landing designator markings, which indicates that runway ends
should be numbered based on the nearest magnetic heading. The current magnetic runway
heading of Runway 14-32 is 147° / 327° and the current magnetic heading of Runway 11-
29 is 117° / 297°. Therefore, to comply with the Markings AC, Runway 14-32 should be
renumbered as 15-33 and Runway 11-29 should be renumbered as 12-30.
FAA Policy on Runway Landing Designator Marking (FAA AC 150/5340-1L)
For single runways, dual parallel runways, and triple parallel runways, the designator number is the
whole number nearest the one-tenth of the magnetic azimuth along the runway centerline when
viewed from the direction of approach. For example, where the magnetic azimuth along the runway
centerline is 183 degrees, the runway designator marking would be 18; for a magnetic azimuth of 87
degrees, the runway designation marking would be 9. For a magnetic azimuth ending in the number
“5” such as 185 degrees, the runway designator marking may be either 18 or 19.
3.11.3 Airfield Signage
The guidelines for airfield signage are provided in FAA AC 150/5340-18F, Standards for
Airport Sign Systems (Signage AC). Because there is currently no airfield signage at PHD, an
airfield signage project should be conducted to comply with the Signage AC. A sample of
airfield signage at an airport at a single runway is provided in Figure 3-5. Such a project would
be conducted in conjunction with other airfield improvement improvements (e.g., parallel
taxiway relocation).
3.11.4 Navigational Aids and Obstruction Removal
Navigational aids (NAVAIDs) are visual or electronic devices that provide information or
position data to aircraft in flight. At PHD, the main NAVAID improvement is to repair the
Precision Approach Path Indicator (PAPI) for Runway 14 approaches. No other NAVAID-related
improvements were identified for PHD except for routine replacements of existing equipment
(e.g., beacon); however, the ability to provide improved instrument approach capability to both
ends of Runway 14-32 is evaluated as part of the alternatives analysis. It is noted that several
tree obstructions were identified by the FAA and the city was actively trying to remove the
obstructions. New obstacle survey was obtained for this Master Plan Update and a detailed
obstruction analysis was conducted for the Airport Layout Plan (ALP) set.

Harry Clever Field Airport Master Plan Update
52
Figure 3-5
Signing Example for an Airport with a Single Runway
Source: FAA AC 150/5340-18F, Standards for Airport Sign Systems (Figure 20).

Harry Clever Field Airport Master Plan Update
53
3.12 Transient Apron and Based Aircraft Storage
Apron and hangar requirements are calculated in consideration of the airport’s existing and
forecast based aircraft mix, owner storage preferences, and transient aircraft parking
demands. In previous years, it was assumed that a certain percentage of based aircraft,
mostly single and multi-engine pistons, would desire apron tie-down parking because it is the
lowest cost storage option. Today, most owners want to be able to protect their aircraft from
poor weather and vandalism and therefore opt for hangar storage. The following sections
describe the requirements for transient apron space and based aircraft storage during the
planning period.
3.12.1 Transient Apron
The transient aircraft parking area at PHD is located on the terminal apron. The apron was
expanded to the west in the early 2000s to accommodate additional based and transient
aircraft parking and a new hangar development. There is additional space to provide
additional paved aircraft parking
positions where the turf tie-downs are
located to the east of the terminal
apron. Transient apron requirements
are typically calculated based on a
percentage of itinerant peak day
operations. By 2035, the number of
itinerant peak day operations is forecast
to reach 19. Assuming that half of those
operations will require transient aircraft
parking at PHD, it would equate to 9.5
aircraft. Therefore, it may ultimately be
beneficial to provide additional paved
tie-down positions to be able to
accommodate demands during peak
periods at PHD.
3.12.2 Based Aircraft Storage
There are several different types of based aircraft storage facilities available at PHD including
paved and turf tie-downs, T-hangars, corporate hangars, and smaller bulk hangars. For this
analysis, it was assumed that all forms of based aircraft storage are currently full at PHD;
therefore, in order to accommodate any new based aircraft, the construction of a new facility
would be required. The forecast of based aircraft estimates that 20 additional based aircraft
will be at PHD by 2035 including 15 additional single-engine pistons, two multi-engine pistons,
one turboprop, and two helicopters. Much of that growth is expected after a new 10-unit T-
hangar facility is constructed in 2017. Table 3-6 illustrates the based aircraft storage
requirements that are anticipated by 2035 at PHD including three additional paved tie-downs,
14 additional T-hangar units, and 14,000 additional square feet of conventional hangar
space.

Harry Clever Field Airport Master Plan Update
54
Table 3-6
2035 Based Aircraft Storage Requirements Apron Tie-Down T-Hangar Conventional Hangar
2035 Requirement Calculation
Aircraft Piston Turboprop Helicopter
Requirement % 20% 0% 0%
2035 Requirement 3 0 0
3 Tie-Downs Required by 2035
2035 Requirement Calculation
Aircraft Piston Turboprop Helicopter
Requirement % 80% 0% 0%
2035 Requirement 14 0 1
14 T-Hangar Bays Required by 2035
2035 Requirement Calculation
Aircraft Type Piston Turboprop Helicopter
Requirement % 0% 100% 100%
2035 Requirement 0 1 2
SF Requirement 2,000 SF 10,000 SF 2,000 SF
2035 Requirement 0 SF 10,000 SF 4,000 SF
14,000 SF of Conventional Hangar Space Required by 2035
Source: Michael Baker International, Inc., 2016.
Note: The sample piston, jet, turboprop, and
rotorcraft aircraft shown in this table are provided
for illustration purposes only.

Harry Clever Field Airport Master Plan Update
55
3.13 Airport Support Facilities
Support facilities are those airport features that are not necessarily specific to aircraft
operations, movement, and storage, but which are vital to ensuring the efficiency, safety, and
persistency of aircraft activity. For PHD, the existing support facilities consist of the FBO,
airport fueling facilities, and automobile parking and access. A review of PHD’s existing
support facilities is presented in the following sections.
3.13.1 Fixed Base Operator (FBO)
The airport’s FBO, ProAv Aviation Services, operates out of the terminal building and aircraft
maintenance hangar. The FBO provides aircraft maintenance, flight training, avionics, and
aircraft rentals. There are currently no rental cars available from the FBO due to insurance
restrictions. During the first TAC meeting, there was a discussion about the limited
transportation options that are available in New Philadelphia and how it would be beneficial
for rental cars and possibly bicycles to be available for aircraft passengers. Those are often
business-related decisions that need to be determined by the FBO and airport sponsor.
Considering the various opportunities for growth that were identified by the TAC, the FBO and
city should consider what types of services would be beneficial to attract more visitors to the
airport.
3.13.2 Airport Fueling Facilities
As mentioned in the inventory chapter, the fuel tanks are located underground and include a
15,000 gallon Jet-A tank and two 10,000 gallon 100LL tanks that were installed in 2000. Jet-
A fuel is used by jets, turboprops, and some helicopters and 100LL fuel is used by pistons and
also some helicopters. The fuel at PHD is available 24 hours a day by credit card and is self-
service. Airport fuel storage requirements are often determined based on peak times when
the most flowage occurs. It is important to make sure the adequate fuel supplies are provided
for tenants and airport businesses that operate seven days a week. It is also important to be
able to purchase fuel in high volumes so that competitive pricing can be obtained. It is
anticipated that the fuel volumes are adequate for existing and forecast activity at PHD;
however, the location of the fuel tanks along the back side of the terminal apron takes up
space that may be better utilized for hangar development. Furthermore, with increasing
regulations on Underground Storage Tanks (USTs), there may be a need to replace the tanks
with Aboveground Storage Tanks (ASTs) during the planning period. Therefore, the potential
for providing ASTs in a more appropriate location should be reserved for PHD.
3.13.3 Airport Access and Parking
The roadways in the vicinity of the airport are intended to provide adequate access to and
from the airport and the community. PHD is located along the main road that runs through
the City of New Philadelphia (East High Avenue) and is accessible from U.S. Interstate 77. No
major access or parking improvements are recommended for the airport, with the exception
of providing access to future facilities.
3.13.4 Airport Maintenance Facilities
Because airport maintenance facilities do not generate revenues, they are often located in
remote areas that are unlikely to be attractive to a potential business and they house the

Harry Clever Field Airport Master Plan Update
56
equipment necessary to maintain the airport property (lawn mowers, tractors, snow removal
equipment, etc.). Although most maintenance at PHD is conducted by the city, the need for
an airport-dedicated maintenance facility should be considered. If ultimately necessary, the
facility should be located in an area that would not be beneficial for aviation development.
3.14 Land Acquisition Requirements
The purpose of the land area requirements is to review the airport’s facilities in comparison
to FAA standards in order to identify additional property that may be required for inclusion into
the land property envelope. The additional properties may be necessary for land use
compatibility purposes, future development needs, to correct non-standard RSAs and ROFAs,
and/or to obtain control over an RPZ. For PHD, the main concern is to obtain control over the
RPZs via acquisition, easement, or zoning. Also, some of the RSA and ROFA correction
measures may require property acquisition in order to provide compliance with FAA standards.
The need to acquire property is further evaluated in later sections of this Master Plan Update
(e.g., the property that is leased from the state), as is the potential to sell/release portions of
the airport property for other purposes.
3.15 Airport Security Analysis
In May 2004, the Transportation Security Administration (TSA) released Security Guidelines
for General Aviation Airports. According to the TSA website, this document “constitutes a set
of federally-endorsed guidelines for enhancing airport security at general aviation facilities
throughout the nation. It is intended to provide general aviation airport owners, operators, and
users with guidelines and
recommendations that address aviation
security concepts, technology, and
enhancements.”
To assist in defining which security
methods are most appropriate for a general
aviation airport, the document includes an
Airport characteristics Measurement Tool
(ACMT) that is used to assess the
recommended security characteristics for
general aviation airports. First, each airport
is assigned a certain point value that is
calculated considering the airport’s
location, number and types of based aircraft, runway length, surface characteristics, and
number of and types of aircraft operations. For PHD, point value of 19 was calculated, which
means the security features shown within the 15-24 point range in Table 3-7 are
recommended. The city should use this table to determine if upgraded security features
and/or policies are needed for PHD.
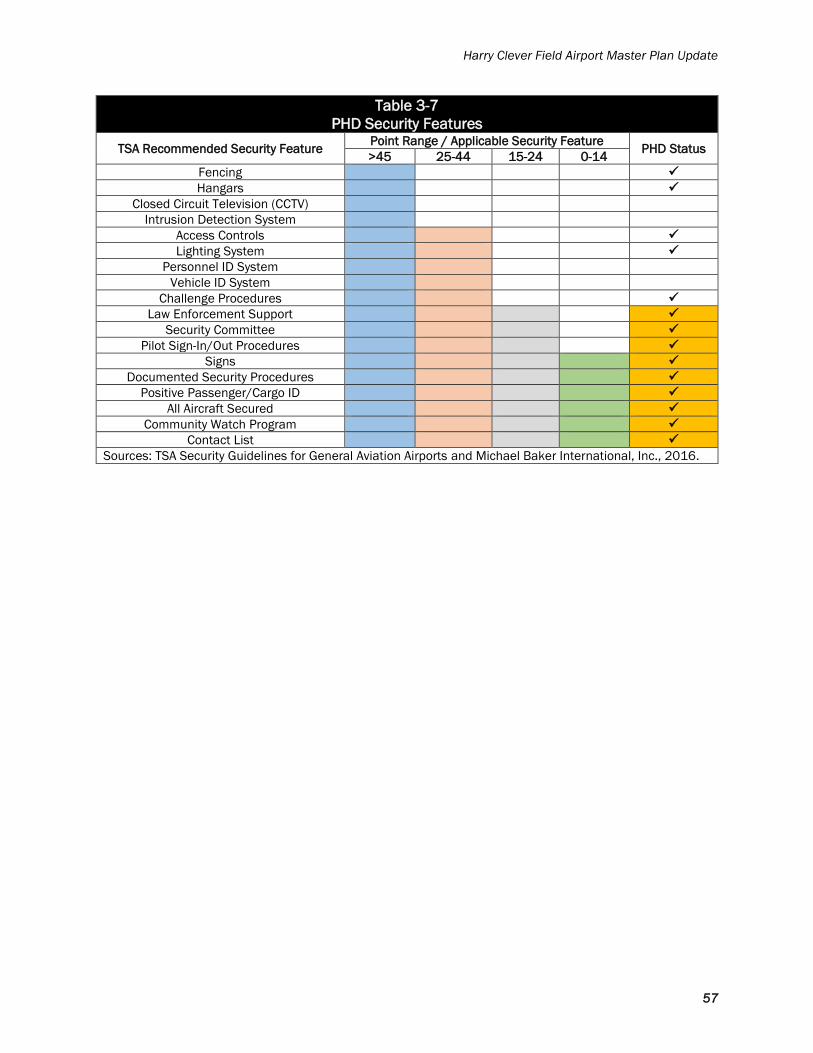
Harry Clever Field Airport Master Plan Update
57
Table 3-7
PHD Security Features
TSA Recommended Security Feature Point Range / Applicable Security Feature
PHD Status >45 25-44 15-24 0-14
Fencing ✓
Hangars ✓
Closed Circuit Television (CCTV)
Intrusion Detection System
Access Controls ✓
Lighting System ✓
Personnel ID System
Vehicle ID System
Challenge Procedures ✓
Law Enforcement Support ✓
Security Committee ✓
Pilot Sign-In/Out Procedures ✓
Signs ✓
Documented Security Procedures ✓
Positive Passenger/Cargo ID ✓
All Aircraft Secured ✓
Community Watch Program ✓
Contact List ✓
Sources: TSA Security Guidelines for General Aviation Airports and Michael Baker International, Inc., 2016.

Harry Clever Field Airport Master Plan Update
58
3.16 Summary
The facility requirements for PHD are summarized in Table 3-8. The remaining sections of
this report present the recommendations to satisfy these facility requirements during the 20-
year planning period.
Table 3-8
Summary of Facility Requirements Category Requirement
Critical Aircraft Beechcraft Baron 58
Runway Design Code (RDC) RDC B-I (Small Aircraft)
Taxiway Design Group (TDG) TDG-1A
Airfield Capacity No Improvements (Runway 14-32 is Sufficient)
Wind Analysis No Crosswind Runway is Needed (Runway 14-32 is Sufficient)
Runway Length Analysis Runway 14-32 (3,900 Feet for All Operations in All Directions)
Runway 11-29 (Use is Determined by Pilot)
Runway Strength Analysis No Improvements
Airfield Design Standards Various Non-Standard Issues (RSA, ROFA, ROFZ, RPZ, and Runway-
Taxiway Separation)
Other Airfield Considerations Remove Direct Taxiway Connections Between Runway and Terminal
Apron and Remove Wide Expanses of Taxiway Pavement
Airfield Lighting No Improvements
Airfield Markings
Based on Current Magnetic Headings, Runway 14-32 Should be
Renumbered as Runway 15-33 and Runway 11-29 Should be
Renumbered as Runway 12-30
Airfield Signage Airfield Signage Should be Provided
Navigational Aids Repair Runway 14 PAPI
Obstruction Removal Continue to Monitor and Evaluate
Approaches Publish Non-Precision Approach for Runway 32
Transient Apron Potentially Expand to Accommodate Long-Term Peak Demands
Based Aircraft Storage Add 3 Paved Tie-Downs, 14 T-Hangar Units, and 14,000 Square Feet
of Conventional Hangar Space
Fixed Base Operator (FBO) Consider Adding Rental Cars
Fueling Potentially Relocate and Install Aboveground Tanks
Access and Parking Provide Sufficient Access to Future Facilities
Airport Maintenance Facilities As Needed, Construct an Airport-Dedicated Maintenance Facility
Land Acquisition Evaluate in Conjunction with Alternatives
Airport Security Review Security Features and Policies
Security As necessary, update security procedures and features
Source: Michael Baker International, Inc., 2016.
Harry Clever Field Airport Master Plan Update
59
4.0 Preliminary Alternatives
The previous chapter of this Master Plan Update presented the facility requirements for the
Harry Clever Field Airport (PHD). The identified requirements include improvements to the
airfield for safety and conformance with design standards, expansion of aprons and additional
hangars in the landside area, and other support facility recommendations. Previous planning
efforts for PHD have recommended the ultimate closure of the turf runway (Runway 11-29).
During the second Technical Advisory Committee (TAC) meeting for this study that was held
on May 4, 2016, the group determined that Runway 11-29 should remain open because it is
frequently used during crosswind conditions and the turf surface is in good condition. Based
on the existing and forecast activity presented herein, the TAC also determined that the
asphalt runway (Runway 14-32) should remain in its current configuration and should be
maintained for regular use by “small aircraft,” which are defined by the Federal Aviation
Administration (FAA) as aircraft with a maximum takeoff weight of 12,500 pounds or less.
That also differs from previous planning efforts for PHD that have recommended a
realignment of Runway 14-32 to provide a longer pavement length and to accommodate
regular use by “large aircraft” (i.e., those aircraft with maximum takeoff weights greater than
12,500 pounds).
This chapter presents the preliminary alternatives for PHD, which are intended to illustrate
potential options for satisfying the identified requirements during the 20-year planning period
(2015 through 2035). The preliminary alternatives are intended for discussion purposes
between the various airport stakeholders including airport tenants, the TAC, City of New
Philadelphia, and the public. The individual components of each preliminary alternative were
evaluated to aid in the selection of a preferred alternative that represents the desired
development plan for PHD, which is presented in Chapter 5. For that reason, the preliminary
alternatives should be viewed as flexible development plans that may be refined or combined
to best satisfy the needs of the airport’s stakeholders. They are intended to provide a clear
understanding of the airport’s possibilities and limitations for airfield and landside
development. An evaluation of the following is presented in this chapter:
• Instrument Approaches
• Parallel Taxiway Alternatives
• Airfield Design Standards Alternative
• Land Use Analysis
• Landside Alternatives
• Support Facilities
Two separate meetings were held on September 14, 2016 to present the preliminary
alternatives to the TAC and public. The input and comments from those meetings were used
to determine the long-term recommended plan for PHD (i.e., the preferred alternative). It is
noted that the preliminary alternatives do not present all facilities and equipment that would
be needed during the 20-year planning period; rather, alternatives are shown to evaluate
potential impacts, understand the desires of airport stakeholders, and to provide sample
illustrations of what the airport is capable of accommodating. The preferred alternative and

Harry Clever Field Airport Master Plan Update
60
Airport Layout Plan (ALP) drawing set illustrate many of the more finite facilities with locations
dictated by the FAA and/or the ultimate layout of airfield and landside facilities.
4.1 Instrument Approaches
The purpose of the instrument approach evaluation was to determine what level of obstruction
removal may be necessary in order to provide clear approaches to both Runways 14-32 and
11-29. The obstruction removal requirements were evaluated for the Threshold Siting
Surfaces (TSS) beyond all four runway ends as well as the Precision Approach Path Indicator
(PAPI) Obstacle Clearance Surfaces (OCS) beyond the ends of Runway 14-32. Additional
surfaces were also evaluated within the ALP drawing set for this Master Plan Update, including
the Federal Aviation Regulations (FAR) Part 77 Approach Surface that is typically used to adopt
building height and land use restrictions around airports. The information presented in this
section is preliminary in nature and does not constitute a formal obstruction
removal/mitigation plan. The TSS and PAPI OCS are used by the FAA to evaluate whether one
or more of the following actions may be necessary.
• Obstacle clearing, marking, or lighting is necessary within the TSS.
• Displacement of the runway threshold is necessary because obstacles cannot be
cleared from the TSS, which results in a shorter landing distance.
• Modification of the approach glide path and/or threshold crossing height is necessary.
• Prohibition of nighttime operations may be necessary unless an approved Visual Glide
Slope Indicator (VGSI) is in use. A PAPI is an approved VGSI.
Figure 4-1 depicts the TSS and PAPI OCS associated with the approaches to Runway 14-32.
As shown, the TSS beyond the Runway 14 end is wider because of the non-precision GPS-
based approach that is published to that end, whereas all approaches to the Runway 32 end
are visual only; however, to evaluate the potential obstruction removal requirements if
Runway 32 were to be equipped with a non-precision GPS-based approach in the future, a
potential TSS is also shown beyond that runway end. A summary of the obstacle analysis for
Runway 14-32 is provided below.
• Runway 14 – Many TSS obstacles closest to the Runway 14 end and threshold are
fence and road penetrations. As you move further north of the Runway 14 end, most
TSS obstacles are larger trees primarily in residential areas and East Avenue
Cemetery. Trimming or removal of the tree penetrations within the TSS is
recommended, while it may be acceptable to mitigate for the close-in fence and road
penetrations by installing obstruction lighting. It is noted that the current PAPI glide
path angle provides mitigation for all but two TSS tree penetrations, which are
considered the two most critical obstacles within the Runway 14 approach.
• Runway 32 – The current TSS associated with the visual approach to Runway 32
contains a mix of road and tree penetrations, all of which are mitigated by the current
PAPI glide path angle. Trimming or removal of the tree penetrations within the TSS is
recommended, while it may be acceptable to mitigate for the close-in road
penetrations by installing obstruction lighting. If Runway 32 were to be equipped with
a non-precision GPS-based approach in the future, the TSS would increase in width

Harry Clever Field Airport Master Plan Update
61
and would contain additional road and tree penetrations, but it appears that the
current PAPI glide path angle would continue to provide mitigation for all obstacles
shown.
Figure 4-2 depicts the TSS associated with the approaches to Runway 11-29, which are visual
only approaches. A summary of the obstacle analysis for Runway 11-29 is provided below.
• Runway 11 – The Runway 11 TSS contains minor fence penetrations along Delaware
Drive Southeast and larger tree penetrations within Evergreen Burial Park. Various
options could be considered to mitigate for the penetrations such as the installation of
a PAPI (would not likely be eligible for FAA funding), tree trimming or removal, relocation
of the threshold, installation of obstruction lighting, or some combination thereof.
• Runway 29 – The Runway 29 TSS contains tree penetrations in residential areas to
the east and south of Runway 32. Similar mitigation options could be considered as
mentioned for Runway 11.
4.2 Parallel Taxiway Alternatives
The standard separation between runway centerline and parallel taxiway centerline is 150
feet for Runway Design Code (RDC) B-I runways that are designed for regular use by “small
aircraft.” Table 3-1 of FAA Order 5090.3C, Field Formulation of the National Plan of Integrated
Airport Systems (NPIAS), indicates that a “Full Parallel Taxiway” as a fundamental
development item for a NPIAS airport. Furthermore, according to Table 3-4 of AC 150/5300-
13A, Airport Design, a full-length parallel taxiway is recommended for runways with instrument
approach procedures with horizontal visibility minimums greater than or equal to one mile.
Because the separation between Runway 14-32 and parallel Taxiway A is currently 135 feet,
it does not meet FAA design standards. In some cases, the FAA will issue a Modification of
Airport Design Standards (MOS) if it can be shown that an existing non-standard condition
provides a reasonable level of safety for activity and there are no practicable alternatives
available to correct the configuration. At PHD, two practicable alternatives that were
evaluated in the 2013 ALP Update and were reevaluated with the new airport base mapping
survey that was collected for this master plan update.
Alternative 1 – Relocate Taxiway Centerline 15 Feet
As shown in Figure 4-3, Alternative 1 includes the relocation of the parallel taxiway centerline
by 15 feet towards the terminal apron to provide the standard runway-taxiway separation of
150 feet. The main benefit of Alternative 1 is that it does not shift the runway centerline,
which would require a reanalysis of various flight procedures and obstacle clearance
requirements, and higher costs associated with relocating lighting and navigational aids
(NAVAIDS) and re-grading the runway and surrounding surfaces. The Taxiway Object Free Area
(TOFA) illustrates the required clearance that must be met for RDC B-I “small aircraft.” The
TOFA under Alternative 1 would not impact any existing operations on the terminal apron and
would remain clear with a 15 foot shift of the parallel taxiway centerline. Furthermore, by
maintaining the centerline of Runway 14-32 versus shifting the runway centerline to the west,
it maximizes the amount of usable pavement available for both takeoff and landing
calculations. For example, as you slide the runway centerline further to the west, it gets closer

Harry Clever Field Airport Master Plan Update
62
to Delaware Drive Southeast and creates greater impacts to the Runway Safety Area (RSA)
and Runway Object Free Area (ROFA). Because the runway length requirement for Runway
14-32 was identified as 3,900 feet for all operations in all directions, it is critical that as much
of the pavement continues to remain available for both takeoff and landing calculations as
possible. The order-of-magnitude cost estimate for constructing Alternative 1 is $986,362.
Alternative 2 – Relocate Runway Centerline by 15 Feet
Alternative 2 includes the relocation of the runway centerline by 15 feet to the west to provide
the standard runway-taxiway separation of 150 feet (also shown in Figure 4-3), which would
require a reduction in the runway width to 70 feet. As mentioned in the description of
Alternative 1, the runway centerline relocation would require a reanalysis of various flight
procedures and obstacle clearance requirements and would have high costs associated with
relocating lighting and NAVAIDS and re-grading the runway and surrounding surfaces.
Additionally, Alternative 2 would slide the runway centerline closer to Delaware Drive
Southeast and would reduce the usable pavement available for both takeoff and landing
calculations, which would further reduce the ability of Runway 14-32 to meet the identified
requirement of 3,900 feet for all operations in all directions. The order-of-magnitude cost
estimate for constructing Alternative 2 is $2,148,132.
Preferred Parallel Taxiway Alternative
Due to the limited impacts associated with constructing Alternative 1 (no relocation of the
runway centerline, maximum preservation of runway length, no impacts to existing facilities,
reduced costs, etc.), the relocation of the parallel taxiway centerline by 15 feet towards the
terminal apron is considered the preferred alternative for satisfying the required 150 foot
runway-taxiway separation at PHD. Alternative 1 would provide a $1,161,770 savings over
Alternative 2 and could be more effectively implemented in a streamlined manner and could
be phased to prevent impacts to airport operations.
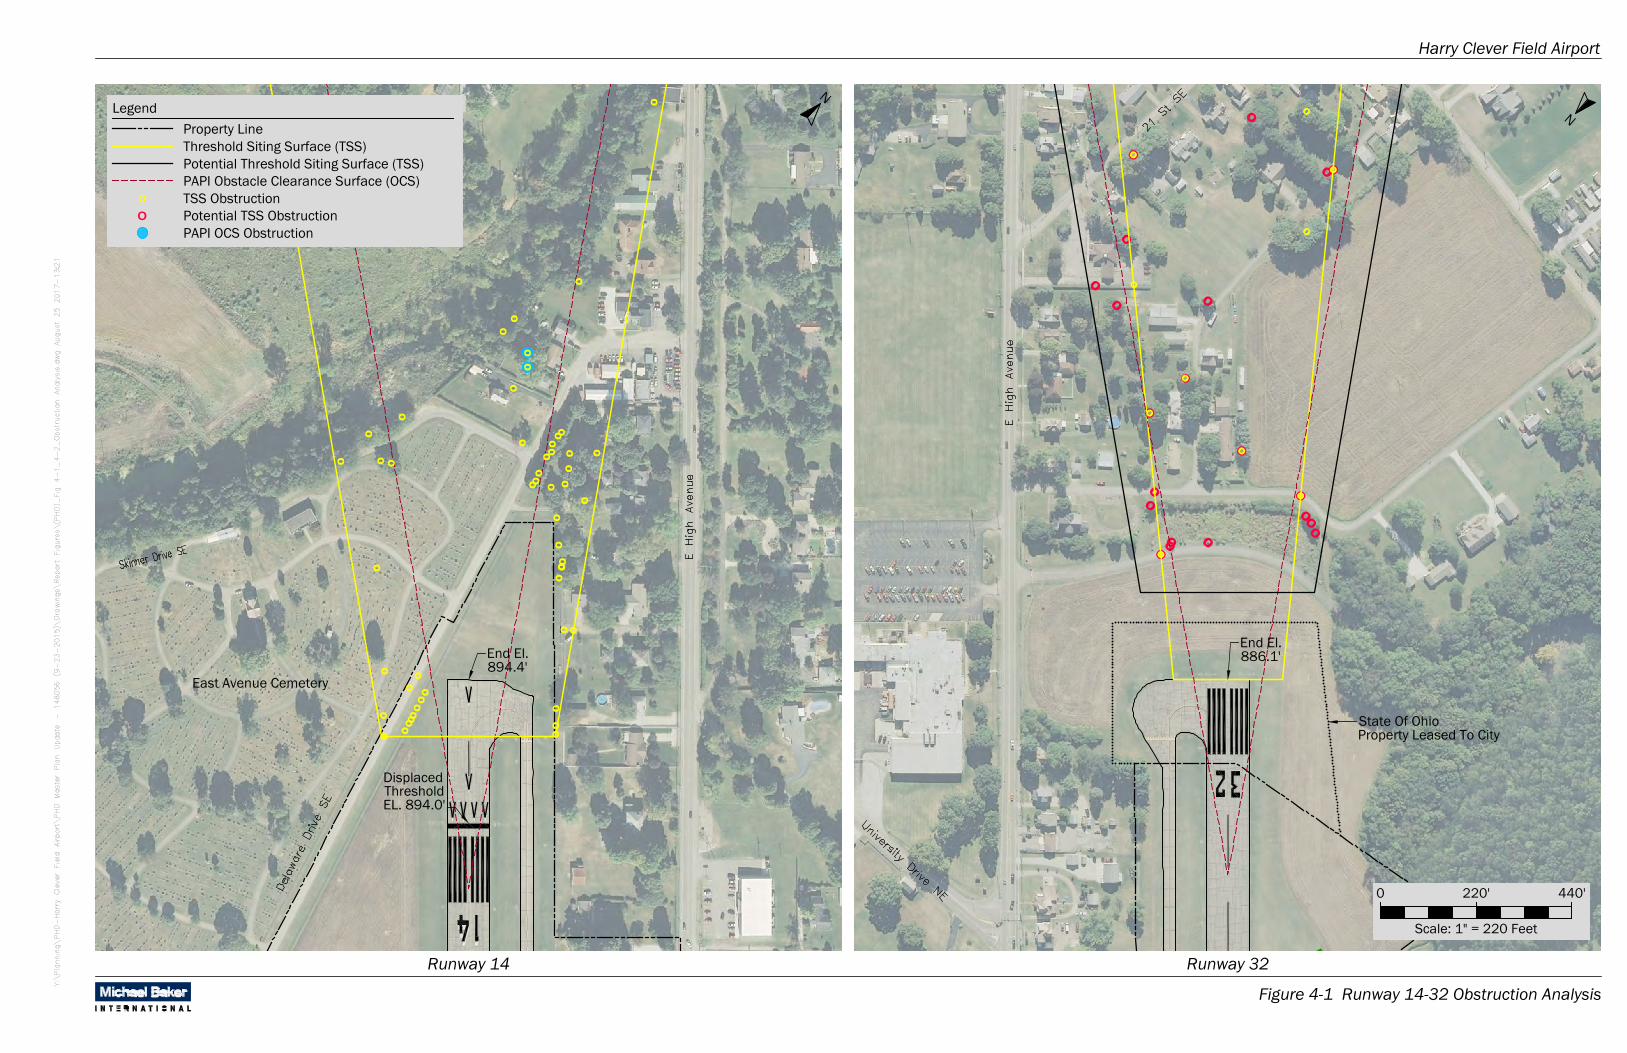
East Avenue Cemetery O
O
O O
OO O
O OO O
O
OOO
O OO
O
OO
OO
OO O
OO
OO
OO OO
O
O
O
O
OO
OO
OO
OO
O
O
DisplacedThresholdEL. 894.0'
End El.894.4'
OO
O
OO O OOOO
O
OO O
O
O
O
O
O
O
O
O
OO
O
O
O
O
O
O
O
O
O
O
End El.886.1'
State Of OhioProperty Leased To City
Harry Clever Field Airport
Figure 4-1 Runway 14-32 Obstruction Analysis
N
0 220' 440'
Scale: 1" = 220 Feet
Runway 14 Runway 32
O
LegendN
TSS Obstruction
Threshold Siting Surface (TSS)
PAPI Obstacle Clearance Surface (OCS)
PAPI OCS Obstruction
Property Line
O Potential TSS Obstruction
Potential Threshold Siting Surface (TSS)

Evergreen Burial Park
Exist. Runway 11-29 (1,907' x 70')
11
OO
O
O
O O O O
End El.891.1'
Taxiw
ay A
29
OOO
O
End El.886.0'
State Of OhioProperty Leased To City
Harry Clever Field Airport
Figure 4-2 Runway 11-29 Obstruction Analysis
N
Runway 11 Runway 29
O
Legend
TSS Surface ObstructionThreshold Siting Surface (TSS)
0 220' 440'
Scale: 1" = 220 Feet
N
Property Line
AutoCAD SHX Text
Delaware Drive SE
AutoCAD SHX Text
University Drive NE

ROFA Penetrated by Fence
150'
29 Property Line (Typ.)
ADG I TOFA
317'
Non-Standard RSA / ROFA
Runway 14-32 (3,951' x 100')
Potential Pavement (Typ.)
30
ROFA Penetrated by Fence
150'
29
ADG I TOFA
345'
Non-Standard RSA / ROFA
30
Runway 14-32 (3,951' x 70')
Harry Clever Field Airport
Figure 4-3 Parallel Taxiway Alternatives
NN
Parallel Taxiway Alternative 2 - Relocate Runway Centerline 15' & Reduce Runway Width to 70'
Parallel Taxiway Alternative 1 - Relocate Taxiway Centerline 15'
0 300' 600'
Scale: 1" = 300 Feet

Harry Clever Field Airport Master Plan Update
66
4.3 Airfield Design Standards Alternative
The airfield design standards alternative includes several improvements to correct non-
standard and non-preferential conditions at PHD including RSA and ROFA, runway incursion
prevention recommendations in accordance with FAA Engineering Brief 75 (EB-75),
Incorporation of Runway Incursion Prevention into Taxiway and Apron Design, and changes in
taxiway fillet/turn geometry as dictated in FAA Advisory Circular (AC) 150/5300-13A, Airport
Design. The airfield design standards alternative is illustrated in Figure 4-4 and is discussed
in the following order: 1) correction of non-standard RSA and ROFA, 2) runway incursion
prevention recommendations, and 3) taxiway fillet geometry recommendations.
4.3.1 Correction of Non-Standard RSA and ROFA
As shown in Figure 4-4, the RSA and ROFA of primary concern at
PHD are located beyond the Runway 14 end where they extend
over Delaware Drive Southeast and into East Avenue Cemetery,
which are non-standard for those protective surfaces. The ROFA
is penetrated by the airport fence approximately 77 feet before the
Runway 14 end and is the first point along the entire runway where
a ROFA violation occurs. According to AC 150/5300-13A, Airport
Design, the FAA may issue a Modification of Standards (MOS) for
“Any approved nonconformance to FAA standards, other than
dimensional standards for RSAs, applicable to airport design,
construction, or equipment procurement project that is necessary
to accommodate an unusual local condition for a specific project
on a case-by-case basis while maintaining an acceptable level of
safety.” Therefore, it is necessary to resolve the non-standard RSA
at PHD based on one of the strategies identified in FAA Order
5200.8, Runway Safety Area Program (RSA Program Order). As
listed below, the RSA Program Order recommends that several
different alternatives be considered in the determination of a
preferred correction measure.
a. Relocation, shifting, or realignment of the runway.
b. Reduction in runway length where the existing runway length exceeds that which is
required for the existing or projected design aircraft.
c. A combination of runway relocation, shifting, grading, realignment, or reduction.
d. Declared distances.
e. Engineered Materials Arresting Systems (EMAS).
At PHD, the following criteria were established to make the ultimate determination regarding
the non-standard RSA: 1) no road relocations, property acquisitions, or grave site relocations
were considered appropriate to provide compliant RSA, 2) it is desirable to maintain as much
runway length as possible, and 3) EMAS are not applicable corrective measures for PHD
because they are intended for 1,000 foot long RSAs, which are crushable concrete blocks that
slow and stop an aircraft during an emergency. There is already a critical shortage of available
grave plots within the city and it was deemed to be overly cost-prohibitive and sensitive
relocate roads and grave sites simply to obtain a minimal amount of useable runway length.

Harry Clever Field Airport Master Plan Update
67
The TAC and city collectively determined that previous recommendations that illustrated large-
scale property acquisition, runway realignment, and grave and road relocations should no
longer be carried forward as the recommended development for PHD. Therefore, declared
distances was considered the most appropriate corrective measure for PHD. In general, the
entire length of a runway might not be declared available for aircraft takeoff and/or landing
calculations because of issues such as non-standard RSA or ROFA length beyond a runway
end, obstructions to approach or departure surfaces, or other property conflicts associated
with movement of Runway Protection Zones (RPZs). The declared distance calculations are
defined below.
• Takeoff Run Available (TORA) – The runway length declared available and suitable for
the ground run of an airplane taking off. The entire runway length is typically declared
available for TORA, unless obstructions to the departure surface or property conflicts
make movement of the departure RPZ infeasible. General aviation aircraft usually
follow TORA when evaluating takeoff requirements, as opposed to commercial and
corporate aircraft that have stricter operating requirements.
• Takeoff Distance Available (TODA) – The TORA plus the length of any remaining
clearway beyond the far end of the TORA. At PHD, TODA should always be equal to the
runway length.
• Accelerate-Stop Distance Available (ASDA) – The distance to accelerate from brake
release to V1 (i.e., takeoff decision speed) and then to decelerate to stop, plus safety
factors. ASDA is the runway length available during an aborted takeoff and is used by
commercial and corporate aircraft to evaluate takeoff requirements. Restrictions to
ASDA occur when there is insufficient RSA length beyond a runway end.
• Landing Distance Available (LDA) – The distance from the threshold to complete the
approach, touchdown, and decelerate to stop, plus safety factors. If the full runway is
not available for landing, a displaced threshold is typically provided to indicate the
point where aircraft can touchdown. Common impacts to LDA include obstructions to
the approach surface, property conflicts that make movement of the approach RPZ
infeasible, and insufficient RSA length prior to the landing threshold.
The bottom half of Figure 4-4 illustrates the declared distances that would need to be
published in order to provide standard RSA and ROFA beyond the Runway 14 end. The main
differences are that the ASDA and LDA calculations would be reduced to 3,364 feet for
Runway 36 operations. Although a reduction in any usable runway length is not ideal for PHD,
a potential reduction may be necessary to meet standards, particularly considering the desire
not to conduct an overly costly and controversial project to extend the runway and acquire
property at this time.

120'
250' 25
0'12
0'
240'
Standard RSA /ROFA (On LeasedState Property)
ROFA Penetratedby Fence
240'
30
77'
29
CityCemetery
ExistingNon-StandardRSA / ROFA
Pavement Removal (Typ.)
Potential Pavement (Typ.)
Property Line (Typ.)
Runway 14-32 (3,951' X 100')
30 29
CityCemetery
240'
120'25
0'
PotentialStandardRSA /ROFA Standard RSA /
ROFA (On LeasedState Property)
240'
250'
120'
120' Runway 14-32 (3,951' X 100')
Declared Distances Alternative (No Physical Changes to the Runway)
Existing RSA / ROFA Deficiencies
Harry Clever Field Airport
Figure 4-4 Design Standards Alternative
0 300' 600'
Scale: 1" = 300 Feet
NN
Runway 14 TODA (3,951')Runway 14 TORA (3,951')Runway 14 LDA (3,621')
Runway 14 ASDA (3,951')
Runway 32 TODA (3,951')Runway 32 TORA (3,951')Runway 32 LDA (3,634') Runway 32 ASDA (3,634')

Harry Clever Field Airport Master Plan Update
69
4.3.2 Runway Incursion Prevention Recommendations
In accordance with EB-75 and AC 150/5300-13A, Airport Design, several airfield
improvements are recommended to improve situational awareness for pilots and to prevent
the chance for incursions. The recommendations include the following and are depicted in
Figure 4-4:
• Removal of excess pavement.
• Removal of direct connections from runways to aircraft parking areas.
• Correction of complex intersections and hot spot.
Where appropriate, other taxiway improvements may be considered as part of the preferred
alternative to further enhance traffic flows at PHD.
4.3.3 Taxiway Fillet Geometry Recommendations
Taxiway fillet geometry was recently revised with the release of AC 150/5300-13A, Airport
Design, to include additional pavement at curves and intersections. The purpose was to
improve the standards for cockpit over centerline steering, which is intended to reduce the
potential for aircraft excursions from the pavement surface. It is likely that these projects
would be conducted in conjunction with taxiway rehabilitation projects during the planning
period.
4.4 Land Use Analysis
The purpose of this analysis was to evaluate vacant parcels on the airport property in terms
of their potential use, aircraft and automobile access, allowable construction elevations, and
feasibility of development. This land use analysis should provide the airport with information
that will be useful for identifying suitable sites for potential tenants. As shown in Figure 4-5,
11 vacant parcels were identified on the airport property and are evaluated in Table 4-1. The
graphic illustrates a relocation of the Automated Surface Observing System (ASOS) on the
south side of the airport to an area that would maximize the hangar development
opportunities on the property while meeting the FAA’s ASOS siting criteria. According to FAA
Order 6560.20B, Siting Criteria for Automated Weather Observing Systems, “It is desired that
all obstructions (e.g., vegetation, buildings, etc.) be at least 15 feet lower than the height of
the [wind] sensor within the 500 foot radius and be no greater than 10 feet above the sensor
from 500 to 1,000 feet.” Because wind sensors are typically installed at a height of 30 to 33
feet above ground level, it is desirable to prevent constructing facilities (i.e., obstructions)
close to the sensor that may impact the reliability of the ASOS weather reports. This analysis
did not consider the impacts to the farming activities that occur on the airport property
because priority was given to aviation development.

12
30
Evergreen BurialPark
Terminal Apron
CalvaryCemetery
SchoenbrunnVillage
Runway 11-29 (1,907' x 70')
East AvenueCemetery
135' 150'
Taxiway A
B
ExistingASOS
RelocatedASOS
Relocated ASOSClearance Area(500' Radius)
Existing ASOSClearance Area(500' Radius)
25'
Railroad
C
Taxi
way
B
Taxiway A
D
1 2.1 Ac.
20.7 Ac.
3 3.3 Ac.
4 5.0 Ac.
5 2.9 Ac.
61.0 Ac.
7 0.5 Ac.
80.1 Ac.
9 0.3 Ac.
100.1 Ac.
110.7 Ac.
Property Line (Typ.)
Potential Pavement (Typ.)
Runway 14-32 (3,951' x 100')
Harry Clever Field Airport
Figure 4-5 Land Use Analysis
N
0 300' 600'
Scale: 1" = 300 Feet
Legend
Property LinePotential Airfield PavementPavement RemovalExpansion Area

Harry Clever Field Airport Master Plan Update
71
Table 4-1
Land Use Analysis
Expansion Area Approximate
Acreage
Min / Max Elevation
Above Nearest Point of Runway
Potential
Use
Aircraft / Automobile
Access
Development
Considerations
1 2.1 7’ to 20’ Aviation/Rural Aviation – Future parallel taxiway or from Taxiway B
Automobile – Delaware Drive Southeast
The only foreseeable aviation use for this area would be an
aircraft parking apron.
2 0.7 20’ to 50’ Aviation/Rural Aviation – Taxiway B
Automobile – Delaware Drive Southeast
This would be a good area to consider the development of several
smaller hangars with direct access from Taxiway B.
3 3.3 7’ to 20’ Aviation Aviation – Future parallel taxiway
Automobile – By connection to Delaware Drive Southeast
The only foreseeable aviation use for this area would be an
aircraft parking apron.
4 5.0 20’ to 40’ Aviation/Rural Aviation – Future parallel taxiway and existing taxilanes
Automobile – By connection to Delaware Drive Southeast This area should be reserved for long-term hangar development.
5 2.9 Max 15’ Aviation Aviation – Future parallel taxiway
Automobile – By connection to Delaware Drive Southeast
The only foreseeable aviation use for this area would be an
aircraft parking apron or lower profile buildings.
6 1.0 10’ to 30’ Non-Aviation/Rural Aviation – N/A
Automobile – Delaware Drive Southeast
This area is not needed for aviation purposes, but cannot contain
high structures.
7 0.5 10’ to 30’ Non-Aviation/Rural Aviation – N/A
Automobile – N/A
This area is not needed for aviation purposes, but cannot contain
high structures.
8 0.1 10’ to 25’ Aviation Aviation – Existing taxiway network
Automobile – East High Avenue
This area was identified as a potential site for aboveground fuel
tanks.
9 0.3 0’ Aviation Aviation – Existing taxiway network
Automobile – East High Avenue
The only foreseeable aviation use for this area would be an
aircraft parking and circulation.
10 0.1 15’ to 25’ Aviation Aviation – Existing taxiway network
Automobile – East High Avenue
A hangar could be developed in this area, particularly if the
underground fuel tanks are removed.
11 0.7 0’ Aviation Aviation – Existing taxiway network
Automobile – East High Avenue
The only foreseeable aviation use for this area would be an
aircraft parking and circulation.
Source: Michael Baker International, Inc., 2016.

Harry Clever Field Airport Master Plan Update
72
4.5 Landside Alternatives
Landside alternatives are intended to illustrate hypothetical examples of how hangar and
apron developments could be arranged at an airport. In the case of PHD, there are very few
development opportunities remaining along the terminal apron and along East High Avenue,
and for that reason, the southern portion of the property needed to be evaluated for its
development potential. The envelope on the south side of the property is currently limited by
the presence of Delaware Drive Southeast, required separations from both runways, and the
required clearance area around the existing ASOS. Therefore, relocating the ASOS to a
location that would allow for the most development potential on the south side of the airport
is viewed as a critical project for PHD. Both of the landside development alternatives illustrate
a relocation of the ASOS to a site near the segmented circle, which would free up an area that
could then be used for the construction of several large hangars.
Development Alternative 1 is illustrated in Figure 4-6. This area shows some improvements
in the terminal area that include removing the underground fuel tanks and replacing them
with aboveground fuel tanks in the northern corner of the Terminal Apron, which would free
up space for the construction of a new hangar in the middle of the Terminal Apron. The
aboveground tanks could be accessed directly from Taxiway A with a new connector to the
Terminal Apron. Additional paved tie-downs could also be constructed on the southern portion
of the Terminal Apron. On the southern portion of the property, this alternative shows 31 T-
hangar units, 13 small box hangars, and three larger corporate hangars. Without the
relocation of the existing ASOS, it is possible that many of the illustrated facilities would
negatively impact the reliability of the wind sensor (including 18 T-hangar units, 10 small box
hangars, and three larger corporate hangars). A paved tie-down apron is shown adjacent to
the three larger corporate hangars, as well as an aircraft wash rack. The taxilane for the paved
tie-down apron could help to provide improved access for operations on Runway 11-29. The
purpose of illustrating various types of developments on the south side of the property is to
show that the property has the flexibility to accommodate a wide range of potential users.
Some of the developments could be accessed by the public and could therefore support a mix
of aviation-related businesses, a flight school, etc. Although the illustrated development in
this alternative far exceeds the forecast based aircraft demands during the 20-year planning
period, it helps show the development potential for PHD and may serve as a marketing tool
for the airport to attract future lease and development opportunities. The two expansion areas
are locations that would not be valuable for aviation-related purposes.
Development Alternative 2 is illustrated in Figure 4-7 and is similar to Development Alternative
1, but with less intense development in the southern portion of the property where 25 T-
hangar units, nine small box hangars, and three larger corporate hangars are shown. Without
the relocation of the existing ASOS, it is possible that many of the illustrated facilities would
negatively impact the reliability of the wind sensor (including 12 T-hangar units, six small box
hangars, and three larger corporate hangars). This alternative also shows aboveground fuel
tanks on the large apron next to the three larger corporate hangars, which may be ideal if the
Fixed Base Operator (FBO) wanted to relocate to new facilities on the southern portion of the
property. With the less intense development under this alternative, an additional expansion
area becomes available that could be considered for non-aviation purposes.

12
30
Evergreen BurialPark
Terminal Apron
CalvaryCemetery
SchoenbrunnVillage
Exist. Runway 11-29 (1,907' x 7
0')
East AvenueCemetery
11
29
135'
80'x80'
150'
Taxiway A
B
ExistingASOS
RelocatedASOS
Relocated ASOSClearance Area(500' Radius)
Existing ASOSClearance Area(500' Radius)13
Unit52'x56' (3)
18 Unit
33'x42' (5)
33'x42' (5)
100'x100'(2)
25'
Railroad
10,000 GallonAboveground Tanks
WashRack
C
Taxi
way
B
Taxiway A
D
Remove Underground Tanks
70'x85'
Runway 14-32 (3,951' x 100')
11.0 Ac.
2 0.5 Ac.
Harry Clever Field Airport
Figure 4-6 Development Alternative 1
N
0 300' 600'
Scale: 1" = 300 Feet
Box Hangar
T-Hangar
Legend
Property Line
Potential Airfield Pavement
Pavement Removal
Potential Road Pavement
Expansion Area

12
30
Evergreen BurialPark
Terminal Apron
CalvaryCemetery
SchoenbrunnVillage
Exist. Runway 11-29 (1,907' x 7
0')
East AvenueCemetery
11
29
135'
80'x80'
150'
Taxiway A
B
ExistingASOS
RelocatedASOS
Relocated ASOSClearance Area(500' Radius)
Existing ASOSClearance Area(500' Radius)
13Unit52'x56' (3) 33'x42' (3)
100'x100' (2)
25'
Railroad
10,000 GallonAboveground Tanks
WashRack
C
Taxi
way
B
Taxiway A
D
Remove Underground Tanks
12Unit
33'x42'(3)
70'x85'
Potential Pavement (Typ.)
Property Line (Typ.)
Runway 14-32 (3,951' x 100')
21.0 Ac.
3 0.5 Ac.
1.0 Ac.1
Harry Clever Field Airport
Figure 4-7 Development Alternative 2
N
0 300' 600'
Scale: 1" = 300 Feet
Box Hangar
T-Hangar
Legend
Property Line
Potential Airfield Pavement
Pavement Removal
Future Road Pavement
Expansion Area

Harry Clever Field Airport Master Plan Update
75
4.6 Support Facilities
Support facilities are those airport features that are not necessarily specific to aircraft
operations, movement, and storage, but which are vital to ensuring the efficiency, safety, and
persistency of aircraft activity. For PHD, the existing support facilities consist of the FBO
terminal area, airport fueling facilities, airport maintenance facility, and automobile parking
and access. The alternatives throughout this chapter illustrate opportunities for relocating
and improving many of the support facilities at PHD. In the next chapter of this master plan
update, the preferred alternative will identify the desired location and configuration of the
airport’s support facilities during the planning period.

Harry Clever Field Airport Master Plan Update
76
5.0 Preferred Alternative
5.1 Introduction
The previous chapter presented the preliminary alternatives for the Harry Clever Field Airport
(PHD). The preliminary alternatives included a mix of corrective actions for non-standard
airfield conditions (e.g., the runway centerline to parallel taxiway centerline separation and
removal of direct connections between Runway 14-32 and aircraft parking areas), new
taxiway infrastructure to support future landside development, and landside development
options for both sides of Runway 14-32. The third Technical Advisory Committee (TAC)
meeting was held on September 14, 2016 to discuss the preliminary alternatives, which was
immediately followed by a public meeting to present the initial findings of the Master Plan
Update. The TAC concluded that a combination of Development Alternative 1 (Figure 4-6) and
Development Alternative 2 (Figure 4-7) should be used to produce the preferred alternative
for PHD. The TAC and New Philadelphia Airport Commission (Airport Commission) also want
to pursue property acquisition along East High Avenue and beyond the Runway 32 end as it
becomes available and there is sufficient demand and funding to do so. This chapter presents
the preferred alternative for PHD as well as additional property analyses for parcels along East
High Avenue and within the approaches to both Runways 14-32 and 11-29. Although previous
planning efforts have shown the closure of Runway 11-29 (i.e., the turf runway), members of
the TAC, Airport Commission, and public expressed an interest in preserving the runway
because it: 1) is in good condition, 2) requires little to no maintenance, 3) serves a niche
aircraft and pilot market, and 4) is frequently used during crosswind conditions. After the
fourth TAC meeting was held on January 25, 2017, the preferred alternative was modified and
an environmental review was conducted to determine if any projects would have the potential
to create impacts. Airport noise exposure contours were also produced for the baseline year
of this master plan update (2015) and the last forecast year (2035). The following chapter
includes the costs estimates and a Capital Improvement Plan (CIP) with anticipated project
phasing and funding sources during the 20-year planning period.
The elements of the preferred alternative are conceptual in nature and are intended to
illustrate what can be done with the airport property should the demand and funding be
available to construct facilities. The following evaluations were conducted as part of this
chapter:
• Properties Analysis
• Runway Protection Zone (RPZ) Properties Analysis
• Summary of Preferred Alternative
• Noise Contours
• Environmental Review

Harry Clever Field Airport Master Plan Update
77
5.2 Properties Analysis
High Avenue (East and West) is the main thoroughfare in the City of New Philadelphia and
connects to U.S. Interstate 77. In addition to various dining, shopping, and entertainment
establishments, the John Knisely Municipal Centre (city hall) and the Tuscarawas County
Courthouse Annex (county administrative offices) are also located along East High Avenue.
Consequently, the airport’s East High Avenue border is the most highly-visible one and may
generate additional interest for development if properties can be acquired and redeveloped
for aviation purposes (e.g., hangar development). The Federal Aviation Administration (FAA)
provides the checklist shown in Table 5-1 to identify the process that should be followed when
Airport Improvement Program (AIP) grants are being utilized to acquire property; however, the
individual elements of the checklist may vary depending upon the scope of the property
acquisition and the funding source. FAA Advisory Circular (AC) 150/5100-17, Land
Acquisition and Relocation Assistance for Airport Improvement Program Assisted Projects,
provides detailed procedural guidance regarding property acquisition.
Table 5-2 and Figure 5-1 illustrate the properties analysis that was conducted for PHD. As
shown, parcels along East High Avenue and beyond the Runway 32 end were broken into
three priorities. All of the parcels shown are located within the municipal limits of the City of
New Philadelphia. The basic thought process behind the properties analysis was to continue
to expand out from the existing airport development by purchasing parcels as they become
available. The Priority 1 parcels include six state-owned parcels (28 through 31, 42, and 43)
that would be ideal to acquire in the short-term (in whole or in part). The city leases a portion
of Parcel 43 from the state for airport purposes. With the upcoming runway rehabilitation
project, the FAA requested that the city obtain long-term control over the section of Parcel 43
that is being used for airport purposes by either extending the lease or acquiring the property.
Acquisition of all or part of the six state-owned parcels would provide the city with indefinite
control over the properties and the potential to use portions of them for future airport
development. Furthermore, vehicles travelling on the access road to Schoenbrunn Village are
obstructions to the Runway 32 approach surface. It is recommended that the road be
relocated to a location where vehicles would no longer be obstructions, potentially off of 20th
Street Southeast.
Parcels 24 through 27 are also identified as Priority 1 parcels because of their proximity to
existing airport development along East High Avenue and near-central location along Runway
14-32. The parcels are owned by the same private property owner and contain a mix of retail
and commercial establishments. It is anticipated that the airport’s long-term (2035)
conventional hangar space requirement of 14,000 square feet could be achieved on the
Priority 1 parcels if they can be acquired and cleared. The next chapter of this study contains
additional details regarding potential property acquisition and facility development costs to
better illustrate the commitment that would be required to develop on the Priority 1 parcels.
Parcels 20 through 23 are identified as Priority 2 parcels and are located along Taxiway A
(near Taxiway B). These include a mix of residential and retail parcels that would likely be
considered for acquisition after the Priority 1 parcels. Parcels 1 through 19 and 32 through
41 are identified as the Priority 3 parcels because they are not located as central along
Runway 14-32 as the others and it is unlikely that the city would need to acquire them to meet
aviation demands during the 20-year planning period.

Harry Clever Field Airport Master Plan Update
78
Table 5-1
FAA Land Project Checklist Step Description
1 Develop Exhibit A Property Map that clearly delineates the land to be required.
2 Consult with the FAA Project Manager to verify that proposed parcels are identified on an approved
Airport Layout Plan (ALP).
3 Verify environmental requirements of the National Environmental Policy Act (NEPA) are met.
4 Prepare surveys and plats for proposed property acquisition.
5 Order preliminary title search to confirm ownership and encumbrances on property title.
6 Select and negotiate contract for qualified appraiser and review appraiser.
7 Select and negotiate contract for Environmental Site Assessment (ESA) consultant (if not completed
in project planning phase).
8 Select and negotiate contract for qualified land acquisition and relocation consultant, if required.
9 Conduct Environmental Site Assessment of property suspected of being contaminated.
10 Prepare relocation plan if there are any persons to be displaced.
11 Perform appraisals and appraisal review, and approve appraised fair market value. The property
owner shall be given the opportunity to accompany the appraiser on the inspection of the property.
12 Submit appraisal and review appraisal reports to the FAA if required by project manager.
13 Make written offer of just compensation. At initiation of negotiations, provide general notice of the
property owner's rights and entitlements on the acquisition of their property and an explanation of
the relocation assistance and payment entitlements. Provide notice of relocation eligibility to
displaced persons.
14 Negotiate purchase agreement. If reasonable attempts to negotiate an agreement or acceptable
settlement are unsuccessful, the acquisition may be referred to the sponsor's attorney for
condemnation under the airport's eminent domain authority.
15 Closing/court award, title conveyance, and schedule possession of acquired property. (Sponsor's
attorney / title company /escrow agent.)
16 Complete relocation assistance for displaced persons. Assure a comparable replacement dwelling
has been made available for all persons displaced from their residence, (as applicable).
17 Clear property for project use.
18 Furnish project application with Exhibit A Property Map and land acquisition cost breakdown sheet,
Certification of Environmental Site Assessment, Certificate of Title, and Sponsor Certification for Real
Property.
19 Execute grant agreement.
20 Submit final Outlay Report and Request for Reimbursement for Construction Programs (Form SF-
271) and make final drawdown.
Source: FAA Land Project Checklist.

Harry Clever Field Airport Master Plan Update
79
Table 5-2
Properties Analysis by Priority Priority Graphic Parcel ID County Parcel ID Acres Class Appraised Value
Priority 1 Parcels (As Warranted and Available)
1 24 43-02571-000 0.60 Retail $24,080
1 25 43-02572-000 0.60 Retail $32,330
1 26 43-02573-000 0.29 Retail $150,330
1 27 43-02574-000 0.42 Commercial $11,580
1 28 43-08489-000 0.33 State $20,600
1 29 43-08491-000 0.22 State $248,260
1 30 43-07317-000 0.29 State $90,170
1 31 43-08490-000 0.19 State $53,540
1 42 43-07310-000 0.37 State $0
1 43 43-07308-000 15.56 State (Partial Pursuit) $135,300
Priority 1 Totals 18.88 $766,190
Priority 2 Parcels (As Warranted and Available)
2 20 43-03702-000 0.61 Residential $194,570
2 21 43-04372-000 0.37 Residential $80,350
2 22 43-04372-002 1.02 Retail $206,000
2 23 43-04089-000 0.30 Residential $93,380
Priority 2 Totals 2.30 $574,300
Priority 3 Parcels (As Warranted and Available)
3 1 43-05163-000 0.27 Commercial $39,950
3 2 43-05162-000 0.30 Commercial $81,520
3 3 43-06063-000 0.57 Residential $134,040
3 4 43-02799-000 0.64 Residential $120,090
3 5 43-00881-000 0.49 Residential $102,990
3 6 43-04142-000 0.17 Residential $7,630
3 7 43-04142-001 0.17 Residential $7,630
3 8 43-04143-000 0.36 Residential $108,400
3 9 43-02546-000 0.15 Residential $4,200
3 10 43-02545-000 0.52 Residential $146,930
3 11 43-03274-000 0.33 Residential $113,820
3 12 43-03276-000 0.07 Residential $6,470
3 13 43-03275-000 0.26 Residential $9,570
3 14 43-06332-000 0.48 Residential $120,230
3 15 43-00235-000 0.48 Residential $140,720
3 16 43-00236-000 0.09 Residential $3,810
3 17 43-03827-001 1.15 Residential $206,830
3 18 43-03827-002 0.63 Residential $22,590
3 19 43-02421-000 0.52 Residential $101,220
3 32 43-00173-000 0.68 Residential $86,850
3 33 43-02943-000 0.62 Residential $111,010
3 34 43-02944-001 0.62 Residential $107,340
3 35 43-01982-000 0.29 Car $61,420
3 36 43-01984-000 0.08 Car $6,710
3 37 43-01985-000 0.26 Residential $93,660
3 38 43-00888-000 0.54 Residential $58,600
3 39 43-00887-000 0.54 Residential $58,600
3 40 43-01537-000 0.06 Residential $69,960
3 41 25-01755-000 0.03 Unplatted $250
Priority 3 Totals 11.37 $2,133,040
Totals (All Parcels) 28.83 $3,473,530
Sources: Tuscarawas County Auditor and Michael Baker International, Inc., 2017.

Evergreen BurialPark
Terminal Apron
CalvaryCemetery
SchoenbrunnVillage
Exist. Runway 11-29 (1,907' x 7
0')
East AvenueCemetery
11
29
Taxiway A
B
Railroad
C
Taxi
way
B
Taxiway A
D
E High Ave
Univers
ity D
r NE
Skinner Ln SE
Delaware Dr SE
Runway 14-32 (3,951' x 100')
16
1 2 3 4 5 6 7 8 9 10 11 14 15 17 18 19
12
13 20 21 22 23 24 25 26 2728 29
30 31
36
32 33 34 35 37 38
41
40
39
42
43
20' BRL
Approach RPZDeparture RPZ
Approach RPZ
Approach RPZ
Approach RPZ
Harry Clever Field Airport
Figure 5-1 Properties Analysis
N
0 330' 660'
Scale: 1" = 330'
LegendProperty LineParcel LineParcel IDPriority 1Priority 2Priority 3
1-43

Harry Clever Field Airport Master Plan Update
81
5.3 Runway Protection Zone (RPZ) Properties Analysis
As mentioned in the facility requirements chapter, the RPZs extend off the airport property
beyond the four runway ends at PHD. According to FAA AC 150/5300-13A, “the RPZ’s function
is to enhance the protection of people and property on the ground. This is achieved through
airport owner control over RPZs. Such control includes clearing RPZ areas (and maintaining
them clear) of incompatible objects and activities. Control is preferably exercised through the
acquisition of sufficient property interest in the RPZ.” In 2012, the FAA issued a memorandum
called Interim Guidance on Land Uses Within a Runway Protection Zone. The guidance in the
memorandum must be used to coordinate any potential changes to RPZs with the FAA. For
the RPZs that currently extend off the airport property, some degree of control should be
implemented in order to maintain land use compatibility within the vicinity of PHD and to allow
the airport to remove obstructions beyond the runway ends.
Figure 5-2 illustrates 31 off-airport parcels where the RPZs extend over, with the exception of
property that is currently owned by the city and state. This graphic provides a preliminary look
at parcels where the city should implement some degree of control, but does not account for
other off-airport parcels where easements may be needed to clear approach surface
obstacles (e.g., trees), which will be identified in conjunction with the Airport Layout Plan (ALP)
drawing set for this study. There are several measures the city can consider to obtain control
over the RPZs including outright acquisition, easement, or by implementing zoning; however,
because some parcels extend outside the city limits primarily beyond the ends of Runways 11
and 32, the preferred degree of control needs to considered for each parcel.
At a minimum, zoning controls should be implemented to prevent the development of further
incompatible land uses within the RPZs and to restrict the height of new structures
surrounding the runways. Figure 5-3 illustrates a sample of the Federal Aviation Regulations
(FAR) Part 77 Imaginary Surfaces surrounding the runways at PHD. Because the Imaginary
Surfaces cross multiple jurisdictions in Tuscarawas County, it is anticipated that zoning for
PHD would have to be adopted in cooperation with the city, county, and other affected
jurisdictions. Chapter 4563 of the Ohio Revised Code (ORC) provides the guidance for
adopting federal obstruction standards and zoning regulations in accordance with FAR Part
77, Safe, Efficient Use, and Preservation of the Navigable Airspace. The city should review
the guidance and work with the county to establish those elements described in Chapter 4563
of the ORC.

Evergreen BurialPark
Terminal Apron
CalvaryCemetery
SchoenbrunnVillage
Exist. Runway 11-29 (1,907' x 7
0')
East AvenueCemetery
11
29
Taxiway A
B
Railroad
C
Taxi
way
B
D
E High Ave
Univers
ity D
r NE
Skinner Ln SE
Delaware Dr SE
Runway 14-32 (3,951' x 100')
12
1
2
1110
98
3 4 5 6 7
31
30
29
20 21
13 14 15 17
16
2223
25
24
26
27 28
18 19
Harry Clever Field Airport
Figure 5-2 RPZ Properties Analysis
N
0 425' 850'
Scale: 1" = 425'
LegendProperty LineParcel Line
Parcel IDRPZ Parcel
1-31City Limits

1,044.4'
1,100'
1,150'
1,200'
1,250'
1,050'
900'
950'
1,00
0'
1,04
4.4'
1,14
4.4'
'
900'
950'
1,00
0'
1,04
4.4'
1,13
6.1'900'
950'
1,000'1,044.4'
1,135.9'
900'950'1,000'
1,044.4'1,140.4'
4,00
0' C
onic
al S
urfa
ce(2
0:1
Slop
e)
NPI Approach(20:1 Slope)
HorizontalSurface
El. 1,044.4'
Airport El.894.4'
Visual Approach(20:1 Slope)
VisualApproach(20:1 Slope)
VisualApproach(20:1 Slope)
TransitionalSurface (7:1 Slope)14 End
El. 894.4'
11 EndEl. 890.4'
29 EndEl. 885.9'
32 EndEl. 886.1'
City Limits (TYP.)
N
0 2100' 4200'
Scale: 1" = 2100 Feet
Harry Clever Field Airport
Figure 5-3 Part 77 Airspace Drawing

Harry Clever Field Airport Master Plan Update
84
5.4 Summary of Preferred Alternative
The preferred alternative is illustrated in Figure 5-4 and includes a combination of
Development Alternative 1 (Figure 4-6) and Development Alternative 2 (Figure 4-7). The main
difference is that the preferred alternative shows additional hangar development options on
the Priority 1 parcels immediately adjacent to existing airport facilities. The primary airfield
improvements include the correction of the non-standard separation between the runway
centerline and parallel taxiway centerline from 135 feet to 150 feet, removal of direct
connections between the runway and aircraft parking areas, and additional taxiways to
improve aircraft traffic flows between both existing and future infrastructure. Based on the
current magnetic headings of both runways, the runway numbers should also be changed as
follows: 1) Runway 14-32 should be changed to Runway 15-33, and 2) Runway 11-29 should
be changed to Runway 12-30.
The preferred alternative also shows some improvements in the terminal area that include
removing the underground fuel tanks and replacing them with aboveground fuel tanks in the
northern corner of the Terminal Apron, which would free-up space for the construction of a
new hangar in the middle of the Terminal Apron. The aboveground fuel tanks could be
accessed directly from Taxiway A with a new connector to the Terminal Apron. Additional
paved tie-downs could also be constructed on the southern portion of the Terminal Apron.
On the opposite side of Runway 14-32, the preferred alternative shows 25 T-hangar units,
eight small box hangars, and three larger corporate hangars, with the relocation of the
Automated Surface Observing System (ASOS) to accommodate those developments. A paved
tie-down apron is shown adjacent to the three larger corporate hangars, as well as an aircraft
wash rack and aboveground fuel tanks. The taxilane for the paved tie-down apron would
provide improved access for operations on Runway 11-29. The purpose of illustrating various
types of developments along Delaware Drive Southeast is to show that the property has the
flexibility to accommodate a wide range of potential users. Some of the developments could
be accessed by the public and could support a mix of aviation-related businesses, a flight
school, or a relocated Fixed Base Operator (FBO) facility. Figure 5-5 illustrates a zoom-in of
this area to illustrate how the facilities could be fenced in order to prevent access to the
airfield.
Overall, the preferred alternative illustrates an additional 25 T-hangar bays (14 required by
2035), 20 paved tie-downs (three required by 2035), and 69,960 square feet of
corporate/box hangar space (14,000 square feet required by 2035). Although the illustrated
development far exceeds forecast demands during the 20-year planning period, it helps show
the development potential for PHD and may serve as a marketing tool for the airport to attract
future lease and development opportunities. The three expansion areas are locations that
would not be valuable for aviation development and could therefore be used for other non-
aviation purposes. The city needs to consider whether the expansion areas should remain
airport property or if it would be beneficial to request a land release from the FAA. If the
expansion areas are to remain airport property, all revenues generated from their use must
be used for airport purposes. If the city prefers to release the expansion areas from being
federally-obligated properties, additional steps and coordination with the FAA would need to
occur.

Harry Clever Field Airport Master Plan Update
85
The individual projects associated with the preferred alternative are summarized in the list
below. The ALP drawing set illustrates many of the more finite recommendations for the
airport, such as obstruction removal requirements and areas for property acquisition and
easements.
A. 13-Unit T-Hangar (Construct)
B. Relocate Parallel Taxiway A (Design/Construct)
C. 5,950 SF Hangar & Aboveground Fuel Tanks (Design/Construct)
D. Tiedowns (Construct)
E. 2-3,472 SF Hangars (Design/Construct)
F. 6-2,500 SF Hangars (Design/Construct)
G. 3-2,912 Hangars (Design/Construct)
H. New Partial Parallel Taxiway (Design/Construct)
I. 12-Unit T-Hangar & AWOS Relocation (Design/Construct)
J. 5-1,386 SF Hangars (Design/Construct)
K. New Partial Parallel Taxiway (Design/Construct)
L. 6,400 SF Hangar (Design/Construct)
M. 10,000 SF Hangar (Design/Construct)
N. 10,000 SF Hangar (Design/Construct)
O. New Apron & Aboveground Fuel Tanks (Design/Construct)
P. Acquire Property & Relocate Road
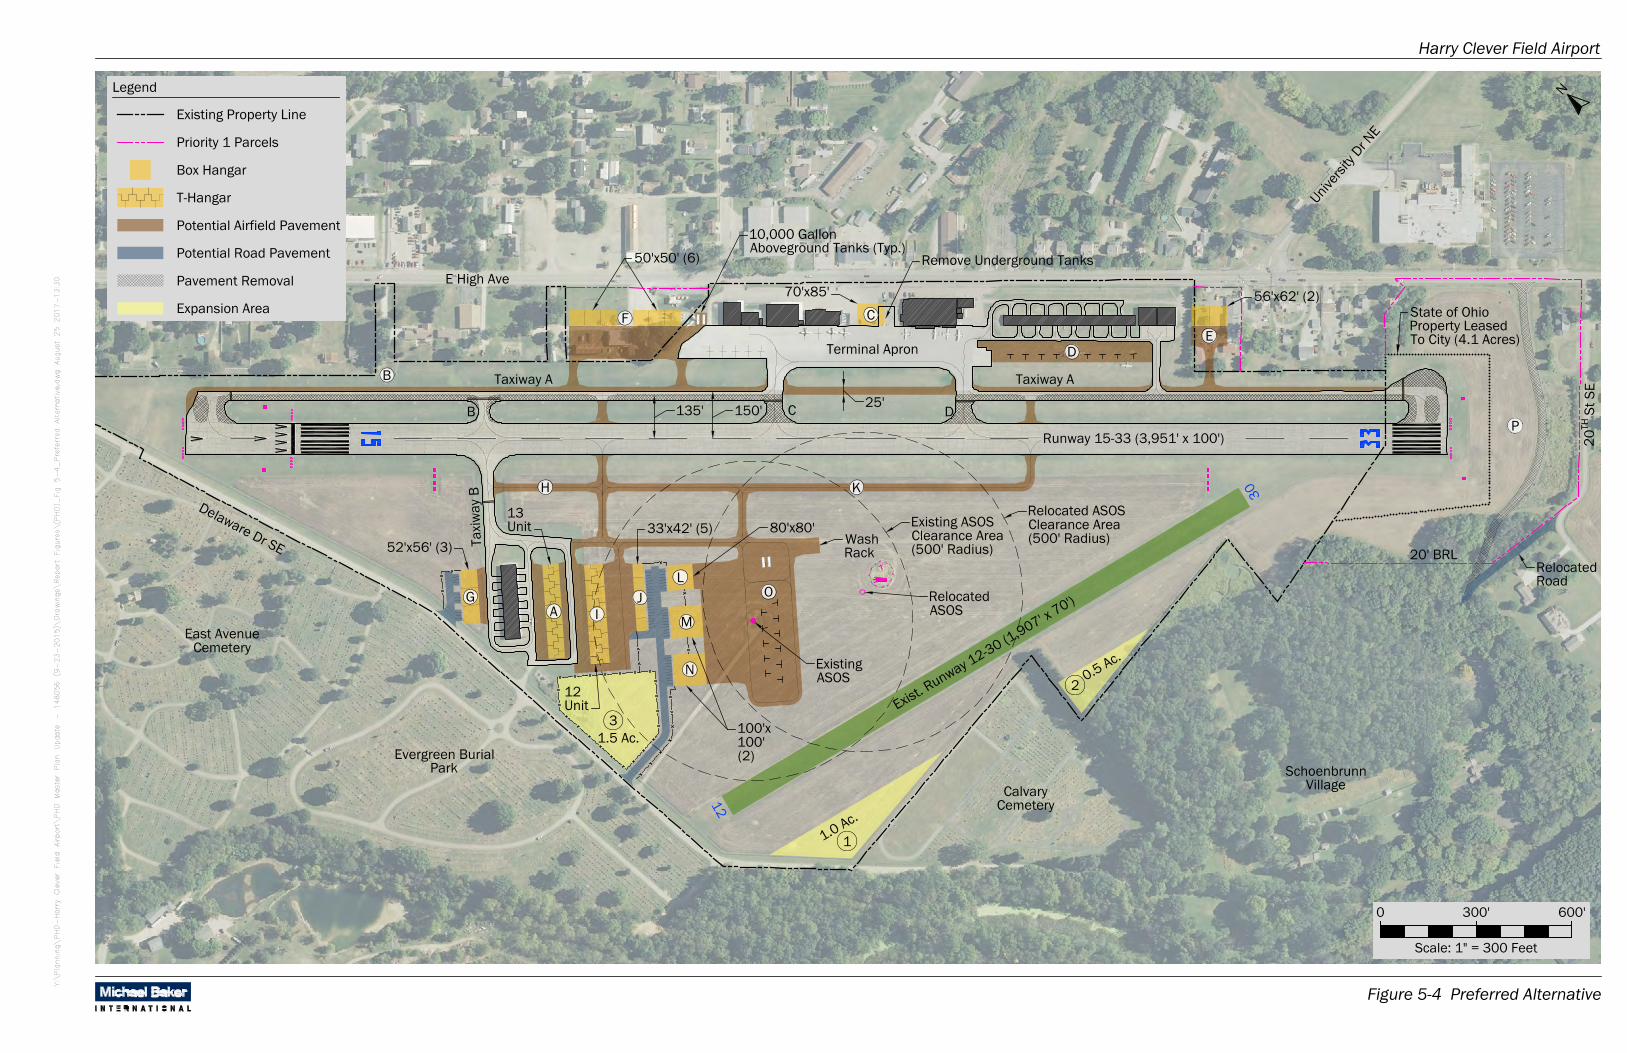
Evergreen BurialPark
Terminal Apron
CalvaryCemetery
SchoenbrunnVillage
Exist. Runway 12-30 (1,907' x 7
0')
East AvenueCemetery
12
30
135'
80'x80'
150'
Taxiway A
B
ExistingASOS
RelocatedASOS
Relocated ASOSClearance Area(500' Radius)
Existing ASOSClearance Area(500' Radius)
13Unit
52'x56' (3)
12Unit
33'x42' (5)
100'x100'(2)
25'
10,000 GallonAboveground Tanks (Typ.)
WashRack
C
Taxi
way
B
Taxiway A
D
Remove Underground Tanks
70'x85'E High Ave
Univers
ity D
r NE
Delaware Dr SE
11.0 Ac.
2 0.5 Ac.
Runway 15-33 (3,951' x 100')
50'x50' (6)
56'x62' (2)
RelocatedRoad
20TH
St S
E
20' BRL
1.5 Ac.
A
E
B
C
D
F
G
H
IJ
K
L
M
N
O
3
State of OhioProperty LeasedTo City (4.1 Acres)
P
Harry Clever Field Airport
Figure 5-4 Preferred Alternative
N
0 300' 600'
Scale: 1" = 300 Feet
Box Hangar
T-Hangar
Legend
Existing Property Line
Potential Airfield Pavement
Pavement Removal
Potential Road Pavement
Expansion Area
Priority 1 Parcels

EvergreenBurial Park
CalvaryCemetery
Exist. Runway 12-30 (1,907' x 7
0')
12
80'x80'
Existing ASOS
Relocated ASOS
Relocated ASOSClearance Area(500' Radius)
Existing ASOSClearance Area(500' Radius)
13 Unit
52'x56' (3)
12 Unit
33'x42' (5)WashRack
Taxiway B
Delaware Dr SE
11.0 Ac.
Runway 15-33 (3,951' x 100')
1.5 Ac.
A
G
H
I
J
K
L
M
N
O
3
100'x100'
100'x100'
Harry Clever Field Airport
Figure 5-5 Preferred Alternative (South Development Area)
0 150' 300'
Scale: 1" = 150 Feet
Box Hangar
T-Hangar
Legend
Existing Property Line
Potential Airfield Pavement
Pavement Removal
Potential Road Pavement
Expansion Area
N

Harry Clever Field Airport Master Plan Update
88
5.5 Noise Contours
The Aviation Environmental Design Tool (AEDT) is the FAA-approved computer program that is
used to generate airport noise contours and to evaluate incompatible noise exposure to
sensitive land uses such as residential properties, schools, places of worship, and hospitals.
The noise contours illustrate the Day-Night Average Sound Level (DNL) that occurs during an
average day and are generated by inputting various airport-specific factors into AEDT (aircraft
activity and fleet mix, flight tracks, runway utilization, day and night activity, etc.). According
to the FAA’s Environmental Desk Reference for Airport Actions, “DNL is the 24-hour average
sound level in decibels (dB). This average is derived from all aircraft operations during a 24-
hour period that represents an airport’s average annual operational day. […] DNL adds a 10
dB noise penalty to each aircraft operation occurring during nighttime hours (10 p.m. to 7
a.m.). DNL includes that penalty to compensate for people’s heightened sensitivity to noise
during this period.” The FAA identifies DNL levels of 65 dB and higher as incompatible with
noise sensitive land uses.
Using the latest version of AEDT (Version 2c), DNL noise contours were generated for the
following two scenarios at PHD: 1) existing 2015 activity levels, fleet mix, and runway
configuration, and 2) forecast 2035 activity levels, fleet mix, and runway configuration. The
AEDT inputs in Table 5-3 were derived from the fleet mix forecast in Table 2-7 and by reviewing
historical flight records to identify aircraft models that commonly operate at PHD. As shown
in Figure 5-6, portions of the DNL 65 dB contour extend off the airport under the existing and
forecast scenarios. The DNL 65 dB contour extends over sensitive land uses (e.g., residential
properties) under both scenarios. However, because there are not changes recommended
for the airfield, the impacts are associated with the natural growth in operations that is
forecast for the airport and not because of the study recommendations.
Table 5-3
Noise Inputs (2015 & 2035)
Aircraft Type Model 2015
Operations
2035
Operations
Single-Engine Piston (Turf Runway Activity) Cessna 172 4,000 4,000
Single-Engine Piston Cessna 182 11,238 18,834
Multi-Engine Piston Beechcraft Baron 58 1,147 1,719
Turboprop De Havilland Twin Otter 77 262
Jet (Small) Cessna Citation 2 22 45
Helicopter Bell 206 166 672
Source: Michael Baker International, Inc., 2016.

12
30
E High Ave
Univers
ity D
r NE
Skinner Ln SE
Delaware Dr SE
Runway 15-33 (3,951' x 100') 20TH
St S
E
State Of OhioProperty LeasedTo City
Harry Clever Field Airport
Figure 5-6 Noise Contours
N
0 350' 700'
Scale: 1" = 350 Feet
Legend
2015 65 DNL Noise Contour2035 65 DNL Noise Contour
Property Line

Harry Clever Field Airport Master Plan Update
90
5.6 Environmental Review
The following sections describe the necessary level of documentation and permitting that
would be associated with undertaking the projects proposed within the preferred alternative
in accordance with the National Environmental Policy Act (NEPA), and identify potential
environmental impacts that would be expected as a result of implementation of those
projects.
5.6.1 Potential NEPA Documentation
FAA Order 1050.1F, Environmental Impacts: Policies and Procedures, provides the FAA policy
and procedures to ensure compliance with the requirements of NEPA for FAA-funded projects
and lists the type of NEPA documentation required for each project type. Chapter 5 of that
document contains advisory and emergency actions and categorically excluded projects and
actions. Categorically excluded projects and actions are those that meet the criteria
contained in 40 CFR 1508.4 and represent actions that do not normally require an
Environmental Assessment (EA) or Environmental Impact Statement (EIS) and do not
individually or cumulatively have a significant effect on the environment. Chapter 3 of that
document provides a summary of requirements for environmental assessments [a summary
of Findings of No Significant Impact (FONSI) is provided in Chapter 6 of that document], and
lists examples of actions or projects that normally require an EA which includes but is not
limited to the following:
• Actions that are not categorically excluded
• Actions that are categorically excluded but involves at least one extraordinary
circumstance that may significantly impact the environment
• Actions that require land acquisition greater than three acres
• Federal financial participation in or unconditional airport layout plan approval of a
major runway extension
The examples were limited to those relevant to the projects proposed in the preferred
alternative. Subsequently, the proposed projects are not anticipated to require an EIS to meet
NEPA requirements.
5.6.2 Potential Regulatory Permits
Permitting requirements for each project type are based upon current federal, state, and local
environmental regulations. The following criteria were used to determine the potential
environmental permit that would be required for each project:
1. National Pollutant Discharge Elimination System (NPDES) Permit for
Construction Activity
An NPDES for Construction permit is required if the project area is greater than
one acre.
2. Section 404 Permit or Corps of Engineers (COE) Dredge and Fill Permit
Harry Clever Field Airport Master Plan Update
91
A Section 404 Permit is required if the project proposes to fill or dredge
wetlands that are waters of the U.S.
3. Ohio EPA Isolated Wetland Permit
An Isolated Wetland Permit is required if the project proposes to fill or dredge
into isolated wetlands that are not waters of the U.S.
5.6.3 Preferred Alternative Projects
The proposed projects of the preferred alternative were overlaid on the most recent aerial
photograph to determine if the projects could impact developed areas, wetlands, non-forested
uplands, and forested uplands. Table 5-4 identifies the potential environmental impacts
associated with the preferred alternative, the anticipated level of documentation and
regulatory permits that would be needed for each project such as a Categorical Exclusion or
Environmental Assessment (EA). The projects were divided into the following:
1. Projects with no potential environmental impact
2. Projects with potential protected species impact
3. Projects with potential wetland impact
Projects with No Potential Environmental Impacts
Projects with no potential environmental impacts are those located on developed areas on
the airport property (i.e., mowed upland or paved areas), do not require land acquisition, and
have a project area greater than one acre. Those projects are typically categorically excluded
and require a NPDES permit except when specifically identified in FAA Order 1050.1F such as
the construction of a fueling facility, major extension of a runway, etc. The projects under this
category are categorically excluded except for the road relocation land acquisition project
which normally requires an EA per FAA Order 1050.1F.
Projects with Potential Protected Species Impacts
Projects with potential protected species impacts are projects that are located in or near
habitat types that have the potential to contain state or federally listed species. The projects
proposed for the preferred alternative are not located on or near any habitats that are likely
to support state or federally listed species. None of the projects proposed are located in or
near any designated critical habitat for state or federally listed species.
Projects with Potential Wetland Impacts
Projects with potential wetland impacts are projects that are located in areas that contain
wetlands or are near wetlands. Those projects are required to have either a Section 404
Permit, COE Dredge and Fill Permit, or an Ohio EPA Isolated Wetland Permit. The projects
proposed for the preferred alternative are not located on or near any waters of the U.S. or
wetlands.

Harry Clever Field Airport Master Plan Update
92
Table 5-4
Environmental Review of Preferred Alternative
Figure 5-4
Reference Project
Disturbed
Area (Acres)
Property
Acquisition (Acres)
Potential
Impact (Y or N) Potential NEPA
Documentation
FAA Order
1050.1F
Reference
Potential
State Permit
Potential
Federal Permit Noise Air Quality Wetlands Upland Forested Protected Species
Projects With No Environmental Impacts
A 13-Unit T-Hangar (Construct) 0.75 N N N N N CatEx 5-6.4 f. None
B Relocate Parallel Taxiway A (Design/Construct) 3.36 N N N N N CatEx 5-6.4 e. NPDES None
C 5,950 SF Hangar & Aboveground Fuel Tanks (Design/Constuct) 0.30 N N N N N CatEx 3-1.2.b.(1) None
D Tiedowns (Construct) 0.79 N N N N N CatEx 5-6.4 f. None
E 2-3,472 SF Hangars (Design/Construct) 0.90 0.90 N N N N N CatEx 5-6.4 f. None
F 6-2,500 SF Hangars (Design/Construct) 1.90 1.90 N N N N N CatEx 5-6.4 f. NPDES None
G 3-2,912 Hangars (Design/Construct) 0.46 N N N N N CatEx 5-6.4 f. None
H New Partial Parallel Taxiway (Design/Construct) 0.39 N N N N N CatEx 5-6.4 e. None
I 12-Unit T-Hangar & AWOS Relocation (Design/Construct) 1.58 N N N N N CatEx 5-6.4 f. NPDES None
J 5-1,386 SF Hangars (Design/Construct) 0.16 N N N N N CatEx 5-6.4 f. None
K New Partial Parallel Taxiway (Design/Construct) 1.17 N N N N N CatEx 5-6.4 e. NPDES None
L 6,400 SF Hangar (Design/Construct) 0.80 N N N N N CatEx 5-6.4 f. None
M 10,000 SF Hangar (Design/Construct) 0.23 N N N N N CatEx 5-6.4 f. None
N 10,000 SF Hangar (Design/Construct) 0.23 N N N N N CatEx 5-6.4 f. None
O New Apron & Aboveground Fuel Tanks (Design/Construct) 3.05 N N N N N EA 3-1.2.b.(5) NPDES None
P Acquire Property & Relocate Road 0.65 12.9* N N N Y N EA 3-1.2.b.(1) None
Source: Michael Baker International, Inc., 2017.
NPDES – National Pollutant Discharge Elimination System Permit for Construction Activity
*Per FAA Order 1050.1F, land acquisitions over three acres require an EA.

Harry Clever Field Airport Master Plan Update
93
6.0 Implementation Plan
6.1 Introduction
The primary objective of this chapter is to analyze the financial feasibility of developing the
projects included in the Capital Improvement Program (CIP) for the Harry Clever Field Airport
(PHD). The proposed financial plan was developed after evaluating the financial structure of
PHD and identifying potential sources of revenue that may be available to fund capital
improvement projects. The funding sources were then matched with projects over an
estimated phasing schedule to determine the financial implications of undertaking the
recommended capital improvements. The implementation plan presented herein describes
the staging of proposed improvements and identifies various means of funding the
improvements. It is the intent of this implementation plan to provide general financial
guidance to the New Philadelphia Airport Commission (Airport Commission) for making policy
decisions regarding the recommended development of the airport over the 20-year planning
period. The information in this chapter presents a preliminary review of the CIP and financial
structure of PHD.
6.2 Federal and State Funding Eligibility
The CIP identifies recommended projects and associated cost estimates for the 20-year
planning period at PHD. FAA Order 5100.38D, Airport Improvement Program (AIP) Handbook,
sets forth the official policy and procedures to be used in the administration of AIP grants.
Table 6-1 lists typical examples of eligible and ineligible AIP projects. Projects eligible for AIP
funding may receive up to 90 percent of the project cost to be covered by the FAA with the
Ohio Department of Transportation (ODOT) and City of New Philadelphia responsible for five
percent each. The city receives $150,000 in entitlement funds from the FAA each year, which
are spent on projects at PHD. Those funds are mostly used for safety, pavement, lighting, and
planning/design/environmental projects. If the airport is conducting a larger project that is
more expensive, the FAA may provide additional discretionary funding.
ODOT also has a Direct Grant Program that covers up to 95 percent of eligible project costs.
The Direct Grant Program is competitive and the amount of annual funding is based on the
remainder of budgeted funds after ODOT allocates the state share of AIP grants. It is noted
that these are typical funding shares.

Harry Clever Field Airport Master Plan Update
94
Table 6-1
Examples of Eligible vs. Ineligible AIP Projects Eligible Projects Ineligible Projects
Runway construction/rehabilitation Maintenance equipment and vehicles
Taxiway construction/rehabilitation Office and office equipment
Apron construction/rehabilitation Fuel farms*
Airfield lighting Landscaping
Airfield signage Artworks
Airfield drainage Aircraft hangars*
Land acquisition Industrial park development
Weather observation stations (AWOS) Marketing plans
NAVAIDs such as REILs and PAPIs Training
Planning studies Improvements for commercial
enterprises
Environmental studies Maintenance or repairs of buildings
Safety area improvements
Airport layout plans (ALPs)
Access roads only located on airport property
Removing, lowering, moving, marking, and lighting hazards
Glycol Recovery Trucks/Glycol Vacuum Trucks**
Source: FAA AIP Overview, FAA website.
*May be eligible. Contact your local Airport District or Regional Office for more information.
**To be eligible, the vehicles must be owned and operated by the Airport and meet the Buy American
Preference specified in the AIP grant. Contact your local Airport District or Regional Office for more
information.
In addition, the following must also apply for FAA to consider a project for AIP funding:
The project sponsorship requirements have been met.
The project is reasonably consistent with the plans of planning agencies for the development of the area in
which the airport is located.
Sufficient funds are available for the portion of the project not paid for by the Federal Government.
The project will be completed without undue delay.
The airport location is included in the current version of the NPIAS.
The project involves more than $25,000 in AIP funds.
The project is depicted on a current airport layout plan approved by FAA.

Harry Clever Field Airport Master Plan Update
95
6.3 Project Costs & Phasing
6.3.1 Project Costs
As shown in Table 6-2, a CIP and phasing plan were identified for the 20-year planning period
that includes a mixture of the study recommendations and routine maintenance of existing
facilities. The CIP planning period is defined as 2017 through 2035+. Each project within the
CIP was assigned to a particular planning period or development phase (i.e., Phase 1, Phase
2, or Phase 3). The Phase 1 time period extends from 2017 to 2022, the Phase 2 period
extends from 2023 to 2028, and the Phase 3 period spans through 2029 to 2035+. A
detailed breakdown of costs and phasing was produced for Phase 1 projects; however, the
Phase 2 and 3 projects are listed in a more generalized order that should remain flexible.
Although this study charts a course for planned development, it must be emphasized that the
planning and development of an airport is a continuous process. The rehabilitation of existing
facilities and development of new facilities must be predicated on sustained demand, which
justifies the costs of improvements. As aviation demand may change at PHD and also specific
project requirements and funding mechanisms may change, the Airport Commission should
consider the impact on the CIP and the potential need to modify certain elements of the Airport
Layout Plan (ALP).
The estimated cost for each of the recommended airport improvements reflects a preliminary
opinion of the probable implementation cost for the project. In addition to the estimated
construction costs, anticipated fees for design, inspection, permitting, surveying, testing and
administration were also included in the overall estimate where applicable. Each project cost
is presented in the base year dollar value and therefore does not reflect unanticipated
increases in labor and material costs or changes in environmental legislation. This is done
for master planning purposes because the dates of project are generally identified in phases
as opposed to specific years. In addition, a contingency was added to the overall costs of
some projects to account for unforeseen variables. A detailed environmental analysis may be
required to recognize the full scope of environmental and budgetary impacts associated with
the proposed development. Some projects may also require mitigation measures to offset
impacts to environmentally sensitive areas whereas others may require some level of
environmental remediation based on conditions that may or may not have been identified as
part of this study. For those reasons, it is important to note that the estimates shown are
accurate based on the costs of labor, materials, and anticipated impacts calculated at the
time of this writing. As such, it is important to revisit and update costs regularly to ensure that
an accurate CIP is maintained.
6.3.2 Project Phasing
Since the airport’s actual versus forecast activity levels may vary, it is important for the staging
of proposed improvement projects remain sensitive to such variations. Some projects may
take precedence over others, depending on their level of priority or due to the availability of
funding. Thus, a list of prioritized improvements was established based upon the urgency of
need, ease of implementation, and logic of project sequencing. The objective was to establish
an efficient order for project development and implementation that meets or exceeds the
forecasted aviation demands at PHD.

Harry Clever Field Airport Master Plan Update
96
The total cost of the 20-year CIP is estimated at $21.70 million. Those figures include all
studies, infrastructure improvements, and proposed construction costs necessary to achieve
the developments shown in the CIP. The CIP for each period presents the improvements
slated for implementation during the period, but it does not assume how financially feasible
it will be for the city to undertake the projects or whether or not funding will be available.
Much of the funding for the projects in Phase 1 has been pre-determined between the Airport
Commission and ODOT, but can be subject to change on a case-by-case and annual basis.
The Phase 2 projects include items that will be necessary based on the forecast demand and
to provide anticipated maintenance activities. Many of the Phase 3 projects include routine
maintenance and higher price private developments that would likely only be implemented as
required by demand. This CIP relies heavily on private investment to construct future hangars
with the overall goal of reducing the city’s maintenance and development costs by
encouraging private facility development.
6.3.3 Consumer Price Index (CPI) Adjustment
The improvements shown in previous tables illustrate the facilities needed at PHD to meet the
forecast demands through the end of the 20-year planning period and likely beyond as well.
The cost estimates were determined in year 2017 dollars, so as time goes by the values
should be reviewed to determine if any project cost adjustments have occurred. Although the
costs for construction projects is highly variable due to the fluctuating cost of materials (e.g.,
asphalt, steel, and energy production), a reasonable estimate of future costs can be
calculated by adjusting the 2015 costs by the appropriate Consumer Price Index (CPI) inflation
factor. The Bureau of Labor Statistics (BLS) provides an online CPI inflation calculator that
may be used to compare historical costs to present day cost and is available on this website
(http://www.bls.gov/data/inflation_calculator.htm).

Harry Clever Field Airport Master Plan Update
97
Table 6-2
Capital Improvement Program (2017-2035+) Year Figure 5-2 ID Project Title Estimated Cost AIP Grants ODOT Grants City Funds Private Funds AIP % ODOT % City % Private %
2017 CIP Runway 14-32 Rehab (Construction) $1,300,000 $1,170,000 $65,000 $65,000 $0 90.00% 5.00% 5.00%
2017 A 13-Unit T-Hangar (Construct) $350,000 $0 $0 $350,000 $0 100.00%
2018 CIP Implement Zoning Ordinance $50,000 $0 $47,500 $2,500 $0 95.00% 5.00%
2019 P Acquire Property & Relocate Road $480,000 $432,000 $24,000 $24,000 $0 90.00% 5.00% 5.00%
2020 CIP Install Beacon $80,000 $72,000 $4,000 $4,000 $0 90.00% 5.00% 5.00%
2021 B Relocate Parallel Taxiway A & Install Signage (Design/Construct) $1,630,000 $1,467,000 $81,500 $81,500 $0 90.00% 5.00% 5.00%
2021 CIP RPZ Acquisition/Clearing (Runway 32) $300,000 $270,000 $15,000 $15,000 $0 90.00% 5.00% 5.00%
2021 CIP East Box Hangar Taxilane Rehab (Design/Construct) $80,000 $21,600 $1,200 $57,200 $0 27.00% 1.50% 71.50%
2022 G 3-2,912 Hangars (Design/Construct) $750,000 $0 $0 $150,000 $600,000 20.00% 80.00%
2022 CIP Airport Wildlife Fencing (Design/Construct) $350,000 $315,000 $17,500 $17,500 $0 90.00% 5.00% 5.00%
TBD C 5,950 SF Hangar & Aboveground Fuel Tanks (Design/Construct) $860,000 $232,200 $12,900 $12,900 $602,000 27.00% 1.50% 1.50% 70.00%
TBD D Tiedowns (Construct) $520,000 $468,000 $26,000 $26,000 $0 90.00% 5.00% 5.00%
TBD CIP West T-Hangar Taxilane Rehab (Design/Construct) $280,000 $252,000 $14,000 $14,000 $0 90.00% 5.00% 5.00%
TBD CIP East T-Hangar Taxilane Rehab (Design/Construct) $160,000 $144,000 $8,000 $8,000 $0 90.00% 5.00% 5.00%
TBD H New Partial Parallel Taxiway (Design/Construct) $260,000 $234,000 $13,000 $13,000 $0 90.00% 5.00% 5.00%
TBD I 12-Unit T-Hangar & AWOS Relocation (Design/Construct) $2,120,000 $572,400 $31,800 $1,515,800 $0 27.00% 1.50% 71.50%
TBD J 5-1,386 SF Hangars (Design/Construct) $480,000 $0 $0 $0 $480,000 100.00%
TBD CIP Master Plan Update $350,000 $315,000 $17,500 $17,500 $0 90.00% 5.00% 5.00%
TBD CIP Terminal Apron Rehab (Design/Construct) $880,000 $792,000 $44,000 $44,000 $0 90.00% 5.00% 5.00%
TBD E 2-3,472 SF Hangars (Design/Construct) $1,220,000 $329,400 $18,300 $18,300 $854,000 27.00% 1.50% 1.50% 70.00%
TBD K New Partial Parallel Taxiway (Design/Construct) $780,000 $702,000 $39,000 $39,000 $0 90.00% 5.00% 5.00%
TBD L 6,400 SF Hangar (Design/Construct) $870,000 $0 $0 $0 $870,000 100.00%
TBD O New Apron & Aboveground Fuel Tanks (Design/Construct) $1,790,000 $1,611,000 $89,500 $89,500 $0 90.00% 5.00% 5.00%
TBD M 10,000 SF Hangar (Design/Construct) $920,000 $0 $0 $0 $920,000 100.00%
TBD F 6-2,500 SF Hangars (Design/Construct) $2,420,000 $653,400 $36,300 $36,300 $1,694,000 27.00% 1.50% 1.50% 70.00%
TBD N 10,000 SF Hangar (Design/Construct) $920,000 $0 $0 $0 $920,000 100.00%
TBD CIP Runway 14-32 Rehab (Construction) $1,500,000 $1,350,000 $75,000 $75,000 $0 90.00% 5.00% 5.00%
Total All $21,700,000 $11,403,000 $681,000 $2,676,000 $6,940,000
Total Phase 1 (2017-2022) $5,520,000 $3,747,600 $255,700 $766,700 $600,000
Total Phase 2 (2023-2028) $5,030,000 $2,217,600 $123,200 $1,607,200 $1,082,000
Total Phase 3 (2029-2035+) $11,300,000 $5,437,800 $302,100 $302,100 $5,258,000
Average Per Year (2017-2035) $1,205,556 $633,500 $37,833 $148,667 $385,556
FAA Entitlement Balance (2017)
$430,270 FAA Entitlements (2018-2035) $2,550,000
Anticipated FAA Discretionary Funding (2017-2035) $8,422,730
Source: Michael Baker International, Inc., 2017.
Harry Clever Field Airport Master Plan Update
98
6.4 Airport Financial Structure
This section presents the historical revenues and expenses that were generated from the
city’s operation of PHD, as well as a forecast of revenues and expenses and a projection of
annual cash outlays that will be required by the city after capital improvements are accounted
for. The information in this chapter represents baseline conditions only and does not include
strategies for increasing the revenues of PHD or decreasing the city’s annual investment into
the airport. The city’s sources of revenue from PHD primarily include the following items:
• Hangar Rental Fees (specific to the hangar)
• Hangar Maintenance Fees ($25 per month)
• Hangar Land Lease
• Restaurant Lease (based on monthly sales)
• Fuel Flowage Fee ($0.035 per gallon)
• Fixed Base Operator (FBO) Lease
Those revenues are collected by the city each month and managed within the city’s airport
account. Each year, the city appropriates funds for the airport to be used for equipment
maintenance, capital improvements, facility maintenance, and hangar maintenance. The city
budgets money from the general fund each year to pay for general maintenance and capital
improvements at the airport. The budgeted funds do not carry over each year (i.e., funds not
utilized do not come out of the general fund and do not go into the airport account). However,
the hangar maintenance funds are part of the airport account and the remaining balance
carries over each year to be utilized for projects at PHD. Members of the Airport Commission
have indicated that the city has always had the ability to pay the local share for projects and
cover the airport’s annual maintenance costs.
6.5 Cash Flow Analysis
As part of this Master Plan Update, a more detailed analysis of the airport’s financial structure
was undertaken following the acceptance of the CIP by the TAC and Airport Commission. The
airport’s historical revenues and expenses for 2015 and 2016 are summarized in Table 6-3.
At this time, any differences between revenues and expenses are covered by the city’s general
fund. The airport’s revenues and expenses are not tracked by a separate airport fund within
the city’s budget. Therefore, it is recommended that the city establish an airport fund in order
to be able to better track the airport’s financial records. That will allow the city to better plan
for how much the airport will need in general fund transfers each year (when necessary) and
to better monitor the financial performance of the airport. The goal should be to make the
airport as financially self-sustainable as possible and to make sure that all airport-generated
revenues are allocated to the airport.

Harry Clever Field Airport Master Plan Update
99
The historical information shown in Table 6-3 was estimated from financial reports from the
city and airport and is intended to represent what a separate airport fund for PHD might
resemble. As shown, general revenues and expenses remain fairly consistent from year to
year, and without the added costs for capital improvements and hangar maintenance, the
airport has the ability to make a small profit each year. As the costs for capital improvements
and hangar maintenance tend to vary from year to year, the annual financial
performance/profit for PHD can be negative, which is illustrated in the potential cash flow
analysis in Table 6-4 for the period from 2017 to 2022. This can be particularly true during a
year when there are expensive projects planned for the airport, such as the relocation of the
parallel taxiway centerline in 2021. During 2021, the airport’s capital improvement costs are
estimated to be $153,700, which would result in a negative annual profit of $128,722. The
information in Table 6-4 was derived by applying the based aircraft forecast growth rate of
0.91 percent per year to certain revenue and expense items. The anticipated lease revenues
from the upcoming T-hangar project were not expected to have a significant effect on the
airport’s finances because the costs to pay off the loan to construct the facility were assumed
to be approximately equal; however, additional hangar maintenance fees would be collected
after the T-hangar is constructed. The Airport Commission could consider encouraging private
development through land leases. The lessee would be responsible for the cost to construct
and maintain their facility throughout the duration of the land lease, after which time
ownership of the facility would either revert to the city or the lease would be renegotiated.
Because of the high cost to construct hangars and the limited funding availability, the Airport
Commission may wish to explore private development at PHD through land leases, particularly
when considering partnership opportunities with local universities, flight schools, etc. A rolling
balance is shown in Table 6-4 beginning in 2018 and assumes that an airport fund would be
created in 2018 and would start with no negative carryover balance from previous years. It
shows when transfers from the general fund would be needed to cover the local share for
annual capital improvements.
Table 6-3
Historical Revenues and Expenses (2015-2016) Item 2015 2016
Revenues
Hangar Maintenance Fees $10,375.00 $10,675.00
Hangar Rents $41,439.05 $48,942.47
FBO Lease $12,000.00 $12,000.00
Fuel Sales $1,000.00 $1,000.00
Restaurant $13,770.47 $13,770.47
Total Revenues $78,584.52 $86,387.94
Expenses
Equipment Maintenance/Operations $13,029.70 $13,755.44
Capital Improvements $0.00 $10,000.00
Facility Maintenance $12,628.21 $13,085.78
Hangar Maintenance $0.00 $20,074.59
FBO Management Services $20,719.53 $24,471.24
Total Expenses $46,377.44 $81,387.05
Annual Profit
Revenues – Expenses $32,207.09 $5,000.90
Source: Estimated from city and airport financial records.

Harry Clever Field Airport Master Plan Update
100
Table 6-4
Potential Cash Flow Analysis (2017-2022) Item 2017 2018 2019 2020 2021 2022
Revenues
Hangar Maintenance Fees $10,772.14 $14,470.17 $14,601.85 $14,734.72 $14,868.81 $15,004.12
Hangar Rents $49,387.85 $49,837.28 $50,290.80 $50,748.44 $51,210.25 $51,676.27
FBO Lease $12,000.00 $12,000.00 $12,000.00 $12,000.00 $12,000.00 $12,000.00
Fuel Sales $1,009.10 $1,018.28 $1,027.55 $1,036.90 $1,046.34 $1,055.86
Restaurant $13,895.78 $14,022.23 $14,149.84 $14,278.60 $14,408.53 $14,539.65
New Land Lease $0.00 $0.00 $0.00 $0.00 $0.00 $6,000.00
Total Revenues $87,064.87 $91,347.96 $92,070.03 $92,798.66 $93,533.93 $100,275.89
Expenses
Maintenance & Operation $13,755.44 $13,755.44 $13,755.44 $13,755.44 $13,755.44 $13,755.44
Capital Improvements $65,000.00 $2,500.00 $24,000.00 $4,000.00 $153,700.00 $17,500.00
Facility Maintenance $13,204.86 $13,325.02 $13,446.28 $13,568.64 $13,692.12 $13,816.72
Hangar Maintenance $15,000.00 $15,136.50 $15,274.24 $15,413.24 $15,553.50 $15,695.04
FBO Management Services $24,693.92 $24,918.64 $25,145.40 $25,374.22 $25,605.13 $25,838.13
Total Expenses $131,654.22 $69,635.60 $91,621.36 $72,111.54 $222,306.18 $86,605.32
Annual Profit
Revenues – Expenses -$44,589.35 $21,712.36 $448.66 $20,687.12 -$128,772.25 $13,670.57
Rolling Balance (Beginning in 2018)
Rolling Balance $21,712.36 $22,161.02 $42,848.14 -$85,924.11 -$72,253.54
Annual Projects
Capital Improvement Costs
Runway Rehab ($65,000)
T-Hangar Construction
(Loan Cost ≈ Lease Income)
Zoning Update ($2,500) Property Acquisition ($24,000) Install Beacon ($4,000)
Relocate Taxiway ($81,500)
RPZ Clearing ($15,000)
Taxilane Rehab ($57,200)
Hangar Construction
(Private Development)
Wildlife Fencing ($17,500)
Source: Michael Baker International, Inc., 2017.

Harry Clever Field Airport Master Plan Update
101
7.0 Airport Layout Plan
7.1 Introduction
The purpose of an approved Airport Layout Plan (ALP) is to serve as the blueprint for future
airport development. One condition of accepting and utilizing grant funding for airport
improvement projects is to maintain an updated ALP. For Harry Clever Field Airport (PHD), the
updated development recommendations presented in this study are pictorially summarized
in the ALP drawing set and include the preferred concepts for airfield development, landside
facility development, and other reserved areas for non-aviation use. The ALP drawing set
represents a scaled, graphic presentation of the airport’s 20-year development program,
thereby providing the airport with a feasible improvement plan that would increase the
capability and safety of aircraft operations, promote compatibility with existing and proposed
developments, and further upgrade the airport to effectively serve the anticipated demands
of general aviation and small corporate aircraft traffic. The drawings depict the
recommendations of this study with regard to aviation development for the short,
intermediate, and long-term planning periods.
The dimensional information provided in the drawings demonstrates compliance with
minimum airport design standards established by federal, state, and local authorities. The
ALP Drawing Set was developed in accordance with the guidance outlined in Federal Aviation
Administration (FAA) Advisory Circular (AC) 150/5070-6, Airport Master Plans, AC 150/5300-
13A, Airport Design, FAA ARP Standard Operating Procedure (SOP) 2.0, Standard Operating
Procedure for FAA Review and Approval of Airport Layout Plans and other supporting circulars
and orders. The ALP drawing set includes the following individual drawing sheets which are
provided at the end of this chapter in reduced-size format:
• Title Sheet (Sheet 1)
• Airport Data Sheet (Sheet 2)
• Airport Layout Plan Drawing (Sheet 3)
• Airport Airspace Drawings (Sheets 4 and 5)
• Inner Portion of the Approach Surface Drawings (Sheets 6 and 7)
• Runway Departure Surface Drawing – Runway 15-33 (Sheet 8)
• Terminal Area Drawing (Sheet 9)
• Land Use Drawing (Sheet 10)
• Airport Property Map (Sheet 11)
7.2 Title Sheet (Sheet 1)
The Title Sheet serves as the introduction to the ALP drawing set. It includes the airport name,
a location/vicinity map, and an index of drawings included in the ALP drawing set. Also
highlighted on the Title Sheet are the project name, sponsor’s name, and the FAA grant
number.
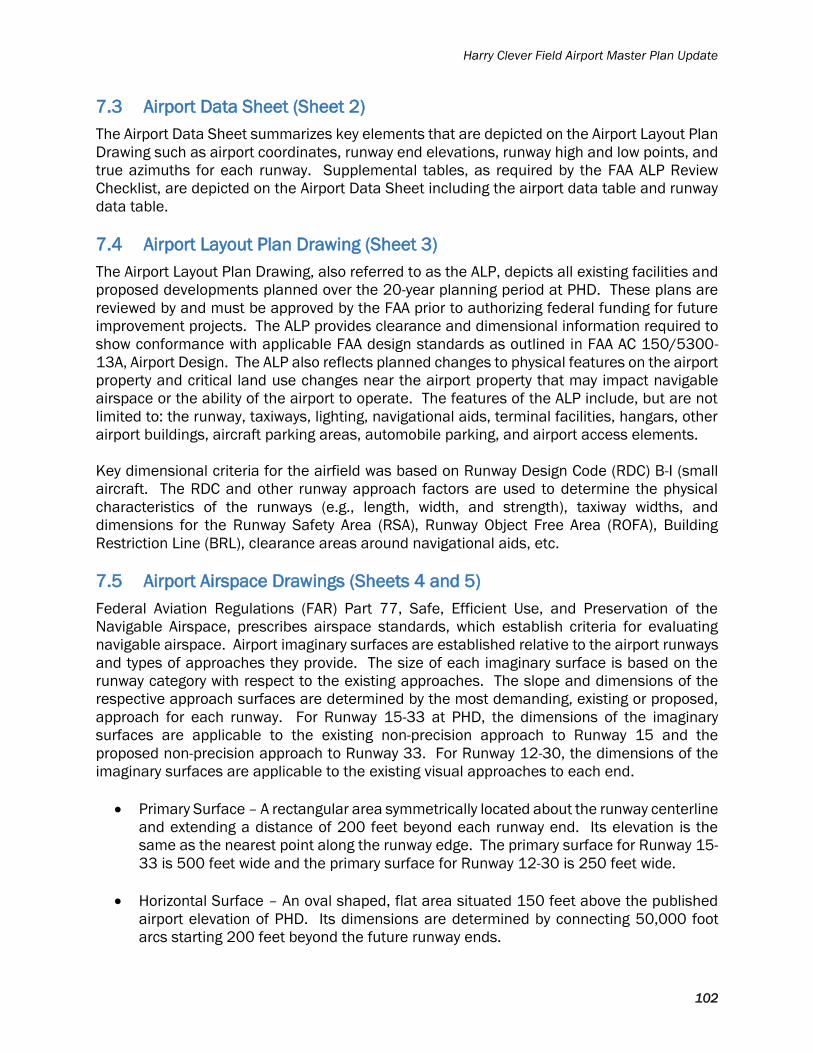
Harry Clever Field Airport Master Plan Update
102
7.3 Airport Data Sheet (Sheet 2)
The Airport Data Sheet summarizes key elements that are depicted on the Airport Layout Plan
Drawing such as airport coordinates, runway end elevations, runway high and low points, and
true azimuths for each runway. Supplemental tables, as required by the FAA ALP Review
Checklist, are depicted on the Airport Data Sheet including the airport data table and runway
data table.
7.4 Airport Layout Plan Drawing (Sheet 3)
The Airport Layout Plan Drawing, also referred to as the ALP, depicts all existing facilities and
proposed developments planned over the 20-year planning period at PHD. These plans are
reviewed by and must be approved by the FAA prior to authorizing federal funding for future
improvement projects. The ALP provides clearance and dimensional information required to
show conformance with applicable FAA design standards as outlined in FAA AC 150/5300-
13A, Airport Design. The ALP also reflects planned changes to physical features on the airport
property and critical land use changes near the airport property that may impact navigable
airspace or the ability of the airport to operate. The features of the ALP include, but are not
limited to: the runway, taxiways, lighting, navigational aids, terminal facilities, hangars, other
airport buildings, aircraft parking areas, automobile parking, and airport access elements.
Key dimensional criteria for the airfield was based on Runway Design Code (RDC) B-I (small
aircraft. The RDC and other runway approach factors are used to determine the physical
characteristics of the runways (e.g., length, width, and strength), taxiway widths, and
dimensions for the Runway Safety Area (RSA), Runway Object Free Area (ROFA), Building
Restriction Line (BRL), clearance areas around navigational aids, etc.
7.5 Airport Airspace Drawings (Sheets 4 and 5)
Federal Aviation Regulations (FAR) Part 77, Safe, Efficient Use, and Preservation of the
Navigable Airspace, prescribes airspace standards, which establish criteria for evaluating
navigable airspace. Airport imaginary surfaces are established relative to the airport runways
and types of approaches they provide. The size of each imaginary surface is based on the
runway category with respect to the existing approaches. The slope and dimensions of the
respective approach surfaces are determined by the most demanding, existing or proposed,
approach for each runway. For Runway 15-33 at PHD, the dimensions of the imaginary
surfaces are applicable to the existing non-precision approach to Runway 15 and the
proposed non-precision approach to Runway 33. For Runway 12-30, the dimensions of the
imaginary surfaces are applicable to the existing visual approaches to each end.
• Primary Surface – A rectangular area symmetrically located about the runway centerline
and extending a distance of 200 feet beyond each runway end. Its elevation is the
same as the nearest point along the runway edge. The primary surface for Runway 15-
33 is 500 feet wide and the primary surface for Runway 12-30 is 250 feet wide.
• Horizontal Surface – An oval shaped, flat area situated 150 feet above the published
airport elevation of PHD. Its dimensions are determined by connecting 50,000 foot
arcs starting 200 feet beyond the future runway ends.

Harry Clever Field Airport Master Plan Update
103
• Conical Surface – A sloping area whose inner perimeter conforms to the shape of the
horizontal surface. It extends outward for a distance of 4,000 feet measured
horizontally, and slopes upward at a 20:1 ratio.
• Transitional Surface – A sloping area beginning at the edges of the primary and
approach surfaces and sloping upward and outward at a ratio of 7:1.
• Approach Surface – This surface begins at the ends of the primary surface and slopes
upward at a predetermined ratio while at the same time flaring out horizontally. The
width and elevation of the inner ends conform to that of the primary surface, while the
slope, length, and outer width are determined by the runway service category and
existing or proposed instrument approach procedures.
7.6 Inner Portion of the Approach Surface Drawings (Sheets 6 and 7)
The Inner Portion of the Approach Surface Drawings show both plan and profile views of the
approach surfaces beyond each end of Runway 15-33. The purpose of these drawings is to
locate and document existing objects which represent obstructions to navigable airspace
within the existing and proposed approach slopes for each runway. Additionally, the drawings
show the ground profile and terrain features along the extended centerline of each runway
end.
Any controlling structures, such as roadways, natural ground elevations, and trees, are also
shown on the Inner Portion of the Approach Surface Drawings, if applicable. Additionally, fixed
objects located along the extended runway centerlines are also illustrated on the sheets to
provide an indication of the relative distance to the approach surfaces. As applicable,
obstructions to navigable airspace are listed in an obstruction data table along with a
recommended action for each obstruction.
7.7 Runway Departure Surface Drawing (Sheet 8)
The Runway Departure Surface Drawing consists of large scale plan views of departure
surfaces for Runway 15-33. The Departure Surface Drawing depicts the ground contour along
the extended runway centerline plus any significant natural or non-natural objects located
along the extended runway centerline and also provides a top elevation for those objects.
Commonly shown objects include buildings, roads, ditches, and trees. Surface penetration
and disposition information is included in the associated obstruction data tables.
7.8 Terminal Area Drawing (Sheet 9)
The Terminal Area Drawing presents an enlarged view of the Fixed Base Operator (FBO) area
at PHD and therefore provides additional dimensional details such as apron areas (existing
and proposed) that are not easily visible on the ALP. These drawings denote the short and
long-term developments and improvements within the vicinity of the FBO complex at PHD and
also illustrates many of the surrounding landside development recommendations. Existing
and proposed automobile access and parking improvements are also included.

Harry Clever Field Airport Master Plan Update
104
7.9 Land Use Drawing (Sheet 10)
The Land Use Drawing designates various sectors of the property for specific uses and also
shows an aerial view of the land surrounding PHD. Additionally, the 2015 and 2035 noise
contours developed as a component of this study have been superimposed on the drawing to
ensure that appropriate aviation-compatible zoning is maintained. The FAA has established
national guidelines for land use compatibility related to airport-generated noise impacts. In
most cases, noise sensitive land uses are considered incompatible if they are exposed to Day-
Night Average Sound Levels (DNL) of 65 decibels or higher, unless noise mitigation measures
are undertaken.
7.10 Airport Property Map (Sheet 11)
In order to comply with FAA grant requirements, airport owners must demonstrate that they
hold “good title, satisfactory to the Secretary, to the landing area of the airport or site thereof,
or will give assurance satisfactory to the Secretary that good title will be acquired.” In order
to meet the FAA’s grant assurances, a sponsors' title must be free and clear of any
reversionary interest, lien, easement, lease, or other encumbrance that would create undue
risk that might deprive the sponsor of control or possession, interfere with its use for public
airport purposes, or make it impossible for the sponsor to carry out the obligations and
covenants in the grant agreement. This drawing was developed based on the FAA’s most
recent guidance – Standard Operating Procedure (SOP) for FAA Review of Exhibit “A” Airport
Property Inventory Maps (ARP SOP 3.00). The purpose of the drawing and associated tables
is to identify how property was acquired in the past as well as to illustrate properties and
easements that should be obtained in the future as necessary to accommodate the proposed
development plan. The existing property information was determined from a 2003 property
map and parcel data from the Tuscarawas County Property Appraiser.

NEW PHILADELPHIA, OHIO
AIRPORT LAYOUT PLAN DRAWING SETHARRY CLEVER FIELD AIRPORT
MICHAEL BAKER INTERNATIONAL, INCPREPARED BY:
MARCH 2018PREPARED FOR:
CITY OF NEW PHILADELPHIA
FAA APPROVAL LETTER
THIS AIRPORT DRAWING IS APPROVED BY:
DATE:(SIGNATURE)
TITLE:
NAME:
AIRPORT SPONSOR APPROVAL
THIS AIRPORT DRAWING IS APPROVED BY:
DATE:(SIGNATURE)
TITLE:
NAME:
ODOT OFFICE OF AVIATION APPROVAL
PHD
INTE
RSTA
TE 7
7
AIRPORT MASTERPLAN UPDATE
PLANNING
TITLE SHEET
1
3-39-0060-012-2015
MARCH2018
NOT TO SCALELOCATION / VICINITY MAP
TUSCARAWAS COUNTY, OHIO
4TH
DR
NW
N B
RO
ADW
AY S
T BEAVER AVE NE
E HIGH AVE
250
250
OLD
TOW
N V
ALLE
Y R
D S
E
TUSCARAWAS AVE NW
10
4
TERMINAL AREA DRAWING
5AIRPORT AIRSPACE DRAWING - RUNWAY 15-33
AIRPORT PROPERTY MAPLAND USE DRAWING
23
DRAWING INDEX
1
6
AIRPORT LAYOUT PLAN DRAWING
7
98 RUNWAY DEPARTURE SURFACE DRAWING - RUNWAY 15-33
TITLE SHEETAIRPORT DATA SHEET
DESCRIPTION
INNER PORTION OF THE APPROACH SURFACE DRAWING - RUNWAY 15INNER PORTION OF THE APPROACH SURFACE DRAWING - RUNWAY 33
REVISIONDATE
DRAWINGNO.
FAA AIP #
DRAWING NAME:
PROJECT NAME:
DESCRIPTIONNO.
REVISIONS
DATE BY
DIVISION:
DATE: DRAWING NUMBER:
11
AIRPORT AIRSPACE DRAWING - RUNWAY 12-30
NEW PHILADELPHIA
NOTE:NO INNER PORTION OF THE APPROACH SURFACE DRAWING WASPRODUCED FOR RUNWAY 12-30.
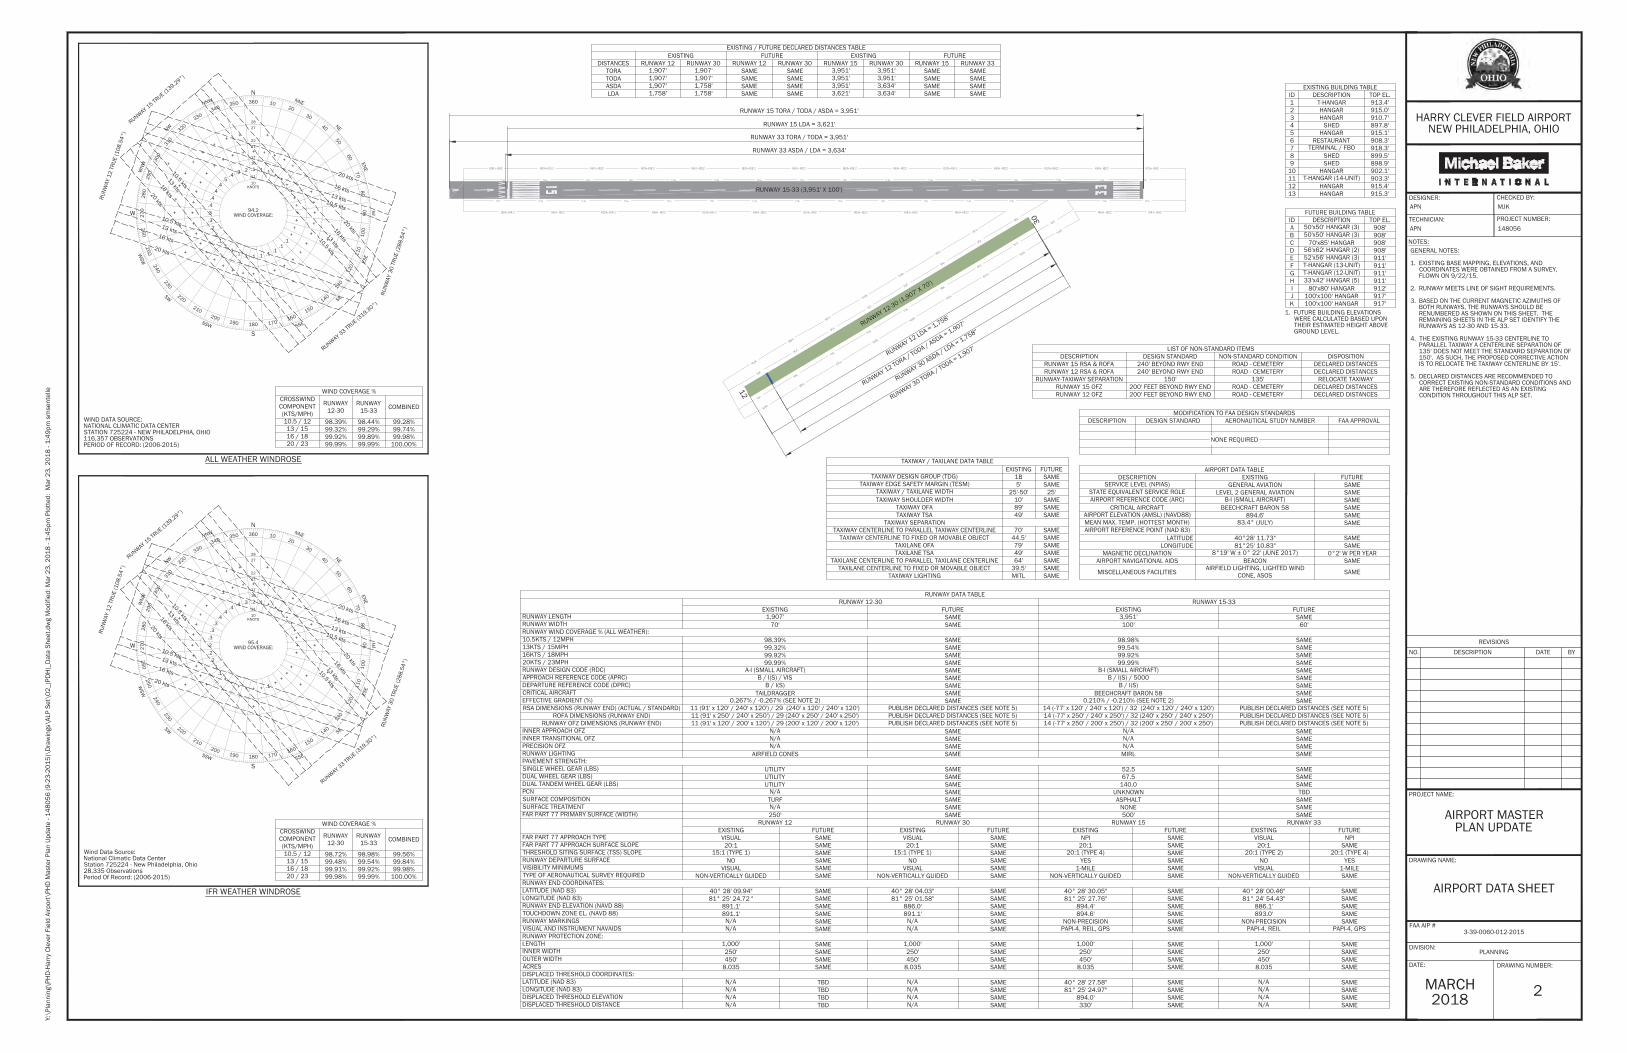
12
30
RUNWAY 12-30 (1,907' X 70')
RUNWAY 15-33 (3,951' X 100')
RUNWAY 15 TORA / TODA / ASDA = 3,951'
RUNWAY 33 TORA / TODA = 3,951'
RUNWAY 15 LDA = 3,621'
RUNWAY 33 ASDA / LDA = 3,634'
RUNWAY 12 LDA = 1,758'
RUNWAY 12 TORA / TODA / ASDA = 1,907'
RUNWAY 30 TORA / TODA = 1,907'
RUNWAY 30 ASDA / LDA = 1,758''
2
AIRPORT DATA SHEET
FAA AIP #
DRAWING NAME:
PROJECT NAME:
AIRPORT MASTERPLAN UPDATE
DESCRIPTIONNO.
REVISIONS
DATE BY
3-39-0060-012-2015
DIVISION:
DATE: DRAWING NUMBER:
PLANNING
MARCH2018
DESIGNER:
TECHNICIAN:
CHECKED BY:
PROJECT NUMBER:
148056
MJKAPN
APN
HARRY CLEVER FIELD AIRPORTNEW PHILADELPHIA, OHIO
NOTES:
1020
NNE
30
40 NE50
60
ENE
7080
90 E
100
110
ESE
120
130
SE140
150
SSE160
170180
S
190200
SSW
210
220SW
230
240
WSW
250260
27
0W
280
290W
NW
300
310NW 320
330
NNW
340350 360
N
28
27
2221
1716
11
.1 .1+
++
+++++
++
.1.1
.1.1.1.1.1.1
.1.1
.1.2
.2.3.3.4.4
.4.4
.5.4
.3 .2 .1
+ ++
+
+
+
+
+
+
+
++
++
++++
++
+
+
+
+
+
+
+
++
++ + +
+
+
+
+
+
+
+
+
+
+
++
+
+
10KNOTS
94.2WIND COVERAGE:
RUNWAY 15 TRUE (1
39.29°)
RUNWAY 33 TRUE (3
19.30°)
RUN
WAY
12
TRUE
(108
.54°
)
RUN
WAY
30
TRUE
(288
.54°
)
16 kts
10.5 kts13 kts
10.5 kts
20 kts
13 kts
16 kts
20 kts
10.5 kts
13 kts
16 kts20 kts
10.5 kts13 kts
16 kts20 kts
WIND DATA SOURCE:NATIONAL CLIMATIC DATA CENTERSTATION 725224 - NEW PHILADELPHIA, OHIO116,357 OBSERVATIONSPERIOD OF RECORD: (2006-2015)
ALL WEATHER WINDROSE
WIND COVERAGE %CROSSWINDCOMPONENT(KTS/MPH)
RUNWAY12-30
RUNWAY15-33 COMBINED
10.5 / 12 98.39% 98.44% 99.28%13 / 15 99.32% 99.29% 99.74%16 / 18 99.92% 99.89% 99.98%20 / 23 99.99% 99.99% 100.00%
1020
NNE
30
40 NE
50
60
ENE
7080
90 E
100
110
ESE
120
130
SE140
150
SSE160
170180
S
190200
SSW
210
220SW
230
240
WSW
250260
27
0W
280
290W
NW
300
310
NW 320330
NNW
340350 360
N
2827
2221
1716
11
.1 ++
++
+++++
++
++
.1+++++
+.1
.1.2
.2.2.3.3
.3.4
.4.4
.4 .3 .2
+ +
+
+
+
+
+
+
+
+
+
+
+
+
+
+
++
.1+ + +
+
+
+
+
+
+
++
+
Wind Data Source:National Climatic Data CenterStation 725224 - New Philadelphia, Ohio28,335 ObservationsPeriod Of Record: (2006-2015)
10KNOTS
95.4WIND COVERAGE:
16 kts
10.5 kts13 kts
10.5 kts
20 kts
13 kts
16 kts
20 kts
10.5 kts
13 kts
16 kts20 kts
10.5 kts13 kts
16 kts20 kts
IFR WEATHER WINDROSE
WIND COVERAGE %CROSSWINDCOMPONENT(KTS/MPH)
RUNWAY12-30
RUNWAY15-33 COMBINED
10.5 / 12 98.72% 98.98% 99.56%13 / 15 99.48% 99.54% 99.84%16 / 18 99.91% 99.92% 99.98%20 / 23 99.98% 99.99% 100.00%
RUNWAY 15 TRUE (1
39.29°)
RUNWAY 33 TRUE (3
19.30°)
RUN
WAY
12
TRUE
(108
.54°
)
RUN
WAY
30
TRUE
(288
.54°
)
RUNWAY DATA TABLERUNWAY 12-30 RUNWAY 15-33
EXISTING FUTURE EXISTING FUTURERUNWAY LENGTH 1,907' SAME 3,951' SAMERUNWAY WIDTH 70' SAME 100' 60'RUNWAY WIND COVERAGE % (ALL WEATHER):10.5KTS / 12MPH 98.39% SAME 98.98% SAME13KTS / 15MPH 99.32% SAME 99.54% SAME16KTS / 18MPH 99.92% SAME 99.92% SAME20KTS / 23MPH 99.99% SAME 99.99% SAMERUNWAY DESIGN CODE (RDC) A-I (SMALL AIRCRAFT) SAME B-I (SMALL AIRCRAFT) SAMEAPPROACH REFERENCE CODE (APRC) B / I(S) / VIS SAME B / I(S) / 5000 SAMEDEPARTURE REFERENCE CODE (DPRC) B / I(S) SAME B / I(S) SAMECRITICAL AIRCRAFT TAILDRAGGER SAME BEECHCRAFT BARON 58 SAMEEFFECTIVE GRADIENT (%) 0.267% / -0.267% (SEE NOTE 2) SAME 0.210% / -0.210% (SEE NOTE 2) SAMERSA DIMENSIONS (RUNWAY END) (ACTUAL / STANDARD) 11 (91' x 120' / 240' x 120') / 29 (240' x 120' / 240' x 120') PUBLISH DECLARED DISTANCES (SEE NOTE 5) 14 (-77' x 120' / 240' x 120') / 32 (240' x 120' / 240' x 120') PUBLISH DECLARED DISTANCES (SEE NOTE 5)
ROFA DIMENSIONS (RUNWAY END) 11 (91' x 250' / 240' x 250') / 29 (240' x 250' / 240' x 250') PUBLISH DECLARED DISTANCES (SEE NOTE 5) 14 (-77' x 250' / 240' x 250') / 32 (240' x 250' / 240' x 250') PUBLISH DECLARED DISTANCES (SEE NOTE 5)RUNWAY OFZ DIMENSIONS (RUNWAY END) 11 (91' x 120' / 200' x 120') / 29 (200' x 120' / 200' x 120') PUBLISH DECLARED DISTANCES (SEE NOTE 5) 14 (-77' x 250' / 200' x 250') / 32 (200' x 250' / 200' x 250') PUBLISH DECLARED DISTANCES (SEE NOTE 5)
INNER APPROACH OFZ N/A SAME N/A SAMEINNER TRANSITIONAL OFZ N/A SAME N/A SAMEPRECISION OFZ N/A SAME N/A SAMERUNWAY LIGHTING AIRFIELD CONES SAME MIRL SAMEPAVEMENT STRENGTH:SINGLE WHEEL GEAR (LBS) UTILITY SAME 52.5 SAMEDUAL WHEEL GEAR (LBS) UTILITY SAME 67.5 SAMEDUAL TANDEM WHEEL GEAR (LBS) UTILITY SAME 140.0 SAMEPCN N/A SAME UNKNOWN TBDSURFACE COMPOSITION TURF SAME ASPHALT SAMESURFACE TREATMENT N/A SAME NONE SAMEFAR PART 77 PRIMARY SURFACE (WIDTH) 250' SAME 500' SAME
RUNWAY 12 RUNWAY 30 RUNWAY 15 RUNWAY 33EXISTING FUTURE EXISTING FUTURE EXISTING FUTURE EXISTING FUTURE
FAR PART 77 APPROACH TYPE VISUAL SAME VISUAL SAME NPI SAME VISUAL NPIFAR PART 77 APPROACH SURFACE SLOPE 20:1 SAME 20:1 SAME 20:1 SAME 20:1 SAMETHRESHOLD SITING SURFACE (TSS) SLOPE 15:1 (TYPE 1) SAME 15:1 (TYPE 1) SAME 20:1 (TYPE 4) SAME 20:1 (TYPE 2) 20:1 (TYPE 4)RUNWAY DEPARTURE SURFACE NO SAME NO SAME YES SAME NO YESVISIBILITY MINIMUMS VISUAL SAME VISUAL SAME 1-MILE SAME VISUAL 1-MILETYPE OF AERONAUTICAL SURVEY REQUIRED NON-VERTICALLY GUIDED SAME NON-VERTICALLY GUIDED SAME NON-VERTICALLY GUIDED SAME NON-VERTICALLY GUIDED SAMERUNWAY END COORDINATES:LATITUDE (NAD 83) 40° 28' 09.94" SAME 40° 28' 04.03" SAME 40° 28' 30.05" SAME 40° 28' 00.46" SAMELONGITUDE (NAD 83) 81° 25' 24.72 " SAME 81° 25' 01.58" SAME 81° 25' 27.76" SAME 81° 24' 54.43" SAMERUNWAY END ELEVATION (NAVD 88) 891.1' SAME 886.0' SAME 894.4' SAME 886.1' SAMETOUCHDOWN ZONE EL. (NAVD 88) 891.1' SAME 891.1' SAME 894.6' SAME 893.0' SAMERUNWAY MARKINGS N/A SAME N/A SAME NON-PRECISION SAME NON-PRECISION SAMEVISUAL AND INSTRUMENT NAVAIDS N/A SAME N/A SAME PAPI-4, REIL, GPS SAME PAPI-4, REIL PAPI-4, GPSRUNWAY PROTECTION ZONE:LENGTH 1,000' SAME 1,000' SAME 1,000' SAME 1,000' SAMEINNER WIDTH 250' SAME 250' SAME 250' SAME 250' SAMEOUTER WIDTH 450' SAME 450' SAME 450' SAME 450' SAMEACRES 8.035 SAME 8.035 SAME 8.035 SAME 8.035 SAMEDISPLACED THRESHOLD COORDINATES:LATITUDE (NAD 83) N/A TBD N/A SAME 40° 28' 27.58" SAME N/A SAMELONGITUDE (NAD 83) N/A TBD N/A SAME 81° 25' 24.97" SAME N/A SAMEDISPLACED THRESHOLD ELEVATION N/A TBD N/A SAME 894.0' SAME N/A SAMEDISPLACED THRESHOLD DISTANCE N/A TBD N/A SAME 330' SAME N/A SAME
AIRPORT DATA TABLEDESCRIPTION EXISTING FUTURE
SERVICE LEVEL (NPIAS) GENERAL AVIATION SAMESTATE EQUIVALENT SERVICE ROLE LEVEL 2 GENERAL AVIATION SAMEAIRPORT REFERENCE CODE (ARC) B-I (SMALL AIRCRAFT) SAME
CRITICAL AIRCRAFT BEECHCRAFT BARON 58 SAMEAIRPORT ELEVATION (AMSL) (NAVD88) 894.6' SAMEMEAN MAX. TEMP. (HOTTEST MONTH) 83.4° (JULY) SAMEAIRPORT REFERENCE POINT (NAD 83)
LATITUDE 40°28' 11.73" SAMELONGITUDE 81°25' 10.83" SAME
MAGNETIC DECLINATION 8°19' W ± 0° 22' (JUNE 2017) 0°2' W PER YEARAIRPORT NAVIGATIONAL AIDS BEACON SAME
MISCELLANEOUS FACILITIESAIRFIELD LIGHTING, LIGHTED WIND
CONE, ASOS SAME
EXISTING BUILDING TABLEID DESCRIPTION TOP EL.1 T-HANGAR 913.4'2 HANGAR 915.0'3 HANGAR 910.7'4 SHED 897.8'5 HANGAR 915.1'6 RESTAURANT 908.3'7 TERMINAL / FBO 918.3'8 SHED 899.5'9 SHED 898.9'
10 HANGAR 902.1'11 T-HANGAR (14-UNIT) 903.3'12 HANGAR 915.4'13 HANGAR 915.3'
FUTURE BUILDING TABLEID DESCRIPTION TOP EL.A 50'x50' HANGAR (3) 908'B 50'x50' HANGAR (3) 908'C 70'x85' HANGAR 908'D 56'x62' HANGAR (2) 908'E 52'x56' HANGAR (3) 911'F T-HANGAR (13-UNIT) 911'G T-HANGAR (12-UNIT) 911'H 33'x42' HANGAR (5) 911'I 80'x80' HANGAR 912'J 100'x100' HANGAR 917'K 100'x100' HANGAR 917'
MODIFICATION TO FAA DESIGN STANDARDSDESCRIPTION DESIGN STANDARD AERONAUTICAL STUDY NUMBER FAA APPROVAL
1. FUTURE BUILDING ELEVATIONSWERE CALCULATED BASED UPONTHEIR ESTIMATED HEIGHT ABOVEGROUND LEVEL.
EXISTING / FUTURE DECLARED DISTANCES TABLEEXISTING FUTURE EXISTING FUTURE
DISTANCES RUNWAY 12 RUNWAY 30 RUNWAY 12 RUNWAY 30 RUNWAY 15 RUNWAY 30 RUNWAY 15 RUNWAY 33TORA 1,907' 1,907' SAME SAME 3,951' 3,951' SAME SAMETODA 1,907' 1,907' SAME SAME 3,951' 3,951' SAME SAMEASDA 1,907' 1,758' SAME SAME 3,951' 3,634' SAME SAMELDA 1,758' 1,758' SAME SAME 3,621' 3,634' SAME SAME
GENERAL NOTES:
1. EXISTING BASE MAPPING, ELEVATIONS, ANDCOORDINATES WERE OBTAINED FROM A SURVEY,FLOWN ON 9/22/15.
2. RUNWAY MEETS LINE OF SIGHT REQUIREMENTS.
3. BASED ON THE CURRENT MAGNETIC AZIMUTHS OFBOTH RUNWAYS, THE RUNWAYS SHOULD BERENUMBERED AS SHOWN ON THIS SHEET. THEREMAINING SHEETS IN THE ALP SET IDENTIFY THERUNWAYS AS 12-30 AND 15-33.
4. THE EXISTING RUNWAY 15-33 CENTERLINE TOPARALLEL TAXIWAY A CENTERLINE SEPARATION OF135' DOES NOT MEET THE STANDARD SEPARATION OF150'. AS SUCH, THE PROPOSED CORRECTIVE ACTIONIS TO RELOCATE THE TAXIWAY CENTERLINE BY 15'.
5. DECLARED DISTANCES ARE RECOMMENDED TOCORRECT EXISTING NON-STANDARD CONDITIONS ANDARE THEREFORE REFLECTED AS AN EXISTINGCONDITION THROUGHOUT THIS ALP SET.
TAXIWAY / TAXILANE DATA TABLEEXISTING FUTURE
TAXIWAY DESIGN GROUP (TDG) 1B SAMETAXIWAY EDGE SAFETY MARGIN (TESM) 5' SAME
TAXIWAY / TAXILANE WIDTH 25'-50' 25'TAXIWAY SHOULDER WIDTH 10' SAME
TAXIWAY OFA 89' SAMETAXIWAY TSA 49' SAME
TAXIWAY SEPARATIONTAXIWAY CENTERLINE TO PARALLEL TAXIWAY CENTERLINE 70' SAME
TAXIWAY CENTERLINE TO FIXED OR MOVABLE OBJECT 44.5' SAMETAXILANE OFA 79' SAMETAXILANE TSA 49' SAME
TAXILANE CENTERLINE TO PARALLEL TAXILANE CENTERLINE 64' SAMETAXILANE CENTERLINE TO FIXED OR MOVABLE OBJECT 39.5' SAME
TAXIWAY LIGHTING MITL SAME
LIST OF NON-STANDARD ITEMSDESCRIPTION DESIGN STANDARD NON-STANDARD CONDITION DISPOSITION
RUNWAY 15 RSA & ROFA 240' BEYOND RWY END ROAD - CEMETERY DECLARED DISTANCESRUNWAY 12 RSA & ROFA 240' BEYOND RWY END ROAD - CEMETERY DECLARED DISTANCES
RUNWAY-TAXIWAY SEPARATION 150' 135' RELOCATE TAXIWAYRUNWAY 15 OFZ 200' FEET BEYOND RWY END ROAD - CEMETERY DECLARED DISTANCESRUNWAY 12 OFZ 200' FEET BEYOND RWY END ROAD - CEMETERY DECLARED DISTANCES
NONE REQUIRED

12 END EL. 891.1' / TDZE /
30 END TDZE / (HIGH POINT)
12
30
30 END EL. 886.0' (LOW POINT)
AIRPORT BEACON
TERMINAL APRON
RUNWAY 12-30 (1,907' X 70') TRUE BEARING (108.54° / 288.54°)
PAPI-4 (TYP.)
REIL (TYP.)
SCHOENBRUNNVILLAGE
B
B
DRPZ(1,000' L X 250' IW X 450' OW)
NON-PRECISION APPROACHSURFACE (20:1 SLOPE)(5,000' L X 500' IW X 2,000' OW)
EXIST. VISUAL APPROACHSURFACE (20:1 SLOPE)(5,000' L X 500' IW X 1,250' OW)
VISUAL APPROACH SURFACE
(20:1 SLOPE)
(5,000' L X 250' IW X 1,250' OW)
VISUAL APPROACH SURFACE
(20:1 SLOPE)
(5,000' L X 250' IW X 1,250' OW)
ARPZ
(1,000' L X 250' IW X 450' OW)
VISIBILITY > 1-MILE
ARPZ
(1,000' L X 250' IW X 450' OW)
VISIBILITY > 1-MILE
ARPZ(1,000' L X 250' IW X 450' OW)VISIBILITY > 1-MILE
ROFA / PRIMARY
SURFACE (TYP.)
3° PAPI OCS(4° AIMING ANGLE)
3° PAPI OCS(4° AIMING ANGLE)
10
6532 7 11 12 13
1
89
4
STATE OFOHIOPROPERTYLEASED TOCITY (SEENOTE D)
12
0'
25
0'
39
0'
39
0'
13
5'
36'
20'
35
'
18'
35' C 50' D 50'
23'TAXIWAY A11
5'
120'
250'
91'
265'
265'
SEE NOTE A
SEENOTE B
ELECTRICAL VAULT
RUNWAY 15-33 (3,951' X 100') (SEE NOTE I)
PRIMARYSURFACE
TSS SURFACE(20:1 SLOPE)
EXIST. TSS SURFACE(20:1 SLOPE)
TSS SURFACE
(15:1 SLOPE)
TSS SURFACE
(15:1 SLOPE)
EXIST. ASOSCLEARANCE AREA(500' RADIUS)
17
6' 114'
END EL. 886.1' (LOW POINT)
14 END TDZE EL. 894.6' (HIGH POINT)
EL. 894.0'
330' DISPLACEDTHRESHOLD77'
EXTENDED RUNWAY CENTERLINE (TYP.)
EXIST. ASOS
LIGHTEDWIND CONE
WIND TEESEGMENTED CIRCLE
EXIST. / FUT. ARP
SEENOTES C & G
SEENOTE E
SEE NOTE F
6' FENCE (TYP.)
PACS PHILPORT KY3547
SACS PHD A AE1807
SACS PHILPORT AZ MKKY3550
END EL.894.4'
240' STANDARD RSA /ROFA (ON LEASED STATE
PROPERTY)
DELAWARE DRIVE SE
E HIGH AVENUE15TH S
TREE
T NE
16
TH S
TREE
T N
E
17
TH S
TREE
T N
E
UNIVER
SITY D
RIVE
NE
US 250
E HIGH AVENUE
20TH
SE
20 TH SE
18
TH S
TREE
T N
E
FUT. ASOSCLEARANCE AREA(500' RADIUS)
ARPZ(1,000' L X 250' IWX 450' OW)VISIBILITY > 1-MILE
FUT.ASOS
33 END TDZE EL. 893.0'
RAILROAD
15
0'
25
'
25
'
RELOCATED ROAD
FUT.WASHRACK
A B C D
EF G
HI
J
K
EVERGREENBURIALPARK
CALVARYCEMETERY
EAST AVENUECEMETERY FUT. NON-PRECISION APPROACH
SURFACE (20:1 SLOPE)(5,000' L X 500' IW X 2,000' OW)
R5
R1
R3
R2
R6
R7
R9
R10R8
R18
R15
R13
R12
R14
R11
R16
R17
R4
UNPAVEDROAD
FUT. TSSSURFACE (20:1 SLOPE)
POTENTIAL 149'
DISPLACED
THRESHOLD
FUT. HOLDINGPOSITION (TYP.)
AIRPORT FENCEHEIGHT VARIES FROM4' TO 7' (TYP.)
TRUE BEARING (139.29° / 319.30°)
15
0'
EXIST UNDERGROUND FUELTANKS. (TO BE REMOVED)FUT. 10,000 GAL
AVGAS TANK (TYP.)
240' RSA
TIEDOWNS (TO BE REMOVED)
24
1'
3
AIRPORT LAYOUT PLANDRAWING
MAG
NETIC
DECLIN
ATIO
N
8° 19' W
± 0
° 22'
JUNE
2017AN
NUAL R
ATE
OF CHAN
GE
0°2' WSOURCE:
NAT
IONAL
GEOPH
YSIC
AL D
ATA
CENTE
R
MAGNETIC
N
TRUE
FAA AIP #
DRAWING NAME:
PROJECT NAME:
AIRPORT MASTERPLAN UPDATE
DESCRIPTIONNO.
REVISIONS
DATE BY
3-39-0060-012-2015
DIVISION:
DATE: DRAWING NUMBER:
PLANNING
MARCH2018
DESIGNER:
TECHNICIAN:
CHECKED BY:
PROJECT NUMBER:
148056
MJKAPN
APN
HARRY CLEVER FIELD AIRPORTNEW PHILADELPHIA, OHIO
NOTES:
0
SCALE: 1" = 300'HORIZONTAL SCALE
300' 600'
GENERAL NOTES:
1. EXISTING BASE MAPPING, ELEVATIONS, ANDCOORDINATES WERE OBTAINED FROM A SURVEY,FLOWN ON 9/22/15.
PLAN REFERENCED NOTES:
A. BUILDING RESTRICTION LINE (BRL) ASSUMES AHEIGHT OF 20' ABOVE THE NEAREST RUNWAYELEVATION.
B. EXISTING / FUTURE HOLDING POSITION MARKINGSARE LOCATED 125' FROM RUNWAY CENTERLINE.
C. THE RSA AND ROFA BEYOND RUNWAY 15 CURRENTLYEXTEND OFF THE AIRPORT PROPERTY AND ARENON-STANDARD DUE TO THE PRESENCE OF A ROADAND CEMETERY. IN ORDER TO REMOVE THOSENON-STANDARD FEATURES FROM THE RSA AND ROFA,THE PROPOSED CORRECTIVE ACTION IS TOIMPLEMENT DECLARED DISTANCES TO REDUCE THERUNWAY 33 ASDA AND LDA CALCULATIONS.
D. ALTHOUGH THE RSA AND ROFA BEYOND RUNWAY 33CURRENTLY EXTEND BEYOND THE AIRPORT PROPERTYLINE, THE SURFACES MEET FAA GRADING ANDCLEARANCE STANDARDS.
E. THE RSA AND ROFA BEYOND RUNWAY 12 CURRENTLYEXTEND OFF THE AIRPORT PROPERTY AND ARENON-STANDARD DUE TO THE PRESENCE OF A ROADAND CEMETERY. THE PROPOSED CORRECTIVE ACTIONIS IMPLEMENT DECLARED DISTANCES.
F. THE EXISTING RUNWAY 15-33 CENTERLINE TOPARALLEL TAXIWAY A CENTERLINE SEPARATION OF135' DOES NOT MEET THE STANDARD SEPARATION OF150'. AS SUCH, THE PROPOSED CORRECTIVE ACTIONIS TO RELOCATE THE TAXIWAY CENTERLINE BY 15'.
G. NO OBJECTS ARE LOCATED WITHIN THE OFZ LOCATED200' BEYOND THE RUNWAY 15 DISPLACEDTHRESHOLD.
H. THE ROADS DO NOT PENETRATE RUNWAY 15-33 20:1TSS OR RUNWAY 12-30 15:1 TSS. OBSTRUCTIONLIGHTS SHOULD BE INSTALLED FOR PART 77PENETRATIONS.
I. RUNWAY 15-33 MAY BE REDUCED TO 60 FEET WIDE INTHE FUTURE IN ACCORDANCE WITH RDC B-I (SMALLAIRCRAFT) STANDARDS.
FAA APPROVAL STAMP
DESCRIPTION
LEGEND
FUTUREEXISTING
PROPERTY LINE
BUILDINGS
PAVEMENT (AIRFIELD)
RSA
ROFA
NAVAIDS / LIGHTING
FENCE
BRL
AIRPORT BEACON
N/APAVEMENT REMOVAL
EASEMENT
ROFZ
N/A
N/A
AIRPORT REFERENCE POINT (ARP)
N/A
N/A
N/A
N/A
N/A
PAVEMENT (ROADS / PARKING)
EXISTING BUILDING TABLEID DESCRIPTION TOP EL.1 T-HANGAR 913.4'2 HANGAR 915.0'3 HANGAR 910.7'4 SHED 897.8'5 HANGAR 915.1'6 RESTAURANT 908.3'7 TERMINAL / FBO 918.3'8 SHED 899.5'9 SHED 898.9'
10 HANGAR 902.1'11 T-HANGAR (14-UNIT) 903.3'12 HANGAR 915.4'13 HANGAR 915.3'
FUTURE BUILDING TABLEID DESCRIPTION TOP EL.A 50'x50' HANGAR (3) 908'B 50'x50' HANGAR (3) 908'C 70'x85' HANGAR 908'D 56'x62' HANGAR (2) 908'E 52'x56' HANGAR (3) 911'F T-HANGAR (13-UNIT) 911'G T-HANGAR (12-UNIT) 911'H 33'x42' HANGAR (5) 911'I 80'x80' HANGAR 912'J 100'x100' HANGAR 917'K 100'x100' HANGAR 917'
RUNWAY 12 END APPROACH TRAVERSE WAY TABLE
ID ROADWAY EL.ROADWAY EL. + PART 77
CLEARANCE REQUIREMENTSEXISTING
PENETRATION DISPOSITION
R11 854.0' 864.0' -67.9' NONER12 893.0' 903.0' 1.3' OBST. LIGHT (SEE NOTE H)R13 893.0' 903.0' 3.7' OBST. LIGHT (SEE NOTE H)R14 893.0' 903.0' 5.9' OBST. LIGHT (SEE NOTE H)R15 893.0' 908.0' 16.3' OBST. LIGHT (SEE NOTE H)
RUNWAY 30 END APPROACH TRAVERSE WAY TABLE
ID ROADWAY EL.ROADWAY EL. + PART 77
CLEARANCE REQUIREMENTSEXISTING
PENETRATION DISPOSITION
R6 886.0' 901.0' -24.7' RELOCATE ROADR16 888.0' 903.0' -23.0' NONER17 886.0' 901.0' -26.2' RELOCATE ROADR18 885.0' 900.0' -24.0' RELOCATE ROAD
RUNWAY 15 END APPROACH TRAVERSE WAY TABLE
ID ROADWAY EL.ROADWAY EL. + PART 77
CLEARANCE REQUIREMENTSEXISTING
PENETRATION DISPOSITION
R1 890.0' 905.0' -18.0' NONER2 893.0' 903.0' -10.7' NONER3 895.0' 905.0' -2.7' NONER4 895.1' 910.1' 15.7' OBST. LIGHT (SEE NOTE H)R5 894.8' 909.8' 13.5' OBST. LIGHT (SEE NOTE H)
RUNWAY 33 END APPROACH TRAVERSE WAY TABLE
ID ROADWAY EL.ROADWAY EL. + PART 77
CLEARANCE REQUIREMENTSEXISTING
PENETRATIONFUTURE
PENETRATION DISPOSITION
R6 876.0' 901.0' 11.7' 11.8' RELOCATE ROADR7 873.0' 898.0' 7.1' 7.2' RELOCATE ROADR8 870.0' 895.0' 1.3' 1.4' OBST. LIGHT (SEE NOTE H)R9 870.0' 895.0' -42.1' -41.1' NONE
R10 872.0' 897.0' -40.1' -39.1' NONE1. ROAD ELEVATIONS ARE ESTIMATED AND INCLUDE PART 77 CLEARANCE REQUIREMENTS. 1. ROAD ELEVATIONS ARE ESTIMATED AND INCLUDE PART 77 CLEARANCE REQUIREMENTS.
1. ROAD ELEVATIONS ARE ESTIMATED AND INCLUDE PART 77 CLEARANCE REQUIREMENTS.1. ROAD ELEVATIONS ARE ESTIMATED AND INCLUDE PART 77 CLEARANCE REQUIREMENTS.
LEASED PROPERTY LINE N/A
RUNWAY 12 RUNWAY 30 RUNWAY 15 RUNWAY 33EXISTING FUTURE EXISTING FUTURE EXISTING FUTURE EXISTING FUTURE
RUNWAY END COORDINATES:LATITUDE (NAD 83) 40° 28' 09.94" SAME 40° 28' 04.03" SAME 40° 28' 30.05" SAME 40° 28' 00.46" SAMELONGITUDE (NAD 83) 81° 25' 24.72 " SAME 81° 25' 01.58" SAME 81° 25' 27.76" SAME 81° 24' 54.43" SAMEDISPLACED THRESHOLD COORDINATES:LATITUDE (NAD 83) N/A TBD N/A SAME 40° 28' 27.58" SAME N/A SAMELONGITUDE (NAD 83) N/A TBD N/A SAME 81° 25' 24.97" SAME N/A SAME

15 ENDEL. 894.4'
33 ENDEL. 886.1'
5
AIRPORTEL. 894.6'
HORIZONTALSURFACE
EL. 1,044.6'
REFER TO INNER PORTIONOF THE APPROACH SURFACEDRAWINGS FOR CLOSE-INOBSTRUCTIONS (TYP.)
7:1
TRANSITIONALSURFACE (TYP.)
7:1
PRIMARYSURFACE (TYP.)
1,200'
1,244.6'
1,050'
1,100'
1,150'
1,044.6'
1,200'
1,244.6'
1,050'
1,100'
1,150'
1,044.6'
90
0'
1,0
44
.6'
95
0'
1,0
00
'
90
0'
1,0
44
.6'
95
0'
1,0
00
'
1,2
00
'
1,2
44
.6'
1,0
50
'
1,1
00
'
1,1
50
'
1,2
00
'
1,2
44
.6'
1,0
50
'
1,1
00
'
1,1
50
'
NPIAPPROACH(20:1 SLOPE)
NPIAPPROACH(20:1 SLOPE)
CON
ICAL
SU
RFA
CE(2
0:1
SLO
PE)
4,0
00
'
1,1
44
.4'
1,1
36
.1'
EXIST.PROPERTY LINE
EXTENDEDRUNWAYCENTERLINE(TYP.)
FUT.PROPERTYLINE
0 2,000' 10,000'8,000'6,000'4,000'02,000'
1,000'
1,400'
10,000' 8,000' 6,000' 4,000'
800'
1,200'
600'
1,200'
1,000'
1,400'
600'
END EL.894.4' END EL.
886.1'15 33
800'
1,200'
1,000'
1,400'
600'
800'
1,000'
1,400'
800'
1,200'
600'
AIRPORT EL. 894.6'HORIZONTAL SURFACE
EL. 1,044.6'
CONICAL SURFACE
(20:1 SLOPE)CONICAL SURFACE
(20:1 SLOPE)NPI APPROACH
(20:1 SLOPE) NPI APPROACH
(20:1 SLOPE)
4
6CENTERLINE GROUND PROFILE (TYP.)
HIGH GROUND PROFILE (TYP.)
LOW GROUNDPROFILE (TYP.)
DELAWAREDRIVE SESKINNER
DRIVE SE
POMPANOLANE SE
SCHOENBRUNN VILLAGESTATE MEMORIAL ENTRANCE
20th ST. SE21st ST. SE
4
AIRPORT AIRSPACEDRAWING - RUNWAY 15-33
MAG
NETIC
DECLIN
ATIO
N
8° 19' W
± 0
° 22'
JUNE
2017AN
NUAL R
ATE
OF CHAN
GE
0°2' WSOURCE:
NAT
IONAL
GEOPH
YSIC
AL D
ATA
CENTE
R
MAGNETIC
N
TRUE
FAA AIP #
DRAWING NAME:
PROJECT NAME:
AIRPORT MASTERPLAN UPDATE
DESCRIPTIONNO.
REVISIONS
DATE BY
3-39-0060-012-2015
DIVISION:
DATE: DRAWING NUMBER:
PLANNING
MARCH2018
DESIGNER:
TECHNICIAN:
CHECKED BY:
PROJECT NUMBER:
148056
MJKAPN
APN
HARRY CLEVER FIELD AIRPORTNEW PHILADELPHIA, OHIO
NOTES:
0
SCALE: 1" = 2,000'HORIZONTAL SCALE
2,000' 4,000'
0
SCAL
E: 1
" = 2
00
'VE
RTI
CAL
SCAL
E
20
0'
40
0'
0
SCALE: 1" = 2,000'HORIZONTAL SCALE
2,000' 4,000'
PLAN VIEW RUNWAY 15-33
PROFILE VIEW RUNWAY 15-33
1. OBSTRUCTION DATA SOURCE: FAA DIGITAL OBSTACLE FILE (DOF), 09/13/2015.
GENERAL NOTES:
1. EXISTING BASE MAPPING, ELEVATIONS, ANDCOORDINATES WERE OBTAINED FROM A SURVEY,FLOWN ON 9/22/15.
2. FEDERAL AVIATION REGULATIONS (FAR) PART 77SPECIFIES CLEARANCE REQUIREMENTS FOR ROADS,RAILROADS, AND WATERWAYS AS FOLLOWS: A) 17FEET FOR AN INTERSTATE HIGHWAY, B) 15 FEET FORANY OTHER PUBLIC ROADWAY, C) 10 FEET OR THEHEIGHT OF THE HIGHEST MOBILE OBJECT THATWOULD NORMALLY TRAVERSE THE ROAD, WHICHEVERIS GREATER, FOR A PRIVATE ROAD, D) 23 FEET FOR ARAILROAD, AND E) FOR A WATERWAY OR ANY OTHERTRAVERSE WAY NOT PREVIOUSLY MENTIONED, ANAMOUNT EQUAL TO THE HEIGHT OF THE HIGHESTMOBILE OBJECT THAT WOULD NORMALLY TRAVERSEIT.
3. THERE IS NOT CURRENTLY A LOCAL ZONINGORDINANCE IN PLACE TO PROTECT THE AIRSPACESURROUNDING THE AIRPORT. HOWEVER, THE OHIOAIRPORT PROTECTION ACT REQUIRES THAT SPECIFICPROPOSED DEVELOPMENTS IN THE VICINITY OF THEAIRPORT BE COORDINATED WITH THE FAA INACCORDANCE WITH FAR PART 77.
DIGITAL OBSTACLE FILE (DOF) OBSTRUCTION DATA TABLEID DESCRIPTION JULIAN DATE GROUND SURFACE EL. AGL AMSL SURFACE PENETRATION LIGHTING MARKING FAA_STUDY DISPOSITION1 TOWER 2014152 1,104.0' 150.0' 1,254.0' CONICAL 207.9' RED MARKED 1976AGL00356OE NONE2 TOWER 2014152 1,099.0' 100.0' 1,199.0' CONICAL 142.2' UNKNOWN UNKNOWN LIGHT / MARK3 TOWER 2014152 1,039.0' 111.0' 1,150.0' HORIZONTAL 105.9' UNKNOWN UNKNOWN LIGHT / MARK4 BUILDING 2014124 878.0' 14.0' 892.0' APPROACH -8.6' NONE NONE 2002AGL06869OE NONE5 TOWER 2004053 1,140.0' 169.0' 1,309.0' CONICAL 239.4' RED MARKED 1999AGL01578OE NONE6 TOWER 2014152 882.0' 100.0' 982.0' HORIZONTAL / APPROACH -62.1 / -99.0' RED MARKED 1992AGL01819OE NONE

5
1,044.6'
1,150'
1,100'
1,050'
1,244.6'
1,200'
1,044.6'
1,150'
1,100'
1,050'
1,244.6'1,200'
PRIMARYSURFACE (TYP.) TRANSITIONAL
SURFACE
7:1
HORIZONTALSURFACE
EL. 1,044.6'
AIRPORTEL. 894.6'
30 ENDEL. 886.0'
12 ENDEL. 891.1'
4,00
0'
VISUALAPPROACH(20:1 SLOPE)
VISUALAPPROACH(20:1 SLOPE)
1,1
50
'
1,1
00
'
1,0
50
'
1,2
44
.6'
1,2
00
'1,150'
1,100'
1,050'
1,244.6'
1,200' 1,0
00
'
95
0'
1,0
44
.6'
90
0'
1,0
00
'
95
0'
1,0
44
.6'
90
0'
1,1
41
.1'
1,1
36
.0'
FUT. PROPERTYLINE
CONI
CAL
SURF
ACE
(20:
1 SL
OPE)
EXIST.PROPERTY LINE
0 2,000' 12,000'10,000'8,000'6,000'4,000'02,000'
1,000'
1,400'
12,000' 10,000' 8,000' 6,000' 4,000'
800'
1,200'
600'
1,200'
1,000'
1,400'
600'
END EL.891.1'
END EL.886.0'
12 30
800'
1,000'
1,400'
800'
1,200'
600'
AIRPORTEL. 894.6'
HORIZONTALSURFACE
EL. 1,044.6'
CONICAL SURFACE
(20:1 SLOPE) CONICAL SURFACE
(20:1 SLOPE)VISUAL APPROACH
(20:1 SLOPE) VISUAL APPROACH
(20:1 SLOPE)
CENTERLINE GROUND PROFILE (TYP.)HIGH GROUND PROFILE (TYP.)
LOW GROUNDPROFILE (TYP.)RAILROAD
SKINNERLANE SE
EAST HIGHAVENUE
SCHOENBRUNNVILLAGE STATEMEMORIAL ENTRANCE
5
AIRPORT AIRSPACEDRAWING - RUNWAY 12-30
MAG
NETIC
DECLIN
ATIO
N
8° 19' W
± 0
° 22'
JUNE
2017AN
NUAL R
ATE
OF CHAN
GE
0°2' WSOURCE:
NAT
IONAL
GEOPH
YSIC
AL D
ATA
CENTE
R
MAGNETIC
N
TRUE
FAA AIP #
DRAWING NAME:
PROJECT NAME:
AIRPORT MASTERPLAN UPDATE
DESCRIPTIONNO.
REVISIONS
DATE BY
3-39-0060-012-2015
DIVISION:
DATE: DRAWING NUMBER:
PLANNING
MARCH2018
DESIGNER:
TECHNICIAN:
CHECKED BY:
PROJECT NUMBER:
148056
MJKAPN
APN
HARRY CLEVER FIELD AIRPORTNEW PHILADELPHIA, OHIO
NOTES:
0
SCALE: 1" = 2,000'HORIZONTAL SCALE
2,000' 4,000'
0
SCAL
E: 1
" = 2
00
'VE
RTI
CAL
SCAL
E
20
0'
40
0'
0
SCALE: 1" = 2,000'HORIZONTAL SCALE
2,000' 4,000'
PLAN VIEW RUNWAY 12-30
PROFILE VIEW RUNWAY 12-30
DIGITAL OBSTACLE FILE (DOF) OBSTRUCTION DATA TABLEID DESCRIPTION JULIAN DATE GROUND SURFACE EL. AGL AMSL SURFACE PENETRATION LIGHTING MARKING FAA_STUDY DISPOSITION1 TOWER 2014152 1,104.0' 150.0' 1,254.0' CONICAL 207.9' RED MARKED 1976AGL00356OE NONE2 TOWER 2014152 1,099.0' 100.0' 1,199.0' CONICAL 142.2' UNKNOWN UNKNOWN LIGHT / MARK3 TOWER 2014152 1,039.0' 111.0' 1,150.0' HORIZONTAL 105.9' UNKNOWN UNKNOWN LIGHT / MARK4 BUILDING 2014124 878.0' 14.0' 892.0' APPROACH -8.6' NONE NONE 2002AGL06869OE NONE5 TOWER 2004053 1,140.0' 169.0' 1,309.0' CONICAL 239.4' RED MARKED 1999AGL01578OE NONE6 TOWER 2014152 882.0' 100.0' 982.0' HORIZONTAL / APPROACH -62.1 / -99.0' RED MARKED 1992AGL01819OE NONE
1. OBSTRUCTION DATA SOURCE: FAA DIGITAL OBSTACLE FILE (DOF), 09/13/2015.
GENERAL NOTES:
1. EXISTING BASE MAPPING, ELEVATIONS, ANDCOORDINATES WERE OBTAINED FROM A SURVEY,FLOWN ON 9/22/15.
2. FEDERAL AVIATION REGULATIONS (FAR) PART 77SPECIFIES CLEARANCE REQUIREMENTS FOR ROADS,RAILROADS, AND WATERWAYS AS FOLLOWS: A) 17FEET FOR AN INTERSTATE HIGHWAY, B) 15 FEET FORANY OTHER PUBLIC ROADWAY, C) 10 FEET OR THEHEIGHT OF THE HIGHEST MOBILE OBJECT THATWOULD NORMALLY TRAVERSE THE ROAD, WHICHEVERIS GREATER, FOR A PRIVATE ROAD, D) 23 FEET FOR ARAILROAD, AND E) FOR A WATERWAY OR ANY OTHERTRAVERSE WAY NOT PREVIOUSLY MENTIONED, ANAMOUNT EQUAL TO THE HEIGHT OF THE HIGHESTMOBILE OBJECT THAT WOULD NORMALLY TRAVERSEIT.
3. THERE IS NOT CURRENTLY A LOCAL ZONINGORDINANCE IN PLACE TO PROTECT THE AIRSPACESURROUNDING THE AIRPORT. HOWEVER, THE OHIOAIRPORT PROTECTION ACT REQUIRES THAT SPECIFICPROPOSED DEVELOPMENTS IN THE VICINITY OF THEAIRPORT BE COORDINATED WITH THE FAA INACCORDANCE WITH FAR PART 77.

15 ENDEL. 894.4'
PAPI-4
ARPZ(1,000' L X 250' IW X 450' OW)VISIBILITY > 1-MILE
DRPZ(1,000' L X 250' IW X 450' OW)
12
0'
25
0'
20:1 TSS(10,000' L x 400' IW x 3,800' OW)
20:1 NPI APPROACH(5,000' L x 500' IW x 2,000' OW)VISIBILITY 1-MILE
200'
200'330' DISPLACED
THRESHOLD
3° PAPI OCS(4° AIMING ANGLE)
300'DISPLACEDTHRESHOLDEL. 894.0'
PRIMARYSURFACE
7950
7966
7974
32762
32778
7678
76869088
77'
8968
915238558
R2
R3
R1
R5
R4
EXIST. PROPERTY LINESEE NOTE A
FUT. PROPERTY LINE
EXTENDED RUNWAY CENTERLINE
END EL.894.4'
15
960'
980'
0200'400'600'800'1,000'1,200'1,400'1,600'1,800'2,000'2,200'
940'
900'
920'920'
960'
980'
940'
900'
880'880'
860'860'
-200' -600'-400'840'840'
1,000'1,000'
-800'
20:1 NPI APPROACH
PAPI-4
300'
20:1 TSS 3° PAPI OCS(4° AIMING ANGLE)
DISPLACEDTHRESHOLDEL. 894.0'
CENTERLINE GROUND PROFILE
HIGH GROUND PROFILE
LOW GROUND PROFILE
38558
8968
7686
9152
90887678
32762 79747966
32778
7950
R1 R2R3
R4R5
SEE NOTE B
330' DISPLACEDTHRESHOLD
200' 200'
6
INNER PORTION OF THEAPPROACH SURFACE
DRAWING - RUNWAY 15
MAG
NETIC
DECLIN
ATIO
N
8° 19' W
± 0
° 22'
JUNE
2017AN
NUAL R
ATE
OF CHAN
GE
0°2' WSOURCE:
NAT
IONAL
GEOPH
YSIC
AL D
ATA
CENTE
R
MAGNETIC
N
TRUE
FAA AIP #
DRAWING NAME:
PROJECT NAME:
AIRPORT MASTERPLAN UPDATE
DESCRIPTIONNO.
REVISIONS
DATE BY
3-39-0060-012-2015
DIVISION:
DATE: DRAWING NUMBER:
PLANNING
MARCH2018
DESIGNER:
TECHNICIAN:
CHECKED BY:
PROJECT NUMBER:
148056
MJKAPN
APN
HARRY CLEVER FIELD AIRPORTNEW PHILADELPHIA, OHIO
NOTES:
0
SCALE: 1" = 200'HORIZONTAL SCALE
200' 400'
0
SCAL
E: 1
" = 2
0'
VER
TICA
L SC
ALE
20
'4
0'
0
SCALE: 1" = 200'HORIZONTAL SCALE
200' 400'
PLAN VIEW RUNWAY 15
PROFILE VIEW RUNWAY 15
RUNWAY 15 OBSTRUCTION DATA TABLE - (20:1) THRESHOLD SITING SURFACE (TSS)
ID DESCRIPTION TRIGGERINGEVENT
OBJECT TOPEL.
EXISTINGSURFACE EL.
EXISTINGPENETRATION DISPOSITION
7678 TREE EXISTING 962.7' 936.5' 26.2' TRIM / REMOVE7686 TREE EXISTING 956.2' 940.6' 15.6' TRIM / REMOVE7950 TREE EXISTING 952.6' 919.2' 33.4' TRIM / REMOVE7966 TREE EXISTING 955.7' 923.1' 32.6' TRIM / REMOVE7974 TREE EXISTING 959.0' 924.9' 34.1' TRIM / REMOVE9088 TREE EXISTING 960.3' 938.2' 22.1' TRIM / REMOVE
32762 TREE EXISTING 974.0' 926.7' 47.3' TRIM / REMOVE32778 TREE EXISTING 964.7' 921.2' 43.5' TRIM / REMOVE
RUNWAY 15 OBSTRUCTION DATA TABLE - (20:1) PART 77 APPROACH SURFACE (NPI)
ID DESCRIPTION TRIGGERINGEVENT
OBJECT TOPEL.
EXISTINGSURFACE EL.
EXISTINGPENETRATION DISPOSITION
7678 TREE EXISTING 962.7' 920.3' 42.4' TRIM / REMOVE7686 TREE EXISTING 956.2' 924.4' 31.8' TRIM / REMOVE7950 TREE EXISTING 952.6' 903.0' 49.6' TRIM / REMOVE7966 TREE EXISTING 955.7' 906.9' 48.7' TRIM / REMOVE7974 TREE EXISTING 959.0' 908.7' 50.3' TRIM / REMOVE8968 TREE EXISTING 933.0' 938.0' -5.0' MONITOR9088 TREE EXISTING 960.3' 922.0' 38.3' TRIM / REMOVE9152 TREE EXISTING 919.8' 923.5' -3.7' MONITOR
32762 TREE EXISTING 974.0' 910.5' 63.5' TRIM / REMOVE32778 TREE EXISTING 964.7' 905.0' 59.7' TRIM / REMOVE38558 TREE EXISTING 936.7' 936.9' -0.2' MONITOR
RUNWAY 15 OBSTRUCTION DATA TABLE - 3° PAPI OCS (4° AIMING ANGLE)ID DESCRIPTION TRIGGERING EVENT OBJECT TOP EL. EXISTING SURFACE EL. EXISTING PENETRATION DISPOSITION
7678 TREE EXISTING 962.7' 956.8' 5.9' TRIM / REMOVE7686 TREE EXISTING 956.2' 960.8' -4.6' TRIM / REMOVE9088 TREE EXISTING 960.3' 958.5' 1.8' TRIM / REMOVE
XO
LEGENDTSS SURFACE OBSTRUCTIONPART 77 SURFACE OBSTRUCTIONPRIMARY SURFACE OBSTRUCTIONOBSTRUCTION WITHIN 5' OF SURFACE
1. ONLY A SAMPLING OF OBSTRUCTIONS ARE SHOWN IN TABLES DUE TO DENSITY.
RUNWAY 15 END APPROACH TRAVERSE WAY TABLE
ID ROADWAY EL.ROADWAY EL. + PART 77
CLEARANCE REQUIREMENTSEXISTING
PENETRATION DISPOSITION
R1 890.0' 905.0' -18.0' NONER2 893.0' 903.0' -10.7' NONER3 895.0' 905.0' -2.7' NONER4 895.1' 910.1' 15.7' OBST. LIGHT (SEE NOTE C)R5 894.8' 909.8' 13.5' OBST. LIGHT (SEE NOTE C)
RUNWAY 15 END TSS TRAVERSE WAY TABLE
ID ROADWAY EL.ROADWAY EL. + PART 77
CLEARANCE REQUIREMENTSEXISTING
PENETRATION DISPOSITION
R1 890.0' 905.0' -34.2 NONER2 893.0' 903.0' -26.9 NONER3 895.0' 905.0' -18.9 NONER4 895.1' 910.1' -0.5 OBST. LIGHT (SEE NOTE H)R5 894.8' 909.8' -2.7 OBST. LIGHT (SEE NOTE H)
1. ONLY A SAMPLING OF OBSTRUCTIONS ARE SHOWN IN TABLES DUE TO DENSITY.
PLAN REFERENCED NOTES:
A. BUILDING RESTRICTION LINE (BRL) ASSUMES AHEIGHT OF 20' ABOVE THE NEAREST RUNWAYELEVATION.
B. THE BASE ELEVATIONS OF ALL OBJECTS AREUNKNOWN. THEREFORE, OBJECTS WERE TRIMMEDAT THE COMPOSITE PROFILE HIGH.
C. THE ROADS DO NOT PENETRATE THE 20:1 TSS.OBSTRUCTION LIGHTS SHOULD BE INSTALLED FORPART 77 PENETRATIONS.
GENERAL NOTES:
1. EXISTING BASE MAPPING, ELEVATIONS, ANDCOORDINATES WERE OBTAINED FROM A SURVEY,FLOWN ON 9/22/15.
2. FEDERAL AVIATION REGULATIONS (FAR) PART 77SPECIFIES CLEARANCE REQUIREMENTS FOR ROADS,RAILROADS, AND WATERWAYS AS FOLLOWS: A) 17FEET FOR AN INTERSTATE HIGHWAY, B) 15 FEET FORANY OTHER PUBLIC ROADWAY, C) 10 FEET OR THEHEIGHT OF THE HIGHEST MOBILE OBJECT THATWOULD NORMALLY TRAVERSE THE ROAD, WHICHEVERIS GREATER, FOR A PRIVATE ROAD, D) 23 FEET FOR ARAILROAD, AND E) FOR A WATERWAY OR ANY OTHERTRAVERSE WAY NOT PREVIOUSLY MENTIONED, ANAMOUNT EQUAL TO THE HEIGHT OF THE HIGHESTMOBILE OBJECT THAT WOULD NORMALLY TRAVERSEIT.
3. THE CITY WAS IN THE PROCESS OF REMOVING TREEOBSTRUCTIONS AT THE TIME THIS EVALUATION WASCONDUCTED. THEREFORE, SOME TREEOBSTRUCTIONS SHOWN MAY HAVE BEEN IDENTIFIEDAND REMOVED BY THE CITY.

30
33 ENDEL. 886.1'
PAPI-4
EXIST. 20:1 TSS(5,000' L x 250' IW x 700' OW)
EXIST. 20:1 VISUAL APPROACH(5,000' L x 500' IW x 1,250' OW)
25
0'
12
0'
ARPZ(1,000' L X 250' IW X 450' OW)VISIBILITY > 1-MILE
3° PAPI OCS(4° AIMING ANGLE)
300'
PRIMARYSURFACE
38800
38832
5746
38824
39128
38912
38928
38984
39080
3908839096
3912039112
39104
R8R10
R9
R7
R6
FUT. 20:1 TSS(10,000' L x 400' IW x 3,800' OW)
STANDARDRSA / ROFA(ON LEASED STATEPROPERTY)
200'38840
5754
38816
38808
38904
38864
38920
3196031928
31904
31998
SEE NOTE A
FUT. 20:1 NPI APPROACH(5,000' L x 500' IW x 2,000' OW)VISIBILITY 1-MILER18
O
STATE OF OHIO PROPERTYLEASE TO CITY (4.1 ACRESSEE NOTE D)EXIST.
PROPERTYLINE
FUT. PROPERTY LINE
LEASEDPROPERTYLINE
EXTENDED RUNWAY CENTERLINE
END EL.886.1'
33
0 200' 400' 600' 800' 1,000' 1,200' 1,400' 1,600' 1,800'
920'
960'
980'
1,000'
940'
900'
880'
960'
980'
1,000'
940'
900'
920'
880'
860'860'
2,000' 2,200'-200-400-600-800840'840'
PAPI-4
300'
EXIST. 20:1 VISUAL /FUT. NPI APPROACH /FUT. TSS
EXIST. 20:1 TSS
3° PAPI OCS(4° AIMING ANGLE)
CENTERLINE GROUND PROFILE
HIGH GROUND PROFILE
LOW GROUND PROFILE
39104
39128
38824 5746
39080
39088
39096
39112
39120
3883238800
38912
3898438928
R6R7
R8 R9R10
38840
5754
38816
38808
38904
38864 38920
31960 31928
31904
31998
SEE NOTE B
200'R18
7
INNER PORTION OF THEAPPROACH SURFACE
DRAWING - RUNWAY 33
FAA AIP #
DRAWING NAME:
PROJECT NAME:
AIRPORT MASTERPLAN UPDATE
DESCRIPTIONNO.
REVISIONS
DATE BY
3-39-0060-012-2015
DIVISION:
DATE: DRAWING NUMBER:
PLANNING
MARCH2018
DESIGNER:
TECHNICIAN:
CHECKED BY:
PROJECT NUMBER:
148056
MJKAPN
APN
HARRY CLEVER FIELD AIRPORTNEW PHILADELPHIA, OHIO
NOTES:
0
SCALE: 1" = 200'HORIZONTAL SCALE
200' 400'
0
SCAL
E: 1
" = 2
0'
VER
TICA
L SC
ALE
20
'4
0'
0
SCALE: 1" = 200'HORIZONTAL SCALE
200' 400'
PLAN VIEW RUNWAY 33
PROFILE VIEW RUNWAY 33
MAG
NETIC
DECLIN
ATIO
N
8° 19' W
± 0
° 22'
JUNE
2017AN
NUAL R
ATE
OF CHAN
GE
0°2' WSOURCE:
NAT
IONAL
GEOPH
YSIC
AL D
ATA
CENTE
R
MAGNETIC
N
TRUE
RUNWAY 33 OBSTRUCTION DATA TABLE - (20:1) THRESHOLD SITING SURFACE (TSS)
ID DESCRIPTION TRIGGERINGEVENT
OBJECT TOPEL.
EXISTINGSURFACE EL.
EXISTINGPENETRATION
FUTURESURFACE EL.
FUTUREPENETRATION DISPOSITION
5746 TREE EXISTING 922.3' N/A N/A 904.1' 18.2' TRIM / REMOVE5754 TREE EXISTING 911.9' N/A N/A 904.9' 7.0' TRIM / REMOVE
31904 TREE EXISTING 942.9' N/A N/A 940.2' 2.6' TRIM / REMOVE31928 TREE EXISTING 946.7' N/A N/A 929.1' 17.6' TRIM / REMOVE31960 TREE EXISTING 926.7' N/A N/A 916.7' 10.0' TRIM / REMOVE31998 TREE EXISTING 955.0' N/A N/A 945.5' 9.5' TRIM / REMOVE38800 TREE EXISTING 943.7' 920.7' 23.0' SAME SAME TRIM / REMOVE38808 TREE EXISTING 920.0' N/A N/A 912.4' 7.6' TRIM / REMOVE38816 TREE EXISTING 916.0' N/A N/A 906.1' 9.9' TRIM / REMOVE38832 TREE EXISTING 942.3' 916.7' 25.6' SAME SAME TRIM / REMOVE38840 TREE EXISTING 934.1' N/A N/A 929.1' 5.0' TRIM / REMOVE38864 TREE EXISTING 956.4' N/A N/A 946.4' 10.0' TRIM / REMOVE38904 TREE EXISTING 950.9' N/A N/A 937.6' 13.3' TRIM / REMOVE38912 TREE EXISTING 949.5' 950.7' -1.2' SAME SAME MONITOR38920 TREE EXISTING 958.9' N/A N/A 951.4' 7.6' TRIM / REMOVE39128 BUSH EXISTING 898.4' 901.5' -3.0' SAME SAME MONITOR
RUNWAY 33 OBSTRUCTION DATA TABLE - EXISTING (20:1) VISUAL / FUT. (20:1) NPI PART 77 APPROACH SURFACE
ID DESCRIPTION TRIGGERINGEVENT
OBJECT TOPEL.
EXISTINGSURFACE EL.
EXISTINGPENETRATION
FUTURESURFACE EL.
FUTUREPENETRATION DISPOSITION
5746 TREE EXISTING 922.3' 894.1' 28.2' SAME SAME TRIM / REMOVE31832 TREE EXISTING 964.1' N/A N/A 962.2' 1.9' TRIM / REMOVE31896 TREE EXISTING 933.4' N/A N/A 936.4' -3.0' MONITOR31904 TREE EXISTING 942.9' N/A N/A 930.2' 12.6' TRIM / REMOVE31928 TREE EXISTING 946.7' N/A N/A 919.1' 27.6' TRIM / REMOVE31960 TREE EXISTING 926.7' N/A N/A 906.7' 20.0' TRIM / REMOVE31998 TREE EXISTING 955.0' N/A N/A 935.5' 19.5' TRIM / REMOVE38800 TREE EXISTING 943.7' 910.7' 33.0' SAME SAME TRIM / REMOVE38824 TREE EXISTING 925.8' 892.2' 33.5' SAME SAME TRIM / REMOVE38832 TREE EXISTING 942.3' 906.7' 35.6' SAME SAME TRIM / REMOVE38928 TREE EXISTING 947.9' 949.4' -1.5' SAME SAME MONITOR38984 TREE EXISTING 951.1' 952.7' -1.5' SAME SAME MONITOR39080 BUSH EXISTING 892.6' 895.7' -3.1' SAME SAME MONITOR39088 BUSH EXISTING 893.5' 896.2' -2.7' SAME SAME MONITOR39096 BUSH EXISTING 893.5' 896.2' -2.7' SAME SAME MONITOR39104 BUSH EXISTING 893.4' 895.9' -2.5' SAME SAME MONITOR39112 BUSH EXISTING 893.7' 896.0' -2.3' SAME SAME MONITOR39120 BUSH EXISTING 893.7' 896.3' -2.5' SAME SAME MONITOR
RUNWAY 33 OBSTRUCTION DATA TABLE - 3° PAPI OCS (4° AIMING ANGLE)ID DESCRIPTION TRIGGERING EVENT OBJECT TOP EL. EXISTING SURFACE EL. EXISTING PENETRATION DISPOSITION
38800 TREE EXISTING 943.7' 947.2' -3.5' TRIM / REMOVE38832 TREE EXISTING 942.3' 943.6' -1.3' TRIM / REMOVE
RUNWAY 33 END APPROACH TRAVERSE WAY TABLE
ID ROADWAY EL.ROADWAY EL. + PART 77
CLEARANCE REQUIREMENTSEXISTING
PENETRATIONFUTURE
PENETRATION DISPOSITION
R6 876.0' 901.0' 11.7' 11.8' RELOCATE ROADR7 873.0' 898.0' 7.1' 7.2' RELOCATE ROADR8 870.0' 895.0' 1.3' 1.4' OBST. LIGHT (SEE NOTE C)R9 870.0' 895.0' -42.1' -41.1' NONE
R10 872.0' 897.0' -40.1' -39.1' NONE
RUNWAY 33 END TSS TRAVERSE WAY TABLE
ID ROADWAY EL.ROADWAY EL. + PART 77
CLEARANCE REQUIREMENTSEXISTING
PENETRATIONFUTURE
PENETRATION DISPOSITION
R7 883.0' 898.0' -2.8' -2.8' RELOCATE ROADR9 880.0' 895.0' N/A -51.1' NONE
R10 882.0' 897.0' N/A -49.1' NONER18 885.0' 900.0' -0.7' -0.7' NONE
XO
LEGEND
TSS SURFACE OBSTRUCTIONPART 77 SURFACE OBSTRUCTIONPRIMARY SURFACE OBSTRUCTIONOBSTRUCTION WITHIN 5' OF SURFACE
1. ONLY A SAMPLING OF OBSTRUCTIONS ARE SHOWN IN TABLES DUE TO DENSITY.
1. ONLY A SAMPLING OF OBSTRUCTIONS ARE SHOWN IN TABLES DUE TO DENSITY.
PLAN REFERENCED NOTES:
A. BUILDING RESTRICTION LINE (BRL) ASSUMES AHEIGHT OF 20' ABOVE THE NEAREST RUNWAYELEVATION.
B. THE BASE ELEVATIONS OF ALL OBJECTS AREUNKNOWN. THEREFORE, OBJECTS WERE TRIMMEDAT THE COMPOSITE PROFILE HIGH.
C. THE ROADS DO NOT PENETRATE THE 20:1 TSS.OBSTRUCTION LIGHTS SHOULD BE INSTALLED FORPART 77 PENETRATIONS.
GENERAL NOTES:
1. EXISTING BASE MAPPING, ELEVATIONS, ANDCOORDINATES WERE OBTAINED FROM A SURVEY,FLOWN ON 9/22/15.
2. FEDERAL AVIATION REGULATIONS (FAR) PART 77SPECIFIES CLEARANCE REQUIREMENTS FOR ROADS,RAILROADS, AND WATERWAYS AS FOLLOWS: A) 17FEET FOR AN INTERSTATE HIGHWAY, B) 15 FEET FORANY OTHER PUBLIC ROADWAY, C) 10 FEET OR THEHEIGHT OF THE HIGHEST MOBILE OBJECT THATWOULD NORMALLY TRAVERSE THE ROAD, WHICHEVERIS GREATER, FOR A PRIVATE ROAD, D) 23 FEET FOR ARAILROAD, AND E) FOR A WATERWAY OR ANY OTHERTRAVERSE WAY NOT PREVIOUSLY MENTIONED, ANAMOUNT EQUAL TO THE HEIGHT OF THE HIGHESTMOBILE OBJECT THAT WOULD NORMALLY TRAVERSEIT.
3. THE CITY WAS IN THE PROCESS OF REMOVING TREEOBSTRUCTIONS AT THE TIME THIS EVALUATION WASCONDUCTED. THEREFORE, SOME TREEOBSTRUCTIONS SHOWN MAY HAVE BEEN IDENTIFIEDAND REMOVED BY THE CITY.

1,0
00
'
95
0'
1,1
49
.4'
RUNWAY 33 (40:1) DEPARTURE SURFACE (10,200' L x 1,000' IW x 6,466' OW)
EXTENDED RUNWAYCENTERLINE (TYP.)
1,0
00
'
1,0
50
'
1,1
00
'
90
0'
3,2
33
'3
,23
3'
10,200'
15 ENDEL. 894.4'
R19
R20
R21
R2
R5
R4
1023710221
10381
86338625
86418745
385958841
9120
38520
32754
5058
EXIST. PROPERTY LINE
FUT. PROPERTY LINE
900'
1,100'
1,200'
1,000'2,000'3,000'4,000'5,000'6,000'7,000'8,000'9,000'10,000'11,000'
1,000'
800'
700'0
END EL.894.4'
15
RUNWAY 33 (40:1) DEPARTURE SURFACE
-1,000'
900'
1,100'
1,200'
1,000'
800'
700'
CENTERLINEGROUND PROFILE (TYP.)
LOW GROUNDPROFILE (TYP.)
HIGH GROUNDPROFILE (TYP.)
R2R5
R4
R19R20
R21
1023710221
10381
8633
86258641 8745
38595
8841
912038520 32754
5058
1,300'1,300'
900'
1,100'
1,200'
0 1,000' 2,000' 3,000' 4,000' 5,000' 6,000' 7,000' 8,000' 9,000' 10,000' 11,000'
1,000'
800'
700'
END EL.886.1'
33
-1,000'
900'
1,100'
1,200'
1,000'
800'
700'
RUNWAY 15 (40:1) DEPARTURE SURFACE
R7R8
R24
R23
R25
29263
29271
2909529103
29111
74547566
7582
39136
39088
39080
39096
39104
3912039112
1,300' 1,300'
95
0'
1,1
41
.1'
RUNWAY 15 (40:1) DEPARTURE SURFACE (10,200' L x 1,000' IW x 6,466' OW)
EXTENDED RUNWAYCENTERLINE (TYP.)
1,0
00
'
1,0
50
'
1,1
00
'
90
0'
1,0
00
'
3,2
33
'3
,23
3'
10,200'
33 ENDEL. 886.1'
R23
R24R25
R7
R8
29263
2927129095
2910329111
7454
7566
758239136
3908839080
3909639104
39120
39112
8
RUNWAY DEPARTURESURFACE DRAWING -
RUNWAY 15-33
MAG
NETIC
DECLIN
ATIO
N
8° 19' W
± 0
° 22'
JUNE
2017AN
NUAL R
ATE
OF CHAN
GE
0°2' WSOURCE:
NAT
IONAL
GEOPH
YSIC
AL D
ATA
CENTE
R
MAGNETIC
N
TRUE
FAA AIP #
DRAWING NAME:
PROJECT NAME:
AIRPORT MASTERPLAN UPDATE
DESCRIPTIONNO.
REVISIONS
DATE BY
3-39-0060-012-2015
DIVISION:
DATE: DRAWING NUMBER:
PLANNING
MARCH2018
DESIGNER:
TECHNICIAN:
CHECKED BY:
PROJECT NUMBER:
148056
MJKAPN
APN
HARRY CLEVER FIELD AIRPORTNEW PHILADELPHIA, OHIO
NOTES:
0
SCALE: 1" = 1,000'HORIZONTAL SCALE
1,000' 2,000'
0
SCAL
E: 1
" = 1
00
'VE
RTI
CAL
SCAL
E
10
0'
20
0'
0
SCALE: 1" = 1,000'HORIZONTAL SCALE
1,000' 2,000'
PLAN VIEW RUNWAY 33 DEPARTURE SURFACE
PROFILE VIEW RUNWAY 33 DEPARTURE SURFACE
0
SCALE: 1" = 1,000'HORIZONTAL SCALE
1,000' 2,000'PLAN VIEW RUNWAY 15 DEPARTURE SURFACE
PROFILE VIEW RUNWAY 15 DEPARTURE SURFACE
0
SCAL
E: 1
" = 1
00
'VE
RTI
CAL
SCAL
E
10
0'
20
0'
0
SCALE: 1" = 1,000'HORIZONTAL SCALE
1,000' 2,000'
RUNWAY 33 (40:1) DEPARTURE SURFACE OBSTRUCTION TABLEID DESCRIPTION OBJECT TOP EL. EXISTING SURFACE EL. EXISTING PENETRATION DISPOSITION
5058 TREE 970.1' 896.2' 74.0' TRIM / REMOVE8625 TREE 956.1' 957.0' -0.8' MONITOR8633 TREE 953.4' 958.4' -4.9' MONITOR8641 TREE 953.3' 955.3' -2.0' MONITOR8745 TREE 925.6' 928.6' -3.0' MONITOR8841 TREE 934.8' 936.8' -2.0' MONITOR9120 TREE 914.7' 915.1' -0.4' MONITOR
10221 TREE 1107.8' 996.9' 110.9' TRIM / REMOVE10237 TREE 1109.9' 1002.9' 107.0' TRIM / REMOVE10381 TREE 1066.2' 996.7' 69.5' TRIM / REMOVE32754 TREE 973.8' 903.4' 70.4' TRIM / REMOVE38520 TREE 913.7' 915.3' -1.6' MONITOR38595 TREE 924.5' 924.9' -0.4' MONITOR
RUNWAY 15 (40:1) DEPARTURE SURFACE OBSTRUCTION TABLEID DESCRIPTION OBJECT TOP EL. EXISTING SURFACE EL. EXISTING PENETRATION DISPOSITION
7454 TREE 951.7' 952.1' -0.4' MONITOR7566 TREE 958.9' 961.7' -2.8' MONITOR7582 TREE 960.2' 964.9' -4.7' MONITOR
29095 TREE 1259.8' 1088.3' 171.5' TRIM / REMOVE29103 TREE 1252.5' 1091.9' 160.7' TRIM / REMOVE29111 TREE 1239.4' 1087.5' 151.9' TRIM / REMOVE29263 TREE 1238.1' 1099.6' 138.5' TRIM / REMOVE29271 TREE 1276.0' 1094.4' 181.6' TRIM / REMOVE39080 BUSH 892.6' 895.9' -3.3' MONITOR39088 BUSH 893.5' 896.2' -2.7' MONITOR39096 BUSH 893.5' 896.2' -2.7' MONITOR39104 BUSH 893.4' 896.0' -2.6' MONITOR39112 BUSH 893.7' 896.1' -2.3' MONITOR39120 BUSH 893.7' 896.2' -2.5' MONITOR39136 BUSH 892.9' 894.0' -1.1' MONITOR
GENERAL NOTES:
1. EXISTING BASE MAPPING, ELEVATIONS, ANDCOORDINATES WERE OBTAINED FROM A SURVEY,FLOWN ON 9/22/15.
2. FEDERAL AVIATION REGULATIONS (FAR) PART 77SPECIFIES CLEARANCE REQUIREMENTS FOR ROADS,RAILROADS, AND WATERWAYS AS FOLLOWS: A) 17FEET FOR AN INTERSTATE HIGHWAY, B) 15 FEET FORANY OTHER PUBLIC ROADWAY, C) 10 FEET OR THEHEIGHT OF THE HIGHEST MOBILE OBJECT THATWOULD NORMALLY TRAVERSE THE ROAD, WHICHEVERIS GREATER, FOR A PRIVATE ROAD, D) 23 FEET FOR ARAILROAD, AND E) FOR A WATERWAY OR ANY OTHERTRAVERSE WAY NOT PREVIOUSLY MENTIONED, ANAMOUNT EQUAL TO THE HEIGHT OF THE HIGHESTMOBILE OBJECT THAT WOULD NORMALLY TRAVERSEIT.
3. NO INSTRUMENT DEPARTURE PROCEDURES ARECURRENTLY PUBLISHED FOR THE RUNWAYS AT PHD,NOR ARE ANY PLANNED AT THIS TIME. AS SUCH,THIS DEPARTURE SURFACES DRAWING IS PROVIDEDFOR INFORMATIONAL PURPOSES ONLY. THEILLUSTRATED DEPARTURE SURFACES EXTEND OUT ATA SLOPE OF 40:1 FROM THE RUNWAY ENDELEVATIONS AND THEREFORE REPRESENT THESTRICTEST FAA EVALUATION CRITERIA FORDEPARTURE FROM NON-COMMERCIAL RUNWAYS.OVERALL, THE INFORMATION PRESENTED SHOULD BECONSIDERED FOR LAND USE PLANNING PURPOSES.
4. THE CITY WAS IN THE PROCESS OF REMOVING TREEOBSTRUCTIONS AT THE TIME THIS EVALUATION WASCONDUCTED. THEREFORE, SOME TREEOBSTRUCTIONS SHOWN MAY HAVE BEEN IDENTIFIEDAND REMOVED BY THE CITY.
RUNWAY 33 DEPARTURE TRAVERSE WAY TABLE
ID ROADWAY EL.ROADWAY EL. + PART 77
CLEARANCE REQUIREMENTSEXISTING
PENETRATION DISPOSITION
R2 893.0' 903.0' -6.1' NONER4 895.1' 910.1' 10.7' OBST. LIGHT (SEE NOTE A)R5 894.8' 909.8' 9.5' OBST. LIGHT (SEE NOTE A)
R19 892.0' 907.0' 12.5' NONE (SEE NOTE 3)R20 893.5' 908.5' 14.0' NONE (SEE NOTE 3)R21 893.0' 908.0' 8.6' NONE (SEE NOTE 3)
RUNWAY 15 DEPARTURE TRAVERSE WAY TABLE
ID ROADWAY EL.ROADWAY EL. + PART 77
CLEARANCE REQUIREMENTSEXISTING
PENETRATION DISPOSITION
R7 883.0' 898.0' 4.5' RELOCATE ROADR8 880.0' 895.0' 0.2' OBST. LIGHT (SEE NOTE A)
R23 888.0' 903.0' 16.8' NONE (SEE NOTE 3)R24 882.0' 897.0' 0.7' NONE (SEE NOTE 3)R25 881.0' 896.0' -15.2' NONE (SEE NOTE 3)
1. ONLY A SAMPLING OF OBSTRUCTIONS ARE SHOWN IN TABLES DUE TO DENSITY.
1. ONLY A SAMPLING OF OBSTRUCTIONS ARE SHOWN IN TABLES DUE TO DENSITY.
PLAN REFERENCED NOTES:
A. THE ROADS DO NOT PENETRATE THE 20:1 TSS.OBSTRUCTION LIGHTS SHOULD BE INSTALLED FORPART 77 PENETRATIONS.

30
DELAWARE DRIVE SE
17TH
STR
EET
NE
18TH
STR
EET
NE
UNIVER
SITY D
RIVE
NE
E HIGH AVENUE
EXIST UNDERGROUND FUELTANKS. (TO BE REMOVED)
TERMINAL APRON
ROFA / PRIMARYSURFACE (TYP.)
10
653
2 7
1112 13
1
89
4
STATE OF OHIO PROPERTYLEASED TO CITY
39
0'
39
0'
13
5'
20'
18'
23'
24
1'
11
5'
SEE NOTE A
SEE NOTE B (TYP.)
ELECTRICAL VAULT
PRIMARY SURFACE
17
6'
114'
EXIST.ASOS
EXIST. / FUT. ARP
SEE NOTE C
)
PACSPHILPORTKY3547
SACS PHD A AE1807
RUNWAY 15-33 (3,951' X 100')
B C D
RUNWAY 12-30 (1,907' X 70')
35
'
B
36'
TAXIWAY A
35' 50'50'
123'
FUT. ASOSCLEARANCE AREA(500' RADIUS)
FUT. ASOS
LIGHTEDWIND CONE
WIND TEE
SEGMENTED CIRCLE
EXIST. ASOSCLEARANCE AREA(500' RADIUS)
FUT. 10,000 GALLON FUEL TANK (TYP.)
FUT. WASHRACK
EXIST. PROPERTY LINE
FUT. PROPERTY LINE
PAPI-4
62
'112'
547'
67
'
930'350'10
3'
13
3'
TIEDOWNS (TOBE REMOVED)
15
0'
15
0' 2
5'
25
'
25' 25'
25' 25'
25'
25' 25'
25'
FUT. HOLDINGPOSITION (TYP.)
25'
74'
84'
91'
25
'
17
3'
41
1'
297'
38
0' 52
3'
79'
FUT. FENCE (TYP.)
A BC D
E
FG
H
I
J
K
20
7'
35
7'
20
7'
35
7'
24'
17
5'
357'
461'
48
1'
56
7'
9
TERMINAL AREA DRAWING
MAG
NETIC
DECLIN
ATIO
N
8° 19' W
± 0
° 22'
JUNE
2017AN
NUAL R
ATE
OF CHAN
GE
0°2' WSOURCE:
NAT
IONAL
GEOPH
YSIC
AL D
ATA
CENTE
R
MAGNETIC
N
TRUE
FAA AIP #
DRAWING NAME:
PROJECT NAME:
AIRPORT MASTERPLAN UPDATE
DESCRIPTIONNO.
REVISIONS
DATE BY
3-39-0060-012-2015
DIVISION:
DATE: DRAWING NUMBER:
PLANNING
MARCH2018
DESIGNER:
TECHNICIAN:
CHECKED BY:
PROJECT NUMBER:
148056
MJKAPN
APN
HARRY CLEVER FIELD AIRPORTNEW PHILADELPHIA, OHIO
NOTES:
0
SCALE: 1" = 100'HORIZONTAL SCALE
100' 200'
GENERAL NOTES:
1. EXISTING BASE MAPPING, ELEVATIONS, ANDCOORDINATES WERE OBTAINED FROM A SURVEY,FLOWN ON 9/22/15.
PLAN REFERENCED NOTES:
A. BUILDING RESTRICTION LINE (BRL) ASSUMES AHEIGHT OF 20' ABOVE THE NEAREST RUNWAYELEVATION.
B. EXISTING / FUTURE HOLDING POSITION MARKINGSARE LOCATED 125' FROM RUNWAY CENTERLINE.
C. THE EXISTING RUNWAY 15-33 CENTERLINE TOPARALLEL TAXIWAY A CENTERLINE SEPARATION OF135' DOES NOT MEET THE STANDARD SEPARATION OF150'. AS SUCH, THE PROPOSED CORRECTIVE ACTIONIS TO RELOCATE TAXIWAY CENTERLINE BY 15'.
EXISTING BUILDING TABLEID DESCRIPTION TOP EL.1 T-HANGAR 913.4'2 HANGAR 915.0'3 HANGAR 910.7'4 SHED 897.8'5 HANGAR 915.1'6 RESTAURANT 908.3'7 TERMINAL / FBO 918.3'8 SHED 899.5'9 SHED 898.9'
10 HANGAR 902.1'11 T-HANGAR (14-UNIT) 903.3'12 HANGAR 915.4'13 HANGAR 915.3'
FUTURE BUILDING TABLEID DESCRIPTION TOP EL.A 50'x50' HANGAR (3) 908'B 50'x50' HANGAR (3) 908'C 70'x85' HANGAR 908'D 56'x62' HANGAR (2) 908'E 52'x56' HANGAR (3) 911'F T-HANGAR (13-UNIT) 911'G T-HANGAR (12-UNIT) 911'H 33'x42' HANGAR (5) 911'I 80'x80' HANGAR 912'J 100'x100' HANGAR 917'K 100'x100' HANGAR 917'
1. FUTURE BUILDING ELEVATIONSWERE CALCULATED BASED UPONTHEIR ESTIMATED HEIGHT ABOVEGROUND LEVEL.

12
30DELAWARE DRIVE SE
E HIGH AVENUE
15TH S
TREE
T NE UNIV
ERSITY
DRIV
E NE
SKIN
NER
LANE N
E
US 250
20TH
SE
20 TH SE
21 ST SE
DELAWARE DRIVE SE
AIRPORT BEACON
EXIST. ASOSCLEARANCE AREA(500' RADIUS)
EXIST.ASOS
LIGHTEDWIND CONE
WIND TEESEGMENTED CIRCLE
FUT. ASOSCLEARANCE AREA(500' RADIUS)
FUT. ASOS
RUNWAY 12-30 (1,907' X 70')
RAILROAD
SCHOENBRUNNVILLAGE
EVERGREENBURIALPARK
CALVARYCEMETERY
TUSCARAWAS RIVER
SEWAGETREATMENT
AGRICULTURE
AGRICULTURE
AGRICULTURE
AGRICULTURE
EAST AVENUECEMETERY
RESIDENTIAL
RESIDENTIAL
KIMBLEMANUFACTURING
COMMERCIAL / RESIDENTIALTIMKEN
RESIDENTIAL
KENT STATE UNIVERSITYAT TUSCARAWAS
AGRICULTURE
BEAVERDAM CREEK
MARSHINDUSTRIES
CHRISTIANLIGHTHOUSEAPOSTOLIC
SCHOENBRUNNMORAVIANCHURCH
SCHOENBRUNNVILLAGE
STATE OFOHIOPROPERTYLEASED TOCITY
10
LAND USE DRAWING
MAG
NETIC
DECLIN
ATIO
N
8° 19' W
± 0
° 22'
JUNE
2017AN
NUAL R
ATE
OF CHAN
GE
0°2' WSOURCE:
NAT
IONAL
GEOPH
YSIC
AL D
ATA
CENTE
R
MAGNETIC
N
TRUE
FAA AIP #
DRAWING NAME:
PROJECT NAME:
AIRPORT MASTERPLAN UPDATE
DESCRIPTIONNO.
REVISIONS
DATE BY
3-39-0060-012-2015
DIVISION:
DATE: DRAWING NUMBER:
PLANNING
MARCH2018
DESIGNER:
TECHNICIAN:
CHECKED BY:
PROJECT NUMBER:
148056
MJKAPN
APN
HARRY CLEVER FIELD AIRPORTNEW PHILADELPHIA, OHIO
NOTES:
0
SCALE: 1" = 300'HORIZONTAL SCALE
300' 600'
GENERAL NOTES:
1. EXISTING BASE MAPPING, ELEVATIONS, ANDCOORDINATES WERE OBTAINED FROM A SURVEY,FLOWN ON 9/22/15.
2. THERE IS NOT CURRENTLY A LOCAL ZONINGORDINANCE IN PLACE TO PROTECT THE AIRSPACESURROUNDING THE AIRPORT. HOWEVER, THE OHIOAIRPORT PROTECTION ACT REQUIRES THAT SPECIFICPROPOSED DEVELOPMENTS IN THE VICINITY OF THEAIRPORT BE COORDINATED WITH THE FAA INACCORDANCE WITH FAR PART 77.
SYMBOL
LEGEND
2015 65 DNL CONTOUR
DESCRIPTION
2035 65 DNL CONTOUR
EXISTING PROPERTY LINE
CHURCH
SCHOOL
FUTURE PROPERTY LINE
CITY LIMITS
12
30
DELAWARE DRIVE SE
E HIGH AVENUE15TH S
TREE
T NE
UNIVER
SITY D
RIVE
NE
SKIN
NER
LANE N
E
US 250
20TH
SE
20 TH SE
21 ST SE16
1 2 3 4 5 67 8 9 10 11 14 15 17 18 19
12
13 20 21 22 2324 25 26 27 28 29
30 31
36
32 33 3435 37 38
41
40
39
42
43
L1
L2 L3 L4
L6
L7
L8
L9 L13
L11
L10
L12
L14
L15
L16
L18
L17
L19
L20
L22
L23
L5
L21
L24
L26
L25
L27
L28
L29
L30
L31
STATE OF OHIOPROPERTYLEASED TO CITY
UNPAVEDROAD
RAILROAD
20' BRL / FUT.PROPERTY LINE
RUNWAY 12-30 (1,907' X 70')
RUNWAY 15-33 (3,951' X 100')
AVEDEDEDROADOAADDUNPAVEUNPAVPU AROAORRO
EDDD
AE9
AE1
AE2
AE8AE
7AE6AE
5
AE3
AE4
AE29
AE24
AE23
AE17 AE18
AE1
0
AE1
3
AE1
4
AE16
AE1
5
AE19
AE20
AE21
AE22
AE27
AE26
AE28
AE11 AE12
SCHOENBRUNNVILLAGE
EVERGREENBURIALPARK
CALVARYCEMETERY
EAST AVENUECEMETERY
AE25
A B
C
J
E
D F
G
HI
K
L M N
O
FUT. ACQUISITIONPARCEL ID (TYP.)
FUT. AVIGATIONEASEMENT ID (TYP.)
EXIST. PROPERTYPARCEL ID (TYP.)
EXIST.PROPERTYPARCELLINE (TYP.)
11
AIRPORT PROPERTY MAPMAG
NETIC
DECLIN
ATIO
N
8° 19' W
± 0
° 22'
JUNE
2017AN
NUAL R
ATE
OF CHAN
GE
0°2' WSOURCE:
NAT
IONAL
GEOPH
YSIC
AL D
ATA
CENTE
R
MAGNETIC
N
TRUE
FAA AIP #
DRAWING NAME:
PROJECT NAME:
AIRPORT MASTERPLAN UPDATE
DESCRIPTIONNO.
REVISIONS
DATE BY
3-39-0060-012-2015
DIVISION:
DATE: DRAWING NUMBER:
PLANNING
MARCH2018
DESIGNER:
TECHNICIAN:
CHECKED BY:
PROJECT NUMBER:
148056
MJKAPN
APN
HARRY CLEVER FIELD AIRPORTNEW PHILADELPHIA, OHIO
NOTES:
0
SCALE: 1" = 300'HORIZONTAL SCALE
300' 600'
DESCRIPTION
LEGENDFUTUREEXISTING
PROPERTY LINE
BUILDINGS
PAVEMENT
RSA
ROFA
FENCE
N/APAVEMENT REMOVAL
EASEMENT
ROFZ
N/A
GENERAL NOTES:
1. EXISTING BASE MAPPING, ELEVATIONS, ANDCOORDINATES WERE OBTAINED FROM A SURVEY,FLOWN ON 9/22/15.
2. THE INFORMATION ON THIS DRAWING WAS DERIVEDFROM A 2003 PROPERTY MAP AND PARCEL DATA FROMTHE TUSCARAWAS COUNTY COUNTY PROPERTYAPPRAISER. INFORMATION FROM THE PREVIOUSPROPERTY MAP COULD NOT BE VERIFIED AS PART OFTHIS EFFORT. AN EXHIBIT 'A' PROPERTY MAP UPDATE ISRECOMMENDED.
LEASED PROPERTY LINE N/A
PARCEL LINE N/A
CITY LIMITS
ACQUISITION (PRIORITY 1)
ACQUISITION (PRIORITY 2)
N/A
ACQUISITION (PRIORITY 3)
N/A
RPZ PARCEL (AVIGATION EASEMENT)
N/A
N/A
N/A
LINE TABLE (EXISTING PROPERTY)LINE DISTANCE BEARINGL1 109.0' N48° 44' 28.14"EL2 280.1' S41° 17' 22.30"EL3 4.2' N48° 35' 23.14"EL4 654.7' S41° 24' 36.86"EL5 20.2' S41° 40' 20.86"EL6 287.5' N48° 30' 01.14"EL7 59.6' S41° 17' 51.48"EL8 245.3' S48° 30' 01.14"WL9 478.7' S41° 32' 35.86"E
L10 235.8' N48° 10' 01.14"EL11 60.0' S40° 53' 17.97"EL12 235.0' S48° 10' 01.14"WL13 265.4' S41° 49' 58.86"EL14 270.5' S89° 33' 16.86"EL15 39.6' N48° 10' 01.14"EL16 1,521.8' S41° 58' 23.86"EL17 290.0' S48° 03' 18.14"WL18 597.7' S41° 49' 58.86"EL19 234.8' S48° 46' 01.14"WL20 290.0' S83° 18' 26.14"WL21 305.0' S83° 18' 26.14"WL22 249.8' N10° 08' 27.14"EL23 731.6' S87° 22' 01.14"WL24 257.6' N11° 05' 43.86"EL25 844.2' S88° 37' 16.14"WL26 32.2' S88° 37' 16.14"WL27 400.7' N39° 51' 17.86"WL28 1,222.2' N0° 19' 00.86"WL29 1,025.9' N13° 47' 44.86"WL30 30.0' N76° 07' 45.14"EL31 260.1' N13° 52' 14.86"W
EXISTING PROPERTYPARCEL
ID GRANTOR GRANTEE VOLUME-PAGE DATE ACREAGE
A FRANK MCCLEAN CITY OF NEW PHILADELPHIA 225-353 12/29/37 0.70B FRANK MCCLEAN CITY OF NEW PHILADELPHIA 225-354 12/29/37 1.10C CRITES ESTATE CITY OF NEW PHILADELPHIA 225-352 12/29/37 13.63D CHARLOTTE RASCHE APPROPRIATION CITY OF NEW PHILADELPHIA 287-43 07/21/48 0.51E CHARLOTTE RASCHE APPROPRIATION CITY OF NEW PHILADELPHIA 287-43 07/21/48 0.51F CHARLOTTE RASCHE APPROPRIATION CITY OF NEW PHILADELPHIA 287-43 07/21/48 0.81G CRITES ESTATE CITY OF NEW PHILADELPHIA 225-352 12/29/37 0.004H DELLA BROWN CITY OF NEW PHILADELPHIA 222-002 07/09/36 0.60I DELLA BROWN CITY OF NEW PHILADELPHIA 249-604 12/29/41 0.50J DELLA BROWN CITY OF NEW PHILADELPHIA 275-343 07/31/46 51.66K DELLA BROWN CITY OF NEW PHILADELPHIA 275-343 04/27/58 18.60L C.O. PAULUS CITY OF NEW PHILADELPHIA 227-285 04/27/38 0.42M ELVA GRAYBILL CITY OF NEW PHILADELPHIA 225-409 12/31/37 0.60N ELVA GRAYBILL CITY OF NEW PHILADELPHIA 225-409 12/31/37 1.20O ELVA GRAYBILL CITY OF NEW PHILADELPHIA 225-409 12/31/37 3.80
EXISTING PROPERTY TOTAL ACREAGE 94.64
N/A
N/A
N/A
N/A
N/A
N/A
N/A
FUTURE PROPERTY ACQUISITIONParcel
ID OWNER NAME VOLUME-PAGE PARCEL ID PROPERTY INTEREST ACREAGE
1 BURKEY CLARENCE RAY 1354-2194 43-05163-000 FEE SIMPLE 0.272 BURKEY CLARENCE RAY 1354-2194 43-05162-000 FEE SIMPLE 0.303 SATTLER RICHARD A & SUSAN D 1433-723 43-06063-000 FEE SIMPLE 0.574 COCHENOUR KEVIN A & BRITTANY M 1433-727 43-02799-000 FEE SIMPLE 0.645 BAILEY SAMANTHA 1325-1504 43-00881-000 FEE SIMPLE 0.496 BAILEY SAMANTHA 1325-1504 43-04142-000 FEE SIMPLE 0.177 MATHEY PATRICIA E 1385-2676 43-04142-001 FEE SIMPLE 0.178 MATHEY PATRICIA E 1385-2676 43-04143-000 FEE SIMPLE 0.369 BARR RICHARD & SUE 704-657 43-02546-000 FEE SIMPLE 0.15
10 BARR RICHARD & SUE 704-657 43-02545-000 FEE SIMPLE 0.5211 HUBBARD JAMES E & STACIE A 1100-1505 43-03274-000 FEE SIMPLE 0.3312 HUBBARD JAMES E & STACIE A 1100-1505 43-03276-000 FEE SIMPLE 0.0713 HUBBARD JAMES E & STACIE A 1100-1505 43-03275-000 FEE SIMPLE 0.2614 PUZA JANET M 1460-1862 43-06332-000 FEE SIMPLE 0.4815 KIRKPATRICK LARRY W & ARLENE M NOT LISTED 43-00235-000 FEE SIMPLE 0.4816 KIRKPATRICK LARRY W & ARLENE M NOT LISTED 43-00236-000 FEE SIMPLE 0.0917 MORRIS PATRICK G & CHRISTINA M 739-206 43-03827-001 FEE SIMPLE 1.1518 TINKER CHARLES L III & ARLENE M 739-204 43-03827-002 FEE SIMPLE 0.6319 STANLEY ELIZABETH A 1182-2294 43-02421-000 FEE SIMPLE 0.5220 CROPPER MARSHALL E JR & SHARON W 673-369 43-03702-000 FEE SIMPLE 0.6121 RUFENACHT DANIEL LEE 1428-2381 43-04372-000 FEE SIMPLE 0.3722 R L GUN INC 1428-2383 43-04372-002 FEE SIMPLE 1.0223 MILLER SHERRY G - TRUSTEE SHERRY MILLER REVOCABLE TRUST 1199-1162 43-04089-000 FEE SIMPLE 0.3024 T-MARK INVESTMENTS LLC AN OH LLC 1161-222 43-02571-000 FEE SIMPLE 0.6025 T-MARK INVESTMENTS LLC AN OH LLC 1161-222 43-02572-000 FEE SIMPLE 0.6026 T-MARK INVESTMENTS LLC AN OH LLC 1161-222 43-02573-000 FEE SIMPLE 0.2927 T-MARK INVESTMENTS LLC AN OH LLC 1161-222 43-02574-000 FEE SIMPLE 0.4228 STATE OF OHIO - THE NOT LISTED 43-08489-000 FEE SIMPLE 0.3329 STATE OF OHIO - THE NOT LISTED 43-08491-000 FEE SIMPLE 0.2230 STATE OF OHIO NOT LISTED 43-07317-000 FEE SIMPLE 0.2931 STATE OF OHIO - THE NOT LISTED 43-08490-000 FEE SIMPLE 0.1932 TP'S FAMILY LLC 1274-2030 43-00173-000 FEE SIMPLE 0.6833 MARTINELLI JOHN J SR & JILL L NOT LISTED 43-02943-000 FEE SIMPLE 0.6234 LESJAK MICHAEL L 1112-1410 43-02944-001 FEE SIMPLE 0.6235 TP'S FAMILY LLC 1274-2030 43-01982-000 FEE SIMPLE 0.2936 TP'S FAMILY LLC 1274-2030 43-01984-000 FEE SIMPLE 0.0837 LOWDERMILK LARRY C & JESSICA E 1166-1565 43-01985-000 FEE SIMPLE 0.2638 CLAY GLORIA ALICE NOT LISTED 43-00888-000 FEE SIMPLE 0.3439 CLAY GLORIA ALICE NOT LISTED 43-00887-000 FEE SIMPLE 0.1940 HOSTETLER LLOYD C & EDNA E 639-270 43-01537-000 FEE SIMPLE 0.0641 HOSTETLER LLOYD C & EDNA E 639-270 25-01755-000 FEE SIMPLE 0.0342 STATE OF OHIO NOT LISTED 43-07310-000 FEE SIMPLE 0.3743 STATE OF OHIO NOT LISTED 43-07308-000 FEE SIMPLE 12.46
PROPERTY ACQUISITION TOTAL 28.91
PROPERTY & AVIGATION EASEMENT TOTALSACREAGE
EXISTING PROPERTY 94.64FUTURE PROPERTY 28.91
FUTURE PROPERTY TOTAL 123.55EXISTING EASEMENT 0.00FUTURE EASEMENT 16.52
FUTURE EASEMENT TOATAL 16.52
FUTURE AVIGATION EASEMENTSParcel
ID OWNER NAME VOLUME-PAGE PARCEL ID PROPERTY INTEREST ACREAGEAE1 SHEL MAR ESTATES II LLC 1385-453 43-04488-000 AVIGATION EASEMENT 2.25AE2 SEIKEL FARMS LTD 1450-119 43-04488-001 AVIGATION EASEMENT 2.28AE3 TOWN & COUNTRY LAND HOLDING LTD NOT LISTED 43-01251-000 AVIGATION EASEMENT 0.03AE4 TOWN & COUNTRY LAND HOLDING LTD NOT LISTED 43-01252-000 AVIGATION EASEMENT 0.03AE5 MISHLER ENTERPRISES LLC I 1397-1109 43-06809-000 AVIGATION EASEMENT 0.15AE6 SCHMITZ LORENA H 1330-1661 43-06810-000 AVIGATION EASEMENT 0.21AE7 RAMSEY JAMES W - SUCCESSOR TRUSTEE LUCILLE RAMSEY TRUST 1174-2168 43-04055-000 AVIGATION EASEMENT 0.26AE8 MEAD MARK & KATHARINE 1170-1089 43-03207-000 AVIGATION EASEMENT 0.61AE9 THE TIMKEN ROLLER BEARING CO 326-402 43-05318-000 AVIGATION EASEMENT 0.19
AE10 WILLIS JOSEPH A & TINA L NUSMAN-WILLIS 1020-1939 25-00963-000 AVIGATION EASEMENT 0.06AE11 NUSMAN BETTY 1133-2312 25-00963-001 AVIGATION EASEMENT 0.18AE12 DERAMO LINDA M 1209-2416 25-00894-000 AVIGATION EASEMENT 0.38AE13 STEPHAN DONALD M 1353-1767 25-00893-000 AVIGATION EASEMENT 0.05AE14 JENKINS DANIEL B & TONYA R 585-754 25-00903-000 AVIGATION EASEMENT 0.12AE15 TANGO & GATTI PROPERTIES LLC 1438-712 25-01876-000 AVIGATION EASEMENT 0.26AE16 FIRST NATIONAL BANK OF DENNISON 1046-1945 43-06671-000 AVIGATION EASEMENT 0.09AE17 BOYD ROBERT D 1460-1378 25-01736-000 AVIGATION EASEMENT 0.47AE18 MCROBIE JEFFERY A & MARSHA J 565-586 25-01735-000 AVIGATION EASEMENT 0.48AE19 SIMMERS TIMOTHY A & PENNEY D 1404-2417 25-01061-000 AVIGATION EASEMENT 0.60AE20 MILLER DANIEL R 1152-487 25-00010-000 AVIGATION EASEMENT 0.77AE21 MCCLOY RICHARD D 1367-849 25-02432-000 AVIGATION EASEMENT 0.38AE22 CONIGLIO VINCENT 1276-1132 25-02431-000 AVIGATION EASEMENT 0.18AE23 NPCW LLC 1441-767 25-01176-000 AVIGATION EASEMENT 1.65AE24 NPCW LLC 1441-767 25-01175-000 AVIGATION EASEMENT 0.06AE25 MCCLOY RICHARD D 1367-849 25-00061-000 AVIGATION EASEMENT 0.10AE26 MCCLOY RICHARD D 1367-849 25-01525-000 AVIGATION EASEMENT 0.30AE27 MUZECHUK DENCIE L TRUSTEE OF DENCIE L MUZECHUK IRR 1433-2219 25-01524-000 AVIGATION EASEMENT 0.005AE28 AIRGOOD ROBERT & BARBARA 1138-913 25-00179-000 AVIGATION EASEMENT 0.04
AE29 BASILETTI HARRY D & RUTH JEAN 1360-1326 25-01067-000 AVIGATION EASEMENT 4.36AVIGATION EASEMENT TOTAL 16.52