Harris Lines as Indicators of Stress: An Analysis of Tibiae ...
87
University of Tennessee, Knoxville University of Tennessee, Knoxville TRACE: Tennessee Research and Creative TRACE: Tennessee Research and Creative Exchange Exchange Masters Theses Graduate School 8-1983 Harris Lines as Indicators of Stress: An Analysis of Tibiae From Harris Lines as Indicators of Stress: An Analysis of Tibiae From the Crow Creek Massacre Victims the Crow Creek Massacre Victims Steven A. Symes University of Tennessee, Knoxville Follow this and additional works at: https://trace.tennessee.edu/utk_gradthes Part of the Anthropology Commons Recommended Citation Recommended Citation Symes, Steven A., "Harris Lines as Indicators of Stress: An Analysis of Tibiae From the Crow Creek Massacre Victims. " Master's Thesis, University of Tennessee, 1983. https://trace.tennessee.edu/utk_gradthes/4232 This Thesis is brought to you for free and open access by the Graduate School at TRACE: Tennessee Research and Creative Exchange. It has been accepted for inclusion in Masters Theses by an authorized administrator of TRACE: Tennessee Research and Creative Exchange. For more information, please contact [email protected].
-
Upload
khangminh22 -
Category
Documents
-
view
0 -
download
0
Transcript of Harris Lines as Indicators of Stress: An Analysis of Tibiae ...
University of Tennessee, Knoxville University of Tennessee, Knoxville
TRACE: Tennessee Research and Creative TRACE: Tennessee Research and Creative
Exchange Exchange
Masters Theses Graduate School
8-1983
Harris Lines as Indicators of Stress: An Analysis of Tibiae From Harris Lines as Indicators of Stress: An Analysis of Tibiae From
the Crow Creek Massacre Victims the Crow Creek Massacre Victims
Steven A. Symes University of Tennessee, Knoxville
Follow this and additional works at: https://trace.tennessee.edu/utk_gradthes
Part of the Anthropology Commons
Recommended Citation Recommended Citation Symes, Steven A., "Harris Lines as Indicators of Stress: An Analysis of Tibiae From the Crow Creek Massacre Victims. " Master's Thesis, University of Tennessee, 1983. https://trace.tennessee.edu/utk_gradthes/4232
This Thesis is brought to you for free and open access by the Graduate School at TRACE: Tennessee Research and Creative Exchange. It has been accepted for inclusion in Masters Theses by an authorized administrator of TRACE: Tennessee Research and Creative Exchange. For more information, please contact [email protected].

To the Graduate Council:
I am submitting herewith a thesis written by Steven A. Symes entitled "Harris Lines as Indicators
of Stress: An Analysis of Tibiae From the Crow Creek Massacre Victims." I have examined the
final electronic copy of this thesis for form and content and recommend that it be accepted in
partial fulfillment of the requirements for the degree of Master of Arts, with a major in
Anthropology.
William M. Bass,, Major Professor
We have read this thesis and recommend its acceptance:
Richard Jantz, P. Willey
Accepted for the Council:
Carolyn R. Hodges
Vice Provost and Dean of the Graduate School
(Original signatures are on file with official student records.)
HARRIS LINES AS INDICATORS OF STRESS:
AN ANALYSIS OF TIBIAE FROM THE CROW CREEK MASSACRE VICTIMS
A Thesis
Presented for the
Master of Arts
Degree
The University of Tennessee, Knoxville
Steven A. Symes
August 1983
To the Graduate Council:
I am submitting herewith a thesis written by Steven A. Symes entitled "Harris Lines as Indicators of Stress: An Analysis of Tibiae from the Crow Creek Massacre Victims." I have examined the final copy of this thesis for form and content and· recommend that it be accepted in partial fulfillment of the requirements for the degree of Master of Arts, with a major in Anthropology.
Accepted for the Council:
Vice Chancellor Graduate Studies and Research
I dedicate this thesis to my parents.
Without their continual love and support
this would not have been possible.

ACKNOWLEDGEMENTS
While masters theses formally list only one author, numerous family
members, colleagues and friends were instrumental in making this project
possible. First and foremost, this thesis is dedicated to Ray and
Mildred Symes, my parents. I offer this small tribute in exchange for
more years of love and support than I can appreciate.
I first met Dr. William M. Bass in South Dakota in 1978. From that
day on, Dr. Bass has supported me through the good and difficult times.
This support has niade this project and degree possible. My remaining
cofTITlittee members, Dr. Richard L. Jantz and Dr. P. Willey are also
instrumental in this effort for their continued support, logic, and
innovative ideas. I can only add that this thesis is simply a
reflection of my committee's professional and personal guidance.
This project originated with the help of Dr. John B. Gregg� Dr.
Gregg not only enabled me to get this project off to a start, but was
also instrumental in coordinating all exchanges of x-rays and
information. Dr. Larry J. Zimmerman, director of the Archaeology ... -·:·- . .... .. .
Laboratory at the Univer.sity of South Dakota, courteously allowed all
exchanges of data. Individuals instrumental in providing this project
with x-ray film are Mr. John C. Fink, Assistant Vice-President and
General Manager of Radiography Markets Division and Mr. Dale K.
Strimple, Regional Representative for Eastman Kodak Company. Dr. James
P. Steele, X-Ray Department, Sacred Heart Hospital, Yankton, South
Dakota, arranged all donations of x-ray film, and Mrs. Helen Ferwerda,
x-ray technician for the X-Ray Department, Sacred Heart Hospital, was
iii
iv
instrumental in overseeing the actual radiographic process of Crow Creek
Bones. Financial support for much of the Crow Creek data collection was
supplied by the Research Corrmittee of the School of Medicine, University
of South Dakota.
Bruce £radtmiller was extremely helpful in organizing initial
stages of this thesis and he, Dr. P. Willey, and Dr. William Bass are
responsible for a majority of the actual editing of this thesis.
Computer analysis was aided by Dr. Richard Jantz, as well as Bill Baden
and Dr. Terry Zobeck. Actual computing was made possible through the
use of the University of Tennessee's Computer Center Facilities. Merle
Symes assisted in graphic illustrations and Dave Neusel did all
photographic enlargements. Access to the Larson Site skeletal materials
was through the kind permission of Dr. William Bass. The Department of
Anthropology has been financially supportive of my efforts in the form
of graduate assistantships. All typing, in the face of repeated
deadlines, was competently and calmly completed by Pam Poe.
Along with my parents, I received continued support from my
brothers, Lennie and Merle and their families. My uncle, Carroll
Crouch, is worthy of recognition here due to his unique ability to exert
a cons i derab 1 e amount of influence over the phone concerning thesis
deadlines.
Many thanks go to Deb Rasmussen and her family in South Dakota.
While not directly involved with this final product, Deb and her family
have been patiently supportive of my college and professional career for
over a decade.
V
My colleagues in work and play have been essential to my completion
of this degree as well as being good diversions from academia. These
include P. Willey, Annette, Joe and Donna Blackbourne, Bill and Karleen
Rodriguez, Pat Key, Terry and Sandy Zobec�, Henry Case, Dwight and Candy
Schmidt, Bruce Bradtmiller and Carol Cottom, Annie and Bard Selwyn,
Richard Jantz, Doug Owsley, Ken Parham, Bill and Ann Bass, Pam Poe,
Maxine Flitcroft, Patti Driscoll, Christy Morris, Steve Harsin, Dr. John
Sharp, Darleen Weigel, Sherry Crisp, Charlene Weaver, Gloria Mclain and
Jeff Buechler just to mention a few. I am also indebted to my major
diversion--volleyball--and the members of the Smoky Mountain Athletic
Club of Knoxville. I owe them alot, I think.
It is co01T1on knowledge that graduate students have to be taught
practically everything. Because of this fact I have had to rely on
three individuals well versed in the mechanics of this graduate system.
Without the help of Dr. William M. Bass, Ms. Annette Blackbourne and Ms.
Betty Spence I might still be standing in the Drop-Add line. Finally I
would like to extend my most sincere thanks to Donna Blackbourne. Many
know her only as Annette I s daughter, but I have found her to be much
more, thank you for your help.
ABSTRACT
Hori zonta 1 1 i nes of increased density in bone, or Harris 1 i nes,
have intrigued scientists for over a century. While earliest Harris
line research dealt with medical aspects of line formation, most recent
emphasis has been anthropological in nature, utilizing Harris lines as
non-specific indicators of stress. The purpose of this study is to test
the usefulness of Harris lines as they are applied anthropologically.
A sample of 122 adult distal tibiae x-rays are used in this study.
This skeletal sample represents massacre victims from the Initial
Coalescent Tradition of the Crow Creek Site in central South Dakota.
Each bone was sexed by discriminant function analysis and age of 1 ine
formation was estimated.
Harris line frequencies reveal no sex differences. However, when
age-specific frequencies are compared with sex-specific human growth . .
curves, there is a strong similarity in curve shape.· These results
suggest that sex influences on line formation are probably subtle but
not detectable. The similarity in frequency of line formation and
growth velocity has discouraging connotations for the usefulness of
Harris lines as indicators of stress.
vi
CHAPTER
I.
TABLE OF CONTENTS
INTRODUCTION
II. HISTORY OF HARRIS LINE RESEARCH
Histology
Appearance .
Etiology .
Inferential Uses and Reliability
III. HYPOTHESES .
IV. MATERIALS
The Crow Creek Site
Degenerative Age Effects •
Sex Assessment . . .
Skeletal Sample
V. METHODS
Harris Line Identification • •
Age Assessment .
Newborn Length .
Prenatal Lines .
VI. RESULTS .
VII. DISCUSSION .
Sex Influences on Harris Lines • •
Developmental Age Influences on Harris Lines
Harris Lines as Indicators of Stress
vii
PAGE
1
4
4
5
6
7
12
15
15
16
18
• • • 27
29
30
. . • • 35
38
41
44
57
. . . . . 57
58
61
CHAPTER
VI I I. SUMMARY
REFERENCES
VITA • •
viii PAGE
63
65
74
LIST OF TABLES
TABLE PAGE
1. Tibia Measurements and Descriptions • • • • • • • 22
2. Descriptive Statistics for Larson Site Tibiae 23
3. Discriminant Analysis for Each Variable and Combination of Variables • • • . . • • . . • • • • . . . . • 25
4. Highly Efficient Single Variable Sectioning Points . 26
5. Crow Creek Tibiae Sample Size • • . . . • . • . • . 28
6. Frequency Distribution of Subadult Arikara Tibiae 59 to 79 Millimeters • • . • • . • . • . • . . • • • . . • • • . . . 40
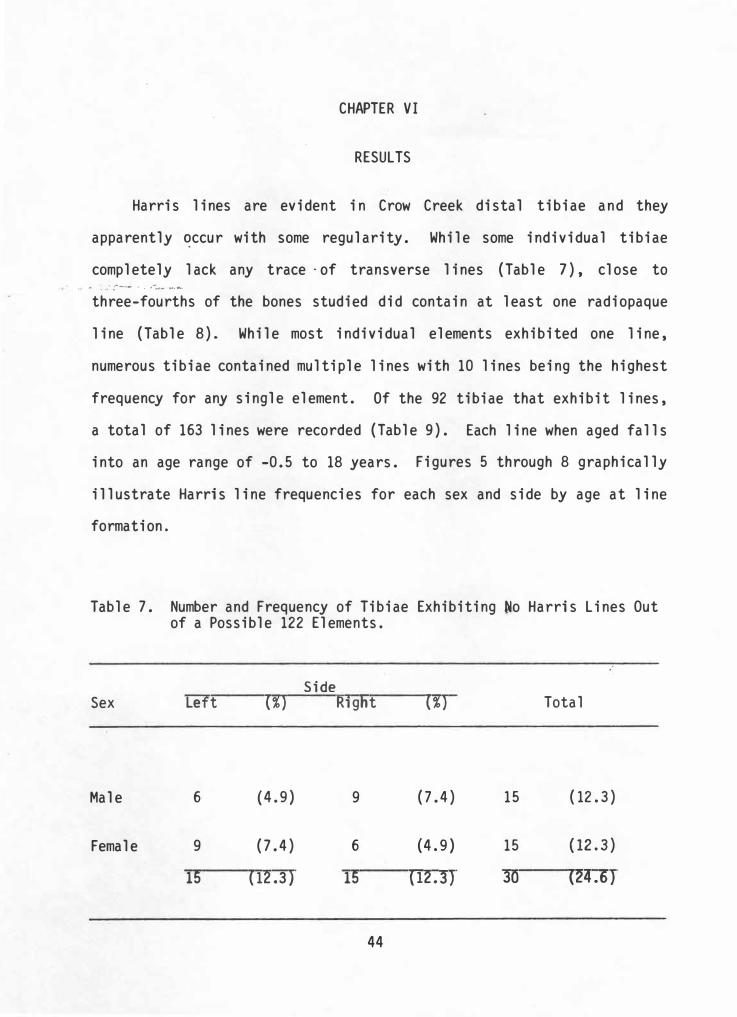
7. Number and Frequency of Tibiae Exhibiting No Harris Lines Out of a Possible 122 Elements • • . . • • . • • • . . . • 44
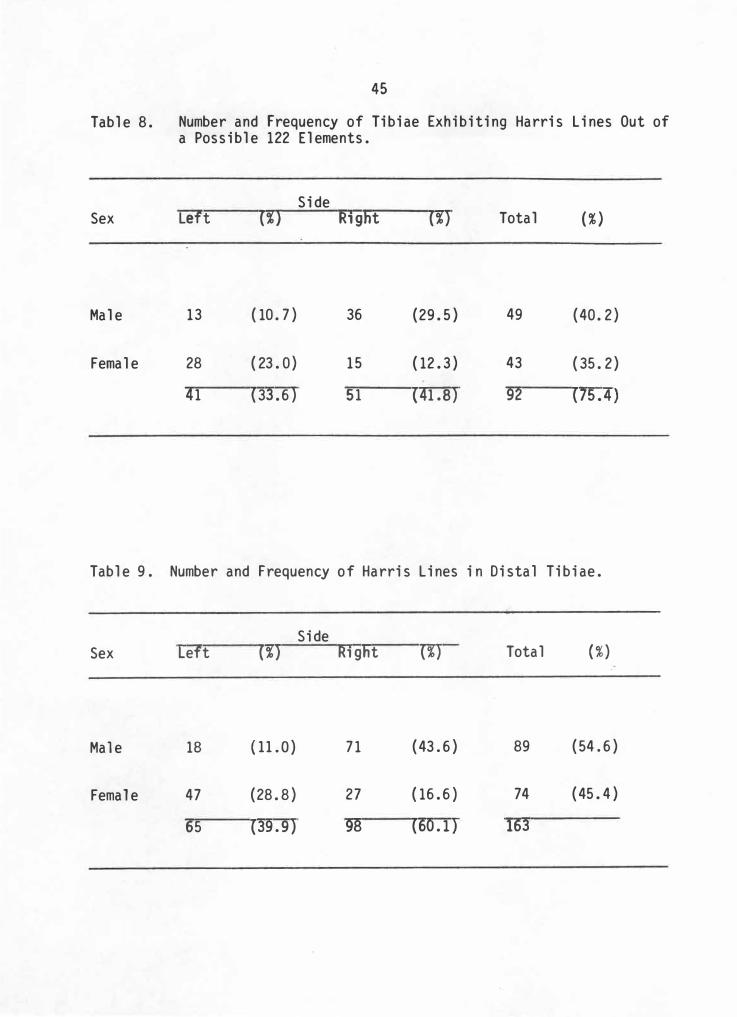
8. Number and Frequency of -Tibiae Exhibiting Harris Lines Out of a Possible 122 Elements . • • • • • • • . . • . 45
9. Number and Frequency of Harris Lines in Distal Tibiae 45
10. Predictive Values of Harris Line Occurrence in Crow Creek Tibiae . . . . . . . . . . . . . . . . . . .
ix
51
L IST OF F IGURES
FIGURE
1. Harris Line Partially Transverse to Shaft
2. Lines Randomly Oblique to Shaft
3. Oblique Lines to Shaft in a Chevron Pattern
4. Harris Lines Exhibiting Extreme Resorption
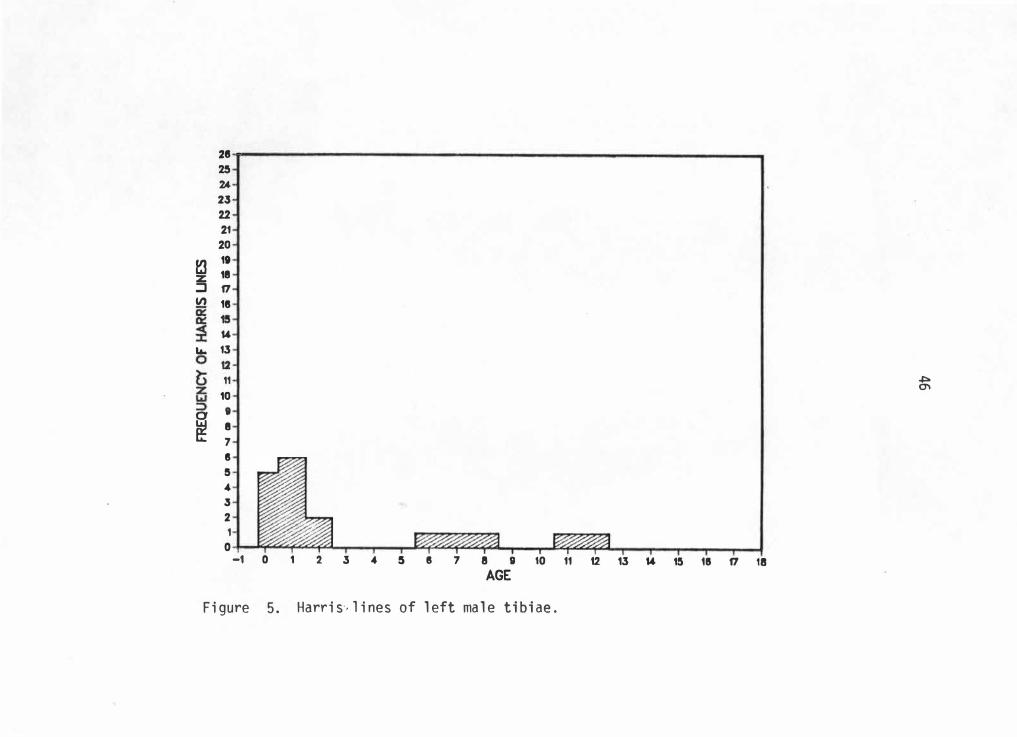
5. Harris Lines of Left Male Tibiae .
6. Harris Lines of Right Male Tibiae .
7. Harris Lines of Left Female Tibiae
8. Harris Lines of Right Female Tibiae . . .
. . .
. . .
.
. . . .
. .
.
. .
. .
. .
9. Combined Sex Harris Lines of Left Tibiae Compared to a Growth Velocity Curve Through Age Nine • • • • • . •
Human . . .
10. Combined Sex Harris Lines of Right Tibiae Compared to a Human
.
.
.
.
PAGE
31
32
33
34
46
47
48
49
53
Growth Velocity Curve Through Age Nine . . • . . . . • . 54
11. Harris Lines of Right Male Tibiae Compared to a Human Male Growth Velocity Curve . . • . . • . . . • . . 55
12. Harris Lines of Left Female Tibiae Compared to a Human Female Growth Velocity Curve . . • • • . . • • • . • • . • • • 56
13. Mean Harris Line Frequencies for Libben Samples with Human Male Growth Velocity Curve . • . • . . • . . . . . • . . 60
X
CHAPTER I
INTRODUCTION
Since the introduction of x-rays, radiologists have corrunonly been
aware of lines of increased density appearing in human bone. These bony
lines are most commonly called lines of arrested growth or Harris lines
after the extensive research on thi.s topic by H. A. Harris {1926, 1931,
1933) near a half century ago. This phenomenon is the result of
increased bone mineralization formed during bone growth. These lines
have been of interest to medical researchers for some time since they
represent immovable markers freezing that particular episode of growth
and separating prior from subsequent growth.
The cause of Harris lines is a complex issue. The main thrust of
etiological research concentrates on illness and nutritional influences
on bone. Line formation is presumed to occur at growth resumption after
a slow period. This variation in growth velocity is attributed to
stresses that reach a threshold after which recovery occurs.
Anthropological application of Harris lines is fairly recent.
Although a consistent one-to-one relationship between any stress and its
bone marker is nonexistent, Harris lines and other nonspecific
indicators of stress have become popular tools for understanding
skeletal biology at the population level. Harris lines and other
indicators of stress used in population approach research have been
portrayed as the tools of ·the "new physical anthropology" {Buikstra and
Cook, 1980).
1
2
The frequent use of Harris lines has not been without criticism.
Like many indicators of stress, it is difficult to demonstrate a clear
correspondence between illness or nutritional factors and Harris 1 ine
formation. This biological phenomenon may be multicausal.
The use of Harris lines as indicators of stress and the
anthropological inferen�es based upon Harris line analysis have raised
many questions as to the validity of this type of research. This study
addresses some of .th� issues by applying Harris 1 ine analysis to a
particular skeletal sample. The results will focus on specific aspects
of this type of research and hopefully shed some 1 i ght on the overa 1 1
utility of Harris lines as indicators of stress.
The following chapter reviews important issues in the last century
of Harris line research. Not only does this review present the biology
of Harris lines which is critical in confronting the problems raised by
anthropology inferences, but it also raises many questions that are
easily tested in a study such as this. Following the review of the
literature is the formulation of hypotheses which outline the design of
this research.
The material's chapter will introduce the archaeological site from
which the skeletal sample originates. As well, descriptions of aging
and sexing techniques will be addressed to present an accurate
description of the skeletal sample used. The methods chapter will
explain x-ray techniques, describe the physical characteristics ·that
constitute a Har.ris line, and finally outline techniques used to assign
ages to each transverse line. The results will outline patterns found

3
in Harris lines by sex and finally the original hypotheses will be
addressed and discussed in terms of the results found in the analysis.
CHAPTER II
HISTORY OF HARRIS LINE RESEARCH
Although anthropological interest in Harris lines is limited to the
past, these bony lines have been a curiosity and topic of research for
over a century {Wegner 1874; Gies 1877). Reviewing past literature is
important to this study since it provides an improved understanding of
Harris l Jnes in general. as,. well as shed light on implications for modern
research. This chapter will examine Harris line histology, appearance,
etiology, and finally uses and reliability.
Histology
Histological explanations for transverse Harris lines are quite
simple. Long bone growth follows a cartilage perfonn. Bone is formed
when osteoblasts settle into a logitudinal matrix frame provided by
earlier cartilage growth. In the event growth is slowed or arrested,
the osteoblasts settle on the horizontal undersurface of the epiphyseal
plate that is perpendicular to the long axis. Instead of ossifying a
longitudinal matrix, bone is horizontally arranged {Park 1954). Park
(1954:277) likens this horizontal stratum to a line formed when
epiphyseal closure begins and cartilage growth ends.
Although transverse lines begin to form with slowed cartilaginous
growth, thickening of the stratum occurs with the resumption of normal
growth. Revived growth triggers the cartilage maturation cycle and
osteoblastic activity. However, until the cartilage life cycle is
complete, no new matrix is available for ossification; thus osteoblasts
4
5
cover the previous horizontal layer with more layers. Only when
osteoblastic activity is allowed to break into longitudinal cartilage
matrices, is the process of normal trabecular formation continued,
ending Harris line formation. The remaining immovable structures are
generally described as lattices or layers of horizontal bone strands.
These layers of bone appear as transvers� lines in x�ray because x-rays - :.- · . . ... . .···�· ·,. � . . , ·
pass parallel to the plane of the bony layer (Park 1954:275-277).·
For decades, scientists have been calling Harris lines 11lines of
arrested growth." This is derived from aberrant histological cartilage
growth associated with line formation as described above. Although
growth is slowed or even arrested at the histological level, there
appears to be no correlation between line formation and the eventual
length of the whole bone (Gindhart 1969). Thus the phrase "lines of
arrested growth" refers only to histological cartilage development and
not to growth in length of the whole bone.
Appearance
Harris lines vary in frequency and general appearance. While they
may appear in all tubular bones and their epiphyses, Harris lines have
been documented in many irregular bones as well {Garn, Silverman, et al.
1968. Lines in irregular bones often resemble, as Garn, Silverman··et
al. {1968:58) describe them, "elevation lines, topographically mapping
the deve 1 opmenta 1 hi story of the bone in question. 11 Transverse 1 ines
occur most commonly in the distal tibia, followed by the proximal tibia,
distal femur, distal humerus and metacarpals {Garn, Silverman; et al.
1968). Due to differential growth rates for each bone, lines vary in
6
thickness from 1 millimeter to over 1 centimeter. Generally the
thickest lines are at the ends of long bones, while near the midshaft
lines are narrow and more transversely oriented (Steinbock 1976).
Occasionally lines appear obliquely in tubular bone. These oblique
lines normally do not span the complete diameter of the bone and occur
most frequently in the medial aspect of the distal femur ·(Garn,
Silverman, et al. 1968; Steinbock 1976).
Etiology
Understanding the etiology of transverse lines has proven difficult
and complex. While there are specific causes of Harris line formation,
most line formation appears to be multicausal. The only known specific
cause for line formation is heavy metal absorption in the form of lead
(Vogt 1932; Park et al. 1933; Caffey 1931), bismuth (Caffey 1937; Russin
et al. 1942) and phosphorus or phosphorized cod liver oil administered
for the so 1 e purpose of forming transverse 1 ines for the treatment of
rickets (Wegner 1874; Phemister 1918; Adams 1938; Pease 1952). The
literature is full of nonspecific factors suggested to influence Harris
line formation. These include actinomycin D (Aarskog and Hexeberg
1968), directed pressure and tension on joint areas (Gelbke 1951),
irradiation (Greulich and Pyle 1959), treatment of leukemia with
aninopterin (Silverman 1950), prolonged exposure to x-rays (Hickle
1943), possible emotional disturbances (Sontag and Comstock 1938), and
birth shock and maternal health (Sontag 1938; Sontag and Harris 1938).
While these factors very likely influence radiopaque line
formation, the main thrust of research dealing with Harris line etiology
involves illness and nutritional influences on bone. Fifty years ago,
7
Harris {1933) 1 is ted meas 1 es, whooping cough, bronchopneumon i a,
influenza, laryngitis, chicken pox and diabetes as likely contributors
to line formation. More recently, Garn, Silverman et al. (1968)
recognized the problem· of accurately relating episodes of disease to
radiopaque ·lines in bone. Their solution to this problem involved
gathering 1 ongi tudi na 1 radiographic data on chi 1 dren whose hea 1 th was
periodically reviewed. Garn and his colleagues found a significant but
low order association between specific diseases (i. e. chicken pox,
whooping cough, pneumonia and smallpox immunization) and line formation
in the distal tibia. Gin_dh_art {1969), in a similar study, also found
high associations between disease and transverse lines but
predictability of line generation was low.
Nutritional affects on growth were considered as early as 1924 when
Asada (1924} produced transverse lines in starved laboratory rats.
Similar studies using laboratory animals were also attempted by Acheson
and MacIntyre (1958}, Acheson (1959), Harris {1933), Mccance et al.
(1942), Platt and Stewart (1962), Stewart and Platt (1958), and Wolbach
(1947). Kwashiorkor has been shown to produce lines in bones (Higginson
1954; Jones and Dean 1959), while Greulich and Pyle (1959:19-22) found
undernourished children from Alabama produced lines when their diet was
supplemented with reconstituted dry milk.
Inferential Uses and Reliability
As suggested earlier, Harris lines have a long history in medicine
while anthropological Harris 1 ine research is recent. Medical
scientists concerned with growth processes use Harris lines in two major
areas of study: histopathologic growth and gross linear growth.
8
Histopathologic research simply explores mechanisms of line
formation in bone microstructure. This is possibly the most common type
of research using Harris lines (Harris 1926, 1931, 1933; Eliot et al.
1927; Follis and Park 1952; Park and Richter 1953; Park 1954, 1964;
Acheson 1959-). Linear growth research artificially produces or uses
existing transverse lines as natural markers for radiographic monitoring
of linear bone growth. These monitoring techniques are generally
conducted to aid in treatment of asynJTletrical limbs (Green and Anderson
1947; Pease 1952; Goff 1960).
An area of Harris line research that combines interest in medical
and anthropological fields involves bone remodeling dynamics. Again
Harris lines are used as natural markers, but in this type of research,
relative growth and bone remodeling are of prime interest. Bone
dynamics research produces allometric functions of relative bone growth
for individual bones and joint areas (Garn, Silverman et al. 1968) and
provide quantitative information for in vivo analysis of endosteal and
subperiosteal apposition and resorption (Garn, Silverman et al. 1968;
Garn, Hempy et al. 1968; Siegling 1941; Lee 1968). Simply stated,
Harris lines �ombined with serial radiographs provide a means for
monitoring bone growth and remodeling.
Anthropological interest in Harris lines as nonspecific indicators
of stress generally involves illness and nutritional influences on bone.
The first application of Harris lines in an anthropological study was
conducted by Wells in 1961. Wells (1961, 1967) radiographically
analyzed individuals from various prehistoric English populations and
determined differential disease and nutritional influences not only
9
between individuals but also between groups. McHenry (1968) also found
significant differences in line formation in three temporally distinct
samples of prehistoric American Indians in California. These frequency
differences were interpreted as indications of nutritional status.
These pioneering studies are important for demonstrating the potential
of radiopaque transverse lines in anthropology. Similar studies have
been attempted by Grey (1967), Wooda 1 1 ( 1968), A 1 1 i son, Mendoza and
Pezzia (1974), Cook (1979), Cook and Buikstra (1979) and numerous
others.
Most recently Harris line analysis has gone beyond simple
inter-individual linecounts allowing some researchers to infer more than
the degree of stress among individuals. McHenry (1968), Buikstra
(1981), and Cook (1979) have suggested that Harris line data may
demonstrate seasonal starvation in early groups of American Indians.
Added information is gained when calculations of individual age at the
time of line formation are performed. Numerous studies have attempted
age estimations (Wells 1967, Allison et al. 1974; McHenry and Schultz
1976) but more recently these techniques have been revised (Hunt and
Hatch 1981; Mensforth 1981) for greater accuracy.
While the use of Harris line data has become more sophisticated,
identified problems have also increased. As mentioned, Garn and
colleagues demonstrated disease-line associations but these studies also
revealed that line formation was influenced by individual age and sex.
Further complications arise when lines occur (approximately 10%) with no
evidence of disease or trauma (Garn, Silverman et al. 1968).
10
Dreizen et al. (1964) found age-related associations influenced not
only by disease, but also multi-complex factors:
Factors which may have contributed to this age-related variation in scarring tendency in the distal radius are a decreased incidence and severity of infectious disease with increasing age, differences in the rate of linear growth of the radius from infancy -throu9h adolescence, and the hormonal changes associated with puberty (Dreizen et al. 1964:304).
In an earlier study, Dreizen et al. {1956:486} similarily reported
"nutritional status per se is not the determining factor in
susceptibility to bone scar formation in growing children. 11
Almost all children at one time or another have visible transverse
·lines (Gindhart 1969) while their appearance in adults over 50 years may
average only one line in four adults. Decrease in mineral density and
bone remodeling are certainly major contributing factors to this
differential appearance. Garn, Silverman et al. (1968) have shown that
lines forming early in the distal tibia are susceptible to fading and
early disappearance due to decreases in mineral density. However, lines
forming 1 ater may be affected in a comp 1 ete ly different manner. Bone
apposition appears to be on the lateral side of the distal end of the
tibia while bone resorption occurs on the medial aspect. Transverse
lines subjected to this type of remodeling appear to shrink and drift
medially (Garn, Silverman et al. 1968).
Finally it is important to remember that transverse line
quantification and identification depends on each researcher's technique
and the sample studied. Technique and bone orientation in x-ray may
produce varied results due to age-related shrinkage of radiopaque lines.
Variable results may also occur with x-rays of skeletal samples versus
living individuals. As demonstrated above, growth studies have been
11
essential in transverse line research, yet every researcher should
realize that relative growth is by no means consistent. Medical records
may also add bias since they are seldom as accurate as desired (Garn,
Silverman et al. 1968).
CHAPTER III
HYPOTHESES
The preceding 1 iterature survey presents several questions which
could be answered with further research. This project addresses three
of those ·questions. These are 1 isted below as. hypotheses and are
accompanied by short explanations.
Hypothesis I: Every remnant transverse Harris line represents a
particular acute stress and recovery. Therefore it is possible to
assume that Harris lines are valuable as anthropological tools in
individual and population approach analysis.
Hypothesis I states that each Harris line chronologically etches,
in the bone matrix, a recoverable stress encountered during the growing
years of that bone. Therefore this radiographically observed marker
indicates some type of stress and recovery that is age-specific,
traceable to that particular time in the growth proces�. Thus Harris
lines have the potential to reveal patterns within an individual (e.g.
seasonal, etc.) or patterns within a group as a whole.
Hypothesis II: Frequency comparisons of Harris lines in a skeletal
sample should produce observable sex differences.
Hypothesis I I is logical because there are biological differences
between the sexes and these differences should affect non-specific
indicators of stress. The simple fact that boys grow at different rates
than girls (Tanner 1978 and others) may also affect Harris line
formation since these lines are created during the growing years.
12
13
Another difference commonly discussed in the literature is that boys are
more susceptible to environmental stress than females. This would
certainly suggest that boys form more lines than girls if all else is
equal. And in fact, Gindhart (1969) in a longitudinal study has
demonstrated that boys form more transverse lines than girls.
Hypothesis III: Since Harris line formation depends on a stress-related
reduction or arrest of histological bone growth followed by recovery,
overall growth velocity changes that occur predictably in all humans
should affect the formation of these bony lines.
This final hypothesis is stimulated by a quote from Park almost 20
years prior to this study:
Since growth, both cartilaginous and osteoblastic, is much more rapid in the first months of life, one might expect the widest distribution of arrest strata • • • in the young infant (Park 1964: 833).
Extrapolations from this idea suggest that Harris line formation is
affected by and depends upon growth. velocity. This includes velocity
changes throughout the growing years and not just one particular period.
Therefore Hypothesis I I I tests the relationship between Harris line
frequencies and the human growth curve.
The above hypotheses are based on an understanding of the history
of Harris line research. Hypothesis I tests the utility of Harris line
research. If lines do not represent individual stress and recovery, the
applicability of Harris line analysis should be questioned. Hypotheses
I I and I I I suggest that sex and deve 1 opmenta 1 age processes affect
Harris line studies and must be controlled if an accurate analysis is

14
expected. Before these hypotheses a re tested, a description of the
skeletal sample and methods used for analysis will be presented below.
CHAPTER IV
MATERIALS
The Crow Creek Site
A sample of adult tibia radiographs from the Crow Creek site in
South Dakota are used in this analysis. The Crow Creek site (39BF11) is
located on the east bluff of the Missouri River in central South Dakota.
Although much of South Dakota is rich in prehistoric and historic
cultural resources, the Crow Creek site has long been of intense
interest to professional and amateur archaeologists. Much of this
attention results from.Crow Creek's most impressive and visible feature,
an irrmense outer fortification ditch. W. H. Over, the premiere
archaeologist of South Dakota, described the ditch as the 11widest and
deepest of any surrounding a village in the state" (Sigstad and Sigstad
1973:9). This ditch extends 1,250 feet (381 meters), has ten U-shaped
bastions and is today about 15 feet (4. 6 meters) across and six to 12
feet (1.8 to 3. 7 meters) below ground surface of the village (Kivett and
Jensen 1976).
Kivett and Jensen (1976:77-78) recognize three occupations at Crow
Creek: Woodland, Initial Horizon of the Middle Missouri Tradition, and
Initial Horizon of the Coalescent Tradition. All skeletal material used
for this study is associated with the latter horizon, the Initial
Coalescent Tradition. This tradition appears to be affiliated with
Arikara tribes that temporally follows Crow Creek and inhabit the area
into historic times (Willey 1982: 1-2).
15
16 .- -.;._ .
�-:-:::� In 1978 human bones were observed protruding out of an eroding bank'- -
cutting into the site boundaries. What was planned as a routine
excavation of a disturbed burial eventually grew into the systematic
excavation and analysis of the largest known prehistoric massacre burial
in North America with the greatest minimum element count totaling 486
individuals .(Willey 1982). Public attention was again focused on the
site in August, 1981 when the bones were reburied in the village site
precluding any further analysis of the remains.
The Crow Creek skeletal sample is unique in that it is more than a
sample, it is a sample with a normal demographic structure, all of
morphologically similar individuals. · Unfortunately this skeletal
population in many ways lends less information to the researcher than do
many cemetery samples. This is because most of the 486 plus individuals
are commingled. Age- and sex-specific information is generally lacking
due to few articulated bones. Since these factors are of utmost
importance to this study, techniques for age and sex assessment of Crow
Creek skeletal material are discussed below.
Degenerative Age Effects
Past studies dealing specifically with individual age and its
effects on Harris 1 i ne appea ranee and retention generally i nvo 1 ve two
types of age: deve 1 opmenta 1 or degenerative. Deve 1 opmental changes
involve bone growth and growth velocities while degenerative changes
center on problems involved with bone remodeling including decreased
mineral density.
17
Since only adult tibiae are used in this study, age assessment of
subadult bones was unnecessary. However, Harris lines that occur in
various locations on the adult shaft are of more value to the researcher
if ages can be assigned to each line. The technique of assessing age at
the time a specific line forms has most recently been improved upon by
Hunt and Hatch (1981). Their techniques and applications to the study
will be thoroughly discussed in the next chapter.
Degenerative age effects of Harris lines simply involve the gradual
obliteration of dense transverse lines in bone due to progressive
endosteal resorption and sub-periosteal apposition. Garn and Schwager
(1967) demonstrate a 50% reduction in the frequency of Harris lines in
an older sample {age 51 to 86) as compared to a younger sample (age 25
to 50). These authors attribute this reduction to degenerative bone
remodeling.
Garn and Schwager• s (1967) study has important implications for
this study since only adult tibiae from Crow Creek are used and the only
age information on these bones is that they are adult. Deletion of old
adults or those showing advanced remodeling is not possible.
It is possible, however, to roughly estimate the percent of
individuals from this sample that fall into Garn and Schwager's (1967)
arbitrary 11 old 11 and "young" age categories. Using data from Willey's
(1982: 37-61) demographic analysis, it can be determined that 22 . 1% of
all adult or near adult individuals from Crow Creek are classified as
being 50 to 59 years of age. While this is a substantial percent of the
total sample, one should not readily assume that half of all lines in
22. 1% of the total sample are obliterated. These figures may be
18
exaggerated due to differences in what each researcher defines as a
Harris line. My identification of Harris lines includes those lines
that have been extensively remodeled yet they are easily recognizable as
transverse lines. (A more detailed description of my definition of a
Harris line .follows this chapter. ) Garn and Schwager (1967), however,
ignore all 1 ines that traverse less than 50% of the shaft and thus
eliminate most lines that undergo excessive remodeling.
Another item to consider is age differences between Garn and
Schwager's sample and the Crow Creek sample. While the former sample
has individuals dispersed in a range from 51 to 86 years, Crow Creek
individuals have been assessed as being only as old as 59 years.
Certainly this upper age limit in Crow Creek is dependent upon and
limited to the few accurate techniques of skeletal age assessment in old
individuals, but it is not unreasonable to suggest that a sample of
prehistoric Plains Indians probably had a shorter average life span than
a sample of modern individuals from Fels Institute Study collections.
Therefore it is 1 i kewi se reasonab 1 e to assume that overa 1 1 the Crow
Creek sample undergoes considerably less remodeling than that documented
by Garn and Schwager {1967). Much more critical to this study is the
age at which lines are formed. Therefore all available x-rays of
healthy complete adult tibiae from Crow Creek are used in this study.
Sex Assessment
Sex assessment·of Crow Creek tibiae can be determined statistically
s i nee these methods of sexing s ke 1 eta 1 e 1 ements a re quite common and
quite accurate (Dwight 1905; Pearson 1917-1919; Pons 1955; Thieme 1957;
Hanihara 1958; Giles and Elliot 1963; Giles 1964; Howells 1970; Steele
19
1976; Black 1978; Kelley 1979; and others). It is surprising, however,
that until recently (Shaivitz and Iscon 1982; Miller-Shaivitz and Iscon
1983; Iscon and Miller-Shaivitz 1983; Symes and Jantz 1983), few of
these studies have been applied to tibiae. Because the tibia is a
compact weight bearing bone that generally preserves well, sexual
dimorphic features should be metrically predictable. This section
presents methods developed for sex assignment of Crow Creek tibiae and
results of applying these methods.
All Crow Creek Site post-cranial elements were measured by Roger
Williams early in 1979 soon after removal from the site. A description
of his procedures and measurements are duplicated below:
Measurements taken followed those described by Bass (1971), though in some instances the procedures used differed slightly (see below). All measurements were recorded to the nearest mi 1 1 imeter (in millimeters). The instruments used to measure the bones were an osteo-metric board, sliding caliper, and a graduated steel tape . • . .
Tibias were measured in the following dimensions: maximum morpological length, physiological length, anterior-posterior diameter at nutrient foramen, media-lateral diameter at nutrient foramen, and one not listed by Bass (1971), circumference at mid-shaft. Bass (1971) gives the procedure for determination of maximum 1 ength according to that used by Trotter and Gl eser (1952:473). The procedure used on the Crow Creek tibias differed from the above in that the intercondyloid eminence was placed against the fixed wall of the osteo-metric board and the block applied to the medial malleolus which was then moved side to side and up and down to find maximum length. Tibias with all or part of· the medial malleolus missing but with complete proximal ends were included with whole tibias (lengths estimated), also those with intact distal ends but damage to one or both condyles (as long as most of one condyle remained) were included (lengths estimated). A few tibias had nutrient foramina located near midshaft or in the distal half of the shaft. These were marked in the usual location for nutrient forami na and measured anterior-posteriorly and medio-1 atera lly at that point (Williams ms).
20
To test sexing potential of tibia size, a sample of tibiae from the
Larson Site was chosen. The Larson skeletal sample, a post-contact
variant of the Coa 1 es cent Tradition, is an exce 1 1 ent samp 1 e for this
type of study since Larson is similar in morphologic affinities and
geographic location to Crow Creek. Although individual sex for Larson
skeletons is not known, a morphological examination of the innominates
produces a very accurate sex assessment.
Four visual criteria on the innominate bone were used to determine
sex of the Larson site individuals. These include the 1} ventral arc,
2) sub-pubic concavity, 3) medial aspect of the ischio-pubic ramus, and
the 4) sciatic notch. The first three criteria are explained in Phenice
(1969) while a description of the last criterion can be found in Bass
(1971: 159). Each skeleton sexed for this study was required to exhibit
at least three of four criteria. All tibiae are from various aged
adults with fused proximal and distal epiphyses. Left tibiae were
preferred for this study although the right was used if it offered more
accurate measurements. In all there were 53 left and 25 right tibiae
used in this study.
Only bones allowing the complete set of five measurements were
used. Measurements used by Williams (ms} on the Crow Creek material are
in Bass (1971} and are originally described in Martin and Saller
(1957: 572-576). Measurements were recorded to the nearest millimeter
(nm.) with no estimations except in cases where the researcher felt that
an accurate estimate could be made. All bones were examined for
pathologies which might affect any measurement. Quite commonly
periosteal reactions occur on the shaft of the tibia near the area of
2 1
midshaft measurements. If any reactions were assessed as being severe
enough to substantially alter any measurement, the bone was rejected.
The five measurements, their descriptions and instruments used to
take each measurement are listed in Table 1. All measurements in the
Larson series were taken by this author and all instruments were kindly
lent by the Department of Anthropology, University of Tennessee. With
measurements completed on 40 male and 38 female individuals, all data
were analyzed using the D ISCRIMINANT subprogram of Statistical Package
for the Social Sciences (SPSS) (Nie et al. 1975). Discriminant function
analysis was conducted on two groups (males and females), and all five
variables (measurements).
Mahlanobis' o2 is calculated from group centroids and significance
for variables was detennined by F ratios. Discriminating efficiency was
calculated by using distance scores (D/2).
SPSS provides Wilks' Lambda for each variable or variables
examined. The goal of discriminant analysis is to maximize distance
among groups means. Wilks' Lambda is a ratio of within to total
variation (male and female) differences. Therefore a low Wilk's Lambda
indicates the largest separation between males and females with the
lowest score.
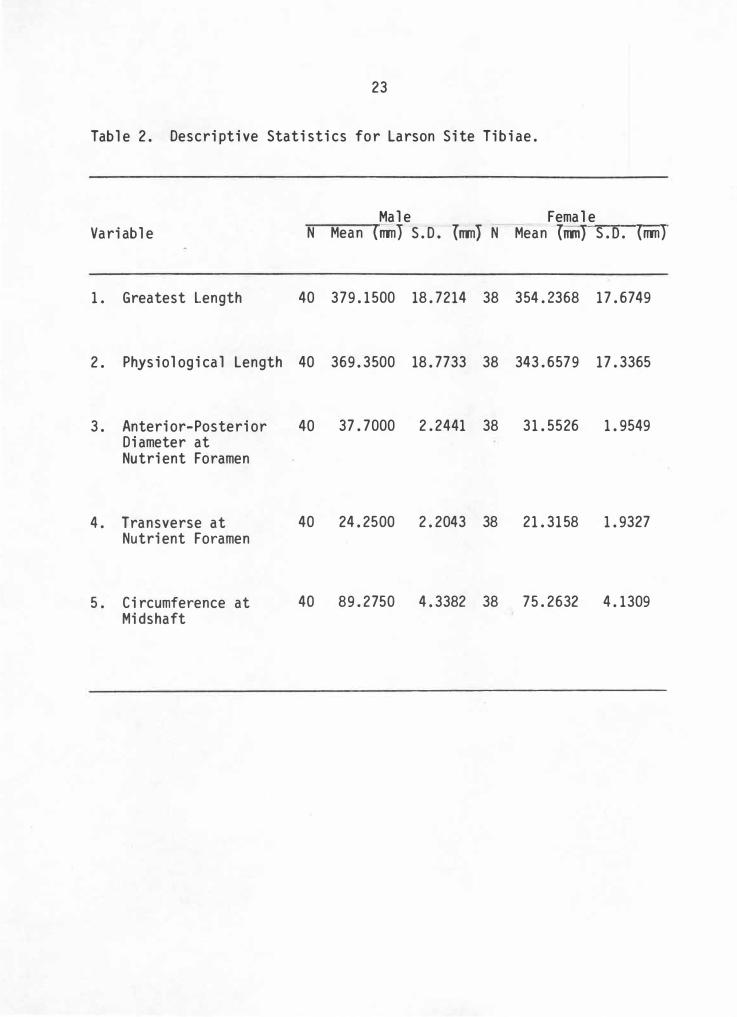
By examining male and female means with respective standard
deviations (Table 2), it is immediately evident that there is fairly
good separation for all variables suggesting there may be substantial
sexual dimorphism displayed in the tibia with these particular
measurements appearing sensitive to size differences. Group separation
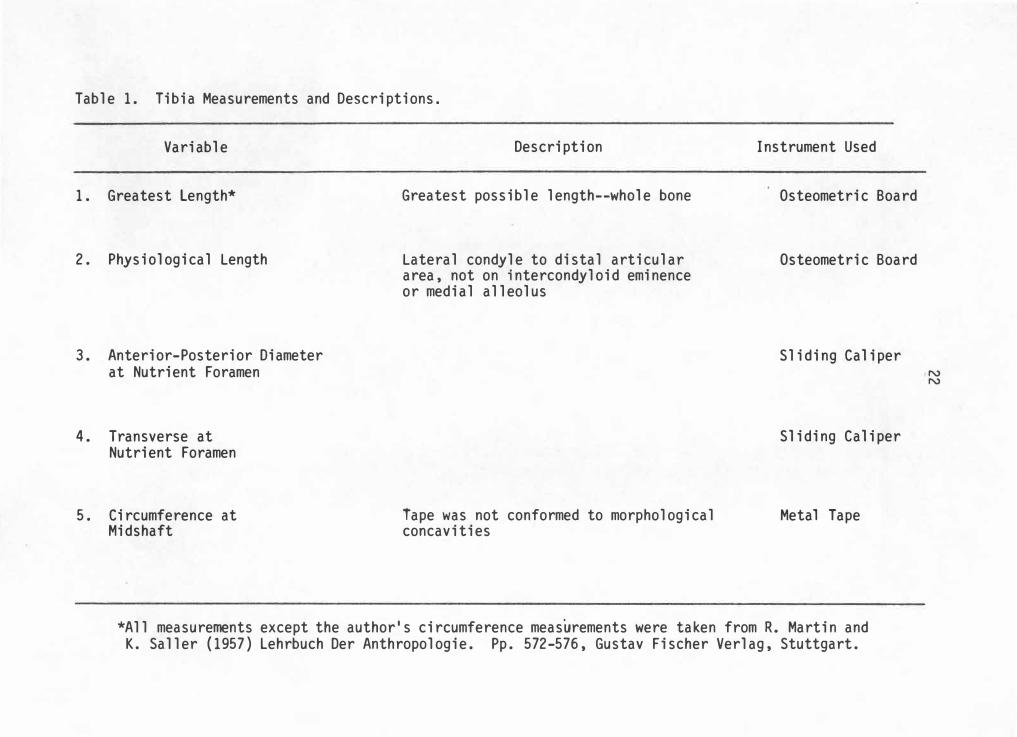
Table 1. Tibia Measurements and Descriptions .
Variabl e
1. Greatest Length*
2. Physiological Length
3. Anterior-Posterior Diameter at Nutrient Foramen
4. Transverse at Nutrient Foramen
5. Circumference at Midshaft
Description
Greatest possible length--whol e bone
Lateral condyle to distal articular area, not on intercondyloid eminence or medial alleolus
Tape was not conformed to morphological concavities
Instrument Used
Osteometric Board
Osteometric Board
Sliding Cal iper
Sliding Caliper
Metal Tape
*All measurements except the author ' s circumference measurements were taken from R . Martin and K. Saller (1957) Lehrbuch Der Anthropologie. Pp. 572-576, Gustav Fischer Verlag, Stuttgart.
N N
23
Table 2. Descriptive Statistics for Larson Site Tibiae.
Male Female Variable N Mean (rrm) S. D. (rrm) N Mean (lllTl} S.D. (nm)
1. Greatest length 40 379. 1500 18. 7214 38 354. 2368 17. 6749
2. Physiological Length 40 369. 3500 18. 7733 38 343. 6579 17. 3365
3. Anterior-Posterior Diameter at Nutrient Foramen
4. Transverse at Nutrient Foramen
5. Circumference at Midshaft
40 37. 7000 2. 2441 38 31. 5526 1. 9549
40 24. 2500 2. 2043 38 21. 3158 1. 9327
40 89. 2750 4. 3382 38 75. 2632 4. 1309
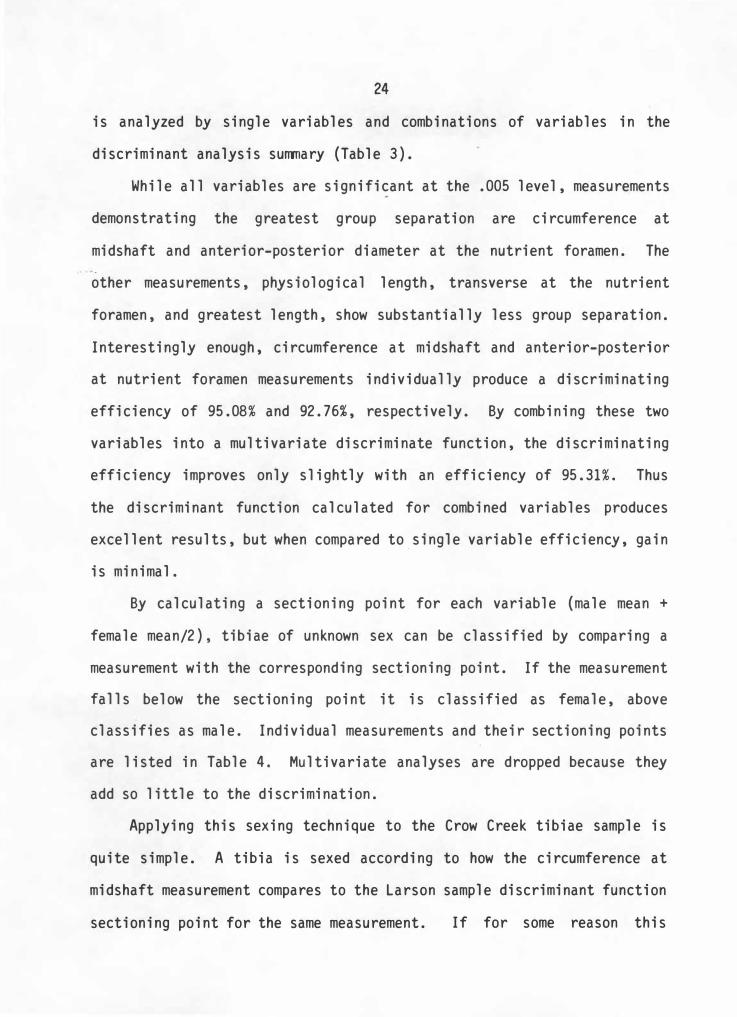
24
is analyzed by single variables and combinations of variables in the
discriminant analysis surrmary (Table 3).
While all variables are significant at the .005 level, measurements
demonstrating the greatest group separation are circumference at
midshaft and anterior-posterior diameter at the nutrient foramen. The
other measurements, physiological length, transverse at the nutrient
foramen, and greatest length, show substantially less group separation.
Interestingly enough, circumference at midshaft and anterior-posterior
at nutrient foramen measurements individually produce a discriminating
efficiency of 95.08% and 92. 76%, respectively. By combining these two
variables into a multivariate discriminate function, the discriminating
efficiency improves only slightly with an efficiency of 95. 31%. Thus
the discriminant function calculated for combined variables produces
excellent results, but when compared to . single variable efficiency, gain
is minimal.
By calculating a sectioning point for each variable (male mean +
female mean/2), tibiae of unknown sex can be classified by comparing a
measurement with the corresponding sectioning point. If the measurement
falls below the sectioning point it is classified as female, above
classifies as male. Individual measurements and their sectioning points
are listed in Table 4 . Multivariate analyses are dropped because they
add so little to the discrimination.
Applying this sexing technique to the Crow Creek tibiae sample is
quite simple. A tibia is sexed according to how the circumference at
midshaft measurement compares to the Larson sample discriminant function
sectioning point for the same measurement. If for some reason this
Table 3. Discriminant Analysis for Each Variable and Combination of Variables.
Variable(s) Mahalanobis' o2 Wilks' Lambda Discriminating Efficiencl
D/2 %
1 . Greatest Length 1.8709* 0.6759 0.6839 75.30
2. Physiological Length 2. 0 175 0.6591 0. 7102 76.12
3. Anterior-Posterior 8.5031 0 . 3145 1.4580 92.76 Diameter at Nutrient Foramen
4. Transverse at 1.9966 0.66 14 0.7065 76.00 Nutrient Foramen
5. Circumference at 10.9283 0.2630 1.6529 95.08 Midshaft
6. Anterior-Posterior 11.2393* 0.2576 1.6763 95. 31 Diameter at Nutrient Foramen with Circumference at Midshaft
* All measurements are significant at the .005 level.
, N (.J"1
26
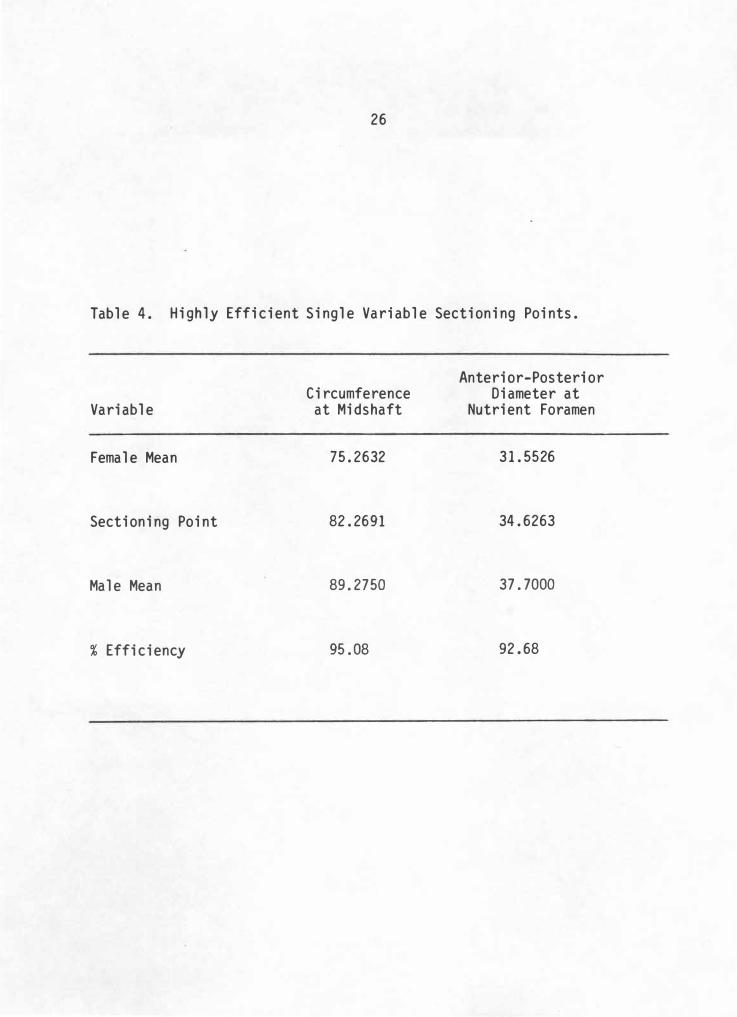
Table 4. Highly Efficient Single Variable Sectioning Points.
Variable
Female Mean
Sectioning Point
Male Mean
% Efficiency
Circumference at Midshaft
75 . 2632
82 . 2691
89 . 2750
95 . 08
Anterior-Posterior Diameter at
Nutrient Foramen
3 1 . 5526
34 . 6263
37 . 7000
92. 68
27
measurement is nonexistent or is of questionable accuracy due to
pathological swelling or other influencing conditions , the
anterior-posterior diameter measurement and sectioning point was used .
The latter measurement was used to sex only eight individual tibiae from
the Crow Creek sample.
Skeletal Sample
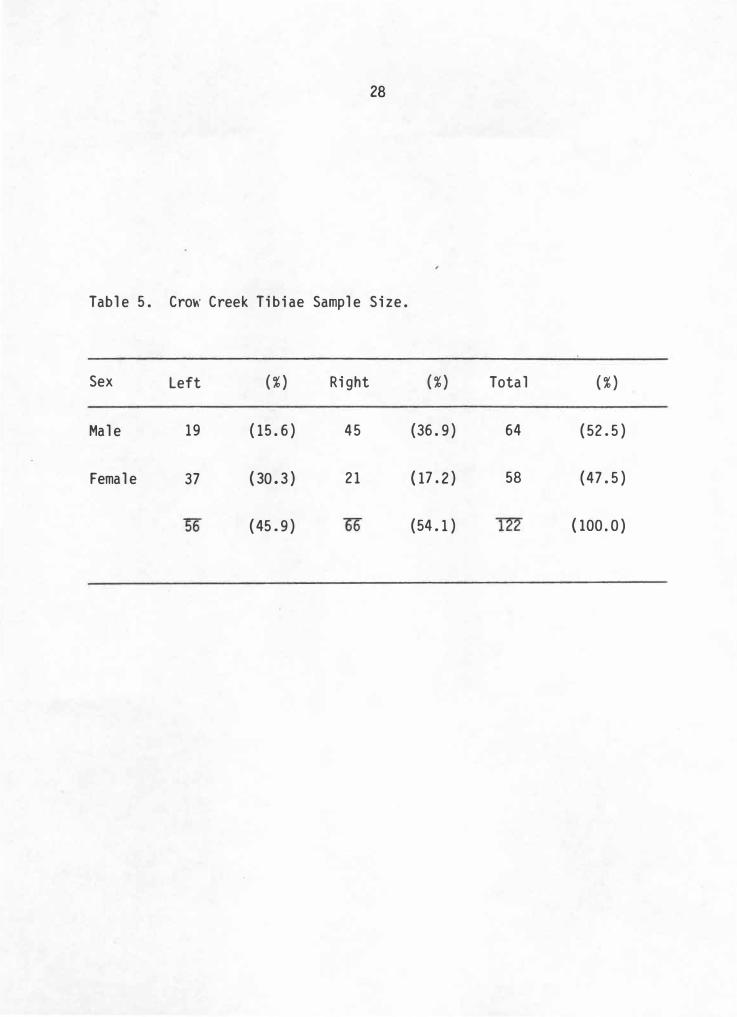
It is now possible to describe the actual materials used for this
study. In all, this study consists of 56 left and 66 right side
elements totaling 122 tibiae. By applying discriminant function sexing
techniques, 64 (52.5%) are assessed as male and 58 (47.5%) as female.
Willey (1982: 49) established a similar ratio when sexing the same sample
by pubic morphology, with males representing 54.4% and females 45. 6% of
the sample. To test this discriminant function sexing distribution
against that established by Willey (1982:142) using pubic morphology, a
chi-square test is calculated. Results show no significant difference
between the distributions . (X2=0.356, p 0. 500). Thus tibiae sex
estimations produce similar results to pubic morphology assessment of
Crow Creek individuals and these overall figures represent a relatively
well balanced sample. This balance is less evident, however, when sex
and side are broken into separate categories. A majority of the tibiae
lie in the male right and female left categories. Combined, these two
groups consists of 67% of the total sample (Table 5).
28
Table 5. Cro\\' Creek Tibiae Sample Size.
Sex Left
Male 19
Female 37
( % )
(15.6)
. ( 30 . 3 )
(45 . 9)
Right
45
21
( % )
(36.9)
( 17 . 2 )
(54. 1)
Total
64
58
( % )
(52 . 5)
(47.5)
( 100 . 0 )
CHAPTER V
METHODS
Certainly one of the most . frustrating problems encountered by
researchers attempting to score Harris lines is replicability. Even
though few techniques for defining or scoring Harris lines are
adequately described in the literature, there is little standardization
among researchers. While many studies define Harris 1 ines making "no
distinction as to thickness or completeness" (Dreizen et al. 1964: 295),
others require that 1 ines must extend 50% or more (Garn and Schwager
1967) or 100% of the total diaphysis (Dreizen et al. 1956). McHenry
(1968; McHenry and Schulz 1976) separates oblique from transverse lines
in long bones, omitting the former because they form "bony spicules or
rods extending between two points in the wall of the cavity" instead of
fanning horizontal "disks. " Garn , Silvennan, et al. ( 1968) point out
that when these spicules lie transverse to the angle of x-ray , they too
appear as bony plates or disks. Heavy, thick-lined subjects have been
separated from light, fine-lined subjects (Gindhart 1969) while lines
that form in prenatal bone have been frequently ignored {Wells 1967;
Allison et al. 1974).
Since tibiae show the highest frequency of Harris lines and seldom
form oblique or chevron lines (Garn, Silverman, et al. 1968), this bone
seemed suitable for this type of study. All x-rays of the midshaft and
distal portions of Crow Creek tibiae were taken between January to May,
1979. All x-rays were generously lent to this researcher by the
Archaeology Laboratory at the University of South Dakota under the
29
30
direction of Dr. Larry J. Zirrunerman . Dr. John B. Gregg was instrumental
in stimulating all research on Crow Creek x-rays and coordinated all
data exchanges . All films were exposed on a Picker , single phase x-ray
machine. A Kodak screen cassette was used with Kodak X-Oma RP film
(XRP-1) , with size 24 x 30 centimeter (cm.) sheets. The tube distance
was 40 inches , with �V . Ra�ge of 50 to 60 and 10 M.A. S. All Kodak film
was supplied courtesy of Eastman Kodak Company , Mr. John C. Fink ,
assistant Vice President , radiography markets division , and Mr . Dale
Strimple , regional representative for Kodak company.
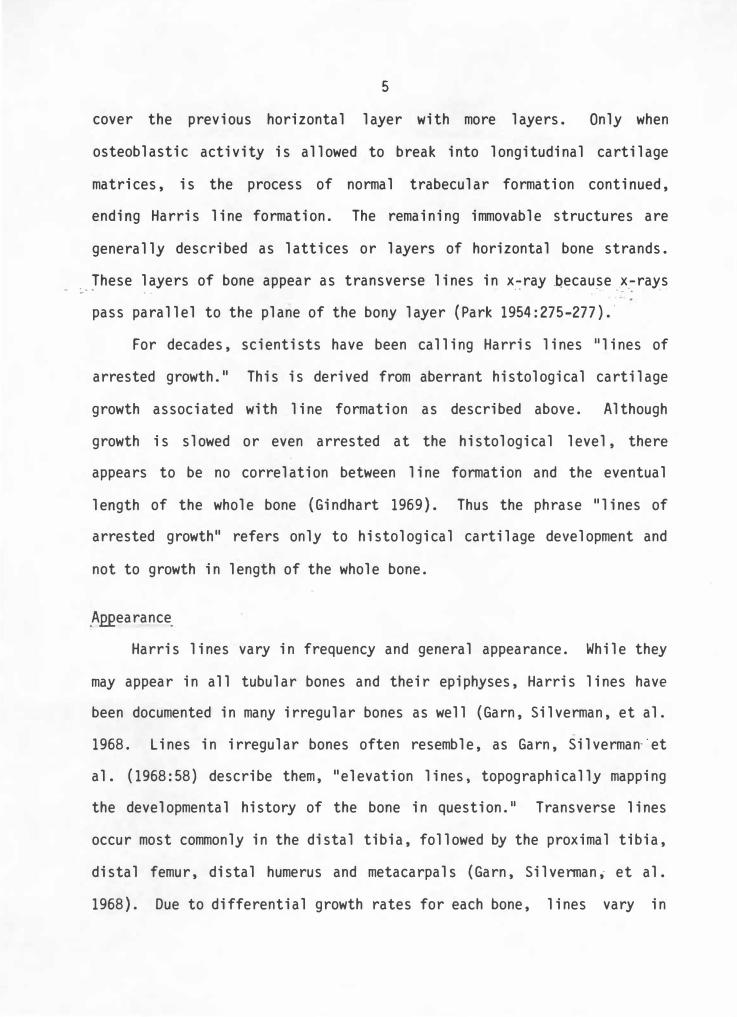
Harris Line Identification
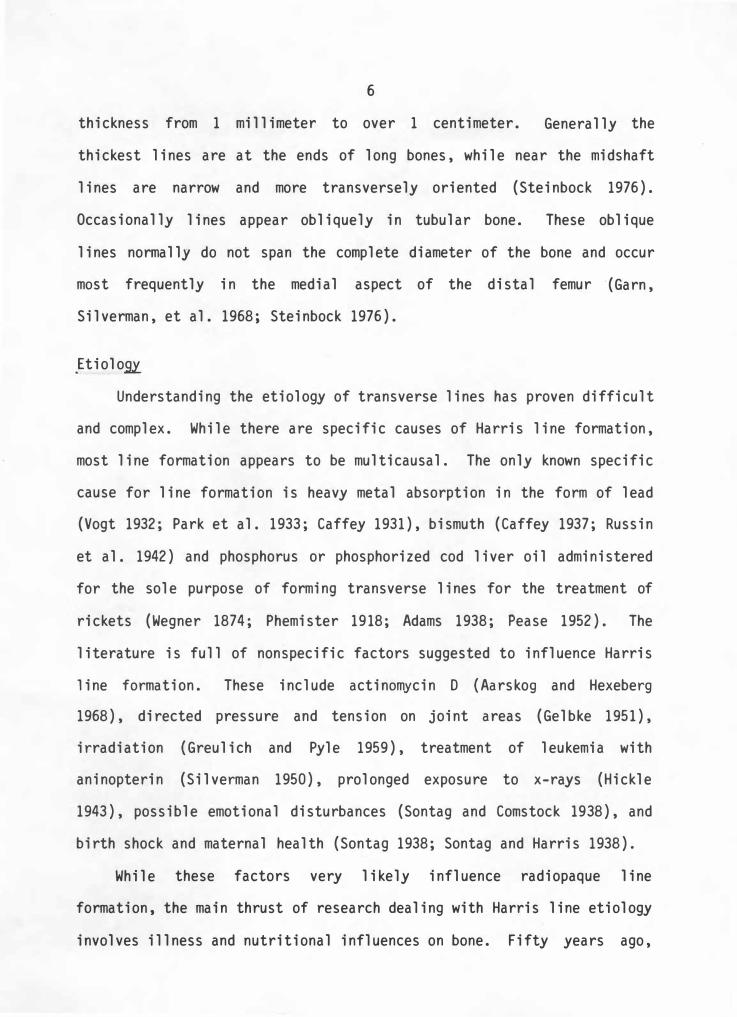
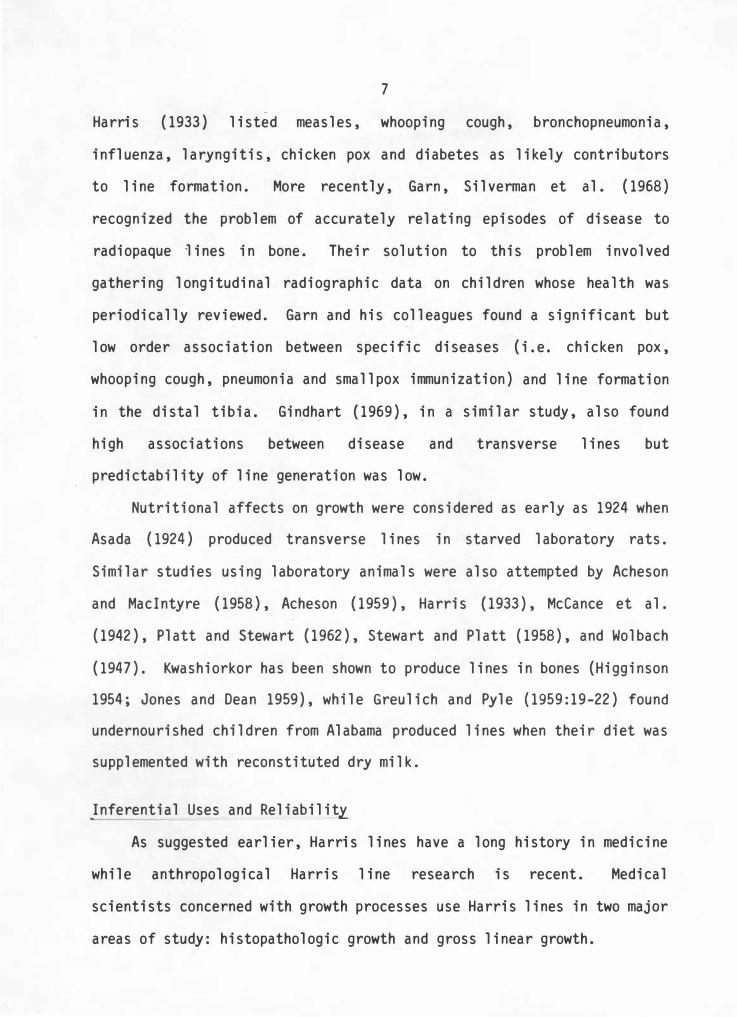
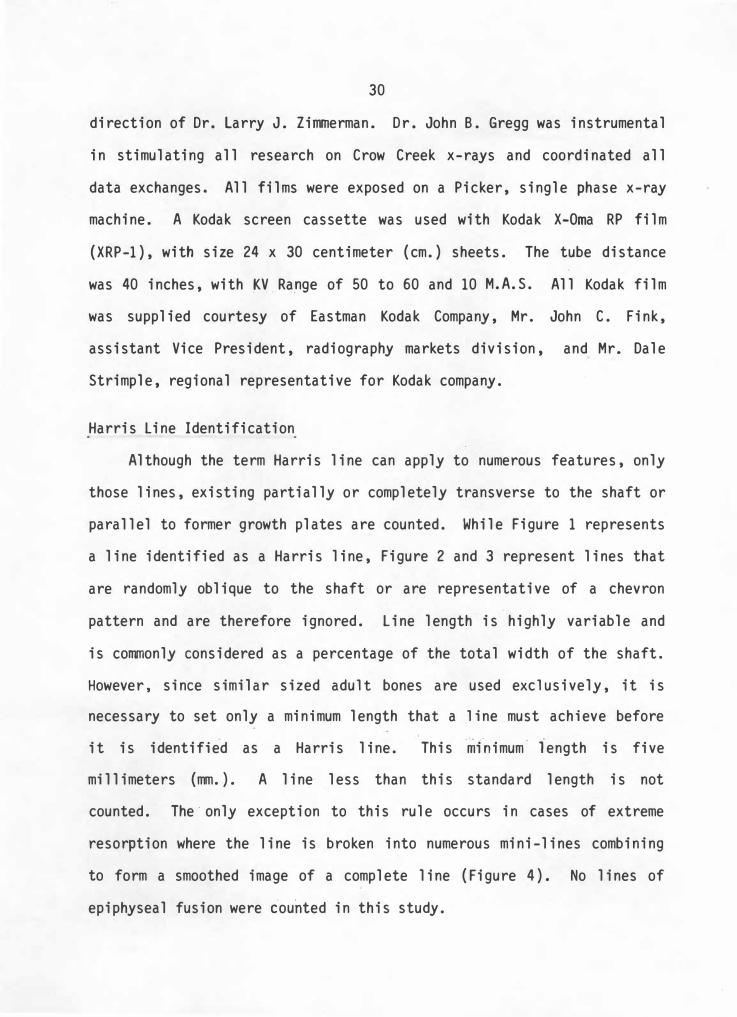
Although the term Harris line can apply to numerous features , only
those lines , existing partially or completely transverse to the shaft or
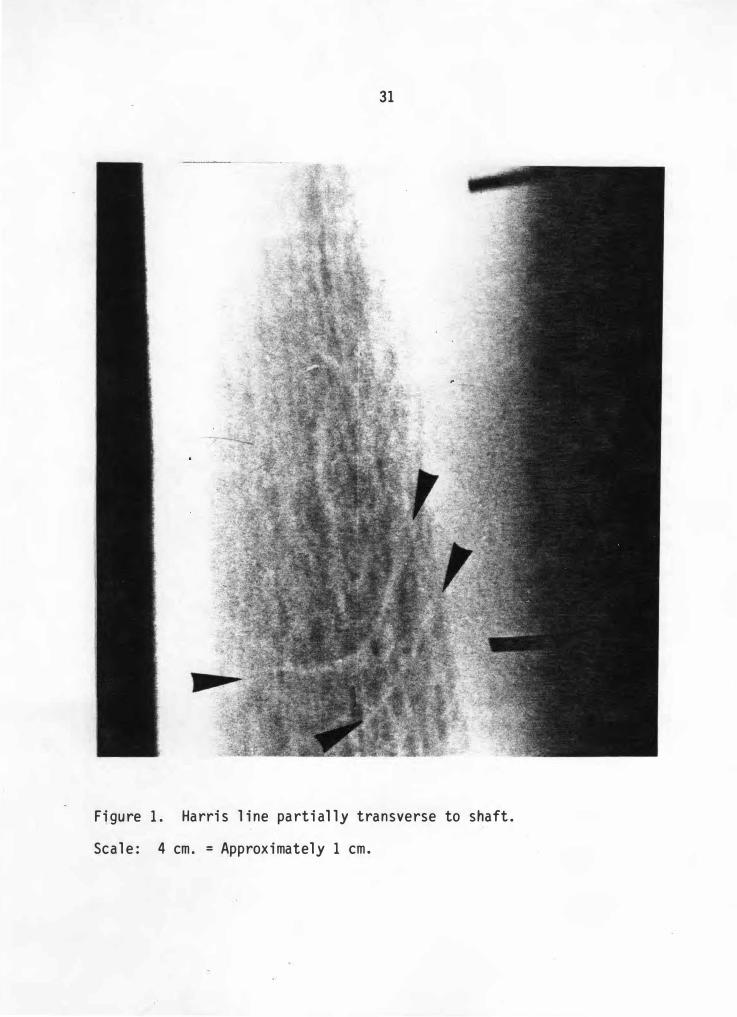
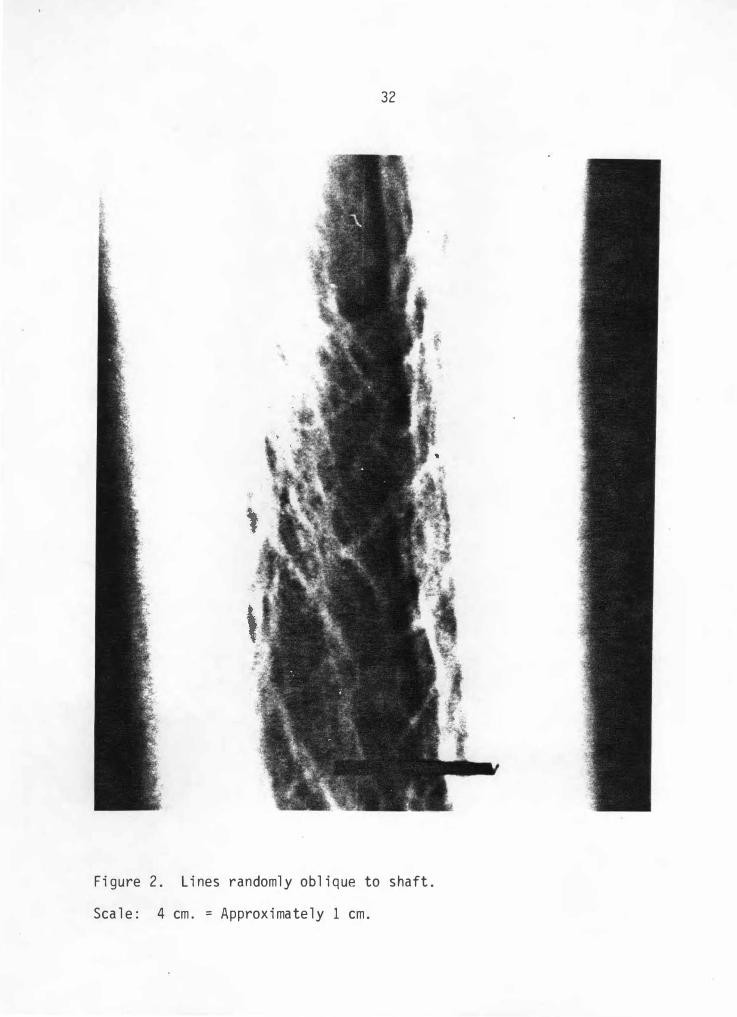
parallel to former growth plates are counted. While Figure 1 represents
a line identified as a Harris line , Figure 2 and 3 represent lines that
are randomly oblique to the shaft or are representative of a chevron
pattern and are therefore ignored. Line length is highly variable and
is commonly considered as a percentage of the total width of the shaft.
However , si nce similar si zed adult bones are used exclusively , it i s
necessary to set only a mini mum length that a l ine must achieve before
it is identified as a Harris line. This �i�imum · iength is five
mi llimeters (mm.). A line less than this standard length is not
counted. The · only exception to this rule occurs in cases of extreme
resorption where the line is broken into numerous mini-lines combining
to form a smoothed image of a complete line (Figure 4). No lines of
epiphyseal fusion were counted in this study.
31
Figure 1. Harris l ine partial l y transverse to shaft.
Scal e: 4 cm. = Approximatel y 1 cm .
32
F i gure 2 . L i nes randoml y obl i q ue to s haft .
Sca l e : 4 cm . = Approx i mate l y 1 cm .
33
cm • •
F i g ure 3 . Obl i que l i nes to shaft i n a c hevron pattern .
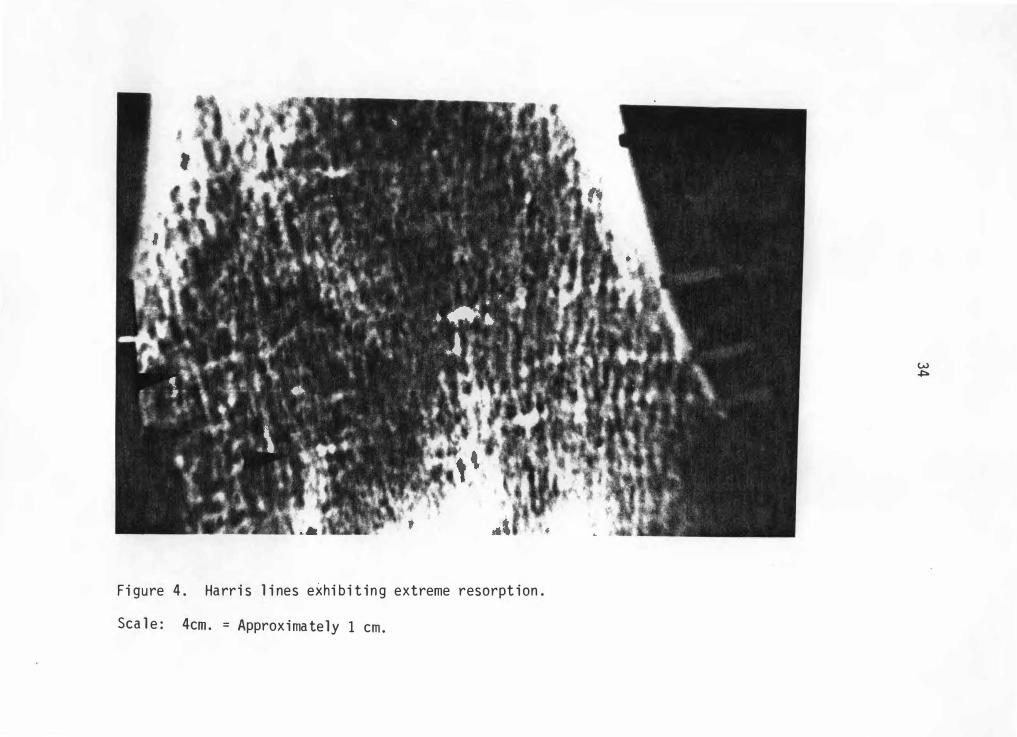
F i gure 4 . Ha rr i s l i nes exhi b i t i n g extreme resorpt i on .
Sca l e : 4cm . = Approxima te ly 1 cm .
w �
35
Age Assessment
Harris line age assessment has been attempted in the past. Wells
{ 1967) assessed Harris line ages using a three-fifths proximal and
two-fifths distal growth ratio of the tibia. With this technique a
constant birth length is subtracted from total diaphyseal bone length.
The remaining length is divided into equal increments representing
yearly growth. The birth length constant, in this case, is 90 rrm.
Wells recognized various problems with this type of age assessment:
This [birth length constant] is uncertain and no doubt even to look for a constant of this kind is an over-simplification. Owing to variations in the rate of proximal or distal growth at different ages the proportion of growth from each is almost certainly a fluctuating one throughout childhood (Wells 1967 : 403).
However, Wells (1967) justifies his technique since all samples used in
his analysis are subjected to the same biases of the technique. This
method has also been used by Allison et al. (1974) and McHenry and
Schultz (1976).
The technique of age assessment used for this study was introduced
by Hunt and Hatch (1981). Hunt and Hatch attempted to reduce these
errors and more closely approximate true age at the time of Harris line
formation. They divided a double logistic growth curve specific to each
sex and population. By calculating total diaphyseal bone length at the
time of a specific line formation, comparisons to their growth curve
produces an estimated age at line formation. The double logistic curve
devised by Hunt and Hatch applies to ages one through eighteen.
Neonatal values are produced by mul tiplying the one year age value by a
constant. To calculate total bone length at the time of line formation
36
the bone origin must first be located. This primary center of
diaphyseal ' ossification in the tibia can be estimated in an adult bone
using the predicted growth ratio of 57% on the proximal end while 43%
occurs on the distal end ( Hunt and Hatch 1981) .
To demonstrate the Hunt and Hatch (1981 ) method of Harris line age
assessment, a brief step-by-step description of their methods wi 1 1 be
listed below. Most computations are conducted using SAS ( SAS Institute
1979).
The first step in this analysis is to examine all radiographs and
identify Harris 1 ines in distal tibiae. All Harris 1 ine assessments
were made and double checked by the author. Lines were marked with a
thin · adhesive tape. Diaphyseal length for each tibia used in this
analysis is determined by subtracting 21 rrm. from each end or 42 fTITl .
from the greatest tibia length measurement. Twenty-one rrrn. is the
average proximal or distal epiphysis length for an individual 12 years ... . :: ·,..,,., ... · ..
of age. Although Hunt and Hatch (1981) acknowledge that epiphyses still
grow after age 12, they suggest that this e��or is trivial. Crow Creek -: . ... ...
tibia length measurements are from Williams (ms). The bone origin is
calcul�ted as being 43% from the distal diaphyseal tibia. This
calculated distance is measured on the x-ray from the most distal point
on the x-ray of the bone. In this study the origin was marked with thin
colored tape. The greatest distance between the origin and each line
was measured to the nearest millimeter. Total length of the bone at the
time of line formation is calculated by dividing each line distance by
43%. Since lines form at the growth plate, the distance from this point
to a Harris line is only the distal portion of the bone. Therefore, the

37
proxi ma l port i on i s cal cul ated then added to the d i sta l to fi nd the
tota l d i aphysea l l ength of the bone at the poi nt of l i ne formati on .
Measurements taken on any x- ray and those taken on actua 1 bone
cannot be expected to y i e l d i denti cal resu l ts . Due to the x-ray
techn i que used , pa ra l l ax d i s tort i on can account for a g reat dea l of
erro r , mak i ng objects on x-ray l arger than actua l d i mens i ons . Si nce
th i s analys i s must depend on measurements taken on actua l bone then
compared to mea surements taken of the same bone on fi l m , - d i_s�or:tion due
to para l l ax cou l d certa i n ly be an i nfl uenc i ng factor . However , . .i t . i s
t h i s researcher ' s op i n i on that d i stort i on i s not g reat for th i s type of
analys i s . . \ ,
Obv i ous ly , the g reater the d i stance the ori g i n of emi tted x-rays
l i es and the sma l l e r the d imen s i on s of the object to be x -rayed reduces
paral l ax . Wi th the x- ray mach i ne tube 102 cm . from s i x 24 x 30 cm .
fi l m , di stort ion i s mi n imal . As wel l , on ly d i sta l ends of ti b i ae are
p l aced on the f i l m . Si nce d i sta l t i b i ae are smal l and do not ri se h i gh
above the fi l m , d i stort i on i s aga i n kept to a mi n i mum .
T i b i ae must be cal i brated i n s i ze to the o ri g i na l Denver Wh i tes
sampl e u sed by Hunt and Hatch . Th i s corrected l ength for ma l es and
fema l es i s cal cu l ated s imply by d i v i di ng each ma l e d i aphyseal l ength by
392 . 0 and femal e l ength by 350 . 0 . These constants represent the average
d i aphysea l l ength of t i b i ae for Denver mal es and femal es respecti ve ly .
Once the t i b i ae a re sexed and corrected l engths a re establ i shed ,
each bone can be separated i nto yearly growth segments u s i ng Hunt and
Hatch ' s ( 1981 : 462 -463 ) formu l ae . W i th bone growth i n l ength computed
for each g rowi ng yea r , the researcher need only a l i gn each l ength of
38
bone at the time of line formation with the closest corresponding yearly
growth segment constant. Thus, the yearly age associated with the
constant that most similarly matches bone length at line formation is
the age at line formation.
Newborn Length
Up to this point, the Hunt and Hatch method of age assessment has
been used without alteration.
length at birth is considered.
Problems arise however, when tibia bone
The Hunt and Hatch newborn tibiae length
for Denver Whites is 59 millimeters. When this newborn constant was
applied to Crow Creek tibia, which were substantially shorter than
Denver White tibiae, the population-specific correction factor produced
newborn tibia lengths of approximately 51 millimeters. From personal
observations of newborn Arikara children it seemed clear that this
figure was too short for newborn length, especially when compared to
prior studies which eliminate lines occuring at 90 millimeters or less
(Wells 1967; Allison et al. 1974; McHenry and Schultz 1976). A range of
51 to 90 millimeters for newborn tibiae length could be proposed but a
range of that magnitude does not seem appropriate for this study.
Many past studies have dealt with newborn length. Fazekas and Kosa
(1978:232-277) have reviewed early studies dealing with neonatal and
prenatal bone measurements. One of the oldest studies cited for this
type of information is Kanzler ' s 1854 description of data gathered by
Nicolai and Beclard. These researchers establish newborn tibia length
at 62.2 and 60. 0 respectively (see Fazekas and Kosa 1978:232). Fazekas
and Kosa (1978:263) themselves give full term tibiae length as being
65. 1 for males and females combined while McCammon (1970 : 181) reports a
39
newborn to 2 months tibiae length at 70. 6 rrm. Stewart ( 1979: 132-135)
takes a slightly different approach and established a frequency
distribution of tibiae · lengths on a protohistoric Arikara Indian s ite
(39WW1). This distribution produced a concentration of bones within a
. range of 63 :0 to 74. 5. The mean length of these two figures is 68. 8.
Since it can be assumed that death most frequently occurs at childbirth,
Stewart stated that these figures strongly suggest accurate Ar· ; kara
tibiae length at birth.
Surrmariz ing the literature of tibia newborn length, it would seem
that this bone is m·ost 1 ikely in a range of 60 to 70 rm,. at birth with ·
most recent research suggesting a length from 65 to 70 rm,. This again
suggests that the Hunt and Hatch (1981) standard for newborn tibiae is
much too small and needs to be revised. Since Crow Creek material is
most closely related to Arikara Indian material, it is more appropriate
to devise a standard based upon Arikara rather than other skeletal
samples.
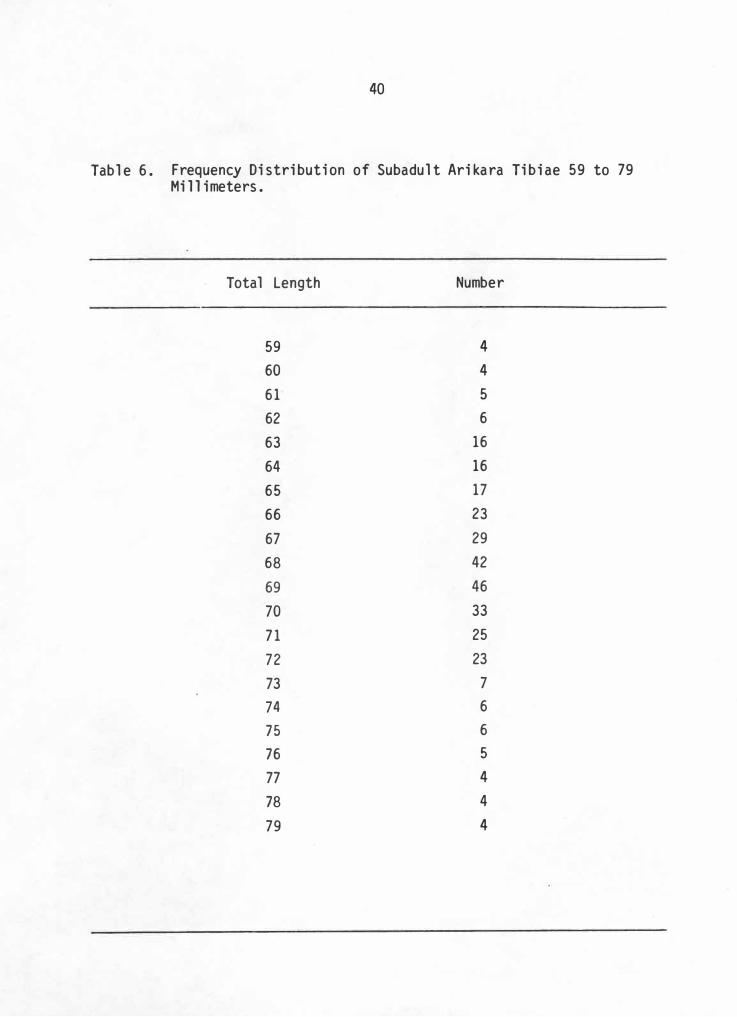
Owsley (ms), in an analysis of Arikara Indian development and
mortality, has measured numerous skeletal elements using seven sites
extending from prehistoric to historic times. Utiliz ing S�ewart ' s
(1979:132-135 ) technique and Owsley's data, a frequency distribution was
established for all tibia 59 to 79 mm. in length, all sites combined.
The results (Table 6 ) demonstrate a concentration of tibiae at the 68 to
69 nm. length. Since this study closely coinsides with the findings of
Stewart, the value of 68. 5 is deemed a more accurate constant newborn
tibia length than the figure provided by Hunt and Hatch.
40
Tabl e 6. Frequency Distribution of Subadul t Arikara Tibiae 59 to 79 Mi 1 1 imeters.
Total Length Number
59 4
60 4
6 1 5
62 6
63 16
64 16
65 17
66 23
67 29
68 42
69 46
70 33
7 1 25
72 23
73 7
74 6
7 5 6
76 5
77 4
78 4
79 4
41
W i th b i rth l ength of t i b i ae estab l i shed at 68 . 5 , the Hu nt and Hatch
method must be rev i sed to use thi s va l ue . S i nce i t i s l i ke ly that most
Crow Creek newborns have a t i b i a l ength s i mi l ar to 68 . 5 rTITl. , it was
dec i ded that for th i s study a l l ti b i ae shou l d approach th i s val ue ,
i rregardl ess· of tota l adu l t l ength . To accompl i sh th i s , sex-spec i fi c
mean adu l t ti b i ae l engths are ca l cul ated for Crow Creek a s a whol e
rather than for each bone . Next , a correcti on factor i s produced to
make Hunt and Hatch age va 1 ues correspond to the s horter adul t Crow
C reek sampl e . Wi th yea rly age va l ues popu l ati on-spec i fi c to Crow Creek ,
a constant for each sex need on ly be mu l ti p l i ed by correspond i ng one
year val ues to produce b i rth l engths of 68 . 5 mm. The cons tants that
produce b i rth l engths speci fi c to Crow Creek a re 0 . 7009 for ma l es and
0 . 6788 and fema l es respecti ve ly .
Prenatal L i nes
Some l i nes may occur before th i s ca l cu l ated newborn l ength i s
reached . Very l i ttl e research has been done on prenata l l i nes . Thi s
i ndi cates e i ther pauc i ty of l i ne formati on before b i rth or a recogn i t i on
probl em w i th prenata l l i nes . We l l s su ggests the l atter :
I t i s worth not i ng here that a transverse l i ne may be s een a s a rare anomaly i n a part of the bone wh i ch corresponds t o i ts prenatal l ength . The i nterpretati on of a l i ne i n th i s pos i ti on i s uncerta i n . I t i s doubtfu l whether they a re true Harri s ' s l i nes and they a re best i gnored (Wel l s 1967 : 404 ) .
Al l i son et al . ( 1974 : 410 ) s i mp ly states that " l i nes that fe l l i n the
prenatal area were not counted i n the study as thei r i nterpretati on was
con s i dered unsati sfactory . "
42
Certainly, it is difficult to deal with prenatal growth, especially
in terms of age prediction. However, these form potentially valuable
record of information that should not be ignored. Although the
occurrence of these lines is rare, they will receive equal treatment in
this research. Obviously prenatal lines cannot be categorized into
years before birth, but using fractions of years before birth would be
consistent with the yearly age assessment of lines after birth. For
example, prenatal growth is often considered in terms of lunar months
with full term development occurring in the tenth lunar month. Dividing
these lunar months into fractions of years, seven months of fetal
development represents approximately one-fourth {. 23) of a year before
birth. Three months represent just over one-half (0. 54) a year before
birth. To study prenatal lines, approximations of tibia bone length at
these periods of development are needed as standards. Fazekas and Kosa
( 1978: 232-277) carefully outline tibia dimensions throughout ten lunar
months of prenatal development and their standar�s are used here.
Comparing prenatal lengths to birth lengths, a constant can be developed
for one-fourth and one-half years before birth. If bone length at
prenatal line formation is compared with bone length at birth, a value
is produced that is comparable to the prenatal constants. Thus prenatal
lines are calibrated the nearest fraction of a year before birth.
This is a new technique whose re 1 i abi 1 i ty has not been assessed.
No standard prenatal growth curve has been established nor have Crow
Creek 1 i ne measurements been ca 1 i bra ted in any way to the Fazekas and
Kosa fetal sample. However, worldwide studies of human growth strongly
suggest the basic reliability of the method. It is logical to assume
43
that growth is predi ctab 1 e in humans whether it is before or after
birth, and prenatal growth is likely more predictable and less
susceptible to environmental stress than postnatal growth. Due to this
predictability, the Fazekas and Kosa mean lengths are probably similar
to those of. Crow Creek. The advantage of the technique is that it
provides a way to identify all lines. Using an untested technique in
this case appears more defensible than simply eliminating all prenatal
1 ines.
CHAPTER V I
RESULTS
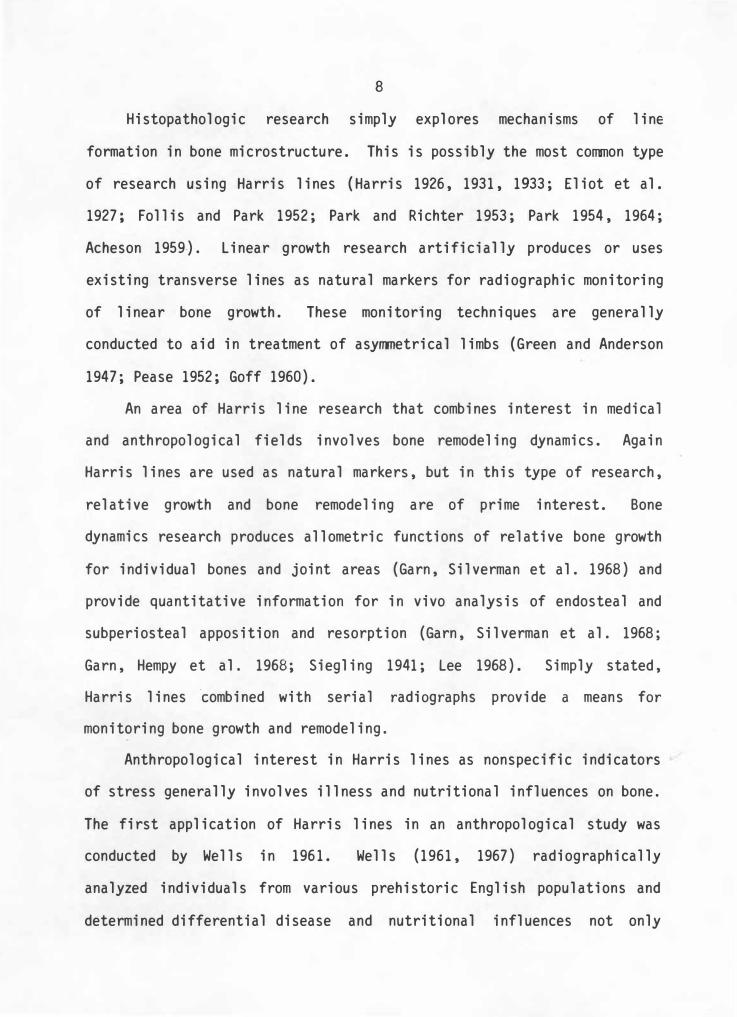
Harris lines are evident in Crow Creek distal tibiae and they
apparently �ccur with some regularity. While some individual tibiae
completely lack any trace · of transverse lines (Table 7 ) , close to : .,� :.--..... . . ,-__ ..,.�
three-fourths of the bones studied did contain at least one radiopaque
1 ine (Table 8 ) . While most individual elements exhibited one 1 ine,
numerous tibiae contained multiple lines with 10 lines being the highest
frequency for any single element. Of the 92 tibiae that exhibit lines,
a total of 163 lines were recorded (Table 9). Each line when aged falls
into an age range of -0. 5 to 18 years. Figures 5 through 8 graphically
illustrate Harris line frequencies for each sex and side by age at line
formation.
Table 7. Number and Frequency of Tibiae Exhibiting No Harri s Lines Out of a Possible 122 Elements.
Sex Left
Male 6
Female 9
15
S i de
(%) Right
( 4 . 9 ) 9
(7. 4) 6
(12 .3) 15
44
(%)
(7. 4)
(4 . 9 )
(12 .3)
15
15
30
Total
(12. 3)
( 12 . 3 )
(24 .6)
45
Table 8. Number and Frequency of Tibiae Exhibiting Harris Lines Out of a Possible 122 Elements.
Sex
Male
Female
Left
13
28
41
(%}
(10.7}
(23.0}
(33.6)
Side Ri ght
36
15
5 1
(%)
(29.5}
(12. 3}
(41 .8)
Total
49
43
92
( % }
(40.2}
(35.2}
(75 .4)
Table 9. Number and Frequency of Harris Lines in Distal Tibiae.
Sex
Mal e
Femal e
left
18
47
65
(%)
( 1 1 . 0 )
(28.8}
(39 . 9)
Side Right
71
2 7
98
(%)
(43. 6}
(16. 6)
(60 . 1)
Total ( % }
89 (54. 6}
74 (45.4}
l63
28 -25
24 23 22 21
20
� 11
z 18 :J f7 V, 18
14 ..... 13
11 10
• 0
� 8 7 8
5 " 3
2 1
0 �, 0 1 2 J .. 5 8 7 8 I 10
AGE
F i gure 5 . Harr i s·, l i nes of l eft ma l e t i b i ae .
11 12 13 14 15 11 f7 11
� O'I
21 25 Z4 u 22 21 20
ti 11
;z 11 :J f1 Cl) 11
15 14
a.. 13
11
• 6 •
� 7 • a 4 3 2 1
0 ..:1 0 1 2 3 " 5 8 7 I I 10
AGE
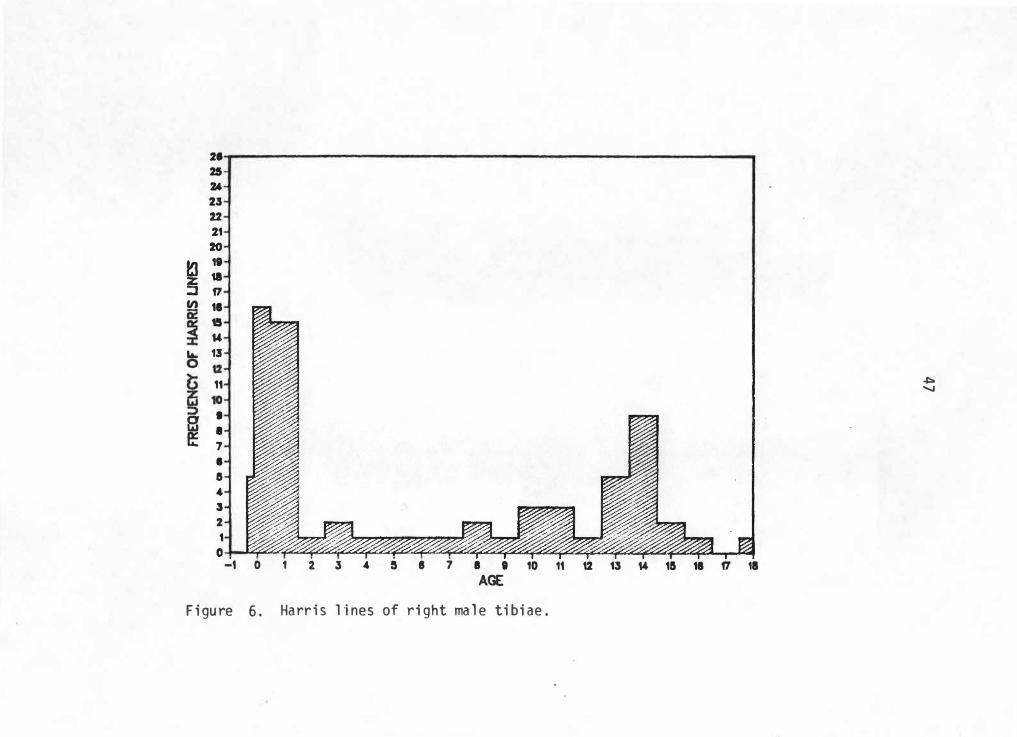
F i gure 6 . Harris lines of right ma l e ti bi ae.
11 12 13 M 15 11 f1 18
.i::......,
21 -r-----------------------------. 25 u 23 22 21
20
� 19
z 18 ::J r, � 18 � 15 :i 14 � 13 O 12 l3 11 � 10
5 9 l.&J 8 e: 7
6 5 " 3 2
1
0 ' ����«�&pa I ��� � ' -1 7 8 9 10 11 12 13 14 15 16 f1 18
AGE
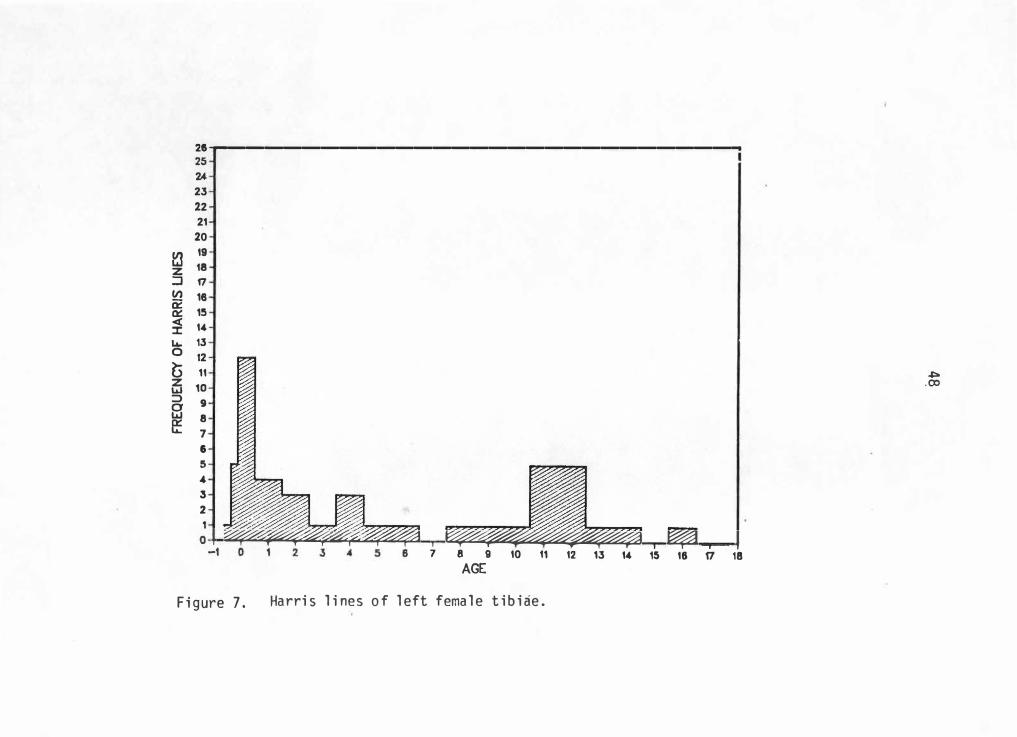
F i g ure 7 . Harri s l i ne s o f l eft fema l e t i b i ae .
.i:. . CX>
28 25 2A 23 22
21 20
� 19
z 18
:J f7 Cl) 16
1, :x: """ 13
11
10
9
8 8
e: 7
6
5 ' 3
2 1
0
-1 0 1 2 3 � 5 6 7 8 g 10 1 1 AGE
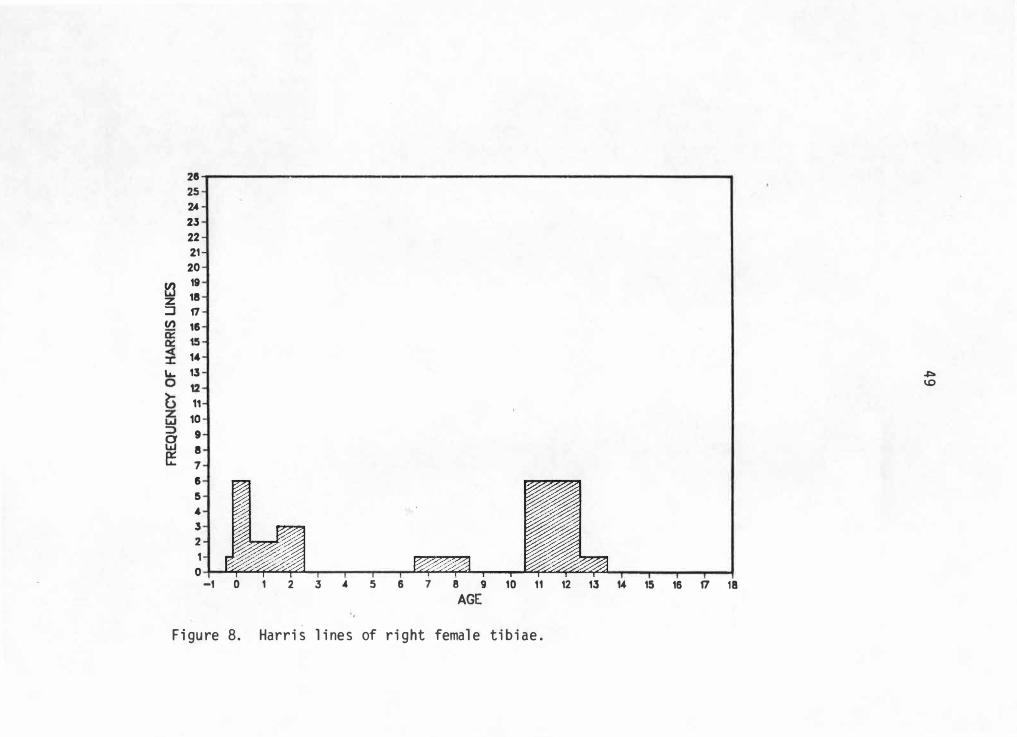
Figure 8. Harris lines of right female tibiae.
12 13 1-4 15 16 f7 18
� \.0
50
With this information available, it is now possible to address the
hypotheses presented in Chapter I I I. Hypothesis I assumes that Harris
lines are non-specific indicators of stress and are of value to
anthropological problem solving on the individual and population level.
While this -hypothesis does provide an es sen ti a 1 base for subsequent
hypotheses to build upon, testing is difficult since initial results
offer little to prove or disprove this hypothesis. Hypothesis I will be
discussed more fully in Chapter 7 so information gleaned from the
following hypotheses and discussions may be more appropriately utilized.
Hypothesis I I states that frequency comparisons of Harris lines in
a skeletal sample should produce observable sex differences. As
mentioned above, this hypothesis simply assumes there are obvious
biological differences between boys and girls and it is likely these
differences influence, in some manner, the formation and retention of
non-specific indicators of stress, or in this case, Harris lines.
However, initial examination of frequencies of individual tibiae with
and without Harris lines give no indication of sex bias {Table 7 and 8).
The same is true for frequencies of actual lines in bone (Table 8) since
lines appear to be equally distributed considering sample sizes.
To test this initial assessment, a statistical test of these
distributions can be performed on the average number of Harris lines
expected to occur in each tibia by sex. Using the predictive values of
1 i ne occurrence in Tab 1 e 10, a Student's t-test pro�uces a value of
0.5819 for left and 0.7913 for right tibiae sex comparisons. Neither
test approaches significance at the 0.05 probability level. While
tibiae sorted according to sex are comparable, side comparisons have
51
limited application since it is impossible to determine which elements
belong to the same individual. However with the use of a t-test, it is
possible to compare the largest samples of tibiae for males and females
even though these occur on opposite sides. Se � differences tested in
this way are· not significant at 0.05 (t= l. 27).
Table 10. Predictive Values of Harris Line Occurrence in Crow Creek Ti bi a e .
Sex
Male
Female
left
0 . 95
1 . 1 4
1 . 16
Side Right
1 . 58
1. 23
1.48
Total
1 . 39
1 . 28
T:34"
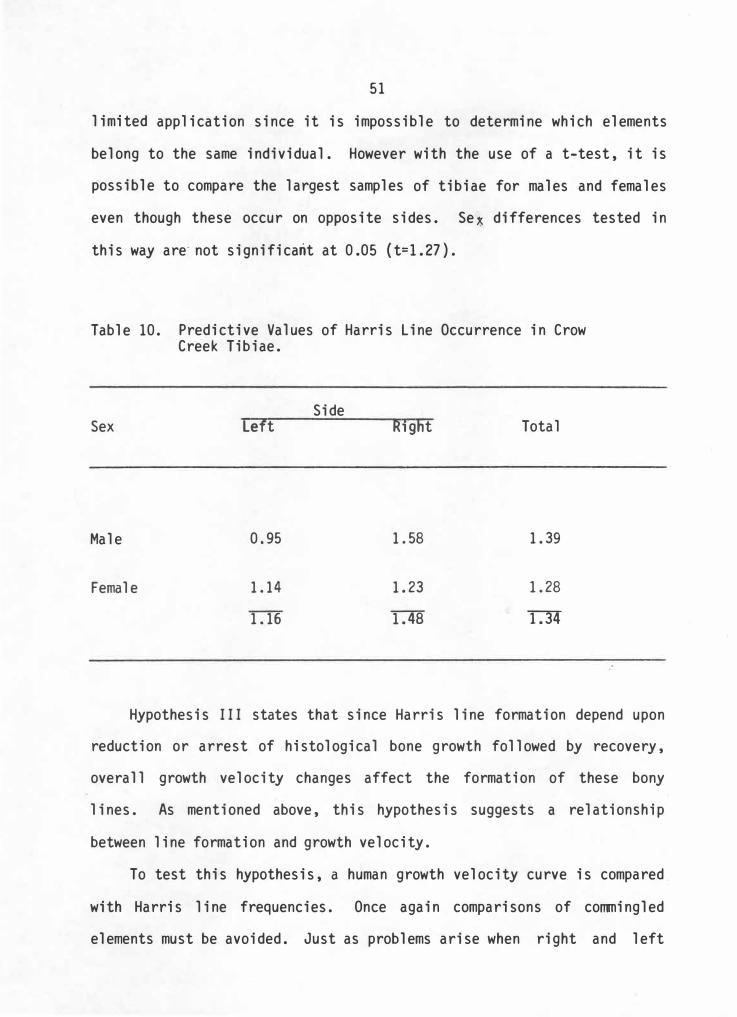
Hypothesis I I I states that since Harris line formation depend upon
reduction or arrest of histological bone growth followed by recovery,
overall growth velocity changes affect the formation of these bony
lines. As mentioned above, this hypothesis suggests a relationship
between line formation and growth velocity.
To test this hypothesis, a human growth velocity curve is compared
with Harris 1 i ne frequencies. Once again comparisons of co111J1i ng 1 ed
elements must be avoided. Just as problems arise when right and left

52
el ements are combined, it is also incorrect to combine el ements from
different sexes because boys and girls grow differently. However, most
of these differences occur in the timing of the prepubertal spurt while
growth up to this point or up to about nine years of age, is for most
purposes all but identical { Tanner 1978: 14). Therefore if Harris line
frequencies are charted with a growth velocity curve from birth to 9
years, sexes can be combined to achieve maximum sample size and still
test for correlation of line formation and growth velocity. Figures 9
and 10 represent left and right tibiae line totals with a modal human
growth velocity curve. Similarities in each curve shape is readily
noticeable.
Since this initial test suggests similarities in curve shapes, this
test is carried one step farther by looking for similar correlations
when controlling for sex. Due to sample size limitations, only right
male and left female tibiae will be considered. However, these
frequencies can now be compared to sex-specific gro��h charts extending
for the total growth period.
Figure 11 represents right male tibiae 1 ine frequencies compared
with a male growth velocity . curve. There seems to be si milarities with
peak periods of growth velocity and line frequencies. Male peak periods
occur at birth and near 14 years of age. A similar correlation is shown
in left female tibiae { Figure 12) with the major peak at birth and a
second peak near 12 years of age.
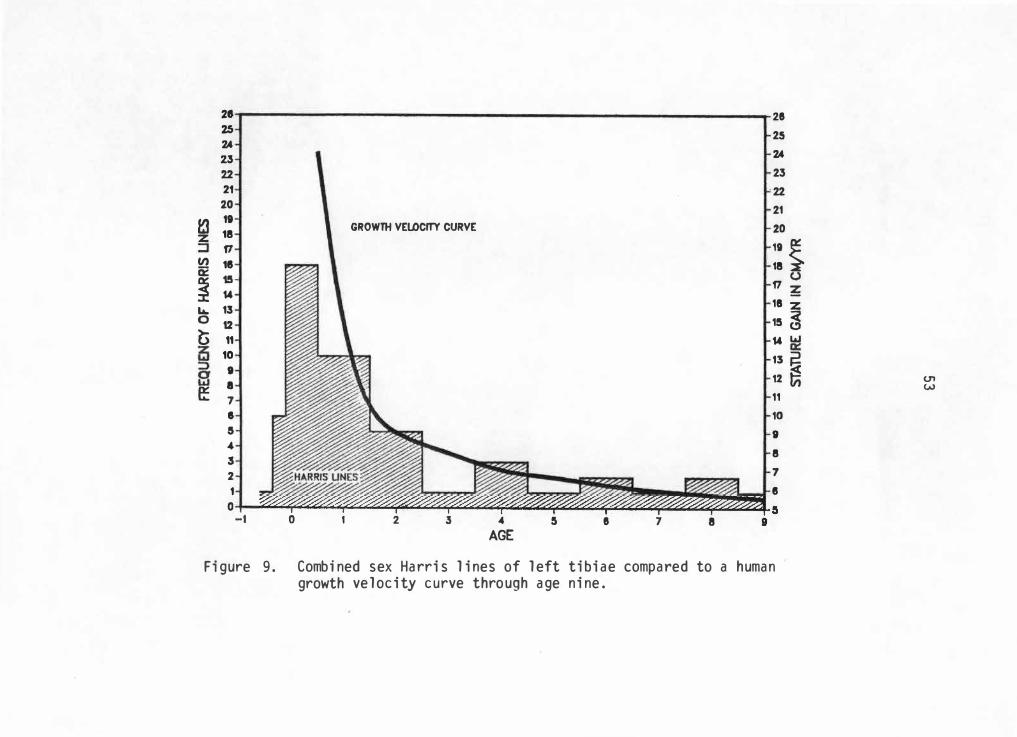
28 28 25 25 24 25 24
22 23 21 ' 22 20 21
t3 11
GROWTH VELOCITY CURVE 18
20 z
f1 ,, t Cl) 11 18 � 15 0
� 1' f1 �
.. 13 11 z 0 12 15 � li 11 1' .....
10 13 � • :c(
I 12 t;, e: 7 11
8 10 5 9
" 8 5
2 7 1 8
0 -t 0 1 2 3 4 5 8 7 8
AGE
Figure 9. Combi ned sex Ha rris l ines of l eft tibiae compared to a human growth velocity curve through age nine.
u, w
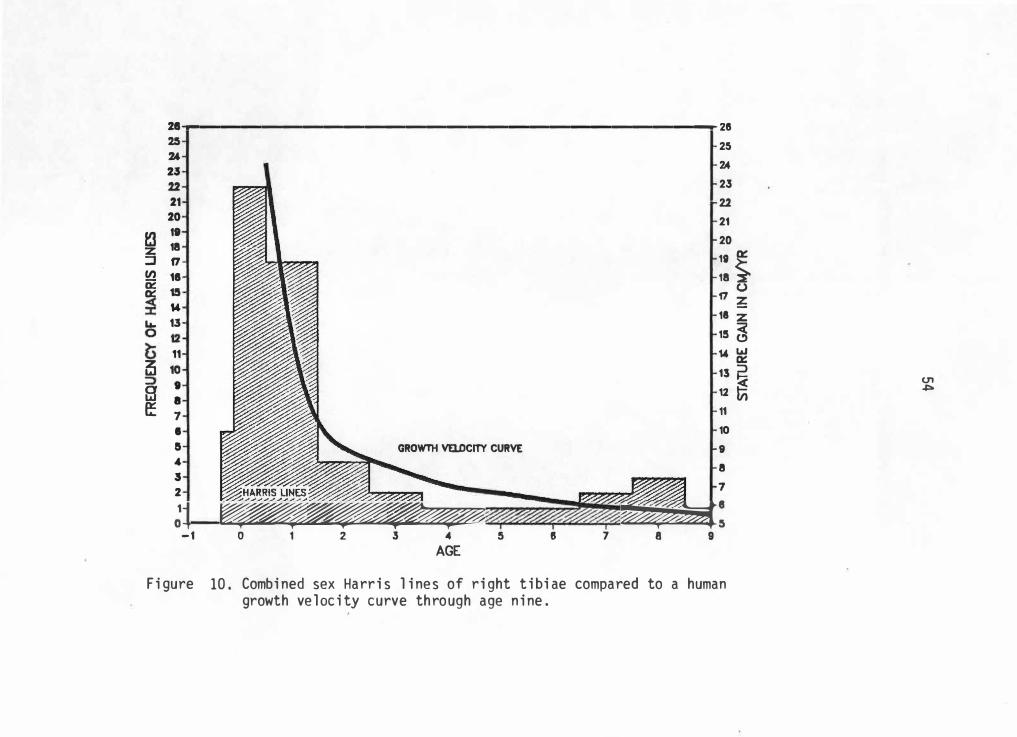
21 1....----------------------------- 28 2.5 24 2� 22 21 20 11
� 18 !i f7 !!} 11 � 15
"
.._ 13
11 � 10
s e:
' I 7 • a
" J 2
GROWTH VD.OCITY CURVE
25 24' 23 22 21 20 19 a:=
18 � 0
17 6 11 z 1!5 �
1' � 13 � 12 �
11 10 9 8 7
�1 ���� �: - 1 0 1 2 3 '4 5 8 7 8 9
AGE
Fi gure 10 . Combi ned sex Harr i s li ne s of ri ght t i bi ae compared to a human growth veloc i ty curve through age n i ne.
(.11 �
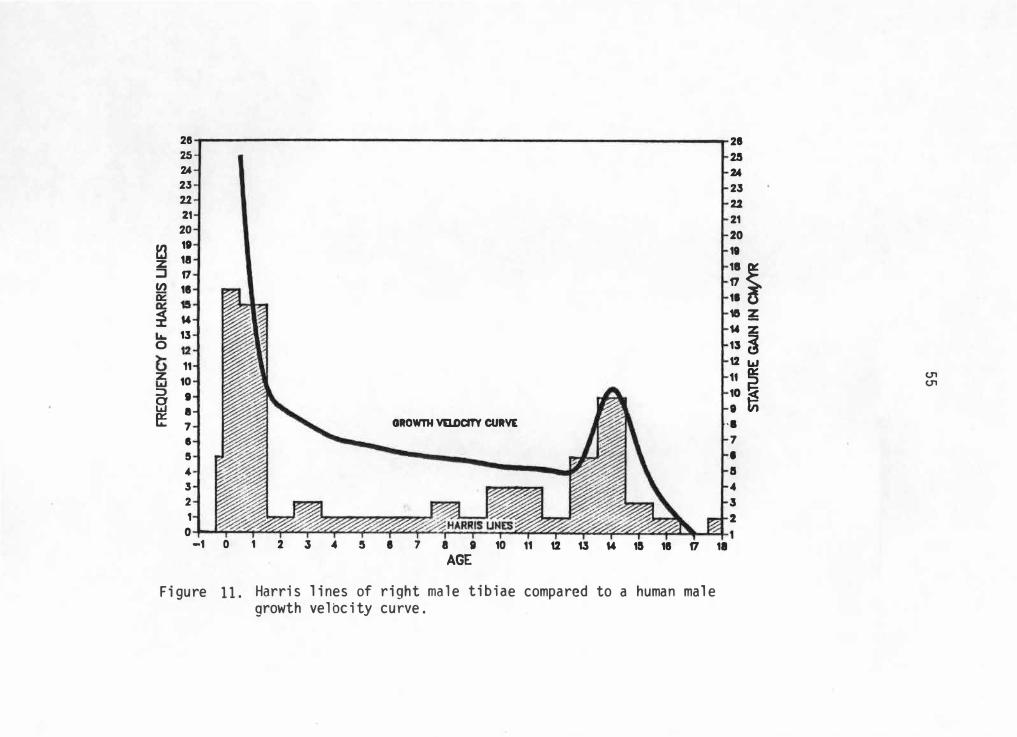
28 25 24 23 22 21
20
� 11
z 18 :J f7 Cl) 11
� u LI. 13 0
11 z 10 ::> I 8 I e: 7 GROWTH VD.OCITY CURVE
8
5 4 3 2
1 0
-1 0 1 2 J .. 5 I 7 a 9 10 11 12 13 u 1& 11 f7 AGE
Figure 1 1. Harris l ines of right ma l e tibiae compared to a human mal e growth vel bcity curve.
21 2.5 24 23 22 21 20 11
: i 11
15 � w z 13 � 12 w 1,
� (JI
(JI
10 :c(
• ln · I 7 •
a .. 3 2
11
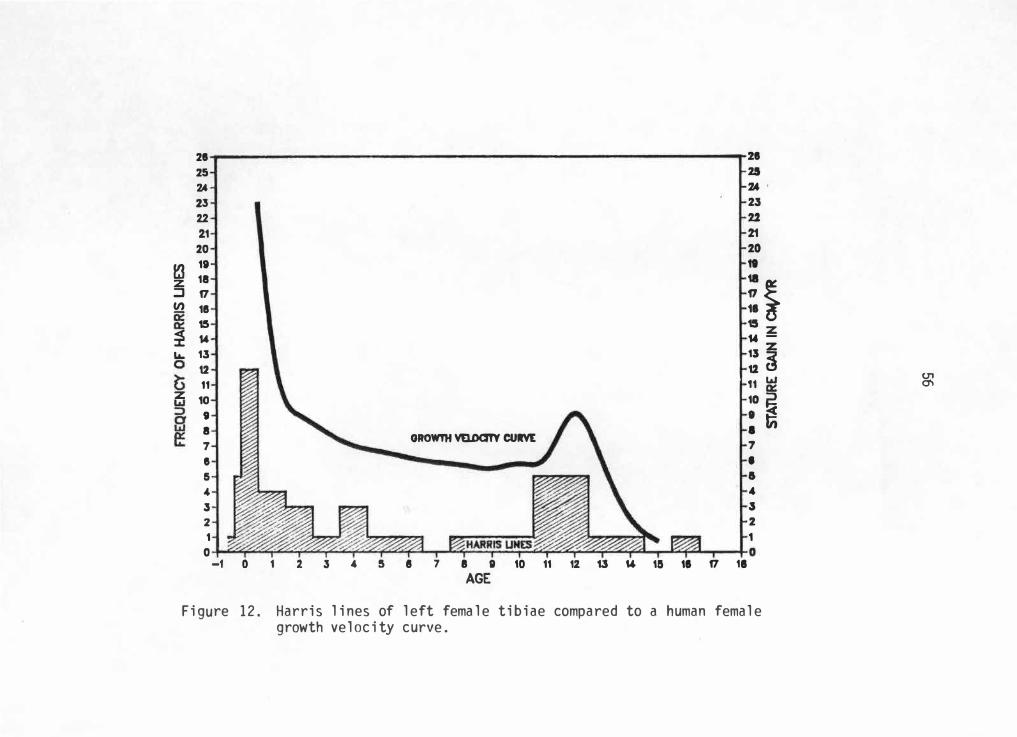
21 21 25 25 24 24 23 23 22 22 21 21 20 20
� 19 11 18 18 z
: 1 :J f1 Cl) 18
15 15 z � w w -La. 13 13 Z
12 12 � 11 11 �
z 10 10 � I
. � 8 OROwnt VELOaTY CUIVE I 7 7 e •
5 a 4 " 3 i 2 2 1 1
0 -1 0 1 2 3 " 5 I 7 I 0 10 11 12 13 " 15 11 f1 11
AGE
Figure 12. Harris l ines of l eft fema l e tibiae compared to a human fema l e growth ve l ocity curve .
�
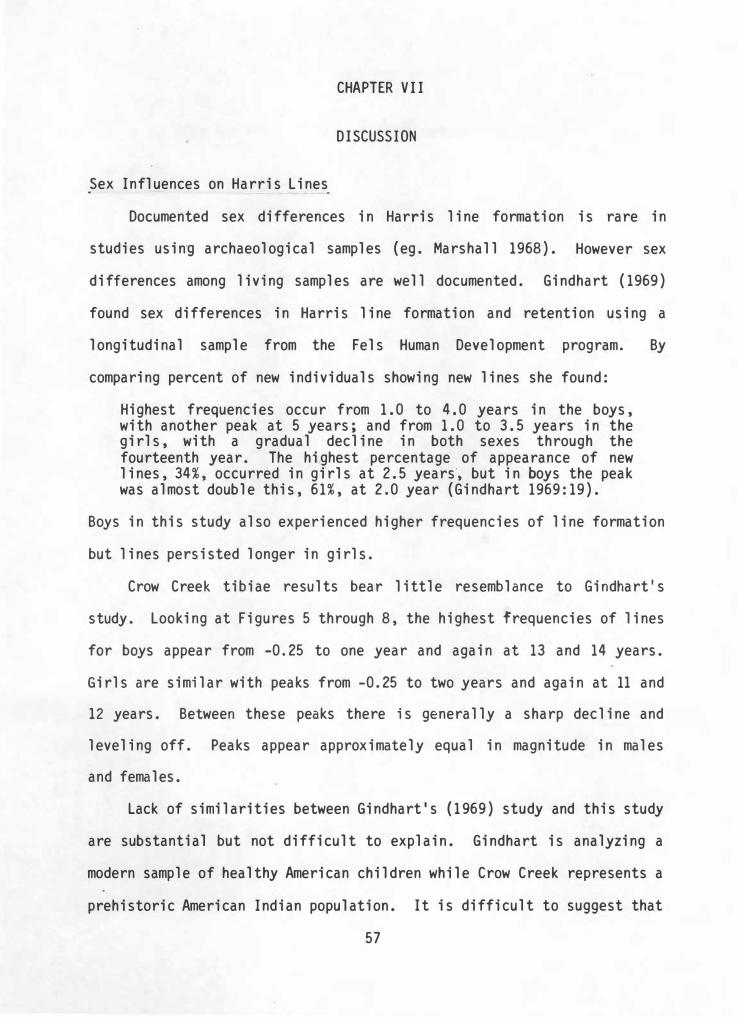
CHAPTER V II
D ISCUSSION
Sex Influences on Harris Lines
Documented sex differences in Harris 1 ine formation is rare in
studies usiny archaeological samples (eg. Marshall 1968). However sex
differences among living samples are well documented. Gindhart (1969)
found sex differences in Harris 1 ine formation and retention using a
longitudinal sample from the Fels Human Development program. By
comparing percent of new individuals showing new lines she found:
Highest frequencies occur from 1. 0 to 4. 0 years in the boys, with another peak at 5 years; and from 1. 0 to 3.5 years in the girls, with a gradual decline in both sexes through the fourteenth year. The hi.ghest percentage of appearance of new lines, 34%, occurred in girls at 2. 5 years·, but in boys the peak was almost double this, 61%, at 2.0 year (Gindhart 1969: 19).
Boys in this study also experienced higher frequencies of line formation
but lines persisted longer in girls.
Crow Creek tibiae results bear little resemblance to Gindhart ' s
study. Looking at Figures 5 through 8, the highest frequencies of lines
for boys appear from -0. 25 to one year and again at 13 and 14 years.
Girls are similar with peaks from -0. 25 to two years and again at 11 and
12 years. Between these peaks there is generally a sharp decline and
leveling off. Peaks appear approximately equal in magnitude in males
and females.
Lack of similarities between Gindhart ' s (1969) study and this study
are substantial but not difficult to explain. Gindhart is analyzing a
modern sample of healthy American children while Crow Creek represents a
prehistoric American Indian population. It is difficult to suggest that
57
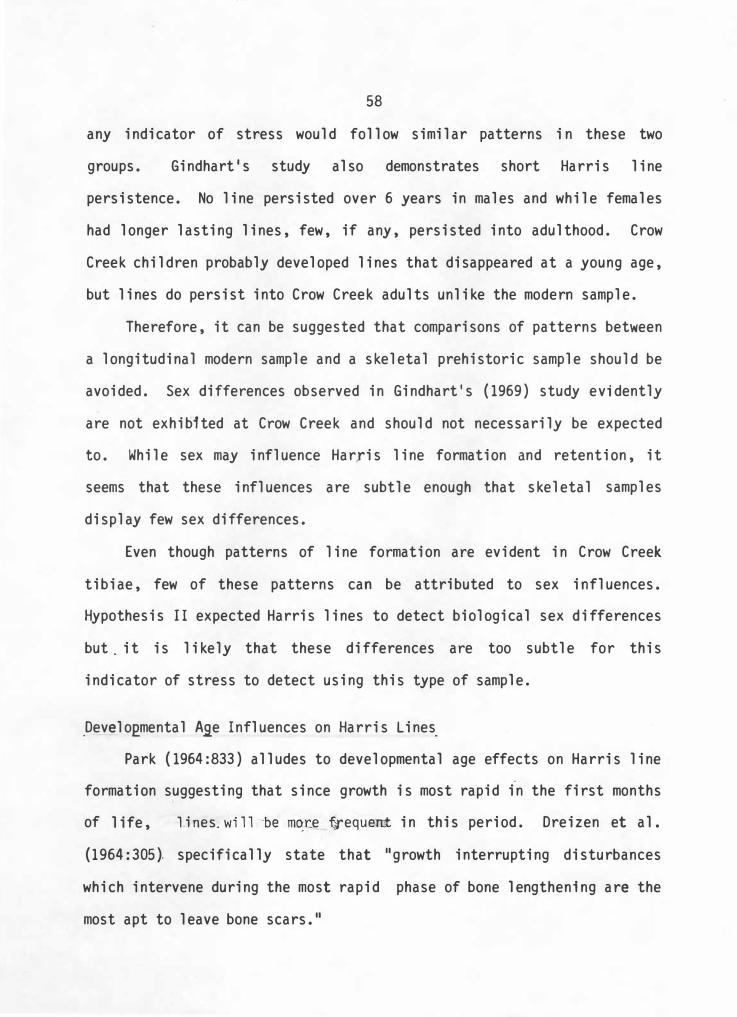
58
any indicator of stress would follow similar patterns in these two
groups. Gindhart ' s study also demonstrates short Harris line
persistence. No line persisted over 6 years in males and while females
had longer lasting lines, few, if any, persisted into adulthood. Crow
Creek children probably developed lines that disappeared at a young age,
but lines do persist into Crow Creek adults unlike the modern sample.
Therefore, it can be suggested that comparisons of patterns between
a longitudinal modern sample and a skeletal prehistoric sample should be
avoided. Sex differences observed in Gindhart ' s (1969) study evi dently
are not exhibited at Crow Creek and should not necessarily be expected
to. While sex may influence Harris 1 ine formation and retention, it
seems that these influences are subtle enough that skeletal samples
display few sex differences.
Even though patterns of 1 ine formation are evident in Crow Creek
tibiae, few of these patterns can be attributed to sex influences.
Hypothesis I I expected Harris lines to detect biological sex differences
but . it is likely that these differences are too subtle for this
indicator of stress to detect using this type of sample.
Developmental Age Influences on Harris Lines
Park (1964:833) alludes to developmental age effects on Harris line
formation suggesting that since growth is most rapid in the first months
of 1 ife, 1 ines. wi l l -be m�r:e frequent in this period. Dreizen et al.
(1964: 305). specifically state that "growth interrupting disturbances
which intervene during the most rapid phase of bone lengtheni ng are the
most apt to leave bone scars. "
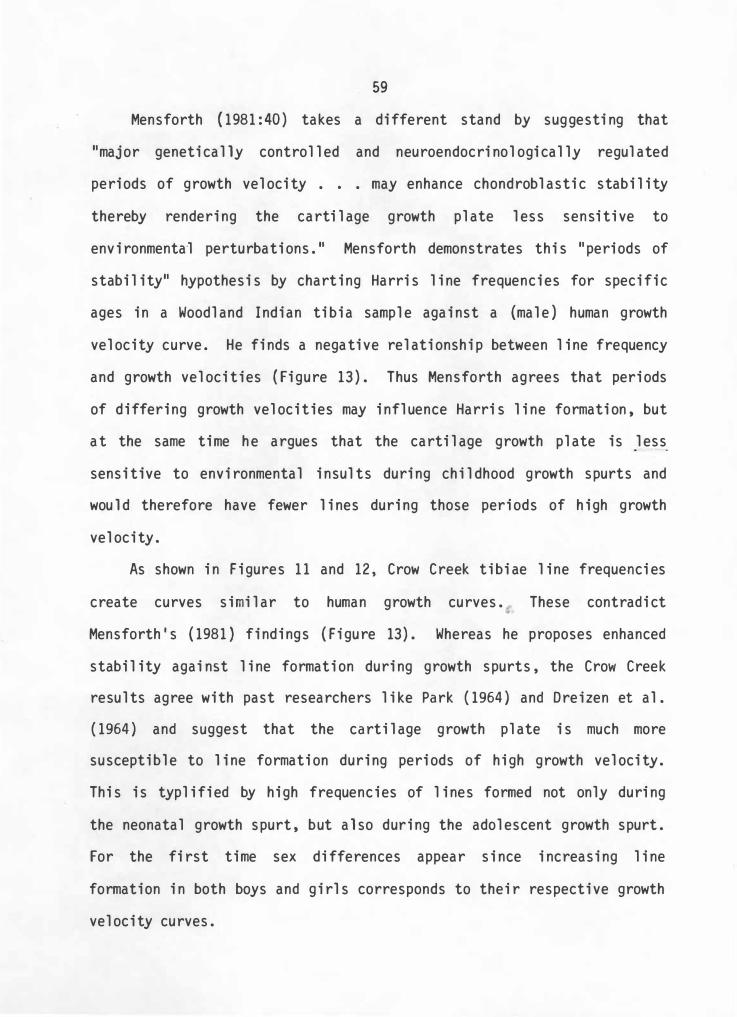
59
Mensforth ( 1981 : 40) takes a different stand by suggesti ng that
"major genetically controlled and neuroendocri nologically regulated
periods of growth velocity . • . may enhance chondroblasti c stab ility
thereby rendering the carti lage growth plate less sensitive to
environmenta·l perturbations." Mensforth demonstrates thi s "periods of
stability" hypothesi s by charting Harri s line frequencies for speci fic
ages in a Woodland Indian ti b ia sample against a (male ) human growth
velocity curve. He finds a negative relati onshi p between line frequency
and growth veloci ties (Figure 13). Thus Mensforth agrees that periods
of differing growth velocities may influence Harri s li ne formati on , but
at the same ti me he argues that the cartilage growth plate is less
sensi tive to environmental insults during childhood growth spurts and
wou 1 d therefore have fewer 1 i nes during those periods of high growth
velocity.
As shown i n F igures 11 and 12, Crow Creek tibi ae line frequenci es
create curves similar to human growth curves. These contradi ct
Mensforth ' s (1981 ) f indings (F igure 13). Whereas he proposes enhanced
stability against line formati on during growth spurts, the Crow Creek
results agree with past researchers like Park ( 1964 ) and Dreizen et al.
( 1964 ) and suggest that the cartilage growth plate i s much more
suscepti ble to 1 i ne formati on during periods of high growth velocity.
Thi s is typlified by high frequencies of l ines formed not only duri ng
the neonatal growth spurt , but also dur ing the adolescent growth spurt.
For the fi rst ti me sex differences appear si nce i ncreasing li ne
formation i n both boys and girls corresponds to their respective growth
velocity curves.
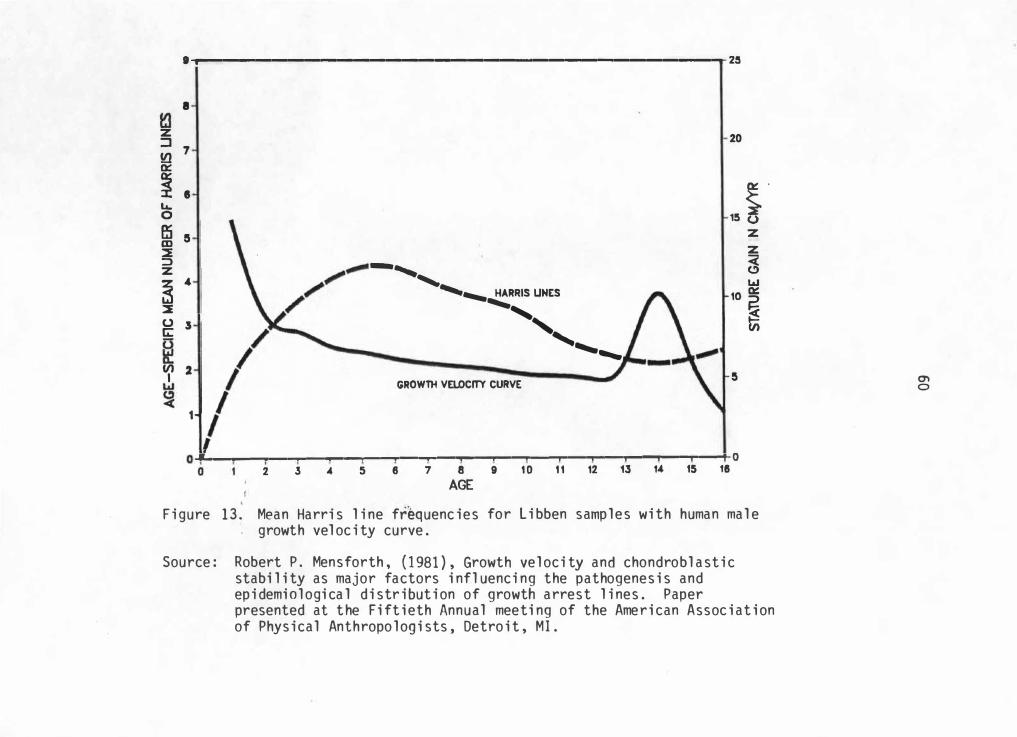
, ..... --------------------------------..- 2�
I
z
::J 7 Ill 0::
i I
L&. 0 ffi 5 m
� ::, z
� "
�
11 0 I Ci:
V) 2 I
1
-............. __ HARRIS LINES � ...... ......,
', , ............
GROWTH VEl.DCfTY CURVE
20
r 15 O
z
z
� La.I 0::: 10 �
�
5
..&----------,---....,....-�-..--.--,.,-�-,...-.....,.--,..,--t- O 2 3 -4 5 8 7 8 9 1 0 1 1 12 13 1-' 15 18
AGE
F i gure 1 3 . Mean Harri s l i ne frequenc i e s for L i bben samp l e s wi th human ma l e . growth vel oc i ty curve .
Source : Robert P . Men sforth , ( 1 981 ) , Growth ve l oc i ty and chondrob l a st i c stab i l i ty as major factors i nfl uenc i ng the pathogenes i s and ep i demi o l ogi ca l d i str i but i on of growth a rrest l i ne s . Paper presented at t he F i ft i eth Annua l meet i ng of the Amer i can Assoc i at i on of Phys i ca l Anthropo l og i sts , Detro i t , M I .
°' 0
61
Harris Lines As Indicators Of Stress
Hypothesis I simply states that Harris lines are non-specific
indicators of stress and are therefore likely to be of some
anthropological value for individual and population studies. While
Hypotheses rI and III were based on these assumptions, Hypothesis I can
be discussed in terms of the findings of these latter hypotheses.
Assuming tibiae sexing and aging of lines were performed accurately
for this sample, Harris lines appear to show little distinction between
sex while being heavily influenced by growth velocity . There is some
evidence that sex separation of line frequencies does occur (the
adolescent growth spurt) but this is dependent upon stringent age
controls. While the lack of demonstrable sex differences does little to
add to the credibility of Harris line analysis, it does not
substantially distract from its utility. Assuming Harris line formation
is related to growth velocity, the analysis and interpretive value of
this indicator of stress is reduced considerably . Certainly the lines
analyzed in this study are those that persisted into adulthood and are
likely remnants of childhood stresses . However, not only is the type
and severity of stress important to line formation and persistence, but
also the age at which this stress occurred. Or more precisely, it is
important to know at what point in the growth cycle the stress occurred
in order to allow stress marker comparison .
Undoubtedly, the dynamics of Harris line· analysis and
interpretation are complex. While many previous studies have questioned
the validity of Harris lines as non-specific indicators of stress, this
analysis suggests that line formation is heavily dependent upon
62
i ndi vi dua 1 growth ve 1 oci ty . Thus this analysis assumes that Harris
lines evident in adulthood are stress induced; it is the usefullness of
these lines to anthropological studies that is being questioned. This
analysis demonstrates that Harris line analysis, as it has been
approached in previous anthropological studies, has little value as a
stress indicator.
CHAPTER V II I
SUMMARY
This study has analyzed Harris lines of the adult distal tibiae of
Crow Creek Massacre victims. These lines are separated by bone side,
sex and age at the time of formation. Specific age at death for each
tibia is lacking.
About three-fourths of the total 122 tibiae exhibit at least one
radiopaque 1 ine with an average of 1. 34 1 ines occurring per element.
When assigning ages to each line, a range from -0. 5 to 18 years is
produced. The most conmen ages for these lines to appear in this sample
are in early adolescence and near the time of birth. While Harris lines
formation in modern longitudinal studies have revealed sex differences,
these differences are likely subtle in adults and are not statistically
significant in this sample. The only exception to this occurs when
tibiae are analyzed with age-specific Harris 1 ines. Here, frequencies
appear to peak at slightly different ages in adolescent boys and girls.
Growth velocity effects on Harris line formation are tested using sex
and age-specific line frequencies plotted against respective male and
female growth velocity curves. The similarities in growth curve shape
and male and female frequencies suggest that line formation is
accelerated during corrmon growth spurts and slowed during decreased
growth velocity years.
Assuming sex and age assessments perf�rmed for this study are
accurate, the reliability of Harris lines as non-specific indicators of
stress is strongly questioned. Certainly Harris lines cannot be
63
64
considered useless for all anthropological application due to the limits
of this study. However, if one assumes that Harris line formation is
dependent upon growth velocity, Harris line analysis, as i t has been
approached in previous anthropological studies, has little value as a
stress indicator.
REFERENCES
REFERENCES
Aarskog, D. and A. Hexeberg 1968 Actinomycin D and transverse lines of growing bones. Acta.
Paediatro Scand 57: 463-467.
Acheson, R. M. 1959 Effects of starvation, seplicaemia, and chronic illness on the
growth carilage plate and metaphysis of the immature rat. J. Anat. 93: 123-130.
Acheson, R. M. and M. N. MacIntyre 1958 The effects of acute infection and acute
skeletal development: A study of young rats. Path. 39 : 37-45.
Adams, C. 0.
starvation on Brit. J. Exp
1938 Effect of inorganic phosphorous on bone growth and repair. Proc . Soc. Exper. Biol. and Med. 38: 449-451.
Allison, Marvin J., Daniel Mendoza and Alejandro Pezzia 1974 A radiographic approach to childhood illness in Precolumbian
inhabitants in southern Peru. Amer. J. Phys. Anthrop. 40 : 409-416.
Asada, T. 1924 Uber die entstehung und pathologische bedeutung der im
rontgenbild des rohrenknochens am diaphysenende zum vorschein kommenden "parallelen querlinienbildung . " Mitt. Med. Fak. Univ. Kyushu Fukuoka 9:43-95.
Bass, Wi 1 1 i am M. 1971 Human Osteology: A Laboratory and Field Manual of the Human
Skeleton. Missouri Archaeologi cal Society, Columbia, MO.
Black, Thomas K. , I I I 1978 Sexual dimorphism in the tooth-crown diameter of the deciduous
teeth. Amer. J. Phys. Anthrop. 48:77-82.
Buikstra, J. E. 1981 The Koster Site: mortuary practices, paleodemography, and
paleopathology: a case study from the lower Illinois valley. In the Archaeology of Death. Ed. R. Chapman, I. Kinnes, K. Randsborg, Cambri dge Univ. Press, London, England.
Buil kstra, Jane E. and Dell a C. Cook 1980 Paleopathology: An American Account. Ann. Rev. Anthrop.
9 : 433-470.
66

67
Caffey, J. 1931 Clinical and experimental lead poisoning: some roentgenologic
and anatomic changes in growing bone. Radiol. 17: 957-983.
1937 Changes in the growing skeleton after the administration of bismuth. Amer. J . Dis. Child. 53:56-78.
Cook, D. C. 1979 Subsistence base and health in prehistoric Illinois Valley:
evidence from the human skeleton. Medical Anthrop. 3:109-123.
Cook, D. C. a�d J. E. Buikstra 1979 Health and differential survival in prehistoric populations:
prenatal dental defects. Amer. J . Phys. Anthrop. 51 :649-664.
Dreizer, S., C. Currie, E. J. Gilley and T. D. Spies 1956 Observations on the association between nutrtive failure,
ske 1 eta 1 ma tu ration rate and radi opaque transverse 1 ines in the distal end of the radius. Amer. J. Roentgen. 76:482-487.
Dreizen, Samuel, Charles N. Spirakis and Robert E. Stone 1964 The influence of age and nutritional status on "Bone Scar"
formation in the distal end of the growing radius. Amer. J . Phys. Anthrop. 22:295-306.
Dwight, Thomas 1905 The size of the articular surfaces of the long bones as
characteristics of sex: an anthropological study. Amer. J. of Anat. 4:19-31.
Eliot, M. M., S. P. Souther and E. A. Park � 1927 Transverse lines in x-ray plates of the long bones of children. Bull. Hopkins Hosp. 41:364-388.
Fazekas, I. Gy. and F. Kosa 1978 Forensic Fetal Osteol ogy. Akademiai Kiado, Budapest.
Follis, Richard Jr. and Edward A. Park 1952 Some observations on bone growth, with particular respect to
zones and transverse lines of increased density in the metaphysis. Amer. J. Roent. 68:709-724.
Garn, S. M., H. O. Hempy, I I I and P. M. Schwager 1968 Measurement of localized bone growth employing natural
markers. Amer. J. Phys. Anthrop. 28: 105-108.
Garn, Stanley M. and Patricia M. Schwager 1967 Age dynamics of persistent transverse lines in the tibia.
Amer. J . Phys. Anthrop. 27: 375-377.
68
Garn, S. M. , F. M. Silvennan, K. P. Hertzog and C. G. Rohmann 1968 Lines and bands of increased density. Medical Radiography and
Photography 44: 58-88.
Gelbke, H. 1951 The influences of pressure and tension on growing bone in
experiment with animals. J. Bone Joint Surg. 33A: 947.
Gies, Th 1877 Experimentelle untersuchungen uber den einfluss des arsensauf
den organismus. Arch. Exp Path. Pharmakol. 8:175-197.
Giles, Eugene 1964 Sex discrminant function analysis of the mandible. Amer. J.
Phys. Anthrop. 22: 129-135.
Giles, Eugene and 0. Elliot 1963 Sex determination by discriminant function analysis of crania.
Amer. J. Phys. Anthrop. 21: 53-68.
Gindhart, P. S. 1969 The frequency of appearance of transverse lines in the tibia
in relation to childhood illnesses. Amer. J. Phys. Anthrop. 3 1 : 17-22 .
Goff, C. W. 1960 Surgical Treatment of Unequal Extremities. Monograph in the
Bannerstone Division of American Lectures in Orthopaedic Surgery. Publication 418, Amer. Lecture Series. Charles C. Thomas, Springfield, IL. •
Green, W. T. and M. Anderson 1947 Experiences with epiphyseal arrest in correcting discrepancies
in length of the lower extremities in infantile paralysis. A method of predicting the effect. J. Bone Joint Surg . 29:659-675.
Grey , P • K . H • 1967 Radiography of ancient Egyptian murrmies. Med . Radiogr.
Photogr. 43: 34-44.
Greulich, W. W. and S. I. Pyle 1959 Radiographic Atlas of Skeletal Development of Hand and Wrist.
2nd ed. , Stanford Univ. Press. , Stanford, CA.
Hanihara, K. 1958 Sexual diagnosis of Japanese long bones by means of
discriminant function. J. Anthrop. Soc. Nippon. 66: 187-196.
69
Harris, H. A. 1926 The growth of the long bones in childhood, with special
reference to certain bony striations of the metaphysis and to the role of vitamins. Arch. Intern. Med. 38 : 785-806.
1931 Lines of arrested growth in the long bones in childhood. Correlation of histological and · radiographic appearances in clinical and experimental conditions. Brit. J. Radiol. 4: 561-588, 622-640.
1933 Bone growth in health and disease: the biological principles underlying the clinical, radiological and histological diagnosis of perversions of growth and disease in the skeleton. Oxford Univ. Press, London.
Higginson, J. 1954 Studies on human bone from South African Bantu subjects. I I:
Histopathological changes in the ribs of South African infants. Metabolism 3: 392-399.
Hinkle, C. L. 1943 Effect of roentgen rays upon growing long bones of albino
rats. I I. Histopathological changes involving endochondial growth conlers. Amer. J. Roent. and Rad. Therapy 49: 321-343.
Howe 1 1 s, W. W. 1970 Multivariate analysis of human crania. Preceedings VIIIth
International Congress of Anthropological and Ethnological Sciences, Tokyo and Kyoto.
Hunt, Edward E. · and James W. Hatch � 1981 The estimation of age at death and ages of formation of
transverse lines from measurements of human long bones. · Amer. J. Phys. Anthrop. 54:461-469.
I scan, M. Yasar and Patricia Miller-Shaivitz · 1983 Sexing the Black and White tibia. Paper presented to the 35th
annual meeting of the Amer. Acad. For. Sci. , Cincinnati, OH.
Jones, P. R. M. and R. F. A. Dean 1959 The effects of kwashiorkor on the development of the knee. J.
Trop. Pediat. 54: 176-184 .
Kelley, Marc H. 1979 Parturition and pelvic changes. Amer. J. Phys. Anthrop.
51: 541-546.
Kivett, M. F. and R. E. Jensen 1976 Archeological investigations at the Crow Creek Site (39BF1 1).
Nebraska State Historical Society Publications in Anthropology 7 , Li nco 1 n , NB.
70
Lee , M. M. C. 1 968 Natural markers in bone growth. Amer. J . Phys. Anthrop.
29 : 295-310.
Marshall , W. A. 1968 Problems in relating the presence of transverse lines in the
radius to the occurrence of disease. In : The Skeletal Biology of Earlier Human Populations. D. R. Brothwell , ed. , pp� 245-261 , Pergamon Press , NY.
Martin , R. and K . Saller 1957 Lehrbuch Der Anthropologie. Pp. 572-576 , Gustav Fischer
Verlag , Stultgart.
McCalTIJlon , R. W. 1 970 Human growth and development. Charles C. Thomas , Springfield,
IL.
Mccance, R. A. , E . M. Widdowson , and H. Lehmann 1942 The effect of protein intake on the absorption of calcium and
magnesium. Biochem. J . 36: 686-691.
McHenry , Henry 1968 Transverse lines in long bones of prehistoric California
Indians. Amer. J. Phys. Anthrop. 29:1-17.
McHenry , Henry and Peter D. Schulz 1976 The association between Harris lines and enamel hypoplasia in
prehistoric California Indians. Amer. J . Phys. Anthrop. 44:507-512.
Mensforth , Robert P. 1 981 Growth velocity and chondroblastic stability as major factors
influencing the pathogenesis and epidemiological distribution· of growth arrest lines. Paper presented to the American Associ ation of Physical Anthropologists Meetings, Detroit, MI.
Miller-Shaivitz , Patricia and M. Yasar lscan 1983 Sex determination from the circumference of tibia. Paper
presented to the 52nd annual Meeting of the Amer. Assoc. Phys. Anthrop. , Indianapolis , IN.
Nie , N. H. , C. H . Hull , J. G. Jenkins , K. Steinbrenner , and D. H. Bent 1975 Statistical package for the social sciences. McGraw-Hill , New
York, NY.
Owsley , Douglas W. ms Effects of disease and malnutrition on Arikara skeletal
development and mortality. Study funded by the National Science Foundation , Smithsonian Institution , Washi ngton , DC.

71
Pa rk , E . A . 1954 Bone growth i n health and d isease. Arch. D is. Chi ldren
29: 269-291.
1964 The i mprinting of nutri tional disturbances on the growing bone. Pediatrics 33: 815-862.
Park, E. A. , D. Jackson, C. T. Goodwin and L. Kajdi 1933 X-ray shadows in growing bones produced by lead; thei r
characteristics, cause, anatomical counterpart in bone and differentiation. J. Ped. 3: 265-298.
Park, E. A. and C. P. Richter 1953 Transverse lines in bone: the mechanism of the ir development.
Bull. Hopkins Hosp. 93: 234-248.
Pearson, Karl 1917- A study of the long bones of the English skeleton I: the
femur. Dept. of Applied Statistics, Universi ty of London, Universi ty College, Drapers ' Company Research Memoirs, Biometric Series X , Chapt. 1-4, London, England.
Pease, Charles N . 1952 Local stimulation of growth of long bones: a preliminary
report. J. Bone Joint Surg. 34A: 1-24.
Phemister, D . B. 1918 The effect of phosphorus on growing, normal and diseased
bones. Jour. Amer. Med. Assoc. 70: 1737-1743.
Phenice, Terrell W . 1969 A newly developed visual method of sexing os pubis. Amer. J.
Phys . Anthrop. 30: 297-302.
Platt, B . S . and R. J. C. Stewart 1962 Transverse trabeculae and osteoporosis in the bones in
experimental protein-calori e deficiency. Brit. J. Nutr. 16: 483-495.
Pons, J. 1955 The sexual diagnosis of i solated bones of the skeleton. Hum.
Biol. 27: 12-21.
Russin, L. A., H. E. Stadler and P. C. Jeans
SAS
1942 . Bi smuth lines of long bones i n relations to linear growth. J. Pediatrics 21: 21 1-213.
1979 SAS User's Guide. 1979 Edi tion. SAS Institute Inc., Cary, NC.
72
Shaivitz, Patricia M. and M. Yasar Iscan 1982 Sex differences in the tibia and femur: a discriminant
function approach. Paper presented to the 34th annual meeting of the Amer. Acad. For. Sci. , Orlando, FL.
Siegl ing, I. A. 1941 Growth epiphyses. J. Bone Joint Surg. 23: 23-36.
Sigstad, John S. and Joanita Kant Sigstad (eds. } 1973 Archaeological Field Notes of W. H. Over. Research Bulletin
Number 1, South Dakota State Archaeologist, Department of Education and Cultural Affairs, Vermillion, SD .
Si l v e nna n , F. N . 1950 Treatment of leukemia and allied disorders with folic acid
antagonists; effect of aminopterin or skeletal lesions. Radiology 54:665 .
Sontag, Lester Warren 1938 Evidences of disturbed prenatal and neonatal growth in bones
of infants aged one month. Amer . J. Dis. Child. 55: 1248-1255.
Sontag, L. and G. Comstock 1938 Striae in the bones of a set of monozygatic triplets. Am. J.
Dis. Child. 56: 301-308.
Sontag, L. W . and L. M. Harris 1938 Evidence of disturbed prenatal and neonatal growth in bones of
infants aged one month, I I. Contributing factors . Amer . J. Dis. Child. 56 : 1248-1255 .
Steele, D. Gentry 1976 The estimation of sex on the basis of the talus and caleaneus .
Amer. J. Phys . Anthrop . 45 : 581-588 .
Steinbock, R. Ted 1976 Paleopathological Diagnosis and Interpretation. Charles C .
Thomas, Springfield, I L.
Stewart, R. J. C. and B. S. Platt 1958 Arrested growth lines in the bones of pigs on low-protein
diets. Proc. Nutr. Soc . 17: V-V I .
Stewart, T. D. 1979 Essentials of Forensic Anthropology. Charles C. Thomas,
Springfield, IL.
Symes, Steven A. and Richard L. Jantz 1983 Discriminant function sexing of the tibia. Paper presented to
the 35th Annual Meeting of the Amer. Acad. For. Sci . , Cincinnati, OH.
73
Tanner , J. M. 1978 Foetus Into Man. Harvard Univ. Press , Cambridge , MA.
Thieme , F. P. 1957 Sex in the Negro skeleton. J. For. Med. 4: 72-81.
Trotter , Mildred and Goldine C. Gleser 1952 Estimation of stature based on measurements of stature taken
duti ng 1 i fe and of 1 ong bones after death. Amer. J. Phys. Anthrop. 10 : 463-514.
Vogt , E. C. 1932 Roentgenologic diagnosis of lead poisoning in infants and
children. J. Amer. Med. Assoc. 98 : 135-129.
Wegner , G. 1874 Uber das normale und pathologische wachsthum
rohrenknochen. Eine kritische untersuchung experimenteller und casiustischer grundlage. Arch. Anat. 61: 44-76.
We 1 1 s , Ca 1 vi n 1961 A new approach to ancient disease. Discovery 22 : 526-531.
der auf
Path.
1967 A new approach to paleopathology: Harris ' s lines. · In Disease in Antiquity. D. Brothwell and A. T. Sandison , eds. , Charles C. Thomas , Springfield , IL.
Willey , P. 1982 Osteology of Crow Creek Massacre. PhD Dissertation , Univ. of
Tenn. , Knoxville , TN.
Wi 1 1 i ams , Roger ms Post cranial metrics. Manuscript on file. Department of
Anthropology , Univ. of Tenn. , Knoxville , TN.
Wolbach , S. Burt 1947 Vitamin-A deficiency and excess in relation to skeletal
growth. J. Bone Joint Surg. 29 : 171-192.
Woodall , J. 1968 Growth arrest lives in long bones of the Casas Grandes
population. Plains Anthrop. 13 : 152-160.
VITA
Steven Al l en Symes was born i n Wes s i ngton Spri ngs , South Da kota on
Apri l 10 , 1954 . He attended el ementary school s i n that town and was
graduated from Wess i ngton Sp ri ngs H i gh School i n June 1972 . The
fol l owi ng September he entered The Un i vers i ty of South Da kota ,
Vermi l l i on , a�d i n June 1976 he rece i ved a Bachel or of Arts degree i n
Anth ropol ogy and H i story . From fa l l of 1976 to surmier of 1978 , he
worked as an archaeol ogi st ma i n ly for the South Da kota Archaeol ogi cal
Research Center .
I n fa l l of 1978 he entered the Graduate School of The Uni vers i ty of
Tennessee , Knoxvi l l e , and soon recei ved a Teach i ng As s i stantshi p for the
Depa rtment of Anthropol ogy and was p l aced i n cha rge of the th i n-secti on
l aboratory . He recei ved a Ma ster of Arts i n Anthropol ogy i n Augu st
1983 .