Harnessing Remote Sensing Derived Sea Level Rise Models ...
18
sustainability Article Harnessing Remote Sensing Derived Sea Level Rise Models to Assess Cultural Heritage Vulnerability: A Case Study from the Northwest Atlantic Ocean Meghan C. L. Howey 1,2 1 Department of Anthropology, University of New Hampshire, 73 Main Street, Durham, NH 03824, USA; [email protected] 2 Earth Systems Research Center, Institute for the Study of Earth, Oceans, and Space, University of New Hampshire, 8 College Road, Durham, NH 03824, USA Received: 20 October 2020; Accepted: 10 November 2020; Published: 12 November 2020 Abstract: Climate change threatens cultural heritage across the globe. Of its varied impacts, sea level rise is critically pressing because of the long relationship between humans and the ocean. Numerous cultural heritage sites lie on the world’s fragile coasts. Identifying cultural heritage sites at risk is an urgent need, but archaeological research programs do not always have the resources available to conduct large-scale cultural heritage vulnerability assessments. Given sea level rise poses myriad pressing issues, entities around the globe are developing sea level rise models for various management purposes (ecology, hydrology, real estate, etc.). These remote sensing-derived sea level rise models can be harnessed by archaeologists to assess cultural heritage site vulnerability. Here, such an analysis is realized for a northwest Atlantic Ocean coastal area experiencing relative sea level rise and with robust cultural heritage, including economically significant maritime heritage tourism. Combining archaeological and historic geospatial databases with LIDAR (Light Detection and Ranging)-derived relative sea level rise models illuminates coastal New Hampshire’s cultural heritage vulnerability. This is informative for risk monitoring, mitigation, and preservation planning, especially for cultural heritage tourism. The analysis also raises the need for discussions around what kind and whose heritage gets priority in planning for future sea level rise impacts. Keywords: sea level rise; cultural heritage; risk; remote sensing; archaeology; LIDAR; GIS 1. Introduction It is well established that modern forces such as development, war, looting, and tourism-induced damage make tangible cultural heritage highly vulnerable to change [1–13]. Today, climate change poses a growing area of threat to cultural heritage sites. Groups from government entities to international organizations to indigenous communities to scholars are ever more aware of the fact that climate change “is eroding and will continue to erode our historic fabric, disturbing and destroying many archaeological, traditional, and historic sites” [14]; see also [15–20]. The impacts of climate change are here to stay and will cause further long-term changes in the climate system [21,22]. Sea level rise is one critical effect of climate change and there is high confidence its associated impacts will persist for millennia [22]. Global sea level rise is caused primarily by added water from melting ice sheets and glaciers and the expansion of seawater as it warms. Global sea level rise has been monitored by satellites by NASA since 1993 [23,24]. These satellite altimetry data indicate the rate of global mean sea level rise (GMSLR) is 3.3 mm per year (Figure 1). Sustainability 2020, 12, 9429; doi:10.3390/su12229429 www.mdpi.com/journal/sustainability
-
Upload
khangminh22 -
Category
Documents
-
view
2 -
download
0
Transcript of Harnessing Remote Sensing Derived Sea Level Rise Models ...

sustainability
Article
Harnessing Remote Sensing Derived Sea Level RiseModels to Assess Cultural Heritage Vulnerability:A Case Study from the Northwest Atlantic Ocean
Meghan C. L. Howey 1,2
1 Department of Anthropology, University of New Hampshire, 73 Main Street, Durham, NH 03824, USA;[email protected]
2 Earth Systems Research Center, Institute for the Study of Earth, Oceans, and Space,University of New Hampshire, 8 College Road, Durham, NH 03824, USA
Received: 20 October 2020; Accepted: 10 November 2020; Published: 12 November 2020
Abstract: Climate change threatens cultural heritage across the globe. Of its varied impacts, sealevel rise is critically pressing because of the long relationship between humans and the ocean.Numerous cultural heritage sites lie on the world’s fragile coasts. Identifying cultural heritage sitesat risk is an urgent need, but archaeological research programs do not always have the resourcesavailable to conduct large-scale cultural heritage vulnerability assessments. Given sea level rise posesmyriad pressing issues, entities around the globe are developing sea level rise models for variousmanagement purposes (ecology, hydrology, real estate, etc.). These remote sensing-derived sea levelrise models can be harnessed by archaeologists to assess cultural heritage site vulnerability. Here,such an analysis is realized for a northwest Atlantic Ocean coastal area experiencing relative sealevel rise and with robust cultural heritage, including economically significant maritime heritagetourism. Combining archaeological and historic geospatial databases with LIDAR (Light Detectionand Ranging)-derived relative sea level rise models illuminates coastal New Hampshire’s culturalheritage vulnerability. This is informative for risk monitoring, mitigation, and preservation planning,especially for cultural heritage tourism. The analysis also raises the need for discussions around whatkind and whose heritage gets priority in planning for future sea level rise impacts.
Keywords: sea level rise; cultural heritage; risk; remote sensing; archaeology; LIDAR; GIS
1. Introduction
It is well established that modern forces such as development, war, looting, and tourism-induceddamage make tangible cultural heritage highly vulnerable to change [1–13]. Today, climate change posesa growing area of threat to cultural heritage sites. Groups from government entities to internationalorganizations to indigenous communities to scholars are ever more aware of the fact that climatechange “is eroding and will continue to erode our historic fabric, disturbing and destroying manyarchaeological, traditional, and historic sites” [14]; see also [15–20].
The impacts of climate change are here to stay and will cause further long-term changes in theclimate system [21,22]. Sea level rise is one critical effect of climate change and there is high confidenceits associated impacts will persist for millennia [22]. Global sea level rise is caused primarily by addedwater from melting ice sheets and glaciers and the expansion of seawater as it warms. Global sea levelrise has been monitored by satellites by NASA since 1993 [23,24]. These satellite altimetry data indicatethe rate of global mean sea level rise (GMSLR) is 3.3 mm per year (Figure 1).
Sustainability 2020, 12, 9429; doi:10.3390/su12229429 www.mdpi.com/journal/sustainability

Sustainability 2020, 12, 9429 2 of 18Sustainability 2020, 12, x FOR PEER REVIEW 2 of 18
Figure 1. Global mean sea level rise (GMSLR) as monitored by NASA satellites, indicating a rate of
change of 3.3 mm a year (credit: Goddard Space Flight Center, https://climate.nasa.gov/vital-
signs/sea-level/).
Sea level rise is particularly pressing for cultural heritage management and risk mitigation
because humans have had a long and intense relationship with the world’s oceans [25–32]. Humans
have been drawn to the sea and its resources for hundreds of thousands of years [33,34]. Today, there
is disproportionate anthropogenic pressure on the world’s marine coasts [35,36]. Ever-increasing
human population presence has undercut the resilience of coastal and ocean ecosystems in a variety
of ways, including overfishing, nutrient runoff, shoreline development, chemical pollution,
alterations of bottom conditions, and dangers caused by atmospheric accumulation of CO2 emissions,
catastrophic weather events, global warming and ocean acidification [37,38]. Today, global coastal
and ocean conditions are characterized as depleted, degraded, and distressed [39–41].
The consequent reduction in ecosystem services has profound impacts on the human
populations reliant on coastal resources [37,38,42–46]. While the distressed state of the ocean is widely
discussed as an ecological crisis, it also concurrently presents notable risk for decreasing cultural
services, including, of focus here, cultural heritage. Numerous and iconic cultural heritage sites across
the world lie on fragile coasts [25,32]. Global modeling has found that over the next two millennia,
up to 19% of UNESCO World Heritage sites will become submerged by rising sea level and storm
surges [47].
Problem Statement
Identifying cultural heritage sites that are vulnerable in the face of sea level rise is an urgent
need. While archaeologists have increasingly recognized this need, archaeological research programs
do not always have the resources available to conduct large-scale cultural heritage risk assessments.
Archaeologists need to find accessible and affordable ways of conducting cultural heritage risk
assessments. One solution emerges from the fact that many entities, from local and regional
municipalities to national governments to global environmental nonprofits, are developing
spatialized sea level rise models for various management purposes (ecology, hydrology, real estate,
insurance, zoning, economy, etc.). Available geospatial maps of projected sea level rise coastal
flooding, even if not created for archaeological purposes, can be productively and creatively
harnessed by archaeologists for the benefit of assessing the vulnerability of cultural heritage sites.
Here, such analysis is realized for a coastal area of the northwest Atlantic Ocean that has rich
cultural heritage sites and that is experiencing many of the effects of climate change seen globally,
including sea level rise [48–50]. Orienting from the water, coastal New Hampshire is located in the
northwest Atlantic Ocean (Figure 2). In addition to experiencing impacts from climate change today,
coastal New Hampshire has a rich history of human occupation and so hosts a rich landscape of
Figure 1. Global mean sea level rise (GMSLR) as monitored by NASA satellites, indicating a rate ofchange of 3.3 mm a year (credit: Goddard Space Flight Center, https://climate.nasa.gov/vital-signs/sea-level/).
Sea level rise is particularly pressing for cultural heritage management and risk mitigation becausehumans have had a long and intense relationship with the world’s oceans [25–32]. Humans havebeen drawn to the sea and its resources for hundreds of thousands of years [33,34]. Today, there isdisproportionate anthropogenic pressure on the world’s marine coasts [35,36]. Ever-increasing humanpopulation presence has undercut the resilience of coastal and ocean ecosystems in a variety of ways,including overfishing, nutrient runoff, shoreline development, chemical pollution, alterations of bottomconditions, and dangers caused by atmospheric accumulation of CO2 emissions, catastrophic weatherevents, global warming and ocean acidification [37,38]. Today, global coastal and ocean conditions arecharacterized as depleted, degraded, and distressed [39–41].
The consequent reduction in ecosystem services has profound impacts on the human populationsreliant on coastal resources [37,38,42–46]. While the distressed state of the ocean is widely discussed asan ecological crisis, it also concurrently presents notable risk for decreasing cultural services, including,of focus here, cultural heritage. Numerous and iconic cultural heritage sites across the world lie onfragile coasts [25,32]. Global modeling has found that over the next two millennia, up to 19% ofUNESCO World Heritage sites will become submerged by rising sea level and storm surges [47].
Problem Statement
Identifying cultural heritage sites that are vulnerable in the face of sea level rise is an urgentneed. While archaeologists have increasingly recognized this need, archaeological research programsdo not always have the resources available to conduct large-scale cultural heritage risk assessments.Archaeologists need to find accessible and affordable ways of conducting cultural heritage riskassessments. One solution emerges from the fact that many entities, from local and regionalmunicipalities to national governments to global environmental nonprofits, are developing spatializedsea level rise models for various management purposes (ecology, hydrology, real estate, insurance,zoning, economy, etc.). Available geospatial maps of projected sea level rise coastal flooding, even if notcreated for archaeological purposes, can be productively and creatively harnessed by archaeologistsfor the benefit of assessing the vulnerability of cultural heritage sites.
Here, such analysis is realized for a coastal area of the northwest Atlantic Ocean that has rich culturalheritage sites and that is experiencing many of the effects of climate change seen globally, includingsea level rise [48–50]. Orienting from the water, coastal New Hampshire is located in the northwestAtlantic Ocean (Figure 2). In addition to experiencing impacts from climate change today, coastal New

Sustainability 2020, 12, 9429 3 of 18
Hampshire has a rich history of human occupation and so hosts a rich landscape of cultural heritagesites that includes both indigenous precontact sites and post-contact historic sites. The region also has aneconomically significant maritime heritage tourism industry based around several of its Euro-Americanhistoric cultural heritage sites. By combining archaeological and historic site geodatabases with LIDAR(Light Detection and Ranging)-derived coastal flooding projection datasets made for six differentrelative sea level rise scenarios, the range of vulnerability of coastal New Hampshire’s cultural heritageresources is illuminated. Tethering between macro-global understandings of the challenges presentedby sea level rise, this kind of regional-scale remote sensing-based vulnerability assessment and localsite-based preservation action plans offers a productive approach to cultural heritage resource riskmonitoring and mitigation.
Sustainability 2020, 12, x FOR PEER REVIEW 3 of 18
cultural heritage sites that includes both indigenous precontact sites and post-contact historic sites.
The region also has an economically significant maritime heritage tourism industry based around
several of its Euro-American historic cultural heritage sites. By combining archaeological and historic
site geodatabases with LIDAR (Light Detection and Ranging)-derived coastal flooding projection
datasets made for six different relative sea level rise scenarios, the range of vulnerability of coastal
New Hampshire’s cultural heritage resources is illuminated. Tethering between macro-global
understandings of the challenges presented by sea level rise, this kind of regional-scale remote
sensing-based vulnerability assessment and local site-based preservation action plans offers a
productive approach to cultural heritage resource risk monitoring and mitigation.
Figure 2. Locator map of coastal New Hampshire in the Northwest Atlantic Ocean (base data from
ESRI).
2. Materials and Methods
2.1. Study Area
Looking east each day to the Atlantic Ocean for thousands of years, indigenous peoples knew
their home (and many continue to know it today) as ndakinna—“our land,” the place “to which we
belong.” Long before colonists came and re-inscribed it as “New England,” this place was called
Wabanaki or Wôpanâak. It is characterized by interlocking ecosystems produced as the ocean and the
land meet at the coast. Freshwater from streams and rivers mingles with the ocean in large coastal
bays and sprawling estuaries, and forests extend inland along the waterways. The East is the land
where the sun is born in a startling array of light every day as it rises over the Atlantic Ocean [51]
(Figure 3).
Figure 2. Locator map of coastal New Hampshire in the Northwest Atlantic Ocean (base data fromESRI).
2. Materials and Methods
2.1. Study Area
Looking east each day to the Atlantic Ocean for thousands of years, indigenous peoples knewtheir home (and many continue to know it today) as ndakinna—“our land”, the place “to which webelong”. Long before colonists came and re-inscribed it as “New England”, this place was calledWabanaki or Wôpanâak. It is characterized by interlocking ecosystems produced as the ocean and theland meet at the coast. Freshwater from streams and rivers mingles with the ocean in large coastal baysand sprawling estuaries, and forests extend inland along the waterways. The East is the land wherethe sun is born in a startling array of light every day as it rises over the Atlantic Ocean [51] (Figure 3).

Sustainability 2020, 12, 9429 4 of 18
Sustainability 2020, 12, x FOR PEER REVIEW 4 of 18
Figure 3. The rising sun over the northwest Atlantic Ocean in Ndakinaa, the land of the dawn, at Star
Island in the Isle of Shoals, off the coast of New Hampshire (photographed by Paul and Denise
Pouliot, the speakers of the Cowasuck Band of the Pennacook Abenaki People, used with permission).
There are a few Paleo-Indian finds in coastal New Hampshire, but the first occupation sites date
to the Archaic period (ca. 8000–1000 BC). Archaeological evidence indicates a marine adaptation
among indigenous communities was well developed here by the Middle Archaic period (ca. 6000–
3000 BC), continued in the Late Archaic period (ca. 3000 BC–1000 BC), and lasted throughout the
Woodland period (ca. 1000 BC to European Contact ca. 1500–1600 AD) [52–54]. Faunal remains from
precontact archaeological sites demonstrate that indigenous populations used a diverse mix of
marine species (mammal, seabird, fish, and shellfish) throughout all seasons [55]; see also
[52,54,56,57]. Reciprocal networks and cyclical seasonal movements between coastal and interior
ecosystems functioned to sustain the diversity of the environment and the survival of its many
inhabitants before Europeans arrived [58–60].
The marine resources of the northwest Atlantic Ocean were a chief attraction for early European
explorers [33,61,62]. Fisheries were established in Newfoundland as early as the early 1500s. A
century later, New England explorers described enormous “shoals” of monstrous cod as big as men
off the shores of New England and marveled at how much bigger, more plentiful, and closer to shore
they were than in Newfoundland. The first Europeans in coastal New Hampshire were fishermen
participating in the expanding commercial fishery, settling permanently on the Isle of Shoals in the
early 1600s [63]. By the 1620s, British settlers moved onto the region’s coast, establishing colonial
farming and fishing villages. Colonial exploitation of natural resources quickly transcended
subsistence-based levels and dried fish, saltmarsh hay, furs, and, above all, lumber, processed in saw-
mills for use in ship-building, became key export commodities for the larger West Indies trade [64,65].
Over the course of the 1600s and early 1700s, coastal New Hampshire was part of the British
colony, but its geographic position left it in a frontier zone between French Quebec and English
Boston [66]. The French and British each made alliances and treaties with Native American groups
as they battled for control of the region. Indigenous communities were powerful entities in these
frontier settings. Many early British colonial settlers lived in garrisons (fortified houses) to protect
themselves from attacks by French and indigenous groups [67]. Despite indigenous attempts to
remove them and the tensions of the period, British settler colonialists stayed because they continued
to prosper off of their commodification of the region’s rich natural resources.
Figure 3. The rising sun over the northwest Atlantic Ocean in Ndakinaa, the land of the dawn, at StarIsland in the Isle of Shoals, off the coast of New Hampshire (photographed by Paul and Denise Pouliot,the speakers of the Cowasuck Band of the Pennacook Abenaki People, used with permission).
There are a few Paleo-Indian finds in coastal New Hampshire, but the first occupation sites date tothe Archaic period (ca. 8000–1000 BC). Archaeological evidence indicates a marine adaptation amongindigenous communities was well developed here by the Middle Archaic period (ca. 6000–3000 BC),continued in the Late Archaic period (ca. 3000 BC–1000 BC), and lasted throughout the Woodland period(ca. 1000 BC to European Contact ca. 1500–1600 AD) [52–54]. Faunal remains from precontact archaeologicalsites demonstrate that indigenous populations used a diverse mix of marine species (mammal, seabird,fish, and shellfish) throughout all seasons [55]; see also [52,54,56,57]. Reciprocal networks and cyclicalseasonal movements between coastal and interior ecosystems functioned to sustain the diversity of theenvironment and the survival of its many inhabitants before Europeans arrived [58–60].
The marine resources of the northwest Atlantic Ocean were a chief attraction for early Europeanexplorers [33,61,62]. Fisheries were established in Newfoundland as early as the early 1500s. A centurylater, New England explorers described enormous “shoals” of monstrous cod as big as men off theshores of New England and marveled at how much bigger, more plentiful, and closer to shore they werethan in Newfoundland. The first Europeans in coastal New Hampshire were fishermen participatingin the expanding commercial fishery, settling permanently on the Isle of Shoals in the early 1600s [63].By the 1620s, British settlers moved onto the region’s coast, establishing colonial farming and fishingvillages. Colonial exploitation of natural resources quickly transcended subsistence-based levels anddried fish, saltmarsh hay, furs, and, above all, lumber, processed in saw-mills for use in ship-building,became key export commodities for the larger West Indies trade [64,65].
Over the course of the 1600s and early 1700s, coastal New Hampshire was part of the British colony,but its geographic position left it in a frontier zone between French Quebec and English Boston [66].The French and British each made alliances and treaties with Native American groups as they battledfor control of the region. Indigenous communities were powerful entities in these frontier settings.Many early British colonial settlers lived in garrisons (fortified houses) to protect themselves fromattacks by French and indigenous groups [67]. Despite indigenous attempts to remove them and thetensions of the period, British settler colonialists stayed because they continued to prosper off of theircommodification of the region’s rich natural resources.
By the time of the American Revolution in the late 1700s, it was clear many fish species were nolonger abundant in the area’s rivers. The forests could not keep pace with the lumber industry [68].

Sustainability 2020, 12, 9429 5 of 18
By the early 1800s, the lumber industry in coastal New Hampshire had all but collapsed. During the1800s, now-Americans living on the seacoast had to look for other economic opportunities beyondthe natural resource base. Manufacturing rose in importance, including paper mills and cottonfactories [69]. When the Boston and Maine railroad came to New Hampshire in 1835, it became thechoice means of shipping manufactured goods from the region to commercial hubs and the region’swaterways, once central to the economy, instead became a dumping ground for manufacturing’ssewage and industrial waste.
Over the course of the 1800s, people left coastal New Hampshire in the face of economic decline.They left a landscape littered with the contaminated residue of human development but also whatwould come to be seen as a rich suite of maritime cultural heritage remnants. After the decline ofthe lumber industry, the area’s forests experienced second-growth reforestation. In the late 1800sand early 1900s, New Englanders living in more urban areas such as Boston began to increasinglyromanticize the sea and seek out coasts for respite and recreation [70]. This was a global trend duringthis time, where, “under the tourist gaze, coasts became regarded as places where human life wassimple and picturesque, turning them into places of heritage and generating new forms of income,i.e., tourism” [71]. Coastal New Hampshire with its increasingly “natural” feel from forest regrowthand its “historic” maritime charm in the remnant buildings from the previous centuries, began seeingsuch coastal tourism and this trend continued throughout the 1900s.
Today, tourism remains a key factor behind strong demographic, social, and economic growthin coastal New Hampshire and the region’s remnant historic heritage sites and maritime culturallandscapes are significant tourist draws. While Rockingham and Strafford counties, New Hampshire’stwo coastal counties, are only two of 10 counties in the state, they contributed 37.5% of the totalstate meals and room tax revenue in fiscal year 2014, accounting for $104.7 million [48]. Of course,COVID-19 has impacted tourism and economics in coastal New Hampshire this year (as across theglobe). However, the City of Portsmouth, the major hub of coastal New Hampshire’s tourist industry,has shown more resilience than other parts of the state, suggesting the continued economic importanceof maritime cultural tourism here [72] (Figure 2).
2.2. LIDAR-Derived Relative Sea Level Rise Flooding Extent Maps
In any given coastal area, sea level rise, while influenced by global patterns, is also subject toprocesses operating on more regional scales and localized phenomena [21,50,73]. Relative sea levelrise is measured by tidal gauges and so accounts for changes resulting from vertical motion of both theland and the sea surface [21]. In New Hampshire, tidal gauge data collected in Portsmouth Harborover decades show relative sea level is rising and as it does, the region is experiencing increased coastalflooding that is only expected to increase in frequency and severity in the future, is experiencing moreextreme precipitation events, is ever more subject to damaging storm surges and astronomical tides,and is likely to experience coastal land submersions within the next 50 to 100 years [50].
In New Hampshire, a private–public partnership called Carbon Solutions New England,working with the National Ocean and Atmospheric Administration (NOAA), has developed regionalmodels of a range of climate change impacts (snow cover, mean temperature, precipitation, etc.).The aim of systematic assessments of climate change impacts by this collaborative group is to aidthe development of municipal and regional climate adaptation plans in the New Hampshire coastalwatershed [49]. Sea level rise is one of the critical climate change impacts focused on in these efforts.Carbon Solutions New England used projections of global eustatic sea level rise and combined themwith regional tidal gauge sea level rise data. They conducted a statistical analysis of available tidalgauge data to create a 100-year coastal still-water elevation (the elevation of the water surface that doesnot account for waves and run-up) [49]. Next, to this estimated still-water flood elevation they addedthe elevation of mean higher high water (MHHW) to create a coastal flooding scenario that occurs atthe highest daily tide, which offers a benchmark of flooding from storm surges. The IntergovernmentalPanel on Climate Change (IPCC) makes comprehensive reports about the state of scientific knowledge

Sustainability 2020, 12, 9429 6 of 18
on climate change for guidance purposes across the globe [22]. In many places, stakeholders andresearchers use IPCC reports to inform their work on the impacts of climate change, including sealevel rise. Accordingly, Carbon Solutions New England used two IPCC global emissions scenarios,a high and an intermediate emissions scenario. For both the intermediate and high emissions scenarios,Carbon Solutions New England estimated what the 100-year still water and storm surge flood heightwould be at mid-century (2050) and the end of the century (2100). Together, they then modeled six sealevel rise scenarios:
• High Emissions Scenario 2050• High Emissions Scenario 2050 Storm Surges• Intermediate Emissions Scenario 2100• Intermediate Emissions Scenario 2100 Storm Surges• High Emissions Scenario 2100• High Emissions Scenario 2100 Storm Surges
While Carbon Solutions New England could create scenario projections, they could not spatializethese sea level rise projections for the region and make actual coastal flooding extent maps until theygained access to high-resolution topographic data. Such topographic data were necessary becausethe likelihood of an area flooding depends on its topographic positioning and elevational properties.The requisite high-resolution topographic data became available in spring of 2011 when detailedairborne LIDAR (Light Detection and Ranging) topographic data were collected over coastal NewHampshire [49]. The output LIDAR Digital Elevation Model (DEM) was 2 m resolution with abare-earth vertical accuracy of 15.0 cm or better [73]. With the availability of high-resolution remotelysensed topographic data, Carbon Solutions New England was able to generate spatialized datasets ofthe areas that are prone to flooding and water-over-land submersion in each of the six sea level risescenarios on the New Hampshire seacoast. The output was six rasters (10 × 10 m resolution) reflectingthe extent of coastal flooding in each of the six sea level rise scenarios. In each raster, every grid cell hasa value field reporting the estimated water inundation depth (in feet) [49]. The six sea level rise rastergrids are available and were downloaded for this project as a geodatabase (.gdb) from NH GRANIT,New Hampshire’s statewide GIS clearinghouse.
As noted above, these LIDAR-derived relative sea level rise coastal flooding extent geospatialdatasets were created for government climate adaptation plans [49]. These high-resolution regionalgeospatial sea level rise models were not created for cultural heritage vulnerability assessment.However, it became apparent that these sea level rise flooding maps offered an opportunity to examinethe risk cultural heritage faces in terms of sea level rise in coastal New Hampshire. Of note, this analysiswas started in an effort to raise awareness of this issue for state and regional stakeholders who maynot have considered cultural heritage in their adaptation planning and a public policy brief wasdisseminated [74]. Given the many pressing concerns over sea level rise around the globe, such datasetsare increasingly available. Archaeologists can, as has been done here, harness these data at no to lowcost and repurpose them to conduct cultural heritage vulnerability assessments.
2.3. Methodology
2.3.1. Cultural Heritage Vulnerability Assessment
As indicated above, coastal flooding extent maps for six relative sea level rise (SLR) scenarioswere created for non-archaeological purposes for coastal New Hampshire based on high-resolutionairborne LIDAR data that indicate which areas are prone to flooding and water-over-land submersion.While created for other purposes, these geospatial datasets were repurposed for an assessment of theregion’s cultural heritage vulnerability to sea level rise. To start the cultural heritage vulnerabilityanalysis, a geodatabase of 383 known precontact and historic period sites for New Hampshire’stwo coastal counties, Strafford and Rockingham, was acquired from the State of New Hampshire’s

Sustainability 2020, 12, 9429 7 of 18
Division of Historic Resources. This geodatabase was transformed so as to align with the sea levelrise (SLR) coastal flooding extent rasters. Known archaeological sites were overlaid on each of thesix sea level rise (SLR) scenario rasters for coastal New Hampshire (High Emissions Scenario 2050;High Emissions Scenario with Storm Surge 2050; Intermediate Emissions Scenario 2100; IntermediateEmissions Scenario with Storm Surge 2100; High Emissions Scenario 2100; High Emissions Scenariowith Storm Surge 2100). Again, each of the six SLR scenario rasters (10 × 10 m resolution) has a valuefield reporting the estimated inundation depth across the grid (in feet) [49]. For each of the six SLRscenarios, the value of the estimated inundation depth was extracted for each archaeological site (allwork done in ArcGIS 10.3 and 10.8). Sites were then sorted by this value for each of the six SLR risescenarios. This allowed for the identification of the range of vulnerability of heritage sites to damageand/or destruction by sea level rise.
Working with the known archaeological geospatial site database, an evaluation of whetherprecontact and historic sites stand to experience differential impacts from sea level rise was conducted.To conduct this evaluation, a dominant cultural heritage era designation was assigned for each site.While there are sites that have both precontact and historic components in the region, in most cases,one of these occupation eras dominates the site (and/or heritage conceptions and valuations of thesite). For instance, Strawbery Banke has precontact components, but is dominated by its historicera cultural heritage, and this is what is packaged and consumed as a maritime heritage tourist sitetoday [73]. Likewise, Seabrook archaeological sites include historic components, but Seabrook is mostknown as a suite of critically significant precontact indigenous sites in the region [54]. Sites where adominant era designation could not be determined were excluded from this specific analysis (sevensites). With assigned dominant time period designations, the number of precontact and historic siteswith water inundation in each SLR scenario was computed and the results were compared.
2.3.2. Historic Graveyard Assessment
Historic graveyards are a common, and iconic, feature of cultural heritage landscapes across NewEngland [75]. The archaeological geospatial site database of known precontact and historic heritagesites does not include historic cemeteries (known precontact burial sites are included). These are animportant aspect of the region’s cultural heritage and historic graveyard vulnerability to sea level riseis important to assess. Indeed, burial sites may demand the most imminent attention in any adaptationand mitigation planning done by local, state, and/or federal entities.
In New Hampshire, the New Hampshire Old Graveyards Association is an organization dedicatedto preserving the historical graveyards of New Hampshire [76]. As part of this, they work on mappingthe location of historic graveyards. In 2000, 20 years ago, the locational data available at that time weretranslated into a digital spatial database. The data in this data layer were “performed on the basis ofdata submitted by individual communities, and thus the quality and completeness of the record willvary considerably across the state” [77]. These data can be accessed from NH GRANIT by requestand subject to approval (and cannot be shared). While recognizing these available graveyard data aresomewhat dated and form what might be considered “fuzzy” data, it was still important to find a wayto include them when considering cultural heritage vulnerability for coastal New Hampshire.
Working with the provided data layer, all graveyards in Rockingham and Strafford counties wereextracted (again, New Hampshire’s two coastal counties). Given this cemetery database has a levelof locational uncertainty (as described), to address its “fuzzy” nature, a 100 m buffer was computedaround cemetery point data. Working with the “worst-case” sea level rise scenario, High EmissionsScenario with Storm Surge 2100, sea level rise inundation values were extracted for each of thesepolygons (the buffers around historic graveyards).
3. Results
Figure 4 presents the coastal flooding extent (water inundation) for each of Carbon Solution NewEngland’s six sea level rise scenarios. On top of these coastal flooding maps are the known cultural

Sustainability 2020, 12, 9429 8 of 18
heritage sites from New Hampshire’s two coastal counties (Strafford and Rockingham). This figurehelps illustrate the results of the cultural heritage vulnerability assessment. It shows how in each ofthe six sea level rise scenarios, known cultural heritage sites in New Hampshire’s two coastal counties,Strafford and Rockingham, will be impacted by coastal flooding from sea level rise and associatedstorm surges and that some scenarios will impact more sites overall.
Sustainability 2020, 12, x FOR PEER REVIEW 8 of 18
helps illustrate the results of the cultural heritage vulnerability assessment. It shows how in each of
the six sea level rise scenarios, known cultural heritage sites in New Hampshire’s two coastal
counties, Strafford and Rockingham, will be impacted by coastal flooding from sea level rise and
associated storm surges and that some scenarios will impact more sites overall.
Figure 4. The six sea level rise coastal flooding rasters presented at full extent of water inundation
with the geodatabase of known cultural heritage sites (historic and precontact) in New Hampshire’s
two coastal counties (Strafford and Rockingham). Water inundation values were extracted for known
sites from each raster to identify how many and which sites stand to be damaged and/or destroyed
in each of the six SLR (sea level rise) scenarios. (SLR data from NH GRANIT; archaeological site data
from the New Hampshire Division of Historical Resources; not publicly available data due to site
sensitivity).
Figure 4. The six sea level rise coastal flooding rasters presented at full extent of water inundation withthe geodatabase of known cultural heritage sites (historic and precontact) in New Hampshire’s twocoastal counties (Strafford and Rockingham). Water inundation values were extracted for known sitesfrom each raster to identify how many and which sites stand to be damaged and/or destroyed in eachof the six SLR (sea level rise) scenarios. (SLR data from NH GRANIT; archaeological site data from theNew Hampshire Division of Historical Resources; not publicly available data due to site sensitivity).
Again, the water inundation value was extracted for each known cultural heritage site in eachscenario. As is reflected in Figure 4, the lowest impact sea level rise scenario, High Emissions Scenario2050, is projected to create the least extent of coastal flooding and thus damages the least number of
Sustainability 2020, 12, 9429 9 of 18
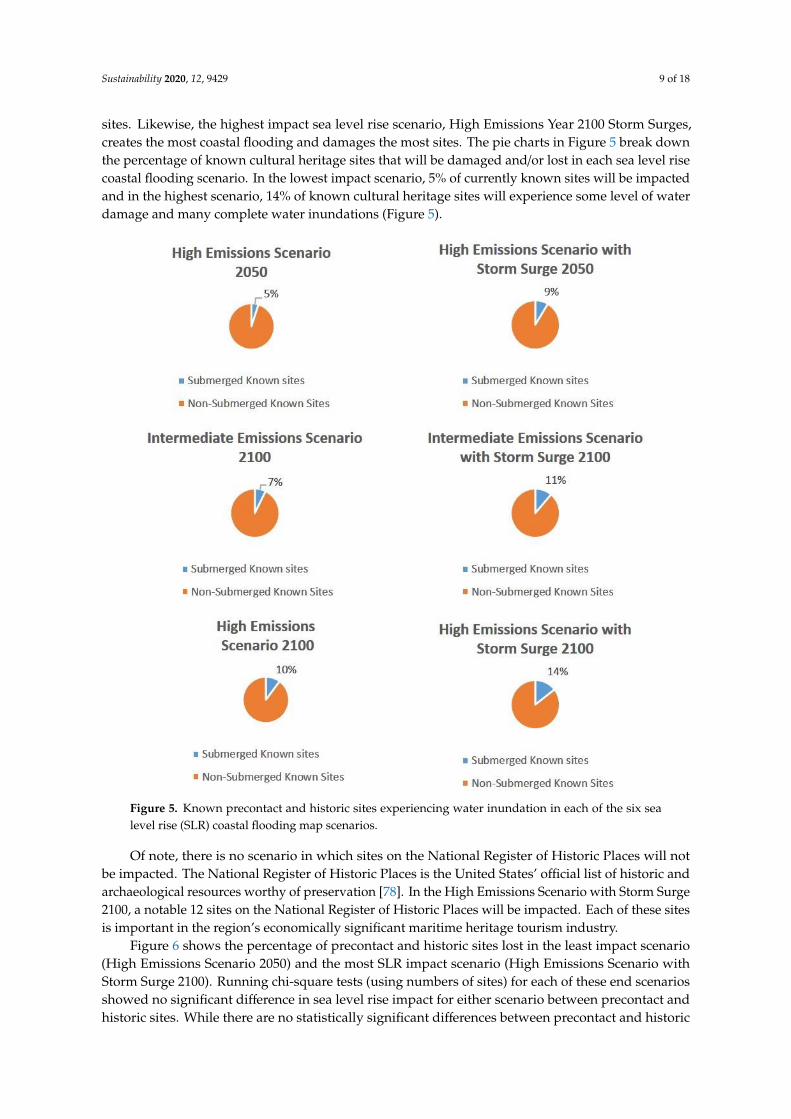
sites. Likewise, the highest impact sea level rise scenario, High Emissions Year 2100 Storm Surges,creates the most coastal flooding and damages the most sites. The pie charts in Figure 5 break downthe percentage of known cultural heritage sites that will be damaged and/or lost in each sea level risecoastal flooding scenario. In the lowest impact scenario, 5% of currently known sites will be impactedand in the highest scenario, 14% of known cultural heritage sites will experience some level of waterdamage and many complete water inundations (Figure 5).
Sustainability 2020, 12, x FOR PEER REVIEW 9 of 18
Again, the water inundation value was extracted for each known cultural heritage site in each
scenario. As is reflected in Figure 4, the lowest impact sea level rise scenario, High Emissions Scenario
2050, is projected to create the least extent of coastal flooding and thus damages the least number of
sites. Likewise, the highest impact sea level rise scenario, High Emissions Year 2100 Storm Surges,
creates the most coastal flooding and damages the most sites. The pie charts in Figure 5 break down
the percentage of known cultural heritage sites that will be damaged and/or lost in each sea level rise
coastal flooding scenario. In the lowest impact scenario, 5% of currently known sites will be impacted
and in the highest scenario, 14% of known cultural heritage sites will experience some level of water
damage and many complete water inundations (Figure 5).
Figure 5. Known precontact and historic sites experiencing water inundation in each of the six sea
level rise (SLR) coastal flooding map scenarios.
Of note, there is no scenario in which sites on the National Register of Historic Places will not be
impacted. The National Register of Historic Places is the United States’ official list of historic and
archaeological resources worthy of preservation [78]. In the High Emissions Scenario with Storm
Surge 2100, a notable 12 sites on the National Register of Historic Places will be impacted. Each of
these sites is important in the region’s economically significant maritime heritage tourism industry.
Figure 6 shows the percentage of precontact and historic sites lost in the least impact scenario
(High Emissions Scenario 2050) and the most SLR impact scenario (High Emissions Scenario with
Figure 5. Known precontact and historic sites experiencing water inundation in each of the six sealevel rise (SLR) coastal flooding map scenarios.
Of note, there is no scenario in which sites on the National Register of Historic Places will notbe impacted. The National Register of Historic Places is the United States’ official list of historic andarchaeological resources worthy of preservation [78]. In the High Emissions Scenario with Storm Surge2100, a notable 12 sites on the National Register of Historic Places will be impacted. Each of these sitesis important in the region’s economically significant maritime heritage tourism industry.
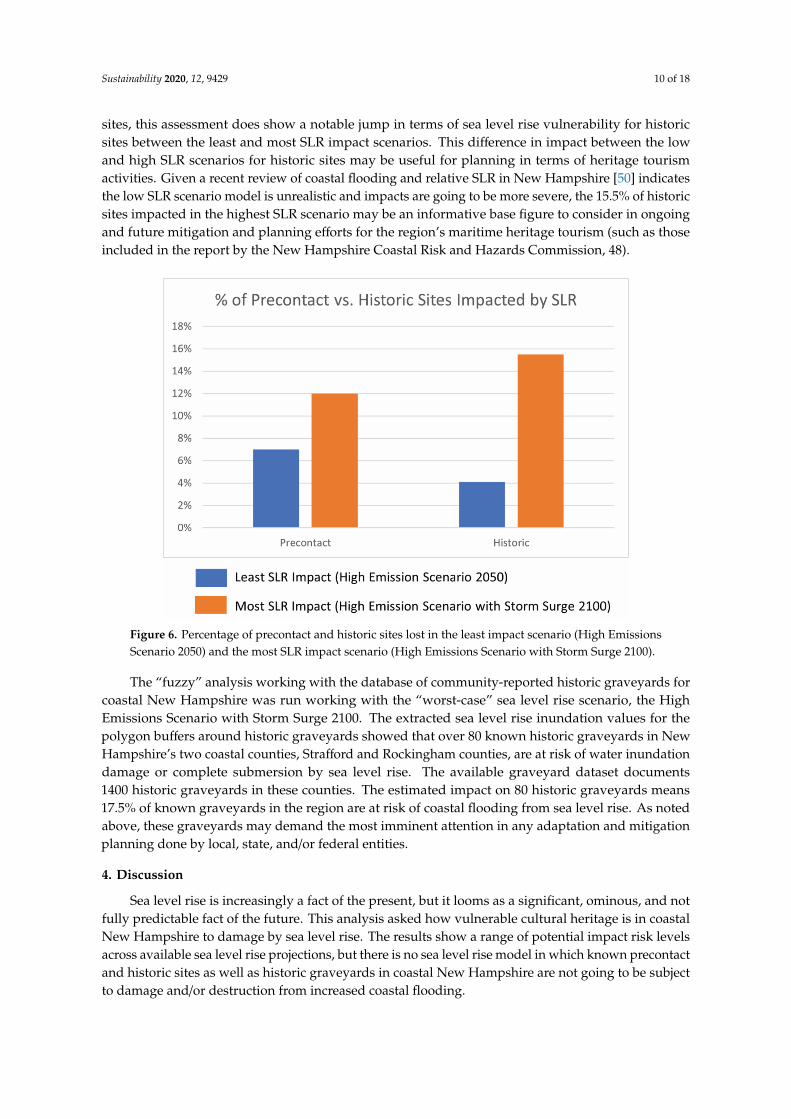
Figure 6 shows the percentage of precontact and historic sites lost in the least impact scenario(High Emissions Scenario 2050) and the most SLR impact scenario (High Emissions Scenario withStorm Surge 2100). Running chi-square tests (using numbers of sites) for each of these end scenariosshowed no significant difference in sea level rise impact for either scenario between precontact andhistoric sites. While there are no statistically significant differences between precontact and historic
Sustainability 2020, 12, 9429 10 of 18
sites, this assessment does show a notable jump in terms of sea level rise vulnerability for historicsites between the least and most SLR impact scenarios. This difference in impact between the lowand high SLR scenarios for historic sites may be useful for planning in terms of heritage tourismactivities. Given a recent review of coastal flooding and relative SLR in New Hampshire [50] indicatesthe low SLR scenario model is unrealistic and impacts are going to be more severe, the 15.5% of historicsites impacted in the highest SLR scenario may be an informative base figure to consider in ongoingand future mitigation and planning efforts for the region’s maritime heritage tourism (such as thoseincluded in the report by the New Hampshire Coastal Risk and Hazards Commission, 48).
Sustainability 2020, 12, x FOR PEER REVIEW 10 of 18
Storm Surge 2100). Running chi-square tests (using numbers of sites) for each of these end scenarios
showed no significant difference in sea level rise impact for either scenario between precontact and
historic sites. While there are no statistically significant differences between precontact and historic
sites, this assessment does show a notable jump in terms of sea level rise vulnerability for historic
sites between the least and most SLR impact scenarios. This difference in impact between the low and
high SLR scenarios for historic sites may be useful for planning in terms of heritage tourism activities.
Given a recent review of coastal flooding and relative SLR in New Hampshire [50] indicates the low
SLR scenario model is unrealistic and impacts are going to be more severe, the 15.5% of historic sites
impacted in the highest SLR scenario may be an informative base figure to consider in ongoing and
future mitigation and planning efforts for the region’s maritime heritage tourism (such as those
included in the report by the New Hampshire Coastal Risk and Hazards Commission, 48).
Figure 6. Percentage of precontact and historic sites lost in the least impact scenario (High Emissions
Scenario 2050) and the most SLR impact scenario (High Emissions Scenario with Storm Surge 2100).
The “fuzzy” analysis working with the database of community-reported historic graveyards for
coastal New Hampshire was run working with the “worst-case” sea level rise scenario, the High
Emissions Scenario with Storm Surge 2100. The extracted sea level rise inundation values for the
polygon buffers around historic graveyards showed that over 80 known historic graveyards in New
Hampshire’s two coastal counties, Strafford and Rockingham counties, are at risk of water inundation
damage or complete submersion by sea level rise. The available graveyard dataset documents 1400
historic graveyards in these counties. The estimated impact on 80 historic graveyards means 17.5%
of known graveyards in the region are at risk of coastal flooding from sea level rise. As noted above,
these graveyards may demand the most imminent attention in any adaptation and mitigation
planning done by local, state, and/or federal entities.
4. Discussion
Sea level rise is increasingly a fact of the present, but it looms as a significant, ominous, and not
fully predictable fact of the future. This analysis asked how vulnerable cultural heritage is in coastal
New Hampshire to damage by sea level rise. The results show a range of potential impact risk levels
across available sea level rise projections, but there is no sea level rise model in which known
Figure 6. Percentage of precontact and historic sites lost in the least impact scenario (High EmissionsScenario 2050) and the most SLR impact scenario (High Emissions Scenario with Storm Surge 2100).
The “fuzzy” analysis working with the database of community-reported historic graveyards forcoastal New Hampshire was run working with the “worst-case” sea level rise scenario, the HighEmissions Scenario with Storm Surge 2100. The extracted sea level rise inundation values for thepolygon buffers around historic graveyards showed that over 80 known historic graveyards in NewHampshire’s two coastal counties, Strafford and Rockingham counties, are at risk of water inundationdamage or complete submersion by sea level rise. The available graveyard dataset documents1400 historic graveyards in these counties. The estimated impact on 80 historic graveyards means17.5% of known graveyards in the region are at risk of coastal flooding from sea level rise. As notedabove, these graveyards may demand the most imminent attention in any adaptation and mitigationplanning done by local, state, and/or federal entities.
4. Discussion
Sea level rise is increasingly a fact of the present, but it looms as a significant, ominous, and notfully predictable fact of the future. This analysis asked how vulnerable cultural heritage is in coastalNew Hampshire to damage by sea level rise. The results show a range of potential impact risk levelsacross available sea level rise projections, but there is no sea level rise model in which known precontactand historic sites as well as historic graveyards in coastal New Hampshire are not going to be subjectto damage and/or destruction from increased coastal flooding.

Sustainability 2020, 12, 9429 11 of 18
It is important to emphasize the word “known” in this statement. Both the archaeological site andgraveyard databases available and used here represent known cultural heritage features. Only smallportions of New Hampshire’s two coastal counties, Strafford and Rockingham counties, have seen anyprofessional systematic survey for historic and precontact sites and the graveyard database available is,as noted, dated and incomplete. The majority of recorded precontact sites in these two counties comefrom individual amateur collectors [79]. The Great Bay Archaeological Survey (GBAS), launched in2016, represents a recent systematic effort aimed at increasing attention on the region’s cultural heritage,however, it is the first university-based archaeological research program in the region since 1980.These facts considered together highlight the critical need for more archaeological research across theregion and also make it clear that there are potentially numerous sites and graveyards that have yet tobe discovered. This is especially the case for cultural heritage sites with no standing architecture left,which includes all precontact indigenous sites as well as early historic cemeteries (1600s–early 1700s),which were marked with small fieldstones rather than cut stone engraved markers.
Figure 7 offers an example of the quite nondescript fieldstones that were used as grave markersduring the early colonial period of the 17th and early 18th centuries before the region had its ownstone cutter. These fieldstones are hard to distinguish as grave markers. The Great Bay ArchaeologicalSurvey (GBAS) has found multiple previously unlocated 17th-century graveyards in coastal NewHampshire with a combination of archival work, detailed walkover survey, and intensive on-the-groundmapping and post-processing analysis. The grave marker shown in Figure 7 is from one of thesepreviously unlocated (and therefore not mapped in any database) 17th-century historic cemeteries.Without standing architecture or distinct gravestones, sites and cemeteries are harder to find andtherefore are underrepresented in these known archaeological site and graveyard databases. As thesenumbers do not account for unknown sites, the vulnerability of cultural heritage resources in theregion to sea level rise is higher than available data can capture.
Sustainability 2020, 12, x FOR PEER REVIEW 11 of 18
precontact and historic sites as well as historic graveyards in coastal New Hampshire are not going
to be subject to damage and/or destruction from increased coastal flooding.
It is important to emphasize the word “known” in this statement. Both the archaeological site
and graveyard databases available and used here represent known cultural heritage features. Only
small portions of New Hampshire’s two coastal counties, Strafford and Rockingham counties, have
seen any professional systematic survey for historic and precontact sites and the graveyard database
available is, as noted, dated and incomplete. The majority of recorded precontact sites in these two
counties come from individual amateur collectors [79]. The Great Bay Archaeological Survey (GBAS),
launched in 2016, represents a recent systematic effort aimed at increasing attention on the region’s
cultural heritage, however, it is the first university-based archaeological research program in the
region since 1980. These facts considered together highlight the critical need for more archaeological
research across the region and also make it clear that there are potentially numerous sites and
graveyards that have yet to be discovered. This is especially the case for cultural heritage sites with
no standing architecture left, which includes all precontact indigenous sites as well as early historic
cemeteries (1600s–early 1700s), which were marked with small fieldstones rather than cut stone
engraved markers.
Figure 7 offers an example of the quite nondescript fieldstones that were used as grave markers
during the early colonial period of the 17th and early 18th centuries before the region had its own
stone cutter. These fieldstones are hard to distinguish as grave markers. The Great Bay
Archaeological Survey (GBAS) has found multiple previously unlocated 17th-century graveyards in
coastal New Hampshire with a combination of archival work, detailed walkover survey, and
intensive on-the-ground mapping and post-processing analysis. The grave marker shown in Figure
7 is from one of these previously unlocated (and therefore not mapped in any database) 17th-century
historic cemeteries. Without standing architecture or distinct gravestones, sites and cemeteries are
harder to find and therefore are underrepresented in these known archaeological site and graveyard
databases. As these numbers do not account for unknown sites, the vulnerability of cultural heritage
resources in the region to sea level rise is higher than available data can capture.
Figure 7. Example of a 17th-century British colonial fieldstone grave marker in coastal New
Hampshire. This picture shows the subtle nature of these features, illustrating the difficulty in
identifying these cultural heritage places.
Figure 7. Example of a 17th-century British colonial fieldstone grave marker in coastal New Hampshire.This picture shows the subtle nature of these features, illustrating the difficulty in identifying thesecultural heritage places.
As noted above, tourism is a key factor behind what has been years of strong demographic, social,and economic growth in coastal New Hampshire and the region’s remnant historic maritime heritage

Sustainability 2020, 12, 9429 12 of 18
sites and cultural landscapes are significant tourist draws [48]. Again, coastal New Hampshire’srevitalization during the 1900s was the direct result of the growth of tourism that saw coasts as placesof leisure and simplicity. Today, a notable part of why people come to, and stay in, coastal NewHampshire remains the desire for a connection to an authentic historic marine lifestyle experience,an experience that is materialized in buildings and landscapes left from earlier times. The terms“sea,” “charming,” “historic,” and “romantic” are used regularly in tourist promotional materials forthe region today [80,81]. Even with the widespread impacts of COVID-19, coastal New Hampshireis showing more service-industry economic resiliency than other parts of the state and is still beingrecognized for its historic tourism appeal [72,80].
The findings of this analysis certainly suggest a possible looming impact on the region’s economy.The 12 sites on the National Register of Historic Places that stand to be impacted by sea level riseinclude many of the key maritime heritage tourism destinations, from museums to historic houses to athriving historic district with restaurants, shops, and bars. Most people seeking out cultural heritagetourism desire authenticity of place and experience. It has been documented that higher perceptions ofauthenticity during cultural heritage tourism leads to greater economic expenditures [82]. The resultspresented here may therefore raise concerns for future tourism revenue. Restaurants once situated inrenovated historic buildings and districts will eventually lie in tidal marshes. If adaptation plans decideto move wharfs, docks, and historic buildings once dotting the coast inland for their preservation,how might this impact tourists’ conceptions of their authenticity?
The significant contribution coastal New Hampshire makes to the state’s tourist revenue certainlymakes revenue loss an important variable to consider and the economic impacts of COVID-19 certainlyraise the profile of fiscal concerns in most any discussion today. However, even in the face of economicconstraints, it is important to consider multiple values and potential issues. What are the ramificationsif revenue becomes the key factor in determining which cultural heritage is addressed in futureplanning? All of the vulnerable sites on the National Register of Historic Places are post-contactEuropean/Euro-American dominated sites. New Hampshire, like all of New England, epitomizes aplace where the arrival of colonists has been constructed as what constitutes “first” and the start ofauthentic history [83,84]. The region’s cultural heritage tourism industry reflects this fact; what touristsseek starts with the settler colonialists of the 17th century, not the indigenous peoples who greeted thesun each morning and engaged in their reciprocal seasonal movements across this region for millenniaprior to the arrival of Europeans.
As people across coastal New Hampshire grapple with the threat sea level rise poses to culturalheritage, challenges will arise around what heritage gets priority in risk management and mitigationplans. Can we avoid conflating the value of cultural heritage with economic value, and if so, how?The loss of precontact indigenous sites will go much less noticed by the broader public than the loss ofa historic period house that is today the site of tourism. If programs and policies around sea level riseare developed that focus on stopping or mitigating the transformation of heritage sites with the mosteconomic significance, the result will be that only post-contact European/Euro-American-dominatedcultural heritage will be preserved.
With this, the false creation of authentic history starting with Europeans will be replicated into thefuture. In a recent interview, Denise Pouliot, Sag8moskwa, lead female speaker of the Cowasuck Bandof the Pennacook Abenaki People, eloquently described the dangers of this kind of history, explainingthat to have a shared future we have to have a shared past and that means telling the whole story [85].While there are no easy solutions to this issue, a critical step is to include indigenous stakeholders insea level rise planning processes. Indeed, across the state of New Hampshire, as elsewhere today,mutual collaborations with indigenous peoples to advance knowledge and enact socioeconomicchanges are emerging [86,87]. Engaging and expanding collaborative efforts will be critical if culturalheritage vulnerability is to be addressed comprehensively.

Sustainability 2020, 12, 9429 13 of 18
5. Conclusions
Human pressure on global systems is accelerating and coastal cultural heritage is vulnerable tothese pressures. Sea level rise poses a particularly looming threat to tangible coastal cultural heritagesites. Being able to systematically assess which sites are at risk of damage or destruction from sea levelrise and how is an urgent need. While archaeologists increasingly recognize this need, the reality ofarchaeological research funding poses constraints in terms of resources for large-scale cultural heritagerisk assessments. However, there are productive and creative ways to work around such limitations.Because sea level rise is impacting so many ecological and cultural services, numerous entities areactively developing accurate predictive models of sea level rise for various (non-archaeological)management purposes (ecology, hydrology, real estate, economics, etc.). Archaeologists, while not theintended audience, can work with these models to achieve archaeological ends. Indeed, the geospatialrevolution in archaeology, from its start, creatively repurposed remote sensing data and technologydesigned for other purposes [88].
Here, LIDAR-derived sea level rise models created for local, regional, and national governmentmitigation and adaptation planning were harnessed productively to assess the vulnerability of coastalNew Hampshire’s cultural heritage resources. This analysis showed there is no sea level rise scenario inwhich known historic and precontact stie are not damaged and/or completely destroyed. The analysisalso showed clearly impending risk to economically significant tourist sites in the region. That said,it is also important to keep in mind that economic value in future cultural heritage preservation andmitigation plans is not the only value to consider; if it becomes so, Euro-American cultural heritage siteswill be overrepresented in the future (and consequently, indigenous heritages further marginalized).In addition to known sites, unknown sites and cemeteries are also at risk, but without more systematicdocumentation of these sites, that risk cannot be assessed. Therefore, while the analysis presented hereis one step in the process, the full extent of cultural heritage vulnerability in coastal New Hampshireremains unknown. Advancing forward, this kind of regional-scale modeling should be connected withlocal risk monitoring and planning efforts to advance actual on-the-ground preservation and mitigation.Strawbery Banke, an important coastal New Hampshire maritime heritage tourist destination on theNational Register of Historic Places found in this analysis to be at risk from sea level rise, has alreadybegun, and so serves as a prime model for local, detailed site-based monitoring and planning [73].More site-based work, increased documentation of unknown archaeological and historic sites in theregion, community outreach around valued local heritage sites, and collaborating with indigenousgroups around ancestral cultural heritage knowledge and places are all necessary for a comprehensiveapproach to this looming issue.
A closing point important to note here is that while many entities are developing sea level risemodels that archaeologists can use for the kind of analysis presented here, coverage and data availabilityis uneven. Regionally specific detailed sea level rise models, as well as the kind of archaeologicaland historic site database available for this analysis, are more commonly found in the Global North.Indeed, one can find remote sensing-derived sea level rise models for the entire United States throughNOAA [89]. Recognizing and respecting the challenges of this unevenness when calling for a researchapproach is important. While detailed sea level rise models and site files may not be readily availableeverywhere, sea level rise is such a pressing global issue that there are ever-growing global resourcesabout its impacts. An archaeologist working somewhere with no available regional specific sea levelrise models or robust site databases can still access open-source sea level rise models from places likeClimate Central [90]. Working with these open-source visualization tools obviously cannot allow forspecific quantifications of site vulnerability, but it can provide a qualitative means of assessing site risk.Moreover, archaeologists could work with such tools to identify areas most at risk so any availablefieldwork time and resources could be targeted to these places. This would allow researchers to focusefforts on places most likely to become inundated, helping document and learn at least somethingfrom cultural heritage sites before they are irreversibly damaged or destroyed by sea level rise.

Sustainability 2020, 12, 9429 14 of 18
Funding: This research was funded by the University of New Hampshire’s Carsey School of Public Policy and theJames H. and Claire Short Hayes Humanities Chair, Center for the Humanities. This publication was also madepossible in part by a grant from Carnegie Corporation of New York. The statements made and views expressedare solely the responsibility of the author.
Acknowledgments: I thank the State of New Hampshire Division of Historical Resources and NH GRANIT forsharing data that enabled this analysis. I thank the three anonymous reviewers whose constructive feedback helpedme improve the paper. Finally, I thank all of the team members and volunteers of the Great Bay ArchaeologicalSurvey (GBAS) who spend countless hours walking through the poison ivy- and tick-filled woods of coastal NewHampshire looking for 17th-century sites and graveyards before they are washed away.
Conflicts of Interest: The author declares no conflict of interest. The funders had no role in the design of thestudy; in the collection, analyses, or interpretation of data; in the writing of the manuscript; or in the decision topublish the results.
References
1. Abate, N.; Lasaponara, R. Preventive Archaeology Based on Open Remote Sensing Data and Tools: The Casesof Sant’Arsenio (SA) and Foggia (FG), Italy. Sustainability 2019, 11, 4145. [CrossRef]
2. Araoz, G.F. Conservation Philosophy and its Development: Changing Understandings of Authenticity andSignificance. Herit. Soc. 2013, 6, 144–154. [CrossRef]
3. Barthel-Bouchier, D. Cultural Heritage and the Challenge of Sustainability; Left Coast Press: Walnut Creek, CA,USA, 2013.
4. Brodie, N. Introduction. In Archaeology, Cultural Heritage and the Antiquities Trade; Brodie, N., Kersel, M.,Luke, C., Tubb, K., Eds.; University Press of Florida: Gainesville, FL, USA, 2006; pp. 1–24.
5. Casana, J.; Laugier, E.J. Satellite imagery-based monitoring of archaeological site damage in the Syrian civilwar. PLoS ONE 2017, 12, e0188589. [CrossRef] [PubMed]
6. Colwell-Chanthaphonh, C. The Archaeologist as World Citizen. In Cosmopolitan Archaeologies; Meskell, L.,Ed.; Duke University Press: Durham, NC, USA, 2009; pp. 140–165.
7. Hammer, E.L.; Seifried, R.M.; Franklin, K.; Lauricella, A. Remote assessments of the archaeological heritagesituation in Afghanistan. J. Cult. Herit. 2018, 33, 125–144. [CrossRef]
8. Kelleher, M. Images of the Past: Historical Authenticity and Inauthenticity from Disney to Times Square.CRM J. 2004, 1, 6–19.
9. Meskell, L. Negative Heritage and Past Mastering in Archaeology. Anthr. Q. 2002, 75, 557–574. [CrossRef]10. Silverman, H. Touring Ancient Times: The Present and Presented Past in Contemporary Peru. Am. Anthr.
2002, 104, 881–902. [CrossRef]11. Smith, L. Uses of Heritage; Routledge: London, UK, 2006.12. Van Krieken-Pieters, J. Afghanistan’s Cultural Heritage: An Exceptional Case? In Archaeology, Cultural Heritage
and the Antiquities Trade; Brodie, N., Kersel, M., Luke, C., Tubb, K., Eds.; University Press of Florida: Gainesville,FL, USA, 2006; pp. 227–235.
13. Vecco, M. A definition of cultural heritage: From the tangible to the intangible. J. Cult. Herit. 2010, 11, 321–324.[CrossRef]
14. Altschul, J. SAA Remarks: Effects of Climate Change on Cultural Resources; Union of Concerned ScientistsPress Conference May 20 2014 (SAA Member Communication). Available online: https://www.eesi.org/
briefings/view/052014landmarks (accessed on 4 January 2018).15. UNESCO. Predicting and Managing the Effects of Climate Change on World Heritage. 2006. Available online:
http://whc.unesco.org/en/climatechange/ (accessed on 4 January 2018).16. UNESCO. World Heritage and Tourism in a Changing Climate. 2016. Available online: https://whc.unesco.
org/en/activities/883/ (accessed on 4 January 2018).17. UNESCO. Climate Change and World Heritage. 2020. Available online: https://whc.unesco.org/en/
climatechange/ (accessed on 4 January 2018).18. Earthjustice. Petition to the World Heritage Committee: The Role of Black Carbon in Endangering
World Heritage Sites Threatened by Glacial Melt and Sea Level Rise. 2009. Available online: file:///C:/Users/mcn45/Downloads/activity-393-4.pdf (accessed on 4 January 2018).
19. National Park Service, Department of the Interior (NPS). Preserving Coastal Heritage: Summary Report.2014. Available online: http://www.achp.gov/docs/pch-summary-report.pdf (accessed on 4 January 2018).

Sustainability 2020, 12, 9429 15 of 18
20. Union of Concerned Scientists. National Landmarks at Risk: How Rising Seas, Floods,and Wildfires are Threatening the United States’ Most Cherished Historic Sites. 2014.Available online: http://www.ucsusa.org/sites/default/files/legacy/assets/documents/global_warming/
National-Landmarks-at-Risk-Full-Report.pdf (accessed on 4 January 2018).21. Church, J.A.; Clark, P.U.; Cazenave, A.; Gregory, J.M.; Jevrejeva, S.; Levermann, A.; Merrifield, M.A.;
Milne, G.A.; Nerem, R.S.; Nunn, P.D.; et al. Sea Level Change. In Climate Change 2013: The Physical ScienceBasis; Contribution of Working Group I to the Fifth Assessment Report of the Intergovernmental Panel onClimate Change; Stocker, T.F., Qin, D., Plattner, G.-K., Tignor, M., Allen, S.K., Boschung, J., Nauels, A., Xia, Y.,Bex, V., Midgley, P.M., Eds.; Cambridge University Press: Cambridge, UK, 2013.
22. IPCC. Summary for Policymakers. In Global Warming of 1.5 C; An IPCC Special Report on the impacts ofglobal warming of 1.5 C above pre-industrial levels and related global greenhouse gas emission pathways, inthe context of strengthening the global response to the threat of climate change, sustainable development, andefforts to eradicate poverty; Masson-Delmotte, V., Zhai, P., Pörtner, H.-O., Roberts, D., Skea, J., Shukla, P.R.,Pirani, A., Moufouma-Okia, W., Péan, C., Pidcock, R., Eds.; World Meteorological Organization: Geneva,Switzerland, 2018; Available online: https://www.ipcc.ch/ (accessed on 9 January 2020).
23. NASA. Global Climate Change. Available online: https://climate.nasa.gov/vital-signs/sea-level/ (accessed on9 January 2020).
24. Chen, X.; Zhang, X.; Church, J.A.; Watson, C.S.; King, M.A.; Monselesan, D.; Legrésy, B.; Harig, C.The increasing rate of global mean sea-level rise during 1993–2014. Nat. Clim. Chang. 2017, 7, 492–495.[CrossRef]
25. Anderson, D.G.; Bissett, T.G.; Yerka, S.J.; Wells, J.J.; Kansa, E.C.; Kansa, S.W.; Myers, K.N.; DeMuth, R.C.;White, D.A. Sea-level rise and archaeological site destruction: An example from the southeastern United Statesusing DINAA (Digital Index of North American Archaeology). PLoS ONE 2017, 12, e0188142. [CrossRef]
26. Carmichael, B.; Wilson, G.; Namarnyilk, I.; Nadji, S.; Brockwell, S.; Webb, B.; Hunter, F.; Bird, D. Local andIndigenous management of climate change risks to archaeological sites. Mitig. Adapt. Strat. Glob. Chang.2017, 23, 231–255. [CrossRef]
27. Erlandson, J.M. Racing a Rising Tide: Global Warming, Rising Seas, and the Erosion of Human History. J. Isl.Coast. Archaeol. 2008, 3, 167–169. [CrossRef]
28. Erlandson, J.M. As the world warms: Rising seas, coastal archaeology, and the erosion of maritime history.J. Coast. Conserv. 2010, 16, 137–142. [CrossRef]
29. McCoy, M. The Race to Document Archaeological Sites Ahead of Rising Sea Levels: Recent Applications ofGeospatial Technologies in the Archaeology of Polynesia. Sustainability 2018, 10, 185. [CrossRef]
30. Reeder-Myers, L.A. Cultural Heritage at Risk in the Twenty-First Century: A Vulnerability Assessment ofCoastal Archaeological Sites in the United States. J. Isl. Coast. Archaeol. 2015, 10, 436–445. [CrossRef]
31. Reeder-Myers, L.A.; McCoy, M.D. Preparing for the Future Impacts of Megastorms on Archaeological Sites:An Evaluation of Flooding from Hurricane Harvey, Houston, Texas. Am. Antiq. 2019, 84, 292–301. [CrossRef]
32. Reimann, L.; Vafeidis, A.T.; Brown, S.; Hinkel, J.; Tol, R.S.J. Mediterranean UNESCO World Heritage at riskfrom coastal flooding and erosion due to sea-level rise. Nat. Commun. 2018, 9, 4161. [CrossRef]
33. Bolster, W.J. The Mortal Sea: Fishing the Atlantic in the Age of Sail; Harvard University Press: Cambridge, MA,USA, 2012.
34. Gillis, J. The Human Shore: Seacoasts in History; The University of Chicago Press: Chicago, IL, USA, 2012.35. UN Atlas of the Oceans. Human Settlements on the Coast. 2010. Available online: http://www.oceansatlas.
org/servlet/CDSServlet?status=ND0xODc3JjY9ZW4mMzM9KiYzNz1rb3M (accessed on 10 January 2020).36. NOAA. National Coastal Population Report: Population trends from 1970 to 2020. 2013.
Available online: http://stateofthecoast.noaa.gov/features/coastal-population-report.pdf\T1\textgreater(accessed on 4 January 2018).
37. Jackson, J.B.C.; Kirby, M.X.; Berger, W.H.; Bjorndal, K.A.; Botsford, L.W.; Bourque, B.J.; Bradbury, R.H.;Cooke, R.; Erlandson, J.; Estes, J.A.; et al. Historical Overfishing and the Recent Collapse of CoastalEcosystems. Science 2001, 293, 629–637. [CrossRef]
38. Myers, R.A.; Worm, B. Rapid worldwide depletion of predatory fish communities. Nat. Cell Biol. 2003,423, 280–283. [CrossRef]

Sustainability 2020, 12, 9429 16 of 18
39. Hughes, T.P.; Baird, A.H.; Bellwood, D.; Card, M.; Connolly, S.R.; Folke, C.; Grosberg, R.; Hoegh-Guldberg, O.;Jackson, J.B.C.; Kleypas, J.; et al. Climate Change, Human Impacts, and the Resilience of Coral Reefs. Science2003, 301, 929–933. [CrossRef]
40. Lotze, H.K. Depletion, Degradation, and Recovery Potential of Estuaries and Coastal Seas. Science 2006, 312,1806–1809. [CrossRef] [PubMed]
41. Pandolfi, J.M.; Bradbury, R.H.; Sala, E.; Hughes, T.P.; Bjorndal, K.A.; Cooke, R.G.; McArdle, D.;McClenachan, L.; Newman, M.J.H.; Paredes, G.; et al. Global Trajectories of the Long-Term Declineof Coral Reef Ecosystems. Science 2003, 301, 955–958. [CrossRef] [PubMed]
42. Costello, C.; Ovando, D.; Hilborn, R.; Gaines, S.D.; Deschenes, O.; Lester, S.E. Status and Solutions for theWorld’s Unassessed Fisheries. Science 2012, 338, 517–520. [CrossRef] [PubMed]
43. McCauley, D.J.; Pinsky, M.L.; Palumbi, S.R.; Estes, J.A.; Joyce, F.H.; Warner, R.R. Marine defaunation:Anima loss in the global ocean. Science 2015, 347, 1255641. [CrossRef]
44. Neubauer, P.; Jensen, O.P.; Hutchings, J.A.; Baum, J.K. Resilience and Recovery of Overexploited MarinePopulations. Science 2013, 340, 347–349. [CrossRef]
45. Pauly, D.; Watson, R.; Alder, J. Global trends in world fisheries: Impacts on marine ecosystems and foodsecurity. Philos. Trans. R. Soc. B Biol. Sci. 2005, 360, 5–12. [CrossRef]
46. Steneck, R.S. Human influences on coastal ecosystems: Does overfishing create trophic cascades?Trends Ecol. Evol. 1998, 13, 429–430. [CrossRef]
47. Marzeion, B.; Levermann, A. Loss of cultural world heritage and currently inhabited places to sea-level rise.Environ. Res. Lett. 2014, 9, 034001. [CrossRef]
48. New Hampshire Coastal Risk and Hazards Commission. Preparing New Hampshire for Projected StormSurge, Sea-Level Rise and Extreme Precipitation. 2016. Available online: http://www.nhcrhc.org/wp-content/uploads/2016-CRHC-final-report.pdf (accessed on 4 January 2018).
49. Wake, C.; Burakowski, E.; Kelsey, E.; Hayhoe, K.; Stoner, A.; Watson, C.; Douglas, E. Climate Changein the Piscataqua/Great Bay Region: Past, Present, and Future. 2011. Carbon Solutions New England.Find the Geodatabase with the Sea Level Rise Rasters they derived and that was used in this analysis.Available online: https://seagrant.unh.edu/sites/seagrant.unh.edu/files/media/pdfs/extension/climate_change_in_the_piscataqua-great_bay_region.pdf or https://granit.unh.edu/data/metadata?file=sealevelrise_2ft_scenarios/nh/sealevelrise_2ft_scenarios.html (accessed on 6 January 2018).
50. Wake, C.; Knott, J.; Lippmann, T.; Stampone, M.; Ballestero, T.; Bjerklie, D.; Burakowski, E.; Glidden, S.;Hosseini-Shakib, I.; Jacobs, J. New Hampshire Coastal Flood Risk Summary—Part I: Science. Prepared for the NewHampshire Coastal Flood Risk Science and Technical Advisory Panel; University of New Hampshire: Durham,NH, USA, 2019; Available online: https://scholars.unh.edu/cgi/viewcontent.cgi?article=1209&context=ersc(accessed on 9 January 2020).
51. Brooks, L. Turning the Looking Glass on King Phillip’s War: Locating American Literature in Native Space.Am. Lit. Hist. 2013, 25, 718–750. [CrossRef]
52. Bourque, B.J. Diversity and Complexity in Prehistoric Maritime Societies: A Gulf of Maine Perspective; Plenum Press:New York, NY, USA, 1995.
53. Bourque, B.J. Twelve Thousand Years: American Indians in Maine; Cox, S.L., Whitehead, R.H., Eds.; University ofNebraska Press: Lincoln, CA, USA, 2001.
54. Robinson, B.S.; Bolian, C. A Preliminary Report on the Rocks Road Site (Seabrook Station): Late Archaic toContact Period Occupation in Seabrook, New Hampshire. New Hamps. Archeol. 1987, 28, 19–52.
55. Lotze, H.K.; Milewski, I. Two Centuries of Multiple Human Impacts and Successive Changes in a NorthAtlantic Food Web. Ecol. Appl. 2004, 14, 1428–1447. [CrossRef]
56. Spiess, A.E.; Lewis, R.A. The Turner Farm Fauna: 5000 Years of Hunting and Fishing in Penobscot Bay, Maine;Original Publications in Maine Archaeology #11; Maine State Museum, Maine Historic PreservationCommission, and Maine Archaeological Society: Augusta, ME, USA, 2001.
57. Spiess, A.E.; Sobolik, K.; Crader, D.; Mosher, J.; Wilson, D. Cod, Clams, and Deer: The Food Remains fromIndiantown Island. Archaeol. East. North Am. 2006, 34, 141–187.
58. Brooks, L.T.; Brooks, C. The Reciprocity Principle and Traditional Ecological Knowledge. Int. J. Crit.Indig. Stud. 2010, 3, 11–28. [CrossRef]
59. Salisbury, N. Manitou and Providence: Indians, Europeans, and the Making of New England, 1500–1643;Oxford University Press: New York, NY, USA, 1984.

Sustainability 2020, 12, 9429 17 of 18
60. Starbuck, D. The Archaeology of New Hampshire: Exploring 10,000 years in the Granite State; University Press ofNew England: Hanover, NH, USA, 2006.
61. Kurlansky, M. Cod: A Biography of the Fish that Changed the World; Walker and Company: New York, NY,USA, 1997.
62. Smith, J. A Description of New England: Or The Obseruations, and Discoueries, of Captain Iohn Smith (Admirall ofthat Country) in the North of America, in the Year of Our Lord 1614 With the Successe of Sixe Ships, that Went theNext Yeare 1615; and the Accidents Befell him Among the French Men of Warre: With the Proofe of the Present Benefitthis Countrey Affoords: Whither this Present Yeare, 1616, Eight Voluntary Ships are Gone to Make Further Tryall;Humfrey Lownes for Robert Clerke: London, UK, 1616.
63. Burke, M. The Isles of Shoals. In Cross-Grained and Wily Waters: A Guide to the Piscataqua Maritime Region;Bolster, W.J., Ed.; Peter Randall Publisher: Portsmouth, NH, USA, 2002; pp. 12–14.
64. Ramsden, D. Time and Tide. The Exeter Bulletin Fall 2001. Available online: https://www.exeter.edu/
documents/Exeter_Bulletin/fall_01/contents.html (accessed on 6 January 2018).65. Candee, R. Merchant and Millwright: The Water Powered Sawmills of the Piscataqua. Old-Time N. Engl.
1970, 60, 131–149.66. DeLucia, C. Memory Lands: King Phillips War and the Place of Violence in the Northeast; Yale University Press:
New Haven, CT, USA, 2018.67. Brown, C.J.; Greenly, M.; Lunt, R.W.; Sablock, P. Hard by the Water’s Edge: A Preliminary Report of the
Darby Field Homestead-Bickford Garrison (27-ST-71) Excavations. New Hamps. Archaeol. 2014, 54, 14–38.68. Thompson, J.R.; Carpenter, D.N.; Cogbill, C.V.; Foster, D.R. Four Centuries of Change in Northeastern United
States Forests. PLoS ONE 2013, 8, e72540. [CrossRef] [PubMed]69. Beaudoin, C. The Mills in Dover. In Cross-Grained and Wily Waters: A Guide to the Piscataqua Maritime Region;
Bolster, W.J., Ed.; Peter Randall Publisher: Portsmouth, NH, USA, 2002; pp. 162–166.70. Bolster, W.J. Introduction: The Nature of this Place. In Cross-Grained and Wily Waters: A Guide to the Piscataqua
Maritime Region; Bolster, W.J., Ed.; Peter Randall Publisher: Portsmouth, NH, USA, 2002; pp. xxi–xxix.71. Egberts, L.; Hundstad, D. Coastal heritage in touristic regional identity narratives: A comparison between
the Norwegian region Sørlandet and the Dutch Wadden Sea area. Int. J. Heritage Stud. 2019, 25, 1073–1087.[CrossRef]
72. Available online: https://citiesspeak.org/2020/10/01/portsmouth-nh-restaurants-show-signs-of-resilience-to-covid-19/ (accessed on 10 January 2020).
73. Curran, B.; Routhier, M.; Mulukutla, G. Sea-Level Rise Vulnerability Assessment of Coastal Resources inNew Hampshire. APT Bull. J. Preserv. Technol. 2016, 47, 23–30.
74. Howey, M.C.L. Climate Change, Sea-Level Rise, and the Vulnerable Cultural Heritage of Coastal NewHampshire. Carsey School of Public Policy, Regional Issue Brief #52. 2018. Available online: https://scholars.unh.edu/carsey/341/ (accessed on 10 January 2020).
75. Deetz, J. Small Things Forgotten: An Archaeology of Early American Life; Anchor Books: New York, NY,USA, 1996.
76. New Hampshire Old Graveyards Association. Available online: http://www.nhoga.com/ (accessed on6 January 2018).
77. NH GRANIT Graveyards Metadata. Available online: https://granit.unh.edu/data/datacat/pages/grave.pdf(accessed on 9 January 2020).
78. National Register of Historic Places. Available online: https://www.nps.gov/subjects/nationalregister/index.htm (accessed on 9 January 2020).
79. Harrington, F.; Kenyon, V. New Hampshire Coastal Sites Survey, Summer 1986. New Hamps. Archeol. 1987,28, 52–62.
80. Available online: http://www.goportsmouthnh.com/ (accessed on 10 January 2020).81. Available online: https://www.visit-newhampshire.com/seacoast/ (accessed on 10 January 2020).82. Chhabra, D.; Healy, R.; Sills, E. Staged authenticity and heritage tourism. Ann. Tour. Res. 2003, 30, 702–719.
[CrossRef]83. O’Brien, J. Firsting and Lasting: Writing Indians Out of Existence in New England; University of Minnesota Press:
Minneapolis, MN, USA, 2010.84. Den Ouden, A. Beyond Conquest: Native Peoples and the Struggle for History in New England; University of
Nebraska Press: Lincoln, NE, USA, 2005.
Sustainability 2020, 12, 9429 18 of 18
85. Available online: https://www.nhpr.org/post/re-assessing-legend-hannah-duston-0#stream/0 (accessed on9 January 2020).
86. Available online: https://indigenousnh.com/ (accessed on 9 January 2020).87. Available online: https://www.unityparkndakinna.net/ (accessed on 9 January 2020).88. McCoy, M. Maps for Time Travelers: How Archaeologists Use Technology to Bring Us Closer to the Past;
California University Press: Los Angeles, CA, USA, 2020.89. NOAA Sea Level Rise Data. Available online: https://coast.noaa.gov/digitalcoast/tools/slr.html (accessed on
10 January 2020).90. Climate Center Sea Level Rise Open Source Tools. Available online: https://ss2.climatecentral.org/ (accessed on
10 January 2020).
Publisher’s Note: MDPI stays neutral with regard to jurisdictional claims in published maps and institutionalaffiliations.
© 2020 by the author. Licensee MDPI, Basel, Switzerland. This article is an open accessarticle distributed under the terms and conditions of the Creative Commons Attribution(CC BY) license (http://creativecommons.org/licenses/by/4.0/).