Harmonic Measurement and Passive Filter Simulation using ...
6
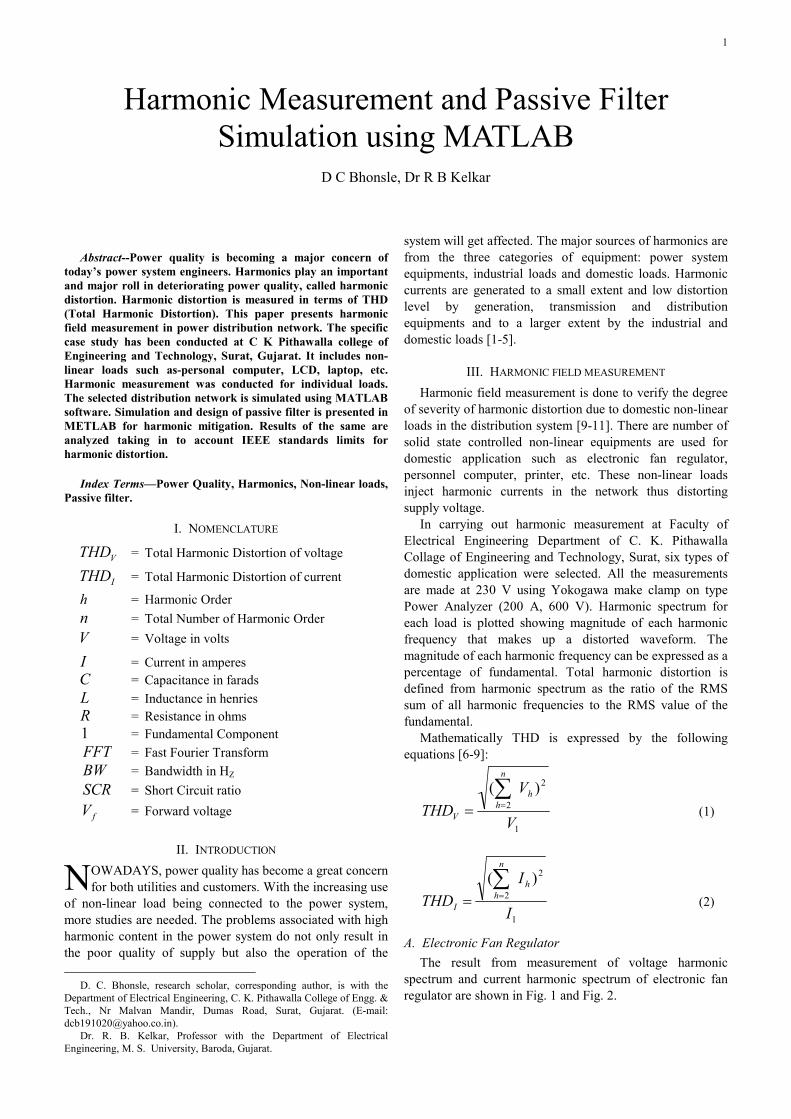
1 Abstract--Power quality is becoming a major concern of today’s power system engineers. Harmonics play an important and major roll in deteriorating power quality, called harmonic distortion. Harmonic distortion is measured in terms of THD (Total Harmonic Distortion). This paper presents harmonic field measurement in power distribution network. The specific case study has been conducted at C K Pithawalla college of Engineering and Technology, Surat, Gujarat. It includes non- linear loads such as-personal computer, LCD, laptop, etc. Harmonic measurement was conducted for individual loads. The selected distribution network is simulated using MATLAB software. Simulation and design of passive filter is presented in METLAB for harmonic mitigation. Results of the same are analyzed taking in to account IEEE standards limits for harmonic distortion. Index Terms—Power Quality, Harmonics, Non-linear loads, Passive filter. I. NOMENCLATURE V THD = Total Harmonic Distortion of voltage I THD = Total Harmonic Distortion of current h = Harmonic Order n = Total Number of Harmonic Order V = Voltage in volts I = Current in amperes C = Capacitance in farads L = Inductance in henries R = Resistance in ohms 1 = Fundamental Component FFT = Fast Fourier Transform BW = Bandwidth in H Z SCR = Short Circuit ratio f V = Forward voltage II. INTRODUCTION OWADAYS, power quality has become a great concern for both utilities and customers. With the increasing use of non-linear load being connected to the power system, more studies are needed. The problems associated with high harmonic content in the power system do not only result in the poor quality of supply but also the operation of the D. C. Bhonsle, research scholar, corresponding author, is with the Department of Electrical Engineering, C. K. Pithawalla College of Engg. & Tech., Nr Malvan Mandir, Dumas Road, Surat, Gujarat. (E-mail: [email protected]). Dr. R. B. Kelkar, Professor with the Department of Electrical Engineering, M. S. University, Baroda, Gujarat. system will get affected. The major sources of harmonics are from the three categories of equipment: power system equipments, industrial loads and domestic loads. Harmonic currents are generated to a small extent and low distortion level by generation, transmission and distribution equipments and to a larger extent by the industrial and domestic loads [1-5]. III. HARMONIC FIELD MEASUREMENT Harmonic field measurement is done to verify the degree of severity of harmonic distortion due to domestic non-linear loads in the distribution system [9-11]. There are number of solid state controlled non-linear equipments are used for domestic application such as electronic fan regulator, personnel computer, printer, etc. These non-linear loads inject harmonic currents in the network thus distorting supply voltage. In carrying out harmonic measurement at Faculty of Electrical Engineering Department of C. K. Pithawalla Collage of Engineering and Technology, Surat, six types of domestic application were selected. All the measurements are made at 230 V using Yokogawa make clamp on type Power Analyzer (200 A, 600 V). Harmonic spectrum for each load is plotted showing magnitude of each harmonic frequency that makes up a distorted waveform. The magnitude of each harmonic frequency can be expressed as a percentage of fundamental. Total harmonic distortion is defined from harmonic spectrum as the ratio of the RMS sum of all harmonic frequencies to the RMS value of the fundamental. Mathematically THD is expressed by the following equations [6-9]: 1 2 2 ) ( V V THD h n h V ∑ = = (1) 1 2 2 ) ( I I THD h n h I ∑ = = (2) A. Electronic Fan Regulator The result from measurement of voltage harmonic spectrum and current harmonic spectrum of electronic fan regulator are shown in Fig. 1 and Fig. 2. Harmonic Measurement and Passive Filter Simulation using MATLAB D C Bhonsle, Dr R B Kelkar N
-
Upload
khangminh22 -
Category
Documents
-
view
1 -
download
0
Transcript of Harmonic Measurement and Passive Filter Simulation using ...
1
Abstract--Power quality is becoming a major concern of
today’s power system engineers. Harmonics play an important
and major roll in deteriorating power quality, called harmonic
distortion. Harmonic distortion is measured in terms of THD
(Total Harmonic Distortion). This paper presents harmonic
field measurement in power distribution network. The specific
case study has been conducted at C K Pithawalla college of
Engineering and Technology, Surat, Gujarat. It includes non-
linear loads such as-personal computer, LCD, laptop, etc.
Harmonic measurement was conducted for individual loads.
The selected distribution network is simulated using MATLAB
software. Simulation and design of passive filter is presented in
METLAB for harmonic mitigation. Results of the same are
analyzed taking in to account IEEE standards limits for
harmonic distortion.
Index Terms—Power Quality, Harmonics, Non-linear loads,
Passive filter.
I. NOMENCLATURE
VTHD = Total Harmonic Distortion of voltage
ITHD = Total Harmonic Distortion of current
h = Harmonic Order
n = Total Number of Harmonic Order
V = Voltage in volts
I = Current in amperes
C = Capacitance in farads
L = Inductance in henries
R = Resistance in ohms
1 = Fundamental Component
FFT = Fast Fourier Transform
BW = Bandwidth in HZ
SCR = Short Circuit ratio
fV = Forward voltage
II. INTRODUCTION
OWADAYS, power quality has become a great concern
for both utilities and customers. With the increasing use
of non-linear load being connected to the power system,
more studies are needed. The problems associated with high
harmonic content in the power system do not only result in
the poor quality of supply but also the operation of the
D. C. Bhonsle, research scholar, corresponding author, is with the
Department of Electrical Engineering, C. K. Pithawalla College of Engg. &
Tech., Nr Malvan Mandir, Dumas Road, Surat, Gujarat. (E-mail:
Dr. R. B. Kelkar, Professor with the Department of Electrical
Engineering, M. S. University, Baroda, Gujarat.
system will get affected. The major sources of harmonics are
from the three categories of equipment: power system
equipments, industrial loads and domestic loads. Harmonic
currents are generated to a small extent and low distortion
level by generation, transmission and distribution
equipments and to a larger extent by the industrial and
domestic loads [1-5].
III. HARMONIC FIELD MEASUREMENT
Harmonic field measurement is done to verify the degree
of severity of harmonic distortion due to domestic non-linear
loads in the distribution system [9-11]. There are number of
solid state controlled non-linear equipments are used for
domestic application such as electronic fan regulator,
personnel computer, printer, etc. These non-linear loads
inject harmonic currents in the network thus distorting
supply voltage.
In carrying out harmonic measurement at Faculty of
Electrical Engineering Department of C. K. Pithawalla
Collage of Engineering and Technology, Surat, six types of
domestic application were selected. All the measurements
are made at 230 V using Yokogawa make clamp on type
Power Analyzer (200 A, 600 V). Harmonic spectrum for
each load is plotted showing magnitude of each harmonic
frequency that makes up a distorted waveform. The
magnitude of each harmonic frequency can be expressed as a
percentage of fundamental. Total harmonic distortion is
defined from harmonic spectrum as the ratio of the RMS
sum of all harmonic frequencies to the RMS value of the
fundamental.
Mathematically THD is expressed by the following
equations [6-9]:
1
2
2
)(
V
V
THD
h
n
h
V
∑=
= (1)
1
2
2
)(
I
I
THD
h
n
h
I
∑=
= (2)
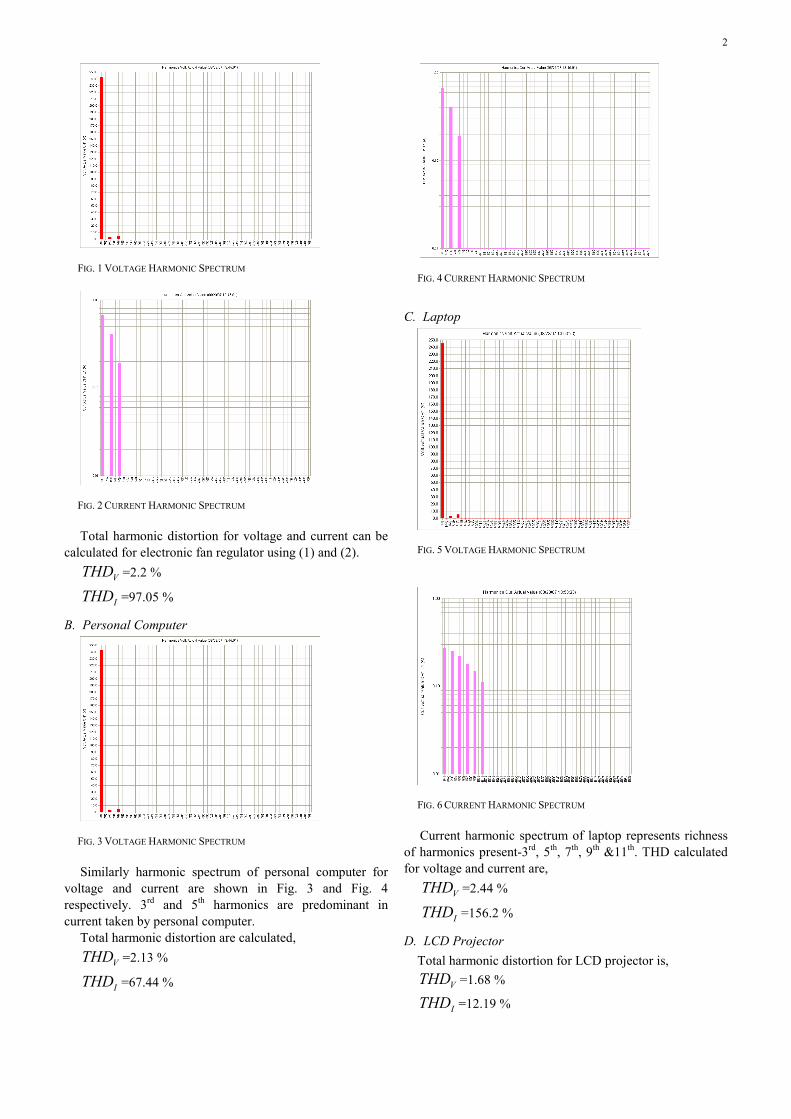
A. Electronic Fan Regulator
The result from measurement of voltage harmonic
spectrum and current harmonic spectrum of electronic fan
regulator are shown in Fig. 1 and Fig. 2.
Harmonic Measurement and Passive Filter
Simulation using MATLAB D C Bhonsle, Dr R B Kelkar
N
2
FIG. 1 VOLTAGE HARMONIC SPECTRUM
FIG. 2 CURRENT HARMONIC SPECTRUM
Total harmonic distortion for voltage and current can be
calculated for electronic fan regulator using (1) and (2).
VTHD =2.2 %
ITHD =97.05 %
B. Personal Computer
FIG. 3 VOLTAGE HARMONIC SPECTRUM
Similarly harmonic spectrum of personal computer for
voltage and current are shown in Fig. 3 and Fig. 4
respectively. 3rd
and 5th
harmonics are predominant in
current taken by personal computer.
Total harmonic distortion are calculated,
VTHD =2.13 %
ITHD =67.44 %
FIG. 4 CURRENT HARMONIC SPECTRUM
C. Laptop
FIG. 5 VOLTAGE HARMONIC SPECTRUM
FIG. 6 CURRENT HARMONIC SPECTRUM
Current harmonic spectrum of laptop represents richness
of harmonics present-3rd
, 5th
, 7th
, 9th
&11th
. THD calculated
for voltage and current are,
VTHD =2.44 %
ITHD =156.2 %
D. LCD Projector
Total harmonic distortion for LCD projector is,
VTHD =1.68 %
ITHD =12.19 %
3
FIG. 7 VOLTAGE HARMONIC SPECTRUM
FIG. 8 CURRENT HARMONIC SPECTRUM
IV. SUMMARY
FIG. 9 VOLTAGE AND CURRENT HARMONIC DISTORTION OF DOMESTIC
NON-LINEAR LOADS
The IEEE 519-1992 [12] has imposed limits on total
harmonic distortion (THD), as shown in appendix. Fig. 9
shows that voltage distortion limits of non-linear loads are
within limits. Current harmonic distortion ranges from 12.9
% to 156.2 %.
V. HARMONIC SIMULATION
The sources of harmonic can be simulated using
MATLAB 7.2 Math Works 2006. Full wave Diode Bridge
feeding a capacitor and a resistance in parallel is designed to
simulate a non-linear load as shown in Fig. 10.
Standard FFT package of MATLAB is used to plot
voltage, current harmonic spectrum and to calculate THD of
the same. The results are shown in Fig. 11. While analyzing
current harmonic spectrum of simulated non-linear load, it
found that 3rd
, 5th
and 7th
odd harmonics are predominant.
The subsequent subsection describes the procedure for
designing single tuned passive filter for elimination of above
said harmonics.
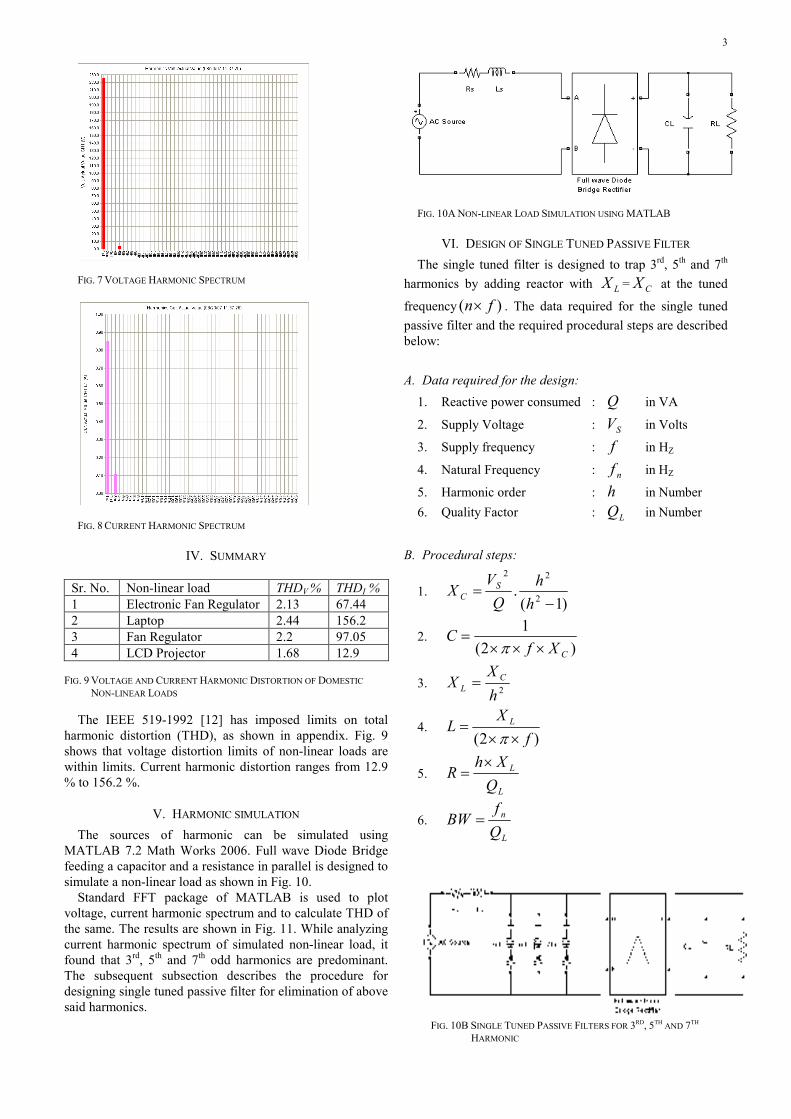
FIG. 10A NON-LINEAR LOAD SIMULATION USING MATLAB
VI. DESIGN OF SINGLE TUNED PASSIVE FILTER
The single tuned filter is designed to trap 3rd
, 5th
and 7th
harmonics by adding reactor with LX = CX at the tuned
frequency )( fn× . The data required for the single tuned
passive filter and the required procedural steps are described
below:
A. Data required for the design:
1. Reactive power consumed : Q in VA
2. Supply Voltage : SV in Volts
3. Supply frequency : f in HZ
4. Natural Frequency : nf in HZ
5. Harmonic order : h in Number
6. Quality Factor : LQ in Number
B. Procedural steps:
1. )1(
.2
22
−=
h
h
Q
VX S
C
2. )2(
1
CXfC
×××=
π
3. 2h
XX C
L =
4. )2( f
XL L
××=
π
5.
L
L
Q
XhR
×=
6.
L
n
Q
fBW =
FIG. 10B SINGLE TUNED PASSIVE FILTERS FOR 3RD, 5TH
AND 7TH
HARMONIC
Sr. No. Non-linear load THDV % THDI %
1 Electronic Fan Regulator 2.13 67.44
2 Laptop 2.44 156.2
3 Fan Regulator 2.2 97.05
4 LCD Projector 1.68 12.9
4
Following above said procedural steps, three single tuned
passive filters are designed to take care 3rd
, 5th
and 7th
harmonics and implemented in MATLAB with the simulated
diode bridge non-linear load shown as shown in Fig. 10B.
The FFT analysis with and without passive filter is
compared in the fore coming section.
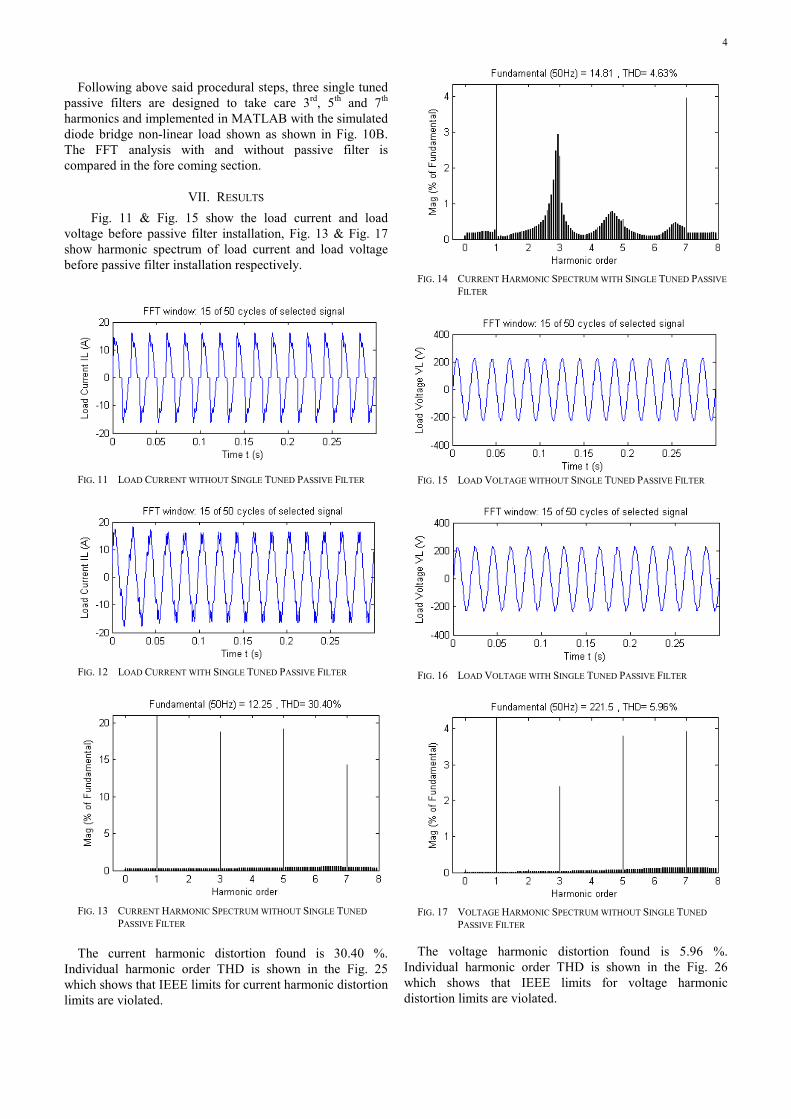
VII. RESULTS
Fig. 11 & Fig. 15 show the load current and load
voltage before passive filter installation, Fig. 13 & Fig. 17
show harmonic spectrum of load current and load voltage
before passive filter installation respectively.
FIG. 11 LOAD CURRENT WITHOUT SINGLE TUNED PASSIVE FILTER
FIG. 12 LOAD CURRENT WITH SINGLE TUNED PASSIVE FILTER
FIG. 13 CURRENT HARMONIC SPECTRUM WITHOUT SINGLE TUNED
PASSIVE FILTER
The current harmonic distortion found is 30.40 %.
Individual harmonic order THD is shown in the Fig. 25
which shows that IEEE limits for current harmonic distortion
limits are violated.
FIG. 14 CURRENT HARMONIC SPECTRUM WITH SINGLE TUNED PASSIVE
FILTER
FIG. 15 LOAD VOLTAGE WITHOUT SINGLE TUNED PASSIVE FILTER
FIG. 16 LOAD VOLTAGE WITH SINGLE TUNED PASSIVE FILTER
FIG. 17 VOLTAGE HARMONIC SPECTRUM WITHOUT SINGLE TUNED
PASSIVE FILTER
The voltage harmonic distortion found is 5.96 %.
Individual harmonic order THD is shown in the Fig. 26
which shows that IEEE limits for voltage harmonic
distortion limits are violated.
5
FIG. 18 VOLTAGE HARMONIC SPECTRUM WITH SINGLE TUNED
PASSIVE FILTER
Fig. 12 & Fig. 16 show the load current and load voltage
after passive filter installation, Fig. 14 & Fig. 18 show
harmonic spectrum of load current and load voltage after
passive filter installation respectively.
FFT window selected for 15 of 50 cycles of selected
current and voltage signals. Total harmonic distortion in
current was reduced to 4.63 % from 30.40 % after passive
filter installation. Whereas voltage harmonic distortion is
reduced to 1.33 % from 5.96 % after passive filters
installation.
Moreover considerable reduction in the total harmonic
distortion in the respective order of harmonic is noticed,
tabulated at the end of this section, shown in Fig. 25 & Fig.
26.
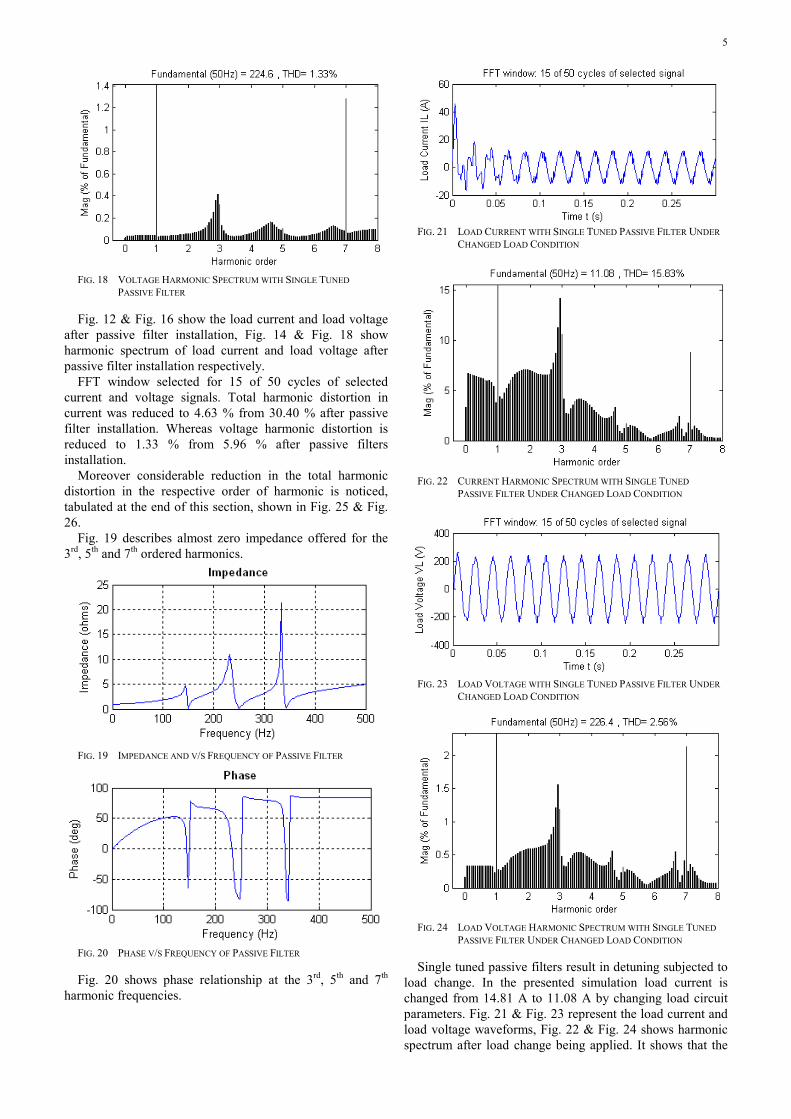
Fig. 19 describes almost zero impedance offered for the
3rd
, 5th
and 7th
ordered harmonics.
FIG. 19 IMPEDANCE AND V/S FREQUENCY OF PASSIVE FILTER
FIG. 20 PHASE V/S FREQUENCY OF PASSIVE FILTER
Fig. 20 shows phase relationship at the 3rd
, 5th
and 7th
harmonic frequencies.
FIG. 21 LOAD CURRENT WITH SINGLE TUNED PASSIVE FILTER UNDER
CHANGED LOAD CONDITION
FIG. 22 CURRENT HARMONIC SPECTRUM WITH SINGLE TUNED
PASSIVE FILTER UNDER CHANGED LOAD CONDITION
FIG. 23 LOAD VOLTAGE WITH SINGLE TUNED PASSIVE FILTER UNDER
CHANGED LOAD CONDITION
FIG. 24 LOAD VOLTAGE HARMONIC SPECTRUM WITH SINGLE TUNED
PASSIVE FILTER UNDER CHANGED LOAD CONDITION
Single tuned passive filters result in detuning subjected to
load change. In the presented simulation load current is
changed from 14.81 A to 11.08 A by changing load circuit
parameters. Fig. 21 & Fig. 23 represent the load current and
load voltage waveforms, Fig. 22 & Fig. 24 shows harmonic
spectrum after load change being applied. It shows that the

6
current harmonic distortion increases to 15.83 % from 4.63
% and voltage harmonic distortion reaches 2.56 % from 1.33
% as shown in Fig. 27.
Before PF After PF % Reduction
3rd
2.3 A 0.34 A 85.21 A
5th
2.34 A 0.08 A 96.58 A
7th
1.75 A 0.59 A 66.28 A
THD 30.40 % 4.63 % 84.76
FIG. 25 IMPROVEMENT IN LOAD CURRENT THD
Before PF After PF % Reduction
3rd
5.3 V 0.73 V 86.22
5th
8.42 V 0.23 V 97.26
7th
8.67 V 1.28 V 66.78
THD 5.96 % 1.33 % 77.68
FIG. 26 IMPROVEMENT IN LOAD VOLTAGE THD
Load Current in % Load Voltage in %
3rd
10.53 1.19
5th
1.70 0.31
7th
8.81 2.31
THD 15.83 2.56
FIG. 27 CHANGE IN LOAD CURRENT AND LOAD VOLTAGE DUE TO
DETUNNING
VIII. CONCLUSION
Harmonic is the predominant power quality issue. Non-
linear domestic loads connected in the distribution system
inject considerable current harmonics in the supply system
resulting in ITHD ranging from 12.9 % to 156.2 % which
violates the limits specified by IEEE 519 for current
harmonic distortion.
Filtering is one of the solutions to prevent the harmonic
from entering the rest of the system. Implementation of
single tuned passive filter taking care of 3rd
, 5th
and 7th
harmonic, suppresses the ITHD by 84.76 % and VTHD by
77.68 %.
Changed system configuration changes the harmonic
profile of the system resulting in detuning, stating the
limitation of passive filters.
IX. APPENDIX
A. Harmonic Voltage limits by IEEE 519
Bus Voltage in KV VTHD in %
69 & above 5.0
115-161 2.5
>161 1.0
B. Harmonic Current limits by IEEE 519
SCR ITHD in %
<20 5.0
20-50 8.0
50-100 12.0
11-15 20.0
C. Designed Circuit Parameters used for simulation of
non-linear load
SV 230 Volts LC 100 µF
f 50 HZ LR 20 Ω
SR 1 Ω fV 0.8 Volts
SX 2.2 mH
D. Designed Circuit Parameters used for simulation of
Passive Filters
For 3rd
Harmonic For 5th
Harmonic For 7th
Harmonic
R Ω 0.1 R Ω 0.033 R Ω 0.017
C µF 42.67 C µF 14.2 C µF 29.1
L mH 26.4 L mH 28.51 L mH 7.4
X. ACKNOWLEDGMENT
The authors gratefully acknowledge the contributions of
Torrent Power PQ Cell, Surat for their assistance in field
measurement of harmonic distortion,
XI. REFERENCES
Papers from Conference Proceedings (Published): [1] D. C. Bhonsle, Dr. R. B. Kelkar and N. K. Zaveri, “Power Quality
Issues-In Distribution System”, IE(I) 23rd National Convention of
Electrical Engineers, Pune, November 2007 Proceedings, pp. 108-
111.
[2] Dalila Mat Said Ahmed, Abdullah asuhaimi, Mohd Zin, "Power
Supply Quality Improvement: Harmonic Measurement and
Simulation," National Power and Energy Conference (PECon), 2003
Proceedings, Bangi, Malaysia, pp. 352-358.
[3] C. Gopalkrishnan, K Udaykumar, T. A. Raghvendiran, "Survey of
Harmonic Distortion for Power Quality Measurement and
Application of Standard including Simulation," 2001, Anna
University, India.
[4] L. A. Moran, J. W. Dixon, J. R. Espinoza, R. R. Wallace, “Using
Active Power Filter to Improve Power Quality”, Santiago, Chile,
2000.
[5] K. C. Umeh, A. Mohamed, R. Mohmed, “ Comparing The Harmonic
Characteristics of Typical Single Phase Nonlinear Loads”, National
Power Energy Conference (PECon) 2003 Proceedings, Bangi,
Malaysia, pp. 383-387.
Books: [6] J. Arrillaga, D. A. Bradley, P. S. Bodger, “Power System
Harmonics”, New York: Wiley, 1985.
[7] E. Acha, M. Madrigal, “Power System Harmonics”, Computer
Modeling and Analysis, New York: Wiley, 2001.
[8] W. Mack Grady, Surya Santoso, “Understanding Power System
Harmonics”, IEEE Power Engineering Review, November, 2001.
Technical Reports: [9] M. S. Lalli, I. P. S. Paul, “ Field Measurement of Power Quality in
Steel Rolling Mills”, Centerl Power Research Institute (CPRI),
Banglore. Pp. 279-282.
[10] Fluke Corporation, “Common Power Quality Factors affecting
Transformers”, An Application Note, 2002.
[11] Marty Martin, P. E., “Two Modern Power Quality Issues- Harmonics
and Grounding”, an Article.
Standards: [12] IEEE Recommended Practices and Requirements for Harmonic
Control of Electrical Power Systems, IEEE Standards, 519, 1992,
1993.


![Passive design[1]](https://static.fdokumen.com/doc/165x107/63215c9580403fa2920cb59b/passive-design1.jpg)