Handbook on the Physics and Chemistry of Rare Earths, Volume 44 ...
496
-
Upload
khangminh22 -
Category
Documents
-
view
0 -
download
0
Transcript of Handbook on the Physics and Chemistry of Rare Earths, Volume 44 ...


Handbook on the Physics andChemistry of Rare Earths
Including Actinides
Volume 44

HANDBOOK ON THE PHYSICS AND CHEMISTRYOF RARE EARTHS
Including Actinides
Advisory Editorial Board
GIN-YA ADACHI
Kobe, JapanWILLIAM J. EVANS
Irvine, USAYURI GRIN
Dresden, GermanySUZAN M. KAUZLARICH
Davis, USAMICHAEL F. REID
Canterbury, New ZealandCHUNHUA YAN
Beijing, P.R. China
Editors Emeritus
KARL A. GSCHNEIDNER, JR
Ames, USALEROY EYRINGw
Tempe, USA
wDeceased (2005)

Handbook on thePhysics and Chemistry
of Rare EarthsIncluding Actinides
Volume 44
Editors
Jean-Claude G. BUNZLISwiss Federal Institute of Technology, Lausanne (EPFL)
Institute of Chemical Sciences and EngineeringBCH 1402
CH-1015 LausanneSwitzerland
Vitalij K. PECHARSKYThe Ames Laboratory, U.S. Department of Energy, and
Department of Materials Science and EngineeringIowa State University
Ames, Iowa 50011-3020USA
North-Holland is an imprint of Elsevier

North-Holland is an imprint of ElsevierRadarweg 29, PO Box 211, 1000 AE Amsterdam, The NetherlandsThe Boulevard, Langford Lane, Kidlington, Oxford OX5 1GB, UK
Copyright © 2014 Elsevier B.V. All rights reserved.
No part of this publication may be reproduced, stored in a retrieval system or transmitted in anyform or by any means electronic, mechanical, photocopying, recording or otherwise without theprior written permission of the publisher.
Permissions may be sought directly from Elsevier’s Science & Technology RightsDepartment in Oxford, UK: phone (+44) (0) 1865 843830; fax (+44) (0) 1865 853333;email: [email protected]. Alternatively you can submit your request online by visitingthe Elsevier web site at http://elsevier.com/locate/permissions, and selecting, Obtainingpermission to use Elsevier material.
NoticeNo responsibility is assumed by the publisher for any injury and/or damage to persons or propertyas a matter of products liability, negligence or otherwise, or from any use or operation of anymethods, products, instructions or ideas contained in the material herein. Because of rapidadvances in the medical sciences, in particular, independent verification of diagnoses and drugdosages should be made.
British Library Cataloguing in Publication DataA catalogue record for this book is available from the British Library
Library of Congress Cataloging-in-Publication DataA catalog record for this book is available from the Library of Congress
ISBN: 978-0-444-62711-7ISSN: 0168-1273
For information on all North-Holland publicationsvisit our website at store.elsevier.com
Printed and Bound in Great Britain
14 15 16 13 12 11 10 9 8 7 6 5 4 3 2 1
Preface
Jean-Claude G. Bunzli and Vitalij K. Pecharsky
These elements perplex us in our reaches [sic], baffle us in our speculations, and haunt
us in our very dreams. They stretch like an unknown sea before us—mocking, mystify-
ing, and murmuring strange revelations and possibilities.
Sir William Crookes (February 16, 1887)
Volume 44 of the Handbook on the Physics and Chemistry of Rare Earthsadds four chapters to the series which span a broad range of subjects, from
catalysis to molten salts, solar energy conversion, and intermetallic com-
pounds R5T4 (T¼Si, Ge, Sn) best known for giant magnetocaloric effect.
The volume is therefore in tune with some of the global concerns about build-
ing a sustainable world.
The first chapter (Chapter 259) is devoted to a fairly new aspect of lantha-
nide catalysts, namely the use of borohydride complexes in polymerization of
polar monomers. Borohydride catalysts were proposed about a decade ago for
the ring-opening polymerization (ROP) of cyclic esters and the review
presents extensive data about the exact experimental conditions, molecular
characteristics, and performances of these catalysts. Emphasis is given to
the strategies adopted by chemists to improve the steric control of the poly-
merization in relationship with tailored rare-earth ligands. The following
review (Chapter 260) deals with melts of rare-earth inorganic salts. These
liquids are known for a long time, but deciphering their exact structure is still
a challenging problem. Major instrumental techniques to deal with this prob-
lem are X-ray and neutron diffraction. The author therefore first focuses on
the definition of the radial distribution function and on the various data treat-
ments leading to estimates of the coordination numbers of the first and second
coordination sphere. The formation of polymers and clusters is carefully
assessed with respect to their influence on coordination numbers. Potential
contribution of rare-earth materials to solar energy conversion is critically
evaluated in Chapter 261. Light-to-electricity conversion by semiconductors
suffers from a major problem, namely spectral mismatch between the solar
emission spectrum and the conversion yield versus wavelength. To rectify
the situation, rare earth containing wavelength-converting materials are pro-
posed which transform too energetic or insufficiently energetic photons into
photons with optimum conversion wavelength. In this way, a few welcome
v

percent can be added to the conversion efficiencies of solar cells. The final
chapter (Chapter 262) describes rare-earth R5T4 intermetallic compounds (T
is Si, Ge, Sn, Ga, P, Sb, Bi, or mixtures thereof). These compounds have very
interesting fundamental science and, in addition, a giant magnetocaloric effect
was reported for Gd5Si2Ge2 in 1997, which paved the way for magnetic
refrigeration applications near room temperature. The comprehensive review
deals with composition–structure–property relationships and highlights the
above-mentioned effect and other properties such as colossal magnetostric-
tion, spontaneous generation of voltage, pressure enhancement of magnetoca-
loric effect, unconventional magnetic glass state, spin-flop transition,
magnetic deflagration, or short-range order magnetic correlations.
CHAPTER 259. CATALYTIC BEHAVIOR OF RARE-EARTHBOROHYDRIDE COMPLEXES IN POLYMERIZATION OF POLARMONOMERS
By SOPHIEM.GUILLAUME, LAURENTMARON, and PETERW.ROESKY
Universite de Rennes 1, France, Universite de Toulouse, France, andKarlsruher Institut fur Technologie (KIT), Germany
Rare-earth borohydride complexes have been used in polymerization for
just over a decade. Significant achievements in the synthesis of such organo-
metallic complexes have greatly contributed to their applications as valuable
initiators in various polymerization reactions. The chapter focuses on the
polymerization of polar monomers. The reader is first introduced to a brief
summary of the synthesis and characterization of the rare-earth borohydride
complexes that have revealed activity in such polymerizations. Advances in
polymerization are then addressed from an experimental approach completed
by mechanistic insights through computational density-functional investiga-
tions. The catalytic behavior of rare-earth borohydride complexes in ring-
opening polymerization (ROP) of cyclic esters including various lactones,
lactides, trimethylene carbonate, and a-aminoacid N-carboxyanhydrides, andin the polymerization of methylmethacrylate, is then comprehensively
reviewed. The chapter is unique in that several tables gather the most significant
features of the experimental conditions for the synthesis of the polymers, and of
their molecular characteristics such as molar mass, dispersity values, and tacti-
city. Special emphasis is given to the strategies improving the control and the
livingness of the polymerization. These strategies lead to tailor-made ligands
Prefacevi

with adequate properties and, additionally, allow access to original well-
defined end-functionalized (co)polymers. Beyond the key reducing ability
of the borohydride anion toward the formation of a,o-dihydroxytelechelicpolymers, the implication of the rare-earth ancillary ligand(s) is also high-
lighted. The review will be useful as a reference material for researchers
active in rare-earth-promoted polymerization, in ROP, in hydroxytelechelic
polymers and for other polymer communities as well.
CHAPTER 260. STRUCTURES AND PROPERTIES OFRARE-EARTH MOLTEN SALTS
By YASUHIKO IWADATE
Chiba University, Japan
There is a definite overlap between the concepts of molten salts and ionic
liquids since the former can be defined as high-temperature ionic liquids; how-
ever, the present tendency is to use the term “molten salts” to characterize melts
of purely inorganic compounds. If theoretical modeling of ionic crystals is rel-
atively easy to achieve, for instance making use of X-ray diffraction data, in
view of the periodic arrangements of ions in the structure, it becomes a much
more involved process when molten salts are considered because of interparti-
cle interactions due to collisions. A single experimental technique usually gives
partial reporting of the situation only so that a multiple-technique approach has
to be used. For instance, X-ray diffraction, vibrational spectroscopy, density
measurements, molecular dynamics, and Monte Carlo calculations are com-
monly combined to gain an objective representation of the ionic liquid state.
The review first focuses on the definition of the radial distribution function
and on the various ways prevailing to the estimate of coordination numbers
in both the first and second shell from this function. The state of knowledge
pertaining to melts of rare earth and alkali halides and salts with polyatomic
anions is then critically detailed. An important point is the penetration of ions
from the second into the first coordination sphere and its effect on coordination
numbers. Finally, the formation of polymeric ions and their clustering is consid-
ered in the context of conciliating experimental data with the stoichiometry of
Preface vii
the salts. The review is aimed at inorganic chemists and materials scientists
dealing with electrolytes and their applications.
CHAPTER 261. LANTHANIDES IN SOLAR ENERGYCONVERSION
By JEAN-CLAUDE G. BUNZLI and ANNE-SOPHIE CHAUVIN
Ecole Polytechnique Federale de Lausanne (EPFL), Switzerland
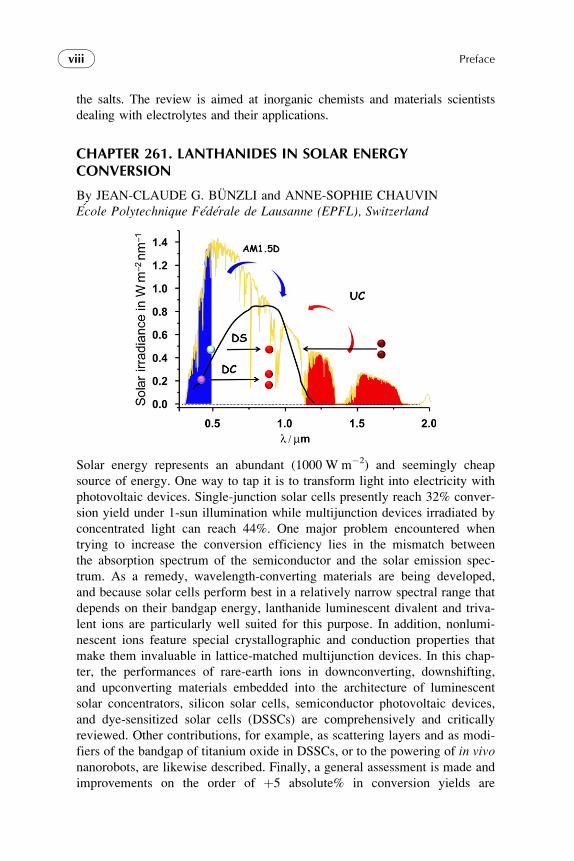
Solar energy represents an abundant (1000 W m�2) and seemingly cheap
source of energy. One way to tap it is to transform light into electricity with
photovoltaic devices. Single-junction solar cells presently reach 32% conver-
sion yield under 1-sun illumination while multijunction devices irradiated by
concentrated light can reach 44%. One major problem encountered when
trying to increase the conversion efficiency lies in the mismatch between
the absorption spectrum of the semiconductor and the solar emission spec-
trum. As a remedy, wavelength-converting materials are being developed,
and because solar cells perform best in a relatively narrow spectral range that
depends on their bandgap energy, lanthanide luminescent divalent and triva-
lent ions are particularly well suited for this purpose. In addition, nonlumi-
nescent ions feature special crystallographic and conduction properties that
make them invaluable in lattice-matched multijunction devices. In this chap-
ter, the performances of rare-earth ions in downconverting, downshifting,
and upconverting materials embedded into the architecture of luminescent
solar concentrators, silicon solar cells, semiconductor photovoltaic devices,
and dye-sensitized solar cells (DSSCs) are comprehensively and critically
reviewed. Other contributions, for example, as scattering layers and as modi-
fiers of the bandgap of titanium oxide in DSSCs, or to the powering of in vivonanorobots, are likewise described. Finally, a general assessment is made and
improvements on the order of þ5 absolute% in conversion yields are
Prefaceviii

predicted provided fully optimized materials can be created. The review will
help scientists and materials engineers planning wavelength-converting mate-
rials for photovoltaic uses and, also, represents a welcome introductory text
for anyone interested in the field.
CHAPTER 262. R5T4 COMPOUNDS: AN EXTRAORDINARYVERSATILE MODEL SYSTEM FOR THE SOLID STATE SCIENCE
By YAROSLAV MUDRYK, VITALIJ K. PECHARSKY, and KARL A.
GSCHNEIDNER Jr.
Ames Laboratory, Iowa State University, USA
Rare-earth metals form intermetallic compounds with most of the metallic and
semi-metallic elements in the periodic table. Due to chemical similarities
among 16 of the 17 rare-earth elements (Sc frequently stands apart), they
often form families of either isostructural or closely related compounds.
Despite a long history of research in a broad field of intermetallics, a general
theory that enables one to clearly relate composition and structure with physi-
cal properties of a multicomponent alloy is still lacking. The review describes
a family of intermetallic materials formed by the rare-earth metals (R) and
Group 14 elements (T, which can also include certain quantities of Group
13 and Group 15 elements substituted for Group 14 elements) at the R5T4
stoichiometry. The uniqueness of these compounds lies in their distinctly
layered crystallography that can be judiciously controlled by chemistry,
Preface ix

processing, and a variety of external triggers including temperature, pressure,
and magnetic field. The materials exhibit a host of physical effects related to
magnetic and structural transformations that can occur separately or simulta-
neously. Unlike many other extended families of intermetallic materials,
present-day understanding of the composition–structure–physical property
relationships of R5T4 compounds approaches predictive power, and in this
chapter, examples of how one can predict some of the interesting physics
based on the knowledge of chemical composition and crystal structure of
these materials are shown. This review will be useful for researchers in the
field of intermetallic compounds and materials engineers seeking materials
that exhibit sharp changes of physical properties associated with first-order
phase transitions.
Prefacex
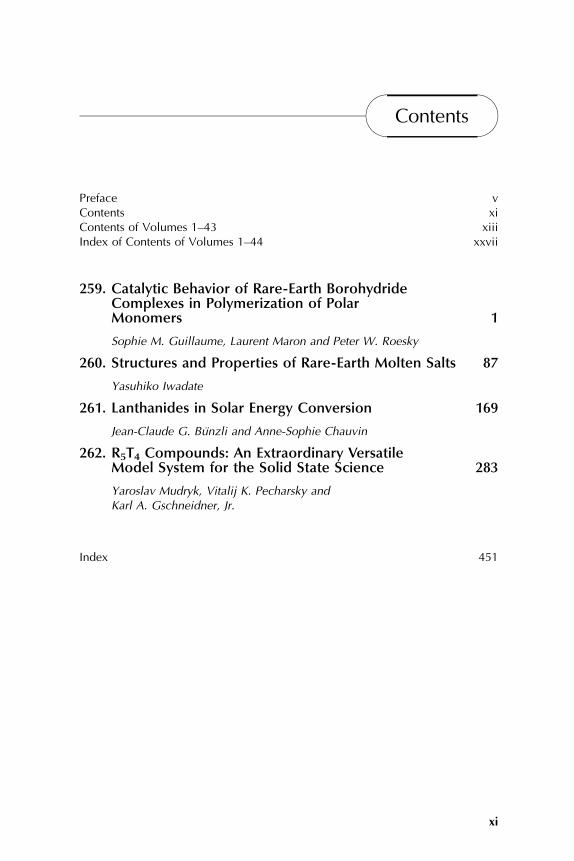
Contents
Preface vContents xiContents of Volumes 1–43 xiiiIndex of Contents of Volumes 1–44 xxvii
259. Catalytic Behavior of Rare-Earth BorohydrideComplexes in Polymerization of PolarMonomers 1
Sophie M. Guillaume, Laurent Maron and Peter W. Roesky
260. Structures and Properties of Rare-Earth Molten Salts 87
Yasuhiko Iwadate
261. Lanthanides in Solar Energy Conversion 169
Jean-Claude G. Bunzli and Anne-Sophie Chauvin
262. R5T4 Compounds: An Extraordinary VersatileModel System for the Solid State Science 283
Yaroslav Mudryk, Vitalij K. Pecharsky andKarl A. Gschneidner, Jr.
Index 451
xi

This page intentionally left blank

Contents of Volumes 1–43
VOLUME 1: Metals
1978, 1st repr. 1982, 2nd repr. 1991; ISBN 0-444-85020-1
1. Z.B. Goldschmidt, Atomic properties (free atom) 1
2. B.J. Beaudry and K.A. Gschneidner Jr, Preparation and basic properties of the rareearth metals 173
3. S.H. Liu, Electronic structure of rare earth metals 233
4. D.C. Koskenmaki and K.A. Gschneidner Jr, Cerium 337
5. L.J. Sundstrom, Low temperature heat capacity of the rare earth metals 379
6. K.A. McEwen, Magnetic and transport properties of the rare earths 411
7. S.K. Sinha, Magnetic structures and inelastic neutron scattering: metals, alloys andcompounds 489
8. T.E. Scott, Elastic and mechanical properties 591
9. A. Jayaraman, High pressure studies: metals, alloys and compounds 707
10. C. Probst and J. Wittig, Superconductivity: metals, alloys and compounds 749
11. M.B. Maple, L.E. DeLong and B.C. Sales, Kondo effect: alloys and compounds 797
12. M.P. Dariel, Diffusion in rare earth metals 847
Subject index 877
VOLUME 2: Alloys and intermetallics1979, 1st repr. 1982, 2nd repr. 1991; ISBN 0-444-85021-X
13. A. landelli and A. Palenzona, Crystal chemistry of intermetallic compounds 1
14. H.R. Kirchmayr and C.A. Poldy, Magnetic properties of intermetallic compounds ofrare earth metals 55
15. A.E. Clark, Magnetostrictive RFe2 intermetallic compounds 231
16. J.J. Rhyne, Amorphous magnetic rare earth alloys 259
17. P. Fulde, Crystal fields 295
18. R.G. Barnes, NMR, EPR and Mossbauer effect: metals, alloys and compounds 387
19. P. Wachter, Europium chalcogenides: EuO, EuS, EuSe and EuTe 507
20. A. Jayaraman, Valence changes in compounds 575
Subject index 613
VOLUME 3: Non-metallic compounds – I1979, 1st repr. 1984; ISBN 0-444-85215-8
21. L.A. Haskin and T.P. Paster, Geochemistry and mineralogy of the rare earths 1
22. J.E. Powell, Separation chemistry 81
23. C.K. J�rgensen, Theoretical chemistry of rare earths 111
24. W.T. Carnall, The absorption and fluorescence spectra of rare earth ions insolution 171
25. L.C. Thompson, Complexes 209
26. G.G. Libowitz and A.J. Maeland, Hydrides 299
27. L. Eyring, The binary rare earth oxides 337
28. D.J.M. Bevan and E. Summerville, Mixed rare earth oxides 401
xiii

29. C.P. Khattak and F.F.Y. Wang, Perovskites and garnets 525
30. L.H. Brixner, J.R. Barkley and W. Jeitschko, Rare earth molybdates (VI) 609
Subject index 655
VOLUME 4: Non-metallic compounds – II1979, 1st repr. 1984; ISBN 0-444-85216-6
31. J. Flahaut, Sulfides, selenides and tellurides 1
32. J.M. Haschke, Halides 89
33. F. Hulliger, Rare earth pnictides 153
34. G. Blasse, Chemistry and physics of R-activated phosphors 237
35. M.J. Weber, Rare earth lasers 275
36. F.K. Fong, Nonradiative processes of rare-earth ions in crystals 317
37A. J.W. O’Laughlin, Chemical spectrophotometric and polarographic methods 341
37B. S.R. Taylor, Trace element analysis of rare earth elements by spark source massspectroscopy 359
37C. R.J. Conzemius, Analysis of rare earth matrices by spark source massspectrometry 377
37D. E.L. DeKalb and V.A. Fassel, Optical atomic emission and absorption methods 405
37E. A.P. D’Silva and V.A. Fassel, X-ray excited optical luminescence of the rareearths 441
37F. F.W.V. Boynton, Neutron activation analysis 457
37G. S. Schuhmann and J.A. Philpotts, Mass-spectrometric stable-isotope dilution analysisfor lanthanides in geochemical materials 471
38. J. Reuben and G.A. Elgavish, Shift reagents and NMR of paramagnetic lanthanidecomplexes 483
39. J. Reuben, Bioinorganic chemistry: lanthanides as probes in systems of biologicalinterest 515
40. T.J. Haley, Toxicity 553
Subject index 587
VOLUME 51982, 1st repr. 1984; ISBN 0-444-86375-3
41. M. Gasgnier, Rare earth alloys and compounds as thin films 1
42. E. Gratz and M.J. Zuckermann, Transport properties (electrical resitivity,thermoelectric power thermal conductivity) of rare earth intermetalliccompounds 117
43. F.P. Netzer and E. Bertel, Adsorption and catalysis on rare earth surfaces 217
44. C. Boulesteix, Defects and phase transformation near room temperature in rare earthsesquioxides 321
45. O. Greis and J.M. Haschke, Rare earth fluorides 387
46. C.A. Morrison and R.P. Leavitt, Spectroscopic properties of triply ionized lanthanidesin transparent host crystals 461
Subject index 693
VOLUME 6
1984; ISBN 0-444-86592-6
47. K.H.J. Buschow, Hydrogen absorption in intermetallic compounds 1
48. E. Parthe and B. Chabot, Crystal structures and crystal chemistry of ternary rareearth–transition metal borides, silicides and homologues 113
49. P. Rogl, Phase equilibria in ternary and higher order systems with rare earth elementsand boron 335
Contents of Volumes 1–43xiv

50. H.B. Kagan and J.L. Namy, Preparation of divalent ytterbium and samariumderivatives and their use in organic chemistry 525
Subject index 567
VOLUME 7
1984; ISBN 0-444-86851-8
51. P. Rogl, Phase equilibria in ternary and higher order systems with rare earth elementsand silicon 1
52. K.H.J. Buschow, Amorphous alloys 265
53. H. Schumann and W. Genthe, Organometallic compounds of the rare earths 446
Subject index 573
VOLUME 8
1986; ISBN 0-444-86971-9
54. K.A. Gschneidner Jr and F.W. Calderwood, Intra rare earth binary alloys: phaserelationships, lattice parameters and systematics 1
55. X. Gao, Polarographic analysis of the rare earths 163
56. M. Leskela and L. Niinisto, Inorganic complex compounds I 203
57. J.R. Long, Implications in organic synthesis 335
Errata 375
Subject index 379
VOLUME 9
1987; ISBN 0-444-87045-8
58. R. Reisfeld and C.K. J�rgensen, Excited state phenomena in vitreous materials 1
59. L. Niinisto and M. Leskela, Inorganic complex compounds II 91
60. J.-C.G. Bunzli, Complexes with synthetic ionophores 321
61. Zhiquan Shen and Jun Ouyang, Rare earth coordination catalysis in stereospecificpolymerization 395
Errata 429
Subject index 431
VOLUME 10: High energy spectroscopy
1987; ISBN 0-444-87063-6
62. Y. Baer and W.-D. Schneider, High-energy spectroscopy of lanthanide materials – Anoverview 1
63. M. Campagna and F.U. Hillebrecht, f-electron hybridization and dynamical screeningof core holes in intermetallic compounds 75
64. O. Gunnarsson and K. Schonhammer, Many-body formulation of spectra of mixedvalence systems 103
65. A.J. Freeman, B.I. Min and M.R. Norman, Local density supercell theory ofphotoemission and inverse photoemission spectra 165
66. D.W. Lynch and J.H. Weaver, Photoemission of Ce and its compounds 231
67. S. Hufner, Photoemission in chalcogenides 301
68. J.F. Herbst and J.W. Wilkins, Calculation of 4f excitation energies in the metals andrelevance to mixed valence systems 321
69. B. Johansson and N. Martensson, Thermodynamic aspects of 4f levels in metals andcompounds 361
70. F.U. Hillebrecht and M. Campagna, Bremsstrahlung isochromat spectroscopy of alloysand mixed valent compounds 425
Contents of Volumes 1–43 xv

71. J. Rohler, X-ray absorption and emission spectra 453
72. F.P. Netzer and J.A.D. Matthew, Inelastic electron scattering measurements 547
Subject index 601
VOLUME 11: Two-hundred-year impact of rare earths on science
1988; ISBN 0-444-87080-6
H.J. Svec, Prologue 1
73. F. Szabadvary, The history of the discovery and separation of the rare earths 33
74. B.R. Judd, Atomic theory and optical spectroscopy 81
75. C.K. J�rgensen, Influence of rare earths on chemical understanding andclassification 197
76. J.J. Rhyne, Highlights from the exotic phenomena of lanthanide magnetism 293
77. B. Bleaney, Magnetic resonance spectroscopy and hyperfine interactions 323
78. K.A. Gschneidner Jr and A.H. Daane, Physical metallurgy 409
79. S.R. Taylor and S.M. McLennan, The significance of the rare earths in geochemistryand cosmochemistry 485
Errata 579
Subject index 581
VOLUME 12
1989; ISBN 0-444-87105-5
80. J.S. Abell, Preparation and crystal growth of rare earth elements and intermetalliccompounds 1
81. Z. Fisk and J.P. Remeika, Growth of single crystals from molten metal fluxes 53
82. E. Burzo and H.R. Kirchmayr, Physical properties of R2Fe14B-based alloys 71
83. A. Szytuła and J. Leciejewicz, Magnetic properties of ternary intermetallic compoundsof the RT2X2 type 133
84. H. Maletta and W. Zinn, Spin glasses 213
85. J. van Zytveld, Liquid metals and alloys 357
86. M.S. Chandrasekharaiah and K.A. Gingerich, Thermodynamic properties of gaseousspecies 409
87. W.M. Yen, Laser spectroscopy 433
Subject index 479
VOLUME 13
1990; ISBN 0-444-88547-1
88. E.I. Gladyshevsky, O.I. Bodak and V.K. Pecharsky, Phase equilibria and crystalchemistry in ternary rare earth systems with metallic elements 1
89. A.A. Eliseev and G.M. Kuzmichyeva, Phase equilibrium and crystal chemistry internary rare earth systems with chalcogenide elements 191
90. N. Kimizuka, E. Takayama-Muromachi and K. Siratori, The systems R2O3–M2O3–
M0O 283
91. R.S. Houk, Elemental analysis by atomic emission and mass spectrometry withinductively coupled plasmas 385
92. P.H. Brown, A.H. Rathjen, R.D. Graham and D.E. Tribe, Rare earth elements inbiological systems 423
Errata 453
Subject index 455
Contents of Volumes 1–43xvi

VOLUME 14
1991; ISBN 0-444-88743-1
93. R. Osborn, S.W. Lovesey, A.D. Taylor and E. Balcar, Intermultiplet transitions usingneutron spectroscopy 1
94. E. Dormann, NMR in intermetallic compounds 63
95. E. Zirngiebl and G. Guntherodt, Light scattering in intermetallic compounds 163
96. P. Thalmeier and B. Luthi, The electron–phonon interaction in intermetalliccompounds 225
97. N. Grewe and F. Steglich, Heavy fermions 343
Subject index 475
VOLUME 15
1991; ISBN 0-444-88966-3
98. J.G. Sereni, Low-temperature behaviour of cerium compounds 1
99. G.-Y. Adachi, N. Imanaka and Zhang Fuzhong, Rare earth carbides 61
100. A. Simon, Hj. Mattausch, G.J. Miller, W. Bauhofer and R.K. Kremer, Metal-richhalides 191
101. R.M. Almeida, Fluoride glasses 287
102. K.L. Nash and J.C. Sullivan, Kinetics of complexation and redox reactions of thelanthanides in aqueous solutions 347
103. E.N. Rizkalla and G.R. Choppin, Hydration and hydrolysis of lanthanides 393
104. L.M. Vallarino, Macrocycle complexes of the lanthanide(III), yttrium(III), anddioxouranium (VI) ions from metal-templated syntheses 443
Errata 513
Subject index 515
CUMULATIVE INDEX, Vols. 1–15
1993; ISBN 0-444-89965-0
VOLUME 161993; ISBN 0-444-89782-8
105. M. Loewenhaupt and K.H. Fischer, Valence-fluctuation and heavy-fermion 4fsystems 1
106. I.A. Smirnov and V.S. Oskotski, Thermal conductivity of rare earth compounds 107
107. M.A. Subramanian and A.W. Sleight, Rare earth pyrochlores 225
108. R. Miyawaki and I. Nakai, Crystal structures of rare earth minerals 249
109. D.R. Chopra, Appearance potential spectroscopy of lanthanides and theirintermetallics 519
Author index 547
Subject index 579
VOLUME 17: Lanthanides/Actinides: Physics – I
1993; ISBN 0-444-81502-3
110. M.R. Norman and D.D. Koelling, Electronic structure, Fermi surfaces, andsuperconductivity in f electron metals 1
111. S.H. Liu, Phenomenological approach to heavy-fermion systems 87
112. B. Johansson and M.S.S. Brooks, Theory of cohesion in rare earths andactinides 149
113. U. Benedict and W.B. Holzapfel, High-pressure studies – Structural aspects 245
Contents of Volumes 1–43 xvii

114. O. Vogt and K. Mattenberger, Magnetic measurements on rare earth and actinidemonopnictides and monochalcogenides 301
115. J.M. Fournier and E. Gratz, Transport properties of rare earth and actinideintermetallics 409
116. W. Potzel, G.M. Kalvius and J. Gal, Mossbauer studies on electronic structure ofintermetallic compounds 539
117. G.H. Lander, Neutron elastic scattering from actinides and anomalouslanthanides 635
Author index 711
Subject index 753
VOLUME 18: Lanthanides/Actinides: Chemistry
1994; ISBN 0-444-81724-7
118. G.T. Seaborg, Origin of the actinide concept 1
119. K. Balasubramanian, Relativistic effects and electronic structure of lanthanide andactinide molecules 29
120. J.V. Beitz, Similarities and differences in trivalent lanthanide- and actinide-ionsolution absorption spectra and luminescence studies 159
121. K.L. Nash, Separation chemistry for lanthanides and trivalent actinides 197
122. L.R. Morss, Comparative thermochemical and oxidation – reduction properties oflanthanides and actinides 239
123. J.W. Ward and J.M. Haschke, Comparison of 4f and 5f element hydrideproperties 293
124. H.A. Eick, Lanthanide and actinide halides 365
125. R.G. Haire and L. Eyring, Comparisons of the binary oxides 413
126. S.A. Kinkead, K.D. Abney and T.A. O’Donnell, f-Element speciation in stronglyacidic media: lanthanide and mid-actinide metals, oxides, fluorides and oxidefluorides in superacids 507
127. E.N. Rizkalla and G.R. Choppin, Lanthanides and actinides hydration andhydrolysis 529
128. G.R. Choppin and E.N. Rizkalla, Solution chemistry of actinides andlanthanides 559
129. J.R. Duffield, D.M. Taylor and D.R. Williams, The biochemistry of the f-elements 591
Author index 623
Subject index 659
VOLUME 19: Lanthanides/Actinides: Physics – II1994; ISBN 0-444-82015-9
130. E. Holland-Moritz and G.H. Lander, Neutron inelastic scattering from actinides andanomalous lanthanides 1
131. G. Aeppli and C. Broholm, Magnetic correlations in heavy-fermion systems: neutronscattering from single crystals 123
132. P. Wachter, Intermediate valence and heavy fermions 177
133. J.D. Thompson and J.M. Lawrence, High pressure studies – Physical properties ofanomalous Ce, Yb and U compounds 383
134. C. Colinet and A. Pasturel, Thermodynamic properties of metallic systems 479
Author index 649
Subject index 693
Contents of Volumes 1–43xviii

VOLUME 20
1995; ISBN 0-444-82014-0
135. Y. Onuki and A. Hasegawa, Fermi surfaces of intermetallic compounds 1
136. M. Gasgnier, The intricate world of rare earth thin films: metals, alloys,intermetallics, chemical compounds,. . . 105
137. P. Vajda, Hydrogen in rare-earth metals, including RH2þx phases 207
138. D. Gignoux and D. Schmitt, Magnetic properties of intermetallic compounds 293
Author index 425
Subject index 457
VOLUME 21
1995; ISBN 0-444-82178-3
139. R.G. Bautista, Separation chemistry 1
140. B.W. Hinton, Corrosion prevention and control 29
141. N.E. Ryan, High-temperature corrosion protection 93
142. T. Sakai, M. Matsuoka and C. Iwakura, Rare earth intermetallics for metal–hydrogenbatteries 133
143. G.-y. Adachi and N. Imanaka, Chemical sensors 179
144. D. Garcia and M. Faucher, Crystal field in non-metallic (rare earth) compounds 263
145. J.-C.G. Bunzli and A. Milicic-Tang, Solvation and anion interaction in organicsolvents 305
146. V. Bhagavathy, T. Prasada Rao and A.D. Damodaran, Trace determination oflanthanides in high-purity rare-earth oxides 367
Author index 385
Subject index 411
VOLUME 22
1996; ISBN 0-444-82288-7
147. C.P. Flynn and M.B. Salamon, Synthesis and properties of single-crystalnanostructures 1
148. Z.S. Shan and D.J. Sellmyer, Nanoscale rare earth–transition metal multilayers:magnetic structure and properties 81
149. W. Suski, The ThMn12-type compounds of rare earths and actinides: structure,magnetic and related properties 143
150. L.K. Aminov, B.Z. Malkin and M.A. Teplov, Magnetic properties of nonmetalliclanthanide compounds 295
151. F. Auzel, Coherent emission in rare-earth materials 507
152. M. Dolg and H. Stoll, Electronic structure calculations for molecules containinglanthanide atoms 607
Author index 731
Subject index 777
VOLUME 231996; ISBN 0-444-82507-X
153. J.H. Forsberg, NMR studies of paramagnetic lanthanide complexes and shiftreagents 1
154. N. Sabbatini, M. Guardigli and I. Manet, Antenna effect in encapsulation complexesof lanthanide ions 69
155. C. Gorller-Walrand and K. Binnemans, Rationalization of crystal-fieldparameterization 121
156. Yu. Kuz’ma and S. Chykhrij, Phosphides 285
Contents of Volumes 1–43 xix

157. S. Boghosian and G.N. Papatheodorou, Halide vapors and vapor complexes 435
158. R.H. Byrne and E.R. Sholkovitz, Marine chemistry and geochemistry of thelanthanides 497
Author index 595
Subject index 631
VOLUME 24
1997; ISBN 0-444-82607-6
159. P.A. Dowben, D.N. McIlroy and Dongqi Li, Surface magnetism of the lanthanides 1
160. P.G. McCormick,Mechanical alloying and mechanically induced chemical reactions 47
161. A. Inoue, Amorphous, quasicrystalline and nanocrystalline alloys in Al- and Mg-basedsystems 83
162. B. Elschner and A. Loidl, Electron-spin resonance on localized magneticmoments in metals 221
163. N.H. Duc, Intersublattice exchange coupling in the lanthanide-transitionmetal intermetallics 339
164. R.V. Skolozdra, Stannides of rare-earth and transition metals 399
Author index 519
Subject index 559
VOLUME 25
1998; ISBN 0-444-82871-0
165. H. Nagai, Rare earths in steels 1
166. R. Marchand, Ternary and higher order nitride materials 51
167. C. Gorller-Walrand and K. Binnemans, Spectral intensities of f–f transitions 101
168. G. Bombieri and G. Paolucci, Organometallic p complexes of the f-elements 265
Author index 415
Subject index 459
VOLUME 261999; ISBN 0-444-50815-1
169. D.F. McMorrow, D. Gibbs and J. Bohr, X-ray scattering studies of lanthanidemagnetism 1
170. A.M. Tishin, Yu.I. Spichkin and J. Bohr, Static and dynamic stresses 87
171. N.H. Duc and T. Goto, Itinerant electron metamagnetism of Co sublattice in thelanthanide–cobalt intermetallics 177
172. A.J. Arko, P.S. Riseborough, A.B. Andrews, J.J. Joyce, A.N. Tahvildar-Zadeh and M.
Jarrell, Photo-electron spectroscopy in heavy fermion systems: Emphasis on singlecrystals 265
Author index 383
Subject index 405
VOLUME 271999; ISBN 0-444-50342-0
173. P.S. Salamakha, O.L. Sologub and O.I. Bodak, Ternary rare-earth-germaniumsystems 1
174. P.S. Salamakha, Crystal structures and crystal chemistry of ternary rare-earthgermanides 225
175. B. Ya. Kotur and E. Gratz, Scandium alloy systems and intermetallics 339
Author index 535
Subject index 553
Contents of Volumes 1–43xx

VOLUME 28
2000; ISBN 0-444-50346-3
176. J.-P. Connerade and R.C. Karnatak, Electronic excitation in atomic species 1
177. G. Meyer and M.S. Wickleder, Simple and complex halides 53
178. R.V. Kumar and H. Iwahara, Solid electrolytes 131
179. A. Halperin, Activated thermoluminescence (TL) dosimeters and related radiationdetectors 187
180. K.L. Nash and M.P. Jensen, Analytical separations of the lanthanides: basic chemistryand methods 311
Author index 373
Subject index 401
VOLUME 29: The role of rare earths in catalysis
2000; ISBN 0-444-50472-9
P. Maestro, Foreword 1
181. V. Paul-Boncour, L. Hilaire and A. Percheron-Guegan, The metals and alloys incatalysis 5
182. H. Imamura, The metals and alloys (prepared utilizing liquid ammonia solutions) incatalysis II 45
183. M.A. Ulla and E.A. Lombardo, The mixed oxides 75
184. J. Kaspar, M. Graziani and P. Fornasiero, Ceria-containing three-way catalysts 159
185. A. Corma and J.M. Lopez Nieto, The use of rare-earth-containing zeolitecatalysts 269
186. S. Kobayashi, Triflates 315
Author index 377
Subject index 409
VOLUME 30: High-Temperature Superconductors – I2000; ISBN 0-444-50528-8
187. M.B. Maple, High-temperature superconductivity in layered cuprates: overview 1
188. B. Raveau, C. Michel and M. Hervieu, Crystal chemistry of superconducting rare-earth cuprates 31
189. Y. Shiohara and E.A. Goodilin, Single-crystal growth for science and technology 67
190. P. Karen and A. Kjekshus, Phase diagrams and thermodynamic properties 229
191. B. Elschner and A. Loidl, Electron paramagnetic resonance in cupratesuperconductors and in parent compounds 375
192. A.A. Manuel, Positron annihilation in high-temperature superconductors 417
193. W.E. Pickett and I.I. Mazin, RBa2Cu3O7 compounds: electronic theory and physicalproperties 453
194. U. Staub and L. Soderholm, Electronic 4f-state splittings in cuprates 491
Author index 547
Subject index 621
VOLUME 31: High-Temperature Superconductors – II
2001; ISBN 0-444-50719-1
195. E. Kaldis, Oxygen nonstoichiometry and lattice effects in YBa2Cu3Ox. Phase
transitions, structural distortions and phase separation 1
196. H.W. Weber, Flux pinning 187
197. C.C. Almasan and M.B. Maple, Magnetoresistance and Hall effect 251
198. T.E. Mason, Neutron scattering studies of spin fluctuations in high-temperaturesuperconductors 281
Contents of Volumes 1–43 xxi

199. J.W. Lynn and S. Skanthakumar, Neutron scattering studies of lanthanide magneticordering 315
200. P.M. Allenspach and M.B. Maple, Heat capacity 351
201. M. Schabel and Z.-X. Shen, Angle-resolved photoemission studies of untwinnedyttrium barium copper oxide 391
202. D.N. Basov and T. Timusk, Infrared properties of high-Tc superconductors: anexperimental overview 437
203. S.L. Cooper, Electronic and magnetic Raman scattering studies of the high-Tccuprates 509
204. H. Sugawara, T. Hasegawa and K. Kitazawa, Characterization of cupratesuperconductors using tunneling spectra and scanning tunneling microscopy 563
Author index 609
Subject index 677
VOLUME 32
2001; ISBN 0-444-50762-0
205. N.H. Duc, Giant magnetostriction in lanthanide-transition metal thin films 1
206. G.M. Kalvius, D.R. Noakes and O. Hartmann, mSR studies of rare-earth and actinidemagnetic materials 55
207. Rainer Pottgen, Dirk Johrendt and Dirk Kußmann, Structure–property relations ofternary equiatomic YbTX intermetallics 453
208. Kurima Kobayashi and Satoshi Hirosawa, Permanent magnets 515
209. I.G. Vasilyeva, Polysulfides 567
210. Dennis K.P. Ng, Jianzhuang Jiang, Kuninobu Kasuga and Kenichi Machida, Half-sandwich tetrapyrrole complexes of rare earths and actinides 611
Author index 655
Subject index 733
VOLUME 33
2003; ISBN 0-444-51323-X
211. Brian C. Sales, Filled skutterudites 1
212. Oksana L. Sologub and Petro S. Salamakha, Rare earth – antimony systems 35
213. R.J.M. Konings and A. Kovacs, Thermodynamic properties of the lanthanide (III)halides 147
214. John B. Goodenough, Rare earth – manganese perovskites 249
215. Claude Piguet and Carlos F.G.C. Geraldes, Paramagnetic NMR lanthanide inducedshifts for extracting solution structures 353
216. Isabelle Billard, Lanthanide and actinide solution chemistry as studied by time-resolved emission spectroscopy 465
217. Thomas Troster, Optical studies of non-metallic compounds under presure 515
Author index 591
Subject index 637
VOLUME 34
2004; ISBN 0-444-51587-9
218. Yaroslav M. Kalychak, Vasyl’ I. Zaremba, Rainer Pottgen, Mar’yana Lukachuk and
Rolf-Dieter Hoffman, Rare earth–transition metal–indides 1
219. P. Thalmeier and G. Zwicknagl, Unconventional superconductivity and magnetism inlanthanide and actinide intermetallic compounds 135
220. James P. Riehl and Gilles Muller, Circularly polarized luminescence spectroscopyfrom lanthanide systems 289
Contents of Volumes 1–43xxii

221. Oliver Guillou and Carole Daiguebonne, Lanthanide-containing coordinationpolymers 359
222. Makoto Komiyama, Cutting DNA and RNA 405
Author index 455
Subject index 493
VOLUME 35
2005; ISBN 0-444-52028-7
223. Natsuko Sakai, Katsuhiko Yamaji, Teruhisa Horita, Yue Ping Xiong and Harumi
Yokokawa, Rare-earth materials for solid oxide fuel cells (SOFC) 1
224. Mathias S. Wickleder, Oxo-selenates of rare-earth elements 45
225. Koen Binnemans, Rare-earth beta-diketonates 107
226. Satoshi Shinoda, Hiroyuki Miyake and Hiroshi Tsukube, Molecular recognition andsensing via rare-earth complexes 273
Author index 337
Subject index 377
VOLUME 36
2006; ISBN 0-444-52142-9
227. Arthur Mar, Bismuthides 1
228. I. Aruna, L.K. Malhotra and B.R. Mehta, Switchable metal hydride films 83
229. Koen Binnemans, Applications of tetravalent cerium compounds 281
230. Robert A. Flowers II and Edamana Prasad, Samarium (II) based reductants 393
Author index 475
Subject index 511
VOLUME 37: Optical Spectroscopy
2007; ISBN 978-0-444-52144-6
231. Kazuyoshi Ogasawara, Shinta Watanabe, Hiroaki Toyoshima and Mikhail G. Brik,
First-principles calculations of 4fn ! 4fn�1 5d transition spectra 1
232. Gary W. Burdick and Michael F. Reid, 4fn�4fn�1 5d transitions 61
233. Guokui Liu and Xueyuan Chen, Spectroscopic properties of lanthanides innanomaterials 99
234. Takuya Nishioka, Koichi Fukui and Kazuko Matsumoto, Lanthanide chelates asluminescent labels in biomedical analyses 171
235. Steve Comby and Jean-Claude G. Bunzli, Lanthanide near-infrared luminescence inmolecular probes and devices 217
Author index 471
Subject index 503
VOLUME 38
2008; ISBN 978-0-444-52143-9
236. Z.C. Kang, Lanthanide higher oxides: The contributions of Leroy Eyring 1
237. Rainer Pottgen and Ute Ch. Rodewald, Rare earth–transition metal–plumbides 55
238. Takao Mori, Higher borides 105
239. K.-H. Muller, M. Schneider, G. Fuchs and S.-L. Drechsler, Rare-earth nickelborocarbides 175
240. Michael T. Pope, Polyoxometalates 337
Author index 383
Subject index 431
Contents of Volumes 1–43 xxiii

VOLUME 39
2009; ISBN 978-0-444-53221-3
241. W.M. Temmerman, L. Petit, A. Svane, Z. Szotek, M. Luders, P. Strange,
J.B. Staunton, I.D. Hughes, and B.L. Gyorffy, The dual, localized orband-like, character of the 4f-states 1
242. L. Vasylechko, A. Senyshyn, and U. Bismayer, Perovskite-type aluminatesand gallates 113
243. Toshihiro Yamase, Luminescence of polyoxometallolanthanoates and photochemicalnano-ring formation 297
Author index 357
Subject index 381
VOLUME 40
2010; ISBN 978-0-444-53220-6
244. Christiane Gorller-Walrand and Linda Fluyt, Magnetic circular dichroism oflanthanides 1
245. Z. Zheng, Cluster compounds of rare-earth elements 109
246. Francois Nief, Molecular chemistry of the rare-earth elements inuncommon low-valent states 241
247. Claude Piguet and Jean-Claude G. Bunzli, Self-Assembled lanthanide helicates: Frombasic thermodynamics to applications 301
Author index 555
Subject index 583
VOLUME 412011; ISBN 978-0-444-53590-0
248. Pieter Thyssen and Koen Binnemans, Accommodation of the rare earths in theperiodic table: A historical analysis 1
249. Hisanori Shinohara and Yahachi Saito, Metallofullerenes 95
250. Lubomir D. Gulay and Marek Daszkiewicz, Ternary and quaternary chalcogenides ofSi, Ge, Sn, Pb, and In 157
251. Chun-Hua Yan, Zheng-Guang Yan, Ya-Ping Du, Jie Shen, Chao Zhang,
and Wei Feng, Controlled synthesis and properties of rare earth nanomaterials 275
Author index 473
Subject index 517
VOLUME 42
2012; ISBN 978-0-444-54316-5
252. Y. Uwatoko, I. Umehara, M. Ohashi, T. Nakano, and G. Oomi, Thermal andelectronic properties of rare earth compounds at high pressure 1
253. Alexander D. Chervonnyi, Thermodynamic properties of lanthanide fluorides andchlorides in the gaseous and condensed states 165
Author index 485
Subject index 507
Contents of Volumes 1–43xxiv

VOLUME 43
2013; ISBN 978-0-444-59536-2
254. Koen Binnemans, Lanthanidomesogens 1
255. Mikiya Tanaka, Tatsuya Oki, Kazuya Koyama, Hirokazu Narita, and Tetsuo Oishi,
Recycling of rare earths from scrap 159
256. Isabelle Billard, Ionic liquids: New hopes for efficient lanthanide/actinide extractionand separation? 213
257. Gopi K. Samudrala and Yogesh K. Vohra, Structural properties of lanthanides at ultrahigh pressure 275
258. John W. Arblaster, Selected values of the thermodynamic properties of scandium,yttrium, and the lanthanide elements 321
Author index 567
Subject index 591
Contents of Volumes 1–43 xxv

This page intentionally left blank
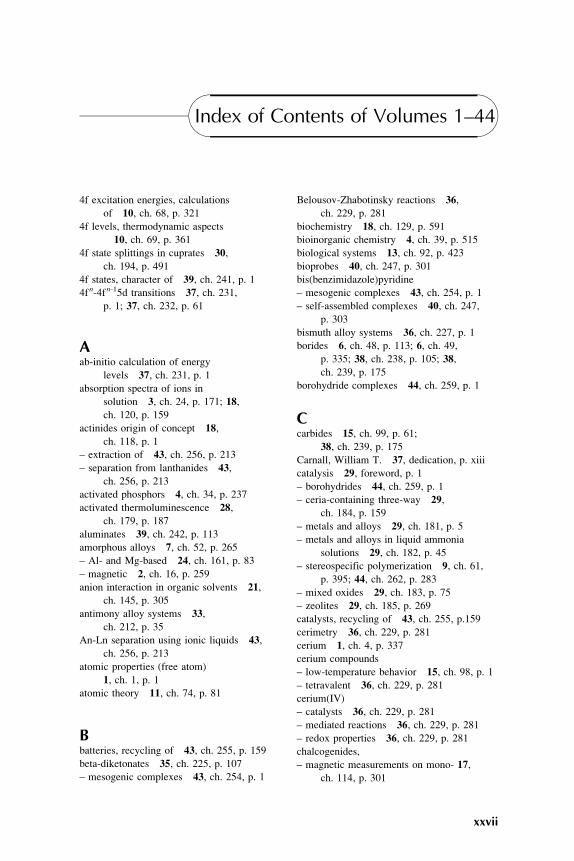
Index of Contents of Volumes 1–44
4f excitation energies, calculations
of 10, ch. 68, p. 321
4f levels, thermodynamic aspects
10, ch. 69, p. 361
4f state splittings in cuprates 30,
ch. 194, p. 491
4f states, character of 39, ch. 241, p. 14fn-4fn-15d transitions 37, ch. 231,
p. 1; 37, ch. 232, p. 61
Aab-initio calculation of energy
levels 37, ch. 231, p. 1
absorption spectra of ions in
solution 3, ch. 24, p. 171; 18,
ch. 120, p. 159
actinides origin of concept 18,
ch. 118, p. 1
– extraction of 43, ch. 256, p. 213
– separation from lanthanides 43,
ch. 256, p. 213
activated phosphors 4, ch. 34, p. 237
activated thermoluminescence 28,
ch. 179, p. 187
aluminates 39, ch. 242, p. 113amorphous alloys 7, ch. 52, p. 265
– Al- and Mg-based 24, ch. 161, p. 83
– magnetic 2, ch. 16, p. 259
anion interaction in organic solvents 21,ch. 145, p. 305
antimony alloy systems 33,
ch. 212, p. 35
An-Ln separation using ionic liquids 43,
ch. 256, p. 213
atomic properties (free atom)
1, ch. 1, p. 1atomic theory 11, ch. 74, p. 81
Bbatteries, recycling of 43, ch. 255, p. 159
beta-diketonates 35, ch. 225, p. 107– mesogenic complexes 43, ch. 254, p. 1
Belousov-Zhabotinsky reactions 36,
ch. 229, p. 281
biochemistry 18, ch. 129, p. 591bioinorganic chemistry 4, ch. 39, p. 515
biological systems 13, ch. 92, p. 423
bioprobes 40, ch. 247, p. 301
bis(benzimidazole)pyridine
– mesogenic complexes 43, ch. 254, p. 1
– self-assembled complexes 40, ch. 247,
p. 303
bismuth alloy systems 36, ch. 227, p. 1borides 6, ch. 48, p. 113; 6, ch. 49,
p. 335; 38, ch. 238, p. 105; 38,
ch. 239, p. 175
borohydride complexes 44, ch. 259, p. 1
Ccarbides 15, ch. 99, p. 61;
38, ch. 239, p. 175
Carnall, William T. 37, dedication, p. xiiicatalysis 29, foreword, p. 1
– borohydrides 44, ch. 259, p. 1
– ceria-containing three-way 29,ch. 184, p. 159
– metals and alloys 29, ch. 181, p. 5
– metals and alloys in liquid ammonia
solutions 29, ch. 182, p. 45– stereospecific polymerization 9, ch. 61,
p. 395; 44, ch. 262, p. 283
– mixed oxides 29, ch. 183, p. 75
– zeolites 29, ch. 185, p. 269catalysts, recycling of 43, ch. 255, p.159
cerimetry 36, ch. 229, p. 281
cerium 1, ch. 4, p. 337cerium compounds
– low-temperature behavior 15, ch. 98, p. 1
– tetravalent 36, ch. 229, p. 281
cerium(IV)
– catalysts 36, ch. 229, p. 281
– mediated reactions 36, ch. 229, p. 281
– redox properties 36, ch. 229, p. 281
chalcogenides,
– magnetic measurements on mono- 17,
ch. 114, p. 301
xxvii

– quaternary 41, ch. 250, p. 157
– ternary 41, ch. 250, p. 157
chemical analysis by
– atomic emission with inductively coupled
plasmas 13, ch. 91, p. 385
– mass spectrometry, see spectroscopy, mass
– neutron activation 4, ch. 37F, p. 457– optical absorption 4, ch. 37D, p. 405
– optical atomic emission 4, ch. 37D, p. 405
– polarography 4, ch. 37A, p. 341; 8,
ch. 55, p. 163
– spectrophotometry 4, ch. 37A, p. 341
– trace determination in high-purity
oxides 21, ch. 146, p. 367– x-ray excited optical luminescence 4,
ch. 37E, p. 441
chemical sensors 21, ch. 143, p. 179
chemical understanding and
classification 11, ch. 75, p. 197
chirality sensing 35, ch. 226, p. 273
chlorides, thermodynamic properties of 42,
ch. 253, p. 165
cluster compounds 40, ch. 245, p. 109
coherent emission 22, ch. 151, p. 507
cohesion, theory of 17, ch. 112, p. 149
complexes (also see lanthanide
chelates) 3, ch. 25, p. 209
– antenna effect 23, ch. 154, p. 69
– beta-diketonates 35, ch. 225, p. 107
– borohydrides in catalysis 44, ch. 259, p. 1
– encapsulation 23, ch. 154, p. 69
– half-sandwich tetrapyrrole 32,
ch. 210, p. 611
– inorganic 8, ch. 56, p. 203; 9,
ch. 59, p. 91
– low-valent state 40, ch. 246, p. 241
– macrocycles 15, ch. 104, p. 443
– molecular recognition in 35, ch. 226,p. 273
– organometallic p type 25, ch. 168, p. 265
– polyoxometalates 38, ch. 240, p. 337
– sensing in 35, ch. 226, p. 273
– with synthetic ionophores 9, ch. 60, p. 321
coordination in organic solvents 21,
ch. 145, p. 305
coordination polymers 34, ch. 221, p. 359
corrosion
– prevention and control 21, ch. 140, p. 29
– protection 21, ch. 141, p. 93
cosmochemistry 11, ch. 79, p. 485
crystal chemistry
– of aluminates 39, ch. 242, p. 113
– of elements at ultra high pressure 43,
ch. 257, p. 275
– of gallates 39, ch. 242, p. 113– of higher borides 38, ch. 238, p. 105
– of intermetallic compounds 2, ch. 13, p. 1
– of quaternary systems with chalcogenides 41,
ch. 250, p. 157
– of R5T4 intermetallic compound 44,
ch. 262, p. 283
– of ternary germanides 27, ch. 174, p. 225
– of ternary systems with chalcogenides 13,ch. 89, p. 191; 41, ch. 250, p. 157
– of ternary systems with metallic
elements 13, ch. 88, p. 1– of ternary transition metal
borides 6, ch. 48, p. 113
– of ternary transition metal
plumbides 38, ch. 237, p. 55
– of ternary transition metal silicides 6,
ch. 48, p. 113
– of ThMn12-type compounds 22,ch. 149, p. 143
crystal field 2, ch. 17, p. 295
– in non-metallic compounds 21,
ch. 144, p. 263
– parametrization, rationalization of 23,ch. 155, p. 121
crystal structures, see crystal chemistry
cuprates
– 4f state splittings 30, ch. 194, p. 491– crystal chemistry 30, ch. 188, p. 31
– electron paramagnetic resonance (EPR)
30, ch. 191, p. 375– electronic theory 30, ch. 193, p. 453
– flux pinning 31, ch. 196, p. 187
– Hall effect 31, ch. 197, p. 251
– heat capacity 31, ch. 200, p. 351– infrared properties 31, ch. 202, p. 437
– magnetoresistance 31, ch. 197, p. 251
– neutron scattering
– – magnetic ordering 31, ch. 199, p. 315– – spin fluctuations 31, ch. 198, p. 281
– overview 30, ch. 187, p. 1
– oxygen nonstoichiometry and lattice
effect 31, ch. 195, p. 1– phase equilibria 30, ch. 190, p. 229
– – of R5T4 intermetallic compounds 44,
ch. 262, p. 283
– phase transitions, structural distortions and
phase separation 31, ch. 195, p. 1
– – in R5T4 intermetallic compounds 44,
ch. 262, p. 283
Index of Contents of Volumes 1–44xxviii
– photoemission, angle-resolved studies 31,
ch. 201, p. 391
– physical properties 30, ch. 193, p. 453– – of R5T4 intermetallic compounds 44,
ch. 262, p. 283
– positron annihilation 30, ch. 192, p. 417
– Raman scattering 31, ch. 203, p. 509– scanning tunneling microscopy 31,
ch. 204, p. 563
– single crystals, growth of 30, ch. 189, p. 67
– superconductivity 30; 31– thermochemical properties 30, ch. 190, p. 229
– tunneling spectra 31, ch. 204, p. 563
Ddedications
– F. H. Spedding 11, p. 1
– Friedrich Hund 14, p. ix
– LeRoy Eyring 36, p. xi
– William T. Carnall 37, p. xiiidiffraction techniques
– at high pressure 42, ch. 242, p. 4
– for molten salts structure determination
diketonates, see beta-diketonates
diffusion in metals 1, ch. 12, p. 847
divalent samarium in organic
chemistry 6, ch. 50, p. 525; 36,ch. 230, p. 393
divalent ytterbium in organic chemistry 6,
ch. 50, p. 525
DNA, cutting of 34, ch. 222, p. 405dye-sensitized solar cells, lanthanides in 44,
ch. 261, p. 169
dynamical screening of core holes in
intermetallic compounds 10, ch. 63, p. 75
Eelastic and mechanical properties of
metals 1, ch. 8, p. 591
electron paramagnetic resonance (EPR) 2,
ch. 18, p. 387; 24, ch. 162, p. 221– in cuprate superconductors 30, ch. 191,
p. 375
electronic excitation in atomic species 28,ch. 176, p. 1
electronic properties of compounds at high
pressure 42, ch. 252, p. 1
electronic structure
– calculations for molecules 22, ch. 152,
p. 607
– of chalcogenides 39, ch. 241, p. 1
– of metals 1, ch. 3, p. 233; 17,
ch. 110, p. 1; 39, ch. 241, p. 1
– of oxides 39, ch. 241. p. 1– of pnictides 39, ch. 241, p. 1
electronic theory of cuprates 30, ch. 193,
p. 453
electron-phonon interaction in intermetallic
compounds 14, ch. 96, p. 225
electron-spin resonance, see electron
paramagnetic resonance
emission spectra (also see fluorescence and
luminescence)
– in solution 3, ch. 24, 172
– X-ray excited 10, ch. 71, p. 453enthalpy of atomization
– of fluorides 42, ch. 253, p. 429
– of monochlorides 42, ch. 253, p. 412
– of RX+ ions 42, ch. 253, p. 436enthalpy of formation
– calculation with Born-Haber cycle 42,
ch. 253, p. 324
– of crystalline dichlorides 42, ch. 253, p. 318
– of crystalline trichlorides 42, ch. 253,
p. 271
– of trichlorides, from mass spectra 42,ch. 253, p. 306
– of trichlorides, from saturated vapor
data 42, ch. 253, p. 306enthalpy of phase transition
– of crystalline trichlorides 42, ch. 253,
p. 256
enthalpy of reaction involving RF, RF2, and
RCl 42, ch. 253, p. 403
enthalpy of sublimation
– of dichlorides 42, ch. 253, p. 354
– of elements 43, ch. 258, p. 321
– of trichlorides 42, ch. 253, p. 274
enthalpy, standard of the elements 43,ch. 258, p. 321
entropy, standard, of the elements 43,
ch. 258, p. 321
equilibrium constant
– calculation for trichlorides 42, ch. 253,
p. 290
– calculation for RF, RF2, and RCl 42,ch. 253, p. 403
europium chalcogenides 2, ch. 19, p. 507
exchange coupling in transition
metal intermetallics 24, ch. 163,p. 339
excited state phenomena in vitreous
materials 9, ch. 58, p. 1
Index of Contents of Volumes 1–44 xxix

extraction, of rare earths and actinides 43,
ch. 256, p. 213
Eyring, L.
– dedication 36, p. xi
– contributions of, higher oxides 38,
ch. 236, p. 1
Ff-electron hybridization 39, ch. 241, p. 1– in intermetallic compounds 10,
ch. 63, p. 75
f-element speciation in strongly acidic media
(superacids) 18,
ch. 126, p. 507
f-f transitions, spectral intensities 25,
ch. 167, p. 101
f-states: dual, localized, band-like
character 39, ch. 241, p. 1
Fermi surfaces
– of intermetallic compounds 20,ch. 135, p. 1
– of metals 17, ch. 110, p. 1
fluorescence spectra of ions in solution 3,ch. 24, p. 171
fluoride glasses 15, ch. 101, p. 287
fluorides
–properties 5, ch. 45, p. 387–thermodynamic properties 42,
ch. 253, p. 165
flux pinning in cuprates 31,
ch. 196, p. 187
fullerenes 41, ch. 249, p. 95
Ggallates 39, ch. 242, p. 113
garnets 3, ch. 29, p. 525geochemistry 3, ch. 21, p. 1; 11, ch. 79,
p. 485; 23, ch. 158, p. 497
germanium, ternary systems 27,
ch. 173, p. 1
giant magnetocaloric effect, see
magnetocaloric effect
Hhalides 4, ch. 32, p. 89; 18,
ch. 124, p. 365
– metal-rich 15, ch. 100, p. 191
Molten salts 44, ch. 260, p. 87
– simple and complex 28, ch. 177, p. 53– thermodynamic properties 18,
ch. 122, p. 239; 33, ch. 213, p. 147
– vapors and vapor complexes 23,
ch. 157, p. 435
Hall effect in cuprates 31, ch. 197, p. 251heat capacity
– of cuprates 31, ch. 200, p. 351
– of metals 1, ch. 5, p. 379; 43, ch. 258,
p. 321
heavy fermions 14, ch. 97, p. 343; 16,
ch. 105, p. 1; 19, ch. 132, p. 177
– phenomenological approach 17,
ch. 111, p. 87
– photoelectron spectroscopy 26,
ch. 172, p. 265
helicates 40, ch. 247, p. 301high pressure studies 1, ch. 9, p. 707
– anomalous Ce, Yb and U compounds 19,
ch. 133, p. 383
– diffraction techniques 42, ch. 252, p. 4– electronic properties 42, ch. 252, p. 82
– heat capacity 42, ch. 252, p. 45
– mass spectra 42, ch. 252, p. 18
– magnetic properties 42, ch. 252, p. 44– optical studies of non-metallic compounds
33, ch. 217, p. 515
– physical properties 42, ch. 252, p. 4
– structural aspects 17, ch. 113,
p. 245; 42, ch.252, p. 4
– thermal expansion 42, ch. 252, p. 33
high temperature superconductors 30; 31history
– of the discovery and separation of rare
earths 11, ch. 73, p. 33
– of the positioning of rare earths in the
periodic table 41, ch. 248, p. 1
Hund, F. 14, dedication, p. ix
hydration 15, ch. 103, p. 393; 18,
ch. 127, p. 529
hydrides 3, ch. 26, p. 299; 18, ch. 123, p. 293
– borohydrides 44, ch. 259, p. 1
– switchable films 36, ch. 228, p. 83hydrogen absorption in intermetallic
compounds 6, ch. 47, p. 1
hydrogen in metals, including
RH2þx phases 20, ch. 137, p. 207hydrolysis 15, ch. 103, p. 393; 18,
ch. 127, p. 529; 40, ch. 245, p. 109
hyperfine interactions 11, ch. 77, p. 323
Iinelastic electron scattering 10, ch. 72,
p. 547
infrared properties
– of cuprates 31, ch. 202, p. 437
Index of Contents of Volumes 1–44xxx
– of molten salts 44, ch. 260, p. 87
inorganic complex compounds 8, ch. 56
p. 203; 9, ch. 59, p. 91Intermetallic compounds
– amorphous magnetic alloys 2, ch. 16,
p. 259
– binary and pseudo-binary R5T4
compounds 44, ch. 262, p. 283
– chalcogenides 2, ch. 19, p. 507
– crystal chemistry 2, ch. 13, p. 1
– crystal fields in 2, ch. 17, p. 295– dynamical screening of core holes 10,
ch. 63, p. 75
– electron-phonon interaction 14, ch. 96,p. 225
– exchange coupling 24, ch. 163, p. 339
– f-electron hybridization 10, ch. 63, p. 75
– Fermi surfaces 20, ch. 135, p. 1– growth of 12, ch. 80, p. 1
– hydrogen absorption 6, ch. 47, p. 1
– itinerant electron metamagnetism in cobalt
compounds 26, ch. 171, p. 177– light scattering 14, ch. 95, p. 163
– magnetic properties 2, ch. 14, p. 55; 12,
ch. 83, p. 133; 20, ch. 138, p. 293
– magnetocaloric effect in R5T4
compounds 44, ch. 262, p. 283
– magnetostriction - in RFe2 compounds 2,
ch. 15, p. 231
– in R5T4 compounds 44, ch. 262, p. 283
– Mossbauer effect in 17, ch. 116, p. 539
– nuclear magnetic resonance in 2, ch. 18,
p. 387; 14, ch. 94, p. 63– scandium alloy systems 27, ch. 175,
p. 339
– ternary RT2X2 type compounds
12, ch. 83, p. 133– ternary equiatomic YbTX 32,
ch. 207, 453
– transport properties 5, ch. 42, p. 117; 17,ch. 115, p. 409
– valence changes in 2, ch. 20, p. 575
intermediate valence 19, ch. 132, p. 177
ionic liquids (also see molten salts), in
An-Ln extraction and separation 43,
ch. 256, p. 213
itinerant electron metamagnetism in cobalt
intermetallics 26, ch. 171, p. 177
Kkinetics of complexation in aqueous
solutions 15, ch. 102, p. 347
Kondo effect 1, ch. 11, p. 797
Llanthanide-induced shifts 4, ch. 38, p. 483;
23, ch. 153, p. 1; 33, ch. 215, p.353
lanthanide chelates (also see complexes)
– for sensitizing NIR luminescence 37,ch. 234, p. 171
– in biomedical analyses 37, ch. 235, p. 217
lanthanidomesogens 43, ch. 254, p. 1
laser spectroscopy 12, ch. 87, p. 433lasers 4, ch. 35, p. 275
light scattering in intermetallic
compounds 14, ch. 95, p. 163liquid crystalline complexes 43, ch. 254, p. 1
liquid salts 44, ch. 260, p. 87
liquid metals and alloys 12, ch. 85, p. 357LIS, see lanthanide-induced shifts
luminescence
– antenna effect 23, ch. 154, p. 69
– in biomedical analyses 37, ch. 234,p. 171; 40, ch. 247, p. 301
– in NIR molecular probes and devices 37,
ch. 235, p. 217
– polyoxometalates 39, ch. 243, p. 297– studies of ions 18, ch. 120, p. 159
– spectra of ions in solution 3, ch. 24, p. 171
luminescent solar concentrators, lanthanides
in 44, ch. 261, p. 169
MmSR studies of magnetic materials 32,
ch. 206, p. 55
magnetic circular dichroism 40, ch. 244, p. 1
magnetic and transport properties of
metals 1, ch. 6, p. 411
magnetic correlations in heavy-fermion
systems 19, ch. 131, p. 123
magnetic properties (also see physical
properties)
– at high pressure 42, ch. 252, p. 1
– of borides 38, ch. 238, p. 105
– of intermetallic compounds 2,
ch. 14. p. 55; 20, ch. 138, p. 293
– of nickel borocarbides 38, ch. 239, p. 175
– of nonmetallic compounds 22, ch. 150, p. 295– of R5T4 pseudobinary intermetallic
compounds 44, ch. 262, p. 283
– of ternary RT2X2 type intermetallic
compounds 12, ch. 83, p. 133
– of ThMn12-type compounds 22, ch. 149,
p. 143
magnetic structures 1, ch. 7, p. 489magnetism 34, ch. 219, p. 135
– exotic phenomena 11, ch. 76, p. 293
Index of Contents of Volumes 1–44 xxxi

– surface 24, ch. 159, p. 1
magnetocaloric effect, in R5T4
compounds 44, ch. 262, p. 283magnetoresistance
– in cuprates 31, ch. 197, p. 251
– negative 42, ch. 252, p. 145
– pressure dependent 42, ch. 252, p. 128magnetostriction
– in R5T4 intermetallic compounds 44,
ch. 262, p. 283
– RFe2 2, ch. 15, p. 231– transition metal thin films 32, ch. 205, p. 1
marine chemistry 23, ch. 158, p. 497
mass spectra
– calculation of enthalpy of formation from
42, ch. 253, p. 299
– of EuCl3 and Eu2Cl6 42, ch. 253, p. 313
mechanical alloying 24, ch. 160, p. 47mechanically induced chemical reactions 24,
ch. 160, p. 47
metal-hydrogen batteries 21, ch. 142, p. 133
metallofullerenes 41, ch. 249, p. 95mineralogy 3, ch. 21, p. 1
minerals, crystal structures 16, ch. 108, p. 249
mixed valence systems
– bremsstrahlung isochromat
spectroscopy 10, ch. 70, p. 425
– calculation of 4f excitation energies 10,
ch. 68, p. 321
– many-body formulation of spectra 10,
ch. 64, p. 103
molecular recognition 35, ch. 226, p. 273
molten salts
electrolysis 43, ch. 255, p. 159
– structure of halides 44, ch. 260, p. 87
molybdates (VI) 3, ch. 30, p. 609
multilayers
– negative magnetoresistance in Fe/Tb 42,
ch. 252, p. 145
– transition metals 42, ch. 148, p. 81Mossbauer effect 2, ch. 18, p. 387
– of intermetallic compounds 17,
ch. 116, p. 539
Nnanostructures and nanomaterials
– Al- and Mg-based systems 24,ch. 161, p. 83
– ceria 41, ch. 249, p. 95
– halides 41, ch. 249, p. 95– hydroxides 41, ch. 249, p. 95
– metallofullerenes 41, ch. 249, p. 95
– oxides 41, ch. 249, p. 95
– oxysalts 41, ch. 249, p. 95
– properties 22, ch. 147, p. 1; 41,ch. 251, p. 275
– photochemical ring formation 39,
ch. 243, 297
– synthesis 22, ch. 147, p. 1; 41, ch. 251,p. 275
– spectroscopic properties 37,
ch. 233, p. 99
– sulfates 41, ch. 249, p. 95– transition metal multilayers 22,
ch. 148, p. 81
negative magnetoresistance in multilayer
Fe/Tb 42, ch. 252, p. 145
neutron scattering
– elastic 17, ch. 117, p. 635
– inelastic 1, ch. 7, p. 489– intermultiple transitions 14, ch. 93, p. 1
– inelastic of anomalous lanthanides 19,
ch. 130, p. 1
– in heavy-fermion systems 19, ch. 131,p. 123
– of magnetic ordering in cuprates 31,
ch. 199, p. 315
– of molten salts 44, ch. 260, p. 87– of spin fluctuations in cuprates 31,
ch. 198, p. 281
near-infrared luminescence in molecular
probes and devices 37, ch. 235, p. 217
nitride materials, ternary and higher order 24,
ch. 166, p. 51
NMR 2, ch. 18, p. 387– in intermetallic compounds 14,
ch. 94, p. 63
– lanthanide induced shifts for extracting
solution structures 33, ch. 215, p. 353– of complexes 23, ch. 153, p. 1
– of paramagnetic complexes 4,
ch. 38, p. 483
– solution structure by paramagnetic NMR
analysis 33, ch. 215, p. 353
nonradiative processes in crystals 4,
ch. 36, p. 317
nuclear magnetic resonance, see NMR
Ooptical glasses, recycling of 43, ch. 255,
p. 159
organic synthesis 8, ch. 57, p. 335organometallic compounds 7,
ch. 53, p. 446
Index of Contents of Volumes 1–44xxxii

– divalent samarium, in 6, ch. 50, p. 525; 36,
ch. 230, p. 393
– divalent ytterbium, in 6, ch. 50, p. 525– low valent 40, ch. 246, p. 241
– tetravalent cerium, in 36, ch. 229, p. 281
oxidation – reduction properties 18,
ch. 122, p. 239
oxides
– aluminates 39, ch. 242, p. 113
– binary 3, ch. 27, p. 337; 18, ch. 125, p. 413
– gallates 39, ch. 242, p. 113– higher 38, ch. 236, p. 1
– mixed 3, ch. 28, p. 401
– sesqui, defects in 5, ch. 44, p. 321– sesqui, phase transformation in 5,
ch. 44, p. 321
– ternary systems, R2O3-M2O3-M’O 13,
ch. 90, p. 283
oxo-selenates 35, ch. 224, p. 45
oxygen nonstoichiometry and lattice effect in
YBa2Cu3Ox 31, ch. 195, p. 1
Ppermanent magnets 12, ch. 82, p. 71; 32,
ch. 208, p. 515
– recycling of 43, ch. 255, p. 159
periodic table
– influence of rare earths on 11, ch. 75,p. 197
– position of rare earths in 41, ch. 248, p. 1
perovskites 3, ch. 29, p. 525
– aluminates 39, ch. 242, p. 113– gallates 39, ch. 242, p. 113
– manganese 33, ch. 214, p. 249
phase equilibria
– in binary R5T4 intermetallic compounds
44, ch. 262, p. 283
– in cuprates 30, ch. 190, p. 229
– in ternary systems with boron 6,ch. 49, p. 335; 38, ch. 238, p. 105
– in ternary systems with
chalcogenides 13, ch. 89, p. 191
– in ternary systems with metallic
elements 13, ch. 88, p. 1
– in ternary systems with lead 38,
ch. 237, p. 55
– in ternary systems with silicon 7, ch. 51,p. 1
– in rare earth binary alloys 8, ch. 54, p. 1
phase transitions
– structural distortions and phase separation in
YBa2Cu3Ox 31, ch. 195, p. 1
– in the elements at ultra high pressure 43,
ch. 257, p. 275
– in R5T4 intermetallic compounds
44, ch. 262, p. 283
phosphides 23, ch. 156, p. 285
phosphors, recycling of 43, ch. 255, p. 159
photochemical, nano-ring
formations in polyoxometalates 39,
ch. 243, p. 297
photoemission
– angle-resolved studies of untwinned
YBa2Cu3Ox 31, ch. 201, p. 391
– in chalcogenides 10, ch. 67, p. 301
– inverse spectra, local density supercell
theory 10, ch. 65, p. 165
– of Ce and its compounds 10,
ch. 66, p. 231
– spectra, local density supercell theory 10,ch. 65, p. 165
– theory of 39, ch. 241, p. 1
Photovoltaics, lanthanides in 44, ch. 261,
p. 169
physical metallurgy 11, ch. 78, p. 409
physical properties (also see magnetic
properties)
– at high pressure 42, ch. 252, p. 1– of cuprates 30, ch. 193, p. 453
– of metals 1, ch. 2, p. 173
– of metals at ultra high pressure 43, ch. 257,p. 275
– of R2Fe14B-based alloys 12, ch. 82, p. 71
– of R5T4 intermetallic compounds
44, ch. 262, p. 283
pnictides 4, ch. 33, p. 153
– magnetic measurements on mono- 17,
ch. 114, p. 301
polishing powders, recycling of 43, ch. 255,p. 159
Polymerization, stereospecific catalysis
– with borohydride complexes 44, ch. 259,p. 1
– with coordination complexes 9, ch. 61,
p. 395
polyoxometalates 38, ch. 240, p. 337– luminescence of 39, ch. 243, p. 297
positron annihilation in high-temperature
superconductors 30, ch. 192, p. 417
preparation and purification of
metals 1, ch. 2, p. 173
pressure-induced
– cross-over 42, ch. 252, p. 83– electronic transitions 42, ch. 252, p. 82
– magnetic order 42, ch. 252, p. 129
Index of Contents of Volumes 1–44 xxxiii

– structural transitions 43, ch. 257, p. 275;
44, ch. 262, p. 283
– superconductivity 42, ch. 252, p. 96pyrochlores 16, ch. 107, p. 225
pyrometallurgy, in rare-earth recycling 43,
ch. 255, p. 159
Qquasicrystalline, Al- and Mg-based
systems 24, ch. 161, p. 83
RRaman scattering of cuprates 31,
ch. 203, p. 509
recycling of rare earths 43, ch. 255, p. 159
redox reactions
– in aqueous solutions 15, ch. 102, p. 347– Ce(IV)/Ce(III) 36, ch. 229, p. 347
– Sm(III)/Sm(II) 36, ch. 230, p. 393
relativistic effects and electronic
structure 18, ch. 119, p. 29Ring opening polymerization (ROP) 44,
ch. 259, p. 1
RNA, cutting of 34, ch. 222, p. 405, 36,
ch. 229, p. 392
Ssamarium (II) reductants 36,
ch. 230, p. 393
scandium alloy systems and
intermetallics 27, ch. 175, p. 339scanning tunneling microscopy of
cuprates 31, ch. 204, p. 563
Schiff’s base complexes 43, ch. 254, p. 1
selenates 35, ch. 224, p. 45selenides 4, ch. 31, p. 1
selenites 35, ch. 224, p. 45
self-assembly of helicates 40,
ch. 247, p. 301
separation chemistry 3, ch. 22, p. 81;
18, ch. 121, p. 197; 21, ch. 139, p. 1; 43,
ch. 256, p. 213
– analytical, basic chemistry and methods 28,ch. 180, p. 311
– silicon solar cells, lanthanides in 44,
ch. 261, p. 169
shift reagents 4, ch. 38, p. 483; 23,
ch. 153, p. 1; 33, ch. 215, p. 353; 35,
ch. 225, p. 107
single crystals
– growth from molten metal fluxes 12,
ch. 81, p. 53
– growth of cuprates 30, ch. 189,p. 67
– growth of metals and intermetallic
compounds 12, ch. 80, p. 1
skutterudites, filled 33, ch. 211, p. 1Solar energy conversion, lanthanides in 44,
ch. 261, p. 169
solid electrolytes 28, ch. 178, p. 131; 35,
ch. 223, p. 1
solid oxide fuel cells (SOFC) 35, ch. 223, p. 1
solution chemistry 15, ch. 103, p. 393; 18,
ch. 127, p. 529; 18, ch. 128, p. 559; 21,ch. 145, 305
solvation in organic solvents 21,
ch. 145, p. 305
spectroscopic properties
– in solution 3, ch. 24, p. 172
– in transparent crystals 5, ch. 46, p. 461
– nanomaterials 37, ch. 233, p. 99
spectroscopy
– absorption and fluorescence of R ions 3,
ch. 22, p. 172
– appearance potential 16, ch. 109, p. 519
– bremsstrahlung isochromat 10, ch. 70,p. 425
– circularly polarized luminescence 34,
ch. 220, p. 289
– high-energy 10, ch. 62, p. 1
– magnetic circular dichroism 40,
ch. 244, p. 1
– magnetic resonance 11, ch. 77, p. 323– mass
– – spark source matrices 4,
ch. 37C, p. 377
– – spark source trace element analysis 4,ch. 37B, p. 359
– – stable-isotope dilution analysis 4,
ch. 37G, p. 471
– – with inductively coupled plasmas
analysis 13, ch. 91, p. 385
– optical 3, ch. 24, p. 172; 5, ch. 46, p. 461;
11, ch. 74, p. 81; 33, ch. 216, p. 465; 37,ch. 233, p. 99; ch. 234, p. 171; 37,
ch. 235, p. 217; 39, ch. 243, p. 297
– photoelectron in heavy fermion systems 26,
ch. 172, p. 265
– time-resolved emission in
solution chemistry 33, ch. 216, p. 465
Spedding, F. H., 11, prologue, p. 1spin glasses 12, ch. 84, p. 213
Index of Contents of Volumes 1–44xxxiv

stannides, transition metal ternary
systems 24, ch. 164, p. 399
steels 25, ch. 165, p. 1stresses, static and dynamic 26, ch. 170, p. 87
structural properties, lanthanides at high
pressure 43, ch. 257, p. 275
sublimation enthalpy
– of metals 43, ch. 258, p. 321
– of trichlorides 42, ch. 253, p. 274
– of trifluorides 42, ch. 253, p. 235
sulfides 4, ch. 31, p. 1– poly 32, ch. 209, 567
superconductivity 1, ch. 10, p. 749; 34,
ch. 219, p. 135
– at high pressure 42, ch. 252, p. 96
– crystal chemistry of cuprates 30,
ch. 188, p. 31
– in metals 17, ch. 110, p. 1– high-temperature layered cuprates:
overview 30, ch. 187, p. 1
– nickel borocarbides 38, ch. 239, p. 175
– unconventional and magnetism 34,ch. 219, p. 135
surfaces
– adsorption on 5, ch. 43, p. 217
– catalysis on 5, ch. 43, p. 217switchable metal hydride films 36,
ch. 228, p. 83
systematics, intra rare earth binary
alloys 8, ch. 54, p. 1
Ttellurides 4, ch. 31, p. 1
ternary equiatomic YbTX intermetallics 32,
ch. 207, p. 453
tetravalent cerium compounds 36, ch. 229,p. 281
theoretical chemistry 3, ch. 23, p. 111
thermal conductivity of compounds 16,ch. 106, p. 107
thermal properties of compounds at high
pressure 42, ch. 252, p.1
thermodynamic functions
– of dichlorides 42, ch. 253, p. 198
– of difluorides 42, ch. 253, p. 207
– of dimeric trichlorides 42, ch. 253, p. 296
– of metals 43, ch. 258, p. 321
– of monochlorides 42, ch. 253, p. 381– of monofluorides 42, ch. 253, p. 381
– of trichlorides 42, ch. 253, p. 176
– of trifluorides 42, ch. 253, p. 196
thermochemical properties 18, ch. 122, p. 239– of chlorides 42, ch. 253, p. 165
– of cuprates 30, ch. 190, p. 229
– of dimeric trichlorides 42, ch. 253, p. 214
– of fluorides 42, ch. 253, p. 165– of gaseous species 12, ch. 86, p. 409
– of metallic systems 19, ch. 134, p. 479
– of metals 43, ch. 258, p. 321– of trichlorides 42, ch. 253, p. 176
– of trifluorides 42, ch. 253, p. 196
thin films 5, ch. 41, p. 1; 20, ch. 136, p. 105
– switchable metal hydrides 36,ch. 228, p. 83
toxicity 4, ch. 40, p. 553
transition metal-indides 34, ch. 218, p. 1
transport properties
– at high pressure 42, ch. 252, p. 68
– of intermetallics 5, ch. 42, p. 117; 17,
ch. 115, p. 409
triflates 29, ch. 186, p. 315tunneling spectra of cuprates 31, ch. 204, p. 563
Uultra high pressure (also see high pressure
studies)
– elements at 43, ch. 258, p. 321
– structural properties at 43, ch. 257, p. 275
Vvalence fluctuations 2, ch. 20, p. 575; 16,
ch. 105, p. 1; 39, ch. 241, p. 1
vapor pressure of halides 42, ch. 253,
p. 441
Xx-ray absorption and emission spectra 10,
ch. 71, p. 453
x-ray scattering 26, ch. 169, p. 1
Index of Contents of Volumes 1–44 xxxv

This page intentionally left blank

Chapter 259
Catalytic Behavior of Rare-EarthBorohydride Complexes inPolymerization of PolarMonomers
Sophie M. Guillaume*, Laurent Maron{ and Peter W. Roesky{*Institut des Sciences Chimiques de Rennes, CNRS – Universite de Rennes 1 (UMR 6226),
Organometallics: Materials and Catalysis, Campus de Beaulieu, Rennes Cedex, France{Laboratoire de Physique et Chimie de Nano-Objets, Universite de Toulouse, INSA and CNRS,
UMR5626 (IRSAMC), Toulouse, France{Institut fur Anorganische Chemie and Helmholtz Research School: Energy-Related Catalysis,
Karlsruher Institut fur Technologie (KIT), Karlsruhe, Germany
Chapter Outline1. Historical Introduction 2
1.1. General Context of the
Use of Rare-Earth
Complexes
in Polymerization 2
1.2. Significant Features
and Advantages of
the Borohydride
Ligand 4
1.3. Scope of the Review 6
2. Synthesis of Rare-Earth
Borohydride Complexes 7
2.1. Inorganic Borohydride
Complexes 7
2.2. Organometallic
Borohydride Complexes 8
2.3. Post-Metallocene
Borohydride Complexes 11
3. Rare-Earth Borohydride
Initiators in the Polymerization
of Polar Monomers 16
3.1. ROP of Lactones and
Lactides, and a-Amino
Acids
N-Carboxyanhydrides 17
3.2. ROP of Trimethylene
Carbonate 47
3.3. Concluding Remarks on
the ROP of Polar
Monomers Initiated by
Rare-Earth Borohydride
Complexes 53
3.4. Polymerization of Methyl
Methacrylate 55
3.5. Copolymers of Polar
Monomers (Cyclic Esters,
Handbook on the Physics and Chemistry of Rare Earths, Vol. 44.
http://dx.doi.org/10.1016/B978-0-444-62711-7.00259-0
Copyright © 2014 Elsevier B.V. All rights reserved. 1

g-Benzyl-L-Glutamate
N-Carboxyanhydrides,
Methyl Methacrylate) 65
4. Computational Studies: DFT
Input into the Mechanism of the
Polymerization of Polar
Monomers 70
4.1. ROP of e-Caprolactoneand Lactide 70
4.2. ROP of Trimethylene
Carbonate 76
4.3. Polymerization of Methyl
Methacrylate 77
4.4. Theoretical Investigations:
An Essential Tool
for Polymerization
Catalysis 79
5. Conclusions and Outlooks 79
1. HISTORICAL INTRODUCTION
1.1. General Context of the Use of Rare-Earth Complexesin Polymerization
Rare-earth1 complexes, both divalent and trivalent ones, have been investigated
in polymerization for over two decades. In the early 1990s, MacLain revealed
the potential of rare-earth alkoxide compounds, namely [R5(m-O)(OiPr)13](R¼Y, La, Sm, Dy, Er, Yb) (Kritikos et al., 2001; Poncelet et al., 1989) and
[Y(OCH2CH2OEt)3], in the ring-opening polymerization (ROP) of lactones
(d-valerolactone (VL), e-caprolactone (CL)) and diesters (glycolide, D-Lactide,
L-Lactide) (McLain and Drysdale, 1991, 1992; McLain et al., 1992, 1994).
Within the same period of time, Yasuda reported the first investigations on
the living polymerization of polar and nonpolar monomers promoted by dis-
crete organometallic rare-earth initiators. In particular, [(Cp*)2RMe(THF)]
complexes (R¼Y, Sm, Yb, Lu; Cp*¼Z5-C5Me5) (Evans et al., 1986, 1998;
Schumann et al., 1995; Watson, 1983), enabled the living polymerization of
lactones such as VL and CL affording polyesters of molar mass values (Mn)
up to 50,000 g mol�1 with dispersity values (ÐM, Mw=Mn) below 1.07 (Yama-
shita et al., 1996; Yasuda et al., 1993a). The same complexes also allowed the
first living, highly syndiospecific (rr>90%) polymerization of methylmetha-
crylate (MMA) affording poly(methylmethacrylate) (PMMA) featuring
Mn¼ 65,000�120,000gmol�1 with Mw=Mn¼ 1:03�1:05 (Yasuda et al.,
1992). In addition, rare-earth metal hydrides exhibiting high activity and unique
behavior in various catalytic processes, among which polymerization reactions,
were already the focus of much attention at that time. Thus, [{(Cp*)2SmH}2]
(Cp¼Z5-C5H5) (Evans et al., 1983; Jeske et al., 1985; Schumann et al.,
1995) initiated the ROP of CL (Mn� 142,200gmol�1-uncorrected MnSECvalue, Mw=Mn¼ 1:05) yet with a lower efficiency than its alkyl homologue
1. Rare-earth metals herein symbolized by “R” refer to group III metals including in addition to
scandium and yttrium, the fifteen lanthanide elements from lanthanum to lutetium.
Handbook on the Physics and Chemistry of Rare Earths2

(Yamashita et al., 1996). Also, this samarium metallocene hydride was shown
to afford at 0 �C high molar mass PMMA (Mn� 563,000gmol�1) with
Mw=Mn values in the 1.02–1.05 range, with a high activity and with a syndio-
tacticity exceeding 95% (Yasuda et al., 1992, 1993a,b). Taking advantage of the
living polymerization process, random, and AB or ABA block copolymers of
acrylates and/or lactones were next prepared from these trivalent organolantha-
nide complexes (Ihara et al., 1995; Tanabe et al., 2002; Yasuda et al., 1993b).
These pioneering investigations, on both alkoxide, alkyl and hydride derivatives
of rare-earth metal initiators, in the challenging field of living polymerizations,
then revealed valuable results. All subsequent studies on the polymerization of
polar and nonpolar monomers catalyzed by rare-earth metal-based systems
were then inspired by these original works.
Ensuing advances were later reviewed, especially by Yasuda (Yasuda and
Ihara, 1997; Yasuda and Tamai, 1993, 2000, 2002) and Okuda (Arndt et al.,
2002; Okuda et al., 2001). Typical examples of organolanthanide complexes
reported as initiators in the polymerization of polar and nonpolar monomers
include metallocenes hydride and alkyl derivatives, including heterobimetallic
species, such as for instance the above-mentioned [{(Cp*)2RH}2] (R¼La,
Nd, Sm, Lu) and [(Cp*)2RMe(THF)] (R¼Y, Sm, Yb, Lu), and
[{(Cp)2YbMe}2] [(Cp)2YbMe(THF)], [{(Cp)2RMe}2] (R¼Y, Yb), [(Cp*)2R
(CHTMS2)] (R¼Y, Sm), [(Cp*)La(CHTMS2)2], [{(Z5:Z1-C5Me4Si-
Me2NCMe3)R(m-H)(THF)}2] (R¼Y, Lu), [(Cp*)2R(m-Me)2AlMe2] (R¼Y,
Sm, Yb, Lu), and [Me2Si{[2,4-(TMS)2C5H2][3,4-(TMS)2-C5H2]}Sm(THF)2]
(Fig. 1; Schumann et al., 1995). Whereas CL and MMA have been, at the early
stage, the most studied monomers, other polar as well as nonpolar monomers
have been considered next, especially lactones (b-propiolactone (PL), VL), car-bonates (trimethylene carbonate (TMC), dimethyl-TMC), oxiranes (ethylene
oxide, propylene oxide, epichloridrin), alkyl (methyl, ethyl, isopropyl, t-butyl)(meth)acrylates, as well as olefins (ethylene, 1-hexene, styrene), conjugated
dienes (butadiene, isoprene), or acetylene derivatives. The latest
SiMe3
H M SiM
3
SiMe3
SmH
Sm YbMe
THFY
SiMe3SmMe2Si THF2
3
H THF SiMe3 SiMe3
Me3Si3
Me Me Me HM MSm
Me
MeAl
Me
MeYb
Me
MeYb Si Lu
H
H
MeMe N
SiLuMeMeNMe Me HN N
THF THFMe Me
Me Me Me Me
FIGURE 1 First typical organolanthanide complexes used as initiators in the polymerization of
polar and nonpolar monomers.
Chapter 259 Rare-Earth Borohydride Complexes in Polymerization 3

contributions, in particular from Hou (Hou and Nishiura, 2010; Hou and
Wakatsuki, 2002; Hou et al., 2006), Endo (Nomura and Endo, 1998), Agarwal
and Greiner (Agarwal and Greiner, 2002; Agarwal et al., 2000), Kerton (Kerton
et al., 2004), or Edelmann (Edelmann, 2009, 2010, 2011), have addressed more
specific domains. Following the developments in organometallic synthesis
of rare-earth complexes, original neutral or cationic initiators, either mono-
or bicomponent catalytic systems, showed novel activity and regio- and/or
stereo-selectivity in (co)polymerization; these include half-metallocene com-
plexes bearing mixed Cp*-monodentate anionic ligands or cyclopentadienyl
(Cp)-amido and -phosphido linked ligands, as well as Cp-free complexes such
as [(COT)RCl] (COT¼cyclooctatetraenyl). Alongside hydrides, alkyls, alkox-
ides or aryloxides, amides and halogenides, like in [R(NTMS2)3] and [SmI2],
were also introduced as active function. Indeed, although highly efficient in
polymerization, hydride complexes of the rare-earth metals are, in comparison
to other species, more sensitive and require good expertise for their isolation
and subsequent handling (Ephritikhine, 1997; Konkol and Okuda, 2008;
Schumann et al., 1995). This is one of the reasons that explain the burst of
the investigations of non-hydride rare-earth complexes in polymerization
catalysis. Note that among these latter, alkoxide or aryloxide derivatives have
stimulated many efforts since they are the most easily prepared.
Tetrahydroborate -namely tetrahydridoborato, commonly referred to as
borohydride -complexes of transition metals, including of f-elements, have
not been that extensively studied as reflected by the limited number of
reviews dedicated to this topic (Makhaev, 2000; Marks and Kolb, 1977; Vis-
seaux and Bonnet, 2011; Xhu and Lin, 1996) or addressing it within a more
general context of the related hydride complexes (Arndt and Okuda, 2002;
Edelmann, 2009; Ephritikhine, 1997). Indeed, the chemistry of transition
metal borohydride species has been essentially pursued to provide reactive
hydride compounds. Rare-earth borohydride complexes, have been first
synthesized as the inorganic compounds [R(BH4)3] (Zange, 1960) and as sol-
vates, [R(BH4)3(THF)3] (1; Gmelin Handbook, 1991; Mirsaidov et al., 1976,
1986b). However, it is only many years later that this chemistry has been
revisited to the profit of organometallic rare-earth complexes (Cendrowski-
Guillaume et al., 1998, 2000, 2002, 2003; Palard et al., 2005; Richter and
Edelmann, 1996; Schumann et al., 1998). This whole pioneering work, up
to the late 1990s, has really launched the organometallic chemistry of rare-
earth borohydrides, as recently reviewed (Visseaux and Bonnet, 2011).
1.2. Significant Features and Advantages of the BorohydrideLigand
The tetrahydroborate ion, BH4�, the simplest known anionic boron hydride,
is usually covalently coordinated to transition metal atoms through a B–H–
metal three center-two electron bridging bond in an Z1, Z2, or Z3 mode
Handbook on the Physics and Chemistry of Rare Earths4

(Makhaev, 2000; Marks and Kolb, 1981; Parry and Kodama, 1993; Xhu and
Lin, 1996). In most of the rare-earth borohydride complexes, the borohydride
ligand is di- or tri-hapto bonded to a unique metal center (terminal BH4�),
or bridging two metals in various ligation modes, (m2-H)3BH (Skvortsov
et al., 2007a), (m2-H)2BH(m3-H) (Skvortsov et al., 2007a), (m2-H)2B(m2-H)2(Khvostov et al., 1998; Visseaux et al., 2010), or (m2-H)2B(m3-H)2(Cendrowski-Guillaume et al., 1998; Jaroschik et al., 2010). This unique
mono-, bi-, or tri-dentate configuration of the bridging hydrogen atoms may
be related to important species in catalytic transformations as a reminiscence
of the reactivity of hydride homologues. Of high significance in rare-earth
borohydride chemistry, tetrahydroborate complexes reacting with acidic sub-
strates are valuable selective reducing agents, and also often play a major role
as catalysts in reactions such as hydrogenation.
More importantly to the present considerations, BH4� features several
advantages over other anionic ligands. On one hand, the borohydride ligand
is isoelectronic with methane thus serving as a structural model in the C–H
activation of saturated hydrocarbons (Makhaev, 2000). On the other hand,
BH4� is considered as a pseudo halide. It is isosteric with Cl�, yet it is much
more electron donating (Cendrowski-Guillaume et al., 2000; Xhu and Lin,
1996). This highly valuable characteristic has been exploited for the isolation
of otherwise inaccessible discrete 4f-element species that thus feature a higher
degree of covalence. Furthermore, owing to the lower propensity of BH4� to
form bridging compounds in comparison to the corresponding halide and alk-
oxide ligands, and thanks to the larger ionic radius (and therefore wider coor-
dination sphere) of rare-earth metals, well-defined non-aggregated 4f-element
derivatives thus become accessible with borohydride ligand(s). Clusters -often
encountered in rare-earth alkoxide species- are therefore avoided. All these
properties impart greater solubility to rare-earth complexes in nonpolar sol-
vents. Last, but not least, formation of ate species is hence much less favored
in borohydride chemistry, one reason being also the lower solubility of alkali
metal borohydride salts which are thereby more easily removed by-products.
Discrete neutral rare-earth borohydride complexes are thus quite (yet not
always) readily accessible (Ephritikhine, 1997; Makhaev, 2000; Marks and
Kolb, 1977; Visseaux and Bonnet, 2011; Xhu and Lin, 1996).
Also, borohydride species are rather attractive given that the presence and
the structure of the borohydride ligand(s) can be easily assessed analytically.1H and 11B NMR spectroscopies allow the detection of the borohydride ligand
upon displaying a typical pattern in the 1H NMR spectrum consisting of a
broad quartet (JBH¼80–90 Hz) arising from the quadrupolar 11B nucleus
(nuclear spin quantum number of 3/2). However, the rapid interchange of
the bridging and terminal hydrogen atoms precludes distinguishing the exact
structure between bidentate and tridentate coordination. Nevertheless, FTIR
spectroscopy has demonstrated that these two coordination modes display
quite distinct and characteristic B–H vibrational bands (Ephritikhine, 1997;
Chapter 259 Rare-Earth Borohydride Complexes in Polymerization 5

Makhaev, 2000; Marks and Kolb, 1977). Ultimately, X-ray analysis nowadays
allows the ligation mode to be unambiguously determined as hinted by the
RdB bond distance(s), and ideally by the location of the refined hydrogen
atoms (Ephritikhine, 1997; Makhaev, 2000; Marks and Kolb, 1977; Xhu and
Lin, 1996). These molecular spectroscopic tools provide a highly valuable
“handle” for both the characterization of borohydride reaction products and
the in situ monitoring of experiments, thus allowing identification of relevant
intermediates leading to the clarification of reaction mechanisms.
Making the parallel between the bridging hydrogen atoms within the bond-
ing mode of the BH4� ligand and those within discrete rare-earth hydride
compounds (Arndt and Okuda, 2002; Makhaev, 2000; Marks and Kolb,
1977; Xhu and Lin, 1996), while further taking into account the high perfor-
mances of the rare-earth hydride species in polymerization as mentioned
above, exploring the ability of rare-earth borohydrides to promote polymeriza-
tion thus appeared appealing. In light of the originality and versatility of this
unusual anionic BH4� ligand featuring a hydridic character, well-defined rare-
earth borohydride complexes have thus been developed to be used as initiators
in the polymerization of polar monomers, and especially of cyclic esters and
MMA (Fig. 2), as well as of nonpolar monomers. Expansion of these poly-
merization studies reciprocally impacted the growth of organometallic chem-
istry of rare-earth borohydride derivatives. The synthesis and characterization
of inorganic and organometallic borohydride rare-earth complexes has been
previously addressed (Arndt and Okuda, 2002; Ephritikhine, 1997; Makhaev,
2000; Marks and Kolb, 1977; Schumann et al., 1998; Visseaux and Bonnet,
2011; Xhu and Lin, 1996) and some aspects of the catalytic behavior of
rare-earth borohydrides in polymerization have been recently reviewed by
Visseaux and Bonnet (2011).
1.3. Scope of the Review
The present chapter is focusing on the most recent achievements (up to the
early beginning of 2013) in the synthesis of rare-earth borohydride complexes
designed for the polymerization of polar monomers. The synthesis and
characterization of inorganic and organometallic rare-earth borohydride
BL
O
O
O
O
O
O
VL CL
O
O
O
O
LA
O O
O
TMC
Me
OMeO
MMA
O
O
PDL
FIGURE 2 Typical polar and nonpolar monomers investigated in polymerization initiated by
rare-earth complexes.
Handbook on the Physics and Chemistry of Rare Earths6

complexes is first presented in the following section, in light of the latest
advances and in relevance to the compounds used as initiators in polymeriza-
tion reactions described in the third section. Special emphasis is given to the
strategies followed to improve the control and the livingness of the polymeri-
zation especially in terms of tailor-made ligands, and in turn, to access to orig-
inal well-defined end-functionalized (co)polymers. Progress in understanding
and tuning their mechanistic behavior as (pre)initiators in polymerization
catalysis, both from an experimental approach combined with computational
insights, is assessed. Efforts are also paid to demonstrate that theoretical
DFT calculations are nowadays an essential tool to better understand and
model polymerization mechanisms. Up-to-date experimental and computa-
tional advances of the past decade are comprehensively covered in the present
tutorial review.
2. SYNTHESIS OF RARE-EARTH BOROHYDRIDE COMPLEXES
The general aspects of the synthesis and characterization of rare-earth borohy-
dride complexes have been recently described (Visseaux and Bonnet, 2011)
and only some essential features are addressed here for the understanding of
the review. Thus, we do not present a full account of rare-earth element boro-
hydride complexes but we rather focus only on those which are relevant as
initiators for the polymerization of polar monomers.
2.1. Inorganic Borohydride Complexes
The trisborohydrides of the rare-earth elements [R(BH4)3] (R¼Y, Sm, Eu,
Gd, Tb, Dy, Ho, Er, Tm, Yb, Lu) were initially prepared in 1960 by Zange
upon reacting rare-earth metal alkoxides [R(OCH3)3] with B2H6 (Zange,
1960). In the 1970s and 1980s Mirsaidov and coworkers reported in several
publications a more convenient approach to the solvates [R(BH4)3(THF)3]
(1R) by starting from RCl3 and NaBH4 (Scheme 1) (Mirsaidov and
Kurbonbekov, 1985; Mirsaidov and Rakhimova, 1978; Mirsaidov et al.,
1976, 1978, 1982, 1986a,b). A similar, yet optimized, synthetic protocol
was also published by Ephritikhine and coworkers (Cendrowski-Guillaume
et al., 2000). In contrast to the other rare-earth compounds, the scandium
borohydride [Sc(BH4)3(THF)2] (1Sc0) (Lappert et al., 1983; Lobkovski
et al., 1977) features only 2 equiv of THF coordinated to the central metal.
The divalent bisborohydride complexes [R(BH4)2(THF)2] (2R) (R¼Sm,
Eu, Yb) were originally reported in 1999 (Makhaev and Borisov, 1999).
RCl3 + 3 NaBH4THF
[R(BH4)3(THF)3] + 3 NaCl
1R
SCHEME 1 General synthesis of [R(BH4)3(THF)3] (1).
Chapter 259 Rare-Earth Borohydride Complexes in Polymerization 7

At that time, they were prepared from [NaR(BH4)4(DME)4] (R¼Sm, Eu, Yb)
by thermal reduction at 150–200 �C in vacuum. Unfortunately, the characteriza-
tion was incomplete. Recently, Nief and Visseaux reported a more convenient
approach to [Sm(BH4)2(THF)2] (2Sm), which was obtained from
[Sm(BH4)3(THF)3] (1Sm) and Sm metal (Scheme 2) (Jaroschik et al., 2010).
The complex was then fully characterized including its solid-state structure fea-
turing an infinite monodimensional polymer with two tridentate BH4� in the
bridging position between two six-coordinated Sm atoms. [Yb(BH4)2(THF)2]
(2Yb) is accessible in a similar way (Marks et al., 2012) while [Eu
(BH4)2(THF)2] (2Eu) was prepared by two synthetic pathways. Compound
2Eu can either be obtained in a reductive pathway from EuCl3 and NaBH4 in
a high yield or by a salt metathesis from [EuI2(THF)2] and NaBH4 (Scheme 2)
(Marks et al., 2012).
The divalent thulium compound [Tm(BH4)2(DME)2] (2Tm0) was only
prepared recently upon reduction of [Tm(BH4)3(THF)3] (1Tm) with C8K or
via salt metathesis from TmI2 and KBH4 in DME (Momin et al., 2011)
(Scheme 2). The solid-state structure displays a discrete molecule with two
DME ligands bonded to TmII.
The monocationic trivalent rare-earth metal borohydrides [R(BH4)2(THF)5]
[BPh4] (3R) were obtained by Okuda and coworkers upon protonation of
[R(BH4)3(THF)3] (1R, R¼Y, La, Nd, Sm) with 1 equiv of the Br�nsted acid
[NEt3H][BPh4] in THF (Robert et al., 2008), as sketched in Scheme 3.
2.2. Organometallic Borohydride Complexes
Although several synthetic routes to lanthanide borohydride derivatives have
been described (Visseaux and Bonnet, 2011), the most popular way remains,
SCHEME 2 Synthesis of [R(BH4)2(THF)2] (2R) and [Tm(BH4)2(DME)2] (2Tm0).
THF[R(BH4)3(THF)3] + [NEt3H][BPh4]
- H2- NEt3- BH3
[R(BH4)2(THF)5][BPh4]
3R1R
SCHEME 3 Synthesis of [R(BH4)2(THF)2][BPh4] (3R).
Handbook on the Physics and Chemistry of Rare Earths8

by far, the salt metathesis reaction of an alkali metal derivative of a given
ligand with [R(BH4)3(THF)3] (1R) (Scheme 4).
The long-time most popular ligand in organometallic chemistry of the
rare-earth elements is the pentamethylcyclopentadienyl (C5Me5, Cp*) ligand
and its related derivatives. In divalent rare-earth element chemistry, the mono-
cyclopentadienyl complex [{(Cp*)Sm(m-BH4)(THF)2}2] (4Sm) was only
reported recently. It was synthesized by Nief, Visseaux, and coworkers in
43% yield from [Sm(BH4)2(THF)2] (2Sm) with KCp* in THF in a 1:1 ratio
(Scheme 5) (Jaroschik et al., 2010).
The metallocene complexes of the trivalent rare-earth elements have been
prepared in different ways, for example [(Cp*)2Sm(BH4)(THF)] (5Sm) was
obtained either from [SmCl3(THF)2], NaCp*, and NaBH4 in THF (Schumann
et al., 1998), or from [Sm(BH4)3(THF)3] and NaCp* (Palard et al., 2004). In a
similar approach, metallocenes with a different substitution pattern on
the five-membered ring were synthesized. Metallocenes with the bulkier
cyclopentadienyl ligands [(Cp*Pr)2Nd(BH4)(THF)] (6Nd), [(CpPh3)2Sm(BH4)
(THF)] (7Sm), and [(CpiPr4)2Sm(BH4)] (8Sm) (Cp*Pr¼C5Me4(nPr),
CpPh3¼C5H2Ph3-1,2,4, CpiPr4¼C5HiPr4) were prepared from the
corresponding potassium cyclopentadienyls (KCp*Pr, KCpPh3, KCpiPr4)
and [R(BH4)3(THF)3] (1R) (Barbier-Baudry et al., 2006). Only [(CpPh3)2Sm
(BH4)(THF)] (7Sm) was isolated.
Although metallocenes of the rare-earth elements are usually much more
common than monocyclopentadienyl complexes, the latter class of com-
pounds was well investigated and used as catalysts in the ROP of polar mono-
mers. Thus, a significant number of monocyclopentadienyl bisborohydride
compounds were prepared in which different substitution patterns on the
five-membered ring have been achieved. In this context, the samarium
complex [(CpPh3)Sm(BH4)2(THF)2] (9Sm) was prepared by Visseaux and
coworkers upon reaction of [Sm(BH4)3(THF)3] (1Sm) with the appropriate
amount of KCpPh3 (Barbier-Baudry et al., 2006). The isopropyl substituted
SCHEME 4 General synthesis of organometallic rare-earth borohydride complexes.
SCHEME 5 Synthesis of the monocyclopentadienyl complex [{Cp*Sm(m-BH4)(THF)2}2] (4Sm).
Chapter 259 Rare-Earth Borohydride Complexes in Polymerization 9

compounds [(Cp*Pr)Nd(BH4)2(THF)2] (10Nd), [(Cp*Pr)Sm(BH4)2(THF)2]
(10Sm) (Bonnet et al., 2004a) and linked half-sandwich complexes
[(C5Me4-C6H4-o-NMe2)R(BH4)2] (R¼Sc (11Sc), Sm (11Sm)) (Jian et al.,
2010) reported by Cui and coworkers, were all obtained in a similar way
(Scheme 6).
Visseaux and coworkers reported on the heteroleptic b-diketiminate lan-
thanide complexes [(Cp*Pr){(p-Tol)NN}R(BH4)] ((p-Tol)NN¼ (p-CH3C6H4)
NC(Me)CHC(Me)N, R¼Nd (12Nd), Sm (12Sm)) (Scheme 7) (Bonnet et al.,
2004b). The complexes were prepared from the direct metathesis reaction of
their monocyclopentadienyl precursors, [(Cp*Pr)Sm(BH4)2(THF)2] (10Sm)
and [(Cp*Pr)Nd(BH4)2(THF)2] (10Nd), respectively, with K{(p-Tol)NN}in good yields (Scheme 7). The corresponding triphenyl derivative [(CpPh3)
{(p-Tol)NN}Sm(BH4)] (13Sm) was obtained in a one-pot reaction from
[Sm(BH4)3(THF)3] (1Sm), KCpPh3, and {(p-Tol)NN}K (Barbier-Baudry
et al., 2006).
An non-cyclopentadienyl but organometallic ionic species, [MeY(BH4)
(THF)5][BPh4] (14Y), was synthesized in moderate yield by Okuda and
coworkers upon reaction of the dicationic methyl complex [MeY(THF)6]
[BPh4]2 with 1 equiv NaBH4 (Scheme 8) (Kramer et al., 2008). The
RN
BH4
BH4
R = Sc (11Sc), Sm (11Sm)
NLi
+ [R(BH4)3(THF)n]- LiBH41R
SCHEME 6 Synthesis of the linked half-sandwich complexes [(C5Me4-C6H4-o-NMe2)R(BH4)2]
(R¼Sc (11Sc), Sm (11Sm)).
[(Cp*Pr)R(BH4)2(THF)n] + K{(p-tol)NN} - KBH4
R = Nd (12Nd), Sm (12Sm)
Toluene
Cp*' = C5Me4nPr
RH4B N
N
R = Nd (10Nd), Sm (10Sm)
SCHEME 7 Synthesis of heteroleptic b-diketiminate lanthanide complexes.
THF[MeY(BH4)(THF)5][BPh4]
14Y
[MeY(THF)6][BPh4]2 + NaBH4- NaBPh4
SCHEME 8 Synthesis of the ionic species [MeY(BH4)(THF)5][BPh4] (14Y).
Handbook on the Physics and Chemistry of Rare Earths10
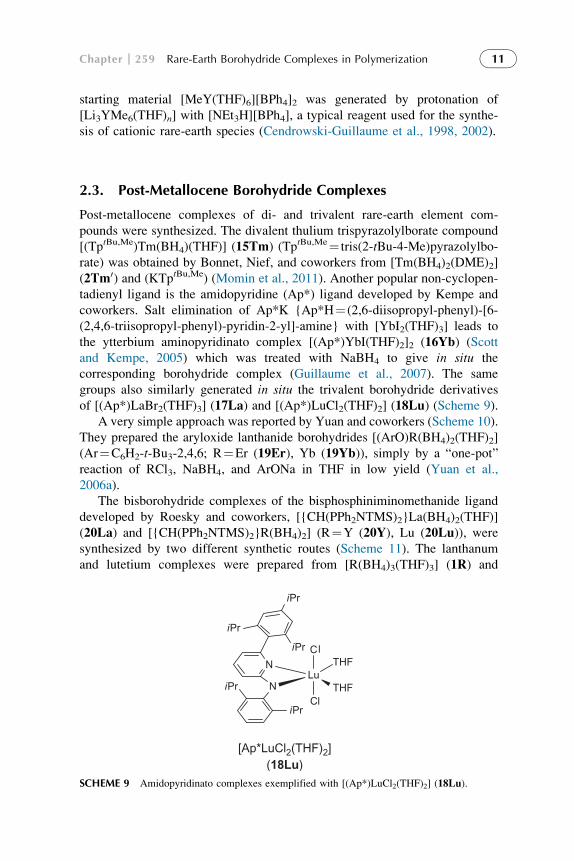
starting material [MeY(THF)6][BPh4]2 was generated by protonation of
[Li3YMe6(THF)n] with [NEt3H][BPh4], a typical reagent used for the synthe-
sis of cationic rare-earth species (Cendrowski-Guillaume et al., 1998, 2002).
2.3. Post-Metallocene Borohydride Complexes
Post-metallocene complexes of di- and trivalent rare-earth element com-
pounds were synthesized. The divalent thulium trispyrazolylborate compound
[(TptBu,Me)Tm(BH4)(THF)] (15Tm) (TptBu,Me¼ tris(2-tBu-4-Me)pyrazolylbo-
rate) was obtained by Bonnet, Nief, and coworkers from [Tm(BH4)2(DME)2]
(2Tm0) and (KTptBu,Me) (Momin et al., 2011). Another popular non-cyclopen-
tadienyl ligand is the amidopyridine (Ap*) ligand developed by Kempe and
coworkers. Salt elimination of Ap*K {Ap*H¼ (2,6-diisopropyl-phenyl)-[6-
(2,4,6-triisopropyl-phenyl)-pyridin-2-yl]-amine} with [YbI2(THF)3] leads to
the ytterbium aminopyridinato complex [(Ap*)YbI(THF)2]2 (16Yb) (Scott
and Kempe, 2005) which was treated with NaBH4 to give in situ the
corresponding borohydride complex (Guillaume et al., 2007). The same
groups also similarly generated in situ the trivalent borohydride derivatives
of [(Ap*)LaBr2(THF)3] (17La) and [(Ap*)LuCl2(THF)2] (18Lu) (Scheme 9).
A very simple approach was reported by Yuan and coworkers (Scheme 10).
They prepared the aryloxide lanthanide borohydrides [(ArO)R(BH4)2(THF)2]
(Ar¼C6H2-t-Bu3-2,4,6; R¼Er (19Er), Yb (19Yb)), simply by a “one-pot”
reaction of RCl3, NaBH4, and ArONa in THF in low yield (Yuan et al.,
2006a).
The bisborohydride complexes of the bisphosphiniminomethanide ligand
developed by Roesky and coworkers, [{CH(PPh2NTMS)2}La(BH4)2(THF)]
(20La) and [{CH(PPh2NTMS)2}R(BH4)2] (R¼Y (20Y), Lu (20Lu)), weresynthesized by two different synthetic routes (Scheme 11). The lanthanum
and lutetium complexes were prepared from [R(BH4)3(THF)3] (1R) and
Lu
Cl
Cl
THF
THF
N
N
iPr
iPr
iPr
iPr
iPr
[Ap*LuCl2(THF)2](18Lu)
SCHEME 9 Amidopyridinato complexes exemplified with [(Ap*)LuCl2(THF)2] (18Lu).
Chapter 259 Rare-Earth Borohydride Complexes in Polymerization 11

K{CH(PPh2NTMS)2} in moderate to good yields, whereas the yttrium ana-
logue was obtained from in situ prepared [{CH(PPh2NTMS)2}YCl2]2 and
NaBH4 (Jenter et al., 2010).
Amidinates and guanidinates are among the most popular ligands in post-
metallocene chemistry of the rare-earth elements (Edelmann et al., 2002). Not
surprisingly, these classes of compounds have been studied as initiators in the
ROP of polar monomers. The guanidinate complexes [{(TMS)2NC(NCy)2}R
(BH4)2(THF)2] (R¼Er (21Er) Yb (21Yb)) were synthesized in moderate yields
by Yuan and coworkers from [R(BH4)3(THF)3] (1R) with the sodium guanidi-
nate [{(TMS)2NC(NCy)2}Na] in a 1:1 molar ratio in THF (Yuan et al., 2006b).
+ RCl3 + 2 NaBH4tBu
tBu
tBu
ONa- 3 NaCl
tBu
tBu
tBu
O RO
O
BH4
BH4
R = Er (19Er), Yb (19Yb)
SCHEME 10 Synthesis of the aryloxide lanthanide borohydrides [(ArO)R(BH4)2(THF)2].
SCHEME 11 Different approaches for the synthesis of bisphosphiniminomethanide complexes.
Handbook on the Physics and Chemistry of Rare Earths12

By using the corresponding lithium salt [{(TMS)2NC(NCy)2}Li] instead
of the sodium salt, the related ate complexes [{(TMS)2NC(NCy)2}2R
(m-BH4)2Li(THF)2] (R¼Nd (22Nd), Sm (22Sm), Yb (22Yb)) were formed
(Scheme 12) (Skvortsov et al., 2007b). The analogous isopropyl compounds
[{(TMS)2NC(NiPr)2}2R(BH4)2Li(THF)2] (R¼Nd (23Nd), Sm (23Sm))
were synthesized by treatment of [R(BH4)3(THF)3] (1R) with lithium N,N0-diisopropyl-N0-bis(trimethylsilyl)guanidinate in toluene (Skvortsov et al., 2007a).
The Mountford group reported on a number of polydentate nitrogen-based
ligands. Thus, reaction of [Sm(BH4)3(THF)3] (1Sm) with diamide–diamine
ligands (2-C5H4N)CH2N(CH2CH2NTMS)2 (N2NNTMS) and (2-C5H4N)CH2N
(CH2CH2NMes)2 (N2NNMes) gave the dimeric compounds [{(N2NN
TMS)Sm
(BH4)}2] (24Sm) and [{(N2NNMes)Sm(BH4)2Li}2] (25Sm) (Scheme 13)
(Bonnet et al., 2005b). In a similar way the diaminobis(phenoxide) ligand
O2NNpy (H2O2NN
py¼ (2-C5H4N)CH2N{2-HO-3,5-C6H2tBu2}2) was coordi-
nated to the various rare-earth metals to afford complexes of composition
[{(O2NNpy)R(m-BH4)(THF)n}2] [R¼Y, n¼0.5 (26Y); Nd, n¼1 (26Nd);
Sm, n¼0 (26Sm)] (Scheme 13) (Bonnet et al., 2005a). Monomeric samarium
borohydride complexes [(O2NL)Sm(BH4)(THF)] (O2N
L¼R0CH2N(CH2-2-o-3,5-C6H2
tBu2)2 where R0 ¼CH2OMe, CH2NMe2, (2-C5H4N), or Et, with
L¼OMe (27Sm), NMe2 (28Sm), py (29Sm)), and [(O2NnPr)Sm(BH4)
(THF)2] (30Sm) with the same and related bis(phenolate)amine ligands were
obtained from [(BH4)3Sm(THF)3] (1Sm) and Na2O2NL (L¼py, OMe, NMe2,
nPr) (Scheme 13) (Dyer et al., 2010).
A similar approach was recently published by Trifonov, Carpentier, and
coworkers. By using the diaminobis(phenolate) ligands [O2N2]1 ({CH2N
(Me)CH2-3,5-Me,tBu-C6H2O}2) and [O2N2]2 (C5H4NCH2N{CH2-3,5-Me,
tBu-C6H2O}2) the heterobimetallic borohydrido neodymium complexes
[{(O2N2)1Nd(BH4)(m-BH4)Li(THF)}2] (31Nd) and [(O2N2)
2Nd(BH4)(m-BH4)
Li(THF)2] (32Nd) (Scheme 14) were synthesized from the lithium salts of
the ligands and [Nd(BH4)3(THF)3] (1Nd) (Sinenkov et al., 2011). Also, Sun
and coworkers reported on tetrahydrosalen supported rare-earth metal
complexes. They reacted the sodium salt of the ligand 6,60-[ethane-1,2-diyl-bis(methylazanediyl)]bis(methylene)bis(2,4-di-tert-butylphenolate) (N2O2)
with the lanthanide trichlorides RCl3 (R¼Er, Yb) in DME to form the
SCHEME 12 Synthesis of some selected guanidinate complexes.
Chapter 259 Rare-Earth Borohydride Complexes in Polymerization 13

SCHEME 13 Polydentate nitrogen- and oxygen-based compounds as ligands for neodymium
and samarium borohydrides.
Handbook on the Physics and Chemistry of Rare Earths14

corresponding complexes [(N2O2)RCl(DME)n] (R¼Er (33Er), Yb (33Yb))(Scheme 14). These compounds were treated with NaBH4 in situ to give the
corresponding borohydrides (Wu et al., 2009).
The research groups of Carpentier and Trifonov used the chelating dianio-
nic bis(amide) ligand (DAB2�) ((2,6-C6H3iPr2)NC(Me)]C(Me)N(2,6-
C6H3iPr2)
2�) to prepare the yttrium complexes [(DAB)Y(OtBu)(THF)
(DME)] (34Y) and [{(DAB)Y(BH4)2}{Li(DME)3}] (35Y) (Scheme 15). For
the preparation of the borohydride, in situ generated (DAB)Li2 was reacted
with equimolar amounts of [Y(BH4)3(THF)3] (1Y) to give 35Y in 52% yield
(Mahrova et al., 2009).
N
O
O
tBu
tBu
N
Nd
BH4H4B
Li THF
N
O
O
tBu
tBu
N
Nd
BH4BH4LiTHF
[[O2N2]1Nd(BH4)(m-BH4)Li(THF)]2 [[O2N2]2Nd(BH4)(m-BH4)Li(THF)2]
N N
O OYb
Cl DME tBu
tButBu
tBu
[(N2O2)YbCl(DME)]
(33Yb)
N
O ONd
H4B H4B tButBu
N
Li(THF)2
(31Nd) (32Nd)
SCHEME 14 Polydentate nitrogen- and oxygen-based compounds as ligands for lanthanide
borohydrides.
N
N
iPr
iPr
iPr
iPr
Y BH4BH4
[Li(DME)3]N
N
iPr
iPr
iPr
iPr
Y DME
OtBu
THF
[(DAB)Y(OtBu)(THF)(DME)] [{(DAB)Y(BH4)2} Li(DME)3]
(34Y) (35Y)
SCHEME 15 Some diazabutadiene yttrium complexes.
Chapter 259 Rare-Earth Borohydride Complexes in Polymerization 15
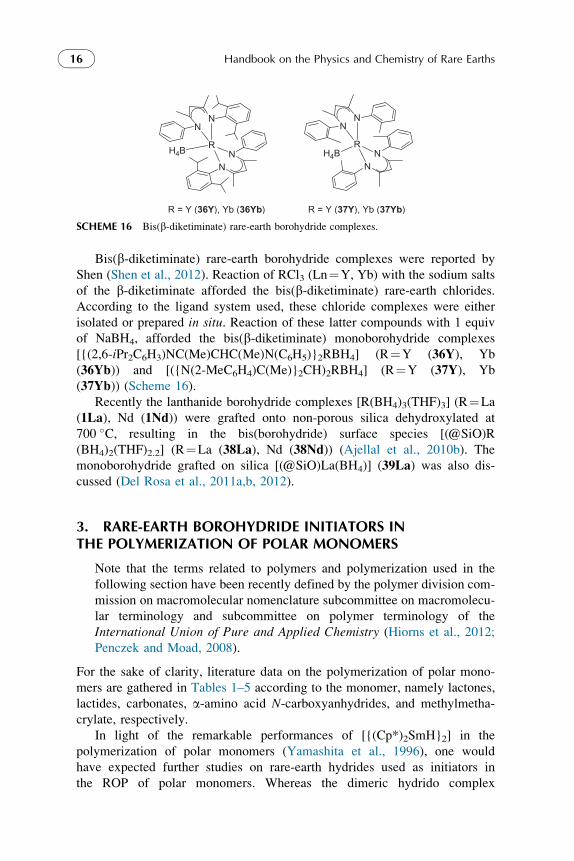
Bis(b-diketiminate) rare-earth borohydride complexes were reported by
Shen (Shen et al., 2012). Reaction of RCl3 (Ln¼Y, Yb) with the sodium salts
of the b-diketiminate afforded the bis(b-diketiminate) rare-earth chlorides.
According to the ligand system used, these chloride complexes were either
isolated or prepared in situ. Reaction of these latter compounds with 1 equiv
of NaBH4, afforded the bis(b-diketiminate) monoborohydride complexes
[{(2,6-iPr2C6H3)NC(Me)CHC(Me)N(C6H5)}2RBH4] (R¼Y (36Y), Yb
(36Yb)) and [({N(2-MeC6H4)C(Me)}2CH)2RBH4] (R¼Y (37Y), Yb
(37Yb)) (Scheme 16).
Recently the lanthanide borohydride complexes [R(BH4)3(THF)3] (R¼La
(1La), Nd (1Nd)) were grafted onto non-porous silica dehydroxylated at
700 �C, resulting in the bis(borohydride) surface species [(@SiO)R
(BH4)2(THF)2.2] (R¼La (38La), Nd (38Nd)) (Ajellal et al., 2010b). The
monoborohydride grafted on silica [(@SiO)La(BH4)] (39La) was also dis-
cussed (Del Rosa et al., 2011a,b, 2012).
3. RARE-EARTH BOROHYDRIDE INITIATORS INTHE POLYMERIZATION OF POLAR MONOMERS
Note that the terms related to polymers and polymerization used in the
following section have been recently defined by the polymer division com-
mission on macromolecular nomenclature subcommittee on macromolecu-
lar terminology and subcommittee on polymer terminology of the
International Union of Pure and Applied Chemistry (Hiorns et al., 2012;
Penczek and Moad, 2008).
For the sake of clarity, literature data on the polymerization of polar mono-
mers are gathered in Tables 1–5 according to the monomer, namely lactones,
lactides, carbonates, a-amino acid N-carboxyanhydrides, and methylmetha-
crylate, respectively.
In light of the remarkable performances of [{(Cp*)2SmH}2] in the
polymerization of polar monomers (Yamashita et al., 1996), one would
have expected further studies on rare-earth hydrides used as initiators in
the ROP of polar monomers. Whereas the dimeric hydrido complex
R = Y (36Y), Yb (36Yb) R = Y (37Y), Yb (37Yb)
RH4B
NN
NN
RH4B
NN
NN
SCHEME 16 Bis(b-diketiminate) rare-earth borohydride complexes.
Handbook on the Physics and Chemistry of Rare Earths16

[{(Z5:Z1-C5Me4SiMe2NCMe3)Y(THF)(m-H)}2] was demonstrated as being a
single-site, single-component catalyst for the polymerization of ethylene,
tert-butyl acrylate, and acrylonitrile (Arndt et al., 2002; Okuda et al., 2001),
the only, to our knowledge, other rare-earth hydride complexes investigated
in polymerization, namely the tetrasubstituted guanidinato yttrium and lute-
tium complexes, [{[TMS2NC(NiPr)2]2R(m-H)}2] (R¼Y, Lu), evaluated in
the ROP of CL, displayed some activity but no control
(MnSEC � 79,000gmol�1, 1:8<Mw=Mn< 3:5; Lyubov et al., 2008).
3.1. ROP of Lactones and Lactides, and a-Amino AcidsN-Carboxyanhydrides
3.1.1. Trivalent Inorganic Rare-Earth Borohydride Initiators
3.1.1.1. e-Caprolactone
The homoleptic rare-earth trisborohydride complexes [R(BH4)3(THF)3]
(R¼Y (1Y), La, (1La), Nd (1Nd), Sm (1Sm)) were the real first transition
metal borohydride derivatives to be investigated in the ROP of a polar
monomer, namely of CL, by Guillaume and coworkers in the early 2000s
(Scheme 17; Guillaume et al., 2003; Palard et al., 2004, 2005, 2006) (Table 1).
ROP of CL proceeded rapidly in THF, DCM, or DCM/toluene at room tem-
perature in a controlled process. As many as 377 CL units per metal-BH4
could be converted within 10 min using the samarium initiator 1Sm providing
PCL of molar mass up to MnSEC ¼ 39,600gmol�1. The molar mass values
MnSEC varied linearly with the feed ratio highlighting a “living” process.
However, at [CL]0/[BH4]0>150, assuming three growing polymer chains
per metal, MnSEC deviated to lower values relative to Mntheo indicating the
presence of some transfer reactions. The fairly narrow dispersity values
(Mw=MnLa,Nd,Sm ca:1:3) similarly suggested the occurrence of side reac-
tions, yet to some minor extent. In ROP of cyclic esters, such undesirable
reactions involve the typical inter- or intra-molecular transesterifications, that
is, reshuffling or backbiting processes respectively, or other transfer reactions
(Albertsson and Varma, 2003). Intra-molecular transesterification reactions
lead to the formation of cyclic polymers (alongside linear ones), ultimately
reducing the molar mass of the polymer. Intermolecular transesterification
reactions, or intermolecular chain transfer reactions, induce the broadening
of the dispersity. The moderate dispersity can also be attributed to a rate of
n
(1) [R(BH4)3(THF)3]
(2) H+HO
OO
OH
O
O
n + 2
HO–PCL–OH
5 5 5O
O
CL
SCHEME 17 Synthesis of HO–PCL–OH from the ROP of CL initiated by [R(BH4)3(THF)3] (1R).
Chapter 259 Rare-Earth Borohydride Complexes in Polymerization 17

TABLE 1 Rare-Earth Borohydride Complexes Used as Initiators in the (Co)Polymerization of Lactones and Experimental Data
Rare-earth borohydride
complex
Lactone
([Lactone]0/[BH4]0highest value)a
Solvent
Temp. (�C)
Reaction
time
Conv.b
Mnmaxc
(Mntheo)a,d
g mol�1 ÐMe
Polymer
Tacticity
(%) Copolymer
Divalent complex
[Sm(BH4)2(THF)2](2Sm, Scheme 2)
CL (232)(Jaroschik et al., 2010)
THF25 �C
5 min100%
24,600(13,250)
1.59
[{(Cp*)Sm(BH4)(THF)2}2](4Sm, Scheme 5)
CL (234)(Jaroschik et al., 2010)
THF25 �C
3 min84%
20,400(22,400)
1.36
[Tm(BH4)2(DME)2](2Tm0, Scheme 2)
CL (233)(Momin et al., 2011)
THF25 �C
19 min74%
12,400(19,600)
1.34
[(TptBu,Me)Tm(BH4)(THF)]f
(15Tm)CL (100)f
(Momin et al., 2011)THF25 �C
3 min100%
5700f
(11,400)1.44f
[(Ap*)YbI(THF)2]2(16Yb)/NaBH4
gCL (568)(Guillaume et al., 2007)
THF23 �C
4 h98%
43,600(63,400)
1.56
Trivalent complex
[Y(BH4)3(THF)2.5]f
(1Y0, Scheme 1)VL(200)f
(Nakayama et al., 2009)THF60 �C
60 min3.3%f
4300f
(660)h1.6f
[Y(BH4)3(THF)3]f
(1Y, Scheme 1)PDL (50)f
(Nakayama et al., 2011)THF60 �C
1 min66%f
11,000f
(7920)h1.9f
[R(BH4)2(THF)5][BPh4]R¼Y (3Y), La (3La), Nd (3Nd),Sm (3Sm) (Scheme 3)
CL (250)(Robert et al., 2008)
THF19 �C
30 s100%
17,400(28,500)
1.33

[{CH(PPh2NTMS)2}Y(BH4)2](20Y, Scheme 11)
CL (150)(Jenter et al., 2010)
THF, Tol20 �C
1 min92%
15,700(16,200)
1.38
[(iPr(TMS)NC(NiPr)N(CH2)3NC(NiPr)N(TMS)iPr)R(BH4)(DME)]R¼Y, Nd, Yb
CL (5000)(Zhang et al., 2012)
Tol20 �C
5 min100%
22,800(45,800)
1.45
[{(O2NNpy)Y(BH4)(THF)0.5}2]f
(26Y, Scheme 13)CL (290)(Bonnet et al., 2005a)
Tol/THF25 �C
2 min84%f
24,700f
(27,800)1.74f
[{(DAB)Y(BH4)2}{Li(DME)3}](35Y, Scheme 25)
rac-BL(250)(Mahrova et al., 2009)
THF, Tol20 �C
48 h14%
4600(3530)
1.23 AtacticPHB
[La(BH4)3(THF)3]f
(1La, Scheme 1)rac-BL (33)(Ajellal et al., 2010b)
Tol20 �C
24 h91%f
2700f
(2610) h1.75f Pm 50
[La(BH4)3(THF)3]f
(1La, Scheme 1)rac-BL (300)(Guillaume et al., 2013)
Tol25 �C
92 h31%
8500(8000)
1.08 Pm 56
[La(BH4)3(THF)3](1La, Scheme 1)
VL (300)(Nakayama et al., 2009)
THF, Tol60 �C
30 min94%
15,000(16,200)h
1.43 PLLA-co-PVLPCL-co-PVL(Nakayamaet al., 2009)
[La(BH4)3(THF)3](1La, Scheme 1)
CL (251)(Palard et al., 2005,2006)
THF21 �C
15 min100%
24,450(28,610)
1.16 PCL-co-PVL(Nakayamaet al., 2009)
[La(BH4)3(THF)3](1La, Scheme 1)
PDL (50)(Nakayama et al., 2011)
THF60 �C
1 min83%
14,000(2880)h
2.8
[(Ap*)LaBr2(THF)3](17La, Scheme 24)/NaBH4
gCL (450)(Guillaume et al., 2007)
THF23 �C
4 h99%
46,300(50,800)
1.45
[{CH(PPh2NTMS)2}La(BH4)2(THF)](20La, Scheme 11)
CL (150)(Jenter et al., 2010)
THF, Tol20 �C
1 min98%
13,400(16,800)
1.34
Continued
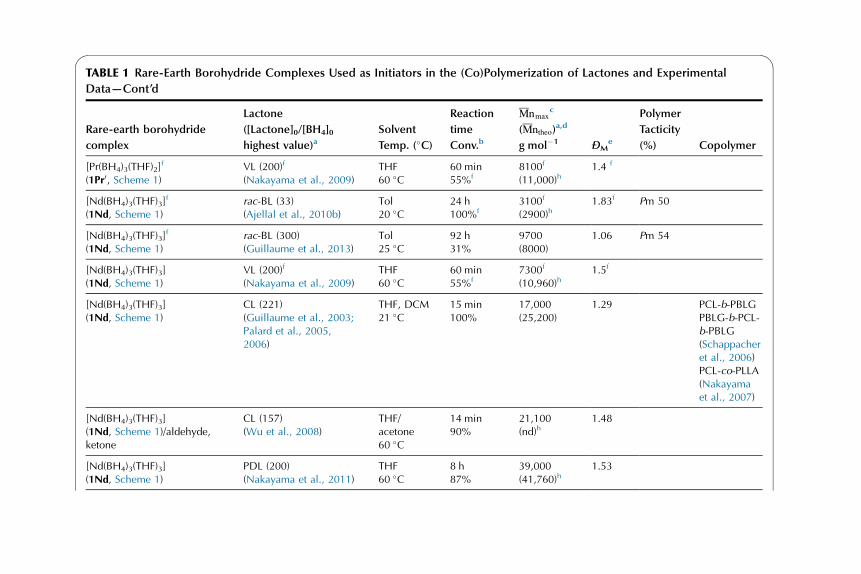
TABLE 1 Rare-Earth Borohydride Complexes Used as Initiators in the (Co)Polymerization of Lactones and Experimental
Data—Cont’d
Rare-earth borohydride
complex
Lactone
([Lactone]0/[BH4]0highest value)a
Solvent
Temp. (�C)
Reaction
time
Conv.b
Mnmaxc
(Mntheo)a,d
g mol�1 ÐMe
Polymer
Tacticity
(%) Copolymer
[Pr(BH4)3(THF)2]f
(1Pr0, Scheme 1)VL (200)f
(Nakayama et al., 2009)THF60 �C
60 min55%f
8100f
(11,000)h1.4 f
[Nd(BH4)3(THF)3]f
(1Nd, Scheme 1)rac-BL (33)(Ajellal et al., 2010b)
Tol20 �C
24 h100%f
3100f
(2900)h1.83f Pm 50
[Nd(BH4)3(THF)3]f
(1Nd, Scheme 1)rac-BL (300)(Guillaume et al., 2013)
Tol25 �C
92 h31%
9700(8000)
1.06 Pm 54
[Nd(BH4)3(THF)3](1Nd, Scheme 1)
VL (200)f
(Nakayama et al., 2009)THF60 �C
60 min55%f
7300f
(10,960)h1.5f
[Nd(BH4)3(THF)3](1Nd, Scheme 1)
CL (221)(Guillaume et al., 2003;Palard et al., 2005,2006)
THF, DCM21 �C
15 min100%
17,000(25,200)
1.29 PCL-b-PBLGPBLG-b-PCL-b-PBLG(Schappacheret al., 2006)PCL-co-PLLA(Nakayamaet al., 2007)
[Nd(BH4)3(THF)3](1Nd, Scheme 1)/aldehyde,ketone
CL (157)(Wu et al., 2008)
THF/acetone60 �C
14 min90%
21,100(nd)h
1.48
[Nd(BH4)3(THF)3](1Nd, Scheme 1)
PDL (200)(Nakayama et al., 2011)
THF60 �C
8 h87%
39,000(41,760)h
1.53

[{(O2NNpy)Nd(BH4)(THF)}2]f
(26Nd, Scheme 13)CL (275)(Bonnet et al., 2005a)
Tol/THF25 �C
0.5 min89%f
24,000f
(27,900)1.57 PCL-b-PLLAf
PCL-b-PLAf
(Bonnet et al.,2005a)
[{(O2N2)1Nd(BH4)2Li(THF)}2]
(31Nd, Scheme 14)rac-BL (50)(Sinenkov et al., 2011)
THFTol20 �C
12 h61%
5000(2625)
1.09 AtacticPHB
[(O2N2)2Nd(BH4)2Li(THF)2]
(32Nd, Scheme 14)rac-BL (50)(Sinenkov et al., 2011)
THF, Tol20 �C
12 h24%
2500(1050)
1.11 AtacticPHB
[Sm(BH4)3(THF)3]f
(1Sm, Scheme 1)rac-BL (300)(Guillaume et al., 2013)
Tol25 �C
72 h22%
8300(5700)
1.05 Pm 52
[Sm(BH4)3(THF)3](1Sm, Scheme 1)
CL (377)(Palard et al., 2004,2005, 2006)
THF, DCM,DCM/Tol21 �C
10 min96%
39,600(41,500)
1.24 PCL-b-PMMAPMMA-b-PCL-b-PMMA(Schappacheret al., 2007)
[Sm(BH4)3(THF)3](1Sm, Scheme 1)
VL (200)(Nakayama et al., 2009)
THF60 �C
60 min26%f
4800f
(5140)h1.5f
[(Cp*)2Sm(BH4)(THF)](5Sm)
CL (565)(Palard et al., 2004,2006)
THF21 �C
30 min99%
39,150(63,850)
1.43
[{(N2NNTMS)Sm(BH4)}2]f
(24Sm, Scheme 13)CL (250)f
(Bonnet et al., 2005b)Tol/THF25 �C
1 min96%f
24,000f
(27,400)1.17f
Continued

TABLE 1 Rare-Earth Borohydride Complexes Used as Initiators in the (Co)Polymerization of Lactones and Experimental
Data—Cont’d
Rare-earth borohydride
complex
Lactone
([Lactone]0/[BH4]0highest value)a
Solvent
Temp. (�C)
Reaction
time
Conv.b
Mnmaxc
(Mntheo)a,d
g mol�1 ÐMe
Polymer
Tacticity
(%) Copolymer
[{(O2NNpy)Sm(BH4)}2]f
(26Sm, Scheme 13)CL (275)(Bonnet et al., 2005a)
Tol/THF25 �C
0.5 min90%f
26,920f
(28,250)1.76f
[(O2NL)Sm(BH4)(THF)]
L¼OMe (27Sm), NMe2(28Sm), py (29Sm),(Scheme 13)[(O2N
nPr)Sm(BH4)(THF)2](30Sm, Scheme 13)
CL (275)(Dyer et al., 2010)
Tol/THFRT
2 min100%
28,400(31,381)
1.83
[(N2O2)Er(Cl)(DME)]/NaBH4g
(33Er, Scheme 14)CL (1500)(Wu et al., 2009)
Tol/Hexane65 �C
120 min95%
33,300(nd)h
1.43
[Yb(BH4)3(THF)3]f
(1Yb, Scheme 1)VL (200)f
(Nakayama et al., 2009)THF60 �C
60 min0%f
–f –f
[(N2O2)Yb(Cl)(DME)2]/NaBH4g
(33Yb, Scheme 14)CL (1000)(Wu et al., 2009)
Tol/Hexane65 �C
120 min96%
36,400(nd)h
1.33
[(Ap*)LuCl2(THF)2](18Lu)/NaBH4
gCL (450)(Guillaume et al., 2007)
THF23 �C
4 h99%
45,600(50,800)
1.53
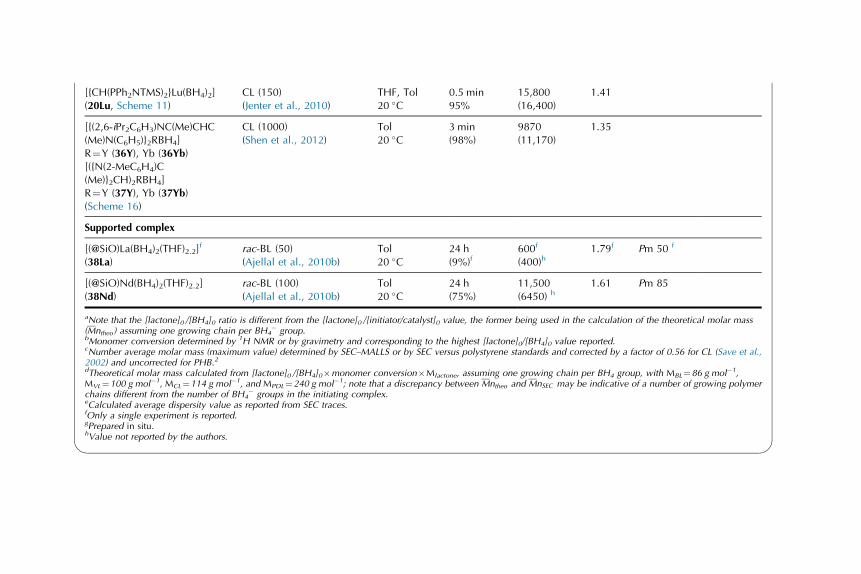
[{CH(PPh2NTMS)2}Lu(BH4)2](20Lu, Scheme 11)
CL (150)(Jenter et al., 2010)
THF, Tol20 �C
0.5 min95%
15,800(16,400)
1.41
[{(2,6-iPr2C6H3)NC(Me)CHC(Me)N(C6H5)}2RBH4]R¼Y (36Y), Yb (36Yb)[({N(2-MeC6H4)C(Me)}2CH)2RBH4]R¼Y (37Y), Yb (37Yb)(Scheme 16)
CL (1000)(Shen et al., 2012)
Tol20 �C
3 min(98%)
9870(11,170)
1.35
Supported complex
[(@SiO)La(BH4)2(THF)2.2]f
(38La)rac-BL (50)(Ajellal et al., 2010b)
Tol20 �C
24 h(9%)f
600f
(400)h1.79f Pm 50 f
[(@SiO)Nd(BH4)2(THF)2.2](38Nd)
rac-BL (100)(Ajellal et al., 2010b)
Tol20 �C
24 h(75%)
11,500(6450) h
1.61 Pm 85
aNote that the [lactone]0 /[BH4]0 ratio is different from the [lactone]0 /[initiator/catalyst]0 value, the former being used in the calculation of the theoretical molar mass(Mntheo ) assuming one growing chain per BH4
� group.bMonomer conversion determined by 1H NMR or by gravimetry and corresponding to the highest [lactone]0/[BH4]0 value reported.cNumber average molar mass (maximum value) determined by SEC–MALLS or by SEC versus polystyrene standards and corrected by a factor of 0.56 for CL (Save et al.,2002) and uncorrected for PHB.2dTheoretical molar mass calculated from [lactone]0 /[BH4]0�monomer conversion�Mlactone, assuming one growing chain per BH4 group, with MBL¼86 g mol�1,MVL¼100 g mol�1, MCL¼114 g mol�1, and MPDL¼240 g mol�1; note that a discrepancy between Mntheo and MnSEC may be indicative of a number of growing polymerchains different from the number of BH4
� groups in the initiating complex.eCalculated average dispersity value as reported from SEC traces.fOnly a single experiment is reported.gPrepared in situ.hValue not reported by the authors.

propagation which is faster than the rate of initiation (Penczek and Moad,
2008). The best control in terms of experimental and calculated molar mass
agreement, and narrow dispersity was achieved with the largest metal,
La>Sm>Nd. The quasi “living” character of the ROP process was later fur-
ther demonstrated with the successful synthesis of block copolymers prepared
by sequential copolymerization, poly(e-caprolactone)-b-poly(trimethylene
carbonate), PCL-b-PTMC (Section 3.5.1; Table 1). The studies on the influ-
ence of solvent revealed the detrimental effect on the polymerization rate of
a coordinative polar solvent such as THF, in comparison to non-coordinative
DCM or apolar toluene. Indeed, it is assumed that THF, because of its high
affinity toward oxophilic rare-earth metals, competes with the polar CL
monomer for coordination onto the metal center. This trend was later often
observed in the ROP of cyclic esters promoted by rare-earth borohydride
complexes, yet with some exception, as for instance with the higher CL
polymerization rate reported in THF than in toluene using diaminobis
(phenoxide)monoborohydride complexes (Bonnet et al., 2005a). The
polyester recovered were established, based on extensive investigations by1H and 13C NMR, FTIR, Matrix-Assisted Laser Desorption/Ionization-Time-
of-Flight Mass Spectrometry (MALDI-ToF MS) and elemental analyses, as
a,o-dihydroxytelechelic PCL (Scheme 17). Note that dihydroxytelechelic
polymers herein referred to as HO-polymer-OH are formally H-polymer-OH
(Guillaume, 2013). Formation of such HO–PCL–OH, initially not
foreseen, resulted from the reduction of the carbonyl group of the first
inserted CL molecule (see below, Scheme 26, Section 3.1.4). This behavior
is certainly distinct from that observed with the more common rare-earth
alkoxide initiators which provide a,o-hydroxyalkoxytelechelic (see below,
Scheme 27, Section 3.1.4; Palard et al., 2006). Detailed FTIR investigations
revealed that the terminal -OBH2 group of the growing polymer was
involved in van der Waals interactions leading to the cohesion of the
experimentally observed “physical” gel. This route from rare-earth borohy-
dride initiators represents a valuable strategy for the synthesis of highly
desirable dihydroxytelechelic macroinitiators (vide infra; Section 3.1.5;
Guillaume, 2013). Interestingly, the residual amount of metal present in the
recovered PCL samples was measured around 0.26–0.63% of the initial
loading in metal (Palard et al., 2005). This issue is relevant considering the
potential application of PCL in the biomedical field. Subsequent investiga-
tions on the in vitro cytotoxicity of PCL samples prepared from various metal
derivatives, including the rare-earth trisborohydride complexes, were carried
out by Guillaume and coworkers (Schappacher et al., 2010). The results
revealed the absence of toxic influence of the polyesters on human osteo-
progenitor cells, making these polymers valuable candidates as biomaterials
to be in contact with living human cells. Besides, the absence of toxicity
of the residual rare-earth metal remaining in the isolated PCL was also
demonstrated.
Handbook on the Physics and Chemistry of Rare Earths24

Following their interest in cationic rare-earth organometallic species,
Okuda and coworkers investigated the first ROP of a cyclic ester using a cat-
ionic borohydride rare-earth complex, [R(BH4)2(THF)5][BPh4] (R¼Y (3Y);La (3La), Nd (3Nd), Sm (3Sm)) (Robert et al., 2008) (Table 1). All initiators
featured a higher activity toward the ROP of CL (Mn< 17,400gmol�1 with
1:25<Mw=Mn< 1:38) than the parent neutral complexes [R(BH4)3(THF)3]
(R¼Y (1Y), La (1La), Nd (1Nd), Sm (1Sm); 100% conversion within
15 min; Palard et al., 2005), with a complete CL conversion reached in 30s
whichever the metal ([CL]0/[BH4]0 ca. 250). However, the number of
growing chains per metal center always exceeded two (as anticipated from
such bisborohydride initiators), presumably due to rapid gelation of the reac-
tion mixture involving chain transfer reactions. These preliminary results next
prompted theoretical investigations by Okuda, Maron, and coworkers on the
ROP of CL initiated by [MeY(BH4)(THF)5][BPh4] (14Y; Susperregui et al.,2011; see below Section 4 and Table 6).
As an extension of these studies on homoleptic rare-earth borohydride initia-
tors, Sun and coworkers developed an elegant approach toward the synthesis of
related end-capped PCLs (Wu et al., 2008) (Table 1). The so-called one-pot
reduction/initiation strategy was successfully extended to the reduction (up to
90% within 14 min at 60 �C), by the rare-earth borohydride complexes
[R(BH4)3(THF)3] (R¼Y (1Y), Nd (1Nd)), of the carbonyl group of an exogenousaldehyde or ketone RC(O)R0 (R¼alkyl, aryl, R0 ¼H, alkyl; see below,
Scheme 28, Section 3.1.4). The resulting rare-earth alkoxide [R(OCHRR0)3]then triggered the ROP of CL with high efficiency, ultimately affording
HO–PCL–OCHRR0 as evidenced by 1H NMR and FTIR analyses
(2,650<Mn< 21,100gmol�1 with 1:25<Mw=Mn< 1:76). Double or multi
carbonyl-containing reagents similarly gave a,o-hydroxyalkoxytelechelic PCLs.While the reduction reactivity of aliphatic aldehydes is prior to that of ketones, the
polymerization process from aliphatic aldehydes was less efficient than others.
3.1.1.2. d-Valerolactone
The ROP of the one-carbon smaller lactone, d-valerolactone (VL) was investi-
gated by Nakayama, Shiono, and coworkers at 60 �C in THF or toluene from
[R(BH4)3(THF)x] (R¼Y, x¼2.5 (1Y0); La, x¼3 (1La); Pr, x¼2 (1Pr0); Nd,x¼3 (1Nd); Sm, x¼3 (1Sm); Yb, x¼3 (1Yb)) with various metal centers
(Nakayama et al., 2009) (Table 1). The catalytic activities observed were in the
same order as the ionic radii of the ions La�Pr�Nd>Sm>Y>Yb (Shannon,
1976), and better in toluene as opposed to THF. The linear variation ofMn values
with the PVL yields along with Mw=Mn ca: 1:43 indicated a rather controlled
polymerization in the case of 1La. In comparison to CL, the ROP of VL in THF
was considerably slower (30 min for 81% conversion at [VL]0/[BH4]0¼200) as
expected for a less strained VL ring (Saiyasombat et al., 1998). 1H NMR and
MALDI-ToF MS analyses supported the formation of a,o-dihydroxytelechelic
Chapter 259 Rare-Earth Borohydride Complexes in Polymerization 25

PVLs (Mn up to 15,000 g mol�1 with 1:3<Mw=Mn< 1:7) following the same
mechanism as that established for CL (Scheme 18).
3.1.1.3. o-Pentadecalactone
In the [R(BH4)3(THF)3] (R¼Y (1Y), La (1La), Nd (1Nd)) series, the neo-
dymium complex was the most efficient (83% in 1 min at [PDL]0/
[BH4]0¼50) toward the ROP of o-pentadecalactone (PDL) at 60 �C, as estab-lished by Nakayama et al. (2011) (Table 1). The molar mass of the polymer
synthesized from 1Nd increased with the yield (Mn up to 39,000 g mol�1 with
Mw=Mn ca: 1:4) featuring a quite good control. The resulting polyesters were
shown by 1H NMR and MALDI-ToF MS analyses as being a,o-dihydroxytelechelic PPDL, HO–PPDL–OH, thereby assuming a mechanism
similar to that of CL (Scheme 19).
3.1.1.4. Lactide
The series of complexes [R(BH4)3(THF)x] (R¼Y, x¼2.5 (1Y0); La, x¼3
(1La); Pr, x¼2 (1Pr0); Nd, x¼3 (1Nd); Sm, x¼3 (1Sm); Yb, x¼3 (1Yb))were also shown by Nakayama, Shiono, and coworkers to be active in
the ROP of racemic-lactide (rac-LA, Nakayama et al., 2009) (Table 2). The
same trend in catalytic activity related to the metal center
(La�Pr�Nd>Sm>Y>Yb) or solvent polarity (ROP proceeded slower
in THF as compared to in toluene) was observed, as for VL (vide supra).No stereoselectivity data have been reported for PLA
(3,800<Mn< 30,100gmol�1 with 1:2<Mw=Mn< 1:7). The ROP of (S,S)-lactide (L-lactide, LLA), initiated by 1Nd at [LLA]0/[BH4]0¼50, reached
76% in 30 min at 60 �C, affording highly crystalline PLLA (Tm¼162 �C,Mn� 16,500gmol�1) with 1:2<Mw=Mn< 1:6 suggesting the absence of
n
(1) [R(BH4)3(THF)3]
(2) H+HO
OO
OH
O
O
n + 2
HO–PVL–OH
O
O
VL
4 4 4
SCHEME 18 Synthesis of HO–PVL–OH from the ROP of VL initiated by [R(BH4)3(THF)3] (1R).
n
(1) [R(BH4)3(THF)3]
(2) H+
HOO
OOH
O
O
n + 2
HO–PPDL–OH
O
O
PDL
14 14 14
SCHEME 19 Synthesis of HO–PPDL–OH from the ROP of PDL initiated by [R(BH4)3(THF)3] (1R).
Handbook on the Physics and Chemistry of Rare Earths26

TABLE 2 Rare-Earth Borohydride Complexes Used as Initiators in the (Co)Polymerization of Lactides and Experimental Data
Rare-earth borohydride
complex
Lactide
([Lactide]0/[BH4]0highest value)a
Solvent
Temp.
(�C)
Reaction
time
Conv.b
Mnmaxc
(Mntheo)a,d
g mol�1 ÐMe
Polymer
Tacticity
(%) Copolymer
Trivalent complex
[Y(BH4)3(THF)2.5]f
(1Y0, Scheme 1)rac-LA(133)f
(Nakayama et al., 2009)THF60 �C
60 min24%f
3800f
(4550)g1.7f ndg
[{(O2NNpy)Y(BH4)(THF)0.5}2](26Y, Scheme 13)
rac-LA (200)(Bonnet et al., 2005a)
THF,25 �CTol, 70 �C
60 min72%
10,600(18,300)
1.52 Pr 87
[{(O2NNpy)Y(BH4)(THF)0.5}2](26Y, Scheme 13)
LLA (200)f
(Bonnet et al., 2005a)THF25 �C
180 min28%f
3850(7780)
1.37f IsotacticPLLA
[{(DAB)Y(BH4)2}{Li(DME)3}](35Y, Scheme 25)
rac-LA (75)(Mahrova et al., 2009)
THF, Tol20 �C
4 h92%
13,400(9950)
1.21 AtacticPLA
[La(BH4)3(THF)3](1La, Scheme 1)
rac-LA (200)(Nakayama et al., 2009)
THF60 �C
60 min90%
30,100(17,625)g
1.33 ndg PLLA-co-PVL(Nakayamaet al., 2009)
[Pr(BH4)3(THF)2]f
(1Pr0, Scheme 1)rac-LA (133)f
(Nakayama et al., 2009)THF60 �C
60 min65%f
12,700f
(12,500)g1.3f ndg
[Nd(BH4)3(THF)3](1Nd, Scheme 1)
rac-LA (133)f
(Nakayama et al., 2009)THF60 �C
60 min64%f
12,200f
(12,300)g1.4f ndg
[Nd(BH4)3(THF)3](1Nd, Scheme 1)
LLA (200)(Nakayama et al., 2007)
THF60 �C
3 h76%
16,500(22,000)
1.2 IsotacticPLLA
PCL-co-PLLA(Nakayamaet al., 2007)
Continued

TABLE 2 Rare-Earth Borohydride Complexes Used as Initiators in the (Co)Polymerization of Lactides and Experimental
Data—Cont’d
Rare-earth borohydride
complex
Lactide
([Lactide]0/[BH4]0highest value)a
Solvent
Temp.
(�C)
Reaction
time
Conv.b
Mnmaxc
(Mntheo)a,d
g mol�1 ÐMe
Polymer
Tacticity
(%) Copolymer
[{(TMS)2NC(NiPr)2}2Nd(BH4)2Li(THF)2]
f
(22Nd, Scheme 12)
rac-LA (200)(Skvortsov et al., 2007a)
THF, Tol20 �C
60 min>98%
52,000(28,220)
1.68 AtacticPLA
[{(TMS)2NC(NiPr)2}2Nd(BH4)2Li(THF)2]
f
(22Nd, Scheme 12)
LLA (100)(Skvortsov et al., 2007a)
THF20 �C
60 min98%
17,300(14,100)
1.54 IsotacticPLA
[1,8-C10H6{NC(tBu)N-2,6-Me2-C6H3}2]R(BH4)2Li(THF)2]R¼Nd, Sm
rac-LA (250)(Yakovenko et al., 2012)
THF, Tol20 �C
18 h97%
18,700(36,000)
1.57 Pr 62
[(iPr(TMS)NC(NiPr)N(CH2)3NC(NiPr)N(TMS)iPr)R(BH4)(DME)]R¼Y, Nd, Yb
rac-LA (1000)LLA (3000)(Zhang et al., 2012)
THF, Tol20 �C
3–15 h78%
30,500(33,700)
1.55 Pr 72
[{(O2NNpy)Nd(BH4)(THF)}2](26Nd, Scheme 13)
rac-LA (200)(Bonnet et al., 2005a)
THF,25 �CTol, 70 �C
120 min33%
4800(9500)
1.57 Pr 64 PCL-b-PLAf
(Bonnet et al.,2005a)
[{(O2NNpy)Nd(BH4)(THF)}2](26Nd, Scheme 13)
LLA (200)f
(Bonnet et al., 2005a)THF25 �C
180 min34%f
6330(9790)
1.31f IsotacticPLLA
PCL-b-PLLAf
(Bonnet et al.,2005a)
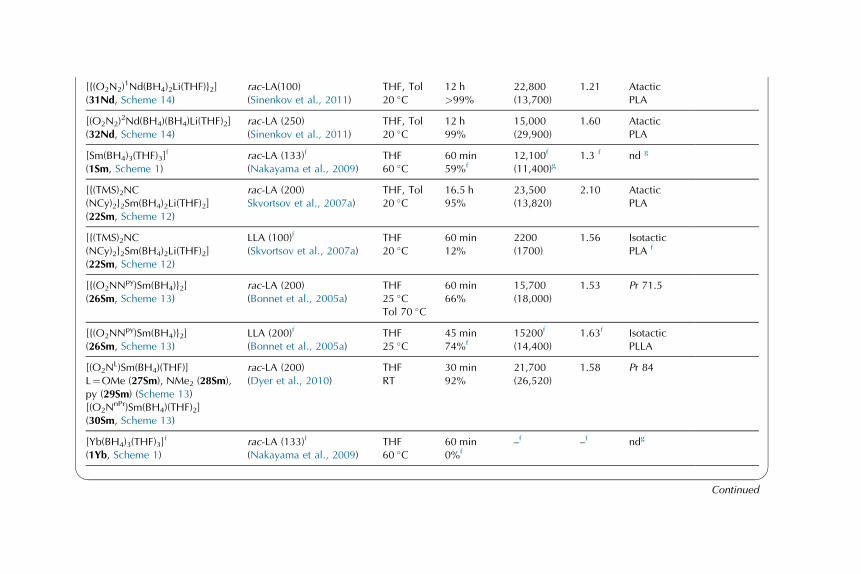
[{(O2N2)1Nd(BH4)2Li(THF)}2]
(31Nd, Scheme 14)rac-LA(100)(Sinenkov et al., 2011)
THF, Tol20 �C
12 h>99%
22,800(13,700)
1.21 AtacticPLA
[(O2N2)2Nd(BH4)(BH4)Li(THF)2]
(32Nd, Scheme 14)rac-LA (250)(Sinenkov et al., 2011)
THF, Tol20 �C
12 h99%
15,000(29,900)
1.60 AtacticPLA
[Sm(BH4)3(THF)3]f
(1Sm, Scheme 1)rac-LA (133)f
(Nakayama et al., 2009)THF60 �C
60 min59%f
12,100f
(11,400)g1.3 f nd g
[{(TMS)2NC(NCy)2}2Sm(BH4)2Li(THF)2](22Sm, Scheme 12)
rac-LA (200)Skvortsov et al., 2007a)
THF, Tol20 �C
16.5 h95%
23,500(13,820)
2.10 AtacticPLA
[{(TMS)2NC(NCy)2}2Sm(BH4)2Li(THF)2](22Sm, Scheme 12)
LLA (100)f
(Skvortsov et al., 2007a)THF20 �C
60 min12%
2200(1700)
1.56 IsotacticPLA f
[{(O2NNpy)Sm(BH4)}2](26Sm, Scheme 13)
rac-LA (200)(Bonnet et al., 2005a)
THF25 �CTol 70 �C
60 min66%
15,700(18,000)
1.53 Pr 71.5
[{(O2NNpy)Sm(BH4)}2](26Sm, Scheme 13)
LLA (200)f
(Bonnet et al., 2005a)THF25 �C
45 min74%f
15200f
(14,400)1.63f Isotactic
PLLA
[(O2NL)Sm(BH4)(THF)]
L¼OMe (27Sm), NMe2 (28Sm),py (29Sm) (Scheme 13)[(O2N
nPr)Sm(BH4)(THF)2](30Sm, Scheme 13)
rac-LA (200)(Dyer et al., 2010)
THFRT
30 min92%
21,700(26,520)
1.58 Pr 84
[Yb(BH4)3(THF)3]f
(1Yb, Scheme 1)rac-LA (133)f
(Nakayama et al., 2009)THF60 �C
60 min0%f
–f –f ndg
Continued

TABLE 2 Rare-Earth Borohydride Complexes Used as Initiators in the (Co)Polymerization of Lactides and Experimental
Data—Cont’d
Rare-earth borohydride
complex
Lactide
([Lactide]0/[BH4]0highest value)a
Solvent
Temp.
(�C)
Reaction
time
Conv.b
Mnmaxc
(Mntheo)a,d
g mol�1 ÐMe
Polymer
Tacticity
(%) Copolymer
[{(TMS)2NC(NiPr)2}2Yb(BH4)2Li(THF)2](22Yb, Scheme 12)
rac-LA, LLA (200)(Skvortsov et al., 2007a)
Tol20 �C
16.5 h94%
15,500(13,700)
1.72 Atactic PLAPLLA
[{(2,6-iPr2C6H3)NC(Me)CHC(Me)N(C6H5)}2RBH4]R¼Y (36Y), Yb (36Yb)(Scheme 16)[({N(2-MeC6H4)C(Me)}2CH)2RBH4]R¼Y (37Y),Yb (37Yb) (Scheme 16)
LLA (1000)(Shen et al., 2012)
Tol20 �C
4 min(96)
12,660(13,760)
1.36 PLLA
aNote that the [lactide]0 /[BH4]0 ratio is different from the [lactide]0 /[initiator/catalyst]0 value, the former being used in the calculation of the theoretical molar mass(Mntheo ) assuming one growing chain per BH4
� group.bMonomer conversion determined by 1H NMR or by gravimetry and corresponding to the highest [lactide]0 /[BH4]0 value reported.cNumber average molar mass (maximum value) determined by SEC–MALLS or by SEC versus polystyrene standards and corrected by a factor of 0.58 for PLA (Save et al.,2002).dTheoretical molar mass calculated from [lactide]0 /[BH4]0�monomer conversion�Mlactide, assuming one growing chain per BH4
� group, with MLA¼144 g mol�1; notethat a discrepancy between Mntheo and MnSEC may be indicative of a number of growing polymer chains different from the number of BH4 groups in the initiatingcomplex.eCalculated average dispersity value as reported from SEC traces.fOnly a single experiment is reported.gValue not reported by the authors.
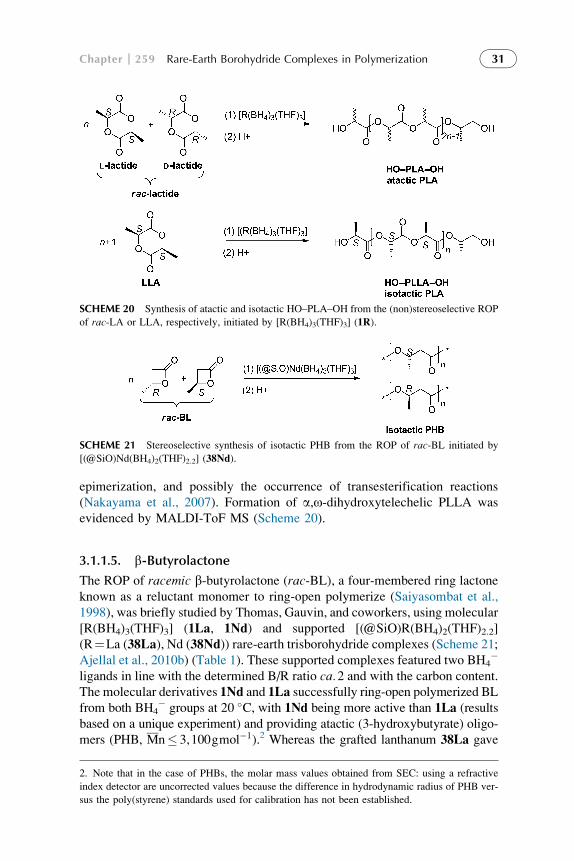
epimerization, and possibly the occurrence of transesterification reactions
(Nakayama et al., 2007). Formation of a,o-dihydroxytelechelic PLLA was
evidenced by MALDI-ToF MS (Scheme 20).
3.1.1.5. b-Butyrolactone
The ROP of racemic b-butyrolactone (rac-BL), a four-membered ring lactone
known as a reluctant monomer to ring-open polymerize (Saiyasombat et al.,
1998), was briefly studied by Thomas, Gauvin, and coworkers, using molecular
[R(BH4)3(THF)3] (1La, 1Nd) and supported [(@SiO)R(BH4)2(THF)2.2]
(R¼La (38La), Nd (38Nd)) rare-earth trisborohydride complexes (Scheme 21;
Ajellal et al., 2010b) (Table 1). These supported complexes featured two BH4�
ligands in line with the determined B/R ratio ca.2 and with the carbon content.The molecular derivatives 1Nd and 1La successfully ring-open polymerized BL
from both BH4� groups at 20 �C, with 1Nd being more active than 1La (results
based on a unique experiment) and providing atactic (3-hydroxybutyrate) oligo-
mers (PHB, Mn� 3,100gmol�1).2 Whereas the grafted lanthanum 38La gave
SCHEME 20 Synthesis of atactic and isotactic HO–PLA–OH from the (non)stereoselective ROP
of rac-LA or LLA, respectively, initiated by [R(BH4)3(THF)3] (1R).
SCHEME 21 Stereoselective synthesis of isotactic PHB from the ROP of rac-BL initiated by
[(@SiO)Nd(BH4)2(THF)2.2] (38Nd).
2. Note that in the case of PHBs, the molar mass values obtained from SEC: using a refractive
index detector are uncorrected values because the difference in hydrodynamic radius of PHB ver-
sus the poly(styrene) standards used for calibration has not been established.
Chapter 259 Rare-Earth Borohydride Complexes in Polymerization 31

poor activity and atactic PHB, the grafted neodymium derivative 38Nd exhibited
the highest stereoselectivity for the isospecific polymerization of rac-BL (Pm85%), as determined from analysis of the carbonyl region of the 13C{1H}
NMR spectrum of the PHB (Mn� 11,500gmol�1; Scheme 21). These heteroge-
neous initiators 38La, 38Nd appeared comparatively less active than the non-
supported analogues 1La, 1Nd. No further characterization of the PHB (chain-
ends, thermal transition temperature of isotactic PHB) was reported. The effect
of the grafting mode of a rare-earth borohydride complex onto a silica surface
was next investigated from kinetic and thermodynamic parameters through
DFT studies on the ROP of the larger lactone, namely CL, by Maron and cowor-
kers (Del Rosa et al., 2011a,b).
Recently, Guillaume, Maron, Roesky, and coworkers showed the con-
trolled ROP of rac-BL from 1La, 1Nd, and 1Sm initiators (Guillaume
et al., 2013). The ROP remained quite slow, as commonly observed with
this b-lactone, and a better control was observed in the order Sm>Nd>La.
Well-defined atactic a,o-dihydroxytelechelic PHBs, withMn up to 7900 g mol�1
and dispersity values �1.10 were formed, in THF or toluene at 25 �C, as evi-denced from combined NMR and MALDI-ToF analyses (Scheme 22). These
findings were further supported by DFT calculations (vide infra).
3.1.1.6. g-Benzyl-L-Glutamate N-Carboxyanhydride
Although a-amino acids N-carboxyanhydrides (NCAs), also known as
Leuchs’ anhydrides, are not cyclic esters, they are cyclic monomers which
undergo ROP to afford the corresponding poly(a-amino acid)s. The trisboro-
hydride complexes [R(BH4)3(THF)3] (R¼Sc (1Sc), Y (1Y), La (1La),Dy (1Dy)) were thus investigated in the ROP of a-amino acids NCA, namely
g-benzyl-L-glutamate NCA, by Shen and coworkers (BLG; Peng et al., 2012a,
2012b) (Table 3). The molar mass values of the resulting poly(g-benzyl-L-glutamate N-carboxyanhydride) (PBLG) prepared from 1Y were controlled
to some extent by the [BLG]0/[1Y]0 ratio and increased with higher reaction
temperatures, but were found larger than the calculated ones. The yttrium
complex 1Y always afforded higher molar mass (Mn� 86,200gmol�1) than
the other three rare-earth metal complexes, while 1Sc gave the lowest Mn
values. Detailed MALDI-ToF and Electron-Spray Ionization MS analyses
along with various NMR experiments (1H, 13C, COSY, HMQC) of a polymer
sample prepared from the related L-alanine NCA (ALA) and 1Y showed the
SCHEME 22 Synthesis of atactic PHB from the ROP of rac-BL initiated by [R(BH4)3(THF)3]
(1R; R¼La, Nd, Sm).
Handbook on the Physics and Chemistry of Rare Earths32

TABLE 3 Rare-Earth Borohydride Complexes Used as Initiators in the (Co)Polymerization of BLG–NCA and Experimental Data
Rare-earth
borohydride complex
BLG
([BLG]0/[BH4]0highest value)a
Solvent
Temp. (�C)Reaction time
Conv.b
Mnmaxc
(Mntheo)a,d
g mol�1 ÐMe
Polymer
Tacticity
(%) Copolymer
Trivalent complex
[Sc(BH4)3(THF)2](1Sc0, Scheme 1)
BLG (73)(Peng et al., 2012a,b)
DMF40 �C
24 h98%
35,100(15,700)
1.65
[Y(BH4)3(THF)3](1Y, Scheme 1)
BLG (388)(Peng et al., 2012a,b)
DMF40 �C
24 h92%
86,200(78,100)
1.32 P(BLG-b-ALA)P(BLG-b/co-BLL)(Peng et al., 2012b)
[La(BH4)3(THF)3](1La, Scheme 1)
BLG (69)(Peng et al., 2012a,b)
DMF40 �C
24 h90%
49,800(13,500)
1.29
[Dy(BH4)3(THF)3](1Dy, Scheme 1)
BLG (59)(Peng et al., 2012a,b)
DMF40 �C
24 h90%
56,800(11,500)
1.16
aNote that the [BLG]0 /[BH4]0 ratio is different from the [BLG]0 /[initiator/catalyst]0 value, the former being used in the calculation of the theoretical molar mass (Mntheo )assuming one growing chain per BH4
� group.bMonomer conversion determined by 1H NMR or by gravimetry and corresponding to the highest [BLG]0 /[BH4]0 value reported.cNumber average molar mass (maximum value) determined by SEC–MALS in DMF/LiBr.dTheoretical molar mass calculated from [BLG]0 /[BH4]0�BLG conversion�MBLG, assuming one growing chain per BH4
� group, with MBLG¼219 g mol�1; note that adiscrepancy between Mntheo and MnSEC may be indicative of a number of growing polymer chains different from the number of BH4 groups in the initiating complex.eCalculated average dispersity value as reported from SEC traces.

formation of an a-carboxylic-o-aminotelechelic polypeptide chain (A) and an
a-hydroxyl,o-aminotelechelic polymer (B), as the two major products. Two
other minor compounds were identified as an a-amino,o-hydantoinic (C),and an a-carboxylic,o-hydantoic acid (D) end-functionalized poly(ALA)
(Scheme 23; see also Schemes 29 and 30 in Section 3.1.4).
3.1.2. Trivalent Organometallic Rare-Earth Borohydride Initiators
3.1.2.1. e-Caprolactone
3.1.2.1.1. Trivalent Rare-Earth Borohydride Initiators Made in Situ In a
recent study, Kempe, Guillaume, and coworkers pioneered the in situ synthe-
sis of a rare-earth borohydride initiator from the salt metathesis reaction
between NaBH4 and the aminopyridinato rare-earth halides [(Ap*)
LaBr2(THF)3] (17La) or [(Ap*)LuCl2(THF)2] (18Lu), in the ROP of CL
(Scheme 24; Guillaume et al., 2007) (Table 1). Whereas no polymer was
obtained in the absence of NaBH4, dihydroxytelechelic PCLs were formed
from such bicomponent initiating systems, 17La,18Lu/NaBH4, thus demon-
strating the successful in situ generation of the rare-earth borohydride pre-
initiating species (vide infra). Fairly large CL loadings ([CL]0/[BH4]0�450)
were quantitatively converted within 4 h at 23 �C affording quite high molar
mass PCLs (Mn up to 46,300 g mol�1) with Mw=Mn ca: 1:49. This attractivestrategy, using a borohydride alkali metal salt combined to a rare-earth halide
as a precursor to the rare-earth borohydride initiator, has later been only rarely
applied in the ROP of cyclic esters to make PCL: examples are the
tetrahydrosalen-backboned rare-earth complexes reported by Shen and
(1) [Y(BH4)3(THF)3]
(2) H+
NH
O OO
R
12
34
5
NH
HN
H
O
Rn
HO
R
O
NH
HN
OHO
R
nHR
B
BLG
CO2
A
O
OR =
nN
N
NH
H
O
HO
HN
O
Rn
DC
HN
OH
O
O
R
R
O
HOR
O
O
R
SCHEME 23 Synthesis of PBLG from the ROP of BLG initiated by [Y(BH4)3(THF)3] (1Y).
n
17La or 18Lu / NaBH4
(2)
(1)
H+HO
OO
OH
O
O
n+2
HO–PCL–OH
5 5 5O
O
CL
SCHEME 24 Synthesis of HO–PCL–OH from the ROP of CL initiated by the rare-earth borohy-
dride complexes generated in situ from [(Ap*)RBr2(THF)3] (R¼La (17La), Lu (18Lu))/NaBH4.
Handbook on the Physics and Chemistry of Rare Earths34

coworkers [(N2O2)R(Cl)(DME)n] (R¼Er, n¼1 (33Er), Yb, n¼2 (33Yb))/NaBH4 (Wu et al., 2009) (Scheme 14) and the related [{CH(PPh2NTMS)2}
R(Z5-C5Me5)Cl]/HOiPr (R¼Y, Sm, Yb), (Gamer et al., 2007) combination.
Such an approach generating the active borohydrido species in situ avoids
the prior synthesis and isolation of the complex, which represents a significant
advantage. Yet it remains largely under-exploited in comparison to the use of
discrete rare-earth borohydride polymerization initiators.
3.1.2.1.2. Discrete Trivalent Rare-Earth Borohydride Initiators The cat-
alytic behavior of [(Cp*)2Sm(BH4)(THF)] (5Sm) was studied in the ROP of
CL by Guillaume and coworkers as the first organometallic rare-earth borohy-
dride evaluated in the ROP of a cyclic ester (Palard et al., 2004) (Table 1).
Quantitative CL conversions were easily reached within 30 min even at higher
monomer loadings ([CL]0/[BH4]0¼565), affording quite high molar mass
(Mn up to 39,150 g mol�1 with Mw=Mn ca: 1:43). A linear dependence of
the experimental molar mass on the [CL]0/[BH4]0 ratio was observed with a
small deviation at higher monomer loadings resulting from side reactions.
Use of this single-site initiator enabled to better understand the ROP mecha-
nism of a cyclic ester promoted by a borohydride initiator, especially in
providing solubility to key intermediates such as [(Cp*)2Sm(BH4)(CL)] (see
Scheme 26, Section 3.1.4). The contribution of the ancillary Cp* ligands
was highlighted by comparison with the performances of the homoleptic com-
plex [Sm(BH4)3(THF)3] (1Sm). The favorable steric hindrance of the Cp*
versus BH4� ligand limited the side reactions whereas the greater electron-
donating ability of Cp* versus BH4� slowed down the rate of polymerization
by a factor of six, thereby enabling a better control of the ROP of CL with the
metallocene initiator.
The ROP of CL from the samarium borohydride complexes of the diamide–
diamine ligand, [{(N2NNTMS)Sm(BH4)}2] (24Sm) and [{(N2NN
Mes)Sm
(BH4)2Li}2] (25Sm), were briefly described by Mountford and coworkers
(Bonnet et al., 2005b). This latter species was found, under the same
conditions, half as active as the former one (96% yield in 1 min of 25 CL
equivs by 24Sm), possibly as a result of the greater steric hindrance of the
mesityl groups.
3.1.2.2. e-Caprolactone and Lactide
The post-metallocene complexes [{(O2NNpy)R(m-BH4)(THF)n}2] [R¼Y,
n¼0.5 (26Y); Nd, n¼1 (26Nd); Sm, n¼0 (26Sm)] were shown by Bonnet,
Mountford, and coworkers as being very effective initiators (up to 90% con-
version of 275 CL units in 0.5 min) in the ROP of CL at 25 �C (Bonnet
et al., 2005a) (Table 1). While a fair control of the molar mass
(Mn� 26,920gmol�1) was observed, dispersity values were rather large
(1:57<Mw=Mn< 1:76). The slightly lower activity of the yttrium complex
Chapter 259 Rare-Earth Borohydride Complexes in Polymerization 35

was attributed to its smaller radius. ROP of lactides initiated by a rare-earth
borohydride complex was first reported with the evaluation of this same series
of initiators (Bonnet et al., 2005a) (Table 2). The ROP of L-lactide (LLA) in
THF (25 �C) or toluene (70 �C) showed, under similar conditions ([LLA]0/
[26R]0¼200), the samarium complex (26Sm) to be the most active (74% of
isotactic PLLA in 45 min) and the only one to enable a good control, yet
only in THF. As for the ROP of CL, the occurrence of transesterification
reactions or a slow initiation step compared to propagation rationalized
both the deviation of the molar mass values measured experimentally
(Mn� 15,200gmol�1) from the expected values, and the large dispersity
values of the PLLA (1:31<Mw=Mn< 1:73). High [LLA]0/[initiator]0 ratios
and/or the use of toluene as solvent at 70 �C afforded a poorer control of
the molar mass, assuming one growing chain per metal center. The O2NNpy
complexes of Y (26Y), Nd (26Nd), and Sm (26Sm) were also all active in
the ROP of rac-LA in THF (25 �C) or toluene (7 �C), with again a “living”
polymerization with limited chain transfer demonstrated in the case of the
samarium initiator (Table 2). Heterotactic enriched PLAs (up to Pr 87% for
26Y) were obtained from the ROP of rac-LA in THF (Mn� 15,700gmol�1),
whereas the reaction in toluene provided atactic polymers. No NMR details
on the microstructure of the formed polylactides and especially on the nature
of the chain-ends, nor on the ROP mechanism of lactides, were reported. FTIR
u(OH) stretching bands between 3650 and 3200 cm�1 were attributed to end-
functionalities.
As an extension of these studies, the solvated samarium borohydride com-
plexes supported by the bis(phenolate)amine ligands, [(O2NL)Sm(BH4)(THF)]
(L¼OMe (27Sm), NMe2 (28Sm), py (29Sm)), and [(O2NPr)Sm(BH4)(THF)2]
(30Sm) (Scheme 13), were further reported in the ROP of CL and rac-LA by
Duchateau, Maron, Mountford, and coworkers (Dyer et al., 2010) (Tables 1
and 2). All samarium complexes were efficient initiators (full conversion
within 2 min) for the ROP of CL ([CL]0/[27–29R]0¼275) affording, based
on 1H NMR and MALDI-ToF MS analyses, linear a,o-dihydroxytelechelicPCLs (Mn� 31,400gmol�1) contaminated by some cyclic polymers. Both
the dispersity –ranging from 1.4 to 2.5– and the control depended on the
O2NL ligand pendant arm, with [(O2N
OMe)Sm(BH4)(THF)] (27Sm) being
the best, especially in terms of PCL molar mass agreement. In the ROP of
rac-LA, only the complexes with the tetradentate O2NL ligand were active,
the one without a pendant donor group, that is, the tridentate [(O2NPr)Sm
(BH4)(THF)2] (30Sm) compound, being totally inactive. The pendant arm
effect was reflected by the following increasing order of activity toward
rac-LA: O2NOMe�O2N
py<O2NNMe2. Heterotactic enriched a,o-
dihydroxytelechelic PLAs (Mn� 26,500gmol�1) were always obtained
(Pr 78–84%). Poly(rac-LA) formed from [(O2NL)Sm(BH4)(THF)] (L¼OMe,
py), showed by MALDI-ToF analyses, in addition to the dC(O)CH(Me)OH
chain-end arising from the protonolysis of the metal–oxygen bond, the
Handbook on the Physics and Chemistry of Rare Earths36
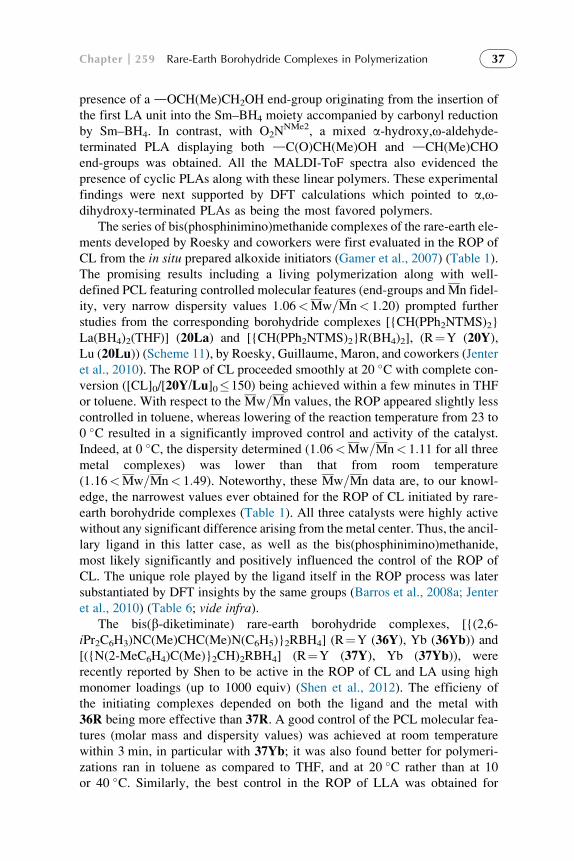
presence of a dOCH(Me)CH2OH end-group originating from the insertion of
the first LA unit into the Sm–BH4 moiety accompanied by carbonyl reduction
by Sm–BH4. In contrast, with O2NNMe2, a mixed a-hydroxy,o-aldehyde-
terminated PLA displaying both dC(O)CH(Me)OH and dCH(Me)CHO
end-groups was obtained. All the MALDI-ToF spectra also evidenced the
presence of cyclic PLAs along with these linear polymers. These experimental
findings were next supported by DFT calculations which pointed to a,o-dihydroxy-terminated PLAs as being the most favored polymers.
The series of bis(phosphinimino)methanide complexes of the rare-earth ele-
ments developed by Roesky and coworkers were first evaluated in the ROP of
CL from the in situ prepared alkoxide initiators (Gamer et al., 2007) (Table 1).
The promising results including a living polymerization along with well-
defined PCL featuring controlled molecular features (end-groups and Mn fidel-
ity, very narrow dispersity values 1:06<Mw=Mn< 1:20) prompted further
studies from the corresponding borohydride complexes [{CH(PPh2NTMS)2}
La(BH4)2(THF)] (20La) and [{CH(PPh2NTMS)2}R(BH4)2], (R¼Y (20Y),Lu (20Lu)) (Scheme 11), by Roesky, Guillaume, Maron, and coworkers (Jenter
et al., 2010). The ROP of CL proceeded smoothly at 20 �C with complete con-
version ([CL]0/[20Y/Lu]0�150) being achieved within a few minutes in THF
or toluene. With respect to the Mw=Mn values, the ROP appeared slightly less
controlled in toluene, whereas lowering of the reaction temperature from 23 to
0 �C resulted in a significantly improved control and activity of the catalyst.
Indeed, at 0 �C, the dispersity determined (1:06<Mw=Mn< 1:11 for all three
metal complexes) was lower than that from room temperature
(1:16<Mw=Mn< 1:49). Noteworthy, these Mw=Mn data are, to our knowl-
edge, the narrowest values ever obtained for the ROP of CL initiated by rare-
earth borohydride complexes (Table 1). All three catalysts were highly active
without any significant difference arising from the metal center. Thus, the ancil-
lary ligand in this latter case, as well as the bis(phosphinimino)methanide,
most likely significantly and positively influenced the control of the ROP of
CL. The unique role played by the ligand itself in the ROP process was later
substantiated by DFT insights by the same groups (Barros et al., 2008a; Jenter
et al., 2010) (Table 6; vide infra).The bis(b-diketiminate) rare-earth borohydride complexes, [{(2,6-
iPr2C6H3)NC(Me)CHC(Me)N(C6H5)}2RBH4] (R¼Y (36Y), Yb (36Yb)) and[({N(2-MeC6H4)C(Me)}2CH)2RBH4] (R¼Y (37Y), Yb (37Yb)), were
recently reported by Shen to be active in the ROP of CL and LA using high
monomer loadings (up to 1000 equiv) (Shen et al., 2012). The efficieny of
the initiating complexes depended on both the ligand and the metal with
36R being more effective than 37R. A good control of the PCL molecular fea-
tures (molar mass and dispersity values) was achieved at room temperature
within 3 min, in particular with 37Yb; it was also found better for polymeri-
zations ran in toluene as compared to THF, and at 20 �C rather than at 10
or 40 �C. Similarly, the best control in the ROP of LLA was obtained for
Chapter 259 Rare-Earth Borohydride Complexes in Polymerization 37
37Yb with evidences of a living feature being reported (linear variation of the
molar mass with monomer conversion) and dispersity around 1.35, yet sug-
gesting the occurrence of some transesterifications. Dihydroxytelechelic PCLs
were obtained while PLLAs were end-capped by a dCH2OH and a
dCHMeOH groups, as evidenced by 1H NMR spectra. Sucessful immortal
ROP (Ajellal et al., 2010a; Guillaume and Carpentier, 2012) was also per-
fomed with iPrOH (up to 200 equiv) at 20–60 �C. In these cases, the PLLA
featured a dOiPr and a dCHMeOH end-capping units.
Finally, the group of Shen recently reported bridged bis(guanidinate)
monoborohydride complexes [(iPr(TMS)NC(NiPr)N(CH2)3NC(NiPr)N
(TMS)iPr)R(BH4)(DME)] R¼Y, Nd, Yb in the ROP of CL, rac-LA and
LLA (Zhang et al., 2012) (Tables 1 and 2). Whereas a significant metal effect
was observed in the ROP of CL, rac-LA, and LLA, the neodymium deriva-
tives revealed the most efficient (Nd�Yb>Y) in terms of activity and molar
mass control whichever the monomer. Very high loadings of CL (up to 5000
equiv) or LLA (up to 3000 equiv) afforded PCLs and PLAs with MnPCL up to
22,800 g mol�1 and MnPLLA up to 30,500 g mol�1, yet with rather large
dispersities (Mw=Mn 1.31–1.81). A double LLA addition experiment showed
the expected increase in PLA molar mass values. Slightly heterotactic PLAs
were formed from rac-LA (Pr<72%). The authors evidenced the
formation of PCL diols as expected, and observed the characteristic quartet
for the dCHMe(OH) end-group, yet without mentioning whether only one
type of chain-end group was observed.
3.1.2.3. Lactide
Lanthanide borohydride complexes of the bulky guanidinate ligands,
[{(TMS)2NC(NCy)2}2R(m-BH4)2Li(THF)2] (R¼Nd (22Nd), Sm (22Sm), Yb
(22Yb)), initiated the ROP of rac-LA and LLA as reported by Carpentier,
Trifonov, and coworkers (Skvortsov et al., 2007a) (Table 2). Assuming
only one growing polymer chain per metal center (instead of the two expected
for a bisborohydride initiator), the overall control (Nd�Yb>Sm) over the
PLA molar mass (Mn� 52,000gmol�1) and dispersity values
(1:09<Mw=Mn< 2:99) revealed better than that observed in the polymerization
of MMA (Skvortsov et al., 2007c, vide infra; Table 5). The detrimental effect of
THF versus apolar non-coordinating toluene on the rate of the ROP of LA was
evidenced, in agreement with most common (see the above-mentioned study on
CL, Palard et al., 2005), yet not systematic (Bonnet et al., 2005a), literature find-
ings. Whichever the reaction solvent, the observed order of decreasing activity
was Nd�Yb>Sm.Whereas atactic PLAwas formed, the ROP of LLA afforded
isotactic microstructures, as evaluated by analyses of the methine region of the
decoupled 1H NMR spectra (Kasperczyk, 1995). The polymers were clearly
end-capped by a dCH(Me)OH group indicative of a classical coordination–
insertion mechanism with an oxygen-acyl bond cleavage, as observed with the
Handbook on the Physics and Chemistry of Rare Earths38

homoleptic trisborohydride complexes 1R (Nakayama et al., 2007). However, the
other chain-end group could not be unambiguously identified. Finally, these same
groups reported the ROP of rac-LA promoted by the moderately active heterobi-
metallic ansa-bis(amidinate) lanthanide borohydrides featuring a conformation-
ally rigid naphthalene linker [1,8-C10H6{NC(tBu)N-2,6-Me2-C6H3}2R
(BH4)2Li(THF)2] (R¼Nd Sm) (Yakovenko et al., 2012) (Table 2). Slightly het-
erotatic PLAs (Pr 54–62%)were prepared in THF or toluene at room temperature,
with controlled molar mass for lower monomer loadings (�120 equiv) and rela-
tively large dispersity values (1:47<Mw=Mn< 1:67).
3.1.2.4. Lactide and b-Butyrolactone
The yttrium borohydride complex supported by chelating diamido ligand,
[{(DAB)Y(BH4)2}{Li(DME)3}] (35Y, Scheme 15), initiates the ROP of rac-LA and rac-BL at 20 �C in toluene providing atactic polymers
(Mn� 13,400gmol�1, 1:15<Mw=Mn< 1:30), as briefly shown by Trifonov,
Carpentier, and coworkers (Scheme 25; Mahrova et al., 2009) (Tables 1 and 2).
A quite good control of the molar mass (assuming two growing polymer chains
per metal center) and dispersity values were obtained. Higher reaction rates were
observed in an apolar solvent such as toluene compared to THF. The nature of
PHB chain-ends were not discussed.
Similarly, these authors reported that the neodymium complexes supported
by diaminobis(phenoxide) ligands ((O2N2)1¼{CH2N(Me)CH2-3,5-Me,t-
Bu-C6H2O}2; (O2N2)2¼C5H4NCH2N-{CH2-3,5-Me,tBu-C6H2O}2), [{(O2N2)
1
Nd(BH4)(m-BH4)Li(THF)}2] (31Nd), and [(O2N2)2Nd(BH4)(m-BH4)Li
(THF)2] (32Nd; Scheme 14), provided atactic PLA (Mn� 22,800gmol�1,
1:15<Mw=Mn< 1:82) and atactic PHB (Mn� 5,000gmol�1,
1:07<Mw=Mn< 1:12) based on NMR analyses (Sinenkov et al., 2011)
(Tables 1 and 2). The solvent effect was more pronounced in the case of
rac-LA than of rac-BL, with ROP in THF being faster than in toluene.
The data suggested that only one BH4� group initiated the ROP of rac-BL,
and that with rac-LA, a single BH4� group initiated polymerization in the
case of 31Nd, and that both BH4� groups within 32Nd were active.
1H NMR spectra of low molar mass PLA samples showed the characteristic
quartet (d 4.33 ppm) for the dCH(CH3)OH terminal group whereas the exact
nature of all termini could not be unambiguously determined. No noticeable
SCHEME 25 Nonstereoselective synthesis of atactic PHB from the ROP of BL initiated by
[{(DAB)Y(BH4)2}{Li(DME)3}] (35Y).
Chapter 259 Rare-Earth Borohydride Complexes in Polymerization 39

influence of the ancillary ligand could be evidenced. The behavior of all these
(DAB) and (O2N2) compounds is reminiscent to that of the above lanthanide
borohydride ate complexes bearing guanidinate ligands, 22 Nd, 22 Sm, 22 Yb.
3.1.3. Divalent Rare-Earth Borohydride Initiators
As a result of their higher sensitivity, with respect to their marked tendency to
oxidize to the more stable trivalent state, divalent rare-earth borohydride com-
plexes have only been rarely and lately studied as initiators in the polymeriza-
tion of a polar monomer, namely of (only) CL (Guillaume et al., 2007; Iftner
et al., 2011; Jaroschik et al., 2010; Momin et al., 2011) (Table 1).
3.1.3.1. Divalent Rare-Earth Borohydride Initiators Made in Situ
Kempe, Guillaume, and coworkers were the first to evaluate a divalent rare-earth
borohydride initiating species in the ROP of a cyclic ester (Guillaume et al.,
2007). The aminopyridinato ligand (Scott and Kempe, 2005) allowed
stabilization and isolation of the mono-ancillary ytterbium(II) halide complex
[(Ap*)YbI(THF)2]2 (16Yb). The pre-initiating ytterbium species formed in situfrom the combination of 16Yb and NaBH4 (1–2 molar equiv) afforded high
molar mass PCLs (Mn� 47,500gmol�1; Mw=Mn ca: 1:56), yet with a control
of the polymer features not as good as that obtained with the trivalent alike initi-
ating systems 17La, 18Lu/NaBH4 (Scheme 9) (Table 1). Indeed, the larger triva-
lent lanthanum bromide based initiating system 17La/NaBH4 afforded the
best defined PCLs (vide supra). This whole study allowed evaluation, on a given–namely aminopyridinato– series of rare-earth derivatives, of the metal, of the
oxidation state, and of the halide substituent effects, as rarely exemplified. Note-
worthy, no oxidation of the divalent complex was observed during the ROP of
CL, as opposed to the behavior of the samarium [Sm(BH4)2(THF)2] (2Sm) and
[{(Cp*)Sm(BH4)(THF)2}2] (4Sm) or thulium [Tm(BH4)2(DME)2] (2Tm0) and
[(TptBu,Me)Tm(BH4)(THF)] (15Tm) complexes described by Nief and Visseaux
(Iftner et al., 2011; Jaroschik et al., 2010; Momin et al., 2011; vide infra).
3.1.3.2. Discrete Divalent Rare-Earth Borohydride Initiators
Of note, compounds based on TmII –the divalent lanthanide exhibiting the largest
reducing power (TmII>SmII>YbII>EuII)– as later developed by Bonnet, Vis-
seaux, Nief, and coworkers, [Tm(BH4)2(DME)2] (2Tm0) and [(TptBu,Me)Tm
(BH4)(THF)] (15Tm), were found active in the ROP of CL at 25 �C (Momin
et al., 2011) (Table 1). However, assuming one growing PCL chain per R-BH4,
the control over the PCL molar mass and dispersity values remained limited, in
comparison to the SmII initiator [{(Cp*)Sm(BH4)(THF)2}2] (4Sm) (Mn up to
20,400 g mol�1 with 1:28<Mw=Mn< 1:36; Jaroschik et al., 2010; Iftner
et al., 2011) (Table 1). With all four divalent initiators [Sm(BH4)2(THF)2]
(2Sm), 2Tm0, 4Sm, and 15Tm, the metal was oxidized during the polymeriza-
tion leading to a RIII active species, as hinted by the observed (from a dark to a
Handbook on the Physics and Chemistry of Rare Earths40

light) color change of the reaction solution. The oxidation of the TmII center
seemed faster than that of SmII. The monosubstituted complexes 4Sm and
15Tm seemed to display a higher activity in comparison to the homoleptic ana-
logues 2Sm and 2Tm0, reflecting the influence of the ancillary ligand, Cp* and
TptBu,Me, respectively, in making the complex more readily oxidizable. Two dif-
ferent mechanisms, involving either monoelectronic transfer (favored at low
[CL]0/[Sm]0 ratios¼116) or insertion into the SmII–BH4 bond (favored at higher
[CL]0/[Sm]0 ratios¼465), were suggested from the experimental results on the
samarium complexes (Jaroschik et al., 2010), and next investigated computation-
ally by Maron and coworkers (vide infra; Iftner et al., 2011).
3.1.4. Mechanistic Insights from Analytical Studies on the ROPof Lactones, Lactides, and a-Amino Acids N-CarboxyanhydridesInitiated by Rare-Earth Borohydride Complexes
3.1.4.1. ROP of Lactones and Lactides
The rare-earth borohydride complex used in the ROP of a polar monomer is
herein commonly referred to as the initiator or as the catalyst. More precisely,
it does act as a pre-initiator as described thereafter.
The ROP mechanism of a lactone initiated by a rare-earth borohydride
complex has been first described by Guillaume and coworkers on the basis
of comprehensive investigations (Guillaume et al., 2003; Palard et al., 2004,
2005). Detailed NMR, FTIR, MALDI-ToF MS, and elemental analyses,
including in particular the monitoring of the stoichiometric reaction of [La
(BH4)3(THF)3] (1La, a diamagnetic complex facilitating NMR understanding)
and [(Cp*)2Sm(BH4)(THF)] (5Sm, an organometallic complex providing bet-
ter solubility and featuring the Cp* as diagnostic group for NMR and MS
investigations –and thus identification– of resulting intermediates) with CL,
all the way to the hydrolysis products, allowed identification of several key
intermediates which were isolated and fully characterized. As depicted in
Scheme 26, during the initiation step, the first three incoming CL molecules
displace the coordinated THF from the metal in [Nd(BH4)3(THF)3] (1Nd) toform the adduct [Nd(BH4)3(CL)3] (i). Subsequently, these first CL molecules
insert into each of the Nd-HBH3 bonds with a C(O)dO (oxygen-acyl) bond
cleavage to give the intermediate [Nd{O(CH2)5C(O)HBH3}3] (ii) (most
likely solvated by a Lewis base). The displaced BH3 group then immediately
reduces the adjacent aldehyde to form a dCH2OBH2 function thereby
generating the alkoxyborane derivative [Nd{O(CH2)5CH2OBH2}3] (iii). Ensu-ing propagation into the NddO bond of this active species gives the living
polymer [Nd[{O(CH2)5C(O)}nþ1O(CH2)6OBH2]3] (iv). Finally, upon
termination –that is, quenching and deactivation– hydrolysis of both the
RdO and CH2OdBH2 bonds of iv generates an hydroxyl end-group at each
chain-end (d1H/13C 3.71/59.9 ppm) giving HO(CH2)5C(O){O(CH2)5C(O)}nO
(CH2)6OH, HO–PCL–OH (v). Direct experimental evidence was provided
Chapter 259 Rare-Earth Borohydride Complexes in Polymerization 41

for species of the type i, iii, iv, and v from both mono- and tris(borohydride)
catalytic systems (Guillaume et al., 2003; Palard et al., 2004). Additional sup-
port of the presence of dCH2OBH2 groups (which lead to the formation of a
“physical gel”) during the polymerization process was obtained from FTIR
investigations which unambiguously showed the presence of B–H unit(s) in
the relevant intermediates depicted in Scheme 26 (Palard et al., 2005).
From these observations, the pseudo anionic coordination–insertion mech-
anism illustrated in Scheme 26 for the neodymium complex, involving in par-
ticular the carbonyl reduction by the reactive dHBH3 group and common to
all borohydride initiators [(L)xR(BH4)3�x(THF)] (“Lx”¼ancillary ligand, for
example, Cp*2; x¼1–2), was suggested to rationalize the formation of a,o-hydroxytelechelic PCL. Finally, this mechanism has been corroborated by
detailed DFT investigations by Maron and coworkers on both trisborohydride
and single-site monoborohydride organometallic complexes (Barros et al.,
2008a; vide infra) (Table 6). This mechanism is similarly taking place during
the ROP of lactones (BL, Guillaume et al., 2013; CL, Guillaume et al., 2003;
VL, Nakayama et al., 2009; PDL, Nakayama et al., 2011) or lactides (Dyer
et al., 2010; Nakayama et al., 2007) initiated by trivalent rare-earth borohy-
dride complexes.
+ [Nd(BH4)3(THF)3] [Nd(BH4)3(CL)3] + 3 THF
i
Nd H BH3
OC
O
Nd O
COH BH3
3(n+1)
H+
ii iii
O
O
CL
3
33
BH3·THF
NdO
HBH3
O
3
NdO
OBH2
O
O
iv
NdO
O
35
O
n+15
OBH2
3
v
OO5
O
n5
OHHO 5
O
Coordination
Insertion
CO Reduction
Propagation
Termination
1Nd
SCHEME 26 Proposed general mechanism for the ROP of CL initiated by a rare-earth borohy-
dride complex illustrated with [Nd(BH4)3(THF)3].
Handbook on the Physics and Chemistry of Rare Earths42

The divalent samarium borohydride complex [Sm(BH4)2(THF)2] (2Sm) has
been suggested by Nief, Visseaux, and coworkers to operate through a similar
coordination–insertion mechanism thereby affording a,o-dihydroxytelechelicPCL (Jaroschik et al., 2010). A different monoelectronic oxidative process, with
the polymerization induced by the oxidation of SmII then involving two samar-
ium centers, was proposed to rationalize the single growing PCL chain per two
metal ions and the observed chain-ends. DFT investigations computed this oxi-
dative route through radical species to be favorable, but the study showed that it
does not occur experimentally unless one considers transfer reactions with the
solvent (vide infra; Iftner et al., 2011).Therefore, in the ROP of a polar monomer promoted by a rare-earth boro-
hydride complex, during the initiation step, the rare-earth borohydride com-
plex reacts with the first incoming monomer molecule to form a complex
then featuring a metal–oxygen bond, which is the real active species. In the
ROP of cyclic esters and acrylates such as lactones, lactides or carbonates
and methyl methacrylate (MMA), the complex formed from the equimolar
mixture of the rare-earth borohydride and the first monomer moiety added,
results in the formation of a rare-earth alkoxide/enolate (vide infra) as the realinitiating and propagating species. Consequently, when using a rare-earth
borohydride in the polymerization of a polar monomer, the propagation will
always take place in a metal–oxygen (and not in a metal–HBH3) bond. Also,
the number of growing polymer chains is given, in a controlled “living” ROP
process, by the number of R-BH4 unit.
In such a coordination–insertion mechanism, the larger size of the metal
center should accelerate the monomer coordination by providing less steric
hindrance in a wider coordination sphere. However, as exemplified above in
several series of rare-earth borohydride complexes, this trend does not always
apply experimentally. Also, the potential coordination of a solvent or another
substrate molecule onto the metal center may similarly impact the rate of
polymerization. This reveals the significant role played by the ancillary(ies)
in providing, along with the metal itself, a delicate balance of steric and elec-
tronic parameters. As demonstrated by the DFT investigations discussed
below, thermodynamic as well as kinetic factors also significantly contribute
to the whole energetic reaction profile.
Finally, we note that using rare-earth borohydride complexes rather
than alkoxide ones as initiators does present the significant advantage of
affording directly a,o-dihydroxytelechelic polymers instead of a-alkoxy,o-hydroxytelechelic analogues (Scheme 27; Palard et al., 2006). Whereas any
initiator will always generate one hydroxyl chain-end upon hydrolysis of the
metal–oxygen bond during termination, only borohydride complexes will con-
comitantly lead to a second alike dOH end-capping function thanks to the
reduction of the cyclic ester carbonyl by the BH3 group (Barros et al.,
2008a; Palard et al., 2006). The potential ring-opening of the cyclic ester
through a OdC (oxygen-alkyl) bond cleavage that may occur besides the
Chapter 259 Rare-Earth Borohydride Complexes in Polymerization 43
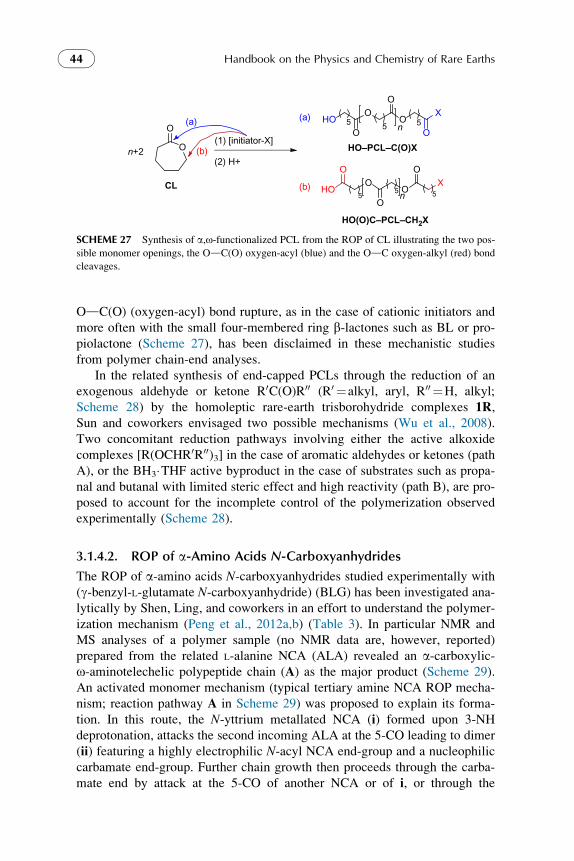
OdC(O) (oxygen-acyl) bond rupture, as in the case of cationic initiators and
more often with the small four-membered ring b-lactones such as BL or pro-
piolactone (Scheme 27), has been disclaimed in these mechanistic studies
from polymer chain-end analyses.
In the related synthesis of end-capped PCLs through the reduction of an
exogenous aldehyde or ketone R0C(O)R00 (R0 ¼alkyl, aryl, R00 ¼H, alkyl;
Scheme 28) by the homoleptic rare-earth trisborohydride complexes 1R,Sun and coworkers envisaged two possible mechanisms (Wu et al., 2008).
Two concomitant reduction pathways involving either the active alkoxide
complexes [R(OCHR0R00)3] in the case of aromatic aldehydes or ketones (path
A), or the BH3THF active byproduct in the case of substrates such as propa-
nal and butanal with limited steric effect and high reactivity (path B), are pro-
posed to account for the incomplete control of the polymerization observed
experimentally (Scheme 28).
3.1.4.2. ROP of a-Amino Acids N-Carboxyanhydrides
The ROP of a-amino acids N-carboxyanhydrides studied experimentally with
(g-benzyl-L-glutamate N-carboxyanhydride) (BLG) has been investigated ana-
lytically by Shen, Ling, and coworkers in an effort to understand the polymer-
ization mechanism (Peng et al., 2012a,b) (Table 3). In particular NMR and
MS analyses of a polymer sample (no NMR data are, however, reported)
prepared from the related L-alanine NCA (ALA) revealed an a-carboxylic-o-aminotelechelic polypeptide chain (A) as the major product (Scheme 29).
An activated monomer mechanism (typical tertiary amine NCA ROP mecha-
nism; reaction pathway A in Scheme 29) was proposed to explain its forma-
tion. In this route, the N-yttrium metallated NCA (i) formed upon 3-NH
deprotonation, attacks the second incoming ALA at the 5-CO leading to dimer
(ii) featuring a highly electrophilic N-acyl NCA end-group and a nucleophilic
carbamate end-group. Further chain growth then proceeds through the carba-
mate end by attack at the 5-CO of another NCA or of i, or through the
n
(1) [initiator-X]
(2) H+
HOO
OX
n+2
HO(O)C–PCL–CH2X
55 5
O
O
CL
nHO
OO
X
O
O
HO–PCL–C(O)X
5 5 5O
O
O
O
(a) (a)
(b)
(b)
SCHEME 27 Synthesis of a,o-functionalized PCL from the ROP of CL illustrating the two pos-
sible monomer openings, the OdC(O) oxygen-acyl (blue) and the OdC oxygen-alkyl (red) bond
cleavages.
Handbook on the Physics and Chemistry of Rare Earths44

electrophilic N-acyl NCA end attacked by i or by the carbamate end of
another ii. The COOH end-group is then generated during the precipitation
upon 5-CO attack of N-acyl NCA end-group by H2O and release of a mole-
cule of CO2. The (other) amino end-group arises from hydrolysis of the active
yttrium carbamate group followed by release of one CO2 molecule. The second
major distribution of peaks was assigned to a-hydroxyl, o-aminotelechelic
polymer (B) formed via a nucleophilic ring-opening initiation and chain growth
process (known as the normal amine mechanism; reaction pathway B in
Scheme 29). The ALA attacks at 5-CO by [Y(BH4)3(THF)3], ring-opens and
inserts into the YdHBH3 bond to give the intermediate (iv), in which the
immediate interaction of the HBH3 group with the a-carbonyl results in the for-
mation of the corresponding yttrium alanine carbamate derivative (v). The ROPof ALA by v then proceeds through attack at its 5-CO by the yttrium carbamate
with the (1-oxygen)-(5-acyl) bond cleavage, and subsequent release of one mol-
ecule of CO2. Water termination/hydrolysis of the [dNHCH(CH3)CH2(OBH2)]
[R(BH4)3(THF)3] + 3R'
O
R"[R(BH4)3] + 3 THF
R'
O
R"3
OBH3
H-BH3 reduction
R'
O
R"
R'
O
R"3
[R(OCHR'R")3]
R = Y, NdR' = alkyl, arylR" = H, alkyl
O
O
OO
R'
O
R" 3
O
OR'
R"
OR
3
O
OR'
R"
OR
3(n-1) CL
n 3
O
OR'
R"
OH
n
3
B
3
Path A
Path B
Coordination
Insertion
Propagation
R'
OBH2
R"
Termination H+
R
BH3 +
SCHEME 28 Proposed mechanism for the ROP of CL initiated by a rare-earth alkoxide
generated in situ from 1/R0R00C(O).
Chapter 259 Rare-Earth Borohydride Complexes in Polymerization 45

chain-end generates the hydroxyl end-group, while hydrolysis of the active
yttrium carbamate group and release of CO2 generate the amino group of the
resulting a-hydroxyl,o-aminotelechelic poly(ALA) chains (B). The swift back
and forth switching between these two mechanisms afforded monomodal SEC
traces and partial control of the polypeptide molar mass.
Both an amino and hydantoic (C, Scheme 30), and a carboxylic and
hydantoic acid (D, Scheme 30) end-functionalized poly(ALA) were finally
identified as minor products in the MALDI-ToF mass spectrum. The forma-
tion of product C is closely related to species i. After formation of the dimer
ii, both cyclization and propagation competitively take place. The cyclized
3-(yttrium carboxylate) hydantoin product iv attacks the 5-CO of N-acylNCA end-group of a polymer chain (iii), thus giving C. Also, the addition
of a propagating nucleophilic carbamate end-group onto the yttrium
a-isocyanato carboxylate that arises from the rearrangement of i is postulatedto result in the formation of product D (Peng et al., 2012a,b).
n
NH
O OO
12
34
5
3-NH
deprotonation
N
O OO
Y+ H2 + 1/2 B2H6
Path A
Path B
ALA attack at 5-CO
N
O OO
HN O
O
O
YN
O OO
Y +
N
O OO
HN O
O
O
Y H3O
2 CO2
NH
HN
O
nHO
OA
NH
O OO
12
34
5
attack at 5-CO NH
OY
OH
O
H3B
CO reduction
NH
OY
OH2BON
H
HN
OH2BO n ALA
n-1 CO2
nO
Y
O
NH
HN
OHO
n
B
ALAi
iii
iii
iv
vH3O CO2
NH2
O
NH2
O
n-1 ALA condensation
Oligopeptidesreaction with ALA or
N-aminoacyl NCA
[Y(BH4)3] +
[Y(BH4)3] +
- CO2
SCHEME 29 Postulated major mechanisms for the ROP of BLG initiated by [Y(BH4)3(THF)3],
1Y.
Handbook on the Physics and Chemistry of Rare Earths46

3.1.5. Valuable a,o-Dihydroxytelechelic Polyesters
The most significant advantage of using rare-earth borohydride complexes
as initiators in the ROP of cyclic esters is the resulting direct formation of
a,o-dihydroxytelechelic polyesters which are not accessible from the more com-
mon alkoxide initiators (Scheme 27; Palard et al., 2006). Indeed, no chemical
modification of a chain-end is required to generate the second OH group, the first
one being necessarily created within the termination step upon hydrolysis of the
active metal–oxygen bound into an OH (vide supra). Hydroxytelechelic poly-
mers are indeed highly desirable and valuable since they provide easy access to
copolymers which are otherwise not so straightforwardly prepared, or to original
(multi-)block (co)polymers (vide infra, Section 3.5.2; Guillaume, 2013).
3.2. ROP of Trimethylene Carbonate
Given the reactivity of the BH4� group with the carbonyl of the first inserted
lactone or diester monomer unit, the ROP of a carbonate monomer was fore-
seen as promising. However, in contrast to the ROP of lactones or lactides
which have been comparatively quite investigated with a variety of inorganic
and organometallic complexes (Table 1), studies on the ROP of a cyclic
nN
N
NH
H
O
HO
HN
O
n+1
D
C
HN
OH
O
O
O
HO
O
O
attack at 2-CON
O OO
HN O
O
O
Y
ii
CO2
nN
N
NH
OO
O
O
O
NO
O
Y
vi
NH
O
O
attack at 5-CO of iiiCO2
H3O
CO2
HN O
Y
O
O
Y
N
O OO
Y
(1) Reaction with iii
(2)
i
OC
NO
Y
O
H3OCO2
SCHEME 30 Proposed side reactions of the ROP of BLG initiated by [Y(BH4)3(THF)3], 1Y.
Chapter 259 Rare-Earth Borohydride Complexes in Polymerization 47

TABLE 4 Rare-Earth Borohydride Complexes Used as Initiators in the (Co)Polymerization of Trimethylene Carbonate (TMC)
and Experimental Data
Rare-earth borohydride
complex
TMC
([TMC]0/[BH4]0highest value)a
Solvent
Temp.
(�C)Reaction time
Conv.b
Mnmaxc
(Mntheo)a,d
g mol�1 ÐMe Copolymer
Trivalent complex
[{CH(PPh2NTMS)2}Y(BH4)2](20Y, Scheme 11)
(250)(Guillaume et al., 2012)
Tol20 �C
2 min26%
8000(6600)
1.29f
[{CH(PPh2NTMS)2}La(BH4)2(THF)](20La, Scheme 11)
(250)(Guillaume et al., 2012)
Tol20 �C
2 min42%
11,300(13,300)
1.47
[Sm(BH4)3(THF)3](1Sm, Scheme 1)
(345)(Palard et al., 2007)
THF, DCM21 �C
4 h74%
27,050(26,050)
1.32 PTMC-b/co-PCL(Palard et al., 2007)
[{CH(PPh2NTMS)2}Lu(BH4)2](20Lu, Scheme 11)
(250)(Guillaume et al., 2012)
Tol20 �C
5 min47%
12,100(12,000)
1.42
aNote that the [TMC]0 /[BH4]0 ratio is different from the [TMC]0 /[initiator/catalyst]0 value, the former being used in the calculation of the theoretical molar mass (Mntheo )assuming one growing chain per BH4
� group.bMonomer conversion determined by 1H NMR or by gravimetry and corresponding to the highest [TMC]0 /[BH4]0 value reported.cNumber average molar mass (maximum value) determined by SEC versus polystyrene standards and corrected by a factor of 0.73 for TMC (Palard et al., 2004).dTheoretical molar mass calculated from [TMC]0 /[BH4]0�TMC conversion�MTMC, assuming one growing chain per BH4
� group, with MTMC¼102 g mol�1; note that adiscrepancy between Mntheo and MnSEC may be indicative of a number of growing polymer chains different from the number of BH4
� groups in the initiating complex.eCalculated average dispersity value as reported from SEC traces.

carbonate monomer are limited to trimethylene carbonate, TMC, and to just a
couple of rare-earth borohydride initiators (Table 4).
3.2.1. Inorganic Rare-Earth Borohydride Initiators
To this end, poly(trimethylene carbonate), PTMC, was synthesized by Guil-
laume and coworkers from the ROP of TMC promoted by [Sm(BH4)3(THF)3],
1Sm, under mild conditions (Palard et al., 2007) (Table 4). Polycarbonates
with quite high molar mass (MnSEC up to 27,000 g mol�1) were obtained in
high yields, with a linear dependence of MnSEC with the [TMC]0/[BH4]0 ratio.
Remarkably, the ROP proceeded without decarboxylation (no ether linkages
observed in the NMR spectra of the polycarbonates) as otherwise commonly
observed with other catalytic systems. The ROP of TMC (81% in 90 min
at [TMC]0/[BH4]0¼86) was found, under similar operating conditions
([initiator]0 ca. 4.5 mmol L�1), to be slower than that of CL (100% in
5 min at [CL]0/[BH4]0¼87; Table 1). The dispersity values of PTMC
(Mw=Mn ca: 1:3) were quite narrow in comparison with PTMC samples
prepared from other non-borohydride rare-earth initiators, and hardly larger
than the ones measured for other polyesters- such as PCLs or PLAs- prepared
from rare-earth borohydride complexes. Note that the correction factor
applied to PTMC samples analyzed by SEC against polystyrene standards to
correct for the hydrodynamic radius difference between such two distinct
polymers was established in this original work from comparative MALDI-
ToF MS, viscosimetry, and NMR investigations. Detailed 1H and 13C, 1D
and 2D NMR and MALDI-ToF MS analyses revealed the formation of
a-hydroxy,o-formatetelechelic PTMC, the first example of formate end-
functionalized PTMC (Scheme 31).
3.2.2. Organometallic Rare-Earth Borohydride Initiators
The unique study on the ROP of TMC promoted by an organometallic rare-
earth borohydride complex involves the bis(phosphinimino)methanide bisbor-
ohydride complexes of lanthanum, yttrium, and lutetium, [{CH
(PPh2NTMS)2}La(BH4)2(THF)] (20La) and [{CH(PPh2NTMS)2}R(BH4)2]
(R¼Y (20Y), Lu (20Lu)) reported by Guillaume et al. (2012) (Table 4).
The ROP proceeded rapidly in toluene at 20 �C with quantitative TMC
conversion reached within 2 min at [TMC]0/[20Y,La,Lu]0¼100
(TOF¼3000 molTMC molY,La,Lu h�1). At larger monomer loadings (500
equivs), this high activity was maintained or improved (TOF up to
O O
OO O O H
O3
OOHO3
O3 n
O
(1) [Sm(BH4)3(THF)3]
(2) H+n+2
SCHEME 31 Synthesis of HO–PTMC–OC(O)H from the ROP of TMC initiated by [Sm
(BH4)3(THF)3], 1Sm.
Chapter 259 Rare-Earth Borohydride Complexes in Polymerization 49
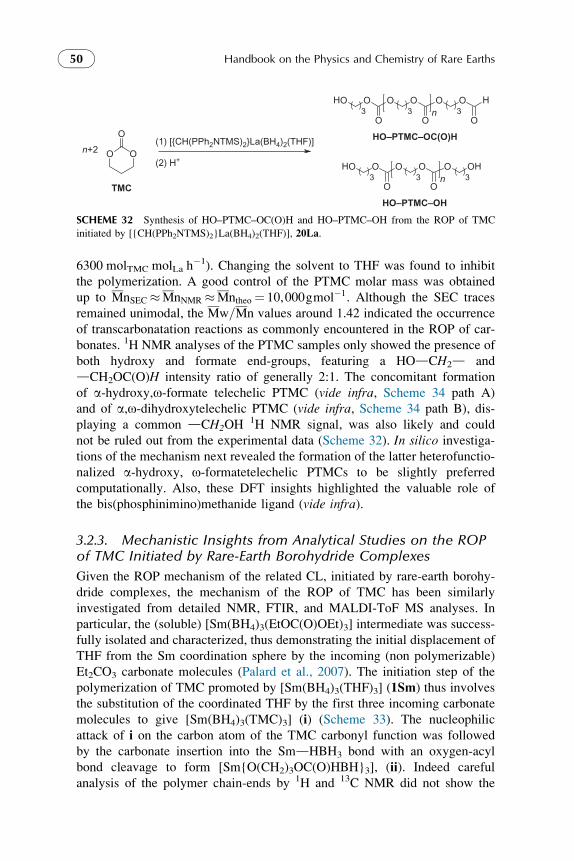
6300 molTMC molLa h�1). Changing the solvent to THF was found to inhibit
the polymerization. A good control of the PTMC molar mass was obtained
up to MnSEC �MnNMR �Mntheo ¼ 10,000gmol�1. Although the SEC traces
remained unimodal, the Mw=Mn values around 1.42 indicated the occurrence
of transcarbonatation reactions as commonly encountered in the ROP of car-
bonates. 1H NMR analyses of the PTMC samples only showed the presence of
both hydroxy and formate end-groups, featuring a HOdCH2d and
dCH2OC(O)H intensity ratio of generally 2:1. The concomitant formation
of a-hydroxy,o-formate telechelic PTMC (vide infra, Scheme 34 path A)
and of a,o-dihydroxytelechelic PTMC (vide infra, Scheme 34 path B), dis-
playing a common dCH2OH1H NMR signal, was also likely and could
not be ruled out from the experimental data (Scheme 32). In silico investiga-
tions of the mechanism next revealed the formation of the latter heterofunctio-
nalized a-hydroxy, o-formatetelechelic PTMCs to be slightly preferred
computationally. Also, these DFT insights highlighted the valuable role of
the bis(phosphinimino)methanide ligand (vide infra).
3.2.3. Mechanistic Insights from Analytical Studies on the ROPof TMC Initiated by Rare-Earth Borohydride Complexes
Given the ROP mechanism of the related CL, initiated by rare-earth borohy-
dride complexes, the mechanism of the ROP of TMC has been similarly
investigated from detailed NMR, FTIR, and MALDI-ToF MS analyses. In
particular, the (soluble) [Sm(BH4)3(EtOC(O)OEt)3] intermediate was success-
fully isolated and characterized, thus demonstrating the initial displacement of
THF from the Sm coordination sphere by the incoming (non polymerizable)
Et2CO3 carbonate molecules (Palard et al., 2007). The initiation step of the
polymerization of TMC promoted by [Sm(BH4)3(THF)3] (1Sm) thus involves
the substitution of the coordinated THF by the first three incoming carbonate
molecules to give [Sm(BH4)3(TMC)3] (i) (Scheme 33). The nucleophilic
attack of i on the carbon atom of the TMC carbonyl function was followed
by the carbonate insertion into the SmdHBH3 bond with an oxygen-acyl
bond cleavage to form [Sm{O(CH2)3OC(O)HBH}3], (ii). Indeed careful
analysis of the polymer chain-ends by 1H and 13C NMR did not show the
O O
O
TMC
HO–PTMC–OC(O)H
O O O H
O3
OOHO3
O3 n
O
(1) [{CH(PPh2NTMS)2}La(BH4)2(THF)]
(2) H+
n+2
HO–PTMC–OH
O O OH
O3
OOHO3
O3 n
SCHEME 32 Synthesis of HO–PTMC–OC(O)H and HO–PTMC–OH from the ROP of TMC
initiated by [{CH(PPh2NTMS)2}La(BH4)2(THF)], 20La.
Handbook on the Physics and Chemistry of Rare Earths50

terminal specific HOC(O)Od and dCH2CH3 groups arising from an oxygen-
alkyl (OC(O)OdCH2) bond breakage, but clearly evidenced the HOCH2dand dOC(O)H protons and carbons at d 3.71/59.9 and 8.03/161.8 ppm,
respectively. At this stage, it appeared experimentally, from the NMR spectra
of the analogous lanthanum species which display the dOC(O)H signals, that
the C(O) of the inserted carbonate of ii would not undergo reduction by the
adjacent H–BH3 group, unlike in the case of CL. However, elimination of
the BH3THF adduct from ii (Scheme 33 path B) or later on upon hydrolysis
from iii (Scheme 33 path A), could not be established from experimental data.
Propagation then proceeds from the active samarium alkoxide species ii/ii0 intothe active polymer [Sm{O(CH2)3OC(O)}nþ1{O(CH2)3OC(O)HBH3}3], (iii), orthe BH3-free analogue [Sm{O(CH2)3OC(O)}nþ1{O(CH2)3OC(O)H}3] (iii0),respectively. Termination upon acidic hydrolysis of the SmdO and possibly
of the OC(O)HBH3 bond(s) (path A), gives the a-hydroxy,o-formatetelechelic
PTMC, HO(CH2)3OC(O){O(CH)3OC(O)}nO(CH)3OC(O)H, HOPTMCdOC
(O)H, (iv) (Scheme 33). This is the first pseudo anionic coordination–insertion
+ [Sm(BH4)3(THF)3]
O O O H
O3
O O
O
TMC
3
OOO3
O3 n
HO–PTMC–OC(O)H
[Sm(BH4)3(TMC)3] + 3 THF
OOO
Sm H BH3
3
Sm
HBH3O
O
OSm
3
O O
O3(n+1)
BH3·THF
HO
O
OSm
3
O O
O
3(n+1)
O 3
O O O HBH3
O3
OOO3
O3 n
Sm
O 3
BH3·THF
H+ H+
O O O H
O3
OOHO3
O3 n
O
Termination
Coordination
Insertion
Propagation
Sm O
3O
O
HBH3
i
ii ii'
iii'iii
iv
Path B
Path A
SCHEME 33 Proposed mechanism for the ROP of TMC initiated by a rare-earth borohydride
initiator illustrated with [Sm(BH4)3(THF)3], 1Sm.
Chapter 259 Rare-Earth Borohydride Complexes in Polymerization 51

type process fully detailed for the ROP of a carbonate initiated by a rare-earth
complex. It is also different from the cationic process described for the ROP of
TMC initiated by rare-earth trishalides (Shen et al., 1997), which proceeds
through an oxygen-alkyl bond scission of the monomer leading to a high con-
centration of ether segments, not observed in this study.
Interestingly, the use of the organometallic bis(phosphinimino)methanide
bisborohydride rare-earth complexes [{CH(PPh2NTMS)2}R(BH4)2(THF)]
(R¼La (20La), Y (20Y), Lu (20Lu)) by Guillaume et al. (2012), raised the
question of the carbonyl reduction by the BH3 function leading to the forma-
tion of a putative a-hydroxy,o-hemiacetaltelechelic PTMC (Scheme 34). The
latter species, [H{O(CH2)3OC(O)}nþ1O(CH2)3OCH2OH] (ii0) would be
formed after the coordination–insertion of the first incoming TMC molecules
to 20La (in)to [{CH(PPh2NTMS)2}La{O(CH2)3OC(O)HBH3}] (i), followedby the reduction of the adjacent carbonyl group of i by the terminal BH3 into
O O
O
TMC
2
HBH3O
O
O[La]
2
O O
O
(1) 2(n +1) O O
O
O O O H
O3
OOHO3
O3 n
O
BH3·THF
(2) H+ Termination
Coordination–insertion
Propagation
i
i'
ii
[La](BH4)2 [La] = [{CH(PPh2NTMS)2}La(THF)]
Path A
No C(O) reduction
Path B
C(O) reduction
HO
OBH3
O[La]
2i
OBH2OO[La]
2
(1) 2(n+1)
(2) H+
O O O OH
O3
OOHO3
O3 n
ii'
O O OH
O3
OOHO3
O3 n
iii'
H2C(O)
BH3·THF
20La
SCHEME 34 Proposed mechanism for the ROP of TMC initiated by [{CH(PPh2NTMS)2}La
(BH4)2(THF)], 20La.
Handbook on the Physics and Chemistry of Rare Earths52

[{CH(PPh2NTMS)2}La{O(CH2)3OCH2OBH2}] (i0) and then by the propaga-
tion (Scheme 34 path B), as observed with the ROP of CL (Scheme 26).
However, no evidence of ii0 could be detected by 1H NMR most likely
because the unstable hemiacetal chain-end evolved toward an dOH group
with liberation of formaldehyde, thus affording the a,o-dihydroxytelechelicPTMC, [H{O(CH2)3OC(O)}nO(CH2)3OH] (iii0) (Scheme 34 path B).The hydroxyl chain-ends of iii0 would then be identical to the one of the
a-hydroxy,o-formatetelechelic PTMC (ii), the latter being formed via the
ROP mechanism which does not involve the carbonyl reduction (Scheme 34
path A), as previously described for the ROP of TMC from trisborohydride
complexes and illustrated in Scheme 33 with [Sm(BH4)3(THF)3] (1Sm).
DFT studies next showed that these two mechanisms (Scheme 34 path
A and B) were computationally feasible (vide infra).
3.3. Concluding Remarks on the ROP of PolarMonomers Initiated by Rare-Earth Borohydride Complexes
The molar mass of the polymers formed from the controlled ROP of a
polar cyclic (non-acrylate) monomer generally remains smaller than
50,000 g mol�1; yet, higher molar mass values have not necessarily been tar-
geted (Tables 1–4). Note that a difference between the experimental molar
mass value (MnSEC), and the one calculated (Mntheo) assuming that all
BH4� groups participate in the ROP, suggested either a poor control of the
catalytic system, or a number of initiating BH4� functions different from
expected (Penczek and Moad, 2008).
It is noteworthy that regarding polylactones and polylactides, the narrow-
est dispersity values (Mw=Mn< 1:06) were obtained for the ROP of
CL initiated by the bisphosphiniminomethanide complexes [{CH
(PPh2NTMS)2}La(BH4)2(THF)] (20La) and [{CH(PPh2NTMS)2}R(BH4)2]
(R¼Y (20Y), Lu (20Lu)), reported by Roesky, Guillaume, Maron, and cow-
orkers (Jenter et al., 2010), or with the synthesis of PHB promoted by the
diaminobis(phenoxide) complexes [{(O2N2)1Nd(BH4)2Li(THF)}2] (31Nd)
and [(O2N2)2Nd(BH4)2Li(THF)2] (32Nd) reported by Carpentier, Trifonov,
and coworkers (Sinenkov et al., 2011), or by the homoleptic rare-earth
trisborohydride complexes [R(BH4)3(THF)3] (R¼La (1La), Nd (1Nd), Sm(1Sm)) as found by Guillaume et al. (2013), thus suggesting a well-controlled
ROP process in these cases (Tables 1 and 2). The Mw=Mn values recorded for
poly(lactide)s prepared from rare-earth borohydride catalysts were larger than
the ones commonly obtained from a well-controlled ROP process involving
the more common alkoxide initiators. In comparison to polylactones, the dis-
persity values usually obtained for PTMC (�1.3) samples were generally
higher as a result of a larger extent of transcarbonatation side reactions versus
transesterification ones (Tables 1–4).
Chapter 259 Rare-Earth Borohydride Complexes in Polymerization 53

The activities of the rare-earth borohydrides investigated in the ROP of
polar monomers (under the operating conditions reported, that is, reaction
times not necessarily optimized) including lactones, lactides,
N-carboxyanhydrides, and carbonates can be estimated from data gathered
in Tables 1–4. The comparison shows the highest activity of up to
TOF¼34,200 molCL molLu h�1, recorded with bis(phosphinimino)methanide
borohydride complexes [{CH(PPh2NTMS)2}La(BH4)2(THF)] (20La) and
[{CH(PPh2NTMS)2}R(BH4)2] (R¼Y (20Y), Lu (20Lu)), by Roesky,
Guillaume, Maron, and coworkers (Jenter et al., 2010), to be in the same
range as those obtained with the rare-earth cationic bisborohydride complexes
[R(BH4)2(THF)5][BPh4] (R¼Y (6Y); La (6La), Nd (6Nd), Sm (6Sm))
(TOF¼30,000 molCL molY,La,Nd,Sm h�1) by Okuda and coworkers (Robert
et al., 2008), or with the bridging monoborohydride diaminobis(phenoxide)
derivatives [{(O2NNpy)R(m-BH4)(THF)n}2] (R¼Y, n¼0.5 (26Y), Nd, n¼1
(26Nd), Sm, n¼0 (26Sm)) (TOF¼29,700 molCL molSm h�1) reported by
Mountford (Bonnet et al., 2005a). Remarkably, these activities are, to our
knowledge, the highest values reported for rare-earth borohydride initiators
promoting either a cyclic polar monomer or an acrylate (vide infra) polymer-
ization (Tables 1–4).
Although within a given series of rare-earth complexes, a direct correla-
tion of the polymerization activity with the ionic radii of the metal centers
is often observed, this trend cannot be taken as a general rule throughout
the rare-earth series. Indeed, subtle parameters often related to the steric and
electronic contribution of the ancillary molecule(s), and most significantly
to the nature of the ligand itself as well as to the presence of the “non-spectator”
BH4� ligand, have to be taken into account. This can be assessed through
DFT investigations as elegantly exemplified with the interaction of the bisphos-
phiniminomethanide ligand with the borohydride ligand.
The mechanism for the ROP of cyclic lactones, lactides, carbonates, and
a-amino acid N-carboxyanhydrides, based on experimental investigations,
are now well established and recognized. However, the exact nature of the
polymer end-capping functions has not yet been systematically investigated
or evidenced. Whereas a,o-dihydroxytelechelic PHB, PCL, PVL, PPDL,
PLA, PLLA, PTMC are formed, other end-functionalized PTMCs and PBLGs
have also been obtained, thus underlying the singularity of both carbonate and
a-amino acid NCA monomers. As addressed thereafter, DFT input has been a
determining factor to support (some of) the mechanisms proposed and to pro-
vide other energetic information otherwise inaccessible.
Regarding the ROP of cyclic carbonates or a-amino acid N-carboxyanhy-drides, the investigations remain quite rare in comparison to other
cyclic esters (lactones and lactides) and limited to TMC and BLG monomers.
The concomitant occurrence of several possible ROP pathways, as evidenced
experimentally and especially from mechanistic insights, may be a limiting
factor.
Handbook on the Physics and Chemistry of Rare Earths54

3.4. Polymerization of Methyl Methacrylate
3.4.1. Inorganic and Organometallic Rare-Earth BorohydrideInitiators
Using Nd(BH4)3(THF)3 (1Nd) as a pre-initiator, in association with variable
amounts of an alkylating agent as co-catalyst such as MgnBu2,nBuLi or
[(2,6-tBu-4-Me-C6H3O)2AlEt], poly(methyl methacrylate) (PMMA) with dif-
ferent tacticities depending on the solvent, was prepared at �40/0 �C in yields
up to 95% by Visseaux and coworkers (Scheme 35; Barbier-Baudry et al.,
2006) (Table 5). Highly syndiotactic PMMA (rr up to 75%) was formed from
all reactions performed in THF, whereas only the use of 1Nd/BuLi in toluene
led to an isotactic enriched PMMA (mm up to 93%). No mechanistic informa-
tion was reported.
The polymerization of methyl methacrylate (MMA) initiated by the rare-
earth borohydride complexes [R(BH4)3(THF)3] (R¼Nd (1Nd), Sm (1Sm)) or
[(Cp*)2Sm(BH4)(THF)] (5Sm) proceeded in various solvents (THF, DCM,
toluene) at ambient temperature to give rather syndiotactic (rr up to 67%)
poly(methyl methacrylate) as reported by Maron, Guillaume, and coworkers
(Barros et al., 2008b) (Table 5). Lowering the temperature from 25 to �10 �Cimproved the conversion of MMA from 10% in 24 h to 35% in 4 h when using
1Nd/DCM. Use of the metallocene complex 5Sm enabled to reach quantitative
MMA conversion and significantly enhanced both the activity (TOF up to
111 molMMA molSm h�1) and the productivity (up to 221 turnover numbers in 2 h).
However, the experimental molar mass values were generally much higher
than expected and quite broad dispersities (1:2<Mw=Mn< 2:7) were
obtained, suggesting poor initiation efficiency. DFT investigations by Maron,
Guillaume, and coworkers of MMA polymerization reactions using [(Cp)2Eu
(BH4)] as model initiator in comparison to [(Cp)2Eu(H)] (related to Yasuda’s
work on [{(Cp*)2Sm(H)}2]) rationalized these experimental data, and allowed
a ROP mechanism to be established (vide infra, Barros et al., 2008b). In parti-cular, in the reaction of [(Cp)2Eu(BH4)] with MMA, the most likely among all
possible computed products was the exergonic borate [(Cp)2Eu {(OBH3)
(OMe)C]C(Me)2}] complex, which was formed via the enolate [(Cp)2Eu
{O (OMe)C]C(Me)2}] (Scheme 36).
n
(1) [Nd(BH4)3(THF)3] /alkylating agent
(2) H+
*On
*Me
OMeO
MMA PMMA
OMe
O
SCHEME 35 Synthesis of PMMA from the polymerization of MMA initiated by Nd(BH4)3(THF)3(1Nd).
Chapter 259 Rare-Earth Borohydride Complexes in Polymerization 55

TABLE 5 Rare-Earth Borohydride Complexes Used as Initiators in the (Co)Polymerization of Methylmethacrylate (MMA) and
Experimental Data
Rare-earth borohydride
complex
MMA ([MMA]0/[BH4]0highest value)a
Solvent
Temp.
(�C)
Reaction
time
Conv.b
Mnmaxc
(Mntheo)a,d
g mol�1 ÐMe
Polymer
Tacticity
(%) Copolymer
Trivalent complex
[(C5Me4dC6H4-o-NMe2)Sc(BH4)2](11Sc, Scheme 6)
(250)(Jian et al., 2010)
Benz,THF20 �C
2 hBenz:TOF¼13THF:TOF¼70
16,600(nd)f
1.59 mm/mr/rrBenz: 80/14/6THF: 2/24/74
[(C5Me4dC6H4-o-NMe2)Sc(BH4)2](11Sc, Scheme 6)/MgnBu2,
nBuLig
(250)(Jian et al., 2010)
Benz,THF20 �C
THF:2.5 minTOF¼15
190,000(nd)f
2.16 THF:mm/mr/rr0/20/80
[{CH(PPh2NTMS)2}Y(BH4)2](20Y, Scheme 11)
(400)(Guillaume et al., 2011)
THF, Tol23 �C
24 h<5%
ndf,h ndf,h mm/mr/rr25/31/44
[{CH(PPh2NTMS)2}La(BH4)2(THF)](20La, Scheme 11)
(400)(Guillaume et al., 2011)
THF, Tol23 �C
2 h9%
ndf,h ndf,h mm/mr/rr29/40/31
[Nd(BH4)3(THF)3](1Nd, Scheme 1)
(130)(Barros et al., 2008b)
THF,DCM, Tol25 �C
4 hTHF: 22%
31,500(680)
2.1 mm/mr/rr16/27/57

[Nd(BH4)3(THF)3](1Nd, Scheme 1)/MgnBu2,nBuLi, [(2,6-tBu-4-Me-C6H3O)2AlEt]
g
(167)(Barbier-Baudry et al.,2006)
THF, Tol�40 �C
THF: 23 h,81%Tol: 3 h,95%
110,000(13,500)f
2.46 mm/mr/rrTHF: 3/22/75Tol: 93/6/1,1/18/81
[(Cp*Pr)2Nd(BH4)(THF)](6Nd)/MgnBu2,
nBuLig(500)(Barbier-Baudry et al.,2006)
THF, Tol0 �C
15 h100%
31,000(44,500)f
2.85 mm/mr/rr4/18/78,77/11/12
[(Cp*Pr)Nd(BH4)2(THF)2](10Nd, Scheme 7)/nBuLig,i
(250)(Barbier-Baudry et al.,2006)
THF, Tol0 �C
19 h92%i
21,400i
(23,000)f
Tol: BMi,j
2.0i mm/mr/rrTHF: 0/27/73i
Tol: 94/5/1i
[(Cp*Pr){(p-Tol)NN}R(BH4)]R¼Nd (12Nd), Sm (12Sm)(Scheme 7)/BuLig,i
(500)(Barbier-Baudry et al.,2006)
Tol0 �C
16 hNd: 100%i
Sm: 59%i
1,000,000i
(50,000)f
or BMj
1.5i mm/mr/rr96/3/1i
[{(TMS)2NC(NCy)2}2Nd(BH4)2Li(THF)2](22Nd, Scheme 12)
(775)(Skvortsov et al., 2007c)
Tol21 �C
8 h39%
615,050(30,550)f
2.72 mm/mr/rr31/34/35
[{(TMS)2NC(NiPr)2}2Nd(BH4)2Li(THF)2]
i
(23Nd)
(250)(Skvortsov et al., 2007b)
Tol, RT 3 h52%i
8500i
(13,000)f2.52i mm/mr/rr
44/41/15i
[Sm(BH4)3(THF)3](1Sm, Scheme 1)
(125)(Barros et al., 2008b)
THF,DCM, Tol25 �C
24 hTol: 7%
30,000(880)
2.2 mm/mr/rr24/20/56
PCL-b-PMMAPMMA-b-PCL-b-PMMA(Schappacheret al., 2007)
Continued

TABLE 5 Rare-Earth Borohydride Complexes Used as Initiators in the (Co)Polymerization of Methylmethacrylate (MMA) and
Experimental Data—Cont’d
Rare-earth borohydride
complex
MMA ([MMA]0/[BH4]0highest value)a
Solvent
Temp.
(�C)
Reaction
time
Conv.b
Mnmaxc
(Mntheo)a,d
g mol�1 ÐMe
Polymer
Tacticity
(%) Copolymer
[(Cp*)2Sm(BH4)(THF)](5Sm)
(320)(Barros et al., 2008b)
THF,DCM, Tol25 �C
20 hTHF: 100%i
378,000i
(22,140)2.1 mm/mr/rr
18/15/67
[(CpPh3)2Sm(BH4)(THF)]i
(7Sm)(500)i
(Barbier-Baudry et al.,2006)
Tol0 �C
16 h90%i
418,000i
(45,000)f2.5i mm/mr/rr
0/18/82i
[(CpPh3)2Sm(BH4)(THF)](7Sm)/nBuLig,i
(500)i
(Barbier-Baudry et al.,2006)
THF0 �C
23 h67%i
31,500i
(33,500)f2.1i mm/mr/rr
2/28/70i
[(CpiPr4)2Sm(BH4)]i
(8Sm)(50)i
(Barbier-Baudry et al.,2006)
Tol25 �C
4 h100%i
540,000i
(5000)f1.45i mm/mr/rr
–/–/68
[(CpiPr4)2Sm(BH4)](8Sm)/MgnBu2,
g,i nBuLig(500)(Barbier-Baudry et al.,2006)
Tol0 �C
20 h45%
BMj BMj mm/mr/rr85/11/4
[(CpPh3)Sm(BH4)2(THF)2](9Sm)/MgnBu2,
nBuLig,i(250)(Barbier-Baudry et al.,2006)
Tol0 �C
16 hMg: 70%i
Li: 23%i
BMj BMj mm/mr/rrMg: 17/18/65i
Li: 84/7/9i
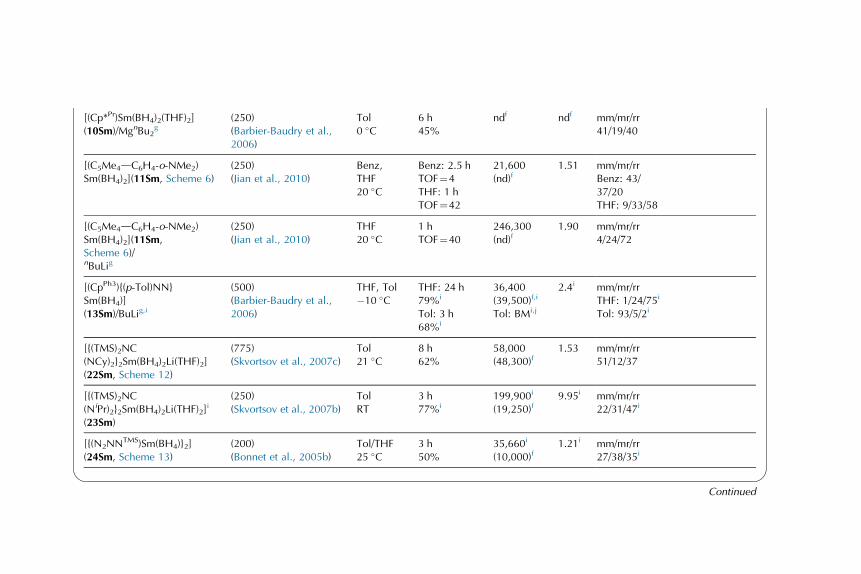
[(Cp*Pr)Sm(BH4)2(THF)2](10Sm)/MgnBu2
g(250)(Barbier-Baudry et al.,2006)
Tol0 �C
6 h45%
ndf ndf mm/mr/rr41/19/40
[(C5Me4dC6H4-o-NMe2)Sm(BH4)2](11Sm, Scheme 6)
(250)(Jian et al., 2010)
Benz,THF20 �C
Benz: 2.5 hTOF¼4THF: 1 hTOF¼42
21,600(nd)f
1.51 mm/mr/rrBenz: 43/37/20THF: 9/33/58
[(C5Me4dC6H4-o-NMe2)Sm(BH4)2](11Sm,Scheme 6)/nBuLig
(250)(Jian et al., 2010)
THF20 �C
1 hTOF¼40
246,300(nd)f
1.90 mm/mr/rr4/24/72
[(CpPh3){(p-Tol)NN}Sm(BH4)](13Sm)/BuLig,i
(500)(Barbier-Baudry et al.,2006)
THF, Tol�10 �C
THF: 24 h79%i
Tol: 3 h68%i
36,400(39,500)f,i
Tol: BMi,j
2.4i mm/mr/rrTHF: 1/24/75i
Tol: 93/5/2i
[{(TMS)2NC(NCy)2}2Sm(BH4)2Li(THF)2](22Sm, Scheme 12)
(775)(Skvortsov et al., 2007c)
Tol21 �C
8 h62%
58,000(48,300)f
1.53 mm/mr/rr51/12/37
[{(TMS)2NC(NiPr)2}2Sm(BH4)2Li(THF)2]
i
(23Sm)
(250)(Skvortsov et al., 2007b)
TolRT
3 h77%i
199,900i
(19,250)f9.95i mm/mr/rr
22/31/47i
[{(N2NNTMS)Sm(BH4)}2](24Sm, Scheme 13)
(200)(Bonnet et al., 2005b)
Tol/THF25 �C
3 h50%
35,660i
(10,000)f1.21i mm/mr/rr
27/38/35i
Continued

TABLE 5 Rare-Earth Borohydride Complexes Used as Initiators in the (Co)Polymerization of Methylmethacrylate (MMA) and
Experimental Data—Cont’d
Rare-earth borohydride
complex
MMA ([MMA]0/[BH4]0highest value)a
Solvent
Temp.
(�C)
Reaction
time
Conv.b
Mnmaxc
(Mntheo)a,d
g mol�1 ÐMe
Polymer
Tacticity
(%) Copolymer
[{(N2NNMes)Sm(BH4)2Li}2](25Sm, Scheme 13)i
(100)i
(Bonnet et al., 2005b)Tol/THF25 �C
12 h26%i
12,400i
(2600)f1.64i mm/mr/rr
25/40/35i
[(ArO)Er(BH4)2(THF)2](19Er, Scheme 10)
(100)(Yuan et al., 2006a)
Tol0 �C
1.5 h58%
96,500(4150)f
ndf mm/mr/rr6/34/60
[{(TMS)2NC(NCy)2}Er(BH4)2(THF)2](21Er)
(300)(Yuan et al., 2006b)
Tol0 �C
2.5 h28%
25,800(7100)f
2.45 ndf
[(ArO)Yb(BH4)2(THF)2](19Yb, Scheme 10)
(100)(Yuan et al., 2006a)
Tol0 �C
1.5 h60%
98,000(4710)f
ndf mm/mr/rr7/34/59
[{(TMS)2NC(NCy)2}Yb(BH4)2(THF)2](21Yb)
(150)(Yuan et al., 2006b)
Tol0 �C
1.5 h41%
15,100(6150)f
2.05 ndf
[{(TMS)2NC(NCy)2}2Yb(BH4)2Li(THF)2](22Yb, Scheme 12)
(775)(Skvortsov et al., 2007c)
Tol21 �C
8 h32%
57,700(24,900)f
1.63 mm/mr/rr52/32/16

[{CH(PPh2NTMS)2}Lu(BH4)2](20Lu, Scheme 11)
(400)(Guillaume et al., 2011)
THF, Tol23 �C
24 h11%
ndf,h ndf,h mm/mr/rr12/27/61
[{(2,6-iPr2C6H3)NC(Me)CHC(Me)N(C6H5)}2RBH4]R¼Y (36Y), Yb (36Yb)(Scheme 16)[({N(2-MeC6H4)C(Me)}2CH)2RBH4]R¼Y (37Y), Yb (37Yb)(Scheme 16)
(2500)(Shen et al., 2012)
Tol0 �C
2 h100%
72,090(nd)
1.62 mm/mr/rr0/21/80
Supported complex
[(@SiO)Nd(BH4)2(THF)2.2](38Nd)
(500)(Del Rosa et al., 2012)
–f 9 h(40%)
42,200(nd) f
4.2 mm/mr/rr69/15/16
aNote that the [MMA]0 /[BH4]0 ratio is different from the [MMA]0 /[initiator/catalyst]0 value, the former being used in the calculation of the theoretical molar mass (Mntheo )assuming one growing chain per BH4 group.bMMA conversion determined by 1H NMR or by gravimetry and corresponding to the highest [MMA]0/[BH4]0 value reported; TOF values given inmolMMA molcomplex h
�1.cNumber average molar mass (maximum value) determined by SEC–MALLS or by SEC versus polystyrene standards and corrected by a factor of 1.0 for PMMA.dTheoretical molar mass calculated from [MMA]0 /[BH4]0�MMA conversion�MMMA, assuming one growing chain per BH4
� group, with MMMA¼100 g mol�1; note thata discrepancy between Mntheo and MnSEC may be indicative of a number of growing polymer chains different from the number of BH4
� groups in the initiating complex.eCalculated average dispersity value as reported from SEC traces.fValue not reported by the authors.gPrepared in situ.hPolymer insoluble in THF.iOnly a single experiment is reported.jBimodal (BM) SEC traces.

The polydentate diamide–diamine supported samarium monoborohydride
complex [{(N2NNTMS)Sm(BH4)}2] (24Sm) developed by Mountford and co-
workers enabled the polymerization of MMA providing polymers with a
microstructure depending on the reaction temperature: the syndiotacticity
reached 65% at �78 �C while rather atactic PMMA (mm/mr/rrca.25/38/35%) were obtained at 25 �C (Bonnet et al., 2005b) (Table 5). Although high
molar mass PMMA formed (Mn¼ 52,800gmol�1) with quite narrow
Mw=Mn values (ca.1.23), no further investigations from 24Sm but these
few experiments were reported. The comparatively less efficient (26% in
12 h at 25 �C) lithiated analogous complex, [(N2NNMes)Sm(BH4)2Li]2
(25Sm) similarly gave atactic PMMA (mm/mr/rr 25/40/35%). These prelimi-
nary data first exemplified the polymerization of MMA by a rare-earth boro-
hydride complex. In comparison, the compounds [{(O2Npy)R(m-BH4)
(THF)n}2] (R¼Y, n¼0.5 (26Y); Nd, n¼1 (26Nd); Sm, n¼0 (26Sm)) were
ineffective for the polymerization of MMA (Bonnet et al., 2005a).
The borohydride metallocene and half-metallocene systems reported by
Visseaux and coworkers derived from substituted cyclopentadienyl rare-earth
complexes [(CpPh3)2Sm(BH4)(THF)], (7Sm), [(CpPh3)Sm(BH4)2(THF)2]
(9Sm), [(Cp*Pr)R(BH4)2(THF)2] (R¼Nd (10Nd), Sm, (10Sm)), [(CpiPr4)2Sm(BH4)] (8Sm), and/or diketiminate [(CpPh3){(p-Tol)NN}Sm(BH4)]
(13Sm), [(Cp*Pr){(p-Tol)NN}R(BH4)] (R¼Nd (12Nd), Sm (12Sm)), and
(p-Tol)NN¼ [(p-CH3C6H4)N(CH3)C]2CH combined (or not) to MgnBu2 ornBuLi gave highly syndiotactic (rr 82%) or highly isotactic (mm 96%)
PMMAs, depending on the ancillary ligand, the alkylating agent and the
polarity of the reaction medium (Barbier-Baudry et al., 2006) (Table 5).
While an electron-withdrawing ligand like CpPh3 (rr 82%) or the use of
THF (rrca.74%) seemed to favor syndiotacticity, nBuLi rather provided iso-
tactic PMMA (mmca.89%) in apolar solvent. However, regardless of the
nature of the ancillary ligand and the operating conditions, the control of
the polymerization was not always satisfactory with these initiating systems,
n
+ [(Cp)2Eu(BH4)]
*O
n
*
Me
OMeO
MMA
PMMA
O
Me
O
H2CMe
OMeO
Cp
Cp
Eu BH4
Enolateformation
MeMe
OMeO
Cp
Cp
Eu
+ BH3
MeMe
OMeO
Cp
Cp
EuBH3
SCHEME 36 Synthesis of PMMA from the polymerization of MMA initiated by [(Cp)2Eu(BH4)].
Handbook on the Physics and Chemistry of Rare Earths62

most likely as a result of propagation faster than initiation, often providing
bi/multi-modal SEC traces.
The aryloxide rare-earth bisborohydride complexes, [(ArO)R
(BH4)2(THF)2] (R¼Er (19Er), Yb (19Yb)), of Yuan and coworkers were
found moderately active in the polymerization of MMA at �30 to 40 �C,and most active at 0 �C (Yuan et al., 2006a) (Table 5). Rising the temperature
from 0 to 25 �C significantly decreased the yield of PMMA obtained from the
erbium and ytterbium compounds from 58–60% down to 14–13%, respec-
tively. Mainly syndiotactic (rrca.60%) PMMA was formed regardless of the
initiator and reaction conditions. However, the polymerization was not con-
trolled in terms of molar mass values (Mw=Mn not reported).
The same group also reported the neutral monoguanidinate rare-earth
bisborohydride complexes, [{(TMS)2NC(NCy)2}R(BH4)2(THF)2] (R¼Er
(21Er), Yb (21Yb)), as active (Er>Yb) in the polymerization of MMA
(Yuan et al., 2006b) (Table 5). The homoleptic guanidinate parent compounds
were inert toward MMA thus highlighting the required presence of the BH4�
group. The complexes were more active at 0 �C due to their deactivation at
higher temperature. However, the polymerization was not controlled in
terms of molar mass and dispersity values (Mw=Mn ca: 2:45). No tacticity
data were given.
The bis(b-diketiminate) ytterbium borohydride complex [{(2,6-iPr2C6H3)
NC(Me)CHC(Me)N(C6H5)}2YbBH4] (36Yb) reported by Shen was found to
polymerize MMA (Shen et al., 2012). The highest activity (quantitative
monomer conversion) was reached within 2 h in toluene at 0 �C at
[MMA]0/[36Yb]0 of 1000, affording syndiotactic PMMA (ca.80%) with
molar mass up to Mn¼ 72,100gmol�1, and 1.45<ÐM<1.81 suggesting a
poor control.
As later reported by Trifonov and coworkers, the corresponding anionic
N,N0-diisopropyl-N0-bis(trimethylsilyl) guanidinate rare-earth borohydride
complexes, [{(TMS)2NC(NiPr)2}2R(BH4)2Li(THF)2] (R¼Nd (23Nd), Sm
(23Sm)), and [{(TMS)2NC(NCy)2}2R(BH4)2Li(THF)2] (R¼Nd (22Nd), Sm(22Sm), Yb (22Yb)) did allow the polymerization of MMA in toluene with
a different level of control according to the metal (Skvortsov et al., 2007b,
c) (Table 5). The PMMA thus formed was characterized by NMR analysis
as heterotactic with a slight predominance of isotactic (23Nd, 22Nd, 22Sm,
22Yb) or syndiotactic triads (23Sm). The catalytic activity which remained
moderate, decreased within the series according to Sm>Nd>Yb. However,
the polymerization was generally uncontrolled in terms of molar mass (assum-
ing two BH4� initiating groups per metal center) and dispersity values, with
the exception of 22Sm.
The group of Cui used the linked half-sandwich bisborohydride complexes
[(C5Me4dC6H4-o-NMe2)R(BH4)2] (R¼Sc (11Sc), Sm (11Sm)) which
showed high isoselectivity at 20 �C (mm 80%) when the polymerization of
MMA was carried out in benzene, and alternatively syndio-enriched PMMA
Chapter 259 Rare-Earth Borohydride Complexes in Polymerization 63

(rr 74%) was formed in THF at �20 �C (Jian et al., 2010). The related two
component initiating systems [(C5Me4dC6H4-o-NMe2)R(BH4)2] (R¼Sc
(11Sc), Sm (11Sm))/MgnBu2,nBuLi also favored the formation of syndiotactic
PMMA (rr up to 80% at �40 �C) in THF. Activation with an alkylating agent
generally improved the activity regardless of the metal center. An extremely
high activity for the synthesis of syndio-enriched PMMA (rr 75%) was
claimed (TOF¼1200 molMMA molSc h�1) from 11Sc/nBuLi at �20 �C.
Investigations of the ability of bis(phosphinimino)methanide rare-earth metal
borohydrides, [{CH(PPh2NTMS)2}Y(BH4)2] (20Y), [{CH(PPh2NTMS)2}
La(BH4)2(THF)] (20La), and [{CH(PPh2NTMS)2}Lu(BH4)2] (20Lu) to poly-
merize MMA, have been reported both experimentally and computationally by
Guillaume et al. (2011) (Table 5). Both the lanthanum and lutetium complexes
polymerized MMA to some extent (yield<11%) at 23 �C whereas the yttrium
derivative was hardly active, whichever the operating conditions (solvent, reac-
tion time). The overall control was quite poor providing PMMA insoluble in
THF (i.e., suggesting the formation of polymers with high molar mass). Rather
atactic PMMA was obtained from 20La and 20Y, whereas 20Lu afforded
slightly syndio-enriched PMMA (rr up to 61%). Similarly, the analogous (phos-
phinimino)methanide chloro complexes combined with the amido ligand, [{CH
(PPh2NTMS)2}R{(Ph2P)2N}Cl] (R¼Y, La), were not very efficient, although
more active in presence of an alkylating co-catalyst, and afforded atactic PMMA
(Gamer et al., 2005). DFT insights highlighted the beneficial influence of the
phosphiniminomethanide ligand, in particular its significant steric, electronic,
and energetic contributions to the polymerization process in trapping the
liberated BH3 group (Guillaume et al., 2011). Also, in the case of yttrium, steric
considerations, in addition to energetically comparable barriers for the first and
second MMA insertions, support the experimentally observed difficulty to poly-
merize MMA (Section 4; vide infra).
3.4.2. Concluding Remarks on the Polymerization of MMAInitiated by Rare-Earth Borohydride Complexes
All rare-earth borohydride initiators, whether in the presence of an alkylating
agent or not and regardless of the solvent, were (in comparison to the ROP of
cyclic esters, vide supra) generally poorly active in the polymerization of
MMA (non-optimized TOF values generally�120 molMMA molrare-earth h�1)
with one exception claimed (�11,120 molMMA molSc h�1, Jian et al., 2010).
Higher reaction temperatures appeared to lower the yield of PMMA in agree-
ment with thermally-activated chain termination steps. Although good data
were sparingly obtained (duplicate experiments were not always reported)
especially with complexes in which the metal center bears (a) polydentate
ancillary ligand(s) (metallocene or non-metallocene type), the control in terms
of molar mass (again assuming one growing PMMA chain per each BH4�
group) and dispersity values was, in general, not good. The experimental
Handbook on the Physics and Chemistry of Rare Earths64
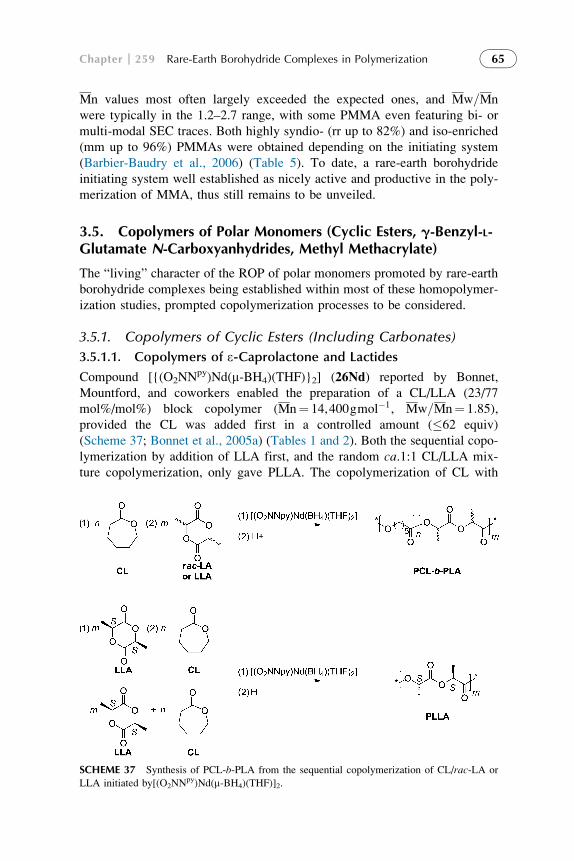
Mn values most often largely exceeded the expected ones, and Mw=Mn
were typically in the 1.2–2.7 range, with some PMMA even featuring bi- or
multi-modal SEC traces. Both highly syndio- (rr up to 82%) and iso-enriched
(mm up to 96%) PMMAs were obtained depending on the initiating system
(Barbier-Baudry et al., 2006) (Table 5). To date, a rare-earth borohydride
initiating system well established as nicely active and productive in the poly-
merization of MMA, thus still remains to be unveiled.
3.5. Copolymers of Polar Monomers (Cyclic Esters, g-Benzyl-L-Glutamate N-Carboxyanhydrides, Methyl Methacrylate)
The “living” character of the ROP of polar monomers promoted by rare-earth
borohydride complexes being established within most of these homopolymer-
ization studies, prompted copolymerization processes to be considered.
3.5.1. Copolymers of Cyclic Esters (Including Carbonates)
3.5.1.1. Copolymers of e-Caprolactone and Lactides
Compound [{(O2NNpy)Nd(m-BH4)(THF)}2] (26Nd) reported by Bonnet,
Mountford, and coworkers enabled the preparation of a CL/LLA (23/77
mol%/mol%) block copolymer (Mn¼ 14,400gmol�1, Mw=Mn¼ 1:85),provided the CL was added first in a controlled amount (�62 equiv)
(Scheme 37; Bonnet et al., 2005a) (Tables 1 and 2). Both the sequential copo-
lymerization by addition of LLA first, and the random ca.1:1 CL/LLA mix-
ture copolymerization, only gave PLLA. The copolymerization of CL with
SCHEME 37 Synthesis of PCL-b-PLA from the sequential copolymerization of CL/rac-LA or
LLA initiated by[(O2NNpy)Nd(m-BH4)(THF)]2.
Chapter 259 Rare-Earth Borohydride Complexes in Polymerization 65

rac-LA as the second monomer gave a mixture of the expected block copoly-
mer PCL-b-PLA along with PLA. No further characterization was reported.
3.5.1.2. Copolymers of e-Caprolactone and Trimethylene Carbonate
The sequential copolymerization of TMC and CL, as reported by
Guillaume and coworkers, afforded block copolymers PTMC-b-PCL(Mn� 11,200gmol�1, Mw=Mn ca: 1:45), featuring different end-capping func-tions depending on the order of monomer addition (Scheme 38; Palard et al.,
2007) (Tables 1 and 4). High TMC (�98%) and CL (�92%) conversion were
obtained using 1Sm as initiator whichever the order of monomer addition.
Depending on the different ROP mechanisms of a carbonate or a lactone pro-
moted by a rare-earth borohydride complex, which generate either a hydroxyl
and a formate terminal functions on a polycarbonate or two hydroxyl end-
groups on a polylactone (vide supra), a-hydroxy,o-formatetelechelic or a,o-dihydroxytelechelic PTMC-b-PCL were generated upon introduction of TMC
or CL first, respectively, as evidenced by 1H NMR analyses (Scheme 38).
The copolymers composition in both the carbonate or ester segments
(40–60% in either block) faithfully reflected the initial feed. Interestingly,
NMR analysis also showed signals corresponding to adjacent TMC and CL
units. No decarboxylation (ether segments) was observed from 1H NMR spec-
tra. Correspondingly, DSC thermograms of these PTMC-b-PCL exhibited two
Tgs (�60 �C, �16 �C) corresponding to each block (CL and TMC, respec-
tively), along with a Tm (64 �C) arising from the PCL segment.
Also, the same authors reported that TMC/CL random copolymers,
poly(trimethylene carbonate)-co-poly(e-caprolactone), PTMC-co-PCL(Mn ca: 8700gmol�1, Mw=Mn¼ 1:48), can be successfully prepared in high
n
(1) [Sm(BH4)3(THF)3]
(2) H+
O OO OH
O
O
n+1
HO–PTMC-b-PCL–OH
5 6O
O
CL
O O
O
TMC
(1) (2) m+1OOHO
3O
3 m
n
(1) [Sm(BH4)3(THF)3]
(2) H+O
OHO
O
O
n+1
HO–PCL-b-PTMC–OC(O)H
55
O
O
CL
O O
O
TMC
(2)(1) m+1
O O O3
O3m
H
O
n+1 O
O
CL
O O
O
TMC
m+1
SCHEME 38 Synthesis of PTMC-b/co-PCL from the sequential/simultaneous copolymerization
of TMC/CL initiated by [Sm(BH4)3(THF)3] (1Sm).
Handbook on the Physics and Chemistry of Rare Earths66

yields from [Sm(BH4)3(THF)3] (1Sm) at ambient temperature in THF or
DCM, upon simultaneous addition of TMC and CL (Palard et al., 2007)
(Tables 1 and 4). Given the established difference in reactivity between a car-
bonate and a lactone, careful analysis of the copolymer chain-ends by NMR
showing both a formate and a hydroxyl end-groups, revealed that a carbonate
unit is inserted first into the SmdHBH3 bond (Scheme 38). The quasi-
quantitative conversion of the monomers, ca.96%, in TMC versus only
ca.81% in CL also showed that TMC reacted faster whichever the feed ratio
([TMC]0/[CL]0¼28/80 to 80/20). This reactivity ratio is reversed in compari-
son to the corresponding homopolymerization behaviors in which CL homo-
polymerized faster than TMC. DSC analysis of the copolymers revealed a
Tg (�35 �C) intermediate between those of each homopolymer, and a Tm(48 �C) lower than that of PCL, thereby supporting its random nature.
3.5.1.3. Copolymers of d-Valerolactone and e-Caprolactoneor Lactides
The effectiveness of [La(BH4)3(THF)3] (1La) in the ROP of CL, VL, and LLA
prompted copolymerization studies of these monomers (Nakayama et al., 2007,
2009) (Tables 1 and 2). The random copolymerization of VL and LLA resulted
in little incorporation of VL (<6%) in PLLA (Mn� 11,900gmol�1,
Mw=Mn¼ 1:3) as observed with the CL/LLA couple which leveled off at 8%
of CL incorporated in the growing PLLA chain (Mn� 8300gmol�1,
Mw=Mn¼ 1:53). Sequential copolymerization of VL and then LLA resulted
in too slow polymerization of LLA. Random copolymerization of CL and VL
using 1La, proceeded at a rate slower than in the respective homopolymeriza-
tion leading (up to 50% yield) to copolymers (Mn� 13,300gmol�1,
Mw=Mn¼ 1:5) with slightly lower CL contents than VL contents. All these
copolymers have not been further characterized (Nakayama et al., 2009).
3.5.2. Copolymers of e-Caprolactone and g-Benzyl-L-GlutamateN-Carboxyanhydride or Methyl Methacrylate
As mentioned above, a,o-dihydroxytelechelic polyesters are highly valuable
polymers. Indeed, they can act as macroinitiators toward the synthesis of var-
ious copolymers (Guillaume, 2013). First, the dOH terminated polymer can
be used as a macro-alcohol allowing the preparation of polyester–polyester
or polyester–polycarbonate block copolymers (Guerin et al., 2013; Guillaume,
2013; Helou et al., 2009). Alternatively, upon chemical modification of the
terminal OH group(s) of a polyester, formed from the ROP of a cyclic ester
promoted by a rare-earth borohydride complex, into an amino- or a bromo-
function, one can further initiate the polymerization of a second co-monomer
requiring a distinct polymerization mechanism. As detailed thereafter, the
combination of two mechanistically distinct polymerization techniques such
as the ROP of a cyclic ester, the ROP of an a-amino acid NCA, the radical
polymerization of a methacrylate, represents a two-step alternative to the
Chapter 259 Rare-Earth Borohydride Complexes in Polymerization 67

unsuccessful (direct) copolymerization of such monomers. It is noteworthy
that whereas PTMC diols can be used toward the synthesis of polyurethanes,
via reaction with a diisocyanate (Loh et al., 2012), the chemical modification
of the hydroxyl end-capping groups of an a,o-dihydroxytelechelic PTMC
(Ajellal et al., 2010a; Guillaume, 2013; Guillaume and Carpentier, 2012;
Helou et al., 2009) into cyclic carbonate units, allowed the synthesis, upon
polycondensation with a diamine, of the highly valuable non-isocyanate
poly(urethane)s, known as NIPUs (Guillaume, 2013; Helou et al., 2011).
Following this strategy, analogous diblock and triblock polyester–
polypeptide copolymers of PCL and PBLG have thus been synthesized by
Guillaume and coworkers from the ROP of e-caprolactone followed by the
ROP of g-benzyl-L-glutamate (BLG, Scheme 39; Schappacher et al., 2006)
(Tables 1 and 3). In this approach the corresponding mono- or dihydroxy
end-functionalized PCL were first chemically modified into the analogous
mono- or diamino end-capped analogous polyesters, which were subsequently
used as macroinitiators for the ROP of the BLG monomer.
Note that block and random copolypeptides of BLG and ALA or
e-carboxbenzoxy-L-lysine (BLL), PBLG-b-PALA, and PBLG-b/co-PBLL have
HO
O OH
On
HO–PCL–OH H2N–PCL–NH2
OO On
PBLG-b-PCL-b-PBLG
NH
Oxx
HN
OHN
H
C(O)OCH2Ph
O
m/2NH
O
H
m/2
O(O)CPhCH2
5 6 OO O
On5 6
O
NH2
OH2N
PCL-b-PBLG
OO
On5 5 OR
O O
x
HN
NH
O
Hm
O(O)CPhCH2
O5 6
O
HN
O O
C(O)OCH2Ph
BLG
m
CH2Cl2, 20h
ROP
(1) Condensation withprotected amino acid
(2) Deprotection
x x
HO
O
On
HO–PCL–OR H2N–PCL–OR
5 5 OO
On5 5 OR
OH2NOR
O O
(1) Condensation withprotected amino acidification
(2) Deprotection
x
O
HN
O O
C(O)OCH2Ph
BLG
m
CH2Cl2, 20h
ROP
m CO2
m CO2
SCHEME 39 Synthesis of PCL-b-PBLG and PBLG-b-PCL-b-PBLG upon ROP of BLG using
mono- or di-amino end-capped PCL macroinitiators.
Handbook on the Physics and Chemistry of Rare Earths68

been prepared from 1Y within a few days (Peng et al., 2012b) (Table 3). 1H
NMR analyses showed that all PBLG chains initiated the ALA/BLL NCA poly-
merization and that the calculated molar ratio of monomers was close to the
feed ratio. The control of the molar mass (Mntheovs MnSEC < 39,000gmol�1)
was not always good while Mw=Mn remained below 1.30.
Also, rare-earth borohydride complexes generally appeared as poorly
active in the homopolymerization of MMA. Similarly, they basically failed
to copolymerize MMA with CL or TMC as co-monomer, as reported with
the trisborohydrides [Nd (BH4)3(THF)3] (1Nd) (Barros et al., 2008b) or withthe phosphiniminomethanide borohydride complex [{CH(PPh2NTMS)2}Lu
(BH4)2] (20Lu) (Guillaume et al., 2011), respectively. These results also
revealed that polyester–polyacrylate copolymers could not be prepared, under
the reported operating conditions, from the sequential copolymerization of a
lactone or a carbonate with a methacrylate by using these rare-earth borohy-
dride initiators. Such copolymers have, however, been successfully synthe-
sized by Guillaume and coworkers from a combined ROP/radical
polymerization approach (Scheme 40) (Tables 1 and 5). The synthetic route
HO
O OH
On
HO–PCL–OH Br–PCL–Br
OO O
n
PMMA-b-PCL-b-PMMA
O
O
Brm/2
Br
m/2
5 6 OO O
On5 6
O
O
PCL-b-PMMA
HO
O
On
HO–PCL–OR Br–PCL–OR
5 5 OO
On5 5 OR
O
OR
O O
O5 6
MeOO
Mem
CuBrPMDETA80 �C
Br
O
Br
Et3N Br
Br
MMA
Radicalpolymerization
OMeO
OOMe
Br
Br
O
Br
Et3N
OO
On5 5 OR
OOBr
m
OOMe
MeOO
Mem
CuBrPMDETA80 �C MMA
Radicalpolymerization
SCHEME 40 Synthesis of PCL-b-PMMA and PMMA-b-PCL-b-PMMA upon radical polymeri-
zation of MMA using mono- or di-bromo end-capped PCL macroinitiators.
Chapter 259 Rare-Earth Borohydride Complexes in Polymerization 69

consisted in using bromo-functionalized PCLs–prepared from the mono- or
dihydroxyfunctionalized PCLs upon esterification by 2-bromoisobutyryl
bromide–as macroinitiators for the polymerization of MMA (Scheme 40,
Schappacher et al., 2007). This approach allowed the preparation of both
analogous diblock PCL-b-PMMA and triblock PMMA-b-PCL-b-PMMA
copolymers, as opposed to the previous MMA/CL sequential copolymeriza-
tion route developed by Yasuda and coworkers from [(Cp*)2Sm(Me)(THF)]
which only gave the diblock copolymers (Yamashita et al., 1996).
Interestingly, the synthesis of PCL-b-PBLG and PBLG-b-PCL-b-PBLG (Schappacher et al., 2006), as well as of PCL-b-PMMA and
PMMA-b-PCL-b-PMMA (Schappacher et al., 2007), using the appropriate
macroinitiator derived from a,o-dihydroxytelechelic PCL as instigated by
Guillaume and coworkers, remains the only pathway established so far toward
the preparation of such analogous diblock and triblock polyester/polypeptide
and polyester/polyacrylate copolymers.
4. COMPUTATIONAL STUDIES: DFT INPUT INTO THEMECHANISM OF THE POLYMERIZATION OF POLARMONOMERS
Since the so-called DFT revolution, theoretical methods have been exten-
sively used to determine the profile of reactions involving transition metals.
However, much less has been reported on the theoretical investigations of
the mechanism of polymerization of polar monomers. The first in silico report
by Guillaume, Maron, and coworkers in 2008 addressed the polymerization of
methylmethacrylate catalyzed by the rare-earth borohydride complexes [Eu
(BH4)3] and [(Cp)2Eu(BH4)] (Barros et al., 2008b). Since then, several
computational investigations have been undertaken dealing with other mono-
mers and alike metallic borohydride complexes, indicating that each catalytic
system is different. However, the number of studies remained rather limited
and mainly involves e-caprolactone (Table 6).
4.1. ROP of «-Caprolactone and Lactide
The first theoretical investigations on the ROP of CL reported by Guillaume,
Mountford, and Maron involved the comparison of the metallocene [(Cp)2Eu
(BH4)] and the post-metallocene diamide–diamine [(N2NN0)Eu(BH4)] cata-
lytic systems (Barros et al., 2008a). These models were selected to mimic
the experimental behavior of the related derivatives, namely of [(Cp*)2Sm
(BH4)(THF)] (5Sm) (Palard et al., 2004) and [{(N2NNTMS)Sm(BH4)}2]
(24Sm) (Bonnet et al., 2005b), respectively (Table 6). Only the first CL inser-
tion was considered in order to explain the experimentally observed formation
of a,o-dihydroxytelechelic PCL (Guillaume et al., 2003, 2007; Palard et al.,
2004, 2005, 2006). The reaction with [(Cp)2Eu(BH4)] or [(N2NN0)Eu(BH4)]
Handbook on the Physics and Chemistry of Rare Earths70

TABLE 6 Relevant Data on the DFT Mechanistic Investigations of
the Polymerization of Polar Monomers Promoted by Rare-Earth
Borohydride Complexes
Rare-earth
borohydride
complex Monomer Most significant features
Divalent complex
[Sm(BH4)2(THF)2](2Sm, Scheme 2)
CL(Iftner et al., 2011)
No oxidation of the metal centerduring the ROPFormation of a,o-dihydroxytelechelic PCL
Trivalent complex
[MeY(BH4)(THF)5][BPh4](14Y, Scheme 8)
CL(Susperregui et al., 2011)
Methyl and BH4� ligands are
active in the ROP process(telomerization is possible)Formation of a,o-dihydroxytelechelic PCL
[{CH(PPh2NTMS)2}Y(BH4)2](20Y, Scheme 11)
CL(Jenter et al., 2010)
Highly efficient catalyst becauseof the low coordination strengthof BH4
� to YFormation of a,o-dihydroxytelechelic PCL
[Eu(BH4)3](1Eu0)
CL(Barros et al., 2008a)
Two consecutive B–H activationsFormation of a,o-dihydroxytelechelic PCL
[(Cp)2Eu(BH4)] CL(Barros et al., 2008a)
Similar features as for [Eu(BH4)3]
[(O2NL)Sm(BH4)
(THF)]L¼OMe (27Sm),NMe2 (28Sm), py(29Sm) (Scheme 13)[(O2N
nPr)Sm(BH4)(THF)2](30Sm, Scheme 13)
rac-LA(Dyer et al., 2010)
Possible formation of either a,o-dihydroxytelechelic or ketone-terminated PLA
[{CH(PPh2NTMS)2}Y(BH4)2](20Y, Scheme 11)
TMC(Guillaume et al., 2012)
Formation of a,o-dihydroxytelechelic or a-hydroxy,o-formatetelechelic PTMC
[{CH(PPh2NTMS)2}R(BH4)2](R¼Y, La; 20Y,20La, Scheme 11)
MMA(Guillaume et al., 2011)
PMMA formation is possiblebecause of the efficient trappingof BH3 by the nitrogen of theligand yielding to the enolateformation. This trapping does notaffect the subsequent insertion toform a keto-enolate complex
Continued
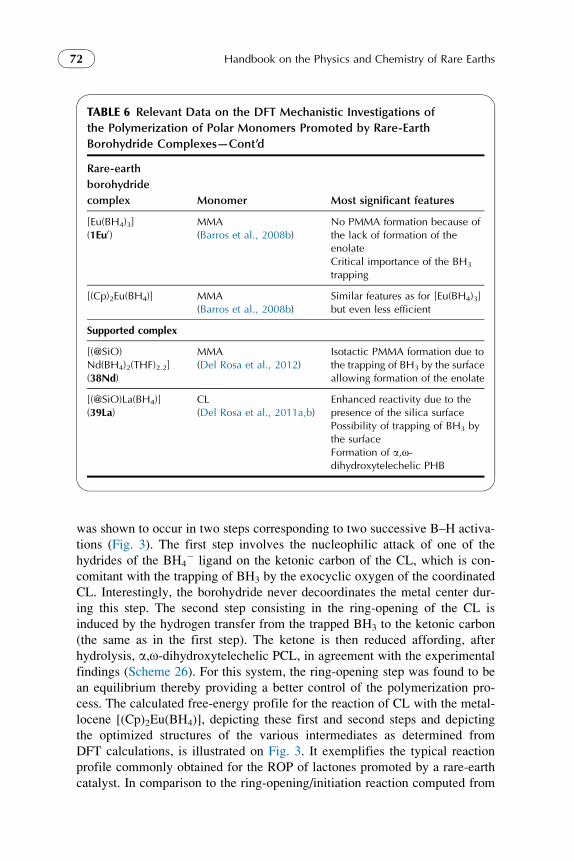
was shown to occur in two steps corresponding to two successive B–H activa-
tions (Fig. 3). The first step involves the nucleophilic attack of one of the
hydrides of the BH4� ligand on the ketonic carbon of the CL, which is con-
comitant with the trapping of BH3 by the exocyclic oxygen of the coordinated
CL. Interestingly, the borohydride never decoordinates the metal center dur-
ing this step. The second step consisting in the ring-opening of the CL is
induced by the hydrogen transfer from the trapped BH3 to the ketonic carbon
(the same as in the first step). The ketone is then reduced affording, after
hydrolysis, a,o-dihydroxytelechelic PCL, in agreement with the experimental
findings (Scheme 26). For this system, the ring-opening step was found to be
an equilibrium thereby providing a better control of the polymerization pro-
cess. The calculated free-energy profile for the reaction of CL with the metal-
locene [(Cp)2Eu(BH4)], depicting these first and second steps and depicting
the optimized structures of the various intermediates as determined from
DFT calculations, is illustrated on Fig. 3. It exemplifies the typical reaction
profile commonly obtained for the ROP of lactones promoted by a rare-earth
catalyst. In comparison to the ring-opening/initiation reaction computed from
TABLE 6 Relevant Data on the DFT Mechanistic Investigations of
the Polymerization of Polar Monomers Promoted by Rare-Earth
Borohydride Complexes—Cont’d
Rare-earth
borohydride
complex Monomer Most significant features
[Eu(BH4)3](1Eu0)
MMA(Barros et al., 2008b)
No PMMA formation because ofthe lack of formation of theenolateCritical importance of the BH3
trapping
[(Cp)2Eu(BH4)] MMA(Barros et al., 2008b)
Similar features as for [Eu(BH4)3]but even less efficient
Supported complex
[(@SiO)Nd(BH4)2(THF)2.2](38Nd)
MMA(Del Rosa et al., 2012)
Isotactic PMMA formation due tothe trapping of BH3 by the surfaceallowing formation of the enolate
[(@SiO)La(BH4)](39La)
CL(Del Rosa et al., 2011a,b)
Enhanced reactivity due to thepresence of the silica surfacePossibility of trapping of BH3 bythe surfaceFormation of a,o-dihydroxytelechelic PHB
Handbook on the Physics and Chemistry of Rare Earths72

the related [(Cp)2Eu(H)] (Yamashita et al., 1996), it is more easily thermody-
namically controlled with the borohydride derivative because no quasi-
equilibrium is involved. In both hydride and borohydride cases, it was
evidenced that the ring-opening proceeds through the oxygen-acyl bond
cleavage, as observed experimentally. Note that this hydride catalyst was
indeed found from this DFT study to afford an alkoxy-aldehyde initiating
species, [(Cp)2Eu{O(CH2)5C(O)H}], which would ultimately lead, via
[(Cp*)2SmO(CH2)6OSm(Cp*)2], to a,o-dihydroxytelechelic PCL.
Subsequently, Mountford, Maron, and coworkers reported the first
DFT study of rac-lactide polymerization using the bisphenolate derivatives
[(O2N0NMe2)Eu(BH4)] (O2N
0NMe2¼O2NNMe2 with the tBu groups removed)
as model of [(O2NNMe2)Sm(BH4)(THF)] (27Sm) (Dyer et al., 2010) (Table 6).
Again, the aim being the investigation of the nature of the polymer chain-end
(controlled by the first insertion), the calculations were restricted to the first
insertion. Both the reaction profiles leading to either a,o-dihydroxytelechelicPCL or a-hydroxy,o-aldehyde-terminated PCL were computed and compared.
Each of these two reaction mechanism profiles was slightly different from the
one reported for CL by Mountford, Guillaume, Maron, and coworkers (Barros
et al., 2008a), as it involved three steps instead of two. Indeed, the first step
involves the attack of the borohydride ligand that is decoordinated from the
[La]-BH4 + CL
[La]=Cp*2La
0.0
-11.8
-19.6
15.5
11.9
-29.0
[La]O
OH4B
[La] OO
H3B
H
[La]
OOH3B
[La]
OOH2B
H
ΔG(kcal mol-1)
[La]
OOH2B
FIGURE 3 Calculated free-energy profile for the reaction of CL with [(Cp)2Eu(BH4)], 37Eu,
depicting the structure of the intermediates as determined by DFT.
Chapter 259 Rare-Earth Borohydride Complexes in Polymerization 73

metal center, onto the ketonic carbon. This leads to an intermediate in which
the formed BH3 still interacts with the hydride and from which the trapping by
the exocyclic oxygen of CL can thus occur. The formation of the two types of
end-functionalized poly(lactide) from the latter species was predicted as being
kinetically possible, yet with an obvious thermodynamic preference for the
formation of a,o-dihydroxytelechelic PCL. This results from the low kinetic
stability of BH3, that has to be efficiently trapped to allow the formation of
the aldehyde-terminated PCL (for instance by a THF molecule). These inves-
tigations thus highlighted the significant influence of both the ligand and the
monomer onto the overall reaction mechanism.
Further instigations developed by Okuda and Maron dealt with the ROP of
CL catalyzed by the simple trivalent cation, [MeY(BH4)(THF)5][BPh4] (14Y)(Susperregui et al., 2011) (Table 6). As mentioned above in the computed
ROP of LA catalyzed by [(O2N0NMe2)Eu(BH4)] (Dyer et al., 2010),
the reaction involves three steps. In the yttrium promoted ROP, only
a,o-dihydroxytelechelic PCL was predicted but the propagation can take
place from either the borohydride or the methyl groups. Moreover, trans effect
was also found quite important, as changing the trans ligand led to either an
increase or a decrease of the overall energetic barrier.
Recently, theoretical studies were extended by Visseaux, Maron, and
coworkers to a homoleptic borohydride of divalent samarium (Iftner et al.,
2011). This was computationally challenging because the classical reactivity
of the borohydride had to be compared with the mechanism involving the oxi-
dation of the lanthanide center (from þII to þIII). The computed reaction
mechanism of the ROP of CL promoted by [Sm(BH4)2(THF)2] (2Sm)
was shown not to involve any oxidation of the metal center, in excellent
correlation with the experimental observations, and to lead to an a,o-dihydroxytelechelic PCL. Moreover, the mechanism involves only two steps,
as in the DFT study of the ROP of CL by the trivalent derivatives (Barros
et al., 2008a).
Finally, Roesky, Guillaume, Maron, and coworkers computationally
instigated the ROP of CL catalyzed by a bis(phosphinimino)methanide
borohydride complex, [{CH(PMe2NSiH3)2}Y(BH4)2], which mimicked the
complex used experimentally, [{CH(PPh2NTMS)2}Y(BH4)2] (20Y) (Jenteret al., 2010) (Table 6). The originality of this organometallic catalyst lies
in the two potential initiating BH4� sites. Also, the first B–H activation of
BH4� is achieved in two distinct unprecedented steps in contrast to the
unique step involved with monoborohydride complexes (Fig. 4). This first
B–H activation involves the nucleophilic attack of one hydride on the car-
bon atom of the ketone with decoordination of BH4� from yttrium, followed
by the trapping of BH3 by the oxygen atom of the ketone. This specificity
arises from the two BH4� groups along with the positive influence of
greater electron-donating ability of the bis(phosphinimino)methanide
ligand. The second B–H activation was classical for a rare-earth
Handbook on the Physics and Chemistry of Rare Earths74

borohydride catalyst. The three-step initiation mechanism found is similar
to the one determined for the ROP of LA by [(O2N0NMe2)Eu(BH4)] (Dyer
et al., 2010), and also promotes the formation of HO–PCL–OH with an
overall kinetically facile and thermodynamically favorable reaction. Inter-
estingly, [{CH(PMe2NSiH3)2}Y(BH4)2] is predicted to date, to be the most
efficient catalyst investigated theoretically (lowest activation barrier of all
investigated complexes). This is attributed to the fact that this organometal-
lic complex is less sterically crowded than the metallocene complex
[(Cp)2Eu(BH4)] (Barros et al., 2008a).
The effect of the ancillary ligand in rare-earth borohydride catalyzed poly-
merization was lately studied on silica-grafted homoleptic species, as reported
by Maron and coworkers (Del Rosa et al., 2011a,b) (Table 6). The effect of
grafting a borohydride complex onto a silica surface has been carefully con-
sidered in terms of the coordination mode and the effect of the coligand on
the energetic parameters. The reaction mechanism is similar to the one
reported for the ROP of lactide (Dyer et al., 2010; Susperregui et al., 2011).
The formation of the CL adduct is predicted to be highly favorable and
strongly exergonic because the grafting of the lanthanide complex onto the
DG(kcal mol-1)
[La]OO
H3B
[La]
OOH B
[La]
OH3BH
OOH2B
H
OO
H
17 6 18.2
H
BH3
17.6 18.2
14.5
0.0 2.7
[Y]-BH4 + CL-2.5 [La]
O[Y]
OOH4B
OO
H-11.8
4 HH3B
[La]
[Y]=[{CH(PMe2NSiH3)2}Y(BH4)]OH3BO
-35.5
[La]
OOH2B
FIGURE 4 Calculated free-energy profile for the reaction of CL with [{CH(PMe2NSiH3)2}Y
(BH4)2], depicting the structure of the intermediates as determined by DFT.
Chapter 259 Rare-Earth Borohydride Complexes in Polymerization 75

surface increased its Lewis acidity. Interestingly, despite the presence of sur-
face oxygen, BH3 is more efficiently trapped by the exocyclic oxygen of CL
than by the surface. Thus, the formation of a,o-dihydroxytelechelic PCL is
more likely than the formation of aldehyde-terminated PCL. On the other
hand, the nature of the grafting mode (mono-grafted or bi-grafted) is found
to hardly affect the reactivity. This is an important outcome since the grafting
mode of the complexes is very often not known experimentally. Thus, the
catalysis of grafted complexes could be viewed as the combination of differ-
ent simultaneously “operating” catalysts. Moreover, the grafted complexes
were found among the most efficient catalysts compared to the other alike
molecular catalysts reported in the literature (low activation barrier). The
effect of the coligand was minor, mainly because the grafting mode imposes
a cis conformation for the two ligands, reinforcing the importance of the trans
effect proposed by Susperregui et al. (2011).
4.2. ROP of Trimethylene Carbonate
As already mentioned, while theoretical DFT investigations on the ROP
mechanism remained rather limited to CL, a very recent study by Guillaume,
Maron, Roesky, and coworkers addressed the reactivity of the bis(phosphini-
mino)methanide rare-earth complexes 20Y, 20La, 20Lu in the ROP of TMC
(Guillaume et al., 2012) (Tables 4 and 6). This work was similarly restricted
to the first insertion in order to predict the nature of the chain-end of the poly-
mer. Two kinetically and thermodynamically favorable pathways are accessi-
ble and gave two distinct end-functionalized PTMCs. Indeed, the carbonyl
reduction could occur, or not, leading to either the “classical” a,o-dihydroxy-or to the a-hydroxy,o-formate telechelic PTMC, respectively. Although
both profiles are very close in energy, the formation of the latter is predicted
to be the most favorable (Fig. 5). Interestingly, the formation of this chain-
end implies the trapping of the formed BH3 molecule, as it cannot be used
to reduce the carbonyl of the TMC. The reaction mechanism involves first
the intermediate trapping of the BH3 by the intracyclic oxygen of TMC
rather than by the exocyclic one. Thus, a 1,2-shift of BH3 occurs leading to
the BH3 trapping by the exocyclic oxygen of TMC (needed for the formation
of the a,o-dihydroxytelechelic PTMC). From this intermediate, either the
reduction of the carbonyl can be achieved or an easy ring-opening
process takes place with subsequent trapping of BH3 by the nitrogen of the
bis(phosphinimino)methanide ligand. The former leads to the formation of
the a,o-dihydroxytelechelic PTMC and the latter to an a-hydroxy, o-formate
telechelic PTMC. Moreover, this study demonstrated the importance of the
ancillary ligand in this reaction process, while the calculations did not high-
light any significant differences among all three complexes 20Y, 20La,or 20Lu. This in-depth computational study remains, to date, the only one
dealing with the ROP of a carbonate (Table 6).
Handbook on the Physics and Chemistry of Rare Earths76
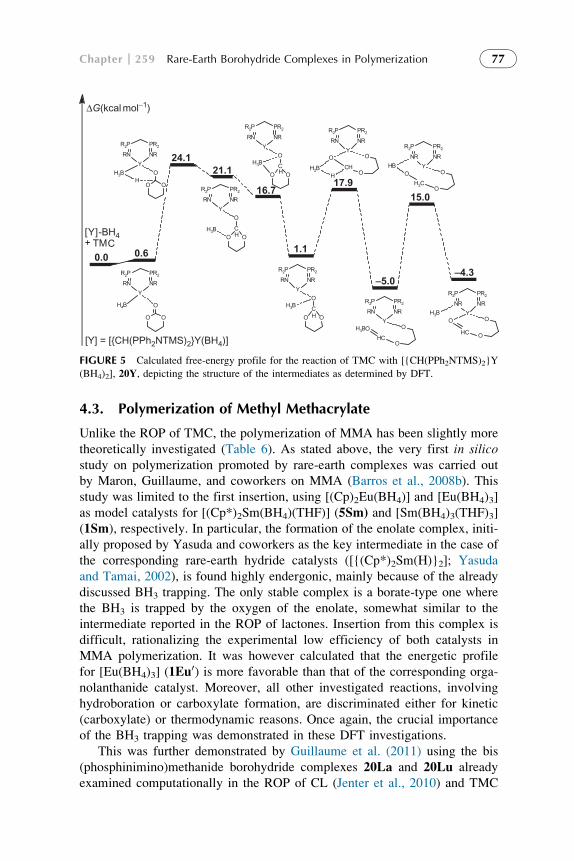
4.3. Polymerization of Methyl Methacrylate
Unlike the ROP of TMC, the polymerization of MMA has been slightly more
theoretically investigated (Table 6). As stated above, the very first in silicostudy on polymerization promoted by rare-earth complexes was carried out
by Maron, Guillaume, and coworkers on MMA (Barros et al., 2008b). This
study was limited to the first insertion, using [(Cp)2Eu(BH4)] and [Eu(BH4)3]
as model catalysts for [(Cp*)2Sm(BH4)(THF)] (5Sm) and [Sm(BH4)3(THF)3]
(1Sm), respectively. In particular, the formation of the enolate complex, initi-
ally proposed by Yasuda and coworkers as the key intermediate in the case of
the corresponding rare-earth hydride catalysts ([{(Cp*)2Sm(H)}2]; Yasuda
and Tamai, 2002), is found highly endergonic, mainly because of the already
discussed BH3 trapping. The only stable complex is a borate-type one where
the BH3 is trapped by the oxygen of the enolate, somewhat similar to the
intermediate reported in the ROP of lactones. Insertion from this complex is
difficult, rationalizing the experimental low efficiency of both catalysts in
MMA polymerization. It was however calculated that the energetic profile
for [Eu(BH4)3] (1Eu0) is more favorable than that of the corresponding orga-
nolanthanide catalyst. Moreover, all other investigated reactions, involving
hydroboration or carboxylate formation, are discriminated either for kinetic
(carboxylate) or thermodynamic reasons. Once again, the crucial importance
of the BH3 trapping was demonstrated in these DFT investigations.
This was further demonstrated by Guillaume et al. (2011) using the bis
(phosphinimino)methanide borohydride complexes 20La and 20Lu already
examined computationally in the ROP of CL (Jenter et al., 2010) and TMC
ΔG(kcal mol-1)
[Y]-BH4+ TMC
0.0 0.6
Y
H4B
R2P PR2
RN NR
O O
O
24.121.1
16.7
1.1
17.9
-5.0
15.0
-4.3
Y
H3B
R2P PR2
RN NR
O O
O
[Y] = [{CH(PPh2NTMS)2}Y(BH4)]
H
Y
H3B
R2P PR2
RN NR
C
O O
O
Y
H3B
R2P PR2
RN NR
C
O O
O
Y
H3B
R2P PR2
RN NR
C
O O
O
H
H
H
Y
H2B
R2P PR2
RN NR
CHO
OO
H
Y
R2P PR2
RN NR
HCO
OH3BO
Y
R2P PR2
NR NR
H2CO
OOHB
Y
R2P PR2
NR NR
HC O
OOH3B
FIGURE 5 Calculated free-energy profile for the reaction of TMC with [{CH(PPh2NTMS)2}Y
(BH4)2], 20Y, depicting the structure of the intermediates as determined by DFT.
Chapter 259 Rare-Earth Borohydride Complexes in Polymerization 77

(Guillaume et al., 2012) (Tables 4 and 6). Interestingly, unlike all other
reports, both the first and the second insertions were taken into consideration
(Fig. 6). Noteworthy, the formation of the enolate complex is determined
exergonic, because the trapping of the BH3 is ensured by the nitrogen of the
bis(phosphinimino)methanide ligand, as similarly observed in the ROP of
TMC (Guillaume et al., 2012). The trapping of the BH3 molecule by the
ligand is seen not to affect the activity of the complex, since the second inser-
tion of the MMA molecule is found to be even more kinetically favorable than
the first one. The activity of this complex in MMA polymerization was in
agreement with the experimental observations.
Another demonstration of the importance of the BH3 trapping was lately
unveiled by Gauvin, Maron, Thomas, and coworkers in the polymerization
of MMA from neodymium borohydride catalyst 1Nd grafted on a silica sur-
face ([(@SiO)Nd(BH4)2(THF)2.2]; Del Rosa et al., 2012). The three first
insertions are theoretically investigated in order to explain the propensity of
the catalyst to experimentally form isotactic rather than the usual syndiotactic
PMMA (Barros et al., 2008b). For the first MMA insertion, the BH3 trapping
by the surface oxygen leads to an exergonic enolate formation, allowing poly-
merization. The experimental preference for isotacticity was thus theoretically
supported; it was explained by the number of oxygen–rare-earth stabilizing
interactions –since the PMMA is acting as a chelating ligand– that are maxi-
mized in an isotactic enchainment. Noteworthy, this is, to date, the only theo-
retical investigation involving a rare-earth borohydride catalyst dealing with
the tacticity of the resulting PMMA (Table 6).
FIGURE 6 Calculated free-energy profile for the reaction of MMA with [{CH(PPh2NTMS)2}Y
(BH4)2], 20Y, depicting the structure of the intermediates as determined by DFT.
Handbook on the Physics and Chemistry of Rare Earths78

4.4. Theoretical Investigations: An Essential Toolfor Polymerization Catalysis
Theoretical methods are nowadays, mainly due to the efficiency of the new com-
puters and the so-called DFT revolution, able to tackle problems as complicated
as catalytic reactions such as polymerizations as well as stereoselectivity (in par-
ticular, the tacticity of polymers). Thus, in silico methods recently became an
important and essential tool in polymerization catalysis. Indeed, understanding
the key factors that govern the polymerization is crucial to design the best catalyst
for a given polymerization, and DFTmethods can provide accurate reaction path-
ways in agreement with experimental findings. For instance, in the specific case
of borohydride catalysts, it was unambiguously theoretically demonstrated that
the key issue, in order to be able to target well-defined polymers, is the trapping
of the formed BH3 molecule. If the BH3 moiety is trapped by the carbonyl group,
then only a,o-dihydroxytelechelic polymers are obtained in the case of cyclic
monomers, while a poor activity is obtained with MMA. On the other hand, if
the BH3 molecule can be efficiently trapped either by the solvent, the ancillary
ligand or the surface, then one can access a greater diversity of polymers and sub-
sequently, of polymer properties. In the sameway, theoretical methods are able to
accurately account for the tacticity of the polymer and the steric and electronic
effects that control the selectivity. In that sense, theoretical investigations, when
carried out in close combination with experimental studies, can be considered as
an essential tool to understand and foresee the polymerization mechanism.
5. CONCLUSIONS AND OUTLOOKS
In the frame of this chapter, we have evidenced that rare-earth borohydride
complexes constitute an attractive valuable class of catalysts for the polymer-
ization of polar monomers. Throughout their evaluation in the ROP of cyclic
esters such as lactones, lactides, carbonates, and even of a-amino acid NCAs,
such complexes have often revealed unexpected and unique behaviors,
as established experimentally. Computational DFT studies have further sup-
ported these findings while rationalizing the postulated polymerization
mechanisms. Moreover, calculations have enabled to better understand the
origin of the chain-ends of the observed a,o-functionalized polymers, often
unveiling unanticipated key intermediates. Whereas the intrinsic nature and
reductive potential of the BH4� active function proved an essential factor in
understanding the overall mechanism, other key parameters have been identi-
fied. Initial efforts to design and synthesize original discrete rare-earth orga-
nometallic post-metallocene borohydride derivatives have thus been deeply
rewarding. Future research in the design of tuned and well-defined rare-earth
borohydride, especially regarding their surrounding ancillary ligand(s), but
also considering their oxido-reduction potential, thus remains highly
promising. In particular, stereoselectivity issues of ROP involving chiral
Chapter 259 Rare-Earth Borohydride Complexes in Polymerization 79

lactones still remain a largely unexplored domain. Similarly, the efficiency of
chiral rare-earth complexes in selectively controlling polymerizations remains
an open field of research. Factors governing the stereoselectivity of the poly-
merization of polar monomers still remain to be better understood so as to
enable access to better controlled polymerization processes and in turn to
more original polymers. The access to well-defined copolymers of controlled
chemical structure from rare-earth borohydride catalysts has been demon-
strated as feasible; yet it is hardly exploited and much remains to be studied
especially regarding simultaneous copolymerization. Such fundamental exper-
imental (synthetic organometallic and polymer chemistries) and theoretical
investigations are thus a prerequisite for developing controlled polymerization
processes and subsequently for allowing access to tailored functional (co)
polymer materials.
ACKNOWLEDGMENTS
The authors gratefully acknowledge the coworkers whose names appear in the following
references for their contribution to this research. S. M. G. most gratefully acknowledges
Michele Schappacher for her significant contribution to the pioneering investigations on the
use of rare-earth borohydride catalysts in the ROP of cyclic esters. The authors are thankful
to the Centre National de la Recherche Scientifique (CNRS) (S. M. G.), the Deutsche
Forschungsgemeinschaft (DFG) (P. W. R.), and the Institut Universitaire de France (L. M.)
for their continuous support.
LIST OF SYMBOLS, ABBREVIATIONS, AND ACRONYMS
ALA L-alanine N-carboxyanhydrideAp*H (2,6-diisopropyl-phenyl)-[6-(2,4,6-triisopropyl-
phenyl)-pyridin-2-yl]-amine
Ar (C6H2tBu3-2,4,6)
Benz benzene
rac-BL racemic-b-butyrolactone, (S,S/R,R)-b-butyrolactoneBLL e-carboxbenzoxy-L-lysine N-carboxyanhydrideBLG g-benzyl L-glutamate N-carboxyanhydrideCL e-caprolactoneCOT Z8-cyclooctatetraenyl (Z8-C8H8)
Cp Z5-cyclopentadienyl (Z5-C5H5)
CpiPr4 tetra-iso-propylcyclopentadienyl (C5HiPr4)
CpPh3 1,2,4-triphenylcyclopentadienyl (C5H2Ph3-1,2,4)
Cp* Z5-pentamethylcyclopentadienyl (Z5-C5Me5)
Cp*Pr tetramethyl-n-propylcyclopentadienyl (C5Me4nPr)
Cy cyclohexyl (C6H11)
DAB2� ((2,6-C6H3iPr2)NC(Me)]C(Me)N(2,6-C6H3
iPr2))2�
DCM dichloromethane (CH2Cl2)
Handbook on the Physics and Chemistry of Rare Earths80
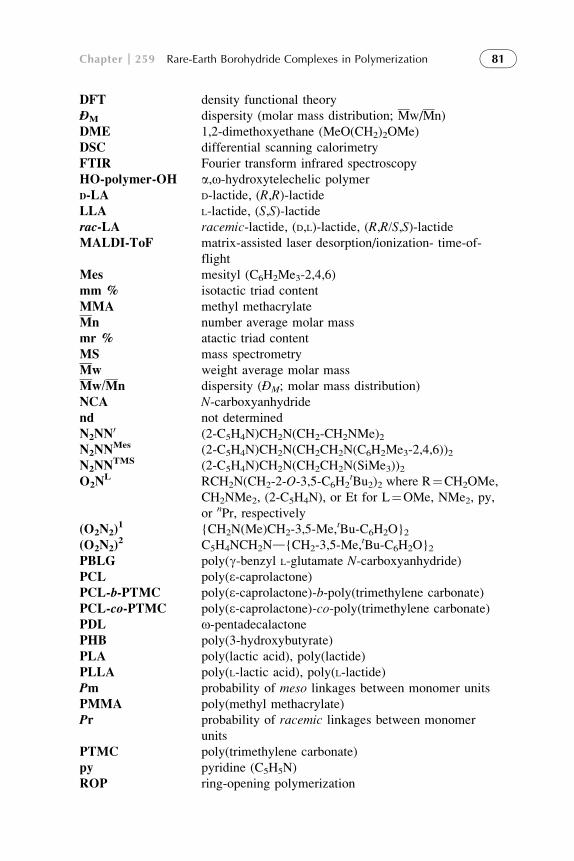
DFT density functional theory
ÐM dispersity (molar mass distribution; Mw/Mn)
DME 1,2-dimethoxyethane (MeO(CH2)2OMe)
DSC differential scanning calorimetry
FTIR Fourier transform infrared spectroscopy
HO-polymer-OH a,o-hydroxytelechelic polymer
D-LA D-lactide, (R,R)-lactideLLA L-lactide, (S,S)-lactiderac-LA racemic-lactide, (D,L)-lactide, (R,R/S,S)-lactideMALDI-ToF matrix-assisted laser desorption/ionization- time-of-
flight
Mes mesityl (C6H2Me3-2,4,6)
mm % isotactic triad content
MMA methyl methacrylate
Mn number average molar mass
mr % atactic triad content
MS mass spectrometry
Mw weight average molar mass
Mw/Mn dispersity (ÐM; molar mass distribution)
NCA N-carboxyanhydridend not determined
N2NN0 (2-C5H4N)CH2N(CH2-CH2NMe)2
N2NNMes (2-C5H4N)CH2N(CH2CH2N(C6H2Me3-2,4,6))2
N2NNTMS (2-C5H4N)CH2N(CH2CH2N(SiMe3))2
O2NL RCH2N(CH2-2-O-3,5-C6H2
tBu2)2 where R¼CH2OMe,
CH2NMe2, (2-C5H4N), or Et for L¼OMe, NMe2, py,
or nPr, respectively
(O2N2)1 {CH2N(Me)CH2-3,5-Me,tBu-C6H2O}2
(O2N2)2 C5H4NCH2Nd{CH2-3,5-Me,tBu-C6H2O}2
PBLG poly(g-benzyl L-glutamate N-carboxyanhydride)PCL poly(e-caprolactone)PCL-b-PTMC poly(e-caprolactone)-b-poly(trimethylene carbonate)
PCL-co-PTMC poly(e-caprolactone)-co-poly(trimethylene carbonate)
PDL o-pentadecalactonePHB poly(3-hydroxybutyrate)
PLA poly(lactic acid), poly(lactide)
PLLA poly(L-lactic acid), poly(L-lactide)
Pm probability of meso linkages between monomer units
PMMA poly(methyl methacrylate)
Pr probability of racemic linkages between monomer
units
PTMC poly(trimethylene carbonate)
py pyridine (C5H5N)
ROP ring-opening polymerization
Chapter 259 Rare-Earth Borohydride Complexes in Polymerization 81
rr % syndiotactic triad content
RT room temperature
SEC size exclusion chromatography
@SiO silica grafted
Sn(Oct)2 stannous(2-ethylhexanoate)
tetrahydrosalen [(2-OHdC6H2tBu2-3,5)CH2N(CH3)CH2]2
Tg glass transition temperature
THF tetrahydrofuran
Tm melting temperature
TMC trimethylene carbonate (3-dioxan-2-one)
TMS trimethylsilyl (SiMe3)
TOF turn over frequency, activity
p-Tol para-tolyl (p-CH3]C6H4)
(p-Tol)NN [(p-CH3C6H4)N(CH3)C]2CH
TptBu,Me tris(2-t-butyl-4-methyl)pyrazolylborate
VL d-valerolactone
REFERENCES
Agarwal, S., Greiner, A., 2002. J. Chem. Soc Perkin Trans. 1, 2033–2042.
Agarwal, S., Mast, C., Dehnicke, K., Greiner, A., 2000. Macromol. Rapid Commun. 21, 195–212.
Ajellal, N., Carpentier, J.-F., Guillaume, C., Guillaume, S.M., Helou, M., Poirier, V., Sarazin, Y.,
Trifonov, A., 2010a. Dalton Trans. 39, 8363–8376.
Ajellal, N., Durieux, G., Delevoye, L., Tricot, G., Dujardin, C., Thomas, C.T., Gauvin, R.M.,
2010b. Chem. Commun. 46, 1032–1034.
Albertsson, A.-C., Varma, I.K., 2003. Biomacromolecules 4, 1466–1486.
Arndt, S., Okuda, J., 2002. Chem. Rev. 102, 1953–1976.
Arndt, S., Beckerle, K., Hultzsch, K.C., Sinnema, P.-J., Voth, P., Spaniol, T.P., Okuda, J., 2002. J.
Mol. Catal. A Chem. 190, 215–223.
Barbier-Baudry, D., Bouyer, F., Madureira, B.A.S., Visseaux, M., 2006. Appl. Organomet. Chem.
20, 24–31.
Barros, N., Mountford, P., Guillaume, S.M., Maron, L., 2008a. Chem. Eur. J. 14, 5507–5518.
Barros, N., Schappacher, M., Dessuge, P., Maron, L., Guillaume, S.M., 2008b. Chem. Eur. J. 14,
1881–1890.
Bonnet, F., Visseaux, M., Barbier-Baudry, D., Hafid, A., Vigier, E., Kubicki, M.M., 2004a. Inorg.
Chem. 43, 3682–3690.
Bonnet, F., Visseaux, M., Barbier-Baudry, D., Vigier, E., Kubicki, M.M., 2004b. Chem. Eur. J.
10, 2428–2434.
Bonnet, F., Cowley, A.R., Mountford, P., 2005a. Inorg. Chem. 44, 9046–9055.
Bonnet, F., Hillier, A.C., Collins, A., Dubberley, S.R., Mountford, P., 2005b. Dalton Trans. 421–423.
Cendrowski-Guillaume, S.M., Nierlich, M., Lance, M., Ephritikhine, M., 1998. Organometallics
17, 786–788.
Cendrowski-Guillaume, S.M., Le Gland, G., Nierlich, M., Ephritikhine, M., 2000. Organometal-
lics 19, 5654–5660.
Cendrowski-Guillaume, S.M., Le Gland, G., Lance, M., Nierlich, M., Ephritikhine, M., 2002.
C. R. Chim. 5, 73–80.
Handbook on the Physics and Chemistry of Rare Earths82

Cendrowski-Guillaume, S.M., Le Gland, G., Nierlich, M., Ephritikhine, M., 2003. Eur. J. Inorg.
Chem. 1388–1393.
Del Rosa, I., Poteau, R., Maron, L., 2011a. Dalton Trans. 40, 11211–11227.
Del Rosa, I., Poteau, R., Maron, L., 2011b. Dalton Trans. 40, 11228–11240.
Del Rosa, I., Tschan, M.J.-L., Gauvin, R.M., Maron, L., Thomas, C.M., 2012. Polym. Chem. 3,
1730–1739.
Dyer, H.E., Huijser, S., Susperregui, N., Bonnet, F., Schwarz, A.D., Duchateau, R., Maron, L.,
Mountford, P., 2010. Organometallics 29, 3602–3621.
Edelmann, F.T., 2009. Chem. Soc. Rev. 38, 2253–2268.
Edelmann, F.T., 2010. Struct. Bond. 137, 109–163.
Edelmann, F.T., 2011. Coord. Chem. Rev. 255, 1834–1920.
Edelmann, F.T., Freckmann, D.M.M., Schumann, H., 2002. Chem. Rev. 102, 1851–1896.
Ephritikhine, M., 1997. Chem. Rev. 97, 2193–2242.
Evans, W.J., Bloom, I., Hunter, W.E., Atwood, J.L., 1983. J. Am. Chem. Soc. 105, 1401–1403.
Evans, W.J., Dominguez, R., Hanusa, T.P., 1986. Organometallics 5, 263–270.
Evans, W.J., Chamberlain, L.R., Ulibarri, T.A., Ziller, J.W., 1998. J. Am. Chem. Soc. 110,
6423–6432.
Gamer, M.T., Rastatter, M., Roesky, P.W., Steffens, A., Glanz, M., 2005. Chem. Eur. J. 11,
3165–3172.
Gamer, M.T., Roesky, P.W., Palard, I., Le Hellaye, M., Guillaume, S.M., 2007. Organometallics
26, 651–657.
Gmelin Handbook, 1991. In: Gmelin Handbook of Inorganic and Organometallic Chemistry, RE
Main vol. C 11 b. Springer-Verlag, Berlin, pp. 480–487.
Guerin, W., Helou, M., Carpentier, J.-F., Slawinski, M., Brusson, J.-M., Guillaume, S.M., 2013.
Polym. Chem. 4, 1095–1106.
Guillaume, S.M., 2013. Eur. Polym. J. 49, 768–779.
Guillaume, S.M., Carpentier, J.F., 2012. Catal. Sci. Perspect. 2, 898–906.
Guillaume, S.M., Schappacher, M., Soum, A., 2003. Macromolecules 36, 54–60.
Guillaume, S.M., Schappacher, M., Scott, N.M., Kempe, R., 2007. J. Polym. Sci. A Polym. Chem.
45, 3611–3619.
Guillaume, S.M., Brignou, P., Susperregui, N., Maron, L., Kuzdrowska, M., Roesky, P.W., 2011.
Polym. Chem. 2, 1728–1736.
Guillaume, S.M., Brignou, P., Susperregui, N., Maron, L., Kuzdrowska, M., Kratsch, J.,
Roesky, P.W., 2012. Polym. Chem. 3, 429–435.
Guillaume, S.M., Annunziata, L., Maron, L., Roesky, P.W., Schmid, M., 2013. Polym. Chem. 4,
3077–3087. http://dx.doi.org/10.1039/c3py00056g.
Helou, M., Miserque, O., Brusson, J.-M., Carpentier, J.-F., Guillaume, S.M., 2009. Macromol.
Rapid. Commun. 30, 2128–2135.
Helou, M., Carpentier, J.-F., Guillaume, S.M., 2011. Green Chem. 13, 266–271.
Hiorns, R.C., Boucher, R.J., Duhlev, R., Hellwich, K.-H., Hodge, P., Jenkins, A.D., Jones, R.G.,
Kahovec, J., Moad, G., Ober, C.K., Smith, D.W., Stepto, R.F.T., Vairon, J.-P., Vohidal, J.,
2012. Pure Appl. Chem. 84, 2167–2169.
Hou, Z., Nishiura, M., 2010. Bull. Chem. Soc. Jpn. 6, 595–608.
Hou, Z., Wakatsuki, Y., 2002. Coord. Chem. Rev. 231, 1–22.
Hou, Z., Luo, Y., Li, X., 2006. J. Organomet. Chem. 691, 314–3121.
Iftner, C., Bonnet, F., Nief, F., Visseaux, M., Maron, L., 2011. Organometallics 30,
4482–4485.
Ihara, E., Morimoto, M., Yasuda, H., 1995. Macromolecules 28, 7886–7892.
Chapter 259 Rare-Earth Borohydride Complexes in Polymerization 83

Jaroschik, F., Bonnet, F., Le Goff, X.-F., Ricard, L., Nief, F., Visseaux, M., 2010. Dalton Trans.
39, 6761–6766.
Jenter, J., Roesky, P.W., Ajellal, N., Guillaume, S.M., Susperregui, N., Maron, L., 2010. Chem.
Eur. J. 16, 4629–4638.
Jeske, G., Lauke, H., Mauermann, H., Swepston, P.N., Schumann, H., Marks, T.J., 1985. J. Am.
Chem. Soc. 107, 8091–8103.
Jian, Z., Zhao, W., Liu, X., Chen, X., Tang, T., Cui, D., 2010. Dalton Trans. 39, 6871–6876.
Kasperczyk, J.E., 1995. Macromolecules 30, 3937–3939.
Kerton, F.M., Witwood, A.C., Williams, C.K., 2004. Dalton Trans. 2237–2244.
Khvostov, A.V., Belsky, V.K., Sizov, A.I., Bulychev, B.M., Ivchenko, N.B., 1998. J. Organomet.
Chem. 564, 5–12.
Konkol, M., Okuda, J., 2008. Coord. Chem. Rev. 252, 1577–1591.
Kramer, M.U., Robert, D., Arndt, S., Zeimentz, P.M., Spaniol, T.P., Yahia, A., Maron, L.,
Eisenstein, O., Okuda, J., 2008. Inorg. Chem. 47, 9265–9278.
Kritikos, M., Moustiakimov, M., Wijk, M., Westin, G., 2001. J. Chem. Soc. Dalton Trans. 1931–1938.
Lappert, M.F., Singh, A., Atwood, J.L., Hunter, W.E., 1983. J. Chem. Soc. Chem. Commun.
206–207.
Lobkovski, E.B., Kravchenko, S.E., Semenenko, K.N., 1977. Zh. Strukt. Khim. 18, 389–391.
Loh, X.J., Guerin, W., Guillaume, S.M., 2012. J. Mater. Chem. 22, 21249–21256.
Lyubov, D.M., Bubnov, A.M., Fukin, G.K., Dolgushin, F.M., Antipin, M.Y., Pelce, O.,
Schappacher, M., Guillaume, S.M., Trifonov, A.A., 2008. Eur. J. Inorg. Chem. 2090–2098.
Mahrova, T.V., Fukin, G.K., Cherkasov, A.V., Trifonov, A.A., Ajellal, N., Carpentier, J.-F., 2009.
Inorg. Chem. 48, 4258–4266.
Makhaev, V.D., 2000. Russ. Chem. Rev. 69, 727–746.
Makhaev, V.D., Borisov, A.P., 1999. Zh. Neorg. Khim. 44, 1489–1491.
Marks, T.J., Kolb, J.R., 1977. Chem. Rev. 77, 263–293.
Marks, T.J., Kolb, J.R., 1981. Inorg. Chem. 20, 297–299.
Marks, S., Heck, J.G., Habicht, M.H., Ona-Burgos, P., Feldmann, C., Roesky, P.W., 2012. J. Am.
Chem. Soc. 134, 16983–16986.
McLain, S.J., Drysdale, N.E., 1991. (E.I. du Pont de Nemours and Co.). U. S. Patent 5028667.
McLain, S.J., Drysdale, N.E., 1992. Polym. Prepr. (Am. Chem. Soc. Div. Polym. Chem.) 33,
174–175.
McLain, S.J., Ford, T.M., Drysdale, N.E., 1992. Polym. Prepr. (Am. Chem. Soc. Div. Polym.
Chem.) 33, 463–464.
McLain, S.J., Ford, T.M., Drysdale, N.E., Shreeve, J.L., Evans, W.J., 1994. Polym. Prepr. (Am.
Chem. Soc. Div. Polym. Chem.) 35, 534–535.
Mirsaidov, U., Kurbonbekov, A., 1985. Dokl. Akad. Nauk Tadzh. SSR 28, 219–220.
Mirsaidov, U., Rakhimova, A.Z., 1978. Izv. Akad. Nauk Tadzh. SSR Otd. Fiz.-Mat. Geol.-Khim.
Nauk 121.
Mirsaidov, U., Rotenberg, T.G., Dymova, T.N., 1976. Dokl. Akad. Nauk Tadzh. SSR 19, 30–33.
Mirsaidov, U., Kurbonbekov, A., Rotenberg, T.G., Dzhuraev, K., 1978. Izv. Akad. Nauk SSSR
Neorg. Mater. 14, 1722–1725.
Mirsaidov, U., Kurbonbekov, A., Khikmatov, M., 1982. Zh. Neorg. Khim. 27, 2436–2439.
Mirsaidov, U., Boiko, G.N., Kurbonbekov, A., Rakhimova, A., 1986a. Dokl. Akad. Nauk Tadzh.
SSR 29, 608–611.
Mirsaidov, U., Shaimuradov, I.B., Khikmatov, M., 1986b. Zh. Neorg. Khim. 31, 1321–1323 Russ.
J. Inorg. Chem. 31, 753–754.
Handbook on the Physics and Chemistry of Rare Earths84

Momin, A., Bonnet, F., Visseaux, M., Maron, L., Takats, J., Ferguson, M.J., Le Goff, X.-F.,
Nief, F., 2011. Chem. Commun. 47, 12203–12205.
Nakayama, Y., Okuda, S., Yasuda, H., Shiono, T., 2007. React. Funct. Polym. 67, 798–806.
Nakayama, Y., Sasaki, K., Watanabe, N., Cai, Z., Shiono, T., 2009. Polymer 50, 4788–4793.
Nakayama, Y., Watanabe, N., Kusaba, K., Sasaki, K., Cai, Z., Shiono, T., Tsutsumi, C., 2011. J.
Appl. Polym. Sci. 121, 2098–2103.
Nomura, R., Endo, T., 1998. Chem. Eur. J. 4, 1605–1610.
Okuda, J., Arndt, S., Beckerle, K., Hultzsch, K.C., Voth, P., Spaniol, T.P., 2001. Pure Appl.
Chem. 73, 351–354.
Palard, I., Soum, A., Guillaume, S.M., 2004. Chem. Eur. J. 10, 4054–4062.
Palard, I., Soum, A., Guillaume, S.M., 2005. Macromolecules 38, 6888–6894.
Palard, I., Schappacher, M., Soum, A., Guillaume, S.M., 2006. Polym. Int. 55, 1132–1137.
Palard, I., Schappacher, M., Belloncle, B., Soum, A., Guillaume, S.M., 2007. Chem. Eur. J. 13,
1511–1521.
Parry, R.W., Kodama, G., 1993. Coord. Chem. Rev. 128, 245–260.
Penczek, S., Moad, G., 2008. Pure Appl. Chem. 80 (10), 2163–2193.
Peng, H., Ling, J., Shen, Z., 2012a. J. Polym Sci. Polym. Chem. 50, 1076–1085.
Peng, H., Ling, J., Zhu, Y., You, L., Shen, Z., 2012b. J. Polym Sci. Polym. Chem. 50, 3016–3029.
Poncelet, O., Sartain, W.J., Hubert-Pfalzgraf, L.G., Folting, K., Caulton, K.G., 1989. Inorg. Chem.
28, 263.
Richter, J., Edelmann, F.T., 1996. Eur. J. Solid State Inorg. Chem. 33, 1063–1069.
Robert, D., Kondracka, M., Okuda, J., 2008. Dalton Trans. 2667–2669.
Saiyasombat, W., Molloy, R., Nicholson, T.M., Johnson, A.F., Ward, I.M., Poshyachinda, S.,
1998. Polymer 39, 5581–5585.
Save, M., Schappacher, M., Soum, A., 2002. Macromol. Chem. Phys. 203, 889–899.
Schappacher, M., Soum, A., Guillaume, S.M., 2006. Biomacromolecules 7, 1373–1379.
Schappacher, M., Fur, N., Guillaume, S.M., 2007. Macromolecules 40, 8887–8896.
Schappacher, M., Le Hellaye, M., Bareille, R., Durrieu, M.-C., Guillaume, S.M., 2010. Macromol.
Biosci. 10, 60–67.
Schumann, H., Meese-Marktscheffel, J.A., Esser, L., 1995. Chem. Rev. 95, 865–986.
Schumann,H.,Keitsch,M.R., Demtschuk, J.,Muhle, S., 1998. Z.Anorg. Allg. Chem. 624, 1811–1818.
Scott, N.M., Kempe, R., 2005. Eur. J. Inorg. Chem. 1319–1324.
Shannon, R.D., 1976. Acta. Cryst. A32, 751–767.
Shen, Y., Shen, Z., Zhang, Y., Hang, Q., 1997. J. Polym. Sci. A 35, 1339–1352.
Shen, X., Xue, M., Jiao, R., Ma, Y., Zhang, Y., Shen, Q., 2012. Organometallics 31, 6222–6230.
Sinenkov, M.A., Fukin, G.K., Cherkasov, A.V., Ajellal, N., Roisnel, T., Kerton, F.M.,
Carpentier, J.-F., Trifonov, A.A., 2011. New J. Chem. 35, 204–212.
Skvortsov, G.G., Yakovenko, M.V., Castro, P.M., Fukin, G.K., Cherkasov, A.V., Carpentier, J.-F.,
Trifonov, A.A., 2007a. Eur. J. Inorg. Chem. 3260–3267.
Skvortsov, G., Yakovenko, M., Fukin, G., Baranov, E., Kurskii, Y., Trifonov, A., 2007b. Russ.
Chem. Bull. 56, 456–460.
Skvortsov, G.G., Yakovenko, M.V., Fukin, G.K., Cherkasov, A.V., Trifonov, A.A., 2007c. Russ.
Chem. Bull. Int. Ed. 56, 1742–1748.
Susperregui, N., Kramer, M.U., Okuda, J., Maron, L., 2011. Organometallics 30, 1326–1333.
Tanabe, M., Sugimura, T., Yasuda, H., 2002. React. Funct. Polym. 52, 135–141.
Visseaux, M., Bonnet, F., 2011. Coord. Chem. Rev. 255, 374–420.
Visseaux, M., Terrier, M., Mortreux, A., Roussel, P., 2010. Eur. J. Inorg. Chem. 18, 2867–2876.
Chapter 259 Rare-Earth Borohydride Complexes in Polymerization 85

Watson, P., 1983. J. Chem. Soc. Chem. Commun. 276–277.
Wu, G., Sun, W., Shen, Z., 2008. React. Funct. Polym. 68, 822–830.
Wu, G., Sun, W., Shen, Z., 2009. J. Appl. Polym. Sci. 112, 557–562.
Xhu, Z., Lin, Z., 1996. Coord. Chem. Rev. 156, 139–162.
Yakovenko, M.V., Trifonov, A.T., Kirillov, E., Roisnel, T., Carpentier, J.-F., 2012. Inorg. Chim.
Acta 383, 137–142.
Yamashita, M., Takemoto, Y., Ihara, E., Yasuda, H., 1996. Macromolecules 29, 1798–1806.
Yasuda, H., Ihara, E., 1997. Adv. Polym. Sci. 133, 55–101.
Yasuda, H., Tamai, H., 1993. Prog. Polym. Sci. 18, 1097–1139.
Yasuda, H., Tamai, H., 2000. Prog. Polym. Sci. 25, 573–626.
Yasuda, H., Tamai, H., 2002. J. Organometallic. Chem. 647, 128–138.
Yasuda, H., Yamamoto, H., Yokota, K., Miyake, S., Nakamura, A., 1992. J. Am. Chem. Soc. 114,
4908–4910.
Yasuda, H., Yamamoto, H., Takemoto, Y., Miyake, S., Yamashita, M., Yokota, K., Miyake, S.,
Nakamura, A., 1993a. Makromol. Chem. Macromol. Symp. 67, 187–201.
Yasuda, H., Yamamoto, H., Yamashita, M., Yokota, K., Nakamura, A., Miyake, S., Kai, Y.,
Kanehisa, N., 1993b. Macromolecules 22, 7134–7143.
Yuan, F., Yang, J., Xiong, L., 2006a. J. Organomet. Chem. 691, 2534–2539.
Yuan, F., Zhu, Y., Xiong, L., 2006b. J. Organomet. Chem. 691, 3377–3382.
Zange, E., 1960. Chem. Ber. 93, 652–657.
Zhang, X., Wang, C., Xue, M., Zhang, Y., Yao, Y., Shen, Q., 2012. J. Organomet. Chem. 713,
182–188.
Handbook on the Physics and Chemistry of Rare Earths86
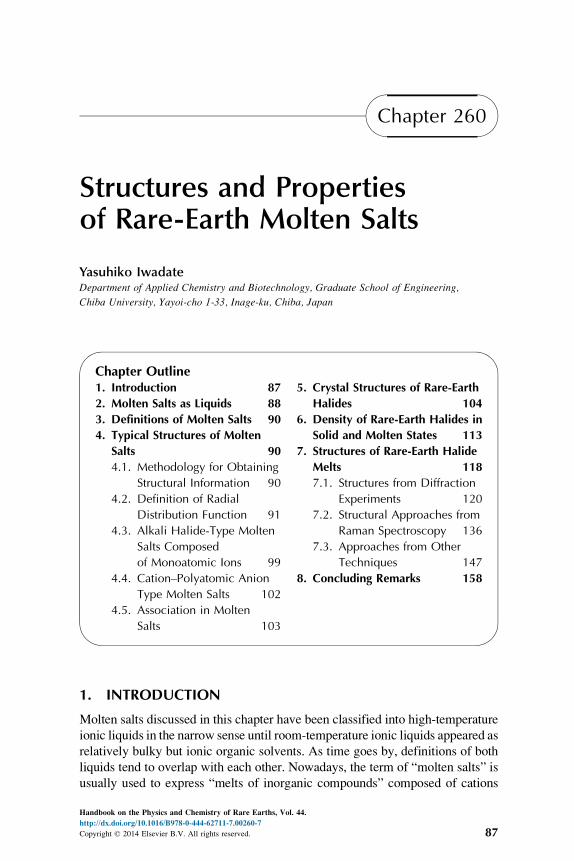
Chapter 260
Structures and Propertiesof Rare-Earth Molten Salts
Yasuhiko IwadateDepartment of Applied Chemistry and Biotechnology, Graduate School of Engineering,
Chiba University, Yayoi-cho 1-33, Inage-ku, Chiba, Japan
Chapter Outline1. Introduction 87
2. Molten Salts as Liquids 88
3. Definitions of Molten Salts 90
4. Typical Structures of Molten
Salts 90
4.1. Methodology for Obtaining
Structural Information 90
4.2. Definition of Radial
Distribution Function 91
4.3. Alkali Halide-Type Molten
Salts Composed
of Monoatomic Ions 99
4.4. Cation–Polyatomic Anion
Type Molten Salts 102
4.5. Association in Molten
Salts 103
5. Crystal Structures of Rare-Earth
Halides 104
6. Density of Rare-Earth Halides in
Solid and Molten States 113
7. Structures of Rare-Earth Halide
Melts 118
7.1. Structures from Diffraction
Experiments 120
7.2. Structural Approaches from
Raman Spectroscopy 136
7.3. Approaches from Other
Techniques 147
8. Concluding Remarks 158
1. INTRODUCTION
Molten salts discussed in this chapter have been classified into high-temperature
ionic liquids in the narrow sense until room-temperature ionic liquids appeared as
relatively bulky but ionic organic solvents. As time goes by, definitions of both
liquids tend to overlap with each other. Nowadays, the term of “molten salts” is
usually used to express “melts of inorganic compounds” composed of cations
Handbook on the Physics and Chemistry of Rare Earths, Vol. 44.
http://dx.doi.org/10.1016/B978-0-444-62711-7.00260-7
Copyright © 2014 Elsevier B.V. All rights reserved. 87

and anions. In this chapter, the concept of “liquid” as one of the three states ofmat-
ter is first defined and the following points are discussed: the general theory of
liquids, structural features and properties of molten salts, and methodology of
structural analyses. The present state of the art of works on structures and proper-
ties of rare-earth molten salts is outlined.
Apart from gaseous phase, particles such as molecules or ions are located
very closely to each other and thus strong forces act between them in solid
and liquid states. As atoms in solids are arranged properly in lines, their phys-
icochemical properties are calculated with relative ease. In contrast, particles
in liquids are mobile and get easily into contact; thus interparticle interactions
are very difficult to model, which consequently delayed progress in the solid-
state physics of liquids. A legitimate theory of liquid appeared in the 1930s by
taking advantage of the analysis of atomic arrangement in liquids by X-ray
diffraction (XRD).
The main differences between solids and liquids are that solids have short-
range ordering as well as long-range ordering but liquids possess only the
latter ordering; furthermore, liquids retain mobility but keep their density
constant thanks to the cohesion among the constituent particles. Accordingly,
molten salts happen to have the same features.
2. MOLTEN SALTS AS LIQUIDS
In order to make the concept of liquid clear, phase diagrams describing the
relationship among pressure, volume, and temperature are briefly referred
to. Figure 1 shows the states of pure matter at a given temperature and pres-
sure (Nakamura, 1993). Three phases such as gas phase (G), liquid phase (L),
and solid phase (S) coexist at the triple point Tt. The critical temperature and
the glass transition temperature are designated by Tc and Tg, respectively. Thedotted line in Fig. 1 refers to supercooling. At atmospheric pressure, three dif-
ferent states of matter can occur, depending on the temperature. For further
classification of liquids, the origins of interactions among constituent particles
should be considered.
The liquids can be roughly divided into three types on the basis of inter-
molecular forces acting between particles. Type 1 corresponds to molecular
liquids which can further be divided into four different categories: simple
liquids (such as argon), nonpolar molecular liquids (n-hexane), polar molecu-
lar liquids (acetone), and hydrogen-bonded molecular liquids (water). Type
2 encompasses ionic liquids or molten salts such as sodium chloride melt,
for instance. Liquid metals constitute type 3.
The averaged physical properties of type 1, 2, and 3 liquids near their
melting points under ambient pressure are listed in Table 1, in which the
values between parentheses correspond to those for crystals. The differences
Handbook on the Physics and Chemistry of Rare Earths88
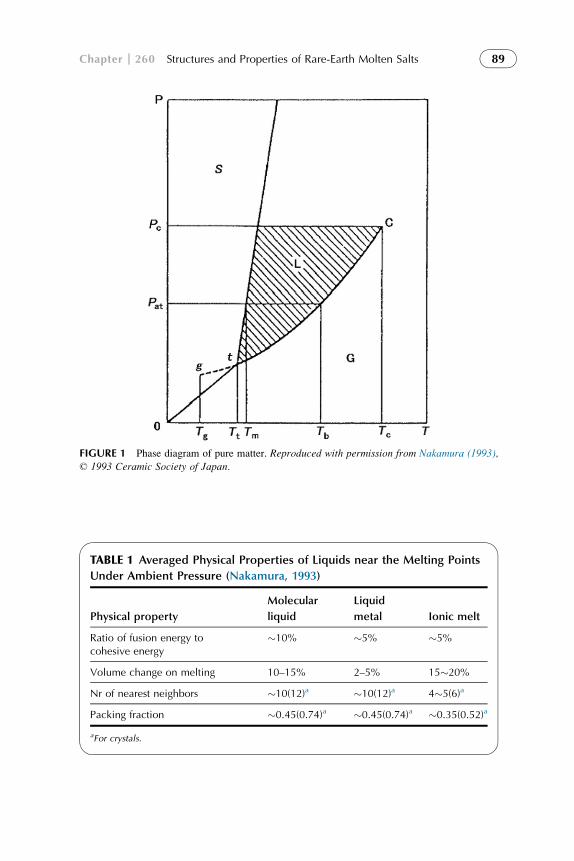
FIGURE 1 Phase diagram of pure matter. Reproduced with permission from Nakamura (1993),
© 1993 Ceramic Society of Japan.
TABLE 1 Averaged Physical Properties of Liquids near the Melting Points
Under Ambient Pressure (Nakamura, 1993)
Physical property
Molecular
liquid
Liquid
metal Ionic melt
Ratio of fusion energy tocohesive energy
�10% �5% �5%
Volume change on melting 10–15% 2–5% 15�20%Nr of nearest neighbors �10(12)a �10(12)a 4�5(6)a
Packing fraction �0.45(0.74)a �0.45(0.74)a �0.35(0.52)a
aFor crystals.
Chapter 260 Structures and Properties of Rare-Earth Molten Salts 89
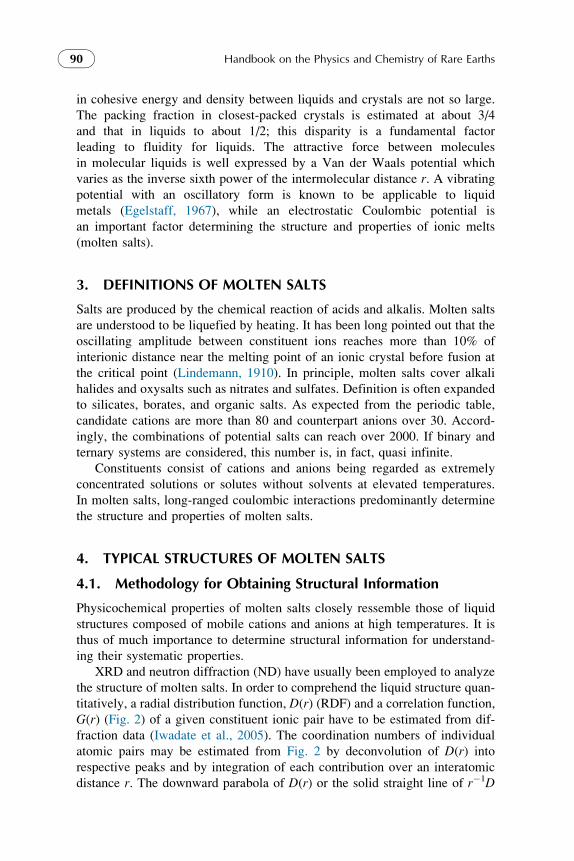
in cohesive energy and density between liquids and crystals are not so large.
The packing fraction in closest-packed crystals is estimated at about 3/4
and that in liquids to about 1/2; this disparity is a fundamental factor
leading to fluidity for liquids. The attractive force between molecules
in molecular liquids is well expressed by a Van der Waals potential which
varies as the inverse sixth power of the intermolecular distance r. A vibrating
potential with an oscillatory form is known to be applicable to liquid
metals (Egelstaff, 1967), while an electrostatic Coulombic potential is
an important factor determining the structure and properties of ionic melts
(molten salts).
3. DEFINITIONS OF MOLTEN SALTS
Salts are produced by the chemical reaction of acids and alkalis. Molten salts
are understood to be liquefied by heating. It has been long pointed out that the
oscillating amplitude between constituent ions reaches more than 10% of
interionic distance near the melting point of an ionic crystal before fusion at
the critical point (Lindemann, 1910). In principle, molten salts cover alkali
halides and oxysalts such as nitrates and sulfates. Definition is often expanded
to silicates, borates, and organic salts. As expected from the periodic table,
candidate cations are more than 80 and counterpart anions over 30. Accord-
ingly, the combinations of potential salts can reach over 2000. If binary and
ternary systems are considered, this number is, in fact, quasi infinite.
Constituents consist of cations and anions being regarded as extremely
concentrated solutions or solutes without solvents at elevated temperatures.
In molten salts, long-ranged coulombic interactions predominantly determine
the structure and properties of molten salts.
4. TYPICAL STRUCTURES OF MOLTEN SALTS
4.1. Methodology for Obtaining Structural Information
Physicochemical properties of molten salts closely ressemble those of liquid
structures composed of mobile cations and anions at high temperatures. It is
thus of much importance to determine structural information for understand-
ing their systematic properties.
XRD and neutron diffraction (ND) have usually been employed to analyze
the structure of molten salts. In order to comprehend the liquid structure quan-
titatively, a radial distribution function, D(r) (RDF) and a correlation function,
G(r) (Fig. 2) of a given constituent ionic pair have to be estimated from dif-
fraction data (Iwadate et al., 2005). The coordination numbers of individual
atomic pairs may be estimated from Fig. 2 by deconvolution of D(r) into
respective peaks and by integration of each contribution over an interatomic
distance r. The downward parabola of D(r) or the solid straight line of r�1D
Handbook on the Physics and Chemistry of Rare Earths90

(r) describes the average number density of the medium. The line G(r)¼1 in
Fig. 2 corresponds to the average number density distribution of atoms. The
G(r) function becomes attenuated with increasing r and reaches a value close
to unity, which reflects that the atomic arrangement is getting less ordered.
4.2. Definition of Radial Distribution Function
In order to understand RDFs, some of their definitions are explained briefly
here. The results of structural analyses are affected by not only the experimental
techniques but also the definitions and calculation procedures of RDFs used.
4.2.1. Definition 1
The pair number density function r(r) is related to coherent-scattered X-ray
intensity Icoh(Q) in electron units as described by Eqs. (1)–(4) (Waseda,
1980a):
FIGURE 2 Distribition (Top) and Coorelation (bottom) functions for molten lead dichlorie.
Reproduced with permission from Iwadate et al. (2005), © 2005 Elsevier.
Chapter 260 Structures and Properties of Rare-Earth Molten Salts 91
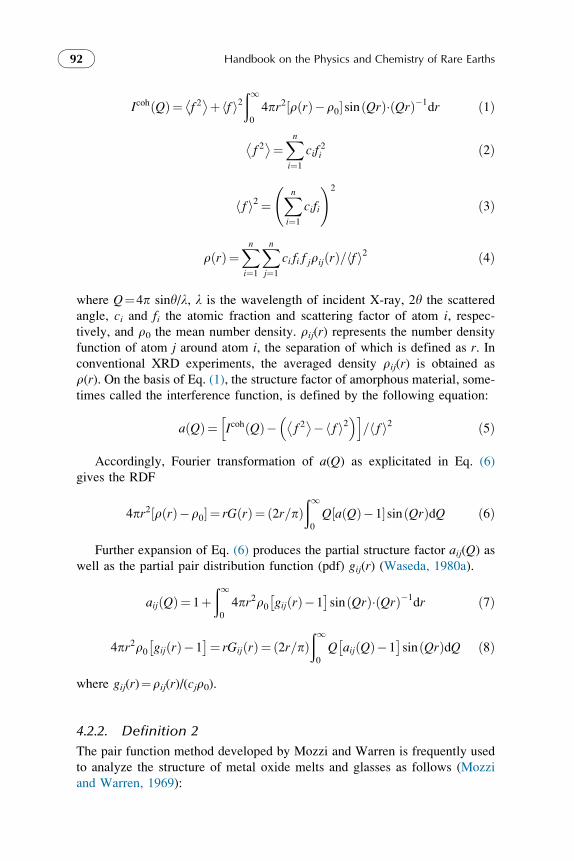
Icoh Qð Þ¼ f 2� �þ fh i2
ð10
4pr2 r rð Þ�r0½ �sin Qrð Þ� Qrð Þ�1dr ð1Þ
f 2� �¼Xn
i¼1cif
2i ð2Þ
fh i2¼Xni¼1
cifi
!2
ð3Þ
r rð Þ¼Xni¼1
Xnj¼1
ci fi f jrij rð Þ= fh i2 ð4Þ
where Q¼4p siny/l, l is the wavelength of incident X-ray, 2y the scattered
angle, ci and fi the atomic fraction and scattering factor of atom i, respec-tively, and r0 the mean number density. rij(r) represents the number density
function of atom j around atom i, the separation of which is defined as r. Inconventional XRD experiments, the averaged density rij(r) is obtained as
r(r). On the basis of Eq. (1), the structure factor of amorphous material, some-
times called the interference function, is defined by the following equation:
a Qð Þ¼ Icoh Qð Þ� f 2� �� fh i2� �h i
= fh i2 ð5Þ
Accordingly, Fourier transformation of a(Q) as explicitated in Eq. (6)
gives the RDF
4pr2 r rð Þ�r0½ � ¼ rG rð Þ¼ 2r=pð Þð10
Q a Qð Þ�1½ �sin Qrð ÞdQ ð6Þ
Further expansion of Eq. (6) produces the partial structure factor aij(Q) aswell as the partial pair distribution function (pdf) gij(r) (Waseda, 1980a).
aij Qð Þ¼ 1þð10
4pr2r0 gij rð Þ�1� �
sin Qrð Þ� Qrð Þ�1dr ð7Þ
4pr2r0 gij rð Þ�1� �¼ rGij rð Þ¼ 2r=pð Þ
ð10
Q aij Qð Þ�1� �
sin Qrð ÞdQ ð8Þ
where gij(r)¼rij(r)/(cjr0).
4.2.2. Definition 2
The pair function method developed by Mozzi and Warren is frequently used
to analyze the structure of metal oxide melts and glasses as follows (Mozzi
and Warren, 1969):
Handbook on the Physics and Chemistry of Rare Earths92

i Qð Þ¼ Ieu Qð Þ.N�
Xuc
f 2i
" #.f 2e ð9Þ
fe¼Xuc
fi
.Xuc
Zi ð10Þ
RDFexp¼ 2p2rreX
ZiþðQmax
0
Q�i Qð Þexp �a2Q2� �
sin Qrð ÞdQ ð11Þ
where Ieu(Q)/N is the scattered X-ray intensity per unit composition, S the
summation over all atoms in unit composition, fe the averaged scattering fac-
tor defined by Eq. (10), re the mean electron number density, and Zi theatomic number.
The total RDF for the given i–j pairs with coordination numbers Nij at dis-
tances rij calculated according to the pair function method is expressed in the
following form:
RDFcal¼XX
Nij=rij� ðQmax
0
fi fj f eð Þ�2 exp �a2Q2� �
sin Qrij�
sin Qrð ÞdQð12Þ
4.2.3. Definition 3
Direct Fourier transformation of the scattered intensity leads to the pdf or
RDF only for the systems composed of monoatomic liquids. In contrast, the
distribution functions are not obtainable with a rigorous scientific definition,
but approximated ones can be estimated for liquids consisting of polyatomic
molecules.
As for monoatomic liquids, the structural contributions in the scattered
intensity, i(Q)¼ Icoh(Q)– f(Q)2, are normalized by the square of the atomic
scattering factor, being relevant to a unit pair, f(Q)2, as shown in Eq. (13).
i Qð Þ¼ Icoh� f Qð Þ2h i
=f Qð Þ2 ð13Þ
The RDF is then expressed by the following form:
4pr2r rð Þ¼ 4pr2r0þ 2r=pð Þð10
Qi Qð Þsin Qrð ÞdQ ð14Þ
Thus, the two-body density function is evaluated, from which the pair
correlation function is obtained by using r(r)¼r0g(r) with r0¼N/V. In con-
nection with this relation, Narten et al. (1967) have carried out the following
Fourier transformation for the diffraction data of polyatomic molecules by
defining the modification function M(Q)¼1/Sfj(Q)2 (Levy et al., 1966;
Narten et al., 1967),
Chapter 260 Structures and Properties of Rare-Earth Molten Salts 93

4pr2 r rð Þ�r0½ � ¼ 2r=pð ÞðQmax
0
Qi Qð ÞM Qð Þexp �BQ2�
sin Qrð ÞdQ ð15Þ
where Qmax refers to the maximum value in the measured range of Q. The func-tion exp(�BQ2) is introduced to reduce the termination effect in Fourier transfor-
mation and the parameter B is usually set to satisfy the equation exp(�BQmax2 )¼
0.1. Ohtaki (1982) has proposed the relationship Sfj(0)2/Sfj(Q)
2¼SZj2/Sfj(Q)
2 as
a modification function, where Zj is the electron number of atom j.Furthermore, Narten (1972) has adapted the applicability of liquid struc-
tural models to real systems by defining the interference function i(Q) in a
reciprocal lattice space, see Eq. (16), where the atomic correlations in the rrange longer than a given distance r0ab are assumed to be distributed at mean
atomic number density:
i Qð Þ¼Xmi¼1
Xk
Nik exp �sikQ2�
fi fk sin Qrikð Þ= Qrikð Þ"
þXma¼1
Xmb¼1
exp �s0abQ2�
fa fb4pr0 Qr0ab cos Qr0ab� � �
�sin Qr0ab� �
=Q3
#,f 2e ð16Þ
4.2.4. Definition 4
Let m and n be the atoms at the origin of the coordinate axes and at a
given point, respectively. In polyatomic liquids, the RDF cannot be directly
calculated through Fourier transformation of the XRD intensity function since
both fm(Q) and fn(Q) are functions of Q. But if estimated values of the effective
scattered electron number of each atom, Km, Kn, are introduced, an approximate
solution of RDF is obtainable (Ohno et al., 1994; Warren et al., 1936).
i Qð Þ¼ Icoheu Qð Þ�NX
fm Qð Þ2n oh i.
NX
fm Qð Þ2n o
ð17Þ
If Eq. (17) can be derived from diffraction experiments, the following
form of RDF, namely, D(r), is finally determined:
D rð Þ¼ 4pr2X
Km
� �2r0þ
XKmð Þ2 2r
p
ðQmax
0
Q � i Qð Þsin Qrð ÞdQ ð18Þ
In practice, it is very important that appropriate substitution of the
atomic scattering factors fi(Q) in the above equations by the scattering
lengths bi is valid for ND analyses, where attention should paid to the fact that
bis are independent of Q, that is constant. The absolute values bis for all
Handbook on the Physics and Chemistry of Rare Earths94

elements in the periodic table are almost of the same order of magnitude. This
trend is quite different for fi(Q)s. For more details, the reader is referred to
the literature cited later. In practice, structural parameters such as
interatomic distance r, coordination number (CN), and mean square displacement
(h⊿r2i) for a particular atomic pair are to be evaluated from these functions.
Spectroscopic measurements have also been used for the same goal, in
particular, for elucidating the short-range structure, that is, for identifying
the chemical species in molten salts. It is noteworthy that both techniques
are powerful and complementary tools.
Principles and calculation procedures of XRD are well described in several
reviews (Furukawa, 1962; Gingrich, 1943; Karnicky and Pings, 1976; Kruh,
1962; Levy et al., 1966; Pings, 1968; Waseda and Ohtani, 1971a; Waseda
and Ohtani, 1971b).
As for neutral diffraction data, literature provides us with fundamental and
useful information (Adya, 2002; Adya, 2003; Enderby and Biggin, 1983). The
above analytical procedures correspond to those carried out in real space. But
for the analyses in reciprocal lattice space, the works of Narten et al. (Narten,
1972; Narten and Levy, 1969; Narten et al., 1967) based on the Debye scatter-
ing equation as well as the algorithm proposed by Busing and Levy (1962) are
of great advantage and service.
4.2.5. Estimation of Nearest-Neighbor Coordination Numberfrom RDF
The coordination number of nearest neighbor n1 provides important informa-
tion on the structure of liquids. There are four methods commonly used for
estimating n1 (Pings, 1968; Mikolaj and Pings, 1968), which are labeled
A–D in Fig. 3. These methods result in progressively higher numerical values
in the order, n1A<n1
B<n1C<n1
D.
Method A—Symmetrical turn-in of D(r)/rThis method involves symmetrizing the first peak in the D(r)/r func-
tion around a radius of symmetry.
Method B—Symmetrical turn-in of D(r)This is based on the assumption that the coordination shells are symmet-
ric about a radius which corresponds to the maximum in the D(r) function.Method C—Decomposition of D(r) into shells
The distance rmax, giving the first maximum in D(r), is taken as the
mean radius of the first shell. Any particle at a distance less than rmax
is counted as belonging to the first shell. As depicted in Fig. 3, a smooth
extrapolation of the leading edge of the second shell followed by sub-
traction gives the outward portion of the first shell.
Method D—Integration to the first minimum in D(r)n1 is determined by integrating D(r) up to a distance corresponding to
the first minimum after the first peak.
Chapter 260 Structures and Properties of Rare-Earth Molten Salts 95

Method A was proposed by Coulson and Rushbrooke (1939) under
the assumption that D(r)/r is, for each coordination shell, symmetrical around
its mean radius for any Einstein model of a liquid. Since the radius of symme-
try in D(r)/r is less than rmax, this method will generally gives the smallest
value of n1. Although method B is perhaps one of the most common schemes
in use, the D(r) function is not really symmetric about the first peak. This fact
is especially noticeable in the measurements made on high-density liquids
near their melting points. As for method C, it is usually difficult to define
the position of the second peak and to extrapolate the coordination number.
This method tends to bear larger uncertainty than the other three methods.
It is the advantage of method D, however, that the distance characteristic to
the first minimum in D(r) may be precisely determined and gives a plain
value of n1. It is therefore essential that the method used to evaluate n1and rl be precisely described in scientific reports. Moreover, it is indispens-
able to compare the observed values of n1 and rl with those
calculated by computer simulation (Sangster and Dixon, 1976; Woodcock
and Singer, 1971).
A
D (
r)/r
D (
r)
D (
r)D
(r)
B
C D
r r
FIGURE 3 Calculation methods of the coordination number. Reproduced with permission fromOhno et al. (1994), © 1994 Trans Tech Pub.
Handbook on the Physics and Chemistry of Rare Earths96

4.2.6. Stability of Nearest-Neighbor Coordination Shelland Penetration Effect of Second Coordination Shell
As described in detail by Enderby and Biggin (1983), the partial structure
factors Sþþ, S––, and Sþ– are related to the pair correlation functions gab(r)s by
Sab Qð Þ¼ 1þ4prQ
ðgab rð Þ�1� �� r sin Qrð Þdr ð19Þ
where a and b refer to þ and � corresponding to a cation and an anion, respec-
tively, and r to the total density of ions. It is nowadays widely accepted that the
most significant structural information about molten salts is contained in Sab(Q).The pair correlation function, Sab(Q), gives reach over a measure of the probabil-
ity of finding a b-type particle at a distance r from an a-type particle placed at theorigin. In other words, let us place an a-type particle at the origin and ask what isthe average number of b-type particles which occupy a spherical shell of radius rand thickness dr at the same time. The number is given by:
dnr ¼ 4prbgab rð Þr2dr ð20Þwhere rb¼Nb/V and Nb is the number of b species contained in the sample of
volume V. A hypothetical g(r) function for a simple liquid which contains a sin-
gle chemical species is sketched in Fig. 4. Since the chance of finding two parti-
cles separated by a distance less than r1 is negligible, r1 becomes a measure for
the closest distance of approach of two particles in the system. On the other hand,
�r giving the maximum g(r) in the first coordination shell allows us to define the
most probable separation of two atoms, and r2 provides the range over which
near-neighbor interactions are likely to be important. The definition of g(r) givenin Eq. (20) implies that the value of integral 4pr
Ð r20g rð Þr2dr is the average num-
ber of near neighbors for one particle chosen to be at the origin. This number is
often called the coordination number, n, although defined in several ways as indi-cated in the preceding section, which combined with the value of �r allows us tobuild up a chemically plausible picture of the short-range order. The ratio h0/h isan important measure of the stability of the first coordination shell. If a distinct
0
h
r
r–r1 r2
h�
1.0
g (r
)
FIGURE 4 Hypothetical radial distribution function g(r) for a simple liquid containing a single
chemical species. Reproduced with permission from Enderby and Biggin (1983), © 1983 Elsevier.
Chapter 260 Structures and Properties of Rare-Earth Molten Salts 97

and long-lived local geometry exists, h0/h tends to be small. For simple liquids in
which there are no special chemical effects, h0/h is typically equal to about 1/4. Ifgab(r) functions are known with sufficient accuracy over a wide range of temper-
ature T, pressure P, and concentration X, the thermodynamic properties relating
to mixtures can, in principle, be deduced.
Enderby and Biggin (1983) have concluded that for systems in which the
cation is small (e.g., Liþ, Naþ, Mg2þ, Zn2þ, and Mn2þ), calculation of the
near-neighbor coordination number from g(r) is satisfactory. The fundamental
reason for this is the absence of significant penetration of similar ions into
the first shell. This means that rþ� deduced from the total diffraction
pattern should also be reliable, as emphasized by Ohno and Furukawa (1981).
For large cations, in contrast, substantial penetration of the first shell by like
ions results in an asymmetric first peak in g(r). It is also important to realize
that integrating up to the first minima in g(r) or r2g(r) is unreliable since spuri-ous peaks frequently occur in this region of the r-space. This results from the
Fourier transformation of the S-space data. It therefore becomes difficult to
locate the position of the minimum with confidence. Typical examples are
depicted in Fig. 5, which clearly evidence the marked tendency for interpenetra-
tion of the first and second coordination shells for the larger cations.
The authors propose that another concept should be introduced to take the
stability of the nearest coordination shell into account. When some penetration
of the second coordination shell into the first coordination shell takes place, for
example, in molten SrCl2, this results in an overestimation of the number of
chloride ions in the first coordination shell. As a consequence, the evaluation
of the nearest-neighbor coordination number should rely on the integration of
g(r) or gþ�(r) up to the cross point of gþ�(r) and g��(r), or up to the first pointwhere gþ�(r) approaches unity from the origin. In any case, it is highly impor-
tant to describe precisely in scientific reports which definition is employed for
evaluating the nearest-neighbor coordination number.
0
1
2g (r
)
3
5.2
Zn Cl2 Ca Cl2 SrCl2 Ba Cl2
4.2
1 2 3 4 0 1 2 3 4 5 0 1 2
r (Å)
3 4 5 0 1 2 3 4 5 6
FIGURE 5 Increased penetration of the second into the first coordination sphere: solid line,
gþ�(r); dotted line, g��(r). Reproduced with permission from Enderby and Biggin (1983), ©1983 Elsevier.
Handbook on the Physics and Chemistry of Rare Earths98

4.3. Alkali Halide-Type Molten Salts Composedof Monoatomic Ions
The excess radial distribution of molten LiCl is shown in Fig. 6 (Marcus,
1977). The large peak at r¼0.385 nm corresponds to the contributions of
pairs of same ions, mainly due to adjacent Cl�–Cl� pairs, while those from
Liþ–Liþ pairs are very small. At less than the above distance, there is a small
peak in the XRD pattern. Simultaneously, a trough appears at around
0.245 nm since the scattering length of 7Li for thermal neutron is negative
(Sears, 1992). This peak is derived from the scattering of nearest-neighbor
pairs, that is Liþ–Cl� pairs, by taking into account the Coulomb forces acting
in the melt. The other peaks are observed at r¼0.70 nm and 1.02 nm, perhaps
being due to the Cl�–Cl� like ion pair. Over r¼1.0 nm, the assignments of
the peaks are difficult and less reliable. Similar results have already been
reported for the other alkali halide melts as listed in Table 2.
It is found from Table 2 that the nearest-neighbor coordination numbers of
melts are always smaller than those of corresponding solids, for example,
CN¼6 for NaCl-type solids and CN¼8 for CsCl-type solids. Due to the
decrease in nearest-neighbor coordination number, nearest-neighbor inter-
atomic distances in melts are reduced by as much as 5% on average in com-
parison with those in solids. The second-neighbor coordination numbers in
liquids are usually smaller than those in solids, namely, 12. The second-
neighbor interatomic distances increase by about 2% on average although
there exist some exceptions. It is noteworthy that the peaks in RDFs are wide
and the peak positions are no more than the mean values of individual distri-
butions. As for the structures of molten alkali halides in the solid state and the
liquid state just above their melting points, the following semi-empirical but
quantitative equation is known to be applicable to real systems (Furukawa,
1961; Furukawa and Ohno, 1973),
0
4pr2 (
g(r)-1
)
2 4 6
r (Å)
8 10
FIGURE 6 Excess radial distribution function of molten LiCl at 900 �C. Reproduced with
permission from Marcus (1977), © 1977 John Wiley & Sons.
Chapter 260 Structures and Properties of Rare-Earth Molten Salts 99

TABLE 2 Radial Distribution Analyses of Molten Alkali Halides by XRD, ND, and Computer Simulations (Ohno et al., 1994)a
Melt r1s (nm) n1
s r11 (nm) n1
1 n11 (cal)
r2s
(nm) n2s r2
l (nm)
DVm/
Vms (%) Method References r1
1 (nm)b Method References
LiI 0.312 6 0.285 5.6 3.9 0.441 12 0.445 20 XRD 1 0.26 MC 10
0.273 MD 11
LiBr 0.285 6 0.268 5.2 4.0 0.403 12 0.412 22.4 XRD 1
LiCl 0.266 6 0.255 4.1 4.2 0.376 12 0.39 26.2 XRD 2 0.240 MC 12
0.247 4.0 3.9 0.385 XRD 1 0.200 MD 13
0.245 3.5 3.7 0.38 ND 1 0.221 MD 14
0.240 4.0 3.5 0.386 XRD 3 0.203 MD 15
0.237 – ND 4 0.23 MC 10
LiF 0.210 6 0.200 3.7 4.0 0.297 12 0.30 29.4 XRD 5 0.175 MD 16
0.2013 6 0.185 3.1 – 0.302 XRD 6
NaI 0.239 0.315 4.0 4.1 0.474 12 0.480 18.6 XRD 1 0.301 MD 17
0.30 MD 18
NaCl 0.295 0.288 4.7 4.5 0.416 12 0.42 25.0 XRD 2 0.265 MD 19
0.277 3.7 4.0 0.415 XRD 7 0.27 MD/MC 20
0.26 MD 11
0.265 MD 21
KBr 0.341 6 0.318 3.5 4.2 0.465 17 XRD 8

NaF 0.250 6 0.230 4.1 4.1 0.330 12 0.35 27.4 XRD 5
KCl 0.327 6 0.320 5.2 4.7 0.461 12 0.44 17.3 XRD 2 0.296 MC 22
0.310 3.7 4.3 0.40–0.50 XRD 1 0.29 MC 23
0.310 3.5 4.3 ND 1 0.295 MD 9
0.305 3.6 4.4 XRD 9
0.301 – ND 4
CsCl 0.357 6 0.353 4.6 5.2 0.427 6 0.45–0.53 10.5 ND 1
(0.505) (12)
0.342 – ND 4
KF 0.280 6 0.265 4.9 4.3 0.396 12 0.36–0.42 17.2 XRD 5 0.235–0.250 MC 24
1: Levy et al. (1960); 2: Zarzycki (1958); 3: Ohno et al. (1978a); 4: Miyamato et al. (1994); 5: Zarzycki (1957); 6: Vaslow and Narten (1973); 7: Ohno and Furukawa (1981); 8: Ohno andFurukawa (1983); 9: Takagi et al. (1979); 10: Lewis et al. (1975); 11: Michielsen et al. (1975); 12: Krogh-Moe et al. (1969); 13: Woodcock (1971); 14: Okada et al. (1980); 15: Takagi et al.(1975); 16: Sangster and Dixon (1976); 17: Dixon and Sangster (1976a); 18: Dixon and Sangster (1975); 19: Lantelme et al. (1974); 20: Lewis and Singer (1975); 21: Dixon and Sangster(1976b); 22: Woodcock and Singer (1971); 23: Romano and McDonald (1973); 24: Adams and McDonald (1974).aKey: r1, nearest-neighbor interatomic distance; n1, nearest-neighbor coordination number; cal, value calculated by Eq. (1); r2, second-neighbor interatomic distance; n2, second-neighborcoordination number; s, solid state; l, liquid state; Vm, molar volume; DVm, Vm
l -Vms ; MD, molecular dynamics simulation; MC, Monte Carlo simulation.
bComputer simulated.

Vsm=V
lm¼ rs1=r
l1
� 3� nl1=ns1� ð21ÞThe applicability of Eq. (21) to several melts is demonstrated in Table 3
(Enderby and Biggin, 1983), where gþ�(r) refers to the partial pdf of dissimi-
lar ion pairs. It is found that even for monovalent or divalent metal chloride
melts, there is good or fairly good correspondence between observed and cal-
culated coordination numbers of these ion pairs.
Equation (21) represents the melting phenomenon of ionic crystal and
describes the volume change on melting from the viewpoints of changes
in nearest-neighbor distance and coordination number. It is found from
Tables 2 and 3 that melting of matter can be interpreted as follows: (1) the
interatomic distance and the coordination number of a given nearest-neighbor
pair in molten state become shorter and decrease, respectively, in comparison
with those in solid state and (2) the second-neighbor interatomic distance in
melt needs to be longer than that in solid so as to realize the thermal expan-
sion on melting.
4.4. Cation–Polyatomic Anion Type Molten Salts
Another category of simple molten salts consists in salts built from metal
cations and polyatomic anions such as nitrates, nitrites, carbonates, sulfates,
and so on. The atomic arrangements of cations around a particular polyatomic
anion in these melts are usually investigated by XRD, ND, XAFS, MD,
Raman, and their combinations. Polyatomic anions such as NO3�, CO3
2�,
TABLE 3 Coordination Numbers of Monovalent and Divalent Metal
Chloride Melts at Respective Melting Points (Enderby and Biggin, 1983;
Janz et al., 1968)
Melt
Cationic
radius (A)
n1 calc. from
Eq. (1)
n1 estimated
from gþ�(r) T (K)
ZnCl2 0.74 3.5 4.3 548
NaCl 0.95 4.0 3.9 1073
CaCl2 0.99 5.8 5.3 1055
SrCl2 1.12 6.5 5.1 1148
KCl 1.33 4.1 4.1 1043
BaCl2 1.35 7.5 6.4 1235
RbCl 1.47 3.8 3.5 988
Handbook on the Physics and Chemistry of Rare Earths102
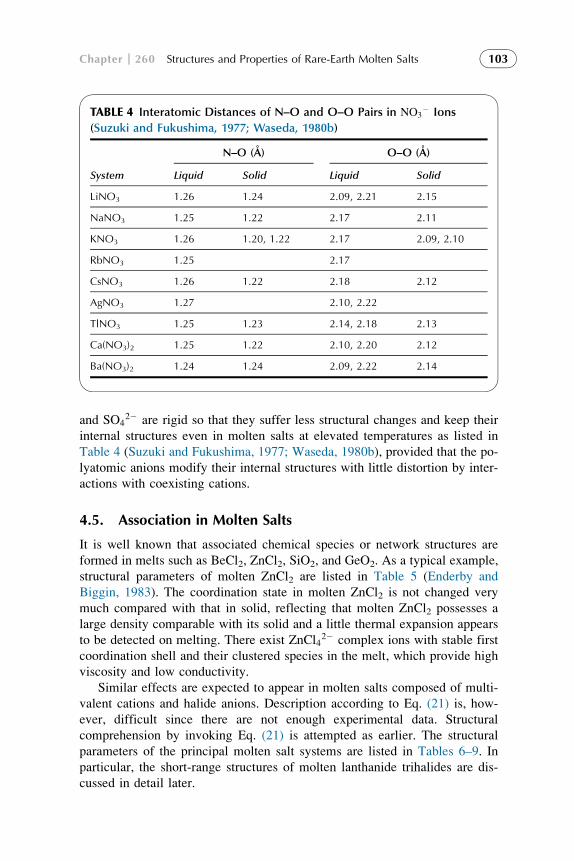
and SO42� are rigid so that they suffer less structural changes and keep their
internal structures even in molten salts at elevated temperatures as listed in
Table 4 (Suzuki and Fukushima, 1977; Waseda, 1980b), provided that the po-
lyatomic anions modify their internal structures with little distortion by inter-
actions with coexisting cations.
4.5. Association in Molten Salts
It is well known that associated chemical species or network structures are
formed in melts such as BeCl2, ZnCl2, SiO2, and GeO2. As a typical example,
structural parameters of molten ZnCl2 are listed in Table 5 (Enderby and
Biggin, 1983). The coordination state in molten ZnCl2 is not changed very
much compared with that in solid, reflecting that molten ZnCl2 possesses a
large density comparable with its solid and a little thermal expansion appears
to be detected on melting. There exist ZnCl42� complex ions with stable first
coordination shell and their clustered species in the melt, which provide high
viscosity and low conductivity.
Similar effects are expected to appear in molten salts composed of multi-
valent cations and halide anions. Description according to Eq. (21) is, how-
ever, difficult since there are not enough experimental data. Structural
comprehension by invoking Eq. (21) is attempted as earlier. The structural
parameters of the principal molten salt systems are listed in Tables 6–9. In
particular, the short-range structures of molten lanthanide trihalides are dis-
cussed in detail later.
TABLE 4 Interatomic Distances of N–O and O–O Pairs in NO3� Ions
(Suzuki and Fukushima, 1977; Waseda, 1980b)
N–O (A) O–O (A)
System Liquid Solid Liquid Solid
LiNO3 1.26 1.24 2.09, 2.21 2.15
NaNO3 1.25 1.22 2.17 2.11
KNO3 1.26 1.20, 1.22 2.17 2.09, 2.10
RbNO3 1.25 2.17
CsNO3 1.26 1.22 2.18 2.12
AgNO3 1.27 2.10, 2.22
TlNO3 1.25 1.23 2.14, 2.18 2.13
Ca(NO3)2 1.25 1.22 2.10, 2.20 2.12
Ba(NO3)2 1.24 1.24 2.09, 2.22 2.14
Chapter 260 Structures and Properties of Rare-Earth Molten Salts 103

5. CRYSTAL STRUCTURES OF RARE-EARTH HALIDES
Crystal structures of rare-earth trihalides at ambient temperature and pressure
can be divided into seven classes on the basis of the elementary combinations
of rare earths and halogens. Evolution of the crystal structures is due to the
change in the ratio of ionic radii, r(X�)/r(Ln3þ), where the ionic radii with
sixfold coordination proposed by Shannon are generally employed (Shannon,
1976). Crystal types, lattice constants, and densities of rare-earth trichlorides
and tribromides are summarized by Murase (1999a, 1999b) in Tables 10
and 11, respectively. As described in the previous section, very few papers
TABLE 5 Interionic Distances and Coordination Numbers n in Solid and
Molten ZnCl2 as Determined by X-Ray Diffraction, Unless Otherwise Stated
(Enderby and Biggin, 1983)
Form of
ZnCl2
Zn–Zn Cl–Cl Zn–Cl
Distance A Coord. n Distance A Coord. n Distance A Coord. n
a solid 3.82 4 3.82 8 2.34 4
b solid 3.77 4 3.78 12 2.31 4
g solid 3.70 4 3.70 8 2.27 4
d solid – 4 3.71 12 2.27 5.07
Liquid, 603 K(EXAFS)
– – – – 2.35 4a
Liquid, 596 K(X-ray)
3.66a 4a 3.85a 12a 2.29a 4a
Liquid, 600 K 3.8�0.1 4.7�0.8 3.71�0.02 8.6�0.5 2.29�0.02 4.3�0.3
aValues of the input parameters used in a nearest-neighbor model to give the best fit to the totalX-ray pattern.
TABLE 6 Interatomic Distances (D in nm) and Coordination Number (CN)
of Molten Cupper Monohalides (Shirakawa et al., 1991)
Salt D(Cu–X) (CN)a D(Cu–Cu) (CN) D(X–X) (CN)a
CuCl 0.234 (2.76) 0.321 (8.69) 0.382 (9.33)
CuBr 0.248 (3.03) 0.334 (5.14) 0.405 (10.06) 0.469 (15.99)
CuI 0.264 (3.36) 0.356 (4.61) 0.437 (6.41) 0.485 (14.97)
aX¼Cl, Br, I.
Handbook on the Physics and Chemistry of Rare Earths104

TABLE 7 Nearest-Neighbor Ag–Ag Interatomic Distances (D in nm)
and Coordination Numbers (CN) of Molten Silver Monohalides
(Inui et al., 1991)
Salt D(Ag–Ag) CN
AgCl 0.262 3.7
AgBr 0.272 3.9
AgI 0.290 4.6
TABLE 8 Interatomic Distances (D in nm) and Coordination Numbers (CN)
of Molten Metal Dihalides (Iwadate, 2011)
Salt Atomic pair D (nm) CN References
MgCl2 Mg–Cl 0.221 4 Takagi and Tomita (1993)
Cl–Cl 0.353 n.a.
Mg–Mg 0.433 n.a.
MgCl2 Mg–Cl 0.242 4.3 Biggin et al. (1984)
Cl–Cl 0.356 12
Mg–Mg 0.38 5
CaCl2 Ca–Cl 0.272 5.5 Iwamoto et al. (1982)
Cl–Cl 0.355 7.4
CaCl2 Ca–Cl 0.278 5.4 Biggin and Enderby (1981)
Cl–Cl 0.373 7.8
Ca–Ca 0.360 4.2
MnCl2 Mn–Cl 0.251 4 Ohno et al. (1978b)
Cl–Cl 0.410 10
Mn–Mn 0.500 8
NiCl2 Ni–Cl 0.236 4.7 Newport et al. (1985)
Cl–Cl 0.380 13.8
Ni–Ni 0.400 6.0
NiBr2 Ni–Br 0.247 4.7 Wood and Howe (1988)
Br–Br 0.397 14.0
Ni–Ni 0.370 5.3
Continued
Chapter 260 Structures and Properties of Rare-Earth Molten Salts 105

TABLE 8 Interatomic Distances (D in nm) and Coordination Numbers (CN)
of Molten Metal Dihalides (Iwadate, 2011)—Cont’d
Salt Atomic pair D (nm) CN References
NiI2 Ni–I 0.260 4.2 Wood et al. (1988)
I–I 0.410 13.1
Ni–Ni 0.460 5.3
ZnCl2 Zn–Cl 0.229 4.3 Biggin and Enderby (1981)
Cl–Cl 0.371 8.6
Zn–Zn 0.380 4.7
ZnCl2 Zn–Cl 0.230 3.6 Iwadate et al. (2001a)
Cl–Cl 0.370 9.0
Zn–Zn 0.432 4.0
ZnCl2 Zn–Cl 0.221 3.9 Fukushima et al. (2005)
Cl–Cl 0.355 n.a.
Zn–Zn 0.427 3.8
ZnBr2 Zn–Br 0.240 3.4 Iwadate et al. (2001a)
Br–Br 0.390 6.3
Zn–Zn 0.458 3.6
ZnBr2 Zn–Br 0.239 3.9 Iwadate et al. (2001b)
Br–Br 0.385 6.2
Zn–Zn 0.450 3.9
ZnBr2 Zn–Br 0.243 3.9 Fukushima et al. (2005)
Br–Br 0.387 n.a.
Zn–Zn 0.469 3.8
ZnBr2 Zn–Br 0.241 3.9 Allen et al. (1991)
ZnI2 Zn–I 0.260 4.2 Allen et al. (1991)
SrCl2a Sr–Cl 0.29 6.7 Biggin and Enderby (1981)
Cl–Cl 0.38 10.2
Sr–Sr 0.49 11.3
BaCl2 Ba–Cl 0.310 7.7 Biggin and Enderby (1981)
Cl–Cl 0.386 7
Ba–Ba 0.49 14
Handbook on the Physics and Chemistry of Rare Earths106

TABLE 8 Interatomic Distances (D in nm) and Coordination Numbers (CN)
of Molten Metal Dihalides (Iwadate, 2011)—Cont’d
Salt Atomic pair D (nm) CN References
CoCl2 Co–Cl 0.239 3.90 Takagi and Nakamura (1985)
Cl–Cl 0.380 10.88
Co–Co 0.488 3.60
Co–Cl 0.556 10.90
PbCl2 Pb–Cl 0.280 4.0 Okamoto et al. (2005)
Pb–Cl 0.320 2.5
Cl–Cl 0.366 9.6
Pb–Pb 0.483 10.5
Pb–Cl 0.610 22.5
Pb–Cl 0.284 4.0 Iwadate et al. (2005)
Pb–Cl 0.340 1.9
Cl–Cl 0.369 6.1
Pb–Pb 0.445 9.0
Pb–Cl 0.576 15.1
PbBr2 Pb–Br 0.286 1.9 Iwadate et al. (2005)
Pb–Br 0.315 1.9
Br–Br 0.364 6.8
Pb–Pb 0.442 8.8
Pb–Br 0.597 18.6
BeF2 Be–F 0.159 4.0 Vaslow and Narten (1973)
F–F 0.254 6.0
BeF2 Be–F 0.158 4.0 Umesaki et al. (1991)
F–F 0.258 4.0
Be–Be 0.306 6.0
aSimulated.
Chapter 260 Structures and Properties of Rare-Earth Molten Salts 107
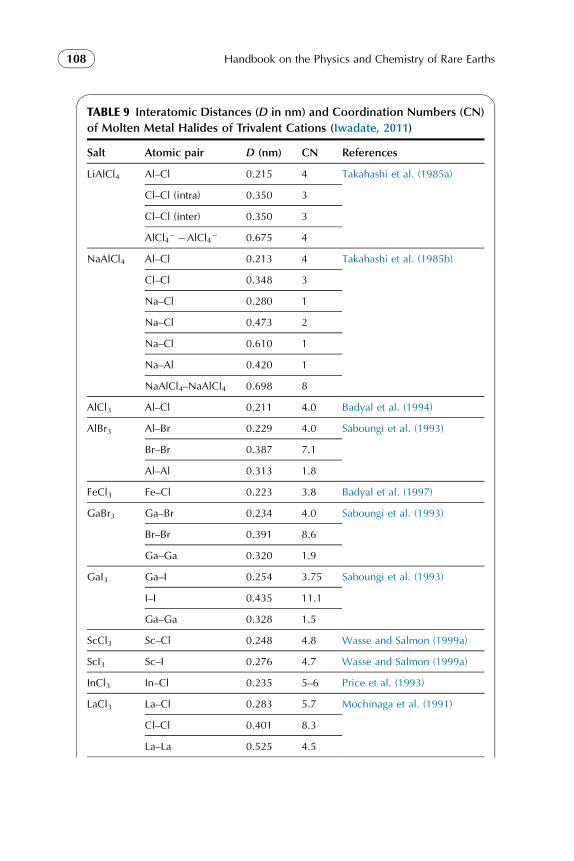
TABLE 9 Interatomic Distances (D in nm) and Coordination Numbers (CN)
of Molten Metal Halides of Trivalent Cations (Iwadate, 2011)
Salt Atomic pair D (nm) CN References
LiAlCl4 Al–Cl 0.215 4 Takahashi et al. (1985a)
Cl–Cl (intra) 0.350 3
Cl–Cl (inter) 0.350 3
AlCl4��AlCl4
� 0.675 4
NaAlCl4 Al–Cl 0.213 4 Takahashi et al. (1985b)
Cl–Cl 0.348 3
Na–Cl 0.280 1
Na–Cl 0.473 2
Na–Cl 0.610 1
Na–Al 0.420 1
NaAlCl4–NaAlCl4 0.698 8
AlCl3 Al–Cl 0.211 4.0 Badyal et al. (1994)
AlBr3 Al–Br 0.229 4.0 Saboungi et al. (1993)
Br–Br 0.387 7.1
Al–Al 0.313 1.8
FeCl3 Fe–Cl 0.223 3.8 Badyal et al. (1997)
GaBr3 Ga–Br 0.234 4.0 Saboungi et al. (1993)
Br–Br 0.391 8.6
Ga–Ga 0.320 1.9
GaI3 Ga–I 0.254 3.75 Saboungi et al. (1993)
I–I 0.435 11.1
Ga–Ga 0.328 1.5
ScCl3 Sc–Cl 0.248 4.8 Wasse and Salmon (1999a)
ScI3 Sc–I 0.276 4.7 Wasse and Salmon (1999a)
InCl3 In–Cl 0.235 5–6 Price et al. (1993)
LaCl3 La–Cl 0.283 5.7 Mochinaga et al. (1991)
Cl–Cl 0.401 8.3
La–La 0.525 4.5
Handbook on the Physics and Chemistry of Rare Earths108

TABLE 9 Interatomic Distances (D in nm) and Coordination Numbers (CN)
of Molten Metal Halides of Trivalent Cations (Iwadate, 2011)—Cont’d
Salt Atomic pair D (nm) CN References
LaCl3a La–Cl 0.269 6 Okamoto and Ogawa (1999b)
Cl–Cl 0.37 n.a.
La–La n.a. n.a.
LaCl3a La–Cl 0.281 6 Okamoto and Ogawa (1999a)
Cl–Cl 0.380 8
La–La 0.500 5
LaBr3a,c La–Br 0.295 6 Okamoto and Ogawa (1999a)
Br–Br 0.375 8
La–La 0.510 5
CeCl3 Ce–Cl 0.284 5.6 Iwadate et al. (1992)
Cl–Cl 0.405 11.3 Mochinaga et al. (1993a)
Ce–Ce 0.521 6.5
PrCl3a Pr–Cl 0.282 5.7 Mochinaga et al. (1991)
Cl–Cl 0.414 11.0
Pr–Pr 0.514 4.8
NdCl3a Nd–Cl 0.277 5.7 Igarashi et al. (1990)
Cl–Cl 0.404 11.3
Nd–Nd 0.508 4.8
GdCl3 Gd–Cl 0.272 5.5 Mochinaga et al. (1991)
Cl–Cl 0.388 10.9 Matsuoka et al. (1993)
Gd–Gd 0.500 5.0
SmCl3 Sm–Cl 0.277 5.7 Mochinaga et al. (1991)
Cl–Cl 0.398 9.0
Sm–Sm 0.506 4.8
TbCl3 Tb–Cl 0.272 6.3 Wasse and Salmon (1999b)
Cl–Cl 0.358 8.1
Tb–Tb n.a. n.a.
DyCl3b Dy–Cl 0.269 5.7 Mochinaga et al. (1991)
Cl–Cl 0.382 8.9 Mochinaga et al. (1993b)
Dy–Dy 0.490 4.5
Continued
Chapter 260 Structures and Properties of Rare-Earth Molten Salts 109

have yet reported structural investigations of molten rare-earth fluorides and mol-
ten rare-earth iodides by diffraction techniques and thus the corresponding crystal-
lographic data are not discussed here. Four types of crystal structures are known for
rare-earth trichlorides. The crystals of LaCl3 to GdCl3 have hexagonal UCl3-type
structure, and those of YCl3 and DyCl3 to LuCl3 possess monoclinic AlCl3-type
TABLE 9 Interatomic Distances (D in nm) and Coordination Numbers (CN)
of Molten Metal Halides of Trivalent Cations (Iwadate, 2011)—Cont’d
Salt Atomic pair D (nm) CN References
HoCl3 Ho–Cl 0.276 6.4 Wasse and Salmon (1999b)
Cl–Cl 0.359 8.1
Ho–Ho n.a. n.a.
ErCl3 Er–Cl 0.263 5.8 Iwadate et al. (1994)
Cl–Cl 0.375 8–9
Er–Er 0.405 1–2
ErCl3 Er–Cl 0.274 5.6 Wasse and Salmon (1999b)
Cl–Cl 0.358 8.9
Er–Er n.a. n.a.
YCl3 Y–Cl 0.271 5.9 Saboungi et al. (1991)
Cl–Cl 0.364 8.2
Y–Y n.a. n.a.
YCl3 Y–Cl 0.269 5.9 Okamoto et al. (1996)
Cl–Cl 0.359 n.a.
Y–Y n.a. n.a.
YCl3 Y–Cl 0.272 5.7 Wasse and Salmon (1999b)
Cl–Cl 0.355 7.8
Y–Y n.a. n.a.
UCl3a U–Cl 0.284 6 Okamoto et al. (1998)
Cl–Cl 0.402 8
U–U 0.520 5
U–Cl 0.580 8
aFor LaCl3, PrCl3, NdCl3, UCl3, and LaBr3 pure melts, each nearest-neighbor coordination numberof RE has been reported to be about 6. See Okamoto et al. (1999).bThe nearest-neighbor coordination number of Dy has been calculated to be about 6 by MDsimulation. See Takagi et al. (1999).cFor LaBr3, CeBr3, DyBr3, and YBr3 pure melts, nearest-neighbor coordination numbers of RE havebeen simulated at 7.1, 7.4, 6.2, and 6.2, respectively. See Hutchinson et al. (2000).
Handbook on the Physics and Chemistry of Rare Earths110
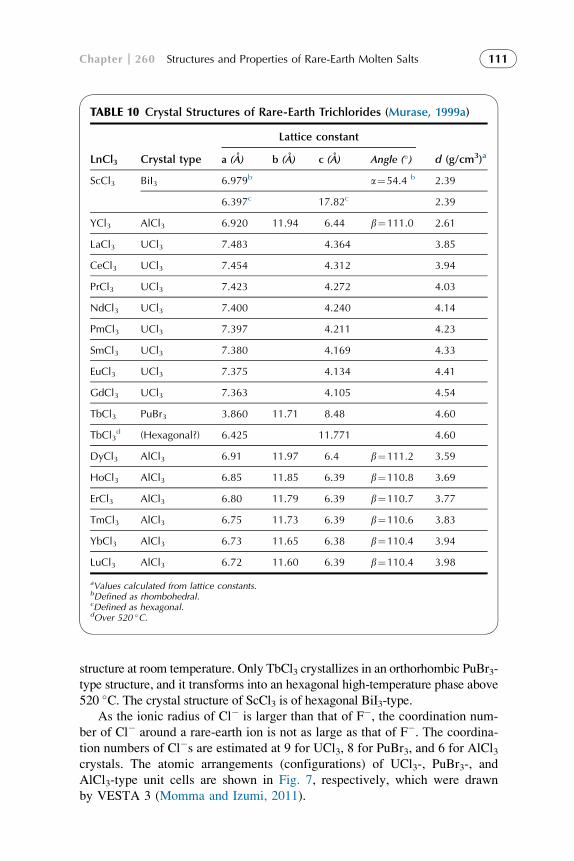
structure at room temperature. Only TbCl3 crystallizes in an orthorhombic PuBr3-
type structure, and it transforms into an hexagonal high-temperature phase above
520 �C. The crystal structure of ScCl3 is of hexagonal BiI3-type.As the ionic radius of Cl� is larger than that of F�, the coordination num-
ber of Cl� around a rare-earth ion is not as large as that of F�. The coordina-tion numbers of Cl�s are estimated at 9 for UCl3, 8 for PuBr3, and 6 for AlCl3crystals. The atomic arrangements (configurations) of UCl3-, PuBr3-, and
AlCl3-type unit cells are shown in Fig. 7, respectively, which were drawn
by VESTA 3 (Momma and Izumi, 2011).
TABLE 10 Crystal Structures of Rare-Earth Trichlorides (Murase, 1999a)
LnCl3 Crystal type
Lattice constant
d (g/cm3)aa (A) b (A) c (A) Angle (�)
ScCl3 BiI3 6.979b a¼54.4 b 2.39
6.397c 17.82c 2.39
YCl3 AlCl3 6.920 11.94 6.44 b¼111.0 2.61
LaCl3 UCl3 7.483 4.364 3.85
CeCl3 UCl3 7.454 4.312 3.94
PrCl3 UCl3 7.423 4.272 4.03
NdCl3 UCl3 7.400 4.240 4.14
PmCl3 UCl3 7.397 4.211 4.23
SmCl3 UCl3 7.380 4.169 4.33
EuCl3 UCl3 7.375 4.134 4.41
GdCl3 UCl3 7.363 4.105 4.54
TbCl3 PuBr3 3.860 11.71 8.48 4.60
TbCl3d (Hexagonal?) 6.425 11.771 4.60
DyCl3 AlCl3 6.91 11.97 6.4 b¼111.2 3.59
HoCl3 AlCl3 6.85 11.85 6.39 b¼110.8 3.69
ErCl3 AlCl3 6.80 11.79 6.39 b¼110.7 3.77
TmCl3 AlCl3 6.75 11.73 6.39 b¼110.6 3.83
YbCl3 AlCl3 6.73 11.65 6.38 b¼110.4 3.94
LuCl3 AlCl3 6.72 11.60 6.39 b¼110.4 3.98
aValues calculated from lattice constants.bDefined as rhombohedral.cDefined as hexagonal.dOver 520 �C.
Chapter 260 Structures and Properties of Rare-Earth Molten Salts 111

TABLE 11 Crystal Structures of Rare-Earth Tribromides (Murase 1999b)
LnBr3 Crystal type
Lattice constant
d (g/cm3)aa (A) b (A) c (A) Angle a(�)
ScBr3 BiI3 7.352b 53.83b 3.91
6.665c 18.838c
YBr3 BiI3 7.575b 55.67b 3.95
7.072c 19.150c
LaBr3 UCl3 7.971 4.522 5.07
CeBr3 UCl3 7.952 4.444 5.18
PrBr3 UCl3 7.939 4.389 5.28
NdBr3 PuBr3 4.115 12.659 9.158 5.35
PmBr3 PuBr3 4.08 12.650 9.12 5.45
SmBr3 PuBr3 4.042 12.706 9.124 5.59
EuBr3 PuBr3 4.015 12.638 9.099 5.63
GdBr3 BiI3 7.633b 56.40b 4.57
7.216c 19.189c
TbBr3 BiI3 7.608b 56.13b 4.66
7.159c 19.163c
DyBr3 BiI3 7.592b 55.83b 4.78
7.107c 19.161c
HoBr3 BiI3 7.576b 55.67b 4.86
7.072c 19.150c
ErBr3 BiI3 7.568b 55.47b 4.93
7.045c 19.148c
TmBr3 BiI3 7.540b 55.36b 5.02
7.005c 19.092c
YbBr3 BiI3 7.540b 55.17b 5.11
6.973c 19.086c
LuBr3 BiI3 7.527b 55.00b 5.17
6.950c 19.109c
aValues calculated from lattice constants.bDefined as rhombohedral.cDefined as hexagonal.
Handbook on the Physics and Chemistry of Rare Earths112
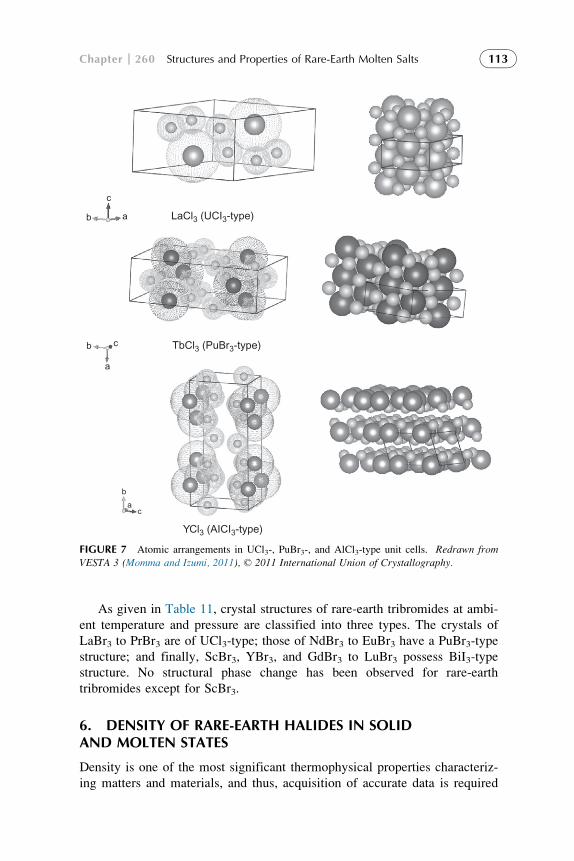
As given in Table 11, crystal structures of rare-earth tribromides at ambi-
ent temperature and pressure are classified into three types. The crystals of
LaBr3 to PrBr3 are of UCl3-type; those of NdBr3 to EuBr3 have a PuBr3-type
structure; and finally, ScBr3, YBr3, and GdBr3 to LuBr3 possess BiI3-type
structure. No structural phase change has been observed for rare-earth
tribromides except for ScBr3.
6. DENSITY OF RARE-EARTH HALIDES IN SOLIDAND MOLTEN STATES
Density is one of the most significant thermophysical properties characteriz-
ing matters and materials, and thus, acquisition of accurate data is required
LaCl3 (UCI3-type)b
c
a
a
b
b
ac
c TbCl3 (PuBr3-type)
YCl3 (AICI3-type)
FIGURE 7 Atomic arrangements in UCl3-, PuBr3-, and AlCl3-type unit cells. Redrawn from
VESTA 3 (Momma and Izumi, 2011), © 2011 International Union of Crystallography.
Chapter 260 Structures and Properties of Rare-Earth Molten Salts 113

as the most important parameter for not only industrial designing but also the-
oretical examinations on structures of molten salts, derivation of other ther-
modynamic properties, and correlation of various thermophysical properties.
A fairly large number of density data are available for molten salts, but there
are plenty of problems to be solved with respect to data reliability and ranges
of temperature and pressure.
In general, the density r is approximated as a linear function of tempera-
ture as described in Eq. (22). This is a rule of thumb with no theoretical basis.
The molar volume Vm is calculated from the density data according to
Eq. (23), and the coefficient of expansion b is derived by using Eq. (24).
r¼ a�bT ð22Þ
Vm¼M
rð23Þ
b¼ 1
V� @V
@T
�p
¼ b
rð24Þ
where M is the molar mass, T the temperature, a and b the least-squares fitted
constants.
The molar volumes of rare-earth halides in solid and molten states are esti-
mated from their respective density data, leading to the volume changes upon
melting. This property is very fundamental and plays a crucial role in
understanding the structure of molten salts, as is described in details in
subsequent sections. The principles pertaining to density measurement of
molten salts are quite simple and an instrumental prototype is sketched in
Fig. 8 (Janz et al., 1972).
Two techniques of density measurement, such as the Archimedes method
and the dilatometric method, have been employed at elevated temperatures.
The former makes use of the principle that the upthrust experienced by a body
wholly or partially immersed in a fluid is equal to the weight of fluid dis-
placed. In studies of molten salts, a plummet of platinum or gold–palladium
alloy suspended from a balance pan by a thin platinum wire has frequently
been utilized. A typical apparatus of this kind is shown, complete with fur-
nace, in Fig. 8. The Archimedes method has the advantage of applicability
to temperatures higher than 1270 K and to more corrosive melts. The adhe-
sion of melt to and the condensation of vapor on the suspending wire are
potential difficulties which must be closely watched (Bell and Flengas,
1964; Bloom et al., 1953; Edwards et al., 1952; Neithamer and Peake,
1961; Peake and Bothwell, 1954; Spooner and Wetmore, 1951).
Dilatometers made of glassy materials have been used below 820 K (Pyrex)
or 1020 K (silica); an apparatus of this type is also illustrated in Fig. 8. An alter-
native is the approach by Husband (Husband, 1958) and by the groups of
Frame and Gebhardt (Frame et al., 1959; Gebhardt and Becker, 1943) who
Handbook on the Physics and Chemistry of Rare Earths114

used the manometric technique in which one measures the pressure of an inert
gas required to bring about a known difference in height between two
columns of the liquid. A difficulty encountered in dilatometry is the maintenance
of constant temperature over a relatively great length of the furnace core. Both
this problem and that of corrosion become more serious at higher temperatures.
For molten pure rare-earth halides, a limited number of data are available
(Janz et al., 1968; Janz et al., 1975), since there are many problems with
respect to their reliability due to hygroscopy of rare-earth chlorides and their
reactions with water content to produce oxychlorides at elevated temperatures
as well as the maintenance of constant temperature in the long furnace. The
volume change on melting is subsequently easily evaluated from the above
molar volumes of solid and melt. This change is expected to reflect the melt
FIGURE 8 Experimental techniques for the measurement of density. (a) Archimedes apparatus: A,
density plummet; B, thermocouple; C, inlet for controlled atmospheres. (b) Density plummet design:
(The tip is designed to known dimensions for surface tension measurements using the detachment
technique.) (c) Dilatometer and loading tube: A, loading tube filled with salt and sealed; B and
C, constrictions for vacuum seals; F, fritted disk; G, graduated dilatometer stem. (d) Dilatometer
and support assembly: G, dilatometer stem; L, locking pins in aluminum block; M, aluminum block
(two sections); S, support rods (hollow); TC, thermocouple well. Reproduced with permission from
Janz et al. (1972), © 1972 American Institute of Physics.
Chapter 260 Structures and Properties of Rare-Earth Molten Salts 115

structure very well, as described in Table 1 as well as Eq. (21) for alkali
halides. The empirical density equations of molten rare-earth trihalides are
tabulated in Table 12, from which the densities at 1100 K are estimated for
comparison by interpolation or extrapolation. At first approximation and
except for fluorides, the r values increase with increasing atomic weights of
constituent ions, as a first approximation. The irregularity of molten fluorides
TABLE 12 Recommended Density Equations for Molten Rare-Earth Halides
(r and T are in g cm�3 and K, respectively)
Salt
r¼a�bTTemperature
range
r(1100 K)
(g cm�3) Referencesa b�103
LaF3 5.793 0.682 1750–2450 5.793 Kirshenbaum et al.(1960)
CeF3 6.253 0.936 1700–2200 5.223 Kirshenbaum et al.(1960)
ScCl3 r¼1.67 1213 K n.a. Klemm (1926)
r¼1.63 1273 K n.a.
YCl3 3.007 0.50 998–1118 2.457 Klemm (1926)
LaCl3 4.0895 0.7774 1146–1246 3.2344 Yaffe and vanArtsdalen (1956)
CeCl3 4.248 0.920 1123–1223 3.236 Mellors andSenderoff (1960)
PrCl3 4.0120 0.74165 1120–1250 3.196 Cho et al. (1972)
NdCl3 4.2642 0.93014 1090–1270 3.2410 Cho et al. (1972)
GdCl3 4.1491 0.67139 940–1280 3.4106 Cho et al. (1972)
DyCl3 4.2668 0.6821 980–1260 3.5165 Cho et al. (1972)
LaBr3 5.0351 0.096 1069–1185 4.9295 Yaffe and vanArtsdalen (1956)
NdBr3 4.9750 0.7779 968–1133 4.119 Yaffe and vanArtsdalen (1956)
Lal3 5.4581 1.1109 1124–1182 4.2361 Kutscher andSchneider (1974)
Ndl3 5.4069 1.0701 1111–1193 4.2298 Kutscher andSchneider (1974)
Gdl3 5.2097 0.9086 1254–1306 4.2102 Kutscher andSchneider (1974)
Handbook on the Physics and Chemistry of Rare Earths116

might be due to good packing of ions, complex ions, and/or clusters in the
melts, reflecting the very high melting points.
In many practical cases, molten salts are utilized under the form of multi-
component mixed melts. When the densities of pure melts are known, those of
their mixtures can be evaluated on the assumption that the additivity rule is
applicable to the molar volume. The density of a mixed melt rm is formulated
as follows,
rm¼P
xiMiPxiVi
¼P
xiMiPxiMi
ri
ð25Þ
where xi refers to the mole fraction, Vi is the molar volume, and Mi the molar
mass of the ith pure melt, respectively.
As for the densities of molten mixtures of rare-earth trihalides with
alkali halides, there have been plenty of data collected up to now; they are
listed in Tables 13–21 under the form of a linear function of temperature,
rm¼a–bT.For a mixed melt having interionic interactions similar to those in pure
melts, the additivity rule holds well enough to estimate the density or the
molar volume of the mixture. Unfortunately, such ideal mixtures are rarely
found in real systems. This might be due to transformations occurring in the
melt upon mixing, for instance, the formation of complex species. In many
cases, complex formation occurs easily in mixed melts composed of multiva-
lent cations and halide anions as central ions and ligands, respectively
(Nakamura, 1983). One has so far been inclined to consider whether observa-
tion of deviations between the measured molar volumes of the mixture
melts and the additivity rule offers or not a useful criterion for unraveling
TABLE 13 Density of Molten LiCl–LaCl3 System Versus Composition
and Temperature (Kim et al., 1987)
LaCl3 (mol%) rm (g cm�3) T range (K)
12.0 2.476–5.311�10�4T 840–1211
24.0 2.917–6.324�10�4T 1008–1217
35.5 3.251–6.987�10�4T 993–1217
56.0 3.671–7.798�10�4T 1109–1215
61.0 3.727–7.713�10�4T 1031–1218
81.5 3.953–7.850�10�4T 1088–1215
86.0 4.011–8.091�10�4T 1102–1218
100.0 4.154–8.326�10�4T 1146–1218
Chapter 260 Structures and Properties of Rare-Earth Molten Salts 117

the existence of complex ions as well as for estimating their stabilities. The
final decision concerning the formation of complicated species such as com-
plex ions, clustered ions, molecules, and so on in the melts should be made
according to direct observations of near-neighbor structures, namely, diffrac-
tion works and Raman spectroscopic measurements as will be described later.
7. STRUCTURES OF RARE-EARTH HALIDE MELTS
Physical and chemical properties of rare-earth compounds have usually been
thought to be similar, since there are very small differences in ionic radii.
TABLE 15 Density of Molten KCl–LaCl3 System Versus Composition
and Temperature (Kim et al., 1987)
LaCl3 (mol%) rm (g cm�3) T range (K)
11.5 2.418–6.057�10�4T 978–1204
24.5 2.711–6.461�10�4T 909–1213
38.0 2.941–6.394�10�4T 970–1216
50.5 3.306–7.622�10�4T 1115–1202
63.5 3.563–7.908�10�4T 1139–1203
76.0 3.783–8.129�10�4T 1141–1210
88.0 3.966–8.159�10�4T 1110–1218
TABLE 14 Density of Molten NaCl–LaCl3 System Versus Composition
and Temperature (Kim et al., 1987)
LaCl3 (mol%) rm (g cm�3) T range (K)
11.5 2.599–6.579�10�4T 1028–1221
24.5 2.944–6.926�10�4T 890–1196
36.5 3.226–7.373�10�4T 1059–1221
49.5 3.450–7.497�10�4T 1091–1221
62.0 3.658–7.734�10�4T 1119–1221
76.0 3.857–7.947�10�4T 1089–1221
87.0 3.995–8.125�10�4T 1109–1221
Handbook on the Physics and Chemistry of Rare Earths118

As mentioned in Sections 5 and 6, some differences which could not be dis-
regarded are really found even in the crystal structures of rare-earth halides
and in their densities in solid and molten states. Accordingly, local or short-
range structures of rare-earth halides have to be clarified in the first place.
Up to now, numerous works have been published which report the structure
of aqueous solutions containing rare-earth ions, but the number of works on
the melt structures is quite limited to halides. As for the techniques to inves-
tigate the local structure of melt, potential tools can be divided broadly into
three categories. The first is comprised of diffraction methods such as XRD
TABLE 17 Density of Molten NaCl–CeCl3 System Versus Composition
and Temperature (Sato and Yamamura, 1992)
CeCl3 (mol%) rm (g cm�3) T range (K)
12.0 2.564–6.047�10�4 T 1023–1134
24.5 2.945–6.826�10�4 T 910–1137
37.0 3.276–7.625�10�4 T 986–1138
50.0 3.508–7.764�10�4 T 989–1143
61.5 3.715–8.067�10�4 T 1010–1131
73.0 3.875–8.237�10�4 T 1019–1136
85.0 3.972–8.001�10�4 T 1042–1135
100.0 4.012–7.183�10�4 T 1046–1145
TABLE 16 Density of Molten CsCl–LaCl3 System Versus Composition
and Temperature (Kim et al., 1987)
LaCl3 (mol%) rm (g cm�3) T range (K)
12.0 3.708–9.726�10�4T 908–1213
25.0 3.714–9.377�10�4T 1072–1219
40.0 3.753–9.064�10�4T 1015–1217
51.5 3.849–9.198�10�4T 875–1208
64.0 3.918–8.911�10�4T 1148–1215
77.5 4.053–9.107�10�4T 1090–1112
90.5 4.127–8.826�10�4T 1113–1217
Chapter 260 Structures and Properties of Rare-Earth Molten Salts 119
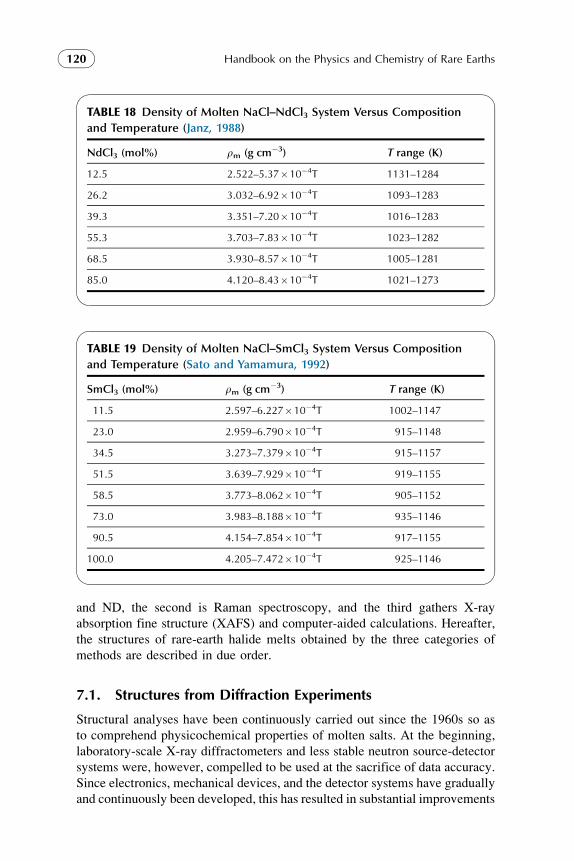
and ND, the second is Raman spectroscopy, and the third gathers X-ray
absorption fine structure (XAFS) and computer-aided calculations. Hereafter,
the structures of rare-earth halide melts obtained by the three categories of
methods are described in due order.
7.1. Structures from Diffraction Experiments
Structural analyses have been continuously carried out since the 1960s so as
to comprehend physicochemical properties of molten salts. At the beginning,
laboratory-scale X-ray diffractometers and less stable neutron source-detector
systems were, however, compelled to be used at the sacrifice of data accuracy.
Since electronics, mechanical devices, and the detector systems have gradually
and continuously been developed, this has resulted in substantial improvements
TABLE 19 Density of Molten NaCl–SmCl3 System Versus Composition
and Temperature (Sato and Yamamura, 1992)
SmCl3 (mol%) rm (g cm�3) T range (K)
11.5 2.597–6.227�10�4T 1002–1147
23.0 2.959–6.790�10�4T 915–1148
34.5 3.273–7.379�10�4T 915–1157
51.5 3.639–7.929�10�4T 919–1155
58.5 3.773–8.062�10�4T 905–1152
73.0 3.983–8.188�10�4T 935–1146
90.5 4.154–7.854�10�4T 917–1155
100.0 4.205–7.472�10�4T 925–1146
TABLE 18 Density of Molten NaCl–NdCl3 System Versus Composition
and Temperature (Janz, 1988)
NdCl3 (mol%) rm (g cm�3) T range (K)
12.5 2.522–5.37�10�4T 1131–1284
26.2 3.032–6.92�10�4T 1093–1283
39.3 3.351–7.20�10�4T 1016–1283
55.3 3.703–7.83�10�4T 1023–1282
68.5 3.930–8.57�10�4T 1005–1281
85.0 4.120–8.43�10�4T 1021–1273
Handbook on the Physics and Chemistry of Rare Earths120

in the apparatuses. Examples of new and performing setups are the high-energy
monochromatic X-ray beam line with a diffractometer at SPring-8 (synchrotron
radiation facility “Super Photon ring-8 GeV”) and the pulsed neutron sources
with high-precision detectors at KEK (High Energy Accelerator Research Orga-
nization) or J-Parc (Japan Proton Accelerator Research Complex) in Japan.
Therefore, accurate measurements of the melt structures are now within
feasibility. Similar apparatuses are also operating at ESRF and ILL (Institut
Laue–Langevin) in France, APS (advanced photon source) and SNS (spallation
neutron source) in the United States, ISIS (centre for research at the Rutherford
Appleton Laboratory; pulsed neutron and muon source) in the United Kingdom,
and in several other countries.
Pioneering works on the structures of molten rare-earth chlorides have
been done by Saboungi et al. (1991) and Mochinaga et al. (1991) in the early
1990s. The former researchers have reported a ND study of the liquid struc-
ture of YCl3 and combined the structural data with macroscopic melting
and transport data to compare the behavior of this molten salt with those of
TABLE 20 Density of Molten LiF–YF3 System Versus Composition
and Temperature (Janz, 1988)
YF3 (mol%) rm (g cm�3) T range (K)
0.0 2.074–3.321�10�4T 1140–1340
19.0 3.254–5.595�10�4T 980–1340
30.0 3.695–6.672�10�4T 1080–1340
40.0 3.902–6.154�10�4T 1080–1340
50.0 4.287–7.216�10�4T 1120–1340
60.0 4.174–5.065�10�4T 1220–1340
TABLE 21 Density of Molten LiF–LaF3 System Versus Composition
and Temperature (Janz, 1988)
LaF3 (mol%) rm (g cm�3) T range (K)
5.0 2.491–3.648�10�4T 1140–1350
10.0 2.799–3.118�10�4T 1180–1350
15.0 3.500–6.658�10�4T 1110–1350
20.0 3.737–6.486�10�4T 1130–1350
25.0 3.799–5.507�10�4T 1130–1350
Chapter 260 Structures and Properties of Rare-Earth Molten Salts 121

SrCl2, ZnCl2, and AlCl3 as prototypes of different melting mechanisms for
ionic materials. DyCl3, HoCl3, and ErCl3 melts have very similar structure
to YCl3, thus confirming the earlier suggestion of a similarity of structural
behavior for these systems in the liquid phase. A novel melting mechanism
for trivalent metal chlorides, leading to a loose disordered network of edge-
sharing octahedral units in the liquid phase, has been thereby established.
The various melting behaviors were related to bonding character with the help
of Pettifor’s phenomenological chemical scale (Pettifor, 1986). These findings
were in good agreement with Papatheodorou’s suggestion obtained from an
extensive Raman scattering study of YCl3 that the structure of the melt may
be a network of distorted chlorine-sharing octahedra (Papatheodorou, 1977).
In the first place, this suggestion emerged from a comparison of the Raman
spectra of pure liquid and solid YCl3 as well as from a series of measurements
on mixtures of YCl3 and alkali chlorides, in which Raman modes of YCl6octahedra were observed in stoichiometric mixed crystals at room temperature
and monitored first up to and across melting and then as a function of the
YCl3 content in the liquid mixture up to the pureYCl3 melt.
In the latter report (Mochinaga et al., 1991), the structures of a series of LaCl3,
CeCl3, PrCl3, NdCl3, GdCl3, DyC13, and SmCl3 pure melts were systematically
studied with a laboratory-scale X-ray diffractometer. In these rare-earth chloride
melts, the existence of six chloride ions as the nearest neighbors surrounding a
rare-earth cation was deduced from the interatomic distance ratio of r(Cl–Cl)/r(R–Cl); interatomic distances as well as the coordination numbers of the rare-
earth ions are listed in Table 9. Interpretation of Raman spectra also showed in
the same report that the chloride ions and the rare-earth cations form octahedral
complex anions RCl63� (R¼La, Ce, Pr, Nd, Gd, Dy, and Sm). Taking account
of the low equivalent electrical conductivities and the separation between the
nearest cations R3þ–R3þ in the results of X-ray analysis of these melts, the exis-
tence of dimers or more polymeric complex anions may be alleged. As an exam-
ple, parameters obtained from XRD data of pure DyCl3 melt are shown in
Figs. 9–11. The calculation procedure is the same as described before. The three
nearest-neighbor ion pairs R3þ–Cl�, R3þ–R3þ, and Cl�–Cl� were assumed to
follow a Gaussian distribution with a mean square displacement 2bij from the
peak positions rij, and the quantities nij, rij, and bij could be obtained by least-
squares fitting of Debye equation for the reduced intensity function S � i(S).We also briefly describe results obtained by other experimental techni-
ques. The Raman spectra of pure molten YCl3, DyCl3, GdCl3, PrCl3, and
LaCl3 are illustrated in Fig. 12. The normal modes of vibration of octahedral
XY6-type chemical species are schematically presented in Fig. 13, where only
the vibrational modes n1, n2, and n5 are Raman active (Nakamoto, 1978). The
typical Raman peaks on the Rayleigh wings for the respective melts are
observed in the wavenumber range of about 140 to 300 cm�1, correspondingto the stretching vibration mode, n1, of octahedral XY6 species. The weak
bending modes are barely detectable at lower wavenumbers.
Handbook on the Physics and Chemistry of Rare Earths122

FIGURE 10 Correlation function C(r) for DyCl3 melt. Reproduced with permission fromMochinaga et al. (1991), © 1991 Trans Tech Pub.
0
2
4
6
80
3
6
9
1 2 3 4 5
10
12
14
1 2 3 4 5
r (Å)
r (Å)
D(r
) (Å
-1)
r-1 .
D(r
).10
-3 Å
-2
6 7 8 9 10
FIGURE 9 Radial distribution function D(r) for DyCl3 melt. Reproduced with permission from
Mochinaga et al. (1991), © 1991 Trans Tech Pub.
Chapter 260 Structures and Properties of Rare-Earth Molten Salts 123

FIGURE 11 Reduced intensity function S � i(S) for DyCl3 melt. Reproduced with permissionfrom Mochinaga et al. (1991), © 1991 Trans Tech Pub.
440 360 280
LaCl3
PrCl3
GdCl3
YCl3
DyCl3
Wavenumber (cm-1)
Inte
nsity
(A
rbitr
ary
unit)
200 120 40
FIGURE 12 Raman spectra of several rare-earth chloride melts. Reproduced with permissionfrom Mochinaga et al. (1991), © 1991 Trans Tech Pub.
Handbook on the Physics and Chemistry of Rare Earths124

Conventional molecular dynamics simulation was also carried out to
investigate the local structure of molten DyCl3, using the simple Born–
Mayer–Huggins-type potentials in which parameters were determined so as
to reproduce the interference function S � i(S) of the melt. The octahedral coor-
dination of the cations was ascertained from the angular distribution of —Cl�–Dy3þ–Cl�, in which strong correlations were obtained at about y¼90� and180� as given in Fig. 14. The distances between the nearest-neighbor cations,
r(R3þ–R3þ), in Table 9 are commonly less than twice the distance of r(R3þ–Cl�). Under the assumption that the octahedral species are linked through at
least one or two Cl� ions, that is corner- or edge-sharing, with each other,
the above facts are consistent with this geometry and the —R3þ–Cl�–R3þ
angles listed in Table 22 indicate bent, not linear, configurations of the octa-
hedra. These data are in line with the possibility that clusters consisting of
dimeric or more polymeric complex anions RCl63� exist in pure RCl3 melts.
The most probable model is illustrated in Fig. 15.
As a consequence, the formation of clusters determines the physicochemi-
cal properties of molten rare-earth halides. As a typical example, the electrical
conduction of molten chlorides is briefly discussed. The molar conductivities,
formerly called equivalent electrical conductivities, of KCl, NaCl, CaCl2,
ZnCl2, and RCl3 melts so far measured are shown in Fig. 16 (Janz et al.,
1968). The molar conductivities of RCl3 melts are much smaller than that
Y
YY
Y
Y
Y
n(XY)
n1(A1g)
d (YXY)
n4(F1u)
d (YXY)
n5(F2g)
d (YXY)
n6(F2u)
n(YXY)
n2(Eg)n(XY)n3(F1u)
X
FIGURE 13 Normal modes of vibrations of octahedral XY6-type chemical species. Reproduced
with permission from Nakamoto (1978), © 1978 John Wiley & Sons.
Chapter 260 Structures and Properties of Rare-Earth Molten Salts 125

of the CaCl2 melt in which similar octahedral complex anions CaCl64� exist.
ZnCl2 has a highly developed network structure in the molten state, and thus,
its electrical conductivity is known to be very low. The electrical conductiv-
ities of RCl3 melts are in the middle range between those of low-conductive
ZnCl2 and high-conductive KCl and NaCl melts.
FIGURE 14 Angular distribution of the Cl�–Dy3þ–Cl� angle simulated by molecular dynamics.
Reproduced with permission from Mochinaga et al. (1991), © 1991 Trans Tech Pub.
TABLE 22 Average Angles R3þ–Cl�–R3þ estimated from XRD data
(Mochinaga et al., 1991)
RCl3 melt —R3þ–Cl�–R3þ(�)
LaCl3 135
CeCl3 130
PrCl3 128
NdCl3 133
GdCl3 134
DyCl3 131
SmCl3 132
Handbook on the Physics and Chemistry of Rare Earths126

After confirmation from Raman scattering experiments on molten CeCl3that octahedral CeCl6
3� exists, a somewhat detailed discussion has been made
on the medium range structure of this melt (Iwadate et al., 1992). The density
of molten CeCl3 dilatometrically measured at 1143 K amounts to
3.193 g cm�3, corresponding to a molar volume of 77.19 cm3 mol�1. Assum-
ing that the Ce3þ ions are homogeneously distributed in the melt, the mean
interionic Ce3þ–Ce3þdistance is calculated to be 5.04 A. But the most
FIGURE 15 Most probable model for dimeric ions R2Cl115�. Black circles: R; empty circles: Cl.
Reproduced with permission from Mochinaga et al. (1991), © 1991 Trans Tech Pub.
600
300ZnCl2
LaCl3
CaCl2
NaCl
KCl
ZnCl2
PrCl3GdCl3DyCl3
50
L (
10-4
Sm
2 mol-1
)
100
150
500
t (�C)
700
800 1000
FIGURE 16 Molar conductivities of several molten salts. Reproduced with permission from
Mochinaga et al. (1991), © 1991 Trans Tech Pub.
Chapter 260 Structures and Properties of Rare-Earth Molten Salts 127

probable interionic distance for Ce3þ–Ce3þ pairs reported in Table 23 is
5.21 A, that is about 3.4% larger. This fact indicates that there is some special
interaction between CeCl63� complex ions.
When two discrete CeCl63� ions approach each other as closely as possible,
the shortest Ce3þ–Ce3þ distance is estimated to 6.04 A by considering the steric
hindrance of Cl� ions and the equality of intraionic and interionic Cl�–Cl�
distances, both of which are undistinguishable in the modeling of the S � i(S)function (see Fig. 17). Therefore, the real medium range melt structure is prob-
ably not composed of discrete CeCl63� octahedra.
Another model was therefore considered, named edge-sharing model and
in which two octahedra share two Cl� ions and form, for example,
Ce2Cl104� dinuclear decahalides. From short-range XRD analysis and Raman
spectra, the Cl�–Ce3þ–Cl�angles and the Ce3þ–Cl� and Cl�–Cl� distances
were calculated to be 90�, 2.84 A, and 4.05 A, respectively. The Ce3þ–Ce3þ
FIGURE 17 Reduced intensity function S � i(S) for molten CeCl3. Reproduced with permission
from Iwadate et al. (1992), © 1992 Chiba University.
TABLE 23 Coordination Numbers nik, Interionic Distances rik, and
Root-Mean Square Displacements h△rik2i1/2 for Molten CeCl3
(Iwadate et al., 1992)
i k nik rik (A) h△rik2i1/2 (A)
Ce3þ Cl� 5.6 2.84 0.249
Cl� Cl� 11.3 4.05 0.573
Ce3þ Ce3þ 6.5 5.21 0.660
Handbook on the Physics and Chemistry of Rare Earths128
distance should be, thus, close to 4.0 A, but the observed value is 5.21 A, indi-
cating that the edge-sharing model is also not a good approximation for the
CeCl3 melt.
In the third, corner-sharing model, two octahedra share one Cl� ion and
form a Ce2Cl115� ion. When the Ce3þ–Cl�–Ce3þ configuration is linear, the
interionic Ce3þ–Ce3þ distance is the same as the sum of the respective ionic
radii, 5.64 A according to Shannon (1976). This value is indeed greater than
5.21 A, but if the Ce3þ–Cl�–Ce3þ angle is set to 133.1�, the corner-sharing
model becomes valid as shown in Fig. 15. In the same manner, trimer, tetramer,
and larger polymeric ions, denoted CenCl 5nþ1ð Þ 2nþ1ð Þ�, may exist in the melt.
As can be seen from the general form of the polymer, a linear configuration
does not satisfy the CeCl3 stoichiometry and values of the Cl/Ce ratio approach
5 when linear polymerization occurs. Therefore, clustering of octahedra as pre-
dicted by the corner-sharing model and the existence of polymeric ions seem to
be needed in order to reduce the Cl/Ce ratio down to the stoichiometric ratio 3
and to reconcile the structural model with the whole set of experimental data.
Additionally, this type of ionic bond has been thought to be not necessarily
rigid, that is, to break and form again in a kinetic process. It may be concluded
from the above discussion and in view of other physicochemical data that
polymeric ions and their clustering exist in the CeCl3 melt.
Tosi et al. have published a series of excellent papers titled Ordering inMetal Halide Melts (Tosi et al., 1993), Melting and Liquid Structure of Poly-valent Metal Halides (Tosi, 1994a), Structure of Covalent Liquids (Tosi,
1994b), and The Molten State of Trivalent Metal Halides and Oxides: RecentProgress (Akdeniz et al., 1998). In particular, the ordering of trihalide melts
and the network formation are mentioned in these reviews. As stated before,
several research groups interested in molten salts have carried out determina-
tions of liquid structures for several trivalent metal halides based on measure-
ments of total X-ray and ND patterns. They focus on two main themes: (i) the
trend from cation-dominated Coulomb ordering to loose network structures
across the series of sixfold-coordinated rare-earth chlorides, including YCl3and (ii) the competition between network formation and stabilization of
molecular-type liquid structures with strong intermolecular correlations, as
in associated molecular liquids. The overall structural evolution as the
trivalent metal ion is changed is governed by the increasing weight of cova-
lency versus ionicity. The macroscopic properties reported for trichlorides
reflect melting mechanisms that are consistent with the observed liquid
structures. Progressive network formation in the melt from LaCl3 to YCl3 is
signaled by decreasing values of DS, DV/Vl and s, where DS is the entropy
change, DV/Vl gives the relative difference between the volume Vl of the
liquid at Tm and that of the solid at room temperature, and s is the electric
conductivity.
Regarding network formation, the following conclusion has been drawn on
the basis of liquid structure data available from XRD for LaCl3, CeCl3, PrCl3,
Chapter 260 Structures and Properties of Rare-Earth Molten Salts 129

NdCl3, SmCl3, GdCl3, and DyCl3 (Mochinaga et al., 1991) as well as from
ND for molten NdCl3 (Saboungi et al., 1990). These compounds have the
UCl3 structure in their high-temperature crystal phase, except for DyCl3,
which transforms into the AlCl3 structure before melting. The UCl3 structure
is hexagonal, with each metal cation (M) surrounded by six chlorides on the
corners of a trigonal prism and further coordinated by three coplanar chlorides
at somewhat larger distance (Wyckoff, 1964). The structure can be built by
stacking into a chain MCl3 units shaped as trigonal pyramids with M at the
apices and the three chlorides in the base of each pyramid being equally
shared between two M to form the trigonal prism around each M, and then
packing these chains so as to give three coplanar interchain M–Cl bonds for
each M. Evidently, a molecular-type crystal structure results if each M is
brought closer to one of the two triplets of chlorides forming each prism.
The AlCl3 structure can also be built from MCl3 pyramidal units, arranged
in layers so as to yield a slightly distorted cubic close packing of chlorides
inside which planes of octahedral sites are alternately either occupied by M
or empty (Templeton and Carter, 1954). Each layer of the AlCl3 structure
can almost be viewed as a hexagonal planar lattice of M sandwiched between
two triangular lattices of chlorides having the phase relationship of adjacent
(111) planes in the face-centered cubic lattice, as shown in Fig. 18. In this fig-
ure, the lower cluster shows the octahedral coordination of the metal ion in the
crystal, which is basically preserved in molten YCl3. The upper cluster shows
an Al2C16 unit, which, through the displacement of the two metal ions as indi-
cated by arrows, yields an Al2C16 molecule on melting of AlCl3.
FIGURE 18 Schematic illustration of a layer in the AlCl3, crystal structure and of melting in
YCl3 and AlCl3. The black spheres represent a plane of trivalent metal ions, and the gray and
white spheres represent planes of chlorines above and below the plane of metal ions, respectively.
Reproduced with permission from Price et al. (1992), © 1992 Electrochemical Society.
Handbook on the Physics and Chemistry of Rare Earths130

All rare-earth trichlorides listed above have similar structural characteris-
tics in the melt. The first-neighbor coordination number of the metal ions is
5.6–5.7 and the R–Cl bond length lies in the range 2.69–2.87 A. The
second-neighbor bond lengths are r(R–R)¼4.9–5.2 A and r(Cl–Cl)¼3.8–
4.1 A, indicating a Coulomb ordering primarily determined by the repulsion
between the polyvalent cations, as discussed earlier for molten SrCl2. Yet
the ionic conductivity in the melt decreases steadily through the series of
compounds from LaCl3 to DyCl3, and Raman-scattering data show that a
high-frequency spectral shoulder in LaCl3 rises to become a very well-defined
peak in DyCl3 (Mochinaga et al., 1991). This suggests that the essentially six-
fold coordination of the metal ions becomes progressively more stable
through the series, leading to a liquid structure that resembles a loose network
of distorted Cl-sharing octahedra. The ND pattern of molten NdCl3 shows a
relatively weak and broad structure in the region of the first sharp diffraction
peak, FSDP (Saboungi et al., 1990).
DyCl3 and YCl3 are structurally isomorphous before melting and melt
with similarly low values of DS and DV/Vl. In a ND experiment on molten
YCl3 (Saboungi et al., 1991), the Faber–Ziman structure factor exhibited a
well-defined FSDP at k¼0.95 A�1, giving unambiguous evidence of
intermediate-range order. The average coordination number of the metal ions
is 5.9, which confirms the Raman-scattering finding (Papatheodorou, 1977) of
rather long-lived octahedral coordination of the metal ions, though in detail
the octahedra in the liquid are somewhat expanded and distorted. The octahe-
dral network must be relatively loose on a time scale longer than the period of
the breathing mode of the octahedron at n¼260 cm�1, to be compatible with
the value of the ionic conductivity of molten YCl3 (Akdeniz and Tosi, 1992;
Janz et al., 1968). The second-neighbor C1–C1 coordination is approximately
8.2, somewhat lower than the value of 9 for intralayer Cl–Cl correlations in
the crystal.
The structural trend represented by increasing connectivity of highly coor-
dinated local structures from LaCl3 to YCl3 can be reproduced within a purely
ionic model (Tatlipinar et al., 1992). This model relates the appearance and
growth of intermediate-range order in a 3:1 liquid to the decrease in the radius
RM of the metal ion. Figure 19 shows the evolution of the theoretical partial
structure factors from LaCl3 through YCl3 and AlCl3 at constant density. As
RM decreases, Coulomb ordering becomes stronger, as indicated by the align-
ment of peaks in the R–R and Cl–Cl structure factors with the valley in the
R–Cl structure factor. At the same time, the main peak associated with cation
ordering in LaCl3 evolves into the FSDP in AlCl3. When the fluid with
RM¼0.82 A is allowed to expand to densities appropriate to real AlCl3 at
standard pressure, the model suggests stabilization of dimeric bound states.
As mentioned above, the main features of the local structures adopted by
molten rare-earth halides have been elucidated during the 1990s by Tosi and
coworkers (Akdeniz et al., 1998; Tosi, 1994a; Tosi, 1994b; Tosi et al., 1993).
Chapter 260 Structures and Properties of Rare-Earth Molten Salts 131

In the diffraction studies, the CN of the first M–Cl correlation has been con-
sistently evaluated to be about 6 for the pure melts, except for molten
ScCl3, for instance, by Wasse and Salmon (1998), Okamoto and Ogawa
(1999a, 1999b), and Okamoto et al. (1999). However, another structural inter-
pretation has been proposed on the basis of ND and molecular dynamics
(MD) data. Wasse and Salmon (1999c) reported from systematic ND studies
of molten rare-earth trichlorides that the CN of the first M–Cl correlation is
not always equal to 6; for example, that of molten LaCl3 is 8.2. Hutchinson
et al. (1999, 2001) have obtained MD simulation results of some rare-earth
trichloride melts by using a PIM, which reproduces well the ND results
obtained by Wasse and Salmon. The CN was estimated to be 7.9 for molten
LaCl3. These ND and MD works concluded that the CN changes with cation
size in the pure melts. The results of simulation works will be described
afterwards.
We now introduce and discuss typical structures of molten rare-earth triha-
lides analyzed by ND. The structure of molten lanthanum and cerium triha-
lides using the method of isomorphic substitution in ND has been carried
out by Wasse and Salmon (1999d). The total structure factors of molten
RX3, where R denotes La or Ce and X denotes Cl, Br, or I, have been
measured by using ND. Difference function methods were then applied on
assuming that the LaX3 and CeX3 melts are isomorphic for a given halide
ion. The results which follow from this assumption show that the FSDP in
0
0
1
2
3
0
1
2
3
0
1
2
3
-1
-1
-1
2
ka
Sij(
k)S
ij(k)
Sij(
k)
4
RM= 0.82 Å
RM= 1.12 Å
RM= 1.42 Å
6 8 10
FIGURE 19 Partial structure factors as functions of scaled wave vector in liquid MCl3 at fixed
density, for three values of the metal ion radius RM corresponding to La3þ, Y3þ, and A13þ (from
top to bottom). (Dotted lines) SClCl(k), (dashed lines) SMM(k), (solid lines) SMCl(k). Reproducedwith permission from Tatlipinar et al. (1992), © 1992 IOP Pub.
Handbook on the Physics and Chemistry of Rare Earths132

the measured total structure factors arises from cation correlations and its shift
to lower scattering vector values with increasing anion size is consistent with
an enhanced separation in real space of cation-centered polyhedra. Upon melt-
ing, the RX3 salts exhibit a decrease in the coordination number of both the
cations and anions. In the liquid state, the R–X coordination environment is
asymmetric with R–Cl, R–Br, and R–I nearest-neighbor distances of 2.93(2)
A, 3.01(2) A, 3.18(2) A, respectively, and R–Cl, R–Br, and R–I coordination
numbers of 8.2(2), 7.4(2), 6.7(2), respectively. The Cl–Cl, Br–Br, and I–I
nearest-neighbor distances are 3.58(3) A, 3.76(3) A, 4.13(2) A, respectively,
and there is a significant penetration of the X–X partial pdf into the first
peak of the M–X partial pdf for all three anions. The Cl–Cl, Br–Br, and I–I
coordination numbers are 9.2(2), 8.7(2), and 8.2(2), respectively, if the R–R
coordination number is set to two.
The structure of molten ScCl3 and ScI3 has also been studied with the
same experimental techniques (Wasse and Salmon, 1999a). The structure of
the salts ScX3, where X denotes Cl or I, was investigated by using ND. On
heating ScCl3, a phase transition from the FeCl3-type crystal structure to pos-
sibly the YCl3-type crystal structure is observed, whereas ScI3 remains in its
room-temperature FeCl3-type crystal structure up to the melting point. On
melting, there is a reduction in the Sc–X coordination number from 6 to 4.8
(2) for ScCl3 and from 6 to 4.7(2) for ScI3 and the Sc–Cl and Sc–I nearest-
neighbor distances in the liquid are 2.48(2) A and 2.76(2) A, respectively.
The measured total structure factors of molten ScCl3 and ScI3 each have a
prominent FSDP at a scattering vector value of 0.75(5) A�1. The results are
discussed in the context of those available for several other trivalent metal
halide systems which also melt from the closely related YCl3-type and
FeCl3-type crystal structures.
In the same way, the structure of molten trivalent metal chlorides such as
TbCl3, YCl3, HoCl3, and ErCl3 has been investigated and the total structure
factors measured. (Wasse and Salmon, 1999b). All four salts melt with a vol-
ume change of 65% from structures comprising RCl63� octahedra to form
liquids which show intermediate-range ionic ordering as manifested by a
FSDP at about 1 A�1 which moves to smaller scattering vector values with
decreasing cation size. In the liquid, R–Cl distances are comparable with
the sum of the ionic radii and the results are consistent with the existence of
distorted RCl63� octahedral units.
Furthermore, ND measurements were performed to determine the structure
of molten trivalent rare-earth bromides such as DyBr3, YBr3, HoBr3, and
ErBr3 (Wasse et al., 2000). Upon heating DyBr3, YBr3, and HoBr3, a phase
transition from the FeCl3-type crystal structure to possibly the YCl3-type crys-
tal structure is observed. The liquids were studied at the total structure factor
level, and difference function methods were also applied to DyBr3 and YBr3by assuming isomorphous structures. The melts are found to comprise dis-
torted RBr63� octahedra with R–Br distances comparable to the sum of the
Chapter 260 Structures and Properties of Rare-Earth Molten Salts 133

ionic radii, and there is evidence for a substantial number of edge-sharing
configurations. The octahedra pack to give intermediate-range ionic ordering
as manifested by the appearance of a FSDP at 0.79(2)–0.87(2) A�1 which is
associated with cation correlations.
The structural information obtained by the research group of Wasse and
Salmon includes molecular dynamics simulations in order to give a detailed
description of molten rare-earth halides. Selected examples are described here.
For instance, the structure of molten DyCl3 and DyNa3Cl6 has been simulated
with polarizable- and rigid-ion models (PIM and RIM) (Takagi et al., 1999). In
these simulations, the Born–Mayer–Huggins potential was employed with the
same potential parameters for both models. In the PIM, the polarization of the
chloride ions was taken into account. Although the partial RDFs between Dy
and Cl, and between Cl and Cl are very similar for the two models, the RDF
between Dy and Dy is quite different. The RDF between Dy and Dy experimen-
tally determined by the isotope substitution method is well reproduced by PIM
simulations. The strong Coulomb interaction between Dy3þ cations is screened
by the polarization of Cl� ions, and the interaction distance betweenDy3þ cationsbecomes smaller than that given by the RIM.MD simulations for DyNa3Cl6 were
made similarly. The PIM also reproduces the experimental total structure factor
very well. It is concluded that strong Coulomb interaction between Dy3þ cations
is screened by the polarization of Cl� ions. On the other hand, MD simulation of
DyNa3Cl6 with the PIM shows that the most prominent peak of gDy�Dy(r) is at amuch larger separation. It would appear that the polarization effects promote the
break-up of the network and the formation of discrete DyCl63� molecular units.
Short- and intermediate-range orders in molten metal tribromides have
been studied in terms of a molecular dynamics simulation (Hutchinson
et al., 2000). Calculations were performed on four molten metal tribromides,
RBr3 with R¼La, Ce, Y, and Dy. The many-body (polarizable-ion) simula-
tion potentials were constructed from metal trichloride potentials using physi-
cally transparent scaling arguments to account for the change in anion size
and polarizability. Comparison was made with neutron scattering results by
constructing the total structure factors from the simulated partial functions.
In addition, difference functions, which exploit the proposed isomorphous
nature of the (Dy, Y) and (La, Ce) pairs, were constructed and compared with
experimental data. The authors proposed that the structures of the trihalide
melts fall into three distinct structure classes, depending on the ratio of cation
and anion radii and independent of the specific cation and anion involved. For
a large radius ratio, a (7–8)-coordinate cation is found and the relative
arrangements of the coordination polyhedra around neighboring cations show
no particular pattern; the polyhedra seem simply to pack together. The sys-
tems which form these liquids exhibit the nine-coordinate UCl3 structure in
the solid phase. For a wide range of intermediate radius ratios, a family of
structures based upon more-or-less six-coordinate cations arises. These
approximately octahedral units exhibit a marked tendency to edge-share so
Handbook on the Physics and Chemistry of Rare Earths134

as to form extended and cross-linked chains, as demonstrated in Fig. 20. This
structural motif seems quite stable against variations in the actual mean coor-
dination number from about 6.5 to 5.5. Most systems within this class exhibit
the six-coordinate YCl3 (or BiI3) crystal structure, but some systems melt into
it from higher-coordinate crystal structures, like the (8þ1)-coordinate PuBr3structure. For still smaller radius ratios, quasi-molecular fluids based on
four-coordinate cations are found, as in AlCl3.
Efforts similar to those described above have been made with the goal of
obtaining a unified description of MC13 systems with a simulation model
including polarization (Hutchinson et al., 2001). Calculations were performed
to substantially improve the agreement with experiments for LaC13, TbC13,
YC13, and AlCl3, and simulation results were presented for the first time
for ScC13, which was shown to exhibit a fascinating cross-linked network
structure. Table 24 lists values for the average numbers of coordinated anions
around cations for each of the simulations with the optimum potentials.
Coordination numbers are obtained by integrating the cation–anion pdfsup to the position of the first minimum and are compared with the results from
ND studies. Surprisingly, good agreement is found, considering the different
shapes of the first peaks, their pdfs, and the ND patterns. Furthermore, in
the ND data, the first peak (due to M–Cl correlations) and the second (due
to Cl–Cl correlations) of the neutron RDF overlap rather strongly, but their
analysis (based simply on the simulated MCl partial distribution functions
and partial structure factors) supports the neutron values.
FIGURE 20 A molecular graphics “snapshot” of the edge-sharing units in a single YBr3 config-
uration highlighting the chain-like nature of the inherent structure. Reproduced with permission
from Hutchinson et al. (2000), © 2000 IOP Pub.
Chapter 260 Structures and Properties of Rare-Earth Molten Salts 135

The results for the coordination numbers of the larger cation systems, which
show values of about 8, are controversial. Raman studies of these systems sug-
gest octahedral coordination, even in the pure melt. Also, older X-ray studies
were interpreted in terms of octahedral coordination (Mochinaga et al., 1991).
A full resolution of this controversy will probably await the separation of partial
pdfs using isotopic substitution methods. To date, such studies have been made
only for the intermediate-size cation Dy3þ (Takagi et al., 1999), which, accord-
ing to all studies, is basically octahedrally coordinated (Dy3þ is very similar to
Y3þ, both experimentally and in our simulation models). Ongoing efforts are
being made to reconcile results from ND, X-ray, and EXAFS studies with com-
puter simulations, which hopefully will lead to a consensus.
For intermediate-size cations, ranging from about Y3þ (or Dy3þ) to Sc3þ,the chloride melts are predominantly octahedrally coordinated, with average
coordination numbers slightly higher than for the larger members and lower
for the smaller. The coordination polyhedra are linked together into a net-
work, with a considerable degree of edge-sharing. A snapshot of the instanta-
neous structure of the ScC13 melt is shown in Fig. 21.
Only a slice of the simulated cell is shown so that there are a number of
ions which are disconnected from their actual neighbors. Nevertheless, the
picture shows five- and six-coordinate Sc3þ linked together with a very high
degree of edge-sharing to form a cross-linked network. The structure features
a number of voids, and intervoid correlations are responsible for the promi-
nent, low k prepeak in the structure factor (Wilson and Madden, 1998).
7.2. Structural Approaches from Raman Spectroscopy
A series of pioneering studies on high-temperature Raman spectroscopy of
molten rare-earth halides were commenced in the 1970s in order to prove
TABLE 24 Temperatures and Densities Used in the Simulations of the
MC13 Liquids Along with Simulated and Experimental Cation–Anion
Coordination Numbers (Hutchinson et al., 2001)
System Temperature (K) Density (g cm�3) CN (sim.) CN (exp.)
LaC13 1178 3.174 7.9 8.2
CeC13 1108 3.234 – –
TbC13 900 3.580 7.2 7.5
YCl3 1033 2.492 6.6 6.2
ScCl3 1253 1.643 5.6 5.2
AlC13 600 1.277 4.0 4.0
Handbook on the Physics and Chemistry of Rare Earths136

and establish the presence of associated species in binary charge-
unsymmetrical fused-salt system as well as to characterize them from a struc-
tural viewpoint, since the thermodynamics of LaC13–AC1 (A¼Li, Na, K, Rb,
or Cs) melts by calorimetric and electromotive-force methods implied the
presence of complex species (Papatheodorou and �stvold, 1974). Early works
dealt with LaC13–KC1 melts (Maroni et al., 1974) and Cs2NaLaCl6,
Cs3LaCl6, and K3LaCl6 in molten and solid states (Papatheodorou, 1975);
efforts were made to surmount technical problems such as the unwanted fluo-
rescence and the residual background extending almost to 2000 cm�1 which
created difficulties in the determination of a reliable baseline, and to establish
experimental and computational procedures. The above systematic studies
were expanded into high-temperature Raman investigations of molten salts
by Papatheodorou (Papatheodorou, 1977). The Raman spectra of molten
YCl3–ACl (A¼Cs, K, Li) mixtures have been reported for different composi-
tions and temperatures up to 890 �C in a paper entitled Raman SpectroscopicStudies of Yttrium (III) Chloride–Alkali Metal Chloride Melts and ofCs2NaYCl6 and YCl3 Solid Compounds. The Raman spectra of polycrystalline
Cs2NaYCl6 and YCl3 were also measured from 25 �C to temperatures above
melting. Factor-group analysis of crystalline Cs2NaYCl6 was used to identify
the three Raman active modes (n1, n2, n5) of octahedral YCl63�. For liquidmixtures rich in alkali halide, the predominant features of the spectra are char-
acterized by a polarized and a depolarized band with frequencies close to the
n1 and n2 frequencies of octahedral YCl63�, which thus indicates the existence
of such a species in the melt. In melts containing more than 25% YCl3, a new
polarized band D appears which shifts continuously and rapidly to higher
FIGURE 21 Molecular graphics snapshot of the liquid ScC13 showing the edge-linked chain
structural motif. The large circles represent the Cl� anions and the smaller circles the Sc3þ
cations. Reproduced with permission from Hutchinson et al. (2001), © 2001 Taylor & Francis.
Chapter 260 Structures and Properties of Rare-Earth Molten Salts 137

energies with increasing YCl3 concentration. The frequency shift is attributed
to a continuous distortion mechanism of the YCl63� octahedra by the neigh-
boring yttrium ions. This shift and a comparison of the liquid and solid Raman
spectra of yttrium chloride suggest the existence of lattice-type modes in these
melts. Typical spectra and a structural model are depicted in Figs. 22 and 23,
respectively.
This methodology has been applied to the ScI3–CsI system to determine its
phase diagram and to establish the existence of two solid compounds, Cs3ScI6
Raman shift (cm-1)
Rel
ativ
e in
tens
ity (
arbi
trar
y un
its)
500
10%
15%
20%
25%
30%
45%
60%
75%
100%
D
KCI–YCI3
% YCI3
800 �C
400 300
P 125
(100)
(105)
(100)
(110)
(77)
(52)
(43)
(32)
S
260
350
200 100 0
FIGURE 22 Raman spectra of molten KCl–YCl3 mixture at 800 �C versus increasing concentra-
tion of YCl3. Reproduced with permission from Papatheodorou (1977), © 1977 AmericanInstitute of Physics.
Handbook on the Physics and Chemistry of Rare Earths138
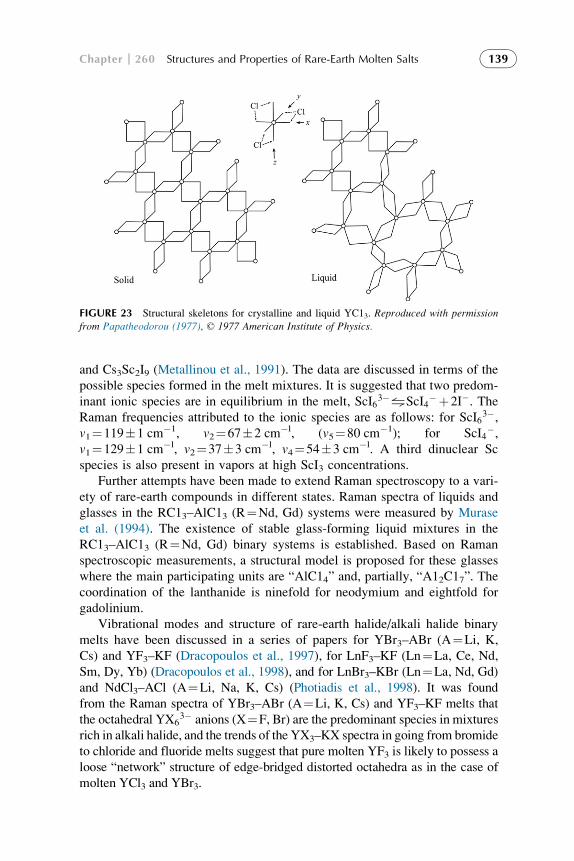
and Cs3Sc2I9 (Metallinou et al., 1991). The data are discussed in terms of the
possible species formed in the melt mixtures. It is suggested that two predom-
inant ionic species are in equilibrium in the melt, ScI63�.ScI4
�þ2I�. TheRaman frequencies attributed to the ionic species are as follows: for ScI6
3�,v1¼119�1 cm�1, v2¼67�2 cm�l, (v5¼80 cm�1); for ScI4
�,v1¼129�1 cm�l, v2¼37�3 cm�l, v4¼54�3 cm�l. A third dinuclear Sc
species is also present in vapors at high ScI3 concentrations.
Further attempts have been made to extend Raman spectroscopy to a vari-
ety of rare-earth compounds in different states. Raman spectra of liquids and
glasses in the RC13–AlC13 (R¼Nd, Gd) systems were measured by Murase
et al. (1994). The existence of stable glass-forming liquid mixtures in the
RC13–AlC13 (R¼Nd, Gd) binary systems is established. Based on Raman
spectroscopic measurements, a structural model is proposed for these glasses
where the main participating units are “AlC14” and, partially, “A12C17”. The
coordination of the lanthanide is ninefold for neodymium and eightfold for
gadolinium.
Vibrational modes and structure of rare-earth halide/alkali halide binary
melts have been discussed in a series of papers for YBr3–ABr (A¼Li, K,
Cs) and YF3–KF (Dracopoulos et al., 1997), for LnF3–KF (Ln¼La, Ce, Nd,
Sm, Dy, Yb) (Dracopoulos et al., 1998), and for LnBr3–KBr (Ln¼La, Nd, Gd)
and NdCl3–ACl (A¼Li, Na, K, Cs) (Photiadis et al., 1998). It was found
from the Raman spectra of YBr3–ABr (A¼Li, K, Cs) and YF3–KF melts that
the octahedral YX63� anions (X¼F, Br) are the predominant species in mixtures
rich in alkali halide, and the trends of the YX3–KX spectra in going from bromide
to chloride and fluoride melts suggest that pure molten YF3 is likely to possess a
loose “network” structure of edge-bridged distorted octahedra as in the case of
molten YCl3 and YBr3.
FIGURE 23 Structural skeletons for crystalline and liquid YC13. Reproduced with permissionfrom Papatheodorou (1977), © 1977 American Institute of Physics.
Chapter 260 Structures and Properties of Rare-Earth Molten Salts 139

As for LnF3–KF (Ln¼La, Ce, Nd, Sm, Dy, Yb) melts, the data indicate
that at mole fractions x(LnF3)%0.25 the LnF63� octahedra are the predomi-
nant species, and at mole fractions x(LnF3)>0.25 one polarized and two
depolarized bands (designated as P and D in Fig. 24) appear in the spectra
which are interpreted as corresponding to distorted LnF63� octahedra bound
by common fluorides (edge-sharing). The anisotropic scattering intensity
increases, relative to the isotropic intensity, with increases in both the size
and mole fraction of the lanthanide cation. This unusual effect is attributed
to dipole-induced-dipole interactions between cations in the melt and its vari-
ation from system to system is related to the size and polarizability of the
Ln3þ cation and its relative shielding by the F� anions.
From Raman spectra of LnBr3–KBr (Ln¼La, Nd, Gd) and NdCl3–ACl
(A¼Li, Na, K, Cs) melts, the following phenomena and interpretations were
obtained. In molten mixtures rich in alkali halide with lanthanide halide mole
fractions less than 0.25, the predominant species are the octahedral LnX63�
anions giving rise to two main bands P1 (polarized) and D1 (depolarized)
which are assigned to the v1 and v5 modes, respectively. In molten mixtures
rich in LnX3, the spectra are characterized by the P1 and D1 bands plus two
new bands D2 (depolarized) and P2 (polarized). The P2 band shifts continu-
ously to higher frequencies with increasing LnX3 content. These four bands
are attributed to the D3 distortions of the LnX63� octahedra bound by edges.
FIGURE 24 Composition dependence of the reduced isotropic (solid line) and anisotropic
(dotted line) Raman spectra of the molten LnF3–KF (Ln¼Y, Ce, La) at 1000 �C. Reproducedwith permission from Dracopoulos et al. (1998), © 1998 Royal Society of Chemistry.
Handbook on the Physics and Chemistry of Rare Earths140

The room temperature Raman spectra of the LnX3 solid compounds are char-
acterized by bands due to the vibrational modes of the different crystalline
structures: hexagonal for LaBr3 and NdCl3, orthorhombic for NdBr3, and
rhombohedral for GdBr3 having the Ln3þ coordination number 9, 8, and 6,
respectively. With increasing temperature, the spectra of the GdBr3 solid
become dominated by six Raman bands which are assigned to the vibrational
modes of a triple layer of ions consisting of distorted octahedra GdBr63�
(CN¼6) which share edges with neighboring octahedra. Upon melting, the
molar volume of GdBr3 does not change much and the spectra are characterized
by the above-mentioned P1, P2, D1, and D2 bands and can be correlated to the
triple layer modes of the solid. The high-temperature spectra of hexagonal
LaBr3, NdCl3, and orthorhombic NdBr3 show that the structure and CN remain
the same up to melting. However, upon melting, the compact orthorhombic
(CN¼8) and hexagonal (CN¼9) forms increase drastically their molar volume
and give spectra similar to those of molten GdBr3, YBr3, and YCl3 where
the Ln3þ is in a sixfold coordination. It appears that the structures of all the
LnX3 melts are similar and independent of the structure of the solids; fast
exchange of ions leads to short lifetimes for the octahedra and weak intralayer
interactions. Accordingly, schematic diagrams of phase transitions of rare-earth
trihalides upon melting are proposed as can be seen in Fig. 25.
The next Raman studies on molten rare-earth halides have turned to the
scandium(III) systems which feature the smallest ionic radius in the rare-earth
series and high melting points. Zissi and Papatheodorou (1999) have measured
FIGURE 25 Schematic structures of solid and molten rare-earth trihalides; solid A: monoclinic
or rhombohedral; solid B: orthorhombic; solid C: hexagonal. Reproduced with permission fromPhotiadis et al. (1998), © 1998 Royal Society of Chemistry.
Chapter 260 Structures and Properties of Rare-Earth Molten Salts 141

Raman spectra of Cs2NaScCl6, Cs3ScCl6, Cs3Sc2Cl9, and ScCl3 compounds
from 258 �C to temperatures above their melting points. The vibrational modes
of the discrete species ScCl63� and Sc2Cl9
3� in the solids are transferred upon
melting into the liquid and reflect an equilibrium involving ScCl4�, that is,
2Sc2Cl93�.ScCl6
3�þ3ScCl4�. The spectra of solid ScCl3 are dominated
by the vibrational modes of a triple layer of ions consisting of edge-sharing
ScCl63� octahedra.
The aforenamed researchers have discovered an interesting phenomenon in
the spectra of molten ScCl3–CsCl mixtures in the range of 600–900 �C(Zissi and Papatheodorou, 2002). The intensity changes of the H and P1bands with composition (see Fig. 26) imply that an equilibrium:
ScCl74�.ScCl6
3�þCl�, is established and that the structure of melts dilute
in ScCl3 is dominated by six- and seven-coordinated scandium species. Figure 27
also indicates that the seven-coordinated species predominates in the melt struc-
ture at lower temperatures while the six-coordinated species is favored at higher
temperatures.
FIGURE 26 Composition dependence of the Raman spectra of xScCl3–(1�x) CsCl
(0<x<0.25) molten mixtures at a few degrees above the binary liquidus temperature. Repro-
duced with permission from Zissi and Papatheodorou (2002), © 2002 Royal Society of Chemistry.
Handbook on the Physics and Chemistry of Rare Earths142

These studies have been expanded in order to unravel the composition-
and temperature-induced changes on the structure of molten ScCl3–CsCl
mixtures (Zissi and Papatheodorou, 2004) in comparison with the results of
molecular dynamics simulations, using a polarizable ion model (PIM)
reported by Madden et al. (2004). The following conclusions concerning the
structure of molten ScCl3–CsCl mixtures were reached:
(i) Contrary to other trivalent systems, the composition of solutions dilute in ScCl3is dominated by two species in equilibrium: ScCl7
4�.ScCl63�þCl�. The
FIGURE 27 Evolution of the Raman spectra with temperature for molten 0.065ScCl3–
0.935CsCl mixture. Reproduced with permission from Zissi and Papatheodorou (2002), © 2002
Royal Society of Chemistry.
Chapter 260 Structures and Properties of Rare-Earth Molten Salts 143
octahedral ScCl63� species overcome the seven-coordinated species at high
temperatures and at composition above�20 mol% ScCl3.
(ii) At ScCl3 mole fractions between �25 and �50 mol%, an equilibrium
is established where a dimer of the “octahedral” species bridged by a
face dissociates into a “tetrahedral” and an “octahedral” species:
2Sc2Cl93�.3ScCl4
�þScCl63�.
(iii) A loose network structure of bridged “octahedra” appears to form in
melts rich in ScCl3. Two main bands are seen in the isotropic Raman
spectra at these compositions; the P1 and P2 bands whose position and
relative intensities behave in a manner analogous to that found for other
lanthanide halide systems. The origin of the P2 band is assigned to a dis-
tortion of the bridged octahedra, in accordance with the g-polarizablemechanism scheme proposed by computer simulation studies. Both
schemes require that the IR active T1u mode of the octahedra becomes
Raman active and that its intensity and frequency increase with increas-
ing ScCl3 content.
(iv) A cluster model is proposed for pure molten ScCl3. Each cluster is com-
posed of a central fragment of a limited network of bridged “octahedra”
(i.e., an YCl3-like network structure) and is terminated on the “surface”
with chlorides bridged to tetrahedrally coordinated scandium having also
(nonbridged) terminal chlorides. The cluster model implies (a) an aver-
age scandium coordination number less than six and (b) a partial
molecular-like character and an electronic conductivity arising from
self-ionization. Furthermore, the model is in accordance with the Raman
spectra, the coordination number, and network structure proposed by
the computer simulations and with some physicochemical properties of
this melt.
Two years later, vibrational modes and structure of the LaCl3–CsCl melts
have been reported by Zissi et al. (2006). Detailed Raman spectroscopic mea-
surements of the LaCl3–CsCl melt mixtures at different temperatures and
compositions show a spectral behavior “isomorphous” to that observed for a
large number of LnX3–AX systems with small or large rare-earth cations.
“Isolated” octahedral LaCl63� ions are definitely formed in CsCl-rich melts,
which with increasing LaCl3 mole fraction share chlorides forming a loose
network of coordination polyhedra in LaCl3-rich melts. The systematics of
the “isomorphous” spectra in all these binary mixtures suggest that the coor-
dination of La3þ is more likely to be octahedral at all compositions.
In order to confirm conclusions drawn from Raman spectra, the electronic
absorption spectra of the f f hypersensitive transitions Ho(5G6 5I8) and
Nd(4G5/2 4I9/2) have been measured in molten LiCl–KCl eutectic and in
LaCl3–KCl molten mixtures by Chrissanthopoulos and Papatheodorou
(2006). The ligand-field components of the above transitions in octahedral
symmetry have been identified, and the molar absorptivity changes with
Handbook on the Physics and Chemistry of Rare Earths144

temperature and composition have been measured. The spectra are discussed
in terms of the coordination geometries of the probe cations Ho3þ and
Nd3þ. The Boltzmann thermal factor appears to be partially responsible for
the variation of the “hot” band intensities. The data suggest that the predomi-
nant factors affecting the oscillator strength of the Ho3þ and Nd3þ hypersen-
sitive transitions is the degree of octahedral distortions in conjunction with the
overall charge asymmetry around the LnCl63� anions (Ln¼Ho, Nd). It
appears that no drastic changes occur in the coordination of the probe cations
Wavenumber (cm-1)
21,600
0
50
100
150
200
0
10
20
30
40
0
10
20
30
40
21,750
C
B
A {34}
{37}
{140}
{180}
solid 460 �C
solid 520 �C
liquid 610 �C
Ho3+:TbCl3
Ho3+:a-TbCl3
Ho3+:b-TbCl3
{40}
22,000 22,250 22,500
mol
ar a
bsor
ptiv
ity (
L m
ol-1
cm-1
)
FIGURE 28 Electronic absorption spectra of Ho3þ in the region of the 5G6 5I8 transition: (A) in
liquid TbCl3; (B and C) in the two allotropic crystalline a- and b-forms of TbCl3, respectively. Repro-
duced with permission from Chrissanthopoulos and Papatheodorou (2008), © 2008 Elsevier.
Chapter 260 Structures and Properties of Rare-Earth Molten Salts 145

in going from dilute solutions in LaCl3 to pure LaCl3 melts; this suggests that
the coordination of La3þ is more likely to be sixfold in the host melt. Further
evidence for sixfold coordination is given by the Judd–Ofelt parameters of
Nd3þ in both molten NdCl3 and La(Nd)Cl3. All these data are considered as
a further and strong indication that the coordination of La3þ in all LaCl3–
KCl melt compositions and in pure molten LaCl3 is predominantly sixfold.
Using the same technique, absorption spectra of the hypersensitive transi-
tion Ho(5G6 5I8) have been measured in different chloride coordination
environments (Chrissanthopoulos and Papatheodorou, 2008). Drastic changes
of the molar absorptivity of the Ho3þ probe have been observed during the
a!b solid phase transition of TbCl3 during which the coordination is altered
from six- to eightfold, as depicted in Fig. 28. In contrast, rather smooth and
continuous changes occur upon melting of Y(Ho)Cl3 and Tb(Ho)Cl3. The data
indicate that the distorted octahedral coordination of Ho3þ in these solids is
preserved in the liquid. Furthermore, it was established that the molar absorp-
tivity of the Ho3þ probe remains practically invariant in liquid rare-earth
chlorides RCl3 with either large (e.g., La) or small (e.g., Y) cations. For the
same group of chlorides, the Raman spectra were found to be rather isomor-
phous, implying that the vibrational modes in these liquids arise from similar
0
21,500
900 �C 680 �C
680 �C867 �C
La(Ho)Cl3 (liq.) Gd(Ho)Cl3 (liq.)
LaCl3 (liq.) GdCl3 (liq.) TdCl3 (liq.) YCl3 (liq.)
Td(Ho)Cl3 (liq.) Y(Ho)Cl3 (liq.)
750 �C
740 �C 740 �C
750 �C
0
5
10
15
20
25
30
35
0
5
10
15
20
25
30
35
22,000 22,500 21,500 22,000 22,500 21,500 22,000 22,500 21,500 22,000 22,500
200
ANISO
ISO
D2D2
D2
D2D1
P1P1
P1P1
P2
P2
P2 P2
D1
D1
D1
ISO ISO ISO
ANISO ANISO ANISO
Red
uce
d in
ten
sity
(ar
b. u
nit
s)
mo
lar
abso
rpti
vity
(L
mo
l-1 c
m-1
)
400 0 200 400
Raman shift (cm-1)
wavenumber (cm-1)
0 200 400 0 200 400 600
FIGURE 29 Systematics of absorption (top) and Raman (bottom) spectra in the rare-earth chlo-
ride series. Upper set of figures: Molar absorptivity of the Ho3þ hypersensitive transition5G6 5I8 in molten RCl3. Lower set of figures: reduced Raman spectra of molten RCl3. Repro-
duced with permission from Chrissanthopoulos and Papatheodorou (2008), © 2008 Elsevier.
Handbook on the Physics and Chemistry of Rare Earths146
coordination geometries. These findings in conjunction with an almost identi-
cal molar volume for all RCl3 liquids suggest similar liquid structures which
are dominated by coordination polyhedra having the R3þ cation in distorted
octahedral geometries, as can be seen in Fig. 29 where the definitions of
reduced Raman spectra are given in the literature (Dracopoulos et al.,
1997). The present method is quite useful in understanding the reliability of
high-temperature Raman spectroscopy of molten salts.
7.3. Approaches from Other Techniques
When a variety of physicochemical properties of solids are correlated with
crystal structures, it is necessary to identify specific crystal directions, because
many properties are directional. As for isotropic liquids, it is of no need to
consider such a situation. Instead, much attention must be paid to ionic spe-
cies, complexation, and clustering in the molten salts. In physics and chemis-
try of molten salts with multivalent cations and univalent anions, novel
developments are progressing smoothly, typical examples of which are molec-
ular dynamics simulations of structures (Wilson and Madden, 1993) and
Raman spectra (Pavlatou et al., 1997) interpreted on the basis of the
polarizable-ion model.
Liquid structure of lanthanide trichlorides has been studied in some detail
by XRD and/or Raman spectroscopy, for instance, pure CeCl3 with hexagonal
UCl3-type crystal structure (Mochinaga et al., 1993a) and ErCl3 with mono-
clinic AlCl3-type (Iwadate et al., 1994). These results indicate that
the nearest-neighbor chloride coordination number of Ce3þ ions decrease
from 9 in the crystal to 6 in the melt and that CN for Er3þ ions remains
unchanged to 6 in both crystal and melt, in any event, allowing for octahedral
geometry around the lanthanide ions. Some difference in bond nature is, how-
ever, predictable from Ce–Ce and Er–Er distances as well as from volume
increases on melting. Consequently, there appear to exist corner-sharing link-
age of octahedra in molten CeCl3 and edge-sharing combination of octahedra
in molten ErCl3, in the sense of “most probable type of linkage.” This finding
may characterize the melting behavior of a series of lanthanide trichloride
crystals (Iwadate et al., 1995). Little is, however, known about the structure
of molten lanthanide trichlorides mixed with alkali chlorides. The short-range
structure of molten SmCl3–LiCl, SmCl3–NaCl, and SmCl3–KCl systems at
different compositions and temperatures has been preliminarily analyzed by
Raman spectroscopy and XRD (Iwadate et al., 1998). According to these
works, the octahedral SmCl63� complex anions are found to exist indeed
not only in the pure melt but also in the mixtures. In particular, peak splitting
in the isotropic Raman component is clearly identified in the reduced Raman
spectra of mixtures, probably, with increasing fraction of distorted SmCl63�
species and bridged octahedra. This hypothesis is confirmed for the molten
SmCl3–NaCl system by conventional molecular dynamics simulation in
Chapter 260 Structures and Properties of Rare-Earth Molten Salts 147

relationship with ND experiments on YCl3 melt by Saboungi et al. (1991) and
in a report on melting and liquid structure of polyvalent metal halides by Tosi
(1994a). Furthermore, another aim of this work is to investigate the ionic
arrangements in molten SmCl3–NaCl system as a prototype of lanthanide
trichlorides/alkali chlorides mixtures.
As demonstrated in Section 4, computer-aided simulations such as the molec-
ular dynamics method and the Monte Carlo method (MC) have made essential
contributions to physics and chemistry of molten salts for more than four dec-
ades. Therefore, the author’s research group has applied MD to the structural
analysis of molten SmCl3–NaCl system (Iwadate et al., 1999). The MD calcula-
tions were carried out as follows: 800 or 840 particles corresponding to the melt
compositions (SmCl3 mol%: 100, 75, 50, and 25) were randomly located in a
basic cubic cell, the length of which ranged from 2.908 to 2.967 nm, reflecting
the measured molar volumes of the melt mixtures (Fukushima et al., 1997).
The Born–Mayer–Huggins-type potential described by Eq. (26) was
assumed to be applicable to i–j pairs of particles, but parameters Cij and Dij
for dipole–dipole and dipole–quadrupole interactions, respectively, were dis-
regarded in this work.
’ij rð Þ¼ ZiZje2=r
� þAijb exp siþsj� r�
=r� �� Cij=r
6� � Dij=r
8� ð26Þ
Aij¼ 1þ Zi=nið Þþ Zj=nj� ð27Þ
where Zi is the electric charge of the ith ion, e the elementary electric charge, rthe interionic separation, Aij the Pauling factor defined by Eq. (27) with ni thenumber of electrons in the outer shell, b the repulsive parameter
(0.338�10�19J), si the size parameter relative to the ionic radius, r the soft-
ness parameter. The parameters were determined after repeated trial and error
cycles so as to reproduce the reduced XRD intensity function Q � i(Q) as closelyas possible. The predictor–corrector method (Gear, 1971) was used as an algo-
rithm for the calculation of particle coordinates and the Ewald method for Cou-
lomb forces. A total of 10,000 steps (time step Dt¼2 fs), extending up to 20 ps,
were accumulated at constant temperature according to Nose’s method (Nose,
1984). The coincidence of interference functions Q � i(Q)s derived from XRD
and MD for SmCl3(25 mol%)–NaCl(75 mol%) melt at 903 K are displayed in
Fig. 30, expressing the validity of the pair potential used.
According to statistical data on particle position and velocity simulated
using the following pair potential parameters ZSm¼3, ZNa¼1, ZCl¼�1,sSm¼0.120 nm, sNa¼0.105 nm, sCl¼0.175 nm, and r¼0.025 nm, the pair
correlation function gij(r) and the running coordination number Nij(r) are
defined by Eqs. (28) and (29), respectively.
gij rð Þ¼ V= NiNj
� � XNjj
nij r�Dr=2;rþDr=2ð Þ= 4pr2Dr� ð28Þ
Handbook on the Physics and Chemistry of Rare Earths148

Nij rð Þ¼ðr0
4prjr02 gij rð Þdr0 ð29Þ
where Ni and Nj are the numbers of ions i and j, respectively, nij(r�Dr/2;rþDr/2) the number of ions j in the spherical shell of a radius range from
r�Dr/2 to rþDr/2 with ion i being at the origin, and rj the average number
density of ion j. In estimating coordination numbers, integration was made up
to the second point at which gij(r) becomes unity, not the first minimum. A
sample of the gij(r)s and Nij(r)s obtained from MD calculations at 953 K is
shown in Figs. 31 and 32, and the first peak positions in gij(r)s for several paircorrelations are given in Table 25.
As for pure SmCl3 melt, the first peak positions in gij(r)s occur at
0.529 nm, 0.275 nm, and 0.359 nm for Sm–Sm, Sm–Cl, and Cl–Cl pair corre-
lations, respectively. It is evident from the first two distances that one Sm3þ
ion is not in direct contact with the other (no Sm–Sm bonding) and that some
0
-5
5
50
Q (nm-1)
Q•i
(Q
) (n
m-1
)
100
XRD
MD
150
FIGURE 30 Interference function Q � i(Q) for molten SmCl3(25mol%)–NaCl(75mol%). Repro-
duced with permission from Iwadate et al. (1999), © 1999 Elsevier.
0
5
10
0.1 0.2 0.3 0.4 0.5
r (nm)
g sm-C
I (r)
0.6 0.7
100:0
SmCl3:NaCI
75:25
50:50
25:75
0.8 0.9 1.0
FIGURE 31 Pair correlation function gSm–Cl(r). Reproduced with permission from Iwadate et al.
(1999), © 1999 Elsevier.
Chapter 260 Structures and Properties of Rare-Earth Molten Salts 149

Cl� ions are always inserted between the two Sm3þ ions. The distance ratio
rCl–Cl/rSm–Cl amount to 1.305, which is roughly equal toffiffiffi2p
, and, further-
more, the running coordination number N[Sm–Cl(r)] reaches a plateau in
the range 0.3% r/nm%0.4, the magnitude of which is about 6. These findings
indicate that six Cl� ions are octahedrally coordinated to a Sm3þ ion. In con-
junction with Raman spectroscopic data (Iwadate et al., 1998), it was con-
firmed that octahedral complex ions of the type SmCl63� exist in the melt.
Regarding SmCl3–NaCl mixture melts, gSm–Cl(r) and NSm–Cl(r) at SmCl3 con-
centrations of 50 and 75 mol% behave similarly as in the case of pure SmCl3melt. But at 25 mol% composition, the first peak in gSm–Cl(r) becomes more
intense, the other peak position shifts to the right, and the plateau in NSm–
Cl(r) becomes longer, as illustrated in Figs. 31 and 32. In the same way, it
was found from the first peak in gCl–Cl(r) that the nearest-neighbor Cl–Cl dis-tance is lengthened with decreasing SmCl3 concentration and therefore that
the ratio of the first peak position in gCl–Cl(r) to that in gSm–Cl(r) approachesffiffiffi2p
, a value corresponding to octahedral geometry. Other features reveal
that the octahedra are less distorted with decreasing SmCl3 concentration
and this trend appears strongly at 25 mol% of SmCl3, the concentration of
0
10
20
0.1 0.2 0.3 0.4 0.5
r (nm)
NS
m-C
l (r)
25:75
50:50
75:25
100:0
SmCl3:NaCl
0.6 0.7 0.8 0.9 1.0
FIGURE 32 Running coordination number NSm–Cl(r). Reproduced with permission from Iwadate
et al. (1999), © 1999 Elsevier.
TABLE 25 First Peak Positions in gij(r)s for the Molten SmCl3–NaCl System
at 953 K (Iwadate et al., 1999)
SmCl3 (mol%) 100 75 50 25
rSm–Sm (nm) 0.529 0.531 0.529 0.535
rSm–Cl (nm) 0.275 0.273 0.275 0.273
rCl–Cl (nm) 0.359 0.363 0.367 0.379
Handbook on the Physics and Chemistry of Rare Earths150

which corresponds to the point for which the local composition of
(3NaþþSmCl63�) is identical to the stoichiometry of the mixed melt.
The location of Naþ ions was determined from Sm–Na, Na–Cl, and Na–
Na correlations. In comparison with the first peak positions in the gij(r) func-tions of these three distinct correlations, Na–Cl correlation possesses a sharp
peak at r¼0.29 nm, independent of SmCl3 concentration. But for Sm–Na
and Na–Na correlations, only broad peaks appears in the r-range between
0.42 and 0.57 nm as well as between 0.35 and 0.50 nm, respectively. It is
therefore natural that NSm–Na(r) decreases with increasing SmCl3 concentra-
tion; more interestingly, the mode of the first peak in gSm–Na(r), statisticallydefined, is situated around rSm–Na¼0.5 nm at SmCl3 concentrations between
25 and 50 mol%. In contrast, the corresponding value is quite shortened,
0.46 nm, at 75 mol%. This fact is tentatively ascribed to the fact that the lin-
kages between SmCl63� units are broken by addition of NaCl and thus that
the Naþ ions enter into the gap shaped between the newly formed octahedra.
In MD simulation, the coordinates of all particles were calculated at every
step and thus the distribution of the number of coordinated Cl� ions around a
Sm3þ ion could be studied in detail. At this stage, it is of high importance to
determine the range of the first coordination shell. The limiting distance of the
first coordination shell (LDFCS) defining the dimension of the shell is defined
in the following ways; it corresponds to (1) the second point at which gSm–
Cl(r) becomes unity, r1 and (2) the first minimum in gSm–Cl(r) just after thefirst peak, r2. The values of LDFCSs are tabulated in Table 26. It should be
stressed that coordinative bond formation between Sm3þ and Cl� depends
on the magnitude of LDFCS.
Under these conditions, the number of Cl� ions surrounding a given Sm3þ
ion is counted up to the distance r1 or r2. The results are depicted in Figs. 33
and 34, respectively.
In the first case, most of the Sm3þ ions are found to be coordinated by six
Cl� ions at every concentration of SmCl3 (Fig. 33). On the contrary, if the dis-
tribution of coordination numbers is still centered at six in Fig. 34, a marked
shoulder points to a nonnegligible quantity of ions displaying CN¼7. If this
TABLE 26 Limiting Distances of First Coordination Shell (LDFCS) in Pair
Correlation Function gSm–Cl(r) for Molten SmCl3–NaCl System (Iwadate
et al., 1999)
SmCl3 (mol%) 100 75 50 25
Temp. (K) 953 953 753 853 953 953
r1 (nm) 0.304 0.307 0.311 0.308 0.307 0.305
r2 (nm) 0.353 0.351 0.353 0.351 0.355 0.391
Chapter 260 Structures and Properties of Rare-Earth Molten Salts 151

were true (r2 was used to test bond formation), it means that every Sm3þ ion
is combined with another one through Cl� bridging ions, leading to not only
large polyatomic anions but also to a network structure. SmCl3–NaCl mixture
melts including pure SmCl3 melt are much less viscous than network-forming
ZnCl2 melt. Raman data (Iwadate et al., 1998; Matsuoka et al., 1993) and
XRD studies (Mochinaga et al., 1991) reported so far support the hypothesis
of the presence of octahedral species with sixfold coordination, and therefore,
it is rational to define the LDFCS with respect to r1, not r2. As a consequence,fivefold or sevenfold coordination appear to be virtually impossible.
The following conclusions can be drawn from detailed analyses of the pair
correlation and running coordination functions.
(I) Octahedral complex species of the type SmCl63� exist, as deduced from
Raman and XRD data.
0
50
100
1 2
25:75
50:50
75:25
100:0
SmCl3:NaCl
3 4 5
Coordination number
Abu
ndan
ce (
%)
6 7 8 9 10
FIGURE 33 Distribution of coordination numbers for Sm–Cl pair in molten SmCl3–NaCl sys-
tem at 953 K: Integration up to the second point at which gSm–Cl(r) become unity. Reproducedwith permission from Iwadate et al. (1999), © 1999 Elsevier.
0
50
100
1 2 3
25:75
50:50
75:25
100:0
SmCl3:NaCl
4 5
Coordination number
Abu
ndan
ce (
%)
6 7 8 9 10
FIGURE 34 Distribution of coordination numbers for Sm–Cl pair in molten SmCl3–NaCl sys-
tem at 953 K: Integration up to the first minimum in gSm–Cl(r). Reproduced with permission fromIwadate et al. (1999), © 1999 Elsevier.
Handbook on the Physics and Chemistry of Rare Earths152

(II) Rational estimates of the important parameter LDFCS point to bond for-
mation between Sm3þ and Cl�.
Many novel details and suggestions for the structure of molten rare-earth
halides have been gained from advanced simulations different from the conven-
tional ones presented earlier (Hutchinson et al., 1999). For instance, simulations
using a polarizable, formal charge ionic interaction model are reported for a
range of RX3 molten salts. The LaCl3, TbCl3, and YCl3 systems studied span
a range of cation sizes and the interaction model is a “generic” one, in the sense
that the cation size is the only parameter in the interaction potential which dis-
tinguishes one system from another. The liquid structures predicted from the
simulations are compared with recently obtained ND data. Excellent agreement
is found, except that the first coordination shell seems to be too tightly bound in
the theoretical model. The cation in LaCl3 is found to be seven- to eightfold
coordinate, and the coordination number drops to 6 for the smallest cation con-
sidered (Y3þ) so that the coordination number in these systems does not change
substantially on melting, in contrast to earlier reports. The polarization effects
promote a significant degree of edge-sharing between these coordination poly-
hedra relative to predictions from a simple ionic pair potential model. Asso-
ciated with these changes is a shift to smaller scattering vectors of the
prepeak in the structure factor and an increase in the fluidity.
MD simulations have been performed with another goal of reproducing
not only experimental structural but also vibrational data for ionic rare-earth
chloride melts. Pavlatou et al. have reported simulations of the short-time,
vibrational dynamics of the network-forming ionic melts LaCl3, and its mix-
tures with network-breaking alkali halides. In the mixtures, high-frequency
peaks in the vibrational density of states are describable in terms of the nor-
mal coordinates of the vibrations of transient molecular ion species, like
LaCl63� (Pavlatou et al., 1997). Concretely speaking, the densities of states
(DOS) of the Cl�, La3þ, and Kþ ions were obtained for the LaCl3–4KCl solu-
tion where the DOS spectrum of the Kþ cations was characterized by a single
band centered at about 50 cm�1, while the corresponding spectra of the Cl�
and La3þ ions were more “structured.” This structure might be associated with
vibrational motions of the LaCl63� ions evident from the snapshots (see
Fig. 35). In the same way, the snapshots of the structure of pure LaCl3 melt
indicates that La3þ ions remain predominantly six coordinate in the melt but
that the octahedral units are linked together, building a network. The implica-
tion of this for the vibrational dynamics is that the vibrations of the individual
octahedral units are somewhat coupled.
Interpretation of Raman spectra by computer simulation has been extended
to the complex-forming ScCl3 melt, again using the polarizable-ion interac-
tion model (Madden et al., 2004). Their final conclusions are summarized in
the paper titled Raman Spectra of Ionic Liquids: A Simulation Study of LaCl3and Its Mixtures with Alkali Chlorides (Glover and Madden, 2004) in which
Chapter 260 Structures and Properties of Rare-Earth Molten Salts 153

Raman spectra of Cs2NaLaC16 and of LaC13 and its mixtures with NaCl and
CsCl are calculated. These calculations are much more extensive than previ-
ous ones and allow a systematic exploration of the spectra for this all range
of systems. Although there is a systematic overestimation of the vibrational
frequencies, the pattern of the spectra and their evolution with mixture com-
position match experimental results very well. For crystals, a clear link
between the predicted spectral bands and the measured vibrational DOS of
the LaC163� coordination centers is seen. In the molten mixtures, bands are
seen at similar frequencies, despite the fact that 6-coordination is no longerpredominant according to Madden et al. (2004), except in dilute solutions.
The coordination number of the La3þ ions increases from 6 in dilute solution
to between 7 and 8 for the pure melt. This increase appears to occur when the
coordination centers begin to cross-link. CsCl appears to be a much better
structure breaker than NaCl so that the coordination units consist of long-
lived, isolated LaC163� anions for LaCl3 concentrations below 25%.
In the early 1970s, Sayers et al. (1971) have succeeded in applying
Fourier analysis to their point-scattering theory of XAFS to formally trans-
form experimental data into a radial structure function with determinable
parameters of distance from the absorbing atom, number of atoms, and widths
of coordination shells for the evaporated and crystalline Ge systems. With
the advent of large-scale synchrotron radiation facilities in the late 1990s, this
FIGURE 35 Molecular graphics “snapshots” of molten LaCl3–4KCl. The large spheres are the
Cl� ions, the medium the Kþ, and the smallest the La3þ. “Bonds” are drawn between La–Cl pairs
at separations of less than 3.3 A. Reproduced with permission from Pavlatou et al. (1997), © 1997
American Institute of Physics.
Handbook on the Physics and Chemistry of Rare Earths154

technique proved to produce excellent results on the local structure around
rare-earth cations in several states.
The coordination environment around Gd3þ ions in GdAl3Cl12 glass and
supercooled liquid has been studied using Gd LIII-edge EXAFS spectroscopy
(Sen et al., 2000). The Gd coordination environment in the glass is found to be
similar to that in the GdAl3Cl12 crystal with eight Cl� nearest neighbors and
four Al3þ next-nearest neighbors. The Gd–Cl distance in the glass is the same
as in the crystal (�2.8 A) although the Gd–Al distance in the glass (�3.85 A)
is longer compared to the crystal (�3.7 A), indicating a less dense structure
with a larger Gd–Cl–Al bond angle in the glass. The Gd–Cl distance and coor-
dination number remain unchanged in the supercooled liquid at 60 �C as
demonstrated from EXAFS spectra (Fig. 36). However, the absence of any
Gd–Al second-neighbor shell in the EXAFS spectra of the liquid indicates
substantial increase in static disorder in the spatial distribution of AlCl4 tetra-
hedra around Gd in the liquid. Such temperature-dependent structural changes
are probably responsible for the marked fragility of this liquid.
In line with the increasing use of XAFS spectroscopy for elucidating the
nearest-neighbor structure in condensed phases, XAFS spectra of NdCl3 and
DyCl3 in both solid and liquid phases have been measured at the Nd and
Dy LIII absorption edges on beam line BM29 of the European Synchrotron
Radiation Facility (ESRF) (Matsuura et al., 2001). The Fourier-transformed
radial structure functions ’(r) show that the prominent peaks corresponding
to R–Cl (R¼Nd, Dy) first shell contributions are shifted to shorter distances
in the liquid melts as compared to those found in the corresponding solids.
A similar behavior has been observed with other diffraction techniques in typ-
ical ionic melts such as NaCl. The temperature dependence of the radial
3
k3 c(
k)
-8
-6
-4
-2
0
2
4
6
8
4 5 6 7 8 0
Four
ier
tran
sfor
m (
AU
)
0
0.1
0.2
0.3
0.4
0.5
0.6
0.7
0.8
2
Radial distance (Å)Wavenumber (Å-1)
4 6 8 10
FIGURE 36 (Left) k3-weighted Gd LIII-edge EXAFS and (right) the corresponding Fourier-
transformed partial radial distribution function for Gd3þ ions at 60 �C in the GdAl3Cl12 super-
cooled liquid. Solid lines represent experimental data and dashed lines correspond to least-squares
fits. Reproduced with permission from Sen et al. (2000), © 2000 IOP Pub.
Chapter 260 Structures and Properties of Rare-Earth Molten Salts 155

structure functions clearly point to the change in the M–Cl distance upon
melting being much larger for NdCl3 compared to DyCl3.
The local structure and structural changes in molten YCl3–LiCl–KCl and
YBr3–LiBr systems have been investigated by using a high-temperature
extended X-ray absorption fine structure (EXAFS) technique (Okamoto et al.,
2001). Octahedral coordination of halide ions around the Y3þ ion has been
studied by EXAFS of the Y3þ K-absorption edge. The nearest Y3þ–Cl� and
Y3þ–Br� distances and the coordination numbers of halide ions around the
Y3þ ion do not change by mixing with the alkali halides. Stabilization of the
octahedral [YCl6]3� and [YBr6]
3� anions upon addition of alkali halides was
suggested from the decrease in the Debye–Waller factor and the anharmonicity
of the nearest Y3þ–Cl� and Y3þ–Br� interactions. The bridging structure of the
[YBr6]3� octahedra sharing a Br� ion in the molten YBr3–LiBr system was
studied by EXAFS of the Br K-absorption edge. The number of coordinated
Y3þ around the Br� ion decreases from 2 in the pure melt to almost unity in
the 30 and 15 mol% YBr3 melts. This suggests that the bridging is almost
broken and that stable octahedra exist freely in the LiBr-rich melts. Schematic
diagrams of isolated and bridged species found in the melts are presented in
Fig. 37. Improvements of the sample cell and furnace led to better measurement
accuracy, but the above conclusions were not altered (Okamoto et al., 2002).
As for the local structure of molten LaCl3, the nearest-neighbor La–Cl dis-
tance and coordination number of La3þ were estimated from the radial distribu-
tion analysis of XRD to be about 0.28 nm and nearly equal to 6, respectively.
On the other hand, according to the La–LIII absorption-edge XAFS technique,
the number of coordinated Cl� around La3þ was evaluated to be around 7. As
a result, the local structure of molten LaCl3 was described as an octahedral-like
coordination scheme where La3þ is surrounded by six or seven chloride anions.
This implies the presence of octahedral complex ions, [LaCl6]3�, in agreement
with Raman data reported by other authors. The La–La distance was evaluated
at about 0.5 nm from the position of a weak and broad second peak in the corre-
lation function g(r), suggesting that a distorted corner-sharing connection of twooctahedral complex species was predominant in the melt. The difference between
the numbers of nearest-neighbor Cl� around La3þ obtained by X-ray and XAFS
measurements could not be explained in a paper in which a new method for cor-
recting diffraction data was proposed to prevent the coordination number from
being reduced in real space (Iwadate et al., 2006).
Rollet et al. (2004) have developed a cell for high-temperature X-ray
absorption measurements in both solid and molten lanthanide fluorides. Two
plates of pyrolitic boron nitride are fixed hermetically together around the
sample in order to avoid any evaporation and interaction with the atmosphere.
EXAFS spectra of molten mixtures of LiF–LaF3 measured at the La–LIII
absorption-edge are reported up to 900 ºC and show the tightness of this cell
which allows data acquisition during a long time, thereby improving the
signal-to-noise ratio.
Handbook on the Physics and Chemistry of Rare Earths156

The above work should stimulate future XAFS researches on molten alkali
metal fluoride systems including rare-earth fluorides, in which the numbers
of coordinated fluorides were reported to be in the wide range of 3 to 10
(Matsuura et al., 2009; Numakura et al., 2010; Watanabe et al., 2006). Though
XAFS has become a very powerful tool due to improvements of high-energy
synchrotron radiation facilities, it is of importance to bear in mind that
the accuracy in coordination number is of the order of �10% only, making
precise evaluation of coordination numbers quite difficult.
FIGURE 37 Models of local structures for molten rare-earth trihalides. (A) Octahedral coordina-
tion [MX6]3�, (B) edge-sharing model, (C) corner-sharing model. Small ball, metal ion M3þ;
large ball, halide ion X�. Reproduced with permission from Okamoto et al. (2001), © 2001International Union of Crystallography.
Chapter 260 Structures and Properties of Rare-Earth Molten Salts 157

8. CONCLUDING REMARKS
The present review has outlined the major structural properties of rare-earth
molten salts as unraveled from several experimental techniques. Some sys-
tematic and common trends have been obtained. However, there is no com-
mon understanding of the structural characteristics of molten rare-earth
halides such as fluorides, bromides, and iodides. Moreover, discrepancies in
structural information about molten rare-earth chlorides still exist, particularly
with respect to coordination numbers, despite more than 20 years of heated
discussions.
The crystal structure of rare-earth trichlorides can be divided broadly into
two categories, one concerning light rare earths (La–Gd) and the other the
heavier ones (Y, Dy–Lu, but excluding Tb). The crystal structure of light
rare-earth chlorides is of UCl3-type in which the metal cation is surrounded
by three chlorides forming a triangle and six chlorides at the corners of a hex-
agonal prism, resulting in a ninefold coordination. The crystal structure of
heavy rare-earth chlorides is, in contrast, of AlCl3-type in which the metal cat-
ion is octahedrally coordinated by six chlorides. Incidentally, TbCl3 is out of
the above crystal scheme, the structure of which is orthorhombic and of
PuBr3-type. Each Tb possesses eight nearest Cl neighbors at an average dis-
tance of 2.81 A (Forrester et al., 1964).
Akdeniz and Tosi (1992) have declared that there also exist two structure
categories for molten rare-earth trichlorides. During the phase transition from
solid to liquid, the molar volume of a typical light rare-earth chloride
decreases by as much as 20% while that of a heavy rare-earth chloride hardly
changes ca. 0–5% at most. This conclusion has proved valid and was con-
firmed in a subsequent paper (Iwadate et al., 1995), see Table 27. The entropy
change of a light rare-earth chloride on melting is therefore larger than that of
a heavy rare-earth chloride.
As mentioned thus far, the melting behavior has been explained in terms
of structural information obtained from experimental techniques such as
XRD, ND as well as from molecular dynamics simulations. Iwadate et al.
(1995) have obtained the nearest-neighbor distances and coordination num-
bers of several ion pairs by model fitting of the XRD structure factors. From
these studies, it has been suggested that each rare-earth cation is coordinated
to six chloride ions in the melt. Further suggested is that the local octahedral
units, [RCl6]3� are linked to each other through apexes of octahedra in light
rare-earth chloride melts, while they share edges of octahedra in heavy rare-
earth chloride melts.
Some research groups have proposed a slightly different picture for pure
melts of light rare-earth chlorides (not for mixtures) on the basis of ND data
and MD simulations. For example, Wasse and Salmon (1999d) have reported
from pdfs that integration of the first peak over the range 2.50% r(A)%3.37 to
the first shoulder gives a number of coordinated Cl� around La3þ equal to 6.7,
Handbook on the Physics and Chemistry of Rare Earths158
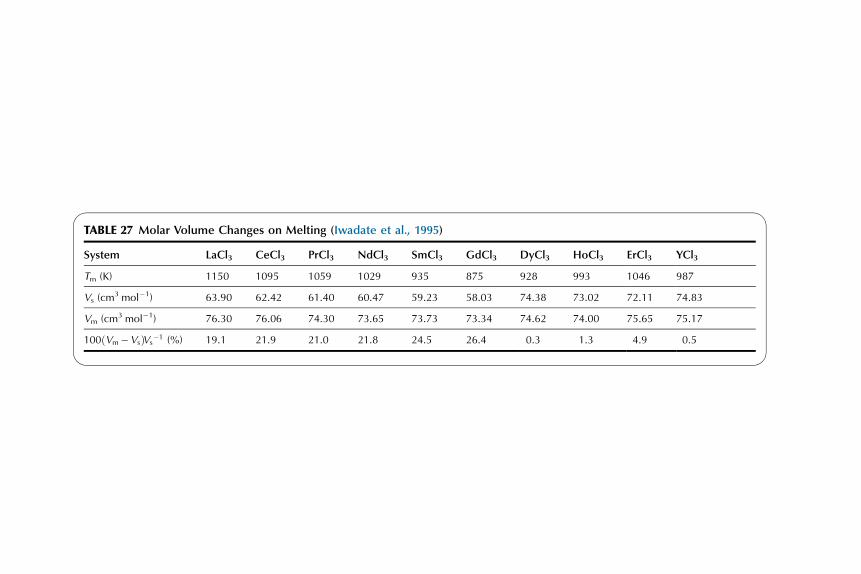
TABLE 27 Molar Volume Changes on Melting (Iwadate et al., 1995)
System LaCl3 CeCl3 PrCl3 NdCl3 SmCl3 GdCl3 DyCl3 HoCl3 ErCl3 YCl3
Tm (K) 1150 1095 1059 1029 935 875 928 993 1046 987
Vs (cm3 mol�1) 63.90 62.42 61.40 60.47 59.23 58.03 74.38 73.02 72.11 74.83
Vm (cm3 mol�1) 76.30 76.06 74.30 73.65 73.73 73.34 74.62 74.00 75.65 75.17
100 Vm�Vsð ÞVs�1 (%) 19.1 21.9 21.0 21.8 24.5 26.4 0.3 1.3 4.9 0.5

while integration to the first minimum at 3.86 A gives 8.2 as the
corresponding coordination number, and the authors think that the latter value
is preferable. But such a large CN requires the presence of many anion–anion
“contacts” in the melt, as pointed out by Hutchinson et al. (1999), which does
not seem to be logical. With the help of MD calculation and the structure fac-
tors reported by Wasse and Salmon (1999d), Madden et al. (2004) have
simulated similar data for the number of coordinated Cl� around La3þ by
integrating the La–Cl pdf up to the first minimum. The experimental results
are thought to be quite reliable and the calculation procedures are correct,
within the definitions of CN used. However, we would like to draw the atten-
tion of the readers on the conclusions of Sections 4.2.5 and 4.2.6. The values
of CNs are directly influenced by the definitions adopted for CN, the integra-
tion range, and whether penetration of the coordination shell of Cl–Cl pairs
into that of La–Cl pairs occurs or not. The simulated pdfs of molten LaCl3and molten YCl3 suggest the importance of the integration range in the eval-
uation of the nearest-neighbor CN (Hutchinson et al., 1999), as illustrated in
Fig. 38. In fact, the first coordination shell of Cl–Cl pairs penetrates deeply
FIGURE 38 Partial pair distribution functions for (A) LaCl3. [The inset shows the effect of
including cation polarization on gLaCl(r).] (B) TbCl3 and (C) YCl3 with peak positions displayed.
In (C), molecular models are given for YCl3, showing several of the Y–CI, Y–Y, and Cl–Cl inter-
ionic distances corresponding to the various peaks (bold lines). Reproduced with permission from
Hutchinson et al. (1999), © 1999 American Institute of Physics.
Handbook on the Physics and Chemistry of Rare Earths160
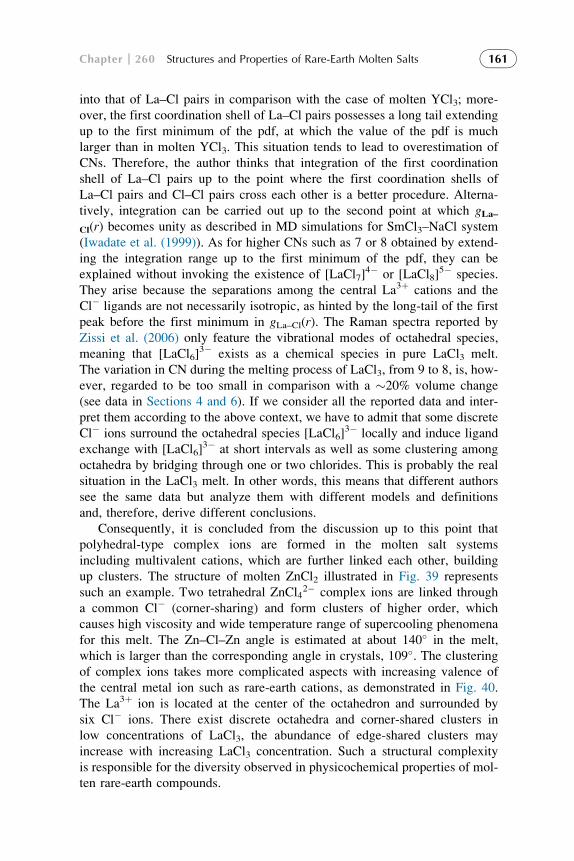
into that of La–Cl pairs in comparison with the case of molten YCl3; more-
over, the first coordination shell of La–Cl pairs possesses a long tail extending
up to the first minimum of the pdf, at which the value of the pdf is much
larger than in molten YCl3. This situation tends to lead to overestimation of
CNs. Therefore, the author thinks that integration of the first coordination
shell of La–Cl pairs up to the point where the first coordination shells of
La–Cl pairs and Cl–Cl pairs cross each other is a better procedure. Alterna-
tively, integration can be carried out up to the second point at which gLa–Cl(r) becomes unity as described in MD simulations for SmCl3–NaCl system
(Iwadate et al. (1999)). As for higher CNs such as 7 or 8 obtained by extend-
ing the integration range up to the first minimum of the pdf, they can be
explained without invoking the existence of [LaCl7]4� or [LaCl8]
5� species.
They arise because the separations among the central La3þ cations and the
Cl� ligands are not necessarily isotropic, as hinted by the long-tail of the first
peak before the first minimum in gLa–Cl(r). The Raman spectra reported by
Zissi et al. (2006) only feature the vibrational modes of octahedral species,
meaning that [LaCl6]3� exists as a chemical species in pure LaCl3 melt.
The variation in CN during the melting process of LaCl3, from 9 to 8, is, how-
ever, regarded to be too small in comparison with a �20% volume change
(see data in Sections 4 and 6). If we consider all the reported data and inter-
pret them according to the above context, we have to admit that some discrete
Cl� ions surround the octahedral species [LaCl6]3� locally and induce ligand
exchange with [LaCl6]3� at short intervals as well as some clustering among
octahedra by bridging through one or two chlorides. This is probably the real
situation in the LaCl3 melt. In other words, this means that different authors
see the same data but analyze them with different models and definitions
and, therefore, derive different conclusions.
Consequently, it is concluded from the discussion up to this point that
polyhedral-type complex ions are formed in the molten salt systems
including multivalent cations, which are further linked each other, building
up clusters. The structure of molten ZnCl2 illustrated in Fig. 39 represents
such an example. Two tetrahedral ZnCl42� complex ions are linked through
a common Cl� (corner-sharing) and form clusters of higher order, which
causes high viscosity and wide temperature range of supercooling phenomena
for this melt. The Zn–Cl–Zn angle is estimated at about 140� in the melt,
which is larger than the corresponding angle in crystals, 109�. The clustering
of complex ions takes more complicated aspects with increasing valence of
the central metal ion such as rare-earth cations, as demonstrated in Fig. 40.
The La3þ ion is located at the center of the octahedron and surrounded by
six Cl� ions. There exist discrete octahedra and corner-shared clusters in
low concentrations of LaCl3, the abundance of edge-shared clusters may
increase with increasing LaCl3 concentration. Such a structural complexity
is responsible for the diversity observed in physicochemical properties of mol-
ten rare-earth compounds.
Chapter 260 Structures and Properties of Rare-Earth Molten Salts 161

In summary, we have tried to comprehend the structures and properties
of rare-earth molten salts by critically discussing the following points. (1)
Definitions of molten salts as liquids; (2) crystal structures of rare-earth
halides; (3) melt structure of rare-earth halides analyzed by diffraction,
Raman spectroscopy, and other techniques; (4) methodology for obtaining
structural information from diffraction experiments: definition of the RDF,
estimation of nearest-neighbor coordination number from RDF, stability of
the nearest-neighbor coordination shell, and penetration effect of the second
FIGURE 39 Tetrahedral complex ions and clustering in molten ZnCl2. Reproduced with per-
mission from Iwadate et al. (2004), © 2004 Elsevier.
FIGURE 40 Conceptual diagram of high-ordered clustering of octahedral units in the LaCl3mixture melt (LaCl3 concentration: low)high); white balls: La3þ; gray balls: Cl�. Reproducedfrom Photiadis et al. (1998), © 1998 Royal Society of Chemistry and Iwadate et al. (2009),
© 2009 Electrochemical Society of Japan.
Handbook on the Physics and Chemistry of Rare Earths162

coordination shell; (5) density of rare-earth halides in solid and molten
states. The properties listed above are static properties and represent merely
half of all properties of the melts. Dynamic properties of rare-earth com-
pounds in solid and molten states, such as diffusion, viscous flow, electrical
conduction, thermal conduction, ligand exchange, are largely unexplored
and should be investigated. Experimental techniques are presently available,
for instance, high-temperature NMR which has been developed in recent
years. Acquiring both dynamic and static properties of molten rare-earth com-
pounds will benefit their global understanding. Moreover, macroscopic prop-
erties permit the discussion of microscopic properties and the reverse
procedure should be implemented too. Therefore, correct application of theory
to the real systems is highly desirable.
ACKNOWLEDGMENTS
The author would like to express my sincere gratitude to Professor Karl A. Gschneidner,
Jr. for giving me the opportunity to write for the Handbook on the Physics and Chemistry
of Rare Earths. The author would particularly like to thank Professor Gin-ya Adachi and
Professor Jean-Claude Bunzli for their arrangements, encouragements, and patience in the
course of publication. My deepest appreciation also goes to the members of “Molten salt
committee, The Electrochemical Society of Japan” for discussions, in particular, to
Professor Junichi Mochinaga. Finally, special thanks would be dedicated to Kato
Foundation for Promotion of Science, Japan for financial supports making possible part of
our experiments.
LIST OF ACRONYMS
CN coordination number
DOS density of states
ESRF European Synchrotron Radiation Facility
EXAFS extended X-ray absorption fine structure
FSDP first sharp diffraction peak
LDFCS limiting distance of the first coordination shell
MC Monte Carlo simulation
MD molecular dynamics simulation
ND neutron diffraction
pdf pair distribution function
PIM polarizable ion model
Raman Raman spectroscopy
RDF radial distribution function
RE rare-earth element
RIM rigid ion model
XAFS X-ray absorption fine structure
XRD X-ray diffraction
Chapter 260 Structures and Properties of Rare-Earth Molten Salts 163

REFERENCES
Adams, D.J., McDonald, I.R., 1974. J. Phys. C: Solid State Phys. 7, 2761.
Adya, A.K., 2002. In: Gaune-Escard, M. (Ed.), Molten Salts: From Fundamentals to Applications.
Kluwer Academic Publishers, London, p. 107.
Adya, A.K., 2003. In: Proceedings of International Symposium on Ionic Liquids in Honour of
Marcelle Gaune-Escard, June 26-28, 2003. Carry le Rouet, France, 411.
Akdeniz, Z., Tosi, M.P., 1992. Proc. R. Soc. Lond. Ser. A 437, 85.
Akdeniz, Z., Price, D.L., Saboungi, M.-L., Tosi, M.P., 1998. Plasmas & Ions 1, 3.
Allen, D.A., Howe, R.A., Wood, N.D., Howells, W.S., 1991. J. Chem. Phys. 94, 5071.
Badyal, Y.S., Allen, D.A., Howe, R.A., 1994. J. Phys. Condens. Matter 6, 10193.
Badyal, Y.S., Saboungi, M.-L., Price, D.L., Haeffner, D.R., Shastri, S.D., 1997. Europhys. Lett.
39, 19.
Bell, M.C., Flengas, S.N., 1964. J. Electrochem. Soc. 569–575, 111.
Biggin, S., Enderby, J.E., 1981. J. Phys. C: Solid State Phys. 14, 3577.
Biggin, S., Gay, M., Enderby, J.E., 1984. J. Phys. C 17, 977.
Bloom, H., Knaggs, I.W., Molloy, J.J., Welch, D., 1953. Trans. Faraday Soc. 49, 1458.
Busing, W.R., Levy, H.A., 1962. Oak Ridge Natl. Lab. Rept. ORNL-TM-271.
Cho, K., Irisawa, K., Mochinaga, J., Kuroda, T., 1972. Electrochim. Acta 17, 1821.
Chrissanthopoulos, A., Papatheodorou, G.N., 2006. J. Mol. Struct. 782, 130.
Chrissanthopoulos, A., Papatheodorou, G.N., 2008. J. Mol. Struct. 892, 93.
Coulson, C.A., Rushbrooke, G.S., 1939. Phys. Rev. 56, 1239.
Dixon, M., Sangster, M.J.L., 1975. J. Phys. C: Solid State Phys. 8, L8.
Dixon, M., Sangster, M.J.L., 1976a. J. Phys. C: Solid State Phys. 9, 909.
Dixon, M., Sangster, M.J.L., 1976b. J. Phys. C: Solid State Phys. 9, L5.
Dracopoulos, V., Gilbert, B., B�rrensen, B., Photiadis, G.M., Papatheodorou, G.N., 1997. J.
Chem. Soc. Faraday Trans. 93, 3081.
Dracopoulos, V., Gilbert, B., Papatheodorou, G.N., 1998. J. Chem. Soc. Faraday Trans. 94, 2601.
Edwards, J.D., Taylor, C.S., Russell, A.S., Maranville, L.F., 1952. J. Electrochem. Soc. 99, 527.
Egelstaff, P.A., 1967. An Introduction to the Liquid State. Academic Press, London p. 46.
Enderby, J.E., Biggin, S., 1983. In: Mamantov, G., Mamantov, C.B. (Eds.), Advances in Molten
Salt Chemistry5, Elsevier, Amsterdam, p. 1.
Forrester, J.D., Zalkin, A., Templeton, D.H., Wallmann, J.C., 1964. Inorg. Chem. 3, 185.
Frame, J.P., Rhodes, E., Ubbelohde, A.R., 1959. Trans. Faraday Soc. 55, 2039.
Fukushima, K., Koseki, S., Wakabayashi, K., Yamane, S., Iwadate, Y., 1997. J. Alloys Compd.
261, 198.
Fukushima, K., Okamoto, Y., Iwadate, Y., 2005. J. Phys. Chem. Solids 66, 414.
Furukawa, K., 1961. Discuss. Faraday Soc. 32, 53.
Furukawa, K., 1962. Rep. Prog. Phys. 34, 395.
Furukawa, K., Ohno, H., 1973. Bussei Kenkyu 19, 1335.
Gear, G.W., 1971. Numerical Initial Value Problems in Ordinary Differential Equations. Prentice
Hall, Englewood Cliffs, NJ.
Gebhardt, E., Becker, M., 1943. Z. Metallkunde 39, 314.
Gingrich, N.S., 1943. Rev. Mod. Phys. 15, 90.
Glover, W.J., Madden, P.A., 2004. J. Chem. Phys. 121, 7293.
Husband, L.J.B., 1958. J. Sci. Instrum. 35, 300.
Hutchinson, F., Rowley, A.J., Walters, M.K., Wilson, M., Madden, P.A., Wasse, J.C.,
Salmon, P.S., 1999. J. Chem. Phys. 111, 2028.
Handbook on the Physics and Chemistry of Rare Earths164

Hutchinson, F., Wilson, M., Madden, P.A., 2000. J. Phys. Condens. Matter 12, 10389.
Hutchinson, F., Wilson, M., Madden, P.A., 2001. Mol. Phys. 99, 811.
Igarashi, K., Kosaka, M., Ikeda, M., Mochinaga, J., 1990. Z. Naturforsch. 45a, 623.
Inui, M., Takeda, S., Shirakawa, Y., Tamaki, S., Waseda, Y., Yamaguchi, Y., 1991. J. Phys. Soc.
Jpn. 60, 3025.
Iwadate, Y., 2011. In: Adachi, G. (Ed.), Rare Metal Binran, Maruzen, Tokyo, II-376.
Iwadate, Y., Fukushima, K., Igarashi, K., Mochinaga, J., 1992. J. Fac. Eng. Chiba Univ. 44, 31.
Iwadate, Y., Iida, T., Fukushima, K., Mochinaga, J., Gaune-Escard, M., 1994. Z. Naturforsch.
49a, 811.
Iwadate, Y., Okako, N., Koyama, Y., Kubo, H., Fukushima, K., 1995. J. Mol. Liq. 65/66, 369.
Iwadate, Y., Yamoto, H., Fukushima, K., 1998. Molten Salt Forum 5–6, 193.
Iwadate, Y., Yamoto, H., Fukushima, K., Takagi, R., 1999. J. Mol. Liq. 83, 41.
Iwadate, Y., Seki, Y., Fukushima, K., Misawa, M., Fukunaga, T., 2001a. J. Phys. Soc. Jpn. 70
(Suppl. A), 359.
Iwadate, Y., Kenmotsu, H., Mori, T., Fukushima, K., Misawa, M., Fukunaga, T., 2001b. J.
Non-Crystal. Solids 293–295, 586.
Iwadate, Y., Fukushima, K., Seki, Y., Itoh, K., Fukunaga, T., Misawa, M., Matsuura, H.,
Kajinami, A., Ohtori, N., Umesaki, N., Kofuji, H., Myochin, M., 2004. Sci. Technol. Adv.
Mater. 5, 683.
Iwadate, Y., Seki, Y., Fukushima, K., Misawa, M., Fukunaga, T., Itoh, K., Nakazawa, T.,
Okamoto, Y., Matsuura, H., Kajinami, A., Ohtori, N., Umesaki, N., 2005. J. Phys. Chem.
Solids 66, 433.
Iwadate, Y., Suzuki, K., Onda, N., Fukushima, K., Watanabe, S., Kajinami, A., Takase, K.,
Ohtori, N., Umesaki, N., Kofuji, H., Myochin, M., 2006. J. Alloys Compd. 408–412, 248.
Iwadate, Y., Matsuura, H., Kajinami, A., Takase, K., Ohtori, N., Umesaki, N., Fujita, R.,
Mizuguchi, K., Kofuji, H., Myochin, M., 2009. Electrochemistry 77, 736.
Iwamoto, N., Umesaki, N., Asahina, T., Kosaka, M., 1982. Nippon Kinzoku Gakkaishi 46, 920.
Janz, G.J., 1988. J. Phys. Chem. Ref. Data 17 (Suppl. 2).
Janz, G.J., Dampier, F.W., Lakshminarayanan, G.R., Lorenz, P.K., Tomkins, R.P.T., 1968.
Electrical Conductance, Density, and Viscosity Data. NSRDS-NBS 15 (National Standard
Reference Data Series-National Bureau of Standards 15). Molten SaltsVol. 1. U.S. Government
Printing Office, Washington, DC.
Janz, G.J., Krebs, U., Siegenthaler, H.F., Tomkins, R.P.T., 1972. J. Phys. Chem. Ref. Data 1, 581.
Janz, G.J., Tomkins, R.P.T., Allen, C.B., Downey Jr., J.R., Gardner, G.L., Krebs, U., Singer, S.K.,
1975. J. Phys. Chem. Ref. Data 4, 871.
Karnicky, J.F., Pings, C.J., 1976. In: Prigogine, I., Rice, S.A. (Eds.), Advances in Chemical
Physics, vol. 34. John Wiley and Sons, New York, p. 159.
Kim, K., Sato, Y., Shimakage, K., Ejima, T., 1987. J. Japan Inst. Metals 51, 630.
Kirshenbaum, A.D., Cahill, J.A., Stokes, C.S., 1960. J. Inorg. Nucl. Chem. 15, 297.
Klemm, W., 1926. Z. Anorg. Chem. 235–295, 152.
Krogh-Moe, K., Ostvolt, T., F�rland, T., 1969. Acta Chem. Scand. 23, 2421.
Kruh, R.F., 1962. Chem. Rev. 62, 395.
Kutscher, J., Schneider, A., 1974. Z. Anorg. Allg. Chem. 408, 121.
Lantelme, F., Turq, P., Quentrec, B., Lewis, L.W., 1974. Mol. Phys. 28, 1537.
Levy, H.A., Agron, P.A., Bredig, M.A., Danford, M.D., 1960. Ann. N. Y. Acad. Sci. 79, 762.
Levy, H.A., Danford, M.D., Narten, A.H., 1966. Oak ridge national laboratory report 3960.
Lewis, L.W., Singer, K., 1975. J. Chem. Soc. Faraday Trans. II 71, 41.
Lewis, L.W., Singer, K., Woodcock, L.V., 1975. J. Chem. Soc. Faraday Trans. II 71, 301.
Chapter 260 Structures and Properties of Rare-Earth Molten Salts 165

Lindemann, F.A., 1910. Z. Phys. 11, 609.
Madden, P.A., Wilson, M., Hutchinson, F., 2004. J. Chem. Phys. 120, 6609.
Marcus, Y., 1977. Introduction to Liquid State Chemistry. John Wiley & Sons, London, p.122.
Maroni, V.A., Hathaway, E.J., Papatheodorou, G.N., 1974. J. Phys. Chem. 78, 1134.
Matsuoka, A., Fukushima, K., Igarashi, K., Iwadate, Y., Mochinaga, J., 1993. Nippon Kagaku
Kaishi 471.
Matsuura, H., Adya, A.K., Bowron, D.T., 2001. J. Synchrotron Rad. 8, 779.
Matsuura, H., Watanabe, S., Akatsuka, H., Okamoto, Y., Adya, A.K., 2009. J. Fluorine Chem.
130, 53.
Mellors, G.W., Senderoff, S., 1960. J. Phys. Chem. 64, 294.
Metallinou, M.M., Nalbandian, L., Papatheodorou, G.N., Voigt, W., Emons, H.H., 1991. Inorg.
Chem. 30, 4260.
Michilsen, J., Worlee, P., Graaff, F.V.d., Ketelaar, J.A.A., 1975. J. Chem. Soc. Faraday Trans. II
71, 1730.
Mikolaj, P.G., Pings, C.J., 1968. Phys. Chem. Liq. 1, 93.
Miyamato, Y., Okazaki, S., Odawara, O., Okada, I., Misawa, M., Fukunaga, T., 1994. Mol. Phys.
82, 887.
Mochinaga, J., Iwadate, Y., Fukushima, K., 1991. Mater. Sci. Forum 73–75, 147.
Mochinaga, J., Ikeda,M., Igarashi, K., Fukushima, K., Iwadate, Y., 1993a. J. Alloys Compd. 193, 36.
Mochinaga, J., Miyagi, Y., Igarashi, K., Fukushima, K., Iwadate, Y., 1993b. Nippon Kagaku
Kaishi 459.
Momma, K., Izumi, F., 2011. J. Appl. Crystallogr. 44, 1272.
Mozzi, R.L., Warren, B.E., 1969. J. Appl. Crystallogr. 2, 164.
Murase, K., 1999a. In: Adachi, G. (Ed.), Kidorui-no-kagaku (Science of Rare Earths). Kagakudojin,
Kyoto, p. 322.
Murase, K., 1999b. In: Adachi, G. (Ed.), Kidorui-no-kagaku (Science of Rare Earths). Kagakudojin,
Kyoto, p. 323.
Murase, K.A., Adachi, G., Zissi, G.D., Boghosian, S., Papatheodorou, G.N., 1994. J. Non-Crystal.
Solids 180, 88.
Nakamoto, K., 1978. Infrared and Raman Spectra of Inorganic and Coordination Compounds, 3rd
ed. John Wiley & Sons, New York p. 153.
Nakamura, T., 1983. Molten Salt 26, 181.
Nakamura, Y., 1993. Ceramics 28, 1221.
Narten, A.H., 1972. J. Chem. Phys. 56, 1905.
Narten, A.H., Levy, H.A., 1969. Science 165, 447.
Narten, A.H., Danford, M.D., Levy, H.A., 1967. Discus Faraday Soc. 43, 97.
Neithamer, R.W., Peake, J.S., 1961. J. Chem. Eng. Data 6, 197.
Newport, R.J., Howe, R.A., Wood, N.D., 1985. J. Phys. C 18, 5249.
Nose, S., 1984. J. Chem. Phys. 81, 511.
Numakura, M., Okamoto, Y., Yaita, T., Shiwaku, H., Akatsuka, H., Nezu, A., Tajima, K.,
Shimohara, Y., Bessada, C., Pauvert, O., Zanghi, D., Chamelot, P., Matsuura, H., 2010. J.
Fluorine Chem. 131, 1039.
Ohno, H., Furukawa, K., 1981. J. Chem. Soc. Faraday Trans. I 77, 1981.
Ohno, H., Furukawa, K., 1983. J. Chem. Soc. Faraday Trans. II 79, 463.
Ohno, H., Yoroki, M., Furukawa, K., Takagi, Y., Nakamura, T., 1978a. J. Chem. Soc. Faraday
Trans. I 74, 1861.
Ohno, H., Furukawa, K., Tanemoto, K., Takagi, Y., Nakamura, T., 1978b. J. Chem. Soc. Faraday
Trans. I 74, 804.
Handbook on the Physics and Chemistry of Rare Earths166

Ohno, H., Igarashi, K., Umesaki, N., Furukawa, K., 1994. X-ray Diffraction Analysis of Ionic
Liquids. Trans Tech Publications, Zurich.
Ohtaki, H., 1982. Rev. Inorg. Chem. 4, 103.
Okada, I., Takagi, R., Kawamura, K., 1980. Z. Naturforsch. 35a, 493.
Okamoto, Y., Ogawa, T., 1999a. Z. Naturforsch. 54a, 91.
Okamoto, Y., Ogawa, T., 1999b. Z. Naturforsch. 54a, 599.
Okamoto, Y., Hayashi, H., Ogawa, T., 1996. J. Non-Crystal. Solids 205–207, 139.
Okamoto, Y., Kobayashi, F., Ogawa, T., 1998. J. Alloys Compd. 271–273, 355.
Okamoto, Y., Hayashi, H., Ogawa, T., 1999. Jpn. J. Appl. Phys. 38 (Suppl. 38–1), 156.
Okamoto, Y., Akabori,M.,Motohashi, H., Shiwaku, H., Ogawa, T., 2001. J. SynchrotronRad. 8, 1191.
Okamoto, Y., Akabori, M., Motohashi, H., Itoh, A., Ogawa, T., 2002. Nucl. Instrum. Meth. Phys.
Res. A 487, 605.
Okamoto, Y., Iwadate, Y., Fukushima, K., Matsuura, H., Minato, K., 2005. J. Phys. Chem. Solids
66, 452.
Papatheodorou, G.N., 1975. Inorg. Nucl. Chem. Lett. 11, 483.
Papatheodorou, G.N., 1977. J. Chem. Phys. 66, 2893.
Papatheodorou, G.N., �stvold, T., 1974. J. Phys. Chem. 78, 181.
Pavlatou, E.A., Madden, P.A., Wilson, M., 1997. J. Chem. Phys. 107, 10446.
Peake, J.S., Bothwell, M.R., 1954. J. Am. Chem. Soc. 76, 2653.
Pettifor, D.G., 1986. J. Phys. C 19, 285.
Photiadis, G.M., B�rresen, B., Papatheodorou, G.N., 1998. J. Chem. Soc. Faraday Trans. 94, 2605.
Pings, C.J., 1968. In: Temperly, H.N.V., Rowlinson, J.S., Rushbrooke, G.S. (Eds.), Physics of
Simple Liquids. North Holland Publishing Co., Amsterdam Chapter 10.
Price, D.L., Saboungi, M.-L., Hashimoto, S., Moss, S.C., 1992. In: Gale, R.J., Blomgren, G.,
Kojima, H. (Eds.), Proceedings of the 8th International Symposium on Molten Salts, Electro-
chem. Soc., 199214.
Price, D.L., Saboungi, M.-L., Howells, W.S., Tosi, M.P., 1993. In: Proceedings of the International
Symposium on Molten Salt Chemistry and Technology, May 16-21, 1993. Hawaii, PV93-91.
Rollet, A.-L., Bessada, C., Auger, Y., Melin, P., Gailhanou, M., Thiaudiere, D., 2004. Nucl.
Instrum. Meth. Phys. Res. B 226, 447.
Romano, S., McDonald, I.R., 1973. Physica 67, 625.
Saboungi, M.-L., Howe, M.A., Price, D.L., 1990. In: Proceedings of the Seventh International
Symposium on Molten Salts, May 6-11, 1990. Electrochem. Soc., Montreal, p. 8.
Saboungi, M.-L., Price, D.L., Scamehorn, C., Tosi, M.P., 1991. Europhys. Lett. 15, 283.
Saboungi, M.-L., Howe, M.A., Price, D.L., 1993. Mol. Phys. 79, 847.
Sangster, M.L.J., Dixon, M., 1976. Adv. Phys. 25, 247.
Sato, Y., Yamamura, T., 1992. Met. Rev. MMIJ 9, 100.
Sayers, D.E., Stern, E.A., Lytle, F.W., 1971. Phys. Rev. Lett. 27, 1204.
Sears, V.F., 1992. Neutron News 3, 26.
Sen, S., Zissi, G.D., Papatheodorou, G.N., 2000. J. Phys. Condens. Matter 12, 2885.
Shannon, R.D., 1976. Acta Crystal. A32, 751.
Shirakawa, Y., Saito, M., Tamaki, S., lnui, M., Takeda, S., 1991. J. Phys. Soc. Jpn. 60, 2678.
Spooner, R.C., Wetmore, F.E.W., 1951. Can. J. Chem. 29, 777.
Suzuki, K., Fukushima, Y., 1977. Z. Naturforsch. 32a, 1438.
Takagi, Y., Nakamura, T., 1985. Phil. Mag. 51, L43.
Takagi, R., Tomita, M., 1993. Z. Naturforsch. 48a, 1239.
Takagi, R., Okada, I., Kawamura, K., 1975. Bull. Tokyo Inst. Technol. 127, 45.
Takagi, R., Ohno, H., Furukawa, K., 1979. J. Chem. Soc. Faraday Trans. I 75, 1477.
Chapter 260 Structures and Properties of Rare-Earth Molten Salts 167

Takagi, R., Hutchinson, F., Madden, P.A., Adya, A.K., Gaune-Escard, M., 1999. J. Phys. Con-
dens. Matter 11, 645.
Takahashi, S., Koura, N., Muneta, T., Ohno, H., 1985a. J. Chem. Soc. Faraday Trans. II 81, 319.
Takahashi, S., Muneta, T., Koura, N., Ohno, H., 1985b. J. Chem. Soc. Faraday Trans. II 81, 1107.
Tatlipinar, H., Akdeniz, Z., Pastore, G., Tosi, M.P., 1992. J. Phys. Condens. Matter 4, 8933.
Templeton, D.H., Carter, G.F., 1954. Acta Crystallogr. 58, 940.
Tosi, M.P., 1994a. Z. Phys. Chem. 184, S121.
Tosi, M.P., 1994b. J. Phys. Condens. Matter 6, A13.
Tosi, M.P., Price, D.L., Saboungi, M.-L., 1993. Annu. Rev. Phys. Chem. 44, 173.
Umesaki, N., Ohno, H., Iwamoto, N., 1991. In: Doyama, M., Suzuki, T., Kihara, J., Yamamoto, R.
(Eds.), Computer Aided Innovation of New Materials. Elsevier Science Publishing, BV,
Amsterdam, pp. 911–914.
Vaslow, F., Narten, A.H., 1973. J. Chem. Phys. 59, 4949.
Warren, B.E., Krutter, H., Morningstar, O., 1936. J. Am. Ceram. Soc. 19, 202.
Waseda, Y., 1980a. The Structure of Non-Crystalline Materials. McGraw-Hill, New York p. 41.
Waseda, Y., 1980b. The Structure of Non-Crystalline Materials. McGraw-Hill, New York p. 188.
Waseda, Y., Ohtani, M., 1971a. Senkenshu 27, 117.
Waseda, Y., Ohtani, M., 1971b. Senkenshu 27, 127.
Wasse, J.C., Salmon, P.S., 1998. Phys. B 241–243, 967.
Wasse, J.C., Salmon, P.S., 1999a. J. Phys. Condens. Matter 11, 2171.
Wasse, J.C., Salmon, P.S., 1999b. J. Phys. Condens. Matter 11, 9293.
Wasse, J.C., Salmon, P.S., 1999c. J. Phys. Condens. Matter 11, 13.
Wasse, J.C., Salmon, P.S., 1999d. J. Phys. Condens. Matter 11, 1381.
Wasse, J.C., Salmon, P.S., Delaplane, R.G., 2000. J. Phys. Condens. Matter 12, 9539.
Watanabe, S., Adya, A.K., Okamoto, Y., Umesaki, N., Honma, T., Deguchi, H., Horiuchi, M.,
Yamamoto, T., Noguchi, S., Takase, K., Kajinami, A., Sakamoto, T., Hatcho, M.,
Kitamura, N., Akatsuka, H., Matsuura, H., 2006. J. Alloys Compd. 408–412, 71.
Wilson, M., Madden, P.A., 1993. J. Phys. Condens. Matter 5, 6833.
Wilson, M., Madden, P.A., 1998. Phys. Rev. Lett. 80, 532.
Wood, N.D., Howe, R.A., 1988. J. Phys. C 21, 3177.
Wood, N.D., Howe, R.A., Newport, R.J., Faber Jr., J., 1988. J. Phys. C 21, 669.
Woodcock, L.V., 1971. Chem. Phys. Lett. 10, 257.
Woodcock, L.V., Singer, K., 1971. Trans. Faraday Soc. 67, 12.
Wyckoff, R.W.G., 1964. Crystal Structures. vol. 2. Interscience, New York p. 45.
Yaffe, I.S., van Artsdalen, E.R., 1956. Chemistry division semiannual progress report, oak ridge
national laboratory, ORNL-2159, p.77
Zarzycki, J., 1957. J. Phys. Rad. Suppl. Phys. Appl. 18, 65A.
Zarzycki, J., 1958. J. Phys. Rad. Suppl. Phys. Appl. 19, 13A.
Zissi, G.D., Papatheodorou, G.N., 1999. Chem. Phys. Lett. 308, 51.
Zissi, G.D., Papatheodorou, G.N., 2002. J. Chem. Soc. Dalton Trans. 2599.
Zissi, G.D., Papatheodorou, G.N., 2004. Phys. Chem. Chem. Phys. 6, 4480.
Zissi, G.D., Chrissanthopoulos, A., Papatheodorou, G.N., 2006. Vibration. Spectrosc. 40, 110.
Handbook on the Physics and Chemistry of Rare Earths168

Chapter 261
Lanthanides in Solar EnergyConversion
Jean-Claude G. Bunzli*,{ and Anne-Sophie Chauvin{*Department of Materials Chemistry, WCU Center for Next Generation Photovoltaic Systems,
Korea University, Sejong Campus, Sejong-si, Republic of Korea{Swiss Federal Institute of Technology Lausanne (EPFL), Institute of Chemical Sciences and
Engineering, Lausanne, Switzerland
Dedicated to Professor Renata Reisfeld for her pioneering work in photovoltaics
Chapter Outline1. Introduction 170
1.1. The Challenges 170
1.2. Role of Rare Earths in
Photovoltaic Systems 174
2. Luminescent Solar
Concentrators 175
2.1. Definitions and Basic
Properties 175
2.2. Downshifting into the
NIR Spectral Range 178
2.3. Downshifting into the
Visible Spectral Range 181
2.4. Other Rare-Earth
Materials for LSCs 186
2.5. What’s Next? 186
3. Silicon-Based Solar Cells 187
3.1. General Considerations 187
3.2. Downconverting
Materials 190
3.3. Downshifting
Materials 201
3.4. Upconverting
Materials 205
3.5. Antireflection Coatings 223
3.6. Practical Implementation
of Lanthanide Materials
in Si Cells 225
4. Solar Cells with Semiconductors
Other Than Silicon 226
5. Dye-Sensitized Solar Cells 229
5.1. Description and Relevant
Parameters 229
5.2. Scattering Layer 240
5.3. Titanium Oxide
Modification 241
5.4. Inorganic Downshifting
Materials 245
5.5. Metal Complexes as Dyes
or Downshifting
Materials 251
5.6. Upconverting
Materials 256
Handbook on the Physics and Chemistry of Rare Earths, Vol. 44.
http://dx.doi.org/10.1016/B978-0-444-62711-7.00261-9
Copyright © 2014 Elsevier B.V. All rights reserved. 169
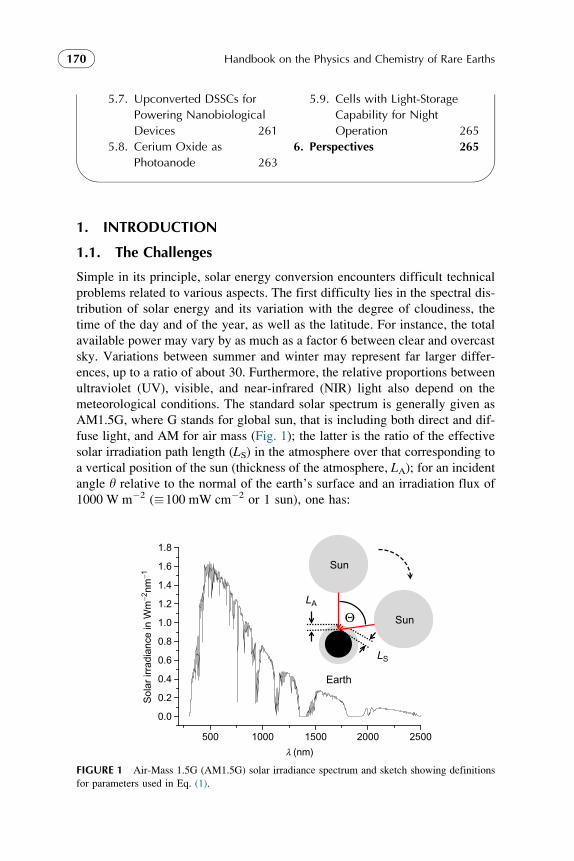
5.7. Upconverted DSSCs for
Powering Nanobiological
Devices 261
5.8. Cerium Oxide as
Photoanode 263
5.9. Cells with Light-Storage
Capability for Night
Operation 265
6. Perspectives 265
1. INTRODUCTION
1.1. The Challenges
Simple in its principle, solar energy conversion encounters difficult technical
problems related to various aspects. The first difficulty lies in the spectral dis-
tribution of solar energy and its variation with the degree of cloudiness, the
time of the day and of the year, as well as the latitude. For instance, the total
available power may vary by as much as a factor 6 between clear and overcast
sky. Variations between summer and winter may represent far larger differ-
ences, up to a ratio of about 30. Furthermore, the relative proportions between
ultraviolet (UV), visible, and near-infrared (NIR) light also depend on the
meteorological conditions. The standard solar spectrum is generally given as
AM1.5G, where G stands for global sun, that is including both direct and dif-
fuse light, and AM for air mass (Fig. 1); the latter is the ratio of the effective
solar irradiation path length (LS) in the atmosphere over that corresponding to
a vertical position of the sun (thickness of the atmosphere, LA); for an incident
angle y relative to the normal of the earth’s surface and an irradiation flux of
1000 W m�2 (�100 mW cm�2 or 1 sun), one has:
500 1000 1500 2000 2500
0.0
0.2
0.4
0.6
0.8
1.0
1.2
1.4
1.6
1.8
l (nm)
Sun
LA
Sun
LS
Earth
Θ
Sol
ar ir
radi
ance
in W
m-2
nm-1
FIGURE 1 Air-Mass 1.5G (AM1.5G) solar irradiance spectrum and sketch showing definitions
for parameters used in Eq. (1).
Handbook on the Physics and Chemistry of Rare Earths170
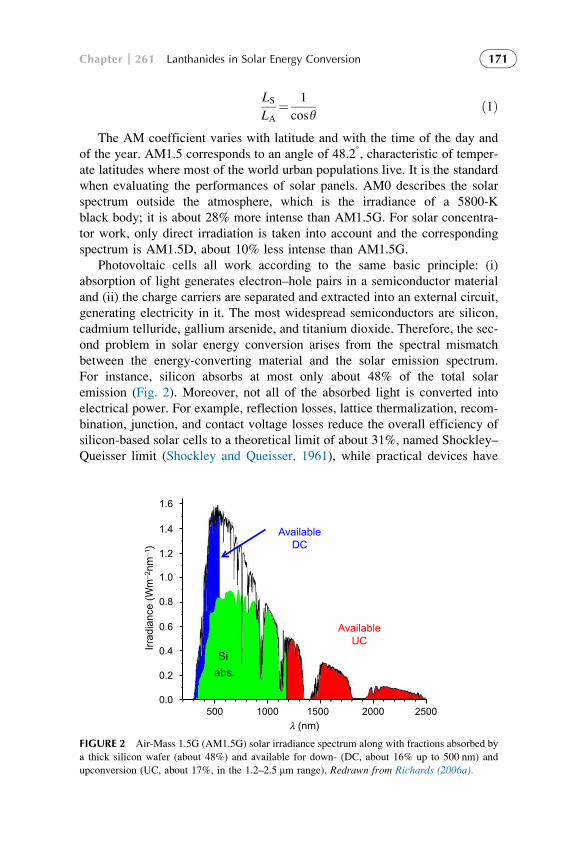
LSLA¼ 1
cosyð1Þ
The AM coefficient varies with latitude and with the time of the day and
of the year. AM1.5 corresponds to an angle of 48.2�, characteristic of temper-
ate latitudes where most of the world urban populations live. It is the standard
when evaluating the performances of solar panels. AM0 describes the solar
spectrum outside the atmosphere, which is the irradiance of a 5800-K
black body; it is about 28% more intense than AM1.5G. For solar concentra-
tor work, only direct irradiation is taken into account and the corresponding
spectrum is AM1.5D, about 10% less intense than AM1.5G.
Photovoltaic cells all work according to the same basic principle: (i)
absorption of light generates electron–hole pairs in a semiconductor material
and (ii) the charge carriers are separated and extracted into an external circuit,
generating electricity in it. The most widespread semiconductors are silicon,
cadmium telluride, gallium arsenide, and titanium dioxide. Therefore, the sec-
ond problem in solar energy conversion arises from the spectral mismatch
between the energy-converting material and the solar emission spectrum.
For instance, silicon absorbs at most only about 48% of the total solar
emission (Fig. 2). Moreover, not all of the absorbed light is converted into
electrical power. For example, reflection losses, lattice thermalization, recom-
bination, junction, and contact voltage losses reduce the overall efficiency of
silicon-based solar cells to a theoretical limit of about 31%, named Shockley–
Queisser limit (Shockley and Queisser, 1961), while practical devices have
500 1000 1500 2000 25000.0
0.2
0.4
0.6
0.8
1.0
1.2
1.4
AvailableUC
AvailableDC
l (nm)
Irra
dian
ce (
Wm
-2nm
-1)
Si
abs.
1.6
FIGURE 2 Air-Mass 1.5G (AM1.5G) solar irradiance spectrum along with fractions absorbed by
a thick silicon wafer (about 48%) and available for down- (DC, about 16% up to 500 nm) and
upconversion (UC, about 17%, in the 1.2–2.5 mm range). Redrawn from Richards (2006a).
Chapter 261 Lanthanides in Solar Energy Conversion 171

reached 25% with single crystalline silicon (c-Si). Cheaper polycrystalline sil-
icon (p-Si) gives inferior results (15–17%) although new fabrication techni-
ques have now boosted the efficiency of commercial panels up to 21%.
Slightly better yields are obtained with the so-called III–V cells featuring,
for instance, gallium arsenide (27.6%) or with multijunction devices such as
GaInP/GaAs/Ge displaying 32% yield (Green et al., 2012). The situation
seems to be less bright for dye-sensitized solar cells (DSSCs) which presently
reach only12% efficiency (Kalyanasundaram, 2010a; Yella et al., 2011),
but these devices present nevertheless definite advantages over Si or semicon-
ductor cells. For instance, contrary to other photovoltaic (PV) cells, they
feature separation of the two essential processes: light harvesting/charge
generation and charge transport. This is not the case for silicon-based cells,
which imposes harsh requirements on the purity of Si and, consequently,
considerably increases the cost of Si-based cells. For the time being, commer-
cial DSSC submodules having overall efficiency close to 10% are available
(Green et al., 2012).
One way toward improving the light-to-electricity conversion yield is to
concentrate the solar light on the photovoltaic devices so as to reach higher sur-
face powers and, consequently, better conversion. Presently, the record of these
“concentrator cells” is held by the multijunction, lattice-matched GaInP/GaAs/
GaInNAs–GaAs cell with 43.5% conversion efficiency under illumination
equivalent to 418 suns (Herb, 2012). Alternatively, a spectral-splitting module
comprising a pair of two-cell stacks (GaInP/GaAs and GaInAsP/GaInAs)
reached a photovoltaic efficiency of 38.5% under 20-sun irradiation; in this
design, a dichroic reflector is used to split the light beam into two subbeams
which are focused on the two different cell stacks (Green et al., 2012).
The other avenue for improving the conversion yield of solar cells derives
from the fact that these cells perform best under monochromatic light with a
wavelength lopt (in nm) given by the following equation:
lopt¼ 1240
Eg
nmð Þ ð2Þ
where the band gap energy Eg is in eV and 1240 is a unit conversion factor
(1 cm�1 corresponds to 1.24�10�4 eV). This corresponds, for instance, to
1127 nm for c-Si (Eg�1.1 eV) or to 690 nm for amorphous silicon (a-Si,
Eg�1.8 eV). Therefore, concentrating the 300- to 1500-nm solar emission
spectrum into a single narrow band spectrum corresponding to lopt would lead
to theoretical efficiencies close to 80% (van Sark et al., 2010). The present
state of the art is still far from this idealized goal, and the solution is
approached stepwise by introducing wavelength-converting layers responsive
to specific portions of the solar spectrum (Figs. 2 and 3).
For instance, the UV part of the solar spectrum can be harvested by lumi-
nescent compounds which then emit at a longer wavelength: the process is
Handbook on the Physics and Chemistry of Rare Earths172

known as wavelength downshifting (DS). Alternatively, a more complex
mechanism is downconversion (DC), or quantum cutting, in which the mate-
rial absorbs an energetic photon and emits two photons of lower energy.
In turn, the NIR portion of the spectrum can be harvested and two (or
more) low-energy photons transformed into one shorter wavelength photon
by upconversion (UC). Since upconversion is at least a two-photon process,
relatively large excitation powers are required, which explains why attempted
applications to solar energy conversion are relatively recent (Shalav et al.,
2003, 2007; Trupke et al., 2002b). Pairs of lanthanide ions involving a
sensitizer and a luminescent ion provide efficient upconversion systems, for
instance, YbIII/ErIII or YbIII/TmIII (Auzel, 2004). For Si cells, however,
upconverting systems featuring the sole ErIII ion are more adequate
(Marques-Hueso et al., 2011). Some transition metal ions, quantum dots
(QDs) (de Wild et al., 2011), and organic dyes (Cheng et al., 2012; Schulze
et al., 2012) are also prone to upconversion (Strumpel et al., 2007). Theoretical
calculations show that adding an upconversion layer to semiconductor multi-
junction cells could increase the absolute external quantum efficiency (EQE)
from about 40% to 50% under AM1.5G illumination (Trupke et al., 2006).
When it comes to devices, the wavelength-converting materials can be
incorporated into either the solar cell architecture (Fig. 4) or a luminescent
solar concentrator (LSC, Fig. 5). Downshifting and downconversion materials
are usually doped into thin layers grown on the top of the solar cell (Fig. 4A),
while upconverting layers are positioned at the bottom of the solar cell and the
emitted light is reflected toward the top of the cell by an additional reflection
layer (Fig. 4B). Both designs generate inconveniencies. The DS and DC
layers are often highly reflective so that reflection losses increase. In the case
of upconversion, NIR light may be absorbed by the top layers, leading to a
warming of the solar cell and diminished performances. An elegant solution
consists in splitting the solar light into two different beams with a dichroic
mirror (Fig. 4C) and to focus the two beams on two adequately tailored solar
cells. This design has been used in the spectral-splitting concentrator module
mentioned earlier. In the case of DSSCs, the wavelength-converting materials
Downshifting DS Downconversion DC Upconversion UC
FIGURE 3 Schematic representation of downshifting, downconversion, and upconversion
mechanisms.
Chapter 261 Lanthanides in Solar Energy Conversion 173

can be co-doped with the organic dye on titanium oxide particles (Fig. 4D) or,
possibly, in the electrolyte, which minimizes the problem of reflection losses.
1.2. Role of Rare Earths in Photovoltaic Systems
Various properties of rare-earth elements and compounds are of interest in
solar energy conversion. For instance, it was discovered that insertion of a
thin insulating layer made up of rare-earth metals between the semiconductor
DS or DC layer
solar cell
A
UC layer
Solar cell
reflector
B
Pt
Glass
ITO
TiO2
Dye
DC orUC material
D
Solar cells
Dichroicmirror
C
Isolation
FIGURE 4 Introduction of wavelength-converting materials into the architecture of solar cells:
(A) front downshifting or downconverting layer; (B) back upconverting layer; (C) removal of
the IR light for specific conversion; (D) introduction of downshifting material in a dye-sensitized
cell. ITO, indium tin oxide.
Solar cell
Organic dye orquantum dot orLn material
Loss
Reabsorption
FIGURE 5 Principle of a luminescent solar concentrator.
Handbook on the Physics and Chemistry of Rare Earths174
(e.g., silicon) and the metal of a Schottky contact improves greatly the photo-
voltaic yield; scandium, yttrium, samarium, ytterbium, and lutetium were
tested as solar cell barrier metals and Sc and Lu performed particularly well
(Munz and Bucher, 1982). This was the first application of these elements
to solar energy conversion. Moreover, rare-earth oxides have structural prop-
erties which are helpful in lattice-matched multilayer semiconductor cells
while their conductivity properties are used to enhance conduction between
the semiconductor layer and the electrode in silicon cells (Takei, 2011). In
addition, cerium oxide displays photoelectric properties similar to those of
titanium oxide (Turkovic and Orel, 1997) and rare-earth oxides are helpful
in lattice-matched multijunction cells (Clark et al., 2010). But by far, the main
applications of lanthanides in photovoltaics stem from the luminescent prop-
erties of their divalent and trivalent ions.
Indeed the electronic configurations 4fn (LnIII) and 4fn�15d1 (LnII) generate awealth of electronic levels which are particularly suitable for acting as
wavelength-converting entities. As a matter of fact, an early application of lumi-
nescent lanthanide ions to solar energy conversion was their introduction as
downshifting materials into LSCs (Reisfeld, 1983, 1987). The LnIII ions also per-
form well in downconversion. This phenomenon was predicted in 1957 (Dexter,
1957) but only demonstrated two decades later with a single LnIII ion, PrIII doped
into yttrium fluoride, absorbing at 185 nm and emitting two visible photons at
408 and 620 nm with a quantum yield up to 140% (Piper et al., 1974). Much bet-
ter quantum yields have then been obtained, close to 200%, with systems featur-
ing different LnIII ions, such as GdIII and two EuIII, for instance (Wegh et al.,
1999). Finally, lanthanide ions are ubiquitous in upconversion (Auzel, 2004);
for instance, the NaYF4:Yb(18%), Er(2%) material is finding applications in
fields as diverse as counterfeiting tags, security inks, bioimaging of live animals,
time-resolved luminescence immunoassays, and solar cells (Tan, 2012).
In this chapter, we concentrate on the use of rare-earth compounds as
wavelength-converting materials in LSCs and various types of solar cells. The
burgeoning field of lanthanide-containing photocatalysts for water splitting or
water decontamination (Weber et al., 2012) is not included in the present work.
With the exception of review papers and of Section 3.2 in which prospective
materials for downconversion are described, the chapter presents and critically
assesses works in which experiments with solar concentrators or solar cells are
presented and not those claiming “potential applications.” This considerably
limits the size of the cited literature, which is covered until the end of 2012.
2. LUMINESCENT SOLAR CONCENTRATORS
2.1. Definitions and Basic Properties
Luminescent solar concentrators offer a cheap solution to solar energy conver-
sion in that they concentrate photoluminescence on the expensive surface of
Chapter 261 Lanthanides in Solar Energy Conversion 175

solar cells, the light emitted by the dopant being kept inside the layer by total
internal reflection (TIR, Fig. 5). They collect diffuse light very well and
consequently eliminate the need for tracking systems which orientate Si solar
cells in the most favorable position with respect to sunlight.
These devices are highly transparent glass plates or polymer sheets
doped with luminescent materials featuring high quantum yields and, ideally,
emission bands having little overlap with absorption bands. Solar light is
absorbed by the dopant and the reemitted radiation concentrates at the end
edge of the thin plate thanks to TIR. Total internal reflection occurs when
light impinges the LSC/air boundary with angles larger than the critical angle
yc (Rowan et al., 2008):
yc¼ sin�11
n
� �ð3Þ
n is the refractive index of the LSC layer and the fraction of photoluminescent
light which will be totally internally reflected is given by:
FTIR¼ n2�1ð Þ1=2n
ð4Þ
For n¼1.5, which is a common refractive index value for glasses, FTIR
will be around 75%, which means that a quarter of the luminescence intensity
is lost. Moreover, if the solar concentrator is not coated with an antireflection
layer, part of the sunlight impinging on the surface will be reflected back
(Fresnel reflection). Assuming vertical incidence, the reflected fraction will
be (Goetzberger and Greubel, 1977):
R¼ n�1ð Þ2nþ1ð Þ2 ð5Þ
The fraction of light entering the collector is (1�R) so that if �PL is the photo-luminescence quantum yield of the dopant, the loss due to the luminescence
and TIR processes can be written as:
LL¼ 1�Rð Þ 1�FTIRð Þ�PL ð6ÞFinally, the total loss will be:
Ltot¼ 1�Rð Þ 1�FTIRð Þ�PLþR ð7Þwhich translates into the following expression if �PL is set to 1:
Ltot¼ 1�4 n�1ð Þ1=2nþ1ð Þ2 ð8Þ
The graph of Ltot versus n depicted in Fig. 6 presents a broad minimum for
n¼2.0 for which the total loss is 23%. At this stage, we make two remarks.
Handbook on the Physics and Chemistry of Rare Earths176

The first one is that under the given hypotheses, Fresnel reflection loss
does not add much to the total loss since the loss due to incomplete TIR,
as expressed by Eq. (8), amounts to 25%, as compared to 28% for the total
loss when n¼1.5. The second remark is that the curve is fairly flat in the
range 1.5<n<2.5 so that common plastic materials (e.g., polymethylmetha-
crylate, PMMA), glasses, or organic–inorganic hybrids with refractive indices
in the range of 1.5–1.6 are well suited for LSCs.
Luminescent solar concentrators present the following advantages: (i) both
direct and diffuse light is collected, (ii) heat generated by unused energy is
well dissipated into the large area of the collector plate so that light reaching
the photovoltaic cell is “cold” minimizing heating of the device. In addition,
the luminescent material can be chosen to match the maximum sensitivity
of the photovoltaic cell. Therefore, cheap LSCs can concentrate light on the
small areas of expensive solar cells. Present interest for these devices is large
because of their ability to collect the often sizeable diffuse component of solar
irradiation, particularly in Northern countries. Commercial exploitation of this
technology seems to be close (Chatten et al., 2010), but we note with some
concern that a similar statement was already made in 1977 (Goetzberger
and Greubel, 1977). In fact, it is thought that 30% efficiency would be needed
to make LSCs commercially viable (Sholin et al., 2007), whereas today the
largest yield is estimated to be �7% (Currie et al., 2008).
Three types of LSCs have been proposed. One design makes use of
organic dyes, which have large quantum yields (near unity) and are available
in a wide range of colors. However, reabsorption (i.e., overlap between
absorption and emission spectra) is a problem, as well as their poor thermal
and photo stabilities under solar irradiance; for instance, rhodamine B doped
1.0 1.5 2.0 2.5 3.0 3.5 4.00.0
0.2
0.4
0.6
0.8
1.0
Tot
al lo
ss L
tot
Refractive index n
28%23%
Commonplasticmaterials
FIGURE 6 Total loss due to reflection and incomplete light refraction, according to Eq. (8), with
the hypotheses that light incidence is vertical and �PL¼1. Redrawn from Goetzberger andGreubel (1977).
Chapter 261 Lanthanides in Solar Energy Conversion 177

in PMMA sustains up to 20–37% thermal degradation upon heating in the
temperature range of 45–94 �C (Meseguer et al., 1981). Despite these draw-
backs, a practical LSC made up of two organic dyes doped in PMMA was
shown to have a power conversion efficiency of 7.1% when linked with four
GaAs solar cells connected in parallel (Slooff et al., 2008). Theoretical mod-
eling has been attempted to maximize the light output of LSCs (Earp et al.,
2004b) and efficiencies of up to 9.1% with an InGaP cell or 14.5% with a
Cu(In,Ga)Se2 cell are predicted (van Sark, 2013). Moreover, a practical
lighting (not energy-converting) device was fabricated consisting of three
different layers of LSC (violet, green, and pink) and having an overall effi-
ciency of about 50% (Earp et al., 2004a). This type of device can be adapted
for photovoltaics by inserting spectral-matched solar cells at the end of each
LSC stack (Rowan et al., 2008).
QDs, for example PbS or CdSe nanoparticles, represent the second alterna-
tive. They offer several improvements over organic dyes: (i) their absorption
spectra are much broader and extend into the UV, (ii) absorption properties
can be tuned by modulating the size of the QDs, (iii) their thermal and photo
stabilities are better compared to organic dyes but still are not quite sufficient,
although it has been shown that QDs recover their absorption properties after
a prolonged dark cycle (Hyldahl et al., 2009), and (iv) the shift between
absorption and luminescence is related to the spread of the QD sizes, a param-
eter that can be mastered during the growth process. On the other hand, their
quantum yield is often smaller compared with organic dyes; they are more
expensive; they still have nonnegligible absorption/emission overlap; they
are quite sensitive to water, ions, and oxygen; and one may have some con-
cern about toxicity of lead and cadmium (van Sark et al., 2008).
All of this explains why lanthanide complexes and lanthanide-containing
upconverting nanoparticles (UCNPs) have also been probed as a third alterna-
tive and are presently the subject of a renewed interest which started around
2009 (see below).
Assessment of the various solutions for the design of LSCs has been
presented in recent review articles (Reisfeld, 2010; Rowan et al., 2008) in
which the authors conclude that a combination of organic and inorganic
materials (hybrid materials) might be the panacea. Data pertaining to the case
of an LSC coupled to a silicon solar cell are listed in Table 1. Plasmonics
may contribute too (see Section 3.4.5): introduction of silver nanoparticles
into luminescent plates increases their luminescent efficiency by as much as
12% (Reisfeld, 2010).
2.2. Downshifting into the NIR Spectral Range
The concept of downshifting for improving the performances of LSCs was
revived by Weber and Lambe in 1976 (Weber and Lambe, 1976) followed
1 year later by the fabrication of a practical device (Levitt and Weber, 1977)
Handbook on the Physics and Chemistry of Rare Earths178

consisting in a thin layer (1.2 mm) of NdIII laser glass containing 3 wt% of
Nd2O3 and having an area of 100 cm2. Upon pumping at 577 nm, a voltage gain
of �6 could be obtained (30% from 880-nm emission and 70% from 1060-nm
emission). Lanthanide-containing LSCs have long-term photostability, but the
low absorptivity of LnIII ions due to the parity-forbidden f-f transitions is a
definite drawback. This may be overcome by introducing a sensitizer, although
at the cost of larger complexity.
Most of the work on lanthanide-containing LSCs has been performed in
conjunction with silicon solar cells. For maximizing the performances of the
tandem LSC-Si cell, the luminescent material should absorb all wavelengths
shorter than 950 nm and emit a single band in the range of 950–1100 nm,
which corresponds to the maximum response of a c-Si cell. NIR-emitting
organic dyes having low quantum efficiencies, lanthanide ions such as NdIII
(emission at 880 and 1060 nm) and YbIII (emission at 980 nm) have been
tested. Indeed, quantum yields can reach 80–90% in glass matrices. Unlike
YbIII which only absorbs at 970–980 nm, NdIII has several absorption bands
in the visible and NIR ranges and it is one of the lanthanide ions having the
largest molar absorption coefficients (10–15 M�1 cm�1). An LSC glass sub-
strate combining these two ions effectively absorbs about 20% of the solar
light in the 440–980 nm range, and since the Nd-to-Yb energy transfer is quite
efficient, this combination leads to a single emission peak in the range of
900–1100 nm with a maximum close to 1000 nm (Reisfeld, 1983). To com-
pensate for the still low absorptivity of lanthanide ions, energy transfer from
a better absorbing species may be required. One of the first donors tested
was CrIII which has two broad absorption bands and which transfers energy
to NdIII and YbIII with an efficiency close to 90% in lithium lanthanum
TABLE 1 Assessment of Luminescent Materials for a LSC Coupled to a
Si Solar Cell with Respect to Four Criteria
Property
Organic
dye
Quantum
dotsaLn
materials
Hybrid
materialsb
Absorb all light<950 nm
� √ � √
No reabsorption � � √ √
Quantum yield>90%
√ � � √
Stable >10 years � � √ √
aPbS QD.bSee text and Section 2.5.Adapted from Rowan et al. (2008).
Chapter 261 Lanthanides in Solar Energy Conversion 179

phosphate glass (Reisfeld, 1983). An alternative sensitizer is uranyl: an LSC
containing 18 wt% of uranyl and 9–10 wt% NdIII ions and with an aluminum
antireflection coating led to an apparent 40% increase in the solar-to-electrical
energy conversion of the attached Si cell (Sytko and Pershina, 1995). Not
much further work has been described on these systems until 2011 when nano-
crystals of NdIII- and YbIII-doped yttrium aluminum garnet (YAG) or gadolin-
ium gallium garnet (GGG, Ga3Ga5O12) or simple yttrium sesquioxide have
been incorporated into PMMA in which efficient Nd-to-Yb transfer was
demonstrated (�78%). However, the LSCs were not coupled to solar cells to
evaluate their performances (Kozlowska et al., 2011). A final option for sensi-
tizing LnIII NIR emission is to resort to organic ligands, which have intense
absorption bands in the UV–vis and transfer energy efficiently onto the metal
ion; the shortcoming here is the presence of high-energy vibrations, for exam-
ple, C-H oscillators, which effectively deactivate the LnIII excited states. For
instance, [Yb(OPyr)3(Phen)] (Scheme 1) has a quantum yield of 2.3% in
CCl4 which decreases to only 1% when inserted into a transparent PMMA stab
at 0.001% concentration (Sanguineti et al., 2012).
N
N
N
N
N
N
N
N
dpbtO O
S
Htta
O O
CF3
CF3
F3C
Hhfa
O P
O
P
O
Ph
Ph
Ph
Ph
dpepo
Rv
R
R
R
N
N
OO
OO
R¢R¢
R¢ R¢
R=OPhe, R¢=i-PrR305
NN
NOH
O
Me
HOPyrN N
phen
Me
O O
n
OH n Cl n
O O n
PMMA PVA PVB PVC
(C3H17)3P=O
(C6H5)3P=O
TOPO
TPPO
SCHEME 1 (Top panel), left: diketone and pyrazolone ligands (L); middle: ancillary ligands L0
for ternary complexes [Eu(L)3L0]; right: organic dye R305 used for reabsorption study. (Bottom
panel) Some polymers used as matrices.
Handbook on the Physics and Chemistry of Rare Earths180

2.3. Downshifting into the Visible Spectral Range
Other devices concentrate on converting the UV portion of the solar spectrum
into red light. This is a relatively recent development, the first report having
been published in 2000 (Machida et al., 2000). In most studies, europium is
chosen as the dopant luminescent ion (main emission lines at 590–620 and
690 nm). Either simple coordination compounds or inorganic–organic hybrids
have been tested to this end. Ternary complexes of tris(b-diketonates) havereceived special attention since they are among the most luminescent
europium complexes with organic ligands, quantum yields reaching 80–85%
(Bunzli and Eliseeva, 2013; Malta et al., 1998; Moudam et al., 2009; Zucchi
et al., 2011). One advantage of lanthanide complexes compared to all-organic
dyes is very limited reabsorption due to the excitation into the ligand levels,
which generates large Stokes’ shifts. This has been firmly established by
comparing an organic dye, R305 (Scheme 1), having a photoluminescence
quantum yield close to 100%, with the highly emitting [Eu(hfa)3(dpepo)]
complex (Scheme 1, QY¼80% both in solution and in PMMA) (Wilson et al.,
2010). The organic dye has a 23-nm Stokes’ shift while the shift for [Eu
(hfa)3(dpepo)] amounts to 300 nm (Fig. 7). R305 was subjected to a detailed
investigation of the reabsorption losses versus the dye concentration in
PMMA (5–1574 ppm) and the excitation wavelength. Experimental results
FIGURE 7 Absorption and normalized emission spectra of R305 and [Eu(hfa)3(dpepo)]
(lex¼530 and 320 nm, respectively). Reproduced with permission from Wilson et al. (2010)© 2010 The Optical Society of America.
Chapter 261 Lanthanides in Solar Energy Conversion 181
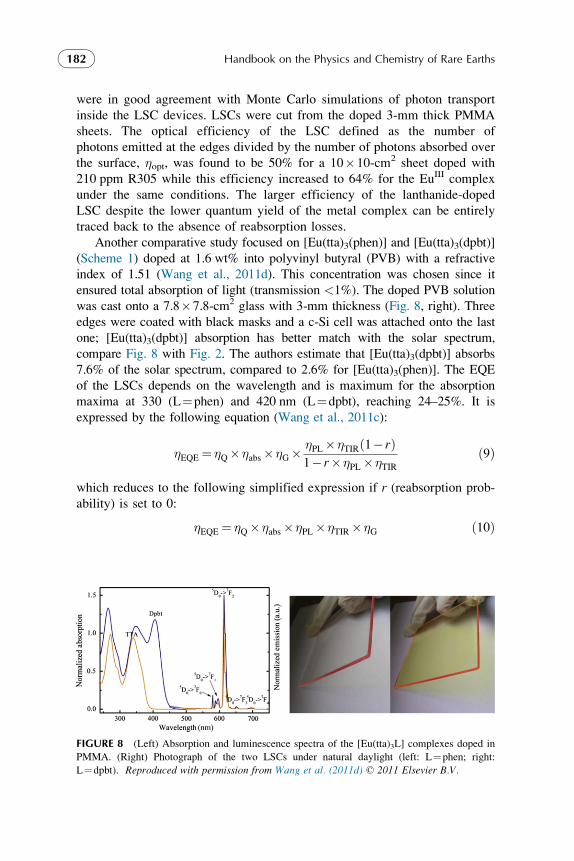
were in good agreement with Monte Carlo simulations of photon transport
inside the LSC devices. LSCs were cut from the doped 3-mm thick PMMA
sheets. The optical efficiency of the LSC defined as the number of
photons emitted at the edges divided by the number of photons absorbed over
the surface, �opt, was found to be 50% for a 10�10-cm2 sheet doped with
210 ppm R305 while this efficiency increased to 64% for the EuIII complex
under the same conditions. The larger efficiency of the lanthanide-doped
LSC despite the lower quantum yield of the metal complex can be entirely
traced back to the absence of reabsorption losses.
Another comparative study focused on [Eu(tta)3(phen)] and [Eu(tta)3(dpbt)]
(Scheme 1) doped at 1.6 wt% into polyvinyl butyral (PVB) with a refractive
index of 1.51 (Wang et al., 2011d). This concentration was chosen since it
ensured total absorption of light (transmission <1%). The doped PVB solution
was cast onto a 7.8�7.8-cm2 glass with 3-mm thickness (Fig. 8, right). Three
edges were coated with black masks and a c-Si cell was attached onto the last
one; [Eu(tta)3(dpbt)] absorption has better match with the solar spectrum,
compare Fig. 8 with Fig. 2. The authors estimate that [Eu(tta)3(dpbt)] absorbs
7.6% of the solar spectrum, compared to 2.6% for [Eu(tta)3(phen)]. The EQE
of the LSCs depends on the wavelength and is maximum for the absorption
maxima at 330 (L¼phen) and 420 nm (L¼dpbt), reaching 24–25%. It is
expressed by the following equation (Wang et al., 2011c):
�EQE¼ �Q��abs��G��PL��TIR 1� rð Þ1� r��PL��TIR
ð9Þ
which reduces to the following simplified expression if r (reabsorption prob-
ability) is set to 0:
�EQE¼ �Q��abs��PL��TIR��G ð10Þ
FIGURE 8 (Left) Absorption and luminescence spectra of the [Eu(tta)3L] complexes doped in
PMMA. (Right) Photograph of the two LSCs under natural daylight (left: L¼phen; right:
L¼dpbt). Reproduced with permission from Wang et al. (2011d) © 2011 Elsevier B.V.
Handbook on the Physics and Chemistry of Rare Earths182

in which �Q is the quantum efficiency of the c-Si cell at 613 nm (76%), �abs isset to 1 (see above), FTIR is 75% according to Eq. (4), and �G, the geometry
efficiency of the host material related to its absorption, is also set to 1 (no
absorption). Since the quantum yields of the complexes doped in PVB, �PL,is estimated to be 44% at the wavelength maxima of the absorption spectra,
�EQE reaches �25%.
These numbers seem interesting. However, when the cell is put under
simulated solar illumination (AM1.5G), the overall power conversion effi-
ciency �P remains small, 0.044 (L¼phen) and 0.05% (L¼dpbt) for one edge.
The power conversion efficiency is given by (Wang et al., 2011d):
�P¼Pout
Pin
¼VOC� JSC�FF
Pin
ð11Þ
with VOC being the open-circuit voltage (�0.47 V), JSC the short-circuit cur-
rent density (0.15, L¼phen, and 0.17, L¼dpbt, mA cm�2), and FF the fill
factor (�0.63). If one multiplies this result by 4 (assuming that the three black
masks are substituted by mirrors), one gets �P(total)¼0.18 and 0.20% only.
That is, replacing phen with dpbt only leads to an 11% increase in power con-
version efficiency despite the much better absorptivity of [Eu(tta)3(dpbt)].
This remains unexplained.
A similar study by the same group (Wang et al., 2011c) deals with
[Eu(tta)3(TOPO)2] in PMMA (Scheme 1) which has �PL¼73% (Teotonio
et al., 2008). The LSC was fabricated by dip-coating a solution of PMMA
containing 10 wt% of the complex onto a 10�10-cm2 glass plate of thickness
3 mm and refractive index 1.52. First, the authors demonstrate that �EQE of
the LSC remains constant around 50% with variation of the geometric gain
of the LSC (ratio of the area of the LSC divided by the area of the attached
solar cell) between 0 (no LSC) and 10, contrary to an LSC containing an
organic dye which exhibits the efficiency decreasing by a factor 5 due to reab-
sorption. The performance of the LSC is summarized by �P(total)¼0.28%,
VOC¼0.51 V, JSC¼0.828 mA cm�2, and FF¼0.66, that is substantially better
than the previously described LSCs (see Fig. 9). But the main point of the
paper is the study of the current–voltage performance with an attached Si cell
under AM1.5G irradiation: both �P and JSC decrease 10 times slower in func-
tion the irradiated surface with [Eu(tta)3(TPPO)2] compared with a dye-based
LSC (Wang et al., 2011c).
Triazine-based ligands have excellent sensitization properties for the lumi-
nescence of europium up to 400–410 nm (Xue et al., 2010) and some of them
display sizeable two-photon absorption cross-sections (Lo et al., 2011) so
that in addition to dpbt (Scheme 1) several triazinyl ligands have been tested
for use in LSCs (Scheme 2) (Katsagounos et al., 2011). Thin 40-nm thick layers
of [Eu(NO3)3(trzi)2] (i¼1, 3), [Eu(NO3)3(trz2)(H2O)2], and [Eu(NO3)2(trz4)2]þ
complexes were spin coated from dichloromethane solutions onto a quartz plate
Chapter 261 Lanthanides in Solar Energy Conversion 183

to one end of which a multicrystalline silicon (m-Si) solar cell with 15% con-
version yield was attached. No quantitative data on the photophysical properties
of the metal complexes are given, but [Eu(NO3)3(trz1)2] appears to be the most
luminescent and it is also the most effective in LSCs. For an initial concentra-
tion of 14.8 mM of the spin-coated solution, a 15% increase in photocurrent and
7.5% increase in photovoltage were observed for a monolayer (area ratio G of
the LSC with respect to the solar cell �3) while these figures rise to 26% and
8%, respectively, for three layers (G�9). Translated in terms of overall cell
efficiency, this represents increases of 17% and 28%, respectively. A qualitative
assessment rates the photostability of these LSCs as being good (no lumines-
cence loss over several months). The reported large increases in performances
FIGURE 9 Current–voltage performance of the [Eu(tta)3(TOPO)2]-doped LSC under AM1.5G
illumination. See text for definitions of variables. Reproduced with permission from Wang et al.
(2011c). © 2011 Elsevier B.V.
N
N N
N
N
N
N N
N
N
N
N NN
N N
N N
NN
trz1 trz2
trz4trz3
SCHEME 2 Triazinyl derivatives (Katsagounos et al., 2011).
Handbook on the Physics and Chemistry of Rare Earths184

are, however, surprising: the thin films absorbs only up to about 400 nm and in
the 280–400 nm range, about 3.4% only of the sun irradiance are available.
Given the above evaluation (�EQE¼0.25 for �PL¼0.44, see Eq. (10)), one
would have predicted adding þ1.7 to þ3.4 absolute% to the overall cell effi-
ciency for quantum yields of the luminescent complex equal to 44% and
88%, respectively, whereas þ2.6% is reported for the one-layer LSC; quantum
yields of the complexes are not given.
Terbium emission matches well the spectral response of AlGaAs so that
application of terbium salicylate doped in polyvinyl alcohol (PVA) or PMMA
(Scheme 1) to LSCs has been assessed. Upon UV excitation around 300 nm,
both salicylate and TbIII emit, but quantum efficiencies, were found to be
too low for practical purposes despite the calculated optical conversion of
8.8% at 542 nm (Misra and Mishra, 2008).
Another way of designing LSCs is to introduce the luminescent dopant
directly into inorganic matrices (e.g., glass). Siloxane- or silicate-based
inorganic–organic hybrids present several advantages. They are synthesized
by sol-gel methods under mild conditions, which protects the fragile organic
molecules from decomposition while dispersion into the inorganic matrix
avoids aggregation detrimental to photophysical properties. In addition, many
precursors are commercially available and the hybrids are versatile in their
composition, processing, and optical properties (Reisfeld, 2010).
Transparent organically modified silicates (ORMOSIL) films prepared
from sol-gel processes have been doped with a simple phenanthroline com-
plex [Eu(phen)2]3þ featuring a sizeable quantum yield of 56% (QY¼80%
with respect to YPO4:Eu having QY of 70%) (Giaume et al., 2005). The
thickness of the film was 300 nm, and an LSC was made by coating a quartz
plate with this film. When coupled with a c-Si solar cell, the device increased
the photovoltaic current by 10–15% (Machida et al., 2000). Luminescent
EuIII-bridged silsesquioxanes obtained from the organosilane precursors P1
(5,50 isomer) and P2 (6,60 isomer) depicted in Scheme 3 have been considered
for LSCs too (Graffion et al., 2011). In particular, the material based on the P2
isomer exhibits a sizeable quantum yield of 34% when processed under the
form of a thin film with thickness of 54 nm, and an optical conversion
N N
NH
OHN
HN
ONH
N NNH
OHN
NH
ONH
Si(OEt)3
Si(OEt)3
(EtO)3Si
(EtO)3Si
P1 P2
SCHEME 3 Organosilane precursors (Graffion et al., 2011).
Chapter 261 Lanthanides in Solar Energy Conversion 185

efficiency of 4% was obtained. When corrected for losses (see Eqs. (4)–(8)),
the effective optical efficiency dropped to 1.7%.
2.4. Other Rare-Earth Materials for LSCs
A proof of principle has been made on the use of ITO electrodes co-doped
with EuIII and YIII ions. Co-doping YIII increases the photoluminescence yield
compared to an electrode containing only the luminescent ion and, provided
that the doping concentrations are precisely controlled (0.1–0.5%), there is
no deterioration of the conductivity. When such electrodes are introduced into
solar cells, they play a dual role as LSCs and transparent conductive electrode
(Ting and Tsai, 2009).
2.5. What’s Next?
Improvement of LSCs efficiencies with lanthanide materials is still in its
infancy, and although the concept was laid out about 25 years ago, the field
started to gain some momentum only during the past 5 years during which
a dozen of papers appeared on the subject (or mentioning the subject). There
is presently much intellectual excitement about the idea, especially within
the context of the current large interest for rare earths in high technology
(Eliseeva and Bunzli, 2011). Rare-earth materials have certainly some
inimitable advantages such as high photostability and very little reabsorption
losses, but they have disadvantages too, the more detrimental one being
the very small absorption coefficients which necessitate sensitization of
the LnIII luminescence by organic ligands, inorganic matrices through
LMCT transitions, or d-transition metal ions. Another pathway is to
pump energy into 4f5d states. One example is SrB4O7:SmII(5%), EuII(5%)
which displays broad absorption in the range of 300–600 nm and emits in the
NIR range of 650–850 nmwith an external quantum efficiency of 90% (de Boer
et al., 2011). If, in addition, cholesteric filters are provided to prevent escape
of emitted light, this phosphor could help increasing the efficiency of LSCs
(de Boer et al., 2012); an experimental efficiency of 2.5% has been obtained
when coupled to a c-Si cell (Desmet et al., 2012). Other drawbacks of Ln-based
materials are quantum yields which are not always large enough and the high
price of some photonic lanthanides. Setting aside these detrimental considera-
tions, it seems, however, that a reasonable view would be to see rare-earth mate-
rials help boosting the efficiency of LSCs in a range where practical applications
become feasible, particularly if hybrid materials combining inorganic and
organic sensitizers are considered. Finally, many engineering efforts are
deployed to minimize losses by using 3D photonic materials (Goldschmidt
et al., 2010; Gutmann et al., 2011).
Handbook on the Physics and Chemistry of Rare Earths186

An insistent wish is that more precise quantitative data should be reported
so that intercomparison between the proposed systems becomes feasible and
helps designing better devices.
3. SILICON-BASED SOLAR CELLS
3.1. General Considerations
Light-to-electricity conversion is based on the photoelectric effect discovered
by H. Hertz in 1887 and has deep roots in the past with names of eminent
scientists, including A. E. Becquerel, C. Fritts, A. Stoletov, A. Einstein, and
R. Ohl, associated with its practical implementation. The first solar cells used
selenium, but their yield was rather low (<1%). The real start of the field is
the seminal paper by researchers from Bell Laboratories in 1954 which briefly
describes (the letter is less than one page long!) a new silicon p–n junction
converting 6% of the sunlight; the authors predict that a conversion efficiency
of 22% could be reached (Chapin et al., 1954). The bandgap of the silicon
used was a little over 1 eV so that photons with wavelengths shorter than
about 1200 nm could theoretically trigger the conversion.
The commercial production of Si-based solar panels has been intimately
linked to the developments of the semiconductor industry and, as a matter
of fact, started by using wafers rejected by this industry since the purity
requirements for solar cells are somewhat less stringent than for semiconduc-
tors. As a result, the price could be reduced from about 100 US$/W to a
present value of about 2.1 US$/W. The estimated “grid parity” price is 1 US
$/W and present technology is close to it, with multijunction panels nearing
1.3 US$/W. There are three generations of Si cells: (i) wafers using crystalline
or multicrystalline Si (c-Si or m-Si) with thickness of about 100–300 mm,
which account presently for more than 75% of the market, (ii) thin films based
on amorphous Si (a-Si or a-Si), which are much cheaper but have lower con-
version efficiency, and (iii) advanced thin films which are thinner and hydro-
genated or doped with carbon, nitrogen, or germanium, for the purpose of
modulating the bandgap. The most sophisticated and best performing cells
are multijunction devices in which the various components have different
bandgaps in order to harvest the largest portion possible of the sun emission.
In Si cells, the absorbed photons generate electron–hole pairs (excitons)
which have to be separated before being extracted into an external circuit to
generate electric current. They are characterized by their overall conversion
efficiency which in turn can be broken down into the product of reflection,
thermodynamic, charge carrier separation, and conduction efficiencies.
Reflection losses can be as large as 30% so that Si cells are usually coated
with an antireflection layer. The thermodynamic efficiency depends on the
bandgap energy and the wavelength of the impinging photons (Shockley–
Queisser limit). On a practical level, the solar cell efficiency (or EQE) is
Chapter 261 Lanthanides in Solar Energy Conversion 187

determined by measuring the maximum cell power output, Pm (W), and divid-
ing it by the surface input power PS (W m�2) and the cell area A (m2):
EQE¼ Pm
PS�Að12Þ
Pm corresponds to the load that maximizes the output voltage. Measurements
have to be conducted under standard test conditions (STC): 25 �C, 1000 W m�2
irradiance with an AM 1.5 global spectrum. Characteristic parameters are (i) the
quantum efficiency �Qwhich is governed by the charge production and separationefficiency as well as by the conduction efficiency, (ii) the open-circuit voltage
VOC (V), (iii) the short-circuit current ISC (A), and (iv) the fill factor (Fig. 10); theyare related by the following relationship, equivalent to Eq. (11):
FF¼ Pm
VOC� ISC¼ �Q�PS�A
VOC� ISCð13Þ
Academic laboratories try hard to maximize EQE but in practice, the power-
to-cost ratio is more important. There are several ways of maximizing EQE:
(i) minimizing reflection losses, (ii) concentrating the irradiation, (iii) using
multijunction cells, and (iv) trying to downconvert/downshift (Klampaftis
et al., 2009; Richards, 2006a,b; Richards and Shalav, 2005; Strumpel et al.,
2007; van der Ende et al., 2009a; Zhou et al., 2010b) and/or upconvert (Fischer
et al., 2012b; Richards, 2006a; Richards and Shalav, 2005; Shalav et al., 2007;
Strumpel et al., 2007) the portions of the solar spectrum not matched by the
bandgap material. In the following, we concentrate on the latter two aspects,
with reference to Ln-containing materials.
Downconversion, or quantum cutting, refers to a system in which an ener-
getic photon is absorbed and two photons of lower energy emitted (Fig. 3), with
a quantum yield which can theoretically reach 200% (Wegh et al., 1999). In
Ln-containing materials, the intermediate level (IL) needed is an f-level,
whereas in other compounds, it is materialized by an impurity. Quantum cutting
ISC
VOC
FF
Point ofmaximum power(Pm)
FIGURE 10 Schematic representation of the fill factor FF.
Handbook on the Physics and Chemistry of Rare Earths188

in lanthanide-doped materials proceeds according to three different mechan-
isms. (i) Generation of two electron–hole (e–h) pairs in the Si lattice, which
requires an energy of at least 2.6 eV, so that the expected increase in EQE is
small (<5% for l¼350 nm). (ii) Production of two visible photons by a single
LnIII ion, for example, PrIII which emits blue (405 nm) and red (620 nm)
photons upon excitation at 185 nm with an efficiency of 140% (Piper et al.,
1974). (iii) Downconversion in systems containing two different lanthanide
ions; a wealth of such systems are presently investigated (see below). We have
to mention here another process induced by QDs with composition PbS, PbSe,
PbTe, or CdSe: multiexciton generation (MEG) in which one photon with
energy hn�Eg yields n e-h pairs (Lohse and Murphy, 2012; Richards, 2006b).
When an energetic photon is simply converted into a longer-wavelength
photon by a single LnIII ion, the correct denomination is downshifting, but
downconversion is also often used in the literature. An intermediate case is
when the excitation photons are converted into both visible and NIR photons,
emitted, for instance, by the matrix and the LnIII active ion, respectively. In
the reported examples, the mechanism is likely to be a double downshifting
process and not a cooperative energy transfer (CET).
In optimizing wavelength-converting materials, one has to keep in mind
the sun spectrum and the spectral response of the solar cell. Indeed, Fig. 2
shows the absorption of a c-Si cell, but when one looks into the conversion
efficiency of c-Si versus wavelength (Fig. 11), one realizes that the best con-
version improvement one could get is when downconversion/downshifting, or
l (mm)
Arb
itrar
y un
its
DC
DS
0.3 0.4 0.5 0.6 0.7 0.8 0.9 1.0 1.1 1.2
0.0
0.2
0.4
0.6
0.8
1.0
1.2
1.4
1.6
FIGURE 11 Normalized spectral responses of m-Si (dotted line) and c-Si (dashed line) com-
pared to the solar spectrum AM1.5G and definitions of downshifting (DS) and downconversion
(DC). Redrawn from Zhou et al. (2010b) and Katsagounos et al. (2011).
Chapter 261 Lanthanides in Solar Energy Conversion 189

upconversion, produces photons in the wavelength range of 850–1100 nm,
with 1050 nm being optimum (Zhou et al., 2010b). With respect to c-Si cells,
the wavelength range of 300–500 nm is well suited for downconversion and it
represents �19% of the sun total illumination (Fig. 12), while wavelengths
larger than �1150 nm are appropriate for upconversion. This demonstrates
that processes, which produce photons in the range of 400–750 nm, are not
ideal with respect to c-Si response. On the other hand, they are well suited
for m-Si cells. Additionally, one has to take into account the fact that if one
converts one 300–500 nm photon into a single 850–1100 nm photon, there
will be a large energy loss (10,000–25,000 cm�1, or 1.2–3.1 eV) which will
translate in heating of the cell. Therefore in theory, one would have to look
for downconversion (possibly “double downshifting”) rather than for down-
shifting of a single photon.
3.2. Downconverting Materials
3.2.1. Prospective Studies
A theoretical background for downconversion in solar cells, which has been
published in 2002 and was based on the hypothesis that no recombination
losses occur, has probed both the effect of the converter layer and its position,
either at the front or at the back of the cell under STC (Trupke et al., 2002a).
The left part of Fig. 13 displays the energy scheme of a device with front loca-
tion of the downconverter and for the ideal case for which (i) Eg(DC)¼2 Eg(Si) and (ii) the IL lies at the center of the downconverter bandgap
Eg(DC). Taking a refractive index of 3.6, which is typical for Si or GaAs
Wavelength range, 280 - l
3000
2
4
6
8
10
12
14
16
18
20
320350
390400
420
500
450
% S
olar
irra
dian
ce (
AM
1.5
G)
1.43.9
4.67
11
19
0.15
FIGURE 12 Calculated percentages of the AM1.5G solar spectrum emitted between 280 nm
and wavelength l.
Handbook on the Physics and Chemistry of Rare Earths190

materials, and assuming nonconcentrated irradiation from a 6000-K sun, an
optimum efficiency of 39.6% may be obtained when the bandgap is 1.05 eV
(c-Si) and the converter positioned at the rear. If the converter is placed at
the front, the Shockley–Queisser limit (30.9%) is still largely overcome, but
the maximum efficiency is smaller, 36.8% for a bandgap of 1.1 eV (Fig. 13,
right). As downconversion layer, the authors suggest the use of III–V
compounds, for example, AlAs or GaP doped with lanthanide “impurities.”
The results obtained by Trupke et al. were corroborated by another model
EV
EC
Eg(Si)
CB
VB
hν IL
CB
VB
E2 = Eg
E1 = Eg
Si-cellDownconverter
A
40
35
30
25
20
15
10
1.0 1.5 2.0
Eg (eV)
Eff
icie
ncy
(%)
2.5 3.0
FIGURE 13 (A) Schematic energy diagram for a c-Si cell fitted with a downconverter layer in
the ideal case for which the energy of the IL lies in the center of the bandgap of the converter and
Eg(DC)¼2 Eg(Si). (B) Efficiencies versus bandgap energy, Shockley–Queisser limit (solid line),
downconverter at the front (empty squares), and downconverter at the rear (solid circles).
(A) Adapted from Trupke et al. (2002a). (B) Reproduced with permission from Trupke et al.
(2002a), © 2002 American Institute of Physics.
Chapter 261 Lanthanides in Solar Energy Conversion 191

study including both upconversion and MEG, and which calculated that effi-
ciencies up to 49% could be obtained (Shpaisman et al., 2008). The enhance-
ment potential of downconversion in the absence of sun concentration has
also been modeled by Abrams et al. (2011), who carefully took into account
all effects, including losses. They confirm the above conclusions by calculat-
ing that DC can add, in an ideal system, a maximum of 7 absolute % to the
cell efficiency. Improvement essentially arises from an increase in photocur-
rent, while the photovoltage remains the same as in the absence of DC.
In fact, the increase in efficiency depends largely on the type of illumina-
tion: a similar theoretical study of anm-Si cell fitted with a top upconversion
layer made up of QDs emitting at 603 nm concluded that the increase in short-
circuit current is 6.3%, 9.6%, and 28.6% under direct, global (AM1.5G), and
diffuse irradiation (van Sark, 2005). Further modeling taking into account
more realistic irradiation patterns (as measured by a Dutch meteorological
station on a yearly basis) shows that the improvement in ISC varies between
7% and 23% and is linearly related to the average photon energy (van Sark,
2008). In any case, when applying downconverting layers to solar cells, one
has to realize that the NIR photons are not necessarily emitted in the direction
of the semiconductor. Depending on the refractive index of the converter, up
to half of the photons can be lost in the sun direction. Simply increasing the
refractive index n(DC) to match that of silicon might unfortunately not be
the right solution because of greater reflection at the air–converter interface.
An antireflection layer has therefore to be added between air and the
converter. If it is difficult to modify n(DC), a second antireflection layer
should then be introduced between the converter and the semiconductor; in
this case, the efficiency of the device becomes independent of n(DC). Thispoints to the necessity of carefully considering light trapping issues when
optimizing solar cells (De Vos et al., 2009).
In two other prospective papers, B.S. Richards has examined which
Ln-containing systems could be envisaged for downconversion (Richards,
2006a,b). The practical relevance of quantum cutting is, in fact, very
limited. Indeed, both in one-ion or two-ion systems, absorption is usually
either in the vacuum UV (Strumpel et al., 2007), for example, the Pr(4f-5d)
transition at 185 nm or the Gd(6GJ 8S7/2) transition at 202 nm, or in the
UV (300–360 nm), that is in a spectral range where there is no or very little
sun emission (Fig. 12). Some potential systems are however worth discussing
even though they have not been directly coupled with solar cells.
3.2.2. Prospective Systems with Narrow-Band Absorption
Several systems have been investigated. For instance, excitation of the 1G4
level of TmIII in Cs2LiTmCl6:Nd at 476.5-nm followed by deactivation to3H5 and energy transfer onto the Nd(2H9/2) level; then relaxation to Nd(4F3/2)
leads to emission around 900 nm. TmIII emits simultaneously in the range
Handbook on the Physics and Chemistry of Rare Earths192

of 800–840 nm, and other mechanisms are also operating so that the quantum
yield could not been determined (Tanner et al., 2002). Some other papers deal
with downconversion to ErIII; however, the emission of this ion in the range of
1520–1560 nm is not suited for silicon but, rather, for germanium which has a
bandgap corresponding to about 1700 nm (Chen et al., 2012d; Timmerman
et al., 2008; Zhou et al., 2010a,c). ErIII and NdIII ions are much more sensitive
to nonradiative deactivation as compared to YbIII. The latter includes the2F5/2!7F7/2 transition in the range of 950–1150 nm, usually peaking around
980 nm, and featuring extended longer-wavelength crystal-field and vibronic
structures. This emission is ideal because it is only slightly more energetic
than the c-Si bandgap (see Fig. 11), which will minimize thermal losses. YbIII
can be excited by a wealth of other LnIII ions, and the relevant works are
briefly discussed here because they contributed to extendour knowledge of
LnIII spectroscopy and energy-transfer processes. It is worth mentioning that
the host matrix has to be chosen with care since it not only influences some
of the energy migration paths but, more importantly, it may induce multipho-
non nonradiative deactivations. Selected phosphors involving YbIII are
reported in Table 2. The downconversion efficiency �DC is calculated as
(Ueda and Tanabe, 2009):
�DC¼ �D 1��CETð Þþ2�CET��Yb ð14Þwhere �D and �Yb are the quantum yields of the donor and of the acceptor
(YbIII), respectively, under direct excitation (intrinsic quantum yields) and
�CET is the efficiency of the CET:
�CET¼ 1� tD obsð ÞtD 0ð Þ ð15Þ
with tD(obs) and tD(0) being the observed lifetimes of the donor in the pres-
ence and in the absence of the acceptor, respectively.
In Eq. (15), lifetimes may be replaced with integrated emission intensities.
Surprisingly, �Yb is rarely determined and simply set to 1 because the matri-
ces used have usually low phonon energies, minimizing nonradiative deacti-
vations. However, if the YbIII concentration becomes large, cross-relaxation
may considerably reduce the quantum yield: in YAG, for instance, �Yb is
reduced from 96% for a concentration between 2% and 6% to 70% for a
concentration equal to 10% (Ueda and Tanabe, 2009). Downconverting
systems are often characterized by �DC only, but much as for luminescent
compounds, it is the product of �DC by the absorptivity of the materials in
the excitation range used which should be considered. This is rarely done
quantitatively. Furthermore, if coupled with a Si cell, this product should
then be further multiplied by the conversion efficiency at the emitted wave-
length to give an objective description of the overall efficiency of the down-
converting layer.
Chapter 261 Lanthanides in Solar Energy Conversion 193
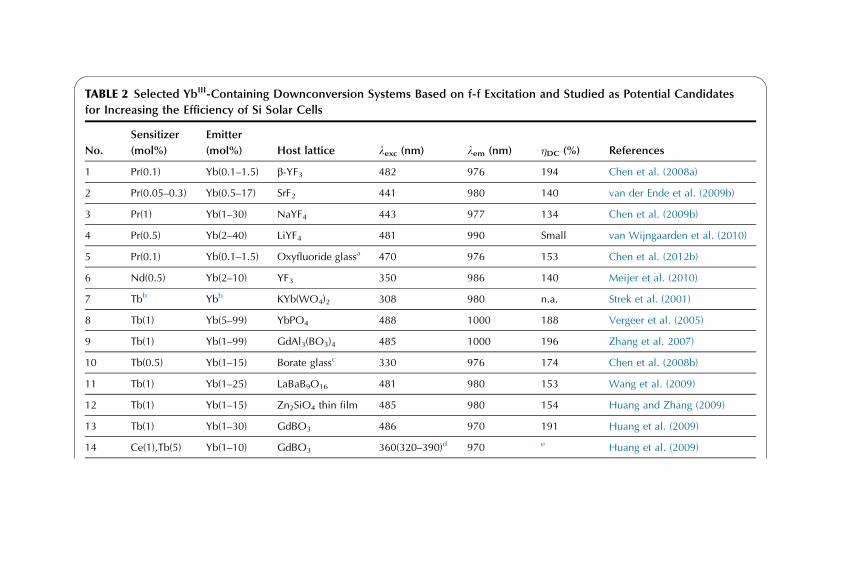
TABLE 2 Selected YbIII-Containing Downconversion Systems Based on f-f Excitation and Studied as Potential Candidates
for Increasing the Efficiency of Si Solar Cells
No.
Sensitizer
(mol%)
Emitter
(mol%) Host lattice lexc (nm) lem (nm) �DC (%) References
1 Pr(0.1) Yb(0.1–1.5) b-YF3 482 976 194 Chen et al. (2008a)
2 Pr(0.05–0.3) Yb(0.5–17) SrF2 441 980 140 van der Ende et al. (2009b)
3 Pr(1) Yb(1–30) NaYF4 443 977 134 Chen et al. (2009b)
4 Pr(0.5) Yb(2–40) LiYF4 481 990 Small van Wijngaarden et al. (2010)
5 Pr(0.1) Yb(0.1–1.5) Oxyfluoride glassa 470 976 153 Chen et al. (2012b)
6 Nd(0.5) Yb(2–10) YF3 350 986 140 Meijer et al. (2010)
7 Tbb Ybb KYb(WO4)2 308 980 n.a. Strek et al. (2001)
8 Tb(1) Yb(5–99) YbPO4 488 1000 188 Vergeer et al. (2005)
9 Tb(1) Yb(1–99) GdAl3(BO3)4 485 1000 196 Zhang et al. 2007)
10 Tb(0.5) Yb(1–15) Borate glassc 330 976 174 Chen et al. (2008b)
11 Tb(1) Yb(1–25) LaBaB9O16 481 980 153 Wang et al. (2009)
12 Tb(1) Yb(1–15) Zn2SiO4 thin film 485 980 154 Huang and Zhang (2009)
13 Tb(1) Yb(1–30) GdBO3 486 970 191 Huang et al. (2009)
14 Ce(1),Tb(5) Yb(1–10) GdBO3 360(320–390)d 970 e Huang et al. (2009)

15 Tb(10) Yb(10–20) LaBGeO5 484/300–490f 1020 146 Liu et al. (2009a)
16 Er(1) Yb(5–30) NaYF4 380 650/980 Small Aarts et al. (2009)
17 Er(0.5) Yb(3) NGCg 350–415h 990/1540 199 Rodriguez et al. (2010)
18 Er(1) Yb(15) Cs3Y2Br9 490/300–380i 999 >195 Eilers et al. (2010)
19 Tmh Ybh Oxyfluoride glassj 468 1016 144–162 Ye et al. (2008a)
20 Tm(1) Yb(5–50) YPO4 474 970–1010 173 Xie et al. (2009)
aGlass composition: 45SiO2–25Al2O3–10Na2O–20CaF2–0.1PrF3–xYbF3 (x¼0.1, 0.3, 0.5, 1.0, and 1.5).bDoping rate not available.cGlass composition: B2O3–BaO–CaO–La2O3.d4f-5d transition of CeIII.eNot available, but Yb emission is 30 times stronger than in the doubly doped (Tb, Yb) material.ff-f transitions to excited TbIII levels.gOxyfluoride nanostructured glass ceramic with optimized composition 32SiO2–9AlO1.5–31.5CdF2–18.5PbF2–5.5ZnF2:3.5LnF3 mol% and a Yb/Er ratio equal to 6.hf-f transitions to 2H9/2,
4G11/2, and2G7/2 excited levels of ErIII.
iThe excitation spectrum of Yb emission also shows a broad Br�-to-Yb3þ charge transfer band between 300 and 380 nm.jGlass composition: 45SiO2–12Na2O–23Al2O3–20LaF3–0.5Tm
3þ–xYb3þ (x¼0, 4, 8).

3.2.3. Prospective Systems with Broad-Band Absorption
The systems listed in Table 2 rely on f-f absorptions as excitation so that they
present limited interest for solar energy conversion because the total amount
of light which can be absorbed is small despite some impressive quantum
yields. This is exemplified by GdBO3:Tb(1%),Yb(x%) (Table 2, entry 13)
with downconversion efficiency of 191% for x¼30, but which only emits
very weakly despite a very efficient Tb(5D4)!Yb(2F5/2) transfer reaching
91% (Huang et al., 2009). The luminescence intensity of the phosphor is,
however, considerably increased when broad-band absorbing CeIII is added
(Table 2, entry 14), 30-fold with respect to GdBO3:Tb,Yb. This is because this
ion has a strong allowed 4f-5d absorption in the range of 320–380 nm and,
also, because energy transfer from the Ce(5d) excited level to Tb(5D3) is very
efficient (98%) as is the Tb-to-Yb transfer; in fact, the luminescence intensity
of the ternary phosphor is fourfold greater compared to GdBO3:Ce,Yb (Huang
et al., 2009). The main observed mechanism is a CET and energy migration
pathways are sketched on Fig. 14.
As a matter of fact, broad-band excitation seems to be the only feasible
alternative. It can be achieved through the lattice, through charge-transfer tran-
sitions, or through 4f-5d transitions. The energy of the latter two can be largely
tuned by changing the metal ion environment (i.e., the lattice). Surprisingly,
fewer broad-band excitation systems have been studied compared to the less
FIGURE 14 Schematic energy-level diagram of the ternary phosphor GdBO3:Ce,Tb,Yb. Dotted
arrows denote either nonradiative or energy-transfer processes. Reproduced with permission from
Huang et al. (2009), © 2009 American Institute of Physics.
Handbook on the Physics and Chemistry of Rare Earths196

efficient f-f excitation. The Cs3Y2Br9 host (Table 2, entry 18) which has very
low phonon energies (�180 cm�1) allows both f-f and broad-band excitation,
but its hygroscopic nature hampers application to solar cells (Eilers et al.,
2010). Selected examples involving YbIII as emitter and broad-band sensitizers
are listed in Table 3. The downconversion efficiencies are similar to those
reported in Table 2, but the absorptivity of the phosphors is larger. As stated
above, there is, however, no quantitative data to assess this aspect.
The tunability of the 4f-5d transition by the lattice is illustrated by CeIII.
When embedded into YAG, this ion displays two 4f!5d transitions owing
to the splitting of the 5d orbital by the crystal field generated by the garnet,
one centered at 350 nm extending from 300 to 370 nm and another one, much
more intense, with a maximum around 450 nm and stretching from 400 to about
500–550 nm. On the other hand, the charge transfer (CT) band of YbIII lies in
the UV (�250–260 nm) and is not of any help for solar energy conversion.
Striking are the large differences in �DC depending on the composition of
the downconverting phosphor, from 96% (Table 3, entry 5) to 175% (entry 6).
Now if CeIII is doped into a borate glass, the energy of the 4f-5d transition is
considerably blue-shifted to �330 nm (Table 3, entry 4) which is detrimental
since solar emission is not intense in the range of 300–380 nm. Introduction of
an additional ion such as TbIII in a Ca2BO3Cl matrix, for instance (entry 2),
has been attempted, and the excitation spectrum contains additional bands
from TbIII f-f transitions; in turn, this necessitates a double energy-transfer
Ce-to-Tb-to-Yb; it seems, nevertheless, that the corresponding phosphor is
much brighter than the GdBO3 downconverters listed in Table 2 (entries 9,
10, 13, 14).
The divalent ions EuII and YbII have also adequate spectroscopic proper-
ties for harvesting part of the UV solar spectrum. For instance, NIR
emission of YbIII occurs after CET from the EuII(4f65d1) level centered at
404 nm (emission range 350–500 nm) to YbIII(2F5/2) in borate glass (Zhou
et al., 2009). The excitation spectrum displays the O2�-to-YbIII CT band at
262 nm (range 220–350)nm and the EuII(5d 4f) transition at 320 nm (range
260–400 nm). The latter is the most efficient in harvesting solar light. Upon
addition of increasing amounts of YbIII, the EuII(4f65d1!4f7) emission is
quenched and the intensity of the YbIII(2F5/2! 2F7/2) fluorescence increases.
This intensity is temperature independent, which points to CET being the
operative mechanism. The composition maximizing CET and minimizing
YbIII cross-relaxation is 0.5 mol% EuII and 3 mol% YbIII. The same authors
have sintered a mixture of CaCO3, Al2O3, and Yb2O3 under reducing atmo-
sphere (8% H2/92% N2) which resulted in a mixed valence compound with
about 40% of the Yb content reduced to YbII (Teng et al., 2010). The
corresponding YbII(5d 4f) transition occurs at 310 nm (range 230–360 nm,
including the YbIII CT transition mentioned above). No luminescence is usu-
ally observed at room temperature from the 4f125d1 state, but in the presence
of YbIII, the luminescence of the latter is enhanced. A log–log plot of the
Chapter 261 Lanthanides in Solar Energy Conversion 197
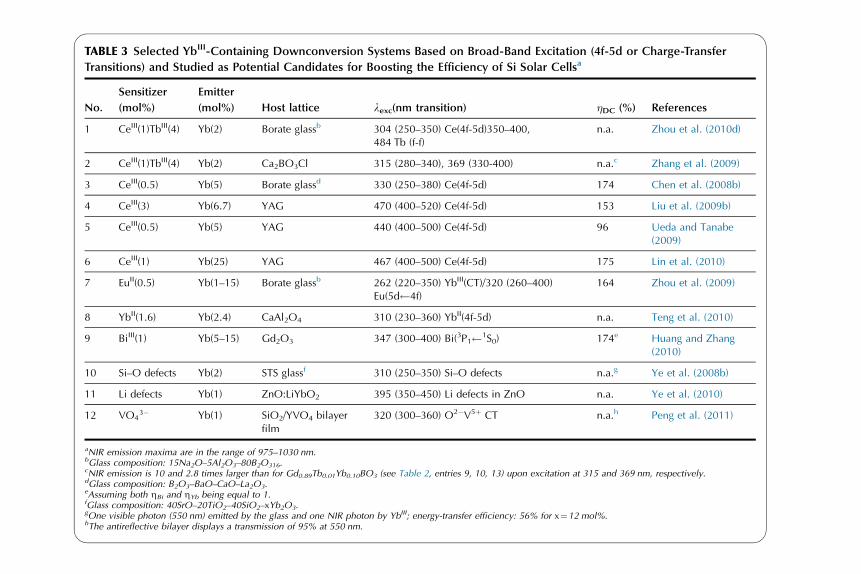
TABLE 3 Selected YbIII-Containing Downconversion Systems Based on Broad-Band Excitation (4f-5d or Charge-Transfer
Transitions) and Studied as Potential Candidates for Boosting the Efficiency of Si Solar Cellsa
No.
Sensitizer
(mol%)
Emitter
(mol%) Host lattice lexc(nm transition) �DC (%) References
1 CeIII(1)TbIII(4) Yb(2) Borate glassb 304 (250–350) Ce(4f-5d)350–400,484 Tb (f-f)
n.a. Zhou et al. (2010d)
2 CeIII(1)TbIII(4) Yb(2) Ca2BO3Cl 315 (280–340), 369 (330-400) n.a.c Zhang et al. (2009)
3 CeIII(0.5) Yb(5) Borate glassd 330 (250–380) Ce(4f-5d) 174 Chen et al. (2008b)
4 CeIII(3) Yb(6.7) YAG 470 (400–520) Ce(4f-5d) 153 Liu et al. (2009b)
5 CeIII(0.5) Yb(5) YAG 440 (400–500) Ce(4f-5d) 96 Ueda and Tanabe(2009)
6 CeIII(1) Yb(25) YAG 467 (400–500) Ce(4f-5d) 175 Lin et al. (2010)
7 EuII(0.5) Yb(1–15) Borate glassb 262 (220–350) YbIII(CT)/320 (260–400)Eu(5d 4f)
164 Zhou et al. (2009)
8 YbII(1.6) Yb(2.4) CaAl2O4 310 (230–360) YbII(4f-5d) n.a. Teng et al. (2010)
9 BiIII(1) Yb(5–15) Gd2O3 347 (300–400) Bi(3P1 1S0) 174e Huang and Zhang(2010)
10 Si–O defects Yb(2) STS glassf 310 (250–350) Si–O defects n.a.g Ye et al. (2008b)
11 Li defects Yb(1) ZnO:LiYbO2 395 (350–450) Li defects in ZnO n.a. Ye et al. (2010)
12 VO43� Yb(1) SiO2/YVO4 bilayer
film320 (300–360) O2�V5þ CT n.a.h Peng et al. (2011)
aNIR emission maxima are in the range of 975–1030 nm.bGlass composition: 15Na2O–5Al2O3–80B2O316.cNIR emission is 10 and 2.8 times larger than for Gd0.89Tb0.01Yb0.10BO3 (see Table 2, entries 9, 10, 13) upon excitation at 315 and 369 nm, respectively.dGlass composition: B2O3–BaO–CaO–La2O3.eAssuming both ZBi and ZYb being equal to 1.fGlass composition: 40SrO–20TiO2–40SiO2–xYb2O3.gOne visible photon (550 nm) emitted by the glass and one NIR photon by YbIII; energy-transfer efficiency: 56% for x¼12 mol%.hThe antireflective bilayer displays a transmission of 95% at 550 nm.

emitted intensity versus excitation power yields a straight line with a slope
0.430.03. The expected value for CET transfer onto two YbIII ions would
be 0.5; if phonon assisted (to degrade the remaining energy), the process
would need 8 phonons (the aluminate matrix has phonon energy of about
1000 cm�1) which is large. Consequently, the authors suggest that part of
the (YbII)* energy is dissipated via CET to three YbIII ions (the slope of the
log–log plot for such a process would be 0.33), although they admit that such
a mechanism has low probability. The idea is partially supported by the fact
that YbIII luminescence is almost temperature independent in the range of
15–350 K.
Ions other than lanthanides have absorption in the range of 300–400 nm
and BiIII (6s2) is one of them. The 3P1 1S0 transition is centered at
347 nm and 3P1 transfers energy onto YbIII(2F5/2) levels in doped Gd2O3
with an efficiency varying between 34% and 74% for YbIII concentrations
between 5 and 15 mol%, respectively (Table 3, entry 9). Under the assump-
tion that �Bi and �Yb are both equal to unity, �DC is calculated to reach
174% (see Eq. (14); Huang and Zhang, 2010). Similar observations are
reported for Y2O3 doped with 1% BiIII and 2% YbIII (Huang et al., 2011). Sil-
icon defects in Ba2TiSi2O8 crystals doped with YbIII also act as sensitizers for
this ion although they absorb in a slightly less favorable spectral range,
250–350 nm (Ye et al., 2008b). More interesting are ZnO hybrid phosphors,
for instance, ZnO:LiYbO2(1 mol%): excitation into Li defects of ZnO
(350–450 nm, maximum at 395 nm) results in intense YbIII fluorescence in
addition to self-activated emission from ZnO peaking at 520 nm but extending
from 450 to 650 nm; this can be considered as being a double downshifting
process (Ye et al., 2010).
3.2.3.1. Trivalent Holmium as Downconverting Ion
Yttrium vanadate is an alternative host for LnIII ions which displays a CT
absorption band at 328 nm (range: 250–360 nm) and emits a broad band at
450 nm (370–670 nm). When 2 mol% of HoIII is doped into YVO4, energy
transfer occurs and strong HoIII luminescence bands at 550 (5S4,5F2!5I8),
650 (5F5!5I8), 975 (5F5!5I7), 1015 (5S4,5F2!5I6), 1150 and 1190
(5I6!5I8 ) nm appear, while the CT luminescence is almost completely
quenched (Yu et al., 2012a). The process can be interpreted as being a
sequential two-step downconversion mechanism yielding two NIR photons;
the corresponding transitions are numbered ① and ② in Fig. 15. The same
host was chosen to develop an antireflective bilayer film for c-Si cells com-
prising SiO2 and doped YVO4 layers that displays downconversion
upon excitation into the vanadate CT band at 320 nm; a highly
transparent device was obtained with transmission up to 95% at 550 nm (Peng
et al., 2011).
Chapter 261 Lanthanides in Solar Energy Conversion 199

3.2.4. Practical Systems for Downconversion
Until now, very few papers report successful downconversion experiments
with actual solar cells. One Chinese patent mentions transparent oxyfluoride
microcrystalline glasses containing 1–40 mol% of LnIII ions and featur-
ing quantum yields larger than 1 (Chen et al., 2009a). In a recent paper,
authors report that a c-Si cell fitted with an oxyfluoride glass layer
(2�2 cm2�2 mm) with composition 60 SiO2–20 Al2O3–20 CaF2: 0.4PrIII,
YbIII (0–4 mol%) has lower EQE compared to the cell without the downcon-
verting layer despite a DC quantum yield of 158%. Two reasons may explain
this deceptive result: reflection losses due to the added layer and, possibly, a
smaller real quantum yield than calculated (Zhou et al., 2012). Finally, the
performances of a c-Si cell have been evaluated with the photovoltaic simula-
tion program PC1D; the simulated conversion efficiency increases from
12.3% to 14.9% (þ22 relative%) upon incorporation of a 3-mm thick fluoride
glass co-doped with PrIII (1.7�1025 ions/m3) and YbIII (3.6�1026 ions/m3).
The quantum yield of the downconversion system amounts to 186% (Song
and Jiang, 2012).
On the other hand, downshifting materials have been tested and they are
described in the following sections.
FIGURE 15 Energy-level diagram for the energy migration processes occurring in YVO4:
Ho(2%) after excitation into the CT band of VO43�; energy transfer on HoIII generates the
two NIR transitions labeled ① and ②; direct excitation into HoIII levels 5S4,5F2, or
5F5 and
subsequent luminescence transitions are also shown. Reproduced with permission from Yu et al.
(2012a), © Elsevier B.V. 2012.
Handbook on the Physics and Chemistry of Rare Earths200

3.3. Downshifting Materials
There are two types of downshifting materials: fluorescent organic dyes and
transition metal (mainly 4f) phosphors and complexes. As will be described
below, it seems that approximately 1% can be added to the efficiency of mod-
ules with overall efficiencies of 10–15% by using a downshifting layer. For
instance, c-Si cells encapsulated into PMMA containing a LUMOGEN® dye
(570, 083, or 300) from BASF display an increase in EQE below 400 nm from
near zero up to 40%, and the subsequent rise in photocurrent induces a þ1%increase in total efficiency (McIntosh et al., 2009). The fluorescent organic
dyes suffer from the same drawbacks as those described for LSCs, particularly
poor photostability, henceforth the idea to replace them with LnIII compounds
which are less prone to photobleaching and reabsorption. The downshifting
process is easier to put into practice than downconversion because there is
no need to precisely match transition energies in the donor and acceptor ions.
That is, broad-band excitation can be used routinely, either by antenna effect
in coordination complexes or 4f-5d transitions for inorganic materials contain-
ing divalent (e.g., EuII) or trivalent (e.g., CeIII) ions.
3.3.1. Complexes with Organic Ligands
To our knowledge, the first demonstration of downshifting increasing the effi-
ciency of both crystalline and amorphous Si solar cells dates back to 1997.
Hybrid Si polyvinyl chloride (PVC) cells were coated with an ORMOSIL con-
taining 1–3 mol% of [EuCl3(phen)2] or [TbCl3(bpy)2] complexes (Scheme 4).
A relative increase in the conversion efficiency of 15% was observed under
O
HO
HC1
HO
HC2O
HO
OHC3
O O
HDBM
N
N
N
N
bpy
phen
O OH
OH
Hphba
MeMe
Me
CF3
O
Oftc
N N N NAL1 AL2
SCHEME 4 Carboxylate ligands, dibenzoylmethane, camphorate, and ancillary ligands
mentioned in Section 3.3.1.
Chapter 261 Lanthanides in Solar Energy Conversion 201

AM1.5G illumination for the c-Si PVC cell coated with the ORMOSIL–EuIII
complex, while the TbIII coating was detrimental. In order to lower the amount
of light scattered by the ORMOSIL–EuIII complex coating, a silica gel layer
was added and the increase in efficiency went up to 18%. The final absolute
efficiency of the commercially available solar cell was 9.1%. Conversely,
the efficiency of the hybrid a-Si PVC cell was increased by 8% when an
ORMOSIL–TbIII complex layer was added (Jin et al., 1997). These results were
confirmed 3 years later by the same authors in a slightly different way. The
ORMOSIL–EuCl3(phen)2 (3 mol%) solution was dip-coated onto a quartz plate
until a 300-nm thick film was obtained. A LSC was then assembled from
three such plates with Ag paste and coupled to commercially available c-Si
PVC hybrid cells (with absolute yield between 6% and 8.5%). The photovoltaic
output of the composite device increased by 10–15% with respect to the
uncoupled cell, that is adding about 1% to the absolute external quantum
efficiency (Machida et al., 2000). This is in fact a good performance because
the absorption spectrum of the EuIII complex only marginally overlaps with
the solar spectrum in the range of 300–390 nm, which represents merely
3.9% of the solar spectrum; this means that the reported overall downshifting
process has an efficiency of about 26%. A later investigation confirmed the use-
fulness of such coatings. For instance, a c-Si cell was fitted with a layer of
PVA containing 10% of [Eu(NO3)3(phen)2] (absorbing >90% of the high-
energy tail of the solar spectrum; quantum yield 40%) and between 0.8% to
1% was added to the overall efficiency of the cell (the efficiency itself was
not given). However, we note that this experiment has been conducted
under AM 0 illumination which delivers about twice as much photons in the
300–390 nm range than AM 1.5 (Marchionna et al., 2006).
Highly luminescent EuIIIb-diketonates have the same effect. For instance,
films containing an equimolar (0.5 mol%/0.5 mol%) mixture of europium tris(thenoyltrifluoro acetylacetonate) (Scheme 1) and terbium p-hydroxybenzoate(Scheme 4) and dip-coated on c-Si commercial cells (yield not known) are
reported to increase the conversion efficiency by 15% but no details are given
(Li and Xianping, 2008). In another attempt, 2 wt% of [Eu(tta)3(phen)] micropar-
ticles (mean diameter 20 mm) encapsulated into silicate glass by a sol-gel proce-
dure resulted in a 1-mA cm�2 increase in the short-circuit current density of a
c-Si cell (yield not given) (Fukuda et al., 2009). A PVA coating doped with
2 wt% of [Eu(dbm)3(phen)] increases the measured maximum power of a
13%-efficiency c-Si module (147�68 cm2) by 2.70.1 relative % (standard
deviation for 15 I–V measurements) and its short-circuit current by 1.10.1
relative %, under AM 1.5G conditions. A similar enhancement is obtained by
co-doping minute quantities of [Eu(dbm)3(phen)], 0.0015 wt% and of the cam-
phorate [Eu(tfc)3] complex (Scheme 4), 0.003 wt% (Le Donne et al., 2009).
When the module is equipped with a protective glass cover, these numbers
decrease to 0.810.1% and 0.650.1%, respectively; however, a calculation
shows that despite the additional cost of the doped PVA coating (estimated to
Handbook on the Physics and Chemistry of Rare Earths202
2.2E), the cost per watt produced decreases by about 10%. A patent by Japanese
scientists proposes to incorporate simple neutral EuIII complexes [Eu(Cn)3]
(n¼1, 2), [Eu(C1)3(bpy)], [Eu(C3)3(phen)], or [Eu(dbm)3(phen)] (Scheme 4) in
the resin used as sealing material in solar cells and modules. The Eu-content is
between 0.1 and 1 wt%, and an increase in the efficiency of Si solar modules
from 14.5% to 15.5% is reported (Kanesato et al., 2010). More recently, several
diketonate ternary complexes, [Eu(DBM)(phen) and [Eu(tta)L] (L¼bipy, phen,
AL1, AL2 Scheme 4), have been tested as downshifting materials. They were
doped into PVA and the best result is with [Eu(tta)(AL2)] at 1 wt%: the photo-
current increases from 35.7 to 36.4 mA cm�2 and the conversion yield from
16.1% to 16.4% corresponding to þ 2 rel% (Liu et al., 2013). We note that
lanthanide complexes with dbm (Ln¼Pr, Sm, Eu, Tb) have also been proposed
as electron acceptors in organic photovoltaic devices (OPVs) (Si et al., 2007).
The work of Katsagounos et al. (2011) is also worth mentioning. These
authors put an m-Si cell with initial quantum efficiency of 15% into contact
with 1 and 3 LSC layers doped with [Eu(NO3)3(trz1)] (Scheme 2) and achieved
improvements reaching 17% and 28%, respectively, corresponding to absolute
2.5% and 4.2% increases (see Section 2.3). This is the largest enhancement
obtained since all other experiments reported to date and involving simple EuIII
complexes converge toward an improvement of 0.5–1% in the absolute external
quantum efficiency of Si cells. Although modest, this is by no way negligible,
provided that the added cost and induced extra engineering is not too large.
3.3.2. Inorganic Materials
An isolated report published in 1998 claimed that implanting europium ions
(2.5�1011 ions/cm2) into the antireflection glass of an a-Si cell improved its
characteristics (I vs. V and P vs. V) by as much as 58% under 240 lx irradiation
(AM1.5G); the reason invoked is wavelength conversion by EuIII ions (Diaw,
1998). However, the luminescence spectrum shown displays a broad shoulder
around 500 nm and no typical emission bands from trivalent europium at
590/620 nm. These data would be more in line with EuII emission. Moreover,
absorption of the ions has a maximum around 370 nm, a spectral range in which
little sun irradiance occurs. There has been no direct follow up to this work until
2009 when EuIII ions were introduced into a silica film by a sol-gel method and
the film was deposited onto an optical glass antireflective substrate by dip-
coating. Characteristic EuIII emission spectra were obtained upon excitation into
the 5L6 7F0,1 transition at 396 nm, and the efficiency of an a-Si cell increased
from 11.0% to 12.0% when a 0.5M EuIII solution was used in the sol-gel syn-
thesis. Further increase in the EuIII concentration led to concentration quench-
ing (Cheng et al., 2009). These data seem reasonable since one may calculate
from Fig. 1 that the spectral range of 385–405 nm (5L6 7F0,1 transition) con-
tains 1.7% of the sun emission, and if considering other excitation paths for
EuIII, the 300–405 nm range corresponds to 5.2% of sunlight.
Chapter 261 Lanthanides in Solar Energy Conversion 203

With respect to inorganic compounds, early experiments took advantage
of the known red phosphors Y2O3:EuIII and Y2O2S:Eu
III which were dispersed
in PVA/water mixtures and spin-coated onto epoxy-encapsulated Si cells.
Under UV excitation (250–400 nm), improved conversion was obtained but
the conversion yield decreased substantially under visible excitation, due to
the coatings inducing light scattering (Chung et al., 2007). Other phosphors
perform better. For instance, KCaGd(PO4)2:EuIII (% Eu not given) dispersed
in PMMA was screen-printed on the top of the Si3N4 reflective layer of c-Si
cells to form a 3–4-mm thick film. Thus, the efficiency of the solar cells
increased by 0.5% to 16.0% due to the conversion of 350–400 nm photons
into red photons (580–710 nm) and to a lower reflectivity (Chen et al.,
2011). Screen-printed c-Si cells are drawing attention and downshifting has
also been applied in an effort to improve their overall efficiency. Since
lanthanide-doped inorganic phosphors are difficult to disperse in solvents,
investigators have turned to yttrium hydroxide nanotubes doped with 5 mol%
EuIII. This nanomaterial can be conveniently synthesized via the hydrother-
mal route at low temperature (180 �C) and is then spin cast on the front face
of the cell. The authors claim that under AM1.5G illumination the yield of
the cell increases from 15.2% to 17.2% upon adding the downshifting layer
(Cheng and Yang, 2012), an amazing þ2 absolute%. Indeed, since the sys-
tem relies on f-f transitions of EuIII in the range of 300–400 nm (4.6% of
the solar irradiance), this would mean that the efficiency of the downshifting
layer is close to 44%. Moreover, the authors report that neither the open-
circuit voltage nor the series resistance of the cells change. Finally, the
ICPE curve of the modified cell only exceeds that of the reference cell by
3.5% in the range of 450–700 nm and does not display a marked increase
at 620 nm where the most intense emission of EuIII occurs. There is little
doubt that these results will have to be confirmed in an independent experi-
ment. On the other hand, an 8.5–9.2-mm thick PMMA film doped with
YVO4:Bi (3.6–15 mol/%), Eu(36 mol%) position on the top of a c-Si mod-
ule with Al tape as side mirrors and a refractive-index matching oil resulted
in a decrease in the conversion efficiency by 1–2% (Iso et al., 2012).
ZBLAN glasses containing chloride and doped with EuII, 48ZrF4–
10BaF2–10BaCl2–20NaCl–3.5LaF3–3AlF3–0.5InF3–5EuF, show EuII lumi-
nescence under UV excitation (280 nm) only; but after oxidation, typical
emission bands from EuIII develop upon excitation in the range of
300–400 nm. When fitted on the top of a conventional c-Si cell, the short-
circuit current increases considerably in this spectral range, up to a factor of
6 at 360 nm, as depicted on Fig. 16 (Schweizer et al., 2010).
Another ion worth of interest is divalent europium with two 4f-5d absorp-
tion bands centered at 215 and 335 nm and an broad emission band at 425 nm,
which can be displaced by modifying the chemical environment of the ion.
This ion has therefore been doped into a crystal of CaF2 itself used as replace-
ment for the antireflection coating of an a-Si commercial cell. An optimized
Handbook on the Physics and Chemistry of Rare Earths204

0.05 mol% doping yields substantial improvements in the cell efficiency
which depends on the intensity of the irradiation: for an illumination of
9�104 lx, þ10% is recorded while this figure goes up to 50% (EQE increas-
ing from 10% to 15%) for 1�104 lx (Kawano et al., 1997a,b). A later deter-
mination yielded þ8% and þ45%, respectively (Kawano et al., 2009).
Inorganic nanoglasses have also been proposed (Chen et al., 2012a), for
instance, nanoglass ceramics containing YF3:Dy,Tb in which dysprosium
efficiently transfers energy onto TbIII (Santana-Alonso et al., 2011) and gado-
linium oxide co-doped with BiIII (0.5%) and NdIII(2%). The first material pre-
sents the inconvenience of relying on weak f-f transitions, while the second is
more interesting because it displays a broad and intense absorption band
between 320 and 400 nm and the bismuth-to-neodymium energy transfer
reaches 64% (Liu et al., 2011a). However, none of these nanoglasses has actu-
ally been coupled to solar cells.
3.4. Upconverting Materials
In a seminal paper, Trupke and coworkers (Trupke et al., 2002b) have ana-
lyzed the influence of adding a rear upconverting layer to solar cells. The idea
is to convert the NIR light unabsorbed by the cell photomaterial into light
with shorter wavelength which, after reflection by a mirror can be absorbed
by the semiconductor (Fig. 4B). The solar cell C1 (Fig. 17) is electronically
insulated from the converter and absorbs sunlight with energies larger than
the bandgap Eg. The upconverter absorbs energies lower than the bandgap
and can be represented by three cells C2, C3, and C4 which are connected
in series. The cell C2 represents the band–band transition and cells C3 and
FIGURE 16 Short-circuit current ratio between a conventional c-Si cell with a glass ceramic
cover made of ZBLAN glass containing 5% EuIII and a cell without glass cover. Reproduced with
permission from Schweizer et al. (2010), © 2010, SPIE.
Chapter 261 Lanthanides in Solar Energy Conversion 205

C4 the two intermediate transitions. The upconverting material ideally has a
band gap matching the one of the solar cell but possesses an IL with energy
E1 above the valence-band edge; additionally, the energy difference between
the lower valence-band edge and the upper conduction-band edge should be
equal to EgþE2. The two sequential transitions result in the creation of
electrons in the conduction band (CB) and holes in the valence band (VB).
A fraction of these electron–hole pairs then recombine in a radiative
band-to-band transition, and since the solar cell and the upconverting material
are assumed to have similar Eg values, the generated photons are reabsorbed
by the solar cell.
The overall conversion yield of the cell fitted with the upconverting layer
depends on several factors, namely, Eg, E1, the illumination (nonconcentrated
or concentrated light, incidence angle), and the relaxation of the electrons in
the intermediate state (thermalization, dark gray bands in the energy scheme
of Fig. 17). With this model, the authors calculate an upper limit of efficiency
for idealized 6000-K blackbody spectrum of 47.6% taking the following
values of the parameters into account: Eg¼2 eV, E1¼0.94 eV,
E2¼1.39 eV, and Erelax¼0.33 eV. For concentrated illumination, this value
goes up to �60%. When the more realistic terrestrial sun spectrum
AM1.5G is used, with the same refractive index of 3.6, the yield reaches
50.7% for a 2-eV bandgap (Trupke et al., 2006). The theoretical maximum
efficiency versus Eg is visualized in Fig. 18.
This model has been later refined by taking into account refractive indices
of the cell and the upconverter and by considering an alternate set-up with
the upconverting layer in front of the cell. The main conclusions are that
the efficiency increases if refractive indices increase and that no improved
conversion efficiency is obtained by inserting the upconverting layer in front
of the cell (Badescu and Badescu, 2009). A practical calculation for c-Si cells
EV
EC
Ei
E1 E2
VB
+
-
C1 C2
C4
C3
E2
Eg
Eg
CB
Erelax
FIGURE 17 Scheme of a solar cell fitted with an upconverting rear layer: energy levels (left)
and equivalent circuit (right). Redrawn from Trupke et al. (2002b).
Handbook on the Physics and Chemistry of Rare Earths206

(Eg¼1.1 eV, n¼3.4) without and with the rear upconverting layer (n¼3.4)
does not show any improvement under nonconcentrated illumination, while
under 1000 suns irradiation, the conversion efficiency is increased by
�20% with respect to a cell without converter. The absolute calculated yields
differ considerably from those reported by Trupke et al. (Trupke et al.,
2002b): 21% and 31%, respectively, because the band gap (1.1 eV vs. 2 eV)
and the refractive index (3.4 vs. 3.6) used in the second work are different,
and because refractive losses have been taken into account.
This points to theoretical models being still insufficiently accurate to predict
the exact effect of upconverting layers taking all parameters into consideration.
But the perspective of boosting the yield of solar cells by upconversion has
stirred a lot of attention, even for Si cell for which the overall yield is already
sizeable, and several review and perspective articles have tackled the problem
(de Wild et al., 2011; Fischer et al., 2012b; Reisfeld, 2010; Richards, 2006a;
Shalav et al., 2007; Strumpel et al., 2007; van der Ende et al., 2009a; van Sark
et al., 2010; Wang et al., 2011a,b). A good upconverter for c-Si cells should
meet the following requirements (Strumpel et al., 2007):
l Absorption in the range l>�1100 nm (corresponding to Eg<�1.12 eV)
l Emission at l<1100 nm
l High upconversion yield at low power excitation
l High transmittance of the upconverted light
The wavelength limits given above depend on the bandgap of the semicon-
ductor. Moreover, thin film a-Si cells display relatively low absorption in
1.0 1.5 2.0 2.5 3.030
35
40
45
50
55
η (%
)
Eg (eV)
FIGURE 18 Theoretical maximum efficiency � of an upconversion-fitted semiconductor solar
cell versus the bandgap Eg of the semiconductor material (refractive index set to n¼3.6).
Redrawn from data reported in Trupke et al. (2006).
Chapter 261 Lanthanides in Solar Energy Conversion 207

the range of 950–1100 nm so that an upconverter absorbing in this range
might also be useful. Upconversion is different from two-photon absorption
in that it requires a real intermediate electronic level (Fig. 19), whereas in
two-photon absorption, the IL is a virtual level. The upconversion yield is a
real concern in that it rarely exceeds 10%. The reason lies in the upconvers-
ion mechanisms which require sequential multiphoton absorption and, there-
fore, are less efficient compared to common one-photon excitation. The
main upconversion mechanisms which may play a role are schematically
depicted in Fig. 19. Energy-transfer upconversion (ETU) has the highest prob-
ability. When the upconverted emission intensity is plotted against the excita-
tion power in a log–log graph, the slope of the resulting linear correlation
indicates how many photons are involved (n¼2 for the mechanisms described
in Fig. 19). However, the experimentally determined numbers are often smal-
ler and noninteger due to cross-relaxation and nonradiative losses.
The various mechanisms can take place simultaneously, but one is usually
dominant. For instance, for doping concentrations larger than 2% and rela-
tively low excitation powers (<200 mW cm�2), ETU is the main mechanism.
Several experimental techniques are available to assess which mechanism
governs the UC process, in particular when it comes to distinguishing between
ETU and ESA (Shalav et al., 2007). Indeed, the luminescence decay profile
for ground state absorption (GSA)-ESA and ETU mechanisms are different.
Excitation in the first case only occurs during the light pulse and the lumines-
cence intensity decreases exponentially after illumination is switched off. On
the other hand, in the case of ETU energy transfer occurs as long as the IL is
populated, that is, even after the end of the light pulse so that the decays are
not exponential. Excitation spectra are also useful in that their crystal-field
structure narrows with the number of photons needed to reach the final
excited state (Auzel, 2004).
Energy transferupconversion ETU
h ≈ 10-3 h ≈ 10-5 h ≈ 10-6 h ≈ 10-8
Excited stateabsorption ESA
Cooperativesensitization
Cooperativeluminescence
FIGURE 19 Upconversion mechanisms and estimated relative efficiencies according to Auzel
(2004). Note that the second mechanism, ESA, is more precisely described as GSA–ESA, ground
state absorption followed by excited state absorption.
Handbook on the Physics and Chemistry of Rare Earths208

The cell architecture, especially the position of the upconversion layer, is
equally important. From a theoretical study (Badescu and Badescu, 2009), as well
as from the experimental results described below, the best design is to position the
upconverting layer at the rear of the cell, with a mirror layer (often Al, playing the
additional role of electrode) sending the upconverted photons into the Si layers.
When looking at Fig. 2, one realizes that 7% of the sun irradiance is emitted
between 1.4 and 1.9 mm so that this spectral range has been a main target for
developing upconverting solar materials. One lanthanide ion of choice
is undoubtedly ErIII since it absorbs in the range of 1460–1580 nm (2.8% of solar
emission) and emits at 980 nm, an ideal wavelength with respect to the c-Si band-
gap. Additionally, it can also absorb at 980 nm (or be excited through energy
transfer from YbIII) and emit green (540 nm) and red (620 nm) light. Other ions
of interest include NdIII (Ahrens et al., 2008), HoIII (Chen and Chen, 2011; Lahoz,
2008), YbIII (Lahoz et al., 2011), and, possibly, TmIII (Strumpel et al., 2007).
3.4.1. Erbium-Based Upconverters
The 4f11 electronic structure of ErIII generates 364 electronic levels and its spec-
troscopy is quite intricate. A partial diagram is shown below (Fig. 20). The main
transitions of interest for our purpose are the ones involving the 4IJ (J¼9/2, 11/2,
13/2, and 15/2) levels. Transitions leading to green and red emission from the4S3/2,
4F9/2 levels are better suited for upconversion in DSSCs (see Section 5.6).
20
16
12
8
4
0
E (103 cm-1) E (103 cm-1)
4F7/25F3
5F4,5S25F5
5I4
5I8
4S3/2
4F9/2
4I9/2
4I11/2
4I13/2
4I15/2
2F5/2
2F7/2
2H11/2
980 1523 1540 540 640 805 980 550 660
20
16
12
8
4
0
ErIII YbIII HoIII
FIGURE 20 Partial energy level diagrams of ErIII, YbIII, and HoIII with main absorption, emis-
sion, and upconversion transitions (wavelengths given in nm) and showing the sensitizer role of
YbIII. Energy levels are taken from Carnall (1979).
Chapter 261 Lanthanides in Solar Energy Conversion 209

The host into which the optically active ion is embedded is of utmost
importance, particularly with reference to preventing nonradiative deactiva-
tions. In this respect, chloride and bromide hosts, with phonon energies of
260 and 175 cm�1, appear to be ideal. However, they generate weak
crystal-field splitting, and as a consequence, the absorption range is reduced,
as exemplified in Fig. 21. Additionally, these hosts are often hygroscopic and
therefore unstable inambient atmosphere. Another point to note here is that
population of some excited levels, for example, Er(4I11/2), the most significant
level contributing to the total upconversion yield, is phonon assisted and low
phonon energies result in smaller population. For these reasons, a majority of
investigations rely on fluoride hosts (350 cm�1), as can be seen from Table 4.
In particular, the b-phase of NaYF4 doped with 20% ErIII (or, for visible
upconversion, 18% YbIII and 2% ErIII) proved to be an efficient upconverter,
contrary to the a-phase; upconversion yields for the YbIII, ErIII-doped micro-
crystalline powder can be as high as 5–6% upon laser excitation at 980 nm
and 200 mW cm�2 (Hehlen et al., 2001) and newer designs considerably
boost the UC yield (see Section 3.4.4).
When reporting an upconversion quantum yield, it is important to mention
the excitation power since the yield (EQE) is proportional to Pin�1ð Þ, where n
1.47 1.49 1.51 1.53 1.55
A
B
1.57
l (mm)
FIGURE 21 Excitation spectra of (A) YF3:Er(20 mol%) and (B) BaCl2:Er(28 mol%);
lem¼550 nm. Adapted with permission from Ohwaki and Wang (1994), © 1994, Japan Societyof Applied Physics.
Handbook on the Physics and Chemistry of Rare Earths210

TABLE 4 Selected LnIII-Based Upconverting Materials for Si Solar Cells
Upconverter How introduced Solar cell Exc./Em. (nm) Effect (excitation power Pex) References
NaYF4:Er(20%) Acrylic adhesive gelon rear of cell in 3:2 wt%ratio, 0.5-mm thick
Bifacial c-Si(�¼15%)
1480–1580/980–1020
EQE 1523 nm: 2.5% (5.1 mW)IQE¼3.8%
Shalav et al.(2003,2005a,b)
NaYF4:Er(20%) White oilþ rubberizeron rear of cell in 4:1 wt%ratio,1.6-mm thick
Bifacial c-Si(�¼15%)
1480–1580/980–1020
EQE 1523 nm: 3.4% (6 mW or2.4 W cm�2)IQE¼5.7%IOE¼16.7% (2.4 Wcm�2)
Shalav et al.(2005b) andRichards andShalav (2007)
NaYF4:Er(20%) Acrylic adhesive gelon rear of cell
Bifacial c-Si(�¼15%)
1480–1580/980–1020
EQE 1550 nm: 0.6% (2000 Wm�2) Trupke et al.(2006)
NaYF4:Er(20%) 96 wt% in zapon varnish(n¼1.50) at rear of cell
Bifacial c-Si(�¼19%)
1460–1580/980–1020
EQE 1522 nm: 0.34% (1090 Wm�2)IQE 1.1% (440 Wm�2)IOE 5.1% (1880 Wm�2)
Fischer et al.(2010)
NaYF4:Er(20%) 98 wt% in zapon varnish(n¼1.50) at rear of cell(0.9-mm thick)
Bifacial Si(�¼16.7%)
1460–1600/980–1020
EQE 1523 nm: 0.47% (1629 Wm�2)EQE 1523 nm: 0.71% (2601 Wm�2)EQE 1460–1600 nm: 1.07% (2601 Wm�2)
Goldschmidtet al. (2011)
NaYF4:Er(2%) 0.75% in a spin-coatedlayer on a glass atrear of cell
Bifacial c-Si(�¼7.7%)
1 sun, AM 0 Relative increase of 8.6% in �, from 7.7%to 8.3%
Chen et al.(2012c)
NaYF4:Yb(18%),Er(2%)
Dissolved in PMMA anddropcast over ZnO:Alback contact
a-Si:H, singlejunction
980/400–700 EQE 980 nm: 0.01% (3 W cm�2) de Wild et al.(2010a)
NaYF4:Yb(18%),Er(2%)
In PMMA, at rear of cell a-Si:H cell(�¼8%)
981–986/650,540, 522
Doubling of current density from 5 to10 mA cm�2
de Wild et al.(2010b)
NaYF4:Yb(18%),Er(2%)
Front layer of NaYF4:Yb,Er,Gd(30%) nanorodsfitted with Au NPs or Aushells
a-Si:H cell 980 (1.1 W)/540, 660
16- (without Au) and 72-fold (with Au)increase in photocurrent (from 16 to260 and 440 mA, respectively)EQE¼0.14% (with Au)
Li et al.(2012c)
Continued

TABLE 4 Selected LnIII-Based Upconverting Materials for Si Solar Cells—Cont’d
Upconverter How introduced Solar cell Exc./Em. (nm) Effect (excitation power Pex) References
NaYF4:Yb(18%),Er(2%)
Dispersed into PDMS(conc. unknown)
a-Si (thin film) 1 sun Current increases from 16 to 17 mA cm�2;conversion yield increases from 5.7% to6.0% (þ5 rel%)
Zhang et al.(2010b)
Gd2O3:Er 250-nm film at front ofcell as passivation layer
c-Si (��11%) 1520–15601 sun
Increase in photocurrent 2.8 (n-type abs.)or 4% (p-type abs.) decrease in �
Sewell et al.(2009)
Gd2O2S:Er Dissolved in PMMA anddrop cast over ZnO:Alback contact
a-Si:H, singlejunction
980/400–700 EQE 980 nm: 0.05–0.09% dependingon texture (0.6–3 W cm�2)
de Wild et al.(2010a)
Yb2O3:Er 250-nm film at front ofcell as passivation layer
c-Si (��11%) 1520–15601 sun
Increase in photocurrent 4.4% decreasein �(p-type abs.)
Sewell et al.(2009)
ZBLAN:Er(5%)a 2-mm thick glass plateon the top of cell
c-Si (�: n.a.) 1540 Increase in photocurrent Passlick et al.(2010) andSchweizeret al. (2010)
ZBLAN:Er(2–14%)a 2-mm thick glass plateon the top of cell
c-Si (�: n.a) 1540 EQE¼1.6% (9.1% Er, 1 mW) Henke et al.(2009)
La2Mo2O9:Yb(18%),Er(2%)
10 wt% in PMMA,at rear of cell
Bifacialpc-Si (�¼16.23%)
1 sun (AM:n.a.)
ISC: þ2.2%, �: þ2.7% (16.67%) Chen andChen (2011)
10 wt% in PMMA,at front of cell
Bifacial pc-Si(�¼16.52%)
ISC: þ1.9%, �: þ1.8% (16.81%)
La2Mo2O9:Yb(18%),Ho(2%)
10 wt% in PMMA,at front of cell
Bifacial pc-Si(�¼16.53%)
1 sun (AM:n.a.)
ISC: þ1.6%, �: þ1.5% (16.70%) Chen andChen (2011)
aZLAN:Er has composition 48ZrF4–20BaF2–20NaF–3.5LaF3–3AlF3–0.5InF3–5ErF3.
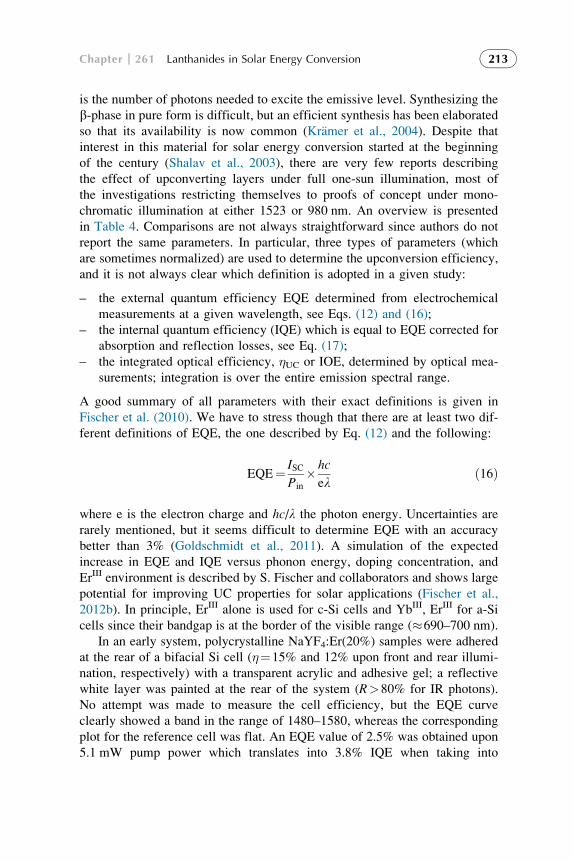
is the number of photons needed to excite the emissive level. Synthesizing the
b-phase in pure form is difficult, but an efficient synthesis has been elaborated
so that its availability is now common (Kramer et al., 2004). Despite that
interest in this material for solar energy conversion started at the beginning
of the century (Shalav et al., 2003), there are very few reports describing
the effect of upconverting layers under full one-sun illumination, most of
the investigations restricting themselves to proofs of concept under mono-
chromatic illumination at either 1523 or 980 nm. An overview is presented
in Table 4. Comparisons are not always straightforward since authors do not
report the same parameters. In particular, three types of parameters (which
are sometimes normalized) are used to determine the upconversion efficiency,
and it is not always clear which definition is adopted in a given study:
– the external quantum efficiency EQE determined from electrochemical
measurements at a given wavelength, see Eqs. (12) and (16);
– the internal quantum efficiency (IQE) which is equal to EQE corrected for
absorption and reflection losses, see Eq. (17);
– the integrated optical efficiency, �UC or IOE, determined by optical mea-
surements; integration is over the entire emission spectral range.
A good summary of all parameters with their exact definitions is given in
Fischer et al. (2010). We have to stress though that there are at least two dif-
ferent definitions of EQE, the one described by Eq. (12) and the following:
EQE¼ ISCPin
�hc
elð16Þ
where e is the electron charge and hc/l the photon energy. Uncertainties are
rarely mentioned, but it seems difficult to determine EQE with an accuracy
better than 3% (Goldschmidt et al., 2011). A simulation of the expected
increase in EQE and IQE versus phonon energy, doping concentration, and
ErIII environment is described by S. Fischer and collaborators and shows large
potential for improving UC properties for solar applications (Fischer et al.,
2012b). In principle, ErIII alone is used for c-Si cells and YbIII, ErIII for a-Si
cells since their bandgap is at the border of the visible range (�690–700 nm).
In an early system, polycrystalline NaYF4:Er(20%) samples were adhered
at the rear of a bifacial Si cell (�¼15% and 12% upon front and rear illumi-
nation, respectively) with a transparent acrylic and adhesive gel; a reflective
white layer was painted at the rear of the system (R>80% for IR photons).
No attempt was made to measure the cell efficiency, but the EQE curve
clearly showed a band in the range of 1480–1580, whereas the corresponding
plot for the reference cell was flat. An EQE value of 2.5% was obtained upon
5.1 mW pump power which translates into 3.8% IQE when taking into
Chapter 261 Lanthanides in Solar Energy Conversion 213
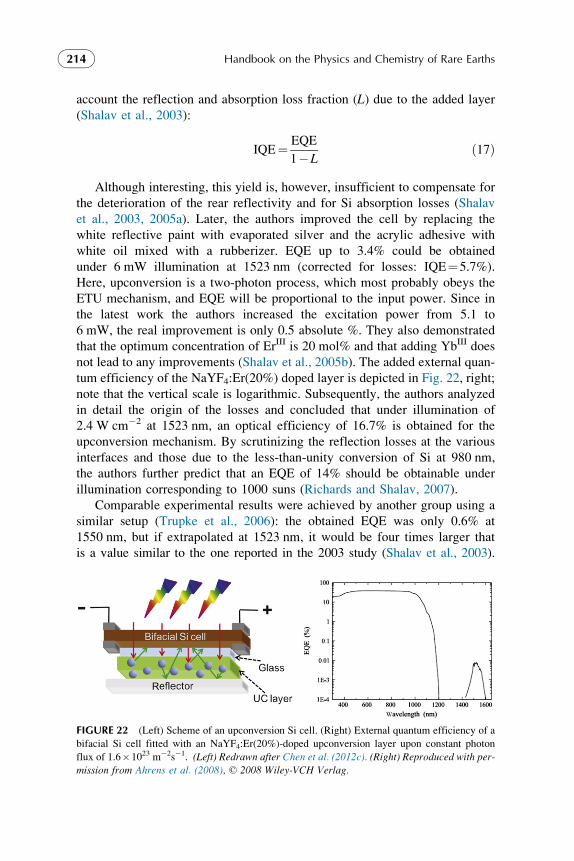
account the reflection and absorption loss fraction (L) due to the added layer
(Shalav et al., 2003):
IQE¼ EQE
1�Lð17Þ
Although interesting, this yield is, however, insufficient to compensate for
the deterioration of the rear reflectivity and for Si absorption losses (Shalav
et al., 2003, 2005a). Later, the authors improved the cell by replacing the
white reflective paint with evaporated silver and the acrylic adhesive with
white oil mixed with a rubberizer. EQE up to 3.4% could be obtained
under 6 mW illumination at 1523 nm (corrected for losses: IQE¼5.7%).
Here, upconversion is a two-photon process, which most probably obeys the
ETU mechanism, and EQE will be proportional to the input power. Since in
the latest work the authors increased the excitation power from 5.1 to
6 mW, the real improvement is only 0.5 absolute %. They also demonstrated
that the optimum concentration of ErIII is 20 mol% and that adding YbIII does
not lead to any improvements (Shalav et al., 2005b). The added external quan-
tum efficiency of the NaYF4:Er(20%) doped layer is depicted in Fig. 22, right;
note that the vertical scale is logarithmic. Subsequently, the authors analyzed
in detail the origin of the losses and concluded that under illumination of
2.4 W cm�2 at 1523 nm, an optical efficiency of 16.7% is obtained for the
upconversion mechanism. By scrutinizing the reflection losses at the various
interfaces and those due to the less-than-unity conversion of Si at 980 nm,
the authors further predict that an EQE of 14% should be obtainable under
illumination corresponding to 1000 suns (Richards and Shalav, 2007).
Comparable experimental results were achieved by another group using a
similar setup (Trupke et al., 2006): the obtained EQE was only 0.6% at
1550 nm, but if extrapolated at 1523 nm, it would be four times larger that
is a value similar to the one reported in the 2003 study (Shalav et al., 2003).
FIGURE 22 (Left) Scheme of an upconversion Si cell. (Right) External quantum efficiency of a
bifacial Si cell fitted with an NaYF4:Er(20%)-doped upconversion layer upon constant photon
flux of 1.6�1023 m�2s�1. (Left) Redrawn after Chen et al. (2012c). (Right) Reproduced with per-mission from Ahrens et al. (2008), © 2008 Wiley-VCH Verlag.
Handbook on the Physics and Chemistry of Rare Earths214
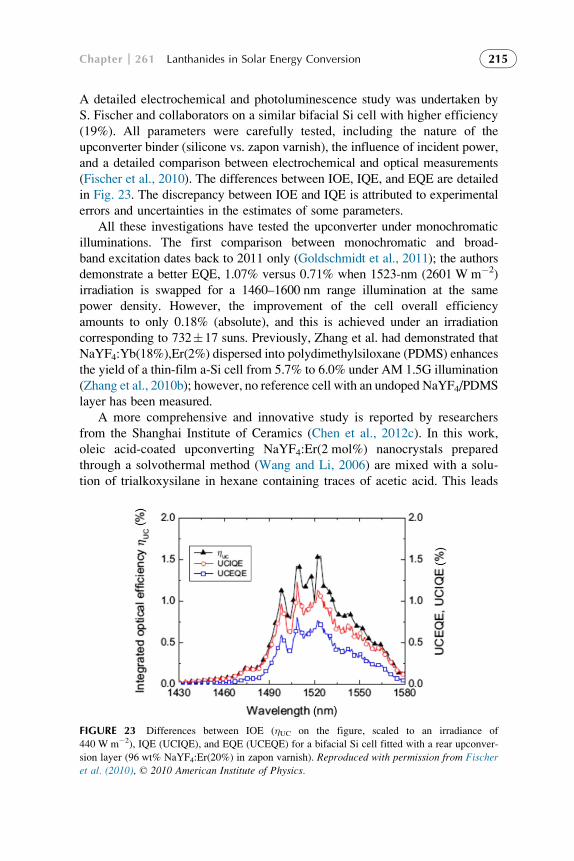
A detailed electrochemical and photoluminescence study was undertaken by
S. Fischer and collaborators on a similar bifacial Si cell with higher efficiency
(19%). All parameters were carefully tested, including the nature of the
upconverter binder (silicone vs. zapon varnish), the influence of incident power,
and a detailed comparison between electrochemical and optical measurements
(Fischer et al., 2010). The differences between IOE, IQE, and EQE are detailed
in Fig. 23. The discrepancy between IOE and IQE is attributed to experimental
errors and uncertainties in the estimates of some parameters.
All these investigations have tested the upconverter under monochromatic
illuminations. The first comparison between monochromatic and broad-
band excitation dates back to 2011 only (Goldschmidt et al., 2011); the authors
demonstrate a better EQE, 1.07% versus 0.71% when 1523-nm (2601 W m�2)irradiation is swapped for a 1460–1600 nm range illumination at the same
power density. However, the improvement of the cell overall efficiency
amounts to only 0.18% (absolute), and this is achieved under an irradiation
corresponding to 73217 suns. Previously, Zhang et al. had demonstrated that
NaYF4:Yb(18%),Er(2%) dispersed into polydimethylsiloxane (PDMS) enhances
the yield of a thin-film a-Si cell from 5.7% to 6.0% under AM 1.5G illumination
(Zhang et al., 2010b); however, no reference cell with an undoped NaYF4/PDMS
layer has been measured.
A more comprehensive and innovative study is reported by researchers
from the Shanghai Institute of Ceramics (Chen et al., 2012c). In this work,
oleic acid-coated upconverting NaYF4:Er(2 mol%) nanocrystals prepared
through a solvothermal method (Wang and Li, 2006) are mixed with a solu-
tion of trialkoxysilane in hexane containing traces of acetic acid. This leads
FIGURE 23 Differences between IOE (�UC on the figure, scaled to an irradiance of
440 W m�2), IQE (UCIQE), and EQE (UCEQE) for a bifacial Si cell fitted with a rear upconver-
sion layer (96 wt% NaYF4:Er(20%) in zapon varnish). Reproduced with permission from Fischer
et al. (2010), © 2010 American Institute of Physics.
Chapter 261 Lanthanides in Solar Energy Conversion 215

to exchanging oleic acid with silane groups, enabling fixation of the UCNPs
on a 3�3 cm2 borosilicate glass plate by spin-coating of a methanolic sus-
pension of the ligand-exchanged nanoparticles. This plate is then fitted on a
bifacial c-Si solar cell (Fig. 22, left) where the glass plate plays the role of
insulator and corresponding VOC, JSC, FF, and � data are determined for
AM0 illumination. Influence of the concentration of UCNPs in the methano-
lic suspension and of the spinning rate is described in Fig. 24 (solid squares).
Improvement in the overall cell yield increases from 1.8 to 5.2 relative % by
decreasing the UCNP concentration in the film from 3.5% to 0.75%. Further
improvement, from 5.2 up to 8.6 relative % is obtained by increasing the
spinning rate from 2000 to 3500 rev/s. The main contribution to the increase
in � arises from an increase of 5.1% in JSC, while VOC and FF are improved
by 1.7% and 1.6%, respectively. Interestingly, the authors have measured the
cell parameters when the glass plate is coated with an undoped layer of
NaYF4. The effect is detrimental, but no clear correlation is observed
between the decrease in � and both the NP concentration and spin rate. The
loss in overall yield ranges from �3.2 to �6.2 relative% (solid circles,
Fig. 23; average �51%). The scatter of data may simply reflect experimen-
tal uncertainties, since a 3% experimental error in EQE determination was
mentioned above (Goldschmidt et al., 2011). As a matter of fact, values rang-
ing from �1.4 to �5.4 relative% were obtained for sample Nr. 4. The losses
mainly arise from scattering and reflection from the added UC layer. Taking
1 2 3 4 5 6 7-10
-8
-6
-4
-2
0
2
4
6
8
10
12
3.5%
1.5%1.0%
0.75%2.5
UCNP conc. 0.75%
Spin rate 2.0
Sample number
3 3.5
% D
iffer
ence
in o
vera
ll yi
eld
FIGURE 24 Change in overall yield of bifacial c-Si cells upon AM 0 irradiation. Blue squares:
cell fitted with a glass plate coated with a film containing various amounts of NaYF4:Er(2%); spin
rate is given in 103 rev/s; initial yield of the reference cell: 7.7%. Red circles: same data for
undoped NaYF4 NPs; initial yield of the reference cell: 14.9%. Drawn from data reported in
Chen et al. (2012c).
Handbook on the Physics and Chemistry of Rare Earths216

this into account, the upconversion layer therefore increases the overall effi-
ciency of the cell by about 13 relative%, under AM0 illumination. The only
questionable aspect of this study is that the cell used for determining the
upconversion improvements has a small yield of 7.7%, while the effects of
the undoped NC layers have been determined on a cell with twice the effi-
ciency (14.9%); the authors do not comment on this in the paper, but when
questioned about this fact, they answered that the commercial cell used has
been damaged when wire electrodes were welded, which resulted in low
FFs (�0.5) and consequently low yields.
Cubic rare-earth oxides are also convenient hosts for luminescent LnIII
ions despite featuring more energetic phonons. One advantage stems from
the lattice parameter of these oxides being about twice that of silicon so that
they are able to use the silicon lattice as a template for crystalline growth and
can therefore be deposited directly on epitaxially grown silicon p–n structures.
When illuminated under laser excitation in the range of 1520–1560 nm,
upconverting layers of Ln2O3:Er (Ln¼Gd, Yb; % Er not specified, but
<10%) display a small short-circuit photocurrent density which is propor-
tional to the laser power between 0.5 and 4.5 mW (990–8940 W m�2 nm�1)and reaches 1.1 mA cm�2. The corresponding slopes are 1.8 for GdIII and
1.3 for YbIII. This proves that upconversion generates the photocurrent. On
the other hand, when these layers are fitted onto the Si cells, a decrease in
overall efficiency is observed, �4.4% for Yb2O3:Er and between �2.8%and �4% for Gd2O3:Er, depending on the absorber, n-type or p-type (Sewell
et al., 2009).
ZBLAN glasses with basic composition ZrF4–BaF2–LaF3–AlF3–NaF and
doped with ErIII reach UC efficiency up to 12.7% (Ivanova and Pelle, 2009)
and are potential candidates for UC layers. Upon irradiation at 1540 nm, they
display both NIR emission at 980 nm (two-photon process) and visible
luminescence at 550 nm and 660 nm (three-photon), in addition to weak
four-photon excited emission at 420 nm (Ahrens et al., 2008). A proof of con-
cept is provided by a glass modified with BaCl2 and containing 5% ErIII
which induces an increase in photocurrent when put onto a c-Si cell, without
special optical coupling, under laser excitation at 1540 nm (Passlick et al.,
2010; Schweizer et al., 2010). The maximum EQE obtained depends on the
doping concentration and excitation power at 1540 nm: it stands at 1.6% for
9.1% ErIII; the 980-nm upconverted emission is the strongest for all excitation
powers (1–17 mW) amounting to 90% at 1 mW and 70% at 10 mW, for
instance (Fig. 25, left). The upconverted 540-nm light is visible on the right
hand side of Fig. 25 (Henke et al., 2009).
The upconverting phosphor NaYF4:Yb(18%),Er(2%) is not convenient for
crystalline Si cells because the emitted light is in the visible (520, 540—main
emission—and 650 nm) that is in a spectral range in which the light-to-electricity
conversion efficiency of c-Si cell is not optimum. This has been verified by
Shalav et al. (2005b). Despite this handicap, La2Mo2O9:Yb(18%),Er(2%)
Chapter 261 Lanthanides in Solar Energy Conversion 217
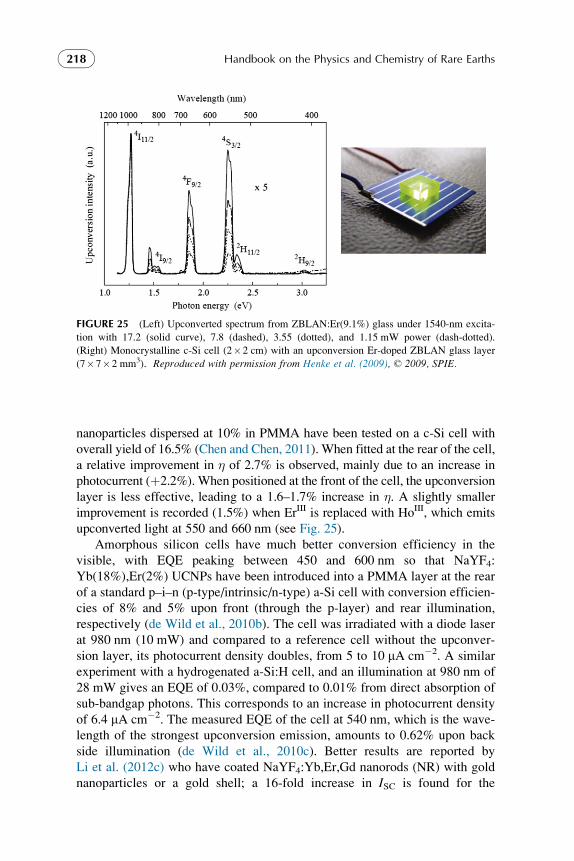
nanoparticles dispersed at 10% in PMMA have been tested on a c-Si cell with
overall yield of 16.5% (Chen and Chen, 2011). When fitted at the rear of the cell,
a relative improvement in � of 2.7% is observed, mainly due to an increase in
photocurrent (þ2.2%). When positioned at the front of the cell, the upconversion
layer is less effective, leading to a 1.6–1.7% increase in �. A slightly smaller
improvement is recorded (1.5%) when ErIII is replaced with HoIII, which emits
upconverted light at 550 and 660 nm (see Fig. 25).
Amorphous silicon cells have much better conversion efficiency in the
visible, with EQE peaking between 450 and 600 nm so that NaYF4:
Yb(18%),Er(2%) UCNPs have been introduced into a PMMA layer at the rear
of a standard p–i–n (p-type/intrinsic/n-type) a-Si cell with conversion efficien-
cies of 8% and 5% upon front (through the p-layer) and rear illumination,
respectively (de Wild et al., 2010b). The cell was irradiated with a diode laser
at 980 nm (10 mW) and compared to a reference cell without the upconver-
sion layer, its photocurrent density doubles, from 5 to 10 mA cm�2. A similar
experiment with a hydrogenated a-Si:H cell, and an illumination at 980 nm of
28 mW gives an EQE of 0.03%, compared to 0.01% from direct absorption of
sub-bandgap photons. This corresponds to an increase in photocurrent density
of 6.4 mA cm�2. The measured EQE of the cell at 540 nm, which is the wave-
length of the strongest upconversion emission, amounts to 0.62% upon back
side illumination (de Wild et al., 2010c). Better results are reported by
Li et al. (2012c) who have coated NaYF4:Yb,Er,Gd nanorods (NR) with gold
nanoparticles or a gold shell; a 16-fold increase in ISC is found for the
FIGURE 25 (Left) Upconverted spectrum from ZBLAN:Er(9.1%) glass under 1540-nm excita-
tion with 17.2 (solid curve), 7.8 (dashed), 3.55 (dotted), and 1.15 mW power (dash-dotted).
(Right) Monocrystalline c-Si cell (2�2 cm) with an upconversion Er-doped ZBLAN glass layer
(7�7�2 mm3). Reproduced with permission from Henke et al. (2009), © 2009, SPIE.
Handbook on the Physics and Chemistry of Rare Earths218

uncoated NRs which goes up to 64-fold improvement with the coated NRs,
demonstrating the effect of plasmon resonance.
3.4.2. Other Systems
As briefly mentioned above, some authors have proposed to use HoIII which
absorbs in the range of 1130–1225 nm for exciting Yb(2F5/2) by both upcon-
version with the help of the 5I6 5I8 transition and energy transfer from higher
levels (Fig. 20); an estimated EQE of 10�3 has been calculated from photo-
physical data, and a suitable model has been suggested to account for the
energy migration phenomena, but this system has not been applied to a solar
cell (Lahoz et al., 2011).
Another proposed phosphor for upconversion in a-Si cells is the IR-
detector Q42 from Lumitek®; its exact composition is not known, but it con-
tains LnIII oxysulfides in a calcium sulfide matrix. Both a UV and an IR
photons are absorbed and emission occurs at 650 nm (Mawyin et al., 2008).
3.4.3. Perspectives
As can be inferred from the above description, there are only two fully tested
systems demonstrating enhancement of light-to-electricity conversion by
upconversion in silicon solar cells. The improvement is rather small, the UC
layer adding 0.25–0.44% to cells with initial yields of 16.2–16.5% (Chen
and Chen, 2011) under AM 1.5 illumination or 0.6% to cells with starting
efficiencies of 7.7% under AM 0 illumination (Chen et al., 2012c). This is
by far much less than the theoretical models predict, namely, an increase of
the Shockley–Queisser limit up to 40% (Trupke et al., 2006). There are two
reasons for this situation: the small yield of upconversion processes and the
power dependence of the UC yield. Obvious fixes will therefore include
concentrating the sun irradiation (up to 1000 sun equivalents), or increasing
the UC yield either by clever design of the materials or by plasmonic effects.
What is also clear is that NaYF4 doped with ErIII only (and therefore absorp-
tion in the 1.5 mm region) is better than the classical NaYF4:Yb,Er upconvert-
ing material for c-Si cells, see (de Wild et al., 2010a).
3.4.4. Enhancement of the Upconversion Yield
Upconversion quantum yields in bulk microcrystalline lanthanide materials
are usually limited to 15–18% under illumination of a few W cm�2 and are
more commonly in the range of 1–5% (Fischer et al., 2012c). They are often
much smaller for some nanoparticles. In addition, the absorptivity of ErIII or
YbIII is low so that the overall luminosity remains weak. Several innovative
ways have been paved to circumvent the problem and to produce more lumi-
nescent UCNPs. Three of them are described here while metal-enhanced
upconversion and photonic crystals are dealt with in the next sections.
Chapter 261 Lanthanides in Solar Energy Conversion 219
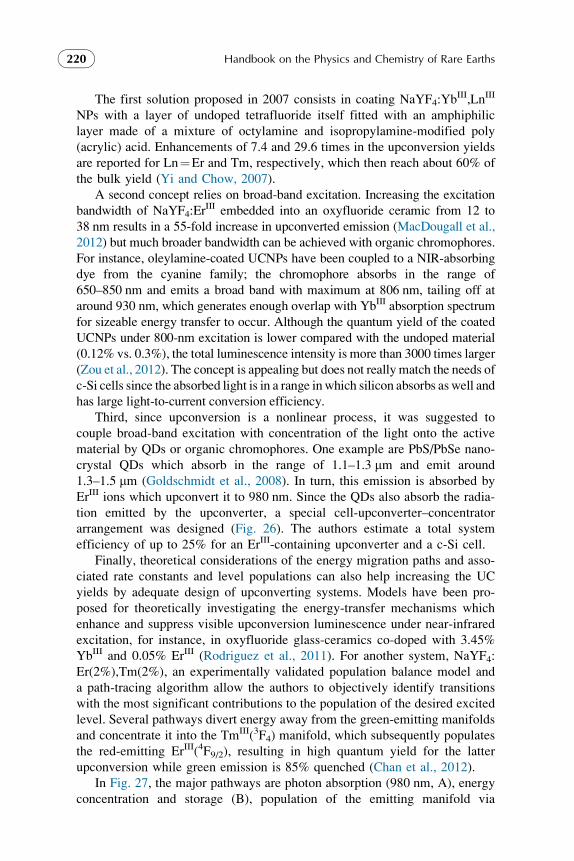
The first solution proposed in 2007 consists in coating NaYF4:YbIII,LnIII
NPs with a layer of undoped tetrafluoride itself fitted with an amphiphilic
layer made of a mixture of octylamine and isopropylamine-modified poly
(acrylic) acid. Enhancements of 7.4 and 29.6 times in the upconversion yields
are reported for Ln¼Er and Tm, respectively, which then reach about 60% of
the bulk yield (Yi and Chow, 2007).
A second concept relies on broad-band excitation. Increasing the excitation
bandwidth of NaYF4:ErIII embedded into an oxyfluoride ceramic from 12 to
38 nm results in a 55-fold increase in upconverted emission (MacDougall et al.,
2012) but much broader bandwidth can be achieved with organic chromophores.
For instance, oleylamine-coated UCNPs have been coupled to a NIR-absorbing
dye from the cyanine family; the chromophore absorbs in the range of
650–850 nm and emits a broad band with maximum at 806 nm, tailing off at
around 930 nm, which generates enough overlap with YbIII absorption spectrum
for sizeable energy transfer to occur. Although the quantum yield of the coated
UCNPs under 800-nm excitation is lower compared with the undoped material
(0.12% vs. 0.3%), the total luminescence intensity is more than 3000 times larger
(Zou et al., 2012). The concept is appealing but does not really match the needs of
c-Si cells since the absorbed light is in a range inwhich silicon absorbs as well and
has large light-to-current conversion efficiency.
Third, since upconversion is a nonlinear process, it was suggested to
couple broad-band excitation with concentration of the light onto the active
material by QDs or organic chromophores. One example are PbS/PbSe nano-
crystal QDs which absorb in the range of 1.1–1.3 mm and emit around
1.3–1.5 mm (Goldschmidt et al., 2008). In turn, this emission is absorbed by
ErIII ions which upconvert it to 980 nm. Since the QDs also absorb the radia-
tion emitted by the upconverter, a special cell-upconverter–concentrator
arrangement was designed (Fig. 26). The authors estimate a total system
efficiency of up to 25% for an ErIII-containing upconverter and a c-Si cell.
Finally, theoretical considerations of the energy migration paths and asso-
ciated rate constants and level populations can also help increasing the UC
yields by adequate design of upconverting systems. Models have been pro-
posed for theoretically investigating the energy-transfer mechanisms which
enhance and suppress visible upconversion luminescence under near-infrared
excitation, for instance, in oxyfluoride glass-ceramics co-doped with 3.45%
YbIII and 0.05% ErIII (Rodriguez et al., 2011). For another system, NaYF4:
Er(2%),Tm(2%), an experimentally validated population balance model and
a path-tracing algorithm allow the authors to objectively identify transitions
with the most significant contributions to the population of the desired excited
level. Several pathways divert energy away from the green-emitting manifolds
and concentrate it into the TmIII(3F4) manifold, which subsequently populates
the red-emitting ErIII(4F9/2), resulting in high quantum yield for the latter
upconversion while green emission is 85% quenched (Chan et al., 2012).
In Fig. 27, the major pathways are photon absorption (980 nm, A), energy
concentration and storage (B), population of the emitting manifold via
Handbook on the Physics and Chemistry of Rare Earths220

Airgap
Si cell
Fluorescent concentrator
Upconverter
Mirrors
FIGURE 26 Proposed setup for an advanced upconverter for a c-Si solar cell. Blue arrows: light
absorbed by the cell; green arrows: light absorbed by the concentrator; red arrows: light absorbed
by the upconverter. Redrawn from Goldschmidt et al. (2008).
0
5
10
15
20
Ene
rgy
(103
cm-1
)
4F7/2
3H4
3H5
3F4
3H6
3F3,2
1G4
4I9/2
4F9/2
4S9/2
2H11/2
4I11/2
4I13/2
4I15/2
A
D
G
C
6
6
98
7
42
3
98 10
10
2
E
F
B
ErIII TmIII
FIGURE 27 Energy level diagrams and major steady-state pathways (capital letters) and energy
transfers (numbers) for NaYF4:Er(2%),Tm(2%) nanocrystals; straight, plain arrows represent
photon absorption and emission, curved and dotted arrows correspond to energy-transfer pro-
cesses, and undulated arrows depict multiphonon relaxation. Redrawn from Chan et al. (2012).
See text for explanations.
Chapter 261 Lanthanides in Solar Energy Conversion 221

upconversion (C), red luminescence (660 nm, D), energy recycling via multi-
phonon relaxation (E) or via energy transfer/cross relaxation (F); finally, the
minor pathway leading to ErIII green emission at 540 nm is schematized under
(G). Emission at 1.5 mm arises essentially from the Tm(3F4!3H6) transition.
The Er(4F9/2) level is almost exclusively populated by the ETU mechanism
(C). Its rate is almost 60% of the rate of the GSA, Er(4I11/2 4I15/2), mainly
because of two reasons: (a) the oscillator strengths of the Er(4F9/2 4I11/2) and
Tm(3F4 3H6) transitions are large, representing 90% of all oscillator strengths
in their respective ions and (b) the steady-state population of the Tm(3F4) level
is high, being more than 25 times the population of any other excited level in
the ErIII/TmIII system.
3.4.5. Plasmonic Enhancement of Photophysical Properties
A way of enhancing luminescence is to bring the emitting moiety in
close contact with a metallic surface or with small colloidal silver or
gold islands/nanoparticles. The physics behind the phenomenon is rather
complex and depending on the size of the metallic colloidal particles either
luminescence quenching or enhancement can be generated (Lakowicz,
2005). Small colloids have the tendency to quench luminescence because light
absorption is dominant over scattering while larger colloids are expected to
enhance luminescence. The incident electric field from the electromagnetic
wave is modified by interacting with the metal surface, resulting in strong
coupling between the surface plasmons of the metal particles and the transi-
tion dipoles of the chromophore. The radiative lifetime is substantially
decreased and, in parallel, luminescence intensity is enhanced. In practice,
nanoparticles can be used for this purpose, for instance, Au-core/Ag-shell
nanoparticles with size >50 nm (Xie et al., 2006). Since not only metal-
enhanced luminescence is achieved but also reduction in photobleaching
(Muthu et al., 2008), the technique is starting to find applications in bios-
ciences (Bunzli, 2013), photocatalysis (Thomann et al., 2011), and photo-
voltaics (Giannini et al., 2011).
Present research in photovoltaics is focused on benefitting from the high
near fields surrounding metallic nanostructures close to their surface plasmon
resonance frequency and from light trapping in the active semiconductor layer
to boost light absorption (Atwater and Polman, 2010; Green and Pillai, 2012;
Schuller et al., 2010). Several light-trapping geometries have been proposed
for thin-film solar cells: (i) metal nanoparticles at the surface, which trap light
by scattering, (ii) metal NPs embedded into the semiconductor, which absorb
light by localized plasmons, and (iii) metal/semiconductor interface which
absorbs light by surface plasmon polaritons, and their relative properties mod-
eled and discussed (Atwater and Polman, 2010). Optimization requires adjust-
ment of the metallic nanostructure size, shape, and spacing, and this is unique
to each specific solar-cell type (Catchpole and Polman, 2008). Such an
Handbook on the Physics and Chemistry of Rare Earths222

optimization carried out for a thin-film Si cell results in enhancement in pho-
tocurrent up to 43% (Pala et al., 2009). To date, however, no plasmonic
effects have been exploited for Si cells in conjunction with upconverting
layers even if a potential system based on NdIII has been prospected (Ahrens
et al., 2008), nanometallic glass hybrid materials designed (Basudeb et al.,
2010), and several model simulations conducted (Fischer et al., 2012a,b;
Goldschmidt et al., 2012). With respect to UCNPs, plasmonic enhancements
of the UC emission by factors 3–4 are routinely obtained for ErIII (Schietinger
et al., 2010); in some cases, the improvement can reach one order of magni-
tude (Basudeb et al., 2010). Moreover, amazing 30- to 110-fold enhancements
are reported for TmIII, which lead to a lowering of the threshold pumping
power by a factor of at least 10 (Liu et al., 2011c).
3.4.6. Photonic Enhancement of Photophysical Properties
Another leverage to increase upconversion efficiency without having the
disadvantage of plasmonics, namely, the introduction of an additional deactiva-
tion path resulting from light absorption by the metal particles, is to achieve
large local fields by photonic crystals (Goldschmidt et al., 2012). Photonic crys-
tals are analogue to semiconductors if electrons are replaced with photons. They
feature a periodic nanostructure which affects the propagation of the photons
and they have a photonic bandgap. The density of states is much larger near
the bandgap which, according to Fermi’s golden rule (Dirac, 1927), increases
the transition probability. On the contrary, within the bandgap, emission is
inhibited (Yablonovitch, 1987). A photonic, grating-like, architecture which is
optimized for amplifying the local field with maximum effect at 1523 nm, a
wavelength corresponding to the ErIII absorption, is depicted in Fig. 28. It con-
sists of a material with refractive index 1.5 (typically glass or plastic) into
which a structure with larger refractive index (n¼2) is embedded. Varying
the various sizes of the structure components allows one to tune the wavelength
at which the local field is enhanced or decreased. Theoretical calculations on
this structure show that absorption is increased at 1523 nm up to a factor 3–4,
but ErIII emission at 980 and 800 nm is more enhanced, resulting in an increase
in upconversion yield by a factor of approximately 3, while emissions in the
visible are suppressed. Further optimization and practical implementation
should follow (Herter et al., 2012).
3.5. Antireflection Coatings
In order to improve light collecttion by reducing reflection, a number of oxide
nanostructures have been grown on bare c-Si cells. These structures include
subwavelength gratings, porous layers, and one-dimensional nanostructures
such as NRs, nanowires, or nanotips. One-dimensional zinc oxide nanostruc-
tures have received great attention in view of their high transparency,
Chapter 261 Lanthanides in Solar Energy Conversion 223

appropriate refractive index (n¼2 at 632 nm) and easiness to grow on almost
any kind of substrate while morphologies can be readily controlled. In this
context, ErIII-doped ZnO has been used to grow multiscaled hierachical anti-
reflective layers on a c-Si cell: c-Si/SiNx:H/ZnO/ZnO:Er where SiNx:H is the
conventional silicon nitride coating doped with hydrogen which functions as
antireflective layer and, in addition, passivates the surface of the c-Si cell
(Liu et al., 2012). The ZnO:Er material grows as nanotips, as shown in Fig. 29.
In comparison with the cell coated with SiNx:H only, the absolute conversion
yield increases from 15.6% to 17.4% (þ11.5 rel.%), mainly because of a 10%
rise in the photocurrent.
n = 1.5
n =
2
1.4 mm
1.8 mm
0.6 mm0.95 mm
Al mirror
FIGURE 28 Sketch of a 2D waveguide structure optimized for maximum field enhancement
at 1523 nm (absorption of ErIII). Redrawn after Herter et al. (2012).
FIGURE 29 SEM images of the ZnO:Er nanotips grown on a c-Si cell for different deposition
time: 60 min (left) and 90 min (right). Reproduced with permission from Liu et al. (2012),
© 2012 Elsevier B.V.
Handbook on the Physics and Chemistry of Rare Earths224

3.6. Practical Implementation of Lanthanide Materials in Si Cells
Competition between solar panel producers is severe and most of the technol-
ogy is protected by patents so that it is difficult to have a realistic
information on the practical use of rare-earth materials in Si solar cells, espe-
cially that industry people include sometimes other elements into the term
“rare earths,” such as indium, titanium, germanium, for instance. There is,
however, a number of recent patents mentioning lanthanide downshifting
and/or upconverting layers, without much precision regarding their exact
composition. Design of a-Si cells including an upconversion layer is described
for both regular (Zhang et al., 2012e,g) and tandem (Zhang et al., 2012f) cells
and the concept is extended to monocrystalline Si cells (Zhang et al., 2012d).
The upconversion layer contains up to six elements and is plated both on the
front and back surfaces of the solar cells (Zhang, 2012). Other cell fabrication
methods include both an upconversion and a downshifting layer as shown in
Fig. 30 (Cang et al., 2012). The latter authors note that the downshifting layer
can equally be deposited onto the front face of the transparent glass. A similar
design is described by Wang and Chen (2011) who use powdered molybdates
doped with YbIII and ErIII as upconversion materials and EuII/III-doped cerium
phosphates as downshifting layers.
In some instances, lanthanide oxides are incorporated into solar cells to
control properties other than luminescence. For instance, conduction between
the semiconductor layer and the electrode can be enhanced in the following
way. First, an antireflection film is formed on the surface of the semiconduc-
tor material followed by screen-printing of a conductive paste made up of
silver, glass, an organic binder, and 1.5–4.5 volume % of Ln2O3 (Ln¼La,
Nd, Dy, Sm). The paste is then burnt, which removes the antireflective layer
and brings the semiconductor substrate and the electrode into close contact
(Takei, 2011).
Photoelectric conversionElectrodes
Transparent glass
Reflective layer
Downshifting
Upconversion
FIGURE 30 Scheme of a Si solar cell fitted with both downshifting and upconversion layers
(Cang et al., 2012). A similar construction has been patented earlier by German researchers
(Wehrspohn and Schweizer, 2009).
Chapter 261 Lanthanides in Solar Energy Conversion 225

4. SOLAR CELLS WITH SEMICONDUCTORS OTHERTHAN SILICON
The cells dealt with here belong to the category of thin-film cells and are
made up of several thin layers (a few nanometer up to a few micrometer
thick) of photovoltaic materials, electrodes, antireflection, and wavelength-
converting materials. They are frequently tandem or multijunction cells. The
photovoltaic material is a combination of elements from Groups12 (Zn, Cd)
or 13 (Al, Ga, In) and 15 (P, As, Sb) or 16 (S, Se, Te) of the periodic table.
More elaborate combinations including Group 11 elements (Cu, Ag, Au) also
induce exploitable photoelectric properties in some materials such as
Cu2ZnSnS4 which is cheap and nontoxic (Suryawanshi et al., 2013). One rea-
son for substituting (or combining) a-Si with these group 12/16 (II/VI using
the old groupnumbering of the periodic system) or 13/15 (III/V) elements is
their lower bandgap and, therefore, better absorption in the NIR (Fig. 31).
Bandgaps for some materials used in solar cells are listed in Table 5, and from
these data, one can easily figure out that combining several semiconductor
materials in one multijunction device allows one to cover a larger portion of
the solar spectrum, henceforth achieving the largest yield of these cells.
The rich diversity of materials at disposition may be the reason why until now
only a few attempts have been made to introduce rare earths into these devices.
One example is a 100-mm thick vitroceramic plate doped with YbIII and ErIII
which has been coupled to a single-junction ultra-thin (3 mm) GaAs cell. The
green upconverted light belongs to a spectral range where GaAs has a good
light-to-electricity conversion (about 55%). When illuminated with a Ti-sapphire
laser emitting at 890 nm, the photoresponse increases quadratically with the input
power, a proof that upconversion is operating.Under 1-W illumination of a 0.039-
cm2 device (25.6 W cm�2, corresponding to 256 suns), a conversion efficiency of2.5% was reached, while no response from the cell is measured in the absence of
FIGURE 31 Comparison of quantum efficiencies of solar cells based on various semiconductor
materials. Reproduced with permission from Fang et al. (2011). © 2011 The ElectrochemicalSociety.
Handbook on the Physics and Chemistry of Rare Earths226

the upconverting layer (Gibart et al., 1996). In another, newer, work, layers of
Y6W2O15:Er(9 mol%),Yb(5 mol%) upconverting materials have been added to
the rear of a GaAs cell, resulting in an increase in the spectral response around
973 nm; at this wavelength, the output power grows from 0 (without UC layer)
to 0.339 mWwith a 300-mm UC layer (Lin et al., 2012).
Cadmium telluride solar cells fitted with a cadmium sulfide layer are cheap
and have reasonable conversion efficiency above 500 nm.As displayed in Fig. 12,
about 19% of solar irradiance occurs in the range of 300–500 so that it is interest-
ing to try to tap it. To this end, potassium magnesium fluoride crystal disks have
been doped with samarium. The crystals contain both SmII and SmIII and feature
broad and fairly intense 4f6-4f55d1 absorption bands from SmII in the range of
250–480 nm in addition to the weak f-f transitions fromSmIII. Divalent samarium
emits in the range of 660–720 nmwith amaximumat 695 nm,while SmIII has less
intense emission bands between 550 and 650 nm. The combined quantum yields
of SmII/III ions reach 84%.When coupled to a 2-mm thick KMgF3:Sm(0.8 mol%)
disk via a refractive-index matching liquid, a commercial CdS/CdTe solar cell
sees its short-circuit current increased by 5%, and since the open-circuit voltage
and the FF are not affected, this figure corresponds to the increase in conversion
yield. The authors calculated that the maximum increase in the latter could reach
22–23% for an optimized system and a unity quantum yield for samarium (Hong
and Kawano, 2003). The study was subsequently completed by another group
who measured all cell parameters and showed that the yield increases from
2.97% to 3.11% (þ4.7 relative%). It was also extended to a-Si and m-Si cells
for comparison: the same disk brought only 3% improvement in conversion
TABLE 5 Bandgaps Eg at 302 K and lopt (See Eq. (2)) for Selected
Semiconductor Materials Used in Solar Cells
Material Symbol
Eg(eV)
lopt(nm) Material Symbol
Eg(eV)
lopt(nm)
Silicon c-Si 1.11 1117 Cadmiumsulfide
CdS 2.42 512
Silicon a-Si 1.7 729 Cadmiumselenide
CdSe 1.73 717
Germanium Ge 0.67 1851 Cadmiumtelluride
CdTe 1.49 832
Galliumphosphide
GaP 2.26 549 Indiumphosphide
InP 1.35 919
Galliumarsenide
GaAs 1.43 867 Indiumarsenide
InAs 0.36 3444
Data from Streetman and Banerjee (2000).
Chapter 261 Lanthanides in Solar Energy Conversion 227

efficiency. Other materials such as CaxSr1�xF2:EuII,TbIII or ethylene vinyl acetate
doped with EuII, TbIII, and DyIII and coupled with the CdS/CdTe cell led to negli-
gible improvements (1–1.7%) only. This is also the case of a borate glass doped
with 1 mol% Sm2O3: a 3.2-nm layer on the top of a 300-nm layer of CdS buffer
layer results in a 0.9% increase in the short-circuit current density of theCdTe cell,
assuming a 50% quantum efficiency for the conversion of a blue into a red photon
by SmIII (Streudel et al., 2012). In this respect, organic downshifting compounds
such as rhodamine 6G doped into PVB or PMMA or coumarin 153 doped into
PVB perform much better, with relative increases in conversion yields reaching
11% and 5.6%, respectively (Kawano et al., 2009).
A light-focusing device has been designed which incorporates a concave
parabolic surface coated with various rare-earth luminescent materials, includ-
ing borides, fluorides, vanadates, silicates, chlorophosphates, or YAG doped
with trivalent lanthanide ions or pairs of ions (including MnII and PbII) and
which is proposed in connection with different cell types, including GaAs
and AlGaAs. It is claimed that the conversion yield is substantially improved,
but without quantifying the data (Zhou et al., 2011).
One of the main problems in multijunction cells resides in designing junc-
tions generating no loss. To this end, lattices have to be matched. It turns out that
the lattice spacing of rare-earth oxides, nitrides, or phosphides fairly well match
those of silicon or SiGe materials, especially that fine tuning can be achieved by
choosing the right RIII ion. For instance, the lattice of an equimolar Si/Ge mate-
rial corresponds to the one of Nd2O3. The rare-earth materials are therefore help-
ful in realizing optimum junctions, as described in Fig. 32 (Clark et al., 2010).
Finally, it seems that some lanthanide nitrides, for example, GdN (Brewer
et al., 2010) or LnB6 (Brewer et al., 2011), could replace other semiconductor
materials, but little information is disclosed until now on solar panels using
such compounds (Cheung et al., 2012).
Si
n-type
p-type
Si0.5Ge0.5
p-type
n-type
Ln2O3
Cell 1
Cell 2
FIGURE 32 Scheme of a tandem Si0.5Ge0.5/Si solar cell with a rare-earth oxide layer as transi-
tion materials. Redrawn after Clark et al. (2010).
Handbook on the Physics and Chemistry of Rare Earths228

5. DYE-SENSITIZED SOLAR CELLS
5.1. Description and Relevant Parameters
DSSCs were initially proposed in 1991 (O’Regan and Gratzel, 1991) and
are currently the subject of intense efforts to improve their relatively low
efficiency compared to Si or III–V cells. Presently, best reported efficiencies
are around 12% for single-junction cells (Heo et al., 2013; Kalyanasundaram,
2010b; Yella et al., 2011), between 15% and 16% for tandem cells (Liska
et al., 2006) and near 10% for modules (Green et al., 2012).
DSSCs have the potential for competing with traditional silicon solar cells:
they can be integrated into building facades and/or windows and outperform
p-Si cells at incident angles larger than 55�. They also have better conversion
yields under diffuse light conditions (hazy, foggy weather); Sony has demon-
strated that a 10%-rated DSSC module produces as much electricity over
1 year as a 15%-rated Si module. Furthermore, stability may be comparable
to one of the Si cells: a lifetime of 25–40 years (depending on the latitude)
can be inferred from fast aging experiments conducted during 3 years
(Harikisun and Desilvestro, 2011). It is presently estimated that DSSCs
will become quite competitive if production costs can be lowered to the
level of present production price of Si panels, 1–2 US$/W (Wikipedia
(Engl.), 2012) and if practical modules with �12% efficiency can be built.
This means that laboratory DSSCs, the parameters of which are usually deter-
mined on a <1-cm2 cell whereas modules features 10–20 cm2 areas, should
achieve 15–16% yield, a goal which is probably reachable within the next
few years.
DSSCs usually consist of multilayer cells (Fig. 33) built on a substrate
glass coated with transparent conducting oxides such as ITO or FTO (Andrade
et al., 2011). A few mm-thick mesoporous TiO2 film made of 5–25 nm-sized
e−
e−
1.0
0.5
0.0
−0.5
E vs. NHE / V
TiO2 dye
ElectrolytePt
ITOITO
S+/S
hn
I− I3−
e−
Load
e−
S*/S+
ΔVmax
CB
FIGURE 33 Scheme of a dye-sensitized solar cell. Redrawn after Kalyanasundaram (2010b)
and Gratzel (2003).
Chapter 261 Lanthanides in Solar Energy Conversion 229

TiO2 nanoparticles coated with a dye (see, e.g., Scheme 5) plays the role of
light harvester and electron donor. Typical characteristics of the dye-loaded
TiO2 electrode are a Brunauer-Emmett-Teller surface of 70–85 m2 g�1 and
a dye concentration in the range of 10�5–10�7 mol cm�2. Once the dye is
excited, electrons are injected into the CB of TiO2, a transfer which must be
fast enough to successfully compete with decay to the ground state, by either
fluorescence or nonradiative process. In fact, the large surface area, porosity,
and electric contact of mesoporous titanium dioxide are particularly favorable
for electron transfer and easy diffusion into the electrolyte.
The classical electrolyte, referred to as redox shuttle electrolyte, is the
iodide/iodine redox couple, which regenerates the dye ground state by trans-
ferring an electron (Hamann and Ondersma, 2011). The voltage attainable
by the cell corresponds to the difference between the Fermi level of TiO2
and the redox potential of the electrolyte. Regeneration of the dye ground
state unfortunately limits the attainable open-circuit potential VOC to about
0.7–0.8 V, and this turned out to be a major cause for the relatively low
efficiency of DSSCs. Hence, cobalt (III/II) polypyridine complexes have been
proposed as alternatives. These complexes have less light absorption in the
350–450 nm range than the iodide electrolyte and their redox potential can be
tuned by modifying the polypyridine ligands (reported range: 0.49–0.92 V, as
compared to 0.31 V for I3�=I�); this is of utmost importance in that the redox
N
N
CO2H
N
-O2C CO2-
But4N+ NBut4
+
Ru
NCSNCSSCN
Black dye (N749)
N
N
HO2C
CO2-
N
N
CO2-
HO2C
RuNCS
NCS
Bu4N+
Bu4N+
N719 dye
N
N
HO2C
CO2H
N
N
R
R
RuNCS
NCS
R = CO2H N3 dyeC9H21 Z907 dye
N
N
CO2H
CO2-
N
N
C101 dye
Na+
Ru
NCSNCS
S
S
S
S
HOH
OH
O
OH
H
H
H
DCA
SCHEME 5 Ruthenium-based dyes and deoxycholic acid used to prevent aggregation.
Handbook on the Physics and Chemistry of Rare Earths230

potential of the shuttle electrolyte should be matched to the ground state poten-
tial of the dye in order to regenerate it with minimum losses (Hamann, 2012).
Gratzel’s group recently came up with CoIII/CoII tris(bipyridyl)-based redox
electrolyte (coupled with a donor-p-bridge-acceptor zinc porphyrin) and
reached a record efficiency of 12.3%, with VOC�0.93 V (Yella et al., 2011).
Finally, the DSSC set-up is completed by Pt-coated ITO or FTO glass serving
as a counter electrode (Fig. 33). In order to cut down the cost of the cells, efforts
are now being made to replace the Pt electrode by poly(3,4-alkylthiophene)
cathodes (Ahmad et al., 2012).
In addition to energy considerations, optimization of a solar cell requires a
precise knowledge of the kinetic aspects of all the processes occurring in the
cell: electron injection, excited state decay, recombination, regeneration,
charge transport (Listorti et al., 2011). A recent study indicates that electron
injection for the N719 dye proceeds on a sub-10 fs time scale, while fluores-
cence has a lifetime shorter than 30 fs (Bram et al., 2012). Furthermore, elec-
tron transport must be 100-fold faster than recombination if >99% of the
photo-generated charge carriers are to be collected (Fig. 34). A difficult aspect
of this kinetics is that it is heterogeneous, with rates varying strongly depend-
ing on the particle size and on the distance between the dye and the TiO2 sur-
face; impurities may also hamper the transfer. To date, few detailed studies
are available on these aspects (Martiniani et al., 2012).
Light harvesting by the dye adsorbed on the TiO2 surface can be increased
by introducing larger TiO2 particles (a few hundred nanometers in size) in
the transparent TiO2 film of or by printing them on the top of the transparent
TiO2 film as a scattering layer (SL). Alternatively, other metal oxide particles
can be used as SL, for example, MgO, ZnO, Al2O3, or ZrO2 aggregates (Chen
and Mao, 2007), as well as various other microscopic or nanoscopic struc-
tures. The efficiency of the cell fitted with such a refractive layer can be
increased by up to 10% (15–25% increase in photocurrent). Another improve-
ment consists in co-adsorbing organic molecules such as deoxycholic acid
(DCA, see Scheme 5) to break up dye aggregates.
The overall power conversion efficiency of a DSSC (written � in this sec-
tion) is defined by Eq. (11), Section 2.3, with Pout¼Vmax�Jmax being the
maximum output power; the FF is given by Eq. (18), identical to the left part
of Eq. (13), Section 3.1:
10−13 10−11 10−9 10−7 10−5 10−3 10−1
ps μsns ms10−15
fs
FIGURE 34 Time scale for DSSC kinetics.
Chapter 261 Lanthanides in Solar Energy Conversion 231

FF¼Vmax� Jmax
VOC� JSCð18Þ
where Vmax (V) and Jmax (mA cm�2) are the voltage and current density at the
point of the maximum power output in J–V curves; VOC (V) is the open-circuit
voltage, and JSC is the short-circuit current density (usually given in
mA cm�2). Another parameter of interest is the incident photon-to-current
conversion efficiency (IPCE/%) defined as:
IPCE¼ JSCPin
�1240
l�100 ð19Þ
where l is the wavelength of the incident light in nm and 1240 is the same
unit conversion factor as in Eq. (2).
Four parameters determine the value of IPCE, the light-harvesting effi-
ciency (LHE), the quantum yield of electron injection from the excited dye
into the TiO2 CB (finj), the efficiency for dye regeneration (�reg), and the col-
lection efficiency of the photo-generated charge carriers (�coll) itself deter-
mined by the time constants for transport (ttrans) and recombination (trec) ofthe electrons injected into the CB (Yella et al., 2011):
IPCE¼LHE�Finj��reg��coll ð20Þ
�coll¼1
1þ ttranstrec
¼ trectrecþ ttrans
ð21Þ
Much as for solar luminescent converters and silicon solar cells, lanthanides
may play a role in improving the overall yield of DSSCs. Until now, however,
few papers present quantitative and reliable data on the subject despite several
review, feature, or perspective articles pointing to their potential in this respect
(Abdel-Mottaleb, 2009; Bunzli and Eliseeva, 2010; Cates et al., 2012; Eliseeva
and Bunzli, 2011; van Sark et al., 2010; Wang et al., 2011a,b). Lanthanides
have been doped as ions, nanoparticles, or complexes into the TiO2 mesoporous
electrode, or provided in refractive layers or as additional, either down- or
upconverting, layers in the devices. Moreover, YIII and LaIII have been shown
to improve solar cell efficiency by simple treatment of the TiO2 photoanode.
Available quantitative data are gathered in Tables 6–8 in which we give
improvements of short-circuit current, open voltage, FFs, and efficiency with
respect to an adequate reference cell, whenever available. It is worth mention-
ing that in most papers, a reference and/or blank is either not appropriate or
inexistent. A correct way of proceeding would be to compare the performances
of the cell doped with luminescent lanthanide material with a cell doped at the
same concentration with a similar but nonluminescent rare-earth compound
(e.g., LaIII, GdIII, LuIII, or YIII) since adsorption of this material affects dye
loading and aggregation; moreover, if dissociation occurs, LnIII ions, which
are p-dopants, may also modify the semiconductor bandgap.
Handbook on the Physics and Chemistry of Rare Earths232

TABLE 6 Rare-Earth Materials as SL and Anode Modifiers in Dye-Sensitized Solar Cells; Effects Are Given for Conditions Leading to the
Best Quantum Efficiency
Nr Rare-earth materials
Form under
which provided TiCl4a Dye
Cell area
(cm2)
DISC or
DJSC (%) DVOC (%) DFF (%) D� (%) � (%) References
Scattering layer
1 Cubic CeO2 400 nm nanoparticlesas scattering back layer
No N719 0.15 19 0.7 �1.5 18 8.6 Yu et al.(2012c)
2 YAG:Ce Scattering/downshiftinglayer on the top of TiO2
electrode
n.a. N719 n.a. 15 None �1.5 13.5 7.9 Zhu et al.(2012)
Chemical modification of titanium oxide
3 YIII [YCl3(H2O)n] 1 mol% in TiO2 electrode No C101 0.16 17 2.5 2.5 22 9.0 Chandiranet al. (2011)
4 LaIII ([La(NO3)3(H2O)n]) 1 mol% in TiO2 electrode Yes N719 0.40 12 None 1 30 6.7 Zhang et al.(2010a)
5 LaIII [La(ac)3(H2O)n]b Posttreatment of TiO2
electrode with 1 mol%La(ac)3 at pH 1 (HCl)
No N719 1.03 23 �1 1.5 25 7.0 Yahav et al.(2011)
6 La2O3 8-mm layer dip-coatedonto 12-mm layer of TiO2
No N719 1.0 49 3 7 41 9.7 Yu et al.(2012b)
7 CeIII/IV
[Ce(NO3)3(H2O)6]0.1%in TiO2 electrode No N719 n.a. 12 �2 1 11 7.1 Zhang et al.
(2012a)
8 CeIII/IV
[Ce(NO3)3(H2O)6]0.1% in TiO2 electrode Yes N719 n.a. 8 �1 0 6 7.7 Zhang et al.
(2012a)
Continued

TABLE 6 Rare-Earth Materials as SL and Anode Modifiers in Dye-Sensitized Solar Cells; Effects Are Given for Conditions Leading to the
Best Quantum Efficiency—Cont’d
Nr Rare-earth materials
Form under
which provided TiCl4a Dye
Cell area
(cm2)
DISC or
DJSC (%) DVOC (%) DFF (%) D� (%) � (%) References
9 NdIII TiO2:Nd(5mol%)nanorods
2% TiO2:Nd nanorods inTiO2 electrode
Yesc N719 0.2 22 �1 10 33 4.4 Yao et al.(2006)
10 EuIII TiO2:Eu(3 mol%) Additional layer on TiO2 Yes BD 0.16 24 8 �3 38 3.4 Huang et al.(2010)
11 GdIII [Gd(NO3)3(H2O)6] TiO2 dipped into 0.2 MGd salt
Yes N3 1.5 36d 3d 54d 35d 0.7d Zalas et al.(2011)
12 YbIII YbCl3 in anh.ethanol
3 mol% doped into TiO2 No N719 0.16 7 �27 10 �28 4.4 Xu et al.(2006)
13 Er2O3 0.1 g Er2O3 in TiO2
electrodeYes C101 0.05 27 n.a. n.a. 25 6.1 Li and Gu
(2012)
14 RIII (R¼Sc, Y, La-Lu,except Tm)
Additional layer ofTiO2:R (0.05 wt%)
Yes N3 0.13 14e 2e 12e 31e 8.9e Zalas andKlein(2012)
Data are rounded to corresponding number of significant digits. Refer to Scheme 5 for chemical formulae of the dyes. Unless otherwise stated, data are for illumination corresponding to1 sun (AM1.5G, 100 mW cm�2).aPosttreatment with TiCl4.bData with respect to TiO2 without LaIII and without TiCl4 treatment.cWith Ti tetraisopropoxide.dTungsten-halogen lamp, 400 W m�2.eData for CeIII, see text for other RIII ions.

TABLE 7 Rare-Earth Complexes as Dyes or Downshifting Materials for Dye-Sensitized Solar Cells; Effects Are Given for Conditions
Leading to the Best Quantum Efficiency
Nr
Rare-earth
materials
Form under
which provided Illum.a Dye
Cell area
(cm2)
DISC or
DJSC (%) DVOC (%) DFF (%) D� (%) � (%) References
Inorganic downshifting materials
1 SmIII 5% doped intocolloidal TiO2
electrode
1 sun N719 0.2 31 1 5 37 5.8 Hafez et al.(2011)
2 EuIII 5% doped intocolloidal TiO2
electrode
1 sun N719 0.2 15.5 �4 8 22 5.2 Hafez et al.(2011)
3 LaVO4:Dy(2 mol%)
luminescent UV-absorbing 300-nmthick coating of TiO2
electrode
84 mW cm�2 N3 0.2 �18 1 17 �5 3.7 Liu et al.(2006)
4 Y2O3:Eu(5 wt%) Doped into TiO2
electrode (3 wt%)1 sun N719 n.a. 1.7 10 1.3 14 6.5 Wu et al.
(2010)
5 Y2O3:Eu(5 mol%),Gd(2 mol%)
Doped into TiO2
electrode (4 wt%)1 sun N719 n.a. 3 8 6 19 6.4 Xie et al.
(2012a)
6 TiO2:Eu(0.07 mol%) nanorods b
Additional 4-mmthick layer onthe top of TiO2
N719 n.a. 7 �3 14 13 8.0 Hafez et al.(2010)
Continued
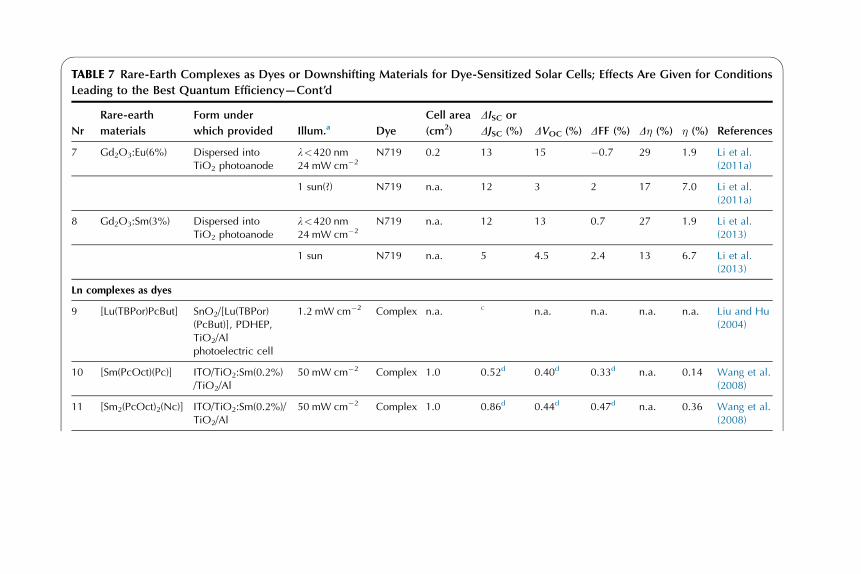
TABLE 7 Rare-Earth Complexes as Dyes or Downshifting Materials for Dye-Sensitized Solar Cells; Effects Are Given for Conditions
Leading to the Best Quantum Efficiency—Cont’d
Nr
Rare-earth
materials
Form under
which provided Illum.a Dye
Cell area
(cm2)
DISC or
DJSC (%) DVOC (%) DFF (%) D� (%) � (%) References
7 Gd2O3:Eu(6%) Dispersed intoTiO2 photoanode
l<420 nm24 mW cm�2
N719 0.2 13 15 �0.7 29 1.9 Li et al.(2011a)
1 sun(?) N719 n.a. 12 3 2 17 7.0 Li et al.(2011a)
8 Gd2O3:Sm(3%) Dispersed intoTiO2 photoanode
l<420 nm24 mW cm�2
N719 n.a. 12 13 0.7 27 1.9 Li et al.(2013)
1 sun N719 n.a. 5 4.5 2.4 13 6.7 Li et al.(2013)
Ln complexes as dyes
9 [Lu(TBPor)PcBut] SnO2/[Lu(TBPor)(PcBut)], PDHEP,TiO2/Alphotoelectric cell
1.2 mW cm�2 Complex n.a. c n.a. n.a. n.a. n.a. Liu and Hu(2004)
10 [Sm(PcOct)(Pc)] ITO/TiO2:Sm(0.2%)/TiO2/Al
50 mW cm�2 Complex 1.0 0.52d 0.40d 0.33d n.a. 0.14 Wang et al.(2008)
11 [Sm2(PcOct)2(Nc)] ITO/TiO2:Sm(0.2%)/TiO2/Al
50 mW cm�2 Complex 1.0 0.86d 0.44d 0.47d n.a. 0.36 Wang et al.(2008)

12 [Eu(DB8QB)3]n TiO2 soaked into0.5 mM complexsolution in DMF
1 sun Complex 0.2 4.8d 0.63d 0.75d n.a. 2.3c Xiao et al.(2010)
13 [Eu(B8QDF)3]n TiO2 soaked into0.5 mM complexsolution in DMF
1 sun Complex 0.2 6.3d 0.64d 0.75d n.a. 3.0c Xiao et al.(2010)
14 [Eu(C4)3(BD2)] Doped into TiO2
electrode1 sun Complex n.a. 0.41d 0.49d 0.77d n.a. 0.15 Oh et al.
(2011)
Ln complexes as downshifting materials
15 [Eu(C4)3(BPBA)] Doped with dyeinto TiO2 electrode
1 sun BD n.a. 14 4 3 22 9.3 Oh et al.(2011)
16 [Tb(HDPA)3]�4EtOH c
Cosensitizer 1:1ratio with N719
1 sun N719 n.a. 47 1 1 44 4.1 Wang et al.(2012e)
17 [Dy(HDPA)3]�4EtOH
Cosensitizer 1:1ratio with N719
1 sun N719 n.a. 66 8 5 72 4.9 Wang et al.(2012e)
Data are rounded to the corresponding number of significant digits. Refer to Scheme 5 (dyes) and Scheme 7 (complexes) for chemical formulaea1 sun¼AM1.5G (100 mW cm�2).bData with respect to a bilayer solar cell (TiO2 nanorods/TiO2 nanoparticles) without EuIII.cJSC¼0.69 mA cm�2.dAbsolute values.

TABLE 8 Rare-Earth Upconversion Materials for Dye-Sensitized Solar Cells; Effects Are Given for Conditions Leading
to the Best Quantum Efficiency
Nr
Rare-earth
materials
Form under
which provided Illum. a Dye
Cell area
(cm2)
DISC or
DJSC (%) DVOC (%) DFF (%) D� (%) � (%) References
1 TiO2 doped withErIII(8.5%),YbIII(8.5%)b
Scattering layer 1 sun N719 0.25 3 None None 3 9.0 Han et al.(2009)
2 LaF3:Er(2.5%),Yb(9%)
Doped TiO2 UClayer
AM1.0G
N719 n.a. 2 None �3 �1 2.7 Shan andDemopoulos(2010)
3 b-NaYF4:Er,Yb Externalbifunctional layerat back of cell
1 sun N719 0.16 9 c 1 �3 6c 7.4 Shan et al.(2011)
4 Colloidal TiO2
doped with2-layer anode d N719 1.0 136 40 13 265 0.15 Xie et al.
(2011)
ErIII, YbIII TiO2/doped TiO2
1/31 sun N719 1.0 0.3 4 8.5 14c 7.3
5 Colloidal TiO2
doped with 7 wt% YOF:Er,Yb
2-layer anode TiO2:doped TiO2 1:3
1 sun N719 n.a. 6.5 6 9.5 24 7.2 Wang et al.(2012d)
6 b-NaYF4:Er,Yb/graphene composite
Mixed withcolloidal TiO2
1 sun N719 n.a. 3 2 0 4.4 2.8 Li et al.(2012b)
7 b-NaYF4:Er(2 %),Yb(20%)
Core–shell NaYF4:Er,Yb/TiO2 NPs
1 sun N719 n..a. 8 �2 18 23 4.3 Zhang et al.(2013)
8 b-NaYF4:Er,Yb Doped into TiO2 1 sun Z907 n.a. 10 n.a. n.a. 3.7 2.8 Yuan et al.(2012)

9 b-NaYF4:Er,Yb/NaYF4
Co-doped with dyeinto ZnO electrode
1 sun BD n.a. �5.5 29 n.a. 12 1.8 Khan et al.(2011)
10 YF3:Er(2%),Yb(18%) 7 wt% into TiO2 1 sun N719 n.a. 17 10 8 35 7.9 Wu et al.(2012b)
11 Y2O3:Er(10%)nanorods
5 wt% in TiO2
electrode
e N719 n.a. 50 28 19 205 0.17 Wang et al.(2012c)
1 sun N719 n.a. 10 5 2 20 7.0
12 Lu2O3:Tm(0.4%),Yb(2%)
4 wt% into TiO2d N719 n.a. 38 15 3 63 0.2 Li et al.
(2011b)
1 sun N719 n.a. 9 2 0.6 10c 6.6
13 TmIII,YbIII (10/1) Ln2O3 3.3 wt%/TiO2
1 sun N719 n.a. 0.8 2 7 10 7.1 Xie et al.(2012b)
Data are rounded to significant digits. Refer to Scheme 5 for chemical formulae of the dyes. Unless otherwise stated, given percentages correspond to mol%.a1 sun¼AM1.5G (100 mW cm�2).bSee text.cw.r.t. solar cell having a pure TiO2 SL.dl>720 nm, 60 mW cm�2.el>900 nm, 33 mW cm�2.

5.2. Scattering Layer (Table 6)
The small size of TiO2 nanoparticles provided as photoanode results in poor
light-scattering properties, and a nonnegligible fraction of photons passes
through the cell without being absorbed. One remedy consists in introducing
a SL made up of TiO2 mesoporous microspheres or Anatase nanoplatelets
(Zhang et al., 2012c); with three 4-mm thick layers, the latter provided a
24% efficiency improvement for a cell based on N719, however, with an effi-
ciency of only 6.5% (Shao et al., 2011). Cerium(IV) oxide is a well-known
material with high refractive index, used in multilayer optical coatings.
Hydrothermally prepared 400 nm sized NPs of cerium oxide have been intro-
duced as a mirror-like scattering back layer with 1.5-mm thickness in a DSSC
based on dye N719. Both one and two layers have been tested, and although
the two-layer arrangement features a reflectance around 75%, the one-layer
fitted cell displays the largest efficiency: 8.6% versus 7.3% for the reference
uncoated cell; this is because the two CeO2 layers reduce considerably the
ability of the dye to diffuse into the TiO2 electrode (Yu et al., 2012c). Simi-
larly, a SL of 200–300 nm nanoparticles of Y3Al5O12:Ce (% not given) on
the top of the TiO2 electrode leads to a 13.5% improvement in the overall effi-
ciency of the N719 cell (Zhu et al., 2012). However, in this case, the authors
also invoke the fact that CeO2 is emissive, as shown in Fig. 35 so that both
light reflection and wavelength downshifting contribute to the improvement.
The IPCE curve is not shown to prove this hypothesis, but close examination
of this curve in the preceding example (Yu et al., 2012c) demonstrates that the
quantum efficiency at 550 nm is more enhanced than, for instance, at 500 nm,
which substantiates the “bimodal” explanation in both cases.
FIGURE 35 Excitation and emission spectra of Y3Al5O12:Ce. Reproduced with permission fromZhu et al. (2012); © Royal Society of Chemistry 2012.
Handbook on the Physics and Chemistry of Rare Earths240

5.3. Titanium Oxide Modification (Table 6)
One of the major problems in DSSCs is charge recombination at the TiO2/
redox electrolyte interface. Electronic states below the CB of TiO2 behave
as efficient recombination centers on the nanoparticle surfaces thus slowing
electron transport. To reduce these effects, a surface treatment generating sev-
eral benefits is applied during which TiO2 nanoparticles are coated with a thin
layer of a wide bandgap semiconductor. First, the number of surface traps
decreases. Second, an energy barrier is created which limits electron transfer
and subsequent recombination into the electrolyte. Third, the TiO2 CB is
shifted downward with respect to the redox potential of the electrolyte, which
favors electron transfer into the CB. Fourth, light scattering is also improved
and, finally, the surface pH can be modified, and therefore, dye loading can be
potentially increased. Typical coatings are metal oxides, carbonates, or tita-
nates such as Al2O3, ZrO2, MgO, CaCO3, or MTiO3 (M¼Mg, Sr, Ba). Alter-
natively, another technique allows low-temperature (<150 �C) fabrication of
the solar cells by electrodeposition of amorphous TiO2 onto the nanoparticles.
The best precursor for this posttreatment is TiCl4: while the open-circuit volt-
age and FFs are hardly affected, the short-circuit current and therefore the cell
efficiency goes up by about 20–28% (Sommeling et al., 2006; Zhao et al.,
2011). A careful study of photoanodes with and without TiCl4 posttreatment
reveals that particle size increases by about 20%, which results in a 7.6%
increase in dye adsorption; however, light absorption increases only margin-
ally so that the increase in photocurrent is mainly due to increases in IPCE
and in charge injection consecutive to a 100-mV lowering of the TiO2 CB
(Sommeling et al., 2006). TiCl4 posttreatment is used by several authors
and improvements in cell efficiencies of 15–25% are regularly reported.
Further improvement comes from simultaneous TiCl4 treatment and
doping of the TiO2 electrode with metal ions. In one example, TiCl4 treatment
applied to an undoped TiO2 electrode results in cell efficiency going up from
7.4% to 8.4% (þ13.5%). Subsequent introduction of 0.5 mol% of aliovalent
NbV into TiO2 leads to a further improvement of the cell efficiency from
8.1% without TiCl4 posttreatment to 8.7% with TiCl4 treatment (þ7.5%).
The enhancement is attributed to better charge collection and electrode trans-
parency (Chandiran et al., 2010). A similar enhancement is obtained with
SnIV: when 11-mm-thick TiO2 films are doped with 0.5 mol% SnO2, the effi-
ciency of a cell based on the N3 dye increases by 11.5%, from 7.45% to 8.3%,
a consequence of both a negative shift of TiO2 VB and a faster electron trans-
port (Duan et al., 2012).
Trivalent GaIII and YIII ions have also been tested, with 0.2–2.0 mol%
doping concentration range; they generate p-type doping in the electrode and
the best results were obtained with 1 mol% concentration of the exogenous cat-
ion. The first ion increases the yield from 7.4% to 8.1% mainly because of an
increase in the voltage and FF, while the photocurrent is slightly decreased.
Chapter 261 Lanthanides in Solar Energy Conversion 241

On the other hand, yttrium performs much better, boosting the photocurrent by
as much as þ17% and the overall cell yield by þ22%, to an absolute 9.0%
(Table 6, entry 3). These data are obtained without TiCl4 treatment, and the
improvement is traced back to an increase in electron lifetime in the doped
photoanode affording close to unity charge collection efficiency. When TiCl4treatment is further applied to the doped photoanodes, no clear improvement
in their characteristics is recorded so that according to the authors, doping of
YIII can replace the somewhat cumbersome TiCl4 posttreatment (Chandiran
et al., 2011), which results in a �15–25% increase in �, see above. An earlier
report reached a different conclusion (Zhang et al., 2010a). In this work, 1 mol%
LaIII is doped into the TiO2 nanoparticles, followed by TiCl4 treatment
(Table 6, entry 4). With respect to the undoped, but similarly TiCl4-treated
electrode, the amount of oxygen vacancies on the LaIII-doped TiO2 surface
increases, which leads to larger dye concentration and to a 13.5% larger cell
efficiency. Here, dye N719 was used, whereas the work on YIII was per-
formed with the larger C101 dye (Chandiran et al., 2011) (Scheme 5), which
may partly explain the different conclusions. We also note that YIII has a
more pronounced Lewis acidity character than LaIII. As a matter of fact, AlIII
is also reported to have beneficial effect on DSSCs efficiency (Ko et al.,
2005) and an increase in efficiency from 10.42% to 10.75% (i.e., þ3%) is
documented for a cell based on the black dye (BD) when the electrode is
treated by 0.01 M of Al(OiPr)3. Magnesium iso-propyloxide has the same
effect, but a much larger concentration of 0.15 M has to be used (Ozawa
et al., 2012).
Less clear-cut conclusion is drawn in the report by Yahav et al. (Yahav
et al., 2011). Here, the methodology differs in that the TiO2 electrode is first
treated with a lanthanum acetate solution (Table 6, entry 5). If the treatment is
performed at neutral pH, the voltage increases, but this advantage is annihi-
lated by a large decrease in photocurrent (��30%) so that the cell yield
drops. On the other hand, acidic treatment at pH 1 is largely beneficial to
the photocurrent, while the other parameters remain more or less constant
and a þ25% increase in � is achieved. A full set of comparative data is unfor-
tunately not given for a dual treatment with TiCl4 and La(ac)3, but in this
case, the photocurrent increases somewhat while the open-circuit voltage
decreases. The increase in ISC appears to be independent of the LaIII concen-
tration in the range of 0.01–0.4 mol%.
An amazing yield increase is generated when a thin layer of lanthanum
sesquioxide is deposited onto a 12-mm thick TiO2 film by dip-coating a solu-
tion of La(NO3)36H2O in isopropanol, followed by heat treatment at 450 �Cfor ½ h (Table 6, entry 6). The coating results in a decrease in the electron
transfer resistance, which reaches a minimum for an 8mm-thick layer.
Remarkably, the concentration of the adsorbed N719 dye is little affected
by the introduction of the La2O3 layer (3–6%, that is at the limit of experi-
mental errors). On the other hand, the 8mm-thick layer generates a huge
Handbook on the Physics and Chemistry of Rare Earths242

increase in JSC of 49% and a 41% improvement in the overall conversion
yield, from 6.8% to 9.7%. No TiCl4 posttreatment was used in this study
(Yu et al., 2012b).
Cerium is an interesting element in view of its CeIII/IV redox properties
exploited in catalysis and photocatalysis. When doped into TiO2, CeO2
induces the formation of an impurity band composed of CeIII/IV(4f) and
oxygen defect states which leads to a tailing of the CB. The resulting
bandgap narrowing extends the photo-activity of TiO2 into the visible (Chen
et al., 2010). Therefore, Anatase photoanodes for DSSCs have been doped
(0.05–0.9 mol%) with CeIII/IV by mixing cerium(III) nitrate hexahydrate with
titanium isopropoxide and then proceeding with the usual fabrication of the
nanoparticles (Table 6, entries 7 and 8). A doping concentration of 0.1%
seems to be optimum in that it increases dye absorption from 1.39 to
1.43�10�7 mol cm�2 while reducing the average particle size from 13.1
to 12.3 nm; increasing the doping concentration further has the tendency to
decrease dye absorption (1.31�10�7 mol cm�2 for Ce:Ti¼0.9%). In addition,
there is a clear, although small, red shift of the absorption edge of TiO2 trans-
lating into a reduction in the band gap from 3.23 to 3.15 eV. Solar cells with
N719 dye were fabricated with an 8 mm nanocrystalline layer of the electrode
fitted with a 4-mm SL (400 nm particle size). Some cells were subsequently
treated with TiCl4 before dye adsorption and others not in order to decipher
the effect of this treatment. Several doping concentrations (0.1–0.9%) were also
tested. In the end, the 0.1% doping concentration again gives the best results.
The initial TiCl4-untreated and undoped cell has a conversion yield of 6.4%
which increases to 7.2% upon TiCl4 treatment (þ12%). Doping cerium leads
to an increased yield reaching 7.1% for the untreated cell and of 7.65% for
the TiCl4-treated one. Therefore, the little amount of cerium introduced
(0.1 mol%) results in an improvement of 6–11%, which entirely comes from
a larger photocurrent, the open-circuit voltage having the tendency to slightly
decrease while the FF remains almost constant (Zhang et al., 2012a). The
authors conclude that the optimized performance of the cell arises from
improved electron injection from the dye; we note, however, that part of it
might simply be due to the larger dye concentration (þ3%). This study also
shows the cumulative effects of the TiCl4 and LnIII treatments.
Several other studies report modifications of TiO2 films with other LnIII ions
leading to various results. For instance, Nd-doped TiO2 NRs (20�2 nm2)
incorporated into a conventional TiO2 anode boost the conversion yield by
33%, but the solar cell has very low final � of 4.4% only (Table 6, entry 9)
(Yao et al., 2006). Similarly, a TiO2:Eu (3 mol%)/TiO2 double layer electrode
increases the conversion yield by 56%, from 2.2% to 3.4% (Table 6, entry
10), and this is attributed to an increase in CB from 3.29 eV for the undoped
TiO2 to 3.34 eV in the doped one, reducing charge recombination (Huang
et al., 2010). A comparable effect is induced by GdIII doped into the TiO2 elec-
trode (% not specified) of a BD-based solar cell with a very low efficiency of
Chapter 261 Lanthanides in Solar Energy Conversion 243

0.7% (Table 6, entry 11) (Zalas et al., 2011). Another investigation with a
C101-based cell shows a TiO2:Er2O3(0.1g) electrode, increasing the conversion
efficiency by 25% (Table 6, entry 13) (Li and Gu, 2012). Finally, and surpris-
ingly, YbIII was found to have a dramatic detrimental effect on JSC (down to
�53%) and � (down to �48%) when doped (0.06–6 mol%) into TiO2 (Table 6,
entry 12) (Xu et al., 2006).
A systematic and reliable study is now available in which all of the rare-earth
ions have been tested as modifiers of the TiO2 photoelectrode together with TiCl4treatment (Table 6, entry 14). In the reported protocol, the TiO2 electrodes are
dipped during ½ h into an aqueous solution of TiCl4 containing 0.2 M Ln(NO3)3,
followed by sintering at 723 K during ½ h and subsequent immersion during 24 h
into a 10�4 M solution of N3 dye.What is remarkable from the scientific point of
view is that five cells have been fabricated for each tested RIII ion and that pho-
toelectric measurements were repeated five times for each cell so that reported
data are averages of 25 determinations (Zalas and Klein, 2012). The added coat-
ing contains about 0.05% of RIII ions, and their introduction in the modifying
layer causes changes in several physicochemical properties of the materials as
shown in Figs. 36 and 37. The R-containing layer acts as an energy barrier
and/or as light SL and influences electron transport and dye adsorption ability.
There is seemingly no systematic trend along the rare-earth series and only half
Ti
ScY
La
Ce
Pr
NdSm
Eu
GdTb
DyHo
Er
Tm
Yb
LuTi
Sc
YLa
Ce
PrNd
Sm
Eu
Gd
Tb
Dy
Ho
Er
Tm
Yb
Lu
Ti
Sc
Y
La
CePr
Nd
Sm
Eu
Gd
Tb
Dy
Ho
ErTm
Yb
Lu
Ti
Sc
Y
La
Ce
Pr
Nd
SmEuGd
Tb
Dy
Ho
Er
Tm
Yb
Lu
3.1
3.2
3.3
Eg (eV)
100
150
200
250Rt (Ω)
5
6
7
8
9
10Ndye (10−8 mol/cm2)
5
6
7
8
9η %)(
FIGURE 36 Clockwise from the top left: bandgap, total resistance, dye concentration, and
conversion yields of DSSCs cells based on N3 dye and fitted with a coating layer TiO2:R
(0.05 wt%); data labeled Ti refer to an undoped photoanode. Drawn from data reported in Zalasand Klein (2012).
Handbook on the Physics and Chemistry of Rare Earths244

of the ions have beneficial influence, La, Ce, Nd, Tb, Ho, Er, Yb, and Lu, with
cerium and ytterbium (two ions having redox properties!), leading to the largest
increase in photoconversion, 31% and 30%, respectively, the latter in complete
contradiction with the previously cited work (Xu et al., 2006). It is noteworthy
though that the photocurrent is larger for all doped photoanodes, except in the
cases of YIII (no improvement) and GdIII (4% decrease).
What can be learned from these investigations is that results obtained by
either adding a rare-earth containing coating or doping rare-earth ions into
TiO2 leads to contradictory results depending on the exact experimental pro-
cedure used. However, looking at the data reported in Table 6 for cells with
yield above 7%, one realizes that (i) lanthanum leads to the best enhance-
ments, 25% and 41% (entries 5 and 6), (ii) cerium is constantly beneficial
(from þ6% to þ31%, entries 1, 2, 7, 8, and 14), (iii) yttrium may (entry 3,
þ22%) or may not (entry 14, �25%) be useful, and (iv) simultaneous or
subsequent TiCl4 treatment brings further benefits (compare entries 7 and
8). Completely opposite conclusions are reached for ZnO-based DSSCs (with
N719 dye): LaIII, CeIII, NdIII doping of ZnO decreases the yield (�11%,
�94%, and �5%, respectively), while SmIII and GdIII increase it (11% and
45%, respectively). Since all photoconversion yields are smaller than 2%
(Lu et al., 2011), these data are not discussed in details.
5.4. Inorganic Downshifting Materials (Table 7)
Downshifting technologies tested in DSSCs can be classified into three cate-
gories. The first is simple doping of luminescent LnIII ions into TiO2 nanopar-
ticles, similar to the work described at the beginning of this section with
6
4
8
18
16
20
η (%
)J S
C (m
A c
m−2
)
Ti Sc Y La Ce Pr Nd Sm Eu Gd Tb Dy Ho Er Tm Yb Lu
FIGURE 37 Photocurrent densities (top) and photoconversion yields (bottom) of N3-based solar
cells fitted with a coating layer TiO2:R (0.05 wt%); data labeled Ti refer to an undoped photoa-
node. Drawn from data reported in Zalas and Klein (2012).
Chapter 261 Lanthanides in Solar Energy Conversion 245

nonluminescent ions. The second involves lanthanide-containing nanoparticles
which are either doped into the photoanode or provided as an additional down-
converting layer. The last category deals with lanthanide complexes with
organic ligands, a promising avenue since it gave the best results to date, but
remains little explored. The complexes are usually adsorbed onto the TiO2
nanoparticles as described below, but one could also think of introducing them
into the electrolyte or in an additional layer. Since the common dyes sketched
in Scheme 5 have maximum IPCE in the range of 500–650 nm, EuIII is the
unavoidable ion because of its strong emission line around 615–620 nm and
the availability of complexes with various ligands having large quantum yields,
in the range of 75–85% (Bunzli and Eliseeva, 2013). On the other hand, euro-
pium may be sensitive to reduction and its cost is relatively high. Other ions
have also been investigated, namely, SmIII and DyIII, but not TbIII despite its
main emission line at 540 nm which corresponds to a spectral range for which
dyes usually have large IPCE. One reason could be that TbIII has to be excited
at shorter wavelengths than EuIII that is in a range in which sun irradiance is
very small.
To our knowledge, the first demonstration that mesoporous Anatase sensi-
tizes the luminescence of LnIII ions was made in 2002 on EuIII-doped titania
thin films (Frindell et al., 2002). The films have a well-ordered pore structure
and two-phase walls made of amorphous titania and titania nanocrystallites.
They were subsequently doped with various amounts of different LnIII ions,
and luminescence was observed for NdIII, SmIII, EuIII, ErIII, and YbIII, but
not for TbIII and TmIII, which resulted in emission in the spectral range of
600–1540nm (Frindell et al., 2003). The nucleation and growth of the nano-
crystallites is not affected by the LnIII content (at least up to 8 mol%). The
sensitization appears to go through TiO2 defects: luminescence decays of
the EuIII-doped films are biexponential with a long component (0.5 ms for
8% EuIII content) and a short 100-ns component corresponding to titania
defects. Since the highest LnIII excited state which could be populated is
Sm(5G5/2) at around 18,000 cm�1, this means that the energy of these defects
is probably larger than about 19,000 cm�1, otherwise too much back energy
transfer would occur (Bunzli and Eliseeva, 2013). The situation is sketched
in Fig. 38. Later, several papers studied in detail the spectroscopy of EuIII
doped into titania (see, for instance, Zeng et al., 2006).
For solar cell applications, the simplest use of SmIII and EuIII is their
doping into the TiO2 nanoparticles (Table 7, entries 1 and 2). Since this treat-
ment increases the photocatalysis behavior of Anatase (Saif and Abdel-
Mottaleb, 2007), the methodology was applied to DSSCs (Hafez et al.,
2011). Doping was achieved from solutions containing 5 wt% of lanthanide
and the authors report large increases in cell efficiency, þ37% for SmIII and
þ22% for EuIII, with respect to an undoped photoanode. The larger increase
generated by the SmIII ions compared to EuIII ions is ascribed to their shorter
excited state lifetime, but inspection of the reported excitation spectra reveals
Handbook on the Physics and Chemistry of Rare Earths246

that SmIII is mainly excited through the Anatase level (�370 nm), while EuIII is
excited almost exclusively through its faint f-f transitions, which may as well
explain the difference. The overall yields of the doped cells remain modest
(5.8% and 5.2%), and no comparison with a nonluminescent ion is made so that
one cannot decipher the “chemical” influence of the LnIII ion as described
above for YIII and LaIII (þ20–30%!). In our opinion, energy-transfer processes
contribute only little to the improvement of the solar cell characteristics.
The first documented attempt to use luminescent LnIII ions to harvest the
UV part of the solar spectrum dates back to 2006 when J.F. Liu and coworkers
(Liu et al., 2006) coated a DSSC with an additional 300-nm thick UV-
absorbing layer containing LaVO4 nanocrystals doped with 2 mol% DyIII
(Table 7, entry 3; see Fig. 39).
According to the authors, the idea is to take advantage of the V-O CT band
at 280 nm (!) to sensitize the DyIII luminescence. The two main emission
bands of DyIII at 480 and 570 nm match reasonably well the long-wavelength
absorption band of the N3 dye used in the experiments. However, when com-
pared to a standard cell, the LaVO4:Dy doped cell shows a decrease in effi-
ciency from 3.9% to 3.7%. This may be due to light absorption by LaVO4,
VB
CB
TiO2
TiO2 defect
LnIII
Nd 4%Sm 2%Eu 8%Er 2%Yb 2%
19,000 cm−1
FIGURE 38 Sensitization of the luminescence of LnIII ions by titania defects in Ln-doped thin
films and maximum doping rate (mol%) attainable without generating self-quenching. Redrawn
from Frindell et al. (2002).
Pt
Glass
ITO
TiO2
N3 dye
VIS
UV
LaVO4:Dylayer
FIGURE 39 Scheme of the DSSC fitted with a UV-absorbing layer. Redrawn from Liu et al. (2006).
Chapter 261 Lanthanides in Solar Energy Conversion 247

which reduces UV-light absorption by the dye. However, downshifting occurs
since a cell doped with LaVO4 only has a lower yield of 3.0%. In summary,
this attempt provides a UV-protective layer for the DSSC, increasing the life-
time of the dye: without protective layer, the cell yield is reduced by 50%
after 12-h irradiation, compared to a 10% loss with the protective layer. The
role of the DyIII ions is to simply compensate the loss due to the removal of
UV light by the protective layer. We also note that in reality, sunlight has very
weak emission power below 320 nm so that the system chosen here is cer-
tainly not optimum. Despite this, the photophysical properties of thin films
doped with LaVO4:Dy(2 mol%) and spin-coated on ITO glass from 0.2 M
solutions in PVA/citric acid have recently been investigated with the purpose
of applying them to DSSCs (Wu et al., 2012a).
The red phosphor Y2O3:Eu is known for more than a century and still in
use in fluorescent lamps, TV screens, computer displays, and OLEDs
(Eliseeva and Bunzli, 2011). Various amounts (1–5 wt%) of Y2O3:Eu(3 wt%)
have been doped into N719-based DSSCs (Table 7, entry 4). Excitation
spectra of the EuIII luminescence show excitation through the Eu-O CT state
in the range of 220–280 nm (maximum at 250 nm), a domain in which there
is no sun emission. Nevertheless, the authors find that the open-circuit volt-
age increases linearly with the phosphor content (Fig. 40), while short-circuit
0 1 2 3 4 50.70
0.72
0.74
0.76
0.78
0.80
0.82
Voc
(V
)
Weight (%)0 1 2 3 4 5
10.0
10.5
11.0
11.5
12.0
12.5
13.0
13.5
14.0
Jsc
(mA
cm-2
)
Weight (%)
h (%
)
0 1 2 3 4 5
5.4
5.6
5.8
6.0
6.2
6.4
6.6
Weight (%)
FIGURE 40 Effect of increasing quantities of Y2O3:Eu(3 wt%) doped into the TiO2 electrode on
the open-circuit voltage (left), short-circuit current density (middle), and overall cell efficiency
(right). Drawn from data in Wu et al. (2010).
Handbook on the Physics and Chemistry of Rare Earths248

current variation is bell shaped with a maximum at 2 wt% displaying a modest
4% increase. With respect to the overall cell yield, the best doping amount is
3 wt% and translates into a 14% increase with respect to the undoped cell. No
blank experiment is described in which luminescent EuIII would be replaced
by a nonluminescent (e.g., GdIII) ion. In addition, no determination of the varia-
tion of dye concentration upon doping of the phosphor is available. We note,
however, that the amount of EuIII required to get the best yield is modest
(�0.15 wt%) (Wu et al., 2010). In a similar work (Xie et al., 2012a), the anode
has been doped with Y2O3:Eu(5 mol%), Gd(2 mol%). Here too, the excitation
spectrum peaks around 254 nm and little downshifting can be expected, but
due to p-doping by both ions, the conversion yield increases substantially
(þ19%) to reach 6.4% (Table 7, entry 5).
A similar improvement in cell yield (þ13%) was obtained by adding a
4-mm thick layer of TiO2 NRs doped with 0.07 mol% EuIII (see Table 7, entry
6; Hafez et al., 2010). Here, the authors have compared four cell designs: (i)
pure TiO2 NRs (NR), (ii) pure TiO2 nanoparticles (NP), (iii) bilayer NP/NR,
and (iv) bilayer NP/Eu-NR. The amount of adsorbed N-719 dye increases from
2.1 to 3.6, 3.6, and 4.8�10�5 mol cm�2, respectively, exemplifying the role of
EuIII ions. The introduction of the NR layer to the reference cell translates into
an increase in cell yield from 5.8% to 7.1% (þ22%), which is considerable.
Adding EuIII boosts the yield to 8% (þ13 relative %). The authors invoke con-
version of UV light into red light and give the argument that the IPCE at
250 nm amounts to 12% for the Eu-doped cell, compared to nil for the undoped
one; furthermore, the same parameter increases from 89% at 575 nm to 94%
upon doping with EuIII (Hafez et al., 2010). Here again, we note that there is
almost no sun emission below 300 nm and certainly no at 250 nm. We think
that the beneficial effects recorded arise from a þ33% increase in dye concen-
tration (see above) and, also, from excitation of the EuIII ion through its f-f
transitions.
Another host material, Gd2O3, gives slightly better results when it contains
6 mol% of EuIII and when the mole ratio Gd:Ti is 6% (see Table 7, entry 7; Li
et al., 2011a). Under UV-irradiation (l<420 m), the cell yield increases from
1.5% to 1.9% upon doping Gd2O3:Eu into the TiO2 electrode, the difference
(0.4%) being consistent with the yield of a cell containing only the Eu phos-
phor. With full sunlight illumination, the undoped cell has �¼6% which can
be increased up to 7% (þ17%) when the phosphor is introduced into the elec-
trode. The characteristic parameters of the cell vary similarly to the depen-
dences shown in Fig. 40 for doping concentrations in the range of 0–12 mol%.
The excitation spectrum contains the strong LMCT Eu-O band at 250 nm,
along with f-f transitions from both EuIII and GdIII. However, LMCT and GdIII
should not play a large role in solar energy conversion since the corresponding
excitation wavelengths are too short. The increased yield with respect to the
preceding papers (17% vs. 13% and 14%) may be explained by the larger quan-
tity of EuIII ions introduced into the cell (0.36 as compared to 0.07 mol%).
Chapter 261 Lanthanides in Solar Energy Conversion 249

Theoretically, one may also think of downconversion from Gd(6PJ) to Eu(5HJ),
as observed in quantum-cutting (Wegh et al., 1999), but the GdIII level absorbs
in the range of 300–320 nm in which solar irradiance is faint. Another factor is
the effect of ion doping on the electrode (see above). In this respect, a reference
cell with Gd2O3 only would have clarified the relative contributions of ion
doping and luminescence to the improved yield.
In these three works, the authors pretend relying on the Eu-O CT centered
at 250 nm to excite EuIII, which, in our opinion, is not reasonable since
the solar spectrum has no emission intensity at this wavelength so that only
the tails of the CT bands overlap with the solar spectrum in the range of
300–320 nm, meaning that very little light can be harvested (<0.1% of total
solar emission!). Another contribution to EuIII excitation is the 5L6 5D0,1
transition centered at 395 nm, which is usually the strongest f-f absorption
associated with this ion, together with several other weaker absorptions in
the range of 360–460 nm corresponding to transitions to the 5GJ (J¼2, 4, 6)
and 5D4 levels.
A very similar work has been conducted with 50-nm Gd2O3 nanoparticles
doped with SmIII (see Table 7, entry 8; Li et al., 2013). The nanoparticles
were prepared from the mixed nitrate Gd0.97Sm0.03(NO3)3�nH2O itself
obtained by dissolving a mixture of Gd2O3 and Sm2O3 with mole ratio 97:3
in nitric acid followed by evaporation. A solution of the mixed salt was then
treated by Na2CO3, and the collected precipitate was dried and calcined at
800 �C for 2 h. The X-ray diffraction pattern of the resulting powder is typical
of gadolinium sesquioxide. The excitation spectrum of the nanoparticles dis-
plays the Sm(LMCT) band around 235 nm as well as f-f transitions from GdIII
and SmIII. With respect to LMCT and GdIII, the problematic is the same as for
Gd2O3:EuIII. Moreover, the main absorption band of SmIII lies in the range of
400–425 nm (0.6% of sun irradiance), with much weaker ones in the range of
310–330 nm, so that the situation is not very favorable. Emission of SmIII on
the other hand occurs in the range of 560–750 nm, which is quite adequate for
transferring energy to the dye. Under UV-irradiation (l<420 nm), the yield
of the cell increases from 1.5% to 1.9% upon introducing Gd2O3:Sm(3 mol%)
into the TiO2 electrode (the doping amount is not given); therefore, an addi-
tional 0.4% of sunlight is converted, identical to the figure obtained with
Gd2O3:Eu(6 mol%) (Li et al., 2011a); since the 300–420 nm spectral range
represents 3.4% of the solar irradiance, it means that the overall efficiency
of the SmIII and EuIII downconverters is about 12%. Under full 1-sun illumi-
nation, an additional 0.75% of sunlight is converted, leading to an improve-
ment of 12.6% in the overall yield of the N-719 based cell, from 6.0% to
6.7%. This is due to increases in both photocurrent, which peaks at 6% doping
concentration, and open-circuit voltage, which increases quasi linearly with
the doping concentration (Fig. 41). The latter observation could point to ion
doping into the TiO2 electrode being responsible for the additional improve-
ment seen in going from UV to full illumination (þ0.75% vs. þ0.4%). In fact,
Handbook on the Physics and Chemistry of Rare Earths250

a cell fabricated with TiO2 doped with 6% pure Gd2O3 displays a relative
improvement of 6.5% with respect to the reference undoped cell pointing
to half of the total improvement effectively due to ion doping into TiO2
(Li et al., 2013). The better improvement reached with the EuIII-doped oxide
(þ1 absolute% under full illumination vs. 0.4% under UV-irradiation) is dif-
ficult to rationalize but could also stem from the influence of the LnIII ions
on the TiO2 bandgap.
A very different strategy has been adopted by Zhu and coworkers (Zhu
et al., 2012) who took advantage of the broad d-f emission of CeIII around
530 nm. In fact, the lanthanide ion is doped into large YAG nanoparticles
(200–300 nm) themselves incorporated into a 4-mm thick TiO2 SL (Table 6,
entry 2). An improvement of 13.5% is observed in the cell yield, attributed
to energy transfer from CeIII to N719 dye (Scheme 5). Despite the broad emis-
sion band which matches well the absorption spectrum of the dye, the increase
is no better than those observed with narrow-emitting EuIII ions, probably
because the absorption band of CeIII, centered at 450 nm interferes with the
dye absorption.
5.5. Metal Complexes as Dyes or DownshiftingMaterials (Table 7)
In view of the comments made in the preceding section, one may hope that
using coordination complexes rather than inorganic materials will improve
light collection due to the antenna effect of the organic ligands. Until now,
however, very few papers deal with downshifting materials or dyes based
on lanthanide complexes with organic ligands and only three papers report
full quantitative data (Oh et al., 2011; Wang et al., 2012e; Xiao et al.,
2010). Other authors have simply concentrated on doped TiO2 materials, for
instance, by linking [Eu(tta)3L] to the TiO2 surface via the carboxylic groups
0 2 4 6 8 10 120.60
0.64
0.68
0.76
0.80
FF
Voc
(V
)
% Gd2O3:Sm% Gd2O3:Sm0 2 4 6 8 10 12
4
5
6
10
12
14
J SC
(m
Acm
-2)
h (%
)
FIGURE 41 (Left) Current density and overall yield of a N-719-based solar cell versus the
amount of Gd2O3:Sm (3 mol%) introduced into the TiO2 electrode. (Right) Open-circuit voltage
and fill factor. Drawn after data reported by Li et al. (2013).
Chapter 261 Lanthanides in Solar Energy Conversion 251

of L¼2,20bipyridyl-4,40dicarboxylic acid (Scheme 6); tta serves as the sensi-
tizer, and the excitation spectrum displays the corresponding broad band
between 320 and 420 nm (maximum at 375 nm) which can be further three-
fold enhanced if the system is immersed into dipropylsulfide during about
1 h (Sirimanne and Cheng, 2009).
With respect to DSSCs, three main types of ligands have been examined,
macrocycles such as porphyrins and phthalocyanines, carboxylates, and
8-hydroxyquinolinates (Scheme 7) and the corresponding complexes have
been used as either dyes or downshifting materials (Table 7). Interest for por-
phyrins comes from the fact that donor-acceptor-substituted zinc porphyrins
can replace the RuII-based dyes and lead to DSSCs with efficiencies around
11% (Bessho et al., 2010). Moreover, the absorption spectrum can be extended
in the NIR range by using more complex entities such as N-fused carbazole/zincporphyrin/free-base porphyrin (Liu et al., 2011d).
Microwave-assisted synthesis easily provided the LuIII complex
[Lu(TBPor)(PcBut)], which was introduced into a photoelectric cell built from
SnO2 glass, [Lu(TBPor)(PcBut)]þPDHEP, and TiO2/Al (Table 7, entry 9).
Compared to other designs with or without the Lu complex or PDHEP, this
cell produced a photocurrent density of 691 mA cm�2 under weak illumination
of 1.2 mW cm�2 (Liu and Hu, 2004). No other parameter is reported. Samar-
ium phthalocyanine double-decker and triple-decker complexes, [Sm(PcOct)
(Pc)] and [Sm2(PcOct)2(Nc)], can function as dye in ITO/TiO2-(TiO2
Sm complex)/Al solar cells (entries 10 and 11). The overall yield remains,
however, quite modest, 0.36% at most under 50 mW cm�2 illumination
(Wang et al., 2008).
Much better results have been obtained with the 8-hydroxyquinolinate
polymeric complexes [Eu(DB8QB)3]n and [Eu(B8QDF)3]n with molecular
weight 20,500 and 28,000 Da, respectively (see entries 12 and 13; Xiao
et al., 2010). In DMF solutions, these complexes have broad absorption bands
with maxima around 310 and 400 nm for the first one and at 400 and 470 nm
for the second compound. When adsorbed on TiO2, the long-wavelength
absorption band trails up to 700 nm. As could have been expected from the
choice of chromophores, no EuIII luminescence is seen upon excitation at
S
O
O
F3C
Eu3+
N
N
3
S
C3H7
C3H7O
O-
O-
O
Ti4+
Ti4+
SCHEME 6 Tentative structure of the fixation of [Eu(tta)3] on a TiO2 electrode (Sirimanne and
Cheng, 2009).
Handbook on the Physics and Chemistry of Rare Earths252

400 nm, but rather broad emission bands from the ligand are detected
at 500 nm (DB8QB) and 460 nm (B8QDF) in DMF, which shift to 570 and
560 nm, respectively, for solid state samples. The bandgaps calculated from
cyclic voltammetry data amount to 2.04 (DB8QB) and 1.90 (B8QDF)eV.
Titanium dioxide anodes, preliminary treated with TiCl4, were soaked into
solutions of these polymers in DMF and cell parameters determined under
AM1.5G illumination. The fluorene-derivatized polymer gave the best results,
with an overall conversion efficiency of 3%.
When it comes to downshifting materials, only two attempts have
been made so far. The group of H. K. Kim doped a DSSC cell with the
[Eu(C4)3(BPBA)] complex (see Table 7, entries 14 and 15; Oh et al., 2011).
The cell design is based on a FTO glass and comprises an 8mm-thick TiO2
SL and a 8mm-thick layer of TiO2 nanoparticles which were treated with
O CO2H
HC4
N
NH
N
HN
H2TBPor H2PcButH2PcOctH2Pc
NNH
N
N
N
HN
N
N
R
R R
RR
R R
R
R= HOC8H17
NNH
N
N
N
HN
N
N
N
N
N
HO2C
OC8H17
C8H17O
C8H17 C8H17
HBPBA
N
O
O
N
O
O
R R
R = J(CH2)3CH(CH3)2 PDHEP
NNH
N
N
N
HN
N
N
H2Nc
NOO
OHOH
H2DPA
H2B8QDF
H2DB8QB
N
HO
N
OH
N
HO
N
OH
SCHEME 7 Ligands for LnIII complexes used as downshifting materials in DSSCs and n-type
photoconducting materials.
Chapter 261 Lanthanides in Solar Energy Conversion 253

TiCl4. Four cells were made by dipping the TiO2 electrode for 12 h into solu-
tions containing 0.2 mM of the EuIII complex alone, or 0.2 mM BD
(Scheme 5) or 0.2 mM BDþ20 mM deoxycholic acid (BD-DCA), or
0.2 mM BD and 0.2 mM of the Eu complex (Bd-[Eu(C4)3(BPBA)]). The cell
with [Eu(C4)3(BPBA)] alone has a low conversion efficiency of 0.15% only
with the maximum of the IPCE spectrum located at 350 nm (absorption of
the ligand). The BD cell has a conversion efficiency of 7.6% which increases
to 8.5% by the addition of DCA (þ12%). When DCA is replaced with the
EuIII complex, the efficiency reaches 9.3% (þ 22% with respect to BD and
þ9% with respect to BD-DCA). Both DCA and the EuIII complex decrease
the amount of adsorbed dye by 18% and 31%, respectively, but this has no
direct correlation with the cell efficiency since when less EuIII complex is
provided (0.1 mM, leading to 25% decrease in dye concentration), the
conversion yield is smaller (8.7%) compared to the one with 0.2 mM of
[Eu(C4)3(BPBA)]. Looking at the emission spectra, the authors note that
naphthalene emission from C4� at 420 nm perfectly matches one of the
absorption bands of the BD and indeed its emission intensity decreases in
the presence of BD; on the other hand, emission of EuIII at 620 nm is
completely quenched so that both ligand and EuIII probably transfer energy
onto the BD, although no peak at 620 nm is seen on the IPCE curve. The con-
tribution of EuIII alone cannot be evaluated because this would require fabri-
cating a cell with a reference complex featuring a nonluminescent lanthanide
and this has not been done.
Much better improvements occur when [Ln(HDPA)3]�4EtOH com-
plexes, Ln¼Tb, Dy (Scheme 7) are provided as cosensitizers in a 1:1 ratio
with N719 (see Table 7, entries 16 and 17; Wang et al., 2012e). With respect
to a pure N719 cell, the current density increases substantially, þ47% (Tb)
and þ66% (Dy), while the cell efficiency increases by 44% and 72%,
respectively. The surface photovoltage spectra (SPS) reported in Fig. 42 (left)
display the improvements obtained with the lanthanide complexes in the spec-
tral range of 400–600 nm. The improvements are essentially due to much
larger current densities as shown on the right part of the same figure. There
are several reasons which could be invoked to explain the experimental data.
First, the presence of the complex in the photoelectrode avoids aggregation of
the N719 dye and therefore improves its efficiency. Second, electrons can be
injected from the lanthanide complex into the CB of TiO2 with a better yield
than N719 alone. However, DPA absorbs light in the range of 250–290 nm
(Chauvin et al., 2004), and therefore, it is not expected that the latter two pro-
cesses will play a role here, despite the claim made by the authors. It is pos-
sible though that direct excitation of the LnIII complexes occurs via the f-f
transitions, but in view of the associated small molar absorption coefficients,
the influence of this process should remain marginal. Unfortunately, no photo-
physical study of the complexes is available, nor have the authors fabricated
reference cells with the complexes only and a composite one with a
Handbook on the Physics and Chemistry of Rare Earths254

nonluminescent lanthanide complex so that deciphering where the improve-
ment is coming from is impossible. In a previous paper, the authors had tested
in a similar way MII (M¼Zn, Cd, Hg) complexes with 2,6-bis[1-(2,6-
dimethylphenylimino)ethyl]pyridine and reported large improvements, up to
þ105%, in the cell efficiency (Wang et al., 2010). From these two works, they
conclude that the improvement is related to the atomic number of the metal
(Wang et al., 2012e). Plots of the improvements, either absolute or relative,
versus atomic numbers, however, results in quite scattered graphs so that in
our mind the explanation is not valid. Better, although not totally satisfying,
correlations are obtained when considering ionic radii for the coordination
number 6 (Fig. 43). The main point, however, is that the starting cells in both
reports have very low efficiencies, 2.2–2.9%, whereas cells based on N719
FIGURE 42 (Left) Surface photovoltage spectra (SPS) of the three photoanodes tested, with and
without [Ln(HDPA)3]�4EtOH complexes. (Right) Current density versus voltage curves for the
three cells tested. Reproduced with permission from Wang et al. (2012e).
0.950.0
0.5
1.0
1.5
2.0
2.5
Impr
ovem
ent (
abso
lute
%)
Ionic radius (CN=6) (A)20
0.0
0.5
1.0
1.5
2.0
2.5Zn
Zn
CdCd
Hg Hg
TbTb
DyDy
Impr
ovem
ent (
abso
lute
%)
Atomic number
806040 1.051.000.70 0.75 0.80 0.85 0.90
FIGURE 43 Absolute improvements in cell efficiency obtained by doping TiO2 with MII
(M¼Zn, Cd, Hg) or LnIII (Ln¼Tb, Dy) complexes. (Left): plot versus atomic number (authors’
explanation); (right): plot versus ionic radii. Drawn after data reported in Wang et al. (2010) and
Wang et al. (2012e).
Chapter 261 Lanthanides in Solar Energy Conversion 255

dye usually have �¼9%. One may legitimately ask if improvements compa-
rable to those reported in these two studies would be obtained by starting with
such optimized N719 cells.
5.5.1. Conclusion
It is clear that downshifting is delicate, and putting it to work is challenging.
Common organic dyes have large absorptivity in the visible and, in part, in the
UV. Any downshifting system absorbing in the same wavelength range as
organic dyes will lose the competition because even if the molar absorption
coefficients were comparable, the yield of downshifting is never 100%. On
the other hand, lanthanide complexes are far less photosensitive than organic
dyes and this might be the very aspect to concentrate on. Indeed, practical
DSSC devices are often coated with a UV filter, cutting all wavelengths smal-
ler than 400 or 420 nm. That is 4.6% or 7.0% of the solar emission is available
for DS materials; assuming an overall efficiency around 30% (light collection,
energy transfer on the LnIII ion, luminescence quantum yield, IPCE of the dye
at the emitted wavelengths), it means that one may hope to add 1.5–2.0 abso-
lute% to the overall cell efficiency, which is by no means negligible.
5.6. Upconverting Materials (Table 8)
From the theoretical studies described in Section 3.4, one may imagine
that upconverting materials will also become useful for DSSCs since
Eg(TiO2)�3 eV (�25,000 cm�1) and n�2.6 so that one expects conversion
efficiency improvement upon building an upconverting layer into the cells.
LnIII ions most suitable for upconversion are ErIII and TmIII, both of them
lending themselves to sensitization by YbIII which absorbs around 980 nm.
As a matter of fact, some patents describe the principle, but without precise
claim on efficiency improvement (Dai et al., 2011). Other articles establish
a proof-of-principle, by using 980-nm laser illumination only; these are not
described here and Table 8 contains only quantitative data obtained with real
DSSC devices under one-sun illumination.
5.6.1. Erbium-Based Upconverters
Three different ways of introducing the upconverting materials into DSSCs
are described: (i) addition of a scattering (SL, usually on the top) or upcon-
verting (UC, usually at the bottom) layer, (ii) design of a two-layer anode
doped with the dye, and (iii) introduction of the UC materials into the TiO2
photoelectrode.
The first experimental attempt was made in 2009 by co-doping ErIII and
YbIII ions (8.5 mol% each) into a TiO2 SL positioned on the top of the cell
(Han et al., 2009). As can be seen from Table 8 (entry 1), a 3% improvement
was recorded with respect to the same cell fitted with an undoped TiO2SL.
Handbook on the Physics and Chemistry of Rare Earths256

In these systems, the conversion efficiency is going from 7.8% (no SL) to
8.7% (undoped SL) and 9.0% (doped SL), that is, the improvement due to
upconversion is close to the experimental uncertainties in the measurement
of �, while the SL itself brings a 12% improvement.
The upconversion ions can also be introduced into various matrices. For
instance, a YAG disk was doped with 3% YbIII and 0.5% ErIII and attached
at the rear of a solar cell. Only limited quantitative parameters are given
(not tabulated), but there is a clear increase in the photocurrent due to emis-
sion of ErIII in the visible under 500 mW illumination at 980 nm (Liu et al.,
2011b).
Another attempt involved the insertion of an intermediate TiO2 layer
doped with LaF3:ErIII,YbIII nanoparticles and loaded with the N719 dye
(Shan and Demopoulos, 2010; see entry 2, Table 8). The solution used to pre-
pare the lanthanide nanoparticles contained a mole ratio La:Er:Yb equal to
88.6:2.5:8.9. The reference cell fitted with a SL had �¼2.7% only (for undis-
closed reasons). The doped layer has been introduced either (i) at the back of
the regular TiO2 layer (�¼1.9%) or between the scattering and the dye-loaded
layers (�¼2.7%) or used alone (�¼0.3%). With respect to a bilayer reference
cell, the only improvement seen is with the second cell which displays a
somewhat larger photocurrent, but the improvement is again close to experi-
mental uncertainties. The fact that energy transfer to the N719 dye occurs is
substantiated by the ratio of the upconverted luminescence bands at 540 and
660 nm, which decreases in the presence of the dye. Nevertheless, the conver-
sion efficiency of the second cell is smaller than that of the reference cell.
These deceptive results were attributed to the Ln-doped nanocrystals acting
as recombination centers so that the authors proposed another material, one
of the most studied and best rare-earth upconverting system, b-NaYF4:Yb(18%),Er(2%) (Hehlen et al., 2001) and another cell design. The UC mate-
rial produces a stronger green emission than red luminescence, which is favor-
able. A film containing hexagonal nanoplatelets (0.8�0.2 mm) of this
compound was deposited at the rear of the Pt counter electrode. The open-
circuit voltage and FF of cells fitted with different thicknesses of such an
UC external layer do not vary much with the thickness and are comparable
to those of the cell without the UC layer. On the other hand, the photocurrent
and conversion efficiencies display bell-shaped variations (Fig. 44). The
thickness giving the largest current and conversion yield is 14 mm for both
the reference cell and the cell containing the UC layer. For this thickness,
the cell conversion efficiency goes up to 6.9% for the former and to 7.4%
for the latter, a 6% increase while the current increases by 8.9% (Table 8,
entry 3). However, close comparison between the effect of the nanoplatelets
with and without YbIII and ErIII dopants clearly evidences that the main per-
formance enhancements are due to the light-reflecting properties of the UC
layer. The upconversion contribution is estimated to be only þ1 relative%
for both JSC and � (Shan et al., 2011).
Chapter 261 Lanthanides in Solar Energy Conversion 257

An apparently better improvement was achieved by producing a TiO2 col-
loid co-doped with ErIII and YbIII (unspecified proportions) which was then
mixed with nanocrystalline TiO2 to produce the electrode (Table 8, entry 4).
Under irradiation with wavelengths larger than 720 nm (60 mW cm�2), thiscell had a 2.6-fold larger conversion yield (0.15%) than a reference cell with-
out upconverting layer (�¼0.04%). Under full one-sun illumination, the con-
version efficiency of the cells increased from 6.4% to 7.3% (þ14%) (Xie
et al., 2011). How much is really due to upconversion is not known since in
view of the larger size of the doped TiO2 nanocrystallites (68 nm vs.
19 nm), these will also act as light scattering particles; moreover, the doped
LnIII ions may act as p-dopants, see above, LaIII (Yahav et al., 2011) and YIII
(Chandiran et al., 2011). These latter two facts may well create the largest
effects responsible for the increase in cell efficiency, since the doped TiO2
layer displays 0.15% yield only under NIR irradiation. A similar conclusion
may be reached when the TiO2 colloid is doped with YOF:YbIII,ErIII. The best
conversion occurs for a doping concentration of 7 wt% (Table 8, entry 5) for
which all four cell parameters sustain a marked increase. If the doping con-
centration is increased over 7%, only VOC continues to increase, pointing to
p-type doping effects (Wang et al., 2012d).
Entries 6–11of Table 8 are concerned with direct doping of the upconvert-
ing materials into the photoelectrode. Mixing the b-NaYF4:YbIII,ErIII upcon-
verter into graphene (entry 6) before doping it into colloidal TiO2 does not
bring much improvement, the conversion efficiency of the low performing
cell (initial �¼2.7%) being improved by only 0.1 absolute% (Li et al.,
2012a). A better performance is achieved if the UCNPs are coated with a
TiO2 shell and the resulting core–shell nanoparticles used as photoelectrode
after annealing at 480�C. The initial conversion yield of 3.5% with TiO2 alone
is increased to 4.3%, mainly due to increases in the photocurrent (þ8 rel.%)
and the FF (þ18 rel%), while the open-circuit voltage slightly decreases
4 8 12 16 20
8
10
12
14
16
18
JSC (
mA
cm-2
) or
DJS
C (
%)
4 8 12 16 204
6
8
10
12
h (%
) or
Δ h
(%
)
d (μm)d (μm)
FIGURE 44 Absolute (black squares) and relative (red circles) variations of JSC (left) and
� (right) with respect to the thickness of an upconverting layer of b-NaYF4:Yb(18%)/Er(2%)
nanoplatelets. Redrawn from data in Shan et al. (2011).
Handbook on the Physics and Chemistry of Rare Earths258

(�2 rel.%). A control experiments with an IR cut-off filter (l>1100 nm)
leads to �¼3.7% so that one may infer than upconversion adds þ0.6 abso-
lute% to the yield. Another control experiment in which TiO2 is mixed with
the UCNPs results in a smaller yield, 2.2% (Zhang et al., 2013).
Experiments with other dyes, namely, Z907 (Yuan et al., 2012) and the
BD associated with a ZnO photoelectrode (Khan et al., 2011) essentially par-
allel to the earlier data reported with N719, namely that the upconverter
improves the absolute conversion yield by about 0.1–0.2 absolute% only
(entries 8 and 9).
To date, the best results with an upconversion-modified electrode have
been obtained by doping microcrystalline YF3:Yb(20 mol%), Er(2 mol%)
(Wu et al., 2012b), or Y2O3:Er(10 mol%) NRs (Wang et al., 2012c) into the
TiO2 electrode. In the first case, the optimum doping concentration was found
to be 7 wt% (Fig. 45) and a 35% increase in cell efficiency was measured,
from 5.8% without the upconversion layer to 7.9%. The improvement can
be split into 17% increase in photocurrent, 10% rise in voltage, and 7%
improvement in the FF (entry 10). As noted above, these improvements do
not solely come from the upconverted light. Indeed, doping trivalent ions into
the n-type semiconductor leads to a negative shift of the flat-band voltage (the
voltage inducing zero charge in the semiconductor), pointing to a change in
the Fermi level. At a doping concentration of 7 wt%, the flat-band voltage
amounts to �0.65 V as compared to �0.44 V for pure TiO2. The saturated
photocurrent density is also larger in the doped anodes, 13.6 mA cm�2 for
7 wt% doping versus 10.1 mA cm�2 for pure Anatase. A clue on the real
contribution of upconversion is given by the cell characteristics under
0 2 4 6 8 10
3
4
5
6
7
8
9
Cel
l effi
cien
cy (
%)
Doping concentration (wt%)
FIGURE 45 Influence of the doping concentration of YF0.78Yb0.20Er0.02 in the photoanode of a
N719-based DSSC. Drawn from data reported in Wu et al. (2012b).
Chapter 261 Lanthanides in Solar Energy Conversion 259

illumination with l>900 nm (33 mW cm�2): the undoped cell displays
�¼0.055% only, compared to 0.255% for the 7 wt% doped photoanode, that
is, upconversion really adds 0.2 absolute% to the conversion efficiency, and
therefore contributes only 1/10th to the overall improvement in light-to-
electricity conversion yield, the remaining 1.9% being attributable to þ3-iondoping of TiO2 (31 relative%, consistent with data in Table 6).
In the second study (entry 11), the efficiency of the Anatase photoelec-
trode under NIR illumination (l>900 nm) increases from a mere 0.06% to
0.17% upon doping with Y2O3:Er(10 mol%) NRs. The largest contribution
stems from the increase in photocurrent density, from 0.22 to 0.44 mA cm�2
but VOC increases also substantially, from 0.49 to 0.62 V. This is in line with
data reported by Xie et al. (2011) for the two-layer anode (entry 4). However,
under full 1-sun illumination, a spectacular increase in conversion efficiency
is recorded: þ1.2 absolute%. Again, since upconversion approximately adds
0.1% only, most of the improvement has to be credited to the p-dopant effect
(þ1.1 absolute% or 19 relative%, consistent with previous reports).
5.6.2. Thulium-Based Upconverters
Upconversion of thulium by energy transfer from YbIII generates blue
(476 nm) and red (653 nm) emission, both lying in favorable spectral range
for absorption by organic dyes. The effect of TmIII upconversion was tested
with Lu2O3:Tm(0.4 mol%), Yb(2 mol%) dispersed at 4% into a TiO2 colloid
(entry 12) which in turn was deposited as a 4mm-thick layer on a 12 mmTiO2 photoanode (Li et al., 2011b). With respect to a reference cell (16-mmthick photoanode), a noticeable improvement in � is seen when NIR illumina-
tion is used (>720 nm), from 0.12% to 0.19%. Under full sunlight illumina-
tion, the conversion yield increases from 6.0% to 6.6%. Smaller increase
was expected from the data obtained under NIR irradiation. A clue to what
may happen is given by the excitation spectrum of the 473-nm TmIII emission
which points to downshifting taking place as well since this spectrum displays
a band at 320 nm with, as a consequence, excitation of the 1G4 level and
subsequent emission of blue light. In addition, the authors also remark that
the LnIII ions act as p-dopants so that the contribution of the UC process to
the overall improvement cannot be deduced from the data presented in this
paper but is probably rather small.
An interestingly simple procedure is used by Xie et al. (2012b) who pre-
pare a TiO2:YbIII,TmIII powder (YbIII:TmIII ratio 10:1) and disperse it into a
TiO2 colloid; the electrode consists of a 10-mm layer of undoped titania and
a 5-mm layer of doped titania onto which the N719 dye is adsorbed. A study
of the cell performances versus doping concentration shows that JSC increases
up to 2.50 wt% and then decreases; this is explained by the formation of crys-
tal defects at higher LnIII concentrations. The best conversion yield, 7.1%, is
obtained for 3.3 wt% doping, up 10 relative% from the cell without LnIII ions
Handbook on the Physics and Chemistry of Rare Earths260

(entry 13). In the absence of experiment with NIR light only, it is again diffi-
cult to decide which part of this improvement can be traced back to upconver-
sion and which part arises from the p-type doping effect.
5.6.3. Conclusions
Considering the limited set of available data and accounting for major side
effects such as p-type doping of TiO2, it seems that in its present state of opti-
mization, upconversion is not yet of much help in boosting the performance of
DSSCs under 1-sun illumination. At most a few relative percent improvement
is obtained with respect to reference cells without upconverting materials, but
the reported results are often within experimental errors. This is understand-
able because the upconversion yield is usually small and depends on excita-
tion power. For the archetype NaYF4:Yb(18%),Er(2%) crystalline material,
quantum efficiency is about 2.5�10�4 per W/cm2 for the green emission
(Hehlen et al., 2001), which translates to about 3�10�4 per W/cm2 for both
green and red emission or 3% for 100 mW/cm2 irradiation at 980 nm. If one
further considers that only about 6% of sunlight is available in the absorption
range of YbIII (950–1050 nm) and that molar absorption coefficients are small
(<10 M�1 cm�1), the odds are difficult to overcome. The field is, however, in
its infancy so that one may hope that more optimized systems will soon be at
hand (see Sections 3.4.4–3.4.6). Moreover, concentrating sunlight to generate
more surfacial power is an option since the upconversion quantum yield is
proportional to the excitation power. Alternatively, photon upconversion upon
irradiation with low-power noncoherent light sources is progressing, in
particular with reference to organic compounds. Sensitized upconversion
can indeed be obtained by annihilation of metastable triplet states of organic
oligomers and yields up to 26% have been reported; but until now, excitation
wavelengths shorter than 650 nm have to be used (Monguzzi et al., 2012),
which is not of much help in DSSCs, and these organic materials are sensitive
to oxygen quenching in addition to being photosensitive (Cates et al., 2012).
Finally, metal-enhanced upconversion luminescence (plasmonics) might be
as promising for solar energy conversion as it seems to be in bioanalyses
(Fischer et al., 2012b; Goldschmidt et al., 2012; Zhong et al., 2011). For
instance, incorporating core–shell Ag@TiO2 NPs into a conventional TiO2
photoanodes increases the yield of a N3-based DSSC from 7.8% to 9.0%, that
is a relative 15% increase (Qi et al., 2011). Photonic crystals will also have to
be considered (Section 3.4.6).
5.7. Upconverted DSSCs for Powering Nanobiological Devices
A futuristic vision in nanomedicine is to provide nanorobots for in vivoadvanced diagnosis, medical therapies, and minimally invasive surgery. These
nanorobots integrate embedded nanoelectronics and circuitry in order to sense
Chapter 261 Lanthanides in Solar Energy Conversion 261
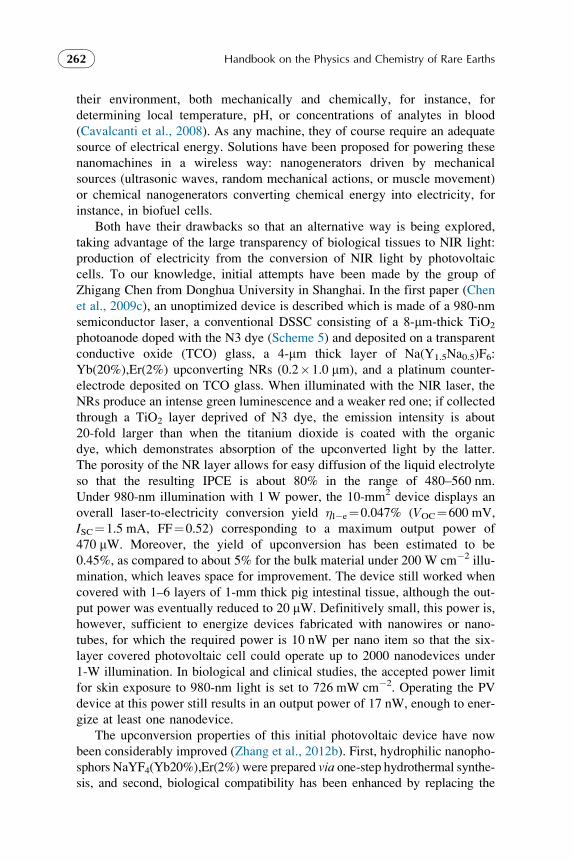
their environment, both mechanically and chemically, for instance, for
determining local temperature, pH, or concentrations of analytes in blood
(Cavalcanti et al., 2008). As any machine, they of course require an adequate
source of electrical energy. Solutions have been proposed for powering these
nanomachines in a wireless way: nanogenerators driven by mechanical
sources (ultrasonic waves, random mechanical actions, or muscle movement)
or chemical nanogenerators converting chemical energy into electricity, for
instance, in biofuel cells.
Both have their drawbacks so that an alternative way is being explored,
taking advantage of the large transparency of biological tissues to NIR light:
production of electricity from the conversion of NIR light by photovoltaic
cells. To our knowledge, initial attempts have been made by the group of
Zhigang Chen from Donghua University in Shanghai. In the first paper (Chen
et al., 2009c), an unoptimized device is described which is made of a 980-nm
semiconductor laser, a conventional DSSC consisting of a 8-mm-thick TiO2
photoanode doped with the N3 dye (Scheme 5) and deposited on a transparent
conductive oxide (TCO) glass, a 4-mm thick layer of Na(Y1.5Na0.5)F6:
Yb(20%),Er(2%) upconverting NRs (0.2�1.0 mm), and a platinum counter-
electrode deposited on TCO glass. When illuminated with the NIR laser, the
NRs produce an intense green luminescence and a weaker red one; if collected
through a TiO2 layer deprived of N3 dye, the emission intensity is about
20-fold larger than when the titanium dioxide is coated with the organic
dye, which demonstrates absorption of the upconverted light by the latter.
The porosity of the NR layer allows for easy diffusion of the liquid electrolyte
so that the resulting IPCE is about 80% in the range of 480–560 nm.
Under 980-nm illumination with 1 W power, the 10-mm2 device displays an
overall laser-to-electricity conversion yield �l�e¼0.047% (VOC¼600 mV,
ISC¼1.5 mA, FF¼0.52) corresponding to a maximum output power of
470 mW. Moreover, the yield of upconversion has been estimated to be
0.45%, as compared to about 5% for the bulk material under 200 W cm�2 illu-mination, which leaves space for improvement. The device still worked when
covered with 1–6 layers of 1-mm thick pig intestinal tissue, although the out-
put power was eventually reduced to 20 mW. Definitively small, this power is,
however, sufficient to energize devices fabricated with nanowires or nano-
tubes, for which the required power is 10 nW per nano item so that the six-
layer covered photovoltaic cell could operate up to 2000 nanodevices under
1-W illumination. In biological and clinical studies, the accepted power limit
for skin exposure to 980-nm light is set to 726 mW cm�2. Operating the PV
device at this power still results in an output power of 17 nW, enough to ener-
gize at least one nanodevice.
The upconversion properties of this initial photovoltaic device have now
been considerably improved (Zhang et al., 2012b). First, hydrophilic nanopho-
sphors NaYF4(Yb20%),Er(2%) were prepared via one-step hydrothermal synthe-
sis, and second, biological compatibility has been enhanced by replacing the
Handbook on the Physics and Chemistry of Rare Earths262

liquid I3- /I2 electrolyte with a stable succinonitrile-based gel electrolyte (Chen
et al., 2007) made of 3-methoxypropionitrile containing 0.6 M 1-methyl-3-
propylimidazolium iodide, 0.1 M iodide, and 0.5 M N-methylbenzimidazole
(Fig. 46). Comparing the upconversion spectra obtained with and without N3
dye, the authors conclude that 93% of the upconverted light is absorbed by the
organic dye. Under irradiation with a 980-nm laser delivering 1-W power, the
yield of laser-to-electrical conversion is 0.09% almost double that of the initial
PV device. Under 1-sun illumination (AM1.5G), the 0.16-cm2 cell presents the
following parameters: VOC¼0.604 V, ISC¼1.61 mA, FF¼0.54, �¼3.3%.
Without upconverting layer, the same cell has �¼5.0% (Chen et al., 2007),
exemplifying the detrimental effect of this layer. With skin-safe 720 mW cm�2
illumination, the new device exhibits a maximum output power of 44.5 mW,
corresponding to a �l�e¼0.039%; the output power reduces to 22.2 mW(�l�e¼0.019%) when the PV cell is covered with one 1-mm layer of chicken
skin as model for biological tissue. This output power is large enough for the
PV device to be effectively considered as power source for in vivo nanorobots
(Zhang et al., 2012b).
5.8. Cerium Oxide as Photoanode
Owing to its nonstoichiometric structure and redox properties, CeIV oxide has
many applications ranging from polishing powders to high-temperature auto-
motive (Kilbourn, 1986) or solar fuel (Chueh et al., 2010) catalysts. More-
over, with a bandgap of 3.2 eV (387 nm), it is a UV-blocking material in
cosmetics, particularly when coated with boron nitride as whitening agent and
for reducing catalytic activity (Masui et al., 2000). On the other hand, the bulk
Gelelectrolyte
Upconversionlayer
N3-coatedTiO2
Solar light or
980 nm laser
Pt
TCO glass
FIGURE 46 Schematic representation of the 980-nm driven upconverter photovoltaic device
proposed for energizing nanorobots in clinical and biological applications. Adapted with permis-sion after Zhang et al. (2012b), © 2012 The Royal Society of Chemistry.
Chapter 261 Lanthanides in Solar Energy Conversion 263

material and large particles of CeO2 do not have exploitable photovoltaic
response, probably because the bandgap corresponds to an O2p!Ce4f ligand-
to-metal transition. In 1997, Turkovic and Orel, who had been developing
rechargeable, photosensitive galvanic cells proposed to replace TiO2 with
mesoporous CeO2 or CeO2/SnO2 photoanode films. With the trinuclear com-
plex initially used by Gratzel and O’Regan, [Ru(bpy)2(m-(CN)Ru(CN)(HL)2](H2L¼2,20-bipyridine-4,40-dicarboxylic acid) as dye, the best results
were obtained with CeO2/SnO2(17%): VOC¼100 mV, JSC¼0.85 mA cm�2
and maximal power of 85 nW cm�2 under sun illumination (91.7 mW cm�2)and with a 0.6-mm layer thickness. Without dye, but with a layer thickness of
only 0.3 mm, the cell power reached 10 nW cm�2 (Turkovic and Orel, 1997).
Yet, mesoporous CeO2 particles with large pore volume are not very stable
and their structure collapses upon steaming at mild temperature. A priori, theseproperties do not make cerium oxide a very good candidate as photovoltaic
material. However, Corma et al. (2004) succeeded in fabricating hierarchically
nanostructured CeO2 nanoparticles by self-assembly of 5-nm nanoparticles,
which are thermally stable and present a high surface area. Their reflectance
spectrum extends more into the visible than the one of TiO2, with a cutoff
wavelength of 430 nm compared to 350 nm (Fig. 47). This corresponds to a
bandgap of 3.0 eV which allows harvesting a larger portion of the solar
spectrum. The unexpected reduction of the bandgap upon going from the bulk
material to the nanostructured one is attributed to the presence of CeIII/CeIV
ions on the surface leading to oxygen vacancies the influence of which on
the bandgap overcome the expected quantum size effect. In addition, charge
recombination is about five times slower in nanostructured CeO2 compared to
standard P-25 TiO2 as shown by the temporal profile of the voltage recorded
after 355-nm excitation. Finally, the material can be doped (up to 30 mol%)
with La2O3 or ZrO2 without perturbing its structure, which results in modula-
tion of its absorption spectrum with possible extension up to 600 nm.
0
5
10
300 400 500
ab
l (nm)
F(R
) (a.
u.)
FIGURE 47 Diffuse reflectance spectra plotted as the Kubelka–Munk function F of the reflec-
tance R of (a) CeO2 and (b) TiO2 nanoparticles. Redrawn with permission from Corma et al.(2004), © 2004 Nature Publishing Group.
Handbook on the Physics and Chemistry of Rare Earths264

A 1-cm2 solar cell was prepared by depositing a suspension of LaIII-doped
CeO2 onto a transparent ITO electrode followed by calcination at 300 �Cand addition of LiI/I2 and adding a platinized aluminum counter electrode.
At 40 mW cm�2 irradiance (AM 1.5 spectrum), its efficiency was 1.4%
(VOC¼0.90 V, ISC¼1.5 mA, FF¼0.41) but dropped to 0.9% under 1 sun
illumination (VOC¼0.82 V, ISC¼3.4 mA, FF¼0.32). A patent was filed
covering this finding and other photovoltaic applications of cerium oxide
(Chane-Ching et al., 2005), but to our knowledge, no subsequent work has
been conducted.
5.9. Cells with Light-Storage Capability for Night Operation
A cell design has been proposed for extending the DSSC operation during
night. The cell is fitted with transparent glass layers containing a long-
persistence phosphor. The latter absorbs UV-blue light and emits visible light
in the dark, allowing solar cell operation in the absence of sun illumination
(Guo, 2007, 2008). Commercial long-persistence phosphors are used in watch
dials, emergency lighting devices, image storage, or detection of high-energy
radiation. The best known, and commercially available, such material is
SrAl2O4:EuII,DyIII discovered in the mid-1990s, but since then other materials
displaying the same properties have been found, including aluminates,
silicates, and stannates doped with various LnIII ions, or simple oxysulfides,
such as Y2O2S:LnIII,MgII,TiIV, with Ln¼Sm or Eu (Lei et al., 2010). The
present patent covers the use of oxides, sulfides, and oxysulfides as afterglow
materials in solar-powered street lamps. The most common material, SrAl2O4:
EuII,DyIII, however, has less than 10% of the EuIII ions associated with traps
(Korthout et al., 2011), which may hamper its use as energy-storage material
for solar cells.
6. PERSPECTIVES
If one counts the number of papers published since 2000 and dealing with
improving the yield of solar cells with rare-earth materials, the total is over
200, a number which can certainly be doubled or even tripled if publications
describing potential or prospective systems are taken into account. This pro-
lific and inventive research effort has produced a wealth of spectroscopic data
on lanthanide inorganic materials prone to either downconversion/down-
shifting or upconversion. Lanthanide complexes with organic ligands have
attracted less attention despite that they appear to be highly useful in the
design of efficient LSCs and as downshifting materials. What is real impact
of all these investigations on photovoltaics? In order to get a synthetic picture,
results obtained (or, better, claimed) with solar cells are summarized in
Table 9, in terms of improvements made to these systems, expressed as the
absolute percentage added to the conversion yield. We also assess the likely
Chapter 261 Lanthanides in Solar Energy Conversion 265
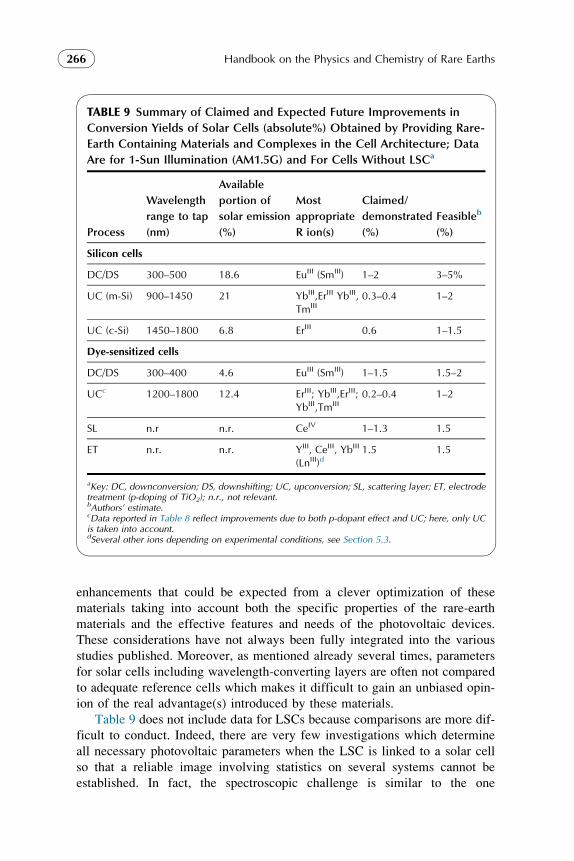
enhancements that could be expected from a clever optimization of these
materials taking into account both the specific properties of the rare-earth
materials and the effective features and needs of the photovoltaic devices.
These considerations have not always been fully integrated into the various
studies published. Moreover, as mentioned already several times, parameters
for solar cells including wavelength-converting layers are often not compared
to adequate reference cells which makes it difficult to gain an unbiased opin-
ion of the real advantage(s) introduced by these materials.
Table 9 does not include data for LSCs because comparisons are more dif-
ficult to conduct. Indeed, there are very few investigations which determine
all necessary photovoltaic parameters when the LSC is linked to a solar cell
so that a reliable image involving statistics on several systems cannot be
established. In fact, the spectroscopic challenge is similar to the one
TABLE 9 Summary of Claimed and Expected Future Improvements in
Conversion Yields of Solar Cells (absolute%) Obtained by Providing Rare-
Earth Containing Materials and Complexes in the Cell Architecture; Data
Are for 1-Sun Illumination (AM1.5G) and For Cells Without LSCa
Process
Wavelength
range to tap
(nm)
Available
portion of
solar emission
(%)
Most
appropriate
R ion(s)
Claimed/
demonstrated
(%)
Feasibleb
(%)
Silicon cells
DC/DS 300–500 18.6 EuIII (SmIII) 1–2 3–5%
UC (m-Si) 900–1450 21 YbIII,ErIII YbIII,TmIII
0.3–0.4 1–2
UC (c-Si) 1450–1800 6.8 ErIII 0.6 1–1.5
Dye-sensitized cells
DC/DS 300–400 4.6 EuIII (SmIII) 1–1.5 1.5–2
UCc 1200–1800 12.4 ErIII; YbIII,ErIII;YbIII,TmIII
0.2–0.4 1–2
SL n.r n.r. CeIV 1–1.3 1.5
ET n.r. n.r. YIII, CeIII, YbIII
(LnIII)d1.5 1.5
aKey: DC, downconversion; DS, downshifting; UC, upconversion; SL, scattering layer; ET, electrodetreatment (p-doping of TiO2); n.r., not relevant.bAuthors’ estimate.cData reported in Table 8 reflect improvements due to both p-dopant effect and UC; here, only UCis taken into account.dSeveral other ions depending on experimental conditions, see Section 5.3.
Handbook on the Physics and Chemistry of Rare Earths266

encountered when adding wavelength-converting layers to solar cells. In par-
ticular, the conversion of UV light into visible light or UV–vis into NIR has to
be tailored with respect to the type of solar cell, c-Si, m-Si, a-Si, or DSSC. In
the case of an m-Si cell with initial 15% conversion yield, it is claimed that
þ2.6 absolute% could be added with a 1-layer LSC based on a EuIII triazinyl
complex (Katsagounos et al., 2011). Assuming conservatively that an LSC
with 30–40% yield can be designed to harvest light in the 300–450 nm range
(10.8% of solar irradiance) for m-Si and 300–500 nm range (18.6% of solar
irradiance) for c-Si, one may hope to add 3–7 absolute% to these types of
cells. For LSCs coupled to DSSCs, the expected maximum improvement
would be smaller (1.5–2.5%) due to competition with dye absorption in the
range of 300–400 nm.
In the case of single-crystal silicon cells, claimed (but not always
unambiguously demonstrated) improvements are in the range of 1–2%
for downshifting, mainly arising from EuIII materials, and 0.3–0.6% for upcon-
version. These figures can likely be doubled for downshifting, particularly if
other ways are exploited for harvesting UV-blue light, for instance, by resorting
to 4f-5d transitions (CeIII, EuII), which in our mind have been too little
explored. In this case, CeIII-to-TbIII energy transfer could be taken advantage
of in the case of m-Si and a-Si cells. Moreover, new nanophosphors such as
spherical EuSe have ideal excitation (300–400 nm, max. at 350 nm; emission
between 375 and 475 nm) could be helpful in the case of c-Si cells, possibly
DSSCs (Wang et al., 2012a). Projections for upconversion are more difficult
to formulate because despite the numerous efforts put forward, relatively few
precise data sets are at hand. But taking into account both improved designs
and syntheses of UNCPs and contributions of plasmonics and/or photonic
materials, as well as concentration of sunlight (van Sark et al., 2013), one
may hope that the demonstrated improvements will be tripled in a near future.
Finally, although heavily studied, downconversion materials have not yet
been successfully introduced into solar cells despite their potential addition
of up to 7 absolute % to the conversion yield (Abrams et al., 2011).
For DSSCs, it seems that downshifting has already met its limits with
the addition of up to 1.5 absolute%, corresponding to an overall 30% effi-
ciency of the process. It will be very difficult to surpass this achievement,
or, even, to match it. Upconversion can certainly be improved along ways
similar to those proposed for silicon cells, but owing to the different design
of the cells we anticipate that the gain will be lower. Very important points
for DSSCs are the large improvements (þ1.5 absolute%) brought by CeIV
containing SLs (helped by some downshifting) and by p-doping of the
TiO2 photoelectrode with various RIII ions. Interestingly, to our knowledge,
no one has attempted combining these two effects which are simple
(and cheap) to implement. On the other hand, it does not seem that using lan-
thanide complexes as substitute for ruthenium dyes or porphyrins has
promising perspectives.
Chapter 261 Lanthanides in Solar Energy Conversion 267
This comment brings us to an essential point: can the described beneficial
effects be combined? The answer is not straightforward, owing to the peculiar
requirements specific to each wavelength-converting/scattering/doping pro-
cess. But some researchers are now tailoring materials with both downshifting
and upconversion ability in order to combine both functions into a single
nanophosphor or material (Richards et al., 2012). One such attempt is the fab-
rication of fluorinated silica glasses of composition 90SiO2–5SnO2–5LaF3doped with 0.1% EuIII, 0.1% ErIII, and 0.3% YbIII in which the SnO2 nano-
crystals strongly absorb UV light and transfer energy onto EuIII ions, leading
to red emission while efficient IR-to-visible upconversion is mediated by the
YbIII/ErIII ions (Yanes et al., 2011). Another design implies the coating of
Gd2O3:Yb(2%),Er(0.3%) nanoparticles with [Eu(dbm)3Phen] which results
in a nanophosphor displaying upconverted green and red emission upon exci-
tation at 976 nm and downshifted red emission when excited at 355 nm (into
ligand levels) or 521 nm (into the ErIII2H11/2 level). Although planned for
luminescent security inks, the material could as well be applied to enhancing
the yield of solar cells (Singh et al., 2011). If these and similar materials prove
to be successful and if their performances can be optimized to meet the goals
set in Table 9, once coupled with photovoltaic devices they might therefore
be able to boost the conversion yields of silicon solar cells by as much as
5–8 absolute% and of dye-sensitized cells by 5.5-6.5 absolute%. Given the
difficulties described in the preceding sections though, it seems more reason-
able to set these figures to 4–5% for Si cells and 3–5% for DSSCs. Another
important point here is that the added absolute% in conversion yield will
decrease if the semiconductor bandgap is better adjusted to the solar emission
spectrum because the primary conversion process will efficiently compete
with the wavelength-converting materials.
As far as other cell types are concerned (e.g., GaAs, mutijunction cells),
too few data are at hand for any reliable estimate to be made although muti-
junction cells will certainly continue to benefit from lattice-matching rare-
earth inorganic compounds. Organic photovoltaic (OPV) cells have not been
treated in a separate section in this review because there are presently very
few papers describing the use of rare-earth containing materials for improving
their performances: LnIII complexes (Ln¼Pr, Sm, Eu, Gd, Tb) have been
tested as electron acceptors (Si et al., 2007), upconversion materials such as
NaYF4:Yb,Er (Wu et al., 2012c) and MoO3:Yb,Er (Wang et al., 2012b)
increase the photocurrent upon illumination at 975–980 nm, and Yb/Al/Se
(Kaulachs et al., 2012) or Sm/Al (Yang et al., 2013) composite electrodes
help increasing both the photocurrent and the power conversion efficiency.
Given the relatively lower conversion efficiency of OPV, on may expect
that lanthanide-based wavelength converting materials would be of help in
improving their overall characteristics.
A final remark is aimed at scientists or engineers developing practical
devices. Getting a high conversion yield is certainly satisfying and most
Handbook on the Physics and Chemistry of Rare Earths268

desirable, but it is not the main point. Cost has to be considered if photovol-
taics is to contribute substantially to electricity production in the future. More
precisely, the cost per watt power is the ultimate parameter to optimize in
order to reach “grid parity,” that is the price of electricity produced by other
means (nuclear energy, fossil fuels, wind, hydroelectricity). Presently, the
matching cost is set to about 1 US$/W. This figure is now close to be reached
for solar panels with 1-m2 area (see, for instance, the MK series panels from
GreenSun, http://www.greensun.biz/Products/). This is certainly encouraging
for the development of wavelength converting materials and layers, provided
they do not increase too much the cost, either because of the high price of the
rare-earth containing materials or by too much added sophistication in the
processing of the panels. An additional concern would be the rare-earth short-
age which is much documented presently (Gschneidner, 2011). However, this
shortage is artificial in that only few of the available rare-earth resources are
presently exploited and the situation on the international rare-earth market
may evolve quickly with the rapidly changing economic situation. As a con-
clusion, rare-earth wavelength converting materials for photovoltaics, as well
as for photocatalysis (Cates et al., 2012; Walter et al., 2010) have a foresee-
able bright future.
ACRONYMS AND ABBREVIATIONS
Ac acetate
AM air mass
a-Si amorphous silicon
BD black dye
bpy 2,20-bipyridineCB conduction band
CET cooperative energy transfer
c-Si crystalline silicon
CT charge transfer
Da dalton
dbm dibenzoylmethanate (1,3-diphenyl-1,3-propanedionate)
DC downconversion (or quantum cutting)
DCA deoxycholic acid
DPA dipicolinate (2,6-pyridine-dicarboxylate)
dpbt 2-(N,N-diethylanilin-4-yl)-4,6-bis(3,5-dimethylpyrazol-1-yl)-
1,3,5-triazine
dpepo oxybis(2,1-phenylene)bis(diphenylphosphine oxide)
DS downshifting
DSSC dye-sensitized solar cell
EQE external quantum efficiency (ratio of charges collected by the
number of incident photons)
ESA excited state absorption
Chapter 261 Lanthanides in Solar Energy Conversion 269
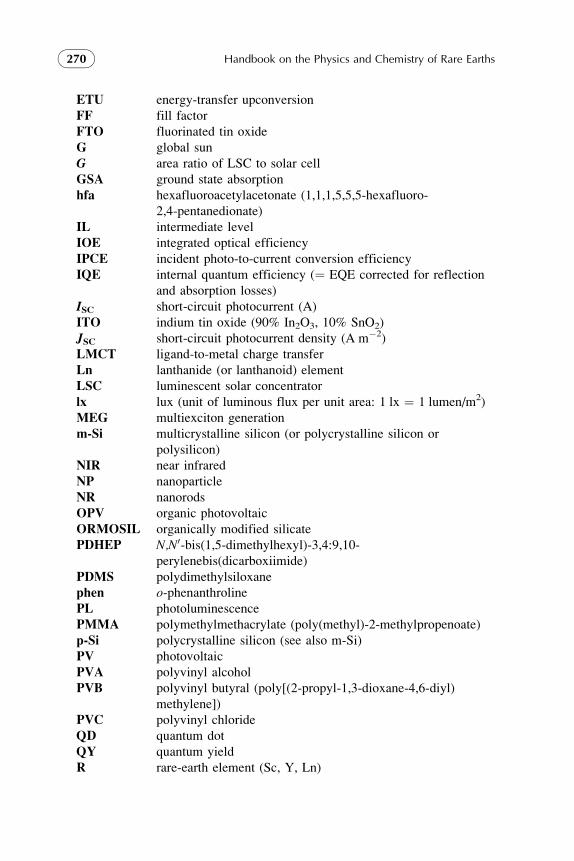
ETU energy-transfer upconversion
FF fill factor
FTO fluorinated tin oxide
G global sun
G area ratio of LSC to solar cell
GSA ground state absorption
hfa hexafluoroacetylacetonate (1,1,1,5,5,5-hexafluoro-
2,4-pentanedionate)
IL intermediate level
IOE integrated optical efficiency
IPCE incident photo-to-current conversion efficiency
IQE internal quantum efficiency (¼ EQE corrected for reflection
and absorption losses)
ISC short-circuit photocurrent (A)
ITO indium tin oxide (90% In2O3, 10% SnO2)
JSC short-circuit photocurrent density (A m�2)LMCT ligand-to-metal charge transfer
Ln lanthanide (or lanthanoid) element
LSC luminescent solar concentrator
lx lux (unit of luminous flux per unit area: 1 lx ¼ 1 lumen/m2)
MEG multiexciton generation
m-Si multicrystalline silicon (or polycrystalline silicon or
polysilicon)
NIR near infrared
NP nanoparticle
NR nanorods
OPV organic photovoltaic
ORMOSIL organically modified silicate
PDHEP N,N0-bis(1,5-dimethylhexyl)-3,4:9,10-
perylenebis(dicarboxiimide)
PDMS polydimethylsiloxane
phen o-phenanthrolinePL photoluminescence
PMMA polymethylmethacrylate (poly(methyl)-2-methylpropenoate)
p-Si polycrystalline silicon (see also m-Si)
PV photovoltaic
PVA polyvinyl alcohol
PVB polyvinyl butyral (poly[(2-propyl-1,3-dioxane-4,6-diyl)
methylene])
PVC polyvinyl chloride
QD quantum dot
QY quantum yield
R rare-earth element (Sc, Y, Ln)
Handbook on the Physics and Chemistry of Rare Earths270

SL scattering layer
SPS surface photovoltage spectra
STC standard test conditions (25 �C, AM1.5G spectrum with
1000 W m2 irradiance)
TCO transparent conductive oxide
tfc 3-(trifluoromethylhydroxymethylene)-d-camphorate
TIR total internal reflectance
TOPO trioctylphosphine oxide
TPPO triphenylphosphine oxide
tta thenoyltrifluoroacetonate (4,4,4-trifluoro-1-(2-thienyl)-
1,3-butanedionate)
UC upconversion
UCNP upconverting nanoparticle (or nanophosphor)
UV ultraviolet
VB valence band
VOC open-circuit voltage (V)
wt weight
YAG yttrium aluminum garnet (Y3Al5O12)
ZBLAN very stable glass containing ZrF4, BaF2, LaF3, AlF3, and NaF
REFERENCES
Aarts, L., van der Ende, B.M., Meijerink, A., 2009. J. Appl. Phys. 106, Art. Nr. 023522.
Abdel-Mottaleb, M.S.A., 2009. Int. J. Nanomanufact. 4, 175.
Abrams, Z.R., Niv, A., Zhang, X., 2011. J. Appl. Phys. 109, Art. Nr. 114905.
Ahmad, S., Bessho, T., Kessler, F., Baranoff, E., Frey, J., Yi, C., Gratzel, M., Nazeeruddin, M.K.,
2012. Phys. Chem. Chem. Phys. 14, 10631.
Ahrens, B., Loper, P., Goldschmidt, J.C., Glunz, S., Henke, B., Miclea, P.T., Schweizer, S., 2008.
Phys. Stat. Sol. A 205, 2822.
Andrade, L., Ribeiro, H.A., Mendes, A., 2011. Encyclopedia of Inorganic and Bioinorganic
Chemistry. John Wiley & Sons Ltd., Hoboken, http://dx.doi.org/10.1002/9781119951438.
eibc0469.
Atwater, H.A., Polman, A., 2010. Nat. Mater. 9, 205.
Auzel, F., 2004. Chem. Rev. 104, 139.
Badescu, V., Badescu, A.M., 2009. Renew. En. 34, 1538.
Basudeb, K., Tirtha, S., ShivPrakash, S., Muthun, N., 2010. Trans. Ind. Ceram. Soc. 69, 171.
Bessho, T., Zakeeruddin, S.M., Yeh, C.Y., Diau, E.W.G., Gratzel, M., 2010. Angew. Chem. Int.
Ed. 49, 6646.
Bram, O., Cannizzo, A., Chergui, M., 2012. Phys. Chem. Chem. Phys. 14, 7934.
Brewer, J.R., Gernhart, Z., Liu, H.Y., Cheung, C.L., 2010. Chem. Vap. Dep. 16, 216.
Brewer, J.R., Jacobberger, R.M., Diercks, D.R., Cheung, C.L., 2011. Chem. Mater. 23, 2606.
Bunzli, J.-C.G., 2013. In: de Bettencourt-Dias, A. (Ed.), Luminescence in Lanthanide Coordina-
tion Compounds and Nanomaterials. Wiley-Blackwell, Oxford, (Chapter 6) in press.
Bunzli, J.-C.G., Eliseeva, S.V., 2010. J. Rare Earths 28, 824.
Chapter 261 Lanthanides in Solar Energy Conversion 271

Bunzli, J.-C.G., Eliseeva, S.V., 2013. In: Yam, V.W.-W. (Ed.), Comprehensive Inorganic Chem-
istry II, vol. 8. Elsevier B.V, Amsterdam, (Chapter 8.03) in press.
Cang, L., Wan, Z., Yan, T., Ding, W., Liu, W., Liu, Z., Chen, L. 2012. Solar cell with high pho-
toelectric conversion efficiency and preparation method thereof, Pat. Nr. CN 102664213 A.
Carnall, W.T., 1979. In: Gschneidner Jr., K.A., Eyring, L. (Eds.), Handbook on the Physics and
Chemistry of Rare Earths, vol. 3. North Holland Publishing Co., Amsterdam, pp. 172–208
(Chapter 24).
Catchpole, K.R., Polman, A., 2008. Appl. Phys. Lett. 93, Art. No.: 191113.
Cates, E.L., Chinnapongse, S.L., Kim, J., Kim, J.H., 2012. Environ. Sci. Technol. 46, 12316.
Cavalcanti, A., Shirinzadeh, B., Freitas, R.A., Hogg, T., 2008. Nanotechnology 19, Art. Nr. 015103.
Chan, E.M., Gargas, D.J., Schuck, P.J., Milliron, D.J., 2012. J. Phys. Chem. B 116, 10561.
Chandiran, A.K., Sauvage, F., Casas-Cabanas, M., Comte, P., Zakeeruddin, S.M., Gratzel, M.,
2010. J. Phys. Chem. C 114, 15849.
Chandiran, A.K., Sauvage, F., Etgar, L., Graetzel, M., 2011. J. Phys. Chem. C 115, 9232.
Chane-Ching, J.Y., Corma, A., Garcia, H., 2005. Use of cerium oxide materials for photovoltaic
applications, Pat. Nr. WO 2005/008786 A3.
Chapin, D.M., Fuller, C.S., Pearson, G.L., 1954. J. Appl. Phys. 25, 676.
Chatten, A.J., Bose, R., Farrell, D.J., Xiao, Y., Chan, N.L.A., Manna, L., Buchtemann, A.,
Quilitz, J., Debije, M.G., Barnham, K.W.J., 2010. In: Tsakalakos, L. (Ed.), Nanotechnology
for Photovoltaics. CRC Press, Boca Raton, USA, pp. 323–329 (Chapter 9).
Chauvin, A.-S., Gumy, F., Imbert, D., Bunzli, J.-C.G., 2004. Spectrosc. Lett. 37, 517 erratum,
2007, 40, 193.
Chen, Y.C., Chen, T.M., 2011. J. Rare Earths 29, 723.
Chen, X., Mao, S.S., 2007. Chem. Rev. 107, 2891.
Chen, Z., Yang, H., Li, X., Li, F., Yi, T., Huang, C., 2007. J. Mater. Chem. 17, 1602.
Chen, D.Q., Wang, Y.S., Yu, Y.L., Huang, P., Weng, F.Y., 2008a. Opt. Lett. 33, 1884.
Chen, D.Q., Wang, Y.S., Yu, Y.L., Huang, P., Weng, F.Y., 2008b. J. Appl. Phys. 104, Art. Nr.
116105.
Chen, X.P., Huang, X.Y., Zhang, Q.Y., 2009a. J. Appl. Phys. 106, Art. Nr. 063518.
Chen, Z., Zhang, L., Sun, Y., Hu, J., Wang, D., 2009b. Adv. Funct. Mater. 19, 3815.
Chen, J., Luo, J., Qiu, J., Ye, S., Zhu, B., 2009a. Down-conversion light-emitting transparent
microcrystalline glass for solar cells, comprises rare earth metal ions doped to oxyfluoride
microcrystalline glass base body, Pat. Nr. CN101353229-A.
Chen, S.W., Lee, J.M., Lu, K.T., Pao, C.W., Lee, J.F., Chan, T.S., Chen, J.M., 2010. Appl. Phys.
Lett. 97, Art. Nr. 012104.
Chen, Y.C., Huang, W.Y., Chen, T.M., 2011. J. Rare Earths 29, 907.
Chen, D., Wang, Y., Hong, M., 2012a. Nano Energy 1, 73.
Chen, Q.J., Zhang, W.J., Huang, X.Y., Dong, G.P., Peng, M.Y., Zhang, Q.Y., 2012b. J. Alloys
Compd. 513, 139.
Chen, S., Zhou, G., Su, F., Zhang, H., Wang, L., Wu, M., Chen, M., Pan, L., Wang, S., 2012c.
Mater. Lett. 77, 17.
Chen, X.B., Yang, G.J., Li, S., Yang, X.D., Liu, D.H., Chen, Y., Ding, F.L., Wu, Z.L., 2012d.
Acta. Phys. Sin. 61, Art. Nr. 037804.
Cheng, C.L., Yang, J.Y., 2012. IEEE Electron Device Lett. 33, 697.
Cheng, Z.J., Pan, L.K., Su, F.F., Cao, M.L., Sun, Z., 2009. Surf. Rev. Lett. 16, 669.
Cheng, Y.Y., Fuckel, B., MacQueen, R.W., Khoury, T., Clady, R.G.C.R., Schulze, T.F.,
Ekins-Daukes, N.J., Crossley, M.J., Stannowski, B., Lips, K., Schmidt, T.W., 2012. Energy
Environ. Sci. 5, 6953.
Handbook on the Physics and Chemistry of Rare Earths272
Cheung, C.L., Brewer, J.R., Deo, N., 2012. Crystalline nanostructures, Pat. Nr. US 8,247,070.
Chueh, W.C., Falter, C., Abbott, M., Scipio, D., Furler, P., Haile, S.M., Steinfeld, A., 2010. Sci-
ence 330, 1797.
Chung, P., Chung, H.H., Holloway, P.H., 2007. J. Vac. Sci. Technol. A 25, 61.
Clark, A., Smith, R., Sewell, R., Semans, S., Srkun, F.E., Lebby, M., 2010. Passive rare earth tan-
dem solar cell, Pat. Nr. US 20100122720 A1.
Corma, A., Atienzar, P., Garcia, H., Chane-Ching, J.Y., 2004. Nat. Mater. 3, 394.
Currie, M.J., Mapel, J.K., Heidel, T.D., Goffri, S., Baldo, M.A., 2008. Science 321, 226.
Dai, S.Y., Zhang, Y.X., Zhang, C.N., Hu, L.H., Kong, F.T., Xu, P., 2011. Application of up-
conversion luminescent material on dye-sensitized solar cells, Pat. Nr. CN101582330 B.
de Boer, D.K.G., Ronda, C.R., Keur, W., Meijerink, A., 2011. Proc. SPIE 8108, Art. Nr. 81080E.
de Boer, D.K.G., Broer, D.J., Debije, M.G., Keur, W., Meijerink, A., Ronda, C.R.,
Verbunt, P.P.C., 2012. Opt. Express 20, A395.
De Vos, A., Szymanska, A., Badescu, V., 2009. Energy Conversion Manage. 50, 328.
de Wild, J., Meijerink, A., Rath, J.K., van Sark, W.G.J.H., Schropp, R.E.I., 2010a. Solar Energy
Mater. Solar Cells 94, 1919.
de Wild, J., Rath, J.K., Meijerink, A., van Sark, W.G.J.H., Schropp, R.E.I., 2010b. Solar Energy
Mater. Solar Cells 94, 2395.
de Wild, J., Meijerink, A., Rath, J.K., van Sark, W.G.J.H., Schropp, R.E.I., 2010c. Improved Pho-
ton Upconversion in Amorphous Silicon Solar Cells, In Proceedings of the 25th European
Photovoltaic Solar Energy Conference, Valencia, Spain, 255.
de Wild, J., Meijerink, A., Rath, J.K., van Sark, W.G.J.H., Schropp, R.E.I., 2011. Energy Environ.
Sci. 4, 4835.
Desmet, L., Ras, A.J.M., de Boer, D.K.G., Debije, M.G., 2012. Opt. Lett. 37, 3087.
Dexter, D.L., 1957. Phys. Rev. 108, 630.
Diaw, D., 1998. Solar Energy Mater. Solar Cells 53, 379.
Dirac, P.A.M., 1927. Proc. R. Soc. Lond. A 114, 243.
Duan, Y., Fu, N., Liu, Q., Fang, Y., Zhou, X., Zhang, J., Lin, Y., 2012. J. Phys. Chem. C 116, 8888.
Earp, A.A., Smith, G.B., Franklin, J., Swift, P., 2004a. Solar Energy Mater. Solar Cells 84, 411.
Earp, A.A., Smith, G.B., Swift, P.D., Franklin, J., 2004b. Solar Energy 76, 655.
Eilers, J.J., van Wijngaarden, J.T., Kramer, K., Gudel, H.U., Meijerink, A., 2010. Appl. Phys.
Lett. 96, Art. Nr. 151106.
Eliseeva, S.V., Bunzli, J.-C.G., 2011. New J. Chem. 35, 1165.
Fang, Y.C., Kao, P.C., Chu, S.Y., 2011. J. Electrochem. Soc. 158, J120.
Fischer, S., Goldschmidt, J.C., Loper, P., Bauer, G.H., Bruggemann, R., Kramer, K., Biner, D.,
Hermle, M., Glunz, S.W., 2010. J. Appl. Phys. 108, Art. Nr. 044912.
Fischer, S., Hallermann, F., Eichelkraut, T., von Plessen, G., Kramer, K.W., Biner, D.,
Steinkemper, H., Hermle, M., Goldschmidt, J.C., 2012a. Opt. Express 20, 271.
Fischer, S., Steinkemper, H., Kramer, K.W., Goldschmidt, J.C., 2012b. Proc. SPIE 8438, Art. Nr.
843806.
Fischer, S., Steinkemper, H., Loper, P., Hermle, M., Goldschmidt, J.C., 2012c. J. Appl. Phys. 111,
Art. Nr. 013109.
Frindell, K.L., Bartl, M.H., Popitsch, A., Stucky, G.D., 2002. Angew. Chem. Int. Ed. 41, 959.
Frindell, K.L., Bartl, M.H., Robinson, M.R., Bazan, G.C., Popitsch, A., Stucky, G.D., 2003.
J. Solid State Chem. 172, 81.
Fukuda, T., Kato, S., Kin, E., Okaniwa, K., Morikawa, H., Honda, Z., Kamata, N., 2009. Opt.
Mater. 32, 22.
Giannini, V., Fernandez-Dominguez, A.I., Heck, S.C., Maier, S.A., 2011. Chem. Rev. 111, 3888.
Chapter 261 Lanthanides in Solar Energy Conversion 273
Giaume, D., Buissette, V., Lahlil, K., Gacoin, T., Boilot, J.P., Casanova, D., Beaurepaire, E.,
Sauviat, M.P., Alexandrou, A., 2005. Prog. Solid State Chem. 33, 99.
Gibart, P., Auzel, F., Guillaume, J.C., Zahraman, K., 1996. Jpn. J. Appl. Phys. I 35, 4401.
Goetzberger, A., Greubel, W., 1977. Appl. Phys. 14, 123.
Goldschmidt, J.C., Loper, P., Fischer, S., Janz, S., Peters, M., Glunz, S.W., Willeke, G.,
Lifshitz, E., Kramer, K., Biner, D., 2008. Advanced upconverter systems with spectral and
geometric concentration for high upconversion efficiencies. In: IEEE Proceedings, Conf.on
Optoelectronic and Microelectronic Materials and Devices (COMMAD 2008), 307.
Goldschmidt, J.C., Peters, M., Gutmann, J., Steidl, L., Zentel, R., Blasi, B., Hermle, M., 2010.
Proc. SPIE 7725, Art. Nr. 77250S.
Goldschmidt, J.C., Fischer, S., Loper, P., Kramer, K.W., Biner, D., Hermle, M., Glunz, S.W.,
2011. Solar Energy Mater. Solar Cells 95, 1960.
Goldschmidt, J.C., Fischer, S., Steinkemper, H., Herter, B., Rist, T., Wolf, S., Blasi, B.,
Hallermann, F., von Plessen, G., Kramer, K.W., Biner, D., Hermle, M., 2012. Proc. SPIE
8256, Art. Nr. 825602.
Graffion, J., Cattoen, X., Man, M.W.C., Fernandes, V.R., Andre, P.S., Ferreira, R.A.S.,
Carlos, L.D., 2011. Chem. Mater. 23, 4773.
Gratzel, M., 2003. J. Photochem. Photobiol. C: Photochem. Rev. 4, 145.
Green, M.A., Pillai, S., 2012. Nat. Phot. 6, 130.
Green, M.A., Emery, K., Hishikawa, Y., Warta, W., Dunlop, E.D., 2012. Prog. Photovolt. 20, 606.
Gschneidner Jr., K.A., 2011. Mater. Matters 6, 32.
Guo, C., 2007. A solar cell with visible light response, Pat. Nr. CN200979886.
Guo, C., 2008. Visible light responding solar cell for e.g. storing solar energy, has transparent
glasses provided with rare earth luminescent material membrane layers, where rare earth
luminescent material is oxide, sulfide or oxy-sulfide, Pat. Nr. CN200979886-Y.
Gutmann, J., Peters, M., Blasi, B., Hermle, M., Zappe, H., Goldschmidt, J.C., 2011. Proc. SPIE
8111, Art. Nr. 81110K.
Hafez, H., Wu, J.H., Lan, Z., Li, Q.H., Xie, G.X., Lin, J.M., Huang, M.L., Huang, Y.F.,
Abdel-Mottaleb, M.S., 2010. Nanotechnology 21, 415201.
Hafez, H., Saif, M., Abdel-Mottaleb, M.S.A., 2011. J. Power. Sources 196, 5792.
Hamann, T.W., 2012. Dalton Trans. 41, 3111.
Hamann, T.W., Ondersma, J.W., 2011. Energy Environ. Sci. 4, 370.
Han, C.H., Lee, H.S., Lee, K.W., Han, S.D., Singh, I., 2009. Bull. Kor. Chem. Soc. 30, 219.
Harikisun, R., Desilvestro, H., 2011. Solar Energy 85, 1179.
Hehlen, M.P., Phillips, M.L.F., Cockroft, N.J., Gudel, H.U., 2001. Up-conversion phosphors. In:
Buschow, K.H.J., Cahn, R.W., Flemings, M.C., Ilschner, B., Kramer, E.J., Mahajan, S.
(Eds.), Encyclopedia of Materials: Science and Technology. Elsevier Science Ltd., Oxford,
pp. 9456–9458.
Henke, B., Ahrens, B., Johnson, J.A., Miclea, P.T., Schweizer, S., 2009. Proc. SPIE 7411,
74110E–74111E.
Herb, J., 2012. Commercialization of New Lattice-Matched Multi-Junction Solar Cells Based
on Dilute Nitrides. Report Nr. NREL/SR-5200-54721, http://www.nrel.gov/docs/fy12osti/
54721.pdf.
Herter, B., Wolf, S., Fischer, S., Peters, M., Blasi, B., Goldschmidt, J.C., 2012. Proc. SPIE 8438,
Art. Nr. 84381D.
Hong, B.C., Kawano, K., 2003. Solar Energy Mater. Solar Cells 80, 417.
Huang, X.Y., Zhang, Q.Y., 2009. J. Appl. Phys. 105, Art. Nr. 053521.
Huang, X.Y., Zhang, Q.Y., 2010. J. Appl. Phys. 107, Art. Nr. 063505.
Handbook on the Physics and Chemistry of Rare Earths274
Huang, X.Y., Yu, D.C., Zhang, Q.Y., 2009. J. Appl. Phys. 106, Art. Nr. 113521.
Huang, J.H., Hung, P.Y., Hu, S.F., Liu, R.S., 2010. J. Mater. Chem. 20, 6505.
Huang, X.Y., Ji, X.H., Zhang, Q.A., 2011. J. Am. Cer. Soc. 94, 833.
Hyldahl, M.G., Bailey, S.T., Wittmershaus, B.P., 2009. Solar Energy 83, 566.
Iso, Y., Takeshita, S., Isobe, T., 2012. J. Electrochem. Soc. 159, J72.
Ivanova, S., Pelle, F., 2009. J. Opt. Soc. Am. B: Opt. Phys. 26, 1930.
Jin, T., Inoue, S., Machida, K., Adachi, G., 1997. J. Electrochem. Soc. 144, 4054.
Kalyanasundaram, K., 2010a. Dye-sensitized Solar Cells. EPFL Press, Lausanne.
Kalyanasundaram, K., 2010b. Photochemical and photoelectrochemical approaches to energy con-
version. In: Kalyanasundaram, K. (Ed.), Dye-Sensitized Solar Cells. EPFL Press, Lausanne,
pp. 1–44 (Chapter 1).
Kanesato, M., Sugaya, K., Segawa, M., 2010. Fluorescent resin composition and solar battery
module using the same, Pat. Nr. EP 2 080 785 B1.
Katsagounos, G., Stathatos, E., Arabatzis, N.B., Keramidas, A.D., Lianos, P., 2011. J. Lumin. 131,
1776.
Kaulachs, I., Muzikante, I., Gerca, L., Shlihta, G., Shipkovs, P., Grehovs, V., Kalnachs, J.,
Roze, M., Rozite, G., Ivanova, A., 2012. Chem. Phys. 405, 46.
Kawano, K., Arai, K., Yamada, H., Hashimoto, N., Nakata, R., 1997a. Solar Energy Mater. Solar
Cells 48, 35.
Kawano, K., Hashimoto, N., Nakata, R., 1997b. Mater. Sci. Forum 239–241, 311.
Kawano, K., Hong, B.C., Sakamoto, K., Tsuboi, T., Seo, H.J., 2009. Opt. Mater. 31, 1353.
Khan, A.F., Yadav, R., Mukhopadhya, P.K., Singh, S., Dwivedi, C., Dutta, V., Chawla, S., 2011.
J. Nanopart. Res. 13, 6837.
Kilbourn, B.T., 1986. J. Less-Common Met. 126, 101.
Klampaftis, E., Ross, D., McIntosh, K.R., Richards, B.S., 2009. Solar Energy Mater. Solar Cells
93, 1182.
Ko, K.H., Lee, Y.C., Jung, Y.J., 2005. J. Colloid Interface Sci. 283, 482.
Korthout, K., Van den Eeckhout, K., Botterman, J., Nikitenko, S., Poelman, D., Smet, P.F., 2011.
Phys. Rev. B 84, Art. Nr. 085140.
Kozlowska, A., Nakielska, M., Sarnecki, J., Lipinska, L., Jeremiasz, O., Podniesinski, D.,
Malag, A., 2011. Opt. Appl. 41, 359.
Kramer, K.W., Biner, D., Frei, G., Gudel, H.U., Hehlen, M.P., Luthi, S.R., 2004. Chem. Mater.
16, 1244.
Lahoz, F., 2008. Opt. Lett. 33, 2982.
Lahoz, F., Perez-Rodriguez, C., Hernandez, S.E.,Martin, I.R., Lavin, V., Rodriguez-Mendoza, U.R.,
2011. Solar Energy Mater. Solar Cells 95, 1671.
Lakowicz, J.R., 2005. Anal. Biochem. 337, 171.
Le Donne, A., Acciarri, M., Narducci, D., Marchionna, S., Binetti, S., 2009. Prog. Photovolt. 17, 519.
Lei, B.F., Yue, S., Zhang, Y.Z., Liu, Y.L., 2010. Chin. Phys. Lett. 27, Art. Nr. 037201.
Levitt, J.A., Weber, W.H., 1977. Appl. Optics 16, 2684.
Li, F., Gu, Y., 2012. Mater. Sci. Semicond. Proc. 15, 11.
Li, W., Xianping, F., 2008. Rare Met. Mater. Eng. 37, 80.
Li, Q.B., Lin, J.M., Wu, J.H., Lan, Z., Wang, J.L., Wang, Y., Peng, F.G., Huang, M.L.,
Xiao, Y.M., 2011a. Chin. Sci. Bull. 56, 3114.
Li, Q., Lin, J., Wu, J., Lan, Z., Wang, Y., Peng, F., Huang, M., 2011b. Electrochim. Acta 56,
4980.
Li, Y., Wang, G., Pan, K., Jiang, B., Tian, C., Zhou, W., Fu, H., 2012a. J. Mater. Chem. 22,
20381.
Chapter 261 Lanthanides in Solar Energy Conversion 275

Li, Z.Q., Li, X.D., Liu, Q.Q., Chen, X.H., Sun, Z., Liu, C., Ye, X.J., Huang, S.M., 2012c. Nano-
technology 23, Art. Nr. 025402.
Li, Q., Lin, J., Wu, J., Lan, Z., Wang, Y., Peng, F., Huang, M., 2013. J. Lumin. 134, 59.
Lin, H., Zhou, S.M., Teng, H., Li, Y.K., Li, W.J., Hou, X.R., Jia, T.T., 2010. J. Appl. Phys. 107,
Art. Nr. 043107.
Lin, H.Y., Chen, H.N., Wu, T.H., Wu, C.S., Su, Y.K., Chu, S.Y., 2012. J. Am. Cer. Soc. 95,
3172.
Liska, P., Thampi, K.R., Gratzel, M., Bremaud, D., Rudmann, D., Upadhyaya, H.M.,
Tiwari, A.N., 2006. Appl. Phys. Lett. 88, Art. Nr. 203103.
Listorti, A., O’Regan, B., Durrant, J.R., 2011. Chem. Mater. 23, 3381.
Liu, M.O., Hu, A.T., 2004. J. Organomet. Chem. 689, 2450.
Liu, J.F., Yao, Q.H., Li, Y.D., 2006. Appl. Phys. Lett. 88, Art. Nr. 173119.
Liu, X., Ye, S., Qiao, Y., Dong, G., Zhu, B., Chen, D., Lakshminarayana, G., Qiu, J., 2009a. Appl.
Phys. B: Laser Opt. 96, 51.
Liu, X., Teng, Y., Zhuang, Y., Xie, J., Qiao, Y., Dong, G., Chen, D., Qiu, J., 2009b. Opt. Lett. 34,
3565.
Liu, G.X., Zhang, R., Xiao, Q.L., Zou, S.Y., Peng, W.F., Cao, L.W., Meng, J.X., 2011a. Opt.
Mater. 34, 313.
Liu, M., Lu, Y.L., Xie, Z.B., Chow, G.M., 2011b. Solar Energy Mater. Solar Cells 95, 800.
Liu, N., Qin, W.P., Qin, G.S., Jiang, T., Zhao, D., 2011c. Chem. Commun. 47, 7671.
Liu, Y., Lin, H., Dy, J.T., Tamaki, K., Nakazaki, J., Nakayama, D., Uchida, S., Kubo, T.,
Segawa, H., 2011d. Chem. Commun. 47, 4010.
Liu, B., Qiu, S., Hu, R., Liao, Y., Chen, N., Du, G., 2012. Appl. Surf. Sci. 259, 705.
Liu, J., Wang, K., Zheng, W., Huang, W., Li, C. H., You, X. Z., 2013. Prog. Photovolt: Res.
Appl., 21, 668.
Lo, W.S., Kwok, W.M., Law, G.L., Yeung, C.T., Chan, C.T.-L., Yeung, H.L., Kong, H.K.,
Chen, C.H., Murphy, M.B., Wong, K.L., Wong, W.T., 2011. Inorg. Chem. 50, 5309.
Lohse, S.E., Murphy, C.J., 2012. J. Am. Chem. Soc. 134, 15607.
Lu, L.L., Li, R.J., Peng, T.Y., Fan, K., Dai, K., 2011. Renew. En. 36, 3386.
MacDougall, S.K.W., Ivaturi, A., Marques-Hueso, J., Chen, D., Wang, Y., Richards, B.S., 2012.
Proc. SPIE 8438, Art. Nr. 84380Y.
Machida, K., Li, H., Ueda, D., Inoue, S., Adachi, G., 2000. J. Lumin. 87–89, 1257.
Malta, O.L., Brito, H.F., Menezes, J.F.S., Goncalves e Silva, F.R., Donega, C.D., Alves, S., 1998.
Chem. Phys. Lett. 282, 233.
Marchionna, S., Meinardi, F., Acciarri, M., Binetti, S., Papagni, A., Pizzini, S., Malatesta, V.,
Tubino, R., 2006. J. Lumin. 118, 325.
Marques-Hueso, J., Chen, D.Q., MacDougall, S.K.W., Wang, Y.S., Richards, B.S., 2011. Proc.
SPIE 8111, Art. Nr. 811102.
Martiniani, S., Anderson, A.Y., Law, C., O’Regan, B.C., Barolo, C., 2012. Chem. Commun. 48, 2406.
Masui, T., Yamamoto, M., Sakata, T., Mori, H., Adachi, G., 2000. J. Mater. Chem. 10, 353.
Mawyin, J.A., Chawda, S.G., Halada, G.P., Clayton, C.R., Tonucci, R.J., Fortmann, C.M., 2008.
J. Non-Cryst. Solids 354, 2492.
McIntosh, K.R., Lau, G., Cotsell, J.N., Hanton, K., Batzner, D.L., Bettiol, F., Richards, B.S.,
2009. Prog. Photovolt. 17, 191.
Meijer, J.-M., Aarts, L., van der Ende, B.M., Vlugt, T.J.H., Meijerink, A., 2010. Phys. Rev. B 81,
Art. Nr. 035107.
Meseguer, F.J., Cusso, F., Jaque, F., Sanchez, C., 1981. J. Lumin. 24–25 (Part 2), 865.
Misra, V., Mishra, H., 2008. J. Chem. Phys. 128, Art Nr. 244701.
Handbook on the Physics and Chemistry of Rare Earths276
Monguzzi, A., Tubino, R., Hoseinkhani, S., Campione, M., Meinardi, F., 2012. Phys. Chem.
Chem. Phys. 14, 4322.
Moudam, O., Rowan, B.C., Alamiry, M.A.H., Richardson, P., Richards, B.S., Jones, A.C.,
Robertson, N., 2009. Chem. Commun. 2009, 6649.
Munz, P., Bucher, E., 1982. Rare Earths Modern Sci. Technol. 3, 547.
Muthu, P., Calander, N., Gryczynski, I., Gryczynski, Z., Talent, J.M., Shtoyko, T., Akopova, I.,
Borejdo, J., 2008. Biophys. J. 95, 3429.
Oh, J.H., Song, H.M., Eom, Y.K., Ryu, J.H., Ju, M.J., Kim, H.K., 2011. Bull. Kor. Chem. Soc. 32, 2743.
Ohwaki, J., Wang, Y.H., 1994. Jpn. J. Appl. Phys. Lett. 2:Lett 33, L334.
O’Regan, B.C., Gratzel, M., 1991. Nature 353, 737.
Ozawa, H., Okuyama, Y., Arakawa, H., 2012. Dalton Trans. 41, 5137.
Pala, R.A., White, J., Barnard, E., Liu, J., Brongersma, M.L., 2009. Adv. Mater. 21, 3504.
Passlick, C., Henke, B., Csaszar, I., Ahrens, B., Miclea, P.T., Johnson, J.A., Schweizer, S., 2010.
Proc. SPIE 7772, Art. Nr. 777201.
Peng, Y.J., Liu, J., Zhang, K., Luo, H., Li, J.H., XU, B., Han, L.X., Li, X.J., Yu, X.B., 2011. Appl.
Phys. Lett. 99, Art. Nr. 121110.
Piper, W.W., DeLuca, J.A., Ham, F.S., 1974. J. Lumin. 8, 344.
Qi, J., Dang, X., Hammond, P.T., Belcher, A.M., 2011. ACS Nano 5, 7108.
Reisfeld, R., 1983. J. Less-Common Met. 93, 243.
Reisfeld, R., 1987. Inorg. Chim. Acta 140, 345.
Reisfeld, R., 2010. Opt. Mater. 32, 850.
Richards, B.S., 2006a. Solar Energy Mater. Solar. Cells 90, 2329.
Richards, B.S., 2006b. Solar Energy Mater. Solar Cells 90, 1189.
Richards, B.S., Shalav, A., 2005. Synt. Met. 154, 61.
Richards, B.S., Shalav, A., 2007. IEEE Trans. Electron. Dev. 54, 2679.
Richards, B.S., Aruna, I., MacDougall, S.K.W., Marques-Hueso, J., 2012. Proc. SPIE 8438, Art.
Nr. 843802.
Rodriguez, V.D., Tikhomirov, V.K., Mendez-Ramos, J., Yanes, A.C., Moshchalkov, V.V., 2010.
Solar Energy Mater. Solar Cells 94, 1612.
Rodriguez, V.D., Mendez-Ramos, J., Tikhomirov, V.K., del-Castillo, J., Yanes, A.C.,
Moshchalkov, V.V., 2011. Opt. Mater. 34, 179.
Rowan, B.C., Wilson, L.R., Richards, B.S., 2008. IEEE J. Quantum Electron. 14, 1312.
Saif, M., Abdel-Mottaleb, M.S.A., 2007. Inorg. Chim. Acta 360, 2863.
Sanguineti, A., Monguzzi, A., Vaccaro, G., Meinardi, F., Ronchi, E., Moret, M., Cosentino, U.,
Moro, G., Simonutti, R., Mauri, M., Tubino, R., Beverina, L., 2012. Phys. Chem. Chem.
Phys. 14, 6452.
Santan-Alonso, A., Yanes, A.C., Mendez-Ramos, J., del-Castillo, J., Rodriguez, V.D., 2011. Opt.
Mater. 33, 587.
Schietinger, S., Aichele, T., Wang, H.Q., Nann, T., Benson, O., 2010. Nano Lett. 10, 134.
Schuller, J.A., Barnard, E.S., Cai, W., Jun, Y.C., White, J.S., Brongersma, M.L., 2010. Nat. Mater.
9, 193.
Schulze, T.F., Cheng, Y.Y., Fueckel, B., MacQueen, R.W., Danos, A., Davis, N.J.L.K.,
Tayebjee, M.J.Y., Khoury, T., Clady, R.G.C.R., Ekins-Daukes, N.J., Crossley, M.J.,
Stannowski, B., Lips, K., Schmidt, T.W., 2012. Aust. J. Chem. 65, 480.
Schweizer, S., Henke, B., Ahrens, B., Passlick, C., Miclea, P.T., Wenzel, J., Reisacher, E.,
Pfeiffer, W., Johnson, J.A., 2010. Proc. SPIE 7725, 77250X–77251X.
Sewell, R.H., Clark, A., Smith, R., Semans, S., Jamora, A., Vosters, G., 2009. IEEE Photovoltaic
Specialist Conference, 2448.
Chapter 261 Lanthanides in Solar Energy Conversion 277
Shalav, A., Richards, B.S., Trupke, T., Corkish, R.P., Game, K.W., Gudel, H.U., Green, M.A., 2003.
The application of up-converting phosphors for increased solar cell conversion efficiencies. In:
3rd World Conference on Photovoltaic Energy Conversion, Osaka, May 11-18, 2003, A-C, 248.
Shalav, A., Richards, B.S., Kramer, K., Gudel, H.U., 2005a. Improvements of an up-conversion
NaYF4: Er3þ phosphor/silicon solar cell system for an enhanced response in the near-infrared.
In: Conference Record of the Thirty-First IEEE Photovoltaic Specialists Conference - 2005,
Lake Buena Vista, Florida, Jan 3-7, 2005, 114.
Shalav, A., Richards, B.S., Trupke, T., Kramer, K.W., Gudel, H.U., 2005b. Appl. Phys. Lett. 86,
Art. Nr. 013505.
Shalav, A., Richards, B.S., Green, M.A., 2007. Solar Energy Mater. Solar Cells 91, 829.
Shan, G.B., Demopoulos, G.P., 2010. Adv. Mater. 22, 4373.
Shan, G.B., Assaaoudi, H., Demopoulos, G.P., 2011. ACS Appl. Mater. Interface 3, 3239.
Shao, W., Gu, F., Gai, L., Li, C., 2011. Chem. Commun. 47, 5046.
Shockley, W., Queisser, H.J., 1961. J. Appl. Phys. 32, 510.
Sholin, V., Olson, J.D., Carter, S.A., 2007. J. Appl. Phys. 101, Art. Nr. 123114.
Shpaisman, H., Niitsoo, O., Lubomirsky, I., Cahen, D., 2008. Solar Energy Mater. Solar Cells 92,
1541.
Si, Z., Li, B., Wang, L., Yue, S., Li, W., 2007. Solar Energy Mater. Solar Cells 91, 1168.
Singh, S.K., Singh, A.K., Rai, S.B., 2011. Nanotechnology 22, Art. Nr. 275703.
Sirimanne, P.M., Cheng, Y.B., 2009. J. Lumin. 129, 563.
Slooff, L.H., Bende, E.E., Burgers, A.R., Budel, T., Pravettoni, M., Kenny, R.P., Dunlop, E.D.,
Buchtemann, A., 2008. Phys. Stat. Sol. Rap. Res. Lett. 2, 257.
Sommeling, P.M., O’Regan, B.C., Haswell, R.R., Smit, H.J.P., Bakker, N.J., Smits, J.J.T.,
Kroon, J.M., van Roosmalen, J.A.M., 2006. J. Phys. Chem. B 110, 19191.
Song, P., Jiang, C., 2012. AIP Adv. 2, Art. Nr. 042130.
Streetman, B.G., Banerjee, S., 2000. Solid State Electronic Devices. Prentice Hall, New Jersey.
Strek, W., Bednarkiewicz, A., Deren, P.J., 2001. J. Lumin. 92, 229.
Streudel, F., Dyrba, M., Schweizer, S., 2012. Proc. SPIE 8438, Art. Nr. 843803.
Strumpel, C., McCann, M., Beaucarne, G., Arkhipov, V., Slaoui, A., Svrcek, V., del Canizo, C.,
Tobias, I., 2007. Solar Energy Mater. Solar Cells 91, 238.
Suryawanshi, M.P., Agawane, G.L., Bhosale, S.M., Shin, S.W., Patil, P.S., Kim, J.H.,
Moholkar, A.V., 2013. Mater. Technol.: Adv. Perform. Mater. 28, 98.
Sytko, V., Pershina, M., 1995. Proc. SPIE 2531, 272.
Takei, M., 2011. Conductive paste for solar cell, Pat. Nr. JP20100099623 20100423 (A).
Tan, T.T.Y., 2012. Rare Earth Nanotechnology. Pan Stanford Publishing, Singapore.
Tanner, P.A., Mak, C.S.K., Kwok, W.M., Phillips, D.L., Joubert, M.F., 2002. J. Phys. Chem. B
106, 3606.
Teng, Y., Zhou, J.J., Liu, X.F., Ye, S., Qiu, J.R., 2010. Opt. Express 18, 9671.
Teotonio, E.E.S., Fett, G.M., Brito, H.F., Faustino, W.M., de Sa, G.F., Felinto, M.C.,
Santos, R.H.A., 2008. J. Lumin. 128, 190.
Thomann, I., Pinaud, B.A., Chen, Z., Clemens, B.M., Jaramillo, T.F., Brongersma, M.L., 2011.
Nano Lett. 11, 3440.
Timmerman, D., Izeddin, I., Stallinga, P., Yassievich, I.N., Gregorkiewicz, T., 2008. Nat. Phot. 2,
105.
Ting, Chu-Chi, Tsai, C.H., 2009. The optical and electrical properties of Eu(3þ)-Y(3þ) codopedITO transparent conductive electrodes as luminescent solar concentrators. In: Brebbia, C.A.,
Mammoli, A.A. (Eds.), WIT Transactions on Ecology and the Environment: Energy and
Sustainability II121, 79–89.
Handbook on the Physics and Chemistry of Rare Earths278

Trupke, T., Green, M.A., Wurfel, P., 2002a. J. Appl. Phys. 92, 1668.
Trupke, T., Green, M.A., Wurfel, P., 2002b. J. Appl. Phys. 92, 4117.
Trupke, T., Shalav, A., Richards, B.S., Wurfel, P., Green, M.A., 2006. Solar Energy Mater. Solar
Cells 90, 3327.
Turkovic, A., Orel, Z.C., 1997. Solar Energy Mater. Solar Cells 45, 275.
Ueda, J., Tanabe, S., 2009. J. Appl. Phys. 106, Art. Nr. 043101.
van der Ende, B.M., Aarts, L., Meijerink, A., 2009a. Phys. Chem. Chem. Phys. 11, 11081.
van der Ende, B.M., Aarts, L., Meijerink, A., 2009b. Adv. Mater. 21, 3073.
van Sark, W.G.J.H., 2005. Appl. Phys. Lett. 87, Art. Nr. 151117.
van Sark, W.G.J.H., 2008. Thin Solid Films 516, 6808.
van Sark, W.G.J.H., 2013. Renew. En. 49, 207.
van Sark, W.G.J.H., Barnham, K.W.J., Slooff, L.H., Chatten, A.J., Buchtemann, A., Meyer, A.,
McCormack, S.J., Koole, R., Farrell, D.J., Bose, R., Bende, E.E., Burgers, A.R., Budel, T.,
Quilitz, J., Kennedy, M., Meyer, T., Donega, C.D.M., Meijerink, A., Vanmaekelbergh, D.,
2008. Opt. Express 16, 21773.
van Sark, W.G.J.H., Meijerink, A., Schropp, R.E.I., 2010. Proc. SPIE 7772, Art. Nr. 777206.
van Sark, W.G.J.H., de Wild, J., Rath, J.K., Meijerink, A., El Schropp, R., 2013. Nanoscale Res.
Lett. 8, Art. Nr. 81.
van Wijngaarden, J.T., Scheidelaar, S., Vlugt, T.J.H., Reid, M.F., Meijerink, A., 2010. Phys. Rev.
B 81, Art. Nr. 155112.
Vergeer, P., Vlugt, T.J.H., Kox, M.H.F., den Hertog, M.I., van der Eerden, J.P.J.M., Meijerink, A.,
2005. Phys. Rev. B 71, Art. Nr. 014119.
Walter, M.G., Warren, E.L., McKone, J.R., Boettcher, S.W., Mi, Q., Santori, E.A., Lewis, N.S.,
2010. Chem. Rev. 110, 6446.
Wang, C., Chen, Y., 2011. Solar cell with fluorescent powder, Pat. Nr. CN 202004034 U.
Wang, L., Li, Y., 2006. Nano Lett. 6, 1645.
Wang, Q., Li, Y., Yan, X.Z., Rathi, M., Ropp, M., Galipeau, D., Jiang, J.Z., 2008. Appl. Phys.
Lett. 93, Art. Nr. 073303.
Wang, Y.H., Xie, L.C., Zhang, H.J., 2009. J. Appl. Phys. 105, Art. Nr. 023528.
Wang, X., Yang, Y., Fan, R., Jiang, Z., 2010. New J. Chem. 34, 2599.
Wang, G., Peng, Q., Li, Y., 2011a. Acc. Chem. Res. 44, 322.
Wang, H.Q., Batentschuk, M., Osvet, A., Pinna, L., Brabec, C.J., 2011b. Adv. Mater. 23, 2675.
Wang, T., Zhang, J., Ma, W., Luo, Y., Wang, L., Hu, Z., Wu, W., Wang, X., Zou, G., Zhang, Q.,
2011c. Solar Energy 85, 2571.
Wang, X., Wang, T., Tian, X., Wang, L., Wu, W., Luo, Y., Zhang, Q., 2011d. Solar Energy 85,
2179.
Wang, C., Xu, L., Li, X., Lin, Q., 2012a. Chemphyschem 13, 3765.
Wang, H.Q., Stubhan, T., Osvet, A., Litzov, I., Brabec, C.J., 2012b. Solar Energy Mater. Solar
Cells 105, 196.
Wang, J.L., Wu, J.H., Lin, J.M., Huang, M.L., Huang, Y.F., Lan, Z., Xiao, Y.M., Yue, G.T.,
Yin, S., Sato, T., 2012c. ChemSusChem 5, 1307.
Wang, J., Lin, J., Wu, J., Huang, M., Lan, Z., Chen, Y., Tang, S., Fan, L., Huang, Y., 2012d. Elec-
trochim. Acta 70, 131.
Wang, X., Yang, Y.L., Wang, P., Li, L., Fan, R.Q., Cao, W.W., Yang, B., Wang, H., Liu, J.Y.,
2012e. Dalton Trans. 41, 10619.
Weber, W.H., Lambe, J., 1976. Appl. Optics 15, 2299.
Weber, A.S., Grady, A.M., Koodali, R.T., 2012. Catal. Sci. Technol. 2, 683.
Wegh, R.T., Donker, H., Oskam, K.D., Meijerink, A., 1999. Science 283, 663.
Chapter 261 Lanthanides in Solar Energy Conversion 279

Wehrspohn, R.B., Schweizer, S., 2009. Solar cell assembly with an optically-active glass ceramic,
Pat. Nr. WO 2009033466 A1.
Wikipedia (Engl.), 2012. On line document, http://en.wikipedia.org/wiki/Photovoltaic_system.
Wilson, L.R., Rowan, B.C., Robertson, N., Moudam, O., Jones, A.C., Richards, B.S., 2010. Appl.
Optics 49, 1651.
Wu, J.H., Xie, G.X., Lin, J.M., Lan, Z., Huang,M.L., Huang, Y.F., 2010. J. Power. Sources 195, 6937.
Wu, D.D., Ma, Y.Q., Zhang, X., Qian, S.B., Zheng, G.H., Wu, M.Z., Li, G., Sun, Z.Q., 2012a.
J. Rare Earths 30, 325.
Wu, J.H., Wang, J.L., Lin, J.M., Lan, Z., Tang, Q.W., Huang, M.L., Huang, Y.F., Fan, L.Q.,
Li, Q.B., Tang, Z.Y., 2012b. Adv. Energy Mater. 2, 78.
Wu, J.L., Chen, F.C., Chang, S.H., Tan, K.S., Tuan, H.Y., 2012c. Org. Electron. 13, 2104.
Xiao, L.F., Liu, Y., Tan, S., Feng, X., Xiu, Q., Zhang, L.R., Guo, L.H., Zhang, H.L., Zhong, C.F.,
2010. J. Polym. Sci. Part A: Polym. Chem. 48, 1943 (erratum 3215).
Xie, F., Baker, M.S., Goldys, E.M., 2006. J. Phys. Chem. B 110, 23085.
Xie, L.C., Wang, Y.H., Zhang, H.J., 2009. Appl. Phys. Lett. 94, Art. Nr. 061905.
Xie, G.X., Lin, J.M., Wu, J.H., Lan, Z., Li, Q.H., Xiao, Y.M., Yue, G.T., Yue, H.F., Huang, M.L.,
2011. Chin. Sci. Bull. 56, 96.
Xie, G., Wu, J., Lin, J., Li, Q., Lan, Z., Xiao, Y., Yue, G., Ye, H., Huang, M., 2012a. Energy
Sources. Part A: Recovery Utilization Environ. Eff. 34, 1534.
Xie, G.X., Wei, Y.L., Fan, L.Q., Wu, J.H., 2012b. J. Phys. Conf. Ser. 339, Art. Nr. 012010.
Xu, W.W., Dai, S.Y., Hu, L.H., Liang, L.Y., Wang, K.J., 2006. Chin. Phys. Lett. 23, 2288.
Xue, F.M., Ma, Y., Fu, L.M., Hao, R., Shao, G.S., Tang, M.X., Zhang, J.P., Wang, Y., 2010. Phys.
Chem. Chem. Phys. 12, 3195.
Yablonovitch, E., 1987. Phys. Rev. Lett. 58, 2059.
Yahav, S., Ruhle, S., Greenwald, S., Barad, H.N., Shalom, M., Zaban, A., 2011. J. Phys.
Chem. C 115, 21481.
Yanes, A.C., del-Castillo, J., Mendez-Ramos, J., Rodriguez, V.D., 2011. J. Nanopart. Res. 13,
7295.
Yang, B.B., Zhang, D.D., Lee, S.T., Li, Y.Q., Tang, J.X., 2013. Appl. Phys. Lett. 102, Art Nr.
073301.
Yao, Q.H., Liu, J.F., Peng, Q., Wang, X., Li, Y.D., 2006. Chem. Asian J. 1, 737.
Ye, S., Zhu, B., Luo, J., Chen, J.X., Lakshminarayana, G., Qiu, J.R., 2008a. Opt. Express 16,
8989.
Ye, S., Zhu, B., Luo, J., Teng, Y., Chen, J.X., Lakshminarayana, G., Qian, G.D., Qiu, J.R., 2008b.
Appl. Phys. Lett. 93, 181110–181111.
Ye, S., Jiang, N., He, F., Liu, X., Zhu, B., Teng, Y., Qiu, J.R., 2010. Opt. Express 18, 639.
Yella, A., Lee, H.W., Tsao, H.N., Yi, C.Y., Chandiran, A.K., Nazeeruddin, M.K., Diau, E.W.G.,
Yeh, C.Y., Zakeeruddin, S.M., Gratzel, M., 2011. Science 334, 629.
Yeo, J.H., Im, S.H., Mandal, T.N., Lim, C.S., Chang, J.A., Lee, Y.H., Kim, H.J., Sarkar, A.,
Nazeeruddin, Md.K., Gratzel, M., Seok, S.I., 2013. Nat. Photon. 7, 486.
Yi, G.S., Chow, G.M., 2007. Chem. Mater. 19, 341.
Yu, D.C., Huang, X.Y., Ye, S., Peng, M.Y., Zhang, Q.Y., 2012a. Solar Energy Mater. Solar Cells
101, 303.
Yu, H., Xue, B.F., Liu, P.R., Qiu, J.X., Wen, W., Zhang, S.Q., Zhao, H.J., 2012b. ACS Appl.
Mater. Interface 4, 1289.
Yu, H., Bai, Y., Zong, X., Tang, F., Lu, G.Q.M., Wang, L., 2012c. Chem. Commun. 48, 7386.
Yuan, C., Chen, G., Prasad, P.N., Ohulchanskyy, T.Y., Ning, Z., Tian, H., Sun, L., Agren, H.,
2012. J. Mater. Chem. 22, 16709.
Handbook on the Physics and Chemistry of Rare Earths280

Zalas, M., Klein, M., 2012. Int. J. Photoenergy 2012, Art. Nr. 927407.
Zalas, M., Walkowiak, M., Schroeder, G., 2011. J. Rare Earths 29, 783.
Zeng, Q.G., Ding, Z.J., Zhang, Z.M., 2006. J. Lumin. 118, 301.
Zhang, Y., 2012. Solar cell efficiently using solar infrared and visible light to generate power, Pat.
Nr. CN 102646743 A.
Zhang, Q.Y., Yang, C.H., Pan, Y.X., 2007. Appl. Phys. Lett. 90, Art. Nr. 021107.
Zhang, Q., Wang, J., Zhang, G., Su, Q., 2009. J. Mater. Chem. 19, 7088.
Zhang, J., Zhao, Z., Wang, X., Yu, T., Guan, J., Yu, Z., Li, Z., Zou, Z., 2010a. J. Phys. Chem. C
114, 18396.
Zhang, X.D., Jin, X., Wang, D.F., Xiong, S.Z., Geng, X.H., Zhao, Y., 2010b. Phys. Status Solidi
(c) 7, 1128.
Zhang, J., Peng, W., Chen, Z., Chen, H., Han, L., 2012a. J. Phys. Chem. C 116, 19182.
Zhang, L., Tian, Q., Xu, W., Kuang, X., Hu, J., Zhu, M., Liu, J., Chen, Z., 2012b. J. Mater. Chem.
22, 18156.
Zhang, Q., Myers, D., Lan, J., Jenekhe, S.A., Cao, G., 2012c. Phys. Chem. Chem. Phys. 14,
14982.
Zhang, Y., Liu, Y., Liu, J., 2012d. Solar cell having microcrystalline silicon intrinsic layer and
high photoelectric conversion efficiency, Pat. Nr. CN 102479834.
Zhang, Y., Liu, Y., Liu, J., 2012e. Solar cell with high photoelectric conversion efficiency and
capable of adjusting amount of transmitting light, Pat. Nr. CN 102479833 A.
Zhang, Y., Mei, C., Liu, J., 2012f. Solar cell having high- and low-temperature amorphous silicon
intrinsic layers and high photoelectric conversion efficiency, Pat. Nr. CN 102479836 A.
Zhang, Y., Mei, C., Liu, J., 2012g. Solar cell with high photoelectric conversion efficiency, Pat.
Nr. CN 102479832 A.
Zhang, J., Shen, H., Guo, W., Wang, S., Zhu, C., Xue, F., Hou, J., Su, H., Yuan, Z., 2013.
J. Power. Sources 226, 47.
Zhao, Y., Li, X., Li, Q., Deng, C., 2011. J. Mater. Chem. Technol. 27, 764.
Zhong, L., Luu, Q.A., Paudel, H.P., Bayat, K., Baroughi, M.F., May, P.S., Smith, S., 2011. MRS
Online Proc. Library 1342, v04.
Zhou, J.J., Zhuang, Y.X., Ye, S., Teng, Y., Lin, G., Zhu, B., Xie, J.H., Qiu, J.R., 2009. Appl. Phys.
Lett. 95, Art. Nr. 141101.
Zhou, J.J., Teng, Y., Liu, X.F., Ye, S., Xu, X.Q., Ma, Z.J., Qiu, J.R., 2010a. Opt. Express 18,
21663.
Zhou, J.J., Teng, Y., Ye, S., Liu, X.F., Qiu, J.R., 2010b. Opt. Mater. 33, 153.
Zhou, J., Teng, Y., Liu, X., Ye, S., Ma, Z., Qiu, J., 2010c. Phys. Chem. Chem. Phys. 12,
13759.
Zhou, J., Teng, Y., Ye, S., Zhuang, Y., Qiu, J., 2010d. Chem. Phys. Lett. 486, 116.
Zhou, M., Huang, J., Wang, L., 2011. Light focusing device and manufacturing method thereof,
and solar cell system comprising the condensing device, Pat. Nr. CN 102253481 A.
Zhou, J.J., Teng, Y., Ye, S., Lin, G., Qiu, J.R., 2012. Opt. Mater. 34, 901.
Zhu, G., Wang, X., Li, H., Pan, L., Sun, H., Liu, X., Lv, T., Sun, Z., 2012. Chem. Commun. 48,
958.
Zou, W.Q., Visser, C., Maduro, J.A., Pshenichnikov, M.S., Hummelen, J.C., 2012. Nat. Phot. 6,
560.
Zucchi, G., Murugesan, V., Tondelier, D., Aldakov, D., Jeon, T., Yang, F., Thuery, P.,
Ephritikhine, M., Geffroy, B., 2011. Inorg. Chem. 50, 4851.
Chapter 261 Lanthanides in Solar Energy Conversion 281

This page intentionally left blank

Chapter 262
R5T4 Compounds: AnExtraordinary Versatile ModelSystem for the Solid StateScience
Yaroslav Mudryk*, Vitalij K. Pecharsky*,{ and Karl A. Gschneidner, Jr.*,{*Ames Laboratory US DOE, Iowa State University, Ames, Iowa, USA{Department of Materials Science and Engineering, Iowa State University, Ames, Iowa, USA
Chapter Outline1. Introduction 284
2. Crystallography 285
3. Gd5SixGe4�x Pseudobinary
System 304
3.1. Phase Equilibria 307
3.2. Magnetic Properties,
Magnetocaloric Effect, and
First-Order Transitions 313
3.3. Anomalous Electrical
Resistivity and
Magnetoresistance 328
3.4. Linear Thermal Expansion
Studies and
Magnetostriction 332
3.5. Thermoelectricity and
Spontaneous Generation
of Voltage 335
3.6. Kinetics of
Magnetostructural
Transitions in
Gd5SixGe4�x 337
3.7. Pressure Effects 345
3.8. Magnetocrystalline
Anisotropy 349
3.9. Short-Range
Correlations 352
3.10. Targeted Chemical
Modification
of Gd5Ge4 354
3.11. Microstructure and
Formation of Thin
Plates 355
3.12. Spectroscopy 357
3.13. First-Principles
Calculations 359
3.14. Miscellaneous 362
4. Other R5SixGe4�x Systems 363
4.1. Y5SixGe4�x 363
4.2. La5SixGe4�x 365
4.3. Ce5SixGe4�x 367
4.4. Pr5SixGe4�x 368
4.5. Nd5SixGe4�x 372
4.6. Sm5SixGe4�x 376
4.7. Tb5SixGe4�x 378
Handbook on the Physics and Chemistry of Rare Earths, Vol. 44.
http://dx.doi.org/10.1016/B978-0-444-62711-7.00262-0
Copyright © 2014 Elsevier B.V. All rights reserved. 283

4.8. Dy5SixGe4�x 394
4.9. Ho5SixGe4�x 396
4.10. Er5SixGe4�x 399
4.11. Tm5SixGe4�x 406
4.12. Yb5SixGe4�x 406
4.13. Lu5SixGe4�x 408
5. R5T4 Systems: Substitutions
of the Rare Earths 408
5.1. (R0xR1�x)5T4 Systems with
T¼Si, Ge 409
5.2. (R1�xMx)5T4: Substitutions
of R Sites by non-R
Elements 416
6. R5T4 Systems Containing Sn 419
6.1. R5Sn4 Compounds 420
6.2. R5SnxSi4�x Systems 423
6.3. R5SnxGe4�x 425
7. R5T4 Systems where T Includes
a Group 13 or 15 Element 425
7.1. Substitutions by Ga 426
7.2. Substitutions by Sb 428
7.3. Other Elements (Bi, P,
and Pb) 431
8. Conclusions and Outlook 432
1. INTRODUCTION
With the exception of the compounds of 4f elements with 3d magnetic transi-
tion metals (Fe, Co, Ni), which are in the spotlight due to their useful mag-
netic (e.g., Nd2Fe14B and SmCo5 magnets, Tb�0.3Dy�0.7Fe2, also known as
Terfenol-D) and hydrogen absorption properties (LaNi5-based alloys for
nickel–metal–hydride rechargeable batteries), vast majority of rare earths
intermetallic compounds remain an extended family of materials with a rich
basic science but little potential for applications. Intermetallic compounds
formed by rare earth metals with group 14 elements were among those that
were nearly exclusively studied for their interesting fundamental science.
The study of the Gd5SixGe4�x system and discovery of other rare earth-based
systems with 5:4 stoichiometries substantially changed the status quo. Soon
after the giant magnetocaloric effect (GMCE) was reported in Gd5Si2Ge2 in
1997 (Pecharsky and Gschneidner, 1997a), a number of other, both fundamen-
tally interesting and potentially useful phenomena have been discovered in the
R5T4 alloys, where R is the rare earth element and T is a p-element from
groups 13, 14, and/or 15 of the periodic table. Among those are colossal
magnetostriction, spontaneous generation of voltage, pressure enhancement
of magnetocaloric effect, unconventional magnetic glass state, spin-flop
transition, magnetic deflagration, short-range order magnetic correlations
(Griffiths-like phase), and this list is incomplete since science of the R5T4
materials remains an active field. Several brief reviews containing informa-
tion about both chemistry and physics of these extraordinarily interesting
compounds have been already published (Miller, 2006; Mudryk et al., 2011;
Pecharsky and Gschneidner, 2005, 2007), but a comprehensive review cover-
ing most of the available science of these materials is lacking.
Handbook on the Physics and Chemistry of Rare Earths284

In addition to rich physics, R5T4 compounds are known for their versatile
and interesting structural chemistry. The overall 5:4 molar ratio of f metals to
p elements in these compounds is quite stable, and no statistically significant
deviations from the 5:4 stoichiometry have been reported. When one of
the components is taken in excess, it is mainly done to compensate for the
excessive weight loss of that component due to evaporation (usually R, but
sometimes T) during alloy preparation, but the resulting intermetallic phase
maintains the 5:4 stoichiometry. For example, one can prepare single-phase
Er5Si4 compound by starting at the Er5.05Si4 composition, but this does not
mean the existence of measurable homogeneity region based of Er5Si4.
On the other hand, the R5T4 phases form a great variety of solid solutions, and
a large number of studies reporting the pseudobinary R5T4 systems have been
published. For the most part, the substitutions have been performed on the T side,
for example, Si was substituted for Ge, Ge for Sb, etc. With a few exceptions
(i.e., Yb5Si4–Yb5Ge4 or Lu5Si4–Lu5Ge4 systems), these solid solutions are lim-
ited: the binary end members have different crystal structures, and quite often
an intermediate ternary compound is formed with a closely related crystal struc-
ture but unique and interesting properties. Pressure-, temperature-, and magnetic-
field-dependent polymorphism is a common structural phenomenon observed in
these systems in both binary and intermediate ternary compounds. It is well
documented that high-temperature annealing can also affect the crystallography
of intermetallic compounds, and in some systems heat-treated and as-cast phase
diagrams of pseudobinary R5T4 systems are substantially different.
Given the fact that the R5T4 compounds have been discovered with all rare
earth elements except Eu (Eu5As4 is an exception but neither the silicide nor
the germanide form at the 5:4 stoichiometry) and Pm (not studied), a large
range of solid solutions can be created by substitutions on the R side. Such
systems are less studied than those with p-element substitutions of the T
atoms, in part because most of them are expected to be continuous solid solu-
tion systems (at least, at room temperature). For example, no intermediate
phase is expected to form in the Gd5Si4-Tb5Si4 pseudobinary system, because
both Gd5Si4 and Tb5Si4 belong to the same structure type. The ground state of
the alloys in these systems, however, may be different from their room tem-
perature structure. The alloys formed by two or more rare earth elements that
have opposite signs of their second-order Stevens parameters (Stevens, 1952)
may be of particular interest in this regard.
This chapter is focused on the composition–structure–property relation-
ships in pseudobinary R5T4 systems as they are known to date, covering most
of the available literature through the end of 2012.
2. CRYSTALLOGRAPHY
The R5T4 compounds were discovered in 1966, when G.S. Smith, A.G. Tharp,
and Q. Johnson (Smith et al., 1966) published a short note reporting
Chapter 262 R5T4 Compounds 285

compositions and lattice parameters of six germanides and three silicides with
the 5:4 stoichiometry. A detailed investigation of the crystal structure of
samarium germanide, Sm5Ge4, performed using single-crystal X-ray diffrac-
tometry quickly followed (Smith et al., 1967a). This compound, as well as
other 12 rare earth germanides with the 5:4 stoichiometry (Smith et al.,
1967b), was found to crystallize in its own unique crystal structure with space
group Pnma and a relatively large unit cell (unit cell volume varies from 796
for Lu5Ge4 to 1019 A3 for La5Ge4) containing a total 20 rare earth and 16 ger-
manium atoms distributed among 6 crystallographic sites. The alloys with Eu,
Yb, and Pm were not studied at that time. The crystal structures of the rare
earths silicides with 5:4 compositions were also reported but the situation here
is more complex. Out of eleven reported R5Si4 compounds (Ho5Si4 and
Tm5Si4 were not reported), four, formed by light lanthanides La, Ce, Nd,
and Pr, crystallize in the tetragonal Zr5Si4 type. Six compounds (R¼Sm,
Gd, Tb, Dy, Er, and Y) are characterized by an orthorhombic unit cell similar
to the one adopted by the related germanides (i.e., Sm5Ge4 type).
Nearly simultaneously, Holtzberg et al. (1967) published a study on R5T4
compounds where they argued that germanides and silicides are not iso-
structural even though they adopt the same space group symmetry and have
similar lattice parameters, which was later confirmed by Iglesias and Steinfink
(1972). At that time, Lu5Si4 compound was thought to be a special case crys-
tallizing in a monoclinic crystal structure with space group symmetry P21/a,which is considered a simple distortion of the Sm5Ge4 type with g¼92.1�
(Smith et al., 1967b).
The layered structure of Sm5Ge4 was first analyzed by Smith et al.
(1967a), who described it as a stacking of three types of atomic networks
(layers) along the b-axis (the longest axis of the unit cell). They identified
(i) layer G containing Ge atoms only, (ii) layer S containing samarium atoms,
and (iii) layer C—a combination of both types of atoms (Figs. 1–3). The
layers are grouped as -GSCSG- (G, germanium layer; S, samarium layer;
and C, combined germanium–samarium layer) blocks, and this sequence
is being repeated along the b-axis. The importance of these five-layer
blocks (or slabs), which are essentially two-dimensional assemblies of atoms
because their extent in the ac-plane is much greater (i.e., they are infinite in
the ac-plane assuming an ideal crystal) than their thickness along the b-axis(1/2 of the unit cell dimension b, or approximately 0.7 nm), was not realized
until systematic studies of the physical behaviors of these materials started in
the late 1990s. The layers G and S are similar to those found in the tetragonal
CuAl2–C16 type, while the networks of C and S types occur in the U3Si2 type
of structure. Therefore, in a formal sense, the Sm5Ge4-type structure
is a hybrid of the CuAl2 and U3Si2 networks, as was pointed out by Smith
et al. (1967a).
The lattice parameters and atomic positions of Sm5Ge4 are summarized
in Table 1. Six (three rare earths and three Ge) nonequivalent atomic
Handbook on the Physics and Chemistry of Rare Earths286

positions combine 36 atoms in one unit cell, resulting in Z¼4. The coordi-
nates of atoms listed in Table 1 are taken from a recent study by Ahn et al.
(2007) (X-ray powder diffraction method); they differ insignificantly from
those reported first by Smith et al. (1967a) (X-ray single crystal diffraction
method).
The study by Holtzberg et al. (1967) was mainly focused on the physical
properties of newly discovered R5T4 compounds; however, it also provided
new insight into crystallography of this series of alloys. Their study was per-
formed on the R5Si4 and R5Ge4 binary compositions containing heavy
FIGURE 1 Crystal structure of Sm5Ge4. Large spheres represent rare earth (R) atoms; small
spheres represent Ge (T) atoms. The shaded area highlights the slab that consists of five atomic
layers or networks. Atom connectivity is shown for clarity and does not represent actual chemical
bonds.
FIGURE 2 Projection of the slab along the b-axis. Only S and C layers are shown for clarity.
The highlighted areas represent main building blocks of the slab (distorted cubes and trigonal
prisms connected via rectangular faces) and are not the actual polyhedra.
Chapter 262 R5T4 Compounds 287

FIGURE 3 Expanded view of atomic networks (layers) of the R5T4 layered compounds. Large
spheres represent rare earth atoms; small spheres represent T atoms. The T–T distances of the
G layer are too long for direct bonding and are shown for clarity of presentation only.
TABLE 1 Atomic Coordinates of the Prototype Sm5Ge4-Type Crystal
Structure
Atom Wycoff position x/a y/b z/c
Sm1 4(c) 0.2909 ¼ 0.0011
Sm2 8(d) �0.0187 0.1000 0.1862
Sm3 8(d) 0.3808 0.8853 0.1647
Ge1 4(c) 0.178 ¼ 0.362
Ge2 4(c) 0.929 ¼ 0.905
Ge3 8(d) 0.222 0.952 0.474
The X-ray powder diffraction data used in the Rietveld refinement were collected at ambientconditions. The space group is Pnma (no. 62), and the lattice parameters are: a¼7.7726(6) A,b¼14.947(1) A, and c¼7.8611(6) A.After Ahn et al. (2007).
Handbook on the Physics and Chemistry of Rare Earths288
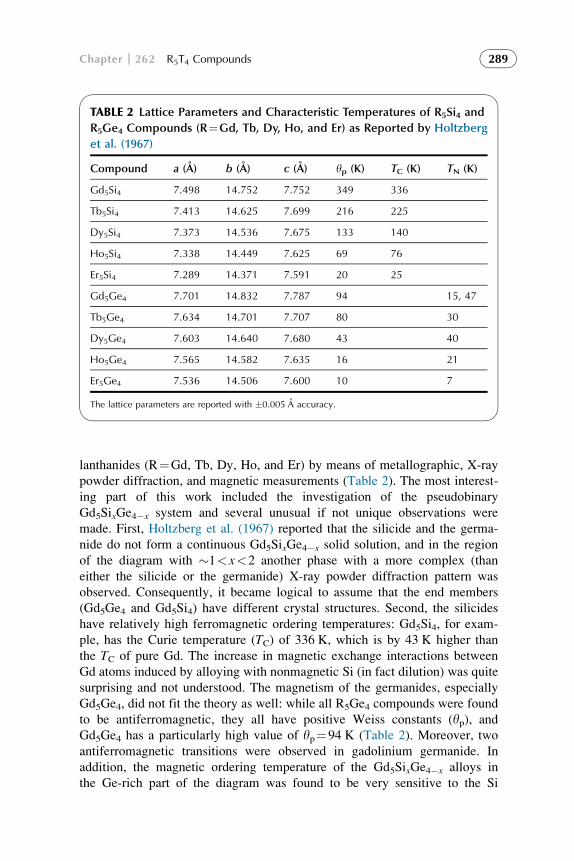
lanthanides (R¼Gd, Tb, Dy, Ho, and Er) by means of metallographic, X-ray
powder diffraction, and magnetic measurements (Table 2). The most interest-
ing part of this work included the investigation of the pseudobinary
Gd5SixGe4�x system and several unusual if not unique observations were
made. First, Holtzberg et al. (1967) reported that the silicide and the germa-
nide do not form a continuous Gd5SixGe4�x solid solution, and in the region
of the diagram with �1<x<2 another phase with a more complex (than
either the silicide or the germanide) X-ray powder diffraction pattern was
observed. Consequently, it became logical to assume that the end members
(Gd5Ge4 and Gd5Si4) have different crystal structures. Second, the silicides
have relatively high ferromagnetic ordering temperatures: Gd5Si4, for exam-
ple, has the Curie temperature (TC) of 336 K, which is by 43 K higher than
the TC of pure Gd. The increase in magnetic exchange interactions between
Gd atoms induced by alloying with nonmagnetic Si (in fact dilution) was quite
surprising and not understood. The magnetism of the germanides, especially
Gd5Ge4, did not fit the theory as well: while all R5Ge4 compounds were found
to be antiferromagnetic, they all have positive Weiss constants (yp), and
Gd5Ge4 has a particularly high value of yp¼94 K (Table 2). Moreover, two
antiferromagnetic transitions were observed in gadolinium germanide. In
addition, the magnetic ordering temperature of the Gd5SixGe4�x alloys in
the Ge-rich part of the diagram was found to be very sensitive to the Si
TABLE 2 Lattice Parameters and Characteristic Temperatures of R5Si4 and
R5Ge4 Compounds (R¼Gd, Tb, Dy, Ho, and Er) as Reported by Holtzberg
et al. (1967)
Compound a (A) b (A) c (A) yp (K) TC (K) TN (K)
Gd5Si4 7.498 14.752 7.752 349 336
Tb5Si4 7.413 14.625 7.699 216 225
Dy5Si4 7.373 14.536 7.675 133 140
Ho5Si4 7.338 14.449 7.625 69 76
Er5Si4 7.289 14.371 7.591 20 25
Gd5Ge4 7.701 14.832 7.787 94 15, 47
Tb5Ge4 7.634 14.701 7.707 80 30
Dy5Ge4 7.603 14.640 7.680 43 40
Ho5Ge4 7.565 14.582 7.635 16 21
Er5Ge4 7.536 14.506 7.600 10 7
The lattice parameters are reported with �0.005 A accuracy.
Chapter 262 R5T4 Compounds 289
content (the Gd5SixGe4�x system will be discussed in detail later). The
reported antiferromagnetic ordering temperatures (TN) of other R5Ge4 phases
were also a bit unusual—in particular, the high TN of Dy5Ge4 compared to the
other R5Ge4 compounds.
Even though a number of interesting features was observed in R5T4 com-
pounds, especially in the Gd5SixGe4�x system, this family of compounds did
not attract much attention of researchers over the next three decades. It is fair
to say that no significant effort directed toward a systematic investigation of
the R5T4 compounds existed before the discovery of the giant magnetocaloric
effect in Gd5Si2Ge2 by Pecharsky and Gschneidner (1997a). The research on
5:4 systems exploded in the twenty-first century, and nearly 400 papers (the
prevailing majority of them in the peer-reviewed literature) devoted to the
investigation of R5T4 compounds have been published so far. While it is
nearly impossible to cover all of this research in this chapter, the important
structural features and physical properties of these interesting intermetallic
compounds are systematically reviewed below. It is important to note that
both the properties and structure of these compounds are extremely sensitive
to the purity of starting materials, particularly rare earths, and sometimes even
very careful research efforts performed in the best research labs do not really
report intrinsic properties of an alloy being examined. Many published results
should be carefully scrutinized, especially when purity of starting elements
used for the sample preparation is either “commercial grade 99.9% pure rare
earth metal” or not reported in the corresponding article.
Structurally, the R5T4 compounds can be separated in two major groups:
compounds formed by slabs, or layered, and compounds without the slabs,
or nonlayered. The nonlayered group mainly constitutes the compounds of
light lanthanide elements with group 14 elements and is essentially limited
to the Zr5Si4 type of crystal structure. The term “nonlayered” should not be
taken literally, of course, because practically all intermetallic structures can
be represented as a stacking of various atomic nets. However, in case of
R5T4 compounds the typical layer is not a single atomic net, but a group of
five nets stacked on top of each other (Fig. 3). Such group is commonly called
a “slab,” and this slab substructure repeats itself along the longest (b) axis ofthe unit cell. The R5T4 compounds without the slabs will be called “non-
layered,” and those that contain the slabs will be referred to as “layered”
(strictly speaking, the names “slab” and “nonslab” structures would be more
appropriate but we will use the definitions commonly used in literature). Sev-
eral different layered structures have been reported to exist in the R5T4 series
of compounds, and one can safely predict that a few others may be found in
the future.
The first 5:4 layered crystal structure was discovered by Smith et al.
(1967a) in the Sm5Ge4 compound. The -GSCSG- sequence of atomic nets is
a hybrid combination of the atomic networks characteristic for the CuAl2and U3Si2 types of crystal structure. Essentially, this -GSCSG- sequence, or
Handbook on the Physics and Chemistry of Rare Earths290

slab, may be considered as a separate structural entity because, as shown in
many studies, it is well preserved in a number of related crystal structure types
and practically does not change during the massive crystallographic transfor-
mations that are typical among R5T4 compounds (Pecharsky and Gschneidner,
2001). One may argue that such extraordinary stability of these slabs is one of
the reasons why R5T4 systems experience these transitions in the first place—
the slabs resist any deformations (with a few exceptions) and the relative
movements of the slabs with respect to each other remains the only structural
degree of freedom that is allowed to change with the change of the external
stimuli, such as temperature, hydrostatic pressure, shear stress, and magnetic
field. The nature of such extraordinary slab stability in the absence of strong
covalent bonding (the prevailing bonding mechanism in R5T4 is indeed metal-
lic) is not fully understood at this point. However, it is in the origin of many
interesting phenomena observed in the R5T4 compounds and the slab structure
is a key to their understanding.
In the R5T4-related literature, there are often referrals to the interslab/
intraslab T atoms and bond distances. Sometimes they are also called
interlayer/intralayer distances, when the whole GSCSG sequence is consid-
ered as one layer. This ambiguity in the definition of a “layer” is, unfortu-
nately, well rooted now in the R5T4 literature reflecting the peculiarity of
the crystal structure of these compounds. The “inner” C net atoms (both rare
earths and T) are always considered as intra-, while the T atoms from the
“outer” G net are considered interslab. The atomic bonds connecting G–Glayers from the neighboring slabs are typically called interslab TdT bonds,
and their length is, probably, the most important crystallographic parameter
of the layered structures indicative of both crystallographic and physical
nature of the R5T4 compounds.
The rare earth atoms from the S net can form intraslab bonds with the
atoms from the C and G nets of the same slab or interslab bonds with
the atoms of S and G nets from the neighboring slabs. Given that most rare
earth atoms are located in the S net, one may expect that the bonds connecting
this atomic net with other atoms are most important in determining the mag-
netic behavior of R5T4 compounds. Somehow surprisingly, no clear correla-
tion between S–S bond length and magnetism has been found; moreover,
the S atoms were found to be less relevant in determining the magnetic ground
state of compounds compared to the rare earth atoms from the C net and T
atoms from the G net.
Coordination polyhedra of atoms in the Sm5Ge4 structure are shown in
Fig. 4. Only the shorter (<3.9 A) R–R distances are taken into account while
plotting the polyhedra for atoms Sm2 and Sm3. It is easy to note that Sm2 and
Sm3 polyhedra are almost identical and so are the polyhedra for the Ge1 and
Ge2. It is also clear that the coordination environment of the intraslab atoms
(C network, Sm1, Ge1, and Ge2) is more symmetrical compared to the atoms
from the outer S and G networks.
Chapter 262 R5T4 Compounds 291

Based on the study of the Gd5Si4–Gd5Ge4 pseudobinary system Holtzberg
et al. (1967) suggested that 5:4 germanides and silicides do not share the same
type of crystal structure, because they do not form a continuous solid solution
and there is an additional intermediate phase with different crystal structure
in the middle region of the Gd5Si4–Gd5Ge4 phase diagram. Iglesias and
Steinfink (1972) calculated the crystal structure of Gd5Si4 using the X-ray
single crystal diffraction method and found that despite its strong similarity to
the germanides its crystal structure differs from the one of Sm5Ge4. Pecharsky
and Gschneidner (1997d), and numerous studies published afterward confirmed
that the Gd5Si4 and alloys from Gd5Si4 side of the quasibinary Gd5Si4–Gd5Ge4phase diagram indeed adopt crystal structure that is different from the one of
the Gd5Ge4 and Gd5Ge4-based alloys, which crystallize in the original
Sm5Ge4-type structure. The analyses of many parameters such as bond lengths,
lattice parameters, electronic structure, magnetic ground state, etc. confirm the
individuality of the Gd5Si4 type. For example, as pointed out by Iglesias and
Steinfink (1972), the coordination polyhedron of the interslab Si atom (G net)
has changed from a distorted pentagonal bipyramid, as described for Sm5Ge4,
into a trigonal prism of rare earth atoms with two rectangular faces capped
by another rare earth atom and Si. Contrary, in the Sm5Ge4 type the interslab
Ge atom is not bonded to any other Ge atom. Most decisively, the fact that
these two crystal structures exist and even coexist in the same compound, trans-
forming into each other depending on the external thermodynamic parameters,
indicates that they are two distinct structure types. However, in older handbooks
and papers the compounds with Gd5Si4 type of crystal structure are sometimes
listed with the Sm5Ge4 prototype crystal structure.
It is not at all surprising that compounds with the Gd5Si4 and Sm5Ge4types of structure were sometimes considered to be crystallographically the
same. They have same space group Pnma, very similar lattice parameters
and atomic positions, and occur in similar systems of the related elements
FIGURE 4 Coordination polyhedra of six nonequivalent atomic positions in the Sm5Ge4structure.
Handbook on the Physics and Chemistry of Rare Earths292

such as Si and Ge. As mentioned above, the easiest and, at the same time, the
most reliable way to figure out what type of structure, Gd5Si4 or Sm5Ge4,
exists in a given alloy, is to calculate the interatomic distance between T
atoms belonging to the G net (T atoms occupying the eightfold atomic site).
As shown by Iglesias and Steinfink (1972), Pecharsky and Gschneidner
(1997d), and a number of later research papers (Choe et al., 2000, 2003a,b;
Morellon et al., 2000) this atomic position is mostly affected by the structural
change from Gd5Si4 to Sm5Ge4 structure. If distance between these T atoms
is close to the sum of the T atoms radii, indicating the presence of the
covalent-like bonds, then the Gd5Si4 type is present. If no bonds between
the G networks of the neighboring slabs occur, than most likely (there are a
few exclusions discussed below) the structure type is Sm5Ge4.
These interslab (interlayer) TdT bonds have surprisingly strong influence
of the physical properties and ground states of the R5T4 compounds. Essen-
tially, the magnetism of these compounds is defined by the presence or
absence of atomic bonds that are formed by mainly nonmagnetic elements
like Si and Ge, despite the fact that RKKY exchange interactions are carried
through the metallic RdR bonds (Pecharsky and Gschneidner, 2001). It is
particularly well highlighted during the magnetostructural transitions when
the change in crystal structure is accompanied by the change in magnetic
ordering. For example, Gd5Ge4, which has the Sm5Ge4 structure in the
absence of applied magnetic field, orders antiferromagnetically at 125 K
(Pecharsky and Gschneidner, 1997a,d). Application of a strong enough mag-
netic field at low temperatures not only induces ferromagnetic order in this
compound, but also changes its crystal structure to the Gd5Si4 type with the
interslab GedGe bond distance of 2.7 A (Pecharsky et al., 2003a). The differ-
ence between the two polymorphs of Gd5Ge4 and their powder diffraction pat-
terns are shown in Table 3 and Fig. 5.
The Gd5Si4 structure type is also commonly known as the O(I) type and the
Sm5Ge4 type is often denoted as the O(II) type. Another common structure type
observed in the R5T4 systems is the M phase, or Gd5Si2Ge2 type that adopts
monoclinic P1121/a space group symmetry. The overwhelming majority of
R5T4 compounds adopt one of these three structure types at room temperature.
The occurrence of a monoclinic phase with lattice parameters close to those
of other R5Si4 compounds and a probable space group symmetry P21/a were
reported for Lu5Si4 by Smith et al. (1967b).1 Holtzberg et al. (1967) suggested
the existence of the intermediate phase with a crystal structure different from O
(I) and O(II) in the Gd5SixGe4�x pseudobinary system. Thirty years later,
Pecharsky and Gschneidner (1997b) reported the discovery of the giant magne-
tocaloric effect in Gd5Si2Ge2, and also determined the crystal structure of this
compound (Pecharsky and Gschneidner, 1997a,d). They found that Gd5Si2Ge2
1. A later study by Gschneidner et al. (2000b) showed that Lu5Si4 prepared using high purity Lu
crystallizes in the Gd5Si4 structure type.
Chapter 262 R5T4 Compounds 293

TABLE 3 Crystallographic Parameters of the O(II)-Sm5Ge4 and O(I)-Gd5Si4Structural Polymorphs of the Gd5Ge4 Compound Measured at T¼25 K in
Different Magnetic Fields (H)
O(II)-Gd5Ge4: a¼7.6841(2) A,
b¼14.7839(5) A, c¼7.7639(3) A;
T¼25 K, H¼0 kOe
O(I)-Gd5Ge4: a¼7.5399(3) A,
b¼14.8050(5) A, c¼7.8125(3) A;
T¼25 K, H¼35 kOe
Atom x/a y/b z/c Atom x/a y/b z/c
Gd1 0.2936(5) 0.25 �0.0005(5) Gd1 0.3481(6) 0.25 0.0076(5)
Gd2 �0.0294(2) 0.1013(1) 0.1773(3) Gd2 0.0146(3) 0.0964(1) 0.1843(3)
Gd3 0.3794(3) 0.8830(1) 0.1642(3) Gd3 0.3216(3) 0.8787(1) 0.1757(3)
Ge1 0.1786(8) 0.25 0.3663(9) Ge1 0.2360(9) 0.25 0.3640(9)
Ge2 0.9188(9) 0.25 0.8850(9) Ge2 0.9723(9) 0.25 0.8937(9)
Ge3 0.2186(6) 0.9564(3) 0.4636(6) Ge3 0.1503(9) 0.9568(3) 0.4758(7)
Space group is Pnma for both structures. Gd1, Ge1, and Ge2 atoms form the C network of the slab,Gd2, and Gd3 are parts of the S network, and Ge3 belongs to the G network. The Ge3dGe3 bondsare present in the O(I) structure but not in the O(II) structure.
FIGURE 5 The X-ray powder diffraction patterns of the Gd5Ge4 at 6.1 and 25 K collected dur-
ing increasing (A and C) and decreasing (B and D) magnetic field. The patterns were collected
using Mo Ka radiation.
Handbook on the Physics and Chemistry of Rare Earths294

adopts crystal structure that must be similar to the one reported for Lu5Si4 by
Smith et al. (1967b), with the monoclinic space group P1121/a and lattice para-
meters being intermediate between those for pure germanide and silicide
phases. Each of the eightfold sites of the orthorhombic structures (Table 3)
splits into pairs of nonequivalent fourfold sites in the monoclinic structure. Choe
et al. (2000) performed the X-ray single crystal diffraction study of the
Gd5Si2Ge2 and parameters of the room temperature crystal structure are listed
in Table 4.
The T sites are occupied by a statistical mixture of Si and Ge atoms. It is
easy to notice that the Si/Ge ratio is not the same in all positions. In
Gd5Si2Ge2 structure, the intraslab atomic sites (T1 and T2) have lower con-
centration of germanium, while the interslab sites (T3 and T4) contain more
than 50% of germanium. This preferential occupation tendency is observed
among all Gd5SixGe4�x compounds, regardless of the actual type of crystal
structure (Choe et al., 2003b; Misra and Miller, 2006). In case of the ortho-
rhombic structures, the T3 (eightfold site) is richer in germanium compared
to the fourfold T1 and T2 sites.2 This indicates that the slab structure itself
TABLE 4 Atomic Positions, Occupations, and Equivalent Thermal
Displacement Parameters in the Crystal Structure of Gd5Si2Ge2 at 292 K
Atom x/a y/b z/c Occupancya Ueq., A2
Gd1 0.17534(11) 0.75355(6) 0.50562(11) 1 0.0064(2)
Gd2(2A) 0.01731(11) 0.40100(6) 0.18203(11) 1 0.0077(2)
Gd3(2B) 0.00515(11) 0.90165(6) 0.81942(11) 1 0.0075(2)
Gd4(3A) 0.66997(11) 0.37795(5) 0.82256(11) 1 0.0060(2)
Gd5(3B) 0.35660(10) 0.88136(6) 0.16328(11) 1 0.0064(2)
T1 0.2913(3) 0.74793(19) 0.8691(4) 0.461(7) Ge 0.0074(8)
T2 0.0477(3) 0.7483(2) 0.1082(4) 0.429(7) Ge 0.0090(9)
T3(3A) 0.8460(3) 0.45898(16) 0.5294(3) 0.575(7) Ge 0.0083(8)
T4(3B) 0.2068(3) 0.95794(17) 0.4639(3) 0.570(8) Ge 0.0083(8)
The data are taken from Choe et al. (2000), however, the atom names are changed in accordancewith their relationship to the atomic positions of the orthorhombic structure types reported inTable 1. Space group (SG) is P1121/a, lattice parameters: a¼7.589(2) A, b¼14.827(3) A, c¼7.7862(2) A, g¼93.262(4)�.aAll T sites are fully occupied with Si and Ge atoms. In this table, only Ge occupations are listed; Sioccupations are 1—occupancy (Ge).
2. Note that both Choe et al. (2003b) and Misra and Miller (2006) use different notation for the
interslab and intraslab T atoms.
Chapter 262 R5T4 Compounds 295

prefers the smaller (Si) atoms inside and larger (Ge) atoms on the slab surface.
Since Ge and Si are isoelectronic, it is safe to assume that the atomic positions
of the outer layer of the slab (G net) are located in the atomic environment
that can accommodate larger atoms more freely. This supports the notion that
the intraslab environment is more rigid and resists expansion.
The monoclinic (M) Gd5Si2Ge2 type is often considered as an intermediate
structure between O(I) Gd5Si4 and O(II) Sm5Ge4 types, partially because its
lattice parameters have values intermediate between those of two orthorhom-
bic structures, but mainly because of the interslab bonding. The structure is
constructed from the same 32434 (rare earth atomic networks, S) slabs, butcontrary to the Sm5Ge4 type, where no TdT (Ge3–Ge3) interslab bonding
exists, and the Gd5Si4 type, where all interslab T atoms form short TdT
bonds, in the Gd5Si2Ge2 structure 50% percent of the interslab T atoms are
connected as short pairs. In Gd5Si2Ge2, the T3–T3 atoms (see Table 4) from
neighboring slabs are connected (dT3�T3¼2.614 A) while the T4–T4 atoms
are not—dT4�T4¼3.488 A (Choe et al., 2000). When the monoclinic structure
transforms into the O(I) Gd5Si4 through massive shear movements of the slabs
along the a-direction, the T4–T4 atoms reconnect and the nonequivalent four-
fold T3 and T4 positions of the M structure become the same eightfold T3
position of the O(I) structure. Interestingly, no breaking of the monoclinic
T3dT3 bonds that would result in the transition from the M phase into the
O(II) Sm5Ge4-type phase has been reported so far. Also, the polymorphic
transformation involving the O(II) structure rarely results in the partial forma-
tion of the T–T dimers and occurrence of the Gd5Si2Ge2 structure. Instead, the
O(I) structure is often the end result of such transformation, except for a few
nonconventional cases, when crystallographic transformations typical for a
particular chemical composition only occur.
Figure 6 schematically illustrates the crystallographic relationships between
the O(II), O(I), and M structures. The O(I) phase may transform into either
O(II) or M phase by breaking all or half of the interslab TdT bonds, respec-
tively. It is important to note that the interslab surfaces with or without T–T
dimers alternate along the b-axis, creating the monoclinic distortion. There is
a clear correlation between the crystal structure type and magnetic properties
of R5T4 compounds (Morellon et al., 1998a; Pecharsky and Gschneidner,
1997d, 2001; Rao, 2000).
Application of the Zintl–Klemm formalism to these crystal structures reveals
another interesting tendency—change of the electron concentration depending on
the presence of the TdT bonds (Choe et al., 2000, 2003a). Indeed, when Gd
atoms are considered as 3þ ions and group 14 elements as 4� ions, then the
charge-balanced formula of the Gd5Si4 compound can be written as
Gd3þ� �
5T2
6�� �23e�ð Þ
h iwith three electrons assigned to the conduction band,
because all Si(T) atoms in this structure form covalently bonded T2 dimers each
using one electron for such chemical bonding. When some of these bonds are
Handbook on the Physics and Chemistry of Rare Earths296

broken, the dimers change into a pair of T4� monomers. Therefore, for the
Gd5Si2Ge2, the charge-balanced formula is Gd3þ� �
5T2
6�� �1:5
T4�� �2e�ð Þ
h i,
and for the Gd5Ge4� Gd3þ� �
5T2
6�� �T4�� �
21e�ð Þ
h i. As a result, the number
of electrons potentially associated with the conduction band drops indicating
possible changes in physical properties. It would be fair to admit that
this approach oversimplifies complex chemical and magnetic interactions
occurring in the R5T4 systems, and, obviously, does not take into account
crystallographic changes induced by the variation of external thermodynamic
parameters, such as temperature, hydrostatic pressure, and magnetic field.
However, it became useful in analyses of the effect of tetravalent element
substitutions by, for example, trivalent elements like Ga on the crystal structure
of R5T4 alloys (Mozharivskyj et al., 2003).
One intrinsic structural feature of the monoclinic phase, which was not
observed in either of the orthorhombic structures, is the intrinsic presence of
the nonmerohedral twinning. The original X-ray single crystal diffraction
study of the Gd5Si2Ge2 (Choe et al., 2000) showed a considerable number
of Bragg reflections with noninterger indices, all multiples of 1/9, along the
b-axis only. The nonmerohedral twinning for which only a small fraction of
reflections from two twin components superimpose, while the rest (majority)
of the reflections remain separate, was indeed found to be very common in
compounds with the M-type crystal structure, for example, in Gd5Si1.5Ge2.5(Choe et al., 2003a). The microstructural investigation of Gd5Si2Ge2 by
Meyers et al. (2002a) revealed a twin law, which transforms one twin compo-
nent into the other, as follows:
FIGURE 6 The schematic of relationships between main crystallographic types observed in the
Gd5(SixGe4�x) system (Pecharsky and Gschneidner, 2001). From left to right: O(II)-Sm5Ge4 type
with all inteslab TdT bonds “broken,” O(I)-Gd5Si4 type with all TdT interslab bonds present,
and M-Gd5Si2Ge2 type with half of the interslab TdT bonds formed. The rare earth atoms located
in the corners of the prisms are not shown for clarity.
Chapter 262 R5T4 Compounds 297

a0 ¼ a
b0 ¼ bþa2b
a
0@
1Acosgffi b�0:2229affi b�2
9a
c0 ¼�c
When the monoclinic phase transforms into O(I) phase, for example, via
cooling below the transition temperature, the twinning disappears, but after
the system returns to the previous condition, where M is the stable phase,
the twinning reappears.
While the Gd5Si2Ge2 type may be considered as the intermediate structure
between Gd5Si4 and Sm5Ge4 types, the closet structural relative to these
orthorhombic types was first discovered in Pu–Rh system. Chebotarev and
Beznosikova (1976) reported the existence of the crystal structure very similar
to those of Sm5Ge4 and Gd5Si4 in the Pu5Rh4 and Pu5Ir4 compounds.
Cromer (1977) also analyzed and published the crystal structure of Pu5Rh4, and
the corresponding type of crystal structure was named after this compound. Its
space group, axial dimensions, andWyckoff sites are the same for the three ortho-
rhombic structures and the same -GSCSG- sequence of atomic networks main-
tains the slab structure for the Pu5Rh4. The main difference between these
structure types is in the positional parameters of atoms, particularly in their
locations along the a-axis (i.e., the values of the x parameters, Table 5). Such dif-
ference leads to a slightly different coordination environment with different num-
ber of nearest neighbors and modified interatomic distances. Clearly, from the
crystallographic point of view it is more appropriate to call the Pu5Rh4 as an inter-
mediate structure between Sm5Ge4 and Gd5Si4, even though the monoclinic
structure is often present in the pseudobinary R5T4 diagrams. At the same time,
Mozharivskyj et al. (2003) reported the Pu5Rh4 type of crystal structure in
Gd5GaGe3 alloy, which on the Gd5Ge4–Gd5Ge1.8Ga2.2 pseudobinary phase dia-
gram occupies a middle position between the compounds with O(II) and O(I)
crystal structures (the Gd5GaxGe4�x solid solution is terminated at x>2.2).
The first-principles calculations performed by Paudyal et al. (2010a)
confirm the stability of the Pu5Rh4 structure in the Gd5Ge4-based alloys. It
is more typical, however, for this structure type to be present in the com-
pounds formed by the rare earths elements and the 4d and 5d transition metal
elements; for example, in the R5Pt4 series of intermetallic compounds
(Le Roy et al., 1978). Such compounds are not in the scope of this chapter,
and, therefore, the Pu5Rh4 type will be rarely mentioned. However, it is
important to note that the R5T4 compounds with layered structures are formed
by rare earth elements with many other elements from the periodic table and
the slabs are, indeed, stable structural elements commonly occurring in many
intermetallic compounds.
According to Mozharivskyj et al. (2003), the interslab T3dT3 bond dis-
tances in Pu5Rh4 type indicate that T atoms are connected in this structure sim-
ilar to the O(I) Gd5Si4, which agrees with calculated ferromagnetic type of
Handbook on the Physics and Chemistry of Rare Earths298

exchange interactions in both compounds (Paudyal et al., 2010a). However,
these bonds are also longer: dT3�T3 is 2.93 A in Gd5GaGe3 (Pu5Rh4 type) ver-
sus 2.74 A in Gd5Ga2Ge2 (Gd5Si4 type). This again indicates the intermediate
position of the Pu5Rh4 structure compared to O(II) and O(I) types.
The Pu5Rh4 type of structure has been observed in the R5T4 compounds
when the 14 group element (e.g., Ge) was substituted by the 13 group element
(Ga). With the inclusion of the 15 group element as T element, for example,
with As or Sb, R5T4 compositions tend to crystallize in a more symmetric
crystal structure, which is closely related to Sm5Ge4 and essentially maintains
the same slab structure. The new orthorhombic structure type was originally
reported for Eu5As4 adopting space group symmetry Ccmb with the following
TABLE 5 Comparison of Positional Parameters of R5T4 Orthorhombic
Structures with Space Group Pnma (Cromer, 1977)
Wyckoff position Sm5Ge4 Pu5Rh4 Gd5Si4
R1 x 4c 0.2880 0.322 0.3560
y 0.25 0.25 0.25
z �0.0024 0.11 0.0113
R2 x 8d 0.3795 0.342 0.3164
y 0.6157 0.622 0.6223
z 0.1612 0.162 0.1795
R3 x 8d �0.0253 0.001 0.0289
y 0.3996 0.410 0.4028
z 0.1781 0.180 0.1827
T1 x 4c 0.1761 0.190 0.2411
y 0.25 0.25 0.25
z 0.3667 0.356 0.3746
T2 x 4c 0.4132 0.459 0.4787
y 0.25 0.25 0.25
z 0.6115 0.607 0.5986
T3 x 8d 0.2206 0.194 0.1435
y 0.5449 0.534 0.5395
z 0.4688 0.451 0.4716
Equivalent atoms have been chosen and reordered. The Sm5Ge4 type was reported by Smith et al.(1967a), Gd5Si4 type by Iglesias and Steinfink (1972), and Pu5Rh4 type by Chebotarev andBeznosikova (1976).
Chapter 262 R5T4 Compounds 299

lattice parameters: a¼8.021 A, b¼15.802 A, and c¼8.058 A (Wang et al.,
1978). Two nonequivalent eightfold atomic positions R2 and R3 from the Snetworks are combined into one 16-fold site, and the fourfold intraslab T1
and T2 positions (C network) are also combined into one eightfold site.
Kozlov et al. (2004) reported an ordered superstructure to the Eu5As4 type,
Tm5Si2Sb2, in which antimony atoms occupy interslab T position and silicon
atoms are located intraslab (Table 6). Space group symmetry was determined
as Cmca with lattice parameters a¼14.768 A, b¼7.723 A, c¼7.741 A, and
both the unit cell orientation and the origin of the unit cell are modified com-
pared to the Eu5As4 and other R5T4 slab structures; however, this is essen-
tially the same -GSCSG- slab stacking motif occurring along the longest
axis of the unit cell. There are practically no bonds between Sb atoms mean-
ing that all TdT interslab bonds are “destroyed” in this structure type.
A series of R5Sb2Si2 and R5Sb2Ge2 compounds adopting Tm5Sb2Si2structure type has been reported by Kozlov et al. (2004). Recent work by
Chernyshov et al. (2006) indicates the presence of a limited ternary solid solu-
tion of the Tm5Sb2Si2 structure in the Gd5SbxGe4�x pseudobinary system
indicating that Ge and Sb can form a statistical mixture while occupying the
T sites in the Tm5Sb2Si2 crystal structure. Such mixed occupancy has been
also observed for the alloys with the Sm5Ge4 structure type which exist at
x<2 in the same system. However, even in this structure type there is a
strong tendency for larger Sb atoms to occupy the interslab position only
(Chernyshov et al., 2009). A similar situation occurs in the Gd5SbxSi4�x system
(Svitlyk et al., 2010), where Eu5As4 type of structure was reported at x>2.
Crystallographic analysis shows strong preference of Sb atoms to occupy the
interslab positions and no more than 6% of Sb is accommodated inside the
slabs. Therefore, the solid solution alloys with the Cmca structure are at least
partially ordered superstructures of Eu5As4, and using the Tm5Sb2Si2 type
for the description of their crystal structure may also be an appropriate choice.
References to both structure types can be found in literature.
Apparently, the majority of layered R5T4 compounds crystallize in four major
structure types: O(I)-Gd5Si4, M-Gd5Si2Ge2, O(II)-Sm5Ge4, and Tm5Sb2Si2 (or
TABLE 6 Atomic Positions for the Tm5Sb2Si2 (Kozlov et al., 2004)
Atom Wyckoff cite x/a y/b z/c Ueq, A2�10�3
Tm1 4a 0 0 0 28
Tm2 16g 0.1291 0.1650 0.3355 35
Sb 8d 0.2049 0 0 35
Si 8f 0 0.3608 0.1380 29
Handbook on the Physics and Chemistry of Rare Earths300

Eu5As4). They all have the distinct slab structure, and, apart from space group
symmetry, the main difference between them lays in the presence or absence
of the interslab TdT bonds (Fig. 7). The compounds with Pu5Rh4 structure are
relatively rare among R5T4, even though this structure becomes muchmore com-
mon among R5M4 phases, where M is transition metal.
In addition to the above mentioned structures, there are a few peculiar
cases of the layered (slab) intermetallics when R5T4 alloys either (a) crystal-
lize in their unique structure types at nonambient conditions or (b) adopt other
known structure types at particular chemical compositions.
The low-temperature crystal structure of Ho5Ge4 is an example of the
former case (Singh et al., 2009). The Ho5Ge4 compound adopts the O(II)-
Sm5Ge4 structure at room temperature. The X-ray powder diffraction mea-
surements, which were later confirmed by neutron diffraction experiments
(Ritter et al., 2009), showed that the paramagnetic–antiferromagnetic transi-
tion in Ho5Ge4 at 23 K is accompanied by lattice deformation in the
FIGURE 7 Crystal structure types that are most common in the R5T4 compounds. The large
light spheres indicate positions of the interslab R atoms, while the large dark spheres mark the rest
of the R atoms. Small gray spheres represent T atoms (T¼Si, Ge, Sn, Ga, or Sb). The interslab T–
T distances are the only interslab distances shown.
Chapter 262 R5T4 Compounds 301

crystallographic ac-plane (and not in the ab-plane, see Fig. 7, as in the major-
ity of known cases). The new crystal structure is monoclinic with the P121/m1space group and the monoclinic angle is b¼90.57� (Table 7).
A number of interesting crystal structures has been observed during chem-
ical substitution of the Gd5Si4 phase by Bi. Svitlyk et al. (2009a) reported that
in addition to the Gd5Si4 structure type observed in the Gd5Si3.904Bi0.096, and
Eu5As4 type observed for the Gd5Si2.416Bi1.584 compositions, at higher bis-
muth concentrations new layered crystal structures appear with the unit cell
doubled along the long axis. The slabs are preserved in those structures but
their stacking along the long axis becomes more complicated allowing two
new tetragonal crystal structure types. The Gd5Si1.93Bi2.07 compound crystal-
lizes with the space group I41/acd, and lattice parameters a¼7.9858 A,
c¼30.700 A; Gd5Si1.58Bi2.42 adopts space group P42bc, and has lattice para-
meters a¼8.0296 A, c¼30.883 A. The atomic parameters for these new crys-
tal structures are presented in Table 8.
Another layered crystal structure was observed in the Gd5�xYxGe4 system by
Misra and Miller (2008). Despite the fact that both end members of this pseudo-
binary system crystallize in the Sm5Ge4 structure type, for the composition range
of 3.6�x�4.2 a monoclinic U2Mo3Si4-type structure occurs as a majority phase
(Table 9). This type of structure, which is rarely observed in the R5T4 systems, is
also built by stacking the typical -GSCSG- slabs. Interestingly, the unit cell
volume of this structure is half of the other main structural types containing slabs.
This happens because the longest axis of these types (usually b-axis) is two times
shorter in U2Mo3Si4 type where all lattice dimensions are quite similar to each
other. There are no direct bond distances between the interslab germanium
atoms, which makes it more similar to the orthorhombic O(II)-Sm5Ge4 structure
than to the another monoclinic structure type, M-Gd5Si2Ge2, where half of the
interslab T atoms are connected with each other.
Smith et al. (1966) reported that the crystal structure of Nd5Si4 (Table 10)
was different from the majority of other R5Si4 and R5Ge4 compounds, and
soon after Smith et al. (1967b) found that a few additional R5Si4 compounds
formed by light lanthanide elements (R¼La, Ce, Pr) crystallize in the Zr5Si4tetragonal structure type (Pfeifer and Schubert, 1966). No tetragonal phases
were observed among R5Ge4 compounds (Smith et al., 1967b). Apparently,
as shown by Le Roy et al. (1978), Zr5Si4 type has same structural features
(distorted cubes and trigonal prisms) as layered structure types, for example,
Pu5Rh4, but instead of the whole slabs stacked alternately—an essential fea-
ture of all previously discussed structures—only fragments of the slabs are
arranged alternately. The absence of slabs dictates a substantially different
behavior of Zr5Si4 type compounds when compared to slab-based struc-
tures—the shift of slabs with respect to each other, which typically results
in change of interslab bonding and physical properties in the layered R5T4
compounds, cannot occur in the nonslab phases, and their physics is not as
interesting compared to their layered relatives.
Handbook on the Physics and Chemistry of Rare Earths302

TABLE 7 Crystallographic Data of Ho5Ge4 at 293 and 15 K
T¼293 K; SG Pnma; a¼7.5789(2) A,
b¼14.5876(4) A, c¼7.6478(2) A, b¼90�
T¼15 K, SG P121/m1; a¼7.5661(2) A,
b¼14.5589(3) A, c¼7.6226(2) A, b¼90.572(2)�
Atom x/a y/b z/c Atom x/a y/b z/c
Ho1 �0.0295(2) 0.6001(1) 0.1787(2) Ho1A �0.0328(4) 0.6021(2) 0.1793(4)
Ho1B 0.4691(4) 0.5998(2) 0.3212(4)
Ho2 0.3787(2) 0.1173(1) 0.1625(2) Ho2A 0.3827(4) 0.1167(2) 0.1640(4)
Ho2B 0.8771(4) 0.1173(2) 0.3370(4)
Ho3 0.2100(3) 1/4 0.4998(3) Ho3A 0.2122(5) 1/4 0.4982(7)
Ho3B 0.7120(6) 1/4 �0.0030(7)
Ge1 0.2175(5) 0.0454(2) 0.4671(5) Ge1A 0.2210(8) 0.0445(4) 0.4695(9)
Ge1B 0.7223(8) 0.0471(4) 0.026(1)
Ge2 0.0801(7) 1/4 0.1149(7) Ge2A 0.085(1) 1/4 0.111(2)
Ge2B 0.583(1) 1/4 0.386(1)
Ge3 0.3347(6) 1/4 0.8647(7) Ge3A 0.338(1) 1/4 0.858(1)
Ge3B 0.832(1) 1/4 �0.364(1)

Figure 8 shows the crystal structure of Nd5Si4 highlighting the similarities
in coordination polyhedra between Sm5Ge4 and Zr5Si4 structure types,
particularly the similar environment of the R1 atoms and of the T atoms
(see also Fig. 4).
3. Gd5SixGe4�x PSEUDOBINARY SYSTEM
The Gd5SixGe4�x is the most studied pseudobinary system of the R5T4 inter-
metallic alloys. Over 200 publications report the crystallography and physical
properties of the Gd5SixGe4�x alloys—half of all published papers about
TABLE 8 Atomic and Isotropic Thermal Displacement Parameters for New
Crystal Structures Observed in the Gd5Si4�xBix System (Svitlyk et al.,
2009a)
Atom Site x/a y/b z/c Occupancy U (A2)
Gd5Si1.93Bi2.07 (I41/acd )
Gd1 32g 0.3331 0.9178 0.06149 1 0.0163
Gd2 8a 0 0.25 0.375 1 0.0116
Bi/Si1 16d 0 0.25 0.97841 0.938/0.062 0.0135
Bi/Si2 16f 0.3658 xþ0.25 0.125 0.098/0.902 0.011
Gd5Si1.58Bi2.42 (P42bc)
Gd1 8c 0.6754 0.1615 0.06388 1 0.043
Gd2 8c 0.6692 0.1583 0.93612 1 0.046
Gd3 8c 0.1693 0.1699 0.3137 1 0.026
Gd4 8c 0.1604 0.1652 0.1864 1 0.026
Gd5 4a 0 0 0.9987 1 0.034
Gd6 4ba 0 0.5 0.2478 1 0.024
Bi1 4a 0 0 0.1033 1 0.033
Bi2 4a 0 0 0.8965 1 0.035
Bi3 4b 0 0.5 0.3511 1 0.039
Bi4 4b 0 0.5 0.1459 1 0.024
Bi/Si5 8c 0.6409 0.8666 0.9974 0.211/0.789 0.037
Bi/Si6 8c 0.1422 0.8647 0.2470 0.211/0.789 0.025
a4a in Svitlyk et al. (2009a).
Handbook on the Physics and Chemistry of Rare Earths304

R5T4. The majority of interesting physical phenomena, among them giant
magnetocaloric effect (GMCE), giant magnetostriction (GMS), giant magneto-
resistance (GMR), magnetic glass state (kinetic arrest), magnetic deflagration,
spontaneous generation of voltage (SGV), were first observed, reported, and
explained during the investigation of the Gd5SixGe4�x alloys. The current
understanding of the relationships between magnetism and structure in R5T4
compounds, as well as in some other systems exhibiting magnetostructural
transitions, was mainly developed through the studies of the composition–
structure–property relationships of the Gd5SixGe4�x compounds. Therefore, the
knowledge of crystallography and properties of the Gd5SixGe4�x alloys is
essential for understanding the behavior of all R5T4 slab structures with and
without Gd.
TABLE 9 Crystallographic Data for the Gd1Y4Ge4 Alloy Crystallizing in the
U3Mo2Si4 Type of Crystal Structure (Misra and Miller, 2008)
Atom Wyckoff cite x/a y/b z/c Occupancya Ueq (A2)
M1 4e 0.7007(1) 0.3219(1) 0.0571(1) 0.32(1) 0.011(1)
M2 4e 0.2658(1) 0.3373(1) 0.2776(1) 0.13(1) 0.009(1)
M3 2a 0 0 0 0.09(1) 0.009(1)
Ge1 4e 0.4112(2) 0.0312(1) 0.1807(2) 1 0.010(1)
Ge2 4e 0.0083(2) 0.6300(1) 0.1286(2) 1 0.011(1)
Space group P21/c; a¼8.0067(9) A, b¼7.7540(10) A, c¼7.6174(8) A, b¼113.04(1)�.aAll M sites are fully occupied by a mixture of Gd and Y atoms. Only Gd occupations are listed.
TABLE 10 Crystallographic Data for the Nd5Si4 Alloy Crystallizing in the
Zr5Si4 Type of Crystal Structure (Yang et al., 2002a)
Atoma Wyckoff cite x/a y/b z/c
Nd1 4a 0.3129 0.3129 0
Nd2 8b 0.3696 0.0114 0.4542
Nd3 8b 0.1300 �0.0155 0.8742
Si1 8b 0.1871 0.1638 0.6945
Si2 8b 0.2864 0.9349 0.0627
Space group P41212; a¼7.8694 A, c¼14.8077 A.aAll sites are fully occupied.
Chapter 262 R5T4 Compounds 305

In addition, Gd5SixGe4�x attracts so much attention because it is the only
R5T4 system that can show many of the above mentioned phenomena near
room temperature, which makes those phenomena not only fundamentally
interesting but also potentially useful for practical applications. The high mag-
netic ordering temperature of the Gd5Si4 and silicon rich Gd5SixGe4�x alloys
had been noted long time ago by Holtzberg et al. (1967), but this finding did
not spark much attention from the researchers. However, the discovery of the
giant magnetocaloric effect in Gd5Si2Ge2 (Pecharsky and Gschneidner,
1997b) became an open invitation for other scientists to look closer at this
system, especially when it was shown that the magnetocaloric machines using
Gd5Si2Ge2 or materials with similar properties may become competitors to
the commonly used vapor pressure refrigeration systems on the industrial
scale (Zimm et al., 1998). This discovery was a major milestone for the whole
magnetic refrigeration research field. A reader interested in the magnetic
refrigeration may find a few informative reviews about the magnetocaloric
effect elsewhere (Franco et al., 2012; Gschneidner and Pecharsky, 2000b;
Guttfleisch et al., 2012; Miller, 2006; Pecharsky and Gschneidner, 2005;
Smith et al., 2012; Yu, et al., 2010).
It is well established by now that the change in the crystal structure of the
Gd5SixGe4�x and R5T4 alloys in general occurs in accord with the change in
the magnetic ground state (or vice versa) and can be induced by: (1) change
in x (chemistry), (2) cooling and/or heating through the magnetic ordering
temperature, (3) application of the magnetic field above HCR or demagnetiza-
tion from high-field state, and (4) application of hydrostatic pressure. In addi-
tion, the crystal structure may be altered by such factors as: (1) heat treatment
of the alloys near the phase boundaries, (2) varying the purity of the starting
materials, and (3) application of shear stress during mechanical grinding
(observed in Er5Si4, Cao et al., 2013). Such extraordinary sensitivity of these
compounds to the external thermodynamic stimuli makes the Gd5SixGe4�x
FIGURE 8 Coordination polyhedra in the Nd5Si4 compound of the Zr5Si4 structure type. Only
atoms included in polyhedra are shown for clarity.
Handbook on the Physics and Chemistry of Rare Earths306
and other R5T4 systems an excellent playground for the study of the
composition–structure–property relationships, as well as making them
promising candidates for use in future technological applications. For exam-
ple, the fact that the magnetostructural response in these compounds may be
triggered by a number a various factors (temperature, magnetic field, pres-
sure) without an external source of power makes them interesting for multi-
functional sensors.
The interslab TdT bond length is a crucial structural parameter influen-
cing magnetism of Gd5T4 phases (Choe et al., 2000; Rao, 2000). While the
situation is different in other R5T4 systems, in Gd5SixGe4�x the ferromagnetic
state is always associated with the O(I)-Gd5Si4 type of crystal structure, and,
therefore, with shorter TdT bonds (Pecharsky and Gschneidner, 2007;
Pecharsky et al., 2003a). The physical phenomena occurring at the magnetos-
tructural transition are, in effect, caused by the breaking and formation of sin-
gle pair of the essentially nonmagnetic tetralide atoms.
Haskel et al. (2007) established the role of the Ge atoms in bridging
ferromagnetic interactions in the Gd5Si2Ge2 and Gd5Si0.5Ge3.5 using the
X-ray magnetic circular dichroism (XMCD) spectroscopy. The induced mag-
netic polarization of the Ge electrons caused by hybridization of the Gd 5dand Ge 4p conduction bands plays a primary role in supporting three-
dimensional ferromagnetism of the Gd5SixGe4�x alloys enabling long-range
exchange interactions between Gd 4f moments in adjacent slabs. Breaking
of the Ge(Si)dGe(Si) interslab bonds weakens such interactions and effec-
tively destroys long-range ferromagnetic order.
As shown by the high pressure XMCD studies (see Section 3.7), the role of
Si atoms on the onset of ferromagnetism in Gd5SixGe4�x is also significant. In
addition to the well-established presence of chemical pressure exerted on the
system due to smaller size of Si atoms compared to Ge atoms, there must be
additional ways for the Si to promote the formation of the O(I)-FM phase,
which are not completely known at this point. A plausible scenario includes
the involvement of the 3p Si bands in the p–d hybridization necessary to sup-
port the three-dimensional ferromagnetism in Gd5SixGe4�x, decreasing the total
energy of Si-substituted alloys in the ferromagnetic state. This is partially sup-
ported by the fact that the magnetic ordering temperature and, consequently,
magnetic exchange interactions in Gd5Si4 are stronger than in pure Gd.
3.1. Phase Equilibria
The early study by Holtzberg et al. (1967) reported a tentative Gd5SixGe4�x
phase diagram. The authors observed an existence of an intermediate
phase with crystal structure different from those of Gd5Si4 and Gd5Ge4.
Later, during investigation of the giant magnetocaloric effect in Gd5SixGe4�x,
Pecharsky and Gschneidner (1997d) refined the pseudobinary phase diagram
of Gd5SixGe4�x system. They determined the crystal structure of the
Chapter 262 R5T4 Compounds 307

intermediate phase, and found that it crystallizes in its own structure type,
Gd5Si2Ge2. In addition to the intermediate monoclinic phase, the alloys from
the Ge-rich side of the diagram were found to crystallize in the O(II)-Sm5Ge4type, while the alloys from the Si rich part adopt the O(I)-Gd5Si4 type of crys-
tal structure. The magnetic phase diagram of Gd5SixGe4�x system was con-
structed in the same study. It was immediately pointed out that the distinct
magnetic behavior of alloys from the three different regions in the system cor-
relates with the crystal structure of the alloys from the respective regions
(Pecharsky and Gschneidner, 1997d).
The recent and the most complete Gd5SixGe4�x pseudobinary phase dia-
gram was constructed by Pecharsky et al. (2002a). The crystal structure, lat-
tice parameters, and magnetic ordering temperatures were determined for
the total of 27 alloys with different x. Most alloys were analyzed as-cast,
but those with the monoclinic crystal structure at room temperature were also
heat treated at 1300 �C for 1 h in Ta crucibles under high vacuum using an
induction furnace. The heat treatment does not have a significant effect on
the values of lattice parameters of the monoclinic Gd5SixGe4�x, although it
was found that annealing may affect the phase content of the alloys at
compositions near the phase boundaries. The main features of the 1997 phase
diagram were confirmed, such as the existence of three distinct magnetic–
crystallographic regions, and the strong compositional variation of the mag-
netic ordering temperature, particularly in the Ge-rich region. The location
of the O(II)–M boundary was corrected. The resulting room temperature crys-
tallographic phase diagram is shown in Fig. 9 (Pecharsky et al., 2002a). The
lattice parameters and unit cell volume values from the studies by Holtzberg
et al. (1967) and Pecharsky and Gschneidner (1997d) are shown for compari-
son, and they all are in good agreement with each other.
It is important to remember that the phase diagram shown in Fig. 9 is
drawn for the ambient conditions. Morellon et al. (1998a) were first to show
that the Gd5Si1.8Ge2.2 compound, which has the monoclinic structure at room
temperature (RT), transforms into the orthorhombic Gd5Si4-type structure
below �230 K. The Gd5Si0.4Ge3.6 alloy, which has O(II)-Sm5Ge4 structure
at room temperature also transforms into the O(I)-Gd5Si4 below �80 K
(Morellon et al., 2000). Similar temperature-induced transformations occur in
other Gd5SixGe4�x samples with 0<x�2 (Choe et al., 2000; Liu et al.,
2001a; Mudryk et al., 2008). Therefore, at different temperatures this phase dia-
gram will look differently. For example, at liquid nitrogen temperature (�80 K)
the monoclinic phase does not exist in the Gd5SixGe4�x system, and only two
phase regions, Ge-rich O(II) and Si-rich O(I), can be observed (Liu et al.,
2001a,b). The structure types and lattice parameters of Gd5SixGe4�x alloys with
x¼0.0, 0.4, 0.6, 0.8, 1.2, 1.4, 1.6, 1.84, 2.4, 3.2, and 4.0 determined at room
temperature and at 80 K are listed by Liu et al. (2001b).
The phase boundaries may slightly shift after heat treatment. The location
of the O(I)–M boundary is especially sensitive to annealing, and the 5:2:2
Handbook on the Physics and Chemistry of Rare Earths308
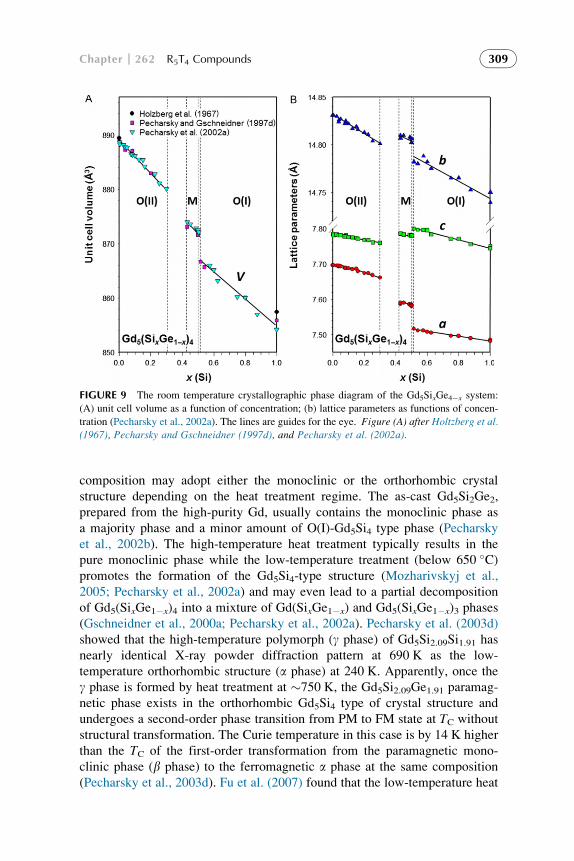
composition may adopt either the monoclinic or the orthorhombic crystal
structure depending on the heat treatment regime. The as-cast Gd5Si2Ge2,
prepared from the high-purity Gd, usually contains the monoclinic phase as
a majority phase and a minor amount of O(I)-Gd5Si4 type phase (Pecharsky
et al., 2002b). The high-temperature heat treatment typically results in the
pure monoclinic phase while the low-temperature treatment (below 650 �C)promotes the formation of the Gd5Si4-type structure (Mozharivskyj et al.,
2005; Pecharsky et al., 2002a) and may even lead to a partial decomposition
of Gd5(SixGe1�x)4 into a mixture of Gd(SixGe1�x) and Gd5(SixGe1�x)3 phases
(Gschneidner et al., 2000a; Pecharsky et al., 2002a). Pecharsky et al. (2003d)
showed that the high-temperature polymorph (g phase) of Gd5Si2.09Si1.91 has
nearly identical X-ray powder diffraction pattern at 690 K as the low-
temperature orthorhombic structure (a phase) at 240 K. Apparently, once the
g phase is formed by heat treatment at �750 K, the Gd5Si2.09Ge1.91 paramag-
netic phase exists in the orthorhombic Gd5Si4 type of crystal structure and
undergoes a second-order phase transition from PM to FM state at TC without
structural transformation. The Curie temperature in this case is by 14 K higher
than the TC of the first-order transformation from the paramagnetic mono-
clinic phase (b phase) to the ferromagnetic a phase at the same composition
(Pecharsky et al., 2003d). Fu et al. (2007) found that the low-temperature heat
FIGURE 9 The room temperature crystallographic phase diagram of the Gd5SixGe4�x system:
(A) unit cell volume as a function of concentration; (b) lattice parameters as functions of concen-
tration (Pecharsky et al., 2002a). The lines are guides for the eye. Figure (A) after Holtzberg et al.(1967), Pecharsky and Gschneidner (1997d), and Pecharsky et al. (2002a).
Chapter 262 R5T4 Compounds 309
treatment of phase-pure monoclinic Gd5Si2Ge2 powder (150 �C/2 h and
400 �C/0.5 h) promotes the b to g structural transformation in the paramag-
netic state producing a mixture of the orhthorhombic and monoclinic phases,
both existing at the same Gd5Si2Ge2 stoichiometry. At the same time, anneal-
ing of bulk Gd5Si2Ge2 alloy at 400 �C for both 0.5 and 10 h does not change
the crystal structure and it remains monoclinic. Since a powdered sample is
more prone to oxidation compared with a bulk sample of the same chemical
composition, Fu et al. (2007) explained the observed difference in structural
behavior by higher concentration of interstitial impurities (O and N) in the pow-
dered samples. However, stress induced by grinding may be related to this dif-
ference as well. The detailed high-temperature single-crystal investigation of
the monoclinic phase stability complemented by tight-binding linear-muffin-
tin-orbital electronic structure calculations using the atomic sphere approxima-
tion method (TB-LMTO ASA) was performed by Mozharivskyj et al. (2005).
The study found that the presence of interstitial impurities, such as O or N,
may impede shear movement of the slabs, consequently slowing the transitions
and making them irreversible.
In order to prevent the formation of the g phase, a high-temperature heat treat-
ment is commonly performed on Gd5SixGe4�x with x�2. The optimal annealing
regime for the formation of the single-phase monoclinic structure with the high-
est magnetocaloric effect was found to be heat treatment at 1300 �C for 1 h
(Pecharsky et al., 2003b). Several studies showed that longer annealing times
even at optimal temperatures are detrimental to the phase purity and magnetoca-
loric properties of the Gd5Si2Ge2 (Belo et al., 2012a; Pecharsky et al., 2003b).
Isothermal cross-section of the ternary Gd–Si–Ge phase diagram (Gd-rich
corner) at 900 �C was constructed by Zhuang et al. (2006a). Samples were
arc-melted using the “commercial grade” Gd metal, heat treated in evacuated
quartz tubes at 900 �C for 10 days, and quenched in liquid nitrogen. All three
crystal structures, O(I), M, and O(II), were observed along the Gd5Si4–
Gd5Ge4 tie-line (denoted in the paper as g, d, and b, respectively). The homo-
geneity range of monoclinic Gd5SixGe4�x phase was reported to be from 13.3
to 22 at.% Si, corresponding to 1.2�x�1.98.
Purity of the starting rare earth metal, gadolinium, particularly the presence
of interstitial impurities such as oxygen, carbon, and nitrogen, is a very impor-
tant factor affecting both the phase composition and properties of Gd5Si2Ge2(Gschneidner and Pecharsky, 1999; Gschneidner et al., 2000a; Mozharivskyj
et al., 2005). The carbon addition drastically decreases the magnetocaloric
effect in Gd5Si2Ge2 (Pecharsky and Gschneidner, 1997c), and preparation route
that reduces carbon concentration in the alloys made from commercial gado-
linium by prolonged melting in the Ta crucible in vacuum allowing release of
C and O in the form of CO and CO2 gases was developed by Gschneidner
et al. (2000a). Overall it is difficult, though not impossible, to obtain the
single-phase monoclinic Gd5Si2Ge2 using the commercial purity gadolinium.
Meyers et al. (2002b) observed that various contaminants and secondary
phases (i.e., Gd(SixGe1�x), Gd5(SixGe1�x)3, and Ta2Si as a result of reaction
Handbook on the Physics and Chemistry of Rare Earths310

with Ta crucible) form during synthesis of large batches (approximately 1 kg
total) of Gd5Si1.95Ge2.05 from “commercial grade” Gd. Gama et al. (2004)
prepared a Gd5Si2Ge2 sample from the commercial grade Gd and found only a
second-order transition at 299 K in the as-cast sample. However, after the sam-
ple was annealed at 1600 �C for 48 h two transitions, a second-order at 299 K,
and a first order at 274 K were observed and GMCE of 18 J/Kg K was reported
for 0–7 T magnetic field change in the heat-treated sample, meaning that a sub-
stantial amount of the monoclinic phase has formed during the heat treatment.
The O(II) phase is separated from the M phase on the Gd5SixGe4�x diagram
by a wide (1.2�x�1.72) two-phase region compared to the narrow O(I)–M
boundary (Dx¼0.05). This two-phase region is less important for practical
application since phase transitions here occur well below room temperature,
and therefore, it was not studied as rigorously as the region near the Gd5Si2Ge2stoichiometry. There is not much change in the values of the lattice parameters
of the annealed and as-cast alloys in the vicinity of this two-phase region, indi-
cating no major change in the x in the 5:4 phases due to heat treatment.
The study of rapidly solidified melt-spun ribbons of Gd5Si2Ge2 showed an
interesting dependence of their phase composition on the wheel speed
(Fu et al., 2006). The crystal structure of the ribbons prepared at 20 m/s wheel
speed is mostly monoclinic and they exhibit a first-order transition at 273 K on
the DSC curves. Higher wheel speeds promote the formation of the orthorhombic
phase instead of the monoclinic, and a second-order transformation is observed
around 290 K in materials prepared at wheel speeds of 30, 40, and 50 m/s.
Exothermic peaks located at �250–300 �C are attributed to the crystallization
of an amorphous phase. Similar study performed on a Gd5Si2Ge2 material
prepared using lower purity Gd than the one used by Fu et al. (2006) showed that
Gd5Si4-type orthorhombic phase forms in the rapidly solidified ribbons at wheels
speeds of 25 and 40 m/s (Zhang et al., 2007). The rapid solidification, however,
at least produces single-phase 5:4 material while the as-cast alloy prepared from
the same starting materials consists of a mixture of both Gd5Si2Ge2 polymorhps
(O(I) and M), Gd5(SixGe1�x)3, and Gd(SixGe1�x) phases.
3.1.1. Coupled Magnetic and Structural Diagram
The particularly interesting property of this series of compounds is strong cou-
pling of their magnetic and crystallographic lattices. The close relationship
between the crystal structure and magnetic properties in the Gd5SixGe4�x sys-
tem was originally observed by Holtzberg et al. (1967) and highlighted in the
refined magnetic phase diagram of Gd5SixGe4�x (Pecharsky and Gschneidner,
1997a,d). However, a detailed investigation of low-temperature crystal struc-
ture and magnetic behavior of many compounds was needed to establish a
clear correspondence between a particular magnetic state and one of three
crystal structure types in Gd5SixGe4�x alloys. Soon, it was discovered that
the structural transformation from the P1121/a monoclinic structure into the
Pnma O(I) structure was observed at 240 K in the Gd5Si1.8Ge2.2 phase, which
Chapter 262 R5T4 Compounds 311

is also the temperature of the transition from the paramagnetic to the ferro-
magnetic state (Morellon et al., 1998a). Further systematic studies of numer-
ous Gd5SixGe4�x alloys clearly showed the intimate relationship between the
magnetic behavior of the alloys and their room temperature crystal structure,
particularly with presence or absence of interslab TdT bonds (Pecharsky and
Gschneidner, 1997d), which is the only substantial difference between three dif-
ferent types of crystal structure observed in the Gd5SixGe4�x system. Breaking
of at least half of the interslab T2 dimers during O(I) to M structural transforma-
tion usually causes the transition from the ferromagnetic ordering into the para-
magnetic state (Choe et al., 2000, 2003a). In the O(II) type of structure with all
interslab TdT bonds broken, the FM state does not occur at all, and the mag-
netic ordering is antiferromagnetic only (Morellon et al., 2000). Multiple stud-
ies confirmed that crystallography of the Gd5SixGe4�x system changes with
temperature in accord with its magnetic state and vice versa, and the combined
magnetostructural x–T diagram can be constructed for the Gd5SixGe4�x system.
Pecharsky and Gschneidner (2007) presented the most recent version of this
diagram, as shown in Fig. 10. It is worth to note that Gd5Ge4 (x¼0) remains
in the O(II) structure at low temperatures after cooling in zero magnetic field,
and its transformation into FM O(I) polymorphic modification (Pecharsky
et al., 2003a) is “kinetically arrested” (Roy et al., 2006); this interesting phe-
nomenon will be discussed below in more detail. First-principles calculations
confirm that the antiferromagnetic O(II)-Sm5Ge4-type structure is a ground
state in Gd5Ge4 (Paudyal et al., 2007).
FIGURE 10 Combined magnetic and structural diagram of the Gd5SixGe4�x pseudobinary sys-
tem. Thick solid lines indicate temperature-dependent boundaries of the second-order phase tran-
sitions, while the thick dash-dotted lines indicate those of the first-order transitions. Thin
horizontal lines indicate constant temperatures of FM-O(I)!PM-M (upper line) and FM-O
(I)!PM-O(II) (lower line) transformations in the O(II)þM two-phase region.
Handbook on the Physics and Chemistry of Rare Earths312

While it is widely accepted and confirmed by numerous magnetic mea-
surements that the O(I) structure in Gd5SixGe4�x alloys is coupled to the
FM state, recent neutron diffraction experiments performed on the samples
with 0�x�0.9 failed to observe any long-range ferromagnetic ordering in
these samples in the absence of the applied magnetic field (Ryan et al.,
2010). At the same time, a clear removal of long-range AFM state was con-
firmed when the O(II) to O(I) structural transition occurrs. Therefore, the
magnetic part of the x–T Gd5SixGe4�x diagram presented in Fig. 10 may not
be strictly valid in the complete absence of applied magnetic field.
3.2. Magnetic Properties, Magnetocaloric Effect, and First-OrderTransitions
The GMCE observed originally in Gd5Si2Ge2 occurs in other Gd5SixGe4�x com-
pounds, however, in the Si-rich alloys, which exhibit highest magnetic ordering
temperatures, only the conventional magnetocaloric effect is present (Gschneid-
ner et al., 1999).3 Yet, the extraordinary sensitivity of the magnetic phase transi-
tion temperature to the Si/Ge content, originally noted by Holtzberg et al.
(1967), means that in the Gd5SixGe4�x system the temperature of the giant mag-
netocaloric effect is tunable in the wide range from�30 to�276 K by adjusting
the Si/Ge ratio (Pecharsky and Gschneidner, 1997a, 1998). Alloying with a small
amount (�0.33 at.%) of Ga raises the Curie temperature to�290 K and preserves
GMCE, while alloying with some other elements, both magnetic and nonmag-
netic (Fe, Co, Ni, Cu, Al, etc.) tends to increase Curie temperature but destroys
the giant magnetocaloric effect (Pecharsky and Gschneidner, 1997c; Provenzano
et al., 2004). Usually, in the Gd5SixGe4�x system the magnetocaloric effect
increases as the magnetic ordering temperature decreases, particularly in the
alloys with the room temperature O(II) crystal structure (Pecharsky and
Gschneidner, 1997a, 1998).While these materials are not suitable for use in mag-
netocaloric refrigerators operating at ambient conditions, there is still a wide
range of applications where they may prove to be useful, that is, for the liquefac-
tion of H2, natural gas, and propane (Gschneidner et al., 1999).
3. The name “giant magnetocaloric effect (GMCE)” was coined by Pecharsky and Gschneidner
(1997a) to designate an unusually large magnetocaloric effect observed during a magnetic field-
induced first order magnetic phase transition in Gd5Si2Ge2. It was later shown by Morellon
et al. (1998a) that in the Gd5SixGe4�x family, the magnetic ordering–disordering transformation
coincides with a structural transformation. Today, it is broadly accepted that the giant magnetoca-
loric effect originates from the enhancement of the conventional magnetocaloric effect, borne by
the magnetic-field-induced changes in the magnetic sublattices, by the entropy difference between
different polymorphic modifications of a crystalline material that are associated with different
magnetic states of the system. Hence, the giant magnetocaloric effect results from coupled mag-
netostructural transformations that are triggered by varying external magnetic fields (Pecharsky
et al., 2003a).
Chapter 262 R5T4 Compounds 313

The occurence of GMCE in Gd5SixGe4�x alloys (and in any other mag-
netic system) is always associated with a first order of the phase transition that
can be induced reversibly by magnetic field (Gschneidner and Pecharsky,
2000b; Gschneidner et al., 1999; Liu et al., 2006; Tegus et al., 2002a). Typi-
cally, the order of a transition is clearly seen from heat capacity measurements
of a given material, but presence of thermal hysteresis in temperature depen-
dence of material’s magnetization is a good indication of the first order of
the transition as well. Gd5Si2Ge2 shows a sharp first-order peak on its heat
capacity data at TC (Fig. 11A; Pecharsky and Gschneidner, 1997b) and
similar first-order heat capacity peaks have been observed for every other
studied Gd5SixGe4�x compound with x�2. On the other hand, in the Si-rich
region (x>2, no GMCE) the heat capacity at the transition shows a textbook
l-shaped anomaly that reflects the second order of the transition (Gschneidner
et al., 1999). This changeover from the first to the second order of the transi-
tion with raising x is shown in Fig. 11B. Despite not showing the GMCE, the
Si-rich alloys with x>2 remain interesting materials for certain applications
due to their high TC and large magnetization. For example, high magnetiza-
tion and TC that may be easily tuned between 40 and 45 �C are desired
properties for materials potentially suitable for a hypothermal treatment of
inoperable tumors (Ahmad and Shaheen, 2009; Ahmad et al., 2005).
The first-order transitions usually show relatively sharp peaks in the heat
capacity data even in high magnetic fields at which the second-order
FIGURE 11 (A) Heat capacity of Gd5Si2Ge2 measured as a function of temperature in zero
magnetic field. In addition to the main peak associated with the paramagnetic M to ferromagnetic
O(I) magnetostructural transition, the purely magnetic transition of the minor O(I) phase is seen at
299 K. (B) Heat capacities of selected Gd5SixGe4�x alloys measured as functions of temperature
in zero magnetic field. The samples with room temperature M crystal structure show strong first-
order transitions, but the samples with O(I) crystal structure show second-order l-shaped peaks.
Handbook on the Physics and Chemistry of Rare Earths314

transitions become broad. As shown in Fig. 12A, in Gd5Si2Ge2 the first order
of the transition is clearly seen even in magnetic fields as high as 100 kOe
contrary to the second-order behavior shown in Fig. 12B.
Heat capacity measurements of Gd5Ge4 in 0, 5, 20, 30, 40, 50, 80, and
110 kOe applied magnetic fields have been carried out by Sharath Chandra
et al. (2009). In magnetic fields higher than 30 kOe, a strong anomaly that
corresponds to the O(I)-FM!O(II)-AFM transition is observed above
�45 K and it moves toward higher temperatures as the applied field increases.
Magnetic contribution to the total heat capacity was calculated by subtracting
the heat capacity of La5Ge4 from that of Gd5Ge4. In addition to a large
peak at TC, a small anomaly in heat capacity is seen at �15 K in low fields,
which disappears in high magnetic fields. Sharath Chandra et al. (2009)
suggested that this anomaly indicates the “freezing boundary” of Gd5Ge4(see Section 3.6). The magnetic entropy of Gd5Ge4 decreases with applied
magnetic field following the field-induced transition into a fully ordered
ferromagnetic state.
Calorimetric measurements performed using a differential scanning calorim-
eter (DSC), developed by Marcos et al. (2003), also show the presence of a
large peak at the first-order AFM-O(II)–FM-O(I) transition in Gd5Si0.4Ge3.6alloy, and much weaker effect at TN, which is the second-order PM–AFM tran-
sition (Fig. 13). A linear increase in the temperature of the first-order transition
with applied magnetic field was observed, dTC/dH¼0.41�0.01 K/kOe. The
peaks associated with the first-order transition become considerably stronger
FIGURE 12 Heat capacity of the first-order M-Gd5Si2Ge2 (A) and the second-order O(I)-
Gd5Si2Ge2 (B) materials measured as a function of temperature in applied magnetic fields of 0,
20, 50, 75, and 100 kOe.
Chapter 262 R5T4 Compounds 315

when magnetic field increases, as the entropy change at the transformation
increases: from DS¼2.85 J/mol K for H¼0 kOe to DS¼3.96 J/mol K for
H¼50 kOe (see insets of Fig. 13). Using the same experimental setup as
Marcos et al. (2003), Casanova et al. (2004b) studied the variation of the tran-
sition field with the transition temperature dHt/dTt in Gd5SixGe4�x alloys for
0�x�2. Two distinct behaviors of dHt/dTt were observed. For x�0.8, two dif-
ferent values of dHt/dTt corresponding to low-field (AFM–FM) and high-field
(PM–FM) regimes exist, while a single value of dHt/dTt is found for
0.96�x�2 compositional range, where only the PM–FM transition is present.
The emergence of two field regimes in the Ge-rich region is due to the fact that
in high magnetic fields (over 10 T) the magnetostructural transition overlaps
with the second-order PM–AFM transition giving rise to a unique PM-O(II)–
FM-O(I) transformation (Casanova et al., 2004b).
In addition to the magnetic ordering temperature(s), TC or TN, other major
parameters describing magnetocaloric effect are: magnetic entropy change,
�DSM; adiabatic temperature change, DTad; and relative cooling power,
RCP (Gschneidner and Pecharsky, 2000b). For characterization of the magne-
tocaloric properties of a given material, the maximum value of each parameter
(except the ordering temperature) is usually reported for a certain magnetic
FIGURE 13 DSC curves measured on a Gd5Si0.4Ge3.6 sample for different applied magnetic
fields. Insets show the entropy change as a function of the magnetic field (Marcos et al., 2003).
Handbook on the Physics and Chemistry of Rare Earths316

field change. �DSM and RCP are extensive parameters usually quoted per
unit of either volume or mass. It is more common in literature to report mag-
netic entropy change per unit of mass (g or kg) though the volumetric units
are better from an engineer’s point of view. The magnetic and magnetocaloric
properties of several Gd5SixGe4�x alloys with different crystal structures from
each part of the phase diagram (Fig. 9) are summarized in Table 11 and mag-
netocaloric properties of monoclinic alloys are also shown in Fig. 14. Obvi-
ously, the alloys with M and O(II) room temperature structures show much
larger MCE compared to the O(I) phases. It is worth to note here that the
actual MCE values for a given Gd5SixGe4�x composition may vary signifi-
cantly depending on the sample preparation routine and quality of the starting
materials. As shown by Pecharsky et al. (2003b), almost a twofold increase in
the magnetocaloric effect in Gd5Si2Ge2 occurs when the sample is optimally
heat treated at 1300 �C compared to other annealing protocols (i.e., annealing
at lower temperatures). Effect of cooling rate on the magnetic entropy change
of Gd5SixGe4�x alloys with x¼1.7 and 2.0 was studied by Yan et al. (2004).
They found that a slow cooling has detrimental effect on MCE, especially for
the Gd5Si2Ge2 compound; both higher Ge content and higher cooling rate are
favorable for the formation of the monoclinic phase.
The magnetocaloric effect (change of materials temperature with applied
magnetic field) can be directly measured using a properly designed experi-
mental setup. Huang et al. (2005) performed direct DTad measurements on
Gd5Si2Ge2, Gd5Si3.2Ge0.8, and Gd5Si4 for the 0–13 kOe magnetic field
TABLE 11 The Magnetic Ordering Temperatures and Magnetocaloric
Properties (for the Magnetic Field Change from 0 to 50 kOe) of the
Gd5SixGe4�x Phases (Gschneidner and Pecharsky, 2000b)
Composition
Crystal
structurea TC (K) TN (K)
�DSM(J/Kg K) DTad (K)
Relative
cooling power
(J/Kg)
Gd5Si4 O(I) 336 – 8.8 8.8 635
Gd5Si2.5Ge1.5 O(I) 313 – 9.6 8.5 630
Gd5Si2Ge2 M 276 – 18.7 15.0 448
Gd5Si1.72Ge2.28 M 246 – 39.2 18.8 549
Gd5Si0.33Ge3.67 O(II) 68 128 36.1 11.2 758
Gd5Ge4b O(II) – 125 16.0 7.2 432
aAt room temperature.bGd5Ge4 remains in the O(II) structure at low temperatures in zero magnetic field but transformsinto O(I) structure when a magnetic field is applied (Pecharsky et al., 2003a). It exhibits GMCE dueto this field-induced transition.
Chapter 262 R5T4 Compounds 317
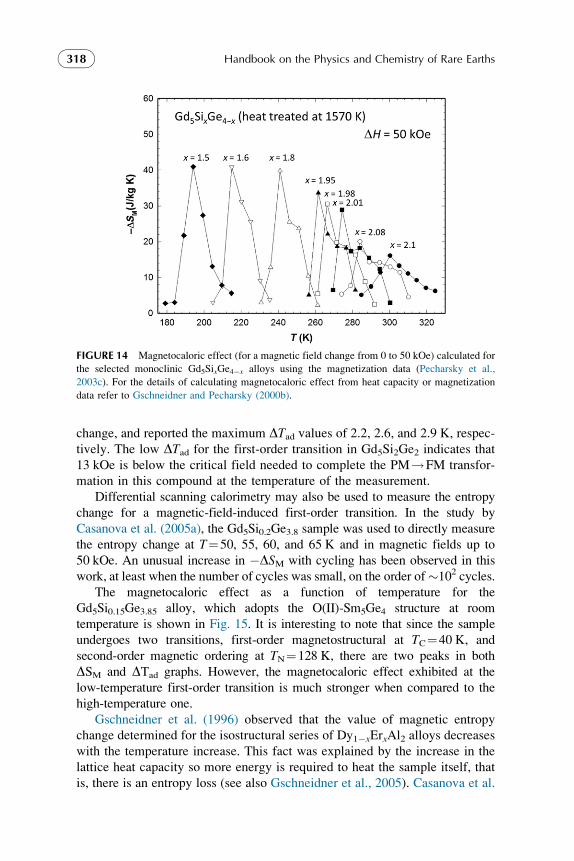
change, and reported the maximum DTad values of 2.2, 2.6, and 2.9 K, respec-
tively. The low DTad for the first-order transition in Gd5Si2Ge2 indicates that
13 kOe is below the critical field needed to complete the PM!FM transfor-
mation in this compound at the temperature of the measurement.
Differential scanning calorimetry may also be used to measure the entropy
change for a magnetic-field-induced first-order transition. In the study by
Casanova et al. (2005a), the Gd5Si0.2Ge3.8 sample was used to directly measure
the entropy change at T¼50, 55, 60, and 65 K and in magnetic fields up to
50 kOe. An unusual increase in �DSM with cycling has been observed in this
work, at least when the number of cycles was small, on the order of�102 cycles.
The magnetocaloric effect as a function of temperature for the
Gd5Si0.15Ge3.85 alloy, which adopts the O(II)-Sm5Ge4 structure at room
temperature is shown in Fig. 15. It is interesting to note that since the sample
undergoes two transitions, first-order magnetostructural at TC¼40 K, and
second-order magnetic ordering at TN¼128 K, there are two peaks in both
DSM and DTad graphs. However, the magnetocaloric effect exhibited at the
low-temperature first-order transition is much stronger when compared to the
high-temperature one.
Gschneidner et al. (1996) observed that the value of magnetic entropy
change determined for the isostructural series of Dy1�xErxAl2 alloys decreases
with the temperature increase. This fact was explained by the increase in the
lattice heat capacity so more energy is required to heat the sample itself, that
is, there is an entropy loss (see also Gschneidner et al., 2005). Casanova et al.
FIGURE 14 Magnetocaloric effect (for a magnetic field change from 0 to 50 kOe) calculated for
the selected monoclinic Gd5SixGe4�x alloys using the magnetization data (Pecharsky et al.,
2003c). For the details of calculating magnetocaloric effect from heat capacity or magnetization
data refer to Gschneidner and Pecharsky (2000b).
Handbook on the Physics and Chemistry of Rare Earths318

(2002a) have shown that such universal dependence can also be applied to the
Gd5SixGe4�x system. The maximum entropy change during the first-order
transition in Gd5SixGe4�x scales well with the temperature of the transition,
regardless of whether that temperature is modified by chemical substitution
or change in magnetic field. The amount of the magnetic entropy change
decreases with the temperature increase between �100 and �300 K. Some-
what unexpectedly, it was reported that DSM also decreases when temperature
decreases below �100 K (Casanova et al., 2002a, 2003). It is important to
note, however, that the MCE of a particular compound obtained by different
methods or in different laboratories may vary substantially.
The formation of a particular polymorphic modification in the paramag-
netic state of Gd5Si2Ge2 due to heat treatment and/or purity of starting mate-
rials has a profound effect on its magnetocaloric properties: when this
compound crystallizes in the monoclinic Gd5Si2Ge2 structure it is a first-order
giant magnetocaloric material, but when the sample is crystallizing in the
orthorhombic Gd5Si4 structure, it is a second-order material and does not
exhibit either GMCE or other interesting phenomena, such as GMS, GMR
or SGV (the difference in MCE for the Gd5Si2.09Ge1.91 composition is shown
in Fig. 16, below). The M to O(I) transition occurs in the former case but not
in the latter. As shown by Hadimani et al. (2008a) by means of the Arrott plot
method the estimated magnetic ordering temperature of O(I) Gd5Si2Ge2 phase
is �300 K in any case. However, when the structural M to O(I) transition
occurs, the PM monoclinic phase forms below this temperature and from
FIGURE 15 The magnetocaloric effect in Gd5Si0.15Ge3.85 calculated using heat capacity data for
four magnetic field changes: DH¼0–20, 0–50, 0–75, and 0–100 kOe: (A) �DSM and (B) DTad(Gschneidner and Pecharsky, 2000a).
Chapter 262 R5T4 Compounds 319

the M(T) plot, the observed TC is equal to 269 K; similar effect was observed
for the Gd5Si1.95Ge2.05 composition. At the same time, for the typical second-
order Gd5Si2.7Ge1.3 compound the TC¼304 K determined by the Arrott
method agrees well with the TC¼307 K determined from the M(T) plot bythe inflection point method (Hadimani et al., 2008b). The magnetic-field-
induced first-order PM!FM phase transition occurs in the Gd5SixGe4�x
alloys for 0.41�x�0.51 even above the projected TC of the O(I) phase,
which is possible due to the broadening of the second-order magnetic ordering
transition of the O(I) structure (Hadimani et al., 2009b).
The competition between orthorhombic and monoclinic structures in
Gd5Si2Ge2 has been analyzed employing the first-principles electronic struc-
ture calculations coupled to the magnetothermodynamic modeling (Paudyal
et al., 2006). The calculated temperature dependences of magnetization and
total energy are in excellent agreement with experimental results. The mech-
anism of the magnetostructural transformation in Gd5Si2Ge2 is illustrated in
Fig. 17. The O(I) phase is stable at low temperatures, but it has higher TCO Ið Þ
than the M phase, which is stable at high temperatures but its calculated TCM
is around 210 K. The energy crossover occurs at the temperature of the first-
order transition, the measured TC of the material, which is TCM < TC < TC
O Ið Þ.It is easy to see from Fig. 17 that the change in magnetization at the transition
in such case is theoretically discontinuous, and experimentally is much sharper
compared to a classical second-order scenario.
It is equally easy to note that the free energy difference between M and O(I)
phases is relatively small near TC and extrinsic factors (such as interstitial impu-
rities) may easily shift the temperature of the crossover or lift the free energy
FIGURE 16 Magnetocaloric effect in the Gd5Si2.09Ge1.91 compounds with the room temperature
crystal structure being: (A) orthorhombic Gd5Si4 type and (B) monoclinic Gd5Si2Ge2 type
(Pecharsky et al., 2002b).
Handbook on the Physics and Chemistry of Rare Earths320

curve of the M phase enough to prevent its formation from the O(I) phase,
which would remain the only thermodynamically stable phase in Gd5Si2Ge2.
The fact that the same compound may order magnetically either
simultaneously with a structural transition or without it allows one to estimate
the contribution from the structural entropy (�9 J/Kg K, Fig. 16) to the
total entropy change observed during the magnetostructural transition in
Gd5Si2Ge2. This is relatively easy to do because with the same chemicalcom-
position and nearly the same transition temperatures, the difference between
the magnetic entropy change values of two polymorphs comes only from
the changes in the crystal structure (Gschneidner et al., 2012).
The influence of the first-order ferromagnetic-paramagnetic phase transition
on the MCE was theoretically investigated by von Ranke et al. (2004). A simple
phenomenological modeling was used to estimate the influence of external para-
meters (i.e., magnetic field, pressure, volume deformation) on the magnetic
entropy change. Monte Carlo calculations of the magnetocaloric effect in
Gd5SixGe4�x alloys with x>0.5 (no first-order structural transition) were per-
formed by Nobrega et al. (2005) and showed good agreement with available
experimental data. Basso et al. (2006) applied a temperature-dependent Preisach
FIGURE 17 Magnetization (lower part of the plot, dashed and dotted lines) and Helmholtz free
energies (upper part of the plot, solid and dash-dotted lines) of M and O(I) polymorphic modifi-
cations of Gd5Si2Ge2 calculated from first principles coupled to magnetothermodynamic models
(Pecharsky et al., 2009). The thick solid line is predicted magnetization of Gd5Si2Ge2 in the case
of first-order structural M!O(I) transformation. The full circles represent experimentally
measured values of the spontaneous magnetization of Gd5Si2Ge2 as a function of temperature.
Chapter 262 R5T4 Compounds 321

model to describe hysteresis in a material with magnetic-field-induced tempera-
ture transformation, namely in Gd5Si0.328Ge3.672.
Another factor that affects the measured entropy change is the history
dependence often observed in samples undergoing first-order transitions, par-
ticularly those with a substantial thermal or magnetic hysteresis. This was illu-
strated by the Hall probe measurements of the monoclinic Gd5Si2.09Ge1.91sample, which was exposed to two different paths: in one case in order to
achieve the transition the temperature was increased first, followed by the
increase in magnetic field; in the other case the sample was magnetized first
and then heated up (Kuepferling et al., 2008). The Hall imaging showed that
the final phase compositions (the ratios of M and O(I) structures) in two cases
were different, and so were the measured MCE values (refer to Section 3.6 for
more information explaining the history dependence).
Guimaraes et al. (2010) applied the acoustic detection method for the mea-
surement of magnetocaloric effect in several Gd5SixGe4�x materials (x¼2, 2.5,
3.0, 3.5, and 4.0) prepared in the form of both pellets and powders (pellets were
made out of powders by compression under 0.6 GPa). For the second-order
samples with 2.0<x�4.0, good agreement between the MCE of powders
and pellets was observed. For the sample with the Gd5Si2Ge2 composition,
the measured MCE properties of the powder and the pellet were different (pellet
has smaller MCE) indicating that a significant fraction of the high-volume
monoclinic phase have transformed into the low-volume O(I) phase during
the compression.
As was mentioned earlier, the purity of the starting rare earth metal has
significant influence on the MCE of Gd5SixGe4�x alloys. Thuy et al. (2001)
were able to obtain GMCE (DSM¼�20 J/Kg K) in as-cast Gd5Si2Ge2prepared using commercial grade Gd metal. The reported TC was 279 K,
and yp¼305 K. The sample was reported to be single phase based on the
X-ray powder diffraction data; it was not clearly specified whether the com-
pound’s crystal structure was monoclinic or orthorhombic, though based on
the presence of GMCE one may suggest that it was indeed monoclinic in
the paramagnetic state. More information regarding sample preparation and
X-ray powder diffraction analysis were provided in a second study of several
other GMCE Gd5SixGe4�x alloys (x¼0.33, 1.01, 1.72, 2.0) made from com-
mercial grade Gd by Thuy et al. (2002). These alloy were prepared with the
3 at.% Gd excess, and a small amount of impurity phase has been observed
on their X-ray diffraction patterns.
Gd1�x(Si0.5Ge0.5)x series of alloys, x¼0.38, 0.41, 0.45, 0.47, 0.5, was stud-
ied by Manivel Raja et al. (2008). Essentially, the authors studied
the composition range between Gd5(Si0.5Ge0.5)3 and Gd1(Si0.5Ge0.5)1 phases,
and expectedly found that the alloy with x¼0.45 (closest to the Gd5(Si0.5Ge0.5)4composition) shows the largest MCE. Interestingly, in agreement with Thuy
et al. (2002), they found that Gd-rich alloys (x0.45) contain the monoclinic
5:4 phase, but Gd-depleted samples contain the orthorhombic O(I) 5:4 phase.
Handbook on the Physics and Chemistry of Rare Earths322

Wu and Lu (2004) confirmed that the presence of GMCE in Gd5SixGe4�x
alloys with x�2 is strongly dependent on the purity of the starting Gd metal.
They found an increase in magnetic entropy change values in the materials
made from purified Gd metal compared to the materials made from the “as-
received” Gd metal obtained from the same commercial vendor. Alves et al.
(2004) were able to obtain GMCE (19 J/Kg K for DH¼70 kOe at TC¼274 K)
in Gd5Si2Ge2 alloy prepared from low-purity Gd by using the
high-temperature heat treatment of the cast alloy at 1650 �C for 48 h. How-
ever, a significant amount of the O(I) structure magnetically ordering at
299 K through a second-order transition was still present in the sample after
annealing. Zhang et al. (2005) observed more than a twofold increase of the
magnetic entropy change in Gd5Si2Ge2 alloy prepared from low-purity com-
mercial grade Gd after annealing at 1200 �C for 1 h.
Wu et al. (2005a) prepared a series of Gd5Si1.95Ge2.05Ox alloys (x¼0.05,
0.10, 0.15, 0.40, and 0.50), in which oxygen was added as Gd2O3, and
the magnetocaloric effect was compared with the parent GMCE alloy
Gd5Si1.95Ge2.05. High amounts of oxygen (x0.15) lead to the decomposition
of the 5:4 phase into the 1:1 and 5:3 phases. Even the lowest amount of added
oxygen (x¼0.05) destroys GMCE by stabilizing the orthorhombic g phase,
and decreasing the amount of the monoclinic b phase that undergoes a first-
order transition.
Hydrogen absorption has similar effect. Carvalho et al. (2007) studied the effect
of hydrogen on the structural and magnetic properties of Gd5Si1.9Ge2.1Hx alloy
(0<x<2.5) and found that even the smallest measured amount of hydrogen
(x¼0.09) changes the PM!FM transition from first to second order stabilizing
the O(I) Gd5Si4-type crystal structure. Hydrogen absorption expands the lattice
along the a- and b-axes but shrinks it along the c-direction. Total volume expansion
measured at x(H)¼2.5 is 1.7%.
Usually, it is much easier to obtain a pure monoclinic phase at room tem-
perature when the composition is slightly shifted from the ideal Gd5Si2Ge2composition toward the Ge side of the Gd5SixGe4�x pseudobinary diagram.
However, the temperature of the magnetic ordering lies below the room tem-
perature. Chernyshov et al. (2002) studied magnetic, magnetocaloric, and
magnetoelastic properties of a Gd5Si1.95Ge2.05 sample and found that simulta-
neous magnetostructural transition occurs at 262 K in zero magnetic field.
Magnetocaloric effect (magnetic entropy change) was determined for the
Gd5Si1.8Ge2.2 sample using the high-field (up to 230 kOe) isothermal magne-
tization measurements (Casanova et al., 2002b). The authors established that
the Maxwell relations can be used to calculate MCE in first-order transition
systems such as Gd5SixGe4�x (x�2) as long as the Maxwell relation is eval-
uated within the transition region only and the applied field is high enough to
complete the transition. The value of the critical field (Hcr) needed to start the
PM!FM transition is Hcr¼170 kOe at 307 K, and a linear behavior of
Hcr(T) was found, with dT/dHcr¼0.45�0.02 K/kOe.
Chapter 262 R5T4 Compounds 323

Tegus et al. (2002a) synthesized single crystals of Gd5Si1.65Ge2.35 and
Gd5Si1.7Ge2.3 by means of traveling floating zone method. Magnetic measure-
ments in small applied magnetic field of 0.5 kOe show that the crystals order
magnetically at 222 and 241 K, respectively. Application of 50 kOe magnetic
field increases TC of both compounds by 18 K. The magnetic moment in
ordered state is 7.6 mB/Gd at 5 K. The value of magnetic entropy change peaks
above �30 J/Kg K for both compounds for DH¼0–50 kOe. The measured
MCE is practically identical when the magnetic field is applied along any
of the three principal crystallographic axes of these monoclinic crystals.
Zhuo et al. (2003) measured magnetocaloric properties of three Ge-rich
Gd5SixGe4�x alloys with x¼0.33, 0.6, 0.75. The Neel temperature of these
alloys is nearly same (TN¼133�1 K) but TC changes quickly with x and is
equal to 67, 92, and 108 K, respectively. The MCE at TN is small (3 J/Kg K
for 0–70 kOe field change). The magnetic entropy change at TC reaches a
saturation plateau at about �45 J/Kg K for a magnetic field change
above DH¼0–20 kOe, and for larger field changes (0–50 and 0–70 kOe),
the maximum value of DSM remains the same but the width of the MCE peak
substantially increases. The width of the “flat” MCE peak is �20 K for the
0 to 70 kOe field change. Mudryk et al. (2008) reported a similar value of
the maximum magnetic entropy change (�44 J/Kg K for a magnetic field
change from 0 to 50 kOe) for the Gd5Si0.5Ge3.5 alloy, TC¼77 K.
Matsumoto et al. (2004) measured magnetic entropy change for several
Gd5SixGe4�x alloys (x¼0.33, 0.6, 0.9, 1.01, and 2.0) and in the Ge-rich alloys
obtained similar maximum �DSM values (�40 J/mol K) for the magnetic
field change from 0 to 50 kOe; the maximum �DSM also reached a plateau
value above DH¼0–20 kOe magnetic field change.
3.2.1. Phase Composition and MCE in Doped Gd5Si2Ge2 Alloys
Lewis et al. (2004) compared the magnetic entropy change of Gd5Si1.5Ge2.5and of the same specimen coated with 100 nm layer of Fe and Al and found
some enhancement of the magnetocaloric effect as a result of coating.
Pecharsky and Gschneidner (1997c) and Provenzano et al. (2004) indepen-
dently showed that iron doping (substitution of Ge by Fe) essentially trans-
forms the first-order transition observed in Gd5Si2Ge2 (Pecharsky and
Gschneidner, 1997b) into a second-order one (no M-to-O(I) transition) with
smaller and wider peak of magnetic entropy change and negligible hysteresis
loss calculated from the M(H) data. The temperature of the transition
increases from �275 K to �300 K (Pecharsky and Gschneidner, 1997c) or
higher (�305 K according to Provenzano et al., 2004). The Provenzano
et al. (2004) study also claims that the monoclinic structure becomes the
stable phase at low temperatures in the iron-doped Gd5Ge1.9Si2Fe0.1 alloy.
However, the follow-up temperature- and magnetic-field-dependent X-ray
powder diffraction study by Her et al. (2005) of the Gd5Ge1.8Si2Fe0.2 and
Handbook on the Physics and Chemistry of Rare Earths324

Gd5Ge1.95Si2Fe0.05 alloys shows that the low-temperature phase is indeed
orthorhombic, and the monoclinic phase forms at and continues to form above
TC. Due to increase in Fe content only part of the low-temperature O(I) matrix
transforms into the M phase, and the magnetostructural transition is incom-
plete; the volume fraction of the impurity phases increases with Fe doping
as well. The volume change at TC for Gd5Ge1.95Si2Fe0.05 is equal to 1.2%.
A series of Gd5Ge1.9Si2M0.1 alloys (M¼Cu, Co, Ga, Mn, Al, Bi, Sn) was
prepared and studied by Shull et al. (2006) in order to investigate the effect
of metal doping on the magnetocaloric properties of Gd5Si2Ge2. The obtained
result is similar to the one reported by Pecharsky and Gschneidner (1997c)—
most metal additions (except Sn and Bi) promote the formation of the ortho-
rhombic phase at the expense of the monoclinic phase effectively destroying
the first-order PM!FM transition, and, therefore, GMCE. According to
Pecharsky and Gschneidner (1997c), small level doping by Ga for both Si
and Ge preserves the first-order of this transition in Gd5Si1.985Ge1.985Ga0.03.
However, Aksoy et al. (2008) observed the reduction of the magnetocaloric
effect in Gd5Si2�xGe2�xGa2x alloys with Ga substitution from 2x¼0.03 and
higher, and found that the stability of the orthorhombic phase increases
with x. Raj Kumar et al. (2008) obtained similar result (a decrease of MCE
and an increase in the O(I) phase concentration at the expense of the M
phase) with Ga doping in their study of a series of Gd5Si2(Ge1�xGax)2alloys with x¼0, 0.01, 0.02, 0.03. The Curie temperatures of the Ga-substituted
alloys correspond to the second-order transition of the O(I) phase (�299 K). It
is worth to note here that the parent Gd5Si2Ge2 alloy in this study contained a
significant amount of the O(I) phase and its magnetic entropy change was
already relatively low, �7 J/Kg K. Both the 5:3 and 1:1 minor phases were
observed by SEM in the Ga-doped alloys. Magnetocaloric properties of the
Gd5Si2Ge1.9Ga0.1 sample, which according to the X-ray powder diffraction
analysis contained �81% of the 5:4 major phase, �4% of the 1:1 phase, and
�15% of the 5:3 phase, were studied by means of heat capacity and direct
magnetocaloric measurements (Palacios et al., 2010a). The sample undergoes
a second-order transition at TC¼296.8 K. The MCE parameters for the 0 to
50 kOe magnetic field change are DSM¼6.93 J/Kg K and DTad¼8 K.
Zhang et al. (2007) confirmed the formation of the Gd5Si4 structure after
doping Gd5Si2Ge2 phase with Mn, Co, and Fe, and found that Ni doping also
produces the same effect. The substitution of Si by Fe, however, does not sup-
press the structural transition in Gd5Si2�xFexGe2 alloys but instead promotes
the formation of the 5:3 phase (Podmiljsak et al., 2008, 2009a). Iron was
mainly found in the grain-boundary phases and the main effect of its substitu-
tion is the change of the Si/Ge ratio in the 5:4 matrix. This, probably, holds
true for other transition metal substitutions: when during substitution the
Gd5Si2Ge2-based matrix becomes Si-rich the O(I) orthorhombic structure
forms, in agreement with the Gd5SixGe4�x phase diagram (Fig. 9), but when
it becomes enriched in Ge, the monoclinic structure remains stable.
Chapter 262 R5T4 Compounds 325

Podmiljsak et al. (2009b) carried out an extensive study of how the Si-for-Fe,
Ge-for-Fe, and (Si,Ge)-for-Fe substitutions affect the phase composition
and magnetocaloric properties of Gd5Si2Ge2. They found that the Fe substitu-
tion promotes the formation of the secondary Gd5(Si,Ge,Fe)3 phase, which
orders magnetically at �110 K (Podmiljsak et al., 2009b,c). The TC of the
5:4 phase increases when Fe replaces Ge but rapidly decreases when Fe
replaces Si.
A study of the effect that the Fe substitution has on microstructure and
magnetism of Gd5Si2Ge2 has been also carried out by Raj Kumar et al.
(2009). The study confirmed that Fe does not dissolve in the 5:4 matrix and
suppresses the structural first-order transition in Gd5Si2Ge2, effectively pro-
moting the formation of the O(I) phase. As a result, the MCE is significantly
reduced in Fe-doped alloys even though the magnetic hysteresis nearly disap-
pears. Microstructure and magnetocaloric effect of the Gd5SixGe3.9�xFe0.1alloys (1.8�x�2.1) were investigated by Rajkumar et al. (2010). Monoclinic
5:4 phase was observed in all alloys as a main phase; while the alloys with
x¼1.8, 1.9, 1.95, and 2 ordered via a first-order transition at TC, the alloy
with x¼2.1 exhibited a second-order of the transition with no magnetic hys-
teresis in basic agreement with the Gd5SixGe4�x phase diagram but in contra-
diction with its mostly monoclinic crystal structure (as judged by room
temperature XRD experiments). Consequently, the GMCE has been observed
in all investigated alloys except the one with x¼2.1. The 5:3 phase was
observed as a minor impurity in all alloys; in addition the 1:1 phase was
detected in the sample with x¼2.1. The iron does not dissolve in the main
matrix but forms the minor FeSi phase.
Yucel et al. (2006) studied the effect of Mn doping on the phase
composition and magnetic properties of Gd5Si2Ge2, making a series of
Gd5Si2�zGe2�zMn2z alloys with z¼0.01, 0.025, 0.04, 0.05, 0.07, and 0.10.
The second-order PM to FM transition was observed in the as-cast alloys with
no GMCE. Crystal structure, magnetic and magnetocaloric properties of the
Gd5Si2.05�xSi1.95�xMn2x alloys (x¼0, 0.3, 0.08) annealed at 900 �C for 1 week
have been reported by Yuzuak et al. (2010a). All heat-treated samples crystal-
lized in the Gd5Si2Ge2 monoclinic structure; Gd5Si3 phase was reported as a
minor phase. The Curie temperature was determined as 295 K for x¼0,
0.03, and 299 K for x¼0.08. The best magnetocaloric effect was obtained
for the sample with x¼0.03: DSM¼�11.6 J/Kg K, RCP¼220.1 J/Kg
(DH¼0–50 kOe).
Phase composition and magnetocaloric properties of Gd5Si2�xGe2�xNb2xalloys (2x¼0, 0.05, 0.1, 0.15, 0.2) annealed at 1200 �C for 1 h have been
investigated by Prabahar et al. (2010). Monoclinic phase was a majority phase
but the samples with 2x¼0.05 and 0.1 contained the O(I) phase as well. Nb
addition results in formation of Nb5(Si,Ge)3 and a-Nb phases. However, at
low concentrations Nb is beneficial for MCE because it prevents the forma-
tion of the Gd5(Si,Ge)3 phase, and a maximum DSM¼�9.6 J/Kg K was
Handbook on the Physics and Chemistry of Rare Earths326

obtained at TC¼293 K for 2x¼0.1 alloy (for a field change from 0 to
20 kOe).
Li et al. (2006) reported the enhancement of magnetocaloric effect in
Gd5Si1.95Ge2.05 by Sn doping. Among five Gd5Si1.95�xGe2.05�xSn2x samples
(2x¼0, 0.01, 0.03, 0.05, 0.10) the sample with 2x¼0.03 has the largest
MCE, DSM¼�28.9 J/Kg K for 0–20 kOe magnetic field change. Zhang
et al. (2008b) studied the effect of Sn doping on the phase formation of
Gd5Si2�xGe2�xSn2x alloys (x�0.25) and found that the Sn addition enhances
the stability of the monoclinic phase in alloys made from the “commercial
grade” Gd. Nearly single-phase monoclinic samples were obtained even
in as-cast tin-doped alloys. Aghababyan and Harutyunyan (2009) prepared a
series of Gd5Si2�xGe2�xSn2x samples (2x¼0, 0.01, 0.03, 0.05, 0.10) and
measured the temperature dependence of their dynamic magnetic susceptibil-
ity. They observed that the magnetic ordering temperatures of tin-doped
alloys are nearly the same (varying from 275 to 278 K) but are �15 K higher
than the TC of their un-doped Gd5Si2Ge2 (262 K).
Zhuang et al. (2006b) prepared a series of Gd5Si2�xGe2�xPb2x alloys
(2x¼0, 0.01, 0.03, 0.05, 0.10) and measured their magnetic and magnetocalo-
ric properties. Largest MCE (27.5 J/Kg K for DH¼0–20 kOe) was observed
at 274 K for the Gd5Si1.975Ge1.975Pb0.05. All samples were prepared by arc-
melting and annealed at 900 �C for 5 days.
Yuzuak et al. (2010b) reported the maximum DSM¼�13.6 J/Kg K and
maximum DTad¼13 K for the magnetic field change from 0 to 50 kOe in
the Gd5Si1.925Ge2.025In0.05 sample. The sample was prepared by arc-melting
followed by annealing at 1173 K for 1 week. According to the electron
microscopy and X-ray powder diffraction analysis the main phase is a
Gd5Si2Ge2-type monoclinic structure but with TC¼298 K. The Arrot plots
confirm the first order of the transition. The Gd5(Si,Ge)3 minor phase is pres-
ent in the studied specimen.
The effect of boron doping on the MCE of Gd5.1Ge2Si2 has been investi-
gated by Zhang et al. (2008a). When Ge was nominally substituted with B,
that is, when the alloy compositions were designed to be Gd5.1Ge2�xSi2Bx,
the Curie temperature increased but when Si was substituted with B in a simi-
lar fashion, the temperature of magnetic ordering was decreasing. The MCE
decreased with boron doping in both cases.
Scaling analysis of the magnetocaloric effect in Gd5Si2Ge1.9X0.1 alloys
(X¼Al, Cu, Ga, Mn, Fe, Co) has been performed by Franco et al. (2010).
In alloys doped with Al, Cu, Ga, and Mn the first-order transition is fully sup-
pressed and the universal curve can be constructed using a single reference
temperature. Moreover, all the magnetic energy curves for all compositions
undergoing second-order transition fit onto the same universal curve con-
structed using the phenomenological scaling model (Franco et al., 2006). In
the Fe-doped sample, the first-order character almost disappeared but the
presence of weak hysteresis makes the scaling procedure more complicated
Chapter 262 R5T4 Compounds 327

(two reference temperatures were needed). In the Co-doped alloy, there is a
significant thermal hysteresis, which makes the scaling results inconclusive.
Unlike the majority of studies, which examined the effect of doping on the
T element side, Prabahar et al. (2011) investigated the effect of doping Zr to
replace Gd. A series of Gd5�xZrxSi2Ge2 alloys (x¼0, 0.05, 0.1, 0.15, and 0.2)
has been prepared by arc-melting followed by annealing at 1200 �C for 2 h.
The Zr substitution results in the formation of the O(I) orthorhombic phase
in all Zr-containing samples; therefore the MCE observed in these samples
is lower compared to the un-doped Gd5Si2Ge2. Interestingly, the Curie tem-
perature increases for the x¼0.05 alloy (295 K) compared to the pure
Gd5Si2Ge2 (278 K) because, as shown above, the TC of the second-order tran-
sition is always higher than the TC of the first-order transformation for the
same composition. However, further increase of Zr content reduces the TCdue to a trivial dilution effect (substitution of the magnetic Gd atoms with
the nonmagnetic Zr atoms).
3.3. Anomalous Electrical Resistivity and Magnetoresistance
In 1998, a series of experiments performed on the Gd5Si1.8Ge2.2 compound
with the room temperature monoclinic structure established the existence of
strong coupling between magnetism and crystal structure in Gd5SixGe4�x
and led to discovery of a number of interesting and potentially useful
phenomena occurring in this system, such as giant magnetostriction and giant
magnetoresistance (Morellon et al., 1998a,b). The Gd5Si1.8Ge2.2 undergoes
PM-M$FM-O(I) magnetostructural transition at TC¼240 K. A strong
decrease of the electrical resistivity (Dr/r¼�20%) was observed at TC on
cooling, and the resistivity increased during heating above TC. The thermal
hysteresis was �5 K. In the ferromagnetic state, the application of magnetic
field induces a small (�4% at 120 kOe) and negative magnetoresistance
effect. However, above and near TC the material undergoes a first-order
field-induced phase transition to the FM state at certain critical field HCR,
which is different for each measuring temperature, and a GMR effect (magne-
toresistance Dr/r¼ [r(H,T )�r(0,T )]/r(0,T )�20%) is observed as shown
in Fig. 18 (Morellon et al., 1998b). An even stronger GMR effect,
Dr/r¼�50%, was observed in the Gd5Si0.4Ge3.6 alloy, which undergoes
AFM-O(II)–FM-O(I) transformation at TC¼81 K (Morellon et al., 2001a).
Levin et al. (1999) performed magnetic-field- and temperature-dependent
measurements of the electrical resistivity of Gd5Si2Ge2 prepared using high-
purity Gd, and observed a similar behavior around TC. The resistivity sharply
decreases below TC and reversibly increases when the samples were
heated above TC. A large thermal hysteresis of �15 K was observed in both
H¼0 kOe and H¼40 kOe measurements. Application of 40 kOe magnetic
field shifts both the TC and the resistivity anomaly by 24–30 K depending
on the sample (Levin et al., 1999). The anomalous behavior of the electrical
Handbook on the Physics and Chemistry of Rare Earths328
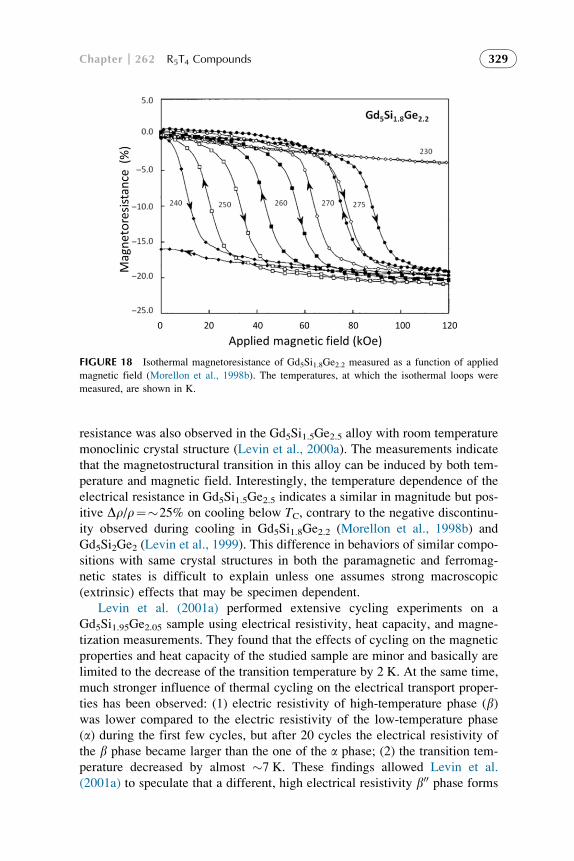
resistance was also observed in the Gd5Si1.5Ge2.5 alloy with room temperature
monoclinic crystal structure (Levin et al., 2000a). The measurements indicate
that the magnetostructural transition in this alloy can be induced by both tem-
perature and magnetic field. Interestingly, the temperature dependence of the
electrical resistance in Gd5Si1.5Ge2.5 indicates a similar in magnitude but pos-
itive Dr/r¼�25% on cooling below TC, contrary to the negative discontinu-
ity observed during cooling in Gd5Si1.8Ge2.2 (Morellon et al., 1998b) and
Gd5Si2Ge2 (Levin et al., 1999). This difference in behaviors of similar compo-
sitions with same crystal structures in both the paramagnetic and ferromag-
netic states is difficult to explain unless one assumes strong macroscopic
(extrinsic) effects that may be specimen dependent.
Levin et al. (2001a) performed extensive cycling experiments on a
Gd5Si1.95Ge2.05 sample using electrical resistivity, heat capacity, and magne-
tization measurements. They found that the effects of cycling on the magnetic
properties and heat capacity of the studied sample are minor and basically are
limited to the decrease of the transition temperature by 2 K. At the same time,
much stronger influence of thermal cycling on the electrical transport proper-
ties has been observed: (1) electric resistivity of high-temperature phase (b)was lower compared to the electric resistivity of the low-temperature phase
(a) during the first few cycles, but after 20 cycles the electrical resistivity of
the b phase became larger than the one of the a phase; (2) the transition tem-
perature decreased by almost �7 K. These findings allowed Levin et al.
(2001a) to speculate that a different, high electrical resistivity b00 phase forms
FIGURE 18 Isothermal magnetoresistance of Gd5Si1.8Ge2.2 measured as a function of applied
magnetic field (Morellon et al., 1998b). The temperatures, at which the isothermal loops were
measured, are shown in K.
Chapter 262 R5T4 Compounds 329

after extensive cycling in Gd5Si1.95Ge2.05, however, this suggestion has
not been confirmed. Hadimani et al. (2009a) measured electrical resistivity
and magnetization of a Gd5Si1.8Ge2.2 single-crystal and polycrystalline
Gd5Si2.09Ge1.91 sample. The irreversible increase in the magnetic coercivity
was observed in the M(H) loops of Gd5Si1.8Ge2.2 single crystal after the
cycling had been performed. The signatures of the first-order transition were
clearly seen on the temperature dependences of both magnetic and electrical
properties. Cycling through this transition shows a gradual increase of the
electrical resistivity values for the polycrystalline Gd5Si2.09Ge1.91 sample.
The annealing of the cycled specimen above room temperature can partially
reduce its electrical resistivity back. By holding the Gd5Si2.09Ge1.91 sample
at 360 K for 25 h, Hadimani and Jiles (2010) were able to recover 45% of
the electrical resistivity increase that had occurred due to cycling through
the first-order phase transition.
The magnetostructural transition in Gd5SixGe4�x is strongly anisotropic
and changes in lattice dimensions are significantly different along all three
major crystallographic directions because the slab movement occurs along
the a-axis in the ac-plane, while there is very little change along the b-axis(see Section 3.4). It should not come as a surprise that such anisotropy
strongly reflects upon the physical properties of these compounds, especially
when there is a possibility to measure a particular property (magnetization,
resistivity, etc.) along one of the crystallographic axes using oriented single
crystals. However, it does not necessarily mean that the effect observed along
the b-axis at the transition point will always be weaker when compared with
the a- or c-axes. For example, the negative magnetoresistance measured in
Gd5Si2Ge2 single crystal is strongly anisotropic, but MR effect observed along
the c-axis (Dr/r¼�14.5%) is �60% weaker compared to the one observed
along the a-axis (Dr/r ¼�24%), while the MR effect observed along the
b-axis (Dr/r¼�21%) is comparable to the one measured for the a-direction(Tang et al., 2004a).
Temperature- and field-dependent electrical resistivity measurements were
performed on polycrystalline Gd5Ge4 by Levin et al. (2001b). These measure-
ments were accompanied by the field-dependent heat capacity measurements
and electronic structure calculations. The zero magnetic field electrical resis-
tivity shows intriguing metal-insulator-like transition at TN¼130 K (Fig. 19).
Both the Fermi-liquid behavior of the electrical resistivity of Gd5Ge4 and its
electronic heat capacity indicate a presence of a narrow conduction band at
low temperatures. Among the models that were used to explain the electrical
resistivity behavior above TN, the hopping conductivity model provided the
best description for the observed results. In an applied magnetic field of
20 kOe, a sharp transition became apparent in the r(T) data at 29 K. The ini-
tial isothermal application of magnetic field to Gd5Ge4 at 5 K resulted in a
sharp first-order like increase in electrical resistivity of the sample above
20 kOe, which was later associated with the AFM-O(II)!FM-O(I) transition
Handbook on the Physics and Chemistry of Rare Earths330

(Pecharsky et al., 2003a). However, the sample did not return into a low elec-
trical resistivity state during demagnetization and remained in high resistivity
state during subsequent magnetic cycling showing the behavior consistent
with the formation of the kinetically arrested “magnetic glass” state (see
Section 3.6).
The electrical resistivity as a function of temperature of Gd5Ge4 in mag-
netic fields of 0, 10, 20, and 40 kOe has been measured by Xue et al.
(2009). The temperature-dependent magnetoresistance was calculated from
the measured electrical resistivity data. Large positive magnetoresistance
Dr/r¼ [r(H,T )�r(0,T )]/r(0,T ) (up to 50% for 40 kOe applied magnetic
field) was observed above 50 K; at low temperatures negative �30% magne-
toresistance was observed around 25 K.
High-resolution electrical resistivity measurements were performed on the
Gd5Si0.4Ge3.6 compound in order to study the evolution of its anomalous elec-
trical transport behavior through more than 50 thermal cycles between 10 and
300 K (Sousa et al., 2003). The electrical resistivity initially showed a sharp
peak at TC�80 K, but after cycling the peak disappeared and was replaced
by a rather monotonous increase in resistivity on heating up to the AFM
ordering temperature (TN¼128 K). Above TN the resistivity starts to decrease
on further heating and this part of r(T) behavior is not affected by the thermal
cycling. Thermal hysteresis associated with the first-order transition at TCslowly decreases through the cycling and becomes negligible after �50 cycles
are performed. However, the electrical resistivity even for the same composi-
tion is sample dependent, and one of the Gd5Si0.4Ge3.6 specimens studied in
this work had higher TC¼87 K and clear multistep behavior in the vicinity
FIGURE 19 Temperature dependence of the electrical resistivity of polycrystalline Gd5Ge4.
Chapter 262 R5T4 Compounds 331

of the first-order transition. Analysis of the anomalous resistivity behavior of
Gd5Si0.4Ge3.6 after a moderate number of cycles (13–28 thermal cycles) was
performed by Correia et al. (2004). Even more detailed investigation of this
sample was performed by Sousa et al. (2005) who found that during the initial
electrical resistivity measurements the magnetostructural transition takes
place in three closely spaced steps. Further thermal cycling results in appear-
ance of an additional reproducible anomaly �4 K below the main transition,
which remains stable after many cycles (>30).
Stankiewicz et al. (2000) studied the magnetic field and temperature
dependences of Hall resistivity in Gd5Si1.8Ge2.2 polycrystalline material. A
clear correspondence between magnetization and Hall resistivity data has
been observed. A sharp dip in the value of the Hall coefficient exists at the
temperature of the magnetostructural transition (�235 K, on heating).
3.4. Linear Thermal Expansion Studies and Magnetostriction
In addition to the GMR effect, Morellon et al. (1998a) observed the occur-
rence of a large volume contraction, DV/V¼�0.4%, in Gd5Si1.8Ge2.2 at its
transition temperature TC¼240 K using linear thermal expansion measure-
ments. As shown by magnetostriction measurements, a large volume magneto-
striction of o¼ (4.5�0.2)�10�3 can be achieved above HCR at T>TC. Thebehavior of magnetostriction is similar to the behavior of magnetoresistance
in the sense that it is reversible, significant hysteresis is present, and the value
of HCR is a linear function of temperature. The higher was the measurement
temperature the higher HCR was required to start the transition.
It is easy to deduce that occurrence of a number of different phenomena
(GMCE, GMR, GMS) at the same TCR and HCR must be caused by same pro-
cess related to the first-order nature of the magnetostructural transitions in
accordance with the Gd5SixGe4�x magnetostructural phase diagram. The unit
cell volume change observed during the temperature-dependent X-ray powder
diffraction experiment on Gd5Si1.8Ge2.2 (Morellon et al., 1998a) was compa-
rable with the value of the measured magnetostriction indicating that the GMS
and GMR effects observed in this alloy must be directly related to this struc-
tural transformation. Casanova et al. (2002a) have shown that magnetovolume
effects observed in Gd5SixGe4�x are of the same nature as the volume changes
caused by the Si/Ge chemical substitution. Magnetostructural transitions
occur in all GMCE alloys from the Gd5SixGe4�x system, which are character-
ized by strong first-order transitions at TC. In fact, the presence of magnetos-
tructural coupling underpins nearly all extraordinary phenomena observed in
R5T4 systems.
The giant magnetostriction effect becomes colossal when an oriented sin-
gle crystal is used instead of a polycrystalline material. Thermal expansion
measurements of the Gd5Si1.95Ge2.05 single-crystal oriented along the a-axisshowed sudden and strong (more than �8000 ppm) change in strain due to
Handbook on the Physics and Chemistry of Rare Earths332

first-order structural transformation (Han et al., 2002). An applied magnetic
field shifts the temperature of this transformation by about 0.49 K/kOe.
Linear thermal expansion measurements performed on a polycrystalline
Gd5Si1.95Ge2.05 sample showed much smaller change at TC: �1300 ppm
(Chernyshov et al., 2002). As noted above, the structural transformation in
Gd5SixGe4�x alloys is strongly anisotropic, and the change along the a crystal-
lographic direction is a few times higher and of the opposite sign than the
change along the c-direction. The change along the b-direction is quite small
when compared with the other two. Using temperature-dependent X-ray pow-
der diffraction Morellon et al. (2000) have found that when Gd5Si0.4Ge3.6alloy undergoes magnetostructural transition [O(II)–O(I)] on cooling at
TC¼81 K, its lattice dimensions change as follows: Da/a¼�1.6%,
Db/b¼þ0.3%, Dc/c¼þ0.7%. Using high-resolution X-ray powder diffrac-
tion Mudryk et al. (2008) found that for a sample of nearly the same compo-
sition, Gd5Si0.5Ge3.5, the difference between the lattice strains along different
crystallographic directions (TC¼77 K) is even higher: Da/a¼�1.86%, Db/b¼þ0.07%, Dc/c¼þ0.63%. The resulting unit cell volume change is DV/V¼�1.16%, which qualifies it as colossal magnetostriction that one may
expect to observe in a bulk sample with completely random orientation of
crystallites. However, if a bulk polycrystalline sample is textured along the
b- or c-direction, as it often happens in real specimens, the measured strain
would be much lower than the one measured along the a-axis of an oriented
single crystal. For example, Hadimani et al. (2011) observed that linear strain
observed in the Gd5Si2Ge2 crystal oriented at 20� angle to the a-axis (i.e., notcompletely aligned) is still three times larger than the liner strain measured for
bulk Gd5Si2.09Si1.91 polycrystalline sample. Somewhat surprisingly, Han et al.
(2003a) observed significant spontaneous LTE strain of �3000 ppm at
TC¼255 K of a Brigman-grown Gd5Si2Ge2 single-crystal oriented along the
b-axis. LTE measurements of two Gd5Si2.09Ge1.91 polycrystalline samples,
one made from high-purity Gd and another made from commercial grade
Gd, showed that the TC of the latter sample was 13 K lower compared to
the former one, but the strain observed at TC in the latter sample was about
three times higher than in the sample made from high-purity Gd (Han et al.,
2003b), which suggests that the grains in the specimen obtained from the
commercial purity Gd were primarily oriented along the a-axis during the
LTE measurements.
Magnetostriction and LTE measurements were performed on a Bridgman-
grown Gd5Si2Ge2 single crystal by Han et al. (2004). They confirmed that the
giant magnetostriction in Gd5Si2Ge2 occurs only as a result of the MST. For
example, at 15 K (�250 K below the transition) practically no magnetostric-
tion was observed, as expected for a Gd-based material (4f charge density
of Gd is spherically symmetrical). A thorough linear thermal expansion study
of the Gd5Si2Ge2 single crystal (Magen et al., 2005) shows that macroscopic
changes of the crystal’s dimensions agree very well with the calculated
Chapter 262 R5T4 Compounds 333

changes in lattice parameters for the M to O(I) transformation, that is,
Da/a¼�0.94%, Db/b¼þ0.13%, and Dc/c¼þ0.22%.
Anomalous volume expansion of �0.8% was observed during thermal
expansion measurements performed on a polycrystalline bulk Gd5Si2Ge2sample prepared using Ames Laboratory Gd, which generally has 99.9 at.%
or better purity with respect to all other elements in the periodic table
(Nersessian et al., 2003, 2004), also in agreement with crystallographic data.
The study found a substantial decrease in the amount of strain produced at
the transition (1300 vs. 8000 ppm) when a composite made out of a ball-
milled Gd5Si2Ge2 (35 vol.%) and vinyl ester resin (65 vol.%) was tested.
Magnetic-field-induced strain for the composite results in a volume strain of
1650 ppm (Nersessian et al., 2004).
Nazih et al. (2003) carried out LTE measurements on a Gd5Si1.72Ge2.28single crystal along all three major crystallographic axes. They obtained the
following values of the step-like changes at TC¼240 K (on heating):
(DL/L)a¼0.68%, (DL/L)b¼�0.2%, and (DL/L)c¼0.21%. The calculated
volume change DV/V is positive and amounts to 0.27%. Using the Clausius–
Clapeyron relation Nazih et al. (2003) estimated a hydrostatic pressure depen-
dence dTC/dP¼3.2�0.2 K/kbar but suggested that the pressure effect is
strongly anisotropic.
LTE results were reported for polycrystalline Gd5Si2Ge2 and Gd5Si0.6Ge3.4alloys by Kamiya et al. (2004) and Kamiya et al. (2005). For Gd5Si2Ge2, the
LTE was measured in magnetic fields of 0, 10, 20, 30, 40, and 50 kOe. How-
ever, these measurements of LTE by the capacitance method were problem-
atic because some of the specimens were too brittle, and some disintegrated
when the magnetic field was applied.
Magen et al. (2003b) studied the magnetoelastic behavior of Gd5Ge4 by
means of linear thermal expansion and magnetostriction measurements in
the temperature range from 5 to 300 K and in applied magnetic fields up to
120 kOe. Zero magnetic field measurements indicated no anomaly in LTE
data on cooling but an anomaly on heating at 16 K. LTE measurements in
applied magnetic fields of H¼20, 50, and 120 kOe have been performed indi-
cating a clear presence of a first-order O(I)$O(II) structural transition
(TC�50 K for 50 kOe data), which has been confirmed afterward by
temperature- and magnetic-field-dependent X-ray powder diffraction studies
(Mudryk et al., 2005a; Pecharsky et al., 2003a). The temperature of this tran-
sition increases with the magnetic field at a rate of �0.5 K/kOe, similar to
other Gd5SixGe4�x compounds. The magnetostriction isotherms indicate a
reversible first-order transition with �7 kOe hysteresis above 20 K. Below
20 K the magnetoelastic behavior starts to show significant irreversibility
effects associated with the “magnetic glass” kinetic phenomena discussed in
Section 3.6.
According to the temperature- and magnetic-field-dependent X-ray pow-
der diffraction measurements by Mudryk et al. (2005a), the following LTE
Handbook on the Physics and Chemistry of Rare Earths334

coefficients were obtained for Gd5Ge4 in the paramagnetic state: 0.69, 1.18,
and 1.03�10�5 K�1 along the a-, b-, and c-axes, respectively. It is interestingto note that the normal thermal expansion is the smallest along the a-axiswhile the structural transformations in R5T4 alloys usually result in the largest
shift in that same direction. In Gd5Ge4, the relative changes in lattice para-
meters during the magnetic-field-induced structural O(II)!O(I) transforma-
tion are Da/a¼�1.9%, Db/b¼þ0.1%, and Dc/c¼þ0.6% (Mudryk et al.,
2005a). The resulting contraction of the unit cell volume is DV/V¼�1.2%.
The temperature dependence of lattice parameters of Gd5Si4 was
studied by Altounian and Liu (2007) using temperature-dependent X-ray pow-
der diffraction. They found that the lattice expands evenly and almost linearly
above and below TC¼336 K, but small anisotropic shifts in lattice parameters
were observed around TC. Between 325 and 345 K, the a-parameter remains
almost the same when accounting for the regular thermal expansion
(a325K¼7.4834(1) A vs. a345K¼7.4846(2) A), while the b parameter contracts
slightly (b325K¼14.7476(3) A vs. b345K¼14.7452(4) A) and the c parameter
expands by �0.08% (c325K¼7.7493(2) A vs. c345K¼7.7560(1) A).
3.5. Thermoelectricity and Spontaneous Generation of Voltage
The spontaneous generation of an electrical signal (voltage) at the magnetos-
tructural transition, or SGV effect, has been observed in several Gd5SixGe4�x
alloys with x¼0.33, 1.5, 1.95, and 2 (Levin et al., 2001c). Majority of
the measurements were performed on the Gd5Si1.95Ge2.05 sample, which
undergoes the O(I)-FM$M-PM transition at 266 K during heating and at
249 K during cooling in zero magnetic field. When the sample temperature
is changed at 1.5 K/min rate across the transition distinct voltage signals of
8 mV (cooling) and �6 mV (heating) are observed with their peaks located
at the above mentioned transition temperatures. When the temperature sweep
is performed in applied magnetic field (i.e., 20 kOe) the temperature at which
the SGV occurs is 12 K higher compared to the zero magnetic field measure-
ment. This is expected because the magnetic field raises the first-order transi-
tion temperatures of Gd5SixGe4�x alloys. In most measurements, observed
SGV signals were not single peaks but contained a number of relatively
random spikes occurring as the transition was approached. In all cases,
however, a strongest peak could be clearly distinguished as the peak of the
transition. When the sample’s temperature was changed at a higher rate
(e.g., 3 K/min), the recorded electric signal was stronger.
An identical effect was observed when the sample was isothermally mag-
netized or demagnetized near the transition temperature (Levin et al., 2001c)
indicating that the occurrence of a magnetostructural transition is the origin of
the SGV phenomena in Gd5SixGe4�x. In other measured Gd5SixGe4�x sam-
ples, the SGV is also observed around the temperature of magnetostructural
transition (MST). Thus, this phenomenon is expected to occur in all R5T4
Chapter 262 R5T4 Compounds 335

systems undergoing first-order transitions and, probably, in many other metal-
lic and nonmetallic systems with structural transitions. The nonequilibrium
first-order phase transition process results in a noneven distribution of latent
heat (expelled or absorbed, depending on the direction of the transformation)
across the specimen during the transition. The created thermal gradient gener-
ates a thermoelectric response, which, apparently, is the basis for the observed
SGV effects. It is safe to suggest that the SGV signal occurs in Gd5SixGe4�x
samples when the transition is triggered by other thermodynamic variables,
for example by applied hydrostatic pressure.
Zou et al. (2006) studied the SGV effect using both polycrystalline and
single-crystalline Gd5Si2Ge2. The experiments showed the presence of revers-
ible and repeatable SGV signals along all crystallographic directions in
response to the changes in temperature and applied magnetic field. The mag-
nitude of the response is anisotropic and depends on the sweep rate (see
Fig. 20). Usually the higher sweep rate (both temperature and magnetic field)
FIGURE 20 The magnitude of SGV (A) and the change of the critical field of SGV compared
with the critical field at 1 kOe/min sweep rate (B) as functions of the magnetic-field sweep rate
in Gd5Si2Ge2 (Zou et al., 2006).
Handbook on the Physics and Chemistry of Rare Earths336

the stronger is SGV signal. The signal for the polycrystalline sample is about
three times weaker than for the single crystal.
Temperature-dependent measurements of thermopower of Gd5SixGe4�x
alloys were performed on a Gd5Si0.4Ge3.6 sample [undergoes O(II)-AFM-
O(I)-FM transformation at TC¼78 K] by Sousa et al. (2002). A sharp change
in thermopower has been observed at TC, and a shallow minimum in Seebeck
coefficient versus temperature-dependence occurs between TC and TN reach-
ing �23 mV/K at �95 K. The first derivative of such dependence clearly dis-
plays critical features at both TC and TN. Contrary to the electrical resistivity
measurements (e.g., Morellon et al., 2001a), thermal cycling does not have
much effect on thermoelectric behavior. In addition to Gd5Si0.4Ge3.6, Pinto
et al. (2005) also reported temperature-dependent thermopower of Gd5Ge4and Gd5Si1.8Ge2.2 samples. Distinct steps were observed in Seebeck coeffi-
cient versus temperature curves at the temperatures of magnetostructural tran-
sition measured for both Gd5Si0.4Ge3.6 and Gd5Si1.8Ge2.2. A Gaussian
distribution, typical for the first-order transformations, was observed in the
first derivative of the temperature-dependent thermopower plots in the vicin-
ity of TC.Temperature dependences of electrical resistivity and thermopower were
measured on bulk polycrystalline Gd5SixGe4�x samples (x¼1.7, 2.0, 2.2,
and 2.3) annealed at 1573 K for 1 h (Raj Kumar et al., 2011). A noticeable
change in thermopower (�8 mV/K) was obtained at the temperature of the
magnetostructural transition (273 K) for the Gd5Si2Ge2 compound.
3.6. Kinetics of Magnetostructural Transitions in Gd5SixGe4�x
Ideally, first-order transitions occur momentarily when at a certain critical
point one phase is replaced by another. In reality, mainly due to macroscopic
effects, such as strain, imperfections of the crystal lattice, compositional inho-
mogeneity, etc., these transitions develop over a certain temperature (or mag-
netic field, or pressure) range, and instead of having only a single critical
parameter (TCR, HCR, or PCR) they may be characterized by, for example,
HCR1 of the start and HCR2 of the end of a magnetic-field-induced transition.
In the region HCR1<H<HCR2, a system exists in the so-called phase sepa-
rated state, where the low-field and high-field phases coexist at proportions
that depend on the magnetic field value. Moreover, first-order transitions usu-
ally exhibit thermal (pressure, magnetic field) hysteresis, and the critical para-
meters of the transition during heating (demagnetization) are different from
those of the same transition during cooling (magnetization). As a result,
instead of having a single-phase transition boundary on the ideal H–T dia-
gram, real Gd5SixGe4�x specimens typically have complex H–T diagrams
similar to the one shown in Fig. 21, which was constructed for Gd5Si1.5Ge2.5using magnetization measurements (Levin et al., 2000b, 2001d).
Chapter 262 R5T4 Compounds 337

The dc magnetic field increases the PM$FM transition temperature
in Gd5Si1.5Ge2.5 by �0.36 K/kOe (Levin et al., 2001d). Both field and
temperature-induced transitions are characterized by large hysteresis, indicat-
ing the formation of the magnetically and structurally heterogeneous system
in Gd5Si1.5Ge2.5 near the transition where O(I)-FM and M-PM phases coexist.
Teng et al. (2002) provided a phenomenological description of the PM$FM
first-order transition for Gd5SixGe4�x alloys with 0.96<x<2.0 using the
Landau–Devonshire theory. They reasonably reproduced the field-driven
magnetic transitions as well as thermal and magnetic hystereses.
The dynamic of the first-order magnetostructural transition in
Gd5Si0.2Ge3.8 compound was studied by means of high-sensitivity DSC mea-
surements (Casanova et al., 2004a). The study found that the entropy change
associated with the transition is different for the thermally and field-induced
processes due to the work done by the magnetic field during field sweep.
The study reports the “jerky” character of calorimetric curves, which is
explained by the avalanche-type dynamics. Such avalanches occur as a result
of nucleation and growth of domains of the new structure taking place during
a first-order transition. The structure of the avalanches becomes repetitive
after a material is cycled a few times through the transition, and can be char-
acterized by power-law distribution (Casanova et al., 2004a).
Perez-Reche et al. (2006) detected acoustic emission occurring when
Gd5Si2Ge2 undergoes magnetostructural transition from M-PM to O(I)-FM
FIGURE 21 Magnetic field (H)–temperature (T) diagram of Gd5Si1.5Ge2.5 (Levin et al., 2000b,
2001d). Critical magnetic fields are determined from the isothermal magnetization measure-
ments and represent the start and the end of the field-induced magnetic PM-M$FM-O(I)
transformation.
Handbook on the Physics and Chemistry of Rare Earths338

state. The acoustic emission spectra confirm the presence of the avalanches
but there is no characteristic scale for the size of these avalanches. The
analysis of results shows that thermal fluctuations are irrelevant for the trans-
formation process indicating athermal character of the M$O(I) transition.
Guimaraes et al. (2009) propose to use acoustic detection of the adiabatic tem-
perature change for the determination of the magnetocaloric effect, and tested
this method on Gd and Gd5.09Si1.88Ge2.03 samples. The measurements were
reproducible and with an appropriate calibration the DT results obtained for
Gd were consistent with those obtained by direct measurements. The mea-
surements performed on the Gd5.09Si1.88Ge2.03 alloy clearly identified a two-
phase nature of the sample and allowed distinguishing between first- and
second-order transitions.
The Bridgman-grown single crystal was used to study magnetic relaxation
in Gd5Si2Ge2 by Leib et al. (2004). The dynamics of the first-order transfor-
mation is different from the magnetization reversal that may be observed in
conventional magnetic relaxation experiments. The measured variations of
magnetic moment with time are consistent with a thermal activation process
with a single energy barrier, which must be overcome in order to proceed with
transformation from one polymorph into another. The study found that mag-
netization curves took as long as 300 s to approach its asymptotic values.
The energy barrier was estimated to be 4.2�0.2 eV (Leib et al., 2004).
A particularly complex kinetic behavior is observed at low temperatures in
Gd5Ge4. When cooled in zero or low (<�10 kOe) magnetic field, this com-
pound remains in the AFM-O(II) state (TN¼125 K) down to at least �2 K
even though the AFM–FM transition may be expected at �25 K from the lin-
ear extrapolation of the AFM–FM phase boundary of the Gd5SixGe4�x phase
diagram shown in Fig. 10. Application of magnetic field at or above HCR trig-
gers a sharp metamagnetic-like magnetostructural transformation from the
AFM-O(II) into FM-O(I) phase (the actual value of HCR depends on many
factors including temperature, thermal history, purity of the rare earth metal
used in sample preparation, etc., but normally lies in the range between 10
and 16 kOe). However, after the Gd5Ge4 sample is isothermally demagnetized
from the FM state, the second magnetization curve is much different from the
first one and is more typical of a conventional ferromagnetically ordered
material (Fig. 22, Levin et al., 2002). Figure 23 shows the structural low-
temperature diagram of Gd5Ge4, determined using X-ray powder diffraction
(XRPD) experiments performed as a function of temperature and applied
magnetic field (Mudryk et al., 2005a). The H–T phase diagram of Gd5Ge4:
(a) indicates structural phase coexistence (phase separation) over an extended
range of temperatures and magnetic fields, (b) is history dependent, and (c)
shows correspondence between magnetism and crystal structure similar to
other Gd5SixGe4�x alloys. It should be noted here that the transition range
observed using the XRPD method is typically broader than the range of tran-
sition observed in magnetization measurements (Mudryk et al., 2005a, 2008).
Chapter 262 R5T4 Compounds 339

FIGURE 23 Magnetic field (H)–temperature (T ) structural diagram for (a) zero-field cooled
Gd5Ge4; (B) field cooled Gd5Ge4. Zero-field cooled magnetization data measured during warming
of a polycrystalline Gd5Ge4 are shown for comparison (measured by Tang et al., 2004b). High-
field (HF) Gd5Ge4 corresponds to O(I) crystal structure. After Mudryk et al. (2005a).
FIGURE 22 Isothermal magnetization of polycrystalline Gd5Ge4 measured at 4.3, 6.3, and
10.3 K. The sample was cooled to the temperature of the measurement in zero magnetic field.
The second magnetization curve coincides with the first demagnetization curve (Levin et al.,
2002).
Handbook on the Physics and Chemistry of Rare Earths340

This is not surprising because larger quantities of material are typically used
in these XRPD experiments (Holm et al., 2004), while magnetic measure-
ments utilize much smaller (and more homogeneous) quantities of material
producing, therefore, sharper transitions.
Chattopadhyay et al. (2004) noted that distinct metastable behavior in
Gd5Ge4 is evidenced by large magnetic relaxation present in H–T region were
the field-induced AFM to FM transition occurs. The magnetization was still
changing with time at certain combinations of applied magnetic field and tem-
perature (e.g., T¼5 K, H¼18.5 kOe), 50 min after both the magnetic field
and temperature were stable.
Interestingly, in ZFC Gd5Ge4 the HCR required to initiate the transforma-
tion in zero-field cooled sample has three types of behavior: below �13–15 K,
dHCR/dT is negative, above �23–25 K it is positive, and between �15 and
�25 K it remains nearly constant (Fig. 23). This reflects the presence of the
so-called freezing boundary, which is shown in the detailed phase diagram
of the system in Fig. 24. In essence, the state below the freezing boundary
is a unique magnetically and crystallographically ordered state that behaves
much as a magnetic glassy state (Roy et al., 2006). Here, when Gd5Ge4 is
cooled in zero or low magnetic fields, the AFM-O(II) Gd5Ge4 lattice becomes
“frozen” or kinetically arrested. Thus, when the AFM-O(II)–FM-O(I) bound-
ary is crossed, the system is retained in a nonequilibrium state and in order to
transform it into the thermodynamically stable ferromagnetic state it needs
to be moved out of the frozen region by changing magnetic field and/or
FIGURE 24 The magnetic field (H )–temperature (T ) phase diagram of a Gd5Ge4 single crystal
with the magnetic field vector parallel to the b-axis. The diagram maps the kinetically arrested
state below the freezing boundary, short-range FM correlations (SRFMC) below TN (�130 K),
and a Griffiths-like state (GP) above TN.
Chapter 262 R5T4 Compounds 341

temperature (Roy et al., 2007). The dynamics of this transformation is typical
of glasses, especially when the system is near the freezing boundary; however,
this phenomenon should not be confused with spin-glasses where the spin
configuration is frozen at random on a microscopic scale. In fact, using Hall
probe microscopy Chattopadhyay et al. (2008) provided visual evidence that
the magnetic glass state in Gd5Ge4 is clearly heterogeneous and contains equi-
librium ferromagnetic clusters randomly distributed in a kinetically arrested
antiferromagnetic matrix. Energy fluctuations (introduced for example
through thermal cycling) lead to the formation of additional FM clusters from
the AFM matrix similar to glass recrystallization process.
When Gd5Ge4 is cooled in magnetic fields above a certain HCR, the “freez-
ing” effect is not observed (Fig. 25) because when the AFM-O(II)–FM-O(I)
boundary is approached from the “warm” side of the phase diagram this is
the boundary that is first crossed by the material. At high temperatures,
where the freezing region has no effect on magnetic behavior, the M(H)curves from the first, second, and subsequent cycles become identical, and
the transformation dynamics becomes typical as in the other alloys from the
Gd5SixGe4�x system experiencing a first-order magnetostructural transition,
for example, the H–T phase diagram becomes similar to the one shown in
Fig. 21. As shown in the Section 3.7, the kinetic arrest may also be removed
by application of hydrostatic pressure.
Hardy et al. (2004) reported that their Gd5Ge4 sample already had a size-
able ferromagnetic component as follows from their virgin ZFC M(H) curve
FIGURE 25 The irreversibility of the O(I)-FM Gd5Ge4 phase content observed while comparing
the ZFC and FC sets of X-ray powder diffraction measurements performed as a function of tem-
perature in different magnetic fields (Mudryk et al., 2005a).
Handbook on the Physics and Chemistry of Rare Earths342

measured at T¼2 K. They suggested that a microstructure as well as purity
of starting Gd metal could have stabilized the high-field FM phase.
Interestingly, this study also pointed out strong similarities between the kinetic
behaviors (in M vs. H measurements) of Gd5Ge4 and manganite compound
Pr0.6Ca0.4Mn0.96Ga0.04O3 at 3.25 K. Similarly, formation of some amount of
the FM phase in the Gd5Ge4 sample in a zero magnetic field was observed
by Xue et al. (2009) in their isothermal magnetization measurements. There-
fore, the H–T phase diagram of Gd5Ge4 constructed by Xue et al. (2009)
reflects the presence of an extended AFMþFM phase separated regions, which
do not necessarily occur due to the kinetic arrest but, perhaps, due to peculiari-
ties of the sample preparation, the purity of Gd being likely the most important
factor. Ouyang et al. (2011) prepared Gd5Ge4 alloy using commercial 99.9 wt.%
pure Gd metal and confirmed that it contains a significant fraction of low-field
FM component clearly visible in the M(H) curves. Moreover, the field-induced
AFM!FM transformation, which is sharp in high-purity samples, especially
at low temperatures (Fig. 22), becomes unusually sluggish in this sample
although broad magnetic hysteresis indicates that this transformation is still a
first-order one. The pulse field measurements indicate interesting developments
in the transition dynamics as a function of the magnetic field sweep rate.
Levin (2009) studied magnetic properties of a series of Gd5SixGe4�x
alloys, x¼0.02, 0.06, 0.1, 0.2, 0.3, 0.4, and showed that even very small sub-
stitution of Ge atoms with Si (x¼0.06) quickly promotes the formation of the
FM phase and a phase separated AFMþFM state exists in ZFC samples even
without application of magnetic field. This work also confirms that as the Si
concentration increases further (0.1�x�0.4) the Gd5SixGe4�x alloys are fer-
romagnets below TC.The glassy nature of Gd5Ge4 is manifested through time dependence of
magnetization of the oriented single crystals when it is measured inside
the region (low temperature, low fields) delineated by the freezing boundary.
For example, the character of the magnetostructural transition in Gd5Ge4 is
influenced by magnetic-field step size during the magnetization measure-
ments. The dynamics of both the magnetization and demagnetization pro-
cesses is associated with approaching true equilibrium states, which
becomes easier with a reduction of the magnetic field step. Small but frequent
discontinuities in magnetization, that is multistep behavior, are commonly
observed in Gd5Ge4 samples during slow measurements (Ouyang et al.,
2007a). When the rate of field sweep is very high, for example, in pulse field
measurements the large magnetocaloric effect observed in the Gd5SixGe4�x
alloys starts to play a defining role, especially when the heat exchange
between the sample and environment is low (Ouyang et al., 2008). In such
a case, the magnetic glass state may not be observed in Gd5Ge4 due to the fact
that the sample’s temperature rises above the freezing boundary as a result of
MCE and the kinetic arrest is thus removed. The same study reports the
increase of HCR with higher sweep rates below 20 K.
Chapter 262 R5T4 Compounds 343

Another interesting kinetic phenomenon observed in Gd5Ge4 is magnetic
deflagration. Deflagration commonly defines a slow burning process, for
example in a combustion engine, in contrast to an explosion. Recently, the
concept of deflagration has been applied to the spontaneous magnetization
process happening in some classes of magnetic materials (e.g., manganites
and molecular magnets). It was found that the energy released by a magnetic
transition initiated locally in a specific part of a material may “ignite” the
nearby regions causing the propagation of the magnetic transformation pro-
cess in striking similarity to chemical oxidation (burning) reaction. Casanova
et al. (2005b) have found that the low-temperature magnetostructural transi-
tion in Gd5Ge4 dissipates heat differently depending on whether the transition
is reversible or not. They observed that when the transition is reversible
(above the “freezing boundary,” Fig. 24) the heat exchanged by the sample
is mostly the latent heat of the first-order transition. However, when this tran-
sition is irreversible, the heat dissipation value strongly increases with the
lowering temperature (i.e., with the sample being moved further into the
metastable frozen state), reaching 237 J/Kg at 4 K. In a follow-up study,
Velez et al. (2010) revealed that the released heat is sufficient to initiate mag-
netic deflagration, which originates from the metastable state of Gd5Ge4 at
low temperatures. Essentially, when a kinetically arrested AFM Gd5Ge4 spec-
imen is moved into a certain point of the H–T diagram where its thermody-
namically stable modification is the FM-O(I) phase (e.g., at T¼2 K and
H¼�20 kOe), the application of a weak heat pulse to one end of the sample
(sample dimensions in the experiment were 4�1�1 mm3) triggers the
avalanche-like magnetostructural transformation at a speed 0.1–1 m/s that
transforms the whole Gd5Ge4 sample into FM phase. The process is driven
by the conductance of the heat released by the structural transformation of
the metastable phase and the kinetics of the transformation agrees well with
the deflagration theory (Velez et al., 2010). Investigation of the deflagration
process in a single crystal of Gd5Ge4 found that this process is anisotropic,
particularly with respect to the applied magnetic field vector (Velez et al.,
2012). The deflagration was induced by controlled pulses of surface acoustic
waves. The measured data show that the thermal diffusivity in Gd5Ge4 is
anisotropic, following ka>kb>kc.Interestingly, the development of a field-induced magnetostructural transi-
tion in Gd5Ge4 (and, likely, in other Gd5SixGe4�x alloys) is affected by the
actual size of the polycrystalline particles. Magnetometry and scanning Hall
probe imaging studies show that the critical field HCR for the AFM-O(II)!FM-O(I) transition in Gd5Ge4 can be reduced by 20% when small fragments
(�100 mm) removed from the bulk sample are measured as compared to the
parent bulk sample (Moore et al., 2006). It is believed that the fragmentation
reduces the strain energy constraining the nucleation of the FM phase within
the AFM matrix at the onset of the field-induced transformation. Hall imaging
shows that the macroscopic domain size is on the order of 30–100 mm, so a
Handbook on the Physics and Chemistry of Rare Earths344

single fragment extracted from the bulk sample would contain up to 3–5
domains only. The nucleation process in this case would proceed
virtually stress-free. On the other hand, when the sample is powdered the
material’s behavior is opposite to fragmentation, with broad transition loops
and depressed saturation magnetization (Moore et al., 2006).
Because in Gd5SixGe4�x alloys strain produced during the structural tran-
sition in bulk alloy affects the path of the transition, and, consequently, the
critical parameters, such as HCR, one may expect to see the evolution of the
H–T diagram when the material is cycled through the transition multiple
times. As noted above, cycling has a profound effect on the electrical resistivity
of Gd5SixGe4�x compounds, for example for Gd5Si0.4Ge3.6 (Sousa et al., 2003).
Cycling through the structural transition in the presence of stress-controlling
boundaries results in the so-called training effect. Microstructure of cycled
materials changes compared to the microstructure of virgin samples in order
to minimize strain energy as was experimentally observed by Manekar et al.
(2006) in Gd5Ge4. It is important to note that training may not necessary
involve the change in a crack structure (not observed by Manekar et al.,
2006), but creates changes at lower length scales, below �20 mm. Using the
same scanning Hall probe setup, Perkins et al. (2007) were able to show the for-
mation of separated phase clusters during the magnetostructural transition in
Gd5Ge4. In addition, they showed that microstructural features have a strong
influence on both nucleation and growth of the emerging phase (O(I)-FM in
case of magnetization) ultimately controlling the macroscopic properties (such
as magnetization) of this material. Comparing the development of reversible
(at 35 K) and irreversible (at 6 K) transitions, significant differences in the
nucleation rate but not in the growth rate have been observed in Gd5Ge4.
Localized magnetic relaxation measurements were performed using a scan-
ning Hall probe technique in Gd5Ge4 at 6, 10, and 35 K (Moore et al., 2008).
The characteristic time for bulk relaxation at 6 K is �38 min. Contrary to bulk
magnetization relaxation measurements, sharp steps were observed in local
magnetization during the relaxation experiments at 10 and 35 K but not at 6 K.
Yuan et al. (2010) observed very small (�7 Oe) exchange bias effect in
Gd5Ge4 polycrystalline specimen in the hysteresis loops measured at 5 K
between �3000 Oe. The authors of the study believe that the observed effect
originates from exchange coupling between FM clusters and AFM matrix in
the kinetically arrested state. The exchange bias field decreases with temper-
ature and is history dependent.
3.7. Pressure Effects
Because magnetostructural transitions in Gd5SixGe4�x system are character-
ized by a large volume change, it is expected that they will be substantially
affected by application of an external pressure, for example, hydrostatic pres-
sure. Indeed, the transition temperature of Gd5Si1.8Ge2.2 is dependent on the
Chapter 262 R5T4 Compounds 345

applied pressure, increasing at a rate of dTC/dP¼3.79 K/kbar (Morellon et al.,
1998a), though the actually reported rate somewhat varies in different studies.
An in situ X-ray synchrotron powder diffraction experiment directly con-
firmed the polymorphic transformation from the monoclinic b-Gd5Si2Ge2(M) to the orthorhombic a-Gd5Si2Ge2 (O(I)) when hydrostatic pressure was
applied at room temperature (Mudryk et al., 2005b). The transition occurs
between 10 and 20 kbar at 298 K. It was shown that in the Gd5SixGe4�x sys-
tem the application of hydrostatic pressure may induce magnetostructural
transition similar to those induced by the chemical substitution, temperature,
and/or magnetic field changes.
Magnetic and magnetocaloric properties of Gd5Si2Ge2 under hydrostatic
pressures up to 9.2 kbar were investigated by Carvalho et al. (2005). The
study confirmed that the magnetic ordering temperature of M-Gd5Si2Ge2increases with pressure, but reported a higher rate of 6.1 K/kbar than quoted
by Morellon et al. (1998a) (see above). Since the orthorhombic (g-phase)Gd5Si2Ge2 was also present in the prepared sample, the pressure dependence
of the TC of this phase was estimated to be 0.9 K/kbar—a much lower value
because this transition is a second-order one. Above 6 kbar only a single tran-
sition was observed because both the first-order and the second-order phase
transformations merge at this pressure. Morellon et al. (2004a) reported
dTC/dP equal to 0.3 K/kbar for the O(I)-Gd5Si3.2Ge0.8 phase and �3 K/kbar
for M-Gd5Si1.8Ge2.2 and O(II)-Gd5Si0.4Ge3.6. Morellon et al. (2004a) also
observed a moderate effect of hydrostatic pressure on the PM!AFM transi-
tion in O(II)-Gd5Si0.4Ge3.6, dTN/dP¼0.7 K/kbar. Magnetization measure-
ments at 4 K indicate that the saturation magnetization does not change
with pressure; but the near room temperature MCE strongly decreases with
pressure when the order of the magnetic transition changes from first to sec-
ond (Carvalho et al., 2005).
Magen et al. (2003a) studied the effect of the applied hydrostatic pressure
on the phase transitions in Gd5Ge4 using LTE and magnetization measure-
ments. They found that ferromagnetic order can arise in this compound when
the applied pressure initiates the transition from the high-volume O(II) phase
into the low-volume O(I) phase. As the pressure goes up, the phase separated
state (mixture of AFM-O(II)þFM-O(I)) occurs first, and above 10 kbar
the entire volume of the sample is in the O(I) structure below the TC(10 kbar)¼53 K. According to their estimates, the rate of temperature change
for the first-order transition (dTC/dP¼�4.9 K/kbar) is about seven times
higher than the pressure dependence of the second-order transition tempera-
ture (dTN/dP¼�0.7 K/kbar). The compressibility of Gd5Ge4 at low pressure
is equal to �(1/V)dV/dP¼1.85(1) Mbar�1.
Carvalho et al. (2008) also performed a pressure-dependent magnetization
study of Gd5Ge4, and obtained dTC/dP¼45 K/GPa (�4.5 K/kbar), in good
agreement with Magen et al. (2003a). However, they did not detect any
change in TN with applied pressure. The magnetic entropy change as a
Handbook on the Physics and Chemistry of Rare Earths346

function of both temperature and applied pressure was obtained from isother-
mal magnetization data (DH¼0–50 kOe). Two MCE peaks, at 11 and 43 K
were observed. When the pressure increases the low temperature peak moves
toward lower temperatures and eventually disappears; the temperature of the
second �DSM peak moves toward higher temperatures and its magnitude fluc-
tuates between 20 and 25 J/Kg K (Carvalho et al., 2008). The pressure–
temperature (P–T) phase diagram shows the presence of an FMþAFM phase
separated state similar to the H–T diagram. The total entropy change values
obtained using different measurement protocols are different reflecting the
complex transition kinetics in Gd5Ge4.
The effect of applied hydrostatic pressure (P¼0, 2.2, 3.7, and 8.7 kbar) on
the magnetocaloric effect in Gd5Ge4 has also been studied by Arnold et al.
(2009a) in the range of temperatures between 16 and 100 K. The �DSM value
for a 0 to 50 kOe magnetic field change was �24 J/Kg K in zero applied pres-
sure, in agreement with other studies. The maximum �DSM values measured
under the applied pressure are lower compared to the results reported by
Carvalho et al. (2008). Because the applied pressure promotes the formation
of the FM phase, and consequently increases the initial low-field magnetization
in Gd5Ge4, the sharp metamagnetic transitions at HCR observed at P¼0
become much smoother at P¼2.2 and 3.7 kbar. At P¼8.7 kbar, the magnetiza-
tion curves have typical FM shape indicating pressure-induced formation of
the FM phase in the majority of the samples. The MCE decreases significantly
at low applied pressures: the maximum �DSM drops almost twofold at
P¼2.2 kbar (12.3 J/Kg K) compared to the P¼0 result (24 J/Kg K). As the
applied pressure increases, the removal of the magnetic inhomogeneity state
becomes complete in Gd5Ge4 (Tseng et al., 2008a), and the MCE starts to mod-
estly increase again (Arnold et al., 2009a).
Effect of the hydrostatic pressure on the magnetic transitions in
Gd5SixGe4�x system has been carefully studied using X-ray magnetic circular
dichroism (XMCD) spectroscopy (Tseng et al., 2007). In particular, the differ-
ences and similarities between the chemical pressure, induced by Si substitu-
tion and external hydrostatic pressure were observed and analyzed with the
help of other research tools such as temperature-dependent X-ray powder dif-
fraction and magnetization measurements. A clear correspondence between
the P–T and x–T diagrams of the Gd5SixGe4�x system was reported. However,
it was also found that a similar volume change results in �3 times larger
increase in TC with Si substitutions than with hydrostatic pressure (Fig. 26).
Apparently, Si doping is more effective in the stabilization of the FM state
in these alloys than just compressing the lattice that also promotes the forma-
tion of the low-volume phase. On the other hand the XMCD pressure study of
the Gd5SixGe4�x with low x¼0.1, 0.2, and 0.3 showed that Si in small con-
centrations leads to the emergence of ferromagnetism when compared to
unsubstituted Gd5Ge4, as expected (Tseng et al., 2008a). However, both mag-
netization and X-ray powder diffraction measurements indicated the presence
Chapter 262 R5T4 Compounds 347

of the magnetically and structurally inhomogeneous (phase separated) state
with both AFM-O(II) and FM-O(I) phases coexisting over an extended
temperature range (tens of Kelvin). Application of a magnetic field, while
increasing the content of the FM-O(I) phase, could not completely remove
this inhomogeneity. The strong irreversibility between ZFC and FC data
and reduced low-temperature magnetization were also strong indications of
the magnetic frustration present in these low-Si specimens. At the same time,
the application of hydrostatic pressure (at 17 K, P¼2, 3, and 5 GPa for
x¼0.3, 0.2, and 0.1, respectively) results in the removal of the magnetically
inhomogeneous state as can be judged by the restoration of the saturation
magnetization values measured by XMCD (Tseng et al., 2008a).
Similarly, XMCD data collected at the Gd L3 absorption edge at T¼35 K for
pressures from 0 to �15 GPa for Gd5Si0.15Ge3.85 and Gd5Si0.5Ge3.5 samples
show that the former sample has reduced saturation magnetization at ambient
pressure indicative of competing AFM and FM interactions. Above 6 GPa
saturation magnetizations of both samples become nearly identical indicating
stabilization of the FM state (Haskel et al., 2008). Pressure dependence of
the magnetic ordering temperature has also been studied by XMCD for
Gd5Si1.5Ge2.5, and the two distinct regions with two different dTC/dP rates
were observed (Tseng et al., 2008b): below 7.2 GPa, the rate is
1.5 K/kbar, comparable to 1.2 K/kbar reported for the Gd5Si0.5Ge3.5 sample
(Tseng et al., 2007), while the rate in the high-pressure range (0.15 K/kbar)
is comparable to the one measured for the Gd5Si2Ge2 sample (0.2 K/kbar,
Tseng et al., 2007).
FIGURE 26 The correspondence between compositional and pressure magnetic phase diagrams
in the Gd5SixGe4�x system. Only relevant parts of the phase diagram are shown. Data points indi-
cate the observed TC for the Gd5Si0.5Ge3.5 (A) and Gd5Si2Ge2 (B) samples for different pressures
as measured by XMCD (Tseng et al., 2007).
Handbook on the Physics and Chemistry of Rare Earths348

The application of hydrostatic pressure to the Gd5Si2Ge2 sample indicates
that TC is 336 K at 10 GPa and given the linear increase of the Curie temper-
ature with pressure, even higher TC values may be reached at higher pressures.
At the same time, this is the maximum Curie temperature that may be
achieved by Si substitution (TC¼336 K for Gd5Si4) proving that despite its
lower impact on TC, hydrostatic pressure provides a valuable method of tran-
sition temperature manipulation in Gd5SixGe4�x alloys in addition to chemical
substitutions (Tseng et al., 2007).
Another interesting effect observed in the pressure-dependent XMCD
measurements is the variation of the dTC/dP rate with sample composition
(for low-Si substitutions) and with the range of the applied pressures. For
example, the rate is higher (typically over 3 K/kbar) below 1 GPa as determined
for the Gd5SixGe4�x alloys with 0<x�2 using magnetic susceptibility data
(Morellon et al., 2004a); but when measured up to 14.55 GPa, lower
dTC/dP¼1.2 K/kbar rate was observed from XMCD data for Gd5Si0.5Ge3.5(Tseng et al., 2007). During the measurements of the barocaloric effect in
Gd5Si2Ge2 (Yuce et al., 2012), a 3.2 to 3.8 K/kbar rate was observed in
pressure-dependent calorimetric measurements at relatively low pressures
(0–2.9 kbar). The fact that the barocaloric effect in Gd5Si2Ge2 reaches its
maximum near 3 kbar and that both the latent heat and the structural entropy
of the M-PM - O(I)-FM transition are expected to decrease as pressure increases
indicates that Gd5SixGe4�x compounds show a stronger response to the applied
pressure when compression is low, that is, when the pressure is moderate (Yuce
et al., 2012).
The variation of TC with pressure for Gd5Si4 was found to be linear, with
dTC/dP equal to 2.9 K/GPa (Parviainen, 1980).
3.8. Magnetocrystalline Anisotropy
Interestingly, even when long-range ferromagnetism is destroyed, short-range
ferromagnetic order may still be present in the O(II) structure. The X-ray res-
onant magnetic scattering study of Gd5Ge4 antiferromagnetic phase (Tan
et al., 2005) complimented by the magnetization studies of the Gd5Ge4 single
crystals along three major crystallographic axis (Levin et al., 2004; Ouyang
et al., 2006a) indicate that the Gd moments are primarily aligned along the
c-axis in the low-field AFM state (Fig. 27). The alignment of the moments
within a single slab unit is nearly collinear so the slabs are practically ideally
ferromagnetic. However, the slabs themselves are magnetically aligned anti-
parallel with respect to each other (Gd moments in each consequent slab are
rotated �180� with respect to the previous slab, see Fig. 27) so the ground
state becomes antiferromagnetic (Tan et al., 2005). Therefore, the prevailing
magnetic interactions in the magnetically ordered slabs are ferromagnetic,
which explains both the highly positive Weiss temperature (yp) observed in
Gd5Ge4 and other antiferromagnetic R5T4 alloys, and the ease of the transition
Chapter 262 R5T4 Compounds 349

into the ferromagnetic state by R5T4 compounds at proper conditions even
with the minor external stimuli.
This peculiar magnetic structure results in a number of interesting mag-
netic effects observed in a Gd5Ge4 single crystal. For example, a weak but
distinct and reversible spin-flop transition is observed when a magnetic field
of 8.4 kOe is applied along the c-axis of Gd5Ge4 (Levin et al., 2004). Ouyang
et al. (2007b) examined the angular dependence of the spin-flop transition and
found that when the magnetic field vector is tilted away from the c-axistoward the b-axis, the spin-flop transition remains first-order in nature. When
the field vector is tilted away from the c-axis toward the a-axis, the first-orderspin-flop transition is only observed at 0<y<20� indicating that the Gd
moments “flip” from the c-axis to the a-axis during the spin-flop transforma-
tion. Presence of such 90� flop was confirmed at T¼9 K, H¼9 kOe by means
of the X-ray resonant magnetic scattering experiment performed on the
Gd5Ge4 single crystals (Tan et al., 2008). No magnetostriction effects were
observed at the transition. Both magnetic sublattices, before and after the
spin-flop transformation have intraslab FM correlations and interslab AFM
correlations.
A neutron diffraction study of the magnetic structure (in the AFM state) of
a series of Gd5SixGe4�x alloys (x¼0, 0.1, 0.3, 0.5, 0.7, and 0.9) was per-
formed in a zero magnetic field by Ryan et al. (2010). The magnetic structure
with Pnma magnetic space group identified by Tan et al. (2005) was con-
firmed. As shown in Table 12, the Gd magnetic moments of all three symmet-
rically independent sites are primarily oriented along the c-direction with zero
spin component along the b-axis. A small but definite a component was
FIGURE 27 (A) Magnetization of the Gd5Ge4 single crystal with the magnetic vector applied
along three major crystallographic directions. (B) Schematic low-field magnetic structure of
Gd5Ge4.
Handbook on the Physics and Chemistry of Rare Earths350

obtained at least for one of the three Gd sites, the 8d2 position. The magnetic
structure of the FM state in these alloys was not determined; in fact the study
did not observe any long-range ferromagnetic order even in alloys with rela-
tively high amounts of Si although the transition from O(II) to O(I) crystal
structure was clearly seen. The magnetic moments in the AFM-O(II) phase
are confined in the ac-plane and are strictly perpendicular to the b-directionwhile in the FM state they are most likely oriented along the b-axis (the easy
magnetization direction of Gd5Ge4, Ouyang et al., 2006a). Based on the study
by Ryan et al. (2010) one may speculate that the magnetic moment rotation
toward the b-direction followed by the setting of the long-range FM state does
not occur spontaneously when the O(I) phase forms out of the O(II) phase
through a temperature-induced transformation in the absence of magnetic
field, and at least a very small (a few Oe) applied field is needed for the
occurrence of the FM order in Gd5SixGe4�x alloys with x�0.9. Complex
dynamics of the displacive structural O(II)–O(I) transition described above
is probably responsible for this unusual behavior.
Despite the fact that Gd magnetic moments align along the c-axis in the
antiferromagnetic state, the easy magnetization direction of Gd5Ge4 is the
b-axis (Ouyang et al., 2006a) since the ferromagnetic order is set quickly
and is the most stable along this direction. Similarly, magnetic force micros-
copy (MFM) and vibrating sample magnetometry (VSM) measurements
preformed on a single crystal of the monoclinic Gd5Si2Ge2 phase also indicate
the b-axis as the easy axis in Gd5Si2Ge2 (Leib et al., 2002a). The MFM study
of the Gd5Si1.95Ge2.05 single crystal confirms this observation (Leib et al.,
2002b). The same authors performed an MFM study on a polycrystalline
Gd5Si2.09Ge1.91 showing that the domain appearance during the PM!FM
first-order transformation is sharper in the single crystal than in a polycrystal-
line sample. The values of magnetic anisotropy coefficients for Gd5Si2Ge2,
K0¼0.78�0.03�104 J/m3, K1¼4.1�0.2�104 J/m3 are similar to those of
iron (Leib et al., 2002a). Essentially, these materials have uniaxial magnetic
anisotropy, which agrees with nearly tetragonal crystal structure (ac<<b).
TABLE 12 Gd Moments in Gd5Ge4 Determined from Neutron Diffraction
Data Measured at 10 K (Ryan et al., 2010)
Gd site
Gd moments (mB)
Totala b c
4c 0.9�1.2 0 6.7�0.3 6.8�0.4
8d1 0.3�1.0 0 6.6�0.3 6.6�0.4
8d2 2.3�0.9 0 6.2�0.2 6.6�0.4
Chapter 262 R5T4 Compounds 351

According to Tegus et al. (2002a), the magnetocrystalline anisotropy in mono-
clinic Gd5SixGe4�x alloys with x¼1.65 and 1.7 is observed only in low
applied magnetic field (0.05 T) and is practically negligible in higher mag-
netic fields, such as 50 kOe. The magnetic measurements of a high-quality
oriented single crystal of Gd5Si2Ge2 (Magen et al., 2005), showed small but
measurable magnetic anisotropy, and the easy magnetization axis determined
using the M(H) data collected at 5 K is the a-axis. This result is in disagree-
ment with the magnetic measurements of Leib et al. (2002a) and the neutron
diffraction study by Palacios et al. (2010b).
Magnetic H–T diagrams were constructed for the Gd5Si1.95Ge2.05 single
crystal along three major crystallographic directions using isothermal magne-
tization measurements (Tang et al., 2003). Magnetocaloric effect was calcu-
lated along all three major axes as well. A small anisotropy affecting the
location of the phase boundaries on the H–T diagrams was observed (Fig. 28).
Direction-dependent differences in the shape of the MCE peak were also
found.
Neutron diffraction determination of the magnetic structure of Gd5Si2Ge2and doped Gd5Si2Ge1.9M0.1 (M¼Ga, Cu) compounds confirms the collinear
ferromagnetic alignment of Gd magnetic moments along the b-axis below
TC (Palacios et al., 2010b). The magnetic structure is independent of whether
the magnetic ordering occurred via a first-order transition (Gd5Si2Ge2) or a
second-order transition (Gd5Si2Ge1.9Ga0.1).
3.9. Short-Range Correlations
In the paramagnetic state, the magnetic susceptibility of Gd5Ge4 measured in
an 8 kOe applied magnetic field obeys the Curie–Weiss law with yp¼94 K
FIGURE 28 Critical magnetic field as a function of temperature of the Gd5Si1.95Ge2.05 single
crystal with the magnetic field applied along three major crystallographic directions.
Handbook on the Physics and Chemistry of Rare Earths352

and effective moment peff¼7.8 mB/Gd (Levin et al., 2004). However, when
the magnetic susceptibility of Gd5Ge4 is examined in paramagnetic state using
magnetic fields below 5 kOe, a clear signature of the so-called Griffith-phase
behavior is observed in the inverse magnetic susceptibility plots in the region
between TN and the characteristic temperature TG>TN (Ouyang et al., 2006b);
TG is approximately 2TN for O(II) R5T4 structures (Pereira et al., 2010).
Essentially, short-range order magnetic correlations in the paramagnetic state
lead to dynamic ferromagnetically ordered clusters that enhance the magnetic
susceptibility of Gd5Ge4 and other R5T4 systems (Pereira et al., 2010). This
effect is most pronounced when the magnetic field is low, H�10 Oe, and
when the measurements are performed in magnetic field applied along the
b-axis (Ouyang et al., 2006b). Ouyang (2010) carried out an extensive inves-
tigation of the Griffiths-like behavior in Gd5SixGe4�x alloys with x¼0, 0.5,
1.012, 1.5, and 3.5 using temperature-dependent ac magnetic susceptibility
and low-field (10 Oe) dc magnetization measurements. Substantial deviations
from the Curie–Weiss behavior indicative of the short-range magnetic cluster-
ing were observed in all samples with x<2. These short-range FM correla-
tions are characterized by unusually slow relaxation dynamics above the
magnetic ordering temperature, which is observed in time-dependent mag-
netic relaxation measurements and are also manifested in the frequency
dependence of ac susceptibility. Ouyang (2010) argues that the low-field
region of the Gd5SixGe4�x x–T diagram should include the area of the
Griffiths-like phase between the long-range magnetically ordered state and
the truly paramagnetic region; the TG for x<2 can be derived from the linear
extrapolation of TC’s of the alloys with x>2.
Casanova et al. (2005c) reported the presence of short-range competing
FM and AFM correlations in Gd5SixGe4�x Ge-rich alloys for x¼0, 0.2, and
0.4 in high magnetic fields (�140–150 kOe) at temperatures slightly below
TN but greater than �80 K. In this area of H–T diagram, the magnetic-field-
induced AFM–FM transition proceeds through an intermediate state, which
the authors mark as a short-range correlation (SRC) region. By using pulse
magnetic fields as high as 400 kOe, Wu et al. (2011) studied the same region
(85 K<T<105 K) of the Gd5Ge4 H–T diagram and concluded that the inter-
mediate state is paramagnetic. As a result, during high-field (> 100 kOe) iso-
thermal magnetization measurements in this range of temperatures, Gd5Ge4undergoes two transitions: (1) second-order AFM–PM transition and (2)
first-order PM–FM transition. Wu et al. (2011) also suspect the presence of
short-range magnetic correlations in this intermediate region between the
AFM and FM states. Appearance of the Griffiths-like phase in Gd5Ge4 at
TG¼240 K was observed in the same work using ac magnetic susceptibility
measurements. Isofield temperature-dependent magnetization measurements
of a Gd5Ge4 sample in 80, 100, 120, 140, 180, and 220 kOe applied magnetic
fields confirms the presence of an additional magnetically inhomogeneous region
immediately below (in terms of temperature) the first-order magnetostructural
Chapter 262 R5T4 Compounds 353

AFM–FM phase transition atH100 kOe (Perez et al., 2011). Perez et al. (2011)
also examined the low-field short-range magnetic correlations (Griffiths-like
phase) in Gd5Ge4 using ac magnetic susceptibility measurements. The TG in their
experiments was found to be 225 K, in fair agreement with other reports. Fre-
quency dependence of ac magnetic susceptibility was observed both at TG and
in the low-temperature region (<80 K). The anomaly at TG becomes suppressed
by dc field of 200 Oe.
3.10. Targeted Chemical Modification of Gd5Ge4
The complexity of the exchange interactions in the Gd5SixGe4�x system has
been exemplified through substitutional doping of Gd5Ge4 with nonmagnetic
rare earth elements (Mudryk et al., 2010). By adding small amounts of La and
Lu (�5%), the effects of chemical pressure and trivial dilution were mini-
mized so the main difference between La- and Lu-substituted alloys was in
the atomic positions where these added atoms were located: Lu atoms prefer
the interslab 4c sites while La atoms occupy the intraslab 8d sites. Such seem-
ingly subtle difference, however, has a drastic influence on the magnetism of
the doped alloys—the La substitution does not have any meaningful effect on
the properties compared with the parent Gd5Ge4, while in the Lu-substituted
alloys the ferromagnetic state is practically destroyed (at least below 70 kOe)
with 5% Lu substitution (Fig. 29).
FIGURE 29 Isothermal magnetization of (A) Gd4.875Lu0.125Ge4, (B) Gd4.75Lu0.25Ge4, and (C)
Gd4.75La0.25Ge4 alloys. The magnetic properties of the La-substituted alloy are similar to those
of the pure Gd5Ge4 (see Figure 22).
Handbook on the Physics and Chemistry of Rare Earths354
These results show that the interslab position (the 4c site) occupied by the
rare earth atoms plays a key role in setting the ferromagnetic interactions in
Gd5Ge4 compound compared to the remaining two eightfold sites. The critical
role of this particular location in the crystal lattice has been also confirmed by
first-principles calculations (Mudryk et al., 2010; Paudyal et al., 2010b). The
study of the Gd4.875Lu0.125Ge4 sample (2.5% Lu substitution, Fig. 29A) shows
that even such a small (overall) quantity of Lu placed selectively in the 4c siteof Gd5Ge4 crystal structure increases the critical field of the AFM–FM trans-
formation by �35 kOe (Mudryk et al., 2013). Similar nearly impurity level
substitutions by other nonmagnetic rare earth elements (Sc and Y) show that
the Y substitution produces the same effect as the Lu substitution (Paudyal
et al., 2010b), but the effect of chemical pressure becomes substantial even
at a low level scandium substitutions. Apparently, Sc promotes the FM state
but with significantly lower efficiency when compared to Si. Both Sc and Y
prefer the intraslab 4c location in the Gd5Ge4 structure. As the amount of sub-
stitution increases (more Gd is replaced by nonmagnetic R), the effects of
chemical dilution become dominant.
3.11. Microstructure and Formation of Thin Plates
The surface structure of the Gd5Si4, Gd5Si2Ge2, and Gd5Ge4 compounds was
first studied by Szade et al. (1999) using single crystals of these compounds
grown by Czochralski method from a levitated melt. The Berg-Barrett X-ray
topography examination has confirmed that the prepared plate-like materials
were single crystals and also has shown the presence of large stresses in the
crystals. Somewhat unexpectedly, they also observed a regular system of thin
channels or lines, which grew independently from the stress structure. The
reported width of the linear features is about 2 mm, and Auger spectroscopy
indicated the increase of gadolinium and oxygen contents in the vicinity of
the lines. Meyers et al. (2002b) observed widespread presence of similar lin-
ear features in the Gd5Si1.95Ge2.05 sample; the chemical composition of the
lines determined by energy dispersive spectroscopy (EDS) was close to
Gd5(Si,Ge)3. Gama et al. (2004) observed the linear features of a Gd5Si2Ge2sample prepared using the “commercial grade” Gd.
Ugurlu et al. (2005a) performed a detailed microstructural characterization
of the oriented Gd5Si2Ge2 single crystals by means of scanning electron
microscopy (SEM) and transmission electron microscopy (TEM). The pres-
ence of a second phase consisting of extremely thin (�250 nm) yet long
(hundreds of microns) plates growing in specific directions was confirmed.
These plates can be observed in a form of linear features reported in other
studies as well. The orientation of the plates is reminiscent of Widmanstatten
precipitation, though conditions of its formation are atypical. TEM indicates
that the structure of the plates is hexagonal with parameters a¼b¼8.53 A
and c¼6.40 A. In agreement with EDS, these results point on the Gd5Si1Ge2
Chapter 262 R5T4 Compounds 355

composition for the plates. Ugurlu et al. (2006a) determined the orientation
relationship between Gd5SixGe4�x matrix and Gd5SixGe3�x plates as
1010� �
1211� �
p== 010½ � 102� �
m. Gd5Si2Ge2, Gd5Si0.33Ge3.67, and Gd5Ge4 com-
pounds were studied. High-resolution TEM revealed a series of regularly
spaced risers and terraces aligned along an irrational interface habit plane.
The study proposed a displacive–diffusional transformation as a possible
mechanism of the thin plate’s formation.
Interestingly, when Fu et al. (2005) performed a microscopy study of the
Gd5Si2Ge2.2 sample they also observed the regular line features but reported
the decrease of Gd content at the lines compared with the 5:2:2 matrix
indicating that they are not the Gd5(Si,Ge)3 phases. High-temperature optical
microscopy did not detect changes in microstructure of Gd5Si2Ge2.2 up to
1400 �C, and the authors suggested that the linear features form during solidi-
fication. Cao et al. (2010) report that the thermal annealing of the Gd5Ge4 sin-
gle crystal at 1200 �C induces dissolution of the plates, which according to
their data have 5:3 stoichiometry, into the 5:4 matrix.
Ugurlu et al. (2005b), reported that thin plates exist not only in
Gd5SixGe4�x but also in other R5SixGe4�x systems (R¼Tb, Dy, Er) and con-
firmed that the chemical composition of thin plates is enriched in rare earths
compared with the 5:4 matrix, upholding the 5:3 stoichiometry. At the same
time, Ugurlu et al. (2006b) confirmed the stability of the thin plates: they
found that temperature changes in the range between �70 and 850 �C do
not have any effect on their morphology, even when the monoclinic matrix
underwent both the low-temperature reversible (b$a) and high-temperature
irreversible (b !g) structural transformations. Podmiljsak et al. (2007) sug-
gested that quick cooling prevents formation of the Widmanstatten-like struc-
ture in Gd5SixGe4�x, based on the fact that they do not see it in the smaller
arc-melted buttons that supposedly cool faster, but found it in all larger arc-
melted buttons. This suggestion has been supported by Cao et al. (2010) who
found that rapid solidification occurring after the laser surface melting
experiment suppresses precipitation of the thin plates in the Ho5Si3.2Ge0.8 sam-
ple. Presence of long straight lines in the SEM picture of Gd5Si2.1Ge1.8Fe0.1,
which were too thin for an accurate estimation of composition, was reported
by Rajkumar et al. (2010).
Detailed microstructural study of the Gd5Ge4 sample that underwent mul-
tiple cycling through a first-order AFM–FM transition has been performed by
Manekar et al. (2006). They observed a change in microstructure at length
scales below 20 mm through the so-called training effect, and came to the con-
clusion that the linear features (or “herringbone structure”) belong to a kineti-
cally arrested phase embedded into the stable matrix.
The most comprehensive study of the linear features in Gd5SixGe4�x
alloys used microscopy (optical, SEM, and TEM) and bulk characterization
methods such as X-ray diffraction, magnetization, and heat capacity measure-
ments to analyze and explain the discrepancies in the published reports about
Handbook on the Physics and Chemistry of Rare Earths356
the nature of thin plates (Chumbley et al., 2008). The authors came to the con-
clusion that the difficulties in the phase identification of these features are
caused by the fact that the majority of microscopy studies strongly overesti-
mate their actual volume fraction (found to be a few percent maximum),
sometimes by a factor of ten. Because the features are thinner than they
appear in SEM pictures, it is easy to obtain erroneous EDS data by scanning
the sample area that belongs not only to the plates but to the matrix and other
potential impurities. Chumbley et al. (2008) assert that the true composition of
the second phase is Gd5(Si,Ge)3, and its volume fraction is 1.0�0.5% in the
majority of the analyzed samples.
Moore et al. (2009) established that despite their minuscule concentrat-
ions these microstructural features play a significant role in the development
of metamagnetic transitions in R5T4 alloys. In particular, they studied the
magnetic-field-induced metamagnetic M-PM - O(I)-FM transformation in
Gd5Si2Ge2 using high-resolution scanning Hall probe imaging and found that
the Gd5(Si,Ge)3 platelets act as nucleation centers for the FM phase when the
magnetic field increases above the critical value. The mechanism of such seed-
ing is interesting because the Gd5(Si,Ge)3 phase is paramagnetic at the studied
temperature (280 K). Most likely, the Gd5(Si,Ge)3 mesoscopic phase is respon-
sible for the variation of local strain energies at the phase boundaries and, there-
fore, for the distribution of critical fields across the sample volume. At the same
time, the platelets do not have any influence on the return FM-to-PM transfor-
mation, thus indirectly confirming the theory that strain at the 5:4 matrix—5:3
platelet interfaces is indeed responsible for seeding the nucleation of the low-
volume ferromagnetic matrix phase when the magnetic field increases.
Transmission electron microscopy and selected area diffraction (SAD)
investigation of the optimally prepared single-phase Gd5Si2Ge2 sample con-
firmed the presence of intrinsic microstructural twinning in the room temper-
ature monoclinic structure (Meyers et al., 2002a, 2003). The twinning
provides a mechanism for stress relief during the M$O(I) reversible phase
transformation. Interestingly, ion milling of Gd5Si2Ge2 at room temperature
causes the irreversible structural transformation into the high-temperature
orthorhombic polymorph. The structure remains monoclinic for all samples
which were thinned by ion milling using a liquid nitrogen cold stage (Meyers
et al., 2003).
Du et al. (2008) studied the magnetostructural transition in Gd5Si1.85Ge2.15using TEM and HRTEM. They confirmed that the O(I)-FM$M-PM transi-
tion is diffusionless and displacive by nature.
3.12. Spectroscopy
X-ray photoemission spectroscopy (XPS) measurements were performed on
Gd5Si4, Gd5Si2Ge2, and Gd5Ge4 compounds and compared with the magnetic
susceptibility and electrical resistivity measurements by Szade and Skorek
Chapter 262 R5T4 Compounds 357

(1999). All compounds show a characteristic feature on their XPS data at
�2 eV, which may be attributed to the Gd 5d-Si(Ge) sp covalently bonded
states. The spectra indicate stronger GddGe bonding compared to the GddSi
bonding. The large shift of core levels (including Gd 4f ) was observed for
Gd–Ge (þ0.5 eV for Gd and �0.8 eV for Ge; the experimental error for most
XPS lines is �0.1 eV). In Gd–Si compounds, the Gd binding energy levels do
not shift with respect to those of the pure element but the Si ones are shifted
by �0.5 eV (2p) and �0.3 (2s), Szade and Neumann (1999). Since the GddSi
bonding is supposed to be quite strong (as may be judged, for example, from
the high melting points of gadolinium silicides), this result means that the
simple charge-transfer bonding is not applicable here, and the model involv-
ing p–d hybridization is needed in order to explain the complex properties
of Gd5SixGe4�x compounds. Resonant photoemission from a Gd5Si4 sample
has been studied in the photon energy range of Gd 4d–4f threshold, but anal-ysis of the Si states was not possible due to overlap with Gd states (Szade
et al., 2002).
X-ray absorption and ultraviolet photoemission spectroscopy was used by
Bondino et al. (2007) for the experimental investigation of the electronic
structure of Gd5Si2Ge2. The Gd core levels show similarity with Gd metallic
compounds and differences from Gd ionic compounds. The Gd 5d itinerant
electrons appear to be responsible for the magnetic exchange interaction
between Gd 4f local moments. A comparison of the spectra measured
above and below the structural transition did not show any clear changes in
the 0 to 4 eV binding energy region. Instead, variations are observed at ener-
gies between 4.5 and 6.5 eV, and are associated with changes in the energy
distribution of Ge(Si) s states.Lee et al. (2004) measured reflectance difference (RD) spectra for the a–b
and b–c planes of Gd5Si2Ge2 in the photon energy range of 1.5–5.5 eV. For
the b–c plane of Gd5Si2Ge2 (and Tb5Si1.8Ge2.2, which was also measured in
this study), one strong peak appeared at 3.2 eV, a small peak at 1.7 eV, and
a weak shoulder at 4.1 eV. For the a–b plane, a weak shoulder was observed
at 2.8 eV together with two peaks at 1.7 and 3.8 eV. Park et al. (2006)
obtained complex dielectric functions of Gd5Si2Ge2 single crystal using spec-
troscopic ellipsometry in nearly same photon energy range (1.5–5.0 eV). The
reflectance difference spectra were derived from these functions and com-
pared with the ones obtained directly by reflectance difference spectroscopy.
These RD spectra were found to agree well with each other.
The atomic excitations in Gd5Ge4 and Gd5Si2Ge2 compounds were studied
by electron energy loss spectroscopy (EELS). The spectra mainly reveal the
excitations in Gd, like 4f!4f (at 4–8 eV), 5p!5d (23–27 eV), and 5p!5dplus 5d!continuum (�35 eV), Tyszka et al. (2005).
Electron spin resonance (ESR) measurements were carried out on
Gd5.09Ge2.03Si1.88 samples, both as-cast and annealed, by Pires et al. (2005).
Distinct signatures of two coexisting phases were clearly seen in the ESR
Handbook on the Physics and Chemistry of Rare Earths358

spectra around room temperature (268 K<T<315 K). Pires et al. (2006)
reported an ESR study of Gd5Si4, Gd5Ge4, and Gd5.09Ge2.03Si1.88 samples at
temperatures between 105 and 405 K. The paramagnetic effective g values
were determined and a negative paramagnetic geff shift was found for the Si
containing samples but it was positive for Gd5Ge4. The values of the
exchange parameter (j) between 4f spins and conduction electrons were calcu-
lated from the g shifts and were found to be positive and of the same order of
magnitude for Gd5Si4 and Gd5.09Ge2.03Si1.88 samples and negative and one
order of magnitude smaller for Gd5Ge4.
Ouyang et al. (2009) performed an electron spin resonance study of the
high-quality Gd5Ge4 sample (prepared at Ames Laboratory using 99.92 at.%
pure Gd) across the field-induced AFM!FM transition. The measured
ESR data were compared with the results of magnetization measurements
and a reasonable correlation between these two methods has been found.
The frequency-resonance field curve of the AFM state exhibits nearly the
same slope as that of the FM state. The g value derived from this curve for
the FM state assuming perfectly parallel alignment of all spins is 1.93, close
to that of noninteracting Gd3þ ions (g¼1.992).
Skorek et al. (2002) compared the results of their TB-LMTO ASA calcu-
lations with the experimentally measured XPS and ultraviolet photoemission
spectroscopy (UPS) data. The LSDA approach to the exchange-correlation
potential in the von Barth–Hedin form with the nonlocal correction of
Langreth, Mehl, and Hu was applied in these calculations. The authors found
good correlation between the measured spectra and calculated electronic
structure and were able to relate the details of the calculated structure with
temperature-dependent XPS spectra. The energy gaps were observed for both
Gd5Si4 and Gd5Ge4, but in the former case the gap is located below the Fermi
level while in the latter case the gap is responsible for the semiconductor-like
behavior above TN (see Fig. 19). The 5 at.% substitution of titanium for Si or
Ge resulted in a relative increase in photoemission intensity in the vicinity of
the Fermi level for Ti-doped compounds. The chemical shifts of the most pro-
nounced photoemission levels for Gd5Si4, Gd5Si2Ge2, Gd5Ge4, Gd5Si3.8Ti0.2,
and Gd5Ge3.8Ti0.2 are listed in Table 13.
3.13. First-Principles Calculations
A substantial amount of research effort has been directed toward deter-
mination of the electronic structure of Gd5SixGe4�x compounds from first-
principles calculations. The complex crystal structure of these alloys and the
presence of Si/Ge statistical mixture in all T positions (except for the binary
Gd5Si4 and Gd5Ge4 end members) complicate the band structure and density
of states (DOS) calculations, as well as the estimations of exchange interac-
tions. Nevertheless, the overall progress in understanding the electronic struc-
ture of R5T4 compounds is quite good.
Chapter 262 R5T4 Compounds 359

Harmon and Antonov (2002) applied both local spin density approxima-
tion (LSDA) and so-called LSDAþU4 approaches and found that the Ueff
parameter strongly influences the results of the electronic structure calcula-
tions in Gd5Si2Ge2. Based on the LSDAþU calculations they predicted
that the magneto-optical spectra can be used for detecting the structural
transition in Gd5Si2Ge2. Soon after, using the same LSDAþU method they
also calculated XMCD spectra for Gd5Si2Ge2 and theoretically found that
the XMCD measurements may also be used to study the magnetostructural
transition in Gd5Si2Ge2, particularly at Gd M4 and N4 edges (Harmon and
Antonov, 2003).
Samolyuk and Antropov (2002) performed TB-LMTO calculations using
local density (LDA) and generalized gradient (GGA) approximations on
Gd5Ge4, Gd5Si2Ge2, and Gd5Si4 compounds. Total energy calculations con-
firmed that the orthorhombic Gd5Si2Ge2 has lower energy than the monoclinic
one. They also have shown that the total energy is sensitive to the distribution
of Si and Ge atoms within the lattice in Gd5SixGe4�x alloys. Temperature
dependences of free energy and magnetic moment were calculated for
Gd5Si2Ge2 by Samolyuk and Antropov (2003), but the calculated transition
temperature (Tm¼61 K) was much lower than the one experimentally
observed in Gd5Si2Ge2 (TC¼276 K, Pecharsky and Gschneidner, 1997b).
Such difference is related to both the underestimation of the magnetic
TABLE 13 Chemical Shifts of the Most Pronounced Photoemission Levels
for Gd5Si4, Gd5Si2Ge2, Gd5Ge4, Gd5Si3.8Ti0.2, and Gd5Ge3.8Ti0.2Compounds (Skorek et al., 2002)
Gd 4f Gd 3d5/2 Si 2p Si 2s Ge 3d Ge 3s Ge 3p1/2 Ti 2p3/2
Pure Elements 8.1 1187.0 99.3 150.2 29.4 181.2 125.7 453.9
Gd5Si4 þ0.1 þ0.3 �0.5 �0.25 – – – –
Gd5Si3.8Ti0.2 þ0.3 þ0.2 �0.1 �0.4 – – – þ0.5
Gd5Ge4 þ0.5 – – – �0.85 �0.7 �0.9 –
Gd5Ge3.8Ti0.2 þ0.6 þ0.2 – – �0.7 �0.4 �0.4 þ0.8
Gd5Si2Ge2 þ0.3 – �0.4 �0.35 �0.8 �0.7 �0.8 –
The binding energies for pure elements are shown in the first row. All data are in electron volts (eV).
4. LSDAþU method enables proper treatment of the localized 4f electrons of Gd by supplement-
ing conventional LSDA with an additional intra-atomic Coloumb correlation term (U) and
exchange interaction term (J) of multiband Hubbard type less a so-called double-counting term
to subtract the electron–electron interactions already included in LSDA (Paudyal et al., 2006).
Handbook on the Physics and Chemistry of Rare Earths360

exchange parameters and simplifications used in the description of the free
energy. Pecharsky et al. (2003d) were able to model the effect of applied mag-
netic field on the transition temperature of Gd5Si2Ge2 obtaining the value of
dTm/dH¼0.26 K/kOe, slightly lower than the experimentally observed rates
�0.4–0.5 K/kOe.
Rhee (2003) performed electronic band structure calculations of
Gd5Si2Ge2 compound using full-potential linear-augmented-plane-wave (FP-
LAPW) methods within the local density approximation. The optical conduc-
tivity spectra were plotted for all three diagonal components. The off-diagonal
component was also calculated but found to be negligibly small. The optical
anisotropy is significant in the 0 to 2 eV range, but it becomes much weaker
at higher photon energies (2–6 eV).
Samolyuk and Antropov (2005) applied the multiple-scattering formalism
in LSDAþU to analyze the electronic structure of Gd5Si2Ge2 and pure Gd
metal. The thermodynamic properties were analyzed within the pair
cluster approximation. The calculated TC (through second-order transition)
was 230 K for the orthorhombic (a) Gd5Si2Ge2 and 180 K for the monoclinic
(b) Gd5Si2Ge2. However, in this model a first-order transition occurs at 206 K
due to a crossover in free energy dependences of a and b phases. Interestingly,
Hadimani et al. (2008a) experimentally proved by using the Arrott plot
method that the a phase would order at a higher temperature (301 K) than
the experimentally observed TC¼269 K, if it did not undergo a first-order
transition.
Altounian and Liu (2007) performed LMTO ASA calculations with LSDA
given by von Barth and Hedin. They found that anisotropic thermal expansion
observed in Gd5Si4 at TC is related to the valence electron distribution at the
magnetic transition when the electrons are transferred from Gd to Si atoms
changing the strength of the GddSi bond and producing magnetovolume
effect.
The LSDAþU method implemented in the TB-LMTO scheme with
U¼6.7 eV and J0¼0.7 eV was employed to perform the first-principles elec-
tronic structure calculations for Gd5Ge4 compound (Paudyal et al., 2007).
When the total energy was plotted against the value of the shear atomic dis-
placement modeled along a-axis, a clear crossover of energy curves was
obtained confirming the intrinsic nature of the structural transition in Gd5Ge4.
The antiferromagnetic Sm5Ge4-type O(II) crystal structure was confirmed as a
ground state. The 5d FM exchange splitting was found to be much larger in
the O(I) structure compared to O(II). The origin of magnetic ordering in
Gd5Ge4was further analyzed by Paudyal et al. (2008) using the same calcula-
tion method. The evaluation of 4f–5d exchange interaction energies showed
that the short-range interactions in Gd5Ge4 are ferromagnetic but the long-
range antiferromagnetic order prevails in the O(II) structure, supporting the
experimental observations (e.g., see Tan et al., 2005). The calculated increase
in 4f–5d interactions in O(I) structure agrees with its ferromagnetic state.
Chapter 262 R5T4 Compounds 361

Tan et al. (2008) reported the magnetic anisotropic energies in Gd5Ge4calculated using FP-LAPW. They concluded that easy plane (ac) anisotropyin Gd5Ge4 arises mainly from the dipolar interactions.
By performing the first-principles calculations (LSDAþU) of the forma-
tion energy as a function of a shear displacement of neighboring slabs,
Paudyal et al. (2010a) found four closely related crystal structure types that
may be stable in the Gd5Ge4 compound. When the lattice parameter a and,
consequently, the interatomic interslab Ge3–Ge3 distance increases, the struc-
tures became stable in the following order: O(I)-Gd5Si4, Pu5Rh4, O(II)-
Sm5Ge4, and Tm5Si2Sb2. The modeling of the slab exchange interactions
using the Heisenberg approach shows that O(I)-Gd5Si4, Pu5Rh4, and
Tm5Sb2Si2 structures have positive effective Gd–Gd exchange interactions
indicating ferromagnetic ground state, while the O(II)-Sm5Ge4 structure sup-
ports antiferromagnetic ground state (Paudyal et al., 2010a).
3.14. Miscellaneous
Thermal conductivity and thermal diffusivity of Gd5Si2Ge2 was measured by
Fujieda et al. (2004). The thermal conductivity of Gd5Si2Ge2 decreases during
cooling of the high-temperature phase (a), shows a minimum at TC275 K,
and then starts to increase slowly upon further cooling down to �50 K. Below
50 K a sharp decrease in thermal conductivity was observed. The absolute
values are in the �4–6 W/mK range. A strong anomaly in thermal diffusivity
is observed at TC.Sambandam et al. (2005) attempted to grow the Gd5Si2Ge2 thin film on
the PECVD Si3N4 coated Si substrate. The study found that Si3N4 is unsuit-
able as a diffusion barrier for Gd5SixGe4�x thin film preparation process and
dissolution of Gd5Si2Ge2 films into silicon nitride and Si upon annealing at
1150 �C was observed.
The elastic stiffness and compliance constants of the monoclinic
Gd5Si2Ge2 phase were determined by Svitelskiy et al. (2006). Using the
pulse-echo ultrasonic technique the study measured the speeds of sound
waves propagating in six directions of Gd5Si2Ge2. The value of bulk modulus
of Gd5Si2Ge2 is equal to 68.5 GPa, and its Debye temperature, calculated
from the measured elastic properties is yD¼250 K.
Phase equilibria in the Gd–Si binary system were studied by means of both
experiment and theoretical modeling by Huang et al. (2007). The study con-
firmed that Gd5Si4 is a line compound that forms by peritectic reaction from
liquid (40.66 at.% Si) and Gd–Si phase at 1770 �C. Modeling gives the forma-
tion temperature at 1774 �C, in excellent agreement with the experiment.
The effect of ball milling on the crystal structure, magnetization, and MCE
of Gd5Si2Ge2 and Gd5Si2Ge1.9Fe0.1 alloys, and on the Gd5Si2Ge2/0.1 wt.% Fe
mixture was studied by Rajkumar et al. (2008). Both magnetization and MCE
decrease with milling time. Giovanna do Couto et al. (2011) carried out a
Handbook on the Physics and Chemistry of Rare Earths362
comparative study of magnetic and magnetocaloric properties of bulk and ball-
milled Gd5Si2Ge2 samples. Even a relatively short (4 h) milling time resulted in
a significant decrease of MCE from DSM¼�20 J/Kg K to DSM¼�4 J/Kg K
for bulk and ball-milled samples, respectively (DH¼0–50 kOe). Both loss of
the M!O(I) structural transition and appearance of super paramagnetic behav-
ior of small particles were observed in the ball-milled samples.
The effect of annealing at different temperatures (650, 750, and 850 �C for
4 days) on the lattice parameters, microstructure, thermal behavior, and mag-
netic properties of Gd5Si4 has been investigated by Yazdani and Bonder
(2011). The authors report a significant change in the lattice parameters of
Gd5Si4 as a function of annealing temperature. The properties of the Gd5Si4material ball-milled both in a dry argon atmosphere and with liquid ethanol
were also investigated.
The powder metallurgy processing was applied to the Gd5.09Ge2.03Si1.88material to evaluate its effect on magnetic and magnetocaloric properties as
well (Trevizoli et al., 2008). The study found that after pulverization and sin-
tering the GMCE may be preserved in this material if large enough particles
(>106 mm) are used for sintering. The first-order transition disappears when
finer powders are used.
The effect of aging on the magnetocaloric properties of first-order
Gd5Si1.9Ge2.1 was studied by Canepa et al. (2008). The specimen was exposed
to air and water for prolonged periods of time, up to 1 year; a clear but rela-
tively slow degradation of MCE was observed.
4. OTHER R5SixGe4�x SYSTEMS
The R5(Si,Ge)4 compounds have been discovered with all rare earth elements
except Eu (neither the silicide nor the germanide form at the 5:4 stoichiome-
try) and Pm (not studied), The diagram summarizing the current state of
knowledge regarding the formation and crystallography of R5SixGe4�x com-
pounds is shown in Fig. 30.
As can be seen from this figure, the phase digrams of the R5SixGe4�x sys-
tems are well studied for the ambient conditions (except for the Tm system).
The available information about their properties is summarized below.
4.1. Y5SixGe4�x
Both Y5Si4 and Y5Ge4 were discovered by Smith et al. (1967b) and reported
to crystallize in the Sm5Ge4 type of crystal structure. Schmidt et al. (1972)
constructed the binary phase diagram of the Y-Ge system, confirming the
Sm5Ge4 structure for Y5Ge4. They also reported that Y5Ge4 forms by peritec-
tic reaction from Y5Ge3 and liquid at 1900 �C. A few years later a binary
Y–Si diagram was reported by Button et al. (1990), who found that Y5Si4 also
Chapter 262 R5T4 Compounds 363

forms peritectically at 1836 �C from Y5Si3 and liquid; Sm5Ge4 type of crystal
structure was confirmed as well.
The pseudobinary Y5Si4–Y5Ge4 phase diagram has been recently investi-
gated by Pecharsky et al. (2004a). Contrary to the earlier literature the crystal
structure of Y5Si4 was found to be monoclinic Gd5Si2Ge2 type with the follow-
ing lattice parameters: a¼7.4722(5)A, b¼14.613(1)A, c¼7.6592(5)A, and
g¼93.399(4)� (SG P1121/a). It is possible that Y5Si4 adopts the monoclinic
structure only when the highest purity yttrium metal is used for the sample
preparation. The crystal structure of Y5Ge4 was confirmed as Sm5Ge4-type:
a¼7.6317(3)A, b¼14.695(1)A, c¼7.6963 (2)A (SG Pnma); Misra and Miller
(2008) reported the Sm5Ge4 type of crystal structure for the Y5Ge4 compound
as well. Two solid solutions exist in the Y5SixGe4�x system: in a narrow Si-rich
region the alloys with 3.5�x�4.0 have monoclinic crystal structure, while the
alloys with 0�x�3.0 adopt the orthorhombic structure. The dependence of the
lattice parameters of Y5SixGe4�x samples with x at room temperature is shown
in Fig. 31; the monoclinic angle g is not shown as it remains practically the
same (�93.4�) for all of the monoclinic alloys.
The heat capacity measurements of the Y5SixGe4�x alloys indicate that no
phase transitions occur in any of them down to 2 K (Pecharsky et al., 2004a).
The electronic specific heat constant g is close to 2 mJ/g-at K2 for the whole
FIGURE 30 Room temperature crystallography of R5SixGe4�x phases. Terminal compositions
that have been established with a few mol.% accuracy are shown as straight lines, while curved
boundaries designate the same known with a lower accuracy, typically to �10–25 mol.%.
Handbook on the Physics and Chemistry of Rare Earths364

series, while Debye temperature (yD) rises from 240 to 330 K as the concen-
tration of Si increases from x¼0 to x¼4.
4.2. La5SixGe4�x
Binary La5T4 compounds were reported by Smith et al. (1967b). The same
study reported the tetragonal Zr5Si4-type nonlayered crystal structure for the
La5Si4 and Sm5Ge4-type structure for La5Ge4. These results were later
confirmed by Gschneidner et al. (2000b) who performed a study of crystal
structure, heat capacity, and magnetic susceptibility of several La5SixGe4�x
alloys as a part of a broader investigation of R5T4 systems. According to
Gschneidner et al. (2000b) both La5Si4 and La5Si2Ge2 (and, probably, the
intermediate compositions as well) crystallize with the Zr5Si4 structure (SG
P41212), while La5Ge4 and La5SiGe3 adopt the Sm5Ge4-type structure.
The heat capacity study of these four La5SixGe4�x alloys reveal that simi-
larly to the Y5SixGe4�x system the electronic specific heat constant g is essen-
tially constant (3.0�0.5 mJ/mol K2) and the Debye temperature increases
with the Si content from 198�10 for La5Ge4 to 239�27 K for La5Si4. The
magnetic susceptibility of La5Ge4 is nearly constant, 0.34�0.02�10�6
emu/g Oe, between 5 and 300 K indicating that it is a Pauli paramagnet
(Gschneidner et al., 2000b).
Yang et al. (2002a) reported a crystallographic investigation of La5Si4compound also confirming its tetragonal Zr5Si4-type crystal structure with lat-
tice parameters a¼8.0467 A and c¼15.4476 A. Yang et al. (2003a) verified
FIGURE 31 The unit cell parameters of single-phase Y5SixGe4�x alloys as functions of Si con-
centration. The location of the two-phase sample is shown as �.
Chapter 262 R5T4 Compounds 365

the orthorhombic Sm5Ge4 type of crystal structure for La5Ge4 with lattice
parameters a¼8.0761 A, b¼15.5209 A, and c¼8.1725 A.
Guloy and Corbett (2005) reported the same crystal structures for the end
members of the La5Si4–La5Ge4 system prepared by the sintering reactions of
the elements at 1100–1300 �C for 10–15 days as well as by arc-melting. They
also studied the crystal structure of arc-melted and sintered samples for the
La5Ge3Six series of alloys, where 0.2<x�1. In most cases, a mixture of
Mn5Si3- and Sm5Ge4-type phases were observed but by using a special prep-
aration procedure they obtained a single-phase Mn5Si3-type compound for the
La5Ge3Si0.75 composition. Interestingly, the La5Ge3Si compound has been
observed crystallizing in both tetragonal and orthorhombic modifications,
depending on the preparation. The a-La5Si4 sample obtained after annealing
at 1100 �C crystallizes in the Sm5Ge4 type, while the b-La5Si4 compound,
which is a quenched high-temperature phase observed in as-cast alloy,
belongs to the Zr5Si4 type of crystal structure.
Liu and Altounian (2012) reported a systematic investigation of the
La5Si4–La5Ge4 that confirmed and completed the structural information about
this pseudobinary system (Fig. 32).
Alloys with 0�x�0.8 crystallize in the orthorhombic Sm5Ge4-type struc-
ture, while for 1.2�x�4 the tetragonal Zr5Si4-type occurs. The x¼1.0 sam-
ple was found to be a two-phase alloy containing both a- and b-La5Si4 (not
shown in Fig. 32). Note that due to a rotation of basis vectors the longest
(b) axis of the orthorhombic structure becomes the c-axis of the tetragonal
structure. The unit cell volume (not shown) continuously decreases in a linear
fashion when the large Ge atoms are replaced by the small Si atoms. Contrary
to what was observed in the R5T4 systems (T¼Si, Ge) with yttrium and the
FIGURE 32 Dependence of lattice parameters on the Si concentration in the La5SixGe4�x
system.
Handbook on the Physics and Chemistry of Rare Earths366

heavy lanthanides, in the light lanthanides an increase in Si concentration
leads to the destruction of the layered (slab) structure and formation of the
nonlayered Zr5Si4 type.
Liu and Altounian (2012) also calculated the compositional dependence of
the Wigner–Seitz volume (WSV) and found that the WSV of the La atoms
decreases when the amount of Ge increases. The study suggests that when
the WSV of the La1 atom decreases below a certain value the crystal structure
changes from Zr5Si4 type to Sm5Ge4 type.
4.3. Ce5SixGe4�x
Ce5Si4 and Ce5Ge4 compounds were discovered by Smith et al. (1967b). As
with other light lanthanides, the silicide crystallizes in the tetragonal Zr5Si4-
type crystal structure while the germanide adopts the orthorhombic Sm5Ge4type. The phase diagram of the Ce–Si system has been investigated by
Bulanova et al. (2002). The study confirms the tetragonal crystal structure for
Ce5Si4 and reports that it forms by peritectic reaction from Ce–Si and liquid
at 1500 �C. Vejpravova et al. (2006) studied the crystal structure (reporting
the same Zr5Si4 type) and magnetic behavior of Ce5Si4, which orders antiferro-
magnetically at TN¼5.6 K. The magnetic susceptibility obeys Curie–Weiss law
in the paramagnetic region with peff¼2.6�0.1 mB/Ce and yp¼�4�1 K.
Malik et al. (2009) investigated basic magnetic properties of Ce5Ge4(Sm5Ge4-type structure) and reported that this compound orders ferromagne-
tically at TC¼12 K. However, the value of the calculated paramagnetic Weiss
temperature was clearly negative, �20 K, and a magnetization value at 6 K
and 90 kOe is only 0.8 mB/Ce atom, much lower than gJ value of 2.14 mBexpected for the trivalent cerium ion in the ferromagnetic state. At the same
time, the effective paramagnetic moment, peff, is 2.44 mB/Ce atom, close to
the theoretical gJ[J(Jþ1)]1/2 value of 2.54 mB for the free Ce3þ ion. The max-
imum magnetic entropy change is �9 J/Kg K for 0–90 kOe magnetic field
change. Heat capacity measurements show that the magnetic transition in
Ce5Ge4 is of second order (Nirmala et al., 2010).
The phase compositions and crystal structures of compounds in the
Ce5SixGe4�x system were studied on the arc-melted alloys annealed at
1000 �C for 1 week by Zhang et al. (2009). Two solid solutions were clearly
identified: a Ce5Si4-based solid solution (1.15<x�4) with the Zr5Si4-type
structure and a Ce5Ge4-based solid solution (0�x<0.65) with the Sm5Ge4-
type structure. In addition, an intermediate phase with the Gd5Si2Ge2-type
monoclinic structure was observed near the x¼1.05�0.05 composition (SG
P1121/a, a¼7.9305(2) A, b¼15.2713(6) A, c¼8.0609(1) A, g¼93.452(7)�);however, this compound was not obtained as a single-phase alloy, but as a
mixture of either MþO(II) or MþT.
The phase boundaries shift slightly due to annealing. Zhang et al. (2010)
reported the results of investigation of the phase relationships, crystal
Chapter 262 R5T4 Compounds 367

structures, magnetic and magnetocaloric properties of the as-cast Ce5SixGe4�x
alloys, and found that the composition of the monoclinic phase in the non-
heat-treated samples is closest to Ce5Si1.75Ge2.25. However, a single-phase
alloy with the monoclinic crystal structure has not been obtained. The tetrag-
onal structure in the as-cast alloys exists for 1.85�x�4.0, and the orthorhom-
bic structure exists for 0�x�1.6. The temperature dependence of the lattice
parameters and unit cell volume on the Si concentration is shown in Fig. 33.
Magnetic properties of the as-cast Ce5SixGe4�x alloys were measured by
Zhang et al. (2010) and are summarized in Table 14. All samples order mag-
netically at low temperatures and their inverse magnetic susceptibilities fol-
low the Curie–Weiss law in the paramagnetic state.
It is interesting to note that unlike the R5T4 systems with heavy lantha-
nides, in the Ce5SixGe4�x system the Ce5Ge4 and other germanium-rich alloys
with the Sm5Ge4-type structure order ferromagnetically, while Ce5Si4 and
silicon-rich alloys with the tetragonal Zr5Si4 structure adopt antiferromagnetic
ground state. The magnetic phase transitions in all alloys appear to be second-
order ones.
4.4. Pr5SixGe4�x
Pr5Si4 and Pr5Ge4 compounds were discovered by Smith et al. (1967b).
Similarly to most of the other R5T4 compounds formed by light lanthanides,
the silicide crystallizes in the nonlayered tetragonal Zr5Si4-type structure,
while the germanide adopts the orthorhombic Sm5Ge4 type. Thuy et al.
(2001) prepared the Pr5Si2Ge2 compound and found it to be isostructural
with the monoclinic Gd5Si2Ge2. They also reported that Pr5Si2Ge2 orders
FIGURE 33 Lattice parameters (A) and unit cell volume (B) of the as-cast alloys from the pseu-
dobinary Ce5Si4–Ce5Ge4 system plotted as a function of Si content (Zhang et al., 2010).
Handbook on the Physics and Chemistry of Rare Earths368

TABLE 14 The Magnetic and Magnetocaloric Properties of the As-Cast Ce5SixGe4�x Alloys (Zhang et al., 2010)
Composition Structurea TC/TNb (K) yp (K)
peff
(mΒ/Ce) MS (mB/Ce) �DSM (J/Kg K), DH¼20 kOe �DSM (J/Kg K), DH¼50 kOe
Ce5Si4 T 3.8b �8.2 2.35 0.909 3.0 8.8
Ce5Si3Ge T 4.8b �13.4 2.39 0.916 3.1 7.6
Ce5Si2.2Ge1.8 T 4.9b �14.2 2.35 0.857 2.5 6.2
Ce5Si1.75Ge2.25 M, O(II) 11.5 13.5 2.30 1.053 3.1 6.6
Ce5SiGe3 O(II) 11.5 50.3 2.25 1.254 4.5 9.9
Ce5Ge4 O(II) 11.5 48.7 2.00 1.200 5.6 11.6
aThe symbols: T, tetragonal Zr5Si4 type; M, monoclinic Gd5Si2Ge2 type; and O(II), orthorhombic Sm5Ge4 type.bValues that denote the Neel temperature.
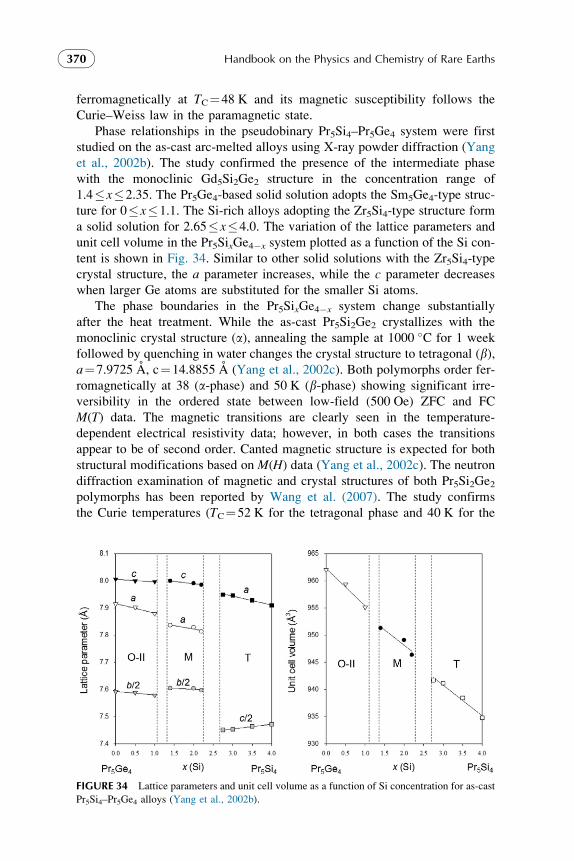
ferromagnetically at TC¼48 K and its magnetic susceptibility follows the
Curie–Weiss law in the paramagnetic state.
Phase relationships in the pseudobinary Pr5Si4–Pr5Ge4 system were first
studied on the as-cast arc-melted alloys using X-ray powder diffraction (Yang
et al., 2002b). The study confirmed the presence of the intermediate phase
with the monoclinic Gd5Si2Ge2 structure in the concentration range of
1.4�x�2.35. The Pr5Ge4-based solid solution adopts the Sm5Ge4-type struc-
ture for 0�x�1.1. The Si-rich alloys adopting the Zr5Si4-type structure form
a solid solution for 2.65�x�4.0. The variation of the lattice parameters and
unit cell volume in the Pr5SixGe4�x system plotted as a function of the Si con-
tent is shown in Fig. 34. Similar to other solid solutions with the Zr5Si4-type
crystal structure, the a parameter increases, while the c parameter decreases
when larger Ge atoms are substituted for the smaller Si atoms.
The phase boundaries in the Pr5SixGe4�x system change substantially
after the heat treatment. While the as-cast Pr5Si2Ge2 crystallizes with the
monoclinic crystal structure (a), annealing the sample at 1000 �C for 1 week
followed by quenching in water changes the crystal structure to tetragonal (b),a¼7.9725 A, c¼14.8855 A (Yang et al., 2002c). Both polymorphs order fer-
romagnetically at 38 (a-phase) and 50 K (b-phase) showing significant irre-
versibility in the ordered state between low-field (500 Oe) ZFC and FC
M(T) data. The magnetic transitions are clearly seen in the temperature-
dependent electrical resistivity data; however, in both cases the transitions
appear to be of second order. Canted magnetic structure is expected for both
structural modifications based on M(H) data (Yang et al., 2002c). The neutron
diffraction examination of magnetic and crystal structures of both Pr5Si2Ge2polymorphs has been reported by Wang et al. (2007). The study confirms
the Curie temperatures (TC¼52 K for the tetragonal phase and 40 K for the
FIGURE 34 Lattice parameters and unit cell volume as a function of Si concentration for as-cast
Pr5Si4–Pr5Ge4 alloys (Yang et al., 2002b).
Handbook on the Physics and Chemistry of Rare Earths370

monoclinic) and a second order of the magnetic transition for both Zr5Si4- and
Sm5Ge4-type structures; no structural transition was observed between 300
and 4 K though small magnetovolume effects are present at TC. No spin-
reorientation transition occurs below TC. In the magnetically ordered state,
magnetic moments are mainly oriented along the c-axis in the Zr5Si4 struc-
ture, and they lie in the ab plane (with the larger a component) in the
Gd5Si2Ge2 structure. In both polymorphs, the lattice contraction at TC occurs
in the direction of the largest net magnetic moment component, while there is
an increase in lattice parameter along other crystallographic directions.
Investigation of the Pr5SixGe4�x system using alloys annealed at 1000 �Cfor 1 week showed that such heat treatment indeed transforms the monoclinic
crystal structure observed in the as-cast alloys into the tetragonal one. Conse-
quently, only two phase regions, the Pr5Ge4-based solid solution with the
orthorhombic Sm5Ge4 type for 0�x�1, and the Pr5Si4-based solid solution
with the tetragonal Zr5Si4 type for 1.2�x�4.0, exist in this system when
the samples are heat treated (Yang et al., 2003b).
Yang et al. (2003c) performed magnetic measurements on the as-cast
Pr5SixGe4�x alloys and found that the magnetic ordering temperature increases
from 41 to 47 K with the increase of Si concentration in the O(II) region of the
phase diagram but remains nearly the same (38 K) in the monoclinic alloys. On
the contrary, in the solid solution region with the tetragonal crystal structure the
Curie temperature decreases from 47 to 38 K with the increase in x(Si).Magnetic properties and temperature dependences of electrical resistivity at
0 and 50 kOe magnetic fields have been reported for the Pr5Ge4 compound by
Yang et al. (2003d). Two magnetic transitions at 25 and 41 K were observed in
500 Oe applied magnetic field. There is an irreversibility between ZFC and FC
M(T) data below 25 K but not between 25 and 41 K. The transitions appear to
be of second order. Only one broad magnetic transition is observed in 50 kOe
applied magnetic field. This magnetic behavior is reflected in the electrical resis-
tivity data, which also show two transitions in zero magnetic field but only one in
H¼50 kOe. A significant magnetoresistance of 25% at 24 K and 15% at 40 K is
probably caused by magnetic-field-induced changes to the magnetic structure.
The existence of two different magnetic structures in Pr5Ge4, one below
25 K and another between 25 and 42 K, has been shown by temperature-
dependent neutron diffraction experiments (Rao et al., 2004). However, they
observed that the crystal structure maintains the Sm5Ge4 type from room tem-
perature down to 1.6 K. In fact, two magnetic sublattices of Pr5Ge4 experience
long-range ordering differently: at 42 K only the praseodymium atoms occu-
pying the 4(c) site order magnetically, inducing small magnetic moments on
the 8(d) sites. Below 25 K both Pr 4(c) and Pr 8(d) sublattices become mag-
netically ordered. The Pr moments on the 4(c) site align along the b-axis.At 9 K, the absolute values of 4(c) Pr magnetic moment is 2.66(7)mB, whilethe 8(d) Pr moments are 2.6(1)mB. According to Rao et al. (2004) lower than
gJ¼3.2 mB/Pr3þ values of magnetic moments indicate crystalline electric field
effect in Pr5Ge4, and, likely, in other Pr5SixGe4�x alloys.
Chapter 262 R5T4 Compounds 371

Temperature-dependent neutron diffraction study of Pr5Si1.5Ge2.5 shows
that the ferromagnetic ordering in this compound occurs through a second-
order transition at TC¼32 K, and, similar to Pr5Ge4, the room temperature
crystal structure (in this case monoclinic Gd5Si2Ge2 type) is preserved down
to T¼4 K (Magen et al., 2004a). However, unlike Pr5Ge4 only one magnetic
transition (at TC) is observed so the Pr atoms located both outside [8(d)] andinside [4(c)] the slabs order simultaneously in Pr5Si1.5Ge2.5. The net magnetic
moment is primarily aligned along the a-axis but significant canting is also
observed. It is important to note that while in the Gd5SixGe4�x system the
magnetic ordering of the monoclinic phase is always coupled with a structural
transformation into the Gd5Si4-type phase (O(I)), in Pr5SixGe4�x (and some
other R5SixGe4�x systems) the monoclinic Gd5Si2Ge2-type structure may
order ferromagnetically without structural transition.
Magnetic and electrical transport properties of Pr5Si4 were studied by
Pinguet et al. (2003). This compound is a ferromagnet with weak magneto-
crystalline anisotropy. The Curie temperature is 40 K and the saturation
moment measured at T¼5 K and H¼30 kOe is 2.14 mB/Pr. Pr5Si4 is a hard
ferromagnet with �80% remanence. In the paramagnetic state, it follows
the Curie–Weiss law with peff¼3.5 mB/Pr and yp¼39 K. The electrical resis-
tivity of Pr5Si4 is metallic and follows the (r/r300)T¼ (r/r300)0þATa law
below TC: (r/r300)0¼0.48, A¼4.4�10�6 mO/K, a¼2.8.
4.5. Nd5SixGe4�x
The end members of this pseudobinary system, Nd5Si4 and Nd5Ge4, were first
discovered and their crystal structures determined by Smith et al. (1967b).
Nd5Ge4 adopts the Sm5Ge4-type crystal structure (SG Pnma, a¼7.86 A,
b¼15.06 A, c¼7.93 A). Similarly to the R5Si4 compounds with R¼La–Pr,
Nd5Si4 crystallizes in the tetragonal Zr5Si4-type crystal structure (SG
P41212, a¼7.78 A, c¼14.78 A). However, Al-Shahery and McColm (1984)
indicate that under certain conditions an unspecified orthorhombic crystal
structure may be observed for this composition.
The investigation of Nd5SixGe4�x as-cast alloys showed that they may
crystallize in four different crystal structure types depending on the composi-
tion (Gschneidner et al., 2000b; Yang et al., 2002d). The Nd5Ge4-based solid
solution adopts the Sm5Ge4-type structure (O(II)) for 0�x�1.1; the mono-
clinic Gd5Si2Ge2-type phase (M) forms for 1.35�x�2.2; the orthorhombic
Gd5Si4-type structure (O(I)) exists in a narrow range of concentrations
(2.6�x�2.9); and the samples in the Nd5Si4-based solution crystallize with
the tetragonal Zr5Si4-type structure for 3.3�x�4.0 (Yang et al., 2002d).
The concentration dependence of lattice parameters of as-cast
Nd5SixGe4�x alloys is shown in Fig. 35. However, similar to the Pr5SixGe4�x
system, annealing (1000 �C/1 week) of the arc-melted alloys changes the
observed phase boundaries, extending the silicide-based solid solution
Handbook on the Physics and Chemistry of Rare Earths372

(1.7�x�4.0) with the tetragonal crystal structure at the expense of the other
crystal structure. In this case, the Gd5Si4-type solid solution does not form in
the heat-treated Nd5SixGe4�x alloys (Yang et al., 2003b).5 Unlike the praseo-
dymium system, the monoclinic phase was observed in the annealed
neodymium-based alloys for 0.95�x�1.5. Finally, the germanide-based
solution with the Sm5Ge4 structure is also affected by the heat treatment
and exists over a narrower range of concentrations: 0�x�0.7.
An early neutron diffraction experiment determined that Nd5Ge4 has a
canted magnetic structure with magnetic moments primarily confined in the
ac-plane of the crystal lattice (Schobinger-Papamantellos and Niggli, 1981).
The moments are ferromagnetically aligned along the a-axis, but show a
minor AFM component along the c-axis. A single magnetic ordering transi-
tion was detected by this neutron diffraction experiment at TN¼52 K (the
compound was considered a ferrimagnet). A more recent neutron diffraction
study of Nd5Ge4 essentially confirmed this magnetic structure reporting zero
net magnetization along the b- and c-directions and a significant net magnetic
moment along the a-direction (Cadogan et al., 2002). The magnetic structure
of Nd5Si4 was investigated by neutron diffraction experiment in the same
work, and was described as antiferromagnetic in the tetragonal basal plane
(ab) and ferromagnetic along the c-axis (TC¼66 K). The Nd magnetic
moment components of Nd5Ge4 and Nd5Si4 compounds are presented in
Table 15.
FIGURE 35 Lattice parameters and unit cell volume as a function of Si concentration for the
as-cast Nd5Si4–Nd5Ge4 alloys (Yang et al., 2002d).
5. Interestingly, the O(I)-Gd5Si4-type structure is stable after annealing (600 �C/2 weeks) when a
small amount of Si is substituted by Ag (instead of Ge) in Nd5Ag0.5Si3.5 (Stepe�n-Damm et al.,
1995).
Chapter 262 R5T4 Compounds 373

TABLE 15 Crystal Structures (at T¼295 K) and Nd Magnetic Moment
Components of Nd5Si4 (at T¼12 K) and Nd5Ge4 (T¼11 K) Compounds
Determined by Cadogan et al. (2002) and of Nd5Si1.45Ge2.55 (Both
Nuclear and Magnetic Structures Determined at T¼4 K) Reported by
Magen et al. (2004a)
Atom x y z mx (mB) my (mB) mz (mB)Total
moment (mB)
Nd5Si4 (P41212, a¼7.8760(8)A, c¼14.8010(18) A)
Nd1(4a) 0.1901 0.1901 0 0.36(4) 0.36(4) 2.34(6) 2.39(6)
Nd2(8b) 0.0142 0.1326 0.6192 0.33(4) 0.43(4) 2.41(6) 2.47(6)
Nd3(8b) 0.9861 0.3667 0.2025 1.38(4) 0.58(4) 2.35(6) 2.79(6)
Si1(8b) 0.0529 0.2810 0.8070 – – – –
Si2(8b) 0.2826 0.3270 0.6926 – – – –
Nd5Ge4 (Pnma, a¼7.8684(9) A, b¼15.1207(16) A, c¼7.9628(9)A)
Nd1(4c) 0.2888 0.25 0.0020 1.84(4) 0 0.16(6) 1.85(6)
Nd(8d) 0.1197 0.1161 0.3429 2.79(4) 1.01(4) 1.12(6) 3.17(6)
Nd(8d) 0.9757 0.0991 0.8176 2.47(4) 0.14(4) 1.20(6) 2.75(6)
Ge1(4c) 0.9159 0.25 0.1032 – – – –
Ge2(4c) 0.1801 0.25 0.6373 – – – –
Ge3(8d) 0.2197 0.9567 0.5305 – – – –
Nd5Si1.45Ge2.55(P1121/a, a¼7.7674(7)A, b¼15.0967(9) A, c¼7.9324(3) A,g¼93.859(5)�)
Nd1(4e) 0.333 0.2430 0.0057 2.3(1) 0.1(2) 0.9(1) 2.5(1)
Nd2(4e) �0.0043 0.1002 0.1820 2.4(2) 1.9(2) 1.7(1) 3.7(2)
Nd3(4e) 0.0291 0.3974 0.1791 2.7(2) 0.6(2) 0.2(1) 2.8(1)
Nd4(4e) 0.358 0.8853 0.1665 1.6(2) 1.8(2) 1.6(1) 3.0(1)
Nd5(4e) 0.326 0.6223 0.1818 2.6(2) 1.0(2) 0.2(1) 2.8(1)
aT1(4e) 0.950 0.2526 0.9013 – – – –
aT2(4e) 0.215 0.2513 0.3681 – – – –
aT3(4e) 0.208 0.9573 0.4735 – – – –
aT4(4e) 0.143 0.5444 0.474 – – – –
aT¼36.25% Siþ63.75% Ge.
Handbook on the Physics and Chemistry of Rare Earths374

The Nd5Si1.45Ge2.55 compound crystallizes in the monoclinic structure at
room temperature and orders ferromagnetically at TC¼56 K (Magen et al.,
2004a). Similarly to the Pr5Si1.5Ge2.5 monoclinic phase it preserves the same
crystal structure down to 4 K, demonstrating the existence of the monoclinic
ferromagnetic phase in the Nd5SixGe4�x system. Overall, the magnetic struc-
ture of Nd5Si1.45Ge2.55 is similar to the one reported for Nd5Ge4 by Cadogan
et al. (2002), that is, the net magnetization is mainly oriented along the a-axisand a strong magnetic moment canting is observed for b- and c-axis. Themagnetic coupling along the c-axis is essentially antiferromagnetic. Only
one magnetic ordering transition occurs in Nd5Si1.45Ge2.55.
On the other hand, neutron diffraction investigation of Nd5Si2.4Ge1.6alloy prepared using high-purity neodymium metal (99.8þat.% pure with
respect to all other elements in the periodic table) from Ames Laboratory
shows that both magnetic and structural transitions occur at TC¼68 K in this
sample (Magen et al., 2004b). The transformation from room temperature
Gd5Si2Ge2-type structure into the O(I) Gd5Si4-type structure is intimately
coupled with magnetic ordering; the transition is accompanied by a strong
volume change estimated as DV/V¼�0.61%. The changes in lattice para-
meters are anisotropic and mainly occur along the a-axis: Da/a¼�0.85%,
Db/b¼þ0.05%, Dc/c¼�0.02%. Similar to the transitions occurring in the
Gd5SixGe4�x system the temperature of the transition changes with applied
magnetic field with a rate of 0.11(1) K/kOe. The structural transition, how-
ever, was not complete and both room temperature and low-temperature struc-
tures coexist at 4 K. The magnetic moments of the orthorhombic phase are
almost collinearly aligned along the a-axis and show small AFM canting in
the b- and c-directions. It is important to note that the Nd5Si2.4Ge1.6 composi-
tion is supposed to be a multiphase alloy according to the diagram
provided by Yang et al. (2002d) (Fig. 35). However, according to Magen et al.
(2004b) an alloy of this composition prepared using the high-purity Nd was
single phase with the monoclinic Gd5Si2Ge2-type crystal structure. Therefore,
apparent phase boundaries in R5T4 systems (i.e., those established using sam-
ples prepared from rare earth metals with commercial purity) are different
from the true phase boundaries established when using alloys prepared from
the high-purity rare earth metals. In addition, purity affects the nature of the
phase transitions occurring in the R5T4 systems as it was well documented
in the Gd5SixGe4�x system. It is also important to emphasize that it does
not mean that the monoclinic Nd5SixGe4�x compound prepared from high-
purity components will necessary show magnetostructural coupling. The rela-
tively low value of the magnetocaloric effect observed in the monoclinic
Nd5Si2Ge2 sample prepared using high-purity Nd suggests that this compound
orders magnetically via a second-order phase transition (Gschneidner et al.,
2000b). In fact, Wang et al. (2008) showed that the magnetostructural
Chapter 262 R5T4 Compounds 375

transition in the Nd5SixGe4�x alloys can be observed in alloys made from
commercial purity metals, yet it occurs in the narrow concentration range:
2.25<x<2.5.
Basic magnetic properties of Nd5Si4 measured by Boulet et al. (2001) show
TC¼67 K, ms¼1.4 mB/Nd, and a remanence of 57% (hard magnetic material).
The Curie–Weiss fit of the magnetic susceptibility in the paramagnetic
region gives yp¼76 K and peff¼3.5 mB/Nd. A systematic study of magnetic
properties of Nd5SixGe4�x alloys by Gschneidner et al. (2000b) shows that in
general the magnetic ordering (and paramagnetic Weiss) temperatures decrease
almost linearly from 71 (yp¼74) to 55 K (yp¼52) when the germanium concen-
tration increases. However, the Curie temperature of an Nd5Si3Ge alloy with the
O(I) Gd5Si4 type of crystal structure does not follow this trend as it orders at
TC¼124 K. The changes in crystal structure due to heat treatment consequently
affect the magnetic properties, especially when the structure changes from O(I)
Gd5Si4 to tetragonal (T) Zr5Si4. For example, b-Nd5Si2.8Ge1.2 (T polymorphic
modification, TC¼77 K) orders magnetically at much lower temperature com-
pared to a-Nd5Si2.8Ge1.2, which adopts the O(I) polymorphic modification
and has TC¼122 K. At the same time, the difference in magnetic ordering tem-
peratures between monoclinic Nd5Si2Ge2 (TC¼66 K) and tetragonal Nd5Si2Ge2(TC¼74 K) is not that large (Yang et al., 2003e).
Tsutaoka et al. (2010) performed magnetic and electrical resistivity
measurements on an Nd5Ge4 single crystal and identified two critical tem-
peratures: TC¼53 K and Tt¼39 K. According to their study Tt is the temper-
ature at which magnetic moments align along the a-axis. At 2 K, a typical FM
magnetization curve is observed when a magnetic field is applied along the
a-axis, and a metamagnetic transition occurs at H¼30 kOe applied along
the c-axis. When the magnetic field is applied along the b-axis the magnetiza-
tion increases linearly with the applied magnetic field suggesting strong AFM
coupling along this direction. A magnetic moment ms¼2.3 mB/Nd is obtained
for the a-direction in 70 kOe applied magnetic field. The electrical resistivity
of Nd5Ge4 was measured along the a-axis. It shows typical metallic behavior
with a rapid decrease in r below TC.
4.6. Sm5SixGe4�x
The Sm5Ge4 and Sm5Si4 compounds were first reported together with other
R5Si4 and R5Ge4 compounds by Smith et al. (1967b). In fact, the crystal struc-
ture of Sm5Ge4 (Smith et al., 1967a) became a prototype crystal structure for
the large class of the layered R5T4 materials (i.e., the O(II) structure) and is
characterized, among other features, by the absence of short interslab TdT
bonds. Another interesting observation made by Smith et al. (1967b) was that
Sm5Si4 also crystallizes with the orthorhombic structure type while R5T4
Handbook on the Physics and Chemistry of Rare Earths376

compounds formed by other light lanthanides (R¼La–Nd) adopt the tetrago-
nal Zr5Si4-type structure.
The number of studies of the Sm5SixGe4�x alloys is limited, probably, due
to difficulties in preparation of high-quality samarium-based intermetallics
related to the high vapor pressure of Sm and the high melting temperature
(>1600 �C) of the Sm5T4 phases. However, Ahn et al. (2007) presented a sys-
tematic investigation of phase relationships and crystal structures in this
pseudobinary system complemented by thorough measurements of the mag-
netic and thermodynamic properties. Samples were prepared in sealed Ta cru-
cibles. Similar to the Gd5SixGe4�x system there are three distinct phase
regions in the Sm5SixGe4�x system: Si-rich solid solution with the O(I)
Gd5Si4-type structure (Sm5Si4 and Sm5Si3Ge alloys), intermediate Sm5Si2Ge2composition with the monoclinic Gd5Si2Ge2-type structure, and the Ge-rich
solid solution with the O(II) Sm5Ge4-type structure (Sm5SiGe3 and Sm5Ge4alloys). Magnetic properties of Sm5SixGe4�x alloys are summarized in
Table 16 below.
The alloys with O(I) and M crystal structures order ferromagnetically
while the alloys adopting the O(II)-type structure are antiferromagnetic. As
commonly observed in the Sm compounds, here the inverse susceptibility in
the paramagnetic region cannot be described by linear Curie–Weiss law due
to a number of interrelated factors including crystalline electric field (CEF)
splitting, the low level excited states of J multiplet, and the Van Vleck transi-
tion between different J multiplets. Both effective paramagnetic and
saturation moments are much lower in Sm5SixGe4�x alloys compared to what
is expected based on the Hund’s rule. The energy separation between J¼7/2
and J¼5/2 states obtained from the fitting of the magnetic susceptibility data
is also lower than expected for free Sm3þ ions (�1350 K, Van Vleck, 1932).
TABLE 16 The Magnetic Properties of Sm5SixGe4�x Alloys (Ahn et al., 2007)
Compound TC, TNa (K) yp (K) peff (mB/Sm)
ms at 1.8 K
(mB/Sm)
ms near TC(mB/Sm) D (K)b
Sm5Si4 220 220 0.34 0.025 0.1 776
Sm5Si3Ge 210 212 0.29 0.02 0.08 824
Sm5Si2Ge2 125 120 0.36 0.02 0.05 1000
Sm5SiGe3 90a 70 0.31 0.024 0.018 1030
Sm5Ge4 90a 60 0.35 0.018 0.018 1030
aFor AFM compounds.bEnergy separation between J¼7/2 and J¼5/2 states.
Chapter 262 R5T4 Compounds 377
Another interesting observation is that the behavior of M(H) loops at high
temperatures but below TC is typical for a hard ferromagnet with significant
coercivity, while at 1.8 K the M versus H dependence is close to linear.
The measured temperature dependences of heat capacity suggest that the
magnetic ordering transitions are of second order since the heat capacity plots
exhibit l-type peaks for all compounds except Sm5Si2Ge2, whose transition
appears to be of first order. The low-temperature X-ray diffraction data
(Ahn et al., 2007) show that a coupled magnetostructural transition from para-
magnetic M structure into ferromagnetic O(I) structure occurs in Sm5Si2Ge2at TC. The structural transition is incomplete: �60% of the powder trans-
formed to the O(I) phase at the lowest temperature of the measurement
(5 K). A significant change in lattice dimensions during this transition occurs
along the a-axis (Da/a¼�0.6%) yet the changes along the b- and c-axes arenegligible: Db/b¼�0.02%, Dc/c¼0.01%.
4.7. Tb5SixGe4�x
4.7.1. Crystallography and Magnetism
The existence, crystal structure, and lattice parameters of the end members of
the Tb5SixGe4�x pseudobinary system, Tb5Si4 and Tb5Ge4 were originally
reported by Smith et al. (1966, 1967b). Holtzberg et al. (1967) confirmed
the crystal structure of the Tb5Si4 and Tb5Ge4 compounds (both were believed
to crystallize in the Sm5Ge4 type) and reported lattice parameters similar to
those of Smith et al. (1967b). In addition, Holtzberg et al. measured basic
magnetic properties of both the silicide and germanide compounds. In line
with the trend observed for all other measured R5Si4 and R5Ge4 compounds,
Tb5Si4 orders ferromagnetically at a relatively high TC¼225 K, while Tb5Ge4is antiferromagnetic below TN¼�30 K (later studies showed that this temper-
ature is actually much higher). At the same time, the paramagnetic Curie tem-
peratures determined from the Curie–Weiss fits of reciprocal magnetic
susceptibility plots are clearly positive for silicide and germanide, 216 and
80 K, respectively (Holtzberg et al., 1967).
Spichkin et al. (2001) studied the crystal structure, magnetic, and magne-
tocaloric properties of Tb5Si4 as part of an investigation of the GdxTb5�xSi4system. The silicide is isostructural with Gd5Si4 and has lattice parameters
a¼7.4234(5) A, b¼14.621(1) A, c¼7.6938(6) A and unit cell volume
V¼835.1(2) A3. The magnetic properties of Tb5Si4 agree with those reported
by Holtzberg et al., 1967: TC¼223.2 K, yp¼227 K, paramagnetic moment
peff¼9.76 mB, and saturation moment ms¼9.06 mB at 5 K (moments are
reported per Tb atom). The magnetocaloric properties were calculated from
the isothermal magnetization data and the values of the maximum magnetic
entropy change were observed as �DSM¼4.5 J/Kg K and �DSM¼9 J/Kg K
Handbook on the Physics and Chemistry of Rare Earths378
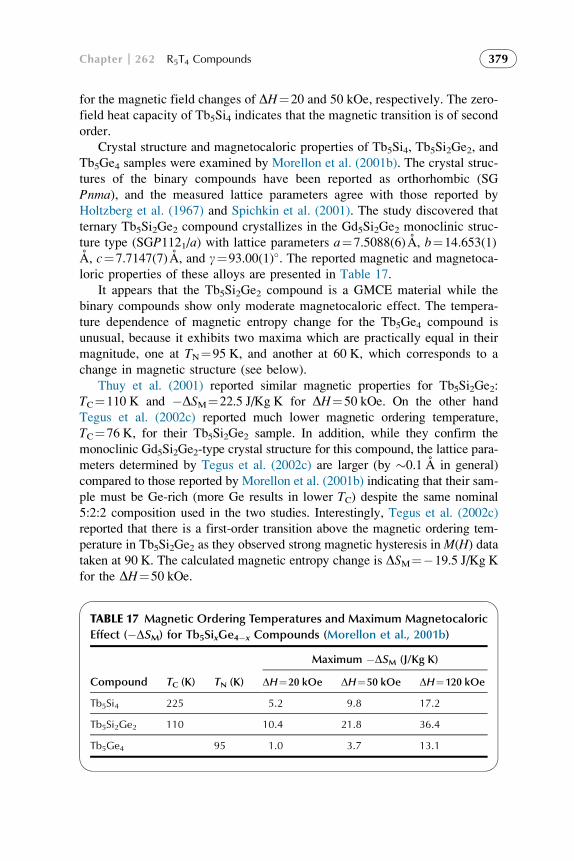
for the magnetic field changes of DH¼20 and 50 kOe, respectively. The zero-
field heat capacity of Tb5Si4 indicates that the magnetic transition is of second
order.
Crystal structure and magnetocaloric properties of Tb5Si4, Tb5Si2Ge2, and
Tb5Ge4 samples were examined by Morellon et al. (2001b). The crystal struc-
tures of the binary compounds have been reported as orthorhombic (SG
Pnma), and the measured lattice parameters agree with those reported by
Holtzberg et al. (1967) and Spichkin et al. (2001). The study discovered that
ternary Tb5Si2Ge2 compound crystallizes in the Gd5Si2Ge2 monoclinic struc-
ture type (SGP1121/a) with lattice parameters a¼7.5088(6) A, b¼14.653(1)
A, c¼7.7147(7) A, and g¼93.00(1)�. The reported magnetic and magnetoca-
loric properties of these alloys are presented in Table 17.
It appears that the Tb5Si2Ge2 compound is a GMCE material while the
binary compounds show only moderate magnetocaloric effect. The tempera-
ture dependence of magnetic entropy change for the Tb5Ge4 compound is
unusual, because it exhibits two maxima which are practically equal in their
magnitude, one at TN¼95 K, and another at 60 K, which corresponds to a
change in magnetic structure (see below).
Thuy et al. (2001) reported similar magnetic properties for Tb5Si2Ge2:
TC¼110 K and �DSM¼22.5 J/Kg K for DH¼50 kOe. On the other hand
Tegus et al. (2002c) reported much lower magnetic ordering temperature,
TC¼76 K, for their Tb5Si2Ge2 sample. In addition, while they confirm the
monoclinic Gd5Si2Ge2-type crystal structure for this compound, the lattice para-
meters determined by Tegus et al. (2002c) are larger (by �0.1 A in general)
compared to those reported by Morellon et al. (2001b) indicating that their sam-
ple must be Ge-rich (more Ge results in lower TC) despite the same nominal
5:2:2 composition used in the two studies. Interestingly, Tegus et al. (2002c)
reported that there is a first-order transition above the magnetic ordering tem-
perature in Tb5Si2Ge2 as they observed strong magnetic hysteresis inM(H) datataken at 90 K. The calculated magnetic entropy change is DSM¼�19.5 J/Kg K
for the DH¼50 kOe.
TABLE 17 Magnetic Ordering Temperatures and Maximum Magnetocaloric
Effect (�DSM) for Tb5SixGe4�x Compounds (Morellon et al., 2001b)
Compound TC (K) TN (K)
Maximum �DSM (J/Kg K)
DH¼20 kOe DH¼50 kOe DH¼120 kOe
Tb5Si4 225 5.2 9.8 17.2
Tb5Si2Ge2 110 10.4 21.8 36.4
Tb5Ge4 95 1.0 3.7 13.1
Chapter 262 R5T4 Compounds 379

The monoclinic crystal structure of Tb5Si2Ge2 was confirmed by Huang
et al. (2002) and the observed Curie temperature, TC¼101 K, is between
the values reported by Morellon et al. (2001b) and Thuy et al. (2001)
(110 K) and that of Tegus et al. (2002c) (76 K). The discrepancies in the mag-
netic ordering temperature values reported in several independent studies indi-
cate that TC in Tb5SixGe4�x is sensitive to the actual chemical composition of
the sample, particularly to the Si/Ge ratio (or x). The purity of the starting rare
earth metal used in the sample preparation also, probably, plays a role. It is
worth to note that the Tb5Si2Ge2 samples from Morellon et al. (2001b)
(prepared using the commercial quality Tb) and Huang et al. (2002) (prepared
using high-purity Tb from Ames Laboratory, which was 99.67 at.% pure with
respect to all other elements in the periodic table) have similar lattice para-
meters yet their TC’s are �9 K apart. Huang et al. (2002) also studied the crys-
tal structure and MCE of Tb5Si4 and Tb5Si3Ge. The results obtained for the
Tb5Si4 sample are practically identical to those of Spichkin et al. (2001)
(see above). The Tb5Si3Ge alloy has orthorhombic O(I)-Gd5Si4 crystal struc-
ture with TC¼209.6 K. According to heat capacity measurements the ortho-
rhombic alloys have second-order magnetic transitions while Tb5Si2Ge2shows a first-order transition in the Cp(T) data, a scenario similar to the
Gd5SixGe4�x system. Consequently, the MCE is the largest for the monoclinic
phase as well. Tocado et al. (2005) determined MCE of Tb5Si2Ge2 from heat
capacity data measured in 0 and 50 kOe applied magnetic fields; the direct
measurement of MCE have been performed as well. The heat capacity data
generally agree with those reported by Huang, et al., 2002: a large
first-order like heat capacity peak is observed at 105 K. The maximum DTad(at 109 K) is 6.5 K for the direct measurement and 7.8 K for the heat capacity
data (Tocado et al., 2005).
Thuy (2002) and Thuy et al. (2002) studied the Tb5SixGe4�x alloys with
x¼2, 3, and 4 but these alloys were prepared using commercial purity Tb.
They reported monoclinic crystal structure for the Tb5Si3Ge compound,
however, the measured TC¼215 K is in good agreement with the value
obtained by Huang et al. (2002), and the calculated MCE for this compound
is typical for a second-order material. The magnetic ordering temperatures
for Tb5Si2Ge2 and Tb5Si4 were 116 and 223.2 K, respectively. The temper-
ature dependences of magnetization (measured at H¼1 kOe) and electrical
resistivity (H¼0 kOe) for Tb5SixGe4�x samples with x¼2.4, 3.0, and 4.0
were measured by Yao et al. (2003). A sharp first-order like anomaly and
strong thermal hysteresis were observed around TC for the Tb5Si2.4Ge1.6sample. Kupsch et al. (2005) confirmed that the Tb5Si2.4Ge1.6 sample under-
goes transformation from the monoclinic (Gd5Si2Ge2 type, P1121/a) struc-ture into the orthorhombic (O(I)-Gd5Si4 type, Pnma) structure between
100 and 150 K. A large effective shift (0.84 A) of the adjacent slabs with
respect to each other along the a crystallographic direction has been
observed. Similarly to Gd5Si2Ge2, this magnetostructural transition results
Handbook on the Physics and Chemistry of Rare Earths380

in the GMCE observed in Tb5Si2.4Ge1.6 at TC¼150 K: DSM¼�29 J/Kg K
for DH¼50 kOe.
The first preliminary Tb5SixGe4�x x–T magnetostructural phase diagram
was constructed by Ritter et al. (2002) based on both macroscopic (LTE, ac
susceptibility, electrical resistivity) and microscopic (neutron powder dif-
fraction) experiments. As-cast samples with x¼0, 0.8, 1.2, 1.6, 2.0, 2.4,
2.8, 3.2, and 4.0 were prepared for this investigation. The samples with
1.6�x�2.4 crystallized in the monoclinic Gd5Si2Ge2 type of crystal struc-
ture (at room temperature), while other samples had orthorhombic crystal struc-
tures: O(I) in the Si-rich side of the diagram and O(II) in the Ge-rich side.
The reported diagram was similar to the Gd5SixGe4�x in several aspects: (1)
the magnetic ordering temperature decreases with increasing concentration of
Ge; (2) the PM!FM magnetic transition is observed in alloys with x1.6,
while in Ge-rich alloys the ordering is antiferromagnetic: (3) a strong coupling
between magnetism and crystal structure was observed. According to Ritter
et al. (2002) the PM!FM magnetic transition in the samples with
1.6�x�2.4 occurs simultaneously with the M to O(I) structural transition
though later studies showed that this is not true for all Tb5SixGe4�x alloys with
room temperature monoclinic crystal structure. Although Ritter et al. (2002)
did not observe a partial decoupling of the magnetic and structural transitions,
they pointed out two other notable differences between Gd5SixGe4�x and
Tb5SixGe4�x systems: (1) samples with the O(II) crystal structure do not undergo
crystallographic transformation and remain antiferromagnetically ordered even
at temperatures as low as 2 K, (2) spin-reorientation transitions were observed
in both the AFM and the FM ordered states.
A high-resolution neutron powder diffraction study of Tb5Si2Ge2 com-
pound complemented by temperature- and magnetic-field-dependent LTE
and magnetoresistance experiments further underscored the differences
between the Gd5SixGe4�x and Tb5SixGe4�x systems (Morellon et al., 2003).
The most important result of this study was a discovery of a ferromagnetically
ordered Tb5Si2Ge2 phase crystallizing in the Gd5Si2Ge2 monoclinic structure.
This phase exists over a narrow temperature range, between TC¼114 K and
Tstr¼�105 K (on cooling, Morellon et al., 2003), but the very fact of the
presence of ferromagnetic order in the monoclinic R5T4 structure has pro-
found implications on the theoretical understanding of the R5T4 systems.
For Gd5SixGe4�x alloys, it holds true that breaking even a half of the interslab
TdT bonds destroys long-range ferromagnetic interactions but it appears that
this may not be common for other lanthanides; moreover, complete coupling
of the magnetic and crystallographic sublattices seems to be mostly con-
strained to the Gd-based compounds.
Using pressure-dependent XMCD experiment Tseng et al. (2011) showed
that the 4f–5d hybridization is stronger in Tb5SixGe4�x compared to the
Gd5SixGe4�x. The less stable 4f8 configuration of Tb compared to the 4f7 con-
figuration of Gd may explain why 4f–5d hybridization becomes stronger in
Chapter 262 R5T4 Compounds 381

the Tb-containing alloys. While in gadolinium alloys the presence of the
Gd-5d–T-p hybridization is critical for the FM exchange interactions (Haskel
et al., 2007), there are, probably, alternative ways for the FM order to settle in
the R5T4 alloys with R other than Gd even though the 5d–3(4)p hybridization
remains important. The presence of single-ion anisotropy is also an crucial
factor influencing the magnetism of Tb compounds.
The practical implications from the existence of such an intermediate
phase are substantial as well. When the structural and magnetic transitions
are not fully coupled and are occurring at different temperatures the sharp
metamagnetic-like transitions, observed in Gd5Si2Ge2, are not seen in
Tb5Si2Ge2 when the magnetic field is applied around TC. As shown by Mor-
ellon et al. (2003), both magnetostriction and magnetoresistance curves still
indicate the presence of first-order transition manifested by strong hysteresis.
However, the field-induced transitions are quite sluggish. The magnitudes of
the field-induced effects (both magnetostrictive and magnetoresistive) are
smaller than the magnitudes of the same effects measured during the temper-
ature change across the transition. For example, the maximum volume magne-
tostriction in Tb5Si2Ge2 amounts to DV/V¼�0.14% at 105 K and 120 kOe,
while the spontaneous volume magnetostriction is DV/V¼�0.6% (Morellon
et al., 2003). Neutron powder diffraction experiments indicate that the mag-
netic field is a very inefficient driving force for inducing the FM-M!FM-
O(I) structural transition in Tb5Si2Ge2 transition: at 105 K only 50% of the
monoclinic phase is transformed into the Gd5Si4-type structure by application
of a 50 kOe magnetic field. The magnetic structure of the M-FM phase is
mostly collinear along the a-axis, with reduced magnetic moments on the
Tb atomic positions that are located near the broken interslab TdT bonds.
The influence of increasing Si concentration and applied hydrostatic pres-
sure on the magnetic properties of Tb5SixGe4�x alloys (x¼1.6, 1.94, 2.5, and
2.8) has been studied by Tseng et al. (2011). The full O(I)-FM state was
observed only in the x¼2.8 sample (TC¼206 K). Tb5Si1.6Ge2.4 displays
canted AFM component in the magnetically ordered state (TC¼105 K), while
two other alloys show clear signs of phase separated FM [MþO(I)] state. The
magnetic ordering temperatures for the Tb5Si1.94Ge2.06 and Tb5Si2.5Ge1.5alloys are 111 and 145 K, respectively. Both chemical substitution of Ge by
Si and applied pressure transform the AFM-O(II) state of Tb5Si1.6Ge2.4 into
the FM-O(I) state. However, applied hydrostatic pressure modifies the elec-
tronic 4f and 5d states of Tb, which is not seen with Si doping (Tseng
et al., 2011).
The magnetic and structural transformations in Tb5Si2Ge2 can become
coupled by application of external (e.g., hydrostatic) pressure. It is well
known that the first-order and second-order transitions respond to applied
pressure differently. For example, in the Gd5SixGe4�x system the pressure rate
of the TC of magnetostructural transformations is by an order of magnitude
higher than the same for purely magnetic transitions (see Section 3.7). Thus,
Handbook on the Physics and Chemistry of Rare Earths382

it may be expected that in Tb5Si2Ge2 and similar systems the temperature of
the structural transformation increases faster with applied pressure than the
temperature of the magnetic transition. At some P value in the P–T phase dia-
gram, a tricritical point should exist at which both temperatures coincide, and
above which only the coupled magnetostructural transformation occurs. This
hypothesis has been experimentally proved by Morellon et al. (2004b), who
performed magnetization, LTE, and neutron diffraction measurements of a
Tb5Si2Ge2 sample at selected applied pressures. The magnetization measure-
ments indicate that dTC/dP is þ0.54(3) K/kbar below 8 kbar (in the range
where transitions are decoupled) but the temperature of the structural transi-
tion changes at 2.64(6) K/kbar rate, as determined from the LTE measure-
ments. The tricritical point is at �8.6 kbar (see Fig. 36); above this pressure
the coupled M-PM!O(I)-FM transformation occurs in Tb5Si2Ge2. Accord-
ingly, the M-FM phase is not seen on the neutron powder diffraction patterns
collected at 9 kbar as a function of temperature.
The coupling of magnetic and structural transformations results in a
significant (�40%) enhancement of the magnetocaloric effect observed in
Tb5Si2Ge2. The maximum magnetic entropy change (for DH¼50 kOe) is
�13.4 J/Kg K for P¼0 kbar but increases to �22.1 J/Kg K at P¼9 kbar.
Since the MCE enhancement takes place due to addition of the structural
transformation it is reasonable to argue that the difference |DS(0 kbar)–DS(9 kbar)|¼8.7 J/Kg K is the structural contribution to the total (not purely
magnetic) entropy change (Gschneidner et al., 2012; Morellon et al.,
2004b). Gomes and de Oliveira (2008) theoretically analyzed the influence
of applied pressure on the MCE of Tb5Si2Ge2 using a model of interacting
spins where the effective exchange interaction parameter was self-consistently
calculated in terms of the electronic structure of the compound. Even though
FIGURE 36 Pressure–temperature phase diagram of Tb5Si2Ge2. The dashed and solid lines rep-
resent the second- and first-order transitions, respectively. After Morellon et al. (2004b).
Chapter 262 R5T4 Compounds 383
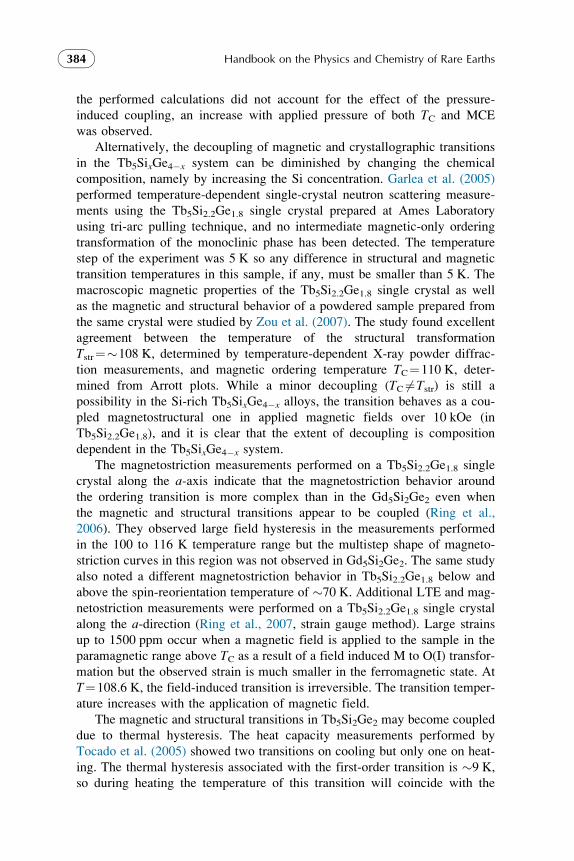
the performed calculations did not account for the effect of the pressure-
induced coupling, an increase with applied pressure of both TC and MCE
was observed.
Alternatively, the decoupling of magnetic and crystallographic transitions
in the Tb5SixGe4�x system can be diminished by changing the chemical
composition, namely by increasing the Si concentration. Garlea et al. (2005)
performed temperature-dependent single-crystal neutron scattering measure-
ments using the Tb5Si2.2Ge1.8 single crystal prepared at Ames Laboratory
using tri-arc pulling technique, and no intermediate magnetic-only ordering
transformation of the monoclinic phase has been detected. The temperature
step of the experiment was 5 K so any difference in structural and magnetic
transition temperatures in this sample, if any, must be smaller than 5 K. The
macroscopic magnetic properties of the Tb5Si2.2Ge1.8 single crystal as well
as the magnetic and structural behavior of a powdered sample prepared from
the same crystal were studied by Zou et al. (2007). The study found excellent
agreement between the temperature of the structural transformation
Tstr¼�108 K, determined by temperature-dependent X-ray powder diffrac-
tion measurements, and magnetic ordering temperature TC¼110 K, deter-
mined from Arrott plots. While a minor decoupling (TC 6¼Tstr) is still a
possibility in the Si-rich Tb5SixGe4�x alloys, the transition behaves as a cou-
pled magnetostructural one in applied magnetic fields over 10 kOe (in
Tb5Si2.2Ge1.8), and it is clear that the extent of decoupling is composition
dependent in the Tb5SixGe4�x system.
The magnetostriction measurements performed on a Tb5Si2.2Ge1.8 single
crystal along the a-axis indicate that the magnetostriction behavior around
the ordering transition is more complex than in the Gd5Si2Ge2 even when
the magnetic and structural transitions appear to be coupled (Ring et al.,
2006). They observed large field hysteresis in the measurements performed
in the 100 to 116 K temperature range but the multistep shape of magneto-
striction curves in this region was not observed in Gd5Si2Ge2. The same study
also noted a different magnetostriction behavior in Tb5Si2.2Ge1.8 below and
above the spin-reorientation temperature of �70 K. Additional LTE and mag-
netostriction measurements were performed on a Tb5Si2.2Ge1.8 single crystal
along the a-direction (Ring et al., 2007, strain gauge method). Large strains
up to 1500 ppm occur when a magnetic field is applied to the sample in the
paramagnetic range above TC as a result of a field induced M to O(I) transfor-
mation but the observed strain is much smaller in the ferromagnetic state. At
T¼108.6 K, the field-induced transition is irreversible. The transition temper-
ature increases with the application of magnetic field.
The magnetic and structural transitions in Tb5Si2Ge2 may become coupled
due to thermal hysteresis. The heat capacity measurements performed by
Tocado et al. (2005) showed two transitions on cooling but only one on heat-
ing. The thermal hysteresis associated with the first-order transition is �9 K,
so during heating the temperature of this transition will coincide with the
Handbook on the Physics and Chemistry of Rare Earths384

temperature of the magnetic only transformation, which is not influenced by
the hysteresis.
Yuzuak et al. (2007) studied the effect of doping on the magnetocaloric
properties of Tb5Si2Ge2 compound. A series of Tb5Si2�xGe2�xM2x alloys
(0�2x�0.1; M¼Fe, Pb, Mn) were prepared by arc-melting of commercial
grade materials followed by annealing at 900 �C for 24 h. The crystal struc-
ture of the main phase is monoclinic and the concentration of Tb5Ge3-type
impurity phase increases with x. Manganese addition decreases the unit cell
volume of Tb5Si2Ge2 (Yuzuak et al., 2010c) but significantly increases the
magnetocaloric effect in Tb5Si2Ge2 from 13 to 21 J/Kg K (DH¼0–50 kOe),
and changes TC from 111 to 125 K (for 2x¼0.1). It is plausible to suggest
that such enhancement occurs due to coupling of the magnetic and
structural transitions in Tb5Si2Ge2 induced by chemical pressure. The maxi-
mum �DSM, refrigerant capacity, and RCP of Tb5Si1.975Ge1.975Fe0.05 are
13.3 J/Kg K, 462 J/Kg, and 512 J/Kg, respectively, for DH¼0–50 kOe
(Yuzuak et al., 2009). The MCE decreases when Tb5Si2Ge2 is doped by Pb
(Yuzuak et al., 2007).
Yuzuak et al. (2007) reported that in the Tb5Si2�xGe2�xFe2x alloys the Fe
addition does not produce any significant change in MCE though it decreases
the hysteresis loss, as the transition at TC becomes clearly second order;
but TC itself is not affected. However, Pereira et al. (2011) report a
significant increase in MCE and Curie temperature with Fe substitution in
the Tb5Si2Ge2�xFex series of alloys, which is similar to the effect of Mn sub-
stitution on the magnetic properties of Tb5Si2�xGe2�xMn2x alloys (Yuzuak
et al., 2010c). The study confirmed that Fe addition indeed induces the cou-
pling of magnetic and crystallographic transitions. Iron addition promotes
the formation of the Tb5(Si,Ge)3 phase because, similar to the Gd5SixGe4�x
alloys, it cannot be incorporated into the 5:4 matrix. The presence of this
phase creates external pressure at the grain boundaries, and such pressure,
as shown by Morellon et al. (2004b), forces the magnetostructural coupling
in Tb5Si2Ge2. The MCE in the Tb5Si2Ge2�xFex series is largest for x¼0.15,
with maximum entropy change over �30 J/Kg K for 0–50 kOe magnetic field
change at �120 K (Pereira et al., 2011).
The single-ion anisotropy of Tb has a serious impact on the magnetic
properties of Tb5SixGe4�x alloys. While the spin-reorientation transitions are
rare in the Gd5SixGe4�x system, the variety of competing magnetic structures
created by nonspherically shaped atomic orbitals of Tb and many other rare
earths causes a number of spin-reorientation transitions to occur in non-Gd-
based compounds. Araujo et al. (2005) identified two critical transition tem-
peratures in Tb5Si2Ge2 in the magnetically ordered O(I)-FM state:
TSR1¼57 K (same as reported by Ritter et al., 2002), and TSR2¼40 K. Erratic
reorientations between TSR1 and TSR2 were observed. The authors also showed
that a simple phenomenological modeling based on approximate magnetic
anisotropy energy gives a satisfactory description of the spin-reorientation
Chapter 262 R5T4 Compounds 385

process. The temperature dependence of Seebeck coefficient measured for
Tb5Si2Ge2 between 10 and 300 K also shows two anomalies in the magneti-
cally ordered state in addition to the one at TC that may correspond to two
spin-reorientation transitions reported by Pereira et al. (2007). High-resolution
measurements of Seebeck coefficient and electrical resistivity in the vicinity
of the magnetostructural transition of Tb5Si2Ge2 confirmed the temperature
splitting between magnetic and structural transitions (Pereira et al., 2008a).
The structural transition occurs with a large thermal hysteresis: Tstr is 97 K
on cooling and 107 K on heating. The magnetic transition occurs at
TC¼112 K, thus it is easy to see that the splitting is larger during cooling than
during heating. Pereira et al. (2008a) also analyzed the magnetic critical
behavior of electrical resistivity and obtained a mean field exponent
a�0.59 for T>TC. A different exponent, a�1.06, was obtained below Tstr.
4.7.2. Anisotropy
The magnetic structures and associated anisotropy phenomena are more inter-
esting in the Tb5SixGe4�x system compared to Gd5SixGe4�x because in addi-
tion to the anisotropic crystal structure, the complexity of magnetic
interactions increases due to the presence of the single-ion anisotropy.
The transitions between different magnetic configurations occur with a
change of the external thermodynamic conditions. Evolution of the magnetic
structure of monoclinic Tb5Si2.2Ge1.8 and Tb5Si2.5Ge1.5 compounds with tem-
perature was investigated by means of neutron powder diffraction and the
detailed description of both crystallographic and magnetic sublattices is pre-
sented by Garlea et al. (2005). The magnetic structures are quite complex as
the magnetic moments of the Tb atoms, with a few exceptions, are mostly
canted. Below the magnetic ordering temperature (�120 K) the magnetic
components (projections of magnetic moments on particular crystallographic
axes) are antiferromagnetically aligned along the b- and c-directions, but allare directed (with slight canting) along the a-axis, so the net moment is ferro-
magnetic. The moments on the intraslab Tb atoms have the smallest canting.
Below the spin-reorientation transition at 75 K the arrangement of magnetic
moments along the c-axis changes to ferromagnetic and the magnetic moment
projection along this direction increases; consequently, the moment canting
along the a-direction increases too. The moment alignment along the b-axisremains antiferromagnetic. Both magnetic structures of Tb5Si2.2Ge1.8 are
shown in Fig. 37. These results indicate that the a-axis is the easy magnetiza-
tion direction in Tb5SixGe4�x alloys (at least in the alloys with monoclinic
crystal structure at room temperature).
An investigation of the magnetic properties of a Tb5Si2.2Ge1.8 single crys-
tal confirms that the a-axis is the easy axis (Zou et al., 2007). Overall, the
magnetic properties of this compound are extremely anisotropic and are in
agreement with the magnetic structure determined by neutron diffraction
Handbook on the Physics and Chemistry of Rare Earths386

studies. When magnetization is measured along the a-axis, Tb5Si2.2Ge1.8behaves similarly to the Gd5SixGe4�x alloys with x�2 showing a sharp first-
order transition at the point of the PM!FM transformation (TC{H||a}¼118 K).
Isothermal magnetization of the single-crystal oriented along the a-axismeasured just above TC shows a sharp metamagnetic step and presence of hyster-
esis, which correspond to the coupled magnetostructural transformation. When
the magnetic field is applied along the c-axis, the PM!FM metamagnetic tran-
sition also occurs but is not as sharp as observed along the a-axis. Furthermore,
the critical field HCR is �36 kOe higher along the c-axis than along the a-axisand the rate of change dHCR/dT is also much higher for the c-axis when com-
pared with the a-axis: 5.4�0.3 kOe/K versus 2.64�0.02 kOe/K, respectively.
The b-axis, which is the hard axis in Tb5Si2.2Ge1.8, shows predominantly
antiferromagnetic behavior (a small ferromagnetic component can be seen in
high magnetic fields), and no characteristic metamagnetic transitions indicative
of the PM!FM magnetostructural transitions have been observed along this
axis. The stark difference between the magnetic behaviors along three major
crystallographic directions is clearly seen in the temperature-dependent magneti-
zation measurements (see Fig. 38).
The magnetocaloric effect calculated from the M(H) isotherms using the
Maxwell relation is also anisotropic. Along the a- and c-axes a maximum
entropy change for DH¼0–50 kOe is ��40 J/Kg K, however, MCE along the
a-axis shows a wide 20 K plateau while a single sharp peak is observed along
the c-axis (Zou et al., 2007). Consequently, the cooling power should be signifi-cantly larger with the magnetic field applied along the a-direction. The MCE
along the b-axis is almost nonexistent for the same field change (�3.6 J/
Kg K). As a result, the MCE of a Tb5Si2.2Ge1.8 powder is �26 J/Kg K, an
FIGURE 37 Magnetic structure of Tb5Si2.2Ge1.8 at temperatures above (A) and below (B) the
spin-reorientation transition. The nonmagnetic (Si/Ge) atoms are excluded for clarity.
Chapter 262 R5T4 Compounds 387
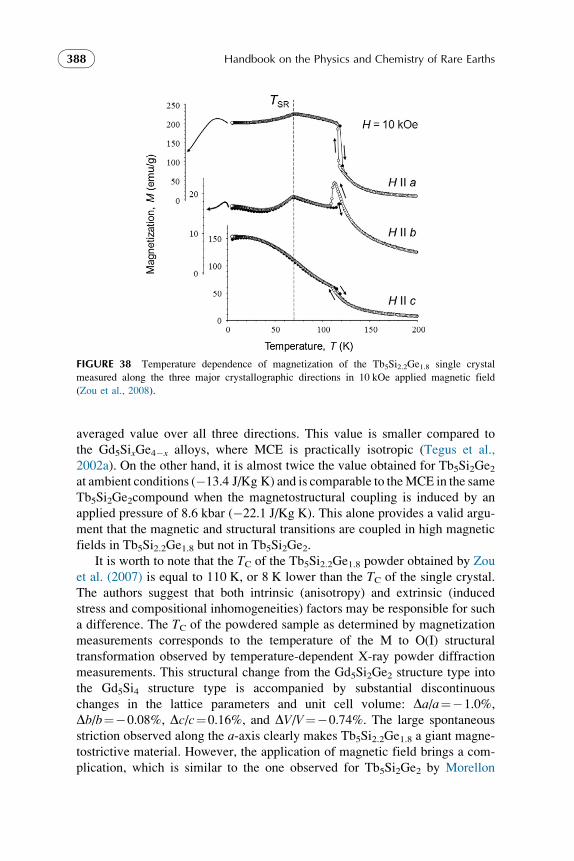
averaged value over all three directions. This value is smaller compared to
the Gd5SixGe4�x alloys, where MCE is practically isotropic (Tegus et al.,
2002a). On the other hand, it is almost twice the value obtained for Tb5Si2Ge2at ambient conditions (�13.4 J/Kg K) and is comparable to theMCE in the same
Tb5Si2Ge2compound when the magnetostructural coupling is induced by an
applied pressure of 8.6 kbar (�22.1 J/Kg K). This alone provides a valid argu-
ment that the magnetic and structural transitions are coupled in high magnetic
fields in Tb5Si2.2Ge1.8 but not in Tb5Si2Ge2.
It is worth to note that the TC of the Tb5Si2.2Ge1.8 powder obtained by Zou
et al. (2007) is equal to 110 K, or 8 K lower than the TC of the single crystal.
The authors suggest that both intrinsic (anisotropy) and extrinsic (induced
stress and compositional inhomogeneities) factors may be responsible for such
a difference. The TC of the powdered sample as determined by magnetization
measurements corresponds to the temperature of the M to O(I) structural
transformation observed by temperature-dependent X-ray powder diffraction
measurements. This structural change from the Gd5Si2Ge2 structure type into
the Gd5Si4 structure type is accompanied by substantial discontinuous
changes in the lattice parameters and unit cell volume: Da/a¼�1.0%,
Db/b¼�0.08%, Dc/c¼0.16%, and DV/V¼�0.74%. The large spontaneous
striction observed along the a-axis clearly makes Tb5Si2.2Ge1.8 a giant magne-
tostrictive material. However, the application of magnetic field brings a com-
plication, which is similar to the one observed for Tb5Si2Ge2 by Morellon
FIGURE 38 Temperature dependence of magnetization of the Tb5Si2.2Ge1.8 single crystal
measured along the three major crystallographic directions in 10 kOe applied magnetic field
(Zou et al., 2008).
Handbook on the Physics and Chemistry of Rare Earths388

et al., 2003: while the changes in the lattice dimensions during the field-
induced magnetostructural transition are identical to those shown above, the
transition itself is broad and largely incomplete. Only 40% of the structural
M to O(I) transformation is completed at 40 kOe at T¼112 K (just above
the TC¼110 K of Tb5Si2.2Ge1.8 powder) so the change in the bulk dimensions
is expected to be much smaller for the field-induced transition than for the
temperature-induced change (Zou et al., 2007).
As expected from the complex nature of the spin-reorientation transitions in
Tb5SixGe4�x alloys (Garlea et al., 2005; Ritter et al., 2002), the magnetic behav-
ior along the three major crystallographic directions is different not only at TC butalso near TSR. This can be seen both in theM(T) (Fig. 38) andM(H) dependencesmeasured with magnetic field along the different axes of the Tb5Si2.2Ge1.8 single
crystal (Zou et al., 2008). The critical fields for steps inM(H) curves that corre-spond to the spin-reorientation transitions and the characteristic shape of these
steps clearly vary from one axis to another for the M(H) data collected at the
same temperature using the same measurement protocol.
The anisotropic behavior of Tb5Si2.2Ge1.8 is summarized in Fig. 39, which
shows three H–T magnetic phase diagrams constructed for each crystallo-
graphic direction (Zou et al., 2008). Since no field-induced transitions were
observed in M(H) data for H||c measurements between 1.8 and 70 K, the phase
boundary line for the spin-reorientation transition along the c-direction is
rather tentative. It is clear that the phase boundaries between the paramagnetic
and magnetically ordered states are considerably different from each other.
The magnetic anisotropy is also present in the paramagnetic state because
both the parameters (peff and yp) obtained using the Curie–Weiss fits of the
high-field wdc�1(T) data and the characteristics of the Griffiths-like phase
behavior (see below) are also different for each direction. According to Zou
et al. (2007), the effective paramagnetic moments, peff, are 10.15, 10.05,
and 10.09 mB/Tb for a-, b-, and c-axes respectively, while the corresponding
values of yp are 117.3, 80.9, and 105.8 K.
The electrical properties of the Tb5SixGe4�x alloys also show a significant
anisotropy in the presence of an applied magnetic field. For example, the SGV
effect, which is essentially a thermoelectric response to the nonequilibrium distri-
bution of the latent heat released at the transition within a solid (see also
Section 3.5), in the Tb5Si2.2Ge1.8 single crystal may be isotropic or anisotropic
depending on whether the magnetostructural transition is induced thermally or
magnetically (Zou et al., 2009a). The voltage signal is similar along all three
major crystallographic directions upon heating or cooling across the TC in a zero
magnetic field. However, isothermal magnetization at 120 K results in a strong
SGV response only when the magnetic field is applied along the a-axis of
Tb5Si2.2Ge1.8, but not along the b- or c-axes (at least for H�40 kOe). This obser-
vation agrees with the fact that sharp, first-order like field-induced magnetic trans-
formations were observed only along the a-axis in Tb5Si2.2Ge1.8 (Zou et al., 2007).
Chapter 262 R5T4 Compounds 389
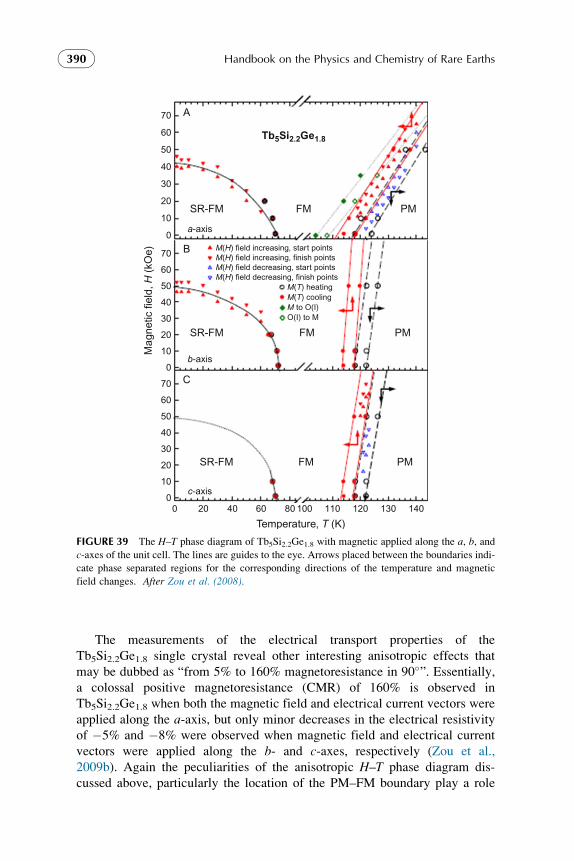
The measurements of the electrical transport properties of the
Tb5Si2.2Ge1.8 single crystal reveal other interesting anisotropic effects that
may be dubbed as “from 5% to 160% magnetoresistance in 90�”. Essentially,a colossal positive magnetoresistance (CMR) of 160% is observed in
Tb5Si2.2Ge1.8 when both the magnetic field and electrical current vectors were
applied along the a-axis, but only minor decreases in the electrical resistivity
of �5% and �8% were observed when magnetic field and electrical current
vectors were applied along the b- and c-axes, respectively (Zou et al.,
2009b). Again the peculiarities of the anisotropic H–T phase diagram dis-
cussed above, particularly the location of the PM–FM boundary play a role
20 40 60
Temperature, T (K)
FM
FM
A
B
C
FMSR-FM
SR-FM
Tb5Si2.2Ge1.8M
agne
tic fi
eld,
H (
kOe)
SR-FM
c-axis
b-axis
a-axis
M(H) field increasing, start points
M(H) field decreasing, start pointsM(H) field increasing, finish points
M(H) field decreasing, finish pointsM(T) heatingM(T) coolingM to O(I)O(I) to M
PM
PM
PM
80 100 110 120 130 14000
10
20
30
40
50
60
70
0
10
20
30
40
50
60
70
0
10
20
30
40
50
60
70
FIGURE 39 The H–T phase diagram of Tb5Si2.2Ge1.8 with magnetic applied along the a, b, and
c-axes of the unit cell. The lines are guides to the eye. Arrows placed between the boundaries indi-
cate phase separated regions for the corresponding directions of the temperature and magnetic
field changes. After Zou et al. (2008).
Handbook on the Physics and Chemistry of Rare Earths390

in this effect. Specifically, the presence of the phase separated state that can
be manipulated by the applied magnetic field is responsible for the CMR.
In addition, the scattering by interphase boundaries that have a particular
orientation relationship due to the monoclinic–orthorhombic distortion of
the lattice also leads to large anisotropic effects observed in the electrical
transport measurements. Cycling through the transition substantially decreases
the MR value from 160% to 90% after just one cycle, falling further down to
�20%, the value observed during the 30th cycle. Such reduction of MR effect
is related to an increase of temperature-independent component of the electri-
cal resistivity due to an increase of incoherent phase boundaries and stress
build up.
The magnetic structure of the Tb5Ge4 compound that orders antiferromag-
netically at 92 K (Tian et al., 2009) is similar to the magnetic structure of
Gd5Ge4: the individual magnetic moments of Tb atoms are ferromagnetically
aligned within the slab (in ac-plane) but the slabs themselves are magnetically
antiparallel with respect to each other as they are stacked along the b-axis.However, the moments are completely confined to the ac-plane in the temper-
ature region between TN and TSR¼�55 K; below TSR a small b-axis compo-
nent exists for the canted Tb2 and Tb3 (8d sites) moments (Ritter et al., 2002).
The anisotropy of the Tb5Ge4 magnetic structure is seen in the temperature
dependences of dc magnetic susceptibility measured with the magnetic field
applied along the three major crystallographic axes of Tb5Ge4 (Tian et al.,
2009). All three w�1(T) curves follow the Curie–Weiss law above �160 K
and the effective paramagnetic moment (9.7 mB/Tb atom) is essentially the
same for all directions. However, the paramagnetic Weiss temperature (yp)is practically the same and is equal to �25 K for the a- and c-axes reflectingprevailing FM interactions occurring in the ac-plane but is negative (�50 K)
for the b-axis, along which the interactions are AFM (Tian et al., 2009). This
is different from Gd5Ge4 where yp’s are decisively positive for all directions
(Ouyang et al., 2006b).
The magnetic structure of Tb5Si4 is largely noncollinear and the a-axis isthe easy magnetization direction (Ritter et al., 2002). This compound also
undergoes a spin-reorientation transition at low temperatures (�80 K), and a
second strong ferromagnetic component develops along the c-axis.
4.7.3. Short-Range Correlations (Griffiths-like Phase)
The deviation of the temperature dependence of reciprocal magnetic suscepti-
bility from the Curie–Weiss law in the paramagnetic region may be associated
with a variety of magnetic phenomena, both intrinsic (superparamagnetism,
Van-Fleck effect) and extrinsic (ferromagnetic impurities). However, as was
shown for Gd5Ge4 (see Section 3.9), the behavior of the reciprocal magnetic
susceptibility of layered R5T4 alloys below a characteristic temperature TGmay be well described in terms of the effect discovered by Griffiths (1969)
Chapter 262 R5T4 Compounds 391

in highly diluted systems of d-elements. The study of the Griffiths-like phase
in Tb5Si2Ge2 by means of low-field temperature-dependent magnetization and
small angle neutron scattering (SANS) spectroscopy described the main prop-
erties of this phase (Magen et al., 2006a). The presence of this phase in the
range of temperatures between TC¼110 K and TG�200 K was manifested
by significant negative deviations from linearity in the w�1(T) plots in mag-
netic fields below 500 Oe (see Fig. 40). As expected for the Griffiths phase,
the low-field magnetic susceptibility can be characterized by the w�1(T) (T–TC)
1�l dependence, where 0�l<1. Moreover, according to Magen
et al. (2006a), even in higher magnetic fields (1500 Oe), where the w�1(T) plotappears to be linear, there are substantial differences in l between a true para-
magnetic region above TG (l¼0.04) and in the TC<T<TG region (l¼0.25).
This shows that the short-range FM clustering above TC, which is responsible
for the Griffiths-like behavior, exists even in higher magnetic fields but is
masked by an increasingly stronger signal from the paramagnetic matrix.
These short-range magnetic clusters were observed in the SANS experi-
ment as well, and it was found that the correlation length of magnetic interac-
tions (x) is suppressed by the applied magnetic field but increases with
cooling (Magen et al., 2006a). The authors suggest that the presence of local
structural disorder is responsible for the nucleation of magnetic clusters and
appearance of a Griffiths-like phase in Tb5Si2Ge2. It is safe to suggest that
the mechanism of this effect is similar for other R5T4 phases crystallizing in
either the monoclinic Gd5Si2Ge2 or orthorhombic Sm5Ge4 type of crystal
structure, because a universal (x, T) phase diagram can be constructed at least
100
120 Oe
500 Oe1500 Oe
20 Oe
Tb5Si2Ge2
5 Oe1 Oe
125 150
Temperature (K)
c dc-1
(103
gOe/
emu)
175 200 225 250750.0
0.5
1.0
1.5
2.0
2.5
3.04.0
3.5
3.0Griffiths phase
PM phase
Singularity
log (T/TC-1)
-lo
g (X
-1)
H = 1 Oe
l= 0.064(3)
l= 0.31(1)
2.5
2.0
1.5-1.25 -1.00 -0.75 -0.50 -0.25 -0.00 0.25 0.50
FIGURE 40 Temperature dependence of w�1(T) of Tb5Si2Ge2 as a function of applied magnetic
field, measured on heating. The inset shows fits of data collected at 1 Oe. After Magen et al.
(2006a).
Handbook on the Physics and Chemistry of Rare Earths392

for R¼Gd, Tb, Dy, and Ho (Pereira et al., 2010). Essentially, TG may be
viewed as the potential “pure” (not affected by a first-order transition) order-
ing temperature of the O(I) structure for a given chemical composition, and
may be interpolated from the region were the second-order only O(I)-PM to
O(I)-FM transition occurs (Ouyang, 2010; Pereira et al., 2010).
The Griffiths-like phase has been observed for a Tb5Si2.2Ge1.8 single crystal
in magnetic fields up to 1000 Oe (Zou et al., 2008). The TG was estimated to be
near 200 K. The study also found that the Griffiths-like behavior in
Tb5Si2.2Ge1.8 single crystal is anisotropic and shows a correlation with yp valuesdetermined using the Curie–Weiss fit of high-field M(T) data: a strongest devi-ation from w�1(T) linearity and a largest l value in 10 Oe field is observed
along the a-axis, which also has the highest value of yp¼117.3 K. When the
magnetic field is applied along the b-axis (yp¼80.9 K), the Griffiths-like phase
appearance is minimal. At the same time, the anomalous thermal hysteresis
observed in Tb5Si2.2Ge1.8 at TC in magnetic fields H�1000 Oe around TC is
most pronounced along the b-axis. A sharp magnetic peak around TC is
observed on cooling but not on heating. It is believed that the presence of such
peak is related to the existence of short-range FM clustering least masked by
the matrix along the b-axis; the thermal history dependence for such peak indi-
cates that the magnetic and structural transitions may not be fully coupled in
low magnetic fields in Tb5Si2.2Ge1.8 (Zou et al., 2008).
Presence of diffuse scattering in the neutron diffraction investigation of an
antiferromagnetic Tb5Ge4 single crystal indicates three-dimensional short-
range correlations both above and below TN (Tian et al., 2009). The shape
of the observed diffuse scattering peak is somewhat unconventional showing
a squared-Lorentzian peak shape. The results support the presence of a clus-
tered magnetic state in Tb5Ge4 but the nature of the diffuse scattering is
apparently AFM, which is different from the FM clustering model proposed
for the Griffiths-like phase in Gd5Ge4 (Ouyang et al., 2006b).
4.7.4. Miscellaneous
Reflectance difference spectra for the b–c plane of Tb5Si2.2Ge1.8 Bridgeman-
grown single crystal were obtained in the photon energy range of 1.5–5.5 eV.
At fixed photon energy, the angle-dependent RD spectra have a sinusoidal
form. The energy-dependent RD spectra of Tb5Si2.2Ge1.8 (b–c plane) are sim-
ilar to those of Gd5Si2Ge2 (b–c plane) showing one strong peak at 3.2 eV, a
minor peak at 1.7 eV, and a weak shoulder at 4.1 eV (Lee et al., 2004).
Ugurlu et al. (2005b) observed thin plates similar to those found in the
Gd5SixGe4�x alloys in the Tb5Si4, Tb5Ge4, and Tb5Si2.25Ge1.75 samples,
whose room temperature crystal structures are O(I)-Gd5Si4, O(II)-Sm5Ge4,
and M-Gd5Si2Ge2, respectively. While they could not identify the chemical
composition of these plates accurately, the EDS results indicate that the plates
are enriched in both Tb and oxygen compared to the matrix.
Chapter 262 R5T4 Compounds 393

The electronic structure and magnetic properties of Tb5Si2.2Ge1.8 have
been studied from first-principles electronic structure calculations (scalar rel-
ativistic version of LSDAþU approach implemented in the TB-LMTO
method) by Paudyal et al. (2011). The calculations showed that the FM-O(I)
structure has lower total energy, and, therefore, is a more stable phase than
the FM-M structure in this compound. Also, the splitting of the 5d bands of
Tb is larger in the orthorhombic structure indicating higher 5d contribution
to the rare earth magnetic moments. These results provide theoretical support
for the fact that Tb5Si2.2Ge1.8 undergoes a structural-only transformation in
the ferromagnetic state, even though the monoclinic structure here may sup-
port the FM order.
4.8. Dy5SixGe4�x
The crystal structure of Dy5Si4 and Dy5Ge4 compounds has been determined
by Smith et al. (1967b). Both compounds were originally reported to crystal-
lize in the Sm5Ge4 type of crystal structure, though Holtzberg et al. (1967)
already noted that germinides and silicides have different crystal structures.
Later it was found that the silicide adopts the Gd5Si4-type structure. Accord-
ing to Holtzberg et al. (1967) Dy5Si4 ordered ferromagnetically at TC¼140 K
while Dy5Ge4is an antiferromagnetic compound with TN¼40 K. Paramag-
netic Curie temperatures are both positive: yp¼133 K for Dy5Si4 and 43 K
for Dy5Ge4. The variation of TC with pressure for Dy5Si4 was found to be lin-
ear with dTC/dP equal to 3.0 K/GPa (Parviainen, 1980).
The Dy5SixGe4�x system in many aspects is similar to Gd5SixGe4�x but
the phase boundaries are shifted toward the Si-rich side. There are three phase
regions: (1) extensive germanium-based solid solution occurring for
0�x<2.6 with AFM type of ordering, (2) intermediate monoclinic structure
at 2.6<x<3.2, and (3) silicon-based solid solution at 3.2<x�4.0 with the
Gd5Si4-type crystal structure and relatively high (compared to two
other regions) magnetic ordering temperatures (Gschneidner et al., 2000b;
Ivtchenko et al., 2000). The Dy5Si3Ge compound with room temperature
monoclinic crystal structure undergoes a first-order transition, which is
accompanied by a relatively large magnetocaloric effect >�20 J/Kg K
(Gschneidner et al., 2000b; Ivtchenko et al., 2000).
Dy5Si3Ge has a number of interesting and unique properties. Most of R5T4
compounds with room temperature monoclinic Gd5Si2Ge2-type structure typ-
ically order ferromagnetically and the magnetic transition may or may not be
coupled with the M to O(I) structural transition depending on chemical com-
position or applied pressure. Dy5Si3Ge, which also adopts the M-type crystal
structure at room temperature, at first orders antiferromagnetically at
TN¼74 K, then undergoes an AFM–FM transition at TC¼62 K (Nirmala
et al., 2007b). The ordering temperature is magnetic-field dependent: the slope
of dTC/dH is equal to �0.45 K/kOe. The transition into the ferromagnetic
Handbook on the Physics and Chemistry of Rare Earths394

state is followed by a partial structural M to O(I) transition, which is occurring
a few degrees below TC indicating a slight decoupling between the crystallo-
graphic and magnetic lattices. Therefore, Dy5Si3Ge is the only known R5T4
compound where the monoclinic crystal structure exists in all three magnetic
states: paramagnetic, antiferromagnetic, and ferromagnetic. Interestingly, the
magnetostructural decoupling is not clearly seen on the heat capacity data—
only one first-order like peak is observed at TC when data are collected during
warming in zero magnetic field (Nirmala et al., 2011). Only 47% of the mono-
clinic phase transforms into orthorhombic phase even when the sample is
cooled down to 5 K yet low-temperature M(H) loops reveal the magnetic
behavior typical for a hard ferromagnet (Nirmala et al., 2007b). The applica-
tion of magnetic field increases the amount of the orthorhombic phase but
even a 40 kOe magnetic field is not strong enough to complete the structural
transition. The M to O(I) structural transition is characterized by large aniso-
tropic change in lattice parameters and unit cell volume, which are typical
for this type of transition: Da/a¼�1.0%, Db/b¼�0.2%, Dc/c¼0.2%, and
DV/V¼0.7% (Nirmala et al., 2007b).
The saturation magnetization at 70 kOe is 9.7 mB/Dy (gJJ¼10 mB) indicat-ing that: (a) the material is 100% FM at 1.8 K and 70 kOe, (b) the magnetic
structure at these conditions is nearly collinear, and (c) crystal field effects
are small. Coercivity decreases with the temperature increase and becomes
zero at 50 K (Nirmala et al., 2007b). In fact, there are reasons to suspect that
the FM phase with the monoclinic crystal structure is a soft magnet while the
FM phase with orthorhombic crystal structure is a hard phase; however, since
both phases are present in the magnetically ordered Dy5Si3Ge alloy in nearly
1:1 ratio, and, consequently, are affecting each other’s coercivity via micro-
structure, it is more appropriate to consider this material as a composite. Such
structurally phase separated materials containing an intimately coupled mix-
ture of hard and soft magnetic phases may have a substantial practical poten-
tial for future development of permanent magnets.
In the paramagnetic region, Dy5Si3Ge follows the Curie–Weiss law. The
paramagnetic temperature yp is 76 K and the effective magnetic moment peffis 11.1 mB/Dy. Electrical resistivity versus temperature of Dy5Si3Ge shows a
strong history dependence and thermal hysteresis (Nirmala et al., 2011).
The Dy5Si2Ge2 composition crystallizes in the orthorhombic Sm5Ge4-type
structure (a¼7.527 A, b¼14.574 A, and c¼7.628 A) and orders antiferro-
magnetically at TN¼56 K via a second-order transition (Nirmala et al.,
2005). Below 20 K, however, it shows a sharp field induced AFM to FM
metamagnetic-like transition. According to the measured M(H) loops
(Nirmala et al., 2007a) this transition is reversible but shows significant
hysteresis. Its critical field is temperature dependent though the rate of this
dependence is smaller above 10 K than at lower temperatures. Above 20 K
the metamagnetic-like transition becomes smooth with no measurable
hysteresis. Neutron diffraction experiment shows that magnetic moments in
Chapter 262 R5T4 Compounds 395

Dy5Si2Ge2 arrange spirally along the a-axis and the net structure is a canted
AFM. The averaged Dy magnetic moment in the ordered state is 7.6(1)mB,much lower than the 10 mB value expected for the Dy3þ free ion; thus, a sig-
nificant CEF presence was suggested for this compound (Nirmala et al.,
2005). The temperature dependence of heat capacity of Dy5Si2Ge2 has been
measured in applied magnetic fields of 0, 50, and 90 kOe and reveals a typical
second-order transition at TN (Nirmala et al., 2007a). The maximum magnetic
entropy change is relatively low (��8 J/mol K), yet it remains nearly con-
stant over a broad temperature range 30–50 K when calculated for a 0 to 90
kOe magnetic field change.
Dy5Si4 alloy with the O(I) crystal structure, Dy5Si3Ge alloy with the M
structure, and Dy5Si2.5Ge1.5 alloy with the O(II) structure were found to share
another common characteristic with the Gd5SixGe4�x—the microstructural
thin plate features (Ugurlu et al., 2005b). The composition of these plates
was also proposed to have the Dy5(SixGe3�x) stoichiometry.
4.9. Ho5SixGe4�x
Both Ho5Ge4 and Ho5Si4 compounds were discovered by Smith et al. (1967b).
The germanide crystallizes in the Sm5Ge4-type crystal structure while the sil-
icide adopts the Gd5Si4 type. Their magnetic properties were first reported by
Holtzberg et al. (1967), who found that similarly to other R5T4 (T¼Si, Ge)
compounds formed by the heavy lanthanides the silicide orders ferromagneti-
cally and the germanide is antiferromagnetic. Formation of the Ho5Si4 com-
pound was investigated by Eremenko et al. (1995), and it was reported that it
forms by peritectic reaction LþHo5Si3!Ho5Si4 at 1850 �C. Schobinger-
Papamantellos and Niggli (1979) performed a neutron diffraction study of the
magnetic structure of Ho5Ge4 without knowing that it undergoes a structural
deformation at TN¼23 K (discovered much later by Singh et al., 2009). They
reported a canted alignment of magnetic moments and a presence of two coex-
isting magnetic structures. The variation of TC with pressure for Ho5Si4 was
found to be linear with dTC/dP equal to 1.8 K/GPa (Parviainen, 1980).
Ho5Si2Ge2 orders antiferromagnetically at TN¼25 K (Thuy et al., 2001,
2003), which is related to the fact that this compound adopts the orthorhombic
Sm5Ge4 type of crystal structure (a¼7.501 A, b¼14.510 A, and c¼7.599 A).
A metamagnetic transition is observed in M(H) data measured for Ho5Si2Ge2below TN; interestingly, the critical field decreases with increasing tempera-
ture. High magnetic field measurements (up to 380 kOe) performed at 4.2 K
show that magnetization approaches very slowly the estimated saturation
value of 10.18 mB/Ho. In the paramagnetic region, the magnetic susceptibility
of Ho5Si2Ge2 follows the Curie–Weiss law (yp¼17 K, peff¼9.7 mB/Ho). Asecond transition at 15 K was observed during heat capacity measurements
of Ho5Si2Ge2 (Thuy et al., 2003). However, another study, while confirming
the two transitions at �25 and 15 K, reports that Ho5Si2Ge2 magnetically
Handbook on the Physics and Chemistry of Rare Earths396

orders at higher temperature, TN¼35 K, based on a series of magnetization,
electrical resistivity and heat capacity measurements (Prokleska et al., 2006,
2007). Two nearby compositions, Ho5Si1.5Ge2.5 and Ho5Si2.5Ge1.5, also order
antiferromagnetically at 37 and 34 K, respectively (Prokleska et al., 2006). It
is worth to note that in these alloys TN is seen only as a weak shoulder on the
M(T) data and becomes largely smeared in high magnetic fields but is clearly
visible in the heat capacity and electrical resistivity data.
A preliminary study of the magnetic properties of Ho5SixGe4�x alloys
(x¼0, 0.5, 1.5, 2.0, 2.5, 3.5, 4.0) indicates the presence of multiple magnetic
transitions in both Ho5Si4 and Ho5Ge4 (Prokleska et al., 2007). Ho5Ge4 showed
two broad transitions: TN¼23 K and another transition at 16 K. Ho5Si4, in
addition to the first magnetic ordering transition at �70 K showed two low-
temperature transformations seen in both Cp(T) and r(T) data at 23 and 16 K,
Prokleska et al. (2007). However, as noted by Ritter et al. (2009) these low-
temperature transitions may occur due to presence of impurities, namely HoSi.
In fact, the neutron diffraction study did not reveal any spin-reorientation tran-
sitions in Ho5Si4 (Ritter et al., 2009). Yet another study (Singh et al., 2010a)
confirmed that the single-phase Ho5Si4 sample prepared by using high-purity
Ho metal (99.68 at.% with respect to all other elements in the periodic table)
indeed shows a spin-reorientation transition around 15 K in addition to the main
ordering transition at TC¼76 K. The magnetocaloric effect in Ho5Si4 has been
determined using heat capacity data measured in 0, 20, and 50 kOe applied
magnetic fields. The magnetic entropy change was found to be �6.6 J/Kg K
and �14.8 J/Kg K for the magnetic field changes DH¼20 kOe and
DH¼50 kOe, respectively. The adiabatic temperature change for the same
magnetic field changes was 2.6 and 6.1 K, respectively (Singh et al., 2010a).
A study of structural and magnetic behavior of Ho5SixGe4�x performed by
Pereira et al. (2008b) also shows discrepancies with the previous results.
While the magnetic ordering transition temperatures generally agree with
those reported by Prokleska et al. (2007), only one spin-reorientation transi-
tion (at �15–18 K, depending on composition) is observed in all studied
Ho5SixGe4�x samples, though as noted above, some of these transitions,
that is, in Ho5Si4, may not be intrinsic and occur due to impurity phases
(Ritter et al., 2009). According to Pereira et al. (2008b) the Ho5Si4 compound
(with O(I) crystal structure) behaves like a normal ferromagnet below
TC¼77 K with a clear saturation (ms¼8.9 mB/Ho at 10 K), and the same is
true for Ho5Si3Ge. Two alloys, Ho5Si3Ge and Ho5Si3.5Ge0.5 crystallize in
the monoclinic structure, while Ho5Ge4, Ho5SiGe3, and Ho5Si2Ge2 have the
O(II)-type crystal structure at room temperature. No thermal hysteresis is
observed around TC (or TN) in agreement with the linear thermal expansion
measurements suggesting second order for the magnetic transitions for all
Ho5SixGe4�x alloys except Ho5Ge4, which shows a small step at TN. Thestructural and magnetic properties of Ho5SixGe4�x alloys determined by
Pereira et al. (2008b) are summarized in Table 18.
Chapter 262 R5T4 Compounds 397

Temperature- and magnetic-field-dependent X-ray powder diffraction
studies show that Ho5Ge4 undergoes a magnetostructural transition at
TN¼23 K (Singh et al., 2009). The transition, however, is unique and has
not been observed in any other R5T4 compound. No shear displacements of
the slabs occur during the transformation, and the volume change is quite
small: DV/V¼0.1%. Essentially, the monoclinic distortion occurs in the
ac-plane simultaneously with the onset of the antiferromagnetic ordering
resulting in a new crystal structure type (see Table 7 in the “Crystallography”
Section 2) with the space group P121/m1. Interestingly, Singh et al. (2009)
found that this distortion can be predicted from first-principles calculations,
which means that this unique monoclinic crystal structure is indeed thermody-
namically stable in Ho5Ge4.
Heat capacity data confirm the presence of the first-order transition at TN in
zero magnetic field; however, the first-order heat capacity peak broadens sub-
stantially in applied magnetic fields and practically flattens out at 50 kOe.
The reason for this phenomenon may lay in the fact that according to powder
diffraction data, application of a magnetic field actually induces a reverse
monoclinic–orthorhombic transformation in Ho5Ge4 (Singh et al., 2009), which,
however, requires high magnetic fields (above 30 kOe) for its completion. The
same set of heat capacity data indicates a spin-reorientation transition at 16 K,
which shifts to lower temperatures in applied magnetic field.
A neutron diffraction study of Ho5SixGe4�x with x¼0, 2, 3, and 4 con-
firmed that Ho5Ge4 undergoes a structural transformation below 25 K, while
other alloys preserve their room temperature crystal structures down to 2 K
(Ritter et al., 2009). However, the neutron diffraction data suggest that the
TABLE 18 Crystallographic Parameters and Magnetic Data for the
Ho5SixGe4�x System (Pereira et al., 2008b)
x(Si)
Crystal
structure a (A) b (A) c (A) g (�)TC,
TNa (K)
msb
(mB/Ho)
peff
(mB/Ho) yp (K)
0 O(II) 7.565 14.549 7.636 – 25a 6.5 8.9 21
1 O(II) 7.531 14.537 7.610 – 30a 6.5 10.2 15
2 O(II) 7.517 14.535 7.601 – 31a 6.6 11.3 15
3 M 7.428 14.498 7.624 93.003 49 7.8 10.1 32.7
3.5 M 7.425 14.486 7.605 93.084 57 8.4 9.9 33.9
4 O(I) 7.340 14.470 7.639 – 77 8.9 10.0 40
aAntiferromagnetic compounds.bT¼10 K and H¼50 kOe.
Handbook on the Physics and Chemistry of Rare Earths398

long-range magnetic order sets in Ho5Ge4 at �30 K, above the temperature of
the structural transformation, so the monoclinic distortion occurs when the
material is already in the AFM state. In addition to the main magnetic struc-
ture with k¼ (0 0 0), a second magnetic phase appears at 17 K with a propa-
gation vector k¼ (0 0 ½). Application of a magnetic field induces
ferromagnetic order in Ho5Ge4, which may be concomitant with the reappear-
ance of the orthorhombic structure. The magnetic moments in the magnetic
structure of Ho5Ge4are essentially restricted to the ac-plane.Ho5Si4 has a noncollinear FM magnetic structure below TC, with the mag-
netic moments mainly oriented along the a-axis but shows weak AFM cou-
pling along the b- and c-directions (Ritter et al., 2009). Ho5Si3Ge
(monoclinic Gd5Si2Ge2-type structure, TC¼50 K) orders ferromagnetically
with k¼ (0 0 0). It shows an FM moment orientation along the a-axis and
an AFM canting along the c-axis. Similar to Ho5Ge4, a second magnetic phase
appears at 16 K. Initially, this second phase is incommensurate, but it
becomes commensurate below 8 K with a propagation vector k¼ (0 0 ¼).
Ho5Si2Ge2 has the most complex magnetic structure among the Ho5SixGe4�x
compounds: in addition to the main AFM magnetic structure appearing at
TN�30 K (k¼ (0 0 0)), two additional magnetic phases with propagation vec-
tors k¼ (0 0 ¼) and k¼ (½ 0 0) occur at 15 and 12 K, respectively.
Structural, magnetic, and thermodynamic properties of the monoclinic
Ho5Si3.2Ge0.8 phase (Gd5Si2Ge2 type) have been examined in detail by Singh
et al. (2010b). The temperature-dependent X-ray powder diffraction experi-
ment confirmed that the crystal structure of Ho5Si3.2Ge0.8 remains monoclinic
below TC¼50 K, in the ferromagnetic state. Two additional anomalies in
M(T) curves, probably associated with changes in magnetic structure (see
Ritter et al., 2009), occur at 23 and 7 K. Even though the magnetostructural
transition and possible related kinetic arrest phenomena are absent in Ho5S-
i3.2Ge0.8, a significant magnetic frustration that may be described in terms
of spin-glass behavior was observed in this compound. Metastability of the
low-temperature magnetization data, frequency dependence of the ac mag-
netic susceptibility, and strong magnetic relaxation behavior were found to
coexist with the long-range ferromagnetic order in the extended temperature
range below TC. Above TC, a Griffiths-like phase behavior was also observed
in Ho5Si3.2Ge0.8. The magnetocaloric effect is moderate (DTad¼1.3 K for the
DH¼20 kOe) and exhibits a plateau-like behavior between �20 and 50 K
(Singh et al., 2010b).
4.10. Er5SixGe4�x
The Er5Si4 and Er5Ge4 intermetallic compounds were discovered by Smith
et al. (1967b) together with other R5T4 compounds. The silicide, Er5Si4, crys-
tallizes in the O(I) Gd5Si4 type of crystal structure while the germanide,
Er5Ge4, adopts the Sm5Ge4-type orthorhombic crystal structure. Holtzberg
Chapter 262 R5T4 Compounds 399
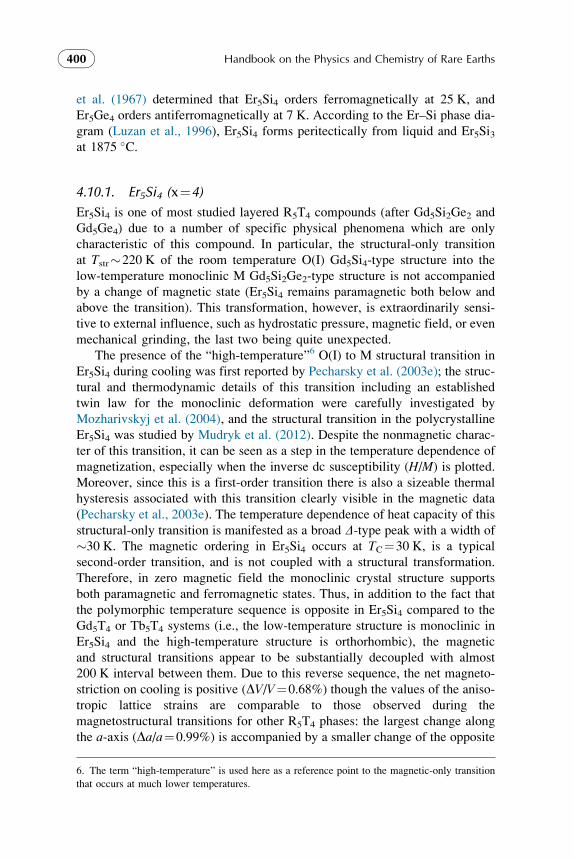
et al. (1967) determined that Er5Si4 orders ferromagnetically at 25 K, and
Er5Ge4 orders antiferromagnetically at 7 K. According to the Er–Si phase dia-
gram (Luzan et al., 1996), Er5Si4 forms peritectically from liquid and Er5Si3at 1875 �C.
4.10.1. Er5Si4 (x¼4)
Er5Si4 is one of most studied layered R5T4 compounds (after Gd5Si2Ge2 and
Gd5Ge4) due to a number of specific physical phenomena which are only
characteristic of this compound. In particular, the structural-only transition
at Tstr�220 K of the room temperature O(I) Gd5Si4-type structure into the
low-temperature monoclinic M Gd5Si2Ge2-type structure is not accompanied
by a change of magnetic state (Er5Si4 remains paramagnetic both below and
above the transition). This transformation, however, is extraordinarily sensi-
tive to external influence, such as hydrostatic pressure, magnetic field, or even
mechanical grinding, the last two being quite unexpected.
The presence of the “high-temperature”6 O(I) to M structural transition in
Er5Si4 during cooling was first reported by Pecharsky et al. (2003e); the struc-
tural and thermodynamic details of this transition including an established
twin law for the monoclinic deformation were carefully investigated by
Mozharivskyj et al. (2004), and the structural transition in the polycrystalline
Er5Si4 was studied by Mudryk et al. (2012). Despite the nonmagnetic charac-
ter of this transition, it can be seen as a step in the temperature dependence of
magnetization, especially when the inverse dc susceptibility (H/M) is plotted.
Moreover, since this is a first-order transition there is also a sizeable thermal
hysteresis associated with this transition clearly visible in the magnetic data
(Pecharsky et al., 2003e). The temperature dependence of heat capacity of this
structural-only transition is manifested as a broad D-type peak with a width of
�30 K. The magnetic ordering in Er5Si4 occurs at TC¼30 K, is a typical
second-order transition, and is not coupled with a structural transformation.
Therefore, in zero magnetic field the monoclinic crystal structure supports
both paramagnetic and ferromagnetic states. Thus, in addition to the fact that
the polymorphic temperature sequence is opposite in Er5Si4 compared to the
Gd5T4 or Tb5T4 systems (i.e., the low-temperature structure is monoclinic in
Er5Si4 and the high-temperature structure is orthorhombic), the magnetic
and structural transitions appear to be substantially decoupled with almost
200 K interval between them. Due to this reverse sequence, the net magneto-
striction on cooling is positive (DV/V¼0.68%) though the values of the aniso-
tropic lattice strains are comparable to those observed during the
magnetostructural transitions for other R5T4 phases: the largest change along
the a-axis (Da/a¼0.99%) is accompanied by a smaller change of the opposite
6. The term “high-temperature” is used here as a reference point to the magnetic-only transition
that occurs at much lower temperatures.
Handbook on the Physics and Chemistry of Rare Earths400

sign along the c-axis (Dc/c¼�0.4%) and a minor change of lattice dimen-
sions along the b-axis (Db/b¼0.23%), as determined by Mudryk et al. (2012).
It is worth to note that no structural transition has been observed in Er5Si4during the temperature-dependent neutron diffraction investigation of its mag-
netic and crystal structure (Cadogan et al., 2004). Possible explanation for this
discrepancy is that the purity of the starting Er metal used for the preparation
of Er5Si4 could be lower in this study since the stability of the orthorhombic
phase increases when interstitial impurities are present, similar to the stabili-
zation of the O(I) phase by interstitials in Gd5Si2Ge2. The magnetic structure
of O(I) Er5Si4 in the magnetically ordered state is characterized by the ferro-
magnetic alignment of Er moments along the b-axis and a strong AFM com-
ponent in the ac-plane (Cadogan et al., 2004).
The most interesting fact about the high-temperature transition is that
despite of being a structural-only transition occurring in the paramagnetic
state, the temperature shows a weak but clear dependence on the applied
magnetic field! At first, Pecharsky et al. (2004b) reported that the heat capac-
ity peak associated with this transition slightly shifts to lower temperatures
(dT/dH¼�0.058 K/kOe) in applied magnetic fields exceeding 40 kOe.
Afterward the shift in the transition temperature was observed in the magnetic
measurements, both in polycrystalline (Mudryk et al., 2011) and single-
crystalline (Mudryk et al., 2012) samples, see Figs. 41 and 42.
FIGURE 41 Magnetic field dependence of the structural-only M to O(I) transition in polycrys-
talline Er5Si4 occurring in the paramagnetic region. (A) Inverse dc susceptibility measured in
magnetic fields 1, 40, 80, 110, and 140 kOe; (B) transition temperature as a function of applied
magnetic field. After Mudryk et al. (2011).
Chapter 262 R5T4 Compounds 401

It is easy to see that the critical temperatures obtained from the Curie–
Weiss fits are different for two different polymorphs. In addition, Fig. 42D
clearly indicates that the magnetic field dependence is anisotropic: the transi-
tion temperature changes with field only when the magnetic field is applied
within the ac-plane but is not affected when the field is perpendicular to it.
This behavior may be understood in terms of strong magnetocrystalline
anisotropy and large value of Er effective magnetic moment: 9.71 and
9.63 mB/Er, for O(I) and M polymorphs, respectively (Pecharsky et al.,
2004b). Even though the magnetic moments in paramagnetic state are nonin-
teracting they still tend to align with the applied magnetic field. This field-
induced rotation of the moments along the a- and c-axes may induce greater
7500
1
2
3
4
5
0
0 75 150
T (K)
Hdc = 1 kOe, llcqP(mono) = 20.9 K
qP(ortho) = 38.1 K
qP(ortho) = 26.3 K qP(ortho) = 44.8 K
qP(mono) = 10 K qP(mono) = 29.3 K
Er5Si4
FCW
T (K)
H/M
(X
103 ,
Oe-
gm
/em
u)
H/M
(X
103 ,
Oe-
gm
/em
u)
H/M
(X
103 ,
Oe-
gm
/em
u)
T (K)165
2.6
2.8
3.0
3.2
180 195 210 225
165
2.8
3.0
3.2
3.4
180 195 210 225 1652.4
2.7
3.0
3.3
180 195 210 225
T (K)
FCWFCC
FCC
FCCFCW
A
C
B
Er5Si4
D
HIIc
HIIb
HIIa
0
202
204
206
208
198
200
202
204
202
204
206
10 20 30
Magnetic field, H(kOe)
Tem
pera
ture
,T(K
)
T(K
)
T(K
)
40 50 60
Er5Si4
Hdc = 1 kOe, lla Hdc = 1 kOe, llb
H/M
(X
103 ,
Oe-
gm
/em
u)
H/M
(X
103 ,
Oe-
gm
/em
u)
H/M
(X
103 ,
Oe-
gm
/em
u)
T (K) T (K)
225 300
1
2
3
4
5
0
1
2
3
4
5
150 225 300 750 150 225 300
70
FIGURE 42 (A–C) Inverse dc magnetic susceptibility of single-crystalline Er5Si4 measured with
magnetic field applied along the three major crystallographic directions. The insets show the dc
susceptibility data in the immediate vicinity of the high-temperature transition. (D) magnetic field
dependencies of the structural transition temperature determined along the three major crystallo-
graphic directions.
Handbook on the Physics and Chemistry of Rare Earths402
strain compared to the b-axis. The strain generates pressure that leads to the
structural transformation.
Of course, in order to support this scenario the compound should have an
extraordinary strong dependence of its transition temperature to the applied
pressure. Several studies confirm that this is, indeed, the case in Er5Si4. The
high-temperature PM-O(I) - PM-M transition shifts to lower temperatures
with applied hydrostatic pressure at the incredibly high rate of
dTs1/dP¼��30 K/kbar (Magen et al., 2006b; Marcano et al., 2012). More-
over, the application of hydrostatic pressure forces the re-entrance of the
orthorhombic structure in the low-temperature ferromagnetic state. This is
understandable since the orthorhombic phase is the low-volume phase. The
temperature at which this FM-M to FM-O(I) transformation occurs increases
at a rate of dTs2/dP¼6 K/kbar. Above �6 kbar both transitions merge, yield-
ing a stable O(I) phase throughout the whole range of measured temperatures
(2–300 K). For example, no structural transition is detected in the LTE mea-
surements performed at applied pressure of P¼9 kbar (Magen et al.,
2006b). The Curie temperature of the emergent O(I) Er5Si4 phase is slightly
higher (�35 K) compared to the TC of M Er5Si4 (�32 K).
The higher Curie temperature of the O(I) phase compared to TC of the M
phase points to the enhancement of the ferromagnetic interactions due to the
formation of additional interslab SidSi bonds. Arnold et al. (2009b) showed
that such enhancement leads to an increase in the magnetocaloric effect
measured around TC with the application of applied pressure. In particular,
setting the pressure to 1.4 kbar increases the magnetic entropy change from
�14.9 to �20.1 J/Kg K for DH¼50 kOe. Further increase in hydrostatic pres-
sure does little to increase the maximum |DSM| value but shifts the peak positionof the |DSM|(T) curve toward 36 K, the TC of the O(I) phase. The mechanism of
such increase is different from the one observed in Tb5Si2Ge2 by Morellon et al.
(2004b). The formation of interslab SidSi bonds leading to higher exchange
interactions is the reason for the increase in MCE of Er5Si4, not the coupling
of the crystal and magnetic lattices as observed in Tb5Si2Ge2.
Study of the magnetic properties of single-crystalline Er5Si4 under applied
hydrostatic pressure showed that the magnetic behavior is largely anisotropic
(Marcano et al., 2012). However, the overall response to the applied pressure–
the enhancement of the ferromagnetic interactions due to the formation of the
interslab SidSi bonds, manifested as the increase in TC, is seen along all
three crystallographic directions. At the same time, the spin-reorientation tran-
sitions observed in M(H) data when magnetic field was applied along a- orc-directions are largely preserved, even if modified, under different pressures
reflecting similarity of the magnetic structures of both the O(I) and M poly-
morphs (see below). Interestingly, the major increase of MCE due to the
application of hydrostatic pressure occurs when the magnetic field is applied
along the c-axis and, to a lesser degree, along the a-axis, while there is almost
no enhancement along the easy magnetization axis b (Marcano et al., 2012).
Chapter 262 R5T4 Compounds 403

The application of a strong magnetic field is also affecting the ground state
of Er5Si4. The analysis of Cp(T) data measured in magnetic fields ranging
from 0 to 100 kOe showed that a magnetostructural transformation may occur
in this compound near 18 K in magnetic fields of 75 kOe and above
(Pecharsky et al., 2004b). Magnetization and magnetostriction measurements
performed in ultra-high pulsed magnetic fields (up to 450 kOe) confirmed that
the field-induced transformation in Er5Si4 indeed proceeds through a magne-
tostructural transition, though the lowest critical field observed was
Hcr¼50 kOe for the T¼5 K measurements (Magen et al., 2006c). The critical
field value rapidly increases with the temperature increase reaching �250 kOe
for T¼80 K. Since the phase volume is decreasing during the transition it was
safe to assume that the reversible M to O(I) transition is occurring as it hap-
pens with the application of the hydrostatic pressure. The analysis of neutron
diffraction patterns measured at T¼2 K in H¼0 and 50 kOe applied magnetic
fields confirmed that while in zero field the sample has the single-phase
monoclinic structure, the majority (�61 vol.%) phase at 50 kOe is O(I)
(Magen et al., 2006c). The interesting fact about this transformation is that
the magnetic-field-induced structural transition occurs without a change in
the magnetic state as both phases are ferromagnetic and have similar magnetic
structures (Magen et al., 2006c; Ritter et al., 2006).
The magnetic structures of both the monoclinic and orthorhombic Er5Si4polymorphs are characterized by the easy magnetization axis b, along which
the moments are oriented with a canted ferromagnetic alignment. Apparently,
magnetic moment canting is stronger in the monoclinic structure while in the
O(I) structure the moments are fully aligned along the b-axis in the Er 4cpositions with a slight canting of the moments located on the Er atoms in
the 8d sites (Magen et al., 2006c). A weak AFM component is observed in
the ac-plane. There is a minor spin-reorientation process that occurs in mono-
clinic Er5Si4 at 15 K, which leads to a small increase in the values of canting
angles (Ritter et al., 2006).
It is hard to say whether the magnetic-field-induced FM-M to FM-O(I)
transformation can be completed by sufficiently high magnetic field. However,
since the high-temperature transition is also affected (its temperature is low-
ered) by the applied magnetic field, it is safe to assume that the stable structure
above �250 kOe is O(I) over the whole temperature range between 2 and
300 K, so in this case the influence of the 250 kOe magnetic field on the crystal
structure of Er5Si4 is comparable to the effect of 6 kbar hydrostatic pressure.
Another unusual property of Er5Si4 is also related to high sensitivity of its
crystal structure to external factors. Hence, Cao et al. (2013) observed that sim-
ple mechanical hand grinding using mortar and pestle at ambient conditions
results in a partial structural transformation from the orthorhombic into the
monoclinic phase. The same result is obtained when the grinding is performed
in a glove box filled with high-purity argon gas. When the powder is annealed
at 500 �C for 20 min (stress relieving annealing), the reversible M to O(I)
Handbook on the Physics and Chemistry of Rare Earths404

transformation occurs indicating that the stress induced during the grinding is
indeed the cause of the O(I) to M transformation. This observation is
fascinating because it shows that the shear stress produced during the mechani-
cal treatment has the effect opposite to the application of hydrostatic pressure,
which actually promotes the formation of the low-volume orthorhombic phase.
4.10.2. Er5SixGe4�x: Alloys with x<4
Addition of Ge removes the structural instability observed in the Er5Si4 alloy.
As shown by Pecharsky et al. (2004b), the main part of the Er5SixGe4�x dia-
gram (0�x<3.5) consists of the Er5Ge4-based solid solution with the O(II)
Sm5Ge4-type crystal structure. The monoclinic Gd5Si2Ge2-type alloys form
in a narrow region of the phase diagram: 3.5�x�3.8. Er5Si4 is the only com-
pound with the O(I) Gd5Si4-type structure at room temperature in this system;
no ternary Er5SixGe4�x compound crystallizing in this structure type has
been observed. According to heat capacity measurements both Er5Si3.5Ge0.5(M structure) and Er5Ge4 (O(II) structure) order magnetically via second-
order transitions (Pecharsky et al., 2004b). Ritter et al. (2006) confirm that
no structural transformations are observed in Er5Si3.5Ge0.5 or Er5Ge4 using
temperature-dependent neutron diffraction data. The magnetic transitions of
Er5SixGe4�x alloys with the O(II) structure appear to be antiferromagnetic
in low magnetic fields but clear ferrimagnetic signatures have been observed
in H20 kOe. The magnetic structure of Er5Si3.5Ge0.5 is similar to that of the
monoclinic Er5Si4. The magnetic structure of Er5Ge4 has not been fully deter-
mined, but according to Ritter et al. (2006) the compound adopts a complex
incommensurate antiferromagnetic structure at TN¼14 K. Basic magnetic
properties of the Er5SixGe4�x alloys are listed in Table 19.
TABLE 19 Basic Magnetic Properties of the Er5SixGe4�x Alloys (Pecharsky
et al., 2004b)
x(Si) Crystal structure TC, TNa (K) peff (mB/Ho) yp (K)
0 O(II) 14a 9.56 14.8
1.95 O(II) 17a 9.56 13.9
3 O(II) 17a 9.57 5.3
3.5 M 28 9.55 15.9
4 Mb 30 9.63 19.6
4 O(I)b 9.71 30.3
aAntiferromagnetic ordering.bStructural transition in Er5Si4 occurs at �200 K.
Chapter 262 R5T4 Compounds 405

Electrical and thermal transport properties of Er5SixGe4�x alloys with
x¼2, 3.6, 3.8, and 4 were measured by Lue et al. (2008). All samples are
orthorhombic at room temperature, and no sign of high-temperature structural
transition around 200 K was detected in the measurements, indicating that
the formation of the monoclinic crystal structure was suppressed in these alloys,
probably due to interstitial impurities. Anomalies corresponding to magnetic
ordering at TC were observed in temperature dependences of electrical resistiv-
ity, Seebeck coefficient and thermal conductivity for all alloys except
Er5Si2Ge2; however, a broad peak in thermal conductivity at 25 K occurs in this
compound. In general, when the Si content increases, the thermal conductivity
also increases while the electrical resistivity decreases (Lue et al., 2008).
4.11. Tm5SixGe4�x
The formation of Tm5Ge4 with Sm5Ge4-type crystal structure was originally
reported by Smith et al. (1967b). The investigation of the Tm–Ge binary sys-
tem (Eremenko et al., 1989) confirmed this crystal structure for the Tm5Ge4compound, which was found to form peritectically from liquid and Tm5Ge3at 1776 �C. Somewhat surprisingly, no reports on the existence of the silicide
Tm5Si4 can be found in literature. Overall, information about Tm5SixGe4�x
alloys is quite limited. Just about the only composition studied is Tm5Si2Ge2,
which also crystallizes in the Sm5Ge4-type crystal structure (Kim et al., 2010).
A single crystal was grown by Bridgeman method and studied by X-ray dif-
fraction, EDS, XPS, magnetic, electrical resistivity, and heat capacity mea-
surements. Thulium was found to be nearly trivalent in this compound but
4f states were split by the crystalline electric field. Tm5Si2Ge2 orders magnet-
ically at 8 K with antiferromagnetic alignment of magnetic moments along
the b-axis; however, there is a possibility of ferromagnetic coupling in the
ac-plane. A metamagnetic-like transition was observed when a magnetic field
was applied along the b-axis in �5 kOe field at 2 K. The magnetization data
presented in the same manuscript also show that the b-axis is an easy magne-
tization axis while the magnetization in the ac-plane is much lower and does
not show any saturation in 50 kOe applied magnetic field. The low-
temperature electrical resistivity shows �logT dependence indicating a Kondo
effect. Thus, a competition between Kondo effect and magnetic order occurs
in Tm5Si2Ge2 (Kim et al., 2010).
4.12. Yb5SixGe4�x
Both Yb5Si4 and Yb5Ge4 binary compounds were first reported in 2003. The
investigations of the Yb–Si binary system (Palenzona et al., 2003) and Yb–Ge
binary system (Pani and Palenzona, 2003) reveal the existence of the phases with
R5T4 stoichiometry; both compounds were reported to crystallize in the O(II)
Sm5Ge4 type of crystal structure. In the same year, Cerny and Alami-Yadri
Handbook on the Physics and Chemistry of Rare Earths406

(2003) determined the crystal structure of Yb5Si4. They also assigned Sm5Ge4 as
a structure prototype but noted that the coordination of some of the Si atoms is
different from the typical Sm5Ge4 coordination and similar to the Gd5Si4 type of
crystal structure. According to Palenzona et al. (2003) Yb5Si4 forms by peritectic
reaction from YbSi and liquid at approximately 1680 �C. On the other hand,
Yb5Ge4 melts congruently at 1640 �C and it has the highest melting temperature
among all other Yb–Ge binary compounds (Pani and Palenzona, 2003).
Systematic study of the crystallography, magnetic properties, and heat
capacity of the Yb5SixGe4�x pseudobinary system has been carried out by
Ahn et al. (2005). Somewhat surprisingly, all studied Yb5SixGe4�x alloys
(x¼0, 1, 2, 3, and 4) crystallize in the same Gd5Si4-type crystal structure.
The lattice parameters in the system linearly decrease with the increase in
Si content. However, comparison of the lattice parameters and unit cell
volumes of the binary compounds with those of other R5Si4 and R5Ge4 com-
pounds shows positive deviation from the normal lanthanide contraction7 indi-
cating that some or all of the Yb atoms in Yb5T4 compounds may be in the
Yb2þ valence state. Since inverse magnetic susceptibility of all Yb5SixGe4�x
follow the Curie–Weiss law in the paramagnetic region, the effective magnetic
moments were calculated and were found to be between 2.73 and 2.84 mB/Yb.Since the theoretical peff for pure Yb
2þ state is zero, and for the Yb3þ state it is
equal to 4.54 mB, it is clear that Yb5SixGe4�x alloys are mixed-valence systems.
Analysis of the magnetic and crystallographic data (see Ahn et al., 2005 for the
details) suggested that 12 out of 20 Yb atoms are in the divalent state and, most
likely, this is achieved byYb2þ occupying the 4c and one of the 8d atomic sites
of the O(I)-type crystal structure, while the trivalent ytterbium atoms occupy
another 8d site. Mossbauer spectroscopy gives a different ratio for Yb2þ/Yb3þ: 51.6(0.3)/48.4(0.3), which is both compositionally (valid for all
Yb5SixGe4�x compositions) and temperature independent (Voyer et al., 2006).
This indicates that Yb atoms with a certain valence state cannot be completely
assigned to a particular atomic site, and therefore, at least some of the Yb ions
must exist in the intermediate valence state.
According to magnetization data, Yb5SixGe4�x alloys order antiferro-
magnetically and the Neel temperature slightly increases from 2.4 for Yb5Si4to 3.2 K for Yb5Ge4 (Ahn et al., 2005). The temperature dependence of the
hyperfine field gives slightly lower TN ranging between �1.5 and 1.7 K
(Voyer et al., 2006). However, the ternary compositions exhibit two distinct
orderings of the Yb3þ sublattice, though the temperature difference between
these two orderings is small (�0.1 K). There is also an unusual increase in
TN between x¼3 and 3.5, though there is no change in the crystal struc-
ture. Except Yb5Si3Ge, which shows slightly positive yp¼2 K, all other
compositions have negative values of their paramagnetic temperatures
7. An exception: A small negative deviation was observed for the a lattice parameter in Yb5Ge4(Ahn et al., 2005).
Chapter 262 R5T4 Compounds 407

(Ahn et al., 2005). The M(H) curves measured at 1.8 and 10 K in magnetic
fields up to 70 kOe indicate gradual saturation below 1 mB/Yb and a
metamagnetic-like spin-flop transformation at �13 kOe. The heat capacity
data collected in 0, 10, and 20 kOe applied magnetic fields show an upturn
below 9 K, while the Cp values measured at 50 and 70 kOe are enhanced com-
pared to zero-field and low-field data (Ahn et al., 2005).
Electron microscopy study of Yb5Ge4 shows the presence of 5:3 platelets,
which typically form in other R5T4 systems as well (Qian et al., 2009). How-
ever, in most R5T4 compounds studied to date, the platelets, or linear features,
exhibit a characteristic criss-cross pattern, while in Yb5Ge4 they are parallel to
each other.
4.13. Lu5SixGe4�x
According to Smith et al. (1967b) Lu5Ge4 crystallizes in the Sm5Ge4-type
crystal structure, while Lu5Si4 has a monoclinic crystal structure with space
group P21/a, which indicates the possibility of adopting the Gd5Si2Ge2 type
of crystal structure discovered later. However, Gschneidner et al. (2000b)
prepared Lu5Ge4, Lu5SiGe3, Lu5Si2Ge2, and Lu5Si4 alloys from high-purity
Lu metal and found that all synthesized alloys crystallize in the orthorhombic
Sm5Ge4-type structure. Temperature dependences of heat capacity were
measured for all prepared samples and both the electronic specific heat coef-
ficient g and the Debye temperature yD were determined using the fitting of
the low-temperature C/T versus T2 plots. The Debye temperature increases
with the Si concentration (215�4 for Lu5Ge4, 262�30 K for Lu5Si4), while
g remains constant, 1.2�0.3 mJ/mol K2 (Gschneidner et al., 2000b).
An orthorhombic crystal structure with the lattice parameters a¼7.386 A,
b¼14.262 A, and c¼7.456 A has been reported by Thuy et al. (2003) for
Lu5Si2Ge2. No transitions were observed in the measured heat capacity data.
5. R5T4 SYSTEMS: SUBSTITUTIONS OF THE RARE EARTHS
Chemical similarity of the lanthanide elements leads to common occurrence
of series of isostructural intermetallic compounds encompassing several or,
in some cases, all rare earth elements with a great variety of stoichiometries
and crystal structures. As shown above, the R5SixGe4�x compounds are
formed by the majority of the rare earth elements, Sc and Eu being two excep-
tions. However, R5SixGe4�x are not cookie-cutter systems, and it is clear that
each R brings something unique, both structurally and magnetically, to the
whole picture. Therefore, while the vast majority of R5T4 studies are focused
on the chemical variations of the T atoms, one may expect some interesting
science to emerge from the combinations of two different lanthanides within
the same layered crystal structure. As was shown for the Yb5SixGe4�x system
(Ahn et al., 2005), R atoms of different size may have specific preferences for
Handbook on the Physics and Chemistry of Rare Earths408

particular atomic sites, which indicates the possibility of having multiple sub-
lattices of different rare earth atoms existing within the same crystal struc-
ture.8 At the same time, these structures should remain sensitive to external
stimuli. Consequently, their physical behavior is expected to be more complex
compared to the alloys with single R, and proper interpretation of the mea-
surement results may become complicated. This could be one of the reasons
why the number of investigations of such (R0xR1�x)5T4 systems is relatively
small.
In addition, several investigations on the substitution of R atom by non-R
atoms (e.g., Ca, Mg, Zr) have been carried out. Most of the studies are
focused on T¼Si, Ge. It should be noted that a significant number of ternary
R5T4 compounds has been prepared during exploratory studies of either vari-
ous ternary systems or isostructural series of compounds. Compounds for
which only crystallographic data are available are not discussed here since
the scope of this review covers composition–structure–property relationships
in pseudobinary R5T4 systems.
5.1. (R0xR1�x)5T4 Systems with T¼Si, Ge
5.1.1. (Gd1�xRx)5Si4 Systems
The substitution of Gd by other rare-earth elements in the Gd5Si4 compound is
relatively well studied due to its high Curie temperature, 336 K. Having the
magnetic ordering temperature in the near room temperature range, such
(Gd1�xRx)5Si4 systems with a small amount of R added were deemed promising
for some practical applications, mostly as potential magnetocaloric materials.
In 1991, Elbicki and coworkers studied the effect of Y and La substitution
on the magnetism and crystal structure of Gd5Si4 (Elbicki et al., 1991). They
found that Y substitution induces a gradual change of TC in Gd5�xYxSi4 alloys
[�60 K/x(Y)], and all alloys in the studied compositional range 0�x(Y)�2.0
retain the orthorhombic O(I) crystal structure. This observation was confirmed
later by Misra and Miller (2008). On the contrary, in the Gd5�xLaxSi4 series
an abrupt change of TC (�90 K) was observed between x(La) ¼ 0.5 and
x(La) ¼ 1.0. The X-ray analysis showed that the crystal structure of the
Gd5�xLaxSi4 alloys also changes from the orthorhombic at x(La)¼0.5 to the
tetragonal at x(La)¼1.0. Therefore, the observed anomaly in compositional
dependence of TC could be clearly associated with this particular crystallo-
graphic change. Such intimate relationship between magnetism and crystal-
lography is in the foundation for the majority of interesting phenomena
observed in R5T4 compounds and is the key to understanding their fascinating
physical properties. The authors (Elbicki et al., 1991) also noted that the
8. Strictly speaking, these alloys are not necessarily superstructures as some statistical distribu-
tion of atoms of different kind is still expected in each particular atomic site similar to the
Si/Ge distribution between the inter- and intraslab T positions.
Chapter 262 R5T4 Compounds 409

temperature dependence of magnetization in Gd5Si4 and substituted alloys
does not follow the Brillouin function for J¼S¼7/2 calculated from simple
molecular-field theory. Misra and Miller (2008) observed that the Gd5�xYxSi4solid solution with the Gd5Si4-type crystal structure extends at least up to
x¼4. Y5Si4 crystallizes in the monoclinic Gd5Si2Ge2 type (Pecharsky et al.,
2004a) therefore there should be a two-phase region in the Gd5�xYxSi4 system
between x¼4 and 5.
Spichkin et al. (2001) studied the crystallographic and magnetic properties
of the Gd5�xTbxSi4 (x¼0, 0.5, 1, 1.5, 2, 2.5, 5) and Gd5�xPrxSi4 (x¼0.5, 0.75,
1.0) solid solutions. Substitution of Gd by Tb or Pr does not change the crystal
structure in the studied range of concentrations—it remains the O(I) Gd5Si4type. As expected, the lattice parameters increase with the increase in Pr con-
centration and decrease when Gd is replaced by Tb in the linear fashion obey-
ing Vegard’s law.
No noticeable differences in magnetic behavior were detected between as-
cast and heat-treated alloys. The prepared alloys order ferromagnetically via
second-order transitions, as confirmed by heat capacity measurements. The
magnetic ordering temperature decreases much faster when Gd is replaced
by Pr (TC of (Gd4Pr1)Si4 is 291.5 K) compared to the change in TC due to
Tb substitution (TC of (Gd4Tb1)Si4 is 318 K), which is expected based on
the de Gennes factor. The calculated paramagnetic Curie temperature of
the alloys also shows linear dependence on the de Gennes factor for both
Tb- and Pr-based solid solutions (Fig. 43). The maximum magnetocaloric
effect remains nearly constant through the Gd5�xTbxSi4 system varying
between �8 and �9.5 J/Kg K (for DH¼50 kOe). On the other hand, the
reduction of MCE due to Pr substitution is substantial: maximum DSM for
(Gd4Pr1)Si4 alloy is only �6.1 J/Kg K for the same 50 kOe magnetic field
FIGURE 43 The paramagnetic Curie temperature of Gd5�xRxSi4 alloys, R¼Pr, Tb, as a func-
tion of de Gennes factor (Spichkin et al., 2001).
Handbook on the Physics and Chemistry of Rare Earths410

change. This may be due a strong reduction of the saturation magnetization in
the Pr-substituted alloys. The analysis of ac magnetic susceptibility and dc
magnetization data suggests the existence of complex magnetic structures in
magnetic fields below 5 kOe.
The magnetic and magnetocaloric properties of Gd5�xDyxSi4 alloys were
studied by Xie et al. (2004). The room temperature XRD analysis showed the
presence of a continuous solid solution with the orthorhombic crystal structure
(the study claims Sm5Ge4-type structure, but most likely it was actually the
Gd5Si4 type that was observed). A linear decrease in TC from 338 for Gd5Si4to 140 K for Dy5Si4 occurs with the increase of x(Dy). The magnetic transitions
in all measured Gd5�xDyxSi4 alloys are of second order. The magnetic entropy
change, DSM, was determined for the magnetic field change of 9.5 kOe and its
maximum value is approximately the same for all alloys (varying between
�2.24 and �2.52 J/Kg K) though pure Dy5Si4 shows a slightly larger value:
DSM¼�2.72 J/Kg K. Direct measurements of MCE were carried out for the
Gd5�xDyxSi4 alloys with x¼0, 0.5, 1, and 2 using an electromagnet with mag-
netic field of 19.2 kOe (Shimotomai and Ido, 2006). The maximum measured
temperature rise was found to be 3.1 K for Gd5Si4, and similar values were
obtained for x¼0.5 and 1 (the x¼2 sample with TC¼253 K was out of the
measurement range of the apparatus).
The Gd5�xHoxSi4 system is also characterized by a continuous solid solu-
tion in the entire range of concentrations (Zhou et al., 2008). The crystal struc-
ture belongs to the Gd5Si4 type. The lattice parameters and unit cell volume
linearly decrease with increasing x(Ho), essentially following Vegard’s law.
Investigation of the crystal structure, magnetic and thermodynamic proper-
ties of alloys in the erbium-rich part of the Gd5�xErxSi4 system (x¼0.75, 0.9)
has been carried out by Singh et al. (2008). The room temperature crystal struc-
ture of these samples corresponds to the Gd5Si4 type, and the compositional
dependence of the lattice parameters (when plotted together with the binary
compounds) appears to follow Vegard’s law. No first-order transition was
detected in gadolinium substituted silicides according to both magnetization
and heat capacity measurements. Competition of FM and AFM interactions is
clearly observed in magnetization data and is manifested via the presence of
two magnetic transitions: the AFM-like magnetic ordering transition is
observed at TN¼61 and 101 K for x¼0.9 and 0.75, respectively, and the
FM-like transition occurs in the magnetically ordered state at TC¼27 and
46 K, respectively. The values of saturation magnetization at 5 K and 70 kOe
are 7.34 and 7.14 mB/R3þ for the x¼0.9 and 0.75, respectively; �1.4 mB lower
than expected from Hund’s rule. The magnetization measurements show strong
relaxation with logarithmic time dependence. However, no significant fre-
quency dependence of the ac susceptibility has been observed so the magnetic
frustration of the complex magnetic state with competing anisotropic exchange
interactions is responsible for the observed relaxation behavior rather than the
traditional spin-glass behavior (Singh et al., 2008).
Chapter 262 R5T4 Compounds 411

5.1.2. (Gd1�xRx)5Ge4 Systems
Yang et al. (2003a) reported the results of a crystallographic investigation of
the Gd5Ge4–La5Ge4 system using X-ray powder diffraction. However, only
one ternary alloy, Gd3La2Ge4, has been prepared and analyzed during this
study; two other alloys studied were Gd5Ge4 and La5Ge4. Investigation of
the crystal structure revealed an unexpected result: while both binary com-
pounds crystallize with the same Sm5Ge4-type structure, the intermediate ter-
nary composition has the Gd5Si2Ge2 monoclinic structure. Thus, no
continuous solid solution exists between two isostructural R5Ge4 compounds
in the Gd5�xLaxGe4 pseudobinary system. A more detailed investigation of
this system may reveal further changes of crystallography, but this remains
to be seen.
The pseudobinary Gd5�xYxGe4 system where Gd was substituted by
another nonmagnetic rare earth element, yttrium, was investigated in great
detail showing some unique crystallographic properties (Misra and Miller,
2008). Both Gd5Ge4 and Y5Ge4 crystallize in the Sm5Ge4 type of crystal
structure but there is no continuous solid solubility between these two binary
compounds. Instead, for the composition range of 3.6�x�4.2, a monoclinic
U2Mo3Si4-type structure (space group P21/c, see Section 2 for atomic posi-
tions) occurs, which is rare in the R5T4 systems. This composition-driven
transformation from Sm5Ge4 type to the U2Mo3Si4 type of structure and back
does not result in significant changes in the interslab bonding and magnetic
interactions. The Gd and Y atoms statistically occupy all three rare earths
atomic sites that exist in both crystal structures. However, there is a clear pref-
erence for Y to occupy the interslab 4c (2a in the U2Mo3Si4 type of structure)
and one of the 8d (4e) sites (Misra and Miller, 2008) opening opportunities for
a targeted chemical substitution of specific atomic sites by a particular type of
rare earth atom. Magnetic measurements of Gd5�xYxGe4 alloys show a
decrease in the strength of exchange interaction (dilution effect) when Gd is
substituted by Y. However, it is worth to note that the initial drop in
yp value—þ69 K for Gd4YGe4 versus �þ130 K for Gd5Ge4—is much larger
than the decrease in the paramagnetic Curie temperature (31 K for GdY4Ge4)
with further increase in x(Y). This is different from the linear decrease in TCobserved in Gd5�xYxSi4 system (Elbicki et al., 1991; Misra and Miller, 2008)
and is related to the fact that the interslab 4c position plays a special role for
magnetic interslab exchange in the Sm5Ge4-type structures (see Section 3.10).
The samples with x¼1 and 2 show antiferromagnetic-like transition at 92 and
57 K, respectively. The samples with larger Y content do not show a clear
magnetic ordering transition, but ferrimagnetic type ordering (as suggested
by Misra and Miller, 2008) occurs at 31, 24, 20, and 15 K for x¼3.0, 3.4,
3.6, and 4.0, respectively.
No binary R5T4 compounds with R¼Eu are known. However, it was
shown that Eu can partially substitute Gd in the pseudobinary Gd5�xEuxGe4
Handbook on the Physics and Chemistry of Rare Earths412

system resulting in interesting crystal chemistry and unconventional magnetic
properties (Yao et al., 2012a,b). Since Eu ions (Eu2þ, Eu3þ and any mixed
valent Eu) are larger than Gd3þ, an expansion of the crystallographic lattice
is expected. On the other hand, the reduction of the VEC number, which in
R5T4 systems leads to the formation of the interslab TdT bonds and transfor-
mation into the Gd5Si4-type structure with lower unit cell volume, should
occur if at least some of the europium atoms are divalent or mixed valent.
An experimental study shows that both of these phenomena indeed occur in
the Gd5�xEuxGe4 system for x<2 (at larger x, the Gd5Si4-structure solid solu-
tion decomposes, Yao et al., 2012b). According to single-crystal X-ray diffrac-
tion data the samples with x¼0 and 0.25 crystallize in the O(II) Sm5Ge4-type
structure (no interslab TdT bonds), the sample with x¼0.5 adopts the room
temperature M Gd5Si2Ge2-type structure (half of the interslab TdT bonds
formed), and the O(I) Gd5Si4-type (all interslab T–T dimers exist) solid solution
is formed for 1�x<2. Similarly to the Gd5SixGe4�x system, this gradual for-
mation of the interslab T–T dimers results in strengthening of the magnetic ex-
change interactions. Even the sample with x¼0.25 shows a PM-O(II)–FM-O(I)
magnetostructural transition at 97 K, indicating a greater stability of the low-
temperature FM-O(I) phase compared to the binary Gd5Ge4. Further increase
in Eu concentration leads to a sharp increase in TC, even though the samples
with x1 show a magnetic (second order) transition only. The Gd4.5Eu0.5Ge4sample with the monoclinic room temperature crystal structure undergoes a
magnetostructural PM-M–FM-O(I) transition at 132 K. The Gd3.5Eu1.5Ge4 sam-
ple was reported to have the highest TC¼191 K in the system, while the mag-
netic ordering temperature of the sample with x¼2 drops to 96 K. Obviously,
in the Gd5�xEuxGe4 system the transition from the O(II) to M and O(I) structure
cannot be explained by the effect of chemical pressure as in the Gd5SixGe4�x
system because the unit cell volume is increasing with Eu substitution. Thus,
this system provides a solid confirmation for the validity of the valence electron
concentration effects in R5T4 systems.
5.1.3. (Gd1�xRx)5(Si,Ge)4 Systems
Magnetic and electrical transport properties of several quaternary
Gd5�xDyxSi2Ge2 samples were investigated. The Gd5�xDyxSi2Ge2 alloys with
x�3.5 adopt a monoclinic Gd5Si2Ge2-type crystal structure, while the alloys
with x4.5 crystallize in the orthorhombic Sm5Ge4 type (Nirmala et al.,
2007c,d). The magnetic ordering temperature drops quickly with x(Dy):TC¼210 K was observed for Dy0.5Gd4.5Si2Ge2, and for Dy3.5Gd1.5Si2Ge2 TC is
equal to�80 K (Nirmala et al., 2007c,d). The Dy substitution also leads to a loss
of a first-order character typical for pure Gd5Si2Ge2. The maximum magnetic
entropy changes for a field change of 55 kOe are �8.8, �13.9, and �6.9 J/Kg K
for x¼0.5, 3.0, and 5.0, respectively. Another transition at 21 K is clearly seen
in the temperature dependences of electrical resistivity and heat capacity of
Chapter 262 R5T4 Compounds 413

Dy0.5Gd4.5Si2Ge2 (Nirmala et al., 2006). In other measured Gd5�xDyxSi2Ge2samples, the temperature dependences of electrical resistivity show a single
anomaly at TC, below which it falls steeply (Nirmala et al., 2007d). The temper-
ature dependence of the thermoelectric power of Dy0.5Gd4.5Si2Ge2, on the other
hand, shows an anomaly at 46 K. A negative magnetoresistance of ��25% is
observed in Dy0.5Gd4.5Si2Ge2 at 50 K in an applied magnetic field of
100 kOe. The field dependence of magnetoresistance at this temperature (well
below TC) was practically linear (Nirmala et al., 2006).
Aghababyan and Harutyunyan (2012) also studied the magnetocaloric
properties of Gd5�xDyxSi2Ge2 alloys for x¼0, 0.5, 1.0, 1.5, 2.0. While the
study confirmed that in this range of concentrations the crystal structure is
Gd5Si2Ge2-type monoclinic, the change of TC with Dy concentration is smal-
ler than reported by Nirmala et al. (2007d). For example, Nirmala et al.
(2007d) reports that the Gd3.5Dy1.5Si2Ge2 composition has TC of 201 K, while
Aghababyan and Harutyunyan (2012) obtained TC¼231 K. The maximum
magnetic entropy change values, measured by Aghababyan and Harutyunyan
(2012) for a magnetic field change of 10 kOe, gradually decreases from �8.1
for a ternary Gd5Si2Ge2 to �7.5 J/Kg K obtained for Gd3Dy2Si2Ge2.
Substitution of Gd by Tb was studied by Deng et al. (2007) in the
(Gd1�xTbx)5Si1.72Ge2.28 series of alloys with 0�x�0.1. X-ray diffraction and
magnetization measurements show that in this range of concentrations the stud-
ied alloys form a solid solution with the Gd5Si2Ge2-type crystal structure and a
gradual decrease of the magnetic ordering temperature with x(Tb) was observed.The first order of the magnetic transition and the giant magnetocaloric effect are
retained. The magnetocaloric effect in the (Gd1�xTbx)5Si2Ge2 series of alloys
was theoretically studied by Gomes et al. (2009) and is in good agreement with
the experimental results (which are only known for the end members).
Substitution of Gd by Er was investigated in the (Gd1�xErx)5Si1.7Ge2.3series of alloys for 0�x�0.2 (Chen et al., 2011). A strong and linear
decrease in the magnetic ordering temperature was observed: TC is 229 K
for x¼0 but drops rapidly to 135 K for x¼0.2. A decrease in the magnetic
hysteresis was reported for Er-substituted alloys but it is accompanied by a
smaller value of the magnetic entropy change. The monoclinic Gd5Si2Ge2-
type crystal structure was observed in all samples.
5.1.4. (R0xR1�x)5T4 Systems without Gd
(R0xR1�x)5T4 pseudobinary systems that do not contain gadolinium have
rarely been studied systematically until recently even though there are a num-
ber of earlier studies in which ternary (R0xR1�x)5T4 compounds with layered
crystal structure have been prepared. They are typically reported to crystallize
in the Sm5Ge4-type crystal structure even though many of them, particularly
silicides, probably have the Gd5Si4-type crystal structure. A significant num-
ber of (R0xR1�x)5T4 compounds were discovered in systems with Sc. For
example, Sc3Pr2Si4, Sc1.26Pr3.74Si4, and Sc3.96Nd1.04Si4 were reported to
Handbook on the Physics and Chemistry of Rare Earths414
crystallize in the Sm5Ge4 type (Kotur et al., 1997); however, analysis of
SidSi atomic bonding indicates that assignment to the Gd5Si4 type would
be more appropriate for these compounds.
The crystallography of Nd5�xErxSi4 and Nd5�xErxGe4 pseudobinary systems
was investigated by Misra et al. (2009a). In the silicide system, the end members
crystallize in different structure types at room temperature: Er5Si4 adopts the
Gd5Si4-type structure, while Nd5Si4 belongs to the tetragonal Zr5Si4 type. Some-
what predictably, two solid solution regions with different crystal structures exist
in Nd5�xErxSi4: alloys with x�1.0 have the tetragonal crystal structure, while the
alloys in the compositional range 2.0�x�5.0 exhibit the Gd5Si4 orthorhombic
structure. The crystallographic properties of the Nd5�xErxGe4 alloys are similar
to those of the Gd5�xYxGe4 system studied by Misra and Miller (2008). While
the binary compounds, Er5Ge4 and Nd5Ge4, adopt the same Sm5Ge4-type crystal
structure no continuous solid solution was observed. Instead, in the region of con-
centrations of 3.2�x�4.0 the monoclinic U2Mo3Si4-type structure occurs as the
majority phase (Misra et al., 2009a). According to X-ray single crystal diffraction
experiment, the smaller Er atoms tend to occupy the interslab 4c sites and to a
slightly lesser degree one of the 8d sites (also preferentially occupied by Y in
Gd5�xYxGe4, Misra and Miller, 2008), indicating that such preference is a
particular property of most if not all R5T4 compounds with or without slab
structure. Nd4ErGe4 undergoes an AFM-like ordering typical for other R5Ge4compounds at TN¼23 K. The Er-rich sample does not show a clear magnetic
ordering transition but analysis of the low-temperature M(T) upturns indicates
ferromagnetic-like ordering at 6, 12, and 11 K for x¼2, 3, 4, respectively. The
magnetic ordering state of these alloys is confirmed by a saturation of the magne-
tization curves measured as a function of the applied magnetic field below these
characteristic temperatures.
Unexpected and interesting results were obtained when Tb was gradually
replaced by La in the Tb5�xLaxSi2Ge2 system (Fig. 44, Belo et al., 2012b).
When La substitutes for Tb at low concentrations (x<1), the monoclinic
Gd5Si2Ge2 type of crystal structure of the ternary Tb5Si2Ge2 compound is
retained and the lattice dimensions increase due to much larger atomic radii
of the La atoms compared to Tb. At the same time, the extent of the mono-
clinic distortion, the g angle, decreases from 93.010(4)� to 92.109(4)� for
x¼0 and 0.75, respectively. The effect of dilution of Tb by nonmagnetic La
on the magnetic properties of these alloys is counterintuitive: the magnetic
ordering temperature (TC) increases with the increase in the La content for
the monoclinic solid solution (see Fig. 44). At the same time, yp behaves
erratically: it remains nearly the same, 94.0 versus 95.7 K, for x¼0 and
0.75, respectively, but is noticeably smaller for x¼0.5, 83.8 K. A similar lack
of a clear trend is also reported for the effective paramagnetic and saturation
magnetic moments. However, there are two characteristic magnetic tempera-
tures that show a clear decrease with the rise in x(La): TG, which indicates
the onset of the Griffiths-like behavior, decreases from 208 to 195 K for
x¼0 and 0.75, respectively, and the temperature of a spin-reorientation
Chapter 262 R5T4 Compounds 415
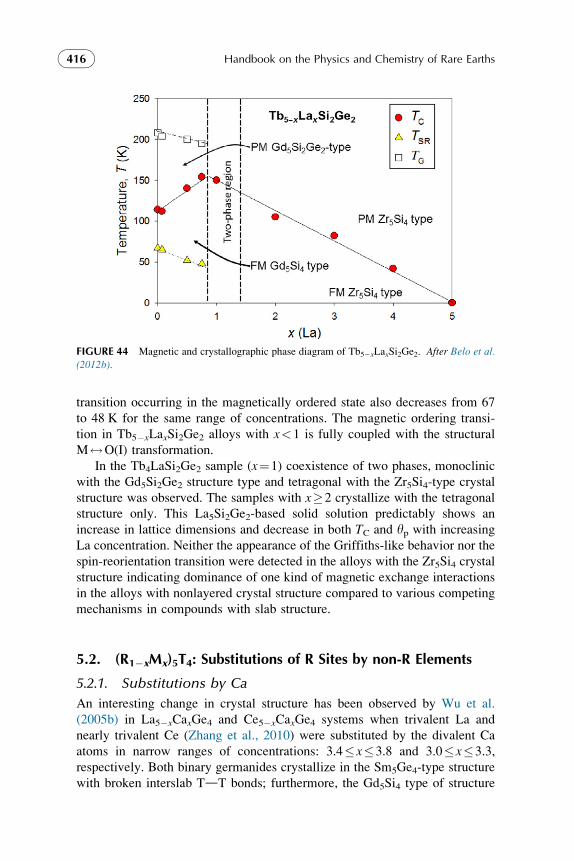
transition occurring in the magnetically ordered state also decreases from 67
to 48 K for the same range of concentrations. The magnetic ordering transi-
tion in Tb5�xLaxSi2Ge2 alloys with x<1 is fully coupled with the structural
M$O(I) transformation.
In the Tb4LaSi2Ge2 sample (x¼1) coexistence of two phases, monoclinic
with the Gd5Si2Ge2 structure type and tetragonal with the Zr5Si4-type crystal
structure was observed. The samples with x2 crystallize with the tetragonal
structure only. This La5Si2Ge2-based solid solution predictably shows an
increase in lattice dimensions and decrease in both TC and yp with increasing
La concentration. Neither the appearance of the Griffiths-like behavior nor the
spin-reorientation transition were detected in the alloys with the Zr5Si4 crystal
structure indicating dominance of one kind of magnetic exchange interactions
in the alloys with nonlayered crystal structure compared to various competing
mechanisms in compounds with slab structure.
5.2. (R1�xMx)5T4: Substitutions of R Sites by non-R Elements
5.2.1. Substitutions by Ca
An interesting change in crystal structure has been observed by Wu et al.
(2005b) in La5�xCaxGe4 and Ce5�xCaxGe4 systems when trivalent La and
nearly trivalent Ce (Zhang et al., 2010) were substituted by the divalent Ca
atoms in narrow ranges of concentrations: 3.4�x�3.8 and 3.0�x�3.3,
respectively. Both binary germanides crystallize in the Sm5Ge4-type structure
with broken interslab TdT bonds; furthermore, the Gd5Si4 type of structure
FIGURE 44 Magnetic and crystallographic phase diagram of Tb5�xLaxSi2Ge2. After Belo et al.
(2012b).
Handbook on the Physics and Chemistry of Rare Earths416
with strong interslab TdT bonds does not form in either La5SixGe4�x or
Ce5SixGe4�x. Yet, the Ca-substituted germanides crystallize in the Gd5Si4-
type structure since the interslab Ge–Ge dimers (d�2.6 A) are, indeed, pres-
ent in the studied samples. The effect of chemical pressure may not be the
most relevant factor here because the effective ionic radius of divalent Ca
(0.99 A) is only slightly lower than the ionic radius of trivalent La (1.04 A)
and is similar to the ionic radius of trivalent Ce (1.01 A).9 Most likely it is
the change in VEC that affects the crystal structure. As was shown also for
the Gd5GaxGe4�x system (Mozharivskyj et al., 2003, also see Section 2),
application of the Zintl–Klemm formalism to electron count in R5T4 com-
pounds leads to a prediction of the T–T dimers formation, and, consequently,
allows derivation of the possible structure type for a given VEC value. Lower
VEC is associated with the increased number of dimers and stability of the
Gd5Si4-type structure. Therefore, reduction of VEC caused by replacement
of the trivalent lanthanides with the divalent Ca may also lead to the forma-
tion of the Gd5Si4-type structure, as was experimentally verified by Wu
et al. (2005b).
5.2.2. Substitutions by Mg
The Yb4MgGe4 has been synthesized by Tobash and Bobev (2006) and was
found to crystallize in the Gd5Si4-type structure—the same as the binary
Yb5Ge4. Similarly to Yb5Ge4 and other Yb5SixGe4�x alloys (Ahn et al.,
2005) Yb4MgGe4 is also an inhomogeneous mixed-valence system where Yb
atoms in one of the 8d sites are trivalent while the other two sites are expected
to be occupied by divalent Yb atoms based on the analysis of their nearest neigh-
bor environments. Interestingly, Mg mainly prefers the intraslab 4c site for the
substitution, but it also can be found (up to 28%) in the trivalent 8d site. Magnetic
susceptibility of Yb4MgGe4 shows no magnetic transition and a modified Curie–
Weiss fit gives a paramagnetic Curie temperature yp¼�11 K, an effective mag-
netic moment peff¼2.3 mB/Yb, and a temperature-independent parameter
w0¼9�10�4 emu/mol.
A systematic study of the Mg substitution for the rare earth element in
the R5�xMgxGe4 systems (for 1.0<x<2.3) with R¼Gd–Tm, Lu, and Y
has been reported by Tobash et al. (2009). Several compositions from the
Ho5�xMgxGe4 system were studied while only one compound from the other
systems was reported. Interestingly, all these ternary germanides crystallize in
the Gd5Si4-type crystal structure even though the parent binary R5Ge4 com-
pounds usually adopt the Sm5Ge4-type structure. As noted above, the change
in VEC results in the formation of the interslab GedGe bonds, and the pres-
ence of such bonds differentiates Gd5Si4-type structure from the Sm5Ge4 type.
9. Here and below, the values of atomic, metallic, and ionic radii are taken from Teatum et al.
(1968).
Chapter 262 R5T4 Compounds 417

Consequently, as a result of the structural change a strong contraction (up to
6%) in the a and b crystallographic directions occurs due to Mg substitution
when compared with the R5Ge4, while the change in the c-direction is the
smallest. In the Ho5�xMgxGe4 solid solution, the change in lattice parameters
is linear and monotonic. The magnetic ordering temperature (TN) for the
Ho5�xMgxGe4 solid solution increases from 17.4 to 24.2 K as the Mg content
decreases from x¼2.06 to 1.23. The TN for R¼Er, Tm could not be deter-
mined due to potentially very low magnetic ordering temperatures, and com-
pounds with R¼Y and Lu are Pauli paramagnets. Compositions, lattice
parameters and basic magnetic properties of selected R5�xMgxGe4 compounds
are presented in Table 20.
5.2.3. Substitutions by Zr and Hf
The metallic radii of Gd (1.802 A) and Zr (1.602 A) are quite different and
they are not isoelectronic elements. Considering that Gd5Si4 and Zr5Si4 crys-
tallize in different structure types a continuous solid solution between them is
not expected. The study of Gd5�xZrxSi4 system shows that the Zr5Si4-based
solution has a wider stability range (1�x�5) than the Gd5Si4-type solution,
which exists only in a narrow range of concentrations for x�0.25 (Yao
et al., 2011). The lattice parameters and unit cell volume substantially
decrease when Zr substitutes for Gd. Interestingly, the plotted dependence
of the unit cell volume versus composition x indicates a weak negative devia-
tion from Vegard’s rule for the Zr5Si4-based solid solution. Even though the
Zr5Si4-type structure is not layered, it was found that the larger atoms tend
to avoid the inner-slab position when Zr substitutes for Gd both in the
TABLE 20 Lattice Parameters and Basic Magnetic Properties of Selected
R5�xMgxGe4 Compounds (Tobash et al., 2009)
Compound a (A) b (A) c (A) TN (K) yp (K) peff (mB/R3þ)
Y3.49Mg1.51Ge4 7.085(2) 14.465(4) 7.718(2) Pauli paramagnet
Gd3.55Mg1.45Ge4 7.1574(9) 14.623(2) 7.7801(9) 110 42 8.30
Tb3.52Mg1.48Ge4 7.128(5) 14.512(11) 7.732(6) 70 19 9.97
Dy3.50Mg1.50Ge4 7.0845(14) 14.425(3) 7.687(2) 31 8 10.85
Ho3.62Mg1.38Ge4 7.0710(11) 14.419(2) 7.6627(12) 23 6 10.75
Er3.41Mg1.59Ge4 7.0214(5) 14.3063(10) 7.6350(5) 3 9.92
Tm3.51Mg1.49Ge4 7.0128(9) 14.270(2) 7.5998(9) 1 8.15
Lu3.60Mg1.40Ge4 6.9750(8) 14.224(2) 7.5619(9) Pauli paramagnet
Handbook on the Physics and Chemistry of Rare Earths418

Gd5�xZrxSi4 and Gd5�xZrxGe4 systems (Yao and Mozharivskyj, 2011). It is
important to note, however, that the effect of VEC may also play a role in
the distribution of substituting atoms among different atomic sites. The dis-
cussed site occupation preferences were observed in many M5T4 systems
(including non-rare earths) and are compiled in a paper presented by Yao
and Mozharivskyj (2011).
The Gd5�xZrxGe4 system is somewhat similar to Gd5�xZrxSi4, but the
Gd5Ge4-based solid solution with the Sm5Ge4-type structure exists over a
larger composition range (0�x�1.49, Yao and Mozharivskyj, 2011), com-
pared to the Gd5Si4-based solid solution in the silicide system. The Zr5Ge4-
based solid solution with the Zr5Si4-type structure occurs for x1.77.
Magnetic measurements show that the Curie temperature of Gd5�xZrxSi4alloys is barely changed by Zr substitution in the Gd5Si4-type region, but it
drops by �100 K when the crystal structure changes to the Zr5Si4 type, and
then gradually decreases due to a dilution effect (Yao et al., 2011). The
Gd5�xHfxSi4 pseudobinary system is nearly identical to Gd5�xZrxSi4 (Yao
and Mozharivskyj, 2011). The Gd5Si4-type solid solution exists over a narrow
range of concentrations (x�0.41), while the alloys for x0.7 adopt the
Zr5Si4-type structure.
5.2.4. Substitutions by Li
The structural investigation of Tm4LiGe4 compound shows that it crystallizes
in the ordered superstructure of the Sm5Ge4 type (Pavlyuk et al., 1990).
The Yb4LiGe4 compound (Xie et al., 2008) can be characterized as an
ordered version of the Gd5Si4 type because the interslab Ge–Ge distance
in this compound indicates the presence of the dimers (dGe3�Ge3¼2.603(2)
A). These phases deserve special mentioning due to strict preferences in
the occupation of R atomic sites: Li exclusively occupies the interslab 4csite, while the rare earth atoms are located in the 8d positions. The
R4LiGe4 compounds were reported for all lanthanides except Eu (Fornasini
et al., 2012).
6. R5T4 SYSTEMS CONTAINING Sn
R5T4 compounds containing Sn have not been studied as well as the silicides
and germanides, but also draw significant attention due to the magnetostruc-
tural transitions and physical phenomena that are associated with them.
Binary R5Sn4 easily hydrolyze when left at ambient atmospheric conditions
and this fact also complicates their investigation. Two pseudobinary
R5SnxSi4�x systems with R¼Nd and Gd have been studied so far; in addition,
the effect of substitution of Si by Sn on the magnetic properties and crystal
structure of GMCE compound Gd5Si2Ge2 was investigated.
Chapter 262 R5T4 Compounds 419

6.1. R5Sn4 Compounds
The crystal structure, lattice parameters, and basic magnetic properties of
R5Sn4 compounds are summarized in Table 21. All known R5Sn4 compounds
crystallize in the Sm5Ge4-type structure, except Yb5Sn4, which was found to
adopt the Gd5Si4-type structure. While the compounds with R¼Ce, Nd,
Gd–Er are relatively well studied (see Table 21), little or no information is
available about the R5Sn4 compounds formed by other rare earths.
The Y5Sn4 compound was observed during the investigation of the Y–Sn
system (Schmidt and McMasters, 1968). It forms by peritectic reaction at
1790�10 �C. The Sm5Ge4 type of crystal structure has been suggested for
this compound. The Yb5Sn4 compound forms peritectically at 1160 �C, and
TABLE 21 Basic Crystallographic and Magnetic Properties of R5Sn4Compounds (Sm5Ge4-Type Structure,a SG Pnma)
R a (A) b (A) c (A) TC, TN (K) Reference
Y 8.05 15.29 8.05 – Schmidt andMcMasters (1968)
La 8.435(1) 16.194(2) 8.630(1) – Guloy and Corbett(2005)
Ce 8.337 16.05 8.480 8.2 Borzone et al. (1982)and Givord et al.(1992)
Pr 8.270 15.94 8.429 – Fornasini and Merlo(1971)
Nd 8.2093(6) 15.8504(13) 8.3797(7) 36 Wang et al. (2005)
Sm 8.126 15.67 8.290 – Fornasini and Merlo(1971)
Gd 8.047(3) 15.545(5) 8.199(3) 82 Wang et al. (2002) andRyan et al. (2003)
Tb 8.0086(3) 15.4369(7) 8.1390(4) 84 (54a) Zhong et al. (2011)
Dy 7.9865(5) 15.3693(9) 8.0930(5) 22b Zhong et al. (2011)
Ho 7.9628(2) 15.3001(4) 8.0534(2) 15b Zhong et al. (2011)
Er 7.9366(1) 15.2330(3) 8.0140(2) 8b Zhong et al. (2011)
Ybc 7.822 15.813 8.280 – Palenzona and Cirafici(1976)
aSpin-reorientation transition.bNeel temperature, TN.cYb5Sn4 was reported to crystallize in the Gd5Si4-type structure.
Handbook on the Physics and Chemistry of Rare Earths420

adopts the Gd5Si4 type of crystal structure (Palenzona and Cirafici, 1976) sim-
ilar to Yb5Si4 and Yb5Ge4 (Ahn et al., 2005). Compounds with R¼Sc, Eu,
Tm, and Lu have not been reported.
6.1.1. R5Sn4 Compounds with R¼La, Ce, Pr, Nd, and Sm
The formation and crystal structure of R5Sn4 compounds with R¼La, Pr, and
Sm has been reported (Fornasini and Merlo, 1971), but to the best of our
knowledge no information about their physical properties is available. Guloy
and Corbett (2005) synthesized the La5Sn4 compound and confirmed that it
crystallizes in the Sm5Ge4-type structure.
Magnetic structure of Ce5Sn4 was studied by neutron diffraction and mag-
netization measurements (Givord et al., 1992). The study confirmed the ortho-
rhombic Sm5Ge4-type crystal structure both above (at 16.6 K) and below (at
1.8 K) the magnetic ordering transition, which occurs at TC¼8.2 K. The para-
magnetic Curie temperature and effective paramagnetic moment were found
to be �16 K and 2.63 mB/Ce atom, respectively, suggesting antiferromagnetic
interactions and the trivalent state of cerium in this compound. Examination
of the magnetic structure by neutron diffraction shows that Ce5Sn4 is a non-
collinear ferromagnet with ferromagnetic component aligned along the a-axis.Two other directions, however, exhibit AFM interactions, in agreement with
negative yp.The magnetic structure of Nd5Sn4 has been determined by using neutron
diffraction (Wang et al., 2005). A complex canted antiferromagnetic structure
is observed below the magnetic ordering temperature of TC¼36 K with mag-
netic moments essentially confined in the ac-plane. The Nd magnetic
moments are higher in the 8d atomic sites (2.44 and 2.63 mB per Nd) than in
the interslab 4c site (1.76 mB).
6.1.2. Gd5Sn4
Gd5Sn4 undergoes a low-temperature magnetostructural PM–FM transition
and the nature of the transition was first studied in Gd5Sn4 by means of mag-
netization measurements and 119Sn Mossbauer spectroscopy (Ryan et al.,
2003). The temperature of the coupled magnetic and structural transition has
been identified as 82 K, based on magnetic susceptibility data. The transition
can be induced by both the change in temperature and applied magnetic field.
The M(H) curve collected at 5 K confirms the ferromagnetic state of Gd5Sn4with a saturation moment of 6.8 mB/Gd. Another magnetic transition, probably
reflecting the presence of a magnetic impurity, was observed in the sample
at �130 K (Ryan et al., 2003). The Mossbauer spectrum of Gd5Sn4 at 9 K
is dominated by two well-split magnetic sextets. A characteristic change is
observed in both temperature and magnetic-field-dependent spectra when
the material proceeds through the first-order transition. The temperature
dependence of the magnetic entropy change forms a plateau for a magnetic
Chapter 262 R5T4 Compounds 421

field change above DH¼�30 kOe with a maximum height of the plateau at
��35 J/Kg K. The width of the plateau increases with the increase in DH,while the maximum value remains stable, a behavior indicative of the first-
order nature of the transition. Ryan et al. (2003) also suggests that the sample
used in their study is magnetically inhomogeneous below 130 K.
The temperature-dependent X-ray powder diffraction study of Gd5Sn4was carried out by Yang et al. (2004) in the temperature range between
�80 and 298 K. The investigation did not show any change of crystal
structure at TC, even though a notable dip in lattice parameters and unit cell
volume was observed at the point of magnetic ordering. However,
Wang et al. (2004) using temperature-dependent X-ray synchrotron diffrac-
tion data showed that Gd5Sn4 (and Si-doped Gd5Si0.4Sn3.6) actually
change their crystal structure at TC from the room temperature O(II) Sm5Ge4type into the low-temperature O(I) Gd5Si4 type. The diffraction pattern col-
lected at 20 K shows that the transition is incomplete, and 13% of the room
temperature structure (6% according to Mossbauer spectroscopy, Ryan
et al., 2003) is still present. The Bragg peaks of impurity phases, Gd5Sn3and Gd11Sn10, were present as well. The contraction of the lattice along the
a-axis during the transition is smaller than in Gd5Ge4, but still large (�1%)
especially when compared to negligible expansions observed along the
b- and c-axes.
6.1.3. R5Sn4 Compounds with R¼Tb, Dy, Ho, and Er
Scarce and often contradictory information regarding the formation of R5Sn4compounds with heavy lanthanides was available in the literature until
recently. Bulanova et al. (1998) reported the formation of Ho5Sn4 by a peri-
tectic reaction from liquid and Ho5Sn3 at 1720�13 �C yet its crystal structure
has not been determined. According to Eremenko et al. (1992), Dy5Sn4 also
forms by peritectic reaction from liquid and Dy5Sn3 at 1712�11 �C, and its
crystal structure was identified as Sm5Ge4 type.
Zhong et al. (2011) studied the crystallographic and magnetic properties of
R5Sn4 compounds with R¼Tb, Dy, Ho, and Er. The study found that all com-
positions crystallize in the Sm5Ge4-type structure but are difficult to obtain as
single-phase materials. The R11Sn10 and R5Sn3 impurity phases are present in
all prepared samples; annealing at 1300 �C for 24 h decreases the amount of
impurities but their concentrations are still relatively high, varying between
9% and 17% depending on the sample. The lattice parameters and magnetic
ordering temperatures of R5Sn4 compounds for R¼Gd–Er are listed in
Table 21. It is noted that according to Zhong et al. (2011), Tb5Sn4 orders fer-
romagnetically at �84 K and its magnetic ordering temperature is nearly the
same as Gd5Sn4 (Ryan et al., 2003). In addition, Tb5Sn4 exhibits a spin-
reorientation transition (AFM like) at 54 K. Ho5Sn4, Dy5Sn4, and Er5Sn4order antiferromagnetically at 22, 15, and 8 K, respectively.
Handbook on the Physics and Chemistry of Rare Earths422

6.2. R5SnxSi4�x Systems
6.2.1. Gd5SnxSi4�x
The replacement of Si atoms by much larger isoelectronic Sn atoms can be
expected to produce the similar effect as the replacement of Si by Ge. The
atomic radius of Sn is larger than Ge, therefore a stronger chemical pressure
effect should be observed in the Gd5Sn4 side of the phase diagram compared
to the Gd5SixGe4�x system (faster increase in TC with Si addition). In addi-
tion, the O(I) phase has a narrower stability range due to a larger expansion
of the unit cell volume so that the low-volume phase may be replaced with
a larger volume phase at smaller x. The investigation of the Gd5SnxSi4�x
pseudobinary system (Wang et al., 2002) indicates that the Gd5Si4-based
solid solution10 is indeed slightly narrower (0�x�1.2) compared to the
Gd5SixGe4�x system. The monoclinic phase with room temperature
Gd5Si2Ge2 structure type exists for 2.8�x�3.2, and the Gd5Sn4-based solid
solution with room temperature O(II) Sm5Ge4-type structure occurs for
x3.6. An extensive two-phase region containing both M and O(I) structures
was found by Wang et al. (2002) for 1.6�x�2.4.
A separate study of the Gd5SnxSi4�x pseudobinary system over the
0�x�3 range of concentrations using X-ray single crystal diffraction
(Mozharivskyj et al., 2006) shows a notable discrepancy with the results
obtained by Wang et al. (2002). While the Gd5Si4-type solid solution was
found by Mozharivskyj et al. (2006) to exist in a range of concentrations
(0�x�1.5) similar to the one reported by Wang et al. (2002) (see above),
they did not observe a Gd5Si2Ge2-type phase in the Gd5SnxSi4�x system.
Instead, the Pu5Rh4-type structure with slightly elongated interslab TdT
bonds (dT–T¼3.04 A) was obtained for the Gd5Sn2Si2 alloy. According to
Mozharivskyj et al. (2006) a further increase in the Sn concentration results
in the formation of alloys with the Ti5Ga4 structure, a filled version of the
Mn5Si3 type. The composition of these alloys is not a 5:4 stoichiometry due
to a partial occupation of Si in the 2a site of the Ti5Ga4 structure (i.e.,
Gd5Si0.7Sn3). Ti5Ga4 is not a layered (slab) structure, yet it is interesting to
note that a further increase in Sn concentration leads to the binary Gd5Sn4,
which has a layered Sm5Ge4-type structure again. Apparently, more detailed
studies are needed on the Sn-rich side of the Gd5SnxSi4�x diagram. However,
as noted by many authors in the past, the Sn-rich alloys are quite air sensitive,
which complicates further research of bulk samples.
Similarly to the Gd5SixGe4�x system, the Curie temperature of
Gd5SnxSi4�x alloys gradually decreases with x(Sn) for the O(I) structure, but
the alloys with M and O(II) crystal structures reported by Wang et al.
(2002) show the opposite trend (a slow increase of TC with Sn addition),
which is remarkably different from the Gd5SixGe4�x alloys.119Sn Mossbauer
10. Wang et al. (2002) assigns Sm5Ge4-type structure for the Gd5Si4-based solid solution.
Chapter 262 R5T4 Compounds 423

spectroscopy shows large transferred hyperfine fields (�370 kOe) at the Sn
sites. In addition, a first-order magnetostructural transformation was reported
for the alloys with Sm5Ge4-type structure, including binary Gd5Sn4. The pres-
ence of a structural transformation was confirmed by temperature-dependent
X-ray synchrotron diffraction studies for the Gd5Si0.4Sn3.6 alloy, as well as
for the binary Gd5Sn4 (Wang et al., 2004). At TC, the re-forming of the inter-
slab Sn–Sn occurs resulting in a structural change from the O(II) Sm5Ge4 type
into the low-temperature O(I) Gd5Si4 type.
A magnetocaloric effect has been measured for the Gd5Si2Sn2 compound
by Campoy et al. (2004). The study points on the difficulties in preparing
single-phase material; the annealing lowers the Curie temperature from 230
(as-cast alloy) to 210 K (1400 �C/20 hþ1000 �C/5 d). The observed maxi-
mum entropy change for DH¼50 kOe is moderate, �4.2 J/Kg K. The crystal
structure and magnetocaloric properties of Gd5SnxSi4�x alloys with x¼1.2,
1.4, and 1.6 were reported by Zhang et al. (2006). In agreement with Wang
et al. (2002), the sample with x¼1.2 was single-phase alloy with the Gd5Si4-
type structure, while two other samples were two-phase alloys containing both
Gd5Si4 and Gd5Si2Ge2 structures. The Curie temperature decreases from 302
for x¼1.2 to 276 K for x¼1.6, while the maximum magnetic entropy change
for a field change of 1.8 T is the largest for x¼1.4, DSM¼�2.3 J/Kg K. The
moderate to low values of MCE are in agreement with the X-ray diffraction
analysis performed by Zhang et al. (2006), which did not observe any crystal-
lographic transition in the studied samples.
It is worth to add, that when Sn replaces Si in the Gd5Ge2(Si1�xSnx)2 com-
pound, the crystal structure remains monoclinic for x¼0.23 but changes to
O(II) for x¼0.40 (Campoy et al., 2007). Two nonequivalent hyperfine sites
for the Sn atoms were observed by using 119Sn Mossbauer spectroscopy.
According to the magnetization measurements both samples order ferromagne-
tically, x¼0.23 at 218 K, and x¼0.4 at 172 K. The measured magnetocaloric
effect is larger in the sample with the O(II) room temperature crystal structure
than for the sample with the monoclinic crystal structure: the maximum DSM is
�33 versus �23 J/Kg K, respectively (DH¼50 kOe). The X-ray powder dif-
fraction data collected at 100 K show a Gd5Si4-type structure for both samples
indicating that the crystallographic transformation occurs at TC (Campoy et al.,
2010). 155Gd Mossbauer spectra obtained at 4.2 K can be numerically resolved
as two quadrupolar patterns with relative area ratios 87:13 for x¼0.23, and
79:21 for x¼0.40, which approximately corresponds to the nonequivalent dis-
tribution of Gd atoms between two interslab 8d and single intraslab 4c sites
(80:20) of the Gd5Si4-type structure (Campoy et al., 2010).
6.2.2. Nd5SnxSi4�x
An investigation of the Nd5SnxSi4�x pseudobinary system shows that except for
the binary Nd5Si4 compound, which adopts the tetragonal Zr5Si4-type structure,
Handbook on the Physics and Chemistry of Rare Earths424

all other synthesized samples in this system (0<x�3.5) crystallize in the
Sm5Ge4-type crystal structure (Wang et al., 2003). Within the orthorhombic
Nd5SnxSi4�x solid solution the lattice parameters and unit cell volume increase
linearly with x(Sn) while TC gradually decreases from �120 K for x¼0.5 to
�33 K for x¼4. The saturation magnetic moment measured at 5 K also
decreases with x(Sn) from �1.6 mB/Nd for x¼3.5 to �0.8 mB/Nd for x¼0.5
and both values are well below the gJ¼3.27 mB value expected for the Nd3þ
ion. The samples with x¼1.5 and 4 were reported to have metamagnetic-like
jumps in their M(H) curves. Mossbauer spectroscopy, however, shows no indi-
cation of a first-order transition in Nd5SnxSi4�x triggered by either the applied
magnetic field or temperature. The transferred hyperfine fields in the
Nd5SnxSi4�x measured at 9 K are in the range of 100–160 kOe, much smaller
compared with the �370 kOe of Gd5SnxSi4�x (Wang et al., 2003).
6.3. R5SnxGe4�x
Only limited information is available for the R5SnxGe4�x systems. Guloy and
Corbett (2005) synthesized the La5Ge3Sn compound, and determined that its
crystal structure belongs to the Sm5Ge4 type with lattice parameters
a¼8.156(1) A, b¼15.630(2) A, and c¼8.292(1) A.
Qian et al. (2009) reported that the Gd5Ge3Sn compound crystallizes in the
Sm5Ge4 type of crystal structure. A microstructural investigation revealed a
large number of linear features in the Gd5Ge3Sn alloy.
7. R5T4 SYSTEMS WHERE T INCLUDES A GROUP 13 OR 15ELEMENT
The Eu5As4 compound is one of the few R5T4 compounds where T sites are
completely occupied by a group 15 element (Wang et al., 1978). Its crystal
structure is closely related to Sm5Ge4 and other structure types containing
-GSCSG- slabs (see Section 2), and its ternary variant, Tm5Sb2Si2-type struc-
ture, is commonly observed in ternary R5T4 compounds containing Sb
(Kozlov et al., 2004). The high-temperature b-Yb5Sb4 phase, whose crystal
structure may represent a supercell (a¼8.13 A, b¼15.97 A, c¼24.39 A) to
the Sm5Ge4-type structure (Bodnar and Steinfink, 1967) is another example
of the R5T4 phase with a slab-based structure11 that does not contain any of
the group 14 elements (Si, Ge, Sn, or Pb). However, in most cases the slab-
based structures containing group 13 or group 15 elements form in ternary
alloys such as pseudobinary R5T14
1�xT13
x or R5T14
1�xT15
x since binary
R5T134 , R5T
154 compounds do not exist with trivalent lanthanides.
Such pseudobinary systems have been mainly studied with Ga and Sb. The
investigations of ternary alloys with other group 13 or group 15 elements is
11. The actual crystal structure of the b-Yb5Sb4 phase has not been reported.
Chapter 262 R5T4 Compounds 425

limited, either because of concerns about their safe handling (i.e., T¼As) or
because such alloys do not readily form slab structures (i.e., T¼ In). However,
they are interesting systems to explore because their substitution enables grad-
ual variation of the valence electron concentration and thus the effect of VEC
on the crystal structure and properties can be determined. The Gd5GaxGe4�x
system was, in fact, the model system in which the dependence of the crystal
structure (more specifically, formation of the interslab TdT bonds) has been
explained using the Zintl–Klemm formalism (Mozharivskyj et al., 2003).
7.1. Substitutions by Ga
The investigations of the R5(GaxT1�x)4 pseudobinary systems are basically
limited to the system with R¼Gd (see below). In addition, Guloy and Corbett
(2005) synthesized the La5Ge3Ga alloy, and the crystal structure determina-
tion showed that it adopts the Gd5Si4-type structure (in accord with the
decrease in VEC) with lattice parameters a¼7.910(1) A, b¼15.294(2) A,
and c¼8.252(1) A.
7.1.1. Gd5GaxGe4�x
The initial crystallographic study of the Gd5GaxGe4�x system (0�x�3)
showed that the increase in Ga concentration leads to strongerinterslab T–T
dimers, resulting in the gradual transition from the Sm5Ge4 type, adopted by
the gadolinium germanide, to the Pu5Rh4-type crystal structure, and, finally
to the formation of the Gd5Si4-type structure (Mozharivskyj et al., 2003).
The Gd5Ge4-based solid solution extends to x¼0.6 and a two-phase region
(Sm5Ge4þPu5Rh4) occurs for 0.7�x�0.9. The single Pu5Rh4-type phase
was observed in a Gd5GaGe3 sample, and for the 1.2�x�2.2 region there
is a solid solution with the Gd5Si4-type structure. However, Mozharivskyj
et al. (2003) argue that the precise value for Ga concentration where Pu5Rh4transforms into Gd5Si4 cannot be defined, and such transition is continuous.
At higher concentrations of Ga, the Gd5(GaxGe1�x)4 phase decomposes into
a mixture of Gd3(GaxGe1�x)2 and Gd(GaxGe1�x) phases.
The continuous transition from the Pu5Rh4 structure to the Gd5Si4 struc-
ture is manifested by a smooth compositional dependence of the lattice para-
meters above x¼0.9, and therefore the only indication of this structural
change is the shortening of the TdT interslab bonds. However, a step-like
change in lattice parameters is observed above x¼0.6. The a-parameter
contracts accommodating the formation of the interslab TdT bonds, while
the c-parameter increases, and a slight gradual expansion is observed along
the b-axis.Since the sizes (metallic radii) of the Ga (1.411 A) and Ge (1.369 A)
atoms are similar, the observed structural evolution may be controlled by a
change in the valence electron concentration. Specifically, when the VEC
Handbook on the Physics and Chemistry of Rare Earths426

value (calculated using the Zintl–Klemm formalism) is between 31 and
30.4 e�/formula, the Sm5Ge4-type structure is stable, but further decrease in
VEC promotes the formation of the interslab T–T dimers, and for VEC values
between 28.8 and 30, the Pu5Rh4 and Gd5Si4 type structures are observed
(Mozharivskyj et al., 2003). TB-LMTO calculations show lower population
of the TdT antibonding states when Ga substitutes Ge.
Temperature-dependent crystallographic, magnetic, and heat capacity
behaviors of Gd5Ga0.7Ge3.3 and Gd5GaGe3 compounds have been studied
by Misra et al. (2009b). Both X-ray powder and X-ray single crystal
diffraction properties were employed for the identification of structural phase
transitions. The Gd5Ga0.7Ge3.3 compound shows a unique sequence of crystal-
lographic transformations: at first, its room temperature O(II) Sm5Ge4-type
crystal structure changes to the monoclinic M Gd5Si2Ge2-type at 165 K,
which exists in the narrow range of temperatures 150<T<165 K. Below
150 K the O(I) Gd5Si4-type structure occurs. While it is common to have an
O(II)–O(I) transition in the R5T4 alloys, the presence of the intermediate mono-
clinic phase so far has been reported only for the Gd5Ga0.7Ge3.3 alloy. How-
ever, it is worth to note that the monoclinic phase was observed in a tiny
(�102 mm) single crystal. Magnetization and heat capacity measurements per-
formed on a bulk sample show a second-order magnetic ordering transition at
�195 K, while the sequence of structural transformations observed in the small
Gd5Ga0.7Ge3.3 single-crystal is hardly noticeable in bulk measurements, except
for a change of slope of M(T) curve around 165 K. Misra et al. (2009b) suggest
that the contraction of the interslab TdT bonds in Gd5Ga0.7Ge3.3 occurs grad-
ually, contrary to what was observed in R5SixGe4�x alloys where structural
change is always sharp; therefore, no clear first-order phase transition can be
observed. The maximum magnetocaloric effect for Gd5Ga0.7Ge3.3 is
DSM¼�14 J/Kg K at �170 K for DH¼50 kOe. The heat capacity peak at
the magnetic ordering transition of Gd5GaGe3 at TC¼190 K is, however, more
typical for a first-order transition and does not become smeared with the appli-
cation of magnetic field, although it is broad even in zero field. The Gd5GaGe3alloy appears to exhibit a structural transition at 523 K from the room tempera-
ture Pu5Rh4 type (interslab dT�T¼2.837 A) to the high-temperature Gd5Si4type (interslab dT�T¼2.521 A).
The Gd5Ge3.8Ga0.2 alloy with the O(II) Sm5Ge4 type of crystal structure
was characterized by magnetic and electrical transport measurements
(Bhattacharyya et al., 2009) and showed magnetic metastability and training
effects similar to the parent Gd5Ge4 compound. However, such a small substi-
tution of Ge by Ga already promotes the temperature-induced transition into
the FM-O(I) state without applied magnetic field, indicating that the VEC
influence may reflect upon the low-temperature properties even when it is
not affecting the room temperature crystal structure.
SEM examination of the Gd5GaGe3 compound by Qian et al. (2009)
revealed the presence of the 5:3 thin plates, which are commonly observed
Chapter 262 R5T4 Compounds 427
in the R5(Si,Ge)4 samples. Therefore, a decrease in VEC does not have effect
on the thin plate formation.
7.1.2. Gd5GaxSi4�x
Characterization of structural and magnetic properties of Gd5GaxSi4�x alloys
showed that the Gd5Si4-based solid solution exists up to x(Ga)�1 (Wang
et al., 2010). Above this concentration, the Gd5Si4-type structure can be
observed in the multiphase Gd5Ga1.5Si2.5 alloy, but not in the annealed
Gd5Ga2Si2. No other R5T4 layered structure types were observed in this pseu-
dobinary system. The Ga atoms preferentially occupy the interslab T sites of
the Gd5Si4-type structure. Temperature dependences of the dc magnetization
were measured for Gd5Ga0.63Si3.37 and Gd5Ga0.81Si3.19 compounds. The for-
mer compound has TC¼310 K and the latter has TC¼286 K. The yp values
obtained via the Curie–Wess fits (308 and 283 K, respectively) agree well
with the magnetic ordering temperatures (Wang et al., 2010).
7.2. Substitutions by Sb
Except for the Yb5Sb4 binary compound (Bodnar and Steinfink, 1967), the
R5T4 alloys containing antimony usually adopt the layered crystal structure
in ternary alloys in which only some of the tetralide atoms are substituted
by Sb. Alternatively, ternary R5(Sb,T)4 compounds with slab-based structures
may form when Ga is used instead of Ge or Si. This was observed for
the Ho5GaSb3 compound, which crystallizes in the Sm5Ge4-type structure
with the lattice parameters a¼7.9667(8) A, b¼15.128(2) A, c¼7.9616(8) A
(Antonyshyn et al., 2009). Such cases may not be rare in nature but they are
not well studied at this point.
According to the Zintl–Klemm formalism, antimony brings five electrons
to the formula unit, so its substitution into the alloys is not expected to result
in the formation of the interslab TdT bonds. In fact, ternary R5SbxSi4�x and
R5SbxGe4�x alloys with high concentrations of x(Sb) crystallize in the
Tm5Si2Sb2-type crystal structure (Kozlov et al., 2004), which is an ordered
superstructure variant of the Eu5As4 type (Wang et al., 1978). This crystal
structure is formed by the stacking of the same -GSCSG- slabs as other lay-ered structures (see Section 2) but is more symmetrical and characterized by
the complete absence of inteslab TdT bonds. Moreover, even when
Gd5Sb0.5Ge3.5 with the O(II) Sm5Ge4 room temperature crystal structure
undergoes a magnetostructural transition at TC¼40 K with a substantial vol-
ume change (�0.5%), the formation of interslab T–T dimers does not occur
and this compound remains in a slightly modified version of the Sm5Ge4-type
crystal structure (Chernyshov et al., 2009).
Kozlov et al. (2004) reported the discovery of 11 isostructural ternary com-
pounds with R5Sb2T2 stoichiometry (T¼Si, Ge) adopting the Tm5Sb2Si2-type
Handbook on the Physics and Chemistry of Rare Earths428

crystal structure: compounds for R¼Y, Dy–Tm were observed with both Si
and Ge, while a terbium compound was reported with Si only. The alloys were
heat treated at 670 K for 2 weeks. No ternary phase containing Gd was found in
this study. The investigation of the Y–Sb–Si system (the alloys were annealed
at 670 K for 30 days) did not indicate any extended homogeneity region for
the Y5Sb2Si2 compound (Kozlov and Pavlyuk, 2004).
7.2.1. Gd5SbxGe4�x
Using high-purity Gd metal Chernyshov et al. (2006) observed the ternary
phase with the Tm5Sb2Si2-type structure in the Gd5SbxGe4�x system, and
showed that it exists in the extended range of concentrations, approximately
from x¼2 to x¼2.7. Moreover, the study observed that a Gd5Ge4-based solid
solution with the Sm5Ge4-type crystal structure occurs when Sb substitutes Ge
at least up to x¼1. Interestingly, the alloys with higher Sb concentration and
Tm5Sb2Si2-type crystal structure order magnetically at much higher tempera-
tures than alloys with the O(II) room temperature crystal structure: TC for
Gd5Sb2.1Ge1.9 is 200 K while TC for Gd5SbGe3 is 37 K only. At the same
time, the Gd5Sb2.1Ge1.9 alloy orders via a second-order transition, while the
transitions observed in alloys with x¼0.7 and 1 are typical first-order
ones. A characteristic increase of the transition temperature with application
of a magnetic field is clearly seen in magnetic, electrical resistivity, and
heat capacity measurements of the Gd5Sb0.7Sb3.3 polycrystalline alloy
(Chernyshov et al., 2006).
The first-order transition occurring in the Gd5SbxGe4�x alloys with x�1,
has been studied in detail using temperature- and magnetic-field-dependent
X-ray powder diffraction as well as by means of ac magnetic susceptibility,
magnetization, and heat capacity measurements of a Gd5Sb0.5Ge3.5 oriented
single crystal; the experimental results were complemented by first-principles
calculations (Chernyshov et al., 2009). The study reports a strong coupling of
the magnetic and crystallographic lattices along all three major crystallo-
graphic directions. The a-axis appears to be the easy magnetization direction,
but the overall magnetic anisotropy in this compound is weak. Sharp meta-
magnetic transitions are seen in the M(H) data measured at temperatures just
above TC (40 K), and it is worth noting that both thermal and magnetic hyster-
eses associated with this compound are small. Another, weaker transition is
observed in the heat capacity data at 63 K; however, this transition is not seen
in either magnetization or ac susceptibility data indicating that its origin is
nonmagnetic. Since the temperature of the main first-order transition
increases in magnetic field, and the temperature of the weaker second-order
transition is field independent, the crossover occurs in magnetic fields above
20 kOe and only the stronger transition is seen in Cp(T) data collected in
50, 75, and 100 kOe applied magnetic fields.
Chapter 262 R5T4 Compounds 429

While the first-order transition in Gd5Sb0.5Ge3.5 appears to be similar to
the magnetostructural transitions observed in other R5T4 alloys, for example
in Gd5Si2Ge2, there is one important difference. Despite a large volume
change at the transition (DV/V¼�0.47%) and an intimate coupling of mag-
netic and crystallographic lattices, Gd5Sb0.5Ge3.5 maintains the same O(II)
Sm5Ge4-type crystal structure below and above TC. No formation of interslab
TdT bonding and no shear movement of the slabs occur during the transition.
Instead, an almost uniform slab contraction within the ac-plane is detected
as shown in Fig. 45. First-principles calculations confirm that in the
Sb-substituted alloys the Sm5Ge4-type structure can support the ferromagnetic
ground state (Chernyshov et al., 2009).
Interestingly, SEM examination did not detect the 5:3 thin plates in the
Gd5Sb0.7Ge3.3 alloy, even though they are commonly present in other R5T4
alloys (including Ga substituted), and the fact that Gd5Sb3 is a stable phase
in the Gd–Sb system (Qian et al., 2009).
7.2.2. Gd5SbxSi4�x
The phase relationships and magnetic properties of alloys in the Gd5SbxSi4�x
pseudobinary system in the range of antimony concentrations up to x¼3.5
FIGURE 45 Temperature dependencies of the lattice parameters and unit cell volume of
Gd5Sb0.5Ge3.5 in 0, 20, and 40 kOe applied magnetic fields. Zero magnetic field data are shown
for both heating and cooling (Chernyshov et al., 2009).
Handbook on the Physics and Chemistry of Rare Earths430

have been reported by Svitlyk et al. (2010). With the increase in x(Sb) thecrystal structure of the alloys transforms from the Gd5Si4 type (x�0.38) to
the Sm5Ge4 type (1.21�x�1.79), and, finally to the Eu5As4 type of crystal
structure (2.27�x�3.1). Above x¼3.1 the ternary Gd5SbxSi4�x solid solu-
tion decomposes. There is a clear preference for the larger Sb atoms to occupy
the interslab T site while smaller Si atoms are located inside the slabs. All
Gd5SbxSi4�x alloys order ferromagnetically. The Curie temperature first drops
when the crystal structure changes from Gd5Si4 to Sm5Ge4 type, but after that
it increases with the increase in Sb concentration, reaching room temperature
(TC¼295 K) for the Gd5SiSb3 sample. All magnetic phase transitions appear
to be of second order. Interestingly, the alloys with the Eu5As4-type crystal
structure show large values of the effective paramagnetic moment per Gd
atom, 8.45 and 8.71 for x¼2.5 and 3, respectively.
7.3. Other Elements (Bi, P, and Pb)
Since it is hard to cover all possible combinations of T elements that may lead
to the formation of the slab-based structures, only the studied pseudobinary
systems are described below.
7.3.1. Gd5BixSi4�x
Because Si and Bi have much different metallic sizes (1.319 and 1.70 A,
respectively) and different number of valence electrons, extended solid solu-
tions are not expected in this pseudobinary system. According to Svitlyk
et al. (2009a), the upper limit of Bi substitution into the Gd5Si4-based solid
solution is x¼0.096(8). Further increase in Bi content results in a variety of
layered crystal structures with different accommodations of -GSCSG- slabs.The Gd5Si2.42Bi1.58 sample adopts the Eu5As4-type structure, while two other
compositions reported by Svitlyk et al. (2009a), Gd5Si1.93Bi2.07 and
Gd5Si1.58Bi2.42 adopt their own tetragonal structure types (see Section 2).
7.3.2. Gd5PxSi4�x
Phase transformations in the Gd5Si4�xPx system were investigated in order to
explore the effect of increasing valence electron concentration on the crystal-
lographic behavior of the R5T4 alloys (Svitlyk et al., 2009b). The atomic
(metallic) radii of P (1.28 A) is smaller than that of Si (1.319 A) but since the
increase of VEC is known to prevent the occurrence of the interslab T–T dimers
(i.e., in Gd5Sb0.5Ge3.5) the increased concentration of phosphorous causes the
formation of the high-volume O(II) Sm5Ge4-type structure in this system. In
fact, the Gd5Si4-based solid solution exists over a limited range of concentra-
tions, for x�0.25. A small homogeneity region for alloys adopting the
Sm5Ge4-type structure was found for 1.0<x<1.25. The two-phase region con-
taining both O(I) and O(II) structures exists between x¼0.25 and x¼1, and
Chapter 262 R5T4 Compounds 431

above x¼1.25 and up to x¼2, a mixture of O(II)-type Gd5Si4�xPx phase and
GdP was observed. Because the O(II) phase is a high-volume phase, the unit cell
volume of the Gd5Si2.75P1.25 sample (V¼856.0(4)A3) is larger than the unit cell
volume of the binary Gd5Si4 compound (V¼853.74(8)A3). The Gd5Si2.75P1.25phase orders magnetically at TC¼184 K (Svitlyk and Mozharivskyj, 2009).
The phase transition appears to be of second order and MCE is moderate: maxi-
mum DSM¼�7.8 J/Kg K for DH¼50 kOe.
7.3.3. La5PbxGe4�x
Guloy and Corbett (2005) have prepared La5Pb4 and La5Ge3Pb and showed
that they have the Sm5Ge4-type structure. The same study also reports the
crystal structure of the La5Ge3In compound, which due to the decrease in
VEC crystallizes in the Gd5Si4 type.
8. CONCLUSIONS AND OUTLOOK
As one can conclude from reading this book chapter, the fundamental science
of R5T4 compounds is alive; interesting and important chemical and physical
phenomena are abundant. Some of the effects are well studied and may soon
be developed for technological applications (e.g., giant magnetocaloric effect,
colossal magnetostriction, and giant magnetoresistance) while the exploration
of others (e.g., magnetic deflagration, spontaneous generation of voltage, and
role of microstructure in controlling magnetostructural transformations) has
just begun. It is fair to say that at this point we already have a substantial
understanding of the composition–structure–property relationships of layered
R5T4 systems, and in many cases one can predict the occurrence of interesting
physical effects based on the knowledge of the alloy’s composition and crys-
tal structure. In addition, the appearance of a certain physical phenomenon
may serve as a reliable projection for the occurrence (or absence) of several
others. For example, the presence of GMCE in any of the Gd5SixGe4�x alloys,
regardless of composition, is a solid indicator that colossal magnetostriction
and giant magnetoresistance also exist near TC. Multifunctionality is what
makes these alloys special and warrants further exploration of effects asso-
ciated with the magnetostructural transitions. The exceptional compositional
and structural diversity of the layered R5T4 systems coupled with a unique
contribution that every rare earth element brings to the fascinating behavior
of this family of intermetallic compounds holds a promise for future discov-
eries of novel physical effects.
Continuing investigations of these materials are important for transforma-
tive advances in energy related materials science and this is true not only
because of their potential applications in energy conversion systems of the
future. In fact, the intrinsic brittleness of alloys, hysteresis effects, and chemi-
cal reactivity of powders are well-known problems that may be limiting the
Handbook on the Physics and Chemistry of Rare Earths432
widespread application of R5T4-based materials. However, better understand-
ing of the behaviors of these systems should lead to a better control over other
materials systems that exhibit structural phase transformations coupled with
spin ordering–disordering effects. For example, the realization that the pres-
ence of the magnetostructural first-order phase transition is a necessary
requirement for the occurrence of GMCE in Gd5Si2Ge2 had already triggered
rapid development of other intermetallic systems where the coupling of mag-
netic and structural transformations results in a highly desired strong magne-
tocaloric effect. LaFe13�xSix-based materials (Shen et al., 2009), transition
metal pnictides (Tegus et al., 2002b), and Ni–Mn–Sn Heusler alloys (Krenke
et al., 2005) are a few well-known examples.
The avenues for the fundamental investigations of R5T4 systems are open
in many directions. The complexity of the crystal structure provides numerous
opportunities for the manipulation of the extraordinary behaviors of these
compounds. Rapid development of density functional theory and first-
principles calculation methods adds an element of control and even prediction
to the experimental research and a significant progress in uncovering basic
science of R5T4 materials is expected to come from the area of first-principles
calculation in the near future. Much can be learned from both novel and tra-
ditional experimental techniques such as spectroscopy and neutron diffraction;
a successful preparation of thin films may increase the technological value of
these compounds tremendously.
We believe that some of the information presented in this book chapter
will be refined in coming years, which is a good sign indeed, and much will
be added to their interesting physics and chemistry. Over the past two decades
knowledge gained during the studies of these systems provided a valuable
addition to the rich and exciting science of rare earths—yet the story of the
layered R5T4 systems is far from being complete.
ABBREVIATIONS
AFM antiferromagnetic
ASA atomic sphere approximation
B magnetic induction
C heat capacity
CEF crystalline electric field
d interatomic distance
DOS density of states
DSC differential scanning calorimetry
EDS energy dispersive spectroscopy
EELS electron energy loss spectroscopy
ESR electron spin resonance
FC in-field cooling
FM ferromagnetic
Chapter 262 R5T4 Compounds 433

FP-LAPW full-potential linear-augmented-plane-wave
GGA generalized gradient approximation
gJ Lande factor
GMCE giant magnetocaloric effect
GMR giant magnetoresistance
GMS giant magnetostriction
H magnetic field strength
HCR critical magnetic field
HRTEM high-resolution transmission electron microscopy
J total electronic angular momentum
K magnetic anisotropy coefficient
L orbital electronic angular momentum
LSDA local spin density approximation
LTE linear thermal expansion
M magnetization
MCE magnetocaloric effect
MFM magnetic force microscopy
MR magnetoresistance
MST magnetostructural transition
P pressure
PECVD plasma-enhanced chemical vapor deposition
peff effective magnetic moment
PM paramagnetic
ppm parts per million
RCP relative cooling power
RD reflectance difference (spectra)
RKKY Ruderman–Kittel–Kasuya–Yosida
S spin angular momentum, entropy
SAD selected area diffraction
SANS small angle neutron scattering
SEM scanning electron microscopy
SG space group
SGV spontaneous generation of voltage
SRC short-range correlations (magnetic)
T temperature
TB-LMTO tight-binding linear-muffin-tin-orbital
TC Curie temperature
TEM transmission electron microscopy
TG Griffiths temperature
TN Neel temperature
UPS ultraviolet photoemission spectroscopy
V unit cell volume
VEC valence electron concentration
VSM vibrating sample magnetometry
Handbook on the Physics and Chemistry of Rare Earths434

WSV Wigner–Seitz volume
XMCD X-ray magnetic circular dichroism
XPS X-ray photoemission spectroscopy
XRD X-ray diffraction
Z number of formula units per unit cell
ZFC zero-field cooled heating
DSM magnetic entropy change
DTad adiabatic temperature change
k thermal diffusivity
mB Bohr magneton
ms saturation magnetic moment
uD Debye temperature
up paramagnetic Curie–Weiss temperature
r electrical resistivity
v volume magnetostriction
REFERENCES
Aghababyan, E.V., Harutyunyan, N.P., 2009. J. Contemp. Phys. (Armenian Acad. Sci.) 44, 197.
Aghababyan, E.V., Harutyunyan, N.P., 2012. J. Contemp. Phys. (Armenian Acad. Sci.) 47, 142.
Ahmad, S.N., Shaheen, S.A., 2009. J. Appl. Phys. 106, 064701.
Ahmad, S.N., Akin, Y., Shaheen, S.A., 2005. J. Appl. Phys. 97, 10Q902.
Ahn, K., Tsokol, A.O., Mozharivskyj, Yu., Gschneidner Jr., K.A., Pecharsky, V.K., 2005. Phys.
Rev. B 72, 054404.
Ahn, K., Pecharsky, V.K., Gschneidner Jr., K.A., 2007. Phys. Rev. B 76, 014415.
Aksoy, S., Yucel, A., Elerman, Y., Krenke, T., Acet, M., Moya, X., Manosa, L., 2008. J. Alloys
Compd. 460, 94.
Al-Shahery, G.Y.M., McColm, I.J., 1984. J. Less-Common Met. 98, L5.
Altounian, Z., Liu, X.B., 2007. J. Appl. Phys. 101, 09D507.
Alves, C.S., Gama, S., Coelho, A.A., Plaza, E.J.R., Calvalho, A.M.G., Cardoso, L.P.,
Persiano, A.C., 2004. Mater. Res. 7, 535.
Antonyshyn, I., Zhak, O., Oryshchyn, S., Babizhetsky, V., Hoch, C., Aksel’rud, L., 2009. Z. Nat-
urforsch. 64b, 909.
Araujo, J.P., Pereira, A.M., Braga, M.E., Pinto, R.P., Teixeira, J.M., Correia, F.C., Sousa, J.B.,
Morellon, L., Algarabel, P.A., Magen, C., Ibarra, M.R., 2005. J. Phys. Condens. Matter 17,
4941.
Arnold, Z., Skorokhod, Y., Kamarad, J., Magen, C., Algarabel, P.A., 2009a. J. Appl. Phys. 105,
07A934.
Arnold, Z., Magen, C., Morellon, L., Algarabel, P.A., Kamarad, J., Ibarra, M.R., Pecharsky, V.K.,
Gschneidner Jr., K.A., 2009b. Phys. Rev. B 79, 144430.
Basso, V., LoBue, M., Sasso, C.P., Bertotti, G., 2006. J. Appl. Phys. 99, 08K907.
Belo, J.H., Pereira, A.M., Ventura, J., Oliveira, G.N.P., Araujo, J.P., Tavares, P.B., Fernandes, L.,
Algarabel, P.A., Magen, C., Morellon, L., Ibarra, M.R., 2012a. J. Alloys Compd. 529, 89.
Belo, J.H., Pereira, A.M., Belo, J.H., Pereira, A.M., de la Cruz, C., dos Santos, A.M.,
Goncalves, J.N., Amaral, V.S., Morellon, L., Ibarra, M.R., Algarabel, P.A., Magen, C.,
2012b. Phys. Rev. B 86, 014403.
Chapter 262 R5T4 Compounds 435

Bhattacharyya, A., Giri, S., Majumdar, S., 2009. J. Phys. Condens. Matter 21, 336007.
Bodnar, R.E., Steinfink, H., 1967. Inorg. Chem. 6, 327.
Bondino, F., Brinkman, A., Zangrando, M., Carbone, F., van der Marel, D., Schlagel, D.L.,
Lograsso, T.A., Gschneidner Jr., K.A., Pecharsky, V.K., Parmigiani, F., 2007. J. Phys.
Condens. Matter 19, 186219.
Borzone, G., Borsese, A., Ferro, R., 1982. J. Less-Common Met. 85, 195.
Boulet, P., Weitzer, F., Hiebl, K., Noel, H., 2001. J. Alloys Compd. 315, 75.
Bulanova, M.V., Eremenko, V.N., Petjukh, V.M., Sidorko, V.R., 1998. J. Phase Equil. 19, 136.
Bulanova, M.V., Zheltov, P.N., Meleshevich, K.A., Saltykov, P.A., Effenberg, G., 2002. J. Alloys
Compd. 345, 110.
Button, T.W., McColm, I.J., Ward, J.M., 1990. J. Less-Common Met. 159, 205.
Cadogan, J.M., Ryan, D.H., Altounian, Z., Wang, H.B., Swainson, I.P., 2002. J. Phys. Condens.
Matter 14, 7191.
Cadogan, J.M., Ryan, D.H., Altounian, Z., Liu, X., Swainson, I.P., 2004. J. Appl. Phys. 95, 7076.
Campoy, J.C.P., Plaza, E.J.R., Carvalho, A.M.G., Coelho, A.A., Gama, S., von Ranke, P.J., 2004.
J. Magn. Magn. Mater. 272–276, 2375.
Campoy, J.C.P., Plaza, E.J.R., Nascimento, F.C., Coelho, A.A., Pereira, M.C., Fabris, J.D.,
Raposo, M.T., Cardoso, L.P., Persiano, A.I.C., Gama, S., 2007. J. Magn. Magn. Mater.
316, 368.
Campoy, J.C.P., dos Santos, A.O., Cardoso, L.P., Paesano Jr., A., Raposo, M.T., Fabris, J.D.,
2010. Hyperfine Inter. 195, 191.
Canepa, F., Cirafici, S., Napoletano, M., Cimberle, M.R., Tagliafico, L., Scarpa, F., 2008. J. Phys.
D: Appl. Phys. 41, 155004.
Cao, Q., Chumbley, L.S., Qian, Z., 2010. Intermetallics 18, 1021.
Cao, Q., Chumbley, L.S., Mudryk, Y., Zou, M., Pecharsky, V.K., Gschneidner Jr., K.A., 2013.
J. Alloys Compd. 556, 127.
Carvalho, A.M.G., Alves, C.S., de Campos, A., Coelho, A.A., Gama, S., Gandra, F.C.G.,
von Ranke, P.J., Oliveira, N.A., 2005. J. Appl. Phys. 97, 10M320.
Carvalho, A.M.G., Alves, C.S., Colucci, C.C., Bolanho, M.A., Coelho, A.A., Gama, S.,
Nascimento, F.C., Cardoso, L.P., 2007. J. Alloys Compd. 432, 11.
Carvalho, A.M.G., Coelho, A.A., Gama, S., von Ranke, P.J., Alves, C.S., 2008. J. Appl. Phys.
104, 063915.
Casanova, F., Batlle, X., Labarta, A., Marcos, J., Manosa, L., Planes, A., 2002a. Phys. Rev. B 66,
212402.
Casanova, F., Batlle, X., Labarta, A., Marcos, J., Manosa, L., Planes, A., 2002b. Phys. Rev. B 66,
100401(R).
Casanova, F., Batlle, X., Labarta, A., Marcos, J., Manosa, L., Planes, A., 2003. J. Appl. Phys. 93,
8313.
Casanova, F., Labarta, A., Battle, X., Vives, E., Marcos, J., Manosa, L., Planes, A., 2004a. Eur.
Phys. J. B 40, 427.
Casanova, F., Labarta, A., Battle, X., Marcos, J., Manosa, L., Planes, A., de Brion, S., 2004b.
Phys. Rev. B 69, 104416.
Casanova, F., Labarta, A., Batlle, X., Perez-Reche, F.J., Vives, E., Manosa, L., Planes, A., 2005a.
Appl. Phys. Lett. 86, 262504.
Casanova, F., Lambarta, A., Batlle, X., 2005b. Phys. Rev. B 72, 172402.
Casanova, F., de Brion, S., Labarta, A., Batlle, X., 2005c. J. Phys. D: Appl. Phys. 38, 3343.
Cerny, R., Alami-Yadri, K., 2003. Acta Cryst. E59, i1.
Handbook on the Physics and Chemistry of Rare Earths436

Chattopadhyay, M.K., Manekar, M.A., Pecharsky, A.O., Pecharsky, V.K., Gschneidner Jr., K.A.,
Moore, J., Perkins, G.K., Bugoslavsky, Y.V., Roy, S.B., Chaddah, P., Cohen, L.F., 2004.
Phys. Rev. B 70, 214421.
Chattopadhyay, M.K., Roy, S.B., Morrison, K., Moore, J.D., Perkins, G.K., Cohen, L.F.,
Gschneidner Jr., K.A., Pecharsky, V.K., 2008. Eur. Phys. Lett. 83, 57006.
Chebotarev, N.T., Beznosikova, A.V., 1976. In: Blank, H., Lindner, R. (Eds.), Plutonium 1975
and Other Actinides. American Elsevier, New York, p. 115.
Chen, X., Chen, Y., Tang, Y., 2011. J. Alloys Compd. 509, 9604.
Chernyshov, A.S., Filippov, D.A., Ilyn, M.I., Levitin, R.Z., Pecharskaya, A.O., Pecharsky, V.K.,
Gschneidner Jr., K.A., Snegirev, V.V., Tishin, A.M., 2002. Phys. Met. Metallogr. 93, S19.
Chernyshov, A.S., Mudryk, Ya., Pecharsky, V.K., Gschneidner Jr., K.A., 2006. J. Appl. Phys. 99,
08Q102.
Chernyshov, A.S., Mudryk, Ya., Paudyal, D., Pecharsky, V.K., Gschneidner Jr., K.A.,
Schlagel, D.L., Lograsso, T.A., 2009. Phys. Rev. B 80, 184416.
Choe, W., Pecharsky, V.K., Pecharsky, A.O., Gschneidner Jr., K.A., Young, V.G., Miller, G.J.,
2000. Phys. Rev. Lett. 84, 4617.
Choe, W., Miller, G.J., Meyers, J., Chumbley, S., Pecharsky, A.O., 2003a. Chem. Mater. 15, 1413.
Choe, W., Pecharsky, A.O., Worle, M., Miller, G.J., 2003b. Inorg. Chem. 42, 8223.
Chumbley, L.S., Ugurlu, O., McCallum, R.W., Dennis, K.W., Mudryk, Y., Gschneidner Jr., K.A.,
Pecharsky, V.K., 2008. Acta Mater. 56, 527.
Correia, F.C., Araujo, J.P., Sousa, J.B., Braga, M.E., Morellon, L., Algarabel, P.A., Ibarra, M.R.,
2004. J. Magn. Magn. Mater. 272–276, 2370.
Cromer, D.T., 1977. Acta Cryst. B33, 1993.
Deng, J.Q., Zhuang, Y.H., Li, J.Q., Zhou, K.W., 2007. J. Alloys Compd. 428, 28.
Du, Z.W., Liu, A.S., Shao, B.L., Zhang, Z.Y., Zhang, X.S., Sun, Z.M., 2008. Mater. Char. 59, 1241.
Elbicki, J.M., Zhang, L.Y., Obermeyer, R.T., Wallace, W.E., Sankar, S.G., 1991. J. Appl. Phys.
69, 5571.
Eremenko, V.N., Meleshevich, K.A., Buyanov, Y.I., Martsenyuk, P.S., 1989. Sov. Powder Metall.
Met. Ceram. 28, 543.
Eremenko, V.N., Bulanova, M.V., Martsenjuk, P.S., 1992. J. Alloys Compd. 189, 229.
Eremenko, V.N., Listovnichii, V.E., Luzan, S.P., Buyanov, Yu.I., Martsenyuk, P.S., 1995.
J. Alloys Compd. 219, 181.
Fornasini, M.L., Merlo, F., 1971. Atti Accad. Naz. Lincei, Cl. Sci. Fis. Mat. Nat., Rend. 50, 186.
Fornasini, M.L., Palenzona, A., Pani, M., 2012. Intermetallics 31, 114.
Franco, V., Blazquez, J.S., Conde, A., 2006. Appl. Phys. Lett. 89, 222512.
Franco, V., Conde, A., Provenzano, V., Shull, R.D., 2010. J. Magn. Magn. Mater. 322, 218.
Franco, V., Blazquez, J.S., Ingale, B., Conde, A., 2012. Annu. Rev. Mater. Res. 42, 305.
Fu, H., Zhang, T., Chen, Y., Tu, M., 2005. J. Chin. Rare Earth Soc. 23, 409.
Fu, H., Zu, X.T., Shen, T.D., 2006. Therm. Acta 445, 53.
Fu, H., Zu, X.T., He, X., He, W.S., Shen, T.D., 2007. J. Alloys Compd. 431, 89.
Fujieda, S., Hasegawa, Y., Fujita, A., Fukamichi, K., 2004. J. Appl. Phys. 95, 2429.
Gama, S., Alves, C.S., Coelho, A.A., Ribeiro, C.A., Persiano, A.I.C., Silva, D., 2004. J. Magn.
Magn. Mater. 272–276, 848.
Garlea, V.O., Zarestky, J.L., Jones, C.Y., Lin, L.-L., Schlagel, D.L., Lograsso, T.A., Tsokol, A.O.,
Pecharsky, V.K., Gschneidner Jr., K.A., Stassis, C., 2005. Phys. Rev. B 72, 104431.
Giovanna do Couto, G., Svitlyk, V., Jafelicci Jr., M., Mozharivskyj, Y., 2011. Solid State
Sci. 13, 209.
Chapter 262 R5T4 Compounds 437
Givord, F., Lejay, P., Munoz, A., Schweizer, J., 1992. J. Magn. Magn. Mater. 116, 419.
Gomes, M.B., de Oliveira, N.A., 2008. J. Magn. Magn. Mater. 320, e153.
Gomes, M.B., de Oliveira, N.A., von Ranke, P.J., Troper, A., 2009. J. Magn. Magn. Mater.
321, 4006.
Griffiths, R.B., 1969. Phys. Rev. Lett. 23, 17.
Gschneidner Jr., K.A., Pecharsky, V.K., 1999. J. Appl. Phys. 85 (8), 5365.
Gschneidner Jr., K.A., Pecharsky, V.K., 2000a. Mater. Sci. Eng. A 287, 301.
Gschneidner Jr., K.A., Pecharsky, V.K., 2000b. Annu. Rev. Mater. Sci. 30, 387.
Gschneidner Jr., K.A., Pecharsky, V.K., Gailloux, M.J., Takeya, H., 1996. Adv. Cryog. Eng.
42, 465.
Gschneidner Jr., K.A., Pecharsky, V.K., Pecharsky, A.O., Zimm, C.B., 1999. Mater. Sci. Forum
315–317, 69.
Gschneidner Jr., K.A., Pecharsky, A.O., Pecharsky, V.K., Lograsso, T.A., Schlagel, D.L., 2000a.
In: Bautista, R.G., Mishra, B. (Eds.), Rare Earth and Actinides: Science, Technology and
Applications IV. TMS, Warrendale, PA, p. 63.
Gschneidner Jr., K.A., Pecharsky, V.K., Pecharsky, A.O., Ivtchenko, V.V., Levin, E.M., 2000b.
J. Alloys Compd. 303–304, 214.
Gschneidner Jr., K.A., Pecharsky, V.K., Tsokol, A.O., 2005. Rep. Prog. Phys. 68, 1479.
Gschneidner Jr., K.A., Mudryk, Y., Pecharsky, V.K., 2012. Scripta Mater. 67, 512.
Guimaraes, A.O., Soffner, M.E., Mansanares, A.M., Coelho, A.A., Carvalho, A.M.G.,
Pires, M.J.M., Gama, S., da Silva, E.C., 2009. Phys. Rev. B 80, 134406.
Guimaraes, A.O., Soffner, M.E., Mansanares, A.M., Coelho, A.A., Carvalho, A.M.G.,
Pires, M.J.M., Gama, S., da Silva, E.C., 2010. J. Appl. Phys. 107, 073524.
Guloy, A., Corbett, J.D., 2005. J. Solid State Chem. 178, 1112.
Guttfleisch, O., Willard, M.A., Bruck, E., Chen, C.H., Shankar, S.G., Liu, J.P., 2012. Adv. Mater.
23, 821.
Hadimani, R.L., Jiles, D.C., 2010. J. Appl. Phys. 107, 09C501.
Hadimani, R.L., Melikhov, Y., Snyder, J.E., Jiles, D.C., 2008a. J. Appl. Phys. 103, 033906.
Hadimani, R.L., Melikhov, Y., Snyder, J.E., Jiles, D.C., 2008b. J. Magn. Magn. Mater. 320, e696.
Hadimani, R.L., Melikhov, Y., Snyder, J.E., Jiles, D.C., 2009a. IEEE Trans. Magn. 45, 4368.
Hadimani, R.L., Melikhov, Y., Snyder, J.E., Jiles, D.C., 2009b. J. Appl. Phys. 105, 07A927.
Hadimani, R.L., Bartlett, P.A., Melikhov, Y., Snyder, J.E., Jiles, D.C., 2011. J. Magn. Magn.
Mater. 323, 532.
Han, M., Paulsen, J.A., Snyder, J.E., Jiles, D.C., Lograsso, T.A., Schlagel, D.L., 2002. IEEE
Trans. Magn. 38, 3252.
Han, M., Jiles, D.C., Lee, S.J., Snyder, J.E., Lograsso, T.A., Schlagel, D.L., 2003a. IEEE Trans.
Magn. 39, 3151.
Han, M., Jiles, D.C., Snyder, J.E., Lo, C.C.H., Leib, J.S., Paulsen, J.A., Pecharsky, A.O., 2003b.
J. Appl. Phys. 93, 8486.
Han, M., Jiles, D.C., Snyder, J.E., Lograsso, T.A., Schlagel, D.L., 2004. J. Appl. Phys. 95, 6945.
Hardy, V., Majumdar, S., Crowe, S.J., Lees, M.R., Paul, D.McK., Herve, L., Maignan, A.,
Hebert, S., Martin, C., Yaicle, C., Hervieu, M., Raveau, B., 2004. Phys. Rev. B 69,
020407(R).
Harmon, B.N., Antonov, V.N., 2002. J. Appl. Phys. 91, 9815.
Harmon, B.N., Antonov, V.N., 2003. J. Appl. Phys. 93, 4678.
Haskel, D., Lee, Y.B., Harmon, B.N., Islam, Z., Lang, J.C., Srajer, G., Mudryk, Ya.,
Gschneidner Jr., K.A., Pecharsky, V.K., 2007. Phys. Rev. Lett. 98, 247205.
Handbook on the Physics and Chemistry of Rare Earths438

Haskel, D., Tseng, Y.C., Souza-Neto, N.M., Lang, J.C., Sinogeikin, S., Mudryk, Ya,
Gschneidner Jr., K.A., Pecharsky, V.K., 2008. High Pres. Res. 28, 185.
Her, J.L., Koyama, K., Watanabe, K., Provenzano, V., Fu, A., Shapiro, A.J., Shull, R.D., 2005.
Mater. Trans. 46, 2011.
Holm, A.P., Pecharsky, V.K., Gschneidner Jr., K.A., Rink, R., Jirmanus, M.N., 2004. Rev. Sci.
Instrum. 75, 1081.
Holtzberg, F., Gambino, R.J., McGuire, T.R., 1967. J. Phys. Chem. Solids 28, 2283.
Huang, H., Pecharsky, A.O., Pecharsky, V.K., Gschneidner Jr., K.A., 2002. Adv. Cryog. Eng.
48, 11.
Huang, J.H., Qiu, J.F., Liu, J.R., Jin, P.Y., Xu, L.Z., Zhang, J.X., 2005. In: First IIF-IIR Interna-
tional Conference on Magnetic Refrigeration at Room Temperature, Montreux, Switzerland,
27–30 September, 2005, p. 179.
Huang, M., Schlagel, D.L., Schmidt, F.A., Lograsso, T.A., 2007. J. Alloys Compd. 441, 94.
Iglesias, J.E., Steinfink, H., 1972. J. Less-Common Met. 26, 45.
Ivtchenko, V.V., Pecharsky, V.K., Gschneidner Jr., K.A., 2000. Adv. Cryog. Eng. 46, 405.
Kamiya, K., Numazawa, T., Koen, T., Okano, T., Matsumoto, K., Nimori, S., 2004. IEEE Trans.
Appl. Supercond. 14, 1734.
Kamiya, K., Numazawa, T., Koen, T., Okano, T., Matsumoto, K., 2005. Adv. Cryog. Eng. 50, 11.
Kim, J.H., Kim, S.J., Lee, C.I., Jung, M.A., Oh, H.J., Rhyee, J.-S., Jo, Y., Mitani, H.,
Miyazaki, H., Kimura, S., Kwon, Y.S., 2010. Phys. Rev. B 81, 104401.
Kotur, B.Ya., Banakh, O.E., Cerny, R., Espejel, P., 1997. J. Alloys Compd. 260, 157.
Kozlov, A.Yu., Pavlyuk, V.V., 2004. J. Alloys Compd. 370, 192.
Kozlov, A.Yu., Pavlyuk, V.V., Davydov, V.M., 2004. Intermetallics 12, 151.
Krenke, T., Duman, E., Acet, M., Wasserman, E.F., Moya, X., Manosa, L., Planes, A., 2005. Nat.
Mater. 4, 450.
Kuepferling, M., Basso, V., Sasso, C.P., Giudici, L., Moore, J.D., Morrison, K., Cohen, L.F.,
2008. IEEE Trans. Magn. 44, 3233.
Kupsch, A., Levin, A.A., Meyer, D.C., 2005. Cryst. Res. Technol. 1/2, 42.
Lee, S.J., Park, J.M., Snyder, J.E., Jiles, D.C., Schlagel, D.L., Lograsso, T.A., Pecharsky, A.O.,
Lynch, D.W., 2004. Appl. Phys. Lett. 84, 1865.
Leib, J.S., Lo, C.C.H., Snyder, J.E., Jiles, D.C., Pecharsky, V.K., Schlagel, D.S., Lograsso, T.A.,
2002a. IEEE Trans. Magn. 38, 2447.
Leib, J., Snyder, J.E., Lo, C.C.H., Paulsen, J.A., Xi, P., Jiles, D.C., 2002b. J. Appl. Phys. 91, 8852.
Leib, J., Snyder, J.E., Lograsso, T.A., Schlagel, D., Jiles, D.C., 2004. J. Appl. Phys. 95, 6915.
Le Roy, J., Moreau, J.-M., Paccard, D., Parthe, E., 1978. Acta Cryst. B34, 3315.
Levin, E.M., 2009. Phys. Rev. B 80, 144401.
Levin, E.M., Pecharsky, V.K., Gschneidner Jr., K.A., 1999. Phys. Rev. B 60 (11), 7993.
Levin, E.M., Pecharsky, V.K., Gschneidner Jr., K.A., Tomlinson, P., 2000a. J. Magn. Magn.
Mater. 210, 181.
Levin, E.M., Pecharsky, V.K., Gschneidner Jr., K.A., 2000b. Phys. Rev. B 62, R14625.
Levin, E.M., Pecharsky, A.O., Pecharsky, V.K., Gschneidner Jr., K.A., 2001a. Phys. Rev. B 63,
064426.
Levin, E.M., Pecharsky, V.K., Gschneidner Jr., K.A., Miller, G.J., 2001b. Phys. Rev. B 64,
235103.
Levin, E.M., Pecharsky, V.K., Gschneidner Jr., K.A., 2001c. Phys. Rev. B 63, 174110.
Levin, E.M., Gschneidner Jr., K.A., Pecharsky, V.K., 2001d. J. Magn. Magn. Mater. 231, 135.
Levin, E.M., Gschneidner Jr., K.A., Pecharsky, V.K., 2002. Phys. Rev. B 65, 214427.
Chapter 262 R5T4 Compounds 439

Levin, E.M., Gschneidner Jr., K.A., Lograsso, T.A., Schlagel, D.L., Pecharsky, V.K., 2004. Phys.
Rev. B 69, 144428.
Lewis, L.H., Yu, M.H., Welch, D.O., Gambino, R.J., 2004. J. Appl. Phys. 95, 6912.
Li, J.Q., Sun, W.A., Jian, Y.X., Zhuang, Y.H., Huang, W.D., Liang, J.K., 2006. J. Appl. Phys.
100, 073904.
Liu, X.B., Altounian, Z., 2012. J. Alloys Compd. 540, 1.
Liu, Q.L., Rao, G.H., Liang, J.K., 2001a. Rigaku J. 18, 46.
Liu, Q.L., Rao, G.H., Yang, H.F., Liang, J.K., 2001b. J. Alloys Compd. 325, 50.
Liu, G.J., Sun, J.R., Lin, J., Xie, Y.W., Zhao, T.Y., Zhang, H.W., Shen, B.G., 2006. Appl. Phys.
Lett. 88, 212505.
Lue, C.S., Sivakumar, K.M., Kuo, Y.K., 2008. J. Phys. Chem. Solids 69, 269.
Luzan, S.P., Listovnichii, V.E., Buyanov, Yu.I., Martsenyuk, P.S., 1996. J. Alloys Compd.
239, 77.
Magen, C., Arnold, Z., Morellon, L., Skorokhod, Y., Algarabel, P.A., Ibarra, M.R., Kamarad, J.,
2003a. Phys. Rev. Lett. 91, 207202.
Magen, C., Morellon, L., Algarabel, P.A., Marquina, C., Ibarra, M.R., 2003b. J. Phys. Condens.
Matter 15, 2389.
Magen, C., Ritter, C., Morellon, L., Algarabel, P.A., Ibarra, M.R., 2004a. J. Phys. Condens. Mat-
ter 16, 7427.
Magen, C., Morellon, L., Algarabel, P.A., Ibarra, M.R., Ritter, C., Pecharsky, A.O.,
Gschneidner Jr., K.A., Pecharsky, V.K., 2004b. Phys. Rev. B 70, 224429.
Magen, C., Morellon, L., Algarabel, P.A., Ibarra, M.R., Arnold, Z., Kamarad, J., Lograsso, T.A.,
Schlagel, D.L., Pecharsky, V.K., Tsokol, A.O., Gschneidner Jr., K.A., 2005. Phys. Rev. B 72,
024416.
Magen, C., Algarabel, P.A., Morellon, L., Araujo, J.P., Ritter, C., Ibarra, M.R., Pereira, A.M.,
Sousa, J.B., 2006a. Phys. Rev. Lett. 96, 167201.
Magen, C., Morellon, L., Arnold, Z., Algarabel, P.A., Ritter, C., Ibarra, M.R., Kamarad, J.,
Tsokol, A.O., Gschneidner Jr., K.A., Pecharsky, V.K., 2006b. Phys. Rev. B 74, 134427.
Magen, C., Ritter, C., Morellon, L., Algarabel, P.A., Ibarra, M.R., Tsokol, A.O.,
Gschneidner Jr., K.A., Pecharsky, V.K., 2006c. Phys. Rev. B 74, 174413.
Malik, S.K., de Almeida, R.L., Quezado, S., Morozkin, A.V., Nirmala, R., 2009. Physica B 404,
3063.
Manekar, M., Chattopadhyay, M.K., Kaul, R., Pecharsky, V.K., Gschneidner Jr., K.A., 2006.
J. Phys. Condens. Matter 18, 6017.
Manivel Raja, M., Gopalan, R., Rajkumar, D.M., Balamuralikrishnan, R., Chandrasekaran, V.,
Suresh, K.G., Hono, K., 2008. J. Phys. D: Appl. Phys. 41, 055008.
Marcano, N., Algarabel, P.A., Rodrıguez-Fernandez, J., Magen, C., Morellon, L., Singh, N.K.,
Schlagel, D.L., Gschneidner Jr., K.A., Pecharsky, V.K., Ibarra, M.R., 2012. Phys. Rev. B
85, 024408.
Marcos, J., Casanova, F., Batlle, X., Labarta, A., Planes, A., Manosa, L., 2003. Rev. Sci. Instrum.
74, 4768.
Matsumoto, K., Okano, T., Kouen, T., Abe, S., Numazawa, T., Kamiya, K., Nimori, S., 2004.
IEEE Trans. Appl. Supercond. 14, 1738.
Meyers, J., Chumbley, S., Choe, W., Miller, G.J., 2002a. Phys. Rev. B 66, 012106.
Meyers, J.S., Chumbley, L.S., Laabs, F., Pecharsky, A.O., 2002b. Scripta Mater. 47, 509.
Meyers, J.S., Chumbley, S., Laabs, F., Pecharsky, A.O., 2003. Acta Mater. 51, 61.
Miller, G.J., 2006. Chem. Soc. Rev. 35, 799.
Misra, S., Miller, G.J., 2006. J. Solid State Chem. 179, 2290.
Handbook on the Physics and Chemistry of Rare Earths440

Misra, S., Miller, G.J., 2008. J. Am. Chem. Soc. 130, 13900.
Misra, S., Poweleit, E.T., Miller, G.J., 2009a. Z. Anorg. Allg. Chem. 635, 889.
Misra, S., Mozharivskyj, Y., Tsokol, A.O., Schlagel, D.L., Lograsso, T.A., Miller, G.J., 2009b.
J. Solid State Chem. 182, 3031.
Moore, J.D., Perkins, G.K., Bugoslavsky, Y., Chattopadhyay, M.K., Roy, S.B., Chaddah, P.,
Pecharsky, V.K., Gschneidner Jr., K.A., Cohen, L.F., 2006. Appl. Phys. Lett. 88, 072501.
Moore, J.D., Perkins, G.K., Morrison, K., Ghivelder, L., Chattopadhyay, M.K., Roy, S.B.,
Chaddah, P., Gschneidner Jr., K.A., Pecharsky, V.K., Cohen, L.F., 2008. J. Phys. Condens.
Matter 20, 465212.
Moore, J.D., Morrison, K., Perkins, G.K., Schlagel, D.L., Lograsso, T.A., Gschneidner Jr., K.A.,
Pecharsky, V.K., Cohen, L.F., 2009. Adv. Mater. 21, 3780.
Morellon, L., Algarabel, P.A., Ibarra, M.R., Blasco, J., Garcıa-Landa, B., Arnold, Z., Albertini, F.,
1998a. Phys. Rev. B 58 (22), R14721.
Morellon, L., Stankiewicz, J., Garcıa-Landa, B., Algarabel, P.A., Ibarra, M.R., 1998b. Appl. Phys.
Lett. 73 (23), 3462.
Morellon, L., Blasco, J., Algarabel, P.A., Ibarra, M.R., 2000. Phys. Rev. B 62, 1022.
Morellon, L., Algarabel, P.A., Magen, C., Ibarra, M.R., 2001a. J. Magn. Magn. Mater. 237, 119.
Morellon, L., Magen, C., Algarabel, P.A., Ibarra, M.R., Ritter, C., 2001b. Appl. Phys. Lett. 79,
1318.
Morellon, L., Ritter, C., Magen, C., Algarabel, P.A., Ibarra, M.R., 2003. Phys. Rev. B 68, 024417.
Morellon, L., Arnold, Z., Algarabel, P.A., Magen, C., Ibarra, M.R., Skorokhod, Y., 2004a. J. Phys.
Condens. Matter 16, 1623.
Morellon, L., Arnold, Z., Magen, C., Ritter, C., Prokhnenko, O., Skorokhod, Y., Algarabel, P.A.,
Ibarra, M.R., Kamarad, J., 2004b. Phys. Rev. Lett. 93, 137201.
Mozharivskyj, Y., Choe, W., Pecharsky, A.O., Miller, G.J., 2003. J. Am. Chem. Soc. 125, 15183.
Mozharivskyj, Y., Pecharsky, A.O., Pecharsky, V.K., Miller, G.J., Gschneidner Jr., K.A., 2004.
Phys. Rev. B 69, 144102.
Mozharivskyj, Y., Pecharsky, A.O., Pecharsky, V.K., Miller, G.J., 2005. J. Am. Chem. Soc. 127,
317.
Mozharivskyj, Yu., Tsokol, A.O., Miller, G.J., 2006. Z. Kristallogr. 221, 493.
Mudryk, Ya., Holm, A.P., Gschneidner Jr., K.A., Pecharsky, V.K., 2005a. Phys. Rev. B 72,
064442.
Mudryk, Ya., Lee, Y., Vogt, T., Gschneidner Jr., K.A., Pecharsky, V.K., 2005b. Phys. Rev. B 71,
174104.
Mudryk, Ya., Paudyal, D., Pecharsky, V.K., Gschneidner Jr., K.A., 2008. Phys. Rev. B 77,
024408.
Mudryk, Y., Paudyal, D., Pecharsky, V.K., Gschneidner Jr., K.A., Misra, S., Miller, G.J., 2010.
Phys. Rev. Lett. 105, 066401.
Mudryk, Y., Pecharsky, V.K., Gschneidner Jr., K.A., 2011. Z. Anorg. Allg. Chem. 637, 1948.
Mudryk, Ya., Singh, N.K., Pecharsky, V.K., Schlagel, D.L., Lograsso, T.A.,
Gschneidner Jr., K.A., 2012. Phys. Rev. B 85, 094432.
Mudryk, Y., Pecharsky, V.K., Gschneidner Jr., K.A., 2013. J. Appl. Phys. 113, 17E104.
Nazih, M., de Visser, A., Zhang, L., Tegus, O., Bruck, E., 2003. Solid State Commun. 126, 255.
Nersessian, N., Or, S.W., Carman, G.P., Choe, W., Radousky, H.B., Pecharsky, V.K.,
Pecharsky, A.O., 2003. In: Lagoudas, D.C. (Ed.), Proc. of SPIE, vol. 5053. SPIE, Bellingham,
WA, USA, p. 25.
Nersessian, N., Or, S.W., Carman, G.P., McCall, S.K., Choe, W., Radousky, H.B.,
McElfresh, M.W., Pecharsky, V.K., Pecharsky, A.O., 2004. Appl. Phys. Lett. 84, 4801.
Chapter 262 R5T4 Compounds 441

Nirmala, R., Sankaranarayanan, V., Sethupathi, K., Morozkin, A.V., Cai, Q., Chu, Z., Yang, J.B.,
Yelon, W.B., Malik, S.K., 2005. J. Appl. Phys. 97, 10M314.
Nirmala, R., Sankaranarayanan, V., Sethupathi, K., Morozkin, A.V., Yamamoto, Y., Hori, H.,
2006. Physica B 373, 120.
Nirmala, R., Morozkin, A.V., Malik, S.K., 2007a. Phys. Rev. B 75, 094419.
Nirmala, R., Mudryk, Ya., Pecharsky, V.K., Gchneidner Jr., K.A., 2007b. Phys. Rev. B 76,
104417.
Nirmala, R., Kundaliya, D.C., Shinde, S.R., Joshi, A.G., Morozkin, A.V., Malik, S.K., 2007c.
J. Appl. Phys. 101, 123901.
Nirmala, R., Sankaranarayanan, V., Sethupathi, K., Morozkin, A.V., Joshi, A.G., Malik, S.K.,
2007d. J. Magn. Magn. Mater. 309, 212.
Nirmala, R., Morozkin, A.V., Lamsal, J., Yelon, W.B., Malik, S.K., 2010. J. Appl. Phys. 107,
09E308.
Nirmala, R., Paudyal, D., Pecharsky, V.K., Gschneidner Jr., K.A., Nigam, A.K., 2011. J. Appl.
Phys. 109, 07A923.
Nobrega, E.P., de Oliveira, N.A., von Ranke, P.J., Troper, A., 2005. Phys. Rev. B 72, 134426.
Ouyang, Z.W., 2010. J. Appl. Phys. 108, 033907.
Ouyang, Z.W., Pecharsky, V.K., Gschneidner Jr., K.A., Schlagel, D.L., Lograsso, T.A., 2006a.
Phys. Rev. B 74, 024401.
Ouyang, Z.W., Pecharsky, V.K., Gschneidner Jr., K.A., Schlagel, D.L., Lograsso, T.A., 2006b.
Phys. Rev. B 74, 094404.
Ouyang, Z.W., Pecharsky, V.K., Gschneidner Jr., K.A., Schlagel, D.L., Lograsso, T.A., 2007a.
Phys. Rev. B 76, 134406.
Ouyang, Z.W., Pecharsky, V.K., Gschneidner Jr., K.A., Schlagel, D.L., Lograsso, T.A., 2007b.
Phys. Rev. B 76, 134415.
Ouyang, Z.W., Nojiri, H., Yoshii, S., Rao, G.H., Wang, Y.C., Pecharsky, V.K.,
Gschneidner Jr., K.A., 2008. Phys. Rev. B 77, 184426.
Ouyang, Z.W., Nojiri, H., Yoshii, S., Rao, G.H., Wang, Y.C., 2009. Phys. Rev. B 80, 054401.
Ouyang, Z.W., Xia, Z.C., Wang, Y.C., Rao, G.H., 2011. J. Appl. Phys. 109, 023901.
Palacios, E., Wang, G.F., Burriel, R., Provenzano, V., Shull, R.D., 2010a. J. Phys. Confer. Series
200, 092011.
Palacios, E., Rodrıguez-Velamazan, J.A., Wang, G.F., Burriel, R., Cuello, G.,
Rodrıguez-Carvajal, J., 2010b. J. Phys. Condens. Matter 22, 446003.
Palenzona, A., Cirafici, S., 1976. J. Less-Common. Met. 46, 321.
Palenzona, A., Manfrinetti, P., Brutti, S., Balducci, G., 2003. J. Alloys Compd. 348, 100.
Pani, M., Palenzona, A., 2003. J. Alloys Compd. 360, 151.
Park, J.M., Lynch, D.W., Lee, S.J., Schlagel, D.L., Lograsso, T.A., Tsokol, A.O., Snyder, J.E.,
Jiles, D.C., 2006. Phys. Rev. B 73, 035110.
Parviainen, S., 1980. Phys. Stat. Sol. 60, K13.
Paudyal, D., Pecharsky, V.K., Gschneidner Jr., K.A., Harmon, B.N., 2006. Phys. Rev. B 73,
144406.
Paudyal, D., Pecharsky, V.K., Gschneidner Jr., K.A., Harmon, B.N., 2007. Phys. Rev. B 75,
094427.
Paudyal, D., Pecharsky, V.K., Gschneidner Jr., K.A., 2008. J. Phys. Condens. Matter 20, 235235.
Paudyal, D., Mudryk, Ya., Pecharsky, V.K., Gschneidner Jr., K.A., 2010a. Phys. Rev. B 82,
144413.
Paudyal, D., Mudryk, Y., Pecharsky, V.K., Misra, S., Miller, G.J., Gschneidner Jr., K.A., 2010b.
J. Appl. Phys. 107, 09A908.
Handbook on the Physics and Chemistry of Rare Earths442

Paudyal, D., Mudryk, Y., Pecharsky, V.K., Gschneidner Jr., K.A., 2011. Phys. Rev. B 84, 014421.
Pavlyuk, V.V., Bodak, O.I., Zavodnik, V.E., 1990. Dopov. Akad. Nauk. Ukr. SSR B 29.
Pecharsky, V.K., Gschneidner Jr., K.A., 1997a. Appl. Phys. Lett. 70 (24), 3299.
Pecharsky, V.K., Gschneidner Jr., K.A., 1997b. Phys. Rev. Lett. 78 (23), 4494.
Pecharsky, V.K., Gschneidner Jr., K.A., 1997c. J. Magn. Magn. Mater. 167, L179.
Pecharsky, V.K., Gschneidner Jr., K.A., 1997d. J. Alloys Compd. 260, 98.
Pecharsky, V.K., Gschneidner Jr., K.A., 1998. Adv. Cryog. Eng. 43, 1729.
Pecharsky, V.K., Gschneidner Jr., K.A., 2001. Adv. Mater. 13, 683.
Pecharsky, V.K., Gschneidner Jr., K.A., 2005. In: Planes, A., Ma�nosa, L., Saxena, A. (Eds.),
Magnetism and Structure in Functional Materials. Springler-Verlag, Berlin, p. 199.
Pecharsky, V.K., Gschneidner Jr., K.A., 2007. Pure Appl. Chem. 79, 1383.
Pecharsky, A.O., Gschneidner Jr., K.A., Pecharsky, V.K., Schindler, C.E., 2002a. J. Alloys
Compd. 338, 126.
Pecharsky, V.K., Pecharsky, A.O., Gschneidner Jr., K.A., 2002b. J. Alloys Compd. 344, 362.
Pecharsky, V.K., Holm, A.P., Gschneidner Jr., K.A., Rink, R., 2003a. Phys. Rev. Lett. 91, 197204.
Pecharsky, A.O., Gschneidner Jr., K.A., Pecharsky, V.K., 2003b. J. Appl. Phys. 93, 4722.
Pecharsky, A.O., Gschneidner Jr., K.A., Pecharsky, V.K., 2003c. J. Magn. Magn. Mater. 267, 60.
Pecharsky, V.K., Samolyuk, G.D., Antropov, V.P., Pecharsky, A.O., Gschneidner Jr., K.A.,
2003d. J. Solid State Chem. 171, 57.
Pecharsky, V.K., Pecharsky, A.O., Mozharivskyj, Y., Gschneidner Jr., K.A., Miller, G.J., 2003e.
Phys. Rev. Lett. 91, 207205.
Pecharsky, A.O., Pecharsky, V.K., Gschneidner Jr., K.A., 2004a. J. Alloys Compd. 379, 127.
Pecharsky, A.O., Gschneidner Jr., K.A., Pecharsky, V.K., Schlagel, D.L., Lograsso, T.A., 2004b.
Phys. Rev. B 70, 144419.
Pecharsky, V.K., Gschneidner Jr., K.A., Mudryk, Ya., Paudyal, D., 2009. J. Magn. Magn. Mater.
321, 3541.
Pereira, A.M., Magen, C., Araujo, J.P., Algarabel, P.A., Morellon, L., Braga, M.E., Pinto, R.P.,
Ibarra, M.R., Sousa, J.B., 2007. J. Magn. Magn. Mater. 310, e580.
Pereira, A.M., Magen, C., Braga, M.E., Pinto, R.P., Fermento, R., Algarabel, P.A., Morellon, L.,
Ibarra, M.R., Araujo, J.P., Sousa, J.B., 2008a. J. Non-Cryst. Solids 354, 5298.
Pereira, A.M., Sousa, J.B., Araujo, J.P., Magen, C., Algarabel, P.A., Morellon, L., Marquina, C.,
Ibarra, M.R., 2008b. Phys. Rev. B 77, 134404.
Pereira, A.M., Morellon, L., Magen, C., Ventura, J., Algarabel, P.A., Ibarra, M.R., Sousa, J.B.,
Araujo, J.P., 2010. Phys. Rev. B 82, 172406.
Pereira, A.M., dos Santos, A.M., Magen, C., Sousa, J.B., Algarabel, P.A., Ren, Y., Ritter, C.,
Morellon, L., Ibarra, M.R., Araujo, J.P., 2011. Appl. Phys. Lett. 98, 122501.
Perez, N., Casanova, F., Bartolome, F., Garcıa, L.M., Labarta, A., Batlle, X., 2011. Phys. Rev. B
83, 184411.
Perez-Reche, F.-J., Casanova, F., Vives, E., Manosa, L., Planes, A., Marcos, J., Batlle, X.,
Labarta, A., 2006. Phys. Rev. B 73, 014110.
Perkins, G.K., Moore, J.D., Chattopadhyay, M.K., Roy, S.B., Chaddah, P., Pecharsky, V.K.,
Gschneidner Jr., K.A., Cohen, L., 2007. J. Phys. Condens. Matter 19, 176213.
Pfeifer, H.U., Schubert, K., 1966. Z. Metallkd. 57, 884.
Pinguet, N., Weitzer, F., Hiebl, K., Schuster, J.C., Noel, H., 2003. J. Alloys Compd. 348, 1.
Pinto, R.P., Sousa, J.B., Correia, F.C., Araujo, J.P., Braga, M.E., Pereira, A.M., Morellon, L.,
Algarabel, P.A., Magen, C., Ibarra, M.R., 2005. J. Magn. Magn. Mater. 290–291, 661.
Pires, M.J.M., Carvalho, A.M.G., Gama, S., da Silva, E.C., Coelho, A.A., Mansanares, A.M.,
2005. Phys. Rev. B 72, 224435.
Chapter 262 R5T4 Compounds 443

Pires, M.J.M., Mansanares, A.M., da Silva, E.C., Carvalho, A.M.G., Gama, S., Coelho, A.A.,
2006. Phys. Rev. B 73, 144404.
Podmiljsak, B., McGuiness, P.J., Skulj, I., Markoli, B., Drazic, G., Kobe, S., 2007. In: Second IIF-
IIR International Conference on Magnetic Refrigeration at Room Temperature, Potoroz,
Slovenia, 11–13 April 2007, p. 145.
Podmiljsak, B., Skulj, I., Markoli, B., McGuiness, P.J., Zuzek Rozman, K., Kobe, S., 2008. IEEE
Trans. Magn. 44, 4529.
Podmiljsak, B., Skulj, I., Markoli, B., Zuzek Rozman, K., McGuiness, P.J., Kobe, S., 2009a.
J. Magn. Magn. Mater. 321, 300.
Podmiljsak, B., McGuiness, P.J., Mattern, N., Ehrenberg, H., Kobe, S., 2009b. IEEE Trans. Magn.
45, 4364.
Podmiljsak, B., McGuiness, P.J., Miklavic, B., Zuzek Rozman, K., Kobe, S., 2009c. J. Appl. Phys.
105, 07A941.
Prabahar, K., Raj Kumar, D.M., Manivel Raja, M., Chandrasekaran, V., 2011. J. Magn. Magn.
Mater. 323, 1755.
Prahabar, K., Raj Kumar, D.M., Manivel Raja, M., Palit, M., Chandrasekaran, V., 2010. Mater.
Sci. Eng. B 172, 294.
Prokleska, J., Vejpravova, J., Danis, S., Sechovsky, V., 2006. Physica B 378–380, 1111.
Prokleska, J., Vejpravova, J., Sechovsky, V., 2007. J. Magn. Magn. Mater. 316, 313.
Provenzano, V., Shapiro, A.J., Shull, R.D., 2004. Nature 429, 853.
Qian, Z., Chumbley, L.S., Misra, S., Miller, G., Pecharsky, V.K., Gschneidner Jr., K.A., Ahn, K.,
Chernyshov, A.S., Singh, N.K., 2009. Acta Mater. 57, 3374.
Raj Kumar, D.M., Manivel Raja, M., Goplan, R., Balamuralikrishnan, R., Singh, A.K.,
Chandrasekaran, V., 2008. J. Alloys Compd. 461, 14.
Raj Kumar, D.M., Manivel Raja, M., Gopalan, R., Sambasiva Rao, A., Chandrasekaran, V., 2009.
J. Magn. Magn. Mater. 321, 1300.
Raj Kumar, D.M., Manivel Raja, M., Prabahar, K., Chandrasekaran, V., Poddar, A.,
Ranganathan, R., Suresh, K.G., 2011. J. Magn. Magn. Mater. 323, 1750.
Rajkumar, D.M., Manivel Raja, M., Goplan, R., Chandrasekaran, V., 2008. J. Magn. Magn.
Mater. 320, 1479.
Rajkumar, D.M., Manivel Raja, M., Gopalan, R., Singh, A.K., Chandrasekaran, V., Suresh, K.G.,
2010. Intermetallics 18, 518.
Rao, G.H., 2000. J. Phys. Condens. Matter 12, L93.
Rao, G.H., Huang, Q., Yang, H.F., Ho, D.L., Lynn, J.W., Liang, J.K., 2004. Phys. Rev. B 69,
094430.
Rhee, J.Y., 2003. J. Kor. Phys. Soc. 43, 621.
Ring, A.P., Ziebler, H.L., Lograsso, T., Schlagel, D., Snyder, J.E., Jiles, D.C., 2006. J. Appl. Phys.
99, 08R104.
Ring, A.P., Lograsso, T., Schlagel, D., Snyder, J.E., Jiles, D.C., 2007. J. Appl. Phys. 101, 09C527.
Ritter, C., Morellon, L., Algarabel, P.A., Magen, C., Ibarra, M.R., 2002. Phys. Rev. B 65, 094405.
Ritter, C., Magen, C., Morellon, L., Algarabel, P.A., Ibarra, M.R., Pecharsky, V.K., Tsokol, A.O.,
Gschneidner Jr., K.A., 2006. J. Phys. Condens. Matter 18, 3937.
Ritter, C., Magen, C., Morellon, L., Algarabel, P.A., Ibarra, M.R., Pereira, A.M., Araujo, J.P.,
Sousa, J.B., 2009. Phys. Rev. B 80, 104427.
Roy, S.B., Chattopadhyay, M.K., Chaddah, P., Moore, J.D., Perkins, G.K., Cohen, L.F.,
Gschneidner Jr., K.A., Pecharsky, V.K., 2006. Phys. Rev. B 74, 012403.
Roy, S.B., Chattopadhyay, M.K., Banerjee, A., Chaddah, P., Moore, J.D., Perkins, G.K.,
Cohen, L.F., Gschneidner Jr., K.A., Pecharsky, V.K., 2007. Phys. Rev. B 75, 184410.
Handbook on the Physics and Chemistry of Rare Earths444

Ryan, D.H., Elouneg-Jamroz, M., van Lierop, J., Altounian, Z., Wang, H.B., 2003. Phys. Rev.
Lett. 90, 117202.
Ryan, D.H., Cadogan, J.M., Cranswick, L.M.D., Gschneidner Jr., K.A., Pecharsky, V.K.,
Mudryk, Y., 2010. Phys. Rev. B 82, 224405.
Sambandam, S.N., Bethala, B., Sood, D.K., Bhansali, S., 2005. Surf. Coat. Technol. 200, 1335.
Samolyuk, G.D., Antropov, V.P., 2002. J. Appl. Phys. 91, 8540.
Samolyuk, G.D., Antropov, V.P., 2003. J. Appl. Phys. 93, 6882.
Samolyuk, G.D., Antropov, V.P., 2005. J. Appl. Phys. 97, 10A310.
Schmidt, F.A., McMasters, O.D., 1968. J. Less-Common Met. 15, 1.
Schmidt, F.A., McMasters, O.D., Carlson, O.N., 1972. J. Less-Common Met. 26, 53.
Schobinger-Papamantellos, P., Niggli, A., 1979. J. Phys. 40, C5.
Schobinger-Papamantellos, P., Niggli, A., 1981. J. Phys. Chem. Solids 42, 583.
Sharath Chandra, L.S., Pandya, S., Vishwakarma, P.N., Jain, D., Ganesan, V., 2009. Phys. Rev. B
79, 052402.
Shen, B.G., Sun, J.R., Hu, F.X., Zhang, H.W., Cheng, Z.H., 2009. Adv. Mater. 21, 4545.
Shimotomai, S., Ido, H., 2006. J. Appl. Phys. 99, 08Q109.
Shull, R.D., Provenzano, V., Shapiro, A.J., Fu, A., Lufaso, M.W., Karapetrova, J., Kletetschka, G.,
Mikula, V., 2006. J. Appl. Phys. 99, 08K908.
Singh, N.K., Pecharsky, V.K., Gschneidner Jr., K.A., 2008. Phys. Rev. B 77, 054414.
Singh, N.K., Paudyal, D., Mudryk, Y., Pecharsky, V.K., Gschneidner Jr., K.A., 2009. Phys. Rev.
B 79, 094115.
Singh, N.K., Paudyal, D., Pecharsky, V.K., Gschneidner Jr., K.A., 2010a. J. Appl. Phys. 107,
09A921.
Singh, N.K., Paudyal, D., Mudryk, Ya., Pecharsky, V.K., Gschneidner Jr., K.A., 2010b. Phys.
Rev. B 81, 184414.
Skorek, G., Deniszczyk, J., Szade, J., 2002. J. Phys. Condens. Matter 14, 7273.
Smith, G.S., Tharp, A.G., Johnson, Q., 1966. Nature 210, 1148.
Smith, G.S., Johnson, Q., Tharp, A.G., 1967a. Acta Cryst. 22, 269.
Smith, G.S., Tharp, A.G., Johnson, Q., 1967b. Acta Cryst. 22, 940.
Smith, A., Bahl, C.R.H., Bjork, R., Engelbrecht, K., Nielsen, K.K., Pryds, N., 2012. Adv. Energy
Mater. 2, 1288.
Sousa, J.B., Braga, M.E., Correia, F.C., Carpintero, F., Morellon, L., Algarabel, P.A., Ibarra, R.,
2002. J. Appl. Phys. 91, 4457.
Sousa, J.B., Braga, M.E., Correia, F.C., Carpinteiro, F., Morellon, L., Algarabel, P.A.,
Ibarra, M.R., 2003. Phys. Rev. B 67, 134416.
Sousa, J.B., Pereira, A.M., Correia, F.C., Teixeira, J.M., Araujo, J.P., Pinto, R.P., Braga, M.E.,
Morellon, L., Algarabel, P.A., Magen, C., Ibarra, M.R., 2005. J. Phys. Condens. Matter 17,
2461.
Spichkin, Y.I., Pecharsky, V.K., Gschneidner Jr., K.A., 2001. J. Appl. Phys. 89, 1738.
Stankiewicz, J., Morellon, L., Algarabel, P.A., Ibarra, M.R., 2000. Phys. Rev. B 61, 12651.
Stepe�n-Damm, J., Zaplatynsky, O.V., Prots’, Yu.M., Slamakha, P.S., Bodak, O.I., 1995. J. Alloys
Compd. 221, 91.
Stevens, K.W.H., 1952. Proc. Phys. Soc. LXV A65, 209.
Svitelsky, O., Suslov, A., Schlagel, D.L., Lograsso, T.A., Gschneidner Jr., K.A., Pecharsky, V.K.,
2006. Phys. Rev. B 74, 184105.
Svitlyk, V., Mozharivskyj, Y., 2009. Solid State Sci. 11, 1941.
Svitlyk, V., Campbell, B.J., Mozharivskyj, Y., 2009a. Inorg. Chem. 48, 10364.
Svitlyk, V., Miller, G.J., Mozharivskyj, Y., 2009b. J. Am. Chem. Soc. 131, 2367.
Chapter 262 R5T4 Compounds 445

Svitlyk, V., Cheung, Y.Y.J., Mozharivskyj, Y., 2010. J. Magn. Magn. Mater. 322, 2558.
Szade, J., Neumann, M., 1999. J. Phys. Condens. Matter 11, 3887.
Szade, J., Skorek, G., 1999. J. Magn. Magn. Mater. 196–197, 699.
Szade, J., Skorek, G., Winiarski, A., 1999. J. Cryst. Growth 205, 289.
Szade, J., Skorek, G., Neumann, M., Schneider, B., Fangmeyer, F., Matteucci, M., Paolucci, G.,
Goldoni, A., 2002. Surf. Sci. 497, 29.
Tan, L., Kreyssig, A., Kim, J.W., Goldman, A.I., McQueeney, R.J., Wermeille, D., Sieve, B.,
Lograsso, T.A., Schlagel, D.L., Budko, S.L., Pecharsky, V.K., Gschneidner Jr., K.A., 2005.
Phys. Rev. B 71, 214408.
Tan, L., Kreyssig, A., Nandi, S., Jia, S., Lee, Y.B., Lang, J.C., Islam, Z., Lograsso, T.A.,
Schlagel, D.L., Pecharsky, V.K., Gschneidner Jr., K.A., Canfield, P.C., Harmon, B.N.,
McQueeney, R.J., Goldman, A.I., 2008. Phys. Rev. B 77, 064425.
Tang, H., Pecharsky, A.O., Schlagel, D.L., Lograsso, T.A., Pecharsky, V.K.,
Gschneidner Jr., K.A., 2003. J. Appl. Phys. 93, 8298.
Tang, H., Pecharsky, V.K., Samolyuk, G.D., Zou, M., Gschneidner Jr., K.A., Antropov, V.P.,
Schlagel, D.L., Lograsso, T.A., 2004a. Phys. Rev. Lett. 93, 237203.
Tang, H., Pecharsky, V.K., Gschneidner Jr., K.A., Pecharsky, A.O., 2004b. Phys. Rev. B 69,
064410.
Teatum, E.T., Gschneidner, K.A., Waber, J.T., 1968. Los Alamos National Laboratory Report No.
LA-4003. Clearinghouse for Federal Scientific and Technical Information, Springfield, VA.
Tegus, O., Bruck, E., Zhang, L., Dagula, W., Buschow, K.H.J., de Boer, F.R., 2002a. Physica B
319, 174.
Tegus, O., Bruck, E., Buschow, K.H.J., de Boer, F.R., 2002b. Nature 415, 150.
Tegus, O., Dagula, O., Bruck, E., Zhang, L., de Boer, F.R., Buschow, K.H.J., 2002c. J. Appl.
Phys. 91, 8534.
Teng, B., Tu, M., Chen, Y., Tang, J., 2002. J. Phys. Condens. Matter 14, 6501.
Thuy, N.P., 2002. Solid State Sci. Technol. (Malaysia) 10, 1.
Thuy, N.P., Tai, L.T., Hien, N.T., Nong, N.V., Vinh, T.Q., Thang, P.D., Nguyen, T.P.,
Molinie, P., 2001. In: APPC 2000: Proceedings of the 8th Asia-Pacific Physics Conference,
Taipei, Taiwan, 7–10 August 2000, 354–359.
Thuy, N.P., Nong, N.V., Hien, N.T., Tai, L.T., Vinh, T.Q., Thang, P.D., Bruck, E., 2002. J. Magn.
Magn. Mater. 242–245, 841.
Thuy, N.P., Chen, Y.Y., Yao, Y.D., Wang, C.R., Lin, S.H., Ho, J.C., Nguyen, T.P., Thang, P.D.,
Klaasse, J.C.P., Hien, N.T., Tai, L.T., 2003. J. Magn. Magn. Mater. 262, 432.
Tian, W., Kreyssig, A., Zarestky, J.L., Tan, L., Nandi, S., Goldman, A.I., Lograsso, T.A.,
Schlagel, D.L., Gschneidner Jr., K.A., Pecharsky, V.K., McQueeney, R.J., 2009. Phys. Rev.
B 80, 134422.
Tobash, P.H., Bobev, S., 2006. J. Am. Chem. Soc. 128, 3532.
Tobash, P.H., Bobev, S., Thompson, J.D., Sarrao, J.L., 2009. Inorg. Chem. 48, 6641.
Tocado, L., Palacios, E., Burriel, R., 2005. J. Magn. Magn. Mater. 290–291, 719.
Trevizoli, P.V., Alves, C.S., Mendes, M.A.B., Carvalho, A.M.G., Gama, S., 2008. J. Magn. Magn.
Mater. 320, 1582.
Tseng, Y.C., Haskel, D., Lang, Y.C., Sinogeikin, S., Mudryk, Ya., Pecharsky, V.K.,
Gschneidner Jr., K.A., 2007. Phys. Rev. B 76, 014411.
Tseng, Y.C., Haskel, D., Souza-Neto, N.M., Mudryk, Ya., Pecharsky, V.K., Gschneidner Jr., K.A.,
2008a. Phys. Rev. B 78, 214433.
Tseng, Y.C., Haskel, D., Lang, J.C., Mudryk, Ya., Pecharsky, V.K., Gschneidner Jr., K.A., 2008b.
J. Appl. Phys. 103, 07B301.
Handbook on the Physics and Chemistry of Rare Earths446

Tseng, Y.-C., Ma, H.-J., Yang, C.-Y., Mudryk, Y., Pecharsky, V.K., Gschneidner Jr., K.A.,
Souza-Neto, N.M., Haskel, D., 2011. Phys. Rev. B 83, 104419.
Tsutaoka, T., Tokunaga, T., Tanaka, A., Narumi, Y., Kindo, K., 2010. J. Phys. Confer. Ser. 200, 1.
Tyszka, B., Szade, J., Skorek, G., Neumann, M., 2005. J. Alloys Compd. 400, 51.
Ugurlu, O., Chumbley, L.S., Schlagel, D.L., Lograsso, T.A., 2005a. Acta Mater. 53, 3525.
Ugurlu, O., Chumbley, L.S., Schlagel, D.L., Lograsso, T.A., Tsokol, A.O., 2005b. Scripta Mater.
53, 373.
Ugurlu, O., Chumbley, L.S., Schlagel, D.L., Lograsso, T.A., 2006a. Acta Mater. 54, 1211.
Ugurlu, O., Chumbley, L.S., Fisher, C.R., 2006b. J. Mater. Res. 21, 2669.
Van Vleck, J.H., 1932. The Theory of Electric and Magnetic Susceptibilities. Oxford University
Press, London.
Vejpravova, J., Prokleska, J., Danis, S., Sechovsky, V., 2006. Physica B 378–380, 784.
Velez, S., Hernandez, J.M., Fernandez, A., Macia, F., Magen, C., Algarabel, P.A., Tejada, J.,
Chudnovsky, E.M., 2010. Phys. Rev. B 81, 064437.
Velez, S., Hernandez, J.M., Garcıa-Santiago, A., Tejada, J., Pecharsky, V.K.,
Gschneidner Jr., K.A., Schlagel, D.L., Lograsso, T.A., Santos, P.V., 2012. Phys. Rev. B 85,
054432.
von Ranke, P.J., de Oliveira, N.A., Gama, S., 2004. J. Magn. Magn. Mater. 277, 78.
Voyer, C.J., Ryan, D.H., Ahn, K., Gschniedner Jr., K.A., Pecharsky, V.K., 2006. Phys. Rev. B 73,
174422.
Wang, Y., Calvert, L.D., Gabe, E.J., Taylor, J.B., 1978. Acta Cryst. B34, 1962.
Wang, H.B., Altounian, Z., Ryan, D.H., 2002. Phys. Rev. B 66, 214413.
Wang, H.B., Elouneg-Jamroz, M., Ryan, D.H., Altounian, Z., 2003. J. Appl. Phys. 93, 8304.
Wang, H.B., Altounian, Z., Ryan, D.H., 2004. J. Phys. Condens. Matter 16, 3053.
Wang, H.B., Altounian, Z., Ryan, D.H., Cadogan, J.M., Swainson, I.P., 2005. J. Appl. Phys. 97,
10M506.
Wang, Y.C., Yang, H.F., Huang, Q., Duan, L.B., Lynn, J.W., Rao, G.H., 2007. Phys. Rev. B 76,
064425.
Wang, H.B., Altounian, Z., Ryan, D.H., Cadogan, J.M., Swainson, I.P., Cranswick, L.M.D., 2008.
J. Appl. Phys. 103, 07B330.
Wang, H., Misra, S., Wang, F., Miller, G.J., 2010. Inorg. Chem. 49, 4586.
Wu, W., Lu, D., 2004. J. Rare Earths 22, 654.
Wu, W., Tsokol, A.O., Gschneidner Jr., K.A., Sampaio, J.A., 2005a. J. Alloys Compd. 403, 118.
Wu, L.-M., Kim, S.-H., Seo, D.-K., 2005b. J. Am. Chem. Soc. 127, 15683.
Wu, Y.Y., Xia, Z.C., Ouyang, Z.W., Huang, Y., Li, L., 2011. J. Appl. Phys. 109, 083911.
Xie, K., Sun, Z., Zhu, Y., Yang, S., Song, X., 2004. J. Alloys Compd. 372, 49.
Xie, Q., Kubata, C., Worle, M., Nesper, R., 2008. Z. Anorg. Allg. Chem. 634, 2469.
Xue, Y., Chen, Z., Zhang, X., Su, Y., Cao, S., Zhang, J., 2009. J. Supercond. Nov. Magn. 22, 637.
Yan, A., Handstein, A., Kerschl, P., Nenkov, K., Muller, K.-H., Gutfleisch, O., 2004. J. Appl.
Phys. 95, 7064.
Yang, H.F., Rao, G.H., Chu, W.G., Liu, G.Y., Ouyang, Z.W., Liang, J.K., 2002a. J. Alloys
Compd. 334, 131.
Yang, H.F., Rao, G.H., Chu, W.G., Liu, G.Y., Ouyang, Z.W., Liang, J.K., 2002b. J. Alloys
Compd. 339, 189.
Yang, H.F., Rao, G.H., Liu, G.Y., Ouyang, Z.W., Feng, X.M., Liu, W.F., Chu, W.G., Liang, J.K.,
2002c. J. Phys. Condens. Matter 14, 9705.
Yang, H.F., Rao, G.H., Liu, G.Y., Ouyang, Z.W., Liu, W.F., Feng, X.M., Chu, W.G., Liang, J.K.,
2002d. J. Alloys Compd. 346, 190.
Chapter 262 R5T4 Compounds 447
Yang, H.F., Rao, G.H., Liu, G.Y., Ouyang, Z.W., Liu, W.F., Feng, X.M., Chu, W.G., Liang, J.K.,
2003a. J. Alloys Compd. 361, 113.
Yang, H.F., Rao, G.H., Liu, G.Y., Ouyang, Z.W., Liu, W.F., Feng, X.M., Chu, W.G., Liang, J.K.,
2003b. J. Alloys Compd. 348, 150.
Yang, H.F., Rao, G.H., Liu, G.Y., Ouyang, Z.W., Liu, W.F., Feng, X.M., Chu, W.G., Liang, J.K.,
2003c. J. Magn. Magn. Mater. 263, 146.
Yang, H.F., Rao, G.H., Liu, G.Y., Ouyang, Z.W., Feng, X.M., Liu, W.F., Chu, W.G., Liang, J.K.,
2003d. Phys. Stat. Sol. A 198, 156.
Yang, H.F., Rao, G.H., Liu, G.Y., Ouyang, Z.W., Liu, W.F., Feng, X.M., Chu, W.G., Liang, J.K.,
2003e. Physica B 325, 293.
Yang, H.F., Rao, G.H., Liu, G.Y., Ouyang, Z.W., Liu, W.F., Feng, X.M., Chu, W.G., Liang, J.K.,
2004. J. Alloys Compd. 368, 248.
Yao, J., Mozharivskyj, Y., 2011. Z. Anorg. Allg. Chem. 637, 2039.
Yao, Y.D., Lee, S.F., Lee, M.D., Wu, K.T., Cheng, D.G., Thuy, N.P., Hien, N.T., Tai, L.T.,
Vinh, T.Q., Nong, N.V., 2003. Physica B 327, 324.
Yao, J., Lyutyy, P., Mozharivskyj, Y., 2011. Dalton Trans. 40, 4275.
Yao, J., Wang, P., Mozharivskyj, Y., 2012a. Chem. Mater. 24, 552.
Yao, J., Wang, P.L., Mozharivskyj, Y., 2012b. J. Alloys Compd. 534, 74.
Yazdani, A., Bonder, M.J., 2011. J. Magn. Magn. Mater. 323, 1658.
Yu, B.F., Liu, M., Egolf, P.W., Kitanowski, A., 2010. Intern. J. Refriger. 33, 1029.
Yuan, S., Ge, J., Cao, S., Yu, L., Wu, A., Xu, J., 2010. J. Appl. Phys. 107, 09E105.
Yuce, S., Barrio, M., Emre, B., Stern-Taulats, E., Planes, A., Tamarit, J.-L., Mudryk, Y.,
Gschneidner Jr., K.A., Pecharsky, V.K., Manosa, L., 2012. Appl. Phys. Lett. 101, 071906.
Yucel, A., Elerman, Y., Aksoy, S., 2006. J. Alloys Compd. 420, 182.
Yuzuak, E., Yucel, A., Elerman, Y., 2007. In: Second IIF-IIR International Conference on
Magnetic Refrigeration at Room Temperature, Potoroz, Slovenia, 11–13 April 2007, 81.
Yuzuak, E., Emre, B., Yucel, A., Elerman, Y., 2009. J. Alloys Compd. 476, 929.
Yuzuak, E., Dincer, I., Elerman, Y., 2010a. J. Rare Earths 28, 477.
Yuzuak, E., Dincer, I., Elerman, Y., 2010b. Chin. Phys. B 19, 037502.
Yuzuak, E., Emre, B., Elerman, Y., Yucel, A., 2010c. Chin. Phys. B 19, 057501.
Zhang, T., Chen, Y., Fu, H., Teng, B., Tang, Y., Tu, M., 2005. Chin. Sci. Bull. 50, 1811.
Zhang, E., Chen, Y., Zhang, T., Tang, Y., Tu, M., 2006. J. Magn. Magn. Mater. 305, 410.
Zhang, T., Chen, Y., Tang, Y., Du, H., Ren, T., Tu, M., 2007. J. Alloys Compd. 433, 18.
Zhang, A., Hou, X., Zhang, P., Hu, X.H., Xu, H., Ni, J.S., Zhou, B.X., Zhao, T., 2008a. Rare Met.
Mater. Eng. 37, 1597.
Zhang, T., Chen, Y., Tang, Y., Ren, T., Tu, M., 2008b. Mater. Char. 59, 1518.
Zhang, H., Mudryk, Ya., Zou, M., Pecharsky, V.K., Gschneidner Jr., K.A., Long, Y., 2009.
J. Alloys Compd. 487, 98.
Zhang, H., Mudryk, Ya., Cao, Q., Pecharsky, V.K., Gschneidner Jr., K.A., Long, Y., 2010.
J. Appl. Phys. 107, 013909.
Zhong, X.C., Zou, M., Zhang, H., Liu, Z.W., Zeng, D.C., Gschneidner Jr., K.A., Pecharsky, V.K.,
2011. J. Appl. Phys. 109, 07A917.
Zhou, Y.F., Hao, Y.M., Hu, Z.B., 2008. Key Eng. Mat. 368–372, 632.
Zhuang, Y.H., Huang, W.D., Li, J.Q., Jian, Y.X., Huang, J.L., 2006a. J. Alloys Compd. 414, 78.
Zhuang, Y.H., Li, J.Q., Huang, W.D., Sun, W.A., Ao, W.Q., 2006b. J. Alloys Compd. 421, 49.
Zhuo, Y., Chahine, R., Bose, T.K., 2003. IEEE Trans. Magn. 39, 3358.
Zimm, C., Jastrab, A., Sternberg, A., Pecharsky, V., Gschneidner Jr., K., Osborne, M.,
Anderson, I., 1998. Adv. Cryog. Eng. 43, 1759.
Handbook on the Physics and Chemistry of Rare Earths448

Zou, M., Tang, H., Schlagel, D.L., Lograsso, T.A., Gschneidner Jr., K.A., Pecharsky, V.K., 2006.
J. Appl. Phys. 99, 08B304.
Zou, M., Mudryk, Y., Pecharsky, V.K., Gschneidner Jr., K.A., Schlagel, D.L., Lograsso, T.A.,
2007. Phys. Rev. B 75, 024418.
Zou, M., Pecharsky, V.K., Gschneidner Jr., K.A., Schlagel, D.L., Lograsso, T.A., 2008. Phys.
Rev. B 78, 014435.
Zou, M., Pecharsky, V.K., Gschneidner Jr., K.A., Schlagel, D.L., Lograsso, T.A., 2009a. J. Alloys
Compd. 488, 550.
Zou, M., Pecharsky, V.K., Gschneidner Jr., K.A., Mudryk, Ya., Schlagel, D.L., Lograsso, T.A.,
2009b. Phys. Rev. B 80, 174411.
Chapter 262 R5T4 Compounds 449

This page intentionally left blank

Index
Note: Page numbers followed by “f” indicate figures, and “t” indicate tables.
AAbsorption spectra, molten salts, 144–146
a-Amino acids N-carboxyanhydrides, 44–46
Aminopyridinato ligand, 40
Antireflection coatings, silicon-based solar
cells, 223–224, 224f
Aryloxide rare-earth bisborohydride
complexes, 63
BBandgaps for selected semiconductors, 226,
227t
g-Benzyl-L-glutamate N-carboxyanhydride.
See N-carboxyanhydrides (NCAs)Bis(phosphinimino)methanide complexes, 37
Bis(b-diketiminate) rare-earth-metal, 16
Borohydride complexes
bis(b-diketiminate) rare-earth, 16
diazabutadiene yttrium complexes, 15
divalent thulium compound, 8
FTIR spectroscopy, 5–6
hydrogen atoms, bridging, 4–5
initiators, 6, 16–70
ligand, features and advantages, 4–6
organometallic, synthesis, 8–11
polar and nonpolar monomers, 6f
polar cyclic monomers initiation, 53–54
polar monomers, polymerization (see Polar
monomers)
post-metallocene, synthesis (see Post-
metallocene borohydride complexes)
pseudo halide, 5
synthesis, 7–8
Borohydride metallocene, 62–63
Broad-band absorption
EuII and YbII divalent ions, 197–199
GdBO3:Ce,Tb,Yb, 196, 196ftunability, 4f-5d transition, 197
YbIII-containing downconversion systems,
198tZnO hybrid phosphors, 199
b-Butyrolactoneatactic and isotactic HO–PLA–OH, 31
isotactic PHB, stereoselective synthesis, 31
PBLG, synthesis, 34
ROP, 31–32
CCaprolactone (CL)
bis(phosphinimino)methanide complexes,
37
bis(b-diketiminate) rare-earth-metal
borohydride complexes, 37–38
discrete trivalent rare-earth borohydride
initiators, 34–35
inter/intramolecular transesterifications,
17–24
and lactides, 35–38, 65–66
one-pot reduction/initiation strategy, 25
and trimethylene carbonate, 66–67
trivalent rare-earth borohydride initiators,
34–35
e-Caprolactone. See Caprolactone (CL)
Carbonate. See Cyclic trimethylene carbonate
Ce5SixGe4-x system
magnetic and magnetocaloric properties,
367–368, 369t
phase boundaries, 367–368
phase compositions and crystal structures,
367
temperature dependence, lattice parameters,
367–368, 368f
tetragonal crystal structure, 367
CL. See Caprolactone (CL)
Computer simulation
octahedra bridge, 144
radial distribution analyses, 100tRaman spectra, interpretation, 153–154
Copolymers
e-caprolactone (see Caprolactone (CL))
methyl methacrylate, 67–70
polar monomers, 65–70
stereoselectivity, 3–4
d-valerolactone, 67Crystallography, R5T4 compounds
atomic and isotropic thermal displacement
parameters, Gd5Si4-xBIX system, 302,
304t
451

Crystallography, R5T4 compounds
(Continued )
atomic coordinates, Sm5Ge4-type, 286–287,
288tatomic networks, 288f
atomic positions, Tm5Sb2Si2, 299–300, 300t
coordination polyhedra, nonequivalent
atomic position, 291, 292fGd5Si4–Gd5Ge4 pseudobinary system, 292
Gd5Si2Ge2atomic positions, occupations, and
thermal displacement parameters, 295tmicrostructural investigation, 297–298
monoclinic (M) type, 296
x-ray single crystal diffraction, 297–298
Gd1Y4Ge4 alloy, 305tHo5Ge4, 301–302, 303t
Lu5Si4, 285–286
Nd5Si4, 302, 305tO(II)-Sm5Ge4 and O(I)-Gd5Si4, 294t
positional parameters, R5T4 orthorhombic
structures, 299t
Pu–Rh system, 298
Sm5Ge4, 285–287, 287f
U2Mo3Si4-type structure, 302
Zintl–Klemm formalism, 296–297
Crystal structure
heavy rare-earth chlorides, 158
rare-earth halides, 104–113
rare-earth tribromides, 112trare-earth trichlorides, 111t, 158
Cyclic trimethylene carbonate
initiation mechanism, 51, 52
inorganic rare-earth borohydride initiators,
49
organometallic rare-earth borohydride
initiators, 49–50
ROP, analytical studies, 50–53
DDensities of states (DOS), 153
Density functional
Archimedes method, 114
dilatometric method, 114–115
measurement, experimental techniques, 115fmixed melt, 117–118
molar volumes, 114
molten KCl-LaCl3 system, 118tmolten LiCl-LaCl3 system, 117t
molten NaCl-LaCl3 system, 118t
molten rare-earth halides, 115–117, 116t
DFT, polar monomers polymerization
caprolactone and lactide, ROP, 70–76
catalysis tools, 79
methyl methacrylate, 77–78
trimethylene carbonate, ROP, 76
Diazabutadiene yttrium complexes, 15
Divalent rare-earth borohydride initiators,
40–41
Doped Gd5Si2Ge2 alloys, 324–328
DOS. See Densities of states (DOS)
Downconversion (DC)
antireflection layer, 192
broad-band absorption, 196–199
energy scheme, 190–192, 191f
Ln-containing systems, 192
narrow-band absorption, 192–195
practical systems, 200
in Si-based solar cells
d-f transitions, 198t
f-f-transitions, 194tDownshifting (DS)
and DSSCs, 235t
inorganic materials (see Inorganic
downshifting materials)
NIR spectral range, LSCs
LSC-Si cell, 179–180
silicon-based solar cells
complex, organic ligands, 201–203
inorganic materials, 203–205
types, 201
visible spectral range, LSCs
europium complexes, 181–186, 181f, 184f
optical efficiency, LSC, 181–182
organosilane precursors, 185–186
ORMOSIL, 185–186
siloxane-/silicate-based inorganic-organic
hybrids, 185
terbium complexes, 185
DS. See Downshifting (DS)
DSSCs. See Dye-sensitized solar cells
(DSSCs)
Dye-sensitized solar cells (DSSCs)
cells, light-storage capability, 265
cerium oxide, photoanode, 263–265
conversion yield, 265–266, 266t
description and parameters
cobalt (III/II) polypyridine complexes,
230–231
dye-loaded TiO2 electrode, 229–230
efficiencies, 229
incident photon-to-current conversion
efficiency (IPCE), 231–232
kinetics, 231, 231f
lanthanides, 232
Index452

light harvesting, dye, 231
multilayer cells, 229–230, 229f
power conversion efficiency, 231–232
rare-earth complexes, downshifting
materials, 232, 235t
rare-earth materials, 232, 233t
rare-earth upconversion materials, 232,
238tredox shuttle electrolyte, 230–231
ruthenium-based dyes and deoxycholic
acid, 229–230
stability, 229
inorganic downshifting materials
(see Inorganic downshifting materials)
metal complexes, 235t, 251–256
OPV, 268
scattering layer
cerium(IV) oxide, 240
excitation and emission spectra,
Y3Al5O12:Ce, 240, 240f
rare-earth materials as, 233t
titanium oxide modification
cerium, 243, 245
erbium, 243–244
lanthanum, 242–243
neodymium, 243–244
photocurrent densities and
photoconversion yields, 244–245, 245f
TiCl4 treatment, 241–242
trivalent GaIII and YIII ions, 241–242
upconverted, nanobiological devices,
261–263
upconverting materials
for dye-sensitized solar cells, 238terbium-based upconverters, 256–260
sensitized upconversion, 261
thulium-based upconverters,
260–261
Dy5SixGe4-x system, 394–396
EElectrical resistivity and magnetoresistance,
Gd5SiXGe4-x system
anisotropy, 330
giant magnetostriction and
magnetoresistance, 328
Hall resistivity, 332
high-resolution electrical resistivity
measurements, 331–332
isothermal magnetoresistance,
Gd5Si1.8Ge2.2, 328, 329f
polycrystalline Gd5Ge4, 330–331, 331f
temperature dependence, polycrystalline
Gd5Ge4, 331f
transition temperature, 329–330
Erbium-based upconverters
DSSCs, 256–260
Si-based solar cells, 209–219, 209f, 211t,
214f, 216f, 218f
UCNPs, 215–217
Er5SiXGe4-x system
crystal structure, 404–405
electrical and thermal transport properties,
406
inverse dc magnetic susceptibility, 402f
magnetic ordering, 400–401
magnetic properties, 405, 405t
magnetization and magnetostriction
measurements, 404
magnetocaloric effect, 403
monoclinic and orthorhombic polymorphs,
404
spin-reorientation transitions, 403
temperature-dependent neutron diffraction,
401
transition temperature, 403
Extended X-ray absorption fine structure
(EXAFS) technique
Gd–Cl distance and coordination number,
155, 155f
isolated and bridged species, 156, 157f
octahedral coordination, 156
FFirst coordination shell, limiting distance
(LDFCS), 151, 151t
GGd5BixSi4-x system, 431
Gd5GaxGe4-x system, 426–428
Gd5GaxSi4-x system, 428
Gd5PxSi4-x system, 431–432
Gd5SiXGe4-x system
anomalous electrical resistivity and
magnetoresistance, 328–332
chemical modification, Gd5Ge4, 354–355
ferromagnetic interactions, 307
first-principles calculations, 359–362
interslab T––T bond length, 307
kinetics, magnetostructural transitions,
337–345
linear thermal expansion studies and
magnetostriction, 332–335
Index 453

Gd5SiXGe4-x system (Continued )magnetic properties and first-order
transitions, 313–328
magnetocaloric effect, 306
magnetocrystalline anisotropy, 349–352
microstructure and thin plates formation,
355–357
phase equilibria (see Phase equilibria,
Gd5SiXGe4-x system)
powder metallurgy processing, 363
pressure effects, 345–349
sensitivity, 306–307
short-range correlations, 352–354
spectroscopy, 357–359
thermal conductivity and thermal diffusivity,
362
thermoelectricity and voltage generation,
335–337
X-ray magnetic circular dichroism (XMCD),
307
Gd5SnxSi4-x system, 423–424
Giant magnetocaloric effect (GMCE)
Gd5Si2Ge2, 313
Gd5SiXGe4-X alloys, 314, 322, 323, 432
magnetostructural transitions, 332
Tb5Si2Ge2, 379
Giant magnetoresistance (GMR), 304–305,
318–319, 328, 332
GMCE. See Giant magnetocaloric effect
(GMCE)
GMR. See Giant magnetoresistance (GMR)
HHo5SixGe4-x system
crystallographic parameters and magnetic
data, 398t
heat capacity, 398
magnetic properties, 396
magnetostructural transition, 398
neutron diffraction study, 397, 398–399
noncollinear FM magnetic structure, 399
structural and magnetic behavior, 397
temperature-dependent X-ray powder
diffraction experiments, 398, 399
IInorganic downshifting materials
categories, 245–246
CeIII, d-f emission, 251
doping concentration, 250–251, 251f
dye-sensitized solar cells, 235t
EuIII ions, 249, 250
LaVO4:Dy, 247–248, 247f
SmIII and EuIII, 246–247
UV-absorbing layer, 247, 247fY2O3:Eu, 248–249, 248f
Intermetallic compounds, 284, 285, 290, 298,
399–400, 408–409, 432
Intramolecular transesterification reactions,
17–24
Ionic liquid. See Molten salts
Isotactic PHB, synthesis, 31
LLactide
atactic PHB, nonstereoselective synthesis,
39
b-butyrolactone, 39–40bulky guanidinate ligands, 38–39
ROP, 26–31
Lactones
divalent samarium borohydride complex, 43
polar monomer, 18t, 43pseudo anionic coordination–insertion
mechanism, 42, 43
ROP, 25–26, 41–44
La5PbXGe4-X system, 432
La5SixGe4-x system
heat capacity, 365
a-La5Si4 and b-La5Si4 compounds, 366
lattice parameters, 366ftetragonal Zr5Si4-type nonlayered crystal
structure, 365
Wigner–Seitz volume (WSV), 367
LDFCS. See First coordination shell, limiting
distance (LDFCS)
Linear thermal expansion and magnetostriction
Gd5SixGe4-x system
Gd5Si2Ge2 single crystal, 333–334
giant magnetostriction effect,
332–333
hydrostatic pressure dependence, 334
large volume contraction, 332
magnetoelastic behavior, Gd5Ge4, 334
polycrystalline Gd5Si2Ge2, 334
temperature dependence, Gd5Si4, 335
Local spin density approximation (LSDA),
359, 360, 361, 362, 394
LSDA. See Local spin density approximation
(LSDA)
Luminescent solar concentrator (LSC)
definition and properties
coupled to Si solar cell, 178, 179t
Index454

loss, luminescence and TIR process, 176,
177f
reabsorption, 177–178
reflected fraction, 176
total internal reflection, 176
UCNPs, 178
downshifting, in (see Downshifting)
Lu5SiXGe4-x system, 408
MMagnetocrystalline anisotropy, Gd5SiXGe4-x
system
angular dependence, 350
Gd5Ge4neutron diffraction study, 350–351
single crystal, 350f
x-ray resonant magnetic scattering study,
349–350
Gd5Si2Ge2, 351–352
magnetic force microscopy, 351–352
Magnetostructural transitions
acoustic emission, 338–339
deflagration, 344
energy fluctuations, 341–342
entropy change, 338
first-order, 337
Gd5Ge4bias effect, 345
field-induced, 344–345
localized magnetic relaxation
measurements, 345
magnetic field–temperature phase
diagram, 341f, 342–343magnetic field–temperature structural
diagram, 340f
irreversibility, O(I)-FM phase content,
342fisothermal magnetization, polycrystalline
Gd5Ge4, 339–341, 340f
magnetic field–temperature diagram, 337,
338fmagnetic relaxation, Gd5Si2Ge2, 339
Metallocene complexes, 9
Methyl methacrylate (MMA)
aryloxide rare-earth bisborohydride
complexes, 63
bis(b-diketiminate) ytterbium borohydride
complex, 63
borohydride metallocene, 62–63
equimolar coordination-insertion reaction,
43
half-metallocene systems, 62–63
homoleptic guanidinate parent compounds,
63
inorganic and organometallic rare-earth
borohydride initiators, 55–64
neutral monoguanidinate rare-earth
bisborohydride complexes, 63
PMMA, synthesis, 55, 62
polymerization, 55–65
MMA. See Methyl methacrylate (MMA)
Molar volume change, 159t
Molten salt
alkali halide-type, 99–102
association, 103
cation-polyatomic anion type, 102–103
coordination numbers, 102t
definitions, 90
distribution and coorelation functions, 91f
interatomic distances, 103t
interionic distances and coordination
numbers, 104t
as liquids, 88–90, 89t
pure matter, phase diagram, 89f
radial distribution analyses, 100tradial distribution function, 91–98
structural information, methodology,
90–91
structural parameters, 104t, 105t, 108tXRD and ND, 90–91
Monte Carlo method (MC), 148
NNarrow-band absorption
downconversion efficiency,
192–193
ErIII and NdIII ions, 192–193
YbIII ions, 194t
N-carboxyanhydrides (NCAs), 32–34,44–46
NCAs. See N-carboxyanhydrides (NCAs)
Nd5SixGe4-x system
concentration dependence, lattice
parameters, 372–373, 373f
crystal structures and magnetic moment
components, 373, 374t
electrical resistivity and magnetic
measurements, 376
magnetic susceptibility, 376
monoclinic phase, 372–373
neutron diffraction, 373, 375–376
orthorhombic crystal structure, 372
Nd5SnXSi4-X system, 424–425
Nose’s method, 148
Index 455

OOPV. See Organic photovoltaic cells (OPV)
Organically modified silicates (ORMOSIL),
185–186, 201–202
Organic photovoltaic cells (OPV), 202–203,
268
Organolanthanide complexes, initiators, 3–4,
3f
Organometallic borohydride complexes
heteroleptic b-diketiminate lanthanide
complexes, 9, 10
ionic species, 10–11
linked half-sandwich complexes, 10
metallocene complexes, 9
monocyclopentadienyl complex, 9–10
ORMOSIL. See Organically modified silicates
(ORMOSIL)
PPartial pair distribution functions, 160f
o-Pentadecalactone (PDL), 26
Phase equilibria, Gd5SiXGe4-x system
annealing, Gd5Si2Ge2, 308–310
coupled magnetic and structural diagram,
311–313
high-temperature heat treatment, 308–310
intermediate phase, 307–308
isothermal cross-section, ternary Gd–Si–Ge
phase diagram, 310
monoclinic structure, 308
O(II) phase, 311
room temperature crystallographic phase
diagram, 308, 309f
solidified melt-spun ribbons, Gd5Si2Ge2,
311
temperature-induced transformations, 308
Photovoltaic systems
dye-sensitized solar cells, 229–264
(see also Dye-sensitized solar cells)
luminescent solar concentrators, 175–186
(see also Luminescent solar
concentrators)
OPV (see Organic photovoltaic cells (OPV))
rare earths, in, 174–175
silicon-based solar cells, 187–225
(see also Silicon-based solar cells)
solar cells, working principle, 171–172
Polar monomer, 33t
copolymers (see Copolymers)
lactides, 27t
lactones, 18t
methylmethacrylate (MMA), 56tpolymerization, 16–70
rare-earth borohydride initiators, 16–70
ROP initiation, 53–54
trimethylene carbonate (TMC), 48t
Poly(methyl methacrylate) (PMMA).
See Methyl methacrylate (MMA)
Polymerization
(pre)initiators, 6–7
methyl methacrylate (see Methyl
methacrylate)
polar monomer, 16–70
Post-metallocene borohydride complexes
amidinates and guanidinates, 12
amidopydrinato complexes, 11
aryloxide lanthanide borohydrides, 11, 12
bisphosphiniminomethanide ligand, 11–12
bis(b-diketiminate) rare-earth-metal
borohydride complexes, 16
chelating dianionic bis(amide) ligand, 15
diaminobis(phenolate) ligands, 13–15
diazabutadiene yttrium complexes, 15
guanidinate complexes, synthesis, 13
polydentate nitrogen- and oxygen-based
compounds, 14, 15
polydentate nitrogen-based ligands, 13
Post-metallocene complexes, 11–16
Pr5SixGe4-x system
crystallization, 368–370
magnetic and electrical transport properties,
371, 372
magnetic measurements, 371
neutron diffraction study, 372
phase boundaries, 370–371
phase relationships, 370
temperature dependences, 371, 372
QQDs. See Quantum dots (QDs)
Quantum cutting. See Downconversion (DC)
Quantum dots (QDs)
and organic dyes, 178
PbS/PbSe nanocrystal, 220
RRadial distribution function (RDF)
atomic scattering factors, 94–95
definition, 91–98
direct Fourier transformation, 93
hypothetical, 97f
interference function, 91–92
Index456

nearest-neighbor coordination number,
estimation, 95–96, 96f
second coordination shell and nearest-
neighbor coordination shell, 97–98
Raman spectroscopy
Boltzmann thermal factor, 144–146
chloride coordination environments,
146–147
composition dependence, 140f, 142f
molten KCl–YCl3 mixture, 138f
molten ScCl3–CsCl mixtures, 143–144
solid and molten rare-earth trihalides,
structures, 141f
vibrational modes and structure, 139, 139f
Rare-earth halide
crystal structures (see Crystal structures)
high-frequency peaks, 153
melts, structures, 118–157
simulations, 153
solid and molten states, density (see Density
functional)
RDF. See Radial distribution function (RDF)
Reluctant monomer, 31–32
Ring-opening polymerization (ROP)
a-amino acids N-carboxyanhydrides, 44–46
analytical studies initiation, borohydride
complexes, 41–46
g-benzyl-L-glutamate N-carboxyanhydride
(see N-carboxyanhydrides (NCAs))
b-butyrolactone, 31–32, 39–40e-caprolactone (see e-Caprolactone)cyclic ester, 25
cyclic trimethylene carbonate, 47–53
a,o-dihydroxytelechelic polyesters, 47
divalent rare-earth borohydride initiators,
40–41
d-valerolactone, 25–26lactide, 26–31, 38–40, 70–76
lactone and VL, 25–26
o-pentadecalactone, 26polar cyclic monomers, 17–24, 53–54
rare-earth alkoxide compounds, 2–3
trimethylene carbonate, 76
trivalent inorganic rare-earth borohydride
initiators, 17–34
trivalent organometallic rare-earth
borohydride initiators, 34–40
ROP. See Ring-opening polymerization (ROP)
R5SixGe4-x system
Ce5SixGe4-x, 367–368
Dy5SixGe4-x, 394–396
Er5SiXGe4-x, 399–406
formation and crystallography, 363, 364f
Ho5SixGe4-x, 396–399
La5SixGe4-x, 365–367
Lu5SiXGe4-x, 408
Nd5SixGe4-x, 372–376
Pr5SixGe4-x, 368–372
Sm5SixGe4-x, 376–378
Tb5SixGe4-x, 378–394
Tm5SiXGe4-x, 406
Yb5SixGe4-x, 406–408
R5T4 compounds
crystallography (see Crystallography, R5T4
compounds)
Gd5SiXGe4-X system (see Gd5SiXGe4-Xsystem)
high-temperature annealing, 285
pressure-, temperature-, and magnetic field-
dependent polymorphism, 285
rare earths substitutions
(Gd1-xRX)5(Si,Ge)4 system, 413–414
(Gd1-XRX)5Ge4 system, 412–413
(Gd1-XRX)5Si4 system, 409–411
(R’XR1-x)5T4, without Gd, 414–416
Ca, 416–417
Li, 419
Mg, 417–418
Zr and Hf, 418–419
R5SixGe4-x system (see R5SixGe4-x system)
R5Sn4 system
R5Sn4 compounds, 420–422
R5SnxGe4-x, 425
R5SnxSi4-x systems, 423–425
R5T4 system with group 13/15 element
Bi, P, and Pb, 431–432
Eu5As4 compound, 425
Ga substitutions, 426–428
Sb substitutions, 428–431
SShort-range correlation (SRC), 352–354
Silicon-based solar cells
absorption, c-Si cell, 189–190
antireflection coatings (see Antireflection
coatings, silicon-based solar cells)
calculated percentages, AM1.5G solar
spectrum, 190fdownconversion materials, 188–189,
190–200
downshifting materials
complex, organic ligands, 201–203
inorganic materials, 203–205
types, 201
electron-hole pairs, 187–188
Index 457

Silicon-based solar cells (Continued )EQE maximization, 188
fill factor (FF), 187–188, 188f
lanthanide materials (see Lanthanide
materials, Si cells)
light-to-electricity conversion, 187
normalized spectral responses, m-Si and
c-Si, 189fthermodynamic efficiency, 187–188
upconverting materials
enhancement, light-to-electricity
conversion, 219
erbium-based upconverters, 209–219
ETU, 207–208
HoIII, 219
mechanisms and relative efficiencies,
207–208, 208f
overall conversion yield, cell, 206
photonic enhancement, 223
plasmonic enhancement, 222–223
rear upconverting layer, 205–207, 206f
requirements, upconverter, 207
yield enhancement, 219–222
Sm5SixGe4-x system
magnetic properties, 377, 377t
O(I) and O(II)-type structure, 377–378
phase relationships and crystal structures,
377
temperature dependences, 378
Solar cells
band-gaps, 226, 227t
cadmium telluride, 227–228
dye-sensitized (see Dye-sensitized solar
cells (DSSCs))
GaAs cells, 226–227
junctions design, 228
lanthanide nitrides, 228
lattice spacing, 228
light-focusing device, 228
photovoltaic material, 226
quantum efficiencies comparison, 226, 226f
silicon-based (see Silicon-based solar cells)
tandem Si0.5Ge0.5/Si solar cell, 228f
Solar energy conversion. See Lanthanides,
solar energy conversion
Spectroscopy, Gd5SiXGe4-x system, 357–359
SRC. See Short-range correlation (SRC)
TTb5SixGe4-x system
anisotropy, 386–391
crystallography and magnetism, 378–386
electronic structure and magnetic properties,
394
reflectance difference spectra, 393
short-range correlations, 391–393
Thermoelectricity and voltage generation,
Gd5SiXGe4-x system, 335–337
Thulium-based upconverters, 260–261
Tm5SiXGe4-x system, 406
Trivalent inorganic rare-earth borohydride
initiators, 17–34
Trivalent organometallic rare-earth
borohydride initiators, 34–40
UUpconversion (UC). See also Silicon-based
solar cells and Dye-sensitized solar
cells
energy-transfer upconversion (ETU), 207–208
erbium-based upconverters, 209–219
in dye-sensitized solar cells, 238tmechanism, 173f, 208f
in silicon-based solar cells, 211t
Vd-Valerolactone (VL), 25–26, 67
XXAFS spectroscopy, 155–156
X-ray diffraction (XRD)
angular distribution, 126f
corner-sharing model, 129
correlation function, 123fdimeric ions, models, 127f
edge-sharing model, 128–129
Faber-Ziman structure factor, 131
first peak positions, 150tFourier analysis, 154–155
interference functions, 148, 149f
intermediate-size cations, 136
lanthanide trichlorides, liquid structure,
147–148
molecular dynamics simulations, 134
molecular-type crystal structure, 129–130
molten rare-earth chlorides, 121–122, 133
network formation, 129–130
pair correlation function, 149f
partial structure factors, 132fPettifor’s phenomenological chemical scale,
121–122
physicochemical properties, determination,
125–126
Index458

polarization, 135
predictor–corrector method, 148
radial distribution function, 123f
reduced intensity function, 124f, 128frunning coordination number, 150f
short- and intermediate-range orders,
134–135
XRD. See X-ray diffraction (XRD)
YYb5SixGe4-x system, 406–408
Y5SixGe4-x system
heat capacity, 364–365
pseudobinary Y5Si4–Y5Ge4 phase diagram,
364
unit cell parameters, 365f
Index 459