
Barricadas na Academia: literatura e abolicionismo na produção do jovem Coelho Netto
Upload
khangminh22Category
view
1download
0
Universidade Federal Fluminense
Institute of Computation
Computer Science Department
Gustavo Marques Netto
TRULY RANDOM NUMBER GENERATOR FROM
OCEAN EVENTS
Niteroi-RJ
2016

Ficha Catalográfica elaborada pela Biblioteca da Escola de Engenharia e Instituto de Computação da UFF
N476 Netto, Gustavo Marques
Truly randon number generator from ocean events / Gustavo
Marques Netto. – Niterói, RJ : [s.n.], 2016.
51 f.
Trabalho (Conclusão de Curso) – Departamento de Computação,
Universidade Federal Fluminense, 2016.
Orientador: Leandro Augusto Frata Fernandes.
1. Processamento de imagem. 2. Criptografia. I. Título.
CDD 006.42

iii
GUSTAVO MARQUES NETTO
TRULY RANDOM NUMBER GENERATOR FROM OCEAN EVENTS
Work submitted to the Computer Science
Bachelor Course at Universidade Federal
Fluminense as a partial requirement to ob-
tain the title of Bachelor in Computer Sci-
ence.
Advisor: Prof. Leandro Augusto Frata Fernandes
Niteroi-RJ
2016


v
Thanks
I would like to thank those who helped during this work, in special professor
Leandro A. F. Fernandes. I would also like to thank Mads Haahr from RANDOM.ORG
for suplying data for the tests.
vi
Abstract
Random number are constantly present in our daily lives. They can be used in the
lottery, making you rich, or in encryption algorithms, responsible for protecting billions
of bytes of data every day. However, generating this numbers is not a simple process. A
machine like a computer is deterministic by nature and random numbers are supposed to
be the opposite, unpredictable. In this work, we propose a technique that generates truly
random numbers from natural phenomena. In this case, images from the movement of
the ocean water captured by a camera. We make the assumption that the wind influence
over the water creates enough randomness, so the generation passes a set of statistical
tests that assure the quality of the generated numbers. In fact, the normal vectors of the
water surface are used to generate the numbers. We employ geometric reconstruction to
minimize the image distortions introduced by to the perspective of an area of the water
surface. The reconstruction also results in the viewer direction for the rectified image.
This is used in a new approach for Shape from Shading. In this technique, based on the
work of Shah and Ping [1], we remove the necessity for the illumination direction as we
deal with outdoor scenes in this work.
Keywords: Random Numbers, Shape from Shading, Truly Random Number Generation,
Geometric Reconstruction, Surface Reconstruction.

vii
Contents
Abstract vi
List of Figures viii
1 Introduction 1
1.1 Related Works . . . . . . . . . . . . . . . . . . . . . . . . . . . . . . . . . . 3
2 Theoretical Concepts 5
2.1 Pinhole Camera Model . . . . . . . . . . . . . . . . . . . . . . . . . . . . . 5
2.2 Shape from Shading . . . . . . . . . . . . . . . . . . . . . . . . . . . . . . 6
2.3 Concepts of Statistics . . . . . . . . . . . . . . . . . . . . . . . . . . . . . . 7
2.3.1 Chi-square Distribution . . . . . . . . . . . . . . . . . . . . . . . . 7
2.3.2 Chi-square Test (Goodness to fit) . . . . . . . . . . . . . . . . . . . 8
3 Surface Reconstruction 9
3.1 Results on Water Surface Reconstruction . . . . . . . . . . . . . . . . . . . 16
4 Random Number Generation 23
4.1 Methodology for Testing Random Number Generation . . . . . . . . . . . 24
4.1.1 Mathematical Tests . . . . . . . . . . . . . . . . . . . . . . . . . . . 25
4.1.2 NIST Tests . . . . . . . . . . . . . . . . . . . . . . . . . . . . . . . 27
4.2 Results on Random Number Generation . . . . . . . . . . . . . . . . . . . 37
5 Final Remarks 40
5.1 Limitations . . . . . . . . . . . . . . . . . . . . . . . . . . . . . . . . . . . 40
5.2 Future Works . . . . . . . . . . . . . . . . . . . . . . . . . . . . . . . . . . 41
Bibliography 42

viii
List of Figures
1.1 Overall view of the technique . . . . . . . . . . . . . . . . . . . . . . . . . 4
3.1 Flow diagram of the calibration process to get the transformation from
world to image coordinates . . . . . . . . . . . . . . . . . . . . . . . . . . . 10
3.2 Warped image positioned in the reconstructed world, in scale . . . . . . . . 11
3.3 A screen-shot of the tool used to calibrate the horizon line in the image . . 12
3.4 Vanishing line in the image, the region of the image that will be projected
and the region projected . . . . . . . . . . . . . . . . . . . . . . . . . . . . 14
3.5 Flow diagram of the shape from shading proposed . . . . . . . . . . . . . . 15
3.6 Comparison showing the effect of the sky color on the water . . . . . . . . 15
3.7 Set of images with reconstructions with average waves . . . . . . . . . . . . 18
3.8 Normal vectors of Figure 3.7d represented as a colored image . . . . . . . . 19
3.9 Set of images with reconstructions with high waves . . . . . . . . . . . . . 19
3.10 Normal vectors of Figure 3.9d represented as a colored image . . . . . . . . 20
3.11 Set of images with reconstructions with short waves . . . . . . . . . . . . . 20
3.12 Normal vectors of Figure 3.11d represented as a colored image . . . . . . . 21
3.13 Set of images with reconstructions with blobs . . . . . . . . . . . . . . . . 21
3.14 Normal vectors of Figure 3.13d represented as a colored image . . . . . . . 22
4.1 Flow diagram of the generation of random numbers from the normal vectors
of an image . . . . . . . . . . . . . . . . . . . . . . . . . . . . . . . . . . . 24

Chapter 1
Introduction
In our daily lives, we deal with random numbers in many situations, Video games,
simulations, gambling and cryptography are some examples. These numbers are sup-
posed to represent unique events. Their combinations are unpredictable and most of the
times non-reproducible. A simple example would be the lottery. It consists in generating
numbers and the person who guesses them takes the jackpot. One of the widest known
lottery game is Powerball. Its prize can reach more than one hundred million dollars and
it includes almost all states of the USA. The need for random numbers is clear here and
with this prize, the process that generates them has to be reliable. Otherwise, the whole
game could be compromised.
An important application is in the security area. Usually, if we want to send a
private information we use algorithms to encrypt data. If anyone tracks the message, this
person will not be able to understand the content. One of the most used algorithms is the
RSA, developed by R. Rivest, A. Shamir, and L. Adleman in 1978. It uses two large prime
numbers as a core part of it, which means that knowing these numbers the encryption can
be broken. In addition, proving that an integer is prime is much simpler than factoring
numbers to craft prime numbers [2]. Therefore, the method to create these numbers is
basically generating numbers and checking if they are prime, if not, the process restarts.
Since random values are so important, the way that they are created becomes a
problem. In most cases, a computer is using this numbers and are generating them, too.
However, computers are deterministic in its core. Unless an external event happens, the
computer is supposed to follow the same set of instructions, always in the same order and
manner. Additionally, algorithms that generate numbers still depend on an external seed.
2
The seed is a number responsible for defining the behavior of the generator. So, a pair
generator/sequence will always generate the same sequence of pseudo-random numbers.
These generators are known as Pseudo-Random Numbers Generators (in this work, they
will be mentioned as PRNG).
PRNGs apply a series of transformations to remove the dependence among previ-
ously generated numbers and the subsequent ones. They also tend to have better statis-
tical results as they force the independence among numbers. On the other hand, knowing
the seed implies in breaking the non-determinism. So the generation process becomes de-
terministic. In this case, they still depend on a Truly Random Number Generator (they
will be mentioned as TRNG in this work).
TRNGs need to come from really random sources. Thus, most of them come from
nature, as it will be presented in this manuscript. Natural events have so many variants
that they become unpredictable. For instance, some software asks the users to make
movements with the mouse to create randomness. Even if the user tried, he/she would
not make the same pattern twice because people do not have that much control over their
muscles. In this work, our approach makes use of images of water movement as a source
of randomness, resulting in a TRNG.
We propose a technique that generates random numbers from the angles between
pairs of direction that are perpendicular to the water surface. For example, given a surface,
for every point there is a direction perpendicular to it. We can write these directions as
vectors and they are called normal vectors. By assuming that the water movement is
random, the normal vectors will be too, as well as the angles between them. To estimate
the water surface, we use a single image from the water. So, from a single image, we are
capable of generating n angles, where n is the number of points (or pixels, in this context).
By applying a threshold over the angles, we produce bit values, one per angle. We build
random integers numbers by binding the random bits.
The two main problems become: (i) getting the normal vectors from the image of
the water surface and (ii) generating random numbers from the normal vectors. Figure 1.1
illustrates the overall process. First, to estimate the normal vectors we deal with a problem
known as Shape-from-Shading. It consists on deriving a 3-D scene description from one
or more 2-D images. We attack this problem by using projective geometry to select a
region of the water surface and then we rectify this part, mitigating the distortion caused

3
by the perspective view. To perform this, we need to reconstruct geometrically the mean
water plane, this also results in getting the viewer direction from any pixel of the rectified
image. This is possible because we become able to get the approximate coordinates of the
camera and the points on the water plane. With this information, we are able to apply a
variation of the Shape from Shading problem proposed by Ping and Shah [1] (Chapter 3).
This technique refines the estimation of the water heights (a discrete height map) by
iterating over a function whose output is the height map. The process tries to minimize
the difference between the input image and the estimated reflectance with the estimated
height. In our case, it deals with uncertainties about illumination that an outdoor scene
presents. Hence, for each image a discrete height map is reconstructed. We then get
the angles between pairs of normal vectors calculated from the height map (Chapter 4).
We convert these angles to random bits applying a threshold. In order to validate our
approach, we present two sets of tests that show the randomness and we compare it
against the performance of other generators (Chapter 4).
For a better understanding of the proposed technique, we introduce in Chapter 2
concepts that are going to be used in this work. In Chapter 5, we present our final
remarks, limitations of the work and some opportunities for improvement.
1.1 Related Works
The technique employs two different steps that were previously approached by
other authors. The first is Shape from Shading to reconstruct surfaces from images of
water. Although, the general algorithm used here was defined by Ping and Shah [1],
different approaches, even more general, were developed afterward. The second is the
generation of truly random numbers given a measurement of a natural event.
Li et al. [3] used Shape from Shading directly as the first step to generate arti-
ficial water surfaces from a single video sequence. Not only the reconstruction is used
but also optical flow as flow divergence is employed to compute the change in surface
height. However, in terms of geometric reconstruction from a single image, details about
the illumination and other assumptions were not mentioned in their paper, making the
reproduction of the work challenging. Another approach was developed by Quan [4]. It
assumes Phong’s Reflection Model for the water and perpendicular illumination direc-

4
0 1 1
1 0 1
(a) Original image, captured from the Guanabara bay.
(b) Warped image, after
intrinsic and extrinsic
calibration.
(c) Reconstructed water
surface from the warped
image.
(d) Sampled normal vectors,
pairs with same color will be
compared.
(e) Final random bits,
generated applying a threshold
over the angles between the
pairs.
Figure 1.1: The technique takes a picture from a water surface, the Guanabara bay,
(b) applies geometric transformations to minimize the effect of perspective, (c) recon-
structs the water surface from the shading, (d) compares pairs of normal vectors from
the surface and (e) applies a threshold over the angles to get random bit values.
tion to the surface. The heights are refined by employing oscillating arcs to make the
normals variation smoother, which in fact yield good results, presented by the author.
On the other hand, the illumination assumption and the direct dependence on the image
derivatives create poor initial reconstructions.
On the generation of truly random numbers, the main examples come from partic-
ulars behaviors of natural phenomena. The first is Hotbits [5], an on-line service designed
by John Walker in 1986. The generators use the randomness of the decay of Caesium-137
to generate the numbers. Even though it is possible to obtain an expected time to decay
into Barium-137, the real moment is unpredictable. Consequently, it compares if the last
decay time was greater than the previous one. If it was, then a certain bit value is gen-
erated. The source is specific, and the hardware necessary for such activity is, at least,
inaccessible to most users. Another on-line service is RANDOM.ORG [6]. It is probably
the one with more resources and information about. It uses atmospheric noise captured
by radio devices to generate the numbers. The statistical tests applied are the same that
were employed in this work. In terms of the algorithm or how the bits are extracted,
neither the company or any publication make it publicly available.

Chapter 2
Theoretical Concepts
In this chapter, we introduce concepts that will be used throughout this work.
First, Section 2.1 presents the pinhole camera model, it allows us understanding how the
3-D view is projected into the 2D image plane. This will be used to reduce the perspective
distortions over the water surface and to estimate the viewer direction on Chapter 3. After
this, Section 2.2 presents a classical solution for the Shape from Shading problem from
a single image [1]. This work presents important topics that will be used in Chapter 3.
Finally, Section 2.3 presents a probabilistic distribution, know as Chi-square distribution.
Associated with it, there is an important statistical test, widely used by us in Chapter 4.
2.1 Pinhole Camera Model
Considering the 3-D space of the world and a point in world coordinates and an
Euclidean coordinate system to express the 3-D space. The pinhole camera model applies
the following transformation to map W to the image plane
G = KR[I| − C]W = PW, (2.1)
where W = [X,Y,Z]T , G = [x,y,z]T are the coordinates of the mapped point in 2-D (homo-
geneous coordinates, a third coordinate is included to indicate the homogeneous plane). P
is the camera matrix, which is given by KR[I|−C] [7]. It maps world to image coordinates.
The 3× 3 matrix K has the intrinsic parameters of the camera (camera parameters that

6
are internal and fixed to a particular setup) and it is written as
K =
ax s px
0 ay py
0 0 1
, (2.2)
where ax is the multiplication of the camera focal distance and the ratio of pixels by
distance on the x-axis of the camera’s sensor. The same is applied to the y-axis, for ay.
For the remaining variables, s is the skew of the pixel grid. Additionally, px and py are the
offset between the origin of the image and the principal point (the intersection between
the line passing through the camera center and the image plane), in pixels. The matrices
R and [I| −C] are responsible for centering the world on the center of the camera and for
aligning the world axis to the camera’s axis. So they apply respectively a translation and
a rotation to do it. R is a 3 × 3 matrix and it is a typical 3-D rotation matrix, aligning
the camera axis to the world axis. For the translation, the matrix is 3× 4, [I| −C], where
I is a 3× 3 identity sub-matrix and C is a 3× 1 vector expressing the cartesian location
of the center of the camera in world coordinates.
2.2 Shape from Shading
Shape from Shading is a problem that consists on recovering the height map from
surfaces using 2-D images. In this case, we focus on the solution proposed by Shah and
Ping [1]. This technique uses a single image as input. It iterates over an equation that
estimates the discrete height map of the surface.
The iterative process occurs over this equation, in this case the previous dis-
crete height (Zn−1(x,y)) starts as 0 for every position and it defines the next estimation,
Zn(x,y).
Zn(x,y) = Zn−1(x,y)− f(Zn−1(x,y))∂f(Zn−1(x,y))
∂Z(x,y)
, (2.3)
and
f = I −R, (2.4)
where I is the input image and R is the calculated reflectance (the ration of light re-
flected from the surface to the light incident upon it). According to [1], the derivative in

7
Equation (2.3) is
df(Zn−1(x,y))
dZ(x,y)=
(∂Zn−1
∂x+ ∂Zn−1
∂y)(∂Z
n−1
∂xix +
∂Zn−1
∂yiy + 1)
√(1 + ∂Zn−1
∂x
2+ ∂Zn−1
∂y
2)3√
1 + i2x + i2y
ix + iy√(1 + ∂Zn−1
∂x
2+ ∂Zn−1
∂y
2)√
1 + i2x + i2y
,
(2.5)
where Z is the height map, n indicates the iteration. This technique assumes Lambertian
surfaces, i.e., surfaces whose luminance is isotropic, uniform in all directions. It means that
the lighting is diffuse, with no highlights or reflexes on the surface. The final reflectance
depends only on the angle between the illumination and the normal vector of the surface.
The illumination direction is modeled as τ ∈ [0, 2π], the tilt (azimuth) angle, and δ ∈[0,π/2], the slant angle (angle between the vector and [0,0,1]T ). The illumination direction
in Cartesian coordinates is defined by
[ix, iy, iz]T = [sin δ cos τ, sin δ sin τ, cos δ]T . (2.6)
Hence, the reflectance is defined as basically the dot product between the unitary
illumination direction and the unitary normal vector
R =[cos τ sin δ, sin τ cos δ, cos δ].[∂Z
n−1
∂x,∂Z
n−1
∂y,1]
√1 + ∂Zn−1
∂x
2+ ∂Zn−1
∂y
2, (2.7)
where ∂Z∂x
is Zn−1x,y −Zn−1
x−1,y for every x ∈ [1, 2, · · · , n−1] and ∂Z∂y
is ∂Z∂y
is Zn−1x,y −Zn−1
x,y−1 for every y ∈[1, 2, · · · , n− 1].
2.3 Concepts of Statistics
2.3.1 Chi-square Distribution
Given n independent random variables with standard normal distribution, u. The
sum of their squares has a Chi-square distribution with n− 1 degrees of freedom,
n∑
i=1
ui2 = q ∼ χ2
n−1. (2.8)
The probability density function in this case is defined as
fq(x; k) =
x(k2−1)e−
k2
2k/2Γ(k2
) , x > 0
0, otherwise
, (2.9)

8
where Γ (x) =∞∫0
sx−1e−sds is known as the gamma function and k = n−1. The cumulative
distribution function of the distribution is defined as
FQ(x,k) =γ(k
2,k
2)
Γ(k
2)
= p
(k
2,x
2
), (2.10)
where p is the incomplete gamma function
p(a,x) =1
Γ(a)
x∫
0
ta−1e−tdt (2.11)
and γ is the lower incomplete gamma function
γ(a,x) =
x∫
0
ta−1e−tdt. (2.12)
2.3.2 Chi-square Test (Goodness to fit)
This test is also known as Pearson’s Chi-square test and it evaluates how the
analyzed set of samples fits a probability distribution. According to Pearson’s theorem [8],
given a set of samples p1, p2,...,pn with frequencies m1,m2,...,mn, we can measure the
deviation of the sample from an expected value. The normalized sum of squared deviations
approximates to a Chi-square distribution with n− 1 degrees of freedom (2.13), and it is
called test statistics (X2) :
X2 =n∑
i=1
(mi − npi)2
npi→ χ2
n−1. (2.13)
So, the test tries to confirm a null hypothesis (H0, the samples fitting the distri-
bution), the opposite will be the alternative hypothesis (H1, the samples not fitting the
distribution). The result of (2.13) is a statistic value that compared to the cumulative
Chi-square distribution with n − 1 degrees of freedom tells how likely that value or an
even more extreme value can happen. This comparison uses the following equation:
p-value = Pr(Xp > X2|H0), (2.14)
where p-value is the probability of such extreme event and Xp is the random variable
which X2 (the test statistic) is a value of. This probability can be calculated with the
formula defined in (2.10), with n−1 degrees of freedom andX2 as the value of the variable.
If the p-value is less than a level of significance (typically 1%), H0 is rejected.

Chapter 3
Surface Reconstruction
The first step of our random number generation procedure consists of the geometric
reconstruction of the water surface from an image. We capture the image of the water.
However, in this image we define the x and y world axis parallel to the mean water plane,
consequently, the z axis corresponds to the normal vector of the plane, pointing to the
sky. The camera is positioned over the mean water plane. We define the origin of the
coordinates system of the world as the resulting orthographic projection of the camera
on the plane. This implies that C = [0,0,h]T , where h is camera height. This setup is
presented on Figure 3.2, the rectangle selected and presented in this figure is just a piece
of the image.
The model used is explained more in depth the Section 2.1. The main objective
is to define a transformation that mitigates the effects of perspective on a region of the
water surface. To achieve this, we have to define a matrix P that takes world coordinates
and maps to image coordinates (see Equation (2.1)). This matrix allows us to obtain the
direction from each point on the water surface to the camera. The steps of this process
can be seen on Figure 3.1. At this moment, the water plane is considered to have no
variation in height (it is the mean water plane). In our experiments, the matrix K with
the intrinsic parameters of the camera is built as:
K =
fmx 0 u0
0 −fmy v0
0 0 1
, (3.1)
where f is the focal length (in centimeters), mx and my are the ratio between the sensor
9

10
Image including
the water surfaceSelecting the horizon
line.
Selecting the region
on the water surface.
Joining matrix by
Geometric
Reconstruction.
Intrinsic and
extrinsic parameters
from the camera.
Matrix P, combining
R,t and K.
Figure 3.1: Flow diagram with the steps used to generate the matrix (Equation 2.1). This
matrix has to be calculated just once. It allow us to rectify an area from the area surface
and calculate the viewer direction in each point of this rectified image.
and the image measurements (width and height, in centimeters for the sensor and in pixels
for the image), u0 and v0 are the center of the image, in pixels. Comparing to the matrix
on Equation (2.2), we assume the skew of the pixel as 0, as the pixels of our camera are
square.
The matrix K takes the coordinates from the camera coordinates system into the
homogeneous image coordinates. In order for us to orient the camera on world coordinate
system it is necessary to include the horizon line, according to the Figure 3.3. This results
on the the rotation, R, if the line has some inclination, a rotation has to be applied,
assuming that the horizon should not have any slope. We created an interactive tool
where we can mark points over the horizon. An image of this process is in Figure 3.3.
Applying linear least squares to fit a line through the points will return the line in the
image, the normal direction of this line is the normal of the plane [7].
In image coordinates, we can consider the horizon as a line. Consequently, this
line will have the coefficients ~l = [a, b, c]T . This vector multiplied by the transpose of
K ( ~n = KT~l ), will be in the camera coordinates. We will call it ~n = [nx, ny, nz]T since
it represents the normal of the mean water plane. We can craft a rotation matrix by
just getting three perpendicular vectors. This transformation that rotates the axis to the
camera ones (Section (2.1)), R, is defined by
R =[~n [1,0,0]× ~n ~n× ([1,0,0]× ~n)
], (3.2)
where × denotes the cross-product.

11
Figure 3.2: The geometric reconstruction with the selected region of the water projected
in scale and the origin and the camera indicated in the figure, i.e., two points where y is
0. The camera was positioned on the fifth floor of a building and the rectified image is
from a specific area of the original image.
According to Section 2.1, P = KR[I| − C], where [I| − C] is an identity matrix
concatenated with −C. The matrix P defines a relation between world coordinates and
image coordinates. Figure 3.2 shows the projection of an area of the water surface,
considering the distance in centimeters. In addition, we can retro-project a point on the
image plane. This consists on defining the line that has all the points in the world that
would project into G. This line is a parametric function given by:
W(λ) = PT (PPT )−1G+ λC, (3.3)
where W(λ) is the parametric function that returns the position (a point W ) on the line
according to the parameter λ ∈ IR, W is the point coordinates in the world, C is the center
of the camera and P defined by Equation (2.1). If we intersect this line with the mean
water plane, λ can be fixed because we will have the exact distance from the camera.
In our case, the horizon line rotation and the height of the camera provide in-
formation to reconstruct the water plane. Substituting the coordinates obtained by the
parametric Equation (3.3), in the plane equation defined by the normal of the water plane,

12
Figure 3.3: A screen-shot of the tool used to calibrate the horizon line in the image.
we obtain an equation that will depend only on one parameter, λ. This equation is:
[nx, ny, nz]
W(λ)x
W(λ)y
W(λ)z
= 0, (3.4)
where [nx, ny, nz]T is the vector normal to the water plane and [W (λ)x,W (λ)y,W (λ)z]
T is
a point in the line defined at the parametric equation (3.3). After solving this equation
for λ, we get lambda and the point on the water surface. The formula to define a point
becomes
W = (−Cz/W(λ)z)W(λ) + C, (3.5)
where W(λ) is the parametric function with λ defined to generate a normalized vector.
As a result, given an area of the water plane on the image we are able to geometrically
reconstruct it. We ask the user to select a point, G1, on the original image and a size
of a rectangle (height and width in world unit length, e.g. centimeters). This point is
retro-projected from the image to the world which results in the point W1. The other
three vertexes of the rectangle are obtained by dislocating the first point in the world axis,
according to the predefined size, calculating W2,W3 and W4. These other three point are
projected back in the image resulting in G2,G3 and G4. Then, we create a homography

13
that maps from the vertexes of the rectangle on the original image to the rectangle on the
world coordinate that takes the points over the mean water plane and rectifies them,
DH =
xg1 yg1 1 0 0 0 −xg1xw1 −yg1xw1) −xw1
0 0 0 xg1 yg1 1 −xg1yw1 yg1yw1 −yw1
xg2 yg2 1 0 0 0 −xg2xw2 −yg2xw2) −xw2
0 0 0 xg2 yg2 1 −xg2yw2 yg2yw2 −yw2
xg3 yg3 1 0 0 0 −xg3xw3 −yg3xw3) −xw3
0 0 0 xg3 yg3 1 −xg3yw3 yg3yw3 −yw3
xg4 yg4 1 0 0 0 −xg4xw4 −yg4xw4) −xw4
0 0 0 xg4 yg4 1 −xg4yw4 yg4yw4 −yw4
h1
h2
h3
h4
h5
h6
h7
h8
h9
= 0, (3.6)
where xg/wi and yg/wi, are the components of each point. The matrix formed by hi in
Equation (3.6) is the homography matrix. It maps image to world coordinates as
xw
yw
zw
=
h1 h2 h3
h4 h5 h6
h7 h8 h9
xg
yg
1
, (3.7)
where [xw,yw,zw] are the coordinates in the world and [xg,yg] in the image. We will call
the rectified image of the region from the water plan as warped image, W .
In addition to the warped image, we calculate the view direction in the world, ~v, for
every point in the warped image. This is possible by subtracting the camera coordinates,
C, from points coordinates in the world system of coordinates. This entire process is
done only one time because for every image we are always selecting the same region to be
warped and the camera is fixed.
The next steps use the warped image. Figure 3.5 shows the flowchart of the process
to estimate the normal vectors of the water surface, the green step is responsible for
estimating the discrete height map. In the warped image, each pixel corresponds to a
centimeter square. We decided to get the normal vector by approximating the geometry
of the water with an adaptation of Shape from Shading (Section 2.2), in a similar fashion
that was employed by Li et al. [3]. The use of this technique requires considering the water
as a Lambertian surface and a unique pointwise light source for the scene. As depicted
in Figure 3.6, the water reflects the sky depending on the incident light direction. Hence,

14
Figure 3.4: The first image is the original picture with the vanishing line and selected
region that will be rectified in orange. In this case, the original image has 4000 × 6000
pixels. The second image maps each square centimeter of the selected region to a pixel.
In this example, a 2700 × 4000 centimeters area in the world becomes an image of the
same size in pixels.
the water is not a Lambertian surface. In addition, even if we ignore other sources of light
inside the scene because it is an outdoor one, we can consider the existence of diffuse light
coming from almost all directions.
To solve this issue, we take concepts from the reflectance law [9]. Given a partially
reflective surface, part of the incident light will be reflected and part will be refracted by
a semi-transparent material. To simplify, we only assume that the water will be reflecting
a single point in the sky. The complete reflectance is the integral of all the lights that
could reach that point. The result is a simplified Fresnel equation [9]
cFresnel = crefract(1− (1− ~v.~d)k) + creflect(1− ~v.~d)k, (3.8)
where ~v is the viewer direction, ~d is the estimated normal vector of the surface and k is
called Fresnel power (typically 5). It is worth pointing that ~n corresponds to the normal
vector of the mean water plane, on the other hand, ~d is the normal vector of the waves
on the water. crefract is the color when the light is completely refracted and creflect when
it is totally reflected. For a gray scale image, the crefract is considered to be the minimum
intensity in the image, Rmin, in a scenario that the Guanabara bay absorbs almost all
light. For creflect, we consider that the maximum intensity is the maximum value in the
image, Rmax. We consider k = 5, as it is typically used in the Fresnel equation. The

15
Images from the
water surface.Warpped Image
Iterations from
our Shape from
Shading approach.
Calculating the
viewer direction for
the warped image.
Height map
recovered from a
single image.
Parameters from
the reconstruction
, matrix P.
Derivatives(x, y, z)
from the
reconstructed
image
Figure 3.5: Flow diagram with the steps used to reconstruct the water surface height. So,
given an image, we already have calculated that transformation and the viewer direction
of the are on the water surface. With this information we can iterate our Shape from
Shading approach.
(a) Water color on a sunny day (b) Water color on a cloudy day
Figure 3.6: Comparison showing the effect of the sky color on the water.
result is the reflectance taking the form:
R = Rmax(1− ~v.~d)5 +Rmin(1− (1− ~v.~d)5). (3.9)
In our implementation of Shape from Shading we use the equation above as the
reflectance model, instead of R = ~i.~d, where ~i is the illumination direction and ~d is the
normal vector. The 3D reconstruction allows us to get the viewer direction, as we have
the camera position and the point coordinates. The other difference to [3] is the derivative
defined in Equation (2.5) which becomes
df(Zn−1(x,y))
dZ(x,y)= (Rmax(1− ~v.~d)4 +Rmin(1− (1− ~v.~d)4))
df(Zn−1(x,y))
dZ(x,y). (3.10)
This is possible because the classic approach assumes the reflectance as the Equa-
tion (2.7). So basically, it is a dot product. Deriving f (2.4) by Zn−1, as it is defined
in the classic approach, is deriving the negative reflectance because the input image is
constant. Therefore, when we derive f (2.4) with Equation (3.9) as the reflectance model

16
and applying the chain rule we obtain
df(Zn−1(x,y))
dZ(x,y)= (max(1− ~v.~d)4 +min(1− (1− ~v.~d)4))
dg(~v, ~d)
dZ(x,y), where g(~v, ~d) = −~v.~d.
(3.11)
As in the case of the classic approach the derivative is a dot product, but instead of
~i, for the illumination direction, we have ~v for the viewer direction. Considering this simi-
larity, we use the Equation 2.5 with ~v substituting~i, to calculatedg(~v, ~d)
dZ(x,y). A detail in this
case is that both ~d anddg(~v, ~d)
dZ(x,y)are calculated using the normalized [∂Z
n−1(x,y)
∂x,∂Z
n−1(x,y)
∂y,1].
The final equation to calculate the estimated is:
Zn(x,y) = Zn−1(x,y)− W −R
df(Zn−1(x,y))
dZ(x,y)
, (3.12)
where the derivative Equation (??)was defined in the previous paragraph and W − R is
the difference between the warped image and the calculated reflectance. The previous
equation is part of an iterative process, as it happens on [1].
After the iterations, Z(x,y) will have the discrete height map. The components of
the normal vector, called here as [dx,dy,dz], are calculated according to Z. The components
dx and dy are calculated using the Sobel filter. We use this filter because it mitigates the
effects of the discretization as the filter considers the adjacent regions, a 3X3 region
centralized on the pixel. The component dz is assumed to be 1. Then, we normalize the
normal vector as:
[dx,dy,dz] =[dx,dy,1]√d2x + d2y + 1
. (3.13)
3.1 Results on Water Surface Reconstruction
In this section, the results from the geometric reconstruction of the water surface
will be presented. We could not define a ground truth for the reconstruction, as it is
impossible for us to acquire the true normal vectors of the water without a scanner. An
option would be using a tool to create a simulation of the water. However, time constraints
and the skill necessary to create a similar scene to what this work is dealing with made
us avoid this approach.
We propose a qualitative analysis that compares the similarity between the image
that we use as input and the output of the algorithm. We show the normal vector direction

17
and how it aligns to our assumptions previously mentioned in this chapter. As examples,
here we present four images, in different situations in terms of the amount of movement
of the water. In Figures 3.7, 3.9, 3.11 and 3.13, we tried to select four different situations
regarding normal, high, short and noisy waves, respectively.
The original image has 4000 × 6000 pixels. The projection considered an area of
2700 × 4000 cm2 and the height of the camera was 2390cm above the sea level. Then
we resize the image by a factor of 13. The result of this geometric transformation is in
each letter (c) of Figures 3.7, 3.9, 3.11 and 3.13. The reconstruction processes have two
thresholds to stop the iterations. The first is 12 iterations and the second is a maximum
height above 1000 (on the whole surface). The second usually limited the process in five
iterations. A Gaussian filter with variance of 0.7 is applied over the image before the
algorithm to smooth the surface, minimizing the effects of high-frequency oscillations.
Additionally, after the reconstruction a median filter, with the window size of 21, removes
outliners that may appear. The algorithm tends to create small bumps with significant
height. The median filter removes this problem as it does with salt-and-pepper noise.
Considering the axis x, y and z where the z represents the height, the projection on the
plane xy are the second image on the second column of the Figures 3.7, 3.9, 3.11 and
3.13. The reconstruction was plotted with gray-scale colors and a pointwise illumination
positioned on the infinite, trying to emulate the lighting effect on the original image. As
we are not reconstructing with the water BRDF function, texture and other details, the
appearance is more similar to plastic or metal.
The results in Figures 3.7, 3.9, 3.11 and 3.13, letters (b) and (d), are similar to
the input images. However, when the heights are considered, they are still not similar
to the real ones. Typically, the maximum height after the reconstruction does not reach
one. This is clearly not the correct height. In fact, the algorithm does not converge to
a specific height. In order to deal with this issue, we decided to scale the height as they
stay in a specific range to a more suitable one. The results displayed in this section are
multiplied by 10.
Figures 3.8, 3.10, 3.12 and 3.14 present the vectors components as colors. Thus,
the x, y and z components of the derivative will be mapped respectively to the red, green
and blue color components of the RGB image. The normal vectors follow the assumption
that the components directed to the camera will be darker, both in the color image as

18
(a)
(b)
(c) (d)
Figure 3.7: An average wave image is captured. Image (a) presents the selected area
that will be rectified, while (b) shows the reconstructed surface in a similar point of
view of (a). The rectified image is presented at (c) and the reconstructed surface at
(d). The green rectangles correspond to regions where the reconstruction was satisfactory
comparing (a) to (b) and (c) to (d). The regions highlighted by the red frames depicts
regions where the reconstruction was not satisfactory.
well as in the normal vector image, as they will not be reflecting the sky but refracting
the light.
Although the reconstruction can be similar, it is not entirely correct. Some details,
as oscillations similar to wrinkles, are not reconstructed. Instead, they tend to disappear.
Spume also becomes “false waves” and gain a height that does not match the reality.
Figure 3.13 depicts this situation as the blob on the lower right corner becomes a bump.
That structure is not observed in the original image.

19
Figure 3.8: The normal vectors from Figure 3.7d, where ‖~d‖ = 1 and[dx, dy, dz]
T + 1
2corresponds to red, green and blue, respectively, in the colored image.
(a)(b)
(c) (d)
Figure 3.9: An high wave image is captured, (a) presents the selected are that will be
rectified, (b) has the reconstructed surface in a similar point of view of (a). The rectified
image is presented at (c) and the reconstructed surface at (d). The green rectangles
correspond to regions where the reconstruction was satisfactory comparing (a) to (b)
and (c) to (d). The red are the opposite, regions where the reconstruction does not
approximately match the reality.

20
Figure 3.10: The normal vectors from Figure 3.9d, where ‖~d‖ = 1 and[dx, dy, dz]
T + 1
2corresponds to red, green and blue, respectively, in the colored image.
(a) (b)
(c) (d)
Figure 3.11: An short wave image is captured, (a) presents the selected are that will be
rectified, (b) has the reconstructed surface in a similar point of view of (a). The rectified
image is presented at (c) and the reconstructed surface at (d). The green rectangles
correspond to regions where the reconstruction was satisfactory comparing (a) to (b)
and (c) to (d). The red are the opposite, regions where the reconstruction does not
approximately match the reality.

21
Figure 3.12: The normal vectors from Figure 3.11d, where ‖~d‖ = 1 and[dx, dy, dz]
T + 1
2corresponds to red, green and blue, respectively, in the colored image.
(a)(b)
(c)(d)
Figure 3.13: An image with noise, probably foam, is captured, (a) presents the selected
are that will be rectified, (b) has the reconstructed surface in a similar point of view of
(a). The rectified image is presented at (c) and the reconstructed surface at (d). The
green rectangles correspond to regions where the reconstruction was satisfactory compar-
ing (a) to (b) and (c) to (d). The red are the opposite, regions where the reconstruction
does not approximately match the reality.

22
Figure 3.14: The normal vectors from Figure 3.13d, where ‖~d‖ = 1 and[dx, dy, dz]
T + 1
2corresponds to red, green and blue, respectively, in the colored image.

Chapter 4
Random Number Generation
The generation of random numbers depends directly on the normal vectors. How-
ever, the technique used to acquire the normal vectors is ignored by this part. Figure 4.1
presents a flow diagram with each step of the generation.
With the reconstructed geometry (with a normal vector associated with each pixel)
for an image, we sample the normal vectors map using a predefined set of points, L.
Actually, they are pairs of points that will give two normal vectors, so
L = {(i,j)|(i,j)are indexes of normal vectors}. (4.1)
The angle between each pair is calculated using Equation (4.2). However, any sampling
pattern in this part could result in some correlation between the location and the angle.
To avoid this, we use a weaker random number generator (one that fails in the tests
defined at Section 4.1). The angles are calculated accordingly to
θ = cos−1(~d(i).~d(j)), (4.2)
where i, j are indexes from the weak set of random numbers L, defined at Equation (4.1).
The final step consists on turning the angles into binary numbers. This turns out
to be critical, as we have to force the realization of a Bernoulli variable, which takes 1 with
a certain probability and zero with another. For a uniform distribution this probability
is equal to 0.5. We do this by setting a threshold as the median of the set of angles (that
are different for each image),
b =
1, if θ > θ
0, otherwise
, (4.3)
23

24
Figure 4.1: Flow diagram with the steps used to generate random numbers from an image.
Notice that the generated numbers from the previous image are used to generate the next
set of random numbers.
where b is the bit, θ is the median and θ the angle. After enforcing this, the probability
mass function becomes
pb(b) =
12, if b = 1
12, if b = 0
0, otherwise
, (4.4)
where pb is the probability mass function over the random variable b, that is the bit,
generated on (4.3).
Although the pairs used to sample the normal vectors come from a weak random
generator (Equation 4.1), using them for every image still caused bias on the generator.
To avoid this, each image is sampled by a constant set of pairs combined with the random
numbers generated by the previous image. This combination is basically summing and
making sure that the index is a valid one (taking the module by the maximum index):
L = (⌊ i+ r
max#d⌋, ⌊ j + t
max#d⌋), (4.5)
where r, t are random numbers generated by the previous image and max#d is the
maximum number of random values generated by one image.
4.1 Methodology for Testing Random Number Gen-
eration
The validation is directly related to the final result, so, to the generated random
numbers. Consequently, testing them define how good they are randomly. In terms of

25
tests, we used two sets. The first one is a set that we will call as mathematical tests.
It tries to identify less subtle deviations on the generation with statistical and geometric
tests. The second set is composed of just statistical tests defined by the National Institute
of Standards and Technology, from the USA [10]. However, first it is necessary to define
some concepts from statistics that will be used in the tests and what a random number
is. In addition, how these tests are able to assure these feature.
A random phenomenon is one that it is impossible to predict the result, regardless
of the total number of possible results. Thus, considering a computer, that only deals
with binary numbers, it is an event with a given probability of generating an 1 or 0.
In a statistical point of view, the uniform distribution is expected when the amount of
generated numbers tends to increase. Another characteristic is unpredictability, i.e. the
next output of the generator should be independent of any previous results.
As randomness is a statistical property. Different statistical tests can be used to
define patterns on a sequence. Actually, the tests try to prove a null hypothesis, that
would be, the sequence is made of random numbers. It is possible that an infinity of tests
exists, as there might exist a distribution that a generator will start to fit in at some
point. As a result of this, no set of tests is considered complete.
In spite of this, our set was defined to join a group comprised of basic tests and
a group of more complex tests. The former can be considered shallower, but they can
quickly exclude a non-random number. The later looks for a more official and standardized
assurance. So it employs more detailed and descriptive tests, besides coming from a
recognized institution (National Institute of Standards and Technology).
4.1.1 Mathematical Tests
The first set of tests includes five mathematical tests and the source code is available
in the page of Fourmilab [11]. This test was used for another well known random number
generator that comes from atomic decay, Hotbit [5].
Entropy - Given an random variable f on the finite alphabet denoted byA = {a1,a2,...,a||n||}.The entropy, H, is defined over the discrete probability distribution of the elements
from this alphabet.
H(f) =∑
a∈A p(f = a)log(1/p(f = a))

26
In this case, this function has log in base 2 as we are dealing with binary information
and we will be counting the entropy in a byte. So the maximum entropy will be
eight because of the 256 possible combinations of bits.
Chi-square Test - This test is the same presented in Section 2.3.2. It considers 256
elements in the alphabet, so the compared distribution is uniform, having one of
probability 1256
for each possible outcome. As a result, the degree of freedom is 255
and the level of confidence is 1%.It also establishes more limits for the percentage,
if it is between 1% and 5% it is considered suspect and up to 10% it considers it
“almost suspect”.
Arithmetic Mean - This is less a test and more a useful information to indicate some
closeness to randomness. For an infinity amount of numbers generated randomly,
their mean value should get closer to 127.5. The test calculates the mean and
compares it to 127.5.
Monte Carlo Value of π− The test uses the fact that the ratio between the area of
a circle inscribed inside a square and the area of the square is π4. The area of the
square is (2r)2 and the circle is πr2. Consequently, for N selected points, Nπ/4 of
them will fall inside the circle.
The test consists of selecting groups of 6 bytes from the data to be analyzed. The
first three corresponds to X and the last three to Y coordinate. If the points fall
inside the circle then X 2 + Y 2 < r2 and it is considered a hit. We can approximate
π as4#Hits
N. The test points the error between the calculated and the value of π
defined as a constant.
Serial Correlation Coefficient - Given two sets of quantities (U,V ) the correlation
coefficient between them has the following formula [12]:
C =n∑n
i=1(UiVi)−∑n
i=1(Ui)∑n
i=1(Vi)√(n
∑ni=1 U
2i −
∑ni=1 U
2i )(n
∑ni=1 V
2i −
∑ni=1 V
2i )
.
The correlation lies between [−1,1] and the sets are totally uncorrelated for 0 and
linearly dependent in the limits. In the case of this test, the idea is to compare the
element with the next one in the sequence of random numbers generated. The first
set will have numbers from [x0,xn−1] and the second [x1,xn].

27
4.1.2 NIST Tests
The second set of tests has a very detailed description in the report [10]. However,
here the tests will be described to the point where it is possible to implement them. For
this purpose, some formulas and explanations were omitted.
Frequency Test - This test focus on the proportion of zeros and ones. In a random
sequence they should happen with similar frequency. Considering the sequence of
bits ε = ε1, ε2, ..., εn, the test applies the transformation Xi = 2ε−1 to the sequence.
After this, all the elements are summed, Sn =∑n
i=1Xi. The next step is based on
the De Moivre-Laplace theorem, for a large number of trials, the probability of the
binomial sum, normalized by√n, named here as Sn, approximates to the cumulative
normal distribution (defined here as φ).
For an normal distribution with σ2 = 1, where σ2 is the variance. The comple-
mentary error function (erfc( X√2) gives the probability that a measurement X with
normally distributed errors has a distance less thenX from the mean value 2φ(z)−1.
So, if X is Sn, the probability will indicate how likely that value can happen with
the mean equal to 0. The complementary function is defined as.
erfc(z) = 2√π
∫∞ze−u2
du
In this test, if the probability is too small, i.e., less than 0.01, it means that Sn is
too large. In such a case, the sequence is considered not random.
Frequency Test with a Block - This test tries to identify parts of the sequence that
deviate from the ideal proportion of 50% of ones and zeros. The data is split in N
non-overlapping sequences, each with M elements. For each separate sequence, the
number of ones is calculated and the distribution is compared to the ideal of 0.5
using the Chi-square test. The Chi-square statistic assumes the formula,
X2 = 4M∑N
i=1[πi − 12]2.
where π is the observed frequency in each sequence of size M . With the statistic we
can apply the Chi-square test (section 2.3.2). The number of subsequences defines
the degree of freedom.

28
The probability from the incomplete gamma function greater than 0.01 indicates
that the null hypothesis is not false (i.e., the sequence is random).
Run Test - The term “Run” here is defined as an uninterrupted sequence of the same
value, i.e., zeros or ones. This test tries to define if the switching between the two
values is satisfactory. Initially, the proportion of ones is defined as π� =
∑j εj
n,
where n is the total number of elements and εj is an element of the sequence to test.
The function to consider is
erfc
( |Vn(obs)− 2nπ�(1− π�)|2√2nπ�(1− π�)
).
Vn is defined as
Vn =∑n−1
k=1 r(k) + 1
r(k) = 0, if εk = εk + 1
r(k) = 1, otherwise
.
For the limit where n → ∞ the function|Vn(obs)− 2nπ�(1− π�)|
2√2nπ�(1− π�)
goes to the
cumulative standard normal distribution.
The decision rule is applied to the complementary error function (erfc) at 1%. For
an error less than 1% the test fails. Vn increases with the variation of bits. So
extreme values of the function are penalized. For more information, see Section 3.3
of the report by NIST [10].
Longest Run of Ones in a Block - This test consists in breaking the sequence, ε, of
n bits in N blocks of size M . The length of the block can assume three different
values (8, 128, 10000) depending on the sequence.
The idea is to compare the frequency of the longest run within a sequence against the
expected one. The Chi-square test is applied in this case. Initially, the frequencies
are tabulated in the following table.

29
Table 4.1: Different cells according to the size of each block. For every cell an specific
frequency or a range (in the extremes)
vi M=8 M=128 M=10000
v0 ≤1 ≤4 ≤10
v1 2 5 11
v2 3 6 12
v3 ≥4 7 13
v4 8 14
v5 ≥9 15
v6 ≥16
The statistical measurement to test is
χ2(obs) =
∑Ki=0(vi −Nπi)
2
Nπi.
The principle is to compare the frequency against the expected concentration of
ones within the block. So, πi is the same π� defined for the run test, but inside a
block. A large value defines a nonrandom sequence (with the presence of clusters).
Finally, the incomplete gamma function yields the tested value. So, for the Chi-
square function (as explained in the second test) the degree of freedom is K/2 and
x = χ2/2. A value less than 0.01 indicates a random sequence. More details about
this test is presented in Section 3.4 of [10].
Binary Matrix Rank Test - This test focus on finding out linear dependencies among
subsets of bits with length n. The sequence ε is broken in O disjoint matrices of P
rows and Q columns, both sets with size 32.
The main idea is to apply the Chi-square test comparing the observed value with
the expected number of ranks, assuming randomness in the original sequence. Each
matrix will have its binary rank defined. According to it, they will be grouped into
three categories: FM for full rank matrices, FM−1 for matrices of full rank -1 and
N − FM − FM−1 for the remaining cases.
The test statistic is defined as

30
χ2(obs) =(FM − 0.2888N)2
0.2888N+
(FM−1 − 0.5776N)2
0.5776N+
(N − FM − FM−1 − 0.1336N)2
0.1336N.
The definition of these constants multiplying the number of matrices can be found
in Section 3.5 of the report by NIST [10].
Finally, the critical value is calculated using the incomplete gamma function with
N/2 degrees of freedom and Chi-square value divided by 2. Results of less than 0.01
indicate that the null hypothesis is false, i.e. the sequence is not random.
Fourier Transform Test - This test focuses on the peaks of the Fast Fourier Transform
of the sequence. Periodic features exceeding 95% of the maximum value should not
surpass significantly 5% of the sequence frequencies. Initially, a sequence of bits, ε, is
transformed into the domain +1,−1 by the function 2εi−1, resulting in the sequence
ε�. The Discrete Fourier Transform will produce complex variables representing the
periodic components of the frequency. The peaks of the n/2 elements of the sequence
ε� are the modules of the complex variables.
The 95% threshold is given by τ =√(log 1
0.05)n. In a random sequenceN0 = 0.95n/2
of the elements shout not exceed τ . This value is compared to the total number of
peaks less than τ , named as N1.
The complementary error function of d =N1 −N0√n 0.95 0.05
4
over√2, returns the prob-
ability of d ∈ [−d, d]. If it is less than 0.01 then the sequence is considered not
random, as the mean value would be 0. The strategy is similar to the one used on
the frequency test. Please, refer to Section 3.6 of [10] for details.
Non-overlapping Template Test - Given a set of templates with sizem, the sequence
of bits ε of size n is tested. The main idea is to compare the observed number of
matches with the expected one in a random sequence. To perform this test the
entire sequence is broken in N strings of M bits each.
A template B, with size m, is compared against a window in the block. If there is
a hit then the window slides to the next bit that was not matched. On the other
hand, it just advances a single bit. Assuming randomness the mean and variance of
the hits are, respectively,
31
µ =(M −m+ 1)
2m, σ2 =M(
1
2m− 2m− 1
22m).
In this work, there will not be any further explanation about this values. More
information can be found in Section 3.7 of [10]. The statistic test is the Chi-square
test. Defining the number of hits as W ,
χ2(obs) =∑N
j=1
(Wj − µ)2
δ2.
As it happened for the previous tests, the critical value is defining by calculating
the incomplete gamma function of half the number of blocks and the statistic value.
For a value less than 0.01 the sequence is not random.
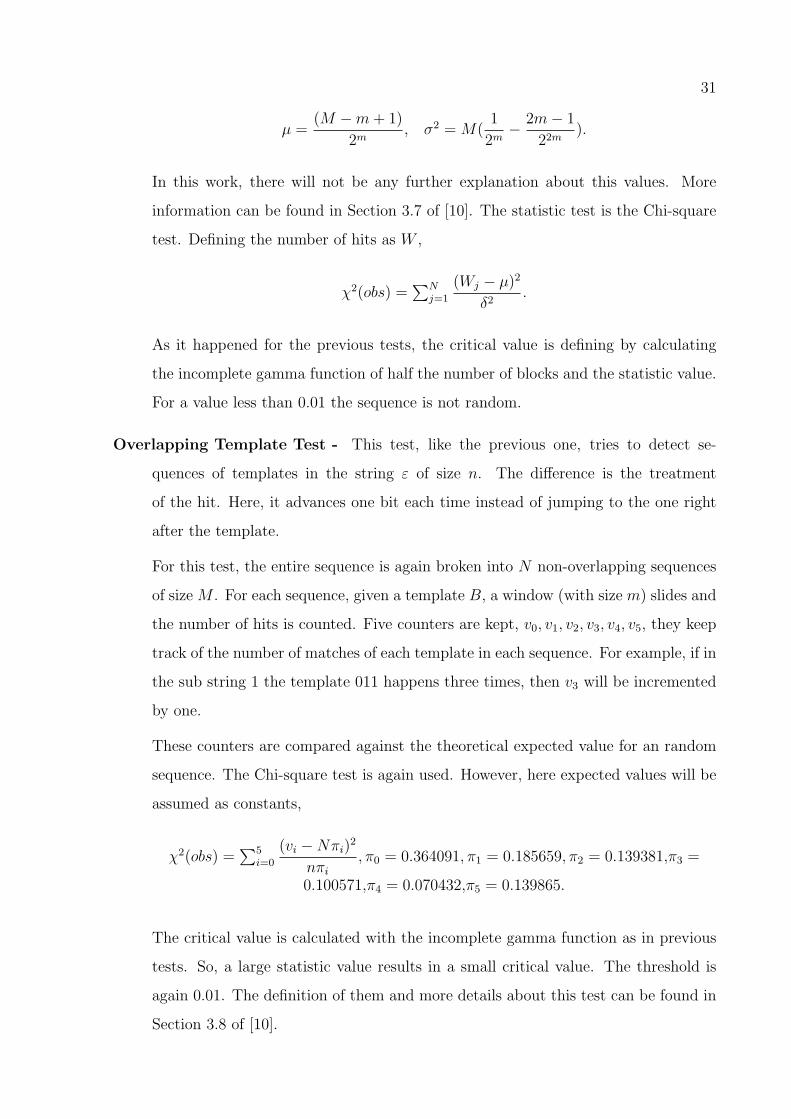
Overlapping Template Test - This test, like the previous one, tries to detect se-
quences of templates in the string ε of size n. The difference is the treatment
of the hit. Here, it advances one bit each time instead of jumping to the one right
after the template.
For this test, the entire sequence is again broken into N non-overlapping sequences
of sizeM . For each sequence, given a template B, a window (with size m) slides and
the number of hits is counted. Five counters are kept, v0, v1, v2, v3, v4, v5, they keep
track of the number of matches of each template in each sequence. For example, if in
the sub string 1 the template 011 happens three times, then v3 will be incremented
by one.
These counters are compared against the theoretical expected value for an random
sequence. The Chi-square test is again used. However, here expected values will be
assumed as constants,
χ2(obs) =∑5
i=0
(vi −Nπi)2
nπi, π0 = 0.364091, π1 = 0.185659, π2 = 0.139381,π3 =
0.100571,π4 = 0.070432,π5 = 0.139865.
The critical value is calculated with the incomplete gamma function as in previous
tests. So, a large statistic value results in a small critical value. The threshold is
again 0.01. The definition of them and more details about this test can be found in
Section 3.8 of [10].

32
Maurer’s “Universal Statistical” Test - This test focuses on how much the sequence
can be compressed. According to its author, the test is designed“to be able to detect
one of the very general classes of statistical defects that can be modeled by an ergodic
stationary source with finite memory”.
The test splits the sequence ε, of n bits, into two sets of non-overlapping blocks.
The first one has size Q bits and is an initialization sequence. The other one, with
size K bits, is the one to be analyzed. Each block has size M .
With the initialization sequence an table is created, it relates the last occurrence of
each sub sequence of size M .
The test goes through all blocks in the testing sequence and replaces the last occur-
rence of each possible block. In addition, a variable accumulates the log2 distances
to the last occurrence of the current block. The statistical test is then defined by
this sum divided by K (the total number of blocks that are tested).
The critical value is given by calculating the complementary error function of
ρ = erfc(|fn−expectedV alue(M)sqrt2δ
|),
where the critical value. In this work, the explanation of this formula as the
ones for the expected value (table 4.2) and variance (σ2 =
√variance(M)
K), c =
0.7− 0.8
M+ (4 +
32
M)K−3M
15will be omitted. More information can be found in the
section 3.9 of [10].

33
Table 4.2: Expected values and variances for every possible length of L
L expectedValue variance
6 5.2177052 2.954
7 6.1962507 3.125
8 7.1836656 3.238
9 8.1764248 3.311
10 9.1723243 3.356
11 10.170032 3.384
12 11.168765 3.401
13 12.168070 3.410
14 13.167693 3.416
15 14.167488 3.419
16 15.167379 3.421
In this test, if the critical values differ significantly from the expected values, then
the sequence is random if the critical value is greater than 0.01.
Linear Complexity Test - Linear feedback shift register is a type of electronic circuit
known for producing pseudo-random sequences. However, the register generates a
repetition of a sequence of bits, so the longer the sequence the more similar to a
random generator.
Given a sequence ε, of length n, N sub sequences of M bits are created. For each
block, the Berlekamp-Massey algorithm calculates the shortest linear feedback shift
register sequence that generates the bits at M . The idea is that by summing, in
a certain manner, previous bits modulo 2 should generate the next element of the
sequence.
The Chi-square measurement is given by∑k
i=0
(vi −Nπi)2
Nπi, where π0 = 0.010417,
π1 = 0,03125, π2 = 0.125, π3 = 0.5, π4 = 0.25, π5 = 0.0625, π6 = 0.02083.
The variable vi is defined according to the result of the function Ti = (−1)M(Li −
µ) + 29, where µ is the theoretical mean µ =
M
2+
9 + (−1)M+1
36−
M3+
2
92M
. So, if

34
Ti ≤ −2.5 Increment v0 by one
−2.5 < Ti ≤ −1.5 Increment v1 by one
−1.5 < Ti ≤ −0.5 Increment v2 by one
−0.5 < Ti ≤ 0.5 Increment v3 by one
0.5 < Ti ≤ 1.5 Increment v4 by one
1.5 < Ti ≤ 2.5 Increment v5 by one
Ti ≥ 2.5 Increment v6 by one.
The critical value is the Chi-square probability with 6 degrees of freedom. A critical
value lower than 0.01 would indicate a deviation from the expected in a random
sequence. More details about these constants and the test, in general, can be found
at Section 3.10 of [10].
Serial Test - The focus of the serial test is to check whether the frequency of all possible
2m m-bits overlapping patterns match the expected value for a random sequence.
In a random sequence, the frequencies should be uniform.
The measure that defines how well the m-bits frequency match the expected fre-
quencies is defined as
∇ψ2m = ψ2
m − ψ2m−1, and ∇2ψ2
m = ψ2m − 2ψ2
m + ψm−2,
where
ψ2m =
2m
n
∑
i1...im
(vi1...im − n
2m)
ψ2m−1 =
2m−1
n
∑
i1...im−1
(vi1...im−1 −n
2m−1)2
ψ2m−2 =
2m−1
n
∑
i1...im−2
(vi1...im−2 −n
2m−2)2,
where vi1...im is the frequency of a specific bit pattern of size m.
The reference distribution for the test is the Chi-square. So, as it was defined in
previous tests, the incomplete gamma function defines the critical value.

35
ρ1 = igamc(2m−2,∇ψ2m), and ρ2 = igamc(2m−3,∇2ψ2
m),
where ρ is the critical value. Both values are compared to 0.01. If any of them is
larger then it means a non-uniformity. Please refer to Section 3.11 of [10] for more
details.
Approximate Entropy Test - This test compares the frequency of overlapping blocks
of two consecutive/adjacent lengths (m andm+1) against the expected for a random
sequence. Given a sequence of length n, the sequence is augmented by m−1 bits to
create n overlapping sequence of m bits. Considering two sizes of sequence m and
m + 1. For each of them, the incidence of each possible sequence is accumulated.
Considering the incidence of, for example, m = 3, there will be 8 accumulators, we
will call each one πi.
The test statistic is computed as χ2 = 2n[log2− ApEn(m)], where
ApEn(m) = ϕ(m) − ϕ(m+1) and ϕ(m) =∑2m−1
i=0 πilogπi.
The chi-square test applied over this statistic with 2m−1 degrees of freedom. This
can be calculated by P − value = igamc(2m−1,χ2
2), where igamc is the incomplete
gamma function, and the P − value is the critical value that is compared to 0.01.
If the variable id greater than 0.01, than it is considered random.
Cumulative Sums Test - The test checks if the cumulative sums of the partial se-
quences deviate from the expected value, 0. In a sequence, called here as ε and with
size n, composed by 1’s and -1’s, a random walk should generate a small cumulative
sum.
Given ε, the partial sums of successively larger sequences (S1, S2, S3, . . .) is computed
in the forward and backward mode.
So in the forward mode
S1 = X1
S2 = X1 +X2
...
Sn = X1 + ...+Xn and in the backwards mode S1 = Xn
S2 = Xn +Xn−1

36
...
Sn = Xn + ...+X1
The maximum absolute value between these two will be used to calculate the critical
value. Here, we will just present the formula to calculate it. More details can be
found in the Section 3.13 of the NIST report [10].
ρ = 1−∑(n
z−1)+4
(−nz
+1)+4
[Φ(
(4k + 1)z
sqrtn)− Φ(
(4k − 1)z
sqrt(n))
]+
∑(nz−1)+4
(−nz
−3)+4
[Φ(
(4k + 3)z
sqrtn)− Φ(
(4k + 1)z
sqrt(n))
],
where Φ is the standard cumulative normal probability distribution function and ρ
is the critical value.
For critical values less than 0.01, the sequence is not random.
Random Excursion Test Variant Given a bit sequence ε, 18 possible states of a cu-
mulative random walk are defined, [−9,−8, . . . , 8, 9]. Applying the function 2εi − 1
over the sequence yields a sequence of only -1 or +1, the new sequence will be called
X. The sum, in a random walk, should be always close to 0. The cumulative sums
are calculated in the following way and it always starts and ends on 0.
S1 = X1
S2 = X1 +X2
...
Sn = X1 + ...+Xn
An accumulator ξ(x) counts the occurrence of each possible state. For each state
the complementary error function test, defined below, will indicate the probability
of that sum, considering a random walk.
ρ = erfc
( |ξ(x)− J |2J(4|x| − 2)
),
where J is the number of times that the sequence is equal to 0 and ρ is the critical
value. A large deviation from randomness is indicated by ρ < 0.01.

37
4.2 Results on Random Number Generation
We applied the tests defined in the previous section to compare our generator with
three others. The first is the generator provided by the function rand(), on Visual Studio
2015. The second one is the rand() function provided by MATLAB. The third is the rand()
function provided by GCC. The last is the generator provided by RANDOM.ORG [6]. The
one from Visual Studio changes from C++ compiler to another. Unfortunately, we could
not define the pseudo-random generator used, the GCC uses the Linear congruential gen-
erator. We directly used the MATLAB generator. The default configuration uses the
Mersenne Twister generator with seed equals to 0. It also assures a uniform distribution
for the generation. The last generator is from the RANDOM.ORG [6], it uses atmo-
spheric noise to create the bits. It is stated that the generator passed the tests defined in
Section 4.1.2.
For MATLAB, GCC and C++ we simply created 10 million bits and saved then
in a file. For RANDOM.ORG, the website administrators keep a set of 1MB of bits,
generated every day. We combined bits from two different days to obtain the necessary 10
million. For our approach, we used a video, which resolution is 1020×1920 and frame rate
of 30 frames per second. We sampled this video taking one image every 50 frames. The
idea was to minimize the effects of similar images on the generation, given that the speed
in which the water changes is slower than the frame water, at least visually. Each frame
generates 20000 bits, therefore it was necessary 500 frames or approximately 7 minutes of
video to generate 10 million bits.
We split the 10 million bits into 10 sets. The table below shows the worst result
for every generator in each test from the Mathematical Test, defined on Section 4.1.1.
For example, in the Arithmetic Mean row, the result more distant to 127.5 was selected.
In the serial Correlation Coefficient, this value is 0. The only different is the Chi-Square
Test, where we defined a threshold of 1%. If the probability tested is less than this, we
consider the sequence not random. The table has the number of sequences that passed
this test. The Visual Studio generator was the only one that failed this test and it was
the one used to select the pairs of normal directions in our approach.
The NIST tests are defined in Section 4.1.2. We decided to count how many times
each sequence passed each test. While mostly we applied one test per set of a million bits
each, resulting in 10 tests. For the Cumulative Sums and Serial Test, there are actually

38
Table 4.3: Mathematical tests results using four different generators. Given a set of 10
million numbers, we split into 10 subsets of 1 million elements each. We selected the worst
result in each test, the exception is the chi-square test. In this specific one, we counted
the amount of sets that passed. The Visual C++ and the GCC generator failed a test,
all the chi-square tests.
Our MATLAB C++ GCC RANDOM.ORG
Entropy 7.99 7.99 7.99 7.99 7.99
Chi-Square Test 10 10 0 0 10
Arithmetic Mean 126.899 127.076 126.525 126.775 127.265
Monte Carlo Value
of π 3.169 3.135 3.178 3.181 3.134
Serial Correlation
Coefficient 0.006 -0.005 -0.003 -0.004 -0.003
2 tests. So for each sub-sequence two tests are applied and we summed the times they
passed. The threshold for each type of test is 8 out of 10 sequences passing the tests.
The Non-Overlapping Template consists of 148 tests, one for each template. In
Table 4.4, instead of summing them all we present a number of tests that passed, con-
sidering a minimum of 8 of 10. Each template will have its own 10 different tests. If it
fails more than two times, then the generator failed for that specific sequence of bits. For
example, the C++ generator failed for 5 templates whereas the other generators passed
them all.
The last one is the Random Excursions Variant test, because it requires a minimum
value of cycles (more information on Section 4.1.2), not all sequences are suitable for it.
However, the fact that the only generator not able to be tested was the same that failed
other tests indicates a possible failure.

39
Table 4.4: It has the results of the NIST tests after 10 sets of one million bits each. Tests
with * were calculated differently, Non-Overlapping Template basically applies a test for
each template and Random Excursions Variant depends on the bits to apply the test (the
set can allow less than 10 tests). Again the Visual C++ generator failed completely on 5
tests. In addition, the GCC failed on six tests.
Our MATLAB C++ GCC RANDOM.ORG
Frequency 10/10 10/10 0/10 1/10 10/10
BlockFrequency 10/10 10/10 10/10 10/10 10/10
CumulativeSums 20/20 20/20 0/20 2/20 20/20
Runs 10/10 10/10 0/10 0/10 10/10
LongestRun 10/10 10/10 10/10 10/10 9/10
Rank 10/10 10/10 10/10 9/10 10/10
FFT 10/10 10/10 10/10 10/10 10/10
NonOverlappingTemplate* 148/148 148/148 143/148 143/148 148/148
OverlappingTemplate 9/10 10/10 0/10 10/10 10/10
Universal 10/10 10/10 10/10 0/10 10/10
ApproximateEntropy 10/10 10/10 0/10 0/10 10/10
RandomExcursionsVariant* 10/10 7/7 -/- 1/1 6/6
Serial 20/20 20/20 18/20 20/20 20/10
LinearComplexity 10/10 10/10 10/10 10/10 10/10

Chapter 5
Final Remarks
We developed techniques to approach the generation of the normal vectors from
the water surface and the generation of the numbers from the normals. It uses geometric
reconstruction and a modified version of Shape from Shading [1] to estimate the discrete
height map. We then calculate the angles between vectors and make the information
binary so we can get the numbers.
As stated before, even though natural events are often used as source for ran-
dom number generators, the ones mostly used for TRNGs are hard to observe and even
dangerous. For example, either Hotbit or RANDOM.ORG require specific hardware.
Consequently, they are not as simple to implement as one that requires just a camera as
a sensor. Secondly, we extended a classic approach for the Shape from Shading problem
to work on images with natural and outdoor illumination, with distant objects and non-
Lambertian surfaces. Even though the results qualitatively are not as precise as expected,
we have a reconstruction that is able to generate random numbers from the variation of
the normal directions of the water surface. In addition, it still estimates surfaces with
detailed level of similarity to the observed one.
5.1 Limitations
As a consequence of depending on a camera to capture images, the random number
are generated only the time with daylight. The shape from shading technique also assumes
that we will be dealing with just water, with no presence of foam, boats, birds and many
other probable objects. We can notice the influence of this “noise” in the fourth example
40

41
of Section 3.1. The number of bits generated by a single image is another issue. In this
work, the maximum number of bits was 20000. We could generate more, meaning that
we would sample more normal vectors from each image. However, at some point this
could result in a spatial dependence between the bits, consequently, the generator could
fail some tests. This problem happens when we did not use previously generated (weak)
random indexes to scramble the pairs used in each iteration (see Chapter 3).
A specific test fails, the Fast Fourier Transform, this happens because by using
the same pairs, a pattern starts to emerge as the quantity of generated numbers increase.
Another limitation is the processing time, to process an image with MATLAB in an Intel
i5, 2.4 GHz, it takes approximately 15 seconds. With our current implementation, a larger
image would demand more processing time (if we desire to keep the same generation time).
Therefore, for an expansion of the number of random numbers created, it is necessary to
optimize the implementation of the proposed technique.
5.2 Future Works
The processing time is a critical problem to be approached. We understand that
most of the 15 seconds come from the Shape from Shading part of the technique. Con-
sequently, improvements on this part is a key factor. New techniques for Shape from
Shading still have to be researched to improve this results. Another area open for im-
provement is the use of previously generated numbers on the next steps. Although this
is not affecting the results, as the tests are passing, a better approach may exist. Perlin
noise [13] employs hashing techniques which can be a solution for this problem.
Bibliography
[1] T. Ping-Sing and M. Shah, “Shape from shading using linear approximation,” Image
and Vision computing, vol. 12, no. 8, pp. 487–498, 1994.
[2] M. Agrawal, N. Kayal, and N. Saxena, “Primes is in p,”Annals of mathematics, pp.
781–793, 2004.
[3] C. Li, M. Shaw, D. Pickup, D. Cosker, P. Willis, and P. Hall, “Realtime video based
water surface approximation,” in Visual Media Production (CVMP), 2011 Conference
for. IEEE, 2011, pp. 109–117.
[4] M. Yu and H. Quan, “Fluid surface reconstruction based on specular reflection
model,”Computer Animation and Virtual Worlds, vol. 24, no. 5, pp. 497–510, 2013.
[5] “Hotbits: Genuine random numbers generated by radioactive decay,” http://www.
fourmilab.ch/hotbits/, 2006.
[6] “Random.org,” http://www.radom.org, 2016.
[7] R. Hartley and A. Zisserman, Multiple View Geometry in Computer Vision. Cam-
bridge University Press, 2004.
[8] J. F. Kenney and E. S. Keeping, Mathematics of Statistics, Pt. 2. John Wiley and
Sons Inc., 1961.
[9] T. Akenine-Moller, E. Haines, and N. Hoffman, Real-time rendering. CRC Press,
2008.
[10] NIST, “A statistical test suit for random and pseudo-random numbers generators for
cryptographic applications,” Tech. Rep. JEITA CP-3451, April 2010.
42

43
[11] “Ent - a pseudorandom number sequence test program,” http://www.fourmilab.ch/
random/, 2008.
[12] D. E. Knuth, Art of Computer Programming, Volume 2: Seminumerical Algorithms.
Addison-Wesley, 1969.
[13] K. Perlin, “An image synthesizer,”ACM Siggraph Computer Graphics, vol. 19, no. 3,
pp. 287–296, 1985.
Copyright © 2022 FDOKUMEN