Guidance Manual for Compliance with the Filtration and ...
580
1 GUIDANCE MANUAL FOR COMPLIANCE WITHTHE FILTRATION AND DISINFECTION REQUIREMENTS FOR PUBUC WATER SYStEMS . USING SURFACE WATER SOURCES .- MARCH 1991 EDITION SCIENCE A N 0 TECHNOLOGY BRANCH CRmERIA AN0 STANOAROS DIVISION OFFICE OF DRINKING WATER US. ENVIRONMENTAL PROTECTION AGENCY WASHINGTON. D.C.
-
Upload
khangminh22 -
Category
Documents
-
view
1 -
download
0
Transcript of Guidance Manual for Compliance with the Filtration and ...

1
GUIDANCE MANUAL
FOR
COMPLIANCE WITH THE
FILTRATION AND DISINFECTION REQUIREMENTS
FOR
PUBUC WATER SYStEMS .
USING
SURFACE WATER SOURCES
.-
MARCH 1991 EDITION
SCIENCE A N 0 TECHNOLOGY BRANCH CRmERIA A N 0 STANOAROS DIVISION
OFFICE OF DRINKING WATER US. ENVIRONMENTAL PROTECTION AGENCY
WASHINGTON. D.C.

GU IOANCE MANUAL FOR
FILTRATION AND DISINFECTION REQUIREMENTS FOR
PUBLIC WATER SYSTEMS USING
SURFACE UATER SOURCES
' COMPLIANCE WITH THE
for
Science and fcchnlo y Branch C r i t e r i a and Standar 8 s Divis ion
Office o f Drinking Water U . S . Env i mnnten t a 1 Protect i on Agency
Washington, D.C.
Contract No. 68-01-6989 .
Malcolm Pirnie, Inc. 100 Eisenhower Drive .Paramus, New Jersey 07653
October, 1990
HDR En ineering, Inc. 5175 H 3 l l sda l c Circle Eldorado H i 11 s , CA 95630.
' . Acknowledgments 1 3
Preparation of this document involved important contributions from many people in two consulting engineering firms, several private consultants, and the United Stat~o,EnvironmentalProtectionAgency (USEPA). Malcolm .Pirnie, Inc., with technical contributions provided by HDR Engineeting Inc., conducted the day-to-day work under contract with the USEPA.
Principal authors from Malcolm Pirnie were David J. Hiltebrand and Linda Averell Wancho. Personnel from HDR involved in this work were Jerry Troyan and Perri P. Garfinkel. Additional personnel '
from Malcolm Pirnie who contributed to either the technical content or the preparation of the manual included: John E. Dyksen, James K. Schaefer, Scott L. Phillips and Peter E. Galant.
Private consultants who contributed to the document included: Dr. Appiah Amirtharajah, Georgia Institute of T.echnology, Atlanta, GA; Dr. Ovadia Lev, Hebrew University, J.erusalem, Israel: Dr. Vincent Oliveri, formerly John Hopkins University, Baltimore, MD: Dr. Phillip C. Singer, University of North Carolina, Chapel Hill, NC: Dr. Mark Wiesner, Rice University, Houston, TX.
Preparation of the document was overseen by Stig Regli, the USEPA project officer . Valuable technical review and major contributions to the text were provided by Thomas Grubbs, Office .of Drinking Water, USEPA, and Leigh Woodruff, Region X, USEPA.
. .
Special thanks are given to the following individuals working for USEPA whose review and comment on numerous drafts great,ly contributed to the evolution of this document: John Davidson, Office of Policy, Planning and Evaluation: Edwin Geldreich, Drinking Water Research Division, Office of Research and Development: John Hoff, formerly with Drinking Water Research Division, Office of Research and Development; Walt Jakubowski, Environmental Monitoring and Support Laboratory, Office of Research '
and Development; Dr. Gary Logsdon, formerly with Drinking Water Research Division, Office of Research and Development: Kevin Reilly, Region I: Margaret Silver, Office of General Council; and Jim Westrick, Technical Support Division, Office of Drinking Water.
Appreciation is also expressed to state public health officials, representatives of the drinking water industry, academicians, and the American public for their participation in submitting timely and insightful comments without which this document would not.have . been possible.
Some of the appendices have primary authors which are noted on the corresponding cover pages.
c
TABLE OF CONTENTS
1. INTRODUCTION
2. GENERAL REQUIREMENTS 2.1 Application
2.1.1 Types of Water Supplies
2.1.2 Determination of Applicable Sources
2.2 Treatment Requirements
2.3 Operator Personnel Qualifications
3. COMPLIANCE FOR SYSTEMS NOT FILTERING 3.1 Source Water Quality Criteria
3.1.1 Coliform Concentrations
3.1.2 TurbIdity Levels
3.2 Disinfection Criteria
3.2.1 Inactivation Requirements
3.2.2 Determination of Overall Inactivation for Residual Profile, Multiple Disinfectants and Multiple Sources and Multiple Sources
3.2.3 Demonstration of Maintaining a Residual
3.2.4 Disinfection System Redundancy
3.3 Site-Specific Conditions
3.3.1 Watershed Control Program
3.3.2 On-site Inspection
3.3.3 No Disease Outbreaks
3.3.4 Monthly Coliform MCL
3.3.5 Total Trihalomethane (TTHM) Regulations

4. DESIGN AND OPERATING CRITERIA FOR FILTRATION AND DISINFECTION TECHNOLOGY
4.1 Introduction
4.2 Selection of Appropriate Filtration Technology
4.2.1 General Descriptions
4.2.2 Capabilities
4.2.3 Selection
4.3 Available Filtration Technologies
4.3.1 Introduction
4.3.2 General
4.3.3 Conventional Treatment
4.3.4 Direct Filtration
4.3.5 Slow Sand Filtration
4.3.6 Diatomaceous Earth Filtration
4.3.7 Alternate Technologies
4.3.8 Nontreatment Alternatives
4.4 Disinfection
4.4.1 General
4.4.2 Recommended Removal/Inactivation
4.4.3 Total Trihalome.thane (TTHM) Regulations
5. CRITERIA FOR DETERMINING IF FILTRATION AND DISINFECTION ARE SATISFACTORILY PRACTICED 5.1 Introduction
5.2 Turbidity Monitoring Requirements
5.2.1 Sampling Location
5.2.2 Sampling Frequency
5.2.3 Additional Monitoring
5.3 Turbidity Performance Criteria
5.3.1 Conventional Treatment or Direct Filtration
5.3.2 Slow Sand Filtration
5.3.3 Diatomaceous Earth Filtration
5.3.4 Other Filtration Technologies
5.4 Disinfection Monitoring Requirements
5.5 Disinfection Performance Criteria
5.5.1 Minimum Performance Criteria Required Under the SWTR
5.5.2 Recommended Performance Criteria
5.5.3 Disinfection By-Product Considerations
5.5.4 Recommended Disinfection System Redundancy
5.5.5 Determination of Inactivation by Disinfection
5.6 Other Considerations

6. REPORTING 6.1 Reporting Requirements for Public Water Systems Not Providing Filtration
6.2 Reporting Requirements for Public Water Systems Using Filtration
7. COMPLIANCE 7.1 Introduction
7.2 Systems Using a Surface Water Source Not Ground Water Under the Direct nfluence of Surface Water)
7.3 Compliance Transition with Current NPDWR Turbidity Requirements
7.4 Systems Using a Ground Water Source Under the Direct Influence of a Surface Water
7.5 Responses for Systems not Meeting the SWTR Criteria
7.5.1 Introduction
7.5.2 Systems Not Filtering
7.5.3 Systems Currently Filtering
8. PUBLIC NOTIFICATION
9. EXEMPTIONS 9.1 Overview of Requirements
9.2 Recommended Criteria
9.3 Compelling Factors
9.4 Evaluation of Alternate Water Supply Sources
9.5 Protection of Public Health
9.6 Notification to EPA

List of Tables
Table Description 2-1 Survey Form for the Classification of Drinking Water Sources
4-1 Removal Capabilities of Filtration Processes
4-2 Generalized Capability of Filtration Systems to Accommodate Raw Water Quality Conditions
6-1 Source Water Quality Conditions for Unfiltered Systems
6-2 Long Term Source Water Quality Conditions for Unfiltered Systems
6-3 CT Determination for Unfiltered Systems Monthly Report to Primacy Agency
6-4 Disinfection Information for Unfiltered Systems Monthly Report to Primacy Agency
6-5 Distribution System Disinfectant Residual Data for Unfiltered and Filtered Systems - Monthly Report to Primacy Agency
6-6 Monthly Report to Primacy Agency for Compliance Determination - Unfiltered Systems
6-7 Daily Data Sheet for Filtered Systems
6-8 Monthly Report to Primacy Agency for Compliance Deterimination-FiItered Systems
7-1 Requirements for Unfiltered Systems
7-2 Requirements for Filtered Systems
2-1 Steps to Source Classification
3-1 Determination of Inactivation for Multiple Disinfectant Application to a Surface Water Source
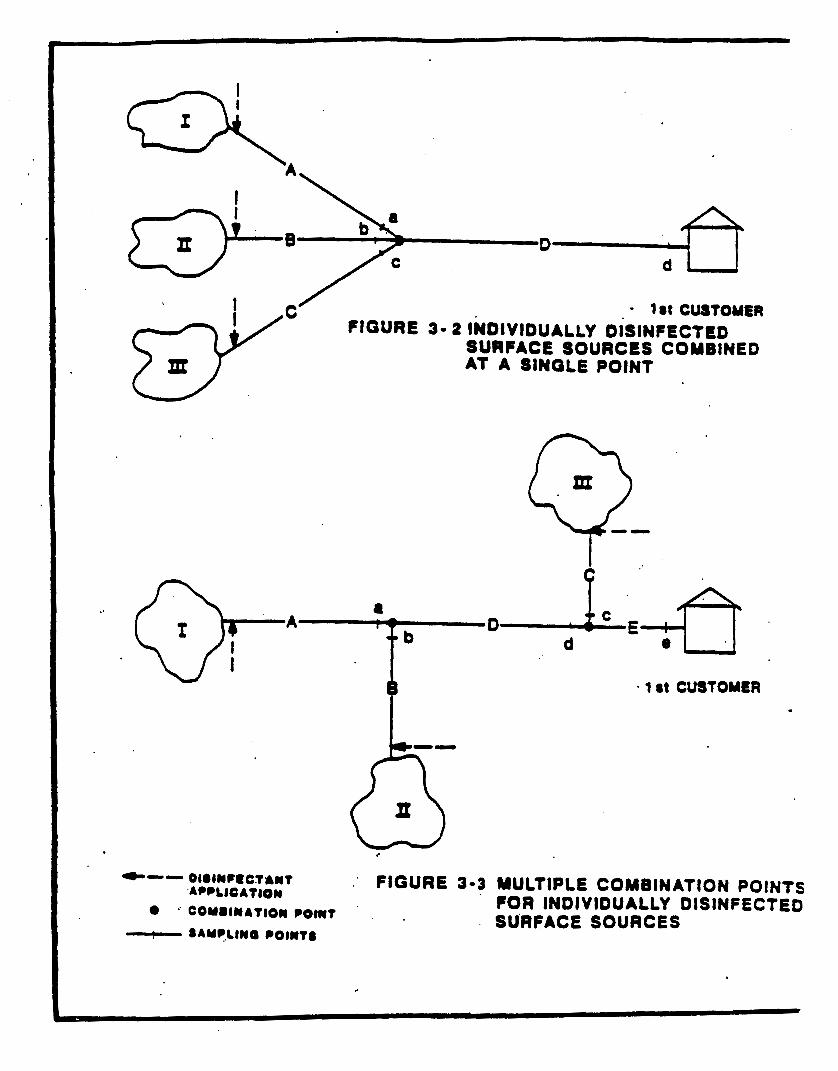
3-2 Individually Disinfected Surface Sources Combined at a Single Point
3-3 Multiple Combination Points for Individually Disinfected Surface Sources
4-1 Flow Sheet for a Typical Conventional Water Treatment Plant
4-2 Flow Sheet for Typical Softening Treatment Plants
4-3 Flow Sheet for a Typical Direct Filtration Plant
4-4 Flow Sheet for a Typical Direct Filtration Plant with Flocculation
LIST OF APPENDICES
Appendix Description A Use of Particulate Analysis for Source and Water Treatment Evaluation
B Institutional Control of Legionella
C Determination Of Disinfectant Contact Time D Analytical Requirements of the SWTR and a Survey of the Current Status of Residual Disinfectant Measurement Methods for all Chlorine Species and Ozone
E Inactivation Achieved by Various Disinfectants
F Basis for CT Values
G Protocol for Demonstrating Effective Disinfection
H Sampling Frequency for Total Coliforms in the Distribution System
I Maintaining Redundant Disinfection Capability
J Watershed Control Program
K Sanitary Survey
L Small System Considerations
M Protocol for Demonstration of Effective Treatment
N Protocols for Point-of-Use Treatment Devices
0 Guidelines to Evaluate Ozone Disinfection

1. INTRODUCflON
This Guidance Manual complements t h e f i l t r a t i o n and d is in fect ion treatment requirements for public water systems using surface water sources o r ground water under the d i rec t in f luence o f surface water promulgated i n 40 CFR Part 141, Subpart H. I n t h i s manual, these . requirements are referred, t o as i n t h e Surface 'Water Treatment Rule (SWTR) .
The purpose of t h i s manual i s t o provide guidance t o United States Environmental Protect ion Agency (USEPA) Regional Offices, Primacy Agencies and a f f e c t e d u t i l i t i e s i n t h e implementation o f t h e SWTR, and t o h e l p assure that implementation i s consistent. For example, the SWTR'sets treatment requirements which apply t o a large range o f source water
. conditions. The guidance manual suggests design, operating and perform- ance c r i t e r i a for speci f ic surface water qual i ty condi t ions to provide the optimum protect ion from microbiological contaminants, These, recomnenda- ,
t ions are presented as advisory guidel ines only; unl ike the provisions o f the SWTR, these recomnendations are not mandatory requirements. I n many cases, i t will ,be appropr ia te to ta i lor requi rements to spec i f ic circumstances; the guidance manual i s designed t o g i v e t h e Primacy Agency f l e x i b i l i t y i n establ ish ing the most appropriate treatment requirements f o r t h e systems w i t h i n t h e i r j u r i s d i c t i o n .
Throughout t h i s document, t he t e rn 'Primacy Agency" re fe rs t o a State wi th pr imary enforcndent responsib i l i ty for publ ic water systems or *primacylw or t o mean EPA i n t h e case o f a State that has not obtained primacy
I n o r d e r t o f a c i l i t a t e t h e use o f t h i s manual, it has been
c L
9
s t r u c t u r e d t o ' f o l l o w t h e framework o f Br ie f descr ip t ions o f the contents of presented i n t h e f o l l o w i n g paragraphs.
&LtiQlu This section provides' guidance
the SWTR as c losely as possible. each s e c t i o n o f t h i s manual are
for deterwining whether a water ' supply source i s subject to the requirements 0.f the SWTR inc lud ing the
determination o f whether a ground water source i s under the d i rec t
1-1
inf luence of surface water, i .e. at r isk for the presence of Giard ia cysts or other large microorganisms. The overall treatment requirements of the SWTR are.also presented, al.ong w i th nComnendations for the qua l i f i ca t ions o f operator personnel
%u?fu For systems which are subject to the requirements of the SWTR and
which do no t cur ren t ly p rov ide f i l t ra t ion , th is sec t ion p rov ides guidance t o t h e Primacy Agency for deterraining i f a given system:
Mtets the source water qual i ty cr i ter ia
Meets the disinfection requirements including:
- 99.9 and 99.99 percent inact ivat ion o f Giardia cysts and viruses and app l ica t ion o f the CT (d is in fectant res idual concentration x contact time) concept
- Point of e n t r y t o d i s t r i b u t i o n system requirements
- D i s t r i b u t i o n system requirements
- Prov i s ion f o r d i s in fec t i on system redundancy
Maintains an adequate watershed cont ro l program
Meets the on-si te inspect ion requir iments
t4as no t had an identif ied waterborne disease outbreak
Complies wi th the requirements of the revised Total Col i form Rule
Complies with Total Trihalormthane (TTHM) Rule
This sect ion per ta ins to systems which do no t meet the requirements t o avoid f i l t r a t i o n o u t l i n e d i n S e c t i o n 3 an,d therefore are requi red to i n s t a l l f i l t r a t i o n . Guidance i s 'given for ' the se lect ion o f an appropriate f i l t r a t i o n technology based on the source water qual i ty and the capabil i - t i e s o f various. technologies t o achieve the required perfonnance cr i ter ia. I n add i t i on , recomaended design and opera t ing c r i te r ia a re p rov ided fo r d i f f e r e n t f i l t r a t i o n t e c h n o l o g i e s .
1 -2

- 5
Section 5 presents guidance t o t h e Primacy Agency for determining ccnnpliance with t h e t u r b i d i t y and d i s in fec t i on performance nquitcments, and i n t u r n , whether f i l t r a t i o n and d i s in fec t i on a re sa t i s fac to r i l y practiced. Recomnendations are made f o r t h e l e v e l o f d i s i n f e c t i o n t o be provided i n order to met the overa l l t rea tment requ i rements o f the SWTR. This section describes how t o evaluate the adequacy o f d is in fec t ion us ing CT or other methods. .I
ssaiQR4 Section 6 provides guidelines t o t h e Primacy Agency far establ ishing
the reporting requirements associated with the SWTR. The requirements include report content and frequency, and are applicable t o b o t h f i l t e r i n g and nonf 11 t e r i n g systems . ss€uuLz
This section provides an overview o f the schedule f o r Primacy - Agencies and u t i l i t i e s t o meet the requirements o f t h e SWTR. Examples are *' _-
by systems which are not i n compliance with the treatment requirements. Section 8
examples o f events which would require noti f icat ion, language f o r t h e notices and the methods o f n o t i f i c a t i o n .
~ presented t o provide guidance for correct ive measures which can be taken ..
This section presents guidance on publ ic not i f icat ion. Inc luded are ..
sslJQL9 Section 9 provides guidance t o t h e Primacy Agency for determining
whether a system i s e l i g i b l e for an exemption. The c r i t e r i a f o r e l i g i b i l i t y f o r an exemption include:
, - Compellin factors (economic or resource l imi tat ions) - No avai l a % l e a1 ternate source - Protection o f publ ic heal th
This section' also provides guidance fo r eva lua t ing the f inanc ia l capab i l i t i es o f a water system, rev iewing the ava i lab i l i t y of al ternate sources and suggests i n t e r i m medsures for protecting publ ic health.
1 -3
AQufWs The manual also contains appendices which provide more deta i led
guidance i n s p e c i f i c areas. These include:
Appendix A - EPA Consensus od for Giard ia cvst An-
Several procedures’are available for Giardia cyst analysis i n water. I n 1983 the USEPA held a conference to es tab l i sh a consensus on the procedure t o be used i n the future. This consensus method wouid promote un i fo rm i t y i n t es t i ng and provide a basis for .future conparirons. The consensus method and the background data used t o develop i t are presented i n t h i s appendix.
Appendix B - I n s t i t u t i o n a l control of Leaionel l a
F i l t r a t i o n and/or disinfection provides protection frm m a . However, i t does not assure that recontamination .or regrowth will not ‘ ’
occur in the hot water or cool ing systems o f bu i ld ings within the d i s t r i bu t i on system. This appendix provides guidance fo r hon i to r i ng ,and treatment which can be used by i n s t i t u t i o n a l systems ior the cont ro l of Ltaionclla.
EDQendix c .) t e r n a t i o n of Ois infcctqat ntact Tw
I n many cases, the determination o f d is in fectant c.ontact times needed t o evaluate the CT of a water system will necessitate the use o f tracer studies. This appendix provides guidance f o r .conducting these studies. I n some cases i t nay not be p r a c t i c a l t o conduct a t race r study. For such cases guidance i s given for estimating the detention time based on the physical configuration o f the system.
1 -4

Appendix 0 - Analytical Re uirements of the SWTR and A Survey o 9r the Current Measurement Methods for all Chlorine .
, Status o f Residual DiSinfectant
5Decies and Orone This appendix includes a listing of the analytical methods required
under the SWTR. An executive turmrary of a report on the analytical methods used to measure the residual concentrations of the various disinfectants is included. The reliability and limitations of each of the
.X.’
methods are presented.
Appendix E - Inactivations Achieved e Various Disinfectants
. This appendix presents the log inactivations o f Eiardb cysts and viruses which are achieved at various CT levels by chlorine, chlorine dioxide, chloramines and ozone. Inactivations of viruses achieved by UV absorbance are a1 so included
d i x F 0 sis for CT Values -~ ’ This appendix provides the background and rationale utilized in
developing the CT values for the various disinfectants. Included is a ’ paper by Clark and Regli, 1990, in which a mathematical model was used in. the determination o f CT values for free chlorine.
c1
. Appendix G Protocol for Demonstrating Effective Disinfection
This appendix provides the reconmended protocols for demonstrating the effectiveness of chloramines, chlorine dioxide and ozone as primary disinfectants.
Appendix H - Samplin Frequency for Total Col iforms in t e Distribution W t e % .
The sampling frequency required by the revised Total Coliform Rule 54 FR 27544 (June 29, 1989) i s presented in this appendix.

Appendix I - Maintainin n t D is in fec t ion iliu
This appendix detai ls the condi t ions and equipment which should be maintained by a system using chlorine, chlorine dioxide, ozone or
'. chloramines t o assure tha t cdmpliance with the SWTR requirement for redundant d i s i n f e c t i o n i s met.
ndix J - tershed Control P r o m . - . This appendix provides a detailed outl ine o f a watershed program.
This program may be adjusted by the Primacy Agency t o serve the 'specific needs o f a pa r t i cu la r water system.
m e n d i x K Survey This appendix provides guidance f o r conducting a comprehensive
sani tary survey o f a supply source and i t s treatment and de l i ve ry t o t he consumer. Suggested elements o f an annual on-sfte inspection are included i n Section 3.
This appendix describes d i f f i c u l t i e s which may be faced by small systems i n complying wi th the SWTR along with guide1 ines f o r overcoming these d i f f i c u l t i e s .
Appendix M - Protocol for the Demonstration of Effect ive Treatment
This appendix presents p i l o t study protocols to evaluate the ef fect iveness of an a l t e r n a t e f i l t r a t i o n technology i n meeting * t h e performance requirements o f the SWTR. It presents the use o f p a r t i c l e size analysis for demonstrating the actual removal o f m d i a cyst achieved by a treatment. train. Guidance for conventional and d i r e c t f i l t r a t i o n p l a n t s t o demonstrate tha t adequate f i l t r a t i o n i s being' maintained a t e f f l uen t t u rb id i t i es between 0.5 and 1 Nephelometric Turb id i ty Uni t (NTU) i s also included.
1 -6

,/-"a\ i ; 1 A'
Appendix N - Protocol for Point 0 - of use Trwlmt Devices
I n s o a ~ 1 imited cases, it my be appropr iate to. instal i point-of-use (POU) or point-of-entry (WE) treatment devices as an i n te r im measure t o provide protect ion to the publ ic heal th. This appendix provides a protocol for evaluat ing and determining the ef f icacy of POU/WE treatment - devices . Appendix 0 - Guidelines t o - Evaluate Ozone Ofsinfect ion
The CT evaiuation used fo r o ther d is in fec tan ts i s i nappropr ia te fo r ozone. This appendix presents a l ternat ive wthods for evaluatfng the dis infect ion ef fect iveness of ozone systems.
- s . 2
4. *C
*- 1
- ..
1-7
2.
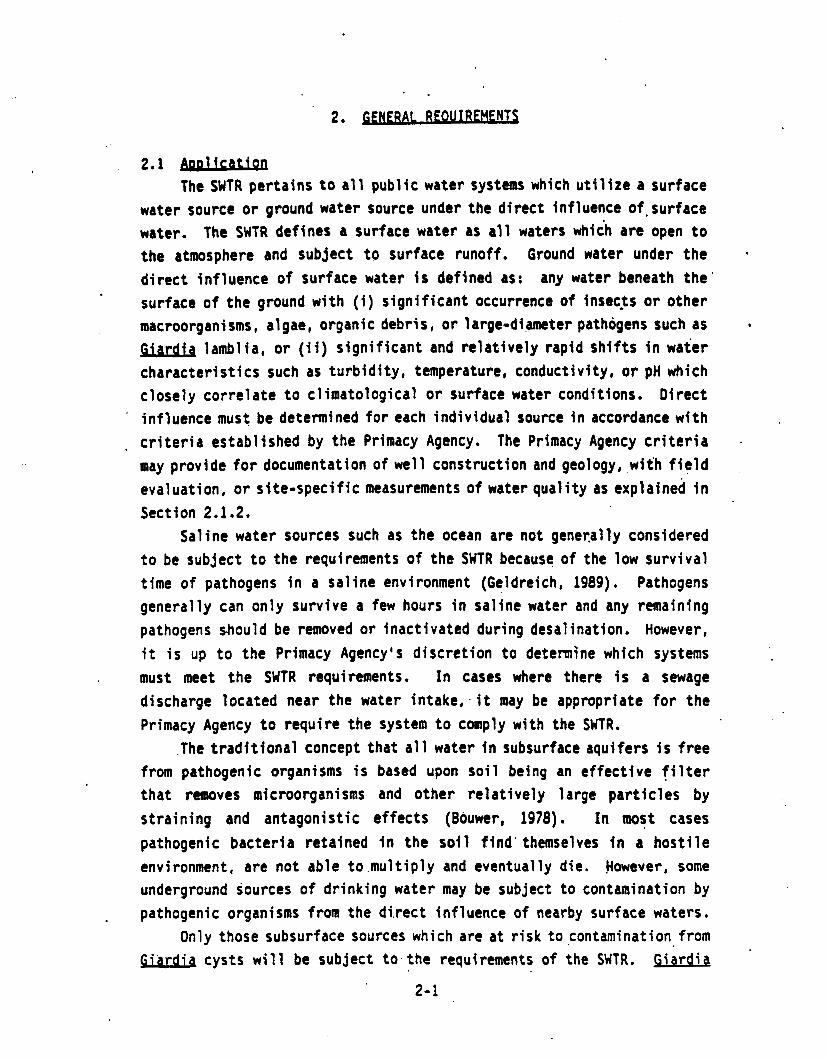
2.1 &gJJg.auiM The SWTR p e r t a i n s t o a , l l public water systems which u t i l i r e a surface
water source or ground water source under the direct influence of.surface water. The SWTR defines a surface water as a l l waters which are open t o the atmosphere and subject to surface runoff. Ground water under the direct inf luence of surface water i s defined as: any water beneath t h e ' surface of the ground w i th (i) sign i f i can t occurrence o f i n s e c p or other macroorganisms, algae, organic debris, or large-di.@neter pathogens such as Giardia lamblia, or (ii) sign i f i can t and r e l a t i v e l y r a p i d s h i f t s i n water charac ter is t i cs such as t u r b i d i t y , temperature, conductivity, or pH which c lose ly cor re la te to c l imato log ica l or surface water conditions. Direct
' inf luence must be determined for each ind iv idual source i n accordance w i t h . c r i t e r i a e s t a b l i s h e d by the Primacy Agency. The Primacy Agency c r i t e r i a .
may p rov ide f o r documentation of well construction and geology, with f i e l d evaluation, or s i te -spec i f i c measurements of water qua l i t y as explained i n Section 2.1.2.
Saline water sources such as the ocean are not generally considered t o be subject t o t h e requirements of the SWTR because o f the low surv iva l time o f pathogens i n a sa l ine environment (Geldreich, 1989). Pathogens general ly can only survive a few hours i n saline water and any remaining pathogens should be removed or inactivated during desal ination. However, i t i s up t o t h e Primacy Agency's d i s c r e t i o n t o determine which systems must meet the SWTR requirements. I n cases where there i s a sewage discharge located near the water intake,. i t m y be appropr iate for the Primacy Agency t o r e q u i r e t h e system t o comply wi th the S U R .
.The t r a d i t i o n a l concept t h a t a l l water i n subsurface aquifers i s free from pathogenic organisms i s based upon so i l be ing an e f f e c t i v e f i l t e r t ha t nmOves microorganisms and o ther re la t i ve ly la rge par t i c les by s t ra in ing and antagonist ic effects (Bouwer, 1978). . In most cases pathogenic bacteria retained i n the soi l f ind' themselves i n a h o s t i l e environment, are not able to.mult iply and eventually die. flowever, some underground sources of drinking water may be subject t o contamination by pathogenic organisms from the d i rec t i n f l uence o f nearby surface waters.
Only those subsurface sources which are a t r i s k t o contamination f r o m Giard ia cysts will be subject to.thc requirements o f the SWTR. Giard ia
2-1

T i \ (, ,: cysts generally rhnge in size from 7 to 12 um. Subsurface sources which
may be at risk to contamination from bacteria and enteric viruses, but * ' which are not at risk from u a r d h cysts will be regulated either under
the Total Coliform Rule or forthcoming disinfection treatment requirements for ground waters. €PA intends to promulgate disinfection requjrements for ground water systems in conjunction with regulations for disinfection by-products by 1992. .
L.
XI 1
3. 2.1.1 m g wfsLw€n 3;. - Surface water supplies that are often used as sources -of' drinking
water include two major classifications, running ahd quiescent waters. Streams, rivers and brooks are examples of running water, while lakes, reservoirs, impoundments and ponds are examples of quiescent waters. The exposure of surface waters to the atmosphere results in exposure to precipitation events, surface water runoff and'contamination with micro '
and macroorganisms resulting from activities i n their surrounding ,areas. These sources are subject to the requirements of the SWTR.
Systems with rain water catchments not subject to surface runoff (e.g. roof catchment areas) are not considered vulnerable to contamination . .- from animal populations which carry protozoan cysts pathogenic to humans .
. and are thus not subject to the SWTR requirements. However, such systems should at least provide disinfection 'to treat f o r potential bacterial and viral contamination coming from bird populations.
T'.
I ' 4;'
ground Waters under Oirect Inf 1 uence of Surface Water Ground water sources which, may be subject to contamination with
pathogenic organisms from surface waters include, springs,' infiltration galleries, wells or other collectors in subsurface aquifers. 'The following section presents a recomnended procedure for determining whether a source wi 1 1 be subject to the requirements of the SUR. These determinations are to be made for each individual source. If the determination will involve an evaluation of water quality, eg. particulate analysis, it is important that these analyses be made on water taken
.s.
I One study (Markwell and Shortridge, 1981) indicates that a cycle of waterborne transmission and maintenance of influenza virus may exist within duck comnunities, and that it i s conceivable for virus transmission to occur in this manner t o other susceptible animals, ,.including humans. .
2-2

directly from the source and not on blended water or water from the distribution system.
2.1.2 &$emination o f ADDliCablt Sourcu The Primacy Agency has the responsibi 1 ity for determining which water
supplies must meet the requirements of the, SWTR. However, it i s the responsibi 1 1 ty of the water purveyors to provide the Primacy Agency with the information needed to make this determination. This section provides guidance to the Primacy Agency for determining which water supplies ire surface waters or ground waters directly influenced by a surface water and are thereby subject to the requirements of the SWTR. Following the determination that the source is subject to the SWTR, the requirements enumerated in Sections 2.2 and 2.3 must be met.
The Primacy Agency must develop a program for evaluating ground water sources for direct influence by December 30, 1990. All comnunity ground water systems must be evaluated by June 29, 1994, while all non-comnunity systems must be evaluated by June 29, 1999. Primacy Agencies.with an approved Wellhead Protection (WHP) Program, may be able to use the WHP program's requirements which include delineation of wellhead protection areas, assessment of. sources of contamination and implementation of management control measures. These same requirements can be used for meeting the requirements of the watershed control program for ground water under the direct influence of a surface water.
A multiple step approach has been developed as the recornended method o f detennini ng whether a ground water source is under di rect inf 1 uence o f , a surface water. This .approach includes the r e v i e w of information gathered during sanitary surveys. As defined by the USEPA, . a sanitary survey is an on-site review o f the water source, facilities, equipment operation and maintenance of a public water system for the purpose of evaluating the adequacy of such source, facilities, equipment, operation and maintenance for producing and distributing safe drinking water. Sanitary surveys are required under the Total Coliform Rule and may be required under the forthcoming disinfection requirements for ground water systems as a condition for obtaining a variance or for determining the level of disinfection required. Therefore, it is recornended that the determination of direct influence be correlated with the sanitary surveys conducted under these other requirements.
2-3

,.-.
A. lpvrcc Evaluation Protocol As'il lustratcd on Figure 2-1, the determination o f whether a source
is subject to the requirements of the SWTR may involve one or more of the following steps:
1. A review of the records of the system's source(s) to.detenine . whether the source is obviously a surface water, i.e. pond, lake, streams, etc.
2. If the source is a well, determination of whether it 1s clearly a ground water source, or whether further analysis i s needed to determine possible direct surface water influence.
3. A complete review of the system's files followed by a field sanitary surve . Pertinent infomation to gather in the file review and fie r d survey includes: source design and .construe- tion; evidence of direct surface water contamination; water quality analysis; indications of .waterborne disease outbreaks; operational procedures (i.e. pumping rates, etc.); and customer complaints regarding water quality or water related infectious illness.
4, Conducting particulate analyses and other water quality sampling and analyses.
-_ Steo 1 Records Reviey '
A review of information pertaining to each source should be carried out to identify those. sources which are obvious surface waters, These would include ponds, lakes, streams, rivers, reservoirs, etc. 1.f the source is a surface water, then the SWTR would apply, and criteria in the rule would need to be applied to determine if filtration.is necessary. I f the source is not an obvious surface water, then further analyses, as presented in Steps 2, 3, or 4, are needed to determine if the SWTR will apply. If the source is a well (vertical or horizontal), go ,to Step 2. . If the source is a spring, infiltration gallery, or any other subsurface source, proceed to Step 3 for a more detailed analysis.
'.V
SteD 7. Review of We1 1 Sour= While most well sources have historically been considered to be
ground water, recent evidence suggests that some wells, especially shallow wells constructed near surface waters, may be directly influenced by surface water. One approach in determining whether a well is subject to contamination by surface water would be to evaluate the water quality o f the well by the criteria in Step 4. However, this process is rather t i m e
2-4 '

Alt. Public Water
I
Obvious Surface Sources:
Lakes, Reservoirs, Streams, Creeks, I* Rivers, etc.
t
Source is Spring or Infiltration Gallery
U Review System File and Conduct
Sanitary Survey
I I
Well is Protected from Direct Surface Influence
Based on SIate Criteria
L
b Source Directly 4
w surface Water? _i
SWTR Applies Influenced by SWTR Does Not Apply
1 _I I
Conduct Particulate , Analysis, Monitor
Changes in Water Quality, Temperature,
etc.
Summary of Findings indicate Source is A
influenced by Surface Water and Could Contain' Giardia?
1 I
' r
FIGURE 2-1 - STEPS TO SOURCE CLASSIFICATION

consuming and labor in tens ive. In an attempt t o reduce the e f fo r t needed t o evaluate well sources, a se t o f c r i te r ia has been developed t o i d e n t i f y wells I n deep, well protected aquifers which are not subject to contamina-
* t i o n from surface water. While these.criteria arc not as d e f i n i t i v e as water qual i ty analysis, it i s believed that they provide a repsonable degree o f accuracy, and a l low for a re la t i ve l y rap id de temina t ion f o r a la rge number o f wel l sources i n the U.S.
We1 1s with perforat ions or a we1 1 screen less than or equal t o 50 feet i n depth are considered t o be.shallow wells, and should b.e evaluated for d i rect surface inf luence according to steps 3 . and/or 4; For wel ls greater than SO fee t i n depth, State or system f i l e s should be reviewed f o r t h e c r i t e r i a l i s t e d below:
' 1. The well construction should include: - A surface sanitary seal using bentonite clay, concrete or other acceptable material .
- A well casing that penetrates a conf in ing bed.
- A well casing or col lector la tera ls that are on ly
The importance of evaluating the hydrogeology o f wel ls or co l lec to rs , even those more than 200 feet from a surface water, cannot be overstated. The porosi ty and t ransmiss iv i ty o f aquifer materials, hydrologic gradients, and cont inu i ty o f conf in ing 1 ayets above screens or perforat ions may need t o be considered i n d e t a i l f o r some sources. Porous aquifer mater ia l i s more l i k e l y t o a l l o w surface water t o d i r e c t l y i n f l u e n c e ground water than finer grained materials. I n addi t ion, h igh well pumping rates may al ter the exist ing hydrologic gradient. Ground water f low d i rect ion may change such that surface water i s drawn i n t o a co l lec to r , whereas under low pumping rates i t may not. Evaluating pumping ra te e f fec ts and other hydrogeolo- g ic in fo rmat ion must be done on a s i te spec i f ic bas is .
I f informat ion on wel l construct ion or hydrogeology are incomplete or raise questions regarding potential surface water inf luence, a more detai led analysis i n steps 3 and 4 should be cons i dered .
perforated or screened below a conf in ing bed.
2. The casing or nearest col lector lateral should be located a t
3. The water qual i ty records should indicate:
leas t 200 f ee t from any surface water.
2-5

- No record o f t o t a l t i on i n un t rea ted years
co l i form or fecal samples col lected
C O ~ i fonn contamina- (-3 over the past three
- .No h i s t o r y o f t u r b i d i t y problems associated with the source, .
- No h i s t o r y o f known or suspected outbreak o f Eidrdi,&, or other pathogenic organism associated with surface water @*g* CrvDtosPor’d’W ), which has been a t t r i b u t e d t o t h a t source
* .
4. I f data i s ava i l ab le f o r pa r t i cu la te ma t te r i n the wel l there should be: - No ev’ldence of part iculate matter associated with
surface water,
If data i s a v a i l a b l e f o r t u r b i d i t y or temperature from the well and a nearby surface water there should be:
- No t u r b i d i t y or temperature data which correlates t o t h a t o f a nearby surface water.
. We1 1s t h a t meet a1 1 o f t h e c r i t e r i a 1 i s t e d above are not subject to the requirements o f t h e SWTR, and no addit ional evaluation i s needed. Wells tha t do not meet a11 the requirements l is ted require fur ther . evaluation i n accordance w i th Steps 3 and/or 4 td determine whether or not they are direct ly inf luenced by surface water.
sten 3 . On - s i te InsDect io t l for sources other than a wel l source, the State or system f i l e s
should be reviewed for the source construction and water qual i ty conditions as l i s t e d i n Step 2. Reviewing h is tor ica l records i n State or system f i l e s i s a valuable Information gatherlng tool for any source. However, the resu l ts may be inconclusive. A sanitary survey i n t h e f i e l d may be he lp fu l in es tab l i sh ing a more def in i te determinat ion o f whether
. the water source i s a t r i s k t o pathogens from direct surface wafer i n f 1 uence.
Information to ob ta in dur ing an on-site inspection include:
- Evidence that .surface water enters the source through defects i n the source such as lack of a surface seal on w e l l s , i n f i l -
2-6

tration gallery laterals exposed to surface water, springs open to the atmosphere, surface runoff entering a spring or.other collector, etc.
- Distances to obvious surface water sources.
If the survey indicates that the w e l l is subject to direct surface water influence, the source must either be reconstructed as explained later in this section or it must be treated in accordance with the requirements for the SWTR. If the survey does not show conclusive evidence of direct surface water influence, the analysis outlined in Step 4 should be conducted .
The Washington State Oepartrnent of Social and Health Services has developed a form to guide them and provide consistency in their evaluation of sources for surface water influence (Notestine 8 Hudson, 1988). Table 2-1 provides a copy of this form as a guide for evaluating sources.
SteD 4. Particulate Analvsis and Other Indicators a. surface Water Indicators Particulate analysis is intended to identify organisms which ,only
occur in surface waters as opposed to ground waters, dnd whose presence in a ground water would clearly indicate that at least some surface water has been mixed. with it. The €PA Consensus Method in Appendix A can be used for Eiardu cyst analysis.
In 1986 Hoffbuhr et. al. listed six parameters identifiable in a particulate analysis which were believed tQ be valid indicators of surface contamination o f ground water. These were: diatoms, rotifers, coccidia, plant debris, insect parts, and Jii’ardb cysts. Later work by Notestine and Hudson (1988) found that microbiologists did not all define plant debrls 4n the same way, and that deep wells known to be free of direct surface water influence were shown by particulate analysis to contain “plant debris” but none of the other five indicators. Their work suggests that “plant debris” may not currently be a useful tool in determining direct surface water influence, but may be in the future when a standard definition of “plant debris” is developed. Therefore, it is recomended that only the presence of the other five parameters; diatoms and certain. other algae, rotifers, coccidia, insect parts, and Giardia, be used es
2-7

TABLE 2-1
FICATXON OF DRINKING WATFR S O U
1.
2.
3.
4.
5.
6.
7.
0.
9.
10.
U t i l i t y Name (100)
Uti 1 i t y Person (s) Contacted
Source Type (As shown on state inventory)
- Spring - Horizontal Well - . Vertical - I n f i l t r a t i o n System - Shal low We1 1 We1 1
Source Name Year constructed
I s t h i s source used seasonally or i n tenn i t t en t l y? No Yes- If yes, are water qual i ty problems the reason? No . Yes-
Has there ever been a waterborne disease outbreak associated with t h i s source? Yes No If yes, explain
Have there been t u r b i d i t y or bacter io logical MCL v io la t ions w i th in . the las t f i ve years assoc ia ted w i th th is source? No - Yes - If yes, describe frequency, cause, remedial action (5) taken
Have there been consumer complaints within the past f ive years associated with this source? No Yes I f yes, discuss nature, frequency, remedial action taken
Is there any evidence o f surface water intrusion .(pH, temperature, conduct iv i ty, etc. changes) during the year? Yes No I f yes, describe
I f not, submit supporting data.
Sketch o f source i n plan v iew (on an addi t ional sheet)
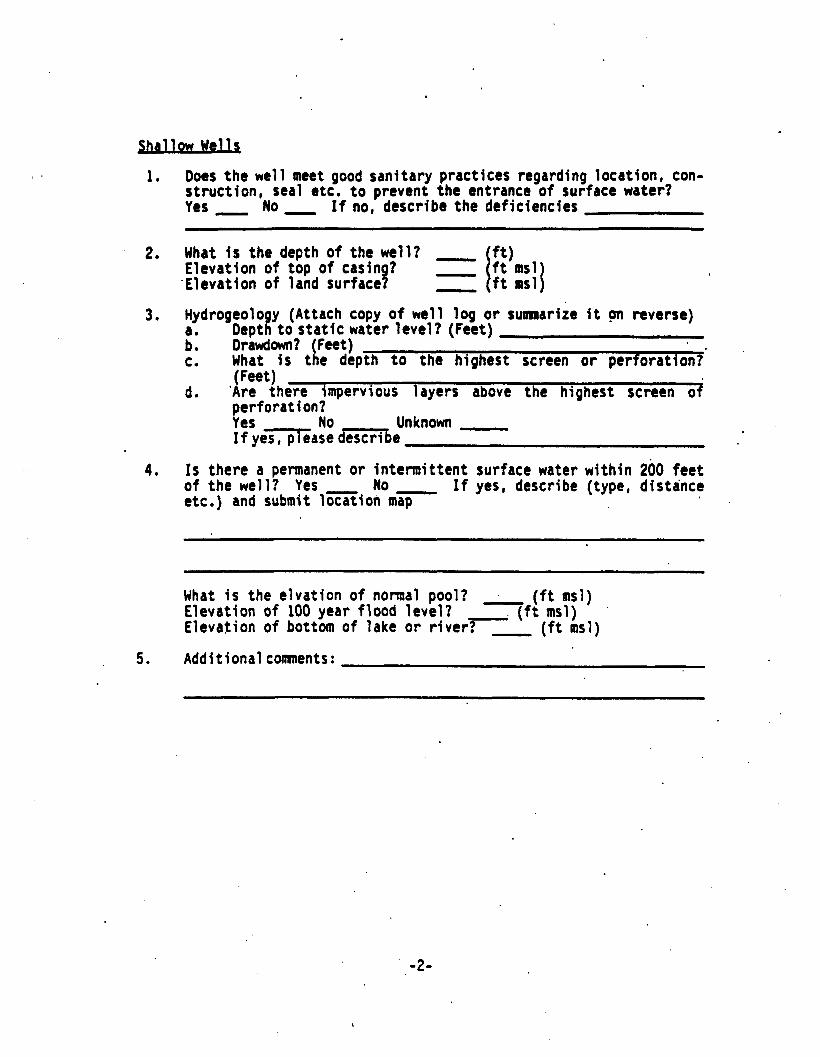
sld&iUU 1. Does the wel l meet good sanitary practices regarding location, con-
struct ion, seal etc. to prevent the entrance of surface water? Yes - No - I f no, describe the deficiencies
2. What i s the depth of the wel l? Elevation of top of casin ? /?msl{
'Elevation of land surface s - ft msl
3 . Hydrogeology (Attach copy o f we1 1 log or suamarite it pn reverse) a. Depth t o s t a t i c water leve l? (Feet) b. Drawdown? (feet) c. What i s t h e depth to t he h ighes t screen or perforat ion?.
d . 'Are there impervious layers above the highest screen o f (feet)
perforat ion? Yes No I f y e i a s e dcscribe
Unknown
4. Is there a permanent or i n te rmi t ten t surface water w i th in 200 feet o f t h e well? Yes - No - If yes, dcscribe (type, distance etc.) and submit locat ion map
What i s the e lvat ion o f normal pool? (ft msl) Elevation of 100 year f lood level? . (ft msl) '
E levat ion of bot tom of lake or river- ( f t msl)
5. Addit ional comnents:
-2-

1.
2.
3.
4.
5.
6.
7.
a. What i s t h e s i t e o f the catchment area (acres)? b. Give a general description of the area (terrain; vegetation;
s o i l etc.)
What i s t he ve r t i ca l d i s tance between the ground surface and the nearest po int o f ent ry to the spr ing co l lector (s) ( feet )?
How rap id l y does r a i n f a l l p e r c o l a t e i n t o t h e ground around the spring?
- Percolates readi ly but there i s some r u n o f f i n heavy ra in . ' - Percolates slowly. Most l o c a l r a i n f a l l ponds or runs o f f .
Does an impervious layer prevent d i rect percolat ion of surface water t o t he co l l ec to r ( s )? Yes No . Unknown
Is the spring properly constructed to preven't entry o f surface water? Yes No
- Percolates readily: seldom if ever any runoff .
- Other
Sediment a. Is the spr ing box free of debris and sediment? Yes - b. When was it l a s t cleaned (Date e. , How o f ten does i t need t o be c caned? (month) d. How much sediment accumulates between cleaning? (estimate i n
\ No f
inches)
Additionalcomnents:
-3-

J n f i l t t a t f o R Svstemx
1. What are the shortest distances ( ve r t i ca l and horizontal seoaratina the co l l ec to r from the nearest suiface water? (Feet) . -~ ~~ ~ ~ ~~ ~-
2. Does t u r b i d i t y of the source vary 0.2 NTU or more throughout the year? Yes No Not measured I f yes, dcrcribc h m and how much (pH, temperature, conduct iv i ty, etc.) ..
3 . AdditionalCoamcnts
Survey Conducted %y: Date:
Decision? Surface Impacted Source Yes No I f no, fur ther evaluat ion needed (par t i cu la te a n a l y s w . )
..

i nd ica tors o f d i rec t sur face contamination. I n addi t ion, 'if other large diameter (> 7 um) organisms wtri.ch are c k a t l y Of surface water origin such as piohilobothriym are present, these should also be considered as indicators of direct surface water inf luence.
b: Jn temre ta t i oq . Since standard methods have not been developed spec i f i ca l l y fo r
part iculate analysis, there has not been consistency i n the way samples have been co l lec ted and analyzed. Differences i n the degree o f t r a i n i n g .
and experience of the microbiologists has added f u r t h e r t o t h e d i f f i c u l t y i n comparing resul ts f rom sample t o sample, and system t o system. The cur ren t l im i ta t ions .in Sample co1lect ion and ana ly t i ca l procedures must be considered when in te rpre t ing the resu l ts . Unti l standardized methods are developed, the €PA Consensus Method included i n Appendix A i s recanmended as the ana ly t i ca l method for par t icu la te analys is . The fol lowing i s a d iscuss ion o f the s ign i f icance o f f ind ing the s ix ind icators ident i f ied above
Iden t i f i ca t i on o f a G ia rd ia cys t i n any source water should be considered conclusive evidence of direct surface water infhence. The repeated presence o f diatoms i n source water should be considered as conclusive evidence of direct surface water influence. However, i t i s important that th is determinat ion be based on 1 i.ve diatoms , and not empty s i l i c a skeletons which may on ly ind ica te the h is to r ica l presence of. surface water.
Bluegreen, green, or other chloroplast containing algae require sunl ight for the i r metabol ism as do diatoms. For t h a t reason t h e i r repeated presence i n source water should also be considered as conclusive evidence of d i rect surface water inf luence.
Hoffbuhr (1986) i nd i ca tes t ha t ro t i f e rs and insect parts are indicators of surface water. Others have pointed out though t h a t r o t i f e r s do not require sunl ight , and n o t a l l r o t i f e r s r e q u i r e a food source such as algae which or ig ina tes i n surface water. Their nutr i t ional require- ments may be s a t i s f i e d by organic matter such as bacter ia, or decomposing s o i l organic material, not necessarily associated with surface water . More p rec i se ' i den t i f i ca t i on o f ro t i f e rs , i . e . t o t he spec ies l eve l , i s necessary t o determine the specif ic nutr i t ional requirements o f the rot i fer(s) present. Further informat ion on i d e n t i f y i n g r o t i f e r species and on which species require food sources originating i n surface water ,
2-8

would be valuable, but is not readily available at this time. Without f-\ ‘, I knowledge of which specie.$ is present, the finding of rotifers indicates that the source is either a) directly influenced by surface water, or b) it contains organic matter sufficient to support the growth o f rotifers. It could be conservatively assumed based on this evidence alone that such a source is directly influenced by surface water. However, it i s recornended that this detennination be supported by other evidence, eg. the source is near a surface water, turbidity fluctuations are signifi- . cant, etc. -
Insects or insect parts 1 i kewise may originate in surface water, f rolll
the soi 1, or they may be airborne in uncovered sources. If insects are observed in a particulate analysis sample, it should be confinned if possible that there is no other route by which insects could contaminate the source other than surface water. For example, if a spring is sampled, and the cover is not w e l l constructed, it i s possible that insects found in a sample were airborne rather than waterborne. Insects which spend a portion of their lifecycle in water are the best indicators of direct surface water influence, for example, larvae of mayflies,’ stoneflies, damselflies, and dragonflies. Terrestrial insects should not be ruled out . --
. .
as -surface water indicators though, since their accidental presence in . surface wa’ter is common . .,.
Howell , (1989) has indicated that some insects may burrow and the finding of .eggs or burrowing larvae (eg. chironomids) kay not be good .., .
indicators o f direct surface water in’fluence. For some insects this may . be true, but the distance which insects burrow in subsurface sediments is expected to be small, and insect 1 arvae are generally large in comparison to Giardia cysts. Until further research suggests otherwise, it i s recomnded that insects or insect parts be considered strong evidence of surface water influence if not direct evidence in and of themselves. The strength of this evidence would be increased i f the source in question is
. near.a surface water, and particulate analysis of the surface water found similar insects.
Coccidia are intracellular parasites which occur primarily in verte- brates, eg. .animals and fish, and live in various tissues and organs including the intestinal tract (cg. Cryptosporidium). Though not frequently identified by normal, particulate analysis techniques, coccidia are good indicators of direct surface water contamination since they
2-9

require a vertebrate 'host or hosts and are generally large in size (10 - 20 urn or greater). Cryptosporidium is comnonly found in surface water, but due to its small size (4 - 6 urn) it is not normally identified without specific antibody staining techniques.
Other macroorganisms (>7 urn) which are parasitic to animals and fish may be found and are good indicators of surface water influence. Examples include, but are not limited to, helminths (cog. , tape won cysts), ascaris, and Diphyllobothrium.
c. - ..
A suggested protocol for collecting samples is listed below.
Samples should be collected using the equipment outlined €PA Consensus Method included in Appendix A,
- - in the
.I Lgcatior\ Samples should always be collected as close to the source as possible, and prior to any treatment. If samples must be taken after disinfection, samples should be. noted and analyzed as soon as possible.
A minimum of two samples should be collected duving the period the source is most susceptible to surface water influence. Such critical periods will vary from system to system and will need to be detenined case by case.. For some systems, it may be one or more days following a significant rainfall (eg. 2" .in 24 hours). For other systems it may be a period of maximum flows and stream turbidities following spring snowmelt, or during the sumer months when water tables are elevated as a result of irrigation. In each case, particulate samples should be collected when the source in question is most effected. A surrogate measure such as source turbidity or depth to water table may be useful in making the decision to monitor. If there is any ambiguity in the particulate analysis results, additional samples should be collected when there is the greatest 1 ikel ihood that the source wi 1 1 be contaminated by surface water.
-Numbct
-Volume Sample volume should be between 5QO and 1000 gal lons , and should be collected over a 4 to 8 hour time period, It is preferable to analyze a similar (+/- 10%) volume of water for all sources, preferably a large volume, althougti this may not always be possible due to elevated turbidity or saniplin logistics. The volume filtered should be recorded for a1 s samp 1 es .
2-10

c" d. gther Indicators . A 'number of other i.ndicators could be used to provide supportive
evidence Of Surface influence. While particulate analysis probably ' provides the most direct evidence that pathogens'frm surface water could be migrating into 'a ground water source, other parameters .such as . turbidity, temperature, pH and conductivity could provide Supportive, but less di rect, evidence.
of a year may be indicative of surface water influence. Considerable caution should be used when evaluating turbidity changes though, since the turbidity could be Caused by very small particles (c lum) not originating in a surface water or it could be that larger particles are being filtered out and only the very smallest particles migrate into the water source. Only ground water sources at risk to contamination from or other large pathogens (> 7 urn) are subject to the SWTR requirements.
Temperature fluctuations may also indicate surface water 'influence. Fortunately these are easy to obtain and if there is a surface water within 500 feet o f the water source, measurements of both should be recorded for comparison. Large changes in surface water temperature closely followed by similar changes in source temperature would be indicative of surface water influence. Also, temperature changes ( i n degrees F) o f greater than 15 to 20% over the course of a year appear to '
be a characterirt.ic o f some sources influenced by surface water (Randall, 1970). Changes in other chemical parameters such as pH, conductivity, .
hardness,etc. could also be monitored. Again, these would not give a direct indication of whether pathogens originating in surface water were present, but could indicate whether the water chemistry was or was not similar to a nearby surface water and/or whether source water chwgistry changed in a similar pattern to surface water chemistry. At this time no numerical guidelines are available to differentiate what is or is not similar, so these comparisons are more qualitative than quantitative.
Turbidity fluctuations of greater than 0.5 - 1 NTU over the course .
.. '
8- &&ammu= Some sources may only be used for part of the year, for example
during the sumner months when water usage is high. These sources should not be excluded from evaluation and, like other sources, should be '
evaluated during their period(s) of highest susceptibility. Particular .
2-1 1

attention should .be g iven to those sources which appear t o be d i r e c t l y influenced by surface water during part of the year. there may be times during which these subsurface water sources are not influenced by surface water and other t imes when they are part or a l l surface water. If t h a t i s the c'ase, then i t i s c r i t i c a l t h a t c a r e f u l t e s t i n g be done p r i o r t o , during and a t t h e end of the use o f t he source. This should be done Over several seasons t o account for seasonal variat ion. I n practice, i t i s preferable t o use sources which are less vulnerable t o contamination since susceptible sources will necessitate ongoing monitoring and close at tent ion to operat ion.
3
c. - . Sources d i rec t l y in f luenced by surface water may be a l t e r e d i n some
cases to e l im ina te the surface water contamination. Primacy Agencies may e lec t t o a l l ow systems w i th such sources t o modify the construct ion of the
. source and/or t he area surrounding the source i n an e f f o r t t o el iminate surface water contamination. Since th i s cou ld be expensive and take considerable t ime t o evaluate for effectiveness, careful consideration should be given t o t h e d e c i s i o n t o modify a source. I n deciding whether source modi f icat ion is appropr ia te, systems and Primacy Agencies should . consider the fol lowing points: - I s t h e cause of the surface water contamination known? If the
spec i f i c cause or point of surface water contamination i s not known, i t will not be possible to determine an ef fect ive control strategy. Further, there may be several reasons why the source i s suscept ib le to d i rect surface water inf luence. For examp1e, an i n f i l t r a t i o n g a l l e r y MY receive surface water because some of i t s l a t e r a l s a r e exposed i n t h e bed o f a nearby stream, and also because la te ra l s d i s tan t from the stream are shal low and are affected by surface runoff. Simply modifying or e l im ina t ing one or the other set o f l a t e r a l s i n t h i s case would not ent t re ly e l iminate surface water inf luence. .
- Uhat i s t he l i ke l i hood t ha t mod i f i ca t i on o f the source will be e f fec t i ve? Assuming that the source of contamination has been i d e n t i f i e d , t h e expected ef fect iveness o f cont ro l measures should be evaluated. I f the cause ' i s re la t i ve ly ev ident , a c rack fn a well casing or an uncovered spr ing box for example; then there i s a high degree of conf idence that an ef fect ive solut ion could be developed. Should the nature of the contdmi- .' ? '
na t ion be more d i f fuse, or widespread, then the meri ts of spending time and money t o modify the source should be carefu l - l y considered. I n t h e case o f the example above, e l iminat ing the use o f t he l a te ra l s under the stream will solve part of the
2-1 2

problem. However, without considerabl amre hydrogeologic information about the aquifer and the p r actrnent of the other la tera ls , i t i s not c lear what, if any, control measures would ef fect ively e l iminate d i rect surface water influence i n those laterals d istant f rom the stream.
If a source i s i d e n t i f i e d as being direct ly inf luenced by surface water, and it i s decided t o attempt t o modify it, inter im d is in fect ion practices which will ensure a t l e a s t 99.9% inact ivat ion o f Giardia should be considered. Methods and leve ls o f d is in fec t ion which can-be used t o achieve such removals can be found i n S141.72 (a) o f t he 'SWTR and i n Section 3.2 o f t h i s manual.
A p a r t i a l l i s t i n g of types of modifications which could be undertaken includes: - Oiverting surface runoff frm springs by trenching, etc.
- Redeveloping springs t o capture them below a confining layer.
- Covering open spr ing col lectors.
- Reconstructing w e l l s to ins ta l l san i ta ry sea ls , and/or t o
- Repairing cracks or breaks i n any type o f source col1,ector t h a t
- Discontinue the use o f i n f i l t r a t i o n l a t e r a l s which intercept
screen them' i n a confined (protected) aquifer.
allows the, entry of surface contaminants.
surface water.
. .
An extended period of monitoring should follow reconstruction (eg. through a t least two years or c r i t i c a l periods) t o evaluate whether t h e . source i s still di rect ly in f luenced by surface water. Preferably part iculate analysis would be used t o make such evaluations, but i t nay be , . , helpful ' t o use simpler measures, such as temperature and t u r b i d i t y , as screening tools. Longer term m n i t o r i n g a t c r i t i c a l times may also be an appropriate agrement between the system and the Primacy Agency i f there i s s t i l l doubt about the long tern e f fect iveness o f the so lu t ion.
If modification i s not fkasible, another a l ternat ive to avoid having ' t o cornply wi th the SWTR may be t o develop a new we l l e i ther deeper OF a t
a disffcrent location,
. ..
2-13

2.2 Ifsun€DtRcau_irzments According t o the S U R , a l l c m u n i t y and nonconmunity pub1 i c water
systems which use a surface water source or a ground water under the ,
d i rect in f luence of a surface water must achieve a minimum o f 99.9 percent (3-log) removal and/or inact ivat ion o f Giard ia cysts , and a minimum of 99.99 percent (4-log) removal and/or inact ivat ion o f v i ruses. In the SWTR and t h i s manual, yvirusesN means viruses of fecal or ig in which are i n fec t i ous t o humans by waterborne transmission. F i l t r a t i o n p l u s ' d is in fec t ion or dis infect ion a lone may be u t i l i z e d ' t o achieve these performance levels, depending on the source water qual i t y and s i t e specif ic condit ions. The SWTR establishes these ranoval and/or inactiva- t i o n requirements based on Giardia and viruses because t h i s l e v e l o f treatment will also provide protect ion from heterotrophic plate count (HPC) bacter ia and Lcafonclla* as requi red in the SDUA amendments.
Guidelines f o r meeting the requirements o f t he SWTR are provided i n the remainder o f t h i s manual as o u t l i n e d i n Section 1. All systems must w e t the operator qual i f icat ions presented i n Section 2.3.
2.3 QDerator Personnel O u a l i f i c a t i o u The SWTR requires that a1 1 systems must be operated by qual i f ied
personnel. It i s recomnded tha t the Primacy Agency set standards f o r ope ra to r qua l i f i ca t i ons , i n accordance with the system type and s i ze . I n order t o accomplish th i s , t he Primacy Agency should develop a method o f evaluating an operator's competence i n operat ing a water ' t reatmnt system.
. Primacy Agencies which do no t cur ren t ly have a c e r t i f i c a t i o n program 'are thereby encouraged t o implement such a program. An opera to r ce r t i f i ca t i on program provides a uniform base for operator qual i f icat ions and an organized system for evaluat ing these qual i f icat ions.
It i s nccnunended that p lant operators have a basic knowledge o f science, mathematics and chemistry involved with water treatment and supply. The minimum requirements f o r a t l e a s t one key s t a f f member should include an understanding of:
. '
2 I n t h e SWTR and t h i s manual "m" means a genus o f bacter ia, some species o f which have caused a type of pneumonia called Legionnaires Disease; the etiologic dgent of most cases o f Legionnaires Disease examined has been L m D h i l g .
2-14

9
The pr inciples of water treatment and d i s t r i b u t i o n and t h e i r (-1 character ist ics
The uses of potable water and v a r i a t i o n s i n i t s demand
The importance o f water q u a l i t y t o pub1 i c hea l th
The equipment, operation and maintenance o f t he d i s t r i bu t i on system %?
The treatment process equipment u t i l i zed , i t s ope ra t i ona l 5 parameters and maintenance ' . !&
The pr inc ip les o f each process un i t ( i nc lud ing ' t he sc ien t i f i c basis and purpose of the operat ion and the mechanical compo- nents of the uni t )
Performance c r i t e r i a such as tu rb id i ty , to ta l co l i fo rm, feca l c o l Ifonn, dis infectant residual , . pH, ete. t o determine opera- t i o n a l adjustments
Comnon operating problems encountered i n the system and actions t o c o r r e c t them
The current National Primary Drinking Water Regulations, the Secondary Drinking Water Regulations and monitoring and reporting requirements
I :
Methods o f sample co l l ec t i on and sample presewation -
Laboratory equipment and tests used.to analyze samples (where appropriate) Tj
The use o f laboratory results to analyze ,plant eff iciency
Record ktepi ng .
.."
1 - -.?-
.~
Customer re1 at i ons
Budgeting and supewision (where appropriate)
Traini 'ng i n the areas l i s t e d above and others i s available through the American Uater Works Association (AWA) t r a i n i n g course series for water supply operations. The course series includes a set o f four t ra in ing manuals and on'e reference book as follows: - Introduct ion t o Water
- In t roduc t ion to Water
- Introduct ion t o Water
- Introduct ion t o Water
Sources and Transmission (Volume 1)
Treatment (Volume 2)
D i s t r i b u t i o n (Volume 3)
Qual i t y Analyses (Volume 4)
, .
2-15 '

- Reference Handbook: Basic Science Concepts and Applications
- Instructor Guide and Solutions Manual for Volumes 1, 2, 3 and 4
These manuals are available through the American Water ,Works Associa- tion, 6666 West Quincy Avenue., Oenver, Colorado 80235 USA, (303) 794-7711.
The State of California also offers a series of training manuals for water treatment plant operators prepared by the California State. University School of Engineering in Sacramento. The laanuals include:
1. Water Supply System Operation. (1 Volume) 2. Water Treatment Plant Operation. (2 Volumes)
.-
' These operator training manuals are available from California State University, Sacramento, 6000 3 Street, Sacramento, California 95819, phone ~
Completion of an established training and certification program will provide the means of assuring that the operators have received training in their respective area, and are qualified for their position. 'The education and experience requirements for certification should be comnensurate with the size and the complexity of the treatment system. At the present time, some states have instituted a certification program while others have not. Following is a rumnary of the basic contents of a certification program, which can serve as a guide to the Primacy Agency in developing .a complete program. - Board of examiners for the development and 'implementation of
- Classification of treatment facilities by grade according to
(916) 454-6142.
the program. '
the size and technology of the facilities.
- Educational and experience requirements for operators of the various treatment faci 1 i ties according to grade.
- A written/oral examination to determine the knowledge, ability and judgement of the applicants with certification obtained upon receiving a passing grade.
- Renewal program for the license of certification, including the requirement of additional coursework or participation in workshops
The .certification program should provide technically qualified personnel for the operation of the plant.
2-15

The extensive responsibility which is placed on the operating (-) . .
personnel warrants the development of an outline of the responsibilities and authority of the personnel members to aid them in the efficient operation of the plant. The major responsibilities which should be delegated in the outline of responsibilities include: the, normal day-to-day operations, preventive maintenance, field engineering, water
control, Implementation of improvements, budget forawlation, response to' eoraplaints and public/press contact. A reference whlch'the Primacy - Agency may utilize in developing the outline is "Water Utility Management practices" published by AWA.
' quality monitoring, troubleshooting, emergency response, cross-connection -. -
1
2-17 .
. .
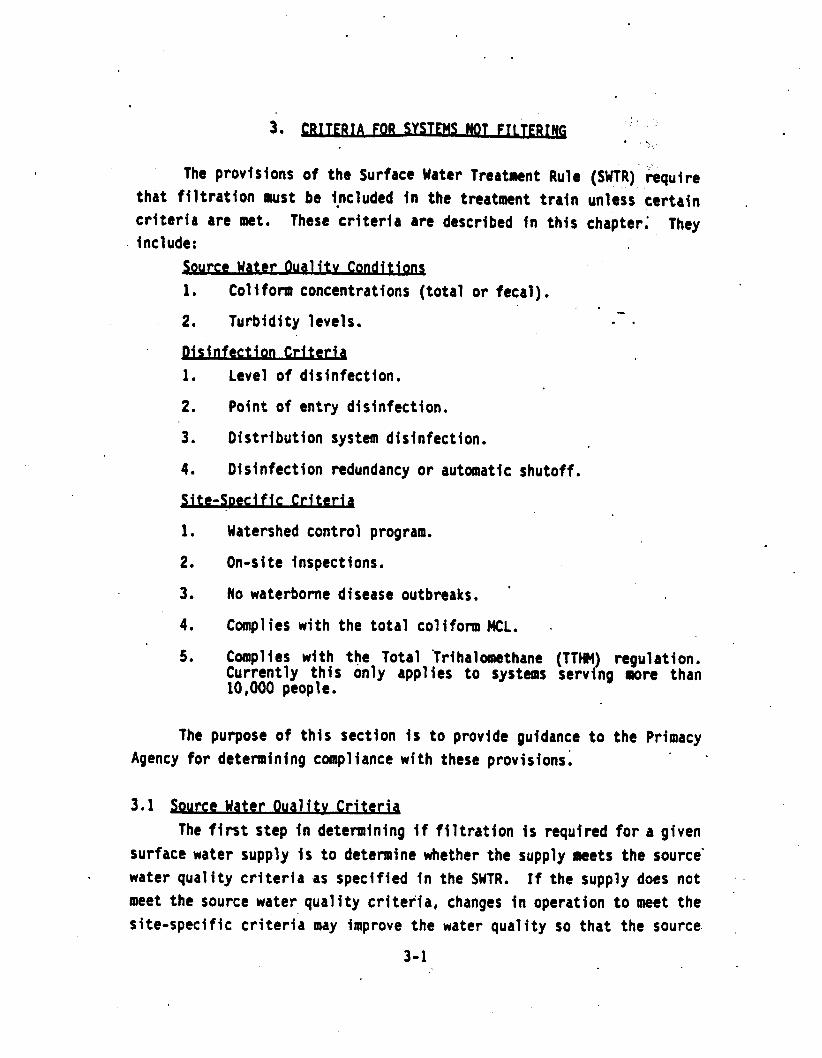
The provis ions of the Surface Water Treatment Rule ( S U R ) require t h a t f i l t r a t i o n must be included i n the tnat lacnt t ra in unless certain c r i t e r i a are met. These c r i t e r i a are described i n t h i s chapter: They include:
source Water Ouali tv Condfticrns 1. Coliform concentrations (total or fecal) . 2. Turbidity levels. . . -
. - I . Level o f d is in fect ion.
2. Point o f entry disinfection.
3. Dist r ibut ion system disinfection.
4. Disinfection redundancy or automatic shutoff.
2. O n 4 t e inspect ions.
3 . No waterborne disease outbreaks.
4. Conrpl ies wi th the total col i form MCL. .
5. Complies with the Total *Trihalomethane (TTHM) regulation. Current ly th is only appl ies to system serving aore than 10,000 people.
The purpose o f th is section i s t o provide guidance t o t h e Primacy Agency for determining compliance wi th these provisions.
3.1 w e Hater Oual i tv Cr i ter ia The first step i n determining i f f i l t r a t i o n i s r e q u i r e d f o r a, given
surface water supply i s t o determine whether the supply meets the source’ water q u a l i t y c r i t e r i a as speci f ied in the SUTR. I f the supply does not ’ .
meet the source water qua l i t y c r i t e r i a , changes i n operation t o meet the s i t e - s p e c i f i c c r i t e r i a may improve the water qua l i t y so that the source-
. .
3-1

c r i t e r i a W i 11 be met . However, i f the Primacy Agency bel ieves that the source water q u a l i t y c r i t e r i a and/or the s i te-speci f ic cr i ter ia cannot be met , or that f i 1 t ra t ion i s appropr ia te regardless, the Primacy Agency may requ,ire the i ns ta l l a t i on o f f i l t r a t i on w i thou t a complete evaluation t o determine whether the system meets a1 1 the cr i ter ia requi red to avoid . f i l t r a t i on . -
The SWTR requires that source water samples be col lected at a loca- t ion just pr ior to the 'po in t o f d is in fectant appl icat ion," Le., where the water i s d is in fec ted and no longer subject t o surface 6noff . For example, a system which has mult iple reservoirs i n series, where each o f the reservoirs has previously been disinfected and receives surface runoff, must take the raw water sample(s) j u s t . p r i o r t o t h e p o i n t o f d is infect ion or disinfection sequences used for calculat ing the C l [disinfectant residual (mg/L) x contact time (min.)]. Disinfected water i n reservoirs receiving surface runoff cannot be counted toward CT credi t . It i s also not appropriate for systems t o monitor the source water af ter . the "point of disinfectant appl icat ion" even i f dis infect ion from t h i s po in t i s no t used for ca lcu lat ing CT credit.
3.1.1 D l i f o n n Concentrations: The SWTR states that, to avoid f i l t r a t i o n , a s y s t m must demonstrate that e i ther the fecal col i fom concentration i s less than 20/100 la1 pf the total col i fom concentrat ion i s less than 100/100 a1 i n the water p r i o r t o t h e p o i n t of disinfectant appl icat ion i n 90 percent o f the samples taken during the six previous .
months. Where monitoring f o r both parameters has been or i s conducted, the ru le requires that only the f e c a l c o l i f o b limit be met. H&ver, €PA recocrmcnds that the analyt ical resul ts for both total col i forms and fecal coliforms be reported. I n addition, i f the tu rb id i ty o f a surface water source i s greater than 5 NTU and the surface source i s blended with a ground water source t o reduce the turbidi ty, €PA recoamends that the high tu rb id i t y wa te r p r i o r t o b lend ing we t t he f eca l co l i f om source water qual i t y c r i t e r i a .
Elevated c o l i f o m l e v e l s i n surface water indicate higher probabil i- t i e s of fecal contamination, some, o f which could be protected from exposure to d is in fec t ion by embodiment i n particulate matter. Blending of
3-2
C
- 18t CUSTOMER
SURFACE SOURCES COMBINED AT A SINGLE POINT
FIGURE 3- 2 INDlVlDUAlLY DISINFECTED - 18t CUSTOMER
SURFACE SOURCES COMBINED AT A SINGLE POINT
FIGURE 3- 2 INDlVlDUAlLY DISINFECTED

the surface water with ground water to reduce colifom levels nay obscure the indication Of such possible effects. Thus, €PA does not m c m e n d blending to reduce coliform levels in the source water. Furthemre, EPA does not reconaKnd blending to reduce turbidity levels in cases where elevated fecal contamination my be masked.
Ongoing monitoring is required to ensure that these requirements are continually net. The samples may be analyzed using either the multiple tube fennentation method or the membrane filter test (MF) as described in the 16th Edition of Standard Methods. v Minimum sampling frequencies are as follows: - - Grab samples mutt be taken on different days. In addition, one
sample must be taken every day during which the turbidity exceeds 1 NTU, unless the Primacy Agency determines that the system, for logistical reasons outside the system's control; cannot have the sample analyzed within 30 hours of collection. If taken, these samples count towards the weekly sampling requirclacnt. Also, under the fatal Coliform Rule, systems must take one colifom sample in the distribution systcra near the first service connection within 24 hours after a source water turbidity measurement exceeds 1 NTU. This measurement rust be included in the total colifom compliance determination. The purpose of these requirements is to ensure that the monitoring occurs during worst case.conditions. .
The initial evaluation of the source water quality is based on the data from the previous 6 months. After the initial evaluation, systems must continue to conduct sampling each knth to demonstrate compliance with the source water quality criteria on an ongoing basis. If the criterion has not been met, the systcm must filter.
.. use of Historical Data Box
3-3
Some systems may already monitor their source water for total and/or fecal colifoim concentration. The resulting historical data base may be sufficient for the Primacy Agency to make the initial determination of whether the system laeats the source water quality criteria.. the historical data base is considered sufficient for making this dttemina- tion if:
. .
- The raw water sampling location i s upstream of the point of .
- The monthly samples represent at least the minimum sampling
0 The sampling period covers at least the previous six months,
disinfectant apglication as pnvlously defined.
frequency previously mentioned.
3.1.2 Jurbiditv Level$: To avoid filtration, the turbidity of the water prior to disinfection cannot exceed '5 NTU, on an ongoing basis,
. based on grab samples collected every four hours (or more frequently) that the system i s in operation. A system may substitute continuous turbidity monitoring for grab sample monitoring if it validates such easurements for accuracy with grab sample measurements on a regular basis, specified by the Primacy Agency.' If a public water system uses conti
. 'ous monitoring, it must use turbidity values recorded every four hours some shorter regular time interval) to determine whether it w e t s turbldity limit for raw water. A systm occasionally 'may exceed the 5
as . nu- (or the NTU
.-.,
I
limit and still avoid filtration as long as (a) the. Primacy Agency '
determines that each event occurred because of unusual or unpredictable - circumstances and (b) as a result of this event, there have not been a w e than two such events i n the past twelve months the system served water to the public or more than five such events in the past 120 months.*the system
* Validation should be perfomed at least twice a week based on the procedure outlined in Part 214A in the 16th Edition o f Standard 'Methods. Although the 17th Edition is available, the 16th Edition is that which i s referred to i n the rule. Improper installation o f continuous monitors may a1 l o w for air bubbles to enter the monitor resulting in false turbidity spikes. to avoid air bubbles reaching the turbidimeter, the sample tap should be installed below the center line of the pipe and an air release valve may be included on the sample line.
3 -4

served water to the publ ic. An Yevent" i s defined as a series of consecutive days i n which at least one tu rb id i t y measurement each day exceeds 5 NTU.
' It i s important t o note that every event, i .e. exceedance of the 5 NTU 1 itnit , regardless o f whether the system must f i l t e r as a consequence, consti tutes a v io la t ion of a treatment technique requirement. For example, i f the tu rb id i ty exceeded 5 NTU i n a t l e a s t one rneasurcrncnt each . day for three consecutive days, t h i s would const i tute one event and one treatment technique violation.. I f t h i s was the t h i rd event i n the past 12 months the system served water to the publ ic , or the s ix th event i n the past 120 months the system had served water t o the publ ic, the system would also be r e q u i r e d t o i n s t a l l f i l t r a t i o n . I n a l l cases, the system must infonn the Primacy Agency when the tu rb id i ty exceeds 5 NTU as soon as possible, but no l a t e r than the end o f the next business day.
The Primacy Agency should evaluate additional data from'the u t i l i t y t o determine the signif icance o f the event with respect to the po ten t ia l hea l th r i sk to the comaunity and determine whether a b o i l water n o t i c e i s necessary. The addit ional data may include raw water fecal col i form levels, duration and magnitude of the tu rb id i ty excursion, nature o f the turbidity (organic or inorganic) , disinfectant residual entering the system during the excursion and/or co l i form leve ls in the d is t r ibut ion system following the excursion. Boil water notices are not required under the SWTR, they may be issued at the discret ion of the Primacy Agency.
' 5 NTU are unusual or unpredictable, i t i s recomaended tha t i n add i t i on t o the h is to r ica l tu rb id i ty data, the water purveyor should co l lec t and . prov ide to the Primacy Agency current and h i s to r i ca l i n fomat ion on flows, reservoir water levels, cl imatological conditions, and any other infoma- t ion tha t the Primacy Agency deems relevant. The Primacy Agency will then evaluate th is in format ion to determine i f the event was unusual or unpredictable. Examples o f unusual or unpredictable events include
In o rde r t o determine i f the periods with turbidity greater than .
hurricanes , by : -
f loods and earthquakes. High tu rb id i t y events may be avoided
Use o f an al ternate source which i s not a surface water and does not have t o m e t the requirements of the SWTR.
- Use Of an alternate source ‘which i s not a surface water and
- Use of an alternate source which i s a.surface water and which
* - U t i l i z a t i o n o f stored water t o supply the comnunity un t i l the
does not have .to meet the requlremcnts of the SWTR.
does meet the requirements. of the SHTR.
source water quality meets the cr i ter ia.
- .
3.2 m-4 3.2.1 Inac t iva t ion Reuuirgngsl& - To avoid f i l t r a t i o n , a system m s t demonstrate that it maintains
disinfection condit ions which inact ivate 99.9 percent o f Gfatdla cysts and 99.99 percent o f v i ruses every day of operation except any one day each month. If the disinfection conditions provide less than these inactiva- tions during more than one day of the month, the system i s i n v io la t ion o f
during any two months i n the previous 12 months, the system must i n s t a l l .. a treatment technique requirement. If the system incurs such a v io la t ion
f i l t r a t i o n , unless ‘one of the violations was caused by unusual and unpredictable circumstances as determined by the Primacy Agency. Systems with three or atore violat ions i n the previous 12 months must i n s t a l l f i l t r a t i o n regardless o f t he cause of the v io lat ion. To demonstrate . adequate inactivations, the system must monitor and record the disinfec- ’
tant(s) used, disinfectant residual (5) , disinfectant contact time(s), pH. ( f o r chlorine) , and water temperature, and use these data t o determine if i t i s met ing the minimum tota l inact ivat ion requirements i n the rule.
A number of d is in fectants are available, including ozone, chlorine, chlorine dioxide and chloramines. The SWTR prescribes CT [C, residual disinfectant concentration (mg/L) x T, contact time (min)] levels f o r these disinfectants which will achieve d i f ferent leve ls o f inact ivat ion under various conditions. The disinfcctant(s) used t o w e t t h e i n a c t i v a - t i o n requirements i s i d e n t i f i e d as the primary disinfectant throughout the remainder o f t h i s document.
To deternine compliance with the inact ivat ion requirements, a system must calculate the CT value(s) for i t s disinfection conditions during peak hourly flow Once each day that i t i s del ivering water t o i t s customers. For the purpose of calculat ing CT value, T i s the time ( i n QinUtes) i t
3-6

takes the wdter, during peak hourly f.low, t o mve between the point of disinfectant + app1icatiOn and a point where, C, residual disinfectant concentration i s measured p r i o r t o t h e f i r s t customer. Residual disinfectant concentration i s the concentration of the disinfectant (in mg/L) at a point before or a t t he f i r s t customer. Contact t ime i n pipelines must be calculated based on plug flow (i .e. , where a l l water moves homogeneously i n time between two points) by dividing the internal volume of the p ipel ine by the peak hourly flow rate through that pipel ine. Contact time within mixing baslns, sett l ing basins storage reservoirs, and any other tankage must be determined by tracer studies or an equivalent method as determined by the Primacy Agency. The contact time deterrained from tracer studies t o be used for calculat ing CT , i s T,;. T,, i s the detention time corresponding to the t ime for which 90 percent o f the water has been i n contact with at least the residual concentration, C. Guidance f o r determining contact times fo r basins i s provided i n Appendix C.
The f i r s t customer i s t he po in t a t which f inished water i s f i r s t consumed. I n many cases t h i s will include the treatment plant itself. This d e f i n i t i o n o f f i r s t customer per ta in ing to . the po int o f first .
consumption assures tha t the water has received the required disinfection - t o provide protection from microorganisms f o r a l l consumers. Peak hourly
f low should be considered as the greatest volusn'of water passing through the system during any one hour i n a consecutive 24 hour period. Thus, i t i s not meant t o be the absolute peak flow occurring at any instant during the day.
. Systems with only one point of disinfectant appl icat ion may determine the to ta l inac t iva t ion based on one point o f residual measure- ment p r i o r t o ' t h e f i r s t customer, or on a pro f i le o f the res idua l concentrat ion af ter the point of d is infectant appl icat ion. Methods of. dis' infcction measurement are presented i n Appendix 0. The residual p r o f i l e and the to ta l inac t iva t ion i s ca lcu la ted as follows: - kasure the d is in fectant res idual , C, a t any number of po ints
- Deternine the travel time, TI between the point of disinfec- tant appl icat ion and the point where C i s measured for the f i r s t section. For subsequent measurements o f "C," T i s the
within the treatment train.
3-7
time i t takes f o r water t o m v e from the previous "C" owkure- nant po in t t o t h i s po in t of aeasurment.
- Calculate CT for each point of residual measurement (CTc,lc)*
- OeterJaine the inact ivat ion ra t io (CT~*,l,/CT,,,9) f o r each sec- t ion,
- Sum the inact ivat ion ra t ios for each section, i.e. C,T /CT , , + C T,/CT,, e + C,t,/Ct,,,, t o determine the to ta l inac tha t fon rat io . #
- I f the total inact ivat ion . rat io (sum (CTe,,JCT,,.,)) 4s equal t o or greater than 1.0, the system provides greater than 99.9 percent inact ivat ion of Giardia cysts), and the system meets the disinfection performance re- quirement. Further explanation of CT calculations i s presented i n Section 3.2.2.
b Systems need only calculate one CT (CTC,,J each day, f o r a po int a t or pr io r t o t he first customer; a l ternat ive ly they have the option of ca l - culat ing numerous CTs after the point of disinfectant appl icat ion but.
% p r i o r t o t h e f i r s t customer t o deternine the inactivation rat io. P r o f i l - * ing the residual gives credit for the higher residuals which ex i s t a f te r
the d is infectant is applied but before the first customer. Pro f i l i ng the residual may not be necessary i f one CT i s calcul-ated (CTC,,J, and t h i s exceeds the applicable CT,,,,. I n t h i s case, the ,system i s meeting the dis infect ion perfomance requirement. for systems with a very low oxidant demand i n t h e water and long contact times, t h i s approach may be the most
For systcms with multiple points of 'disinfectant application,. such as ozone followed by chlorine, or chlorine applied at two different points i n the treatment train, the inactivation rat io. of each disinfectant section prior t o t h e f i r s t customer i s used t o determtne the . to ta l inact ivat ion ra t io . The dis infectant residual of each dis infect ion
- p rac t i ca l t o use.
2 CT,,,, i s t h e CT value required t o achieve 99.9 percent or 3-1og E_iprdia cyst in,activation for the condi t ions of ' pH, temperature and residual concentrat ion for each section. A section i s the portion o f the system with a measurable contact time between two points of d is infect ion application or residual monitoring.
3-8

section.md the corresponding contact tine must be measured a t s&e point p r i o r t o t h e subsequent dis infect ion appl icat ion point($) to determine the
' i nac t i va t i on ra t i o f o r each section, and whether. the t o t a l inact ivat ion r a t i o is 1.0 or more. For example, if 'the first disinfection section provided an i nac t i va t i on ra t i o o f 213 (or 99 percent inact ivat ion) 'and the second disinfection section provided an inac t iva t ion ra t io o f 1/3 (or 90 percent inact ivat ion), the total Inact ivat ion rat io would equal 1.0 (2/3 + 1/3 = 1) indicat ing that 99.9% inact ivat ion was provided and the d is in fect ion requirements are met. Further explanation o f thedetemina- t i o n of to ta l inac t iva t ion provided is contained i n Section 3.2.2. s The SWTR establishes CTs for chlorine, chlorine dioxide, ozone and
chloramines which will achieve 3-109 inac t iva t ions o f aardb cys ts and a t least 4-100 inact ivat ion of v i ruses. Appendix E presents Cfs for these and other log inactivations. A system must demonstrate compliance wi th the inact ivat ion requirements based on conditions occurring 'during peak hourly flow. Since a system generally can only ident i fy peak hourly flow a f t e r i t has occurred, hourly residual measurements during the day are suggested. I f the sampling points are remote, or manpower i s l i m i t e d and co l lect ion o f hourly grab samples i s impractical, continuous monitors may. be i ns ta l led . In cases where continuous monitors are impractical., the
case-by-case basis; where possible th is should be based on h is to r ica l f low patterns. Measurements for. the hour o f peak flow can then be used i n calculat ing C t . The pH ( fo r systems using chlorine) and temperature must be determined d a i l y f o r each d is in fect ion sequence p r i o r ' t o the f i r s t customer.
Since the system's i n a c t i v a t i o n i s determined during peak hour ly f low, the disinfectant dosage app l i ed t o me t CT requircraents may not be necessary during lower flow conditions. Continuing t o apply a disinfec- t an t dosage based on the peak hourly flow could possibly resul t in increased levels o f dis infectant by-products, including TTHMs and increased costs. Under lower flow conditions, a higher contact time i s ,
avai lable and a lower residual may provide the CT needed t o meet the inact ivat ion requirements. The system may therefore choose t o adjust the
- Primacy Agency may establ ish an acceptable monitoring program on a
3-9
f-? t ,; disinfectant dose with changes in flow. The system should, however, maintain a disinfectant residual which will still provide a 3-1og inactivation o f cysts and a 4-log inactivation of viruses at non-peak hourly flows. The system should therefore evaluate the residual needed to provide the required inactivation under different flow conditions and set the dosage accordingly. The following provides an example of maintaining the required inactivation.
lExamDlt A 5 q d non-filtering systm disinfecting with free chlorine at one
point of application, has a contact time of 165 minutes during-a'peak flow of 5 ffi0. The flow va'ries from 1 to 5 HGD. The pH and temperatures o f the water are 7 and 5 C, respectively. At a residual of 0.9 q/L, a CT o f 148 mg/L-min is required to meet the disinfection requirements. the CT for 0.9 mg/L residual is determined by straight line interpolation between
available contact time is longer and a lower residual would provide the required disinfection. Based on existing contact time and using 'the appropriate CT tables (in this case, Table € 4 ) in Appendix E for a 3-109 Gtardia cyst inactivation, the required disinfection would be provided by maintaining the following chlorine residuals for the indicated flow:
c . 0.8 mg/L and 1.0 mg/L residuals. Under h e r flow conditions, the
Contact CT (mg/L-min) Free Chlorine €JAu!w Iimuu Reau i red Psidual ~~
165 206 275 412 025
148 145 143
0.9 0.7 0.6 0.4 0 0.2
This table indicates the variation of residuals needed for the system to provide the required inactivation. For chlorine, the disinfec- tant residual cannot be adjusted in direct proportion to the flow because the CT needed for disinfection is dependent upon the residual. Since i t
is not practical to continuously adjust the' residual and, s h c e a disinfection level for a &log aardia cyst inactivation must be maintained under all flow'conditions, it is suggested that the flow .'
variation at the utility be divided into ranges and the residual netded at
3-10 . .

the higher flow range t o ensure
r a t e o f each range be maintained .for a l l f lows within the the required disinfection. The following flow ranges and
residuals are suggested for the system:
ElQuuum - 1 - 1.9 0.4 . 2 - 3.9 0.6 4 - 5 0.9
f tee Ch 1 o r i ne
By maintaining these residuals, the u t i l i t y i s ensuring the p-mvision of the required disinfection while minimizing the disinfectant application, which should r e s u l t i n lower disinfection by-pioducts and costs.
Although these residuals will meet the inactivation nquireratnts, maintaining a residual i n the d is t r ibut ion system must also be considered. I f no other po int o f d is in fect ion ex is ts pr ior to the d is t r ibut ion system, the res idual for d is in fect ion must be maintained a t a level which will also provide a residual throughout the distribution system. The complete range o f flm occurr ing at the p lant should be evaluated for determining. the required residual. A u t i l i t y may establ ish the residual requirements f o r as many flow ranges as i s pract ical .
The C f s determined from the daily systtm data should be compared t o the values i n t h e t a b l e for the pH and temperature o f the water, t o detennine i f the required CT has been achieved. Only the analyt ical methods prescribed i n t h e SWTR, or otherwise approved by €PA, m y be used f o r measuring disinfectant residuals. Wthods prescribed i n t h e SUTR are
- l i s t e d i n Appendix 0. The Appendix also contains a paper which describes monitoring methods for various disinfectants and conditions.
The Primacy Agency should make periodic checks on i t s u t i l i t i e s t o assure that they are maintaining adequate d is in fec t ion a t non-peak flow conditions.
e t i n g t h e b t i v a t i o n R e g u i r w n t Usina Free Ch- When f ree ch lo r i ne i s used as a dis infectant, the ef f ic iency of
inact ivat ion is inf luenced by. the temperature and pH o f the water. 'Thus, the measurement of the temperature and pH for the deteminat ion of the CT i s required. The SWTR provides the CT requirements for f ree ch lor ine ' a t
3-11

f? various tefnpttaturcS and pHs which may occur i n a source water. These values a n presented i n Table € 4 through fable €07 In Appendix E. The
* basis for these values i s discussed i n Appendix F. For free chlorine, a 340g inact ivat ion of Giardia cysts will provide greater than a 4.109 inact ivat ion of viruses, thus met ing the SWTR inact ivat ion requirements.
As indicated i n Table E-2, a raw water temperature o f 5 C, a pH of 7.0, and a residual chlorine concentration o f 1.4 mg/l require a C f o f 155 . mg/L-min t o provide a 340g inact ivat ion of Giardia cysts. Therefore, t o meet the inact ivat ion requirement under these condit ions with one po in t o f residual wasureQKnt, a contact time of 111 minutes [(l% ag/L-min)/ (1.4 IIQ/L)] p r i o r t o t h e f i r s t customer would be required.
e t i u I n a c t i v a t w n t Usm Chloramiw Chloramines are a'much maker oxidant'than free chlorine, chlorine
di'oxidc and ozone. The CT values for chloramines presented i n Table E42
excystation of EJardia cysts (Rubin, 1988). No safety factor was applied to the laboratory data on which,the CT values were based since EPA . '
* . are based on disinfection studies using prefomd chloramines and io y i t r q
bel ieves that chlormination, conducted i n t h e f i e l d , i s more effect ive .
than using preformed chloramines,
chlorine were reacted t o form chloramines before the addition of the microorganisms, Under f ie ld condi t ions, ch lor ine is usugl ly added f i r s t followed by' m n i a addi t ion fur ther downstream. Also, even after the addition of amonia, some free chlorine residual may pers is t fo r a period o f time. Therefore, f ree chlor ine i s present f o r a per iod of t ime pr ior to the format ion of chloramines. Since this free chlorine contact t ime i s not dupl icated in the laboratory when test ing with prefomed chloramines, the CT values obtained by such t e s t s m y provide conservative values when compared t o those Cfs actually obtained i n the f ield with chlorine appl ied before anmonia. Also, other factors such as mix ing ' in the f ie ld (versus no mixing i n the laboratory) may contr ibute to d is infect ion ef fect iveness. For these reasons, systems 'using chloraqines for disinfection may demonstrate ef fect ive d is in fect ion in accordance with the .procedure i n Appendix G i n l i e u of meeting the CT values i n Appendix E.
In the laboratory test ing using prefomd chloramines, amnonia and .
. .
3-12

.
If a s y s t m uses chloramines and i s able t o achieve the CT values f o r 99.9 percent inactivation of Giardia cysts, i t i s not always appropriate t o assume that 99.99 percent or greater inactivation of viruses was .also achieved, Mm data indicate that Hepatit is A v i r u s i s more sensit ive than cysts to inactivation by preformed chloramines
> (Sobsey, 1988). The CT values required to achieve 99.99 percent inact ivat ion of Hepat i t is A with preformed chlormines are lower than
. those needed t o achieve 99.9 percent inactivation of cysts. These data contrast with other data which i n d i c a t e t h a t r o t r v i n i 3 . i s more resistant than giardia cysts to prefonned chloramines (Hoff, 1986) . I
HAver , ro tav i rus 4s very sensi t ive to inact ivat ion by free chlorine, much more so than Hepatitis A (Hoff, 1986;' Sobsey, .1988). I f chlorine i s app l i ed p r i o r t o amnonia, the short term presence of f ree chlor ine would be expected to provide at least 99.99 percent inactivation of
.. ro tav i rus pr ior to the addi t ion of anmonia and subsequent formation o f chloramines. Thus, EPA believes i t i s appropr iate to use Hepati t is A data, i n l i e u o f rotavirus data, as a surrogate for def in ing minimum CT values fo r inac t iva t ion of viruses by chloramines,' under the condit ion tha t ch lo r i ne i s added t o the water p r i o r t o t he add i t i on o f amnonia.
A system which achieves a 99.9 percent or greater inact ivat ion of . m r d i a cysts with chloramines can be considered t o achieve a t leas t 99.99
percent inactivation of viruses, provided that chlorine i s added to t he water p r i o r t o t h e a d d i t i o n o f m n i a , Table E-13 provides CT values f o r achieving different levels of. virus inactivation. However, i f anmonia i s added f i r s t , t h e CT values i n t h e SWTR for achieving 99.9 percent inact ivat ion o f cysts cannot be considered adequate for achieving 99.99 percent inactivation of viruses.
t o demonstrate through on-site challenge studies, that the system i s Under such cases o f chloramine production, the SWTR'requires systems.
CT values I n excess o f 5,000 are required for a 4-1og inact ivat ion-of rotavirus by preformed chloramines but no minimum CT values have been determined.
4 CT values ranging from 0.025 t o 2.2 achieve 99 percent inactivation of ro tav i rus by free chlorine a t pH = 6 .-lo and 4 - 5'C (Hoff, 1986)
3-13

achieving at least a 4-109 inact ivat ion o f viruses. Guidance for conducting such studies i s given i n Appendix G . Once conditions for achieving a 4-109 inactivation of viruses has been established, the Primacy Agency should require systems to repor t the i r d is in fect ion operating conditions on an ongoing basis. These conditions should verify that the SySttm IS operating at CT values i n excess of that needed t o achieve a 4-100 virus inact ivat ion or 3-109 cyst inactivation, whichever i s higher.
t i v a t i o n m u i r e q g n t U s i u Chlorine b io r i& Under the SWTR, the CT values for the inactivation of cysts
using chlorine dioxide are independent of pH. Under the SUTR the only parameter affect ing the CT requirements associated with the use of chlor ine d iox ide is temperature. Table €08 . i n Appendix E presents the chlorine dioxide CT values required for the inact ivat ion of E ia rdb cys ts
Appendix F. Systas which use chlorine dioxide a n not nqui red t o measure the pH of the disinfected water for the calculat ion of CT. For'
. chlorine dioxide, a 3-109 inact ivat ion o f Giardia cystsowi l l genera l ly resu l t in g rea ter than a 4-109 virus inactivation, and assure meeting the SWTR inact ivat ion requirements. However, for chlorine dioxide, uni ikc .
chlorine where th is re la t ionship always holds true, at certain tempera- tures, the &log virus CTs may be higher than the 3-1og Giardia cyst CTs.
I a t d i f f e ren t temperatures. The basis for these CT values i s discussed i n
The Primacy Agency may allow lower CT values than those specified i n . - the SWTR fo r ind iv idua l systems based on infornation provided by the
system. Protocols for demonstrating ef fect ive d is infect ion at lower CT values i s provided i n Appendix G .
As ind icated in Tables E-8 and €09, the C f requirements fo r ch lo r ine dioxide am substant ia l ly lower than those required for free chlorine: However, chlorine dioxide i s not as stable as free chlorine or chloramines i n a water systen and say not be capable of providing the required disinfectant residual throughout the distribution system. I n addition,,
. . out of concern for toxicological ef fects, EPA's current guideline i s t h a t the sum of the. chlorine dioxide, chlorate and chlori te residuals, be less than 1.0 nrg/L a t a l l consumer taps. This guideline may be h e r e d as more health effects data become available. These concerns further reduce the
3-14

f e a s i b i l i t y of using chlorine dioxide as a secondary disinfectant for d is t r ibu t ion Systems. Therefore, the use of chlorine dioxide as a primary disinfectant m y resu l t i n t he need for the appl icat ion o f a secondary disinfectant, such as chlor ine or chloramines, that will pers is t in the d is t r ibu t ion systear and provide the required residual protection: .
c t i w c t l v a t m a u i r w US- Another disinfect.ant t o i nac t i vq te - cysts and viruses i s
ozone. As with chlorine dioxide, under the SWTR, the CT values f o r ozone *
are independent o f pH* Tables E-10 and E-11 present the CT nquirementt for ozone a t d i f f e r e n t source water tapera tuns . the bas is fo r the C t ,
values for ozone i s given i n Appendix F. As for free chlorine., a 3-109 cyst inact ivat ion wi th ozone will resul t i n greater than a &log ’
v i m inactivation. Unlike chlorine, for .cases here only a 1-log or lower &jardi,$ i n a c t i v a t i o n i s needed wi th ozone, the CT values f o r v i r u s ‘ inact ivat ion MY be higher than the CT f o r w. The Primacy Agency . may allow lower CT values for indiv idual systems based on infoimation .provided by the systera tha t demonstrates that CT values lower than those specified i n t h e r u l e achieve the same inact ivat ion ef f ic iencies (see Appendix 6) .
Ozone i s extretnely reactive and dissipates quickly after applica- tfon. Therefore, a residual’ can only be expected to pe rs i s t a short time
’ The r e s i d u a l m s t be matured using the Indi o .Trisulfonate Method (Bader I, Hoigne, 1981.) or automated methods s i ch a n ca l i b ra ted i n reference to the rusults obtained by the Indigo Trisulfonate method, on a regular basis as determined by the Primacy Agency. The Indigo Tr isul fonate method i s included i n t h e 17th Edition of m d a r d m. This method i s preferable to current standard methods because o f t h e s e l e c t i v i t y of the Indigo Trisulfonate indjcaor i n the presence
. o f most h t e r f e n n c e r found i n oronated waters. The ozone degrades an ac id ic so lu t ion of indigo’ t r isul fonate i n a 1:l proportion. . T.he d w n r s e i n absorbance is l inear w i th inc reas ing ozone Concentrations over .a wfde range. Halonic acld can be added t o block interference from chlorine. Interference f ra penran mate, produced by the oronation of manganese, i s corrected b runn ng a blank i n which ozone i s destroyed p r i o r t o a d d i t i o n of the ndigo reagent. The sampleo’can be analyzed using a spectrophotometer a t a 600 nm wavelength which can, , detect residuals as low as 2 ug/L or a visual color cbtnparison method which can measure down t o 10 ug/L Ozone. Although current ly available monitoring probes do not use the Indigo Trisulfonate Method, they can
r !
3-15
after appl icat ion. I n addition, the application of ozone t o water i s (- '. dependent Qn Uss transfer. For these reasons, the method of CT determination used for the other dislnfectants 1.s inpractical for ozone, the CT,,,, must be' determined for the ozone contactor alone. The contactor w i 11 have SOW port ions here the ozone i s applied and other portions of the contactor where ozone i s no longer applied, which are referred t o as the reactive flow chambers.
For many ozone contactors, the residual in the contactor will vary i n accordance with the method and rate of applicat1on;the residual will be nonuniform and i s l i k e l y t o be zero I n a portion of the contactor. As . '
previously iqdlcated, the CT value i s based on the presence of a known. residual during a specific contact tiae. Thus dis infect ion. credi t is only provided for the time when a residual i s present. Besides the nonunifonn- i t y of the residual, monitoring the residual will be d i f f i c u l t because o f
. the ozone's h igh reac t iv i t y and the closed design of the contactors. I n add i t ion to the d i f f i cu l ty i n determining the ozone res i&a l . f o r
' . the CT calculation, the contact t ime will vary between basins depending .on t h e i r flow configuration. Several types o f devices are avai lable for adding ozone t o water including porous diffuse&, submerged turbines, in jector , packed towers and s ta t i c mixers. Each type o f device can be . .used i n e i ther s ing le or a u l t i p l e chamber cmtactors. The flow through a single'charaber turbine contactor will approximate a corapletcly mixed un i t , h i l e f l w ' t h m u g h a s ingle chamber dif fused contactor',. or a mult ip le
' chamber diffused contactor, will mom closely represent plug flow. This var ia t ion i n flow i n different contactors makes the use of T,,, inappropri- ate for tm 'contacton.
The dif fennces between ozone contactors and other ' d is infect ion ' s y t t m <ed i n the development o f several approaches for detemining
~ c-
the inakt ivat ion provided by ozone, including: - Evr lua t ion o f C and 1 - Segregated flow Analysis (SFA)
- Site Specif ic Evaluation . . Continuously S t i r r e d lank Reactor (CSTR)
be ca l i b ra ted v la t h i s method.
3-16

The method which i s appropriate for a par icular system will depend on system COnffguratiOn and the required level of inactivation, An0the.r s igni f icmt d i f ference i s that ozone may be applied t o provide only 6 por t ion o f the overa l l 3-109 Eiardtp cyst and 4-log virus inactivation' wi th the remainder of the inactivation provided by another disinfectant. Appendix' 0 provides detafls for selectfng the appropriate ncthod of evaluation for specific cgnditions.
The evaluation of C and T involves separate detennination of the ozone residual concentration, C, and the contact time, T, i n the contactor. C can be detennined for indiv idual chambers of a' contactor based on the residual ncasured a t several points throughout the chamber, or a t t he ex i t o f t he chamber. The T value can be detennined through a tracer study or an equivalent method as approved by the Prindcy Agency w i t h a i r or oxygen applied during testing, using the same feed gas ra te as used during operation. Appendix 0 provides de ta i l s for the CT approach.
$FA i s based on the resul ts o f .a t racer study used i n conjunction with the measured ozone res idual to determine the survival of r icroorgan- isms exi t ing the contactor. The survival corresponds t o a cer ta in inactivation. Guidelines for t h i s approach are included fn Appendix 0.
The CSTR approach i s applicable for contactots nhich have a high degree o f mixing. Experience has shown that for contactorf, such as turbine units, the ozone residual i s generally uniform throughout the contactor. The ozone residual measured a t t h e e x i t i f the contactor i s
. used i n an equation for CSfRs t o determine the inact ivat ion provided. . - Appendix 0 provides detai ls for conductfng CSTR anklysis.
Si te speci f ic evaluat ions may include: . - Measurement o f an observable parameter to co r re la te w i th C - Mathematical model fo r d is in fec t ion e f f i c iency - Microbial indicator studies for d is infect ion ef f ic i .ency
t o amre c losely determine the fnactivation provided tn a par t i cu la r system. Appendix 0 provides details for applying s i t e spec i f i c evalua- tions.
3-1 7

3Lmmarv r' . ,
mny SYttcrPs which do not prov ide f i l t ra t ion will have d i f f i c u l t y ' i n . providing the cpntact time necessary to sa t i s f y t he i nac t i va t i o i
requi-nts P r i o r t o t h e f i r s t c u t t k r . For example, a sys tm using free chior ine at 1 ur ter tc lnpcratun o f 5 C, a pH of 7.0 m d 4 chlorine residual of 1.4 mg/L would r q u i r e 111 minutes of contact time t o meet the inactivation nquirement. Potential options for these systeas include: - Ins ta l la t ion o f storage f a c i l i t i e s t o provide the required
contact time under maximum flow conditions. - - Use of an alternate primary disinfectant such as ozone or
chlorinq dioxide which has CT values lower than those required f o r free chlorine. for the required inactivation.
. -
- . For so10 Systems, the d i f f i cu l t y i n obtaining the required
inact ivat ion may only be a seasonal pmblm. A system that has raw water temperatures which reach 20 C during the s m r months a t a pH o f 7.0, may have suff icient contact t ime to neet the CT o f 56 mg/L-min (fable E-5) a t a chlorine concentration of 1 ag/L. However, assuming the same pH and chlorine concentration, It may not have suff iclent contact t h e t o m e t * the CT requirement a t 5 C, 149 ag/L-min (fable E-Z), or a t 0.5 C, 210 mg/L-ain (Table E-1). Under those conditions, a systm could choose. t o use ozone or chlorine dioxide on a reasorril basis, sfnce they are stronger disinfectants requir ing a shorter contact ti,-. '
As indicated i n Table € 4 2 , the Cl values for chlorar ints may be impract ica l to a t ta in for most system. Systems which c u r r e n t l y u t i l i z e chlormines as a primary disinfectant MY need t o use e i ther free chlor- ine, chlorlne dioxtde or!otone i n order t o provide the raquind dis in- fcctim. m v e r , systems using chloramines as a pri+ry disinfectant nay chose t o d m n s t r a t e t h e adequacy o f the disinfection. Appendix. G presents a wethod for 8aking t h i s demonstration.
the fapgtivation k a i t ~ l ~ t using AltSCmOate D m For s y s t m using disinfectants other, than chlorine, ch1ormineS,
chlorine dioxide, or ozone, the effectiveness of the disinfectant Can be dmnsttytcd using the protocol contained in Appendix 6. The P ~ O C O l i n Appendix 6.3. for batch test ing should be followed for any dfsinfcctant

which can be prepared i n an aqueous solut ion and will be stable throughout the testing.' for disinfectants which are not stable, the pilot study protocol outl ined , in. Appendix G.4 should be f o l l w d .
3.2.2 DttemIinatiOn o f Overal l Inactivation for Residual Prof i le,
For systems which apply disinfectant(s) at mre than one point, or choose t o prof i le the residual from one point of appl icat ion, the total inac t iva t ion i s the sum of the inact ivat ion rat ios between each of the points o f d is in fec t ion or between each of the residual monitoring points, respectively. The por t ion o f the system with a neasurable contact tian between tw points of d is infect ion appl icat ion or residual monitoring will be re fe r red to as a section. The calculated CT (CTC,,J f o r each section i s detemined daily.
. The CT needed t o f u l f i l l t h e d i s i n f e c t i o n requirements i s CT9,,), . corresponding t o a 3-109 inact ivat fon of Glatdia cysts and greater than or
equal t o a 4-109 inact ivat ion of viruses (except for chloramines and sometimes chlor ine d ioxide as explained i n Section 3.2.1). The inact iva- t i o n r a t i o f o r each section i s represented by CTe,,c/Cf99,9, as explained i n
. Section 3.2,1, and indicates the port ion o f the required fnactivation provided by the section. The sum of the inact ivat ion rat ios from each section can be used t o determine the overal l level o f d4sinfectio.n provided. Assuming inact ivat ion i s a first order ieaction, the inac- t i v a t i o n r a t i o corresponds t o log and percent inactivations as follows:
f l u w R h D f s i n f c c t a n t J l t i d e Sources
& I . c U O . 9
0.17
0 .33
0.50
0.67
0.83
1 .oo
8 0.5 log
(I 1 log
I 1.5 log
S 2 log
m 2.5 log
.I 3 log
1.33 I ' 4 log
a 6 0 %
I 908
I 96 .& I 99%
8 99.7%
I . 99.9%
I 99.9%
3-19

Ct, , , +an be detennined for each section by referring to Tables E-1 r). through 4-13 in Appendix E, using the pH (when chlorine i s the disinfec- tant) and temperatures of the water for the respective sections. These tables present the log inactivation of a r d i a cysts and viruses achieved' by CTs at various water tcmptratuns and pHs.
Log inactivations are additive, so: 0.5 Log + 1.0 Log = 1.5 Log or 0.17CT,,., + 0.33CT,,,, O.SCT,,., ._ ,..
- ._
If the sum of the inactivation ratios i s greater than or equal to one, the required 3-109 inactivation o f cysts has been achieved. An inactivation ratio of at least 1.0 is needed to demonstrate compliance with the Giardia cyst inactivation rquirenents for unfiltered systkr.
The total log inactivation can be determined by multiplying the sum of 'tho 'inactivation ratios (sum (CTeJ,JCT,,.,)), by three. The total log inactivation can be datemined in this way because CT,,,, is equivalent to a 3-100 inactivation. The total percent inactivation can be determined as
- f o l l ~ : c.
y - l Q Q - l Q Q Equation ' (1) 10'
when: y 4 Inactivation x 8 log inactivation
For example:
X = 3.0 l o g inactivation
Y = l o O - # L 99.9 Q inactivation
As explained in Section 3.2.1, the CTcJlc detemlned for each disin- fection section i s the product o f the disinfectant residual i n ag/L and the detcntlon time in minutes through the section at peak hourly f low. However, for many water systems, peak hourly, flow will not necessari ly
. occur sirrultaheously in all sections. The extent to which the occurrtnce o f peak hourly flow will vary between sections of the system depends on
. c
3-20

the characterist ics Of an individual system including i t s size, storage capacity within the d is t r ibu t ion system, the number of sources, and hydraulic Capacities between d i f ferent sections. I n order to s i lpp l f fy the’ determination Of peak hourly flow f o r ‘ t h e system, it should be taken as peak hourly flow i n the last sect lon of the system p r i o r t o t h e f i r s t customer.
The CT values for $11 the sections should be calculated for the flow and the residuals occurring during the hour of peak flow i n the l as t section. The most accurate way t o deternine the flow i n a $art icular section i s through the use of a flow meter. However., some sections o f the
, systea may not have e f l o w meter. The following guidelines can be used t o determine the flow t o be used in ca lcu la t ing CT: - for sections which do not have meters, the flow should be
astuned t o be the higher of the two flows occurring i n the closest upstream and downstrear sections with meters. - In cases where a section contains a pipeline and a basin with the f l o w meter located p r io r t o t he basin, the metered flow does not represent the discharge rate o f the basin, The di f ference i n i n l e t and discharge rates frm a. basin will impact the water level i n t h e basin. As explained i n Appendix C, f a l l i n g water levels will r e s u l t i n lower T,, values.
- To assure that the detention time o f a basin i s not. overestimated, the discharge flow f m a basin should be used i n l i e u of the inf luent flow, unless the influent. flow i s higher.
- To estilrate the discharge flow fm a basin the closest flow metap downstream of the basin should be used.
The fo l lowing example presents the detemination ‘of the total percent i n a c t i v a t b n for mult ip le po ints o f dis infect ion, with var ia t ion i n flow between sections.
UmElS A c a a u n i t y of 6,000 people obtains i t s water supply fm a lake
’ which ’ i s 10 r i l e s froe the c i t y l i m i t s . Two 0.2 MG storage ‘tanks are located along the 12-inch transmission line t o t h e c i t y . The water is disinfected with ch lo r ine d iox ide a t the ex i t fnw the lake and wi th chlorine at the discharge frm the first and second storage tanks. The
3-2 1
. ... .

average water demand of the connunity i s 1 MGD with o f approximately 2 ff iD. For the calculat ions of
a peak hourly demand r ? . . the overall percent
inactivation, the supply systemis divided into three sections as shown Figure 3 4
Section 1 - frOQI the lake to the discharge frm the f i r s t btorage tank , Section 2 - frm the discharge from t h e f i r s t storage tank t o t h e . discharge froa the second tank
f i r s t c u s t m r * ' Section 3 - ftom the dlscharge o f the second storage tank to the
The overa l l inac t iva t ion i s computed da i l y fo r the peak hourly fl& condi- tions. Sections 1 dnd 3 contain flow meters t o monitor the water being withdrawn from the lake and the water being delivered to t he d i s t r i bu t i on system as shown on Figure 3-1. On the day of. t h i s example calculation, the peak hourly flow i n section 3 was 2 HGD. During th i s hour, water .was being withdraw from the lake at a ra te o f i . 5 mgd. ' Considering the placetaent o f flow meters, the flow o f 2 mgd llaasured i n section 3 should be used for calculat ing CT for that section. Since section 2 does not have a flow meter, the meter i n section 3 serves as a measure o f the discharge from storage tank 2 and should be the flow used i n the calculat ion o f CT for section 2. The flow meter i n section 1 records the flow through the transmission main which should be used in the ca lcu la t ion of Cf for the pipel ine. Hauevet, t h i s meter does not represent the discharge frola storage tank' 1. Since the water i s being pumped t o t he d i s t r i b u t i o n s y s t m a t 4 higher rate than the flow entering storage tank 1, the flow of 2 q d measured i n section 3 should be used for calculat ing the CT for storage tank 1.
T b pH, temperature and dis infectant residual of the water were m a s u d a t t he end of 8ach sec t ion jus t p r io r t o the next point of dis infect ion and t h e f i r s t customer during the hour Of peak flow. The water travels through the 12-inch transmission Rain a t '177 f t jmin a t
3-22
. .

1.5 ffi0.' The detention times of the storage tanks wre read off the Ti, VS. 0 plots generated frola tracer studies conducted on the storage tanks (see Appendix C). The data f o r the inactivation calculition are as' follows:
length of pipe (ft) flow (wd) Pipe tank
Pipe tank total
contact time (lain)
disinfectant
residual (IDQ/L temperature (C PH
h i ! x u % u L 2 a s u u L 2 15,840 26,400 10,560
1.5 2.0
2ao 2.0
2.0
dioxldt- -.. .-. .I...
0.1 5 8
oa2 5 8
0.4 5 8
This information is then used in conjunction with the CT,,., values In Appendix E to deternine the (CT,,,,/CTgg,,) i n each section as follows: action 1 - Chlorine dioxide CTCrlr - 0.1 mg/L x 105 dinutes .I 20.5 mg/L-ain
3-23 . .
- setion 1, - Chlorine .
CT,,,, 0.4 sg/L-ain x 45 nin = 18 mg/L-min
. Frm table E-2 at a temperature of 5 C m d pH 0, CT,9, , is 198 mg/L-min
The sm of Cl,,,,/CT,,.9 i s equal to 1.11, which is greater than 1, therefore, the system meets the requirements o f providing a 3 4 o g inactivation o f E j a t d b cysts. The log inactivation provided is:
x 3 x &,,( = 3 x 1.11 3.33 Cf99.9
The percent inactivation can be determined using equation 1.
The system meets the requirement of providing a 99.9 percent inactivation o f cysts.
The SWTR also requires that the public be provided with protection from u c l l p as w e 1 1 as Gtrrdip cysts and vivyes. ,Inactivation levels .. have not been set for j&gm because the required inactivation o f
cysts will provide protection f r o l , ~ e l l p . ’ However, this . level of disinfection cannot rsture that all will be inacti- c
. systems o f bufldings or cooling systems will occur. Appendix 6 provides . . vated and that no recontaaination or r q n m t h in recirculating.hot water
a
’ W h t 8 et rl . (1983) +eportad a maxim CT requinrwnt of 22.5 for ‘a 99’ pcrrcent inactivation of i n a 21 C tap water at. a PH o f 7.64.0 when usin free chl ng first order kinetics, a 99.9 percent inactivat P on requires a CT o f 33.8. Table A-5 presents the C f s needed for free chlorine to. achieve 8 99.9 percent Inactivation o f E iardb cysts at 20 C. This table indicates that the CT required for a 3-log inactivation of at the twperature and pH of the
# test ranges from 67 to 108 depending on chlorine residual. These CT’s are t w to three tines higher than that which is needed to
. .
, achieve a 3 log inactivation of -. . .
3-24

guidance for mitoring and treatment to control -ella in institu- tional systems.
The 8bove discussion pertains to a systea with one source with. sequential disinfection. Another system my blend more than one source, and disinfect one or more of the sources independently prior t o bl'ending. Systtm conditions which nay exist include: - All the sources are combined at one point prior to supplying
the conmunity but one or more of the sources are disinfected '
prior to being colabined, as shown on Figure 3-2. - Each source is disinfected individually m d 'antem the distribution systcm'at a different point, as shown on Fig- ure 3-3.
-
- For all systems combining sources, the'fint step in detemining the
Cf should be to determine the CT,,,, provided f r w the point o f blending . closest to the first customer using the contact time and residual at peak - hourly flow for that portion of the distribution system. This corresponds to section 0 on Figure 3-2 and section E on Figure 3-3. If the CT,,,, for section 0 or E provides the required inactivation, no additional CT credit is needed and no further evaluation is rquired. However, if the CT for section 0 or E is not sufficient to achieve the required inactivation, then the inactivdtion ratio (CTcJIc)/(CT,,,,) should be detamined f o r each section to deternine the overall inactivation provided for each source. The total inactivation must be greater than or qual to one for all
' 'sources in order to coaply with the requirements for 3-109 inactivation of
On Figure 3-2, sections A, '8, C and 0 contain sampling points a, b, UardQ cysts.
c and d, respectively. The tun of the inactivation ratios for sections A+D, . 8 + 0 and C+D =st each be greater than or equal to one for the disinfection r e q u i m n t s to be met.
The total inactivation for each sou'rce on Figure 3-2 should be dctemined as follows: SQUSLL
- Deterwine CT,,, for sections A and 0 based on 'the residual measurements a f . sample points a and d, and the travel time
,3-25 .

r" through each section under peak hourly flon conditions f o r the .respect i ve sect ion.
- Oetemine Ct,,, for the pH and temperature conditions i n eacti section using the tables in Appendix E - Calculate the inactivation ratios (CT,,,,/CT,,.9) for sections A and 0.
.. ~ - Calculate the sm of the inactivation ratios for sections A . and 0 to determine the total inactivation for source 1.
- If the sum of the inactivation ratios i s greater than or equal to 1.0, the systen has provided the required 3-109 cyst inactivation.
sausLu - . .
- Determine CT, for section B based on the residual measured at sample poht b and the travel time through the section under peak hourly flow Conditions.
- Determine CT,,, for section 8 for the .pH and tecnperature conditions in \he section using the appropriate tables' in Appendix E
- Calculate the inactivation ratio (CTg,,e]CTs,.,). for section B. a
- Add the inactivation ratios for sections 8 and 0 to detennint .
- If the sua of the inactivation ratios is greater than or equal the total inactivation for source I f .
.to 1.0, the syttea has provided the required 3-109 Gidrdia . cyst inactivation for the source.
s u K L u ' - Deternine CT, ,, for'section C based on the residual measured
,rt rapla pobt c and the travel time through the section wider peak hourly flow conditions.
:- ' Deternine CT,,, for section C for the 'pH and tclnperatun conditions in \he section using the appropriate tables in Appendix E.
. - Calculate the inactivation ratio (CT+,,,/CT,,.,) for section C.
- Add the inactivation ratios for sections C and D to determine - the total inactivation for Source 111.
3-26

.
- If the sum of the inactivation ratios is greater than or equal to 1.0, the system has provided the required 3-109 cyst inactivation for the source.
The determination of the total inactivation for each source may require more cakulations for system such as that on Figure 3-3 than on Figure 3-2. On Figure 3-3 sections A, 8,' C, 0, and E contain sampling points a, b, c, d, and e respectively. In order to minimize the calculations needed, the determination of the total inactivation should begin with the source closest to the first customer. -
The total inactivation for each source on Figure 3-3 .should be determined as follovit: 3QuKuu - Oetennine CT, for sections C and E based on the residual
measurement at sample polnts c and e and the detention time in each section under peak hourly .flow conditions for the respect i ve section.
- Oetemine Cf,, for the pH and temperature conditions in each section using !he tables in Appendix E. . .
- Calculate the inactivation ratios (Clc,,c/CTg,,;) for sections C and E.
- Calculate the sua of the inactivatisn ratios for sections C and E to deterwine the total inactivation for source 111.
- If the sua of the inactivation ratios is qkater than or equal to 1.0, the system has provided the required 3-log Efardiq cyst inactivation for source 111.
- Deternine Cf for section 0 based on the residual measured at sarple pohd d and the detention timtthrough the section under peak hourly flow conditions.
- Deternine Cl,,. for section 0 for the pH and temperature conditions in \he section using the appropriate tables in Append i x E .
- Calculate the inactivation ratio'(Cf,,,,/Cf,,.,) for section 0.
- Add the inactivation ratios for sections 0 and E to detenine the overall inactivation.
3-27

- 'If the sum of the inactivation ratios is greater than orequal f ?. to 1.0, the system has provided the required 3-109 EiarQlP cyst inactivation for source 11, as well as source I since the water f m each o f these sources are combined prior to sections 0 and E.
- I f the total inactivation ratio for sections 0 and E Is less than 1.0, additional calculations are needed. Proceed as follows for source 11.
- hternine Cf for section 8 based on the residual measured rt sample pohf b and the detention time through the section under peak hourly flow conditions. - - ' Determine Cf,, for section 8 for the .pH and temperature conditions in \he section using the appropriate tables in Append 1 x E.
- Calculate the'inactivation ratio .(CTcJ,JCT,,.,) for section 8.
' - Add the inactivation ratios for sections 8, 0 and E to
- If the sum o f the inactivation ratios is greater than or equal
determine the total inactivation for source I t .
to 1.0, the systea has provided the required 3-109 cyst inactivation for the source.
slussJ As noted in the determination o f the inactivation provided. for
source 11, i f th4 sum of the inactivation ratips for sections 0 and E is greater than or equal to l .OO the system has provided the required 3-109 Eiardlp cyst inactivation. H O W I V ~ ~ ~ if this sua is less than 1.0 additional calculations will be needed to determine the overall inaCtiv8-
a tion provided for source I. The calculations are as follows: . W c a I'
- Daternine C t J, for section A based on the nsidual measured at SarQte p i n 8 a and the detention time in the section under peak hourly flow conditions. - .. . . .&temine cT,, for section A for 'the. pH and thaQeratutt conditions in \he section using the appropriate. tables ' in Append i x E .
.. .
- ' Calculate the inactivation ratio (CTeJ,JCT9,.,) for section A.
- Add the inactivation ratios for sections A, 0, and ' E to determine the total inactivation for source I.
-z
3-20

- If the sum o f the inactivation ratios is greater than or equal - to 1.0, the systm has provided the required 3-109
. cyst inactivation for the source.
* 3,2.3 m i a n o f Mar- a R c s m The SWTR establishes two requirements concerning the maintenance of
a residual. The first requirement i s to mintdin 1 lainbn residual of 0.2 q / L entering the distribution system. The second is to maintain a detectable residual throughout the distribution system. The disinfectant used to met these requircmcnts i5 identified as the secondary disinfec- tant throughout the remainder of this document. These requirements are further explained i n the following sections.
a -1 m e Distribution qv-
. To avoid filtration, the disinfectant residual in water entering the distribution system cannot be less than 0.2 mg/l for more than four hours, with one exception noted below, Systems serving more than 3,300 persons must monitor continuously. If there i s a failure in the continuous monitoring equipment, the system .may substitute grab sampling every four hours for up to five working days following the fai'lure of the equipment. Systems serving 3,300 or fewer people may monitor continuously or take grab samples at the frequencies prescribed below:
d o 0 1 501-1,OOO 2
1 ,OO1-2,500 3 2,501-3,300 4
*Samples cannot be taken at the s a w time. the sm ling intervals are subject 'to Priaacy Agency review and approva f*
. .
If at any time the residual disinfectant concentration falls below 0.2 q/l in a system using grab sample monitoring, the systm must continue to take a grab sample every four hours until the residual disinfectant concentration i s qual to or greater than 0.2 q / l . For a11 system, if the residual concentration i s not restored to at least 0.2 wg/1 within ,
four hours after a value of less than 0.2 q/l i s observed, the system i s
3-29

?
i n v i o l a t i o n of 'a treatment technique nquirement, and m s t i n s t a l l (-3
fi I t ra t i on* HwVer , if the PFiUCy Agency f inds that the exceedance was Caused by an ~ ~ s u ~ l and unpredfctable circunstance, the Prjmcy Agency. may choose not to requi re fi It rat ion. €PA expects PrfIRAcy Agencies t o use this Provision Sparingly; it i s fntended t o encocapass catastrophic events, not infrequent large t t o m events. I n idd j t ion, my tima the resfdual concentration f a l l s below 0.2 mg/l, the systcla rust not i fy the Primacy Agency. Not i f icat ion &st occur as soon as pofsible, but no l a t e r than ' the end o f the next business day. The syst tq a lso must not i fy the Primacy Agency by the end o f the next business day whether or not the r&dur\ was restored within four hours.
Fai lure o f a monitoring or report ing requinnnnt does not t r igger a requirement t o f i l t e r although they are violations.
. .. i
0'.
:. ;.-
in ina a R o s w Uithin tho S v s t w l o avoid f i l t rat ion, the d is infectant residual i n the d is t r ibu t ion
sys tm .cannot be undetectable i n more than f fve percent of the s*leS; fn a month, for any two consecutive months that the system sewer water. t o the publ lc. Systcms nay measure HPC instead of disinfectant residual. Si tes wi th HPC concentrations of less than or q u a l t o 500/ml are considered equivalent to s i tes wi th detectable residuals for the purpose o f determining compliance. Public water systcaas rust monitor for the presence o f a disinfectant residual ('or HPC levels) ' at the sane frequency and locations as to ta l co l i fo rm measurements taken pursuant to the Total Colifom Rule. Hobever, i f the Primacy Agency deterrines, based on s i t e - .~ specific considerations, t h i t a system has no mans f o r having a sample transported and analyzed f o r HPC by a cert i f ied laboratory wi th in the requis i te time and temperature conditions (Wthod 907, APHA, 1985), but that the system i.s providing adquate disinfection i n . the d is t r ibut ion system, th lr requirements docs not apply t o t h a t systcs.
For systms which use both surface and ground water sources, the Pri-cy Agency my allow the system to take .disinfectant residual or HPC samples a t points other 'than the to ta l cO1i fO~'SuDpi ing 1ocationS i f it. deternines that such points are mre representative Of t reated (dis in- fected) water qual i ty wi th in the d is t r ibut ion SyStclll.

Disinfectant residual can be natured as total chlorine,. free chlorine, combined chlorine or chlorine dioxide (or HPC level). The SWTR lists the approved analytical mthods for these analyses. For example,' several test methods can be used to test for chlorine residual in the .
water, including m p e r m t t i c titration, OPO colorimetric, DPD ferrous titrimetric method and iodoarttrlc ncthod, as described in the 16th Edition of f tandard Methpslr.' Appendix 0 provides a revicw and sumary of available techniques to measure disinfectant residuals.
If a system fails to maintain a detectable disinfectant residual or an HPC level o f less than or equal to 500/1111 in more than 5 percent o f the '
samples during'a month, for any two consecutive months the system serves '
water to the public, the system is in violation o f a treatment technique requirement. In addition, this systcrn must install filtration unless the Prflaacy Agency determines that the violation was not due to a deficiency in treatmant of the source water (e.g., the violation was due to a deficiency in the distribution system, such as cross-connection contamina- tion or failure in the pipeline) . tion system may be due to a number of factors, including: .
the absence of a,detectable disinfectant residual in the distribu- .
- Insufficient chlorine applied at the treatment plant
- Interruption of chlorination
- A chan e in chlorine demand in either the source water or the distri 1 ution system
. . - tong standing times and/or, long translaission distances
Available O p t l M S t o correct the problem of low disinfectant residuals i n distribution systems. include: - Routine flushing
' Also, portable test kits are available which can be used in the field to detect residual upon-the approval of the Primacy Agency. These k i t r MY employ titration or colorimetric test methods. The colorimetric kits employ either a visual detection of a residual through the use o f
. a color wheel, or the detection o f the residual through the use o f a hand held spcctrophotomcter.
3-31
- -Increasing disinfectant d w s at the plant - 'Cleanin of the pipes (either mechanically by pi ging or'by . the add 1 tion of chemicals to dissolve the depos f tt) in thC
distribution system to m o v e accumulated debris which may be exerting a disinfectant demand; - Flushin and disinfection of the portions of the distribution system 1 n which a residual is not maintained; or
. Installation o f satellite disinfection feed facilities within * g I the distribution system. -. 3-
.. If-
For systems unable to maintain a residual, the Primacy hgency MY deternine that it is not feaslblc for the system to monitor HPC and judge' that disinfection is adequate based on site-specific condttiont.' , .
Additional information on maintaining a residual in the systam is, available in ' the AUUA Manual of Water Supply Practices and Water 'Chlorination Principles and Practices.
3.2.4 Disinfection futm Another requirement for unfiltered water supply . systems is .
disinfection facility redundancy. A system providing disinfection as the . only treatmtnt is required to assure that the water delivered to the distribution rystcm i s continuously disinfecttd. The SWTR requires either *
redundant disinfection equipment with auxiliary power and automatic x- start-up and alarm; or an rutmatic shutoff of delivery .of 'water to the Q
distribution syrtea h e n the disinfectant residual 1eve.l drops below 0.2 -4
a g / L . In order to fulfill the requirement of providing redundant disinfection facilitles, the following system is mcoaarcnded:
greater than the largest unit o n 4 ine.
,)..
- All ctmpontnts have backup units with capacities equal to or .
. - - - . . A m i n i m o f tm.storage units o f disinfectant which can be '
.,:. tanks o f hypoch f orite solution used alternate1 0 e.g., two cylinders of chlorine gas, two
0 Where the disinfectant is generattd &-site, such as ozone, backup units with a capacity qual to or greater than that o f the largest unit on-line.
Automatic twitchovcr q u i #nt to change the feed from one. .storage unit to the other 1 efore the first empties or becomes
.(
, i noperabl e
3*32

- F e e d systems with backup uni ts with capacities equal t o or greater than the largest unit on-line.
- An al ternate power supply such as a standby generator with the capabi l i ty o f running a l l the e lect r ica l equipment at the disinfection ,station. The generator should be on-site and funct ional wi th the capabi l i ty of automatic start-up on power '
f a i l u r e
i
Systems providing dis infect ion may have several different configura- t ions for typo and location of disinfectant appl icat ion. The fol lowing guidelines are provided to ass i s t Primacy Agencies and: U t i J i t i e s i n datemining the need for redundancy. Possible disinfection configurations include: - one d is in fectant used f o r primary and Secondary di 'sinfect ion
- one point of application - mul t ip le po ints of appl icat ion
- two dif ferent disinfectants used for primary and secondary d is in fec t ion
Inamany cases one dis infectant will be used t o f u l f i l l both the to ta l inac t iva t ion and residual requirements. One or more application points nay be used to accmpl ish th is . When one.application point i s used t o meet both the primary and secondary d is in fect ion requirements., the sys t ta i s requ i red to inc lude redundant disinfection.facilities.
Hhen mul t ip le po ints o f appl icat ion an used, redundancy i s ncocnnended for t h e d i s i n f e c t i o n f a c i l i t i e s a t each point o f appl icat ibn which is essent ia l t o met the to ta l inact ivat ion requirements. In addition, t o assure the maintenance o f a residual entering and throughout the d is t r ibu t ion system, either: - the l as t po in t o f app l ica t ion p r io r to the d is t r ibu t ion system
should have redundancy, or
- the po int o f app l i ca t i on imed ia te l y p r i o r t o t h i s po in t should have redundancy and suf f ic ient capaci ty to assure a residual enter ing the d istr ibut ion systm.
Systems nay also use tw di f ferent d is in fectants , one t o f u l f i l l ' t h c .
inactivation 'requirements and the second t o maintain a residual. An
3-33

Tt example of this would include a system using ozone as a primary disinfec- tant and chloramines as a secondary disinfectant. €?A reconrncnds that:
, . - the disinfection facilities at each point o f disinfectant application in the primary system essential in providing the overall Inactivation requirements Include redundancy, and
- the secondary disinfection facilities include redundancy, unless the disinfectant used for primary disinfection can provide a residual for the distribution system as well. If the primary disinfectant can be used for residual maintenance, the last point o f primary disinfectant application should include redundancy and sufficient capacity . to. assure a residual entering the distribution systea.
. x JT 4. --
Appendix I contains amre specific inforartion to assist the Prikcy Agency in establishing requirements for providing kundant disinfection facilities.
. Providing automatic shutoff o f .water delivery requires approval by the Primacy Agency. The Primcy Agency must deternine that this action, will not result in an unreasonable risk to health or interfere with fire' protection. This determination should include the evaluation o f the systta configuration to protect against negative pressures in the system, and providing for high demand periods including fire flow requirements. Automatic shutoff should be allowed only if systems have' adequate 5%;.
distribution system storage to maintain positive pressure for continued =u' .rf,
water use.
. ' 'M
3-34

3.3 UfE-sPKIFIC coyplTIONZ
t i on c r i t e r i a , non f i l t e r i ng systems using surface water supplies must meet . the fo l lowing cr i ter ia :
In 'addi t ion t o m e t i n g source water qua l i t y c r i t e r i a and disinfec-
- Maintain a watershed control pro ram - Conduct a yearly on-site inspect 3 on - Determine that no waterborne disease outbreaks have occurred
- cmply w i th TTHM re ulat ions (currently appl ies to systems i - Comply with the revised annual to ta l co l i form MCL
serving >10,000 peop 9 e)
Guidelines f o r meeting these other cr i ter ia 'are presented in the fo l lowing sections.
3.3.1 WConttol~t~atam A watershed control program i s a surveii lance and monitoring program
which i s conducted to protect the qual i ty o f a surface water source. An aggressive and detai led watershed control program i s des i rab le to
' e f fec t i ve ly limit or el iminate potent ia l contamination by human viruses. A watershed program may impact parameters such as tu rb id i ty , cer ta in ,
organic compounds, v i ruses, total and fecal col i foms, and areas of wi ld- l i f e habitat ion. However, the program i s expected t o have l i t t l e or no impact on parameters such as naturally occurring inorganic chemicals. L imit ing human a c t i v i t y i n t h e watershed may reduce the l ikel ihood of animals becoming infected wi th pathogens and thereby reduce the ttansmis- s ion of pathogens by w i l d l i f e . Preventing animal a c t i v i t y near the source water intake pr ior to d is in . fec t ion may also reduce the l ike l ihood o f pathogen occurrence a t the intake.
The e f fec t of a watershed p r o g r m i s d i f f i c u l t t o q u a n t i f y since many var iables that inf luence water qua l i t y are beyond the control or knowledgo of the water suppl ier. As a resul t , the btnefd t o f a watershed control program or speci f ic cont ro l measures must i n many cases be based on accuaulated cause and ef fect data and on the general knowledge of the impact of control measures rather than on actual quantif ication. The effectiveness of a program t o limit or eliminate potential contamination by human viruses ni 11 be determined based on: the -conrprehensivencss of the watershed &view; t h e a b i l i t y o f the water system to e f fect ive ly carry
3-35
out and monitor the management decisions regarding control o f detr.imcnta1 act iv i t ies dccurr ing in the watershed; and the potential for the water
watershed. According to t he SUR, a watershed control progracl should include as a minimum:
i systm to aaxi l r ize land ownership and/or control o f land use within the
- A descript ion Of the watershed including i t s hydrology and 1 and mers h i p - Identi f icat ion, monitoring and control of watershed character- i s t i c s and ac t i v i t i es i n the Watershed which aay have an adverse effect on the source .water qua l i t y
- A progrm to ga in ownership or control o f the land within the watershed through wri t ten agreemnts with land Owners, fo r the purpose o f con t ro l l ing ac t i v i t ios which will adversely a f fec t the microbiological qual i ty of the water
- An annual report which ident i f ies special concerns i n t h e . watershed and how they are being handled, i den t i f i es ac t i v j -
t i e s i n the.watershed, projects adverse a c t i v i t i e s expected t o occur in the fu tu re and how t h e u t i l i t y expects t o address them.
Appendix 3 contains a more detailed guide t o a' comprehensive
In preparing a watershed control 'program, surface water systems should draw upon the State watershed assessments and nonpoint source (NPS) po l lu t ion management programs requitad by S319 o f t he Ciean Uater Act. In fomat ion on these programs i s available from S t i t e water qua l i t y agencies or EPA's regional offices. Assesswnts ident i f y IPS pol lutants i n water and assess the urger qua l i t y . U t i l i t i es should use the assessments when evaluating pol lutants i n t h e i r watershed- Surface water qual i ty rssessmnts can also be obtained fma t h e l i s t s o f waters prepared under $304(1) of the Clean Water Act, and State b iennial ly prepared 5305 (b) nports
, State NPS rcrnagement programs ident i fy best management p rac t ic is (BMPS) t o bo craployed i n reducing UPS pol lut ion. . These management programs can be incorporated i n t h e watershed progrm to protect against
*. watershed program.
a dqradat ion of the source'water quality.
. .
. 3-36

for systms using ground water sources under the influence of surface water, the control measures delineated i n the Wel1.head Protection (WHP) program encompass the requirements of the watershed control progrm, and can be used t o f u l f i l l t h e requirements of the watershed control program. Guidance on the content of State Wellhead Protection Progrms
- and the del ineation of mllhedd protect ion areas i s given in: "Guidance for Applicants for State Wellhead Protection Program Assistance Funds Under the Safe Drinking Water Act," June, 1987, and "Guidelines f o r Oelineation o f Wellhead Protection Areas," June, 1987, available from the €PA off i c e o f Ground-Water Protect ion (WH-SSOG) .
As a minimum, the WHP program must: - Specify the duties of State agencies, local governacntal e n t i t i e s and public water supply systems with respect t o the development and impleaentation o f Programs; - Determine the wellhead wellhead as defined i n reasonabl avai lable
deems necessary t o adequately determine t h e WHPA;
- Ident i fy wi th in each WHPA a l l po ten t i a l anthrop enic sources of contminants which my have any adverse e 7 fee t on the heal th o f persons;
- ,Describe a program that contains, as appropriate, technical assistance, f inancial assistance, iwlementation of control m a s u n s , education, t ra in ing and demonstration p ro jec ts t o protect the water supply wi th in WHPAs f m such contaminants; .
flow, rec i arge and discharge an
1
lans for locating and ppv id ing a l te rna te ies for each public water sys.tcm i n t h e
contamination by such contaminants;
Consider a l l o t e n t i a l sources o f such contminants within the ex ected we] P head area of a new water wel l which serves ' a pu 1 l i e water supply system; and
- Provide for publ ic part ic ipat ion.
3.3.2 ' -fnsptctw The watershed control program and on-site inspection are inter-
related preventive strategies. On-site inspection i s actual ly a program which includes and surpasses the requirements o f a watershed program.
3-37
f-"l
Whi le the watershed program i S min)y concerned with the water source, on-site inspection includes 9- addltional mqui-nts for so&ce water quality control ?nd is also concerned. with the disinfection facilities: AS deflvd bY the EPA, an.on4te inspection includes rwiew'of the water source, disinfection facilities and operation and maintenance of 4 public water SyStm for the purpose of evaluating the adquacy of such systms for producing safe drinking water.
The SWTR requires an annual on-site inspection to evaluate the watershed control prograra and disinfection facilitles. The-inspection bust be perfomd by a party approved by the Primacy Agency. The inspec- tion should be conducted by competent individuals such bs sanitary and civil engineers, sanitarians, and technlcians who. have 'experience and knowledge in the operation, maintenance, and design of water systems, and who have a sound undetstanding.of public health principles and waterborne dlseases. Guidance for the contents of an inspection are included in the ,
following paragraphs. Appendix K presents guidelines for a sanitaty 1 / . survey which includes and surpasses the requirements of an on-site inspection.
As the first step in detemining whlch SUTR requiknts, if any, a source is subject to, €PA recamends that utilities conduct a detailed,. *
coarprehenslve sanitary survey. Appendix K presents a colllprehensive list of water system features that the person conducting the survey should be aware of and revim as appropriate. . This inltial investigatlon estab- '
1 ishes the quality of the water source, its treatment and delivery 'to the consuer. €PA recomaends that this colrprehensive evaluation be repeated every thisa years for rystas serving 4,100 people or less and every five years for systems serving more than 4,100 people. Also, under the Total Collfonr fila, ground water systems which. take l h s than 5 colifona supler"pr w n t h m s t conduct such sanitary surveys within every 5 or 10 years d w d i a g upon. whether th8 .sourc8 1s protected and disinfected..
The annual on-site inspection to fulfill the SUTR WulrcrPcnts
c ;
.
' should include as a m i n i m : .
3-38

1 a! CUSTOMER ..
CWCORJWE OIOXJDE
CHLORIWE I I
FIGURE 3- l*DETERMlWATlON OF' INACTIVATION FOR MULTIPLE OIStWF@CTANt APPLICATION TO A SURFACE WATER SOURCE
.
L

1. Source Eva1 uat ion
. a. Review ' the effect iveness of the watershed control-
b. Review .the physical condition and protect ion 'of the
. program (Appendix J).
source intake.
c. Reviek the maintenance program to insure ' t h a t a l l d is infect ion equipment i s appropriate and has received regular maintenance and repa i r t o assure a high operat- i n g r e l i a b i l i t y .
.I
2. Treatment Evaluation
a. Review improvements and/or additions u d e t o d i s in fec - t i o n prdcesses during the revious year to co r rec t deficiencies detected i n ear P i e r surveys.
b. .Review the condit ion of disinfection equipment.
c. Review operating procedures.
d. Review data records t o assure tha t a l l r equ i red t es ts are being conducted and tecorded and d i s i n f e c t i o n i s effect ively practiced (CT calcutations should be spot . checked t o ensure that they were done correct ly)
e. Ident i fy any needed improvements i n the equipment, systcla maintenance and operation, or data collection.
I n a d d i t i o n t o these requirements, a periodic. sani.tary survey i s . recoamnended for a l l systems, including those with f i l t e r e d and un f i l te red
supplies. The sani tary survey should include the items l isted i n 1 and 2 above as we1 1 as:
3. Dis t r i bu t i on Systea Evaluation
a. Review the condit ion o f storage f a c i l i t i e s .
b. Otternine that the system has su f f i c i en t pressure
e. Ver i fy tha t systea equipment has received regular
throughout the year.
maintenance.
d. Review additions/improvements incorporated during the year to correct deficiencies detected i n t h e i n i t i a l inspection.
3-39

e. Revi& cross connection prevention programb inclydfng f-\ annual test ing o f backflow prevention devices.
I ' .
.
.. , .
f. Review routine f lushing program f o r effectiveness.
, g. Evaluate the corrosion control program and i t s impact on .
h. Review the adequacy of the prograa for per iodic storage
i. Review practices i n repair ing water nuin breaks t o
d is t r ibu t ion water quality.
reservoir f lushing.
assure they include disinfection. ..
4. 13anagcl#nt/Operation Evaluation
a. Review the operations t o assure that any d i f f i c u l t i e s experienced during the year have been adequately addressed.
b. Review s ta f f ing to assure adequate numbers of roper ly t ra ined and/or cer t i f ied personnel are rvai lab P e.
c. Verify that a regular maintenance schedule i s followed.
d. Audit Systems n c ~ r d s to ver i f y tha t they are adequately aaintained.
e. Review bacteriological data frola the d is t f ibu t ion system f o r c o l i f o m occurrence, repeat sanples and action
. response.
3.3.3 b m Under the provisions of the SWTR, a surface water system which.does
. not filter must not have been ident i f ied as a ' source of waterborne disease, or i f i t has been SO identi f ied, the systm w s t have bten modif ied suf f ic ient ly t o prevent another such occurrence, a t datemined by the Priucy Agency. I f 8 waterborne disease outbreak has occurred and the
'outbrerk was or Is a t t r i b u t e d t o a treatment deficiency, then the system must i n t t a 1 . l f i l t r a t i o n unless the system has upgraded i t s treatment system t o &dy the deficiency which led to . the outbreak and the Primacy Agency has deterained that the system i s sa t i s f y ing t h i s requirement. I f the Primacy Agency has detemined the disease outbreak was the resu l t of a d is t r ibu t ion system prob lm ra ther than a source water treatment deficiency, the system i s not required t o i n s t a l l f i l t r a t i o n .
3-40

In order to deternine whether the above requi r-nt is being met, the responsible federal, state and 'local health agencies should be surveyed. to obtain the current and historical information on waterborne. disease outbreaks which may have occurred within i given system. Whether conducted by the Primacy Agency or subaitted by the water purveyor, this . infomation should include:
\ 1. Source of the Infowation:
a. Name of agency b. Name and phone number of person contacted e. Date o f inquiry
2. Outbreak Data
a. Known or suspected incidents o f . waterborne disease outbreaks
b . Oate( I) of occurrence s) d. Number of cases c . Type or identi ty o f i 1 lness
3. Status of Disease Reporting:
a. Changes in regulations; ., giardiasis was not a "'9 reportable disease until 198
. 4. If a Disease Outbreak has Occurred:
a. Uas the reason for the- outbreak identified; e.g., '
inadequate disinfection?
b. Did the outbreak occur while the 'system was in its
e. Was remedial action taken?
current configuratlan?
d. Have there been any further outbreaks sincc the remedial action was taken?
If 8 nview o f the availabh! infomation indicates that the system ' or network for disease reporting is inadequate within the Primacy Agency's a n a of responsibility, efforts should be aade to encourage the appropti- ate agencies to upgrade the disease reporting capabilities within the area.
3 -41

chloramines as secondary note that €PA also w i 11
r-+,
3.3.4 W l v Col i forn a I ; . .
5. TO avoid f i l t ra t ion, a sys tm must comply with the MCL for to ta l co l i for#, estab l ished in the Tota l Col i fom Rule, f o r a t least 11 out 0;
the previous 12 months the system served water to the publ ic on an ongoing basis, .unless the Primacy Agency detern ines that fa i lure to met th is requirement was not caused by a deficiency i n treatment of the source water. I f the Prirracy Agency makes such a detemination, the system i s , no t requ i red to ins ta l l f i l t ra t ion . The Total Colifora Rule requires systems using surface water or ground water under the inf 1 uence %f surface water which do not f i l t e r t o c o l l e c t a srople at or near , t h e f i r s t curtomar, each"day that the turb id i ty leve l exceeds 1 NTU within.24 hours *
of learn ing o f the resul t and t o analyze the sample for the presence o f total col i forms. (If the Primacy Agency deternines that i t i s n o t . pos.sible fo r t he system t o have such a sample analyzed wi th in 24 hours,
. th is t ime limit ray be extended on a case-by-case basis.) This sample may ,be used t o f u l f i l l the routine compliance monitoring requirements o f .the Total Col i form Rule. The resul ts o f the rdd i t ional sanple must be included in da temin ing whether the system i s i n compliance with the
. monthly WL f o r t o t a l c o l i f o m . 3.3.5 Jotal Trihahg$hw !T- For the system t o continue . t o use d is in fect ion as the . on l y
treatment, it must comply w i th the to ta l t r iha lmthane (TTHM) HCL regulation. The current regulation established an WL for t o t a l TTHM of 0.10 mg/L for systems serving a population greater than 10,OOO. l o t h the KL and the system population covered ray be reduced i n the future, and this-should be cdnsidered'&en planning disinfectant application.
One a l t e m r t i v e t o & e t t h e CT n q u i n w n t s o f t h e SWTR i s t o incnrse ' tho dis inf&tant dose. f o r many systems, a higher chlorine'dose will diTt f n ' increased 'forration of TTHnt. Changes i n dis infect ion
' pr&& sbm1d m i n t a i n TTHn 1,evels o f less than 0.10 q / L . f n l i e u of incmasing chlorine dose, use o f an alternate disinfectant which Produces f-r nws could be considered. Alternate disinfectants include the US@
'of ozone Or chlorine dioxide as primary disinfectants with ch lor ine Or . .
(residual) disinfectants. It i s important t o promulgate regulations f o r disinfectants and
3-42

disinfection by-products which ray limit appllcrtion o f some of there disinfeCtmtS* €PA recotmends that Primacy Agencies keep inforacd through conmunicrtion with €PA on interim guidance on haw to avoid conflict for - systems to comply with both the SWTR and the forthcoming regulations on disinfectants and disinfection by-products. Any changes which appear to n o t meet the by-product regulations should not be implemented.
3-43

4.1 rntroductton TO c m l y with the SWTR, public water systems nust include. fittra-
tion, or sow other approved particulate removal technology, in their ' treatment process unless they are able to satisfy certain conditions.
Those conditions include compliance with source water quality criteria and site-specific criteria. Guidance for detennining whether tbese conditions are act is provided In Section 3 of this manual. Systehs 'unable to sati.sfy these conditions rmst provide partlculate rmoval . and met criterla pertaining to operation, design and perfomance. these criteria a n specified in part in the definitions of technologies in the SWTR and more specifically as detemined by the Primacy Agency.
. Tbis section provides guidance both for those water systems M . c h . currently do not have fi lttation equipment and must add it, and, for
systems which have existing filtration processes. Guidance on additional alternatives for small systems is presented in Appendix L.
this section includes guidance on the following topics: .a. Filtration Technology: Oescriptions, capabilities, design
criteria and operating requirements for each technology, and a listing o f major factors to be considered in . their selection, including raw water quality considerations.
b. Disinfection: Descriptions o f the most .applicable disin- fection techno1 ies used with filtration systems, and a presentation of't 7 a relative effectiveness of these disinfec- .tion t8chnOlopieS with respect to inactivation of bacteria, cysts and viruses.
e. Alternate Technologies: Descriptions of some currently available alternate filtration technologies.
d. Other Alternatives: Includes a description o f s o w nontteat- rant alternatives including ngionaliration and use of an a1 ternate source.
4.2 &leetion o f A b w r i a t e FiltrALion T W Filtration is generally provided by passing water through a bed of .'
. sand, a layer of diatomaceous earth or a combination bed of coarse anthta-
4-1
c i te co i l ove rhy ing f i ne r sand. F i l t e r s are classif ied and n a k d i n a number o f ways. For example, based on application rate, sand f i l t e r s CM
be classi f ied as ei ther slow or rapid; yet these two types of f i l t e r s d i f f e r i n many Iore character is t ics than just appl icat ion rate. they d i f f e r i n t h e i r removal process, bed material, method of cleaning, and operation. Eased on the type of bed mater ia l , f i l te rs can be Classified as sand, diatocaaceous earth, dual-wdia (coal-sand) or even nulti-media i n which a t h i rd l aye r of high density sand i s used. -
4.2.1 wu- Current technologies specified by the SWtR are: a. Conventionat treatment: A series of processes including
b. D i rec t F i l t ra t ion : A series o f processes including coagula- ' t i o n (and perhaps f locculat ion) and f i l t rat ion, but excludlng
coagulation, flocculation, sedimentation and f i l t r a t i o n . .
sedimntation.
c. Slow Sand F i l t r a t i on : A process which involves passage o f ran .
water through a bed o f rand a t low velocity, eneral ly less )I
than 0.4 naters/hour (1.2 f t /hr ) , resu l t ing - ? n substantial par t i cu la te rrmoval by physical and biological mechanisms.
-_ --
d. Di8tOaIaC80US Earth Fi l t rat ion: A process tha t 'meets the
' - A precoat cake o f diatoarceous earth f i 1 t a r media is ' deposited on a support membrane (septum)
- The w r t e r ' i s f i l t e r e d b assing it through the cake on the scptm; addit ional !! I t a r media, k n o w as body feed, i s continuously added t o t h e feed water i n order t o maintain the perwabi l i t y o f the fi.?ter cake.
following conditions:
4-2
e. Alternate Technologies: An f i l t r a t i o n process other than . those l i s t e d above. Availab r e a l te rna te f i l t r a t i on technolo-
gies include, but w e not l imited to:
- ' Package Plants'
- Car t r idge F i l ters
4.2.2 W # U F l l t r a t i o n processes provide various levels of turbidity and
microbial contaminant mboval. When properly designed and .operated and when t reat ing source waters of sui table qual i ty, the above f i l t r a t i o n processes. are capable of achieving a 2-109 (99 percent) removal of GiarQin cysts and a t leas t a 1-log (90 percent) removal of v i ruses without disinfection (Logsdon, 1987b; USEPA, 1988b; Rocbeck, 1962). The exception i s ' c a r t r i d g e f i l t e r s which u y not provide ef fect ive v i rus removal. A sumnary of the removal capab i l i t ies o f the var ious f i l t ra t ion processes i s presented i n Table 4-1.
t i o n i s capable of achieving up t o a 3-log maoval of Ejardlp cysts and up t o a 3-109 teaoval of viruses. Ofrect f i l t r a t i o n can achieve up t o a
' 3-109 m v a l o f cysts and up t o a &log m v a l o f viruses. '
Achieving the maximum nroval e f f ic ienc ies wi th these treatment processes requires the raw water t o be properly coagulated and f i ltered. Factors which can r d v e n e l y rffecy removal efficiencies include:' . - Rm water turbidit ies less than 1 NTU - Cold water conditions - Non-optimal or no coagulation - Improper f i l t e r operation including:
As indicated i n fable 4-1, conventional treatment without disinfec- .
Depending upon the type o f t rea taent & i ts in p lace , h is to r ica l pwfomance rnd /or p i lo t p lan t work, these plants could be categorized 8s one of the technologies i n a-d above a t the d iscret ion o f the State. Several studies have already indicated that some packa e plants e f fec t i ve l y m v e cysts. i f such plants provide 8 adquate d is in fec t ion so that the coaplete tnataent t ra in achieves a t leas t a 3- log rmoval / inact ivat ion o f Giardl_a c sts and a 4-109 m m v a l / i n a c t i - vat ion o f v i ruses, use of t h i s techno f ogy would sa t is fy the minimum treatment requ i fcQnn t s .
4-3
r-*., i - No f i l t e r t o waste * . - Internit tent’ operation - . Sudden rate changes - Poor housekeepi ng
9 Operating the f i l t e r s a f t e r t u r b i d i t y breakthrough Studies Of S l o w sand f i l t r a t i o n l a v e s h m t h a t t h i s technology
(without disinfection) i s capable o f providing greater thM a 3-109 removal of W Cysts and greater than a 3-100 IWW)V~I of viruses . factors which can adversely affect m v a l efficiencies include: - Poor source water qua l i t y - Cold water conditions - Increases i n f i l t r a t i o n r a t e s - Oeereases i n bed depth - Improper sand size - Inadequate ripening ... >..
Diatoraaceous earth (DE) f i l t r a t i o n CUI achieve greater than a 3-log m v a f of Eiard in cysts when suff icient ptscoat and body feed a n used. However, t u r b i d i t y and to ta l co l i f o rm removals an.strongly inf luenced by- the grade of DE eaployed. Conversely, DE f i l t r a t i o n i s not very effective
’ for removing viruses unless the surface properties o f the diatomaceous earth have been al tered by p n t n r t m e n t o f the body feed wi th alum or a su i tab le po ly#r . In general, DE f i l t r a t i o n i s assumed. t o achieve only a 1-log ratoval o f viruses unless demonstrated otherwise. . Factors which can affect the removal o f cysts and viruses include: - Precoat thickness - h u n t of body‘ feed
+ f’ frproper conditioning of s e p t u -. trpropii p n t n a t w n t i f ttw body fwd
’. * - 6f8dr! Of DE
* p ~ k a g e ptmts can be used t o t r e a t water supplies for c-nities * as ~ 1 1 8% for n c n a t i o n a l anrs , pahs, constmet ion CWS, sk i m 0 t - t ~
’ B i l i t a t y i n s t a l l a t i o n s and o t h e r f r c i l i t i c k p o t a l e water i s not r v a i l a l e f r a a r rn ic ipr ’ l supply. Operator m u f m n t s ~Wfi- cant ly wi th speci f ic s i tuat ions. Under unfavorable raw water condit ionst
4-4

TA0LE 4-1
, .
‘ 2 z s K s S
Conventional Treatment Direct Filtration Slow Srnd Filtration Dirtmaceour Earth Filtration
Note:
1. Uithout disinfection. 2. Logsdon, 19876. 3. Roebeck $& a 1962. 4.. Poynter and Slade, 1977. 5. These technologies generally achieve greater than a 3-109 removal.

package plants could dmand full-tim attention. Package plants are mst widely ut8d to tnat Surfrce supplies for tenoval of turbidity, Color and colifom organisms prior to disinfection. They are currently available in capacities up to 6 ngda
Colorado State University conducted a series of tests on oni package plant over a 5-month period during the winter o f 1985-86 (Horn and Hendricks, 1986). fiisting installations in Colorado had proven effective for turbidity removal , and the tests at the university were designed to evaluate the systsm's effectiveness in removing colifom bactetta and
cysts frm low turbidity, tow teapetaturn source waters. The test ' results showid that the filtration systea could rewve greater than 99 percent'of Eiardb Cysts for waters which had less than 1 WTU turbidity and less than 5 C tarrperatures, as long as proper chemical treatment was . applied, and. the filter rate was 10 gp/ft* or less. I n addition, an
- alternate water source having a turbidity ranging f m 3.9 to 4.5, NTU was used in 12 test runs with coagulant doses ranging fm 15 to 45 ql.. The effluent turbidities ftoo these runs were consistently less than 0.5 NTU.
Surveys of existing facilities indicate that while package plants. ray be capable of achieving effective treatment, aany have not consistent- ly met the interim ClCL for turbidity, and in s a cases, col ifonns were *
detected in the fi ltered water (brand et a1 . , 1980; brand and Young, 1983) . The perfomnee diff iculties were primarlly the result of the short detention time inherent in the design o f the treatment units, the lack o f skilled operators with sufficient time to devote to operating the - treatment facilities, m d the wide-ranging variability in quality of the raw water source. for instance, raw water turbidity was reported to often exceed 100 W T U rt one site. I a p W v e m t S in operational techniques and methods at this slte resulted fn a substantial improvement in effluent quality. After adjustments wan aade, the plant was capable o f producing a filtered water with turbidities lest than 1 WTU, even when influent
' turbidities increased fra 17 to 100 MlU within 8 2-hour period, as iong as proper coagulation was provideda
One of 'the maor conclusions o f these surveys w8s that package water treatment plants manned by competent operators can COnSiStently remove
,
i
.
L
(-1
turbidity and bacteria from surface waters of a fairly unifom quality. Plckr9e Plants aPPlid where raw water turbidities are vari&le require 4 high d W @ e of OPmt!Onal ski1 1 and nearly -constant attention by the Operatof. Regardlest of the quality o f the raw water sOuEe, 411 package plants requim at least a rinimua level of wintenance and opirational skill and p r o w chmical treataent if they are to produce satisfactory wrter qual i ty.
Cartridge filters using microporous filter elements (ceramic, paper or fiber) with pore Sites as sull as 0.2 UR my be suitable for producing potable w t e r from raw water supplies containing moderate levels of .turbidity, dgae and microbiological contaminants. The advmtrge to sAl.1 systems of these cartridge filters is that, with the exception of disinfectant, no other chemicals are nquimd. the process is one of strictly physical IYIIK)val of mall particles by straining as the water passes through a porous cartridge. Other than occasi.onr1 cleaning or cartridge reptac-nt, operational requirements a n not complex and do not require ski 1 led personnel However, the SUTR does require each surface water systea to be operated by a qualified operator, 4s detemined by the Priaacy Agency. Such a systea ray be suitable for s o w small systems where, generally, only maintenance personnel are avpilable for operating water supply facilities. However, the use o f cartridge filters should be 1 imited to low turbldi ty source waters because o f their susceptibi 1 i ty to rapid headloss buildup. For example, manufacturer's guidelines for achieving reasonable filter run lengths with certain polypropylene' filter element,$ are that the raw water turbidity be 2 NTU or less (USEPA, 1988b) .
Long (1983) malyted the eft icacy o f 8 variety o f cartridge f i 1 tars ,using turbidity measurements, particle site analysis, and scanning electror, .nicroscope analysis.. . The filters were *challenged with a S~rp&a ot microspheres averaging 5.7 UI in diameter which is saaller than cyst. The ricrosphcns Mm 8ppli8d at 8 COnC8nttatiOn Of
40 ,m. t o 65,000 spheres per 11. Ten o f 17 cartridge f 11 tars ta#ved over 99.9 percent o f the microspheres .
In tests using live Infectious cysts fm a human source, CaflridV filtcn w+m found to be highly efficient in reQoving w' cysts
4-6 -

(Hibler, 1986). Each test involved challenging a filter with 300,000 cysts at 1 concentration of 10,OOO cySts/ml. The average m v a l for five test,s was 99.86 percent, with removal efficiencies ranging froa 99.5 per- cent to 99.99 percent.
The application of 'cartridge fi ItwS to saal 1 water systrlas using either cleanable ceramic or disposable polypropylene cartridges appears to be a feasible .athod for removing turbidity and most microbiological contaminants. However, data regarding the ability o f cartridge fllters to m o v e viruses are not available. Since disinfection by Uself could
' achieve a 4-1og inacthation of. viruses, if the cartridge filter m v e s greater than of equal to 3 logs of Glrrdlr, then the fi lter plus disinfection would achieve the overall minima requirements, -regardless o f whether only negliglbla inactivation is achieved (e.9. , less than O S log). However, consideration should be given to the feasibility of providing multiple barriers of treatment for each target organism, i .e. , s o w Glardla and virus removal by each barrier (Le . , so(# removal by filtration and so(bc inactivation by disinfection) as protection i n case one o f the barriers fails. The efficiency and mnmics of' the process. must be closely evaluated for each situation. Pretreatment i n the fom of 'roughing filters (rapid sand or rulti-mdia) or fine mesh screens may be needed to m w v e larger suspended solids which, if not removed, could cause the rapid buildup o f haadloss across the cartridges (USEPA, 1988a);
In general, conventional tnataent, direct fi'ltration, slow sand ' filtration m d diataacaous earth filtration CUI be designed and operated '
to achieve the maxima removal o f the water quality parmeten indicated ' i n Table 4-1. Ik@V8F, for the purpose o f the appropriate filtration and disinfection technologies and for detemining design criteria, .these filtration processes should be attum&l to achieve a 2-log m v a l of-- cysts and a 1-log removal of viruses. Thls conserva- tive ,approrch nil 1 assure that the trea'tnent f a d l ity has adequ,atc 1
capabi 1 ity t o respond to non-optimum perforranee due to changes in raw water quality, plant upsets, etc. The balance of the required ranovals and/or inactivation of cysts and viruses would be achieved through .the applicatlon of appropriate disinfection.
4-7

(- .\
The PerforrClmce of alternate technologies such as cartridge fil ters , '
and possibly package plants, depending upon the unit under consideration cannot be stated with certainty at this time. Ckcause of these perform- ance uncertainties, pilot studies should be used to demonstrate their efficacy for a given water supply.
4.2.3 For m y specific site and situation, a number o f factors wilt
detenine which filtration technology i s most appropriate. .-Among these are: raw water qua1 ity conditions, space and personnel avaiiabr 1 1 ty, and econooic constraints. A discussion of the impact o f raw water quality on the technology selection i s presented hen. The impact of site-specific factors and economic COnStr8intS i s presented i n the USEPA document %chnologies and Costs for the Removal of Uicrobial Contaminants frm Potable Water Suppl i W (USEPA, 1988b) . * The number o f treatment barriers provided 'should be coarmcnsutatc
with the degree of contamination in the source water. The four technolo- gies specified i n the SUTR vary i n their ability to meet the performance criteria when a wide range of raw water quality i s considered. Uhije the numerical values of rm water quality that CUI be a c c d a t e d by each o f the four technologies will vay fra site to site, general guidance can be provided. Ganeral guidelines for selecting filtrrtion processes, based on total colifom count, turbidjty, and color an presented i n Table 4-2. It i s not recamended that filtration systems other than those listed i n ' -
Table 4-2 be used when the general tau water qual i ty conditions exceed the values listed, unless it has been denonstrated thmugh pilot testi.ng that tlw tachnology can meet the perfoflance criteria under the raw water quality conditions expected to occur at the site.
The filtration processes listed i n Table 4-1 are capable of achieving the required performance criteria when properly designed and operated i f they a n treating a source water o f suitable quality ( i : .e . , . .
generally within the ranges indicated in Table 4-2) . One of the causes '
4-8

TABLE 1-2
Ttcatnnnt
GENERALIZED CAPABILITY O f FILTRATION SYSTEM Ty COND1TIONS
Total Grnc tal u i e t b
Col i f oms 4umlU --uYIlL
Turbidity . Color (CUI
Conventional with
Conventional without predisinfaction QO,OOO(J) No . - <7S2)
predisinfcction &,OOO(’) No restrictions(]) <75‘2’
Direct filtration with flocculation &OO(’) <7-14.(’)
In-line filtration <500‘J) <7-14‘”
. Slow sand filtration CBOO(’) 4 1 )
Diatmaceous earth filtration 4 0 ” ) 45‘1’
1. Depends on algae population, alum or cationic polymer
2. USEPA, 1971.
coagulation -- (Clcasby et & l o t 1984.)
3 Letterman, 1986.

. .
of tilttation failures is the use of inappropriate technology for a given raw wrtw quality (Logsdon, 1987b) . These criteria r n general guide- tines. Periodic occurrences of raw water coliform, turbidity or color levels in excess o f the V a b S presented in table 4-2 should not preclude the selection of use of a particular filtration technology. For';xuple, the following alternatives are available for responding to occasional raw
% . water turbidity spikes: a. Direct Filtration - Continuous monitoring and coagu.lant dose adjustment - More frequent backwash o f f i 1 tart - Use o f prasedimentation
- Use of a roughing filter 9 - Use of an infiltration gallery
- Use o f I I roughing filter - Use o f excess body feed
b. Slow Sand filtration
e. Oiat#aCeOuS Earth Fi ltrrtion .
For the above alternatives, EPA r e c w n d s that pilot testing be conducted to dawnstrat8 the efficacy of the treatmnt alternative.
The characteristics of each filtration technology are major factor in the selection process. Significant characteristics include perfomnce capabilities (contuinant removal efficiencies) design and construction requirements, and operation 'and maintenance requimmnts. Details regarding each of the four filtration technologies am presented in the following section.
4.3 U l r b l e Flltration t- 40301. As fndkrted i n tho preamble to the SWfR, the historical nrponsi-
bility o f the States to establish design and operating criterii for pub1 ic drinklng water plants will continue. The p.urpose o f .the. following sections is ,to provide guidance on how the design and operating criteria way need to be changed in order to assure that the perfo*nce criteria in the SUTR rn met.
4-9
.. .

{ # -
The d w i g n c r i t e r i a for the various f i l t r a t i o n technologies found i n the 1987 ed i t ion of -61- Work (6reat Cakes, 1987) a n the mininun design c r i t e r i a t ha t a r ra jor i ty o f states are currently following.' These standards are re fer red to 4s ten States .
i n the Ten States Stmdards hive not been duplicated here. Rather, the reader i s referred to the Ten States Standards direct ly. €PA nconmcnds the following additions and/or changes to the Ten State Standards i n order t o ~ S S U ~ cotppl f ance with the performance c r i t e r i a o f the SUTR.
I Standards In t he remainder of t h i s manual. The design c r i t e r i a contained
4.3.2 The fol lowing .recotmuendations apply t o a l l f i l t r a t i on p lan ts : a. All f i l t r a t i o n p l a n t s should provide continuous ' t u r b i d i t
monitoring of the eff luent turbidity f ra each individua Y .. f i l ter. ' . ' If continuous monitoring i s impractical, routine
monitoring o f i n d i v i d u a l f i l t e r s i s ncoantnded as a ainiutun. '
b. All f i l t r a t i o n systeas should be concerned with the perk tu rb id i ty leve ls in the filtered water a f te r backwashing and '
.
Based upon the resul ts o f a surve conducted for the American Water . .
Ten States Standards en t i re l y or i n modified fora (AUUARF, 1986). Works Association Research Foundat r on (AWARF), son18 38 states use the .
' Although t h i s it not a n q u i m n t of the S'CITR, it +s recOn@nended because of t h e p o s s i b i l i t y t h a t n o t a l l f i l t e r s i t 1 (I treatment plant wil1'pFoduC8 th8 tm eff luent turb id i ty . This MY be due t o a var iety o f conditions that include bed upsets, f a i l u r e o f m d i a support or underdrain systems, etc. Although the combined cff luent from all the filt$n'my ae8t the, t u r b i d i t y m q u l r m n t s o f the SWR, the tu rb id i ty leve l fm UI i n d i v i d u a l f i l t e r MY substantial ly exceed the limits.
.This my n t u l t i n t h e passage of cysts or other pathogens.
' Validation should be performed a t least twice, a week based on the procedure ou t l ined in Par t 214A i n the 16th Edition o f Standard bk tbds . I t should be noted tha t improper i ns ta l l a t i on o f continuous monitors
turbidi ty spikes. lo avoid a i r bubbles reaching the turbi B iracter the . sample t a should be i ns ta l l ed below the. center l lne of the pipe and
an a i r .re ! ease valve ray be included on the s8fJrple l ine.
$ m y a l l o w for a i r bubbles t o enter the monitor n s u l t i n in false '
* 4-10

aake every attempt to operate the fi hers to mi,nimize the .Mgnitude and duration of these turbidity spi kes .
Individual' filters should be monitored as discussed in Section 4.3.2.a and when excessive turbidity spikes are found, corrective actions
. taken. During these turbidity peaks, Ejard la cysts and other pathogens MY be passed into the finished water. There is evidence that a 0.2 to 0.3 WTU increase in the turbidity during the first period of the filter run can be associated with rises in Gfardia cyst concentrations by factors of twenty to forty (Logtdon, 1985) . Special studies should'be conducted to determine the extent of the turbidity spike probldas.
There are basically four approaches available for' correcting problrms with turbidity spikes after backwashing. These are as follows (Bucklin, et rl 1988) : - Proper chcmical conditioning of the influent water to the
filter can miniaire the na nitude and'duration of these turbidity spikes. This coul 8 include proper control o f . the primry coagulant chemicals such as alum or iron compounds. . In some cases filter aids using polymers may .be needed to control the turbidity spikes.
Gradually increasing the filtration rate in increments when placing the filter in operation. Starting the filter at a low flow rate and then increasing the flow i n small increments over 10 to 15 ainutes has been shown to reduce the turbidity spi kes in sone cases (Logtdon , 1987).
.
- Addition of coagulants to the backwash water ' has also been show to reduce the extent of turbidity spikes after backwash. Typically the same primary coagulant used in the plant i s added to the backwash water. Polymers alone or in combination with the primary coagulant may also be used.
filter-to-uaste MY be practiced where a portion of t h e filtered water irmcdiately after startin the filter 1 is
. warted. This is only possible where the P ilter system has
' For most high rate granular 'bed filters, there is a period of conditioning, or break-in iamcdiately following backwashing, during which turbidity and particle removal is at a mini~num, referred to as
, the break-in period. The turbidity peaks are thought to be caused by manants of backwash ' water within the pores of and above the mcdi a passing through the filter, and/or floc breakup during the f 1 1 t c t ripening period before it can adequately remove influent turbidity.
. provided the necessary valves and p ip ing to a l low th is procedure. There i s some concern whether or not th is pract ice
. i s beneficfal. The extra valve erationt needed for f i l t e r - to-waste can d is rup t the f i l te r 7 low rate to the extent that they create their own t u rb id i t y spikes. S a w knowledge of the t iam actual ly needed for f i l ter- to-waste I s also needgd before i t can be detstmined tha t t h i s i s m effect ive prochdure f o r con t ro l l ing tu rb id i ty spikes. If the length of tirn the f i l ter- to-waste is pract iced i s less than that before the turbidi ty spike parses, the disruption caused b the valve operation MY actual ly Increase the turbidity sp ! ke.
Dif ferent p lants and the ind iv fdua l f i l te rs w$th in . th plant m y have d i fk ren t tu rb id i ty sp ike charac ter is t i cs . The four approaches presented above, therefore, nust be evaluated on 'a case-by-case basis. Special studies will be mqufmd t o i den t i f y those f i l t e rs w i th t he tu rb fd i ty spdke probl-s and ass is t in se lect ing which of the four approaches i s best for correcting the problea. It has been generally found tha t t u rb id i t y spikes can be ainimited through one or a conbination o f the f i rs t th ree approaches.
In order to establ ish f i l ter-to-uaste operit ing guidel ines, the following procedure i s suggested: - Review the eff luent turbidlty data for each f i l t e r and detcr-
mine which filter h is to r i ca l l y has the highest effluent tu r - b id i ty . - fo l lowin backwashing o f the f i l t e r w i t h t h e . poorest perfor- mance, p 1 ace t h a t f i l t e r i n t o s e r v i c e and col lect rub s q l p every 5 t o 10 minutes for a period o f a t least. a8 minutes.
' - Analyze the grab samples for tu rb fd i ty and determine how long t h e f i l t e r must be i n operation before the effluent turbidity drops - t o less than or equal t o 0.5 WTU ,
. .. or 1 WTU i n cases when a f i l t e r e d water tu rb id i t y of less than or equal t o 1 #TU i s allowad.
b
J. ' ' Continuous turbidi ty monitor ing can be used i n place o f grab sampling.
4- 12

Limited informtion exists on the typical magnitude and duration o f peak tuf'bidity h v e b after backwashing and what levels are considered
. acceptrbh t o assure that these turbidity spikes. are not rssoclated with passage of G_tatdfa cysts. Information from plant scale tests, showing the typical magnitude m d duration of these turbidity spikes is available froa two plants (Bucklin Wal; , 1988). Studies conducted at these plants over a year showed that these peaks occurred within the first few minutes after the filter was placed back in operation, their effects lasted for several hours, and varied in magnitude fm 0.08 to 0.35 NTU o n average.
For existing plants without pmvislons fo r filter-to-waste, the decision t o add the necessary piping to provide this capability should'bc. M d e only after Carefully evaluating the other three approaches. If the results of special studies show that the other three options are not. cffectiv8 in riniaiting the turbidity spikes then the expense o f adding the filter-to-waste capabilities aay be justified.
For new plants the Capability of filter-to-waste nay be tequibd by the Prirarcy Agency or should be considered. 8y having this capability, additional flexibility will be available for turbidity splke control. This flexibility may also be useful for other filter naintenance functions such as after media replacement or when heavy chlorination of the filter is needed after maintenance.
4.3.3 -1 T- Conventional treatment is the most widely used technology for
. removing turbidity m d aickbial contaminants froa surface water supplies. Conventional treatment includes the pretreatment steps o f chemical coagulation, rapid mixing, flocculation md sedimentation followed by filtrrtfon.. These conventional treatment plants typically use alwinum and lmn w o u n d s In the coagulation processes. Polymers may also be
' used to mhmce the coagulation and filtration processes. A flow sheet for a conventional treatment plant i s presented on Figure 4-1.
L i m softening is a treatment process used to runova hardness and turbidity froa surface waters. Treatment is typically accomplished with conventional process units. The l i m e softening process m o v e s the
4-13
' calcim and Mgnesim from the water' by precipitating than as calcium Carbonate and WgneSim hydroxide. Turbidity levels in the water are also reduced bY this process. and possibly soda ash is added to the raw water t o raise its p~ to a point at which. these precipitates am f o m d and then r e w e d fm the'water during sediaentation and fi1tratfon. 'Lim Softening M y be used for the removal of carbonate hardness.. in the PH range of 9 to 10 through a single stage process. lwo-stage lime/soda ash softening at a pH of 10 to 12 e m be urd for the nnoval of non-carbonate hardness and rrgnesiun. Two-stage softening includes recafbonation to neutralize the caustic alkalinity, reducing the pH. to the range of 8.5 to 9.5. A flow. sheet; for typical one- and two-stage softening plants is' ptdsented on Figure 4-2.
Each of these three conventional trertnent processes uses filtration fol.lowing sedimentation. Three different types of filters w e used. Sand filters, nonaally found in older plants, use a single aedia of sand to
. fom a filter bed, and a n generally designed with a filtration rate of '2 gpc/tt'. Newer plants nonnally use dual-aedh or aixed aedia filters. Dual media fi 1 tars use a coobination of mthracite coal aloni with a sand to fo ta the filter bed. Himd media filters use coal, sand, and a third iaterial to form the filter bed. Dual and mixed media filters can be designed to operate at hightr filtration rates.. than sand filters, i.e., 4 to 6 gpa/ft2.
A
- The m i n i m a design criteria in , the Ten State Standards for
conventional treatment are considered sufficlent for the purposes of complying with tho SWlR with the following rddltion: . fh8 criteria for sediwntation should be expanded to include
other methods o f solids m v a l including dissolved air flotation. plate separation and upflow-sol ids contact clrrffierr included .in the 1987 ten State Standards should also be considered.
e '
. .
ratiu Re- In addltion to the operating requirements in the Ten State
Standards, a Coagulant should be used at all times the treatment plant i s
4-14

in operation.' Conventional and dinct filtration plants rust be monitored canful1y b=ause failur'e to uintaln optimum C04gU18tiOn can result in poor filter performance and breakthrough of cysts and viruses.* A1 though the detention time ppvided by the settllng basins results in some margin of Safety, the 1oSS Of coagulation controt at the chemical feed'br rapid alx points my not be noticed until the poorly corgulat~ water reaches the filters, after the process hrs tailed. Failure to effectively monitor and control filter operation can result in undetected poor filter perfomance (Logsdon, 1987a; Logsdon, 1987b) . ..
Effective operation of a conventional treamnt plht requires careful monitoring and control of: - Chanical Feed - - Rapid Mix . . - Flotculatlon - Sediwntation - Fi 1 trat ion
For the purposes of the SHTR, the requitcllants for ettectlve . operation of a conventionil water treatment plant can be stmatized as
a. The application of a coagulant and .,the maintenance o f effective coagulation and flocculation at all t i m when a treatment plant is in operation.' Proper process control
follom:
e .
~-
' bpendrble removal of cysts can not be guaranteed if 'a water is filt8red without being properly coagulated (Logsdon, 1987b; -AI-Ani et at., 1985). This is tiwe even if the raw water turbidity is less than 1 W T U ,
* & indicated in the pnamble to the proposed SWTR, 33 percent o f the mrtid cases o f giardiasis In waterborne disease outbw.aks were attributed to laproperly operated flltratlon plants.
' Some conventional water tmatmnt plants which treat low turbidity source waters (4 NTU reportedly discontinue the rpplitation of coagulant($) during per 1 ods o f low turbldity since the raw water ahead meets the turbidity WL. Houever, studies have shown that cyst rcmOva r for lowturbidlty waters is the most difficult to rchfeve and requires
. optima pretreatwnt including coagulation to achieve effective removals 4-15

(. *
/-: \
p W 8 d u n s should be used at the p lant t o assure tha t chmica l feeds a n adjusted rnd maintained i n nsponse to var ia t ions
b. h in tenance o f e f fec t i ve f i l t r a t i on will t a q u i n proper operation procedures t o meet the tu rb id i ty requirements of the SUTR. Proper operation should include:
. i n raw water tee~porrture and tu rb id i ty .
- Proper cheder1 condit ioning of the water 'ahead of the -j.
f i l t e r t o assure adequrte tu rb id i t y removal through the ' :& f i l t e r .
changes i n flow rate appl ied t o t h e f i l t e r .
. - - Control o f ,the flow rates and e l i r i n r t i o n o f r a p i d
L
- Backwashing of f i l t e r s before the f i l t e r e d water qual i t y i s degraded to the po in t tha t thb l a n t f a i 1s t o m e t the tu rb id i ty requ l remnts o f tho 9 U T R . Tho c r i t e r i a on which t o base I n i t i a t i o n o f backwash will have t o be detemined fof each plant. Experience with operation 0
cycles including iun times and headlors data may serve as the bas is fo r th is s i te spec i f i c c r i te r ia .
A f te r backwash br inging the c lean f i l ters. back on l i n e . so that excessive t u r b i d i t spikes In t h e f i l t e r e d water am not created. Sect r on 4.3.2.8 o f t h i s manual discusses these tu rb id i ty sp i kes and rpproaches ava i lab le to minimize thee.
c. F i l t e r s moved from sewice general ly should be backwashed . upon start-up. However, i n some cases, it m y be i l lp ract ica l
t o backwash f i l t e r s each time they a n m v e d frocr service. Accordingly, the Prlracy Agency may choose t o allow start-up without backwashlng under certain condit ions on a si te-by-si te basis. I n m k i n g t h i s decision, the following should be
. cons 1 dared: , - ' - - the l eng th o f t ime the f i l t e r was o f f - l i ne . per fomnce o f the f i l te r wh i le be ing pu t on- l ine
The f i l t e r , should be brought 'bac,k on- l i ne i n such 8 way t h a t no tud fd i ty spikes tha t could be associated with passage of
_ _ ( A l - A n i e t a1 . , 1985) 1
4-16
Qfrrdfa cysts and other pathogens occur. If problems wlth turbidity spikes an found when starting up dirty filters,
- special studies should be used to 8valuate if any o f the approaches discussed in Section 4.3.2.8 of this .manual are effective in rlnimiting the turbidity spikes.
4.3.4 Direct W t r a t i u A direct filtration plant can include several different pretreatment
unit processes depending upon the application. I n its simplest foru, the process includes only in-line filters preceded by chemical * coagulant application and aixi'ng. The mixing step, particularly in pressure fllten, can be satisfied by Influent pipeline turbulence. In larger plants with gravity filters, UI open rapid-mix basin with aechanical aixers typically is used. Figure 4-3 illustrates the unit processes of a typical direct filtration plant.
' * Another variation of the direct filtration process consists o f the addition o f a coagulant to the raw water followed by rapid aixing and flocculation, as illustrated on Figure 4-4. The chemically condftioncd and flocculated water is then applied directly to a dual- or mltl-media filter (USEPA, 1988b) . -
the 1987 edition of the Ten State Standards recolllwnds pilot studies to datemine #st design criteria. For the purposes of implementatton .of the SUR this raquiment i s considered sirtficient with the following exception:
8 . A coagulant mist he used at a11 t i w s when the treatment plant a
i s i n operation.
lo @ t i M coa ulation is critical for effective turbidity and aicrobiolog-.' ical rewva 9 s with direct filtration (AI-Ani et al., 1985).
4-17
- f? Operating considerations for direct filtration plants are e&ential-
ly identical to those for Convent~Onal treatment plants. The w o r dlffemnce is that a direct filtration plant will not have a clarifier, and may or M y not have a ftoccuhtfon or Contact basin. In addityon, EPA reconncnds that a11 direct filtration plants, both new and existing, be required to makc provlsions to rinirlte the break-In tiw of a filter being put on-1ine.l'
As with Conventional treatment, the inltlatlon o f backwrshlng a filter should flrst be based on fllter e#fluent turbldity valies, then by headloss and run time. Effluent turbidity mnitorlng qulpmnt should be set to lnltiate filter backwash at an effluent value o f 0.5 NTU or less, in order to meet fittend water qualfty pquinwnts. Also, my filters ranoved ft# service should be backwashed upon start-up. In some cases, It ray ,not be practical to backwash filters every t h e they are removed f r a sewlce. This declslon should be made by the Primacy Agency on a case-by-case basis, based on the same conslderations as for conventional systems .
4.3.5 $l&&ml Flltrati~ Slow sand fllters dtffer fron slngle-aadla rapid-rate filters I n a . number of inportant characterlstlct. In addjtion to the difference. of
flow rate, sldw sand filters: ,* .-
a. Function using blological mechanisms 8s w e l l as physical-che-'
b. Use mal ler sand particles e. A r e not backwashed, but rather am clemed by m v l n g the
rical mehaniur
surface media - d. Have u c h longer run times between cleanlng
As with conventional treatannt;direct filtratlon produces a relatively poor quality flltemd . water at the beginning o f filter runs * and therefore a filter-to-waste period is ncorcnded. In sane cases, the additton. of a filter aid or brln ing filten on-line slowly will be
' appropri-ate (Clearby et a1 ., 19841.

f l W R E 4-I-FLOW SHEET OF A TYPICAL CONVENTlONAL
WATER TREATMENT PLANT

TWO STAGE SOfTfNlNG 11 1
AtCAROONATlON
I J
FILTRATION
b
I b
$Of TfNCO WATER
FIGURE 4-2-FLOW SHEET OF TYPICAL SOFTENING TREATMENT PLANTS
\

COAGULANTS
INFLUENT 1 FIGURE 4 -3 FLOW SHEET FOR A TYPICAL
DIRECT FILTRATION PLANT
COAGULANTS
FIGURE 4-4-FLOW SHEET FOR A TYPICAL DIRECT
FILTRATION PLANT WITH FLOCCULATION

e. Require a r ipening period at the beginning of each run
Although rap id ra te f i l t r a t i on i s t he water treatment technology used most ;xtensively i n the United States, i t s use has of tea proved inappropriate for small comnunities since rapid-rate f i l tration i s a technology that requires 'ski1 led operation by trained operators. Slow sand f i l t r a t i o n requires very l i t t l e c o n t r o l by an operator. Consequent- ly, use o f t h i s technology nay be more appropriate for small systems where source water qua l i t y i s within the guidel ines recotmended i n Section 4.2.3.
As indicated i n this sect ion, slow sand f i l t r a t i o n a l s o may be appl icable to other source water qual i ty condit ions with the addit ion of pretreatment such as a roughing f i l t e r or pratedimentation.
8
s&muu=h The minimum design c r i t e r i a presented i n t h e Ten State Standards for
slow sand f i l t e r s are considered sufficient for the purposes of implemen- ta t i on o f the SWTR with the fol lowing exceptions:
a. Raw water qua l i t y l im i ta t ions should be changed to re f lec t the values given i n Table 4-2."
b. The ef fect ive sand size should be between Q;15m and 0.35m rather than the current 0.30 IUII t o 0.45 m.
Additional guidance- on the design o f slow sand f i l t r a t i o n i s avai lable i n t h e design manual e n t i t l e d w n d F i l t r d g n f o r C w )later Syoplies t- P a w 74. 19a published by the International
l2 . WIthout pretreatment, 1 im i ta t i ons ex i s t i n t he ua l i t y o f water that i s s u i t a b l e f o r slow sand f i l t r a t i o n (Lo sdon, 1 $s 7b; Cleasby et al., 1984; Bel laay e t a1 ., 1985; Fox e t al., f983).
'' Signi f icant decreases i n t o t a l c o l i f o n a removals were shown a t e f fec t i ve sand sizes less than 0.35 m (Bellany e t al,, 1985) . As defined . in the
, AWA Standard fo r F i l te r ing Mater ia l , e f fec t i ve s i t e i s t h e size opening that will pass 30 percent by weight o f a .sample o f f i l t e r m a t e t i a i .
4-19
(-' . I Reference Centre for Conmunity Water Supply and Sanitation (IRC) , ,~
p.0, Box 5500, 2280 HM Riijswijk, the Netherlands.
W r a t i Mbintenance of a slbn sand f i l t e r involves two periodic tasks: a. Removal of the top 2 t o 3 an (0.8 t o 1.2 inches) o f the
b. Replacement of the sand when repeated scrapings have reduced ''
the depth of the sand t o ap r o x i u t e l y one-half o f i t s design
_- surface of the sand bed when the headloss exceeds 1 t o 1.5 me1' *-. *. .
..
depth (Bel lmy e t a1 .( 198 s ). Fol lowing schping , slow sand f i 1 ters produce 'poorer qual i t y
f i l t r a t e a t t h e beginning of a run, and a f i l ter-to-waste or ripening period . . o f one t o two days i s recomMnded before use t o supply the system. The r ipen ing per iod i s an in te rva l of time iamcdiataly after a scraped filter i s put back on-line, d e n t h e t u r b i d i t y or par t i c l e count resul ts are signi f icant ly h igher than the corresponding values for the operating f i l t e r , During t h i s time, the microorganisms mul t ip ly . and a t ta in equ i l ib r ium in the mschmuttdecke.m F i l t e r eff luent monitoring results should be used t o determine the end o f the a 'turbidimeter could be set at 1.0 NTU or f i 1 t e r run ,
When repeated scrapings of the sand sand bed t o approximately one-half of, i t s be replaced, Ff 1 t e r bed depths of less inches) have been shown t o resu l t i n poor
?
ripening period. For example, lest t o i n i t i a t e s t a r t o f the .-&
I",
have rtduc.ed the depth o f the izz design depth, the sand should -- than 0.3 t o 0.5 I (12 t o 20 f i 1 t a r performance (Bel lamy e t .. a l . , 1985) . The replaccnnnt procedure should include rauoval of the
remaining sand down to the gravel support, the addition o f new sand t o one h a l f o f the design depth and placcmcnt o f the sand previously removed o n top of the new sand."
'' Removal o f th is top layer of the OSchautrdeckan should restore the f i l t e r t o i t s operational, capacity and i n i t i a l haadlost.
o f t h e f i l t e r bed and b io log ica l ly act ive sand i n the top half reducing the w u n t . o f time required for the curing period. It also prov:des
z This procedure r e s u l t s i n clean sand being placed i n t h e bottom h a l f
4-20 -

The amount of tian for the biological population to mature in a new sand filter (also called curing) and to provide stable and full treatment varies. * The World Health Organization (1980) reported that curing requires a fen weeks to a few months. Fox et a1 . , (1983) found that "about 30 days" were required to bring particle and bacterial effluents down to a stable level. All researchers agree that a curing tian for a
I new filter is required before the filter operates at its fullest potential (Bel lq et a1 . , 198s) .
4.3.6 F i l t r u Diatomaceous earth (DE) f i 1 trat ion, a1 so known as precoat or
diatomite filtration, is appropriate for direct treatment of surface . waters fo r naroval of relatively l o w levels o f turbidity and microorgan-
' isms. .1 Diatomite filters consist of a layer of DE about 3 un (118 inch)
thick supported on a septum or fi 1 tar element. The thin precoat layer of DE must be supplemented by a continuous body iced of diatomite, which is used to maintain the porosity of the filter cake. . If no body feed is added, the particles filtered out will build up on the surface of the' filter cake and cause rapid increases in headloss. The problems inherent . in maintaining the proper film o f DE on the reptun have restricted the use o f diatomite filters for municipal purposes, except under certain favorable raw water quality conditions, Le., low turbddity and good bacteriological quality. Specific upper 1 iaits o f ran 'water qual i ty ,
parameters are not well-defined because diataaceous earth filtration performance depends on the nature, as w e l l as the concentration, of the raw water particles m d the grades of diatomite employed. Logsdon (1987b)
' , reported that filtered water turbidities above 1 NTU and short filter runs were observed for several diatomaceous earth plants having maxilbum raw water turbidities above 20 NTU.
for a Complete exchan e of sand over tire, alleviating potential problems of excessive s s It accumulation and clogging o f the f i l t e r bed (Bellmy et al., 1985) .
4-2 1
- c the minimum design c r i t e r i a presented i n the Ten State Standards f o r c diat008CeOUS e a r t h f i l t r a t i o n r n considered suf f ic ient for the purposes
of compliance wi th the SWTR with the fo l lowing exceptions: a. The ret-nded quantity of precoat i s 1 kg/$ (0.2 pounds per --.
square foot) of f i l t e r area, and the minimum thickness of the
b. treatment plants should be encouraged to provide a cpfgulant
-.
precoat f i l t e r cake i s 3nn t o SOIR (1/8 t o 1/5-inch).i6 Y .. ~ -
coating (alum or suitable polymer) of the body fr'ed. - . Operatlng requirements spec i f i c to DE f i l t e r s include: - Preparation o f body feed and precoat - Ver i f i ca t ion tha t dosages are proper
- Periodic backwashing and disposal o f spent f i I t e r cake
- Periodic inspection of the septtm(s) for cleanliness or damage
- Ver i f icat ion that the filter i s roducing a ' f i l t e red water that meets the performance c r i t e t P a
4- . .
4.3.7 b l t e - o l o w The SWTR allows the use o f f i l t r a t i o n technologies other than those *
specif ied above provided that the systea dunonstrates t o t h e Primacy . I C * Agency us ing p i lo t s tud ies or other #ant that the f i l t ra t ion technology -
* when combined w i th d is in fec t ion achieves a t leas t 3-109 5- cyst and &log v i rus rewval / inact ivat ion. Such technologies must a l s o m e t t h e t u r b i d i t y performance c r i t e r i a f o r slow sand f i l t r a t i o n . Guidance . . for
" Studies have shown that a pncoat thickness of 1 k g / d (0.2 l b s j f t f ) was most e f fec t i ve i n cys t removal and that the pruoat thickness was atore important than the grade s ize in cys t rcnoval (DeWallc et at., 1984; Logsdon e t a1 1981; Beltamy et a1 . , 1984) . coagulant coating o f the body feed has been found to signi. f icant1y i rove mnovals of viruses, bacteria and tu rb id i ty . .(Brown et al., 19 7 4; Bel lamy e t a1 * , 1984)
'' Although enhancement o f the DE i s not nqul red for Giard ia cyst removal, .
4-22

conducting pilot studies to demonstrate this effectiveness is provided in Appendix W o f this manual.
Revhrse osmosis is a membrane filtration method which is .used for ' desalination and/or the ranoval o f organic contkinants. The treatment process' is effective' for the noloval of Eiardb cysts and viruses and no demonstration is necessary.
Alternate filtration technologies which are currently available include, but are not limited to: - Package Plants .. - Cartridge Filters
Package plants in principle a m not a separate technology f m the preceding technologies. However, in many cases they are different enough in design criteria, and operation and maintenance requirements that they should be considered as an alternate technology. The package plant is designed as a factory-assembled, skid-mounted unit generally incorporating a single, or at nost, a few process units. A complete treatment process typically consists of chemical coagulation, flocculation, settling and filtration. Package plants generally can be applied to flows ranging from. about 25,000 gpd to approximately 6 llgd (USEPA, 1988b) . In cases where the. Primacy Agency believes that the design criteria o f the package plant corresponds to the design criteria of the processes establ ished earlier in this section (i.e., that the package plant qualifies. as conventional or direct filtration), the requirement o f pilot testing may be waived.
or disposable polypropylene cartridges to small water systems my be a feasible method for removing turbidity and some microbiological contami- nants, such as cysts although no data are available regarding their ability to m v e viruses. Pilot studies a m rquired to demon- strate the efficacy 'of this technology for a given supply. However, if the technology was demonstrated to be effective through pilot plant studies at one site, then the technology ,could be considered to be effective a t . another site which had similar source water quality conditions. Therefore, pilot piant testing at the new site might not be necessary.
The application of cartridge filters using either cleanable ceramic .
4-23

It i s ilaportant t o note that the demonstration o f achieving the 3- r . .*
log Glrrdla Cyst and 4-10g virus tarroval/inactivation requi-nts includes dlsinfection. Thus, i f a cartr idge filter i s demonstrated t o achieve a 3-log removal o f Gtardfa cysts and i t i s datemined by CTs that the d is infect ion achieves a t l eas t a 4-109 v i rus inactivation, the . effectiveness of the technology would be. demonstrated. The technology must also maintain turbidit ies less than 1 NTU i n 95 percent of the monthly samples. Wteting t h i s t u r b i d i t y requirement assures a high probab i l i t y tha t tu rb id i ty w i 11 not in ter fere wi th d is in fect ipn and that .
the inact ivat ion ef f ic iencies predicted by the CTs are reliable.
Cri t e r i a After any necessary p i lo t s tud ies are conducted and a successful
demonstration of performance has been made, design c r i t e r i a should be established and approved by the Primacy Agency. Eventually, a su f f i c ien t - l y la rge da ta base will b e c m available, making it easier t o appiy the alternate technologies t o other water supplies o f simi lar qual i ty. - . After any necessary p i lo t s tud ies are conducted and a successful
demonstration o f performance has been made, operating requirements should * be established and approved by the Primacy Agency.
4.3.0 m t A l t c t u t i v U Under cer ta in circumstances, some systems may have other altema-
t ives avai lable. These alternatives include regional izarion and the use . o f a1 ternate sources.
for m a l 1 water systms which must prov ide f i l t ra t ion, a feasible option may be to Join with other small or large systems t o fora a region- a l water supply systm. In addi t ion, a l ternat ive water sources located wi th in a kasonabl t d istance o f a colrmunity which would allow the system t o meet the requirements o f the SWTR and other applicable drinking water regulations, may be developed t o provide a sat is factory so lu t ion to a comnunity water qual i ty problem. The ava i lab i l i t y o f a l te rna t ive ground .' '
4-24 -

water sources nil 1 depend upon the s ize and locat ion of the system and the costs Involved.
4.4 u u e 4.4.1 Gcnctal The SWTR requires that d is in fect ion be included as par t o f the
treatment of surface water for potable use. As noted ear l ie r , €PA rocomends that tho number o f t rea tmnt bar r ie rs bo c m n s u r a t e w i t h t h e degree o f contamination i n t h e source water i n accordance wi th Table 4-2. For example, as ind icated in Table 4-2, when t h e t o t a l c o l i f o m s i n t h e source water are greater than 5,000/100 nl, conventional treatment with p red is in fec t i on i s recorwnded. However, the select ion of appropriate disinfection requires consideration o f other factors in addi t ion to than those included i n Table 4-2. These considerations include:
a. Source water qua l i t y and the overal l tslnoval/ inactivation of GIatdrr cysts and viruses desired.
b. L i k e l ihood o f TTHM formation.
e. Potent ia l need for an ox idant for purposes other than d is in fect ion inc lud ing cont ro l o f taste; odor, i ron, manganese, co lor , etc .
4.4.2 ~ d t d v a l / ~ a t i a n The SWTR requires a mini- 34og rmova l / inac t iva t ion o f Giard ia
cysts and a mini- 4-109 rmoval / inact ivat ion o f viruses: a. Well-operated conventional treatment plants which have been
optimized for t u r b i d i t y removal can be expected t o achieve a t leas t a 2.5-log removal o f Giardia cysts.
b. Well-operated diatomaceous earth, slow sand f i l t r a t i o n and direct f i l t r a t i o n p l a n t s can be expected t o achieve a t leas t S l o g removal of Wardiq cysts.
EPA ncomnands that: a. Conventional f i l t r a t i o n systems w i d e s u f f i c i e n t d i r i n f e c -
t i o n t o achieve a nrinirurm o f 0. 1. - log cyst and 2-log v i rus inact ivat ion.
4-25

b.
C.
Slow sand f i l t r a t i o n systems provide suff icient disinfection t o achieve a miniwm of 2-109 m d i q cyst and 2-lo9 virus inactivation. '
Systems using diatomaceous earth and d i rec t f i l t r a t i on , or o t h e r f i l t r a t i o n methods, should provide suf f ic ient d is in fec- t i o n t o achieve a minimurn o f l - log cyst add 3-109 virus inact ivat ion.
Further guidance on the dis infect ion level t o be provided i s contained i n Section 5. CT values f o r achieving these'inactivations are presented i n Appendix E. As indicated i n t h i s Appendix: -
a. A comparison of Tables €01 through E-6 with Table E-7 indicates that systcrat which achieve a 0.5-log inact ivat ion of Giardia cysts, using free chlorine, 'will achieve greater than a 4-log inactivation of viruses.
b. Ozone and chlorine dioxide are generally more ef fec t i ve a t inactivating viruses than cysts. However, as i nd i ca ted i n Tables E-8 through E-11, there are sme conditions under which the dis infect ion needed t b provide the recomncnded virus inact ivat ion is h igher than that needed for
I. the recomended cyst inactivation. Therefore, a system using ozone or chlor ine d ioxide for d is infect ion must check the CT values needed t o provide the' recwnended
. inact ivat ion of both cysts and viruses and provide the . h igher o f the two disinfection levels. Systems may demon-
s t ra te the i r e f f i c iency fo r overal.1 nmoval/inactivation using the p ro toco l i n Appendices G and M.
e. As l n d l c r t e d I n fables €112 and € 4 3 , chloramines are much less ef fect ive for inact ivat ing cysts and viruses than
. the other disinfectants. Also, chloramines cay be appl ied to the system i n several ways, ei ther wi th chlor ine added p r i o r t o aamonia, amnonia added p r io r t o ch lo r i ne or preformed. For systems applying chlorine ahead o f &nia, the required level o f d is in fec t ion may be determined as follows: . - determine. the CT needed t o provide the required
inact ivat ion o f and viruses and provide the higher of the two levels or
,4026
- follow the ptotocol in Appendix 6 to demonstrate effective lnactivatlon to allow lower levels of disinfection. .
' For systems applying aaraonia ahead of chlorine o r phformcd chloramines, the EPA ncaaaends that the system demonstrate effective virus inactivation according t o the protocol in Appendix 6, since the Cf values for virus inactivation in' Table €113 only apply to the additton of chlorine prior to aaraonia.
Although the SUTR requires a ainimun of a 340g moval/inactivation of EiatdLp cysts and a minimum of a 4-log removal/fnactivation of viruses, it may be appropriate for the Primacy Agency to require greater removals/- inactivations .depending upon the degree o f contamination withln the source
Rose (1988) conducted a survey o f water sources to characterize the level of Giardia cyst occurrence for 'polluted' and "pristine" waters. Polluted waters are defined as waters in the vfcinity of sewage and agricultural wastes, while pristine waters are those originating ,from protected watersheds with no significant sources of microbiological
. contamination frola human activities. EPA believes that treatment should be provided to assure less than one case of microbiologically-caused illness per year per 10,000 people. In order to provide this level of protection, 3, 4 or 5-log Grardra cyst rmval/inactivation should .be provided for the following source water qualities:
. water.
Giardia Cyst Rmoval/Inactivation Required Bdsed 18, 19 on M e Uatcr Cvst -on
Giardia Inactivation Llai At lowable daily avg cyst concentration/100 L (geometric man)
_. .-
Rose, 1988.
daily. lo 10'' annual risk per person based on consumption of 2 liters of water
4-27

if - 'j \ :
According t o these guide1 ines, systems with sewage and agr icul tural discharges t o t h e source water should provide treatment t o achieve an overal l 5-100 r ~ v a l / i n a c t i v a t i o n of E i a r d u cysts, while the ninimm required 3-log rcraoval/inactivation i s s u f f i c i e n t for sources"kith no signi f icant a icrobiological contamination fm human ac t iv i t ies . A 4-109 refnoval/inactivation of cysts should be provided f o r source waters whose level of microbiological contamination Is between these tm, extremes. The location o f discharges or other act ivi t ies pol lut ing the water-tupply with respect to the locat ion of the intake should also be considered i n determining the level of reInoval/lnactivation needed. for instance,. long t r a v e l t i m s and substant ia l d i lut ion of a discharge will lessen the impact of the discharge on the intake water quality, i n which case less of an increase i n the overall treatment recamended above, would be
different generalized source water characterizations are presented only as guidelines. The Primacy Agency could develop dis infect ion requirements . based on these or other guidelines. It could also require systems with avai lable resources t o conduct raw water monitoring for E l a t d i p cyst concentrations to establish the appropriate level of overall treatment and d is in fect ion needed.
The Primacy Agency may also review the nature of occurrence o f --sized par t i c les i n the raw water supply and the association with t u r b i d i t y occurrence. I f it can be demonstrated that a higher degree o f ranoval o f pa r t i c l es i n t he s i ze range o f i s accomplished when tu rb id i t y l eve l s and associated Giardia levels are elevated, then a log removal cred i t higher than 3 could be allowed for that par t icu lar trea-nt plant, during such occurrences. This c r e d i t should correspond t o t h e log p i r t i c l e removal e f f i c i t nc ies accoarplishcd, as determined by part ic le count ing data, or turb id i ty data i f proper ly qual i f ied. In a l l
. cases, a minimum of 0.5 log reduction o f &jardln should be achieved by d i s in fec t i on i n add i t i on t o ' t he removal c red i t allowed for by other
1
< warranted. It i s important t o note that these levels of treatment for
c t reatmnt
- Based on To
changes
Until a r i sk ana lys is fo r exposure t o viruses i s developed, a rough
1. . For a 4-109 Giardia cyst tcrnoval/inactivation, a 5-10g v i rus
b. for 5-109 Giardia remval/ inact ivr t ion, a 6.100 v i fus
guidel ine for virus rsRoval/ inactivrt ion, can be considered as follows:
nmoral /i nact i vat i on i s recomnended . r m v a l / i n a c t i v r t i o n i s recomrnanded.
These guidelines assume that v i rus occurrence i n the source water'
- v i r k occur at higher concentrations i n source waters, or
- are more in fect ious than E iardb cysts and
- infect ions from viruses may have amre health r isk signif lcance
i s roughly proportional t o cyst occurrence, and that
than Giardia cysts.
these assumptions, higher levels of protection are warra.nted. m e t t h e l e v e l s of inact ivat ion recommnded here, s ign i f icant
i n t h e system may be required. To avoid changes i n t h e system which may resul t in conf l ic ts wi th fu ture regulat ions, the Primacy Agency. way wish to es tab l i sh in te r im d is in fec t ion leve ls to p rov ide p ro tec t ion of the publ ic heal th prior t o t h e promulgation of the d is infect ion by-product regulat ions and then reconsider whether these levels are still appropr iate af ter the d is infect ion by-product regulations .arc'promulgated. Guidance for establ ish ing in ter im d is in fect ion nqui rcncnts i s provided '
i n Section 5.5.
4.4.3 Jotal Trih-e ! T T ~ l a t i ~ I n a d d i t i o n t o complying w i th d is in fec t ion requirements, systems
must meet the requirements o f t h e TTHM regulations. Currently, this ngulat fon. includes an )9cL f o r TTtiMs o f 0.10 r g / L f o r systeas which serve greater than 10,000 people. €PA expects , to issue new regulat ions with a lower MCL i n the near future. These regulati,ons m y also pertain t o systems serving less than 10,000 people. Therefore, the select ion of an appropriate disinfectant or dis infect ion strategy must include consid- erat ion o f current and futu& regulat ions.
.. 4-29

5. CRITERIA FOR DETERMINING I F FILTRATION FECTION ARE SATISFACTQgLLY PRqul l ; fp
5 .1 l n j roduc t iop Under the SWTR, new and e x i s t i n g f i l t r a t i g n p l a n t s aust m e t .
specif ied monitoring and performance c r i t e r i a i n o r d e r t o assure tha t f i l t r a t i o n and d is in fect ion are sat is factor i ly pract iced. These c r i t e r i a i nc l ude: - Turbidity monitoring requirements
- Turb id i ty performance c r i t e r i a ..
- Disinfection monitoring requirements
- Dis in fec t ion performance c r i t e r i a
The overa l l ob ject ive of these c r i t e r i a i s t o provide control o f : Giardia cysts; viruses; turbidity: HPC; and w l l g by assuring a high probabi 1 i t y that:
a. Fi l t rat ion p lants are wel l -operated .and achieve maximum
b. D is in fec t ion will provide adequate i n a c t i v a t i o n o f G i a r d i a
r m v a l e f f i c i e n c i e s of the above parameters.
cysts, viruses, HPC and ~ a i o n e l l ~ .
5.2 Turbiditv MQajtorina R- 5.2.1 Location The purpose of the turb id i ty requi rements. for systems which use .
a. Giard ia cyst and general part iculate removal for conventional f i l t r a t i o n i s t o i n d i c a t e :
treatment and d i r e c t f i l t r a t i o n
b. General pa r t i cu la te removal m d slow sand f i l t r a t i o n
c. Possible interference wi th processes
To accomplish the purposes o f t h e
fo r diatomaceous earth f i 1 t r a t ion
d i s i n f e c t i o n f o r a l l f i l t r a t i o n
t u r b i d i t y requirements, requ i res tha t the tu rb id i ty samples be representat ive of the
the SWTR system! s
5- 1

r) f i l t e r e d water. The sampling locations which would sa t i s f y t h i s requirement include:
a. . Combined f i l t e r e f f l u e n t p r i o r t o e n t r y i n t o a clearwell',
b. Clearwell effluent;
c. Plant eff luent or imned ia te l y p r i o r t o en t r y i n to t he d i s t r i -
d. Average of me!asuremcntr frola each f i l t e r e f f l u e n t .
but ion system; or
The se lect ion of sampling locations for demonstrating compliance w i th t he t u rb id i t y performance c r i t e r i a i s l e f t t o t h e system or, t he preference o f t h e Primacy Agency.
-
5.2.2 a m d i n a F r e a w The t u r b i d i t y o f t h e f i l t e r e d water must be determined: d. A t l eas t once every' four hours that the system i s i n opera-
b. . The Primacy Agency may reduce the sampling frequency t o once per day f o r systems using slow sand f i l t r a t i o n or f i l t r a t i o n treatment pther than conventional treatment, direct f i l t rat ion or diatomaceous e a r t h f i l t r a t i o n , i f it determines that less frequent monitoring i s s u f f i c i e n t t o i . n d i c a t e ' e f f e c t i r e f i l t r a t i o n performance. For systems serving 500 or fewer people, the Primacy Agency may reduce the samplin frequency
* it determines that less f requent noni tor ing is Suf f ic ient to . i n d i c a t e e f f e c t i v e f i l t r a t i o n performance,
4. t ion , or
t o once per day regardless o f t h e t y p e o f f i l t r a t ? on used i f
A systtrn may subs t i tu te continuous turbidi ty monitor ing for grab sample monitoring i f i t validates the continuous measurement for accuracy on a regular basis using a protocol approved by the Primacy Agency. EPA recomaends tha t t he ca l i b ra t i on o f continuous turb id i ty moni tors be v e r i f i e d a t least tw ice per week according t o t h e procedures established i n Method 214A o f t he 16 th Ed i t i on o f Standard Me#&.'

5.2.3 Additional hnitoriqg As Indicated in Section 4.3.2, EPA recommends that systems equip
each filter with a continuous turbidity neonitor. This recomnendation is not part of the requirtmentr of the SWTR and i s not requfred for establishing compliance. Rather, it. i s reconmcnded as a tool for'systems to use to better monitor their treatmnt efficiency and to provide a method for detecting a deterioration in filter perfonnance.
If continuous monitoring of each filter effluent cannot be implemented, then EPA recmends that at least the following be conducted on a quarterly basis:
a. Monitor each filter, either by grab samples or continuous monitors, through the course of a routine cycle of operation, i .e.: from restart to backwash
b. Visually inspect each filter where appropriate for indications of physical deterioration of the filter
These are general suggestions. The Primacy Agencies are encouraged to work with the systems to determine the best overall monitoring program(s) for their particular filtration plants .in order to assess the' status of the filter units. Each filter within a system should be
* ' maintained so that each filter effluent N e t s the turbidity performance criteria for the combined filter effluent (i.e.( .the turbidity limits specified in the SWTR).
5.3 m i t v P e r f o w c e Cri- . The SWTR establishes turbidity perfomance criteria for each o f the
filtration technologies. As previously indicated, these criteria provide an indication of:
a. Effective particle and aicrobial removal
b. Potential for interference with disinfection -
In filtration, effective particle removal'depends on both physital and chemical factors. The particles to be removed must be transported to the surface ,of the media and they must attach to the media. When efficient particle removal does not occur, the deterioration o f filter

/-- -; performance ,can be due to e i ther phys ica l problems w i t h t h e f i l t e r s Or i ; problems with the treatment chcnrisfry.
perfonnance include: Physical problems which can r e s u l t i n a deter iorat ion of f i l t e r
a. Media loss .. b. Media deter iorat ion
c. Mud bal l format ion
d. Channeling or surface cracking
e. Underdrain f a i l u r e
f . Cross-connect i ons
In addition, the treatment chemistry has a s ign i f i can t impact on f i l t ra t ion . Spec i f i ca l l y , e f fec t i ve par t i c le removal i s a funct ion o f the:
a. Raw water chemistry and the changes induced by the chemicals
b. Surface chemistry o f t he pa r t i c l es t o be remored
c. Surface chemistry o f the media
added ?
Consequently, when a f i l t e r experiences p a r t i c l e or t u r b i d i t y breakthrough p r i o r t o the development o f t e m i n a l headloss, the search fer alternat ives ..
to cor rec t the problem must include not only an evaluation of the . potent ia l physical causes but the treatment chemistry as well . Central ly th is invo lves an evaluation o f one or more of the fo l lowing:
a. A1 ternate coagulant type and/or dose
b. Alternate coagulant aid or f locculant a id type and/or dose .
e. Need f o r an alternate oxidant type and/or dose
.d . Need f o r a f i l t e r a i d or al ternate dose
5-4

5.3.1 -1 TreatlpCat or Direct Filtratin The .inimurn t u r b i d i t y performance c r i t e r i a f o r sys tms us ing
conventional treatment or ' d i r c c t f i 1 t r a t i o n are: t a. F i l t e r e d water t u r b i d i t y must be less-than or equal t o 0.5 NTU
f n 95 percent, o f t h e measurements taken every month,
b. F i l t e r e d water tu rb id i t y l eve l s o f less than or equal t o 1 NTU i n 95 percent of the Reasumnentt taken every month may be p a m i t t e d on a case-by-case basis i f the Primacy Agency determines that the system ( f i l t r a t i o n w i t h d i s i n f e c t i o n ) i s . capable o f achievlng the minimum overall perfomance require- ments o f 99.9 percent rcmoval/inactivatlon o f - cysts a t the h igher turb id i ty leve l . Such a determination could be based upon an analysis o f ex is t ing 'design and operating condit ions 8nd/or performance r e l a t i v e t o c e r t a i n water quali- ty characterist ics. The design and operat ing condi t ions to be rcvimed include:
- the adequacy of treatment p r i o r t o f i l t r a t i o n ,
- level o f d is in fect ion.
. - the percent turbldity removal across .the treatment t ra in , and
Water qual i ty analysis which may also be used to evaluate the treatment effectiveness include particle size counting before and af ter the f i l ter . P i lo t p lant chal lenge s tud ies s imulat - t ,
i n f u l l scale operation ma also be used t o demonstrate ef ective treatment. Depend ng on the source water qua l i t y and system size, the Primacy Agenc will determine the extent. of the analysis and whether a p i T ot p lan t demonstration i s needed. For t h i s demonstration, . systems are allowed t o inc lude d is in fect ion in the determinat ion o f the overa l l ' performance by the system.
s r -1
c. . F i l t e r e d water t u r b i d i t y may not exceed 5 NTU a t any time.
The Primacy Agency can assume that conventional treatment plants
a 2.5-log removal o f Gfatdia cysts and a t leas t a 2-log removal of v i ruses p r i o r t o d i s f . p f e ~ t i o n . ~
I t h a t are meeting the ainimum performance cr i ter ia are achiev ing a t least
' Recoamended protocol for th is demnstrat ' ion i s presented i n Appendix M. '
' The l i te ra tu re ind ica tes tha t we l l operated conventional t rea tment p lants can achieve up t o 3-1og reduction o f u d i a cysts and viruses Logsdson, 1987b and Roebeck e t at., 1962). L imi t in the c red i t t o
b.5-logs fo r cys ts and 2-100s for viruses prov ? des a margin o f safety by requi r ing more disinfection. This i s consistent w i t h t h e
5-5
The Primacy Agency can assume tha t d i rec t f i l t r a t i on p lan ts t ha t a re me t ing t he minimum perfonnance cr i ter ia are achiev ing a t least a 2-109 removal of cysts and a 1-log removal o f viruses.'
Although the minimum turb id i ty .per fomance cr i ter ion a1 lows for a maximum f i l t e r e d water tu rb id i ty o f 0.5 NTU, treatment fac i l i t i - us ing conventional treatment or d i r e c t f i l t r a t i o n , whose raw water supplies have
' t u r b i d i t y l e v e l s o f 1 NTU or less, should be encouraged t o achieve f i l tered water turb id i ty leve ls o f less than 0.2 NTUDs
Primacy Agencies nay al low systems which bel ieve that they are actually achieving greater than a 2- or 2.5-log Giardb cys t ' removal t o demonstrate the actual removal achieved using the protocol outlfned ' in Appendix M., It i s 'reasonable t o expect tha t systems using conventional treatment f o r h i g h t u r b i d i t y source water (e.g., t u r b i d i t i e s i n excess o f 100 NTU), and which optimize chemical treatment p r i o r t o f i l t r a t i o n , may
e f f l uen t i s subs tan t i a l l y below the 0.5 NTU t u r b i d i t y limit. Softening t plants using conventional processes and 2-stage treatment processes may J also achieve a 3-109 Giardia cyst removal/ inactivation. The high pH o f
softening may r e s u l t i n i n a c t i v a t i o n o f m d i a cysts and viruses which can be demonstrated according to t he p ro toco l ou t l i ned i n Appendix G , Appendix M can be used t o demonstrate the GiardlQ cyst removal achieved.
c be achieving a 3-1og or greater Giardia cyst removal i f t h e i r f i l t e r
mu1 ti p l e b a r r i er concept . ' Li te ra tu re ind ica tes tha t we l l opera ted d i rec t f i l t ra t ion p lan ts - can
achieve. up t o a 3-log removal o f Giard ia cysts and up t o a 2-log rcaoval o f v i ruses (Logsdon, 1987b; Roebeck e t a1 , 1962) . *Limi t ing the c red i t t o 2 - l og for Giardia cysts and 1-109 for viruses provides a . mar i n o f s a f e t by requir ing more disinfection. This i s consistent wit if the mu l t ip r e b a r r i e r concept. .
' Research has demonstrated'that f i l t e r e f f l u e n t t u r b i d i t i e s s u b s t a n t i a l -
Giardia cysts and viruses wi th low t u r b i d i t y source waters (Logrdon, 1987b; A1-Ani e t a1 . , 1985).
- l y .lower than 0.5 NTU are needed t o obta in e f fect ive removals of
5-6

5.3.2 Slow For systems using slow sand f i l t ra t ion , the tu rb id i ty per fomance
requirements are: t a. The fi l tered water tu rb id i ty must be less than o r equal to.
1 NTU i n 95 percent of the lcasunmcnts for each mon,th.
b. A t the d iscret ion o f the Primacy Agency, a higher f i l t e r e f f l u e n t t u r b i d i t y my be allowed for wel l o erated plants
Section 4.3.5) on a case-by-case basis, i P there i s no nterference wi th d is infect ion and the tu rb id i ty leve l never
exceeds 5 NTU. Noninterference with disinfection could be assumed i f the f inished water entering the distr ibution system i s meeting the col i form MCL and HPC levels are less than lO/ml during times of highest turb id i ty .
I
c. F i l tered water turbidi ty may not exceed 5 NTU a t any time.
Slow sand f i l t ra t ion p lan ts , w i th appropr ia te design and operating condit ions and which meet the minimum t u r b i d i t y performance c r i t e r i a can be considered t o be well operated and achieving at least a &log removal o f cys ts and 2-109 removal of viruses without disinfection.' Primacy Agencies may al low systems which believe 'that they are actually achieving greater than a 2-109 Gfardia cyst removal t o demonstrate the actual removal achieved using the protocol outl ined i n Appendix M.
5.3.3 QiatomqCpOus Earth Filtram For systems using diatomaceous e a r t h f i l t r a t i o n , t h e t u r b i d i t y
a. The f i l t e r e d w a t e r t u r b i d i t y must be less than or equal, ' t o 1 NTU i n 95 percent o f t h e measurements f o r each month.
performance c r i t e r i I I are:
b. The t u r b i d i t y l e v e l o f representative samples of f i l t e r e d water must a t no t ime exceed 5 NTU.
Diatomaceous earth systems, with appropriate design and operating Conditions and which meet the minimum t u r b i d i t y performance c r i t e r i o n can
' As ind ica ted in Sec t ion 4, p i l o t s t u d i e s have shown that wi th proper . nur tur ing o f the schmutsdecke, operation a t a maximum loadin . r a t e of 0.2 m/hr will provide optimum removal o f Giardia cysts an 8 viruses (Logsdon, 1987b; 8 e l l amy e t a1 . , 1985).
5-7
L
be considered t o be wel l operated and achieving at least 2-log removal of w d i a cysts and at least 1- log removal of viruses without disinfection. Systems which believe that they are actually achieving greater than a 2- l og Giardia cyst removal my demonstrate the actual mnoval achieved using the protocol out l ined in Appendix M, . .
5.3.4 U r F i l t r a t i o ~ o l o p i U The tu rb id i ty p t r fomance c r i te r ia fo r f i l t ra t ion techno log ies o ther
than those presented above, are the same as for slow sand f i l t r a t i o n . The Giardia cyst removal achieved by these systems m s t be demonstrated t o t h e Primacy Agency. The protocol out1 ined i n Appendix M may be used as a
.bas is fo r th is demonstration, Reverse osmosis i s a ncmbrane f i l t r a t i o n method used t o remove
dissolved solids from water suppties. Desalination i s a t yp ica l use of the process. Application to potable water treatment i s l i m i t e d t o extremely high quality raw water supplies of low t u r b i d i t y (1 NTU or less) , or following pretreatment to' produce a supply o f low. tu rb id i t y . .
The membrane excludes part ic les larger than 0.001 t o 0.0001 um range, thereby e f fec t i ve l y removing bacteria, Giardia cysts and viruses. Credi t can be given f o r a t least a 3-log giardia cyst and 4-log virus removal, w i th no demonstration. It should be noted t h a t t h i s removal c r e d i t assumes the membranes are i n t a c t w i t h no holes i n t h e membranes al lowing the passage of organisms.
5.4. O i s i n f s t i o n M o n i t o r i w R r a u i r m Each system must continuously monitor the disinfectant residual of
the water as i t enters the d is t r ibu t ion system and record the lowest dis infectant residual each day. If t h e r e i s a f a i l u r e i n t h e continuous monitorlng equipment, the system may subst i tu te grab sample monitoring every 4 hour's for up t o 5 working days fo l lowing the qu ipmcnt fa i lure. Systems serving 3300 people or fewer may take. grab samples i n l i e u o f continuous monitoring a t frequencies as follows:
- s4luuRu ~ 5 0 0 1
5014,000 2
‘1,001 - 2,500 3 . 2,501 - 3,300 4
The grab samples must be taken a t d i f f e ren t times during the day, with the sampling i n t e r v a l s s u b j e c t t o P r h c y Agency review’and approval I f the residual concentrat ion fa l ls below 0.2 mg/L, the system must take ’
another sample w i th in 4-hours and n o t i f y t h e Primacy Agency as soon as possible, but no l a t e r than the end of the next business day, even if the res idua l i s res to red t o 0.2 mg/L or greater wi th in 4 hours. If the res idua l i s no t res to red to 0.2 mg/L or greater wi th in 4 hours, the system f s i n v i o l a t i o n o f a treatment technique requirement. Each system must a lso measure the d is in fec tan t res idua l in the d is t r ibu t ion system a t t h e same frequency and locat ions a t which t o t a l c o l i f o m measurements are made pursuant t o t h e requirements in the rev ised Tota l Col i form Rule (54 FR 27544; June 29, 1989) For systems which use both surface and ground water sources, the Primacy Agency may a1 low subst i tu te sampldng ‘sites
. .
I which are more representative of the .treated surface water supply.
5.5 Dis in fec t ion P r r f o w C r i t e r i a 5.5.1 5 For systems which provide f t l trat ion, the disinfection requirements
o f t h e SWTR are: a. Dls in fec t ion must be provided t o ensure tha t t he t o ta l
treatment processes o f t h e system ( i nc lud ing f i l t r a t l on ) achieves a t l e a s t a % l o g r m v a l / i n a c t i v a t i o n of Giatdia cyst and a .4- log removal/ inactivation of viruses. The Primacy Agency nust determine what l eve l o f d i s in fec t i on i s requ i red for each system t o meet t h i s c r i t e r i o n .
b e The s stem ‘nust demonstrate by continuous m n i t o t i n g and. recor cr i ng t ha t a d is in fec tan t res idua l in the water entering the d i s t r i bu t i on system i s never less than 0.2 mg/L for more ’
than 4 hours. I f a t any t ime the res idua l fa l l s below 0.2 ’
mg/L f o r more than 4 hours the system i s i n v i o l a t i o n . The
5-9

* . ,.
r". t tystcin must no t i f y the Primacy Agenc whenever the residual
f a l l s below 0.2 mg/L before the end o the next business day.
e. . The System must demonstrate detectable disinfectant residuals or HPC l eve l s o f 500 or fewer colonies/ml i n a t l e a s t 95
f o r any two consecutive months. , percent of the samples from the d is t r ibut ion syst tm each m n t h .
-% -A
5.5.2 P e r f m c e C r i t e r i a ."
D is in fect ion must be applied t o assure that the overal l t reatment provided achieves a t l e a s t a 3-109 removat/inactivation o f cyst and a 4-109 rcoKlval/inactivation of 'viruses. As- out l ined in Sect ion 5.3, we l l operated f i l t e r p l a n t s achieve a t l eas t a 2 t o 2.5-109 reatoval o f Giardia cysts and between a. 1 t o 2-109 removal o f viruses.. EPA therefore recomnends that the Primacy Agencies adopt addi t ional d is in fect ion per for - mance c r i t e r i a t h a t include:
a. As a minimum, pr imary d is in fect ion rqu i runents that are consistent with the overal l treatment requirements o f the 4
% * ~ C SWTR, or preferably;
* b. Primary disinfection requirements as a . func t ion o f raw water q u a l i t y as out l ined in Sect ion 4.4. .
D is in fect ion
. .- .
f? . The required minimum pr imary .d is infect ion i s the d is in fec t ion
needed for the ent i re t reatment process t o m e t t h e o v e r a l l treatment requirement o f 3-109 Ji iprdiq and 4-log virus runoval/ inactivation. The '
fol lowing table provides a .sumnary o f t h e expected minimum leve l of treatarent performance i n we1 1 operated f i l t e r systems and the recomnended leve l o f d is in fec t ion .
Expec t ed Rcconmcnded D i s i n f ec t i on LO Val s l-t ivationtl .
F i l t r a t i ~ a .. w-yirvrer Giardia Yhws Conventional 2.5 2.0 0.5 2.0
Direc t 2.0 ' 1 .o . 1.0 3 .o S low Sand 2.0 2.0 1 .o 2.0
D i atomaceous Earth 2 .o 1 .o 1 .o 3 .O
-.
5- 10

In cases where the system believes that the tnattnent processes are achieving. greater removals than those listed above, the actual removal provided by the processes can be demonstrated through the procedures outlined in Appendix M. However, €PA reconmcndt that, despite the removals demonstrated, systems should provide a minimum o f 0.5 log Giardia cyst inactivation to supplement filtration and maintain a second treatment, barrier for microorganisms.
ed Disinfection as a F w i o n of -Water Ouatity Although the SWTR requires the overall treatment to provide a
minimurn o f a 3-109 &iardia cyst and a 4-109 virus mval/.fnactivation, it may be appropriate for the Primacy Agency to nquiry greater removals/- inactivations depending on the degree of contamination in the source water as presented in Section 4.4. Following is a surrraary o f the ncoaxnended overall treatment which should be provided based on an estirnate.of the Giardia cyst concentration in the source water:
A1 lowable daily avg cyst conccntration/100 L 1 aardia cyst Removal/Inactivation 3-109 4-1 09 5-1 Og
Virus Removal/Inactivation 4-10g * 5-1 09 6-1 09
If a slow sand filtration plant must achieve a 401og removal/inacti- vation o f Ejardia cysts and a S l o g &val/inactivation of viruses, and credit for 2-log GiarpLn cyst and 2-109 virus removal by filtration is granted, disinfection for a 2-log cyst inactivation and 3-109 ,
virus inactivation would be needed to neet the overall renoval/inacti- vation, However, Primacy Agencies may allow systems which use particle size analysis. outlined i n Appendix M to demonstrate greater than a 2-log Ejardip cyst nmoval to provlde less than &log giardia cyst inactivation through disinfection.
5-1 1

P., 6 : 5.5.3 Disinfection BV Product C o w r a t i o p f
Although the EPA suggests increased levels of disinfection for various source water conditions, a utility should not implement such a change without considering the potential conflict with the requirements of existing or future disinfection by-product regulations. EPA idtends to promulgate National Primary Drinking Water Regulations to regulate levels of disinfectants and disinfection by-products when it promulgates disinfection requirements for ground water systeas (anticipated in 1992). €PA is concerned that changes . required in utilities' disinfection practices to m e t the recormranded inactivations for the SWiR night be inconsistent with treatment changes needed to.comply with the forthcoming regulations for disinfectants and disinfection by-products. For this reason, EPA recornends that Primacy Agencies exercise discretion, . sensitive to .potential disinfection by-product concerns, in determining
. the level of disinfection needed for filtered systems to m e t the.overal1 treatment requirements specified in the rule or reconmended based. on source water qual i ty.
Until the promulgation o f the disinfection by-product regulation,
0
€PA reconmends that the Primacy Agency allow more credit for uardia cyst and virus removal by filtration than otherwise recoamended if a) the Primacy Agency determines that a system is not currently at a significant risk from microbiological contamination at the existing level of disinfection and b) less stringent interim disinfection conditions are necessary for the system to modify its disinfection process to optimally
. achieve compliance with the SWTR as well as the forthcoming disinfection by-product regulations. The following paragraphs outline the ncomnended disinfection levels for systems meeting the above conditions.
. For mll-operated conventional filtration plants that w e t the minimua turbidity requirements at a1 1 times, the Primacy Agency may consider giving the systers credit for 3-log Giardia cyst removal (in lieu of the generally recomnended 2.5-log &dit) . Also, for well-operated direct filtration plants, the Primacy Agency m y consider giving the system credit for 2.5-log Giardia cyst removal in lieu of the generally
. 5-12
mcorrannded 2.0-log c red i t . €PA recoaracnds tha t these addit ional credits be given for conventional or d i r e c t f i l t r a t i o n o n l y if:
a. The t o t a l treatment t r a i n achieves 1) a t l eas t 99 percent t u r b i d i t y removal, or f i l t e n d water turbid1 t ip are consis- t e n t l y less than 0.5 NTU, whichever i s lower, p~ 2) a 99.9 percent removal o f p a r t i c l e s i n t h e s i z e r n e o f 5 t o 15 urn i s demonstrated as out l ined i n Appendix M;! i n d
b. The level af heterotrophic p late count (HPC) bac te r ia i n t he f in ished (dis infected) water enter ing the d istr ibut ion systm i s c o n s i s t e n t l y less than lO/m1. -
Systems using slow sand f i l t r a t i o n or diatoaaceous e a r t h f i l t r a t i o n may be g iven in ter im credi t for up t o 3-109 Siatdia cyst removal i f the . system ateets the recamended cond i t ions l i s ted above for conventional systems. P i lo t p lan t s tud ies have demonstrated that these technologies, when w e 1 1 operated, general \ y achieve a t l eas t 3 .04og removals (USEPA, 1988a) .
The EPA bel ieves that in ter im leve l o f d is in fect i6n requirements may be appropriate i n some cases depending upon source water qua l i t y , r e l i a b i l i t y o f system operation and potential increased health risks from disinfection by-products. EPA intends to regulate d is in fectants and disinfection by-products i n 1992. A t th is t ime it will become apparent how systems w i th d is in fec t ion by-product problems can opt imal ly meet the disinfection requirements of the SWTR and the disinfection by-products regulations, concurrently.
' For example, a system with 9 raw water t u r b i d i t y averaging 20 NTU maintain ng a f i l t e r e d water tu rb id i ty less than 0.2 NTU can be granted 3-109 Eiarm cyst removal c red i t w i th no fu r ther demonstration.
* I n cases where the Primacy Agency has a data base which .shows a cor re la t ion between t u r b i d i t y and Giardia cysts removal, t u r b t d i t y may be used i n l i e u o f p a r t i c l e size analysis. Turbidity removal require- nrents should be set t o assure 99.9 percent Giardia cyst removal. A
. cor re la t ion between t u r b i d i t y and U r d i q cyst removal was shown i n a study reported ,by Hendricks e t a1 (1984).
5-13
5.5.4 The SWTR does not require a redundant d is in fec t ion system f o r
f i l tered supplies. However, i n order t o assure the continuous provision of d is in fec t ion to met the overa l l maova l / inac t iva t ion requirements and t o maintain a residual enter ing the d istr ibut ion system, EPA kcomnends tha t redundant d is in fect ion equipment be provided. As contained i n t h e 1987 ed i t i on o f Ten State Standarb, where d is in fec t i on i s requ i red f o r protection of the supply, standby equipment i s required. Automatic switchover should be provided as needed, t o assure continuous dis infectant application.
Recommendations for providing redundant d is in fect ion are out l ined in Section 3.2.4 and d e t a i l e d i n Appendix 1.
5.5.5 petermiuption of U c t i v a t w bv D i s i n f c c t i w The desired level of inact ivat ion can be achieved by d is in fect ion a t
any point in the t reatment or d is t r i bu t i on system p r i o r t o t h e first customer. D is in fec t ion p rov ided p r io r to f i l t ra t ion i s re fe r red to as pre-d is in fect ion whi le , d is in fect ion a f ter f i l t ra t ion is re fer red to as post-disinfection. As presented i n Section 3.2, the inact ivat ion of Giarm cysts and viruses provided by disinfection are indicated by CT values
The SWTR defines C f as the residual disinfectant concentrat ion(s) in mgjL mul t ip l ied by the contact t ime(s) i n minutes. The contact time is measured from the po in t o f d is in fec tan t app l i ca t ion to the po in t of residual measurement or between points of residual measureqent. The inact ivat ion e f f ic iency can be determined by calculat ing CT a t any point along the process a f t e r d i s i n f e c t a n t a p p l i c a t i o n p r i o r t o t h e f i r s t cus t m r .
A system may determine the inactivation eff iciency based on one p o i n t of residual measurement p r i o r t o t h e f i r s t customer, or on a p r o f i l e of the residual concentrat ion after the point of disinfectant appl icat ion. The res idual prof i le i s generated by monitoring the residual at several points between the point(s) of d is in fectant appl icat ion and the f i r s t customer. The system can then use the method described i n Section 3.2 for dete imin ing the to ta l , inact ivat ion cred i t . Prof i l ing the res idual allows
. .
4?.* .-
5- 14
f o r c r e d i t Of s igni f icant ly h igher residuals which may ex i s t before the water reaches t h e f i r s t customer. Methods f o r determining vario,us disinfectant ' residuals are described i n Appendix 0.
In p ipe l ines, the contact t ime can be assumed equivalent t o t h e hydraul ic detention t ime and is ca lcu la ted by d iv id ing the in tema? volume o f the p ipe l ine by the peak hourly flow ra te through the pipeline. I n mixing basins and storage reservoirs, the hydraulic detention t ime generally does not represent the actual disinfectant contact tim because o f shor t c i rcu i t ing. The contact t ime i n such chambers should be determined by t racer studies or an equivalent demonstration; The time determined from the t racer study t o be used for calcu lat ing CT i s Tlo. T,, represents the time that 90 percent o f the water (and microorganisms within the water) will be exposed to d is in fec t ion w i th in the d is in fec tan t contact chamber. Guidance fo r detemining detent ion t ime in contact chambers i s provided i n Appendix C.
The residual d is infectant concentrat ion should be measured da i l y , during peak hour ly flow, for each d i s in fec tan t sec t i on p r i o r t o t he f i r s t customer i n t h e d i s t r i b u t i o n system, Unless a ' system knows from experience when peak flow will occur, a system cdn on ly , i den t i f y peak hourly f l ow a f t e r it has occurred. Therefore, €PA suggests that residual . masurements be taken every hour. I f i t i s no t p rac t ica l to take grab samples each hour, the system may take grab samples during the period peak f l o w i s expected t o occur, or continuous monitors may 'be used. The measurements taken during the hour of peak flow can then be used t o deternine the C f f o r each section (CTCtlc). The determination of CTs is explained i n Section 3.2.1.
Although the inactivation maintained i n the system i s determined during peak hour ly flow, the d is in fectant dosage appl ied to maintain th is. inac t iva t ion may not be necessary under lower flow conditions. Under lower flow conditions, a higher contact t ime i s general ly avai lable and
, the CT needed t o meet the requi red inact ivat ion may be met with a lower residual concentration. Continuing to apply a d is in fec tan t dosage based on the peak hour ly flow may 'provide more d is in fec t i on t han i s needed, Increasing costs and possibly resul t ing in increased levels of d is infec- tan t .by-products. However, the system should also maintain the required
5-15
..
4

... .. .. .
i" inactivation levels at non-peak hourly flows. The syst& should therefore evaluate the dose needed to provide the CT necessary for maintaining the required .inactivation under different flow conditions and set the dosage accordingly. The following example provides guide1 ines for determining flow ranges and disinfection levels to maintain the requ'ired disinfection.
ExamPle A 20-argd direct filtration plant applying free chlorine as - a
disinfectant has a contact time of 27.5 minutes under peak flow condi- tions. As noted in Section 5.3, well-operated direct filtration plants achieve 2-log Eiardiq cyst removal and 1-109 virus removal. Therefore, I
disinfection for 1-109 U r d i p cyst inactivation and 3-1og virus inactivation is recommended. The pH and temperature of the water are 7 and 5 C, respectively. Using Table €02, a CT of 55 is required to achieve 1-10g Giardia cyst inactivation at a residual of 2 mg/L. This level of treatment is more than adequate for 3-109 inactivation of viruses requiring a CT of 6, as indicated in Table E-7. However, under low flow conditions the available contact time is longer, and lower residuals are
. .
.. needed to provide the same level of inactivation. Based on the calculated
contact time under various flow rates and the CT values in Table E-2, adequate disinfection would be provided by maintaining the following chlorine residuals for ,the indicated flows:
CT90
.X
..."
s. -.
Contact Free Ch 1 ori ne -/.
- I ,
uLlwu lkimu 20 27.5 55 2.0
15 36 52.5 1.5
10 54
5 108
50
47
1 .o 0.5
CT,, corresponds to a 1-log inactivation. If a different level 'of inactivation were needed, CT values for that inactivation would be read from the tables corresponding to the pH and temperature of the water. - Section 3.2.2 lists the percent inactivations corresponding to
log inactivations, i.e., 0.5-log equals 68 percent requiring CT6'
5-16

.. Sn cases where the residual , pH or teapcrature of the water i s T an i n temdia te va lue no t repor ted i n the tab les, l inear
(s t ra ight - l ine) in terpolat ion may be used.
- For example, i n t h e above. l i s t i n g , 0.5 mg/L residuals are not included in-. the Appendix E tables. The CT ,, value was
* detcnained by interpolating between the a.4 ag/t value of 46 ag/L-min and the 0.6 mg/L value o f 48 q/L-min. ,
- CT values for intermediate pH and temperature values nay also be interpolated; or
- The C f values for the higher pH or lower tcnperatuye l i s t e d i n the tab le amy be used instead o f interpolat ion.
requ re t o achieve any log inact ivat ion by:
>
. .
- CT9,. 1 tab les in the SWTR can be used t o calculate the CT
l og inac t iva t ion
3.0 l og CTrequi red reau i red x Cf,,. 9.
The v a r i a t i o n i n CT required wi th respect to the residual for ch lor ine makes it imprac t i ca l f o r t he u t i l i t y t o con t i nua l l y change the d is in fectant dose as the flow changes. Therefore, EPA .suggests tha t the f l o w v a r i a t i o n a t t h e u t i l i t y be d iv ided in to ranges and the residual needed at the h igher flow o f t h e range be maint.ained for a l l flows wi th in the range t o assure adequate dis infect ion. The' fo l loning flow ranges and residuals a t the given pH and temperature are suggested f o r t h i s p l a n t :
€lauwuw ' -
f ree Ch 1 o r i ne
5-10 10-15 15-20
1.0 1.5 2.0
I
In t h i s way, t h e u t i l i t y i s assuring the provision o f the required d is in fect ion whi le min imiz ing the d is in fectant costs and possibly lowering .
d i s in fec t i on by-products, *
Although these residuals will meet the required CT, maintaining a res idua l i n t he d i s t r i bu t i on system must also be considered. I f there i s no other point o f d i s i n f e c t i o n p r i o r t o t h e d i s t r i b u t i o n system, the residual for d is in fec t i on must be maintained at a leve l which will also
a provide a residual .throughout the distribution system. The complete range of ,flows OCCurting a t the p lan t should be evaluated for d e t e d n i n g t h e required rasidual . The u t i l i t i e s may establ ish the residual needs for as many flaw ranges as i s p r a c t i c a l .
fhe Primacy Agency *should make periodic checks t o assure that the u t i l i t y i s maintaining adequate d is in fect ion a t both peak and non-peak flow conditions.
In con t ras t to th is c lose con t ro l o f dis infectant addi t ion and CT monitoring, f o r f i l t e r e d systems which have long detention. times and regular ly exceed the CT requirements for the inact. ivat ion needed, it may be unnecessary f o r t h e system to ca lcu la te CTs each day of operation. Unl ike unf i l tered systems where CTs r u s t be calculated each day, f o r .
fi l tered systems, monitoring the residual at, the end o f the contact t ime may be su f f i c i en t t o i nd i ca te t ha t t he requ i red d i s in fec t i on i s provided. However, t h i s r e s u l t s i n much higher CTs i n the sumer than i s needed, which adds t o costs and possibly unnecessary increased production of d is in fec t ion by-products. The fol lowing example out l ines one scenario f o r which t h i s would apply. . .
ExamPle ' A u t i l i t y d i s i n f e c t s w i t h c h l o r i n e ahead o f a. rese rvo i r p r i o r t o
d i r e c t f i l t r a t i o n . The Primacy Agency may give a well-operated direct f i l t r a t i o n p l a n t c r e d i t for 2-109 Gfardfa cyst removal and 1- log v i rus removal. Therefore, 1-log Eiarm cyst and 3-109' v i rus inac t iva t ion through disinfection i s needed. For free chlorine, the CTs fo r 1 - log Giard ia cyst inact ivat ion exceed the CTs for 3- log v i rus inact ivat ion. Therefore, CTs for Eiardia cyst inact ivat ion are the control l ing CTs. The fol lowing water qual i ty condit ions occur in the reservo i r dur ing the year:
PH 7 - 7.5 temperature ( O C) 5 - 20 Chlor ine residual ( q / L ) 0.2 - 0.8
The required CT for chlorine increases with:, - i ncreasi ng n s i dual , .- - increasing pH, and
- decreasing temperature
n.. ,A
5- 18
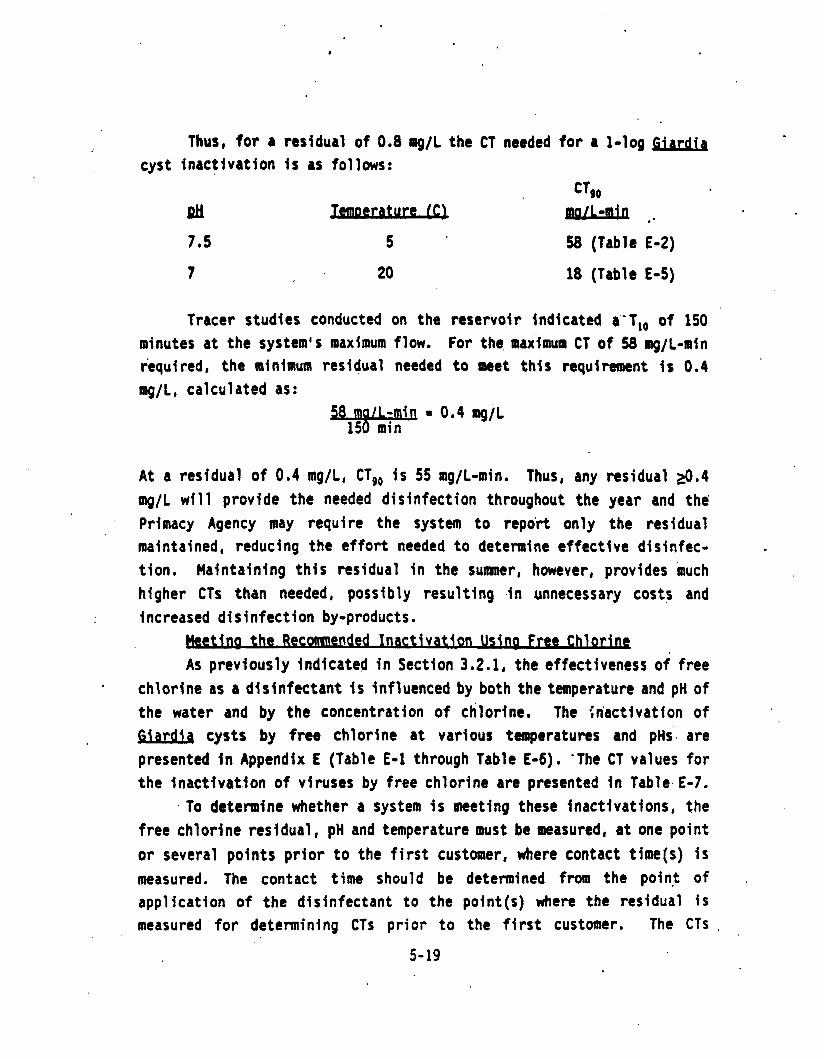
Thus, f o r a residual of 0.8 mg/L the CT needed cys t i nac t i va t i on i s as follows:
RH - 7.5 5
7 20
for a 1-109 g ia rd ia
CT90
ma/Llmin *. 58 (Table € 4 )
18 (Table € 4 )
Tracer studies conducted on the reservoir indicated a'-T,o of 150 minutes a t t he system's maximum flow. For the, maximum CT of 58 mg/L-min required, the minimum residual needed t o meet t h i s r a q u i m n e n t i s 0.4 q / L , calculated as:
58 m8LL- = 0*4 laoiL mi
15 rnin
A t a residual of 0.4 mg/L, CT,, i s 55 arg/L-min. Thus, any residual s.4 mg/L will provide the needed disinfection throughout the year and the' Primacy Agency may require the system t o repo'rt only the residual maintained, reducing the effort needed t o determine e f fec t i ve d is in fec- t ion. Mainta in ing th is res idual in the suamer, however, provides much higher CTs than needed, possibly resul t ing . in unnecessary costs and increased disinfection by-products.
e t m t h e R e c w n d e d I n a c t i v a t i o n UsQa f ree C h l o r a As previously indicated in Sect ion 3.2.1, the effectiveness o f f r e e
* ch lor ine as a d is in fec tan t i s influenced by both the temperature and pH o f the water and by the concentrat ion of chlorine. The h 'ac t i va t i on o f m r d i g cysts by f ree ch lor ine a t var ious temperatures and pHs.. are presented i n Appendix E (Table E-1 through Table €06). 'The C f values f o r the inact ivat . ion o f v l ruses by f r e e ch lor ine are presented i n Table. €07.
. To determine whether a system i s meeting these inactivations, the f ree chlor ine residual , pH and temperature must be measured, a t one point or several points prior t o t h e first customer, where contact time(s) i s measured. The contact time should be appl icat ion o f the d is in fec tan t to the measured f o r determining CTs p r i o r t o
5-19
determined from the po int of point(s) where the residual is the first customer. The CTs .

c
actually achieved in the system should then be compared to the values in the table for the pH and temperature of the water at the point(s) of residual llcasurment. Guidance on calculating the Cf for chlorine is presented in Section 3.2.1.
e t b the R e c m c t i v a t i o n Usirlg Chlorine DfoxiQp CT Values for the inactivation o f cysts by chlorine dioxide
are presented in fable E-8 and the CT values for the inactivation of viruses are presented in fable E-9. As shown in fables € 4 and E-9, the *
only parameter affecting the CT requirements for chlorine dioxide is temperature. However, the disinfection efficiency of cblorine'dioxide may be significantly 'increased at higher pHs. Since the CT values in fables E-8 and E-9 were based on data at pH 7 and 6, respectively, and chlorine dioxide appears to be more effective at higher pHs, systems with high pHs may wish to demonstrate that Cf values lower than those presented in Tables €08 and E-9 may achieve the desired level of inactivation.
Chlorine dioxide residuals are short-lived. Therefore, sampling and residual analysis at various points in the treatment process downstream of. the point o f application may be necessary tcr establish the last point at which a residual is present. Subsequent sampling and resjdual analyses conducted upstream of this point can be used to determine the CT credit by using the demonstrated detention time between the point of application and the sampling location. Methods for calculating CT values are presented in Section 3.2; Systems using chlorine dioxide may conduct pilot studies to demonstrate effective disinfection in lieu o f calculating C f , o f for determining that lower Cf values than those in Appendix E are appropriate. Gui'delines for conducting these studies are presented in Appendix G.
u s i w CT values for the inactivation of Giardia cysts by ozone are.
presented i n Table E-10 for various temperatures and inactivation rates. As indicated ,in this table, the CTs required for inactivation with ozone are substantially lower than those required for f ree chlorine. Th'iS
reflects the fact that ozone is a more pwerfu.1 disinfectant. The CT requirements for inactivation of viruses using ozone are presented i n fable E-11. In cases where 'only a 1-log or lower G i b cyst inactiva- tion 1s needed, the CT values for virus inactivation may be higher than
5-20
r"
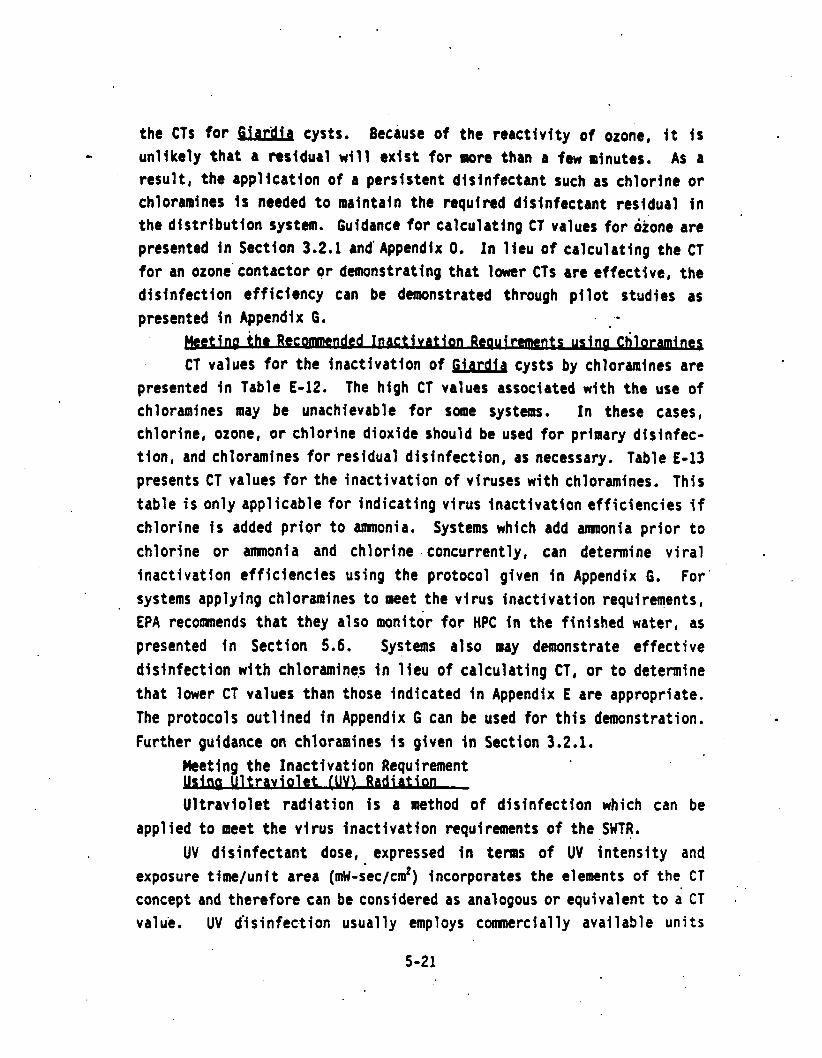
the C f s f o r s x b cysts. Because o f t he reac t i v i t y of ozone, i t i s
resu l t , the appl icat ion o f a pers is tent d is in fectant such as ch lor ine or chloramines i s needed t o maintain the required disinfectant residual i n the d is t r ibu t ion system. Guidance fo r ca lcu la t ing CT values for &ne are presented i n Section 3.2.1 and' Appendix 0. I n l i e u of ca lcu lat ing the cf for an ozone contactor or demonstrating tha t lower CTs are effect ive, the d is in fect ion e f f ic iency can be demonstrated through p i l o t s tud ies as presented i n Appendix G . . .
R e c w In(LI2flvation R e a u i m t s u s f w C h l m CT values for the inact ivat ion o f cysts by chloramines are
presented i n Table E-12. The high CT values associated with the use of chloramines may be unachievablc f o r some systems. I n these cases, chlorine, ozone, or chlor ine d ioxide should be used for primary disinfec- t ion, and chloramines for res idual d is in fect ion, as necessary. Table E-13 presents CT values for the inact ivat ion o f viruses with chloramines. This tab le i s only appl icable for indicat ing v i rus inact ivat ion ef f ic iencies if c h l o r i n e i s added p r i o r t o amnonia. Systems which add amnonia p r i o r t o chlor ine or amnonia and chlor ine .concurrent ly, can determine v i r a l inact ivat ion e f f ic ienc ies us ing the protocol g iven in Appendix G . F o r ' systems applying chloramines t o meet the virus inactivation requirements, EPA recomnends that they also monitor for HPC i n t he f i n i shed water, as presented i n Section 5.6. Systems also aay demonstrate e f fec t i ve d is in fec t ion w i th chloramines i n l i e u o f c a l c u l a t i n g Cf, or t o determine tha t lower CT values than those indicated i n Appendix E are appropriate. The protocols out l ined in Appendix G can be used f o r t h i s demonstration. . Further guidance on chloramines i s given i n Section 3.2.1.
). un l i ke l y t ha t a residual nil 1 e x i s t f o r more than a fw minutes. As a
Meeting the Inac t iva t ion Requirement
U l t r a v i o l e t r a d i a t i o n i s a method o f d i s in fec t i on which can be app l ied to meet the v i rus inac t iva t ion requirements o f the SWTR.
UV d is in fec tan t dose, expressed i n terms of UV i n tens i t y and exposure time/unit area (aW-s&cm*) incorporates the elements of t h e CT
concept and therefore can be considered as analogous or equivalent t o a CT . '
value. UV d3sinfect ion usual ly employs commercially avai lable units
U l t r a v i o l e t fUVWRadtatlon . .
5-21

designed t o d e l i w doses Of 25 t o 35 nW-rec/cd. The dose can be c increased by reducing water flow rate and/or by adding addi t ional un i ts i n
series. UV dis in fect ion e f f ic iency d i f fers from that of chemical d is infectants in' tha t I t i s not affected by water temperature. uv radiat ion does not ef fect ively penetrate sol ids and i s absorbed by"certain
' dissolved substances. Therefore, t u r b i d i t y and other ,water qual i ty factors are important determinants of UV disinfection eff iciency, and uv should be app l ied a f te r ' tu rb id i ty removal.
CT values fo r the inac t iva t ion of cysts by UV are not included i n Appendix E. The resu l t s o f tw studies (Ric'a and' Hoff, 1981; Carlson a l l 1985) indicate that Giardia cysts are extremely resistant t o i nac t i va t i on by UV with doses greater than- 60 Rlw-sec/cd causing less than 80% inact ivat ion. Because UV appears t o be very ineffective for
cyst inact ivat ion and i n the absence o f su f f i c i en t da ta showing the doses needed t o i n a c t i v a t e 0.5 t o 3.0 logs of cysts, UV must be used i n combination wi th other d is infectants to provide evidence of effect ive cyst inact ivat ion.
Table E-14. Units used f o r UV disinfection should be equipped w i t h f a i l - safe devices tha t will provide automatic shutdown o f water flow i f UV dose +
decreases t o l e v e l s lower than those specified i n Table E-14.
i
.*
4
CT values fo r the inac t iva t ion o f v i ruses by UV are presented i n .
_ . .&.
I. et ina the I n u t i v a t i o n R e w n t U s u Alternate Dis infectants For system using disinfectants other than chlorine, chloramines,
chlor ine d ioxide, or ozone, the effect iveness of the disinfectant can be demonstrated using the protocol contained i n Appendix G. The protocol i n Appendix 6.3 fo r ba tch tes t ing should. be followed for any. dis infectant which can be prepared i n an aqueous solut ion and will be stable throughout the test ing. For dis in fectants which are not stable, . the p i lot study. protocol outl ined i n Appendix 6.4 should be followed.
"- - I
ICs for Determinina the D i s i n f e a o n t o be Provided
1) Becommended 0.5 109 G .. iardia. 2-loa Virus Inactivation ... A comnunity o f 70,000 uses a r i v e r as i t s d r i n k i n g water source. .' '
Oronation p r i o r t o a conventional treatment plant i s used t o t r e a t t h e
5-22
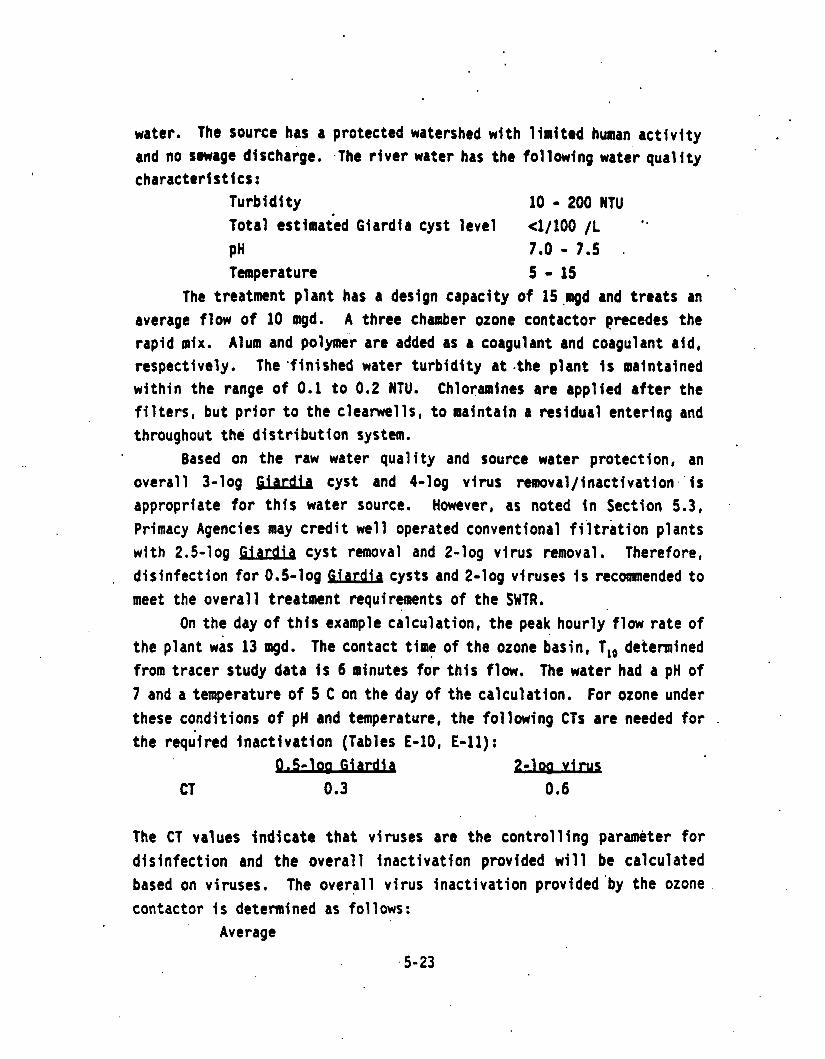
and no sewage discharge. .The river water has the characterfrtics:
Turbidi ty Total estimated Giardia cyst level PH Temperature
water. The source has a protected watershed with limited human activity fol lowing water qual i ty
10 - 200 NTU <1/100 /L 0 .
7.0 - 7.5 . 5 - 15
The treatment plant has a design capacity of 15 .mgd and treats an average flow of 10 mgd. A three chamber ozone contactor precedes the rapid mix. Alum and polymer are added as a coagulant and coagulant aid, respectively. The 'finfshed water turbidity at .the plant i s maintained within the range of 0.1 to 0.2 NTU. Chloramines are applied after the filters, but prior to the clearwells, to maintain a residual entering and throughout the distribution system.
Based on the raw water quality and source water protection, an overall 3-109 Eiardin cyst and 4-log virus remval/inactivation.'is appropriate for this water source. However, as noted in Section 5.3, Primacy Agencies may credit well operated conventional filtration plants with 2.5-109 Giardia cyst removal and 2-109 virus removal. Therefore, disinfection for 0.5-1og Eiardb cysts and 2-log viruses is recommended to meet the overall treatment requirements o f the SWTR.
On the day of this example cdlculation, the peak hourly'flow rate of the plant was 13 mgd. The contact t i e o f the ozone basin, f,, determined from tracer study data is 6 minutes for this flow. The water had a pH of 7 and a temperature o f 5 C on the day of the calculation. For ozone under these conditions of pH and temperature, the following CTs are needed for . the required inactivation (Tables € 4 0 , E-11): - Gi a r d b vi r u
CT 0.3 0.6
The C f values indicate that viruses are the controlling paramkter for disinfection and the overall inactivation provided will be calculated based on viruses. The overall virus inactivation provided'by the ozone contactor is determined as follows:
Average 5-23

1 ' 0.1 2 0.2 0.9 2
0.22 0.2 2 0.4 0.9 0.44
3 0.2 2 0.4 0.9 '0 . 44
The sum o f CT,,,,/CT,,,, i s 1.1. This corresponds t o w r e than a 3-109 v i rus inac t iva t ion determined as 3 X CTC,,,/CTg9,, 3 X 1.1 0 3.3-109. Therefore, *
the system exceeds the reconmended inact ivat ion.
2) 0 d i a Cvst. 2-loa Virus Ippttivattm
A 2 MGD slow sand f i l t r a t i o n p l a n t t r e a t i n g r e s e r v o i r water, fed by mountain streams w i th no nearby wastewater discharges, provides drinking water for a comnunity of 8,000 people. The water qua l i t y a t the in take has the fo l lowing water qual i ty character ist ics:
Turb id i ty 5 - 10 NTU
Total estimated Giardia cyst level ' <1/100 L
Temperature 5 - 1 5 C
rc Total col i forms Not measured
PH 6.5 - 7.5 .
-\* '6-
The f i l t e r e d water turb id i ty ranges from 0.6 - 0 . 3 NTU. Considering the source water qua l i t y and p lan t per fmance, an overal l 3- log Giardia cyst and +log virus rcmoval/ inactivation i s considered suff icient for t h i s system. As noted i n Section 5.3, the Primacy Agency may c red i t slow sand p lants wi th 2-log a a r d i q c y s t and 2-109 virus ranoval. Therefore
' d i s in fec t i on f o r 1 - l og ga rd ig cys t and 2-109 v i r u s i n a c t i v a t i o n i s recomnended fo r the system t o m e t t h e o v e r a l l t r e a t m e n t requirements. .
Chlorine i s added pr io r to the c learwe l ls to p rov ide d is in fec t ion . The c'learwells have a capaci ty of 80,000 gallons. A one mile, 16-inch transmist ion' iain transports the water frm the t reatment p lant to the f i r s t customer. Ttie inact ivat ion provided i s detennined d a i l y f o r t h e peak hourly flow conditionsr Tracer studies .have been conducted t o determine the T,, for t he c lea rwe l l s f o r d i f f e ren t flow rates. For the purposes of calculating the inactivation the system i s divided into huo sections.
./ ..-
Section 1 - clearwel l
5-24

Section 2 - transmission main The f lowrate a t peak hourly flow from the c l e a k l l was 1.5 mgd on
the day o f t h i s example. A t th is f lowrate, the T,, o f t he c lea rwe l l i s 67 minutes, as detennined from the results of the tracer studies. A t t h i s flowrate, water travels through the transmission main a t 99 f t / m h . The
.. data f o r the ca lcu la t ion o f the inac t iva t ion i s as follows:
sasmLl SssmLZ length of p ipe ft) contact t ime (la 1 n)
P i PC bas i n t o t a l
d is in fectant residual (mg/L) temperature C
PH
0 5280
0 67
53 - 0
...
67 55 . ch 1 o r i ne chlor ine
1 .o 0.6 5 5
7.5 7.5
For free chlorine, a 1-log Giardia cyst inactivation provides greater ' than a 4- log v i rus inact ivat ion; therefore, Giard ia cyst inact ivat ion is the con t ro l l i ng parameter, and the inactivation provided' i s determined based on Giard ia cysts. The'calculat ion i s as follows:
Section 1 - Chlorine
CTCaIc - 1.0 mg/L x 67 minutes (I 67 mg/L-min
CT,, I J C f 9 9 . 9 - c t i o n 7 - Chlorine
CT,,,, = 0.6 ag/L X 53 minutes = 32 mg/l-rain .
From Table E-2, a t a temperature of 5 C and a pH of 7.5, CT,,,, i s 171 ag/L-nin
The sum o f CT,,,,/CTQQe, i s equal t o 0.56. This i s equiva lent to a 1.7-log a a r d i q c y s t i n a c t i v a t i o n determined as 3-log x. CT,,,,/CT,,., (I 3 x 0.56 =
5-25

. 1.7-logs. Therefore, the system exceeds i w e t the overall treatment requinments.
the d is infect ion reconmended t o
3) . -dia - Qst.' 4 0 loa Virus Inact ivat iqp A C m n i t y of 30,000 people uses a reservoir t reated by d i r e c t
f i l t r a t i o n f o r i t s water supply. The reservoir i s fed by a r i v e r which receives the discharge from a wastewater treatmcnt plant 10 miles upstream of the reservoir . The reservoir water qual i ty i s as follows:
t u r b i d i t y 5 - 15 NTU Total col i forms 100 - looo/loo ml - Total est imated Giardia cyst level 5/100 L
Temperature 5 - 1 5 c Based on the source water qua l i t y , an overal l rcmoval/ inactivation
o f 4-109 Giardia cyst and 5-109 v i r u s i s tccomacnded as o u t l i n e d i n
The source water flows by gravi t y t o a 3 l#i storage reservoir pr ior t o pumping t o t h e water treatment plant. Chloramines are, produced by f i r s t adding chlorine .then amnonia t o t h e water w i th in t he i n le t of the storage reservoir. Chlorine dioxide i s added to t he f i l t e red wa te r p r i o r t o the clearwells. Chloramines are appl ied after the clearwells . to maintain a residual i n t h e d i s t r i b u t i o n system. The system design flow 'is 8 mgd with an average f low of 5 mgd. For the ca lcu lat ion o f the overa l l inact ivat ion, the system i s d i v i d e d i n t o 2 sections. .
Section 1 - the storage reservoir and the transmission t o t h e treatment p l ant
Section 2 t h e c l e a r m l l s
The overa l l i nac t i va t i on f o r t he system i s computed d a i l y a t t h e peak hourly flow conditions. The pH, temperature, and dis infectant residual i s measured a t the end o f each sect ion pr ior to the next point of d is infectant appl icat ion and t h e f i r s t customer.. The flow i s measured i.n the transmission main enter ing the p lant and exi t ing the c leatwel ls. On the day of t h i s example calculat ion, the peak hourly flow was 6 ragd i n t h e transmission mains entering and leaving the plant. If the flowrates were
. different, the f,, corresponding to the respective f lowrate would be used
PH 6 - 7
s Section 4.4.
.. .
5-26
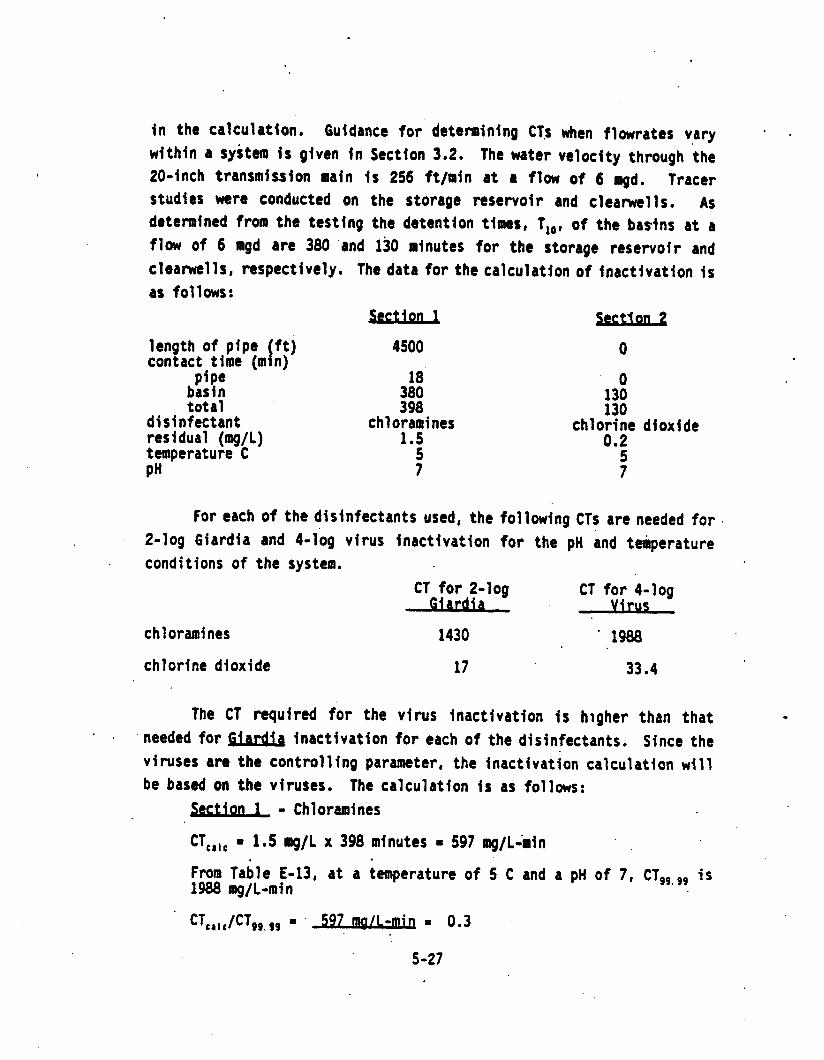
i n the calculat ion. Guidance for detemining CTS when flowrates vary w i th in a system i s given i n Section 3.2. The water velocity through the 20-inch transmission main i s 256 ft/min 8 t a flow of 6 mgd. Tracer studies were conducted on the storage reservoir and clearwells. As determined from the test ing the detent ion t imes, TL0, o f the basfns at a flow o f 6 rngd are 380 'and 130 minutes for the storage reservoir and clearwells, respectively. The da ta fo r the ca lcu la t ion o f inac t iva t ion i s as follows:
length of pipe ft) contact time (m I n)
P i PC basin t o t a l
d is in fectant residual (mg/L) temperature C PH
4500
la 380 398
chl otami nes 1.5
5 7
0
0 130 130
0.2 5 7
chlor ine d iox ide
For each of the d is infectants used, the fo l lowing CTs are needed for 2-log Giardia 8nd 4- log v i rus inact ivat ion for the pH and temperature
. conditions o f the system. CT fo r 4 - log
Virus
chloramines 1430 . 1988
chlor ine d ioxide 17 33.4
The CT requi red for the v i rus inact ivat ion i s hrgher than that - . needed for Wardiq i nac t i va t i on f o r each o f the disinfectants. Since the
v i ruses are the cont ro l l ing parameter, the inact ivat ion ca lcu lat ion will be based on the viruses. The c a l c u l a t i o n i s as follows:
-ion 1 - Chloramines
CT,,,, = 1.5 q / L x 398 minutes = 597 ag/L-min
From f ab le E-13, a t a temperature o f 5 C and a pH o f 7, CT,,, 99 i s 1988 rag/L-min
5-27

.
1988 arg/L-min
*tion, - Chlorine Dioxide
CTctlc = 0.2 mg/L x 130 minutes = 26 nrg/L-min
From Table E-9, a t a temperature o f 5 C and a p~ of 7, CT,,.,, i s 33.4 mg/L-mi n
CTcr,c/CT99,99 = 26 ma/L-min 0.78 33.4 mg/L-min
The sum of CTc,,c/CT99,99 i s equal t o 1.08, which i s equivalent to 8 4.3-109 inact ivat ion o f viruses, determined as follows:
x 4-log x. CTcaIc - 4 x 1.08 = 4.3-logs CT99.99
Therefore, the system prov ides su f f i c ien t d is in fec t ion to met the overa l l * recomnended treatment performance.
+ 5.6 g t h r r C-ationt Monitoring for heterotrophic plate count (SIPC) bac te r ia i s no t ..
.. operational tool for: -' - Measuring microbial breakthrough i 7:- " S
required under the SWTR. However, such monitoring nay"provide .a good
- Evaluating process modif icat ions .,> 1 ,
- Detecting loss o f water main i n t e g r i t y
- Detecting bacterial regrowth condit ions within the distr ibu-
- Detennining interference with the col i form measurtrafnts ( A H A ,
t i o n system
1987)
Therefore, EPA recoamends rout ine monitor ing for HPC i n t h e p l a n t eff luent and wi th in the d is t r ibut ion systea whenever the analy t ica l capabi 1 i t y i s a v a i l a b l e in-house or nearby. Systems which. do nut have th i s capab i l i t y should consider using a semi-'quantitative bacterial water sampler k i t , although t h i s is not acceptable f o r compliance monitoring.
. 5-28

.
As discussed In the preamble to 'the SWTR, €PA believes that it is inappropriate to include HPC as a treatment performance criterion in the rule since smatl systems would not have in-house analytical capability to
' conduct the acasurcrpent, and they would need to send the rmples to a private' laboratory. Unless the analysis i s conducted rapidly, .HPC may multiply and the results may not be representative.
entering the distribution systela and levels of less than SOO/rnl throughout '1
the distribution system. .I
uionellq is another organism which is not i.ncluded as- a treatment performance criterion. Inactivation information on u e l l q is limited. €PA bel ieves that treatment which compl its with the SWTR will r a v e and/or inactivate substantial levels o f which might occur in source waters, thereby reducing chances that &ionrllq will be trans- ported through the system and reducing the possibility that growth might occur in the distribution systm or hot water systems within homes and institutions. Since w e l l p are similar in size to coliform organisms, removals by filtration should .be similar to those reported for total coliforms. In addition, the available disinfection infomation indicates that the C t requirements for inactivation o f JSQionellq are lower than those required for the inactivation of m r d i & cysts. EPA recognizes, that regardless of the treatment provided, $'me w n e l l a may enter plumbing and air conditioning systems and subsequently multiply (Muraca et al., 1986) * EPA believes that these concerns are best addressed through guidance contained in Appendix B.
8 €PA reconnrcnds an HPC level of less than 10/ml in the finished water
5-29

6.1 Reportin! Requirements for Public Water Systems t Prov dina Filtration
The SWTR requires unfiltered systms to prepare monthly reports for the Primacy Agency to determine compliance with the requirements for: - source water fecal and/or total colifona levels - source water turbidity levels - disinfection level - disinfectant residual entering the distribution -system . - disinfectant residuals throughout. the distribution system.
..
The monthly reports must be prepared and submitted to the Primacy Agency within 10 days after the end of the month. The utility must maintain a daily or monthly data log used to prepare the monthly reports. Tables 6-1 through 6-5 are examples of daily data sheets which the utilities may find useful for 'logging the data needed to prepare reports
Table 6-6 presents a concise format which can be used by the system' for the monthly reports to the Primacy Agency. Tab1,es 6-3 and 6-4 must also be submitted with the lnonthly report. After the initial 12 months of reporting, the Primacy Agency slay nmove the requirement for reporting the information contained in Table 6-3 if it is satisfied' .that the system is computing compliance with the CT requirements correctly. . The
. indfvidual sample results sumnarired in the monthly reports should be kept on file at the utility for a minimum o f 5 years. . .
In addition to the monthly reporting requirements for source water qualfty conditions and disinfection iniormation, systems with unfiltered ' supplies are also required t o submit annual reports for the watershed control program and the on-site inspection, within 10 days after the end of the federal fiscal year.
The Primacy Agency will review the reports' to determine whether the system is in 'compliance. A possible report format for the watershed control program is:
. for the Primacy Agency.
6-1
1.
2. *
3.
Sunmarite a l l a c t i v i t i e s i n the watershed(s) for the previous year.
I d e n t i f y a c t i v i t i e s or s i tuat ions of actual and po ten t ia l concern i n the watershed(s) . Describe how t h e u t i l i t y i s proceeding t o address a c t i v i t i e s creating potent i a1 heal th concerns .
EPA reconmcnds tha t the Primacy Agency submits the annual watershed repor ts to the S ta te Water Qual i t y Managers. The reports ni 11 .- be' useful i n updating statewide assessments and management programs. -
the SWTR requires each system t o provide the Primacy Agency witti a report o f the on-site inspection unless the inspection i s conducted by the Primacy Agency. €PA suggests that :
1. A report of the inspect ion containing the f indings, suggested improvements and dates by which t o complete improvements i s
how system has resolve B problems iden t i f i ed i n t he p rev ious report should also be included.
: t o be prepared f o l l o w i n t h e i n i t i a l system review. When and
-..- I
*
2. t o lessen the burden on u t i l i t i e s , a report containing resul ts , -.
of the general survey should be submitted i n subsequent years. ..d
I n a d d i t i o n t o these reporting requirements, the SWTR requ i res ' tha t the report ing requirements of the Total Trihalorrrethane Regulation and the c - Col i f o m Rule also be met .
Records o f waterborne disease outbreaks also must be maintained. I n t h e event o f a waterborne disease outbreak, as defined i n p a r t 141.2
' o f t h e SWTR, t he Primacy Agency must be n o t i f i e d by the end of the next
-I< -.
business day . the repor t . - o f the outbreak should contain: 1. Oate o f occurrence 2. '.. Type o f i l l n e s s 3. Number o f cases 4. System cond i t ions a t the time o f t h e outbreak, including
d is in fectant res iduals , pH, temperature, t u r b i d i t y , and bacter io log ica l resul ts .
The records of an outbreak should be maintained permanently or u n t i l f i l t r a t i o n i s i n s t a l l e d .

6.2 m o r f i n a Re- for Public Water Svstm Usina F i l t r a t b
The SWTR requires f i 1 tered water systems t o submit mnth ly repor ts t o t h e Primacy Agency for determination o f compliance with the .require- ments for:. - treated water tu rb id i t y - d is in fectant res idual cnter in the d is t r ibut ion system - disinfectant residuals throug 51 out the d is t r ibut ion system
. - Tables 6-7 and 6-8 present a fonaat which t h e u t i l i t y can use as a da i l y 'data log and t o submit monthly repor ts to the.Priaracy Agency.
a Not Rcauired bv the S U R The Primacy Agency may a1 so want fi 1 tered water systems to repor t
some information associated with reconmendations made i n t h i s manual which are not requirements of the SWTR. €PA recomnends tha t . f i l te red water sys t ms :
1. Report the log inact ivat ion of w r d i q cysts and viruses, required by the Primacy Agency.
2. Report point of app l i ca t ion fo r a l l d is in fec tan ts used.
3 . Report the daily CT(s) used t o calculate the log inact ivat ion of cysts and viruses.
4. I f more than one d i s in fec tan t i s used, report the CT(s) and inact ivat ion(s) achieved for each dis infectant and the to ta l percent inactivation achieved.
5. Note any dif ference between the measured .CT(s) and the CT requ i red to met the overa l l minimum treatment perfomance
.- . . requirement specified by the Primacy Agency.
Tables 6-3 and 6-4 can be used t o maintain the records necessary for numbers 2 through 5.
This i n f o m t . i o n .can be used to detern ine the d is in fect ion leve l maintained by the system t o assure that the overal l rernoval/ inactivation required i s maintained.
,-...
The Primacy Agency may make provisions to minimize . the report ing requirements for systems w i th re rewo i r s , large amounts o f storage or long transmission mains h i c h provide a long dis infectant contact time. Since these systcpls t yp i ca l l y p rov ide i nac t i va t i on i n excess o f t ha t needed, the Primacy Agency may require the system only to report the r in iauim dai ly res idual a t the end of the d i i infectant contact t ime. The CT malntained can then be estimated based on th is res idua l and the contact time under the system design flow. t h i s method o f Ct determination will eliminate the need for t he system t o determine the contact t ime under w i m u m f l o w conditions each day.
. .-
,
c
6-4
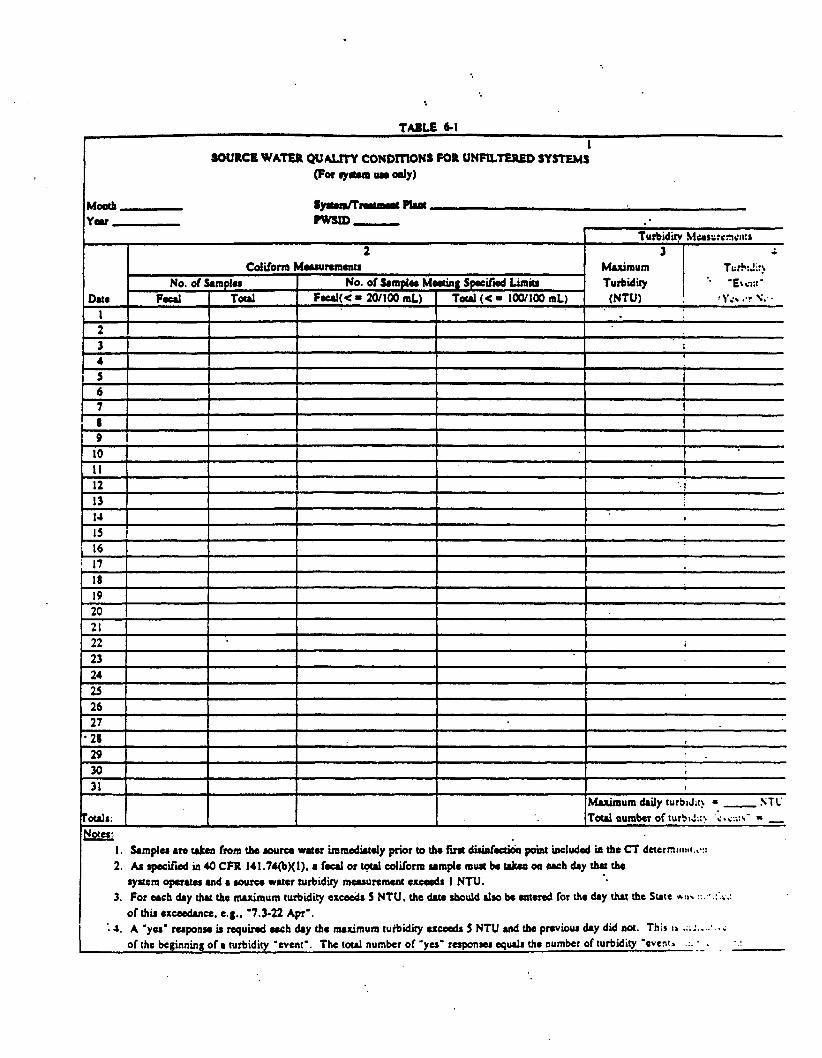
TADWE bl I I

. .

I 6. From Tlrblu 1.1 - 1.6.2.1. and 3.1.40CFR 141.74bx3).

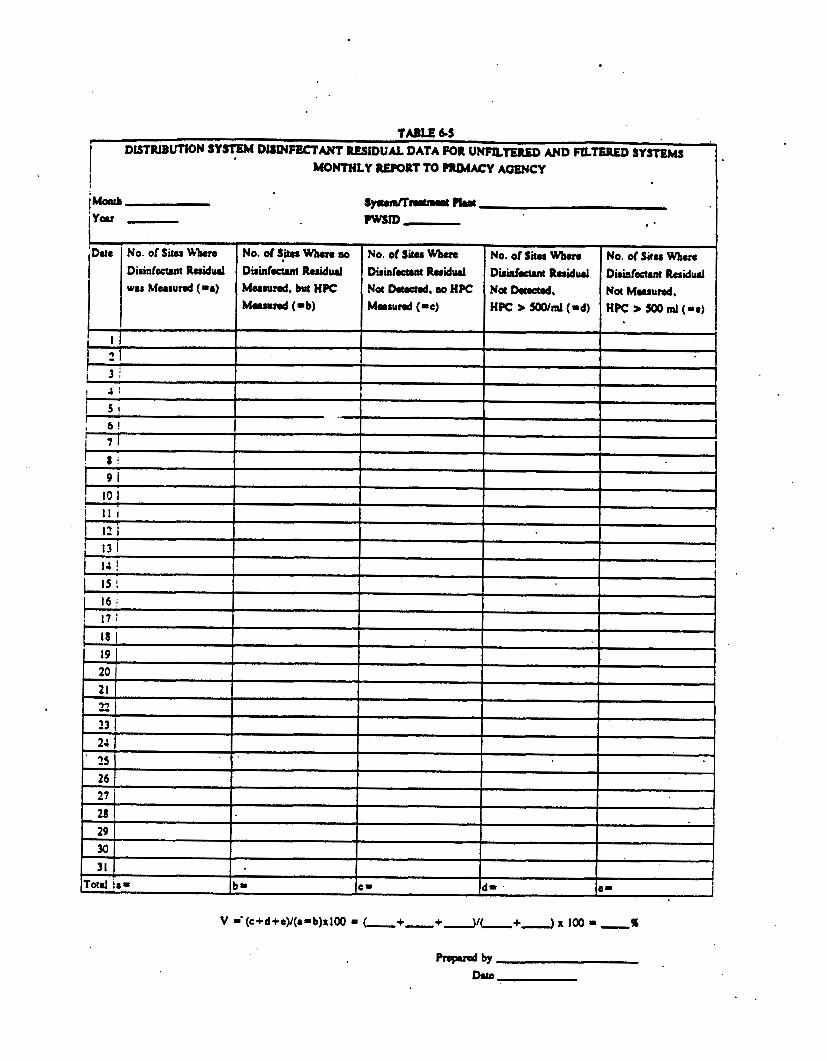

TABLE 6.6 MONTHLY REPORT TO P W Y AOWCY FOR !


>isinfation Performance Criteria 4. Pointof-Entry Minimum Disinfectant Rod4 Criteria
7.
7.1 B-W This section provides guidance on'when and how the requirements o f
the SWTR will go into ef fect , including determinat ions made by*Primacy Agenc i es . 7.2 SYSTEMS USING A SURFACE WATER SOURCE (NOT GROUND WATER
THE DIRECT INFLUENCE OF SURFACE WATER) The SOWA requires, wi th in 18 months following the prdmulgation o f
a ru le , that Primacy Agencies promulgate any regulat ions necessary t o implement that ru le . Under 51413, these rules must be a t l eas t as s t r ingent as those required by EPA. Thus, Primacy Agencies awst promulgate regulations which are a t l eas t as s t r ingent as the SWTR by December 30, 1990. By Oecember 30, 1991, each Primacy Agency must determine which systems will be r e q u i r e d t o f i l t e r . I f f i l t r a t i o n i s required, it must be i n s t a l l e d w i t h i n 18 months following the determina- t i o n o r by June 29, 1993, whichever i s l a t e r . I n . cases where it i s n o t . f e a s i b l e f o r a system t o i n s t a l l f i l t r a t i o n i n t h i s t i m e p e r i o d , t h e Primacy Agency cay a l low an exemption t o extend the time period (see Section 9) .
I f a Primacy Agency f a i l s t o comply wi th th is.schedule for adopting
comply wi th the nobject ive" or sel f - implement ing cr i ter ia (i.e., the requirements tha t a re c lea r on the face o f t h e r u l e and do not requi re the exerc ise o f Pr imcy Agency discret ion). Unf i l tered suppl ies must comply beginning December 30, 1991 and f i l tered suppl ies beginn ing June 29, 1993.
Monitor ing requirements for unf i l tered systems must be, act beginning December 30, 1990 unless the Primacy Agency has already determined that f i l t r a t i o n i s necessary. This coincides with the Agency's requirement t o
. promulgate regulat ions ' for making f i l t r a t i o n d e c i s i o n s by that date under the SOWA. Primacy Agencies may specify which systems should conduct the monitoring necessary t o demonstrate compliance w i t h t h e c r i t e r i a for avo id ing f i l t r a t i on . For some systems where an h i s to r i ca l da ta base ex is ts , and where i t i s apparent that the system would exceed the source
t h e c r i t e r i a and applying them t o determine who m u s t ' f i l t e r , systems must
7 - 1

. (-3 water q u a l i t y C r f t e r i d (or tha t some o the r c r i t e r i a would not be met, such
as an adequate watershed control program) , no monitoring may be necess.ary f o r t h e Primacy Agency t o determine t h a t f i l t r a t i o n i s required. If a par t i cu la r system (and/or the Primacy Agency) knows tha t i t cannot meet t h e c r i t e r i a for a v o i d i n g f i l t r a t i o n , ' t h e r e i s no reason t o r e q u i r e t h a t system t o conduct the source water monitoring prior t o t h e formal decision by the Primacy Agency t h a t f i l t r a t i o n i s required. This i s t rue because the only purpose of that monftoring would be t o demonstrate whether or not t h e c r i t e r i a t o avo id f i l t ra t ion a re be ing met. ..
In reviewing the data for detennining which systems must f i l t e r , t h e . Primacy Agency will have t o decide on a case-by-case basis the condit ions
which will requ i re f i l t ra t ion . For example, a system may n o t m e t t h e speci f ied CT requirements f o r t h e f i r s t few months of woni tor ing and upgrades i t s d i s i n f e c t i o n t o meet the CT requirements i n subsequent months. I n t h i s case, the Primacy Agency could conclude that the system will be a b l e t o meet t h i s c r i t e r i o n f o r a v o i d i n g f i l t r a t i o n . The time p e r i o d s s p e c i f i e d f o r i n t h e c r i t e r i a t o a v o i d f i l t r a t i o n (e.g., s i x months for total col i forms, one year and ten years fo r tu rb id i ty and one year for CT requirements) do no t beg in un t i l December 30, 11991 unless the *
Primacy Agf-cy specifies an e a r l i e r date.
specif ied i n 5141.71(a) and (b) and the requirements o f S141.71(c) and '
S141.72(a) go i n t o e f f e c t unless the Primacy Agency already has determined .
tha t f i l t ra t ion i s requ i red . Beg inn ing December 30, 1991, . i f a system . . f a i l s t o meet any one o f t h e c r i t e r i a f o r a v o i d i n g f i l t r a t i o n , even if the
system were m e t i n g a l l t h e c r i t e r i a up t o t h a t p o i n t , i t must i n s t a l l f i l t r a t i o n and comply w i th the requirements f o r f i l t e r e d systems includ- ing the general requirements i n 5141.73 and the disinfection requirements i n S141.72(b), w i t h i n 18 months o f the fa i lu re . Whenever a Primacy Agency de tern ines tha t f i l t ra t ion i s requ i red , it may Specify in ter im requi te-
Fo l low ing the de termina t ion tha t f i l t ra t ion i s requ i red , the system
Beginning December 30, 1991 the requirements f o r a v o i d i n g f i l t r a t i o n
. Mn tS , f o r t he pe r iod p r i o r t o i ns ta l l a t i on o f f i l t r a t i on ' t r ea tmen t . '
c must develop a p l a n t o implement i t s i n s t a l l a t i o n . The plan must include considerat ion for the fo l lowing:
7 - 2
0 Providing uninterrupted water service throughout the transition period
- . Siting for the future facility . 0 Financing optjons and opportunities
. - Scheduling of design and construction
Systems which are unable to install filtration within the specified time frame may apply for an exemption t o extend the period for. installing filtration,
Table 7-1 sumnarizes the requirements for the SWTR. for unfiltered systems noting conditions which require the installation of filtration. It is important to note thatonly treatment technique violations trigger the' requirement to install filtration while violations of monitoring, reporting or analytical requirements do not. The monitoring requirements for unfiltered supplies are presented in Section 3 and the reporting requirements are presented in Section 6.
All systems with filtration in place must meet the treatment technique requirements specified in 5143.73 (filtration criteria) and
' S141.72(b) (disinfection criteria), and the monitoring and reporting, requirements specified in S141.74(c) and S141.75(b) , 'respectively, beginning June 29, 1993. Table 7-2 sumnarites 'the SWTR requirements for filtered systems, including conditions needed for compliance with treatment requirements. Monitoring requirements for filtered supplies are enumerated in Section 5 and reporting requirements are presented in Section 6.
7.3 liance Transition with Curent NPDWR Turbiditv m u i r e m w . The current (interim) NPDWR for turbidity under 5141.13 (MCL
requirements) and 5141.22 (monitoring requirements) will apply for unfi 1 tered systems until December 30, 1991. unless the Primacy Agency determines that filtration is required. In cases where filtration is re'-
is installed, whichever is later. Unfiltered supplies will also be . quired, the interim NPDWR applies until June 29, 1993 or until filtration
7 - 3

f-3 (. : subject to the turbidity monitoring requirements of $141.74(b) (2) beginning OeCembtt 30, 1990 coincidently with the Interim requirements. Beginning June 29, 1993, the turbidity performance criteria for filtered systems (S141.73), and the monitoring requirements under 5141.74 will apply* .
7.4 Systems Using a Ground Water Source der the Direct Influence of Surface Water
t Part of the Primacy Agency's program revisions to adoet the SWTR
must include procedures for determining, for each. system in' the Primacy Agency served by a ground water source, whether that source is under the direct influence of surface water. 0y June 29, 1994 and June 29, 1999, each Primacy Agency must determine which coamunify and non-comnunity public water supplies, respectively, use ground water which is under the direct influence of surface water. EPA recomnrends that these determina- tions be made in conjunction with related activities required by other regulations (e.g., sanitary surveys pursuant to the final coliform rule, vulnerability assessments pursuant to the volatile organic chkicals rule, the forthcoming disinfection requirements for ground water systems) In
* add.ition, €PA-approved wellhead protection programs required under the Safe Drinking Water Act Section 1428 may contain methods and criteria for deteming zones of contribution, assessments o f potential contamination,. and management of sources of contamination. These programs may be used as a partial basis for the vulnerability assessment and for making the .
determination of (a) whether a system i s under the direct influence of surface water and (b) if direct influence is determined, whether there is adequate watershed control to avoid filtration. Guidelines for developing and implementing a wellhead protection program are found in "Guidelines for Applicants for State Wellhead Protection Program Assistance Funds under the Safe Drinking Water Act" (U.S. EPA, 1987a).
A system using a ground water source under the influence of Surface water that does not have filtration in place must begin Inonitorin9 and reporting in accordance with S141.74(b) and S141.75(a), respectively, to determine whether it meets the criteria for avoiding filtration beginning
. December 30, 1990 or six months after the Primacy Agency determines tha t .
. .
.7. - 4

U
W
c
8
n-
I Y
*.
3 ;.
I-
m
00
0
m-
-
'I 8 c
n
Y ...
..I
0
A
0
I
L
L
i
m
0
m
4
c

Y
cc
Y
0
I
e i
n
0
E' in
e
(L
o P :
w

rluNuml fillrrrd trppllra (S141.73)
r ) Crmrrrllrrrl r~ D l r a c t flllrrtlrr
1 IIU

P
N
rr
.L
m I
m
m
m '
a -

the ground water source i s under the influence of surface water, whichever i s l a t e r . W h i n 18 months following the determination that a system i s under thq inf luence of surface water, the Primacy Agency must determine, using the tam. c r i t e r i a t h a t a p p l y t o systems using a surface water‘ source, whether t h e tys.tem wst prov ide f i l t ra t ion t reatment .;e As for systems using a surface water source, the Priaacy Agency must evaluate the data on a case-by-case bas i s t o determine conditions which will t r i g g e r the need f o r f i l t r a t i o n .
Beginning Oeccaaber 30,1991 or 18 months after the determination that a system i s under the d i rec t in f luence o f sur face water, -whichever i s l a t e r , t h e c r i t e r i a f o r a v o i d i n g f i l t r a t i o n i n Sl41,71(a) and (b) and the requirements f o r u n f i l t e r e d systems i n Sl41.7l(c) and S141.72(a) go i n t o ef fect , unless the Primacy Agency has determined t h a t f i l t r a t i o n ’ i s required. As with systems using a surface water source, subsequent f a i l u r e t o comply w i t h any one of t h e c r i t e r i a f o r a v o i d i n g f i l t r a t i o n requi res the insta l la t ion o f f i l t ra t ion t reatment . Thus, beginning December 30, 1991 or 18 months a f t e r t h e Primacy Agency determines tha t a system i s using a ground water source under the d i rec t . in f luence o f surface water, whichever i s l a te r , a system which’ f a i l s t o meet any one o f t h e c r i t e r i a t o a v o i d f i l t r a t i o n m s t i n s t a l l f i l t r a t i o n and comply .
. with the requirements for fi 1 tered system wi th i0 18 months o f t h e f a i l u r e or by June 29, 1993, whichever i s la ter . As f o r u n f i l t e r e d systems, systems under the direct inf luence o f surface water may apply for an exemption t o ex tend t he t ime pe r iod f o r i ns ta l l i ng f i l t r a t i on .
Any system using a ground water source tha t the Primacy Agency deternines i s under the d i rect in f luence o f sur face water and that already has f i l t r a t i o n i n place a t the t ime o f the Primacy Agency determination must meet the treatment technique, monitoring and reporting requirements for f i t t enx i systems beginning June 29, 1993 or 18 months a f te r t he Primacy Agency determination, whichever i s la ter .
. .
.
. 7 - 5

7.5 RSSWSS for SvrtcRls not SWTR Cr i te r i a r" 7.5.1 I p t r o m Systks which present ly fa i 1 t o meet the SWfR c r i t e r i a may be able
. t o achieve compliance. The purpose of th is sect ion i s to pnsent 'opt ions
L
.t t o upgrade the system's design and/or operation and maintenance i n order
which may be fol lowed to achieve compliance.
7.5.2 &&@Not- 0 Systems not f i l te r ing nus t meet t h e c r i t e r i a t o a v o i d f i l t r a t i o n
beginning December 30, 1991 and on a continuing basis thereafter or i n s t a l l f i l t r a t i o n . Systems n o t f i l t e r i n g can be div ided in to two categories:
A. Those systems not current ly met ing the SWTR cr i te r ia bu t w i th t h e a b i l i t y t o upgrade t o w e t them.
8. Those systems not able t o !neet the SWTR c r i t e r i a by December 30, 1991. I f t he i ns ta l l a t i on o f f i l t r a t i on i s no t poss ib le by June 29, 1993 the system m y request an exemption and take in ter im measures t o provide safe water t o avoid v io lat ion of a treatment technique requi reutent . -
l e A - rise S i tua t ipn
W ~ Q : System i s not meet i n t h e source water fecal and f or t o t a l c o l i f o m concentrations but !l as not received judgment on the '
adequacy o f i t s watershed control.
- Uonitor for fecal col i forms rather than total .col i forms if t h i s i s n o t already done. fecal coliforms are a d i rec t ind ica tor o f feca l contamination where .total coliforms are not. I f t o t a l c o l i f o m l e v e l s are exceeded but fecal levels are not, the systew we ts t he c r i t e r i a .
- Take appropriate action i n the watershed t o assure fecal and total col i form concentrat ions are below the cr i ter ia , such as el iminat ion o f animal a c t i v i t y near the source water intake.
7 - 6

Candltlon: S y s t k lbeets the source water qua l i t y c r i t e r i a , ur tar thed control requirements, and i s Iraintaining a dis infectant res idual wi th in the d is t r ibut ion system, but i s not ab le to met the CT requirements due to lack o f con tac t t ime p r io r t o t h e f i r s t customer.
.
- Increase the appl icat ion of disinfectant while monitoring THM l e v e l s t o ensure they remain below the MCL. .-
- Add additional contact time through storage to ob ta in an adequate C t ,
- Apply a more effect ive d is infectant such as ozone. . .
l e A - w s e Si-
-: System meets the source water turb id i ty but not the fecal coliform requirements. A sewage treatment p lan t discharges in to the source water. A determination has been made that the system does not have adequate watershed control
- Purchase water from a nearb surveyor or use an al ternate source such as ground water 1 f avai lable.
- Take steps t o i n s t a l l f i i t r a t i o n , applying f o r an exemption (tiate delay) aspresented i n Section 9 where appropriate.
m i t i o n : The source water exceeds a t u r b i d i t y o f 5 NTU f o r more than two periods f n a year under noma1 weather and operating conditions,
- Purchase water frorn a nearb purveyor or use an al ternate source such as ground water r f available.
- Take s te s t o i n s t a l l f i l t r a t i o n , a p p l y i n g f o r an exemption (time de P ay) as presented i n Section 9 where appropriate.
7 - 7

b
In the interim prior to adoption of either of the above options, certain protective' measures may be appropriate. 'One protective
+ measure which can be used would be the issuance o f a public notice 5 to boil all water for consumption during periods when the turbidity
exceeds 5 NTU. if such a notice is issued, the utility should continue sampling the distribution system for chlorine residual and total coliforms, and initiate measurement of HPCs in the distribu: tion system. These data and the raw water turbidity should be used to determine when to lift the boil water notice. .-
The notice could be lifted when:
- The historical (prior to high turbidity) disinfectant residual
- The total colifonn requirements are met; - The HPC count is less than 500/ml; and
concentration is reestablished in the distribution system;
- The turbidity of the raw water is'less than 5 NTU.
Systems which are currently filtering must meet the SWTR criteria . . within 48 months of the SWTR to be in compliance, after which the criteria must be continually met for the system to be in compliance.
. .
le A 0
S o n d i m : A direct filtration plant is treating'a surface water which is not compatible with this treatment process. The system is not achieving its required turbidity petfonnance or disinfection criteria.
- Optimize coagulant dose.
- Reduce filter loading rates.
- Evaluate the effect on perfomance of installing flocculation and sedimentation ahead of the filters.
7 - 8

le B - R w c Sit-
m: A filtration plant is using surface water which is coapatible with its treatment s stem. The system is not achieving disinfection performance criter r a uired by the Primacy Agency to rchievo 8 1-109 inactivation of cysts; however, it is rmting the requirements of the Total Coliform Rule.
RtsDonze: - Increase disinfectant dosagets) - Install storage facilities to increase disinfectant contact
- Ensure optimum filtration efficiency by: tima.
- Use of a filter aid.
- Reduction'in filter loading rates.
- More frequent backwashing of fi 1 ters.
The Primacy Agency may grant additional removal credit for optimum
EPA intends to promulgate National Primary Drinking Water Regula- tions to regulate levels of disinfectants and disinfectant by-product when it promulgates disinfection requirements for ground water systems (antfcipated in 1992). €PA is concerned that changes required in utilities' disinfection practices t o meet the required inactivations for the SWTR might be inconsistent with treatment changes needed to 'comply with the forthcoming regulations for disinfectants and disinfection by-products. For this reason, the €PA. is allowing Primacy Agencies discretion tn detemining the level of disinfection required for fi1.tered systaas to #st the overall treatment performance requirements specified in the rule or reconanended based on source water quality.
Durtng the interim period, prior to promulgation of the disinfection by-product regulation, €PA recotmends that the Primacy Agency a1 1 ow more credit for fiiprdiq cyst and virus ranoval than generally recaanended. This interim level is recoimnended in cases where the Primacy Agency detennines that a system i s not -currently at a significant risk from microbiological concerns at the existing level of disinfection and t h a t
. filtration.
7 - 9

(---! a deferral i s necessary for the system to upgrade i t s disinfection.process t o optimally achieve compliance with the SWTR as mll as the forthcoming disinfection by-product regulations. Section S A 3 presents s m
? guidelines for establishing interim disinfection requirements.
7 - 10

.
.
The SWTR spec i f ies tha t the pub l i c no t i f i ca t ion requirements o f the Safe Drinking Water Act (SDWA) and the implementing regulat ions of 40 CFR Paragraph ' 141.32 must be followed. These regulat ions d iv ide publ ic no t i f i ca t i on requirements i n t o two t ie rs . These t i e r s are defined as follows:
1. Tier 1: a. Fa i l u re t o comply with HCL b. Fa i l u re t o cornply with prescr ibed t reatkf l . technique c. F a i l u r e t o cornply wi th a variance or exemption schedule
a. F a i l u r e t o comply with monitoring requirements b. F a i l u r e t o comply w i th a tes t ing procedure prescribed
c. Operating under a variance/exemption. This i s not considered a v io la t i on bu t pub l i c . no t i f i ca t i on i s requi red.
2. Tier 2:
* by a NPDWR
The SWTR c lass i f ies v io la t ions o f Sections 141.7O1 141.71(c), 141.72 and 141.73 (i.e.l treatment technique requirements as spec i f ied in Section 141.76) as T ie r 1 v io la t ions and v io la t ions of Section 141.74 as Tier 2 v io la t ions . V io la t ions o f 141.75 (reporting requirements) do not requi re publ ic not i f icat ion.
There are cer ta in general requirements which a1 1 publ i c no t i ces must met. A1 1 not ices must provide a c lear and read i l y understandable explanat ion o f the v io la t ion, any po ten t ia l adverse health effects, the populat ion at r isk, the steps the system i s taking t o correct the v io lat ion, the necessi ty o f seeking alternate water supplies ( i f any) and any preventative measures the consumer should take. .The not ice must be conspicuous, not contain any unduly technical language, unduly small p r i n t o r s i m i l a r problems. The not ice must include the telephone number o f t h e owner or operator or designee o f t he pub l i c water s y s t k ,as a source of addi t ional in fomat ion 'concern ing the v io la t ion where appropriate. The not ice must be b i - or mul t i l i ngua l i f appropriate.
providing information on potent ia l adverse hea l th e f fec ts i n T ie r 1 publ ic In addi t ion, the publ ic not l f icat ion ru le requi res that when .
8 - 1

notices and i n m t i c e s on the .granting and continued existence of a variance or exapt ion , tha m e r or operator of a public water system must include certain mandatory heal th ef fects language. For v io la t ions of treatment technique requirements f o r f i l t r a t i o n and d is in fect ion, the mandatory heal th e f fects ' language is : .
r:'
.a
s The United States Environmental Protection A ency (EPA) sets dr inking water standards and has determined tha t microb 3 ological eontaminants are a health concern a t cer ta in leve ls o f exposure. I f water i s inadequately treated, microbiological contaminants i n t h a t water may cause disease. Disease symptoms may include diarrhea, nausea, and possibly jaundice and any associated headaches, and atigue. These symptoms, however, a re no t * jus t associated with disease-causing organisms i n d r ink in water, but also may be caused by a number of factors other than your dr 3 nking water. EPA has set enforceable requirements f o r t r e a t i n g dr ink ing water to reduce the r i sk o f these adverse heal th ef fects. Treatment such as f i l t e r i n g and disinfecting the water removes or destroys microbiological contaminants. Drinking water which i s t r e a t e d t o meet EPA requirements i s associated with l i t t l e t o none o f t h i s r i s k and should be considered safe.
crm!s,
fur ther , the owner or operator of a comnunity water system must g ive a copy o f t h e most recent notice for any T ie r 1 v i o l a t i o n s t o all new b i l l i n g u n i t s or hookups p r i o r t o or a t the time service begins.
The medium f o r performing publ ic not i f icat ion and the time period . ..i
i n which n o t i f i c a t i o n must be sent var ies wi th the type of v io lat ion and i s s p e c i f i e d i n Section 141.32. .for .Tier 1 v io la t ions (i.e. , v io la t ions " .
of Sections 141.70, 141.71, .141.72 and 141.73), the Owner or operator 'of a. public water system must give notice:
1. By p u b l i c a t i o n i n a l oca l da i l y newspaper as soon as possible but i n no case l a t e r than 14 days a f te r t he v io la t i on or fa i lure. If the area does not have a d a i l y newspaper, then no t i ce sha l l be given by p u b l i c a t i o n i n a weekly newspaper of genera l c i rcu la t ion in the area, and
- _
2. By e i ther d i rec t ma i l de l i very or hand del ivery of the notice, e i t h e r by i t s e l f or with the water b i l l not later than 45. days a f t e r t h e v i o l a t i o n or fa i lu re . The Primacy Agency may waive t h i s requirement i f i t deternines that the Owner or operatoi has corrected the v io lat ion wi th in the 45 days.
8 - 2

.
Although the SWTR does not specify any acute violations, the Primacy Agency may Specify some Tier 1 v io la t ions as posing an acute r i s k t o human health; .tor example these violat ions ray include:
1. A waterborne disease outbreak i n an un f i l t e red supply.
2. Turb id i ty of the water p r i o r t o d i s i n f e c t i o n o f an un f i l t e red supply or t h e t u r b i d i t y o f f i l t e r e d water exceeds 5 NTU a t any time.
3. Fai lu re t o maintain a dis infectant residual of a t leas t 0.2 argil i n t h e water being delivered t o t he d i s t r i bu t i on system.
.-
For these v io la t ions or any others defined by the Primacy Agency as "acute" violat ions, the system must furnish a copy of the not ice to the rad io and te lev is ion s ta t ions serv ing the area as soon as possible but i n no case later. than 72 hours af ter the v io la t ion. Depending upon circum-
, stances p a r t i c u l a r t o t h e system, as determined by the Primacy Agency, the not ice may i n s t r u c t t h a t a l l water should be b o i l e d p r i o r t o consumption.
a t l eas t once every three months by mai l de l ivery (e i ther by i t s e l f or. wi th the water b i l l ) , or by hand de l i very , fo r as long as the v io la t ion o r f a i l u re ex i s t s .
There are two var iat ions on these requirements. F i rs t , the owner or operator of a comnunity water systtm i n an area not s.erved by a da i l y or weekly newspaper must g ive not ice wi th in '14 days a f te r t he v io la t i on by hand del ivery or continuous posting o f a no t ice o f the v io la t ion . The not ice must be i n a conspicuous place i n t h e area served by the systea and must continue for as long as the v io lat ion exists. Not ice by hand del ivery must be repeated a t l eas t every three months for the durat ion o f the v io la t ion. .
Secondly, the m e r or operator o f a - i t v m r sv- ( L e * , one serving a t ransi tory populat ion) may, give notfce by hand del ivery or continuous posting o f the not' ice i n conspicuous places i n t h e area served by the system. Notice must be given wi th in 14 days after the v io la t ion. I f n o t i c e i s given by posting, then it must continue as long
Fol lowing the . ini t ial notice, the owner or operator must give not ice .
8 - 3

as the violat ion exists. Notice given by hand delivery must be repeated at leaf t every three months f o r as long as the v io lat ion exists.
F o r t i e r 2 v io la t ions (i .e, , v io la t ions o f 40 CFR 141.74, analy t ica l * x and monitoring requirements) notice must be given wi th in three months .. a f t e r t h e ' v i o l a t i o n by p u b l i c a t i o n i n a da i l y newspaper of,.general
c i rcu la t ion , or i f there i s no d a i l y newspaper, then i n a weekly ' newspaper. In addi t ion, the Owner or operator shal l give notice by mai l
(e i ther by i t s e l f or wi th the water b i l l ) or by hand de l i very a t leas t - once every three months f o r as long as the violat ion exists. Notice of a variance or exemption must be given every three aonths from'the date It i s granted f o r as long as i t remains i n e f f e c t .
I f the area i s not served by a d a i l y or weekly newspaper,' the owner or operator o f a comnunity water system must give not ice by continuous posting i n conspicuous places i n t h e area served by the system, t h i s must continue as long as the v io la t ion does or the variance or exemption remains in e f fec t . Not ice by hand del ivery must be repeated ax l eas t every three months fo r the dura t ion o f the v io la t ion or the variance of exemption
. For noncomunity water systems, the Owner or operator may give not ice by hand del ivery or continuous posting i n conspicuous places; beginning within 3 months o f the v io la t ion or the variance or exemption. Posting must cont inue for the durat ion o f the v io la t ion or variance or exemption and no t ice by hand del ivery must be repeated at least every 3 months dur ing th is per iod.
The Primacy Agency nay allow f o r Owner or operator ' to provide less frequent notice for minor monitoring violations (as defined, by the Prilnacy Agency if EPA has approved the Primacy Agency's subs t i tu te . requirements contained i n a program revision appl icat ion).
fo provide further assistance in preparing public notices, several examples have been provided, However, each s i tua t ion f s di f ferent and may ca l l for d i f ferences in the content and tone of the notice. A 1 1 notices must comply w i th the general requirements specified above.
' &.
8 - 4

l e 1 m c r 1 Viblatron - Unf i l tered zupolv
. - .
Following i s an example o f a Tier 1 v io la t i on which may be considered by the Primacy Agency t o pose an acute r i s k t o human health.
A systcln which does no t app ly f i l t r a t i on experiences a breakdown i n the chlorine feed system and the switchover system f a i l s t o a c t i v a t e t h e backup systems. A number of hBurs pass before the operator discovers the malfunction. The operator, upon discovery of the malfunction, contacts the loca l te lev is ion and radio stat ions and announces tha t t he pub l i c i s receiving untreated water. The announcement may read as follows:
We have just received word from the Aswan Water Board tha t a malfunct ion of the d is infect ion system has allowed untreated water . t o pass i n to t he d i s t r i bu t i on system. Thus, t h i s system prov.iding d r ink in water i s i n v i o l a t i o n o f a treatment technique requircnient. The Un f ted States Environmental Protection Agenc (EPA sets drinking water standards and has determined tha t rn r 1 crobio ogical contaminants are a health concern a t cer ta in leve ls of exposure. I f water i s inadequately treated, aicrobiodogical contaminants i n that water may cause d i tease. Disease symptoms may include diarrhea, cramps, nausea, and possibly jaundice and any associated headaches , and fatigue. These symptoms , however, are not Just associated with disease-causing organisms i n dr ink ing water, but also may be caused by a number of factors other than your dr ink ing water. EPA h a s m t enforceable requirements fo r t rea t i ng d r i nk ing water t o reduce the r i s k o f these adverse heal th e f fects . Treatment such as , f i l t e r i n g and d is in fect ing the water removes or destroys microbiological contamlnantr. Drinking water'which i s t r e a t e d t o meet EPA requirements i s associated with l i t t l e t o none of t h i s r i s k and should be considered safe.
The temporary breakdown in d i s in fec t i on may have allowed micro- organfsms t o pass i n to t he d i s t r i bu t i on system. The operation of ' t he sys tm has been restored SO tha t no further contamination of t he d i s t r i bu t i on system will occur. Any fu r ther changes will be announced
Addi t ional in format ion is ava i lab le a t the fo l lowing number: 235-WATER.
A d i r e c t m a i l i n g o f the not ice i s provided wi th in 45 days o f the occurrence.
a m d t 2 - Tier 1 Vio lat ion-Unf i l tered S u p p l v Following i s an example o f a T i e r 1 v io la t i on which may b e
considered by. the Primacy Agency t o pose an acute r i s k t o human health.

A system supplies an unfi l tered surface water t o i t s customers. r> During a period of unusually heavy rains caused by a hurricane i n t h e area, t h e t u r b i d i t y of the water exceeds 5 NTU. the turbidi ty data dur ing
.i which the heavy rains occur i s as follows:
0.4 0.8- 0.4 0.5 0.5 0.5 Oe7 Oe4 1.1 0.4 0.9 0.6 , .
0.7 0.7 Oe4 7.6 0.4 11.3 0.5 9.6 0.4 7.2 0.6 5.0 .
The fol lowing publ ic not ice was prepared and submitted t o t h e ' newspaper, te lev is ion and radio stat ions wi th in 72 hours o f t he t u r b i d i t y exceedence of 5 NTU.
The occurrence o f heavy rains i n our watershed i s causing a r t h e t u r b i d i t y of the drinking water supplied by Fai.rfax. Company .
7.6 3.1 2.7 0.7 0.8 0.5
loca l f i r s t
i s e i n Water
:' T u r b i d i t y i s a measurement o f par t i cu la te mat te r in water. , It i s of s i n i f i cance i n drinking water because i r regu la r ly shaped p a r t i c 3 es can both harbor microorganisms and in te r fe re d i rec t l y w i th d is in fect ion which destroys microorganisms. While the par t ic les causing the turbidi ty may not be harmful or even vis i ,b le at the concentrations measured, the net e f fect of a tu rb id water i s . t o increase the surv iva l ra te o f microorganisms contained i n t h e water. This i s o f concern because several diseases are associated with waterborne microorganisms.
Because o f the h igh tu rb id i ty leve ls , the Fa i r fax system i s i n v i o l a t i o n o f a treatment requirement set by the Environmental Protection Agency (EPA)
The United States Environmental Protection Agenc (EPA sets ,
dr inking water standards and has determined tha t m crobio ogical contaminants are a health concern a t ce r ta in l eve l s o f exposure. If water i s inadequately treated, microbiological contaminants i n that water may cause disease. Disease symptoms may include diarrhea, cramps, nausea, and possibly jaundice and any associated headaches, and fatigue. These symptoms, however, are not jus t associated with disease-causing organisms i n drinking water, but a lso may be caused by a number of factors other than your drinking water. EPA has set en'forceable requirements for t reat ing dr ink ing water t o reduce t h e r i s k o f these adverse health effects. Treatment such as f i 1 te r ing and disinfecting the water removes or des t 'Ws
I microbiological contaminants. Drinking water which i s t r e a t e d t o
7.
.x.
r 1 .
8 - 6

.--- . meet EPA requirements i s associated with l i t t l e t o none of t h i s r i s k
' and should be considered safe. . .
' In order t o protect yourself from i l l n e s s , a l l water from the Fafr fax system used for drinking, cooking and washing dishes should be bo i l ed a t a t o 1 l i n g b o i l f o r one minute.
The system i s being closely monitored and a not ice will be issued when the water returns t o an acceptable qua l i t y and no longer needs t o be boiled.
The u t i l i t y continues sampling the distribution systcla.for chlorine residual and total col f forms, and i n i t i a t e s measurement of the HPCs i n the d i s t r i b u t i o n system. The n o t i c e i s l i f t e d when a l l the fo l low ing a re met: - The h is to r ica l (p r io r to h igh tu rb id i ty ) d is in fec tan t res idua l
- The t o t a l c o l i f o n n requirements are met . concentration i s reestablished i n the d is t r ibu t ion system.
- The HPC count i s <5OO/m1
- The t u r b i d i t y o f the raw water i s less than 5 NTU.
The Primacy Agency most decide whether the t u r b i d i t y event was unusual or unpredictable and whether f i l t r a t i o n should be insta l led,
*
le 3 0 cr 1 Vio lat ion - F i l t e red Q&y A conventional treatment plant i s t r e a t i n g a suiface water. A
malfunctioning alum feed system resu l ted i n an fncrease -of the filter e f f l uen t t u rb id i t i es . The e f f l u e n t t u r b i d i t y was between 0.5 and 1.0 NTU i n '20 percent o f the samples fo r t he month. The u t i l i t y . fssued a no t ice which was publ ished fn a loca l da i ly newspaper w i th in 14 days af ter the v io la t ion. The notfce read as follows:
Ourin the previous month, t he Ba l t i c Water Treatment Plant ex er enced d i f f i c u l t i e s w i t h t h e chemical feed s stem. The
ma P P functions caused an e f f l uen t t u rb id i t y l eve l above I .5 NTU i n 20 percent o f t h e samples for the month. The cur ren t t rca tmnt
' s tandards require that the turbidi ty must be less than 0.5 NTU i n 95 percent of the month1 samples. The Ba l t i c d r i nk ing water system has thus been f n v i o l a t r on of a treatment technique requirement.
The United States Environmental Protection Agency (EPA sets drinking water standards and has determined that s lcrob io 1 ogical .

r" contaminants are a health concern at cer ta in leve ls of exposure. . i If water i s inadequately treated, microbiological contaminants, i n
. that 'water may cause disease. Disease symptoms nay include diarrhea, cramps, nausea, and possibly jaundice and any associated headaches ,- and fatigue. These symptoms, however, are not jus t associated with disease-causing organism i n d r i n k i n g water, but also may be caused'by a number of factors other than your drinking
water t o reduce the r i sk of these adverse health effects.. treatment .g such as f i l t e r i n g and disinfecting the water removes or destroys microbiological contaminants. Drinking water which i s t r e a t e d t o . meet €PA requirements i s associated with l i t t l e t o none o f t h i s r i s k and should be considered safe.
The chemical, feed and switchover components o f the system have been repaired and w e i n workin order and tu rb id i ty leve ls a re met ing the standard. It i s u n l i 1 e ly tha t i l l ness will resu l t from the t u r b i d i t y axceedences previously mentioned because continuous str ingent d is infect ion condi t ions were i n e f f e c t and the system was i n compliance with other microbiological drinking water standards per ta in ing t o microbiological contamination. However, a doctor should be contacted i n t h e event o f i l l ness . For addit ional in format ion ca l l 1-800-726-WATER.
. . . I
'. water. €PA has set enforceable requirements fo r t rea t ing d r ink ing
_>. --
"-
"
.

9. EXEMPTIONS
. 9.1 Q y e w i w of Rcautrrments Section 1416 o f the Safe Drinking Water Act allows a Primacy Agency
. t o e x k t any publ ic water systan w i t h i n i t s j u r i s d i c t i o n Frola any treatment technique requirement imposed by a national primary drinking water regulat ion upon a f inding that:
1. Due t o compelling factors (which ma include . economic factors) , the publ ic water system i s unab e t o cowply wi th the treatment technique requirement;
r 2. The publ ic water system was i n operation on the effect ive date
o f the treatment technique requirement or, f o r a system tha t was not i n operation by tha t date, only i f no reasonable a l te rna t ive source o f drinking water i s ava i l ab le t o t he new system; and
3. The granting of the exemption will not resul t ‘ in an unreason- able r i s k t o health.
I f a Primacy Agency grants a publ ic water system an exemption, the Agency must prescribe, at the time the exemption i s granted, a schedule for:
1. Compliance ( including increamto o f progress) by the publ ic water system wi th each treatment technique requirement wi th respect t o which the exemption was granted; and
2. Implementation by the s stem o f such control measures as the Primacy Agency may requ r re during the period the exemption i s i n e f f e c t .
. . Before prescribing a schedule, the Primacy Agency mutt provide not ice and oppor tun i ty for a public hearing on the schedule. The schedule prescribed must require compliance by the publ ic water r ys tm w i th t he treatment technique requirement as expeditiously as practicable, but i n . no case l a t e r than one year af ter the exemption i s issued (except that , i f the systcrn meets cer ta in requirements, the f ina l date for compliance may be extended for a per iod not to exceed three years from the date the exemption i s granted). For systems serving less than 500 service
9 - 1

connections, and meeting certain addit ional requirements, the Primacy (-- '?
Agency l a y renew the exemption for one o r anre additional two-year periods.
Under the SWTR, no exemptions are allowed frm the requirement t o provide disinfection for surface water system, but cxunptfons are available t o reduce the degree of disinfection required. Exemptions from
guidelines for evaluating conditions under which exemptions are appropri- ate.
, t h e f i l t r a t i o n requirements are available. The following sections present "L
9.2 W d e d Criteria I n order to ob ta in an exemption from the SUTR, a system must meet
cer ta in minimum c r i t e r i a t o assure no unreasonable Fisk to health. These should be applied before looking at other factors such as economics.. Reconmrended minimum c r i t e r i a fo r assuring no unreasonable, r i sk to hea l th ex is ts are l is ted below.
- Pract ice d is infect ion to achieve at least a 2-log inactivation of m r d i a cysts; or comply with the disinfection'requirements fo r the d is t r ibu t ion system as defined i n Section 141.72(b) o f the SWTR .
- Comply with the monthly c o l i f o n MCL; or provide bottled water or another alternate water source) or po in t o f use treatment evices f o r t h e i r customers i n which representive samples
comply w i t h a l l t h e MCL National Primary Drinking Water Regul a t i ons . d
EPA recomacnds t h a t i n order to obta in an extension t o t h e i n i t i a l 1 year exemption period i n add i t i on t o t he requ i red e lamts i n Sec t i on 1416, the system would need t o be i n compliance wi th ' the monthly col i form MCL, sat is fy the above d is in fec t ion c r i te r ia and not have any evidence o'f waterborne disease outbreaks a t t r ibu tab le to the sy$tcm a t the end o f t h a t f i r s t exemption period. I f a t any point during the extended exemption period the system d i d n o t m e t these conditions, the exemption should 'be
c withdrawn and the system should be subject t o an en fo rcen t ac t i on . *
9 - 2

- Pract ice d is in fect ion to achieve a t leas t a 0.5 lo inactiva- t i o n o f uardiq cysts; l y w i t h t h e d ? s in fect ion
. requirements for ' t h e d i s t r i b u t on system as defined i n Section 141.72 of the ru le.
Or '7 - Comply with the monthly coliform MCL;' or provide bottl'ed water
or another alternate water source) o r po in t o f use treatment evices f o r t h e i r customers i n which representive samples
comply w i t h a l l t h e MCL National Primary Drinking Water Regulations.
- fake a l l p r a c t i c a l steps t o improve t h e p e r f o w n e e o f i t s f i l t r a t i o n system,
6
I n order to ob ta in an extension t o t h e i n i t i a l exemption period, i n . addi t ion to the required elmtents in Sect ion 1416, the systen should be
i n compliance with the col i fonn MCL, sa t i s f y the above d is in fect ion . c r i t e r i a and not have any evidence o f waterborne disease outbreaks
at t r ibutable to the t reatment system a t t he end o f t h a t f i r s t exemption period, I f a t any point during the extended exemption period the system d i d n o t m e t these conditions, the exemption should be withdrawn and the system should be subJect t o an enforcement action. In addition, the system must continue t o be taking steps to improve the performance o f i t s f i l t r a t i o n system t o achieve the cr i ter ia speci f ied 'in the SWTR. .
Once these minimum requirements are applied, the Primacy Agency should look at the other factors as described i n Sections 9.3, 9.4, and 9.5.
9.3 -11- F a c w Compel 1 ing factors are often assoclated with small systems. The
major c a p e l l i n g f a c t o r tends t o be economic. I n some cases the compell lng factor may not be sole ly economic, but rather the contractual and physfcal, i n feas ib i l i t y o f hav ing a r q u i r c d treatment . instal led within the time per iod spec i f ied in the regulat ion. For example, i t may not be feas ib le f o r a very large system t o i n s t a l l f i l t r a t i o n by June 1993 i f required. In such cases exemptions are also appropriate; Additional considerations for small systems are presented i n Appendix L .
9 - 3

If SYstm i~provements nuessary'to comply with the SWTR,incur costs which the Primacy Agency .determines pose an economic barr ier to acquis i - t i o n o f . necessary treatment, the system f u l f i l l s t h e c r i t e r i a of demonstrating a compelling hardship which makes it unable t o m e t the treatment requirements. 'In such cases, the €PA believes i t i s reasonable t o grant an exemption i f the system a l so we ts t he c r i t e r i a , i n 9.4 and 9.5.
The USEPA document, "Technologies and Costs for the Removal of Microbial Contaminants from Potable Water Supplies," conhins costs associated with avai lable treatment alternatives (USEPA, 1988b). Costs found i n t h i s document, or those generated from mre s i te-speci f ic
. conditions, can be used as the basis for determining the abi l i ty of a system t o a f f o r d treatment. The t o t a l annual water production costs per household f o r a system can be estimated based on the household water usage and the production costs per thousand gallons. As estimated i n t h e above c i ted USEPA document, each cent per thousand gallons o f treated water i s approximately equivalent t o $1 per year per household i f a household water usage o f 100,000 gallons per year i s assumed.' This es t ina te 'w i l l need t o be adjusted' according t o water usage f o r cases where the .household usage di f fers from 100,000 gal Ions per year.
The fol lowing examples are presented ' t o provide guidance i n estimating costs for a system t o upgrade i t s system or i n s t a l l f i l t r a t i o n . This cost information could be used f o r determining whether a system might be e l i g i b l e f o r an exemption.
U
.
WnulLl A water system which supplies an average da i l y flow o f 0.05 ngd t o
a small urban conmunity receives i t s water supply f m a lake. The system current ly provides dis infect ion wi th chlor ine but does not provide f i l t r a t i o n . The system reviewed i t s source water qua l i t y and found the character is t ics to be as follows:
:P 9 ' This i s the national average resident ia l househOld consumption.reported
in: Final Descript ive Sumnary - 1986 Surve o f C m u n i t y Water Systems. October 23, 1987. USEPA: Off ice of Dr in 5: ing Water.
9 - 4

Total col i fonns 1,000/100 fa1 Turbidi t y 10 - 13 NTU
. Color 6 - 9 C U
Bdsed upon.the c r i t e r i a i n t h e SWTR, t h i s source requ i res f i l t r a t i on and a rev,icw o f t h e water q u a l i t y c r i t e r i a presented i n t t b l e 4-2 . indicates that the treatment technique best suited t o these source conditions i s conventional treatment. A conventional package treatment plant wi th a capacity of 0.068 1360 way be purchased and put on 1 i ne a t a cost o f $277/household-year not including real estate, piping or raw water pumping costs which nay be s ign i f icant depending on-.the plant location.? €PA has estimated that, on average, these costs might add another 50% depending on s i te spec i f ic factors (USEPA, 1989) '
Thus the cost estimate f o r implementing f i l t r a t i on i nd i ca tes t ha t the i n c r u i n the average annual household water b i l l would be approximately $277 plus the cost of real estate, piping, and raw water pumping as needed. The incomes o f people i n t h e c m u n i ty and the current water b i 11s can be reviewed by the Primacy Agency along with these estimated costs t o determine if an undue economic hardship i s incurred by these treatment methods. Upon determination that an economic hardship i s ' incurred, the Primacy Agency may grant an exemption from f i l t r a t i o n , provided that the system can assure the protection o f the heal th of the
. comnunity . However, i f the water supply system for a nearby c m u n i t y meets the drinking water standards a there i s t h e a b i l i t y t o hook up t o that system, an exemption generally should not be granted unless such costs also presented an economic hardship.
' -
A 1 arge urban coamuni t y , wi th a lnedi an annual i ne- o f $25,000 per family, i s supplied with water from lakes and reservoirs. The comnunity places an average d a i l y demand o f 3 q d on the supply system. ' The watershed o f t he system i s moderately populated and used f o r fanning and
. .
. .
* Table VI-3 ("Technolo ies and Costs for the Removal o f Microbial Contaminants from Potab 3 e Water Supplies, USEPA, 1988b) l i s t s t h e t o t a l costs as 277.4 cents/1000 gal. Estimated costs for real estate, 'p ip ing. ' '
and raw water pumping as a funct ion o f s i te spec i f ic condi t ions are available i n Table E-1, E-2, and E-3 o f t h i s same document.
9 - 5

grazing. The system currently. provides filtration using diatomaceous earth filtration and disinfection wlth chloramines.
A review of the source and finished water quality was conducted to evaluate the plant's performance. The source water quality was determined t o be: . .
Total col iforms 30 - 40/100 ml Turbidity 2 - 3 NTU Color 1 - 2 c u
Diatomaceous earth is therefore an acceptable filtration wethodO3 However, review of the finished water showed that a residual in the distribution system is only maintained ' 8 0 percent of the time. In .addition to this, coliforms were detected in 10 percent of the samples taken over the twelve month period. Inspection of the chlorination equipment showed the equipment is deteriorated. Review of the monthly reports showed that the coliforms appeared in the distribution system shortly after the chlorinators malfunctioned. This observation led to the conclusion that new disinfection facilities were needed.
The source water quality and available contact time'after disinfec- tion were then used to deternine the most appropriate disinfectant for the system. As described in Section 5.5, ozone, chlorine or chlorine dioxide can be used as primary disinfectants given these conditions. A prelimi- nary review of costs for applying the various disinfectants .showed ' ,.7
chlorine to be the most economical at a cost of $2.8/household/year4 (USEPA, 1988b). This cost does.not include backup equipment; however, ... 5 .
even with providing duplicate equipment doubling this cost to $5.6/house- hold/ year, the improvement incurs lainiml cost and the Primacy Agency should not grant the system an exemption based on economic hardship.
- .
c
As detennined from Table 4-2 of Section 4.
a plant capacity of 5.05 mgd. ' Table VI-12 (USEPA, 1988b) lists a total cost of 2.8 cents/1000 gal for
. .
JSl/household-vearl = $2.8/household-year (cents/1000 ga l )
9 - 6

9.4 W u a t i o n of Alternate Water Sypglv SOU Systems which would incur very high costs for i ns ta l l i ng a required
treatment t o comply wi th the SWTR, should evaluate the possibil i ty of using an al ternate source. These alternate sources include: . - The use o f ground water - Connection t o a nearby water purveyor - Use o f an alternate surface water supply
When considering the use o f ground water, the purveyor must determine the capacity of the underlying aquifer for supplying-the demand. The water qual i ty character is t ics o f the aqui fer nust be evaluated . t o determine what treatment may be needed t o meet ex is t ing standards. The cost of the wel l construct ion and treatnient f a c i l i t i e s must then be determined and converted i n t o a yearly cost 'per household.
The connection t o a nearby purveyor involves contacting the purveyor t o determine their capaci ty and will ingness t o supply the water. Once. i t has been determined that the a l ternate source meets a l l appl icable . drinking water standards, the cost o f the transmission l ines, 'distr ibution system, and o the r f ac i l i t i es (e.9. d is infect ion, npumping, etc.) must then be determined and amortized i n t o a yearly cost per household.
I f the cost for using an al ternate source i s found by the Primacy Agency t o present an economic hardship, and the purveyor can demonstrate that there w i I 1 be no unreasonable grant an exemption to t he SWTR f o r compl i ance .
r isk to hea l th , the Primacy Agency may the purveyor and develop a schedule o f
9.5 . Systems which apply for an exemption f m the SWTR must demonstrate
t o t h e P r i m c y Agency tha t t he hea l th o f t he cmun i t y n i l 1 not be put a t r i s k by the granting of such an exemption. A system should be able t o provide adequate protection f o r the publ ic heal th by meeting the minimum suggested €PA requirements i n Section 9.2. However, a Primacy Agency may specify addit ional measures pub1 i c health, depending on'
. current ly unf i l tered surface
or c r i t e r i a a system must meet to p ro tec t the par t icu lar circumstances. Systems w i t h
water supplies which f a i l t o meet the source
9 - 7

water t h e i r
q u a l i t y c r i t e r i a will be requ i red t o i ns ta l l f i l t r a t i on as par t o f treatment process. However, It may take 3 t o 5 years or more before
t h e f i l t r a t i o n system can be designed, constructed and begin operation,
possible interim Rcasures which the systcln could take to fu r t t iep sa t is fy the Primacy Agency's concern {nclude one or more of the following:
a. Use of h igher d is infectant dosages without exceeding the TTHM MCL (even f o r systems not currently subject to this MCL) .
b. I ns ta l l a t i on of a replacanent or addit ional d is infect ion system which provides greater disinfection eff iciency and which can be integrated into the new f i l t r a t i o n p l a n t
c. Increasing the monitoring and report ing to the Primacy Agency
d. Increasing protection of the watershed
' t thereby Just i fy ing the grant ing of an exemption. Ouring this' period,
e. Increasing the frequency of sanitary surveys
f. Temporarily purchasing water from a nearby water system
g. For small systems, temporary i n s t a l l a t i o n o f a ='bile f i l t r a t i o n (package) plant
h. Increasing contact t ime by rerouting water through reservoirs
I n some cases systems may be able to increase their disinfection dosages during the interim period to provide addit ional protection against pathogenic- organisms. This alternative should be coupled wi th a requirement f o r increased monitoring for coliforms, HPC and disinfectant res idual wi th in the d is t r ibut ion system. However, disinfectant dosage. should not be increased i f t h i s would r e s u l t i n a v io la t ion of the TTHM MCL, even for systems not current ly subject to th is MCL.
. Systems which are planning t o i n s t a l l f i l t r a t i o n may be able t.0
u t i l i z e a more ef f i c ien t d is in fec tan t tha t can l a t e r be in tegrated in to the f i l ter p lant . Current ly ozone and chlorine dioxide are considered to be the most e f f ic ient d is in fectants .
For a1 1 systems which do not meet the source water q u a l i t y c r i t e r i a
the Primacy Agency increase i t s surveil lance o f the system and require .. pari most i n s t a l l f i l t r a t i o n , €PA recomnends that during the interim period '.
9 - 8

increased mnitoring and reporting requirements to assure adequate protection of the public health.
Any required increases in watershed control and/or on-site inspections will not alleviate the need for amre stringent disinfection requirclncnts and increased monitoring of the effectiveness of'the system employed. Their purpose would be to identify and control all sources o f contaatination SO that the existing systea will provide water of the best posti ble qual i ty .
For tome systems, it nay be possible to purchase water from a nearby system on a temporary basis. This may involve no more than the use of existing interconnections or it nay require the installation of tmporary connect ions.
Trailer mounted filtration units (package plants) are sometimes available fram state dgencies for emergencies or may be rented or leased from equipment manufacturers.
Systems may also be required to supply bottled water or install point-of-entry (ME) treatment devices. For the reasons listed below, these alternatives should only be utilized if the'previou'sly mentioned a1 ternat i ves are not feas i bl e: - In many states bottled water is subject only to the water
quality requirements of the FDA as a beverage and 'not to the requirements o f the Safe Drinking Water Act.
- . Point-of-entry treatment devices are not currently covered by perfonnance or certification requirements which would assure their effectiveness or perfonnance. .
If the installation of POE devices is required, the selection of the appropriate treatment device should be based upon 1 laboratory or field scale evaluation o f the devices. A guide for testing the effectiveness of PO€ units in the microbiological purification of contaminated water is provided in Appendix W .
Several issues arise with the use of ME devices. These include establishing who or what agency (1) has the responsibility for ensuring compliance with standards; ,(2) retains ownership of the treatment units; (3) performs monitoring, analysts and maintenance; and (4) manages 'the
9 - 9

treatment program and maintains insurance coverage for damage and l i a b i l - F' . .
i n r i s k over central ly treated water.
a l te rna t ive i s be ing con$idered.
i ty . It should also be considered that there i s n o ' s i g n i f i c a n t increase E
Thase issues should be borne i n mind when PO€ as a treatment
Systems with currently unfi ltered surface water supplies which m e t the source water qua l i t y c r i t e r i a , bu t do not meet one or mre o f t h e other requirements f o r watershed control e sanitary survey, compliance wi th annual col i form MCL or disinfection by-product regulation(,), will be r e q u i r e d t o i n s t a l l f i l t r a t i o n unless the deficiencies can .be corrected w i th in 48 months o f promulgation o f t h e SUTR. Interim protection measures include those previously listed.
Systems with currently unfi ltered surface water supplies which meet the source water q u a l i t y c r i t e r i a and the s i t e spec i f i c c r i t e r i a bu t which do no t met the d is in fec t ion requirements, will be required t o i n s t a l l f i l t r a t i o n unless the disinfection requirements (adequate CT and/or d is in fect ion system redundancy) can be met. Ouring the interim period, available options include:
a. Temporary i n s t a l l a t i o n o f a mobile treatment plant
b. Temporary purchase of water frm a nearby purveyor .
e. Increased monitoring o f t h e system'
d. I n s t a l l a t i o n o f temporary s torage fac i l i t ies to increase the disinfectant contact t ime
Current ly f i l tered suppl ies which f a i l t o meet the tu.rbidi ty or d is in fec t ion performance c r i t e r i a presented i n Section 5 will be required t o evaluate and' upgrade the i r t r ea t l nen t f ac i l i t i es i n order t o a t t a i n .
compliance. During the interim period avai lable options for improving the finished water quality include: ,'
a. Use of a f i l t e r a i d t o improve f i l t e r e f f l u e n t t u r b i d i t i e s
b. Increased dis infectant dosages
e. The addit ion o f an a l te rna te d is in fec tan t i s an op t ion a f te r the d is in fect ion by-products r u l e i s promulgated
9 - 10

d. Reduction in filter loading rates with subsequent reduction
e. , ' Installation o f temporary storage fact litits to increase in plant capacity
disinfectant contact time
The SOUR requires that each Primacy Agency which grants an exemption notify €PA of the granting of this exemption. The notification must contain the reasons for the exemption, including the b a s h f o h e findfng that the exemption will not result in an unreasonable r i s k to public health and document the need for the examption.
9 - 11

REFERENCES
.
American Water Works Association. Manual of Uater Supply Practices and Water Chlor inat ion Pr inciples and Practices, 1973.
American Water Works Association Research Foundation AUUARF). A Sumnary of State Drinking Water Regulations and Plan Review Gu I dance. June, 1986.
Bader, H.; Hoigne, 3. Determination of Ozone i n Water by the Indigo Method, Water Research 15; 449-454, 1981.
Bellamy, W. 0.; Lange, K. P.; Hendricks, 0. W. F i l t r a t i o n of Giard ia Cysts and Other Substances. Volume 1: ceous Ear th F i l t r a t i on . EPA-600/2-84-114, U.S. Environmental Protection Agency, Cincinnati , Ohio, 1984.
Bellamy, W. 0.; Silverman, 6. P.; Hendricks, 0; W; F i l t r a t i o n o f Giard ia Cysts and Other Substances. Volume 2: slow Spnd F i l t r a t i o n . EPA-600/2- -85-026, UsS. Environmental Protection Agency, MERL, Cincinnat i , Ohio, Apri 1 , 1985.
Bishop, S.; Craf t , T. F.; Fisher, 0. R.; Ghosh, M.; Prendiv i l le , P.M.; * Roberts, K. J.; Steimle, S.; Thompson, 3. The Status o f D i r e c t F i l t r a t i o n ,
e ReD-. J.AWWA, 72(7):405-411, 1980.
Boumr, H. Water Hvdrology. McGraw Hill Book Co., N e w York,
Bucklin, K.; Eff luent Qual AUWA Research
Amirtharajah, A.; Cranston, K. C h a r a c t e r i s t i c s o f I n i t i a l i t y and I t s I m p l i c a t i o n s for the Fi l ter-to-Waste Procedure. Foundation Report. November, 1988. .
\
..
Carfson, D.A.; Seabloom, A.M.; DcWalle, F A . ; Wetrler, T.F.; EV efet, 3.; Butler, R.; Wangsuthachart, S.; Hang, 5. Ul t rav io le t D is in P ect ion of Water for Small Water Systems. EPA/600/2-85-092, U.S. Environmental Proteetion A ency, Water .Engineering Reserach Laboratory, Drinking Water Research Div P sion, Cincinnati, Ohio, September, 1985.
Clark, R.M.; Re 11, S. -A Mathematical and Sta t is t i ca l Ana lys is - fo r the Inact ivat ion o? Giardia 1- by Free Chlorine. Submitted t o t h e Journal o f Environmental Science Engineering, 1989.
Clark, R.; Regli , 5.; Black, 0. Inact ivat ion o f Giardia mlia by Free Chlorine: A Mathematical Model* Presented a t AWWA Water Qua l i t y Technology Conference. S t . Louis, Mo., November 1988. - Cleasby, 3. 1.; Hilmoe, 0. J . : Dimitracopoulos, C. J. Slow-Sand and Di rect In-L ine F i l t ra t ion.of a Surface Water. L A U U A , 76(12):44-55, 1984.
DeWalle, F. B.; Engeset, J . ; Lawrence, W. Removal o f i a rd ia l amb l i Cysts by Dr inking Water Plants. EPA-600/S2-84-069, Unfted States En! vironmental Protection Agency, HERL, Cincinnati , Ohio, May 1984.
FOX, K. R.; Mi l tner , R. 3 . ; Logsdon, 6. S.; Dicks, 0. L.; Drolet , L. F. P i lo t P lant Explorat ion of Slow Rate F i l t r a t i o n . Presented a t t h e AWWA Annual Conference Seminar, Las Vegas , Nevada, June 1903.
Fujioka, R.; Kungskulnit i , N.; Nakasone, S. Evaluat ion of . the Presence - Absence Test for Col i fonns and the Membrane F i l t r a t i o n Method for Heterotrophic Bacteria. AUUA Technology Conference Proceedings, November, 1906 .
. .
Gtldreich, E. Personal comnunication t o Linda Averell, Malcolm Pirnie Engineers, Paramus, New Jersey, July 1989. *
Great Lakes-Upper Mississippi River Board of State Publ ic Heal th and Environmental ’Managers Comnittee. -Standards f o r Water Works, 1987 Edit ion.
Hendricks, 0.; A1-Ani, M.; Bellam , W.; Hibler, C.; McElroy, 3. Surro ate Ind i ca to rs f o r Assessin Remova o f G ia rd ia Cysts, AUUA Water Qua i t y Technology Conference, 1 84.
Hoff, J . C. nact iva t ion o f M ic rob ia l Autnts bv C cal Ofs in fectant tS EPA-600/52-8J-067, U.S. Environmental Protection , Water En ineer- i n Research Laboratory, Drinking Water Research D i v r sion, Cine ? i lnat i , Oh yo, September 1986.
Hoffbuhr, 3. W.; B l a i r , 3.; Bartleson, M.; Karl in, R. Use o f P a r t i c u l a t e Analysis for Source and Water Treatment Evaluation. AUUA Water Qual i ty Technology Conference Proceedings, November 1986.
\ 7 4 . .
Horn, 3 . 6.; Hendricks, D. W. Removals o f G i a r d i a Cysts and other Part icles from Low Turb id i ty Waters Using the Cull igan Multi-Tech F i 1 t ra-
-2-

Joost, A; 0.; Long, 8. W.; Jackson, L. Usin Ozone as a . Primary Dis infectant for the Tucson CAP Water Treatment P s ant, presented at the IOA/PAC Ozone Conference, Monroe, MI, 1988.
Kuchta, 3. M.; States, 5. 3.; HcNmara, A. M.; Wadowsky, R, M.; Yee, R. 8. Suscep t ib i l i t y of w o n e l l a -h i la to Ch lor ine in Tap Water. Appl. b v i r o n . M i t r o b i o l . , 46(5): 1134-1139, 1983.
Letternan, R. 0. The F i l t r a t i o n Requirement i n t h e Safe Drinking Water Act Amendments of 1986. .U.S. EPA/AAAS Report, August 1986.
Logsdon, 6. S. Com arison of Some F i l t r a t i o n Processes Appropriate for
a t Calgary Giardia Conference, Calgary; Alberta, Canada,' February 23-25, 1987b.
Cyst R m v a P . USEPA Drinking Water Research Division; Presented.
Markwell, 0. D., and Shortridge, K. F. Possible Waterborne Transmission and Maintenance of In f luenza V i ruses in Domestic Ducks. Applied and Environmental Microbiology, Vole 43, pp. 110-116, January, 1981.
Morand, J . , M.; C. R. Cobb; R. M. Clark; Richard, G. S. 'Packa e Water Treatment Plants, Vol . 1, A perfomance Evaluation. EPA-600/2-b-O08a, USEPA, HERL, Cincinnat i , Ohio, Ju l y 1980.
Morand, 3. U,; Young, M. 3. Performance Character is t ics o f Package Water Treatment Plants , Project Sunrmary. EPA-600/52-82-101 , USEPA, MERL, Cincinnati, Ohio, March,. 1983.
Muraca, P.; Stout, 3. E.; Vu, V. L. Comparative Assessment of Chlor ine, Heat, Ozone, and UV L i g h t f o r K i l l i n g Lg&nellp mi la Within a Mode1 Plumbing System. Appl Environ. Microbiol. , 53(2):447-453, 1987.
Notestine, T., Hudson, 3. Class i f i ca t ion o f Drinking Water Sources as ,Surface or Grbund Waters. Final Project Report. Office of Environmental
-3 -

Health Pro f a m i Washington Department o f Soc ia l and Health' Services, August' 1 d Po nter,. S. F. B.; Slade, J. S. The Removal of Viruses by Slow Sand
Pr inted i n Great Br i ta in. * F d t r a t i o n , Prog. Wat., Tech. Vol. 9, pp. 75-88, Pergamon Press, 1977.
Randall, A.D. Movement of Bacteria From a River t o a Municipal Uel l - A Case History. Atnerican Water Works Association Journal. Vol. 62, No. 11, p. 716-720. ,' November 1970.
Rice, E.W.; Hoff, J.C. Inac t iva t ion o f Giardia c s t s by Ul t rav io le t Radiat ion. Appl. Environ. Microbfol. 42: 546447, 1 t 81.
Robtck, 6. e.; Clarke, N. A.; Dostal, K. A. Effectiveness o f Water :.Treatment Processes i n Virus Removal . 3. AUWA, 54( 10) :1275-1290, 1962.
Robson, C.; Rice, R.; FuJikawa, E.; Farver, B. . Status o f U.S. Drinking Water Treatment Ozonation Systems, presented at IOA Conference, Myr t le Beach, SC, December 1988.
Rose, 3 . $rvDtosDor id iu i n Water; Risk o f Protozoan Waterborne l rans- mission. Report prepared for the Office of Drinking Water, U.S. €PA, S u m r , 1988.
Rubin, A. Factors Af fect ing the Inact ivat ion ., o f Giardia Cysts by Monochloramine and Comparison with other Disinfectants. Water Engineering Research Laboratory, Cincinnati , OH, March 1988a.
Rubin, A. "CT Products fo r t he I nac t i va t i on of Giard ia Cysts by Chlorine, Chloramine, Iodine, Ozone and Chlorine Dioxiden submitted for publi ,catfon i n 3. AWWA, December 1988b.
Slezak, L.; Sims, R. The Appl icat ion and Effectiveness of Slow Sand F i l t r a t i o n i n the United States. ' J.AUUA, 76(12):38-43, 1984.
Sobsey, M. Detection and Chlor ine Dis infect ion of Hepatitus A i n Water. CR-813-024. €PA Quar ter ly Report. Oecembcr 1988. * .
Sto lar ik , 6.; Chr is t ie , D. Pro ject ion o f Ozone, C-T Values Lor Angeles Aqueduct F i l t r a t i o n P l a n t , 1988.
U. S. Environmental Protection A ency, Of f ice o f Dr ink ing Water, C r i t e r i a and Standards Div is ion. Manua s for Evaluat ing Publ ic Dr inking Water Suppl ies, 1971 . U. S. Environmental Protection Agency, Of f i ce o f Dr ink ing Water. . Pub1i.c N o t i f i c a t i o n Handbook for Drinking Water Suppliers, May 1978.
U. S. Environmental Protection Agency, O f f i ce o f Ground Water Protection. . Guidelines for Appl icants for State Wellhead Protection Program Assistance Funds Under the SDWA, June 1987a.
, .
-4- -- .
U. 5. Environmental Protection Agency, Office of Ground Uater Protection. Guidelines fo r Delineation of Wellhead Protection Area, June 1987b.
U. S. €nvironemtal Protection A ency, Office of Drinking Water. Workshop on Emerging Technologies for Dr P nking Water Treatment, April, 1988a.
U. S. Environmental Protection Agency, Office of Drinking Water. Technologies and Costs for the Removal o f Microbial Contaminants from Potable Water Supplies, October, 1988b.
World Health Organization Collaborating Center. Slow Sand Filtration o f Supplies in Developin Countries. Report o f .an Interna-
raiser Meeting, Nagpur, In !!I ia, Bulletin Series 16, September
.

- .
APPENDIX A
EPA CONSENSUS METHOD FOR WADI4 CYST ANALYSIS
. .

Nethods of Testin; for Cisrdia i n Water (George (Jay:. ;sccncelos, k g i m s ; Nicrobiologis:, Region 10 L;1bcr3tcrl.*, Nanchester, hbhington)
Background: .-
Although recent development of an excystation technique by Drs. Bingham, jkyer, Rice and Schaefer could in future lead to developing cultural rethois, a t this tire no reliable methods exist for culturing Giardia', cysts from u t e r samples. At present, the only.practica1 method for detemining the presence of cyst; i n water is by direct microscopic examination of s a q f e concentrates.
Microscopic detection in water-sample concentrates i s n ' t an ideal process. Finding and identifying the cysts relies almost entirely on the training, skill, experience and persistence of the examiner. (And it is a skill not widespread m,ong water- sqply laboratories. ) But despite i ts limitations , microscopic identification is currently the best method ;<e have.
Years ago, the basic a s s q t i o n was made that in order t o find GiarBia c::st; , i n water, some form of sample concentration was necessav. xs m s ~ 3 5 ; > , .. 'labs were u i n g membrane f i l t e r s h' i th a porosity of 0.45 p . with fet es:?;tions, these atternpts \\.ere unsuccessful. The center for Disease Control has t r ie3 particulate f i l tration, wi th diatomceous earth as the !licdiUm. This rezcvec! the cysts irom the water, but the cysts couldn't be separated fron the particles of diatomaceous earth.
Mth the recent increase i n the incidence of uaterborne giardiasis, iur=!er efforts, have been made t o improve the detection method. An ideal method \ml< be one that recovers a l l cysts i n a water s q l e rapidly, cheaply and s iT1y; al1ok.s rapid detection, identification and quantification; and provides
. infomation on the viabi l i ty of and/or infectivity potential of cysts derexe2.
Unfortunately, no such method exists. The nethods presently available can be broadly separated into two general stages: primary concentration ani processing (see Table 1 on next page), and detection and ident i f icat im . (see Table 2 on next page)
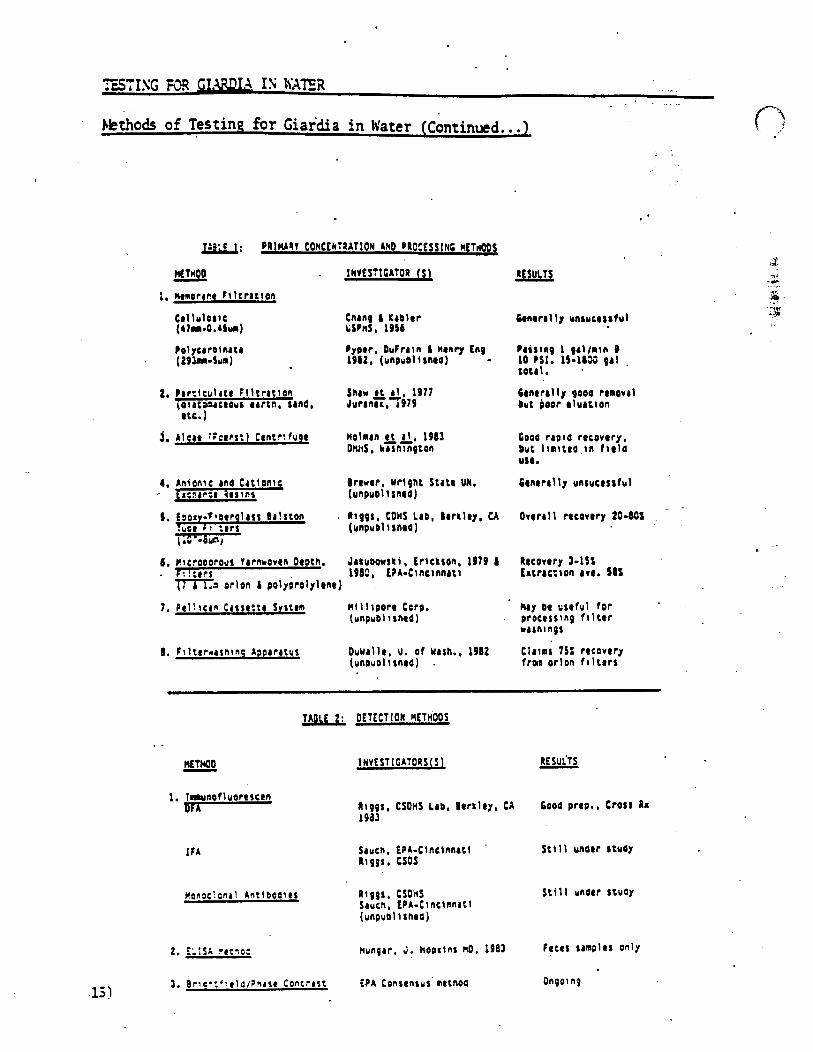
. .- hkthods of Testing for Giardia in Water (Continwd.. .)
crlluloric (41m-O.45r)
Cnrn9 I Krolrr USPnS, 1956
Crnrrtlly unsucrssful
.13 1
. .
Polyccroinrtr PIprr, Oufrcin I Henry En9 Pairin9 1 9cllarn (29 ln -Sd) 1982, (unoualirnra) - 10 PSI. 15-183 9rl ,
total.
nolncn 2 11, 1983 Owls, brsnlngton
Weurr. wrlght Srttr UA. Cenerr~ly unsucrssful (unouallsnra)
1 . Prlliean Ccssr?tr System Millrporr Cero. (unpublisnrd)
8. Flltrrarsnlnp A o o c r m s Duwcllr. u. of Ycsh., 1982 C l e m 75: recovery (unouolrsntdl . frw orlon flltrrt
.. - METHOD -
1. lmunofluorrscen mA
IFA
TAOCf 2: DETECTfON RETHOOS
Seucn, LPA-Cfncinnctl ' Still unatr stuoy R l qgs , CSDS

Copies of Table 1 and Table 2 are also sham i n Appendix C, along wi th further detail about the methods.
EP.4 Consensus Nethod:
In 'September, 1980, the EPA convened a workshop on Giardia methodology i n Cincinnati. Its main purpose was to identify the best available methodolog;, and t o agree on a reference nethod. 7he five labs i n attendance recognized '
that any proposed method would be based in large part on opinions and perscna: preferences rather than on hard data, but that agreeing on a consensus r?edi:~i . would promote unifoxmity and provide a basis for future comparisons. Cur lab has modified the EPA consensus method s l ight ly for our w e . This rc.!!ci is outlined below.
Fi l ter unwound into quarters I
JI Rinsed i n d i s t i l l ed water with polysorbate 20
3. .1 .1 J f .
Settled overnight, or centrifuged
Collecz sediment and add 3 Formaldehyde . in PBS
Settled overnight, or centrifuged .
Collect sediment
1 7 1 8. L Sucrose or 5-
Percoll-sucrose gradient
4 41 g.
.1 ZnSOd Flotation
Nicroscopic obsenation of the entire concentrate (Brigktfield/Phase-contrast)

APPENDIX 8 INSTITUTIONAL CONTROL OF

APPENDIX 8 JNSTITUTIONAL CONTROL OF
l&gjonellq i s a genus name for bacteria coaaonly found in lake and ,river waters. Soate Species of this genus have been identified as the cause o f the disease 1eg.iOnelloSiS. In particular, w o n e l l a pneumoohila has been identified as the cause of Legionnaires disease, the pneumonia .
form of legionellosir and with Pontiac Fever, a nonpneumonia disease. Outbreaks of legionellosir are primarily associat.ed with fnhalation of water aerosols or, less cOmmOnly, with drinking water containing -ne114 bacteria with specific virulence factors not yet identified. Foodborne outbreaks have not been reported (USEPA, i985).
. As discussed in this document, treatment requirements for disinfec- tion o f a municipal water supply arc thought to provide at least a 3 log reduction of w l l q bacteria (see Section 3.2.2). However, some recontamination may occur in the distribut.ion systcm due to cross connections and during installation and repair of water mains. It has been hypothesized that the low concentrations o f j&gjonellp entering bui.ldings due to these sources may colonize and regrow in hot water systems (USEPA, 1985). Although all of the criteria required f o r colonization are not known, large institutions, such as hospitals, hotels,. and public buildings with recirculating hot water systems seea to be the most susceptible. The control of W o n c l l p in health care institutions,
. such as hospitals, i s particularly important due to the increased susceptibility o f many of the patients. 'The colonization and growth of Lcaionclta in drinking water primarily occurs within the consumer's plumbing systems after the water leaves the distribution system.. Therefore, the control o f these organisms must be the consumer's responsibility. This appendix i s intended to provide guidance to these . inst i tut ions for the detection and control o f the J&g&mlla bacteria.
* .
8.1 MONITORING
It is sug.gested that hospitals, and other institutions w i t h
potential for the growth o f U e l h , conduct routine monitorin.9 o f
B- 1
r' -~ .
the i r ho t water systems at least quarterly. ' The analy t ica l procedures for the 'detection of these organisms can be found i n Section 012.1 "-" o f the 16 th ed i t ion o f Standard'-. Samples should be taken at , or c losely fo lhy ing, the hot water storage reservoir and from a number o f shower heads. I t i s r e c b e n d e d t h a t showers wi th the least frequent usage be included i n the sampling program. follow-up -_ _.
t e s t i n g i s suggested f o r a l l p o s i t i v e i n d i c a t i o n s p r i o r t o t h e i n i t i a t i o n f '::,
of any remedial masures. I f the the presence o f -el l a is confirmed, then remedial measures should be taken. .Although the regrowth o f k a i o n e l l p i s comonly associated with hot water systems, hot and cold water interconnections may provide a pathway for cross contamination. For t h i s reason, systems detecting j.ggione11q i n h o t water systems should also monitor t he i r co ld
B .2 TREATMENT
Because the
water systems.
primary route o f exposure t o w e l l 4 i s probably t
inhalation, rather than ingestion, it i s recomaended tha t d is in fec t ion procedures include an i n i t i a l shock treatment pe r iod ' to d i s in fec t shower 4 "4-. X". e&
heads and hot water taps where the bacteria may colonize and l a t e r become - ... airborne. The shock treatment period should also include disinfection of hot water tanks'. A f t e r t h i s time, a point-of entry treatment system can - . '* be ins ta l led to p rov ide con t inua l d is in fec t ion o f ' the ho t water system.
,, * -
._ 1 * I
6.2.1 l & j j b The most applicable method f o r t h e i n i t i a l d i s i n f e c t i o n of stiower
heads and water taps i s heat eradication. The f i t t i n g s can be removed and held a t temperatures greater than 60 C f o r a t l eas t 24 hours. Disinfec- t i o n of f i t t i n g s can also be achieved by soaking or r ins ing w i th a strong chlorine solut ion. When soaking the f i t t i ngs , a minimum chlorine strength of 50 m g / ~ should be used f o r a period o f no less than 3 hours. Rinsing
' Monitoring frequency based on the reported rate o f Legionella regrowth observed during disinfection studies (USEPA, 1985)

0
with chlorine should be performed wi th more concentrated solutions. Care must be taken not t o corrode the finished surface on the f i t t ings. , Comnercially available bleaches, f o r example, are typ ica l ly 5.25 percent ch lor ine by weight.
..
8.2.2 -Term Dis in fect ion && - Numerous studies have shown that increarlng the hot water
t q e r a t u r e t o 50 - 70 C Over a perlod of several hours may he lp t o reduce and i n h i b i t m i o n e l l a populations. However, .soate instances o f regrowth a f t e r 3 t o 6 months have been reported. I n these cases, the authors have concluded tha t a per iod ic schedule of short-term temperature elevation I n the hot water. may be an effect ive control against legionel losis (USEPA, 1985; Muraca, 1986). Dis in fect ion by t h i s method also requires periodic f lushing of faucets and shower heads with hot water. Although heat eradication i s eas i l y implemented and re la t i ve i y inexpensive, a disadvan- tage i s the potent ia l need for per iodic d is infect ion. The potent ia l for scalding from the unusually hot water a l so ex is ts (USEPA, 1985; Muraca, e t a l . 1986)
ch lo r ina t iqn - Several studies have suggested tha t a f ree ch lor ine residual o f 4 mg/L will e r a d i c a t e m i o n e l Lp growth. There i s , however, a p o s s i b i l j t y for recontamination i n areas o f the system where the chlor ine residual drops below t h i s l eve l . A str ingent monitoring program i s therefore requi red to ensure that the proper residual i s maintained throughout the systea and under varying f low condttions. It may also be necessary t o apply a l a r g e i n i t i a l c h l o r i n e dose to mainta in the 4 m g / L residual. This may cause problem of pipe corrosion and, depending an- water qual i ty , h igh leve ls o f t r iha lmthanes (THMs).
Oronc - Ozone is the aost powerful oxidant used in the po tab le water' i n d u s t j . One study indicated that an ozone'dosage o f 1 t o 2 mg/L was suf f ic ient t o provide 8 5 log reduct ion of (Muraca, e t a l . 1986) . Ozone i s generated by passing a high voltage current .of e l e c t r f c i - t y through a stream o f d r y a i r or oxygen. The
. e lec t r i c i t y requ i res proper handling t o avoid conditions. The ozone i s applied by bubbling the through the water i n a chamber ca l led a contactor,
8-3
use o f h igh voll tage creat ing hazardous
ozone containing gas

One of the disadvantages of t h i s system i s i t s complexity. It requires a d r y a i r or oxygen source, a generator, and a contactor sized t o provide 2 t o 5 minutes of contact time and an ambient ozone monitor. ~ 1 1 materials in contact with' the ozone must be constructed of spec i i l Ozone resistant mater ia ls to prevent leakage. Leak detection i s also required because of the toxic nature of ozone and possible explosive conditions i f ' pure oxygen i s used f o r generation.
Another disadvantage o f ozonation i s t h e r a p i d decomposition of ozone residuals. The h a l f - l i f e of ozone i n drinking water i s t y p i c a l l y around 10 minutes. * This makes i t d i f f i c u l t , i f not impossible, t o maintain a residual throughout the water system and may require the use of a supplementary dis infectant such as chlor ine or heat. For these reasons it i s not thought that ozonation i s v i a b l e for inst i tut ional appl icat ions.
y l t r a v i o l e t I r r a d i a t i o n - U l t rav io le t (UV) l i g h t , i n the 254 nanometer wavelength range can be used as a dis infet tant . UV systems typ ica l ly conta in low-pressure mercury vapor lamps t o maximize o u t p u t ' i n the 254 nm range. Water enter ing the un i t passes through a clear cyl inder while the lamp i s on, exposing bac ter ia to the UV l i g h t . Because UV l i g h t can not pass through ordinary window glass, special glass or quartz sleeves are used t o assure adequate exposure. '
The in tens i t y o f UV i r r a d i a t i o n i s measured i n microwatt-seconds per square centimeter (uW=s/cm2) . Several studies have shown a 90 percent reduct ion of u n o 1 1 a with .a UV dosage o f 1000 - 3000 uW-s/cm2, compared t o 2000 t o 5000 uW=s/cm2 for E. col 1, Iplmonella and pseudomonas (USEPA, 1985). I n another study, a 5 log reduction of -el la was achieved a t 30,000 uW=t/cm2; and the reduction was atore rapid than with both ozone and ch lor ine d is in fect ion (Muraca, e t a l . 1986) .
The major advantage o f UV d i s i n f e c t i o n i s t h a t i t does not require the addit ion of chemicals. This eliminates the storage and feed problems associated with the use of chlor ine, chlor ine.dioxide and chloramines. I n addit ion, the only maintenance required is per iod ic c leaning of the quartz' sleeve and replacement of bulbs. UV monitors arc available which measure the l ight intensi ty reaching the water and provides a s ignal to the user when maintenance i s required. These monitors are Strongly suggested for any application of Uv i r rad ia t ion fo r d is in fec t ion . It Should be noted,
however, thht these Mn i to rS measure l i gh t i n tens i t y which may not be d i rec t l y re la ted to d is in fec t ion e f f i c iency . The UV lamps should therefore not be operated past the manufacturers use ra t i ng even wi th a continuous UV Isonitor instal led.
Another disadvantage of UV dis infect ion, as with otonation, i s t h a t a residual i s not provided. A supplementary disinfectant my' therefore be required to provide protection throughout the systm. . In addit ion, t u r b i d i t y may in te r fe re with UV dis in fect ion by blocking the'passage of l i g h t t o t h e microorganisms.
8.3 OTHER CONTROL METHODS
I n add i t i on t o chemical and heat disinfection, there are system modif icat ions which can be made t o i n h i b i t w e t l a growth. Many ins t i t u t i ons have large hot water tanks heated by co i ls located midway i n the tank. This type o f design may r e s u l t i n areas near the bottom of the tank which are not hot enough t o k i l l Ltaiontlla; Designing tanks for ' more even d i s t r i b u t i o n o f heat may help limit bacter ia l co lon izat ion. In addit ion, sediment bu i ld -up in the bottom o f storage tanks provides a
* surface .for colonization. Periodic 'draining and cleaning may therefore help control growth. Addit ional ly, other studies have' found tha t ho t water systems w i th stand-by hot water tanks used for m e t i n g peak demands, s t i l l tested posi t ive for j .ggjgnellq despite using elevated temperature (55 .C) and ch lor inat ion (2 ppm) (Fisher-Hoch, e t a l . 1984,) Stringent procedures for the c leaning, d is infect ion and monitoring o f these stagnant tanks should be set up and followed on a regular basis..
I n another study, it was reported that black rubber washers and gaskets supported Leaionella growth by providing habitats protected from heat and chlorine. It was found, a f te r replacement of the black rubber washers with Proteus 80' compound washers, t ha t it was not possible ta detect Leaionel lg from any o f t he f i x tu res (Colbourne, e t a l . 1984).

. .
t ion. Four nethods o f d i s
presented i n t h i s appendix; i r rad iat ion. All f o u r o f
’ m n e l l q . U l t r a v i o l e t
8.4 CONCLUSIONS
bacter ia have been iden t i f i ed as the cause of the disease leg ionc l los is , o f which the -st serious fom i s Legionnaires Qisease, Although conventional water treatment practices are sufficient t o provide dis infect ion of w o n e l l $ , regrowth i n buildings with large hot water, heaters, md espec ia l l y w i th rec i rcu la t ing ho t water systems, i s a s ign i f i can t problem. This problem i s o f p a r t i c u l a r concern tohea l th care ins t i tu t ions , such as hospitals, where pat ients may be owre susceptible to the disease.
This guideline suggests a program of ’ quarter ly monitor ing for J,ggioneUp. I f the monitoring program suggests a potent ia l problem wi th these organisms, a two stage disinfection program i s suggested consisting of an i n i t i a l p e r i o d o f shock treatment followed by long term disinfec-
infect ion for the control of Lcaionella were . heat, chlor inat ion, ozonation, and u l t r a v i o l e t the methods have proven e f f e c t i v e i n k i l l i n g i r rad ia t i on and heat eradication are the
suggested methods o f d i s in fec t i on due, p r imar i l y , to advantages i n monitoring and maintenance. However, s i te spec i f i c fac to rs ’ may make chlor inat ian or otonation more feas ib le fo r cer ta in ‘app l i ca t ions . In addition, it i s reconmended tha t a l l ou t l e t s , f i x tu res and shower heads be inspected and a1 1 black rubber washers and gaskets replaced with materials which do not support the growth of wllq organisms. ’ ’
One problem associated wi th the appl icat ion of point-of-entry treatment systems i s t h e l a c k o f an approved progrim f o r c e r t i f y i n g performance claims. However, the National Sanitation Foundation ( N U ) Ann Arbor, H I an unoff icial, non-profi t organization, does have a tes t ing program t o ve r i f y d i s in fec t i on e f f i c i enc ies and materials of const.ruction. Cer t i f i ca t ion by the NSF, or other equivalent organizations, i s desirable when select ing a treatment ‘system.
8-6

APPENDIX C
DETERMINATION OF DISINFECTANT CONTACT TIME
APPENDIX C TION OF D I S I N F W N T CONTACT T M
As indicated i n Section 3, for pipelines, rill f l u i d passing through the pipe i s assurncd t o have a detention time q u a l t o the theoret lcal or mean residence time a t a par t i cu la r flow rate. However, i n mixing basins, storage reservoirs, and other treatment plant process u n i t s , u t i l i t i e s will be required to determine the contact time for the calculat ion of C f through tracer studies or other methods approved by the Primaw Agency.
For the purpose of determining compliance with the d is infect ion requirements o f the SWTR, the contact time o f mixing basins and storage reservoirs used in ca l cu la t i ng Cf should be the detention ti.# a t which 90 percent o f the water passing through ' the 'unit i s retained within the basin. This detention time was designated as T,, according t o the convention adopted by Thirumurthi (1969). A p ro f i le o f the flow through the basin over time can be generated by tracer studies. Information provided by these studies i s used for estimating the detention time, Tlo, for the purpose of calculat ing CT.
This appendix i s d i v i d e d i n t o two sections; The. f i r s t sec t i on '
* presents a b r i e f synopsis of t racer study methods, procedures, and data evaluation. In addi t ion, examples are presented f o r conducting hypo- the t ica l t racer studies t o deterwine the T,, contact .time i n a clearwell. The second section presents a method o f determining T,, frpar theoret ical detention t imes In sys tem where i t i s impract ical to conduct t racer studies.
. c.1 TraccJl S t W
C.l.l flow cmdi t ionz Although detention tian i s proport ional to flow, i t i s not generally
a l inear function. Therefore, tracer studies are needed t o establ i s h
.detention t imes for the range o f flow rates experienced wi th in each disinfectant section.
As discussed i n Section 3.2, a single flow rate my not Characterize the flow through the en t i re system. With a series of reservoirs,

. . c l e a ~ l l s , and Storage tanks flow will. vary between each port ion of the r' system.
In f i l te r p lan ts , the p lan t flow i s r e l a t i v e l y u n i f o m from the intake through the f i l te rs . An increase or d u c t i o n i n the intake pumping capacity wili iqart a proportional change i n flow through each process u n i t p r i o r t o and including the filters. Therefore, a t a constant intake pumping rate flow variat ions between disinfectant sections within a treatment plant, excluding clearwells, are l ikely to be small , and the * .
the design capacity o f the plant, or plant flow, can be considered the nominal flow ra te through each individual process un i t w i th in the p lan t . Clearwells may operate a t a dif ferent flow rate than the rest of the plant, depending on the pumping 'capacity.
Ideal ly, tracer tests should be perfonned fo r a t leas t four flow rates that span the ent i re range of flow for the section being tested. The flow rates should be separated by approximately equal in te rva ls to span the range o f operation, with one near average flow, two greater than average, and one less than average flow. the flows should also be selected so that the highest test flow ra te i s a t leas te 91 percent o f the highest flow rate expected t o ever occur i n t h a t section. Four data
- points will assure a good def in i t ion of the sect ion's hydraul ic prof i le. the resul ts of the t racer tests performed . for d i f ferent flow rates
should be used t o generate p lo t s o f T,, V S . Q f o r each section i n the. system. A smooth l i n e i s drawn through the points on each graph to create a curve fm which T,, nay be read for the corresponding'Q a t peak hourly . .
flow conditions. This procedure i s presented i n Section C.1.8. It way not be p r a c t i c a l f o r a l l systems t o conduct studies at four
flow rates. The number of t racer tests that are p rac t ica l to conduct i s dependent on s i te-speci f ic rest r ic t ions and resources avai lab le to the. SYSfm. S Y ~ ~ S wi th 1 i laited resources can conduct a minimum of one t racer test for each dis infectant sect ion at a flow rate of not less than 91 percent of the highest flow rate experienced at that section. If Only one t r a c e r t e s t i s performed, the detention timi determined by the tes t may be used t o provide a conservative estimate i n C t calculat lons for that sec t ion fo r a l l flow rates .less than or equal to the t racer test f low rate. T,, i s UverstIy propor t ional to flow ra te , therefore, the a t a
c-2
..
flow rate 0 t h than that which the tracer study was conducted (T,os) can be determined by mult ip lytng the f,, frm the t racer study (TIOT) by the r a t i o of the t racer study flow rate to the desired flow rate, i.e.,
f i a t .. ~ I O T X ff,/QO where
TtQS = t,, a t system flow rate f lOl T,, at t racer f low ra te Ql 9 tracer study flow rate QD = s y s t m flow ra te
. ' . .
The gos t accurate tracer t e s t results are obtained whim flow i s constant through the section during the course of ' the test. Therefore, the t racer study 'should be conducted a t a constant ' flow whenever pract ical , For a treatment plant consisting of two or amre equivalent process trains, a constant f low tracer test can be performed on a section of the p lant by holding the flow through one of the trains constant while operat ing the para' l le l t ra in(s) to absorb any flow variations. Flow var ia t ions dur ing t racer tests in systems wi thout para l le l t ra ins or with single clearwells and storage reservoirs are more d i f f i c u l t to avoid. I n these i,nstances, T,, should be recorded at the average flow ra te over the course of the test .
C.1.2 Q$&r Tracer St-atiou In add i t i on t o flow conditions, detention times -detemined by t racer
studies are dependent on the water level in the contact basin. This i s part icular ly pert inent to storage tanks, reservoirs, and clearwells which, i n additiofi to being contact basins for dtsinfection are also often used as equal izat ion s torage for d is t r ibut ion system demands. I n such instances, the water levels i n the reservoirs vary t o meet the syste! demands. The actual detention tint o f these contact basins will also vary depending on 'whether they are emptying or f i 1 1 ing .
For so1116 process units, especial ly sedimentation basins which are operated a t a near constant level, that is, 'flow i n equals flow out, the detention time detemined by tracer tests i s va l id fo r ca lcu la t ing CT when the basin i s operating at water levels greater than or q u a l t o t h e l e v e l a t which the test was performed. I f the water level during testing i s
c-3

higher than the noma1 operating level, the resulting concentpation p ro f i l e Will Predict an erroneously high detention time. Conversely, *
ex tmm1y '~ow water levels during testing may lead t o an overly COnserVa- t ive detent ion time. Therefore, when conducting a t racer study t o ' determine the detention ti-, a water leve l a t or s l i g h t l y below, *but not above, the normal minimum operating level i s recomended.
For many plants, the water l e v e l i n a clearwell or storage tank varies between high and low l e v e l s i n response to d i s t r i bu t i on system demands. I n such instances, i n order to ob ta in a conservative.estiMte of the contact time, the tracer study should be conducted during a period when the tank level i s f a l l i n g (flow out greater than flow in). This procedure will provide a detention ti= for the contact basin which i s also val id when the water level i s r i s i n g (flow out less than flow in ) from a level which i s a t or above the level when the T,, was determined by the tracer study. Whether the water l e v e l i s constant or variable, the t racer study f o r each section should be repeated for several d i f ferent flows, as descrjbed i n t h e previous section.
level, maintaining a CT t o comply with inactivation requtrunents may be impractical. Under such operating conditions, a reli.able detention time 1s not provided for disinfection. However, the system may i n s t a l l a weir t o ensure a minimum water level and provide a rel iable detent ion time.
Systems comprised o f storage reservoirs that experience seasonal variat ions i n water levels may perfom tracer studies durihg the various seasonal conditions. For these systems, t racer tests should be conducted a t several flow rates and representative water levels that occur for each seasonal condition. The resu l t s o f these tests can be used t o develop hydraul ic prof i les of the reservo i r for each water level. These profi les' can be p lo t ted on the same ax is o f T,, VS. Q and may be used for calculat- ing C t for dif ferent water levels and flow rates.
Detention fim my also be influenced by differences i n water temperature wi th in the system. For plants . w i th potent ia l for thermal strat i f icat ion, addi t ional t racer studies are suggested under the various seasonal conditions which are l i k e l y t o occur. The Contact times detemined by the tracer studies under the various seasonal Conditions
c-4
For clearwells which are operated with extreme var ia t ions in water .

should remain va l i d as long as no physical changes are aade t o the.mixing basin(s) or storage nservoir(s).
As. defined i n Section 3.2.2, the port ion of the system with a measurable contact time between two points o f disfnfect ion or residual. monitoring i s r e f e r r e d t o as a section. For systems which apply dis infectant(s) at more than one point, or choose to p ro f i l e t he res idua l from one point of application, tracer studies should be conducted t o determine TI, f o r each section containing process uni t (+ The Tlo for a section aay or nay not include a length of pipe and i s used along with the residual disinfectant concentration prior t o the next disinfectant appli.. cat ion or monitoring point t o determine the CTC,,, f o r t h a t section. The inac t i va t i on ra t i o for the section i s then determined. The t o t a l inact ivat ion and log inact ivat ion achieved i n the system can then be determined by sunning the inact ivat fon ra t ios for a l l sect ions as explained i n Section 3.2.2.
configuration, tracer studies only need t o be conducted on one o f t h e units. The resul t ing graph of TI, vs. flow can be used t o determine T,, for a1 1 ident ical uni ts.
Systems wi th a w e than one section i n t h e treatment plant 'may
For systems that have two or more un i ts o f ident ical s ize and .
determine Tl0 for each section - by individual tracer studies through each section, or - by one tracer study across the system
If possible, tracer studies should be conducted on each sec t ion to deternine the TI, f o r each section. I n order? t o minimize the t h e needed t o conduct studies on each section, the tracer studies should be started a t the las t sec t ion o f the treatment t r a i n p r i o r t o t h e f i r s t customer'and - completed with the f i r s t sec t i on o f the system. Conducting the t racer studies i n th is order will prevent the interference o f residual tracer material with' subsequent studies.
However, i t may not always be prac t i ca l f o r systems t o conduct. tracer studies for each section because of t ime and manpower constraints. I n these cases, one tracer study may be used t o determine the TI0 values
c-5

for a l l of the sections a t one flow rate. This procedure involves the following steps:
1. Add tracer at the beginning o f the furthest upstream disinfec- t i o n section.
2. . Measure the tracer concentrat ion at the end o f each dtsinfec- , t i o n section.
3. Determine the T,, t o each monitoring point as ou t l i ned i n t he data evaluation examples presented i n Section C.1.7.
4, Subtract T,, values o f each o f the upstream sections frola the overal l T,, value t o deternine the T,, o f edch *d.ownstream section.
This approach i s v a l i d f o r a series of two or more consecutive sections as long as a l l process units within ,the sections experience the same flow condition. This approach i s i l l u s t r a t e d by Hudson (1975) i n which step-dose tracer tests were employed t o evaluate the baffl ing characterist ics of f locculators and s e t t l i n g basins a t s i x water treatment plants. A t one plant, tracer chemical was added to the rap id mix, which. represented the beginning of the furthest upstream dis in fect ion sect ion in the system. Samples were collected frotn the f locculator and se t t l i ng basin outlets and analyzed t o determine the residence-tire characteristics for each section. Tracer measurements at the f locculator out let indicated
' an approximate T,, o f 5 minutes through the rapid mix, interbasin piping and flocculator. Based on tracer concentrat ion monitoring at the sett l ing basin outlet, an approximate T,, o f 70 ainutes was determined for the
- conrbined sections, including the rapid mix, interbasin piping, floccu- la tor , and se t t l i ng basin. The flocculator' l,, o f 5 minutes was subtracted from the combined sections' T,, o f 70 minutes, t o determine the T,, f o r t he set t l ing basin alone, 65 minutes.
This approach may also be applied i n cases where disinfectant application and/or residual monitoring i s discontinued a t any poi,nt between tm, or more sections with known T,, values. These T,, values may
For Ozone contactors, f locculators or any basin containing mixingl tracer studies should be conducted fo r t he range of mixing used i n the '
' be swmd to ob ta in an equivalent f,, fo r the combined sections.
C-6

process. I n Ozone COntaCtOrS, a i r or oxygen should be added i n l i e u of ozone t o prevent degradation of the t racer. The flow rate of a i r or oxygen used for the contactor should be applied during the study t o simulate actual operation. Tracer studies should then be conducted a t several airloxygen t o water rat ios to provide data for the cotnplett range of ra t ios used at the p lant. For flocculators, tracer studies should be conducted for var ious mixing intensi t ies to provide data for the complete range o f operat i ons
.I
C.1.3 fraccr St- This section discusses the two amst c0rmK)n methods of t racer
addit ion employed i n water treatment evahations, the step-dose method and the slug-dose method. Tracer study Isathods involve the appl icat ion of chemical dosages t o a system and tracking the resul t ing ef f luent concentration as a function of time. The eff luent Concentration p r o f i l e i s evaluated t o determine the detention time, T,,.
While both t racer test methods can use the same tracer materials and involve measuring the c.oncentration o f t racer with time, each has d i s t i n c t advantages and disadvantages with respect to tracer addit ion procedures and analysis of results.
The step-dose method en ta i l s in t roduc t ion o f a tracer chemical a t a constant dosage unt i l the concentrat ion at the desired end point reaches a steady-state level. Step-dose tracer studies are frequently employed i n drinking water applications for tho fol lowing reasons: - the resu l t i n normalized concentration VS. t ime p ro f i l e i s
d i r e c t l y use 8 t o deternine, Tto, the detention time required for calcu lat ing CT
- very often, the necessary feed equipment i s avai lab le to . provide a constant rate of application of the t racer chemical
One other advantage of the step-dose method i s t h a t t h e data may be . v e r i f i e d by comparing th,e concentration versus elapsed time p r o f i l e for
samples co l lec ted a t the s ta r t o f dosing with the profi le obtained when. the t racer feed i s discontinued.
..
c-7
I
I I
Alternatively, with the slug-dose method, a large instantaneous dose of t racer i t added to t he incoming water and samples are taken a t t h e e x i t o f the un i t over time as the tracer passes through the unit. A disadvan- tage o f t h i s technique i s t h a t very concentrated solutions are needed f o r the dose i n order t o adequately define the concentration versus tiae profi le, Intensive mixing i s therefore required to minimize potent ia l density-current effects and to ob ta in a uniform distr ibution of the instantaneous tracer dose across the basin. This i s i nhe ren t l y d i f f i cu l t '*
under water flow condit ions of ten exist ing at in lets to basins. Other disadvantages of using the slug-dose aethod include: - the concentration and volume of the instantaneous tracer dose
must be careful ly computed t o provide an adequate tracer prof i le a t the e f f luent o f the bas in
- the resulting concentration vs. t ime prof i le cannot be used t o d i rec t l y determine TI, without further manipulation
- a aass balance on the treatment section i s required to determine whether the tracer was cqcnpletely recovered . .
One advantage o f t h i s rn thod i s t ha t it may be appl fed where chemical feed equipment i s not available at the desired point of addition, or where the equipment avai lable does not have the capacity t o provide the necessary concentration of the chosen tracer chemical. Although, i n general, the step-dose procedure offers the greatest simplicity, both methods are.. theoretically equivalent for determining TIq. Either method i s acceptable f o r conducting drinking water tracer ttudles, and the choice o f the method may be determined by s i te-speci f ic constraints or the system's experience.
. ..
*
C.1.4 fraccr Sel- . An important step i n any tracer study i s the select ion of a chemical.
t o be used as'the tracer. Ideally, the selected tracer chemical should be readily available, conservative (that is, not consumed or ranoved during treatment), easily monitored, and acceptable for use i n potable water sup-
. p l ies . H is to r ica l l y , many chemicals have been used in t racer studies that do no t sa t is fy a l l of these cr i ter ia, . including potassium permanganate, alum, chlorine, and sodium carbonate. However, chloride and fluoride are
c-a
. . the most Comon tracer chmicals employed i n drinking water plants that are nontoxic and approved for potable water use. Rhodamine UT can be used as a f luerescent tracer ' in water flow studies i n accordance with the fol lowing guide1 ines: - Raw water concentrations should be l imi ted t o a .haximum
- Drinking water concentations should not exceed 0.1' Ug/L.
- Studies which results i n human exposure t o the dye w s t be b r i c f and i nf requent . .-
- Concentrations as low as 2 ug/L can be used in t racer studies because,of the low detection level i n the range o f 0.1 t o 0.2
concentration o f 10 q / L .
W L -
The use o f Rhodamine 8 as a t racer i n water flow studies i s not recom- mended by the EPA.
The choice o f a t racer chemical can be made based, i n p a r t , . on the selected dosing method and also on the ava i l ab i l i t y o f chemical feeding equipment. For example, the high density of concentrated sa l t so lu t ions .
and the i r po ten t ia l for inducing density currents, usually precludes chlor ide and f luor ide as the selected chemical f o r slug-dose tracer tests.
Fluoride can be a convenient t racer chemical f o r step-dose tracer tes ts of clearwells because i t i s frequently appl ied for f inished water treatment. However, when f luor ide i s used in t race r t es ts on c l a r i f i e r s , allowances 'should be made f o r fluor.ide t h a t i s absorbed on f l o c and se t t les out o f water (Hudson, 1975). Additional considerations when using f luor ide i n tracer studies include: - i t i s d i f f i c u l t t o d i t e c t a t low levels
- many states impose a f in ished water l im i ta t ion o f 1 mg/L
the federal secondar and primary drinking water standards (MCLs) f o r f r uoride are 2 and 4 q / L , rcspcc- t i v e l y
The use o f f l u o r i d e i s o n l y recomnended i n cases where the feed quipment i s a1 ready i n place for safety reasons
c-9

I n instances where only one of two or more para l le l un i ts is tested, flow fm the other units would di lute the t racer concentrat ion pr ior . to leaving tbe plant and entering the distr ibution system. Therefore, the impact o f drinking water standards on the use of f luor ide and other tracer chemicals can be a l lev ia ted in somc cases.
C.1.5 -ition The tracer chemical should be added at the same point (s) in the
treatment t r a i n as the d is in fectant to be used i n t h e C t calculations. C.1.5.1 gteo 0 dose Mcthpd
The duration of tracer addi'tion i s dependent on the volume of. the basin, and hence, i ts theoret ica l detent ion time. I n order t o approach a ,steady-state concentration i n the water exi t ing the basin, tracer addit ion and sampling should usually be continued f o r a period of two to three times the theoretical detention time (Hudson, 1981). It i s not necessary t o reach a steady state concentration i n the exi t ing water t o dete'rmine Tlol however, i t i s necessary t o determine tracer recovery. It i s reconmended that the t racer recovery be determined . to ident i fy hydraul ic . characterist ics or density problems'. Generally, a 90 percent recovery i s considered t o provide rel iable resul ts for the evaluation o f Tl4.
I n a l l cases, the tracer chemical should be dosed i n s u f f i c i e n t concentration to easi ly monitor a residual a t the basin outlet throughout the tes t . The required tracer chemical concentration, i s generally depen- '
. dent upon the nature of the chosen tracer chemical, including i t s background concentration, and the nix ing character i t t ics o f the basin t o be 'tested. Recomnended chlor ide doses on the order o f 20 mg/L (Hudson, 1975) should be used for step-method tracer studies where the background chloride level i s less than 10 mg/L. Also, fluoride concentrations as 10lJ as 1.0 t o 1.5 ng/L are practical when the raw water f luor ide leve l is not s igni f icant (Hudson, 1975). However, tracer studies conducted on Systems suffering from ser ious shor tc i rcu i t ing o f flow nay require substantial ly larger step-doses . This would be necessary to detect the t racer chemical and t o adequately define the ef f luent t racer COnCentratiOn prof i le .
c-10

C.1.5.2 e Mew The durat ion o f t racer neasurcrscnts using the slug-dose acthod i s
also dependent on the volume of the basin, and hence, i t s t h e o r e t i c a l detention time. I n general, samples should be col lected for at leas t twice the basin's theoretical detention time, or un t i l t r ace r concentra- t ions are detected near background levels. I n order to ge t re l i ab le
' resu l ts fo r TI, values using the slug-dose method, i t i s recommended that the to ta l mass o f t racer recovered be approximately 90 percent of the mass applied. This guideline presents the need t o sample un t i l the t racer concentration recedes t o t h e background level. The t o t a l mass recovered during test ing will not be known u n t i l completion of the test ing and analysis of the data collected. The sampling period needed I s very ' s i te specif ic. Therefore, i t nay be he lp fu l to conduct a f i r s t run tracer test as'a screen to ident i fy the appropr iate sampllng period for gathering data t o determine T,,.
Tracer add i t ion fo r slug-dose lnethod tests should be instantaneous and provide unifonnly mixed distr ibution of the chemical . Tracer addi t ion i s considered instantaneous i f the dosing time does 'not exceed 2 percent of the basin's theoretical detention time (Marske and Boyle, 1973). One recoamcnded procedure f o r achieving instantaneous tracer dosing i s t o apply the chemical by g rav i ty flow through a funnel and hose apparatus. This method i s a l so bene f i c ia l because i t provides a means of standardita- t ion, which i s necessary to obtain reproducible results.
theoretical concentration -and basin sire. The mss of t racer added i n slug-dose t racer tes ts should be the minimum mass needed ' to obta in detectable residual measurements t o generate a concentration profi le. As a guidel ine, the theoretical concentrat ion for the slug-dose method should. be comparable' t o the constant dose applied i n step-dose tracer tests, i.e., 10 t o 20 q / L and 1 t o 2 q / L for ch lor ide and f luor ide, nspect ive- ly. The maximum mss of t racer chemical needed i s calculated by mult iplying the theoretical concentrat ion by the total basin volume. Thi.s i s appropriate for systems Mith high dispersion and/or mixing. T h i s quantity i s d i l u t e d as requi red to apply an instantaneous dose, and minimize density effects. It should be noted that the mass applied i s not
The mass o f t race r chemical t o be added i s determined by the desired .
c-11

l i k e l y t o g e t cocnpleteiy mixed throughout the to ta l volume of the basin. Therefore, the detected concentration might exceed theoret ical concentra- t ions based on the t o ta l volume of the basin. for these cases, the mass of chmica l t o be added can be determined by mult ip ly ing the theoretical concentration by only a port ion of the basin volume. An example**of t h i s i s shown i n Section C.1.7.2 for a slug-dose tracer study. I n cases where the tracer concentration i n the eff luent aust be maintained below a specified level, it may be necessary t o conduct a preliminary test run with a minimum tracer dose to ident i fy the appropr iate dose for detemin- ing T,, without exceeding th is leve l .
C.1.6 , f c s t P r o c c d u r c
I n preparation for beginning a t racer study, ,the raw water background concentration o f the chosen tracer chemical must be estab- lished. The background concentration i s essent ia l , not only for a id ing in the select ion of the t racer dosage, bu t a l so t o f ac i l i t a te proper evaluation of the data.
monitoring for the tracer chcraical p r i o r t o beginning the test. The SaRlpling point(s) for the pre-tracer 'study monitoring should be the same as the po ints to be used for residual monitoring to determine CT values. The monitoring procedure i s out l ined. in the fo l lowing steps:
The background tracer concentration should be detennined by .
If the t racer chemical i s normally added f o r treatment , discontinue i t s addi t ion to the water i n su f f i c i en t time t o e m i t t h e t r a c e r concentration t o recede t o i t s background eve1 before the test is begun.
Pr ior to the s tar t o f the test , regard less o f whether the chosen t racer mater ia l is a treatment chemical, the tracer concentration i n the water i s monitored a t t he sampling point. here the disinfectant residual will be measured for CT calculat ions.
If a background tracer concentration i s detected, monitor .it u n t i l a constant concentration, a t or below the raw water back round l e v e l i s achieved. This measured Concentration i s the 1 asel ine tracer concentration.
P . .
f., 1 !
a .
w
c-i2

Following the determination of the tracer dosage, feed and monitoring point(s), and a baseline tracer concentration, tracer testing can begin.
Equal sampling Intervals, as could be obtained from autoaratic sampling, are not ' required for e i ther t racer study method. However, using equal sample In te rva ls fo r the slug-dose method can simpli fy the analysis o f the data. During testing, the time and tracer residual of each
. measurement should also be recorded on a data sheet. I n addition, the water level , flow, and temperature should be recorded during the test.
C.1.6.1 lftrp - dose Mpm .-
A t time zero, the t racer chemical feed will be started and l e f t a t a constant ra te fo r the dura t ion o f the tes t . Over the course 'of the test, the tracer residual should be mnitored at the required sampling .
point(s) at a frequency deterrained by the overall detention time and s i t e specific considerations. As a general guideline, sampling a t in terva ls of 2 t o 5 minutes should provide data for a well-defined plot of t racer concentration vs. time. I f on-site analysis i s available, less frequent residual monitoring MY be possible unt i l a change i n residual concentra- t i o n i s f i r s t detected. As a guideline, i n systems with a theoretical de- . tention t ime greater than 4 hours, sampling may be conducted every 10
t he base l i ne l eve l i s f i r s t detected. I n general, shorter sampling in terva ls enable better characterization o f concentration changes; therefore, sampling should be conducted a t 2 t o 5-minute {ntewals from .
the t ime that a concentration change i s f i r s t observed unt i l ' the residual . concentration reaches a steady-state value. A reasonable sampling in te rva l should be chosen based on the overal l detention time o f the un i t being tested.
I f ve r i f i ca t i on o f t h e t e s t i s desired, the tracer feed should be. discontinued,. and the receding tracer concentration at the effluent should be monitored a t t he same frequency unt i l tracer concentrations correspond-
. i ng t o t he background level are detected. The t ime at which tracer feed i s stopped i s tiate 2er0 for the receding .tracer' test and must be noted. The receding racer test will provide a rep1 icate set of measuretnents which can be compared with data derived frm the r ising tracer concentrat ion versus time curve. For systems which current ly feed the t racer chemical,
8 . . minutes f o r t h e f i r s t 30 minutes, or u n t i l a tracer concentration above .
C-13
the receding Curve may be generated frm the ti= the feed i s turned off TZ t o deternine the background concentration level.
C.1.6.2 I dose Methpp. A t tilac zero f o r t h e slug-dose method, a large instdntaneous'dose of
tracer will be added to the in f luent o f the un i t . The same sampling locations and fraquencies described for step-dose aethod tests also apply t o slug-dose method tracer studies. One exception with t h i s method i s that the tracer concentration profi le will not equi l ibrate t o a steady state concentration. Because of th is , the t racer should be monitored frequently enough t o ensure acquisit ion o f data needed t o ident i fy the peak tracer concentration.
Slug-dose method tests should be checked by performing a material balance t o ensure tha t a1 1 'of the tracer fed i s recovered, or,. mass
. applied q u a l s mass. discharged.
f
.:
C.1.7 Data Evaluation Data from tracer studies should be runmarired in tables.of t ime and
residual concentration. These data are then analyzed t o determine the detention time, TlO, t o be used in ca lcu la t ing CT. Tracer test data from
numerically, or by a combination o f these techniques. . .
. ei ther the step or slug-dose anthod can be evaluated graphically, ' r:
'C.l.7.1 - dose M r t h a r
The graphical method o f evaluating step-dose test data involves . p1,otting a graph o f dimensionless concentration versus time and reading the value for T,, d i r e c t l y f m the graph at the appropriate dimensionless concentration. Ai ternat ivdy, the data frm step-dose tracer studies may be evaluated numerically by developing a semi-logarithmic p l o t o f the. dimensionless data. The semi-logarithmic plot al lows a straight l ine to be drawn through the data. The resulting equation of t h e l i n e i s used t o calculate the T,, value, assuming that the corre la t ion coef f ic ient indicates a good s t a t i s t i c a l f it (0.9 or above). Scattered data points from step-dose tracer tests are d iscredi ted by drawing assmooth curve through the data.
C-14

An i l l u s t r a t i o n o f t h e T,, detemination w i 11 be presented i n an example of the data evaluation required for a clearwell tracer study.
C.1.7.2 0
Data from slug-dose tracer tests , is analyzed by converting it t o t h e mathematical ly equiva'lent 'step-dose data and using techniques discussed i n Section C.1.7.1 t o determine Tlo. A graph of dimensionless concentration versus time should be drawn which represents the resu l ts o f a slug-dose tracer test . The key t o converting between the data forms i s obtaining , .
the to ta l area under the slug-dose data curve. This area is found by graphical ly or numerical ly intergrating the curve. The conversion t o step-dose data i s then coopleted i n several mathematical steps involving the t o ta l area.
A graphical technique for converting the slug-dose data involves physical ly measuring the area using a planimeter. The planimeter i s an instrument used t o measure the area o f a plane closed curve by tracing i t s boundary. Ca l i b ra t i on o f t h i s instrument t o t h e scale o f the graph i s required t o obtain meaningful readings.
The rec tang le ru le i s a simple numerical in tergrat ion in thod which approximates the t o ta l area under the curve as the sum of the areas of individual rectangles. These rectangles have heights and widths equal t o the residual concentration and sampling interVal (time) f o r each data point on the curve, respectively. Once the data has been converted, f,; may be determined i n the same manner as data fm step-dose tracer tests.
the hydraulics of the basin. Therefore, slug-dose data points should not be discredited by drawing a smooth curve through the data p r i o r t o i t s conversion t o step-dose data. The steps and speci f ic detai ls involved with evaluating data frtnn both tracer study methods are i l l u s t r a t e d i n t h e fol lowing examples.
Slug-dose concentration profi1es"can have many shapes, depending on I
%,- Trio tracer studies employing the step-dose and slug-dose acthods o f
tracer addit ion were conducted f o r a clearwcl l wi th a theoret ical detention time, 1, o f 30 rainutes a t an average flow o f 2.5 MGD. Because f l u o r i d e i s added a t t h e i n l e t t o t h e c l e a r w e l l as a water treatment chemical, necessary feed equipment was i n place for dosing a constant
c-15

concentration of f luor ide throughout the ttep-dose tracer test. eased on t h i s convenience, f luor ide was chosen as the tracer chemical for the SteP-dose method test. Fluoride was also selected as the tracer chemical
baseline Concentration o f 0.2 mg/L was established for the wa te r *x i t i ng the cl earwei 1.
.. for the slug-dost aethod tes t . Pr io r to the s ta r t of testing, a f luoride.
Step 0 dose l m l o d Test For the tttp-dose test a constant f luor ide dosage of 2.0 IQ/L was
added to the c learwt l l in le t . F luor ide leve ls in the c leam! l e f f luen t were monitored and recorded every 3 ainutes. The raw tracer'study data, along with the resul ts o f fur ther analyses are shown i n Table C-1.
The steps i n evaluating the raw data shown I n t h e f i r s t c o l m of Tdble C-1 are as follows. First, the baseline fluoride concentration, 0.2 q / L , i s subtracted from the measured, concentration to g ive the f luoride concentrat ion result ing from the tracer study addit ion alone. For example, a t elapsed time = 39 minutes, the tracer f luoride concentra- t ion, C, i s obtained as follows:
C.trsurtb - Cbrst l lnc
= 1.85 w/L - 0.2 w/L = 1.65 mg/L
This calculat ion was repeated a t each t ime interval to obtain the' data shown i n t h e t h i r d column o f Table C-1. As indicated, the f luoride concentration rises f m 0 q / L a t .t s 0 minutes to the appl ied f luoride
The next step i s t o develop dimensionless concentrations by d iv id ing the tracer concentrations i n t h e second column o f Table C-1 by the applied f luoride dosage, Co .I 2 q / L . For time = 39 minutef, C/Co i s ca l cu la ted as follows:
. clotage o f 2 mg/L, a t t 63 minutes.
*.
C/CO = (1.65 q/L)/(2.0 q / L )
= 0.82
The result ing. dimensionless data, presented i n the fourth Column of Table c-1, i s the bas is fo r completing the determination of Ti, by e i ther the graphical or numerical method.
C-16

0 3 6 9
12 15 18 21 24 27 30 33 36 39 42 45 40 51 54 57 60 63
TABLE C-1
DATA -0 STEP - DOSE TRACER T E S I (1.2.31
fluoride Conqtntr - a* 0.20 ' 0 0 . 0.20 0 0 0.20 0 0 0 020 0 0 0.29 0.09 0 . 045 0.67 0.47 .. 0.24 0.94 0.74 0.37 1.04 0.84 0.42.
1.55 1.35 0.68 1.52 1.32 0.66 1.73 1.53 0.76 1.93 1.73 0.86 1.85 1.65 0.82 1.92 1.72 0.86 2 .02 1.82 0.91 1.97 1.77 0.88 1.84 1.64 0.82 '
2.06 1.86 0.93 2.05 1.85 0.92 2.10 1.90 0.95 2.14 1.94 0.96
1.44 1.24 . 0.62
Hoter:
1. Baseline conc. = 0.2 mg/L, f luor ide dose = 2.0 mg/L 2. Mcasured conc. = Tracer conc. + Bate1 ine conc. 3 . Tracer conc. = Measured conc. - Basel ine conc.

In order to.detemine T,, by .the graphical method, a plot of C/Co VS. ti= should be generated using the data in Table C-1. A smooth curve should be.drrwn through the data as shown on Figure C-1.
TI, I s read directly f n the graph at a dimensionless concentration (C/Co) corresponding to the t i n for which 10 percent of the tracer has passed at the effluent end o f the contact basin (flo). For step-dose method tracer studies, this dimensionless concentration is C/Co = 0.10 (Levenspiel 8 1972).
T,, should be read directly f m Figure C-1 at CjCo = . I 0.1 by first drawing a horizontal line (CICo - 0.1) fm the Y-axis (t.- 0) to its Intersection with the smooth curve drawn through the data. At this point of intersection, the timc read frola the X-axis is TI, and ray be found by extending a vertical line downward to the X-axis. These steps were performed as illustrated on Figure C-1, resulting in. a value for T,, of approximately 13 minutes.
For the numerical method of data analysis, several additional steps are required to obtain f,, frola the data in the fourth c o l m of Table C-1. The fonns of data necessary for determining TI, through a numerical solution are log,,(l-C/Co) and t/T, the elapsed time divided by the theoretical residence time. These are obtained by performing the required mathematical operations on the data in the fourth column of Table C-1.
' For example, recalling that the theoretical detention time, 1, is 30 minutes, the values for log,, (1-C/Co) and t/T are computed as follows for the data at t - 39 minutes:
= log,, (0.18)
-0,757
t / T 39 min/30 min 9 1.3
This calculation was repeated at each time interval to obtain the data shown in Table C-2. These data should be linearly regressed as log,,(l-C/Co) versus t/T to obtain the fitted straight-line parameters to the following equation:
C-17

..
mURE C-1 WCo vs Time *.
Graphical Analysis for TlO
0 10 20 30 6Q 80
TIME (MINUTES)
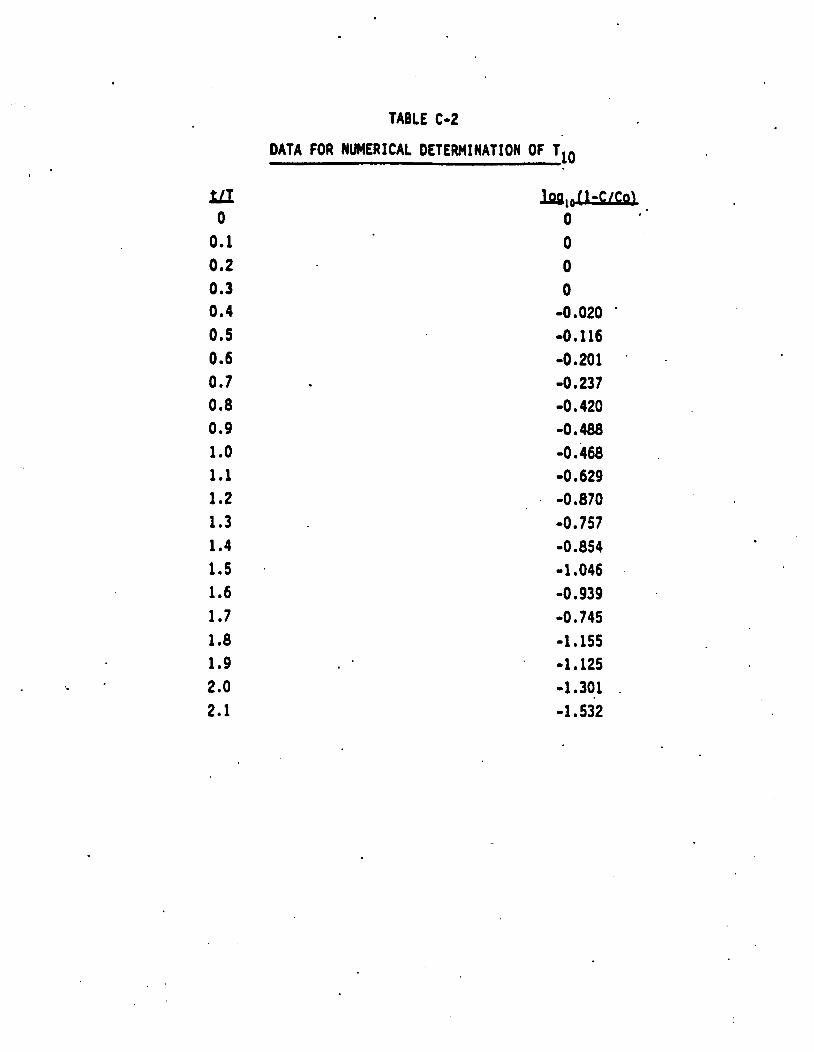
UI 0 0.1 0.2 0.3 0.4 0.5 0.6 0.7 0.8 0.9 1 .o 1.1 1.2 1.3 1.4 1.5 1.6 1.7 1 .a 1.9 2.0 2.1
tA0I.E: C-2
DATA FOR NUMERICAL DETERMINATION OF Tl0
k 1 W . 0 0 0 0 -0 0020 - -0.116 -0.201 -0 . 237 -0 . 420 -0.488 -0.468 -0.629
, . -0.870 -0 . 757 -0.854 -1.046 .
-0 . 939 -0.745 -1 . 155 -1 . 125 -1.301 . -1.532

In equation 1, A and b are the slope and intercept, respectively, for a plot of logl0(l-C/Co) vs. t/T. This quation can be used to calculate Tlo, assuaing that the correlation coefficient for the" fitted data indicates a good statistical fit (0.9 or above) ..
.A linear regressfon analysis was performed on the data in Table C-2, resulting in the following straight-line parameters:
slope = a = -0.774 .-
intercept = b = 0.251 correlation coefficient 0 0.93
Although these numbers wen obtained nwerically, a plot of log,,(l-C/Co) versus t/T is shown for illustrative purposes on Figure C-2 for the data in Table C-2. In this analysis, data for tiwe = 0 through 9 minutes were excluded because fluoride concentrations above the basdine level were not observed in the clearwell effluent until t = 12 minutes.
solution for Tie: Equation 1 is then rearranged in the following form to facilitate a .
flo/T (log,, (1 - 0.1) - b)/m In equation 2, as with graphical method, Tto is determined at the
time for which C/Co = 0.1. Therefore, in equation 2, C/Co has been . replaced by 0.1 and t (time) by T,,. To obtain a solution for TlO, the values of the slope, intercept, and theoretical deterrtion time are substituted as 'fol lorn:
* Tio/30 ain. (lOgl0(1 - 0.1) - 0.251)/(-0.774) TI, = 12 minutes
.
In sunrmary both the graphical and nuukrical methods of data reduction resulted in comparable values for T,o. With the numerical method, TI, was deterrained as the solution to an equation based on the
C-18

4
r" st ra ight - l ine parameters t o a l inear kegression analysis o f the t racer study data instead of an ."eyeball" estimate f m a data plot .
e m o d t e s t A slug-dose t racer ' test was also perfomed on the clearwell at a
flow rate of 2.5 mgd. A theoretical clearwell f luoride concentration of 2.2 ntg/L was selected. The f luoride dosing vo luw and concentration were determined frola the following considerations:
rmhullm -
- The f luor ide in ject ion apparatus consisted o f a funnel and a length of copper tubing. This apparatus provided a constant volumetric feeding r a t e o f 7.5 l i t e r s per minute (L/min) under grav i ty flow conditions.
- A t a flow rate of 2.5 mgd, the clearwell has a theoretical detention time o f 30 minutes. Since the duration of tracer in jec t ion should be less than 2 percent of the cledrwell I s theoretical detention t ime for an instantaneous dose, . the maximurn durat ion of f luor ide in ject ion was:
Max. dosing time - 30 minutes x .02 - 0.6 minutes --
- A t a dosing ra te o f 7.5 L/min, the maximum f luor ide dosing
. Max. dosing volume = 7.5 L/min. x 0.6 minutes = 4.5 L .
* for th is t racer test , a dosing volume o f 4 l i t e r s was select- ed, providing an instantaneous f luor ide dose i n 1.8 percent of . the theoretical detention ti=.
volume i s calculated to be:
- The theoretical detention t ime of the cleatwell , 30 minutes, was calculated b div id i the c learwel l volume, 52,100
. gallons or 1 9 7 , d liters,?! the average flow r a t e through the clearwell , 2.5 mgd.
- Assuming the t racer i s c m l e t e l y dispersed throughout' the t o t a l volume o f the clearwe P 1, the rbass of f luoride required t o achieve a theoretical concentration of 2.2 mg/L i s calcu- la ted as follows:
Fluoride mass ( i n i t i a l ) = 2.2 mg/L x 197,200 L x = 4349 1000 mg
c-19

FlQURE C-2 -.l-C/Co vs . VT
Numerical Analysis for TlO
0.01

- The concentration o f the instantaneous f luor ide dose i s . detenoined by d i v id ing t h i s mass by the dosing volume, 4
1 i tars:
Fluoride concentration I 434 g = 109 g/L 4 L
Fluor ide leve ls in the ex i t to the c learwe l l were monitored and recorded every 3 minutes. The raw slug-dose t racer test data are shown i n Table C-3.
The f i r s t step i n evaluating the data for dif ferent -times i s , t o subtract the baseline f luoride concentration, 0.2 q / L , from the measured concentration a t each sampling in terva l (Table C-3) . This i s the same as the f i r s t s tep used t o evaluate step-dose method data and gives the fluoride concentrations resulting fm the tracer addit ion alone, shown i n the t h i rd column o f Table C-3. As indicated, the fluoride concentration r i ses from 0 m g / L a t t = 0 minutes t o t h e peak concentration of 3.6 m g / L a t t .I 18 minutes. The exiting fluoride concentration gradually recedes t o near zero a t t = 63 minutes. It should be noted that a maximum fluoride concentrat ion of 2.2 mg/L i s based on assuming complete mixing o f the tracer added throughout the to ta l c learwel l volume. H w v e r , as shown i n Table C-3, the f luoride concentrations i n the c learwt l l e f f luent exceeded 2.2 mg/L f o r about 6 minutes between 14 and 20 minutes. ,These higher peak concentrations are caused by the ’ dispersion of tracer throughout only a por t ion o f the to ta l c learwel l volunte. I f a lower tracer concentration i s needed i n the ef f luent because of local or federal
The dimensionless concentrations i n the fourth colurair o f Table C-3 were obtained by dividing the tracer concentrations i n the t h i r d column by the cleanrcWs theoretical concentrat ion, Co = 2;2 q / L . These dimensionl-css. concentrations were then p lo t ted as a function of ti=, as i s shown by . the slug-dose data on Figure C-3. These data points were connected by s t ra igh t lines, resul t ing i n a somewhat jagged curve.
The next step i n evaluating slug-dose data i s t o detennine the to ta l area under the slug-dose data curve on Figure C-3. Two methods ex is t for f i nd ing t h i s area -- graphical and numerical, The graphical method i s
. regulations, the mass t o be added should be decreased accordingly.
e-20

c L 1
*??
?9
??
??
?S
??
V?
?9
0
00
0-
Am
-m
--
-0
00
00
00
00
0
.e3 '
uo u
e- c
u I1 u
00
Ub u
cc
0
-0
U
d u
nh-C
I
...

FIGURE C-3 ' C / C o vs. Time
Conversion of Slug-to Step-Dose Data
2
1.8
1.6
* 1.4
1.2 0 0
' \
0- 0.8
0.6
0.4
0.2
Ol I
dl
Slug-dose dc:s n Y
Step-dose d m A

based on a physical aeasurclacnt o f the area using a planikter. This Involves cal ibrat ion of the instrument t o define the units conversion and t rac ing the out l ine of the curve t o determine the area. The resul ts of performing t h i s procedure may vary depending on instrument accuracy and aeasument technique. Therefore, only an i l l u s t r a t i o n o f the nuinerfcal *
technique fo r f ind ing the area under the tlug-dose curve will be presented f o r t h i s example.
The a n a obtained’by either the graphical or numerical method would be simi lar . Furthermore, once the area Is found, the remaining steps involved with converting the data to the ttep-dose response ate the same.
Table C-4 sumnarires the resul ts of determining the t o t a l area using a numerical integrat ion technique cal led the rectangle rule. The f i r s t and second columns i n Table C-4 are the saapling time and f luor ide concentrat ion result ing from tracer addit ion alone, respectively. The steps i n applying these data are as fo l lo ln . F i rs t , the sampling time in terva l , 3 minutes, i s m u l t i p l i e d by the f luoride concentration at the Lnp of the 3-minute in terva l to g ive the incremental area, i n uni ts o f mil l igram minutes per liter. For example, a t elapsed time, t = 39 minutes, the incremental area i s obtained as follows:
Incremental area = sampling t ime interval x f luor ide cone. = (39-36) minutes x 0.4 mg/L = 1.2 mg-slin/L
This calculat ion was repeated a t each t ime interval to obtain the data . shown i n t h e t h i r d column o f Table C-4.
I f the data had been obtained a t unequal saq l ing in te rva ls , then the incremental area for each in te rva l would be obtained by mul t ip ly ing the f luor lde concentrat ion a t the a o f each in terva l by the. t ime durat ion o f ..the interval. This convention also requires that the incremental area be zero a t the f i r s t sampling point, regardless o f the f luor ide concentrat ion at that time.
As i s shown i n Table C-4, a l l incremental areas were sunned t o - obtain 59.4 ag-ain/L, the t o t a l area under the slug-dose t racer test
curve. This number represents the total mass o f f luor ide tha t was
c-2 1

,/ ' i
,- . .
detected during the course of the trgcer test divided by the average flow ra te through the clearwell .
To. cotdplete the conversion o f slug-dose data t o i t s equivalent step-dose response requires two addit ional steps. The f i r s t involves sunning, consecutively, the incremental areas i n the th i rd colum'of Table C-4 t o obtain the cumulative area at the rpP o f each sampling interval . For example, the cumulative area a t time, t = 27 minutes i s found as f o l lorn:
. .
.- Cumulative area = 0 + 0 + 0 + 0 + 3 + 10.2 + 10.8 + 5.4 + 5.7 + 3.6
= 38.7 sg-min/L
The cumulative areas fo r each interval are recorded i n the fourth column o f Table C-4.
The f i n a l step i n converting slug-dose data involves div id ing the cumulative area a t each in terva l by the to ta l laass applied. Total area based on applied mass i s calculated as follows:
Total area mass applied/average flow = 434 g x 1000 ~ 6 , 5 7 0 -
9 mi n
= 66.1 a ,L
For time = 39 minutes, the resul t ing step-dose data point it calculated as follows:
C/Co = 49.5 q-min/L / 59.4 mg-min/L . . . = 0.83
The resul t o f per foru ing th is operat ion a t each sampling in terva l i s the equivalent step-dose data. These data points are 'shown i n t h e fifth column of 'Table C-4 and are also plotted on Figure C-3 t o f a c i l i t a t e a graphical detemination of TI,. A smooth curve was f i t t e d t o the step-dose data 'as shown on the f igure.
T,, can be determined by the methods i l lus t ra ted prev ious ly in this example for evaluating step-dose t racer test data. The graphical method
i l l us t ra ted on Figure C-3 r e s u l t s i n a reading o f T,, = 15 minutes.
c-22

.
F

C.1.7.3 -1 C m In addition to determining l,, for use in CT calculations, slug.dose
tracer tests provide a aore general measure o f the basin's hydraulics in terns o f the fraction of tracer recovery. This nuaber is rapnrmtrtive o f short-circuiting and: dead space in the unit resulting f m n poor baffling conditions and density currents induced by the tracer chemical . A l o w tracer recovery is generally indicative of inadequate hydraulics. However, ' inadequate sampling in whlch peaks in tracer passage are not ' .
measured will result in an under estiaate o f tracer recovery. ._the tracer recovery is calculated by dividing the mass o f fluoride detected by the l a s s o f fluoride dosed.
The dosed fluoride M s s was calculated previously and was 434 grams. The mass o f detected fluoride can be calculated by bltiplying the total area under the slug-dose curve by the average flow, in appropriate units, at the time of the test. The average flow in the clearwell during the test was 2.5 ngd or 6,570 L/lain. Therefore, the mass of fluoride tracer that was detected is calculated as follows:
Detected fluoride mass = total area x average flow = 59.4 x 1 a X 6,570
390 g L 1000 mq mi n
Tracer recovery is than calculated as follows: Fluoride recovery detected mass/dosed mass x 100.
= 390 g / 434 g x 100 * 90 I
Thfs is a typical tracer recovery percentage f o r a slug-dose test, based on the experiences of Hudson (1975) and Thitunwrthi (1969)
c.1.3 Ttowpcbcnde~ofo For systems conducting tracer studies at four or amre flows, the T,,
detention time should be determined by the above procedures for each of the desired flows. The detention tiaes should then be plotted versus flow. For the example presented in the previous section, tracer studies
C-23

were conducted at addi t ional flows o f 1.1, 4.2, and 5.6 NO. values at the various flows ware:
1 1 0
'25 13 . 7 4
f,, data for these tracer studies were plot ted as a function of the flow, Q, as show on Figure C-4.
If only one t r a c e r t e s t i s performed, the flow rate for the tracer study should be not less than 91 percent of the h ighest flow rate experienced for the section. The hydraul i c p r o f i l e t o be used for calculat ing CT would then be generated by drawing a l i n e through points obtained by mult iplying the TI, at the tested flow rate by the ra t i o of the t racer study flow r a t e t o each of several different f lows in the des i red flow range.
For the example presented i n the previous section, the clearwell experiences a maximum flow a t peak hourly conditfons of 6.0 mgd. The. highest tested flow rate was 5.6 mgd, or 93 percent of the maximum flow. . -
. Therefore, the detention time, TI, = 4 minutes, determined by the tracer . t e s t a t a f low ra te of 5.6 q d may be used t o provide a conservative estimate of TI, f o r a l l flow rates less than o r equal t o the maximurn f l o w ra te , 6.0 slgd. The l i n e drawn through points found by mult ip ly ing 1" = 4 minutes by t h e r a t i o o f 5.6 ngd t o each o f several f l on r ' l ess than 5.6 mgd i s also shown on Figure C-4 f o r comparative purposes with the hydraul ic prof i le obtained from performing four tracer, studies at d i f fe ren t flow rates.
c.2 of T: IO nithout c0ndUct'n-r Study
-2
- -
I n stme situations, conducting tracer studies f o r determining the . disinfectant ' contact time, T,,, may be impractical or p r o h i b i t i v i l y
expensive. .The l im i ta t ions may include a Jack of funds, manpower of equipment necessary t o conduct the study. For these cases, the Primacy Agency may al low the use o f " ru le o f thumb" f r i c t ions repreSenting the
C-24

3t
3c
25
20
Z ' 3 F Y
0
10
1 5
0
FIOURE C-4 Detention Time vs, Flow
Avel
- .^
Maximum
I I I I I I I 1
' 0 1 2 3 4 5 6
FLOW (MGD) ?
D
II
8

ratio of T,, to T., and the theoretical detention time, to deternine the detention time, f t O , to be used for calculating CT values. This mthod for finding T,, involves multiplying the theoretical detention t i m by the rule of thumb fraction, l,,/T, that is representative of the particular basin configuration for which T,, is desired. These fractions provide rough
, astinates of the actual T,, and are ncollwnded to be used only on a . limited basis.
Tracer studies conducted by Uankc and byle (1973) and Hudson (1975) on chlorine contact chambers and flocculators/settl lng basins, respectively, were used as a basis in detemining representative T,,/T values for various basin configurations. Uarske and Boyla (1973) perforwed trdcer studies on 15 distinctly different types of full-scale chlorine contact chambers to evaluate design characteristics that affect the actual detention ti-. Hudson (1975) conducted 16 tracer tests on several flocculation and settling basins at six water treatment plants to identify the effect of flocculator baffling and settling basin inlet and outlet design characteristics on the actual detention time.
1
C.2.1 wt of Des-istics The significant design characteristics include: length-to-width
ratio, the degree of baffling within the basins, and the effect of inlet ' baffling and outlet weir configuration. These physical characteristics of
the contact basins affect their hydraulic efficiencies in terns of dead space, plug flow, and mixed .flaw 'proportions. The dead space zone of. a basin is basin volume through which no flow occurs. The remaining v o l w where flow occurs is cotapri sed of plug flaw and mixed flaw zones . The plug flow zone is the portion of the maining volume in which no mixing occurs In the direction of flow. The mixed flow zone is characterized by complete mixing in the flow direction and is the complement to the plug flow tone. All o f these zones were identified in the studies for each contact basin. Comparisons were then aade between the basin configura-
-
tions and the observed flow conditions and design characteristics. The ratio T,,/T was calculated from the data presented in the studies ,
and compared to its associated hydraulic flow characteristics. Both *
studies resulted in Tlo/T values which ranged f m 0.3 to 0.7. The results C-25

r ' l , ; of the studies indicate how basin baffling conditions can influence the T,,/T ratio, particularly baffling at the inlet and outlet to the basin. As the brsin baffling conditions improved, higher t,,/T values were observed, with the outlet conditions generally having a greater impact than the inlet conditions. . .
As discovered from the results of the tracer studies performed by 4s. _ .
k r s k e and Boyla (1973) and Hudson '(1975), the effectiveness of baffling . in achieving a high T,,/T fraction is #)re related to the geometry and ' '
baffling of the basin than the function of the basin. For this reason, T,,/T values aay be defined for three levels of baffling conditions rather than for particular types of contact basins. General guidelines were developed relating the Tl,/T values from these studies to the respective baffling characteristics. These guidelines'can be used to determine the T,, values for,specific basins.
C.2.2 JaffliQo Classificatb The purpose of baffling is to maximize utilization of basin voluk, .
increase the plug flow tone in the basin, and riniaitt short" circuiting. Solac form of baffling at the inlet and outlet of the basins is used to
'. evenly distribute flow across the basin. Additional baffling may be provided within the interior of the basin (intra-basin) in circumstances requiring a greater degree of flow'distribution. Ideal baffling design reduces the.. inlet and outlet flow velocities, distributes the water as unifomly as practical over the cross section of the 'basin, minimizes mixing with the water already in the basin, and prevents entering water from short circuiting to the basin outlet as the result of Mind or density current effects. Three general classifications of baffling conditions -- poor,.average, and superior -- were developed to categorize the results of- . .
the tracer Ltudies f o r use in determining T,, fm the theoretical detention tine of a specific basin. The T,,/T fractions associated with each degree of baffling are tuaraarircd in Table C-5.: Factors representing the ratio between T,, and the theoretical detention time for ,phg flow in pipelines and flow in a completely rixed chaaber have been: included in Table C-5 for comparative purposes. However, in practice the theoretical
.. T,,/T values of 1.0 for plug flew and 0.1 for rixed flow are seldom C-26

- Unbaffled (mixed flow)
Poor
Average
Supcri or
Perfect (plug flow)
I,& - 0.1 None, agitated basin, very low length to
width ra t io , h igh in le t and ou t l e t f l o w ve loc i t ies
out 0 t t s , no int ra-basin baf f les
bas i n ' b r f f 1 as
0.7 Perforated i n le t ba f f l e , se rpen t ine or perforated intra-basin baf f les, out let weir or perforated 1 aunders
flow) , perforated in let , out let , and i n t ra - basin baffles
0.3 S i n l e or mult ip le unbaffled i n le t s and
0.5 . Elaffled i n l e t p~ out le t w i th m a t e i n t ta -
1 .o Very high length to width rat io (p ipel ine
achieved because of the effect of dead space. Conversely, the T,,/T values shown for the intermediate baffling conditions already incorporate the effect of the dead space zone, as well as the plug flow zone, because they were derived empirically rather than from theory.
As indicated in Table C-5, PPQT baffling conditions consist of an unbaffled inlet .and outlet with no intra-basin baffling. Avcraat baffling conditions consist of intra-basin baffling and either a baffled inlet o r . outlet. w c r i o r baffling conditions consist of at least a baffled inlet and outlet, and possibly SOW intra-basin baffling to redistribute the flow throughout the basin's cross-section.
The three basic types of basin inlet baffling configurations .are: a target-baffled pipe inlet, an overflow weir entrance, and a baffled subawged orifice or port inlet. Typical intra-basin baffling structures include: diffuser (perforated) walls; launders; cross, longitudinal , or
* maze baffling to cause horizontal or vertical serpentine flow; and longitudinal divider walls, which prevent mixing by increasing .the length-to-width ratio of the basin(s). Coamonly .used baffled outlet . structures include free-discharging weirs, such as sharpcrested and V-notch, and submerged ports or weirs. Weirs that do not span the width of the contact basin, such as Cipolleti weirs, should not be considered baffling as their use may substantially increase niir overflow rates and the dead space zone of the bqsi n.
C.2.3 -11s of 6 a f f l W Examples of these levels of baffling conditions for rectangular and
circular basins are explained and illustrated in the following section. . Typical uses of various f o r m of baffled and unbaffled inlet and outlet
structures are also illustrated. The 9 1 ~ and section of a rectangular basin with ~ p c baff 1 ing con-
ditions, which can be attributed to the unbaffled inlet and outlet pipes, is illustrated on Figure C-5. The flow pattern shown in the plan view indicates straight-through flow with dead space occurring in the regions between the individual pipe inlets and outlets. The sectiofv view reveals additional dead space f m a vertical perspective in the upper inlet and
. lower outlet corners 'of the contact basin. Vertical mixing also occurs as C-27
bottm density currents induce a counter-clockwise flow i n the upper water 1 ayers .
The i n l e t flow d i s t r i b u t i o n i s markedly improved by the addition of an in le t d i f fuser wal l and intra-basin baf f l ing as shown on Figure C-6. However, only Dzu baffling conditions are achieved for the basin as a whole because of the inadequate out let structure -- a Cipol le t i weir. The width of t h e w e i r i s short i n coatparison with the width of the basin. Consequently, dead space ex i s t s i n t he corners of the basin, as shown by the plan vim. I n addition, the small weir width causes a- high mir overflow rate, which resu l ts in shor t c i rcu i t ing i n the center of the basin.
Syperior baffling conditions are exemplified b) the flow pattern and physical characteristics of the basin shown on Figure C-7. The i n l e t t o the'basin consists of submerged, target-baffled ports. This inlet design serves t o reduce the veloci ty of the incotaing water and d is t r ibu te it
~ n i f o n n l y throughout the basin's cross-section. The ou t l e t s t ruc tu re i s a sharpcrested weir which extends for the entire width of the contact basin. This type of out le t s t ructure will reduce shor t c i rcu i t ing and decrease the dead space f ract ion o f the basin, although the overflow weir *
does create some dead space a t the lower comers of the eff luent end. These i n l e t and outlet structures are by themselves su f f i c i en t t o a t ta in superior baffl ing conditions; however, mate-type intra-basin baf f l ing was included as an' example o f how t h i s type o f b a f f l i n g . aids i n flow redis t r ibut ion wi th in a contact basin.
The plan and sect ion of a circular basin with 0pp1: ba f f l i ng conditions, which can be a t t r ibu ted to flow shor t c i rcu i t ing from the center feed wall di rec t l y t o t he e f f l uen t trough i s shown ori Figure C-8. Short c i r cu i t i ng occurs i n spite of the outlet weir configuration because the center feed In le t i s no t ba f f l ed . The i n l e t flow dist r ibu t ion i s improved s e a t on Figure C-9 by the addit ion of an annular r ing baf f le a t t he i n le t which causes the i n le t flow t o .be distributed throughout-
' great& portion of the basin's available volume. HOwtvCr, the baff l ing conditions i n this contact basin are only per= because the in let center feed arrangement does not entirely prevent short Circuit ing through the upper levels of the basin.
(-" i
. - -
I --e
. C-28
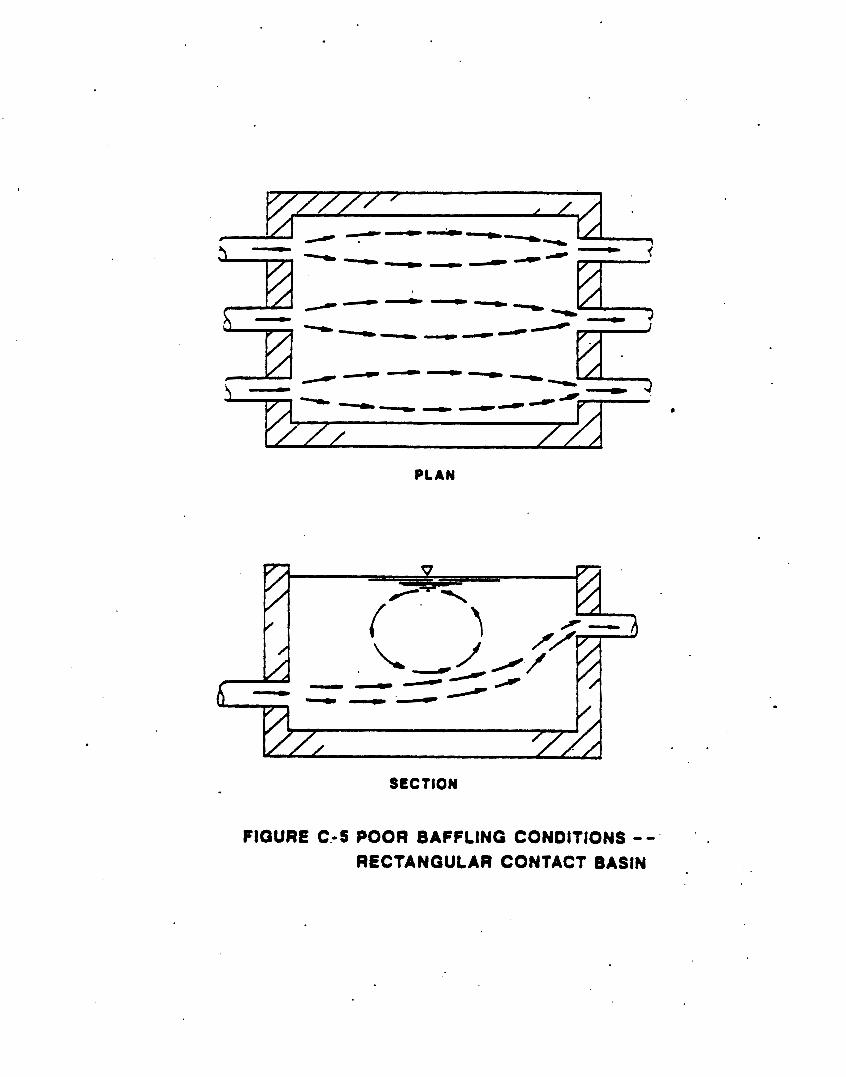
SECTION
FJOURE C-5 POOR BAFFLING CONOlTlONS - 0 '
RECTANGULAR CONTACT BASIN

SECfION
FIGURE C-6 AVERAGE BAFFLING CONDITIONS -- RECTANGULAR CONTACT BASIN

FIGURE C-7 SUPERIOR BAFFLING CONDITIONS - 'b
'RECTANQULAR CONTACT BASJN
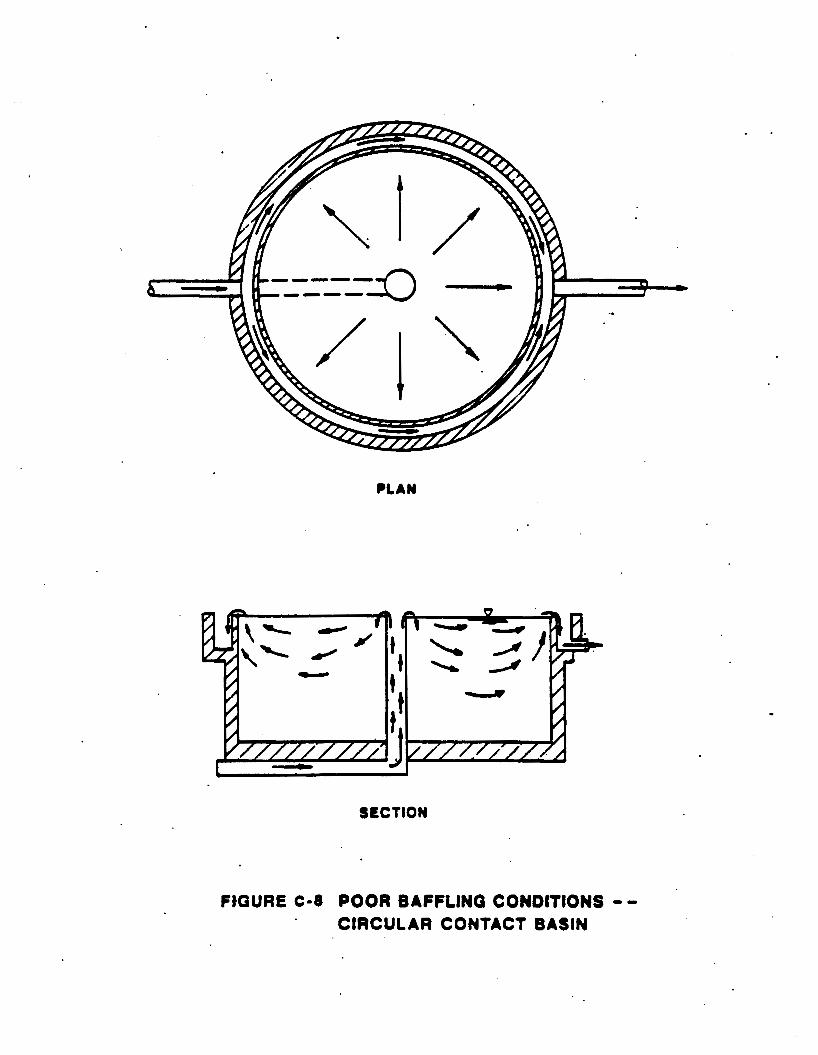
?LAN
SfCTlON
FtGURE C-8 POOR BAFFLING CONDITIONS -- CIRCULAR CONTACT BASIN
. .

PLAN
FIGURE C - 9 AVERAGE BAFFLING CONDITIONS 0
CIRCULAR CONTACT BASIN

SyDerioc baffl ing conditions are attained fn the basin configuration shown on Figure C-10 through the addition of a perforated in le t baf f le and submerged or i f ice out le t por ts . As fndicated by the flow pattern, more of the basin's volurne i s u t i l i z e d due t o uniform flow dist r ibu t ion created by . the perforated baff le. Short circuit ing i s also diniQiZed because only a small port ion of flow passes d i rec t l y through the perforated baff le wall fm the in le t to the out le t por ts .
C.2.4 A d d i t i o n a l C o w e r a t - .-
Flocculation basins and ozone contacton represent water treatment processes with s l ight ly d i f ferent character ist ics fnwa those presented i n Figures C-5 through C-10 because of the addi t ional ef fects of mechanical agi tat ion and mixing from ozone addition, respectively. Studies by Hudson (1975) indicated that a single-compartment f locculator had a T,,/T value less than 0.3 , corresponding t o a dead space zone of about .20 percent and a very high mixed flow zone of greater than 90 percent. I n t h i s study, two four-compartment flocculators, one with and the other without .
mechanical agi tat ion, exhibi ted T,,/T values in the range o f 0.5 t o 0.7. This observation indicates that not only will compartmentation r e s u l t i n higher T,,/T values through bet ter flow distr ibut ion, but a lso that .the ef fects o f ag i ta t ion in tens i ty on T,,/T are reduced where su f f i c ien t baf f l ing ex is ts . Therefore, regardless of the extent of agitat ion, baff led f locculat ion basins with two or non cmpartanntr should be consi dered t o possess average baf f 1 ing conditions (T,,/t - 0.5) , whereas unbaffled, single-coapartntnt flocculation basins are Characteristic of poor baff l ing condi t ions (T,,/T 9 0 . 3 ) .
Similarly, mu l t ip le stage ozone contactors are baffled contact
stage ozone contactors should be considered as being poorly baffled. However, c i rcu lar , turb ine ozone contactors ray exhibit flow dis t r ibu t ion characterist ics uhich approach those o f completely nixed basins, with 'a f,,/T o f 0.1, as a resu l t o f the intense mixing.
In many cases, s e t t l i n g basins are d i rec t l y connected to t he f locculators. Data froa Hudson (1975) indicates that poor baff?ing condi t ions at the f locculator/set t l ing basin interface can r e s u l t i n
. . basins whlchthocr character ist ics of average baffl ing conditions. Single .'
C-29
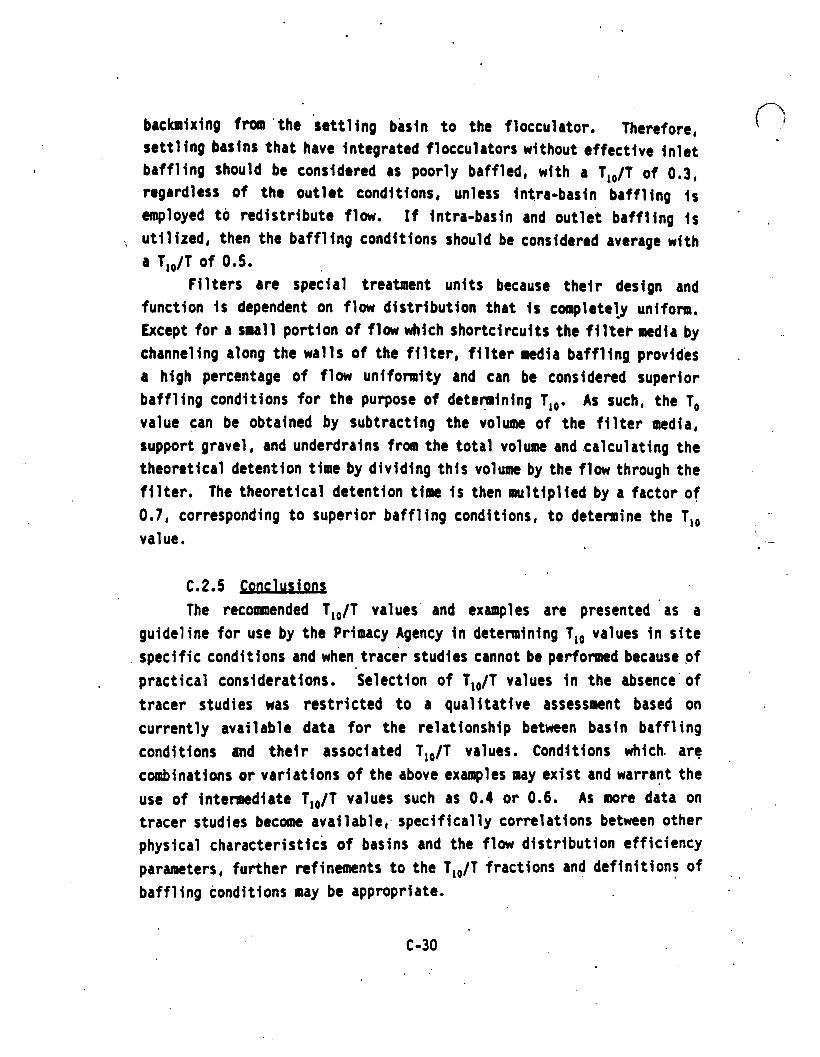
backmixing fFolR 'the 'sett l ing basin to the f locculator. Therefore, se t t l i ng basins that have integrated f locculators without effective inlet ba f f l ing should be considered as poorly baffled, with a T,,/T of 0 . 3 , regardless of the outlet conditions, unless in t ra -bas in ba f f l ing i s employed to red is t r ibute flow. I f intra-basin and o u t l e t b a f f l i n g i s
%, u t i l i zed , then the baff l ing condi t ions should be considered average with
F i l t e r s are special treatment units because the i r design and function i s dependent on flow d is t r i bu t i on t ha t i s completely uniform. Except for a small por t ion o f flow which shortcircuits the fil& media by channeling along the walls o f t h e f i l t e r , f i l t e r media ba f f l i ng provides . a high percentage o f flow uniformity and can be considered superior baff l ing condit ions for the purpose o f determining t,,. As such, the lo value can be obtained by subtracting the volumc o f t h e f i l t e r media,
(?
a T,,/l of 0.5.
support gravel , and underdrains from the t o t a l volume and .calculating the theoretical detention tilac by d iv id ing th is volume by the flow through the f i l t e r . The theoretical detention t ime i s then mult ip l ied by a factor o f 0.7, corresponding to super ior baf f l ing condi t ions, to determine the TI, value . .~
C.2.5 gonclus iou The recomnended T,,/T values' and examples are presented as a
guidel ine for use by the Primacy Agency in detemin ing t,, values i n s i t e specific conditions and when tracer studies cannot be performed because o f practical considerations. Selection o f l , ,/T values i n t h e absence'of tracer studies was r e s t r i c t e d t o a qual i ta t ive assessment based on current ly avai lable data for the re lat ionship between basin baf f l ing conditions und t h e i r associated l,,/T values. Cond3tions which. are canbinations or var iat ions of the above examples m y e x i s t and warrant the use of intenecdiate T,,/T values such as 0.4 or 0.6. As more data on tracer studies become available; specifically correlations between other physical characterist ics of basins and the flow dis t r ibu t ion e f f i c iency parameters, further refinements to t he TIo/T fractions and def in i t ions of baff l ing condi t ions may be appropriate.
C-30

PLAN
FIGURE C-10 SUPERIOR BAFFLING CONDITIONS CIRCULAR CONTACT BASIN
RtfcFcnccs Hudson, He E., Jr. . "Residence 1i-s
January , 1975. in Pretreatment", J. AWA, pp. 45-52,
Marske, 0. W. and byle, J. 0.. "Chlorine Contact Chamber'ksign - A Field Evaluation" , Water and Sewage Uorks , pp. 70-77, January, 1973 . .- fhirunrurthi, 0.. 'A Break-through in the Tracer Studies o f Stdiocntation TanksY, 3. WPCF, pp.. R405-R418, November, 1969.
.C-31

1,
2.
3 .
4.
5 .
4.
7 .
8.
INVESTIGATOR ( 5 ) RESULTS
%rrhrane Fi 1 trati on
Chang and Kabl er USPHS, 1956
Generally unsuccersfd
Pyper, DuFrain and Henry Eng Passing 1 gal/min a t 19W, (unpubl ishe41 *l(I-PSI. 15-1800 gal
total
Shaw e t a l , 1977 Jura nX,T9?9
Gt?wally goo(! r e n m 1 but poor eluation .
Particulate F!l tratf on Tfliatomacrtaus ? a r t h , f l n A , t t c . 1
Holman e t a l , 1983 Good r ap id recovery, DHHS , Waxg t o n , b u t limited i n field
use
Brewer, Wright State UNO Generally unsuccessful (unpub l ishedl
Rf ggs, COHS Lab, Serkley , CA . Overs1 1 recovery 23-83 (ungubl i shed) percent
4nianic and Cationic hchantYr! Re sins
Epoxv-Fihergl ass Sal ston rube Fi 1 ters TI1T” -arm I
Recavee 3-15 percent Extraction ave. 58 . percent
Jakvbowski, Erickson, 1979 and 1980, EPA-Cincinnati
MicroDorous Yarnwnven neath. Fq’ters T F X l urn arlon an+ polvprolvlene)
Mi 11 i pore Corp. (unpuhl istred)
?day be useful f o r .processi ng f i l t e r washings
Pe? 1 icalr Cassette Svstern
Claims ?5 percent recovery froi orlon f i 1 t e rs
OuWall e, U. of Wash., 1982~ (unpu31 f shed)
F i l terwashi ng Apparatus
TABLE 1
! CI

PRI!MRY C O ! I ~ E N f R . ~ T I O N AND PROCESSTX YETHr)[)S
1, YMeRANE FILTER IMF) ETHODS
3.
1. Chan? and Kabler ! n 1955 First t o use MF for cyst recovery. Recovered 2C-42 percent a t cyst concentration of 3, 5 , ant 10 cyst/gal. - nn c.dst foun4 a t 1 cys t/ga 1.
2. tle++nrl was ‘used i n 1965 Colnra!o outhroak (%ore, e? a t , 1969) us:ng 2 l i t e r s i ze water samples from 10 sites. )lo cysts rrere detactec. Use rli cel lulosic f i l ters have generally not hen successful, i n demonstrating cysts jq drinking water.
--
1. Luchtel an4 Co’lleases !n 198n wed 233 m, 5.0 urn pore size nocleooor? (PC) fi1terS t o sonce?trato formalin-flxe3. G. l m b l i a . cysts f r m 2Q L t a p water sanrples. Recovery rates of a p ? j r o m ; d 75 ps rcon t were reportel.
2. Pyper of ilufrain w d Henry Engineers c? aim good recovery w i t h ‘ saxe nucleopora f i l t e r a t a f!ow rate o f 1 gal. /min., n o t over 12 35:, passing 15-1899 gal. i n iust over 24 hours.
’ c , Ever, w i t h thcse claims SV Pyper and Luchtel , the !1F !lethod has onl:l mcs (Aspen, 1966) heen successful i n demonstrating cysts i n water--frobaSly because:
1. Ina9ili ty to process a sufficient volume.
2. Inabi?ity t o remove rlyrts from Ci l t c r .
a.
5 .
C,3 >
5ku9 - CDC (Shaw, 1977) used high-vat f i l t ra t ion through swimin? ~ c s ? sdnn f i l t e r (28Q,000 g a l . t o t a l 9ver 10 clays) - was backflushed i?:2 5 5 gal. d r u m an6 coagulated w/alun. concentration fed t o beagle p u r c i e j B n A a f t e r treatmn? (cheescc?otb t o wire scrgening t o 33 r?F Centrffuge) was examine4 microsconically. First time cysts .observee i n water sup?ty after concentrntinn.
qiatomaceous earth ( V I - ‘COC (Juranek, 1979) used D E to remove tis:! fro? seode? water. Prohlm was t’wt cysts couldn’t be removert fr:- particles. f3rewer (1983) claims 5 .2 -31 .1 percent recovery fron X backwash. Petention thro l rgh ‘3 f 3 n z (celit: 505, HyFl o-Supercc‘ 3- - ce l f t e 56O). .a t cyst concentration r a n g i n g from 6-16,000 cys+./L.. z : . . - . range betwoen 66-131: percent.

.MAE CENTRIFUGE
a . Was found t o recover more cysts ( \ O X ) t h a n a series of MF-f i.1 ters and nylon screens: 5 VS. 1 day. by MF.
5. Yay he !mpractical i n f ield because o f power requirement.
c. If used i n lab, 1 large single sample collected i n the field could miss cyst. .-
A , May f i n d applicatfon f9r concentration cysts from orlon f i l t e r wasbings.
A!l?DlIC AMD CATIOlUC EXCHANGE RESINS (Brewer - unpubl ishad)
a. Rased on bypothesit t h a t cysts could be attracted t o charged surfaces, c.vsts have a cfiargp of approximately 25mV a t pH 5.5 which increases i n clectro-neqativi ty as the pH ri ses t o 8.0.
b. Charge at t ract ior l tecaniques have been used for conctntration'of b o t h bacterf a and viruses i n wter.
c, Five oxcharqe resi.no were tested: (1. 40 percent recovery f rom anfonfc Dowex 1-XY columns (2 . 38 percent recovery from cationic Dowex 53W-X8 columns
A . Compared t o parallel tests wjdiatomaceous e a r t h , exchange resins less ccficieqt i n retention.
SALVO1.I EPOvY-FIBERGLACS TUBE FILTERS
a . Riggs o f CSlrD, Viral and Rick. Lab., can f i l t e r SO0 gallons d r ink in3 w a t w thru IO" - 8 pm Balston tube f i1 ter ,
h. Backflushes w / l L 3 percent beef extract or solution of 0.5 percent
c . Concentration i s centriflrged w/40 percent potassium c i t ra te and niidl e
p o t a s s f m ci t ra te .
layer f i l tered thru 5 Y polycarboqate f i l t e rs .
d. Uses direct fmunofluoresccnce antibody technique f o r detectfon and idantification.
e. Claims ?0-30 percent efficiency i n collection, preprocessing a n d :3 .
YICROP3R9US YAR!ROVEN DEPTH FILTE!?S
a . In 1976 EVA develooed a concentration-extraction method i n v o l v i p ; 3r;l volumes of water t h r u sicroporous yarnwoven orlon-fiber f i l t e r s .
b. This method has been tenatively adopted as the "method o f choi:2 :**
. concentmting cysts from wa?er sugpl i c s .

1. Gone from 7,to 1 urn p a r s t t y f i l t e r 2. ' L imi ted the ra+e o f flaw t o 1/2 gallon/min 3 . Lfmi ted the pressure head t o 10 PSI 4. Have gone t o p o l y p r o y l a n e f i l t e r s I n 1 i e u . o f or lon -
d. It was t h e f i r s t metho.4 successful ly used t o detect cysts i n the - d fs t r fbu t ion sys te f l of a community water supply.
e. Is t h e r e c m c n d e d f f 1 t e r t o be used hy the EPA contenius method.
a. Is a p t a t e an4 frame s t y l e h a l j a r which accepts both u l t ra th in and .!e?th t y p t f i 1 tcrs.
h, Has from'O.5 $0 25 ft2 of ? f l t e r area.
C. Has n o t been iwest igateA thorougi r ly but has had some success i n v i r u s concentration.
d. I t s maf n app'l f c a t i o n for cyst recovery nay l a y w i t h t h e processf ng o f ' filter washings.
- 8. F I LTERV4SH ING APPARATUS
a. This f s a proposed device by Du!Jal?e, 1982 -from U. of W., for unwinding ' the f ibers from the f i 1 t e r c a r t r i d g e whf 1 e repzatedly brushing atld
squeezing them w h i l e i n a bath solut ion.
3. S a t h c o u l d c o n t a i n e i t h e r a sur factant or pH c o n t r o l l e d s o l u t i m .
c. Potentfal c la ims are as high a5 75 percent ex t rac t lon o f cysts f rom t h e f f bers.
TABLE 2: Off ECTION :TETHODS
I WVESTIGATOR I S 1 RESULTS
1. Inmtrnof? uorescence Qfggs, CSDHS Lab, Berkley, CA Good prep.. a . n F A 1983 Cross Rx
. b. f ? A Sauch, EPA-Cincinnatf Still under study Riggs , CSOS
C. Yonoclonal Ant ibodies Ri gas , CSDHS Still under study Sauch, EPA-Unci nnati !unpu$l i shedl
2. ELISA Methad c4 1
3 . Rrf'ghtf i el d/Phase Contra st .
Hungar, J . Hopkfns MD, 1983 Feces sanoles only
€PA Consensus method 3ngoi ng

1.a. nIRECT FLUOSESCEYT A!ITfBOnY ( O R A ) TECHN1r)UE * .
1, R i ggs has produced a h i g h ti te r purified imnune sera t o GI arb i a 1 anbl i a cysts i n guinea p igs and IahelQd i f wfth Fluoreceis f s o t m n m e r a i s purified thru NHqOH and DEAE sefadex fractionation.
2. Obtained cross reactions w i t h Chilonastix nesnili cysts b u t claims i t c&n be easily distingufshed from G'1arQia 3y Its smaller size.,
1. b. ItJflIRECT FLUORESCENT ANTIBODY (IFA) TECHNIQUE
1. Sauch using IFA w i t h fmnune sera from rabbits (unpurified). I t i s reacted w i t h cometxially available fluorescent-labeledagoat anti-rabbi t gamma g l o h 1 i n. I
2. Some cross-reactions w i t h certain a lga l cells.
1.c. MO~JOCLOt!AL ANTIB0r)IES
1.
2.
Usf ng clones of hybri cel ls w i t h sgleen col W O D h O Z O i t e S .
noma cell 1 ines obtained by fusing mouse myeloma 1s f rm m!ce (BALR/c) immunized wfth - G. lamblia
Produced ei q h t manocl anal antibodies evaluated by IFA against both trophs and cysts , a. 3/8 stafne4 the ventral disk b. 2 stained the n u c l p i c , 2 stained cytoplasmfc granules d . 2 stained membrane conponmts.
3. Varfability i n s ta rn ing may be due t o differences i n Stages of encystment.

l
.
.

d
. .
l 0 1 . a . .

*
l
*
.
l
*
l
1
02 a l l
.
,
.

.
e *
.
ttu? eric3n id f Associ a3 cm
. . l *
l
‘
0
l
t
.
*
l .
.
I’
l
.

.
.
n
3 t
-- - --
e
c wll
l
l
8 fan md
fens - of kntwm olfds, color,
II”OTP chr presence of ath ram concomit8n~ ctmmica
2 1 l
*
l
.
* .
_ I 3 ‘

CO I)
Bl +
c .
C c a
*
0.01
0.01
t
l
e
0 e * 10
.
.
NF
. 1 eD 15
N
‘
2
1
1
l/2
l 1
.
2 .
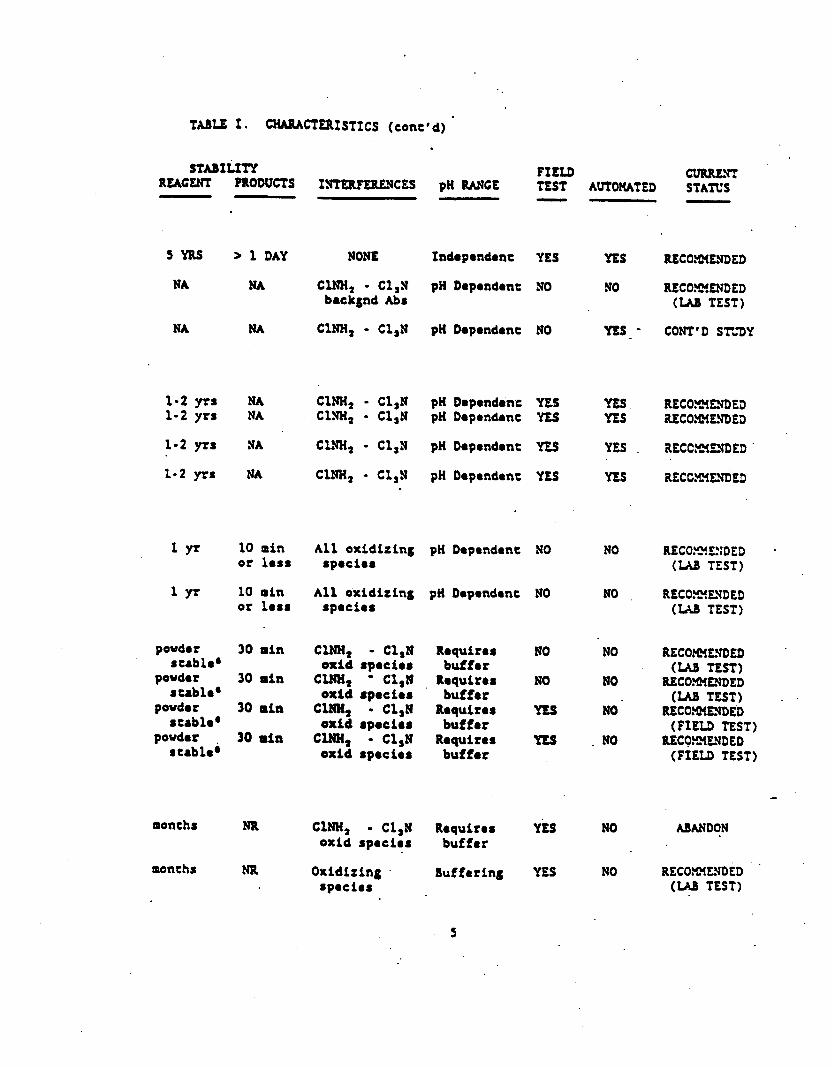
C s
* s . .
.
l
YE
YES
.
.
NO
l
NO
.
.
C s
.
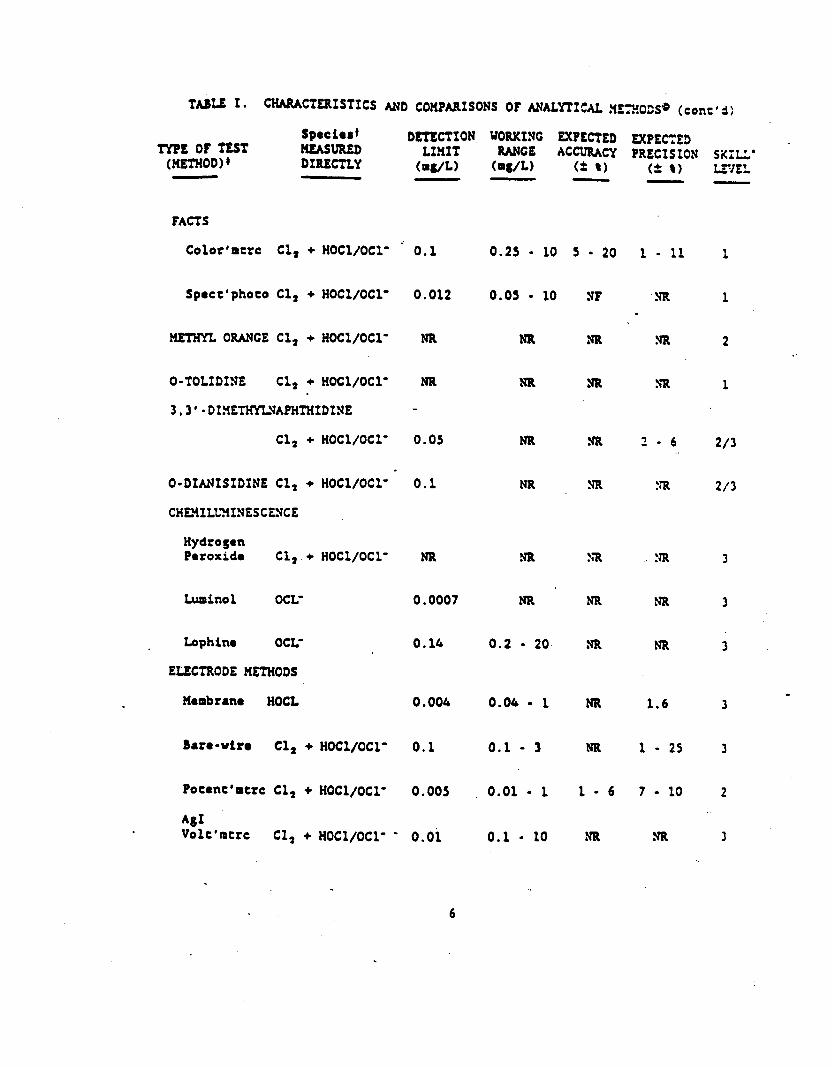
. I
PO
t Cl, +
. .
c 6
3 I

.
3 nth
NA l
0
1
I ,
frrr rsquf
. 7
1
YE
POSSIB
Y
co
.
R b
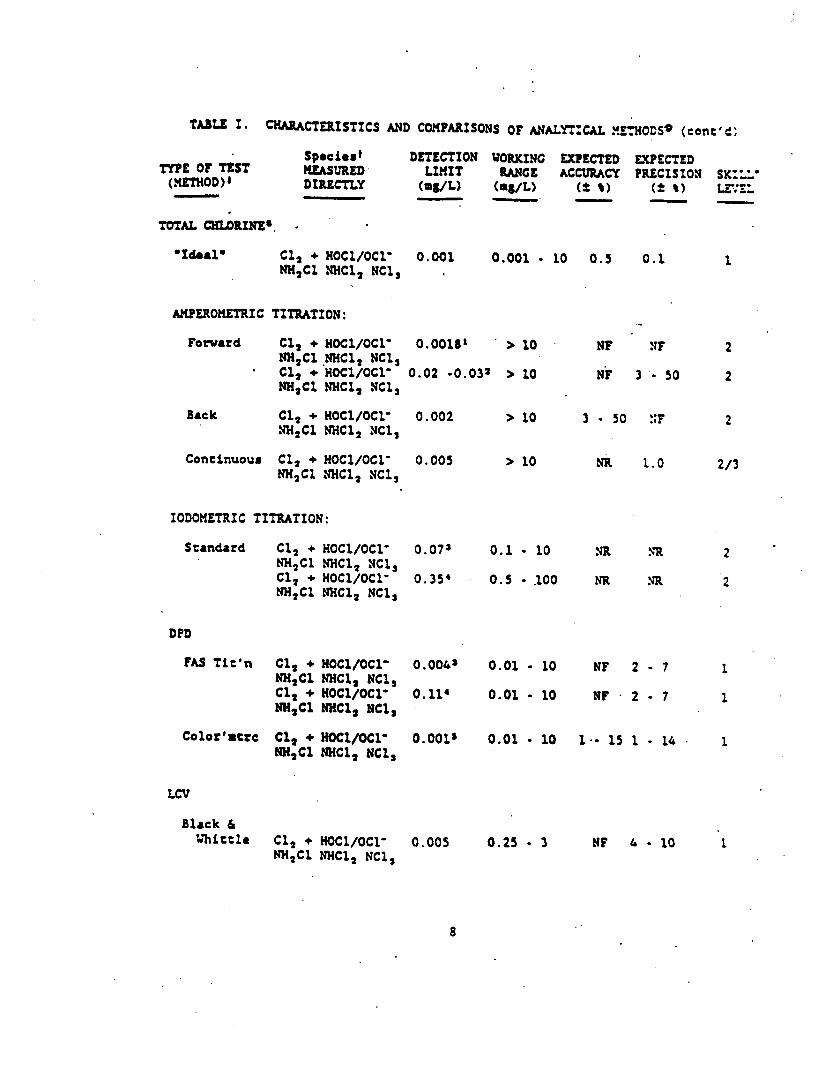
0 0 . 1 131
0
0.25 - 3
P 2 - 7
NE k - 10
2
1
1
1 I
.

5
1 a 2
1 ylt 10
Y .
I
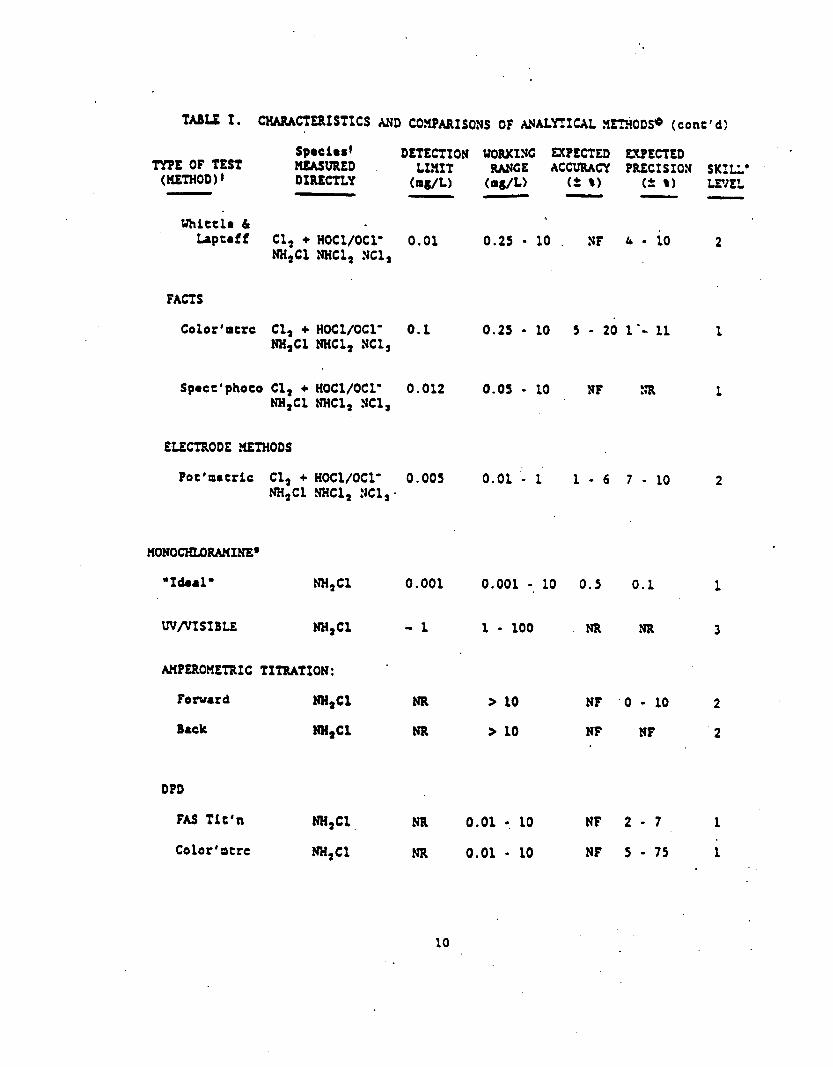
DP
co1
l
f 1 m 1 0
1 a 10 UF
a
5 a 7 1 *
l

1 * * .
N
NO
- *
(FI E’?3 ‘IEfK:
.
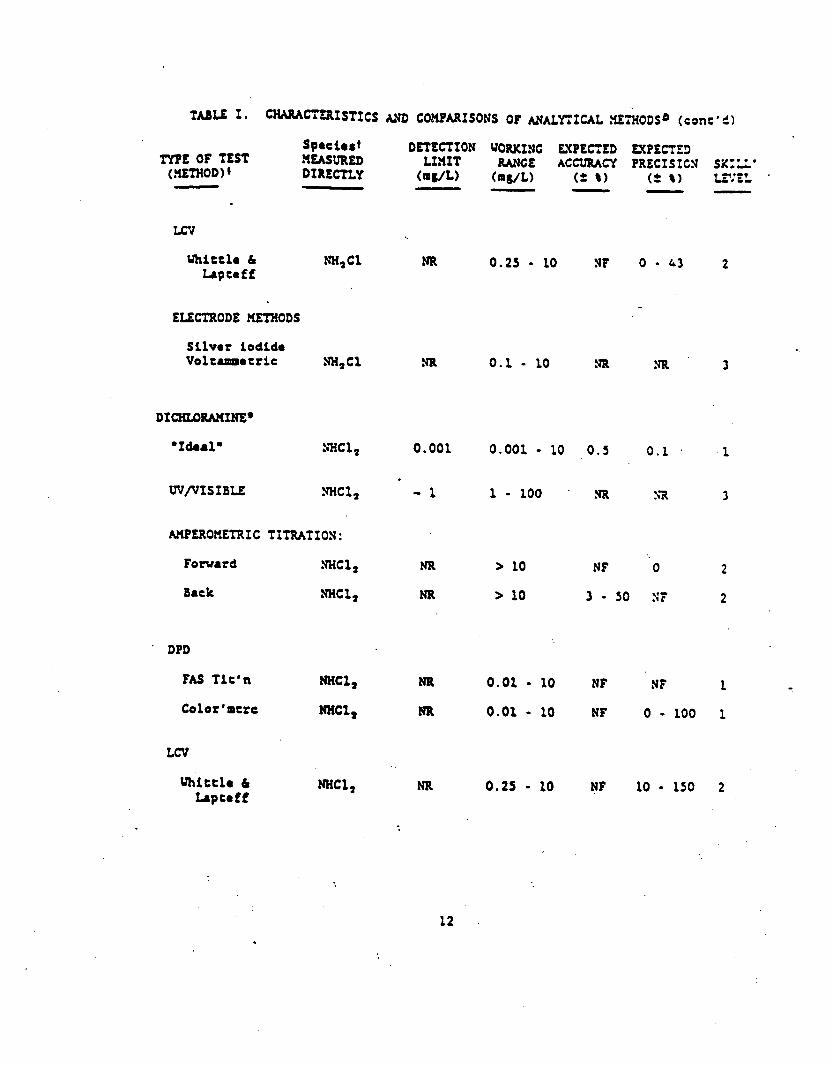
.
. .
* NF
0 * 100
10 * 15
3
1 II
1
2

N
moncht
N
.
l
. S
. .
N
. *
13
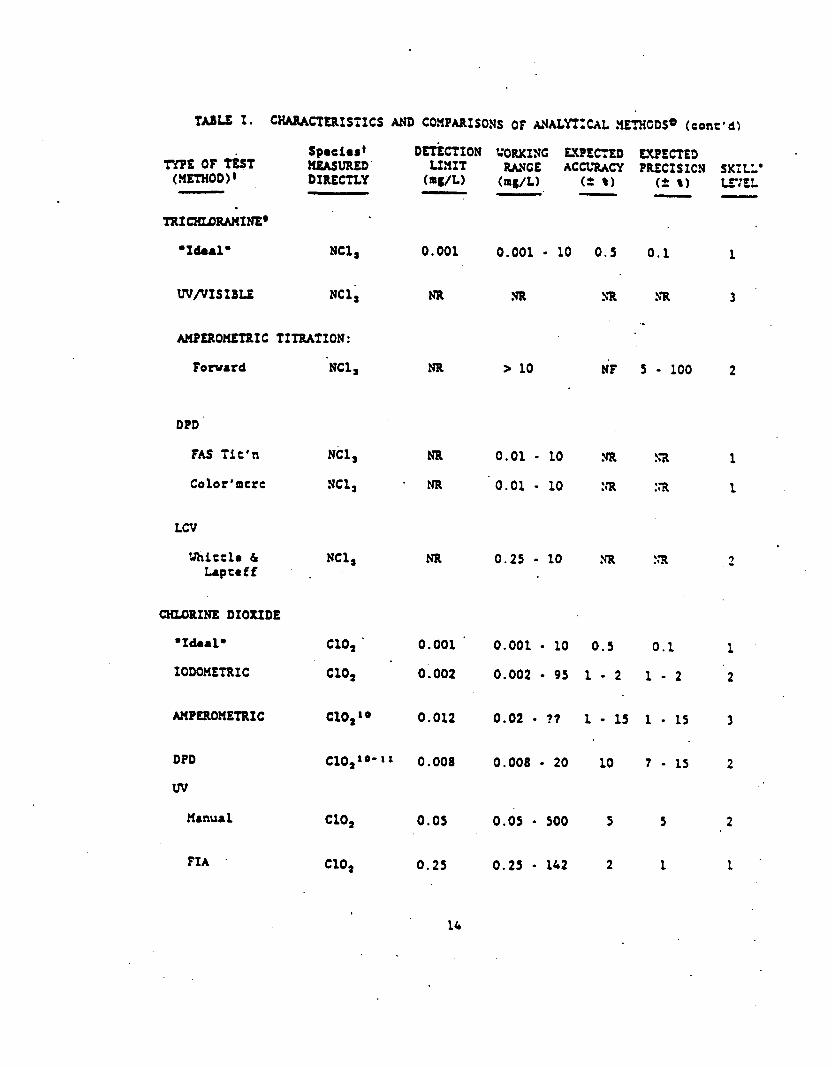
.
* t lb .
m I m
PD
W
fir 0.05
a 0 20
I 5 - 500
0.25 - 142
* .
5 s
2 1
1
2
1 *

NO
N
NO
.
R DED ST)
n8n8
newt
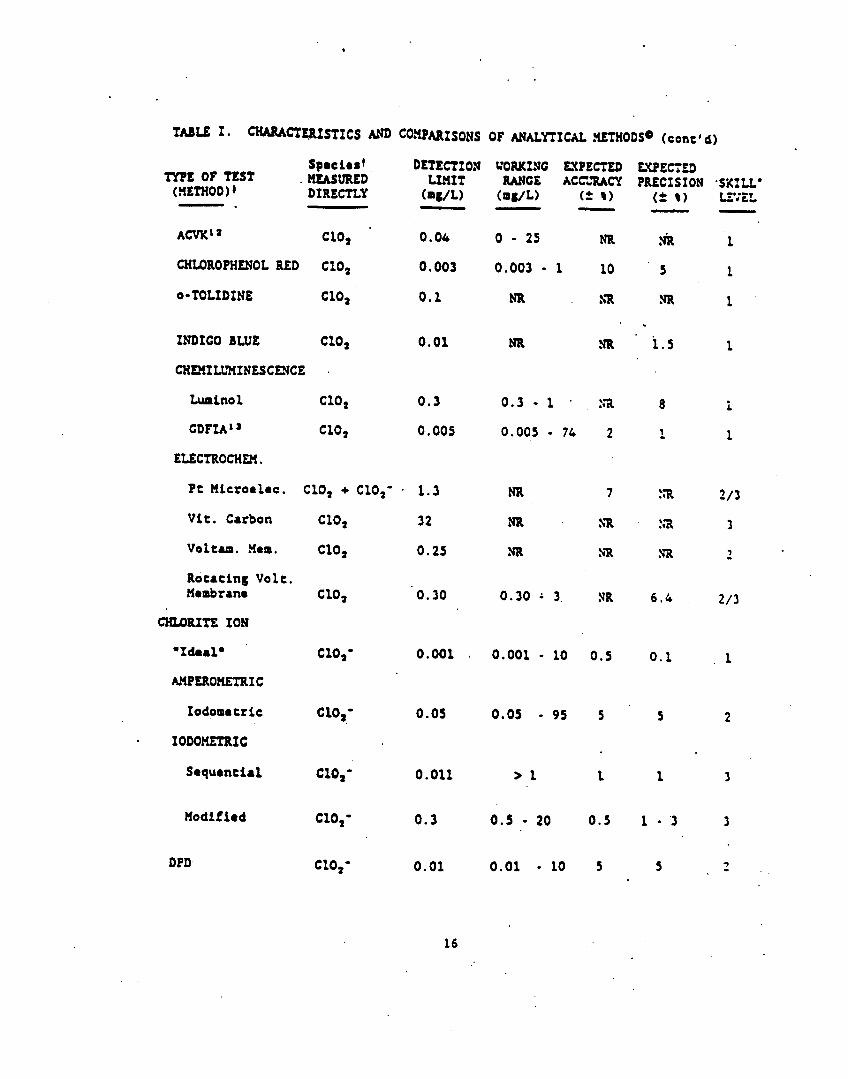
0.01
1
1
1 *
1
i
1
2/s
3
‘) am
2/
, 1
2
l
3
3 .
l
5 9 c 0 . . . l
.
. .
l

A
s -* II
,v
I
‘
NO
HO
NO
RECO T ii
CONY l L
I
(I ,uOT R
.
7
good
Stalid stable”
17
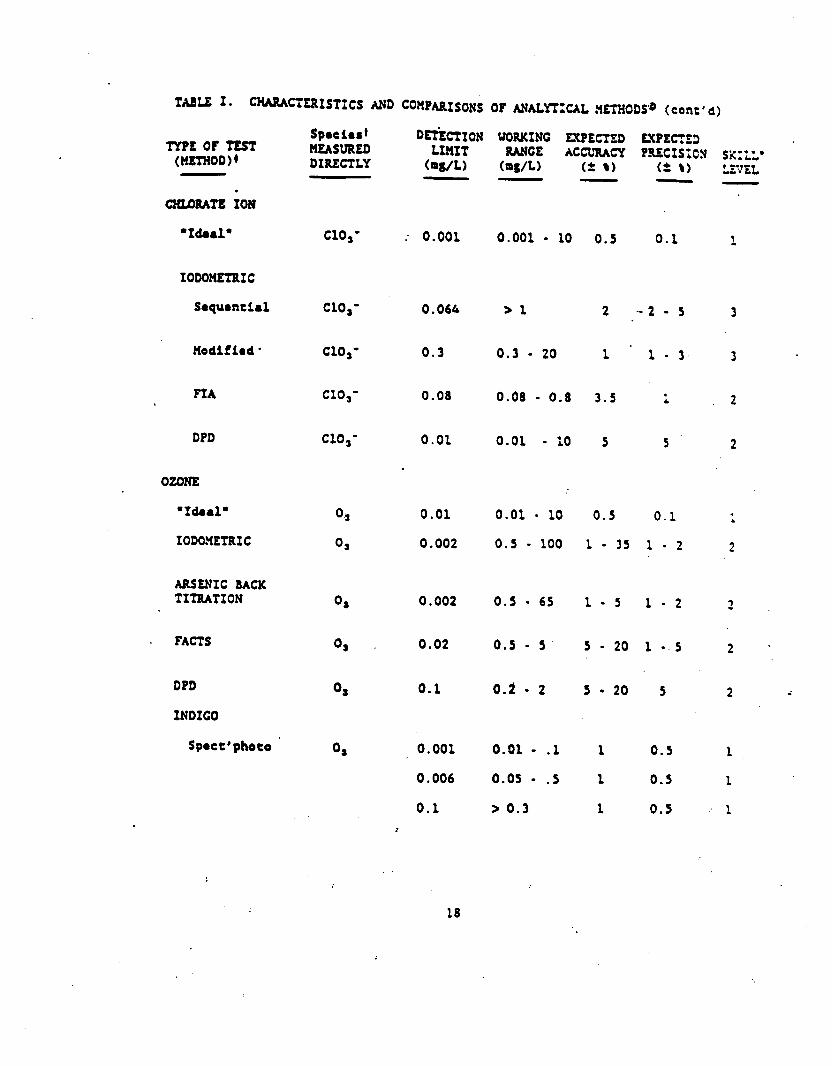
* 1 -. s .
1 0.3 1
1 0,s 1
1 0,s “ 1

19
. *
NO
.
.
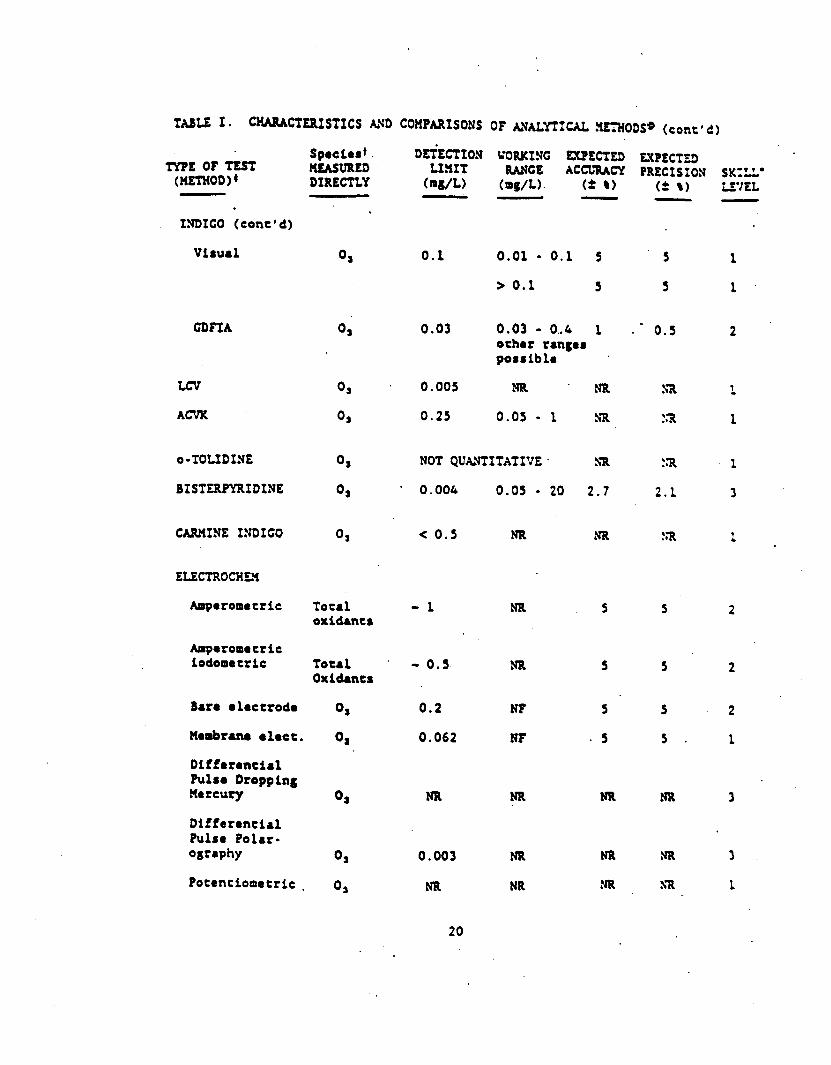
. . I 0 (
0, P tric i) 0,
0 a 3
NR
1
t I,
2
2
l
2
1
3
3 .
1

nma
non
2
4
NR
21
* L
N
0
‘
NO
NO
.
NO
N
. NO .RES

l ,
* 00
-2 . l
i *
*
1 .
I .
l

.
f
llr
.
Y s GOT 3 t
10 l
11
13
14
. 0
l 23
l ‘

II 2 .
6 l
l .
.
.
. * l 5
. I
l

1
.
.
.
d *

E
‘
l

l

will, h
methods,: wit cho~i~e/chl suffer ftom as
. l 29

fcai . .
I: eV&lurffon of concan- 18!w of II QDOIIII rrl
ati. ‘ t 83. . -
iofiarrr=Ibd lm tho ts with the ad
,
. 31 . . . *
. * .
.,

.
.
.

e
.
* . . .

l
a
.
*
.
.
l
. . .
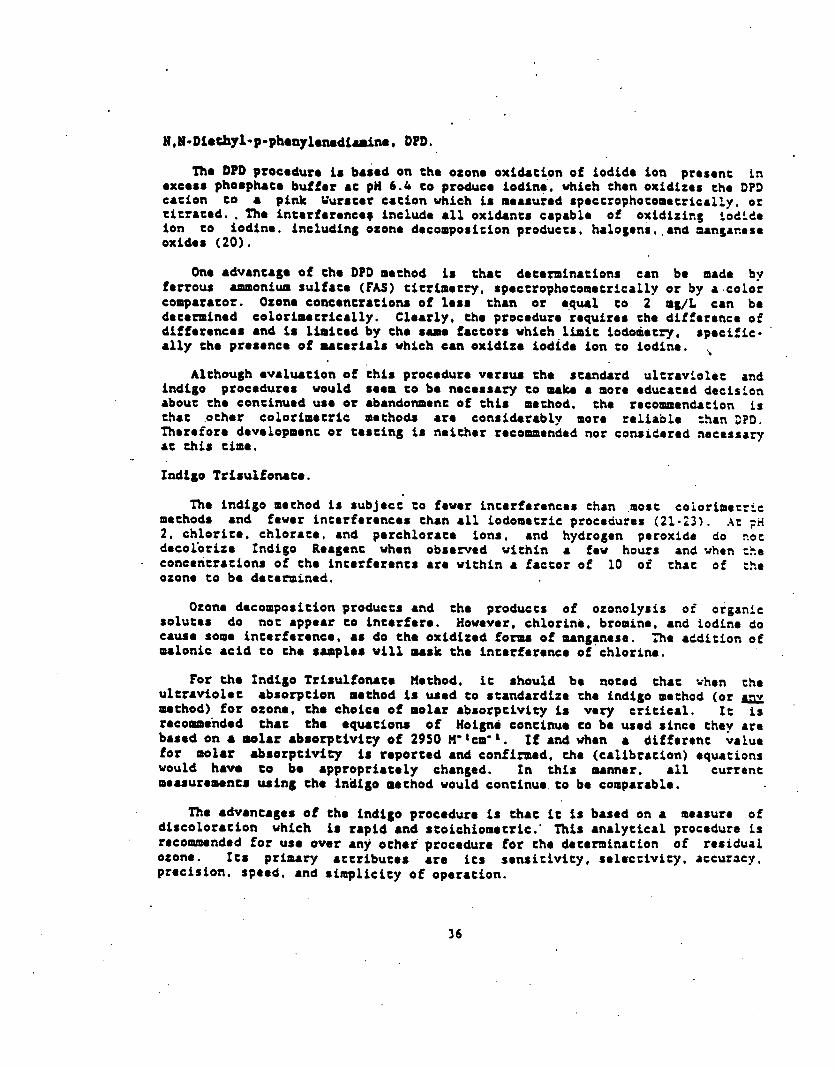
*
. . l
36
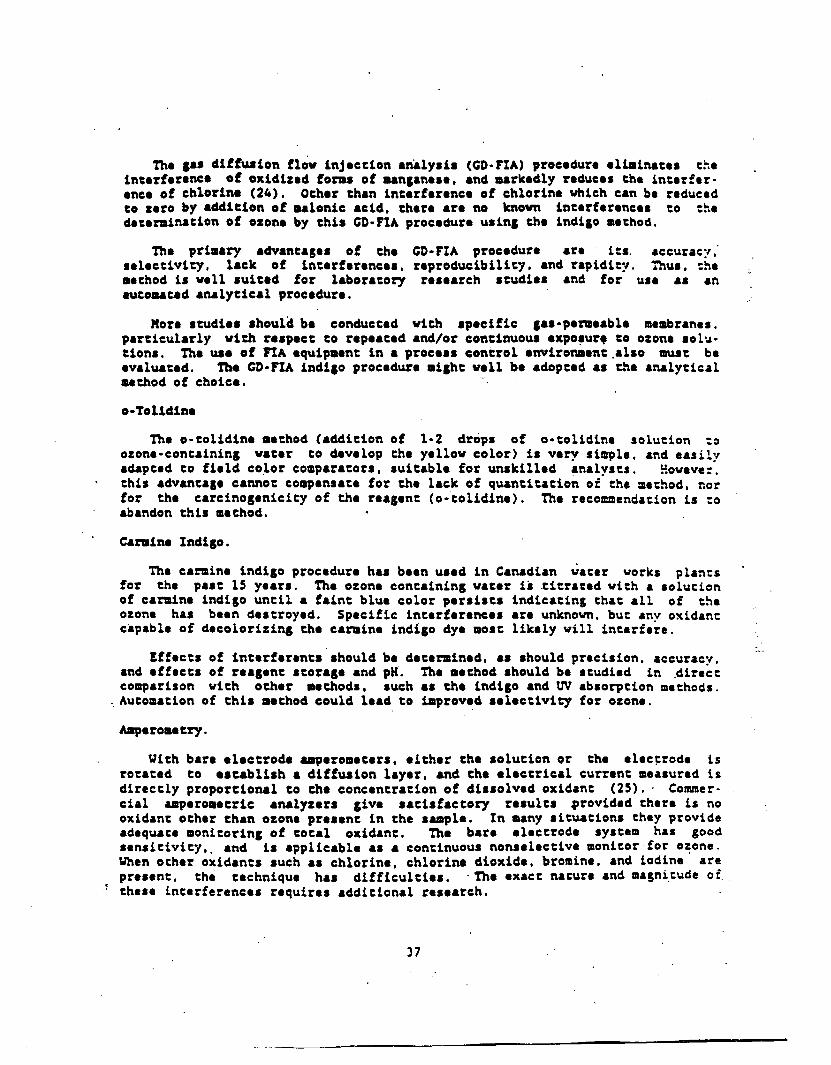
I
. I ) .
I .
37 a
a .
t ‘ . . l
. ,

* .
l *
. * 38
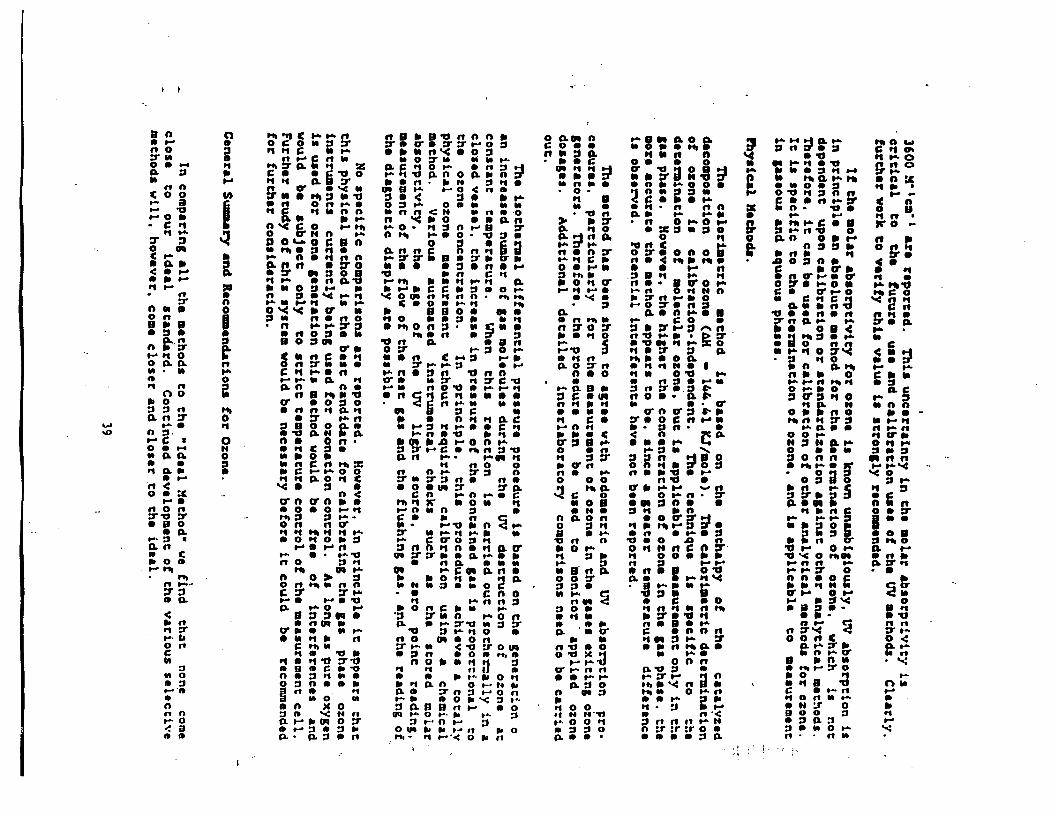
* .
-- - :
/
- - - -

0 l
n .

10 *
1 I)
1 *
* .
.
14 4
13 * * m .

. 22 .
23 *
27 l
‘icI, I and D rritfo l
08 c f . 1 ’ *
.

A brief ard v8riout rpec in .
IL

.
f
mm the s ‘
8 I, I HO t-, HO,, Ox, 0,-e
.
T .

APPENDIX E
INACTIVATIONS ACHIEVED BY VARIOUS DISINFECTANTS

TABLE E- I Cl' VALUES FOR INACrTVATBON
OF GIARDIA CYSTS BY FREE CHLORINE AT 0.5 C OR LOW pH43 .
Lo((- 0.5 1.0 1.5 2.0 2.5 3.0
n w. 28% 2 9 n 2 9 5 9 3 0 6 0 31 61 3 2 6 3 3 2 6 4 3 3 6 6 34 67 1 1 6 8 35'10 36 71
82 W 86 88 90 n 9s 97 99
101 103 la to7
109 I12 I I5 I I7 110 I 2 3 I 2 6 129 131 134 t37 139 142
1% 140 143 147 150 IS3 IS8 161 161 1 4 171' I74 In
163 168 I72 I76 I# I 8 4 189 193 197
20s 209 213
m1
0 5 1.0 1.5 2.0 25 3.0
55 s7 59 61 6)
6s 66 68 'Io 71 73 74 75 - n
110 IU 114 171 118 l?i I22 ' I83
129 I94 I 3 2 199 I% 204 139 #)9
142 213 145 218 148 222
153 210
1 2 s 1 8 8
IS1 226 -
p b 7 . 0
0.5 1.0 1.5 2.0 23 3.0 Iq-
33 6s 33 67 3 4 6 8 u r n 3 6 7 2 n n u n 3 9 7 7 3 9 7 9 40 $1 41 82 42 84 43 86
130 I 33 I 3 7 110 I43 147 IS1 IS4 IS7 I41 I 6 IU 171
o s 1.0 i s 2.0 2.1 3-0

HLORINE oNcENmATlON 4 4 -
< =0.4 0.6
. 0.0 I
I .2 I A I .6
' 1.0 2
2.2 2.4 2.6 2.0
3 HUMINE DNcENlmlmN
.kh) < -0.4
0.0 I
I .2 I A 1.6 I .0
2 2.2 2 A 2.6 2.8
3
0.6
pH<4
0.S 1.0 I .J 20 2 5 3.0 4-
21 42 a w IO5 126 pH40
lall-. 0.5 1.0 15 2.0 2.) 3.0
ATSC( I ) pH =6.5
6.5 1.0 1.5 2.0 2.5 3.0 m-
10 s 9 n 9 0 1 1 7 a0 10 a o o 1 0 0 1 2 0 20 41 61 01 102 122 21 42 63 U lo) 12s 21 42 H 05 106 In 22 43 o 07 to1 130 22 u 66 II 110 132 23 4s 60 90 113 I35 23 46 69 92 115 I# 23 47 ?o 93 117 144 24 40 72 95 119 I43 24 49 73 9 7 1 2 2 1 4 6 25 49 74 99 123 140 2s so 76 101 126 151
p H 4 . 5 4-
0.) 1.0 I S 2.0 2.5 3.0
SI 79 110 1 s 7 IQI m 41 81 122. 163 203 W 42 04 I26 160 210 252 43 87 I# I f j 217 2W 4s 09 I,M In m 261 46 9 1 . 137 1.3 228 ' 2 7 4
47 94 141 IO7 234 2 0 1 48 96 144 191 239 213 49 90 147 I% US 294 so 100 IJO m m m SI ' 102 I53 ZM . 255 306 52 lo( I S 6 208 2 a 312 53 IO6 IS9 212 265 310 51 IO8 I62 216 270 XU
pH ~ 7 . 0
O S 1.0 1.5 2.0 2.S 3.0 h-
30 61 91 I21 IS2 IO pH < ~ 9 . 0
h- 0.1 1.0 1.5 2.a 2 s 3.0
4 7 9 3 4 9 9 7 JOm 52 lo) 53 IO7 u 110 56 112 so I15 J 110 60 I 2 0
63 I 2 5 61. In
H in
IY tu 2001 200 213 219 m 230 2 s 241 245 250 255
6s 13Ol95 259324 3.9
#l=7.5 hl-
0 3 1.0 1 5 2.0 25 3.0
111 1 I4 1 I7
'I I) 122 IS I20 131 133 1% 13) 142
I47 i45
IU I71 It! l?! IC I& IW m 2ol 2m PI 213 211 211
I .

PILORINE oNcENTMTloH
< ~ 0 . 4 0.6 0.8
1 I .2 I A I .6 1 .I
2 2.2 2.4 2.6 2.8
3 'HUMINR m c ~ m .rdL)
< -0.4 0.6 0.8 I
I .2 I .4 I .6 I .I
2 2.2 2.4 2.6 2.8
3
pH<-6
0.5 1.0 I S 2.0 2 5 3.0 Lq-
1 2 3 4 3 7 4 9 1 3 Z S # 5 0 l 3 2 6 S 5 2 I 3 2 q 4 0 S 3 I3 27 40 53 I 4 2 7 4 1 5 5 I4 .28 42 55 I4 29 43 S7 1 5 2 9 4 4 % I5 30 45 59 I5 30 45 60 IS 31 46 61 I 6 31 47 62
61 63 61 66 67 u 69 72
74 75
n
n n
1 6 3 2 4 8 6 3 7 9 % pH4.0
0.5 1.0 i.5 2.0 2.5 3.0
2 5 5 0 26 S I 26 53 2 7 % 2 8 5 5 2 8 5 3 29% 3 0 6 0 30 61 31 ' 62 32 63 3 2 6 s 33 66 34 67
n n 79 81 83 8s 87 #)
91 93 . 95 97 99 101 -
AT IO C ( I ) pH 4 . 5
0.5 1.0 1.5 2.0 2.5 3.0
I5 29 I S 30 I5 31 I6 31 16 32 I6 33 I7 33 I7 34 17 35 I8 35 I8 36 18 37 19 37 I9 38
1) 45 46 47 U 49 so 51 52 53 54 55 56 n pH ~ 8 . 5
0.J 1.0 1.5 2.0 2.5 3.0 WL-
89 118 I 4 8 n 122 Is3 % I 2 6 IS 98 130 I 6 3
100 133 I67 I o 3 !37 In IO6 W I 176 IOI 143 I79 111 147 I 8 4 113 150 I 8 8 115' I53 192 117 I S 6 1% I 2 0 I 5 9 I 9 9 122 162 203
In I83 189 1% 200 206 211 215 221 22!5 230 234 239 ?A3 -
pH =X0
0.5 1.0 1.5 2.0 2.5 3.0 Lq-
1 7 s ~ m n w
1 8 n u n n w I8 36 54 71 09 101
I9 37 56 75 93 I l l I9 3 8 5 7 7 6 9 5 IU
2 0 4 0 6 0 7 9 9 9 I M 20 41 61 81 ICn 122 21 41 62 83 IO3 I24 21 42 64 85 Io6 m
22 44 66 . 87 I@ 131 22 45 67 89 112 I34 23 46 t@ 91 I14 13l
19 s sa n 97 IM
22 43 6s I( la tm
pH < r9.0
0.5 1.0 1.5 2.0 23 3.0 Lq-
3s m m 5 I B I 7 4 2 m 36 73 Mp I45 182 218 38 7S 113 151 188 226 39 78 117 IS6 I% W 40 m020 l a m ma 41 I 2 4 I65 206 %7 42 84 I27 I69 211 2 s 43 86 1 9 I73 216 259 44 U 133 I77 221 %S 45 90 I 3 6 181 226 271 46 92 I38 I84 230 276 47 94 141 I 8 7 234. 281 48 96 144 I91 239 287 49 97 146 IPS 243 292
pH -7.5 w-
0.5 1.0 1.5 20 23 3.0
21 21 22 22 23 23 1) 2s
26 26 27 27 28
n

HUMINE ONCENtluTKm en') -
< a0.4 0.6 0.8
I I .2 I .I 1.6 I .8 2
2.4 ' 2.6
2.8 3
HUMlNE ONCENTRAtloN w - 1
2:2
< =0.4 0.6 0.8 I
I .2 I .4 I .6 I .8 2
2.2 2.4 2.6 2.8
3
(I) CT = c 99.9
' pH<4 ht-
0.S 1.0 I5 2.0 25 3.0
8 I 6 2 S 3 3 4 1 49 8 1 7 2 S 3 3 4 2 S O 9 1 7 % % 4 3 52 9 1 8 2 7 % 4 4 5 3
9 1 8 2 8 3 7 4 6 U 9 1 9 2 8 3 ? 4 7 # IO 1 9 2 9 3848s 10 I9 29 3 9 4 8 S8 1 0 2 @ 3 0 3 9 4 9 9 1 o m 3 0 4 0 s 0 6 0 10 20 31 41 SI 61 10 21 31 41 S2 62 I 1 21 32 42u63
pH4.0 h- - 05 1.8 I.S 2.0 zs 3.0
1 I7 ..33 SO 66 &l 99 I7 34 S I U 83 101
9 1 8 n ~ a s
I8 35'. S3 'FD 0 lab 18 M H n m o a I 9 37 s6 74 93 I11 I9 38 S7 76 9S 114
1. I9 39 S8 n 97 116 20 40 60 79 99119 20 41 61 81 101 1 2 2
22 44 66 88 110 132 22 45 67 89 112 I34
Gx~ivsrirrlia
r o m ~ # 3 9 4 ? # s l 2 2 3 u 4 7 % 1 0 2 0 3 0 4 0 0 6 0 1 2 2 4 % 4 8 6 0 10 20 31 41 51 61 I2 24 '37 49 61 1 1 - 21 32 42 53 63 13 25 38 50 63 11 21 32 43 53 64 13 25 38 51 63 II 22 33 43 51 611 I 3 26 39 S2 U 11 22 33 U 55 66 13 26 40 53 66 11 23 34 45 S7 68 I4 2 7 4 1 W 68 I2 23 35 46 S8 6) I4 1 42 55 W 12 23 3S 47 S8 '10 I4 28 '43 S7 71 1 2 2 4 % 4 8 6 0 7 2 1 4 2 9 4 3 S 7 7 2 I 2 2 4 3 7 4 9 6 1 7 3 1 5 2 9 4 4 $ 9 7 3 1 2 2 S 3 7 4 9 a 7 4 u s 3 0 4 s $ 9 7 4 13 2S 38 SI 63 76 IS 30 46 61 16 91
20399 20 41 61 21 42 63 22- 43 6s 22 . . I S 67 2 3 4 6 6 )
2 4 4 8 7 2 2 s 4 9 7 4
a4 47 71
S S O ~ M 51 n 26 52 n 27 53 10
79 D l 84 n 89 91 94 w 98
100 102 IO4 I 0 6
93 117 UO n 122 I46
101 124 151 101 130 1% 107 I 3 3 I@ 110 138 la 113 U1 169 IIS 144 I 7 3 I18 I 4 8 I 7 7 I21 151 181 ID I53 IS4 I 2 5 In 188 127 IS9 191
27 W D l IOD 135 162 I 33 6S 98 130 163 1%
pH 173 h-
05 1.0 15 20 2s 3.4
# U IS IS I S I6 I6 I6 I7 I7 I8 I8 I8
28 29 29 30 31 31 32 33 33 w 3s 36 36
I9 37 % n 93 II

:HUlRINE -ATION YlL) -
' erO.4 0.4 0.8 I
I .2 . 1.4
I .6 I .I 2
2.2 2.4 2.6 2.8
3 I U W N E oNcENTMI1oN
< 1.0.4 0.6 0.8 I
1.2 I A 1.6 I .8 2
2.2 2.4 2.6 2 1
3
05 1.0 1.5 2.0 2.5 3.0
6 I2 18 % a 3 6 6 13 I9 Z S 3 2 R
' 7 1 3 2 0
7 1 3 2 0 2 7 3 3 4 0 7 I4 21. 27 M 41 7 I4 21 28 3 S 4 2 7 14 22 29 3 6 4 3 7 1 s 2 2 2 9 3 7 4 4 ? I S 2 2 2 9 3 7 4 4 8 I S 2 3 m S 4 S 8 I S 2 3 31 3 8 4 6 8 16 24 31 39 47 8 16 24 31 39 47
Lq-.
7 1 3 2 0 2 6 3 3 3 9
. pH4.0
0.5 1.0 1.5 2.0 2.S 3.0
I3 26 40 W . 6 6 79 I4 27 41 S4 ' 68 81 I4 28 42 5s 49 83 I4 28 43 57 71 8S 1 s 2 9 4 4 u n n I S 3 0 4 5 s 9 7 4 89 I5 30 46 61 76 91 1 6 3 1 4 7 6 2 7 8 9 3 I6 32 48 63 79 95 16 32 . 49 65 81 97 17 33 50 66 13 99 17 34 51 67 84 I01
AT2OC(I) pH =6.5
0.5 1.0 1.5 2.0 2.5 3.0 Lo(r-
7 1 s 2 2 2 9 3 7 4 4 8 I S 2 3 3 0 3 8 4 5 8 I 5 23 31- 38 46 8 I6 U 31 39 47 8 I6 24 3 2 . 4 0 U 8 I6 21 33 41 49 8 1 7 2 S 1 3 4 2 W 9 I7 26 W 43 51 9 1 7 2 6 3 5 4 3 S 2
9 1 8 2 7 3 6 4 5 s 9 I 8 2 8 3 7 4 4 S S 9 1 9 2 8 3 7 4 7 % IO 19 29 3 8 4 8 51
pH r8.5 w-
0.1 1.0 1.5 2.0 2.S 3.0
9 1 1 1 2 7 3 5 ~ s ~
I S 3 0 4 5 97489
1 6 3 2 4 8 6 3 7 9 % 1 6 3 3 4 9 6 5 8 2 9 8 17 33 50 67 83 100 17 34 'S2 69 86 . 103 I8 '35 53 10 U IO5
I8 37 55 73' 92 110 19 38 57 75 94 113 19 3S U n 96 I15
IS. 31 16 61 n ,n
18 w 72 9 0 1 0 1
20 H n P I I W 20 10 60 79 9 9 1 1 9 20 41 61 81 IOL I22
pW7.0
0.5 1.0 1.5 2.0 2.5 3.0 Ipll-
9 I7 26 9 I8 27 9 18 28 9 19 28
80 19 29 IO 19 29 IO 10 30 10 20 31 IO 21 31 II 21 32 I 1 22 33 I 1 22 33 I1 22 34
3s 43 36 45 3 7 4 6 3 7 4 7 3 a 4 8 3 9 4 8 3 9 4 9 41 S I 41 M as3 43 w 44s 45 56
11. 23 34 45 9 u pH < t9.0 4t-
0.5 1.0 t.5 2.0 2 5 3-0
I8 35 S3 I8 36 SS I9 38 n 2 0 3 9 s 9
21 41 62 21 42 63 22 43 65 2 2 4 4 6 6 2 3 1 5 6 8 23. 46 69 24 47 71 2 4 4 8 7 2
m l o d o
pW47.s w-
05 1.0 1.5 2.0 25 3.0
10 II 11 11 I2 I2 I2 I2 13 13 13 13 w
21 21 22 22 23 23
21 21 26 26 27 27
w
I 4 2 8 4 2 U Q
- . i.

TABLE 6-6 cr VALUES FOR'INACTIVATION
OF OlARMA CYSCI BY FREE CHUWUNE
MIBRINE x)NcENTMTK))J
k < m0.4
0.6 . . 0.8
I I .2
- 1.4 I .6
. 1.8 2
. 2.2 2.4 2.6 2.8
3 HLORINB -lmN
E L - m E
< ~ 0 . 4 0.6 0.8
1 I .2 I A I .6 I .I
2 2.2 2.4 2.6 2.8
3
pll< =6
b.- . .
0.5 1.0 IJ . 2.0 2 5 3.0
4 8 I 2 16 2@ .34
4 8 , I3 17 21 25 4 9 1 3 1 7 2 2 2 6 4 9 13 1 7 2 2 2 6 5 9 1 4 1 8 2 3 2 7 5 9 1 4 1 8 2 3 2 7 5 9 U 1 9 2 3 2 8 5 IO I S I9 24 29 S IO IS I9 24 29 5 IO I5 2025s S IO 15 2 0 2 5 30 5 IO I6 21 26 31 5 IO 16 21 26 31
pH-8.0
0.5 1.0 1.5 2.0 2 3 3.0
5 II 16 21 n 32
Lq-
8 17, 25 33 42 SO 9 I7 26 34 43 SI 9 1 8 z 1 % U S 3 9 I 8 2 7 3 6 4 5 s 9 1 8 2 8 3 7 4 6 S S 1 0 1 9 2 9 3 8 4 8 5 7 IO 19. 29 39 U SI 1 0 2 0 3 0 1 0 9 6 0 IO 20 31 41 S I 61 10 21 31 41 S2 62 II 21 32 *2 s3 63
II 22 33 u ss 66 II 22 34 45 # 6 7
II 22 33 43 54 8
AT 25 C ( I ) pH =6.5
0.5 1.0 1.5 2.0 2.5 3.0 Iq- - L_ P
S IO IS 19 24 29 S l O l 5 2 0 2 5 M 5 10 16 21 26 31 S 16 16 21 26 31
6 11 17 22 28 33 6 I1 I7 22 28 33 6 1 1 17 2 3 2 8 3 4 6 12 I8 2 3 2 9 35 6 12 I8 23 29 35 6 I2 I8 1A 3 0 3 6 6 I2 19 25 31 3l 6 I2 19 25 31 fl 6 1 3 1 9 25323
pH183 lal-
0.S 1.0 1.S 2.0 2.5 3.0
s II 16 21 n a
l o 2 0 3 0 3 9 4 9 1 IO 20 31 41 S I 61 II 21 32 42 53 63 II 22 33 43 ' 5 4 6s I 1 2 2 . 34 45 56 67 12 23 3s' 46 u . 69 I 2 23 ' 35 47 u 'fl I 2 2 4 3 6 4 8 6 0 7 2 1 2 2 5 3 7 4 9 6 2 7 4 I3 2S 38 SO 63 75 13 26 39 51 61 n 1 3 . 26 39 S2 U n 13 27 4U 153 67 10 I4 27 41 S4 68 I 1
pH =7.0 La(l-
O S 1.0 1.S 2.0 2.5 3.0 - 6 I2 88 23 29 6 I2 I8 24 30 6 I2 19 25 31 6 I2 19 25 31 6 13 I9 25 32 7 1 3 2 0 2 6 3 3 7 1 3 1 0 n n 7 14 21 n w 7 I4 21 27 34 7 I4 21 28 35 7 1 4 2 2 2 9 % 7 1 5 2 2 2 9 3 7 8 I S 2 3 3 0 3 8
31 % 37 37 38 39 40 41 41 42 43 U 4s
fl s7.5 hl-
0.s 1.0 1 3 2.0 2 5 3.0
7 7 7 8 8 8 8 8 8 9 9 9 9
I4 I4 1s I S I5 I6 I6 I6 I7 I7 I7 I8 I8
9 I8 28 37 1 6 . 5 3
.
99.9
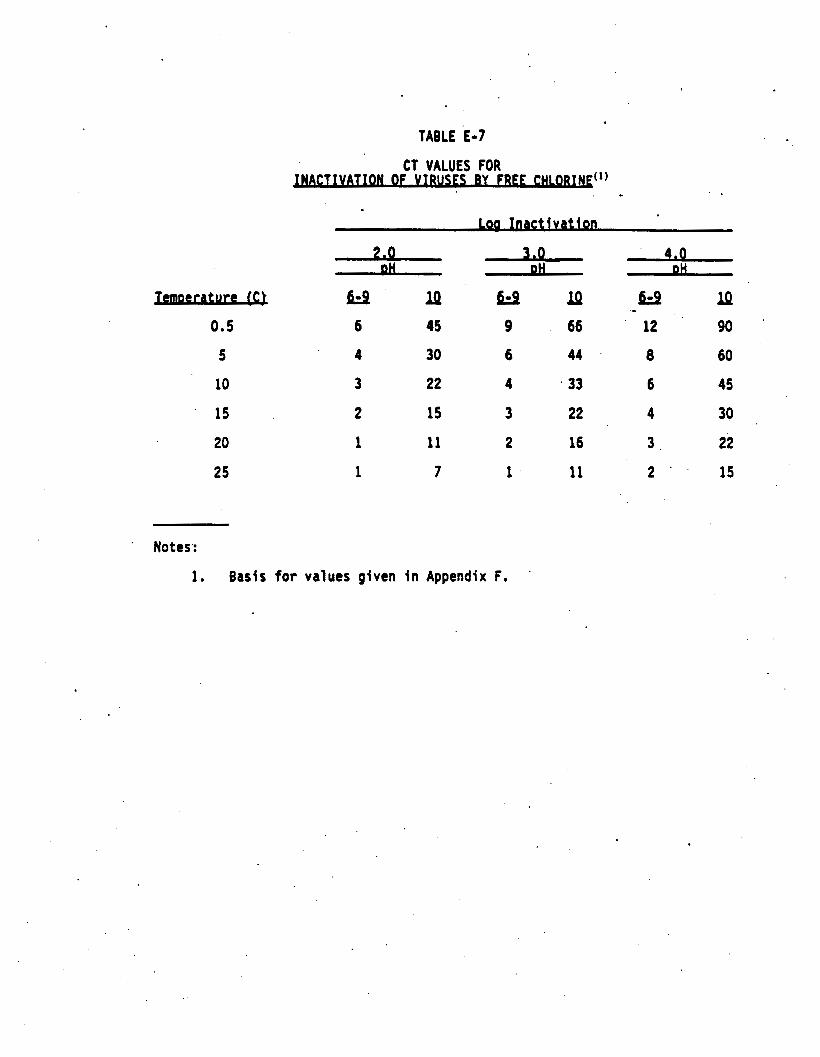
4
TABLE E-7
mlR-wLu 0.5
5
10
' 15
20
25
Notes:
CT VALUES FOR CTIVATION OF VIW BY FREE
*
Inactivation
2.0 3.0 4.0 DH A A
4rp lQ 4=9 1p fi=9 1p
6 45 9 66 . 12 90
4 30 6 44 ' 8 60
3 22 4 . 33 6 45
2 15 3 22 4 30
1 11 2 16 3 . 22
1 7 1 11 2 " 15
1. Basis for values given in Appendix F.
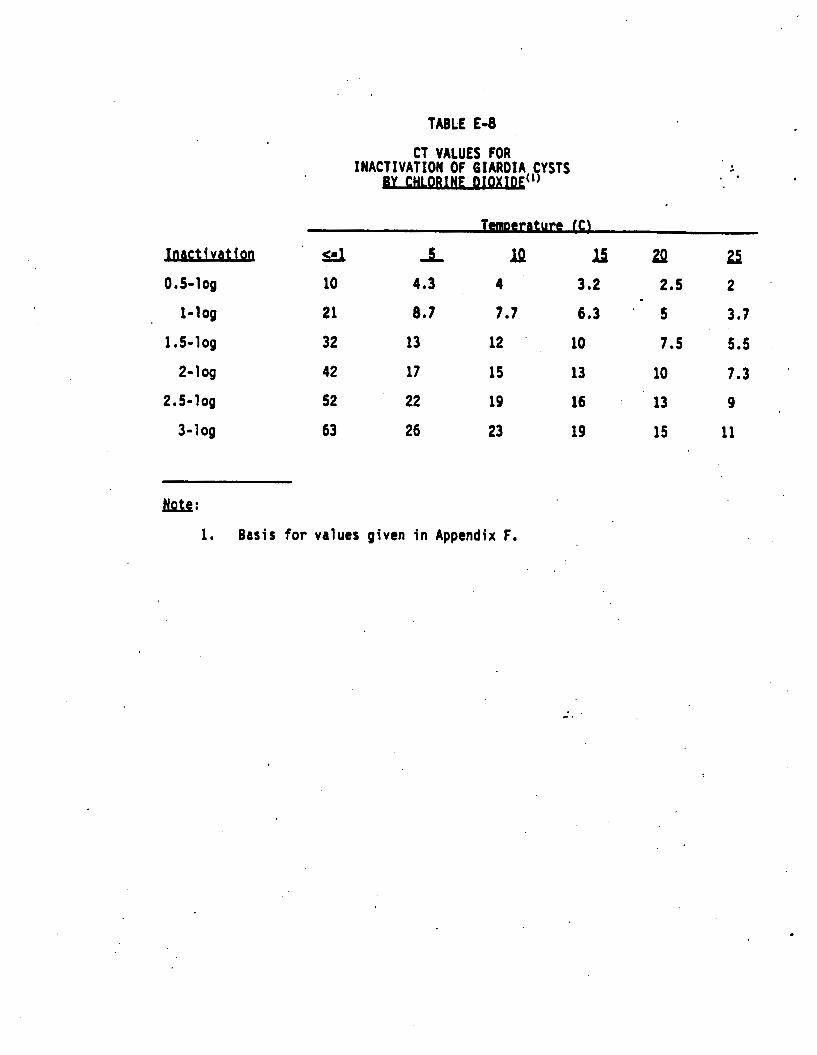
TABLE €08
CT VALUES FOR INACTIVATION OF GIARDIA CYSTS B y DIQLIIPT(1) . .
t-e IC\
ImaiYum sd J, u ls 2p 21
1-log 21 8.7 7.7 6.3 ' 5 3.1
1.5-log 32 13 12 ' 10 7.5 5.5
240g 42 17 15 13 10 7.3
0.5-10g 10 4.3 4 3.2 2.5 2
2.5-1 Og 52 22 19 16 13 9 3-1 Og 63 26 23 19 15 11
m: 1. Basis for values given i n Appendix F.

TABLE E-9
CT VALUES FOR INACTIVATION OF VIRUSES Y -brOXfM DH 6-9(1)
Rrmoval 2-109 8.4 5.6 4.2 2.8 . 2.1 1.4
. . 3-1 Og 25.6 17.1 12.8 8.6 6.4 4.3
4-1 Og 50.1 33.4 25.1 ' 16.7 12.5 8.4
Notes:
1. Basis for values given i n Appendix f.

TABLE E-10 CT VALUES FOR
INACTIVATION OF GIARDIA CYSTS gy Q&’) I -
O 5-1 Og 0.48 0.32 0.23 0.16 0..12 0.08
1-log 0.97 0.63 0.48 0.32 0.24 0.16
1.5-1Og 1.5 0 -95 0.72 0.48 0.36 0 -24
2-log 1.9 1.3. 0.95 0.63 0.48 0.32
&5-1 og 2.4 1.6 1.2 0.79 0 -60 0.40 ’
3-1 Og 2.9 1.9 1.43 0.95 0.72 . . ’ 0.48
: m: 1. Basis for values given in Appendix f.

TABLE E-11
2 4 0 g 0.9 0.6 0.5 0.3 0825 0.15 3-1 Og 1.4 0.9 0.8 4-1 Og 188 1.2 1 e o
0.5 0.4 - 0825
0.6 0.5 0.3
m: 1. Basis for values given i n Appendix F.
.. c
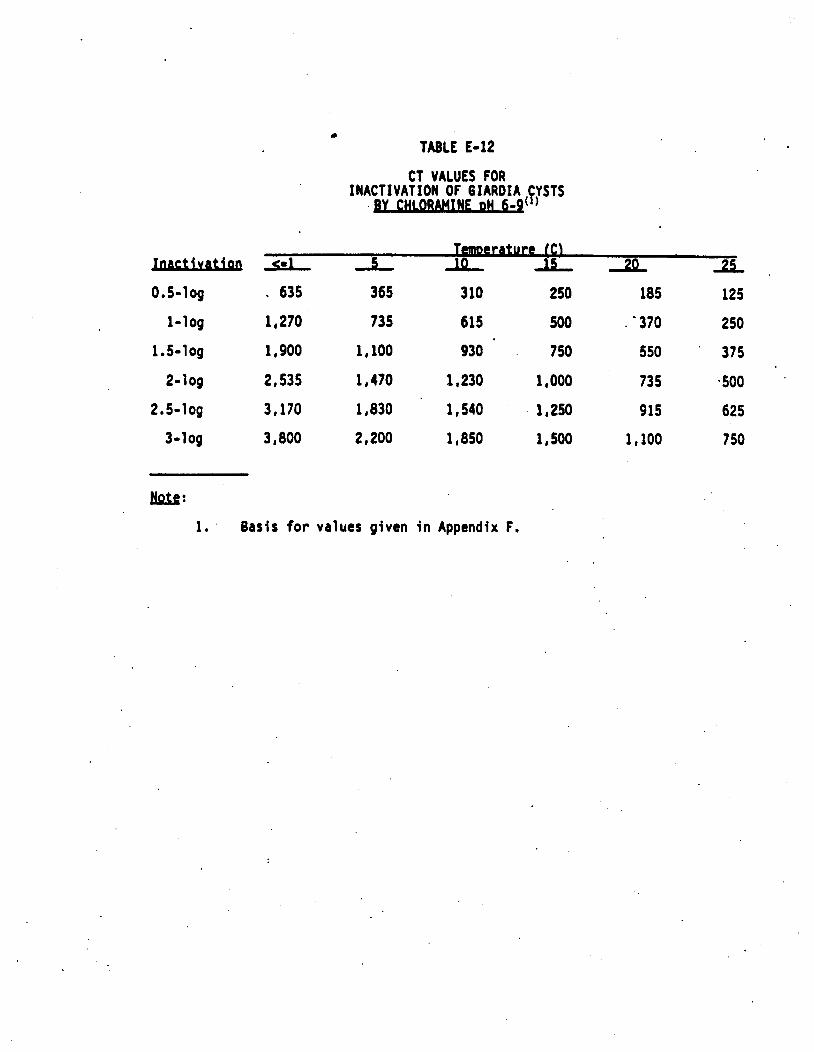
CT VALUES FOR I N A C T I V A T I O N OF G I A R D I A ( f r S f S
Y C H L O R W OH 6-9
T eraturc fCI <rl s z 152Q L . . 635 365 3 10 250 185 125
1,270 735 615 500 . '370 250
1 ,900 1,100 930 . 750 550 ' 375
2,535 1,470 1,230 1,000 735 -500
3,170 1,830 1 540 1 250 915 625
3,800 2 200 1,850 1,500 1,100 750
1. ' Basis for values given in Appendix F.

TABLE E-13
Cl VALUES FOR . OF VIRUqFS BY CHL6RAMfNE(’)
2- 1 og 1 , 243 857 643 428 321 214
3-1 09 2,063 1 , 423 1 067 712 534 356 4-1 Og zl883 1,988 1,491 994 746 497
Notes :
1. Basis for values given i n Appendix F.

TABLE €014
Lo- I on
21 36 3.0
Note:
1, Basis for values given i n Appendix F,

....
APPENDIX F BASIS FOR C f VALUES

APPENDIX F - F.l.l free sorb The CT values f o r f r e e c h l o r i n e i n Tables E-1 through E-6 are based *
on a s ta t is t ica l analys is (Clark e t al.,' 1988; attached t o t h i s appendix), which considered both animal in fec t i v i t y s tud ies (H ib le r e t ale-, 1987) and excystat ion studies (Jarrol l et a1 , , 1981; Rice e t a1 ., 1982; Rubin e t a1 ., 1988) A mul t ip l i ca t i ve model was selected t o best represent the chemical reactions during the fnactivatidn process. This model was applied t o each of the data sets, l is ted above, and i n various cunbina-
studieb. The animal in fec t i v i t y da ta was considered essent ia l . for i nc lus ion i n a l l t he ana lys i s o f wmbined data sets because i t included many more data points than the other data sets, a l l o f which represented
' i nac t iva t ion leve ls a t 99.99 percent. Because of l imi ta t ions wi th the excystation methodology, only data for achieving less than 99.9 percent inact ivat ion was avai lable from such studies.
Stat is t ica l analys is supported the choice o f combining the Hib ler e t a1 . and t h e J a r r o l l e t a1 . data (and excluding the Rice e t a1 e (1981) and Rubin e t a l . (1987) data), t o form the best f it model for predict ing CT values for d i f fe ren t leve ls of i t iact ivat ion. As a conservative regulatory strategy, Clark and Regli (1990) (attached a t the end o f t h s i appendix) , recotmended tha t C f values fo r d i f f e ren t l eve l s o f i nac t i va t i on be '
detemined by app ly ing f i r s t o rder k ine t ics to the 99 percent upper. confidence interval of the CT,,.,, values predicted by the model.
The model was applied using the above strategy as a safety factor, t o determine the CT values ranging from 0.5-10g to '3- log inact ivat ion a t 0.5 and 5 C. CT values for temperatures above 5 C were estimated assuming a twofold decrease for every 10 C. CT values f o r temperatures a t 0.5 C were estimated assuming a 1.5 times incrcase t o CT values a t 5 C. This
. general p r i n c i p l e i s ,supported by Hoff (1986). It i s important t o note that the CT values for f ree ch lor ine are sensi t ive to the residual
. t ions. The animal i n fec t i v i t y da ta were included i n a l l combinations -
F-1

r
' concentration, C. For exdmple, at. a pH o f 7 and a temperature of 10 C, a . - 3-100 cyst inactivation tesultt from a C f o f 107 ng/L-ain with a free residual of .0.6 g/L and a CT o f 124 mg/L-ain with a free residual of
Application of the model to pHs above 8, up to 9, nas considered reasonable because the model is substantially sensitive to pH (e.g., CTs at pH 9 are over three t i m s greater than CTs at pH 6 and over two times: greater than CTs at pH 7) . At a pH o f 9, approxiaately four percent of the hypochlohut acid fraction o f fret chlorine is still p r e s e k Recent data indicate that in terms o f HOCl residuals (versus total free chlorine residuals including HOCl and OC1') the CT products required for inactiva- tion o f E i a r u muris and -din cysts decrease with increasing pH from 7 to 9 (Leahy et a1 . , 1987; Rubin et ale, 1988b) . However, with increasing pH, the fraction of free chlorine existing as the maker +
oxidant species (OC1') increases. In t e r n o f total free chlorine residuals (i .e., HOCl and OCl-) the CT products required for inactivation o f E i a r u cysts increase with increasing pH fm 7 to '9 by less than a factor of 2 at concentrations 6f less than. 5.0 og/L (see *
Table F-1). Also, the significance o f pH on the value o f CT products achieving 99 percent inactivation appears to decrease with decreasirig temperature and free chlorine concentration. The relative effects o f pH, temperature, and chlorine concentration, on inactivatfon of Giardia cysts appears to be the same for m r d i a cysts (Rubin et a1 ., 1988b), although aot as much data for Giardia h&.Lb cysts for high pH and temperature values as for nuzh cysts is yet available.
2.0 mg/L.
F.1.2 @one md Chlorine Oioxidg The CT values for ozone in Table E-10 are based on disinfection
studies using yitrp . excystation of Giardia . (Wickramanayake, 6. e., et al., 1985)'. CT,, values at 5 C and pH 7 for
ozone ranged from 0.46 t o 0.64 (disinfectant concentrations. ranging from 0.11 to 0.48. olg/L). No CT values were available for other pHs. The highest CT,, value, 0.64, was used as a basis for extrapolation to obtain the CT values at 5 C, assuming first order kinetics and applying a safety factor o f 2, e.g., (0.64 X 3/2 X 2 = 1.9). .CT values for temperatures
F-2

TABLE F-1
QM 7
8
9
Temperature (CI w w 2.015.11
C o m t t a t i o n
1 15
1 15
1 15
500 200
510
440 3 10
760 290
820 220
1 , 100 420
1,460 360
1 , 300 620
1 , 200 290
1 , 300 320
2,200 . 760
..
. .

above 5 C were estimated assuming a twofold decrease for every 10 C. CT values f o r temperatures a t 0.5 C were est i ra tcd assuming a 1.5 t i b s increase t o CT values a t 5 C.
The CT values' for:chlorine dioxide I n Table E 4 are based on disinfection studies using yftrQ excystation of EJardip mr'rn CT,, values a t pH 7 and 1 C, 5 C, 15 C and 25 C (Leahy, 1985 and Rubin, 1988b). The average CT,, value a t each teatperatun (27.9 a t 1 C, 11.8 a t 5 C, 8.5 a t 15 C, and 4.7 a t 25 C) was extrapolated using f i r s t order k inet ics and mul t ip l ied by a safety factor of 1.5 t o obtain the CT,,., values, e.g.,
a t 1 C, C,,., 9 27.9 x 1.5 x 1.5 = 63. Because of the l imi ted data avai lable at pHs other than pH 7, the tam CT values are specified for a l l pHs. Although most o f the 'CT,, data were determined a t pH 7, it i s known that ch lor ine d iox ide is amre ef fec t i ve a t pH 9. Thus, the CT values i n the ru le are more conservative for higher pHs than f o r lower pHs.
A lower safety factor i s used for chlor ine d ioxide than for ozone, because the data was generated using Eiardia cysts nhi,ch are more resistant than M b l i a cysts. Cf values .at other temperatures . mr.e estimated, based on the same r u l e o f thumb a u l t i p l i e r s assumed f o r ozone
A larger safety factor was applied to the ozone and chlorine dioxide . data than to the chlor ine data because:
a.
b.
C.
d.
Less data were available for ozone and chlorine dioxide than for chlorine;
Data avai lable for ozone and chlorine dioxide, because o f the l imi ta t ions o f the excystat ion procedure, only ref lected up t o o r s l i g h t 1 beyond 99 percent inactivation. Data for ch lo- r ine, base i on animal Infect ivi ty studies rather than excysta- t i o n procedures, re f lected inact ivat ion o f 99.99 percent.. Extrapolat ion of data t o achieve C f values f o r 99.9 percent inact ivat ion wi th ozone and chlorine dioxide, involved greater uncertainty than the direct determination of CT values f o r 99.9 percent inactivation using chlorine. .
The CT values f o r ozone and chlorine dioxide t o achieve 99.9 percent inact ivat ion are feasible to achieve; and
Use o f ozone and chlorine dioxide i s l i k e l y t o occur w i th in the .plant rather than i n the d is t r ibut ion system (versus chlor ine and ,chloramines which are the l ikely d is infectants
F-3

. .
,/- - , for we i n the d is t r tbut ion system). Contact time masure-
mnt r w i th in the p lan t will involve nater uncertainty than measurement of contact time i n p i p e l 0 net.
€PA recognizes that the CT values for ozone and chlorine dioxide are ,
based on l ' imited data. Therefore, €PA encourages the generation of ' additional data i n dCCOrdanCe with the'protocols provided i n Appendix 6 t o ,
determine conditions other than the specified CT values,' for providing ef fect ive d is in fect ion a t a par t icu lar system.
.-
F.1.3 Qdorwnius The CT values f o r chloramines i n Table E-12 are based on disinfec-
tion studies using prefonacd chloramines And In Y l f f b ' excystation of (Rubin, 1988). Table F-2 suamarizes CT values for achieving
99 percent inactivation O f Giardia cysts. The highest CT values for achieving 99 percent inactivation at 1 C (2,500) and 5 C (1.,430) were each mul t ip l ied by 1.5 (i.e., first order kinetics wen assumed) t o estimate the CT,,h, values a t 0.5 C and 5 C, respectively, : in Table 512: The CT,, value o f 970 a t 15 C was mul t ip l ied by 1.5 to'estimate the CT,,., value. The highest CT,, value of 1,500 a t 15 C .and pH 6 was not used because it appeared anomalous to the other data. Interest ing to note i s that among the data i n Table F-2 the CT values i n the .lower residual concentration range (Q m g / L ) are higher than those'in the higher residual concentration range (2-10 mg/L) . This i s opposite t o 'the relationship between these variables for free chlorine.: For chloramines, residual concentration may have greater influence than contact time on the inactivation of Giardia. cysts within the range of chloramine p s i d u a l concentrations practiced by water u t i l i t i e s ( l e s s than 10 a g / L ) . .No safety factor was applied t o these data since chloramination, conducted i n the f ield,-- is more effebtive.
. than using preformed chloramines. Also, appears t o be more resistant than t o chloramines (Rubin, 1988b).
The protocol i n Appendix G can. be used t o demonstrate if less stringent disinfection conditions than those cited i n Table €012 c a i achieve comparable leve ls o f inact ivat ion for speci f ic system characteris- ':,
t i cs .
F-4
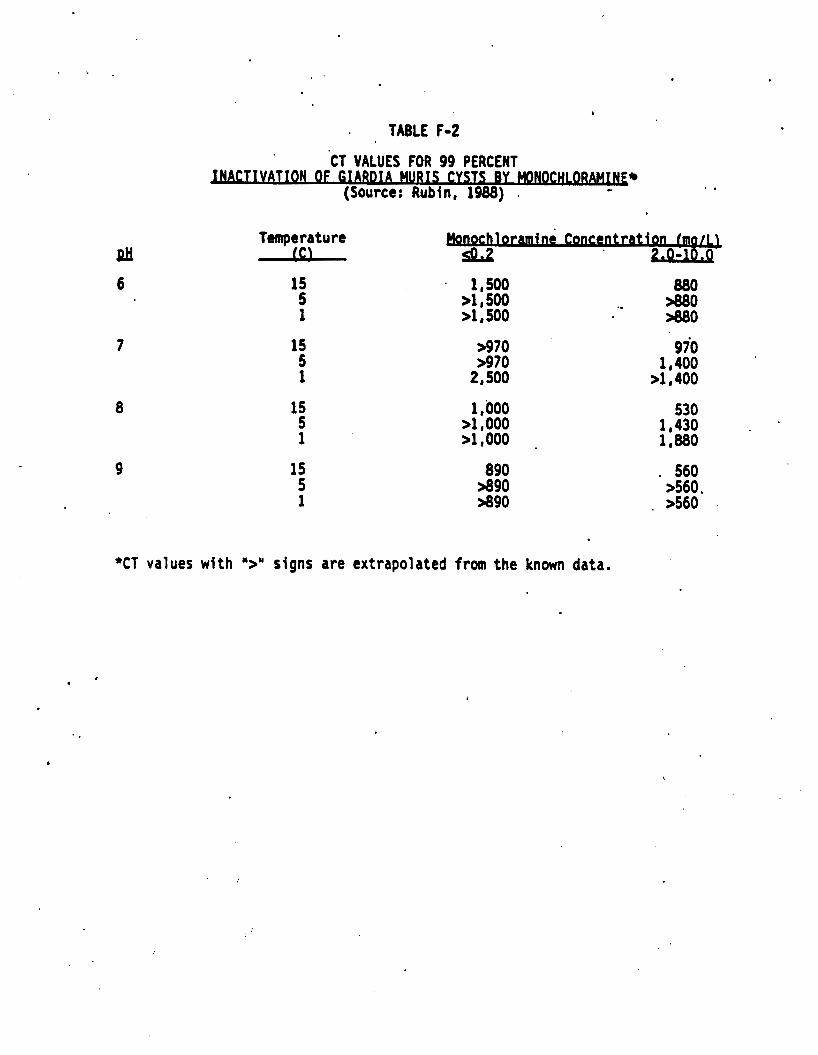
ptt 6
7
8
9
TABLE F-2 CT VALUES FOR 99 PERCENT
CTIVATION OF U D I A N R I S CYSTS By m- (Source: Rubin, 1988) . .. . .
Temperature A a2
loraminc C o n w t r a t
15 5 1
15 5 1
15 5 1
15 5 1
1 , 500 >1,500 >1 a 500
~ 9 7 0 >970
2 , 500
1,000 >1 , 000 >1,000 .
890 9 9 0 a 9 0
*CT values with ">Ic signs are extrapolated from the known data.
.-

F.2
F.2.1 free C h l o r b CT values fo r f ree ch lo r ine a re based on data by Sobsey (lm) for
inact ivat ion of Hepat i tus A virus (HAV), St ra in HM175, a t pH 6,7,8,9 and 10, chlorine concentrations of 0.5 t o 0.2, and a temperature o f 5 C, as contained i n Table F-3. The highest CT value fo r t he pH range 6-9 f o r *
achieving 2, 3, and 4-log inactivation of HAV mre mul t ip l ied by a safety factor of 3 to ob ta in the CT values l i s t e d i n Table E-7. (e.g; , the CT . value for achieving &tog inactivation at pHs 6-9 was determined by mult ip ly ing 2.55 X 3 = 7.6 = 8). The CT values a t pH 10 were s ign i f icant - ly higher than those f o r pHs 6-9 and are considered separately. The CT values i n Table E-7 f o r pH 10 also include a safety factor of 3. CT values a t temperatures other than 5 C were determined assuming a two f o l d decrease for every 10 C increase. CT values for inactivating viruses i n general are based on HAV data since they give h'igher CT'values than ttiose for inact ivat ion o f po l io and rotaviruses under s imi lar condi t ions of pH and 'temperature (Hoff , 1986)
.. . -
F.2.2 Qilorine Dioxide Data by Sobsey (1988) for inact ivat ion of Hepat i tus A v i rus, s t ra in
HM 175, by a chlor ine d ioxide concentrat ion of 0.5 mg/l a t pH 6 and 5 C i s shown i n Table F-4. The CT values i n Tab1 e E-9 f o r pHs' 6-9 and tempera- tu re = 5 C were determined by applying a safety factor of 2 t o the average CT values presented i n Table F-4 a t pH 6. This safety factor 4s lower than that used t o determine CT values for chlor ine because chlor ine dioxide appears t o be s ign i f i can t l y more e f f e c t i v e a t .. 'higher pHs and.most. waters are assumed t o have a higher pH than 6.
CT values a t ' temperatures other than 5 C i n Table E-9 were determined by applying a twofold decrease f o r every 10 C increase. The data for pH 9 was not considered because i t i s very l imi ted and other: viruses are more resistant to chlorine dioxide than Hepati tus A i s a t pH 9 . According to Ho f f (1986) a t a pH of 9 and a temperature o f 21 C, a CT . o f 0.35 provides a 4-109 inac t iva t ion o f po l iov i rus 1. Applying the same safety factor and r u l e o f thumb m u l t i p l i e r s t o t h i s data resul ts in a CT
. .
F-5 .

* . of 2.8 f o r a 4-109 v i rus Inact ivat ion a t *0SoC, i n contrast t o a CT of 50.1 resul t ing from the Hepatitus A data a t pH 6. Therefore, i n order t o assure inact ivat ion of Hepatitus A, the higher CT values are needed. Systems wlth high pHs nay wish t o demonstrate the effectiveness of chlorine dioxide at lower CT values based on the protocol i n Appendix 6. Chlorine dioxide i s much more effect ive for Inact ivat ing rotavirus and polio virus than it i s fo r inac t iva t ing HAV (Hoff 1986).
F.2.3 m r a m i M The CT values i n Table €013 a t 5 C mn based d i r e c t l y on data by
Sobsey (1988) using prefolarcd chlormines at pH 8. No safety factor'was applied to the laboratory data since chloramination ' in the f ield, where some ' t ransient presence of free chlorine would occur, i s assumed mri effect ive than preformed chloramines.
HAV i t less res is tan t to preformed chloramines than are 6ther viruses. For example, CTS of 3,800-6,500 were needed for 2-log inactiva- t i o n o f simian rotavirus at pH = 8.0 and ttraperature I 5 C (ham and Hoff, 1984) However; these S- viruses are very sensitive t o free chlorine. CT values ranging from less than 0.025 t o 2.16 were required t o achieve 99 percent inactivation of rotavirus by free chlorine at 'pH I 6-10 and tunperature 4-5 C (Hoff, 1986). HAV i s amre resistant to f ree chlorine than are rotavi ruses
The C f values i n Table E-13 apply f o r systems using combined chlorine where chlorine i s added p r i o r t o anraonia i n the treatment sequence. This should provide suff icient contact with free chlorine to assure inactivation of rotaviruses. CT values Table E-13 should not be used for est imat ing the adquacy of d is infect ion in system apply ing prefonaed chlo'ramines or ruanonia ahead o f chlorine, since C f values based on HAV inact ivat ion wi th preformed chloramines may not be adequate for destroying rotaviruses. In systems applying preformed chloramines, i t i s reconmended that inactivation studies as ou t l i ned i n Appendix G be performed with Bacteriophage"S2 as the indicator v i rus to determine suff ic ient Cf values. Also, the protocol i n Appendix G can be used .by systems applying chlorine ahead o f w n i a t o demonstrate less stringent disinfection conditions than those indicated i n Table E-13.
.-
F-6

TABLE F-3 CT VALUES FOR INACTIVATION OF HEPATITUS A VIRUS
Y F W N E .. (Source: Sobsey 1988) . *
OH
4 2 B 9 ' u 1.18 0.70 1 .oo 1.25 19.3
1.75 1.07 1.51 . 1.9 14.6
2.33 1.43 2.03 2.55 9.0
.
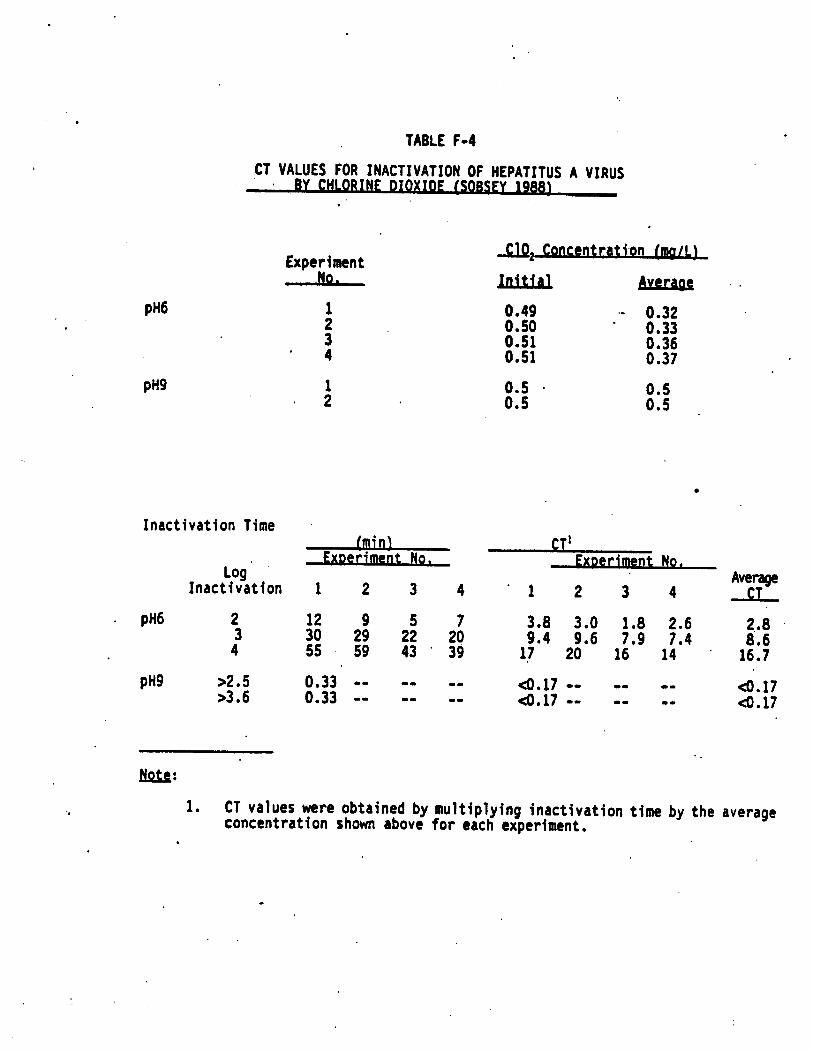
1ABLE F-4
pH9
CT VALUES FOR INACTIVATION OF HEPATITUS A VIRUS BY CHLORINE DIOXIDE ( W s E y 1988)
Experiment .No.
1 2 3
- 4
1 2
-2 Concentrati,on WL! lnitidl AY=a!E ' .
0.49 .- 0.32 0.50 ' 0.33 0.51 0.36 0.51 0.37
0.5 * 0.5 0.5 0.5
Inactivation Time (mi n\ CT1
t No. Lo9 -
Inactivation 1 2 3 4 * 1 2 3 4 Average Cf
. pH6 2 12 9 5 7 3 30 29 22 20 3.8 3.0 1.8 2.6 2..8 4 55 ' 59 43 * 39 9.4 9.6 7.9 7.4 8.6
17 20 16 14 ' 16.7
1. CT values were obtained by multiplying inactivation time by the average concentration shown above for each experiment.
6
F.2.4 * [lzonc No laboratory Cf values based on inact ivat ion o f HAV virus are yet
avai lab le for ozone. Based on data fm Roy (1982), .a mean C f value of 0.2 achieved 2-109 inact ivat ion o f po l iov i rus 1 a t 5 C and pH 7.2. h c h lower CT values are needed t o achieve a 2-log inactivation of mtavims (Vaughn, 1987). No CT values were available for achieving greater than a 2.109 inactivation. The CT values i n Table E-11 for achieving 2-log inact ivat ion a t 5 C were detenained by applying a safety factor of 3 t o the data frola Roy (1982). CT values f o r 3 and 4-log inactivation were dttemined by applying f i r s t order kinet ics and assuming the same safety factor of 3. CT values were adjusted for temperatures other than 5 C by applying a twofold decrease for every 10 C increase. Based on the available data, CT values for ozone d is in fect ion are not strongly dependent on pH. Therefore, data obtained a t pH = 7.2 i s assumed t o apply for pHs i n t h e range of 6.0 t o 9.0, However, i t should be noted that the maintenance o f an ozone residual i s affected by pH.
F.2.5 g i t r a v i o l e t LiQbt !UVl The CT values fo r inac t iva t ion o f viruses by UV are, based on studies . '
. .
by Sobsey (1988) on inact ivat ion o f Hepat i t is A virus (HAV) by UV. These data were used because HAV has been established as an important cause o f waterborne disease. The CT values were derived by applying a safety .
fac tor o f 3 t o t h e HAV inact ivat ion data. The CT values i n Table E-14 are . higher than the CT values for UV inact ivat ion o f po l iov i rus 1 and simian rotavirus from previous studies (Chang e t a1 ., 1985).
F.2.6 potassium P e m Potassium permanganate i s a comnonly used oxidant i n water
treatment. Preliminary testing by Yahya, e t a1 1988, indicates that potassium permanganate nay contr ibute to v i rus inact ivat ion. The tes t data included i n Table F-5 indicates the inactivation of bacteriophage MS-2 using potassjum permanganate with a pure water-buffer solution. These data do not include safety factors. It i s l i k e l y t h a t CT values for actual water treatment processes will di f fe r from these values. This data has only been provided here as an indicat ion o f the potent ia l of potassium .
F-7

n u 4 nu& 0.5 27.4 a(') 2 6 4 a
1.5 32.0 a W.9 b 2.0 N D ( ~ ) * 53.5 c
5.0 63.8 a 35.5 c
1. Letters indicate di f ferent cxperikntal condit ions.
2. Not determined.
.

THE BASIS FOR TREATMENT RULE :
C'T VALUES I N THE SURFACE WATER ,
INACTIVATION BY CHLORINE
Robert I!. Clark, Director Drinking Water Research Division
Risk Reduction ,Engineering Laboratory Cincinnati, OH 45268
and
St ig Reg1 i Office o f Drinking Water
U. S . Environmental Protect i on Agency' Washington, DC 20460 .
RISK REDUCTION ENGINEERING LABORATORY OFFICE OF RESEAReH AND DEVELOPMENT
U. S. ENVIRONMENTAL PROTECTION AGENCY CINCINNATI, OH 45268
*
February 1991
THE BASIS FOR GIARora C'T VALUES 'IN THE SURFACE WATER TREATMENT RULE: INACTIVATION BY CHLORINE
bY
Robert W. Clark,' and Stig Reglib
INTRODUCTION
The 1986 amendments to the Safe Drinking Water Act (SDWA) require €PA to
promulgate primary drinking water regul ations (a) specifying criteria under
which filtration would be required, (b) requiring disinfection, as a treatment technique for a11 public water systems, and (e) establishing maximum
contaminant levels (MCLs) or treatment ,requirements for control of Giardia
lamblia, viruses, Leafonella, heterotrophic plate count bacteria, and
turbidity, EPA has promulaged treatment technique requirements to fulfill the
SDWA requirement for systems using surface waters and ground waters under the
direct influence o f surface water.' Additional regulations specifying
disinfection requirements for systems using ground water sources not under the
direct influence of surface water will be proposed and promulgated at a later
date. This paper presents a model that relates pH, temperature, chlorine
concentration, and inactivation level to Elardla inactivation by free
chlorine. Because Uardia lamblia is known to be one of the most resistant
- .
organisms to disinfection by.ch1orine found in water, much interest and effort
a Director, Drinking Water Research Division, Risk Reduction Engineering Laboratory, 26 W. Martin Luther King Drive, Cincinnati, Ohio 45268
bUSEPA, Office of Drinking Water,, 401 M Street,'S.W., Washington, DC 20460

has been devoted t o determination of C't values for h'u. The
model has been used to predict 'C ' t" values that have been Included as part of
EPA's Surface Water Treatment Rule (SUTR).
* .
BACKGROUND ' 5
Under the SUR all conanunity and non-cokunity public water systems using & 9 ? -
surface water, or ground water under the direct influence of surface water, are required to provide ainimurn disinfection'to control fjiardil \rmb'lla, enteric viruses and bacteria.' In addition,.unless the source water i s well
protected and meets certain water quality criteria (total or fecal io1 iforms
and turbidlty limits), treatment must also Include filtration. The treatment
provided, in any case, is required to achieve .at least 99.9 percent removal . and/or inactivation of Giardia Jambliq cysts and a t least 99.99 percent
i removal and/or inactivation of viruses (i.e., virus of fecal origin and
infectious to humans). Unfiltered systems are required to demonstrate that . . .
. disinfection alone achieves the minimum performance requirements by monitoring . %;
disinfectant residual(s), disinfectant contact time(s), pH (if chlorine, is -. ri; - ,
used), and water temperature. These data must. be applied to determine if their --.a - # C a t ' value [the product of disinfectant concentration (mg/L) and disinfectant .
contact (minutes)] equals or exceeds the C't values for fifardia
specified in the SUR.' With the exception of chloramines, where amnonia is
added prior to chlorine, these C't values are also adequate. to achieve greater
. .
than 99.99 percent inactivation of viruses. For filtered systems, states are
required to specify the level of disinfection.for each system to ensure that their overall treatment achieves at least 99.9 and 49.99 percent removal . and/or inactivation of Giardia jamblla cysts and viruses, respectively. 1
In the Guidance Manual to the SWTR, €PA recomnends C't values for

different disinfectants to achieve levels of inactivation for unfiltered
systems, filtered systems will be required to rehieve less Inactivation then
required for unfiltered systems. The percent inactivation that filtered
systems should achieve as a function of the filtration technology in place and source water quality conditions is-also recouunended.'
I - .
. PROBLCU
The destruction o f pathogens by chlorination is dependent 'on 8 number of factors, including water temperature, pH, disinfectant contact t h e , degree of
mixing, turbidity, presence of interfering substances, rnd concentration of
chlorine avallable. The pH has a significant effect on Inactivation
efficiency because it determines the species of chlorine found in solution,
each of which has a different inactivation efficiency.
The impact of temperature on disinfection efficiency is also slgnificant.
For Example, Clarke's work in virus destruction by chlorine indicates 'that
contact time must be increased two to three times when the temperature is
lowered 10°C.3 Disinfection by chlorination can inactivate Eiardig cysts, but
only under rigqrous conditions. Host recently, Hoff et al, concluded that (1)
these cysts are among the most resistant pathogens known, (2) disinfection at
low temperatures is especially difficult, and (3) treatment processes prior to
disinfection are important.'
Typical C't values for 99 percent inactivation of Eiardia Jamblla by free
chlorine a t different temperatures and pH values are shown in Table 1.
3

TABLE 1. COT VALOES FOR 99% INACTIVATION OF &IARDIt' LAMBLfA CYSTS BY FREE CHLORINE
g!.
e Disinfectant
Temp Concentration TIN (OC PH (RIo/L) (ain) C't C't Experiments 5 6 1 ;.0-8 0 6-47 47*84 65 . I
7 2.0-8.6 7-12 56-152 97 3 8 2.0-8.0 72-164 72-164 -110 3
Mean No. o f
IS. 6 2.5-3.0 7 18-21 20 2 7 2.5-3.0 6-18 18-45 32 2 8 2.5-3.0 7-21 . 21-52 37 2
25 6 1.5 c. 6 C 9 C 9 1 7 1.5 ( 7 (10 c10 1 8 1.5 c 8 4 2 <12 . 1
Jarroll et ol., using vitrQ excystation to determine cyst.'viabtlity, -A .*b,
. showed that greater than 99.8 percent o f Eiardia Jamblip cysts can be killed -E-?
by exposure to 2.5 arg/L o f chlorine for 10 minutes at l5'C and pH 6, or after
60 minutes at pH 7 or 8. At S°C, exposure'to 2 mg/L of chlorine killed at
least 99.8 percent o f all cysts at pH 6 and 7 after 60 minute^.^ While it
required 8 mg/L to kill the same percentage of cysts at pH 6 and 7 after 10
minutes, it required 8 mg/L to inactivate cysts to the same level at pH 8
after 30 minutes. Inactivation rates decreased at lower temperatures and at
. .
. . -
higher pH values as indicated by the higher C ' t values. Because 'of the obvious interactions among these variables it i s essential
that a model be developed for predicting C't values under the various
conditions that ray exist. in drinking water, systems,
4

OBJECTIVE As Indicated, @any factors Influence U d i a tambllr reaction kinetics.
The objectlve of the study described In thls paper therefore 1s to develop an' .-. equation that will relate C't values for inlctivated by chlorlne to
such factors 8s pH, temperature, level' of Inrctlv8tion m d chlorlne
concentration. As mentloned previously, this equation ultlaately provided the ,
values presented In the SWTR and rssoclrted Guldance Manual for dlslnfectlon
of 5- by free chlorlne.
. .
SIGNIFICANCE
The significance of these efforts relates to the fact that EPA's Office
of Drinking Water has adopted the C't concept to quantify the inactivatlon of
Giardia lamblia by disinfection with free chlorine. Whether or not a utility is forced to install surface water treatment will depend, on its ability to
meet the C't values specified by the SUTR. Even if the utility is not
required to install filtration a utility may have to make significant
. investments in holding basins and disinfection capacity In order to meet these
' requirements. Therefore C't values established under the. SUTR will be
extremely important to the'drinking water 'industry and the authors believe it'
is important that the industry understand the basis for the procedures used t o
estimate these values. This paper describes the way in which C't values were
6 calculated for the MR. It Is unlikely that'utilities can directly use the.
models developed in this paper, although it is important that they understand ,
the mechanism by which C't values have been derived. Tables generated from
the wdel will be useful as they provide the C't values for 5iardia inacti-
vation by chlorine that utilities must achieve. These tables are presented at
the end .of the paper. .
5

THEORY
Current disinfection theory i s based on the Chick or Chick-Watson model. Chick's law expresses the rate of destruction of microorgrnisars based on a
f"--i. i
first-order chemical reaction.'
dN/dt 9 -kt (1)
which when integrated yields
In (\/Ne) .I -kt . (2) .-
N, = number o f organisms present at time t (minutes) where . .
N, = number of organisms present at time 0 ' ,
k = rate constant characteristic of type o f disinfectant,
t = time (minutes)
Watson, using Chick's data, refined this equation to produce an empirical
microorganisat, and water quality aspects o f system (minutes") - .'.
velation that included changes in the disinfectant concentrati.on:' In (N/No) - r C"t v- " .LF.
. (3) .+-
where
C = concentration of disinfectant [ (milligrams/l iter)*'"] r - coefficient of specific lethality (liters/milligram minutes)
n = coefflcient of dilution (liters/ailligrams minutes)
or
(l/r) 1 n (Nt/No) = C"t (4)
For a given level of survival such as N,/No = 0.001 (3 log reduction) the left
hand side of equation 4 is a constant K, or
K - C"t (5)
The value K will vary depending on the level of inactivation.
6

\
where
temp temperature at which experiment was conducted in OC
pH - pH at which experiment was conducted in pH units
Equation 6 can be rewritten in the form:
c a t R PCbpHCtempd ( 7 )
where
R,a,b,c, and,d are coefficient to be determined. .
A more convenient form for coefficient estimation and the one used in this
paper is as follows:
- t = R I c PH tempd 4 b-1 c (8)
As will be discussed in the following sections these coefficients will be
determined by a statistical analysis using appropriate data bases. COEFFICIENT ESTIMTES
Several data sets are available for estimating the coefficients in. .
equation 8. Data sets have been developed by Jarroll, Hibler, Rice and Rubin.Sos#lOvI1
Much of the available giardia inactivation data is based on. excystation.
rather than animal infectivity since it is an easier measure o f cyst
viability.'l Hoff et at. compared mouse infectivity and excystation for
7

' determining the viabiiity of 5. mui,S cysts exposed to chlorine rnd reported '
that both methods yielded slmllar tasuits.1' Hibler et al. used Mongolian gerbils to deternine the effects of chlorine on &. u b l i a cysts.' In a
. series of experiments, cysts were exposed for various time periods to free ._ : - -*. .* I
chtorine concentrations ranging from 0.4 to. 4.2 mg/~ at 0.5, 2.5, 8nd 5 .00~
and pH 6, 7, and 8. Erch of's gerbils was fed 5 x lo' o f the chlorine exposed
cysts and subsequently examined for evidence 'of infection. ,Since the test
animals had each received a dose of 5 x 10' o f the . _ chlorine exposed cysts and
,.
--.
. . subsequently examined for evldence o f infection and since infectivity studies
with unchlorinated cysts showed that approximately 5 cysts usually constituted
an infective dose, the following assumptions were caade dependi.ng on the
infectivity patterns occurring in the animals. If all five animals were
infected, it was assumed that C't had produced less than 99.99 percent
inactivation and if no animals were infected, that .it had produced greater
than 99.99 percent inacti~ation.~ If, however, 1-4 animals were infected It
was assumed that the level of viable cysts were 5 per animal and that 99.99
percent of the original cyst population had been inactivated. Hibler
interpolated from the results and provided comprehensive tables showing C't.
values at O.S0C temperature interva]~.' Because of observations. indicating
that C't values increased as chlorine concentration increased within the range of chlorine concentrations used, Hibler et a i . advised against use of the C't.
values for chl'orine concentrations above 2.5 mg/L.
fable 2 sumnarites Hibler's data for the different experimental * . conditions examined. Column 3 shows the range o f chlorine concentrations i n
mg/L to which cysts were exposed before being fed to the gerbils, and Column 7
shows the number of experiments which yields 1-4 infected gerbils out of 5.
*-.'

Column 4 shows the range Of cyst exposure times rnd Column 5 contains the
range o f C ' t values that r re the product o f the ch lor ine concentrat ion and
cyst exposure time. , .
TABLE 2. C'T VALUES FOR 99.99 PERCENT INACTIVATION BASED ON ANIMAL INFECTIVITY DATA
Range o f Range o f Cyst Exposure Ran e o f Ran e o f Number of f Temp Conc, Time C ' t va ues from Pr.e t! i c ted Obserln-
pH "c (mg/L) . (min) Data C ' t Values t ions
f I:: 0": 6 5 0. i 0.5' 0. 7 2.5 0. 7 5 0. 8 0.5 0. 8 2.5 0. 8 5 0.
x 1-3. 1-3. -4. ,=4. 1-4. ' -3 . 1-3. -3.
96 80 47 05 23
25 24 67
oa
39 - 300 . 18-222 25-287 76-600 55-350 47-227
132-593 54-431 95-417
7 6 5
15 12 14
3 '5 '0 6 4 4 9 5 0
7 ' -2 ' - 1 -3 -3 -2
-3
63
47 22
-526 -37 1
86
136-192 107-151 93-134
205-295 169-235 156-211 294-410 233-324 209-299
25 15 26 14 14 15 22 . 21 15.
Hibler's data set, based on animal i n f e c t i v i t y , i s appealing because i t
i s a more d i rect ind icator o f cyst v iab i l i ty than data based on excystation.
However the C ' t values i n t h i s data set are based so le ly on 99.99 percent
inactivation. The other three data sets, based on excystation, have values
calculated f o r all four parameters i n equation 8. Table 3 contains a sumnary
characterization of the studies on which these data sets were based. Because
' no one individual experiment provided the exact characteristics required for
t h i s study an attempt was made t o f ind the 'nost consistent" set of data f o r .
parameter estimation, which might include several o f t h e data sets discussed.
9

TABLE 3. CHARACTERIZATION OF &. FREE CHLORINE* INACTIVATION STUDIES USED IN PREDICTIVE HODELS
Reference cyst Viability Comen t s NO. Source Assay .- 'I -
5 Symptomatic rxcystatlon Conventional - A
human survival ,curves based on. multiple snap1 es End point - 0.1% survival
-, ..
7 Gerbils, adapted gerbil 'infec- No survival curves. from infected tivity (5 Endpoint sought . humans. (CDC anicrls/sample) - 0.01% survival i sol ate)
8 Symptomatic and excystation Conventional nonsymptomat ic survival curves humans based on mu1 tiple
samples. End point - 0.1% survival .-. .
u.
9 Gerbils adapted excystation Conventional from infected survival curves humans. (Several based on mu1 tiple i sol ates used) samples. . End
e".- &-.
*Data provided by Dr. John Hoff formerly of USEPA
*. The Hibler data set was included in a11 combinations considered because
it was the largest data set, the data set was based on animal infectivity, and
. the data reflected higher percent inactlvation than required under the SWR.
Since the data based on excystation, with the exception of a few data points,
only reflected percent inactivation up to 1 log or 1,ess than that required
under the SWTR, inclusion o f the Hibler data was considered essential for
-developing a model that could predict disinfection conditions for achieving 10

99.9 percent inact ivat ion wi th ainimm uncertainty. f i l tered systems will
need t o know disinfection condit ions for achieving less than 99.9 percent
inactivation. Therefore data from a t least one of the excystrtion studies was,
considered essential since t h e C ' t values i n the SUTR may be used f o r
ca lcu lat ing par t ia l inact ivat ion leve ls (1.8.. less than 99.9 percent).
. .
A fundamental question that needed t o be addressed was t he s ta t i s t i ca l
compatibil i ty of the data sets. I n i t i a l regression estimates for.each o f the
data sets were made using equation 8.'' High #rr8 were obtained for these .
f i t s but slgnif icant dif ferences were found f o r the "R" coef f i c ien t o r slope.
This indicated that the basic model was adequate but that there were
differences i n the coefficients as defined by the individual estimates using
equation 8. It was decided t o 'anchor" a l l of the data sets to the Hibler
data set. The approach used was t o construct an ind icator random variable t o
move the regression intercept or slope t o compensate f o r data set
differences." The signif icance o f the indicator random variable would .
support the hypothesis o f different regression surfa'ces, i.e., incompatibi l i ty
o f the data sets chosen. The ind icator random variable w.as created i n such a
way as t o always d i f f e r e n t i a t e between the' Hibler data s e t and other data sets
considered and t o move the regression intercept not the slope. The indicator
random variable was defined as follows:
o i f Hibler data
1 i f other data 2 - r l ( 9 )
Therefore equation 8 was modified as follows:
t - R I C pvtemp 10 (I b-1 d u (101
where t, I , C, pH, temp 'are defined as i n equation 8, and R,a,b,c,d,e a r e
constants determined from regression.
11

Equation 10 can ba t r a n s f o m d as follows:
log t log R + a l og I +. (b-1) l o g C t c log pH + d temp + ez (11)
:In equatlon 11 when z 0 equation 10 i s defined over the Hibler data set,
and u-- Y
t R I* c"' pHc tempd (12) 4 . . i. v. ._
When z - 1 equation 10 I s defined over the remrinlng data and -r6 :*? 7
t - (R 10') I* cbo1 p t t tempd - (13)
Table 4 displays the data set combinations and regression dlagnostlcs. Note
that t I s the Indicator random variable.
I n Table 4, t h e f i r s t column shows the various data sets considered 'In
the analysis. Column two contains'the 'r2' values based on equation 13 for '
each o f the data combinations. Column three indicates major resul ts of. the
* analysis. for example i t was found, f o r t h e f i r s t data set combination, that
the intercept, and temperature variable were not slgnif icant. Column 4 shows
the t e s t that was used t o determine whether o r not the equation yields biased .*-- ** >.
results. ;z.
As indicated i n Column 4 o f Table 4 residual plots were used t o determine
constant variance and normality. Fortunately a s t r i c t assumption o f normality
i s not required. As s ta ted in Neter, Wasseman and Whitmore 'Small departures
from normal i t y do not create any serious problems. " Hajor departures, on the
other hand, should be o f concern". further they wr i te , 'Unless the departures
f rom normality are serious, particularly with respect t o skewness, the actual
confidence coeff ic ients and r i sks o f e r ro r will be close t o the levels fo r
exact normality". I n add i t i on because o f the large sample size one would
expect the central limit theories would apply and symnetry would not be an
issue.
12

It was found that 90% of the data fell within plus/or/minus deviations of the man. I n addition 75% of the data fell within 1 minus standard deviation which gives support for the normality
1.64 standard
plus or minus
assumpt i on.
[For I perfect nomat distribution we would expect 68% of the data to lie within plus or minus 1 standard deviation. Similarly, we would expect 90% to
lte within plus or minus 1.64 standard deviation of the mean]. The indicator random variable for the intercept variable using the
* Hibler, Jarroll data base was not significant (p-value = 0.3372). All other data bases considered had a Significant indicator random variable at the 0.095
level of significance. A formal test .for differences. of intercept and/or
slope between the Hibler and Jarroll data sets was conducted and no difference
was detected.
As mentioned previously the Hibler data set does possesses some desirable
characteristics and it it the largest data set among a11 data sets available.
However one aight argue that by forcing the Hibler data set into the analysis
the possibility has been ignored that the other data sets may be mutual1.y
consistent, and the Hibler data set may represent an "outlier". In addition,
one might hypothesize that data from different experimental situations .
prohibits us from making a reasonable. comparison m n g these excystation
studies. Table 4 shows that the Hibler and Jarroll data sets are compatible.
.Since Table 4 also shows that Hibler-Rice and Hibler-Rubin i s not consistent,,
then it is reasonable to assume that the Jarroll date is not consistent with
the Rice and Rubin data so that the Hibler data is not alone in being inconsistent with the other data sets. It seems reasonable therefore t o stact
with the Hibler data set, the largest one, then Incorporate other smaller data ' . .
sets into the modelfng process. Thus logic supports the use o f the Hibler,
13 . .

. .
,
Jarroll dataabase. for extending the model development'and the coefflclents in '
equation 8 were estirnrted using these data as shown In Table 5 in the log ' transfomd form. ra -
TABLE 4. DIAGNOSTIC RESULTS FRON DATA. SET COMBINATION ANALYSI$ -.
kbler, Rlce, Jarroll, Rubin 0.6801 Intercept, temp non-normal data . . not-slgniffcant non-constant var
..
ta sets considered R - w a r e - Varl ab1 as Plots r .
.,a,
Hibler, Rlce, Jarroll, Rubin, t 0.7316 Intercept, temp , non-normal data Albler, Rice, Rubin 0.6649 Intercept, temp aon-normal data
Hibler, Rlce, Rubln, L b. 7899 Intercept non-normal data
not-slanlficant n o n - w t a n t var
, not-significant .non-constant var
not-slgnlficant non-constant var
hibler, , Jarroll , Rubin 0.6424 intercept, temp non-normal data not;signiflcant non-constant var -
Hibler, Jarroll, Rubin, L b. 6879 intercept, :temp non-normal data . not-slgnlficant .non-constant var
Ri bl er, Rice, Jarroll 0.8619 a l l variables non-normal data .
Hibler, Rice, Jarroll, z b. 865 all varlables non-normal data
slgnlficant , non-constant var
si,qnfficant ' non-constant var .w*
.
" ' ih
. .
klbler, Rubin 0.6483 ' temp non-normal data not-slgniflcant non-constant var
Hibler, Rubin, z . b. 7593 .Intercept non-normal data not-slgnfflcant constant var
hibler, Rice 0.8548 all variables non-normaJ. data significant constant var
Hibler, Rice, z 0.8678 all variables . non-normal data significant constant var. .
hi bl er , Jarroll 0.8452 all varlables non-normal data
Hi bler, Jarroll , .z b. 8459 z not significant non-normal data
slgnlficant constant var
constant var

TABLE 5. COEFFICIENT ESTIMATES FOR EQUATION 8.'
Statistical Analysis Standard T for HO: Var i ance
retor Variable OF Coefficient Error Parameter-0 PROB > . O 1. - inflation .
INTERCEP 1 -0.902 0.200 -4.518 0 . 0001 1061 1 -0.268 0.014 -19.420 0.0001 LOGCHLOR 1 -0.812 0 . 042 -19.136 0.0001 LOGPH 1 2.544 0.221 11.535 0.0001 L06lEHP 1 -0.146 0 . 028 -5.117 0 0001
0.000 1 . 183 1.033 . 1.032 1.179
In Table 5 column 7 entitled the 'Variance Inflation Factor (VIF)' is defined as (l-&*) where is the coefficient of aultiple determination when % is regressed on the other variables in the model. The minimum value of VIF
i s . 1 if there is no multicollinearity. As shown in column 7 all of the
variance inflation factors are close to one.
DISCUSSION OF MODEL
As discussed in the previous sections the coefficients for equation 8
were determined by a combination of log transformation and linear regression.
An issue to consider is the probability that there i s measurement error in the
model's independent variables and the effect that this could have on estimates
of the parameters.
Regression is intended to fulfill the
explanation. The purpose of equation 8 is dual purposes of .predict ion and
primarily to predict by providing water utiiities guidance as to what C't values will be needed for a desired .
level of inactivation. The purpose of this model is to predict C't values and
will not be hampered by measurement error as long as consistency 1 s
maintained." Since any measurement is subject to some type of error, the
approach taken to deal with this issue was to provide safe or "conservative
.estimates' of C't values..
15
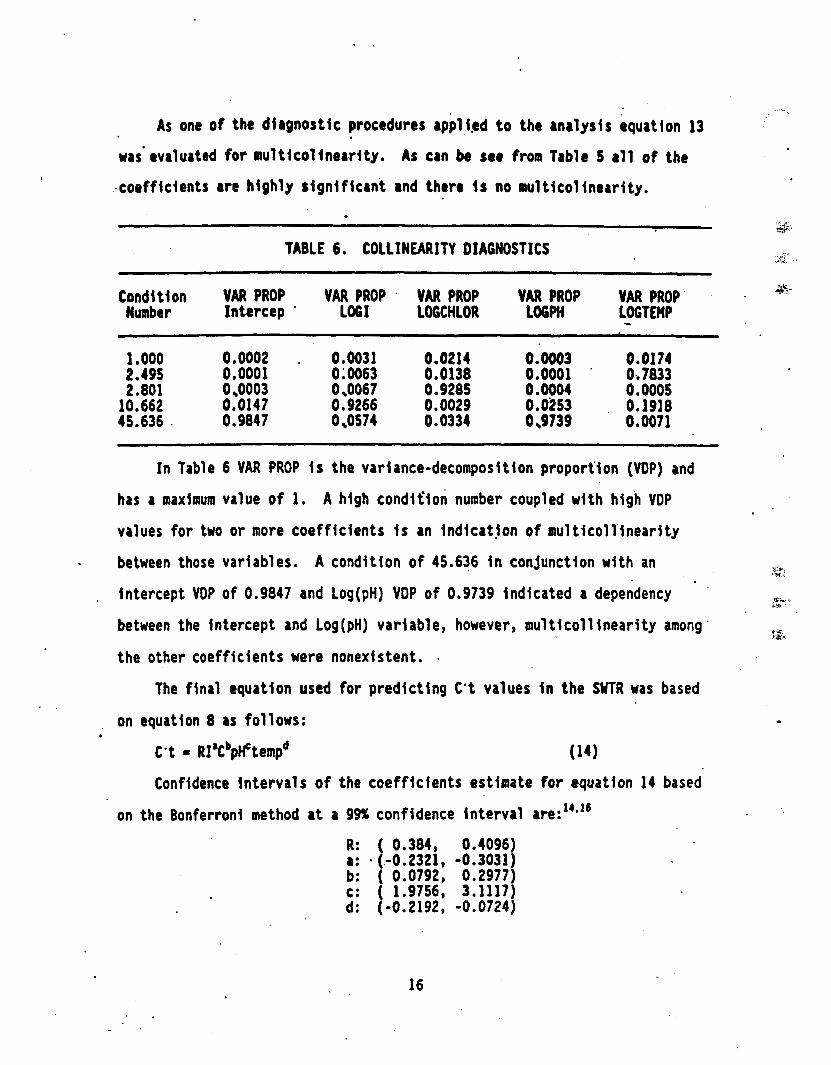
As one of the dirgnostic procedures rppligd to the rnrlytis equation 13
was'evaluated for mu1ticolinearlty. As can be see from Table 5 all of the
.coefficients are highly tignlficant rnd there Is no nultlcolinearity.
TABLE 6. COLLINEARITY DIAGNOSTICS
Condition VAR PROP VAR PROP VAR PROP VAR PROP VAR PROP' Number Intercep ' La61 LOGCHLOR LO6Ptl LOGTEHP - 1 a 0 0 0 0.0002 . 0.0031 0.0214 0.0003 0.0174 2.495 0.0001 0 i 0063 0.0138 0.0001 ' 0..7833 2.801 0 0003 0 0067 0.9285 0.0004 0.000s
10.662 0.0147 0.9266 0.0029 0 . 0'253 0.1918 45.636 . 0.9847 0 OS74 0.0334 0 9739 0.0071
. .
In Table 6 VAR PROP is the variance-decornpositlon proportion (VDP) and
has a maximum value o f 1. A high condifion number coupled with high VOP values for two or more coefflcients is an indicatjon o f multicoll'lnearity
between those variables. A condition of 45.636 i n conjunction with an
. intercept VDP of 0.9847 and Log(pH) VDP of 0.9739 indicated a dependency ' '
between the intercept and Log(pH) variable, however, multicollinearity among '
the other coefficients were nonexistent. .
The final equation used for predicting C't values in the SWTR was based
, on equation 8 IS follows:
C't = RI'Cbplftempd (14)
Confidence intervals of the coefficients estimate for equation 14 based
R: ( 0.384, 0.4096)
b: ( 0.0792, 0.2977) c: ( 1.9756, 3.1117)
8: * (.-0.2321, -0.3031)
d: (-0.2192, -0.0724)
16

RESULTS
There are many uncertalnties regarding the varlous data sets that might
be considered for calculating C't values. The random varlable analysis shows' :
the' statlstlcrl tnconrpatlbillty among nost of these data sets. More work needs to be done to deflne the Impact of strain vrrlatlon and &l yiyn versus
&l yitrq techniques on C't values. In order to provlde conservatlvc estlmates
for Cat values In the SUTR and the guldance document the authors used the
approach Illustrated In Figure 1,
. .
In Figure 1 the OOX'confIdence Interval of the 4 log inactivation level Is calculated, First order kinetics are then assumed so'that the inactivation "line" goes 'through 1 at C't - 0 and, a C't value equal to the upper 99% con-
fidence Interval at 4 logs of Inactivation. Rs can be seen the lnactlvition
llne consfsts of higher C't values than all of the mean predicted C't values
from equation 14, most of the Jarroll et a1 .( and most of the Hibler data points. Conservative, C't values, for a specified level of inactivation, can
. be obtained from the inactivation line prescribed by the disinfection condi-
' tions. For the example indicated in Figure 1, the appropriate C-t for
qchieving 99.9% inactivation would be 105.' This approach (assumption of first
order kinetics) also provides the basis for establishlng credits for sequen-
tial disinfection steps allowed under the SUTR. It should be noted that this
approach provides very conservative estimates' at mid range levels of Cat. .
Note in Figure 1 that some of the Individual data points fall outside the
99% confidence Interval estimated at the four logs of inactivation. This is
to be expected since the confidence Intervals constructed were for mean C a t
values, but also indicated the high variability of the
Equation 14 was applied using the above strategy,
determine the .C't values for 99.9 percent inactivation
17
,Hi bl er data.
as a safety factor, to
at 0.5OC and SoC in the

I N A
' C T I v A T I 0 N
L E V E .I
- Ct-PRED.
' ACTUAL Ct
A 99% CONF. INTERVAL AT '4 LOGS OF INACTtVATlON
. .
Ct VALUES
FIGURE 1. 99Oh CONFlDENCE LEVELS USING .EQUATION 14 FOR CHLORINE = 2'mgA; PH 1 6; TEM.PERATURE 5OC

final MR.' C't values for temperatures rbove 5% were estimated assuming a twofold decrease fbr every 10°C incteata in temperature since all the Hibler
. .
data was generated at SoC or less. This generrl principle 1s supported by
Hoff. Application 'of equation 14 to pHs rbove 8, up to 9 , was considered
reasonable because the model f s substantially sensitive to pH (e.g., C'ts at
pH 9 are about three times greater than C'ts at pH 6 and about two times
greater than C'ts at pH I), At a pH o f 9, rpproximately four percent of the hypochlorous acid fraction of free chlorine i s still present. Other data
indicate that in terms of HOCl residuals (versus total free chlorine residuals
including HOCl and OCI') the C't values required for inrcttvation of aardia gutit and Giardia cysts decrease with increaslng pH from 7 to 9.''
However, with Increasing pH, the fraction of free chlorine existing as the
weaker oxidant species (OC1') increases. In terms of total free chlorine
residuals ( i .e . , HOCl and OC1-) the C't values required for inactivation o f
Giardia puri t and Giardia lamb1 i a cysts increase wlth increasing pH from 7 to
9 but generally iess than by a factor of 2 at concentrations of less than 5.0
mg/L." Table 7.compares the C't values in the proposed SUTR to those given
in the SUTR. The C't values in the proposed SWTR were based only on the
Hibler data and included different safety factors.*"
19

TABLE 7, COMPARISON BETWEEN MOOIFIEO APPROACH (HUNS) AND RULE C'TS 6
AT 99.9% INACTIVATION AND S°C I N THE PROPOSED AND FINAL SWTR.
DM Concentration 6 7 8 3 . #;.
WL Proposed Flnrl , Proposed FInai Proposed FInal Proposed Final
1 105 108 149 165 216 -238 329 312 2 116 122 165 186 243 269 , 371 ,
353 &-x
The C o t values in the final SWfR 8re 0-10 percent lower than In the proposed S U R . T8ble 8 presents representative C ' t values determined by
application o f the above detcrlbed approach.
TABLE 8. CALCULATED C'T VALUES FOR GIARDIA INACTIVATION USING USING EQUATION 14 AT 0.5OC and 5"
Values for Inactivation o f Giardia Cysts by free Chlorine at 0.5OC z
orine PH - PH * 7 PH = 8 1.. pH - 9 t o L r a t i , o n Inactlfatipp Loa hactivatioq . koa Inactivation oa Inactivation
p .
mg/L 0.5 1.0 2.0 3.0 0.5 1.0 2.0 3.0 0.5. 1.0 2.0 3.0 0!5 1':O 2.0 3.8 -. v.
23 46 91 137 33 65 130 195 '46 92 185 277 65 130 260 390 0.4 -T
1 25 49 99 148 35 70 140 210 51 101 203 304 73 146 ,291 437 2 20 55 110 165 39 79 -157 236 5 8 ' 115 231 346 03 167 333 500 3 30 60 121 181 44 87 174 261 64 127 255 382 92 184 368 552 ,
Values for Inactivation o f Giardia Cysts by Free Chlorine'at 5OC
Chlorine PH = 6 PH - 7 PH - 8 pn = 9 Concentration Loa Inactivation a Inactivation loa Inactivatlort oa Inactivation
mg/L 0.5 1.0 2.0 3.0 0%. 1.0 2.0 3.0 0.5 1.0 2.0 3.0 0)s l..O 2.0 3.8 ',
0.4 16 32 65 97 23 46 93 139 33 66 137 198 47 93 186 279 I 18 35 70 105 25 50 99 149 36 72 144 216 52 104 208 ,312 2 19 39 77 116 28 55 I10 165 41 81 162 243 59 118 235 353 3 21 ' 42 84 126 30 61 121 182 45 89 179 268 65 130 259 '389
20

4
Because ca lcu lat ions for the SYfR C ' t ' values are the ,upper llmit on the I -
error bounds assodated with equrtlon I4 (Tabla 8), an equation was developed
t o estlmate these C ' t values for 0.5 and S°C d l n c t l y . C ' t values ibove SoC
can be estimated by using the method glven below t o estimate C o t values a t
SOC, then the assmptlon that there i s a twofold decrease I n C ' t values f o r
every 10°C increase I n temperature can be applled. The q u a t i o n for the
estimated C ' t values a t 0.5 and 5OC Is as follows:
C ' t - 0.36 pH2~~temp~o"sCo"s(-log I)'*w (R2 = 0.998) (15)
where the variables I n equation 15 are as defined previously.
Table 9 compares the values estimated by equation 15 and the WR values
shown i n Table 8.
TABLE 9. CALCULATED C'T VALUES FOR GIARDIA INACTIVATION USING EQUATION 15 AT 0.5 AND SoC
Values fo r Inac t iva t ion of Giardia Cysts bv Free Chlorine at 0,SoC
- Chlorine pH 0 6 pH - 7 pH - 8 pH - 9
Concentration h a Inact ivat ion Loa Inact ivat ion LOCI Inact ivat ioq a Inact ivat ion mg/L 0.5 1.0 2.0 3.0 0.5 1.0 2.0 3.0 0.5 1.0 2.0 3.0 0% 1.0 2.0 3.8
0.4 22 43 86 129 33 65 131 196 47 94 187 281 64 129 257 385 * l 25 49 99 148 37 75 149 224 54 107 214 321 74 147 294 441 -
2 . 27 55 109 164 41 83 165 248 59 118 137 355 81 163 325 487 3 29 58 116 174 44 88 175 263 63 126 251 377 06 173 3 4 5 517
Values fo r Inac t iva t ion o f G iard ia Cysts - bv Free Chlorine a t 5 C
k2uuu&m Concentration Loa Inactfvatloa Loa Inact i v a t i on
0
Chlorine PH * 6 pH = 7 pH - 8 pH = 9
mg/L 0.5 1.0 2.0 3.0 0.5 1.0. 2.0 3.0 0.5 1.0 2.0 3.0 0.5 1.0 2.0 3.8,
0.4 15 31 61 91 23 46 92 138 33 66 132 198 46 91 182 272 1 17 35 70 104 26 53 106 158 38 76 151 227 52 104 208 311
. 2 19. 39 77 1.16 . .29 58 117 175 42 ,84 167 251 .58 115 320 345 3 20 41 82 123 31 62 124 186 44 89 178 266 61 122 244 366
21

. FUTURE YORU . Because o f the importance from an economic and a publ ic health viewpoint
of the calculation of C't values for the inactivation of m a Jamblil by '
free chlorine, much effort has been expended i n developing models that.
interrelate the important variables effectlng these values.' The work
' reported in thls paper reflects the ruthors attmpts to develop such 1
relationship for inclusion in the SUTR. However, it also r h s r-very
interestfng pofnt regardlng the application of statistical methodology to
public policy decision problems. There is no perfect 'regulatory' experimnt
that answers all of the textbook questions that could be raf sed regarding
regulatory decision making. One has to use rvallable data and Incorporate the .
best judgment that can be brought to bear on a given issue t o insure that
publ ic health and we1 fare is protected. The need to combine data sets from
different investigations and then develop a decision rule based on the data,
as shown in this paper, as an example o f the this process. . %:
There is no doubt in the authors' mind that other better models may be =--
.
I
developed. For.example, Haas' work in applying the Horn model to inactivation
data and incorporating the method of Maxirnura likelihood for estimating
parameters Is promising." The authors believe that the public Is best served . by examining problems from many different points of view and encourage others .
to pursue these difficult, frustrating but extremely challenging problems. .
SUMMARY AND CONCLUSIONS
v + * .
i
Amendments to the Safe Drinking Water Act clearly iequire that a l l
surface water suppliers in the U.S. filter and/or disinfect to protect the '
health of their customers. 5. jamblia has been identified as one of the .leading causes of waterborne disease.outbreaks in the U.S. E. , m a cysts
. are also one of the most resistant organisms to disinfection by free chlorine.
22

EPA's Office of Drinking Water has adopted the C't concept to quantify the
inactivation of Ea J m a cysts by.disinfection. If a utility can assure
that a large enough C't can be maintained to ensure adequate disinfection '.:
then, depending upon site specific factors, t t aay not be required to install
filtration. Similarly, the C't concept can be applied to filtered systems for
determining appropriate levels o f protection.
. *
In this paper, an equatlon has been developed that can be used to predict
C't values for the Inactivation of 6. ljlmblia by free chlorine based on the '
interaction o f disinfectant concentration, temperature, pH, and inactivation
level. The parameters for this equation have been derived from a set o f
animal Infectivity and excystation data. The equation can be used to predict
C't values for achieving 0.5 to 4 logs of inactivation, within temperature
. ranges of 0.5 to S0C, chlorine concentration ranges up to 4 mg/L, and pH
1 eve1 s of 6 to 8. While the model was not based on pH values above 8, the
model is still considered applicable up to pH level of 9. . The equation shows
the effect of disproportionate increases of C't versus Inactivation levels.
. Using 9% confidence intervals at the 4 log inactivation levels and applying .
first order kinetics to these end points a *conservative regulatory strategy
for defining C't at various levels o f inactivatlon has been developed. This
'approach represents an alternative to the regulatory strategy previously
proposed. L
23 .

.. The authors would like to acknowledge Hs. Patricia Pierson and Hs. Diane
Routledge for the?r assistance In preparing this manuscript. The authors are
grateful to Dr. John Hoff, forrnerly 'of USEPA, Ms. Shirley Pien and Hs. Eleanor
Read of the Computer Sciences Corporation, Hr. Dennis Black of the University
o f Nevada, Las Vegas, and Dr. Charles Haas o f the Illinols Institute of Technology for their review and suggestions to Improve the aanuscript. The
. .
authors would like to extend a special acknowledgement to Ms. Dianne-Wild for
her assistance in the preparation o f this manuscript.
24

REFERENCES
1. National Primary Drinking Water Regulations: Filtration, Disinfection, Turbidity, 5- J!A!!!&h, Viruses, Lsgiwella, and Heterotrophic Bacteria. Final Rule, 40 CFR parts I41 and 142. Fed. Reg. 54:124:27486 (June 29, 1989).
2. U.S. Environmental Protection Agency, Office o f Drinking Water, Criteria and Standards Divislon. Guidance Uanual for Compliance with the Filtra- tion and Ditinfectlon Requirements for Public Water Systems Using Surface Water Sources , October 1987,
Viruses In Yater: Source, Survlvrl, and Removability'. International Conference on Yater Pollutions Research, Landar, Septeraber, 1962.
4. Hoff, 3. C., Rlce, E. W., and Schaefer 111, F. W. 'Disinfection and the Control of Waterborne Giardiasis", In Proceedings of the 1984 Specialty Conference, Environmental Engineering Division, ASCE, June 1984.
3. Clarke, N. A., Berg, C., Kabler, P. W., and Chang, S. L., 'Huplan Enteric
5. . Jarroll, E. L., Bingham, A. K. , and Heyer, E. A. "Effect of Chlorine on . . Giardia mlia Cyst Viability". Bpglied and Envfronmental HicrabioloQy, Vol. 41, pp. 483-48, February, 1981.
6. Chick, H., "an Investigation o f the Laws of Disinfection:, J. Hygiene, 8, 92 (1908)
7. Watson, W. E., "A Note on the Variatlon of the Rate of Disinfection with Change in the Concentration of the Disinfectant", 3. Hygiene, 8, 536 (1908).
8. Clark, R. M., Read, E. 3 . , and Hoff, J. C. "Analysis of Inactivation o f * Giardb Lamblia bv Chlorine". Journal o f Environmental Engineering, A X E ,
Vol. 115, No. 1, February, 1989, pp. 80-90.
9. Hi bler, C. P., Hancock, C. M., Perger, L. H., Wegrryn, 3. 6. and Swabby, K. 0. 'Inactivation of Eiardia Cysts with Chlorine at O.S°C to 5.OoC. rmerican Water Yorks Association Research Foundation, 6666 West Quincy Avenue, Denver, Colorado 80235, 1987.
Cysts by Chlorine", f l it, 1 Jan. 1982, . 10. Rice, E. W., Hoff, 3. C. and Schaefer 111, F. Y. "Inactivation o f Eiardfa
V O ~ . 43, NO, 1, pp. 250-251.
11. Rubin, A. 3. . Evers, 0. P., Eyman, C. H., and Jarroll, E. L., "Inactivation of Gerbil-Cultured Eiardb Cysts by Free Chlorine", flmlied and Environmental Microbiolociy, k t . 1989, Vol. 55, No, 10, p. . 2592-2594.
12. Hof f , J . C., "Inactivation o f Hicrobial Agents by Chemical Disinfectants" EPA/600/2-86-067.
13. Draper, N. and Smith, H. (1981) Second Edition, ADDlied Rearession /balvsis, Wiley: New York.
25 . '

17: Haas, Charles W., m d H i l l a r , B. Str t ist ical Analysis of 0 a t a . m Chlorine Inrct ivrt ion o f # lardla w, Final Report prepared for U.S. EPA Office o f Drinking Water, January 6, 1988. e ,
26

GLOSSARY
d N,/dt = rate of change of organisms with respect to time
k
t
Nt
N* r C n
K
PH ' temp
I
. C't
R a
c
d
e
z
VIF
VDP
= fnactlvation rate tn minutes-' 9 . . .
time In alnutes = number of organisms 8t tlm t
number o f organisms 8t time o . - coefflcient of spcclfic lethrllty (liters/mtlligrm - minutes) = concentration of disinfectant .(mi11 Igrrms/liter)*'"
= coefflcient of dllution
constant, at given level temperature, pH and Inactivation level
= pH In water phase
temperature in O C
= level of inactivation
= concentration in q / L times time in minutes
= coefficient to be determined
coefflcient to be determined
= coefficient to be determined
Coefficient to be determined
= coefflcient to be determlned
= coefficient t o be determined
variance lnflatlon factor. If VIF is 1 there is no multicolinearity
= variance decomposition number. If VDP is high for two or more varlables there i s an inductlon o f multlcollnearity. between
vari ab1 es
Bonferroni technique = a conservative method of estimating confidence intervals
27
pcmanganatq as A disinfectant. It i s not meant t o be used as a basis for establ ishing CT requirements.
z . ' Reftrcncet Beman, 0.; Hoff, J. Inact ivat ion of Simian Rotavirus SA 11 by Chlorine, Chlorine Dioxide and eknochloramine. Appl . Environ; Microbiol. ,
, J.C.H.; Ossoff, S.F.; Lobe, D.C.; Dorfman, U.H.; Dumais, C.M.; Qual s, R.G.; Johnson, J.D. I nac t i va t i on o f Pathogenic and Ind icator Microorganisms. Applied Environ. Uicro., June 1905, pp. 1361-1365.
Clark, R.M.; Read, E.J.; Hoff, J.C. Inact ivat ion o f by Chlorine: A Mathematical and S t a t i s t i c a l Analysis. Unpuhlished Report, EPA/600/x-87/149, OWRD, Cincinnati , OH, 1987.
Clark, R.; Regli, S.; Black, 0. Inact ivat ion o f Giardia by Free Chlorine: A Mathematical Model. Presented a t AWA Water Qua l i t y Technology Conference. S t . Louis, Mo., November 1988.
48:317-323, 1984.
ChanP
Clark, M.R.; Regli , S. The Basis for Giardia CT Values i n t h e Surface Water Treatment Rule: Inact ivat ion by Chlorine. Submitted t o Journal of Water Supply Research and Technology-Aqua, August 1990.
Hibler, C.P.; C.M. Hancock; L.M. Perger; 3.6. Wegrrn; K.D. Swabby Inac t i - . vat ion of Giardia cysts wi th Chlor ine at 0.5 C t o 5.0 C American Water ..
Works Association Research Foundation, In press , 1987 . Hoff, J.C. E P A / 6 0 0 , 5 2 - ~ ~ ~ ~ ~ ~ , v ~ ~ ~ n E ~ ~ i r%zi6"1' P%%i o " , V A ~ ~ ~ ~ ~ ~ a ~ ~ ! $ ~ % % ~ Research Laboratory, Cincinnati, Ohio, September, 1986. '
Ja r ro l l , E.L.; A.K. Binham; E.A. Heyer Ef fect o f Chlor ine on u r d i g
Leahy, J.G.; Rubin, A.J.; Sprout, O.J. I nac t i va t i on o f & Cysts by Free Chlorine. Appl. Environ. Microbiol., July 1987.
Rice, E.; Hoff, 3.; Schaefer, F. Inact ivat ion Gf Giardia Cysts by Chlorine. Appl . and Environ. Microbiology, 43:250-251, January 1982.
Cyst V iab i l i t y . Appl. Environ. Microbiol., 41"-487, 1981.
Roy, D., R.S. Engelbrecht, and E.S.K. Chian. Comparative Inact ivat ion .of Six Enteroviruses by Ozone. 3. AWA, 74(12):660, 1982.
Rubin, A. Factors Affect ing the Inactivation o f Eiardb Cysts by Mono- chloramine and Comparison with other Disinfectants. Water Engineering Re- search Laboratory, Cincinnati, OH March 1988a.
F-8 .
Rubin, A. "Cf Products for .the Inact ivat ion of (;lardta Cysts by Chlorine, Chlormine, Iodine, Ozone rnd Chlorine Dioxide" submitted for publication i n 3. AWWA, December, 1988b.
Sobte , M. 'Detection and Chlorine Disinfection of Hepatitus A i n Water. CR-8d-024 . €PA Quarter ly Report . December 1988.
Vau hn, 3.; Chen, Y.; Lindburg, K.; Morales, 0. Inact ivat ion o f Human and Sia ? an Rotaviruses by Ozone. Appl. Environ. Microbiol.; 53(9):2218-2221, September 1987.
Wickramnayake, 6.; Rubin, A.; Sproul, 0. Effects of Ozone iind Storage
Yah a, H.T., Lrndetn, L.K., forsthocfel , N.R., Kujawa, .KO, and Gerba, C.P. Eva T uat ion o f Potassium Permanganate fo r Inac t iva t ion o f Bacteriophage US-2 i n Water Systems. Copyright 1988, Catus Chemical Company, Ottawa, I l l i n o i s .
. . tanperature on Cysts.. J.AWWA, 77(8):74-77, 1985.
. .

..
DETERMINING CHLORNIINE INACTIVAfIOt~ OF dIARDIA
FOR THE SUSFACE UATER TREATMNT RULE
Microbiological Treatment Branch Risk Reductfon Engineering Laboratory
and
Paras i to logy and Immunology Bianch Environmental ‘ loni toring System Laboratory
U.S. Environmental Protection Agency 2C West 7 l a r t i n L u t b r K i n g D r i v e
Cincinnati Ohio 45268

?
Appendix

3
The Surface Water treatment Rule requlres 99.93 or greater removal/ i b c t l v a t l o n o f Giardia. The fo l lowing protocol may be used t o determine the percentage o f r d l a i nac t i va t l on ob ta ined by a t reatment p lant us ing c3 loramlne d ls in fect ion.
I . MATERIALS
A. H a t e r i a l s f o r D l s l n f e c t l o n
1. Stock ch lo r ine so lu t ion 2. Stock ammonia s o l u t l o n 3. St i r r i ng ' dev i ce . . - 4. Incubator Of water bath for temperatures below .aablent 5. Water froin treatment glant 6. Gia rd ia muds cys ts 7. A s J o r t e d m s o a r e
11 12
8 9 10
. Assorted plpettes . Reagents and ins t ruments fo r de termin ing d is in fec tan t res idua l . S t e r i l e sodium t h i o s u l f a t e s o l o t l o n . Vacuun f i l t e r device, for 47mn diameter f i l t e r s . 1.0 itm pore s ize po lycarbonate f i l ters , 47. nm diameter 13. Vacuum source 14. Crushed I c e and ice bucket 15. Timer
3. P a t e r i a l s f o r E x c y s t a t i o n
1, 2. 3. 4. 5. 6. 7. 8. 9.
13. 11, 12. 13. 14. 15. 16.
Exposed and contro l Giard ia mur ls cysts Reduc i ng sol u t i on - 0.1 M sidium bicarbonate Trypsi n-Tryode' s s o l u t i on 15 m l con lca l screw cap centr i fuge tubes Water bath, 37OC Warn a i r i n c u b a t o r or s l i de wamlng t ray , 37OC A s p l r a t o r f l a s k : Vacuum source Assor ted p ipet tes Vortex mixer Centr i fuge wi th swlnging bucket ro tor Chamber s t Ides Phase contrast microscope Oi f f e r e n t l a l c e l l c o u n t e r TImer
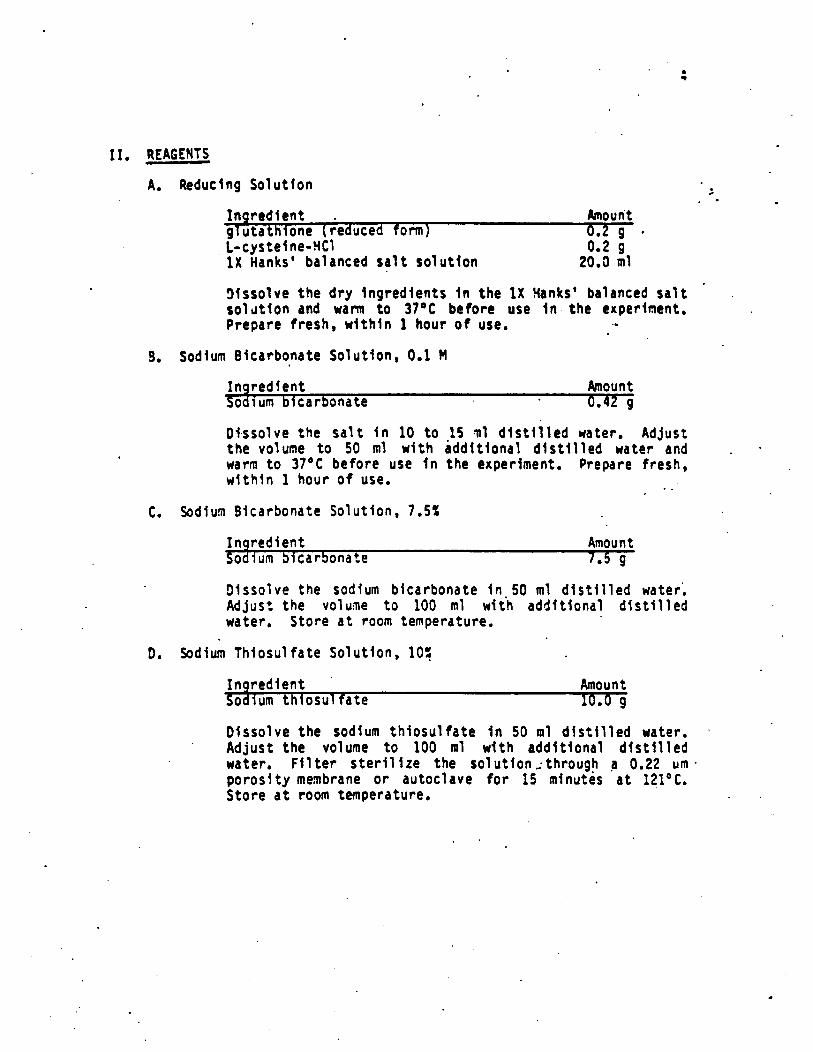
I I . REAGENTS
A. Reducing Solutlon c
. *
Ingredient . Amount glutathione (reduced form) 0.2 9 - Lcystelne-YCI 0.2 9 1X Hanks' balanced sal t so lu t ion 20.0 m l
Wssolve the dry ingredients In the 1X Hanks' balanced salt soldtion and warm t o 3 7 O C before use In. the experlnent. Prepare fresh, w l t h l n 1 hour o f use. ..
9. Sodium Bicarbonate S o l u t i o n , 0.1 M
Ingredient Amount Todium blcarbonate 0.42 9
01,ssolve the salt I n 10 to IS tnl d i s t i l l ed water. Adjust the volume t o 50 ml w i t h addltlonal dlstllled water and warm t o 3 7 O C before use In the experiment. Prepare fresh, w l t h l n 1 hour of use. . .
C. Sodlum B i c a r b o n a t e S o l u t l o n , 7.5%
Ingredient Amount 3odium bicarbonate 7.5 9
Dissolve the sodium blcarbonate ln.50 m l d i s t l l l ed water. Adjust the voluwe t o 100 ml w i t h a d d l t i o n a l d is t i l led water. Store a t room temperature.
D. Sodlum thlosul fate S o l u t l o n , 10;
Ingredlent Amount Sodium thlosul fate 10.0 9
Dissolve the sodlum thiosulfate i n 50 m l d ls t l l led water. . Adjust the volume t o 100 m l w i t h addltlonal distllled water. F l1 t e r s t e r i l i r e the so lu t lon ;through a 0.22 um poroslty menrbrane or autoclave for 15 mlnutes a t 121°C. Store a t room temperature.
.

E. TySode's Solutlon, 20X
Ingredlent Ainount Ba CI KC1
160.0 9 4.0 9
CaC12 ' 4.0 9 Mg Cl 6H 0 2.0 9 . G1 ucose 20.0 9'
* * AaH2504 g20 1.0 9
Dlssolve the dry Ingredlents I n the order l'lsted In 750 m l . dis t l l l ed water. Adjust the volune t o 1.0 l i t e r w l t h addl - t l o n a l d i s t l l l ed water, . I f l o n g term storage 4 u p t o 1 year) Is des i red , f l l t e r s te r l l l t e t h e solutlon'through a 0.22 urn porosity meabrane.
F. Tyrode's Solutlon, 1%
Ingredient Amount X Tyrode' s sol u t i o n 5.0 m i
Oilute 5 ml o f the 20% Tyrode's solutlon t o a' f l n a l volune' of 100 ml w i t h d u t l l l e d water.
C;. Trypsin-Tyrode's S o l u t i o n
Ingredient Amount 'trypsin, 1:100, U.S. Siochemlcal Co. 3.50 9 NaHCO3 1X Tyrode's solutlon
0.15 g 100.90 ml
!4i th continuous m i x i n g on a s t i rp la te , gradually add 100 m l . 1X Tyrode's so lu t ion t o the dry Ingredients, Contlnue s t i r r ing u n t i l the dry Ingredients are completely dissolved, Adjust the pH of the s o l u t i o n t o 8.0 w i t h 7.5': Chill the trypslri Tyrode's. solutlon t o 4 O C . NOTE: Tryps Na n lo t s nust be tested for thelr excystatlon eff lc lency. Prepare fresh,.wlthln 1 hour of use.
H. Polyoxyethylene Sorbitan Konolaurate (Tween 20) Solution, 0.01% ( v / v )
Inqredient Amount Tween 20 0.1 ml
Add the Tween 20 t o 1.0 l i t e r , of d is t l l led water. ? f ix well .

5
I , Vaspar
Ingredient Amount Paraffin 1 part Petrol eum j e l l y 1 part
Yeat the two Ingredients I n a boi l ing water b a t h until melt- ing and mixing i s complete.

.. . 7
111. GIARDIA MuRIS ASSAY
A. Cysts
Giardia muris cysts may be a v a i l a b l e from commercial sources. be produced i n Mongolian gerbils (Meriones un uicu-
latus) or i n mice. Mus musculus, the 1 aboratory mouse, +T m, and C3H/he s t r r n s h a v e e e n used to produce G. muris cysts. The method, i s labor intensive and requires a g 6 d anfmaT
I n order for the disinfection procedure t o work properly, the G. - muris cysts used must be of h i g h quality. fvaluation'of a cy% suspension is a subjective procedure i . n v o l v i n g aspects of morpho- logy and microbial contamination as well as excystment. . A good quality - - G. muris cyst preparation should exhibit the following:
1. Examine cyst stock suspension microscopically for the presence of eqpty cyst walls (ECU). Cyst suspensions containing equal t o or greater t h a n 1% ECY should n o t be used for determining inactivation a t any required level. However, i f a 99.9: level o f disinfection i n a c t i v a t i o n Is required, the stock cyst suspension must contain <O,.l'% ECU.
fdCi1 i ty.
2. Excystation should be 90: or greater. . .)
3. The cyst suspension s h o u l d contain l i t t l e o r no detectable microbial contamination.
4. Good G. muris cysts are phase bright w i t h a defined cyst w a l l , perf t?opTiTc'?pace, and agranular cytoplasm. Cysts w h i c h are phase dark , have no detectable peritrophic space, and h a v e a granular cytoplasm may be non-vi.able. There generally should be no more t h a n 4 t o 5% phase dark'cysts i n the cyst prepara- tion.
Sood G. muris cyst 'preparations result when the following guldeTines are follosJed d u r i n g cyst purification from feces:
e .
a. Use feces colt ected over a period of ' 24 hours or less. .
b. The isolation o f the cysts from the feces should be done Immediately a f t e r the fecal material is collected.
c. I n i t i a l l y , G. muris cysts ' should. be purified froni the fecal mater61 b y o t a t f o n u s i n g 1.0 11 sucrose.
d. If the G. muris cyst suspension contains an undesirable * *density?f contaminants after the f irst sucrose f l o a t ,
further purification is necessary. Two methods for further puri,fication are suggested.
1) Cysts may be reconcentrated over a layer o f 0.85 Y sucrose I n a 50 m l conical centrifuge tube. If th i s

3
4
second exposure to sucrose 1s not done qulckly, h l g h cyst losses can occur due t o thelr Increased bouyant dcnslty i n the hyperosmotlc sucrose medium. The cysts must be thoroughly washed free of the sgcrose lmnedlately after collection o f the Interface.
2 ) Cysts can be separated from dlsslmllar sized contami- nants by sedimentation a t u n i t gravity, which wlll n o t qdversely affect cyst bouyant denslty, morphology, or v l a b l l l t y .
8. Yalntenance o f Cysts
1. Preparatlon of stock suspension ~
Oetemlne the suspenslon denslty of the g. muris cyst prepara- t i o n uslng a hemocytometer (see Appendix A ) j j u s t the cyst suspension denslty w i t h d i s t i l l ed water t o approximately 3-5 x 10⁶ cystslml .
>",. e---
2. Storage
Store cysts I n d i s t i l l ed water I n a refrigerator a t -4*C. Cysts s h o u l d n o t be used for disinfection experlnents I f they are dore t h a n 2 weeks old (from tlme of feces deposition) .
C. Excystation Assay
A number o f G. muris excystation procedures have been described i n the s c l e n t l f l c ~ r a t u r e (see Bib1 lography, Section VI). Any of
*x these procedures may be used 'provided 90% or greater excystation o f control, undlslnfected G. murls cysts Is obtalned. The fo l lowlng protocol I s used t r e v a m the suitabil i ty of cysts I n the stock suspension, and t o determine excystation I n control and disinfected cysts. *
1. For evaluatlng a cyst suspension or for runnlng.an unexposed control , transfer 5 x 10⁵ G. murls cysts from the stock (.
preparatlon t o a 15 m l conlca'T screu cap centrlfuge tube. An unexposed control should be processed a t the.same tlme as. the dlslnfectant exposed cysts.
-,rsy. I" 8
-ps -*rr.
.+. ,". -
2. Reduce the volunre o f G. muris cyst suspenslon I n each 15 ml centrlfuge tube t o O . r m l e s s by centrifugatfon a t 400 x g for 2 minutes. Aspirate and discard the supernatant t o no l ess t h a n 0.2'ml above the pellet.
3 . Add 5 m l reducing solution, prewamed t o 37*C, t o each tube.
. 4. Add 5 n l 0.1.M NaHC03, prewanned t o 3 7 O C , t o each tube. NOTE: l i g h t l y close the caps t o prevent the loss of C02. I f the CO2 escapes, excystation will not occur.
5. Mix the contents of each tube by vortexing a n d place , i n a 3 7 O C water b a t h for 30 mi.nutes.

3
6.
7.
8.
9.
10.
11.
12.
13.
11.
Remove the tubes'.from the water b a t h and centrifuge each for 2 mlnutcs a t 400 x g.
k p l r a t e and discard the supernatant t o no l e s s t h a n 0.2 m l above the pellet-and resuspend the pellet In each tube i n 10 m l trypsln-fyrode's so lu t ion chilled t o 4 O C .
Centrifuge the tubes for 2 minutes a t 400 x g.
Aspirate and discard the Supernatant t o no l ess t h a n 3.2 m l above the pellet.
Add 0.3 m l trypsin-Tyrode's solution, prewarned to' 3 7 O C , t o each tube. . Resuspend the p. muris cysts by low speed vortex- i ng.
.-
Prepare a chamber sl lde for each tube '(see Appendix B ) .
Seal the covers1 i p on each chantber s l ide w i t h me1 ted vaspar and incubate a t 37°C for 30 minutes i n an incubator or on a sl ide wanner.
After i n c u b a t i o n , place a 'chamber sl ide on the stage o f an u p r i g h t phase contrast mic'roscope. Focus on the slide w i t h a low power objective. Use a t o t a l m a g n i f i c a t i o n o f 3OOX or more for the actual q u a n t i t a t i o n . NOTE: Be careful t o keep the objectives o u t of the vaspar.
Ilhile scanning the slide and u s i n g a different ia l cel l coun-. t e r , enumerate the number of eapty cyst walls (Em) , p a r t i a l - l y excysted trophozoites ( P E T ) , and i n t a c t cysts ( IC) observed (see Sectlon V for a further description o f these form and the ,nethod for calculating Rercentage excystation). If the percentage excystation i n the stock suspension i s not 90: or greater, do n o t continue w i t h the disinfection expcriment.
.

10
.IV. DISINFECTION PROCEDURES FOR G I A R D I A
A. The t rea tment p lan t water to be used should be the water In f luent . I n t o the ch lo ramfne d ls ln fec t lon un l t p rocess used I n the p lant, .. :. I f ch lo ran lne d l s ln fec t l on Is performed a t tnore than one p o i n t I n the treatf lent process, e.3. , p r e f l l t ra t lon and p o s t f l l t r a t l o n , t9e pr0cedur.e should slmulate as c lose ly as post1 b l e actual treatment practlce.
B. Prepare stock ammonia and ch lo r l ne so lu t l ons t o be added t o the t reatment p lant water to achfeve the same s to l ch lomet r l c re la t l on - sh lp between c h l o r l n e and ammonla that I s used I n the water treattnent plant. These sol ut lons should be concentrated enough so t h a t no more than 2 a1 o f each s o l u t l o n wlll be added t o t h e treatrnent plant water belng dlslnfected. '
C. Deternine the contact t lme by the methods described I n the Surface ! later Treatinent Rule and/or the associated Guldance Manual,
D. Rinse a 600 m l beaker w l th t rea tnent p lan t w a t e r t o remove any extraneous material t h a t may cause d i s l n f e c t a n t demand. Then add 500 m l t r e a t n e n t p l a n t w a t e r t o the beaker.
E. M I X the Contents of the beaker short o f produclng a v o r t e x I n the center and cont inue un t i l the conc lus lon o f the expcrlment.
F. Equi l ib ra te the 600 m l beaker and i t s contents as wel l as the d i s - infectant reagents to the desired exper imental temperature.
G. Adjust the stock 5. mur is cys t sus enslon w1,th d i s t i l l e d water so t h a t t h e c o n c e n t r a t i n 2-5 x 13 l cysts/ml.
H. Add 0.5 m l o f the ad justed cyst suspension to the contents o f the 600 m l bea ker.
I. Add the d l s ln fec tan t reagen ts t o t he beaker uslng the same r e a - gents, the same sequence o f add i t lon o f reagents , and the sane t lme In te rva l be tween add l t lon o f reagents tha t Is used I n the d l s ln fec t l on p rocedure I n the t reatment p lant . .
J. J u s t p r l o r t o the end o f the exposure time, r h o v e a sample ade- *
qua te fo r de tenn lna t lon o f the d fs in fec tan t res idua l concent ra - t l on . Use methods prescrlbed I n the Surface Water treatcnent Xule f o r the de termina t ion o f coeblned chlor ine. Thls residual shou1.d be the same (2205) as resldual ?resent I n the t reatment p lant operat lon.
K. A t the end o f the exposure t ime , add 1.0 m l 102 sodium t h i o s u l f a t e so l i l t i on t o t he con ten ts o f the 600 m l beaker.
L. Concentrate the G. m u r i s c y s t s I n t h e b e a k e r b y f i l t e r i n g t * e en t i re con ten ts tT ro- 1.0 um poros i t y 47 ma dlameter polycar- bonate filter.
.
11
M. Place the filter, Cyst s ide up, on the s ide o f I 150 m1 beaker. Add 10 m l 0.01% tween’ 20 s o l u t i o n t o the beaker. Using a Pasteur p ipe t te , wash the .p. .muds cysts from the surface of t he filter by a s p i r a t i n 3 and e x p m g the 0.01% tween 20 s o l u t i o n over t h e surface of the f l l te?.
. . s- N. t ransfer the contents of . t he 150 a l beaker t o an appropr ia te ly
0. Keep the tube on crushed ice unt i l the excystat ion assay i s . .
l abe led 15 m l screw cap conical centrifuge tube.
performed (see Section 111, C ) on the d is in fec tan t exposed cysts and on an unexposed control preparat ion obtained from She stock c y s t suspension,
-..
.

12
V. PROCEOURE FOR DETERMINING IHACtIVAfIO~J
A. Glard la mutts Excys ta t l on Quan t l t a t l on Procedure
where ECW I s t h e number of empty c y s t wal ls, - PET I s the number of p a r t l a l l y cxcysted trophozoites, and
B.
IC I s ' t h e number o f In tac t cys ts .
An EC'A Is def ined as a c y s t wall whlch I s open a t one end and I s conrpletely devoid o f a t rophozol te. A PET I s a cyst which has s tar ted the excystat ion process and progressed to t he po in t where the t rophozol te has e l t h e r s t a r t e d t o emerge or has coap le te l y emerged and i s s t111 a t tached to the cyst wal l . An IC i s a t rophoto l te dh ich I s completely surrounded with I cys t wa l l showing no evidence o f emergence. For the cont ro l , genera l ly 100 forms are counted to determine the percent excystat ion.
The number o f c y s t s t h a t must be observed and c l a s s l f l e d (ECW, PET, IC) i n t h e d i s i n f e c t e d sample i s dependent on t h e l e v e l o f i n a c t i v a t i o n d e s i r e d and on the excystat lon percentage obtained i n t h e c o n t r o l
Far 0.5, 1 and 2 l o g 0 reduct ions, (583, 905 and 99% l n a c t i - vat ion, TeSpeCtivelyf, the mlnimum number o f c y s t s t o be observed and c l a s s i f i e d I s determined by d iv ldfng 100 by the percentage exCyStatfon (expressed as a decimal) obtained in' t he con t ro l . For a 3 log lo reduc t ion (99.93 i n a c t l v a t l o n ) t h e minimum number of cys ts t o be observed and classif ied is, determined b y d l v i d f n g 1.000 by the percentage excystat ion (expressed as a decimal) obtained I n the con t ro l .
Detenn ln ing Inac t lva t lon
The amount o f I n a c t i v a t i o n I s determined by comparing the percent- age e x c y s t a t i o n o f ' t h e exposed cys t p repara t ion t o the percentage excys ta t lon i n t he con t ro l p repara t i on us ing t he fo l lowing for- *
mu1 a :
% i n a c t l v a t i o n = 100% - [(exposed Z excysted/control X excysted) x 1003
If the percentage excystat ion i n t h e exposed preparat ion i s Zero, 1.e.. on ly IC [no ECW o r ?ET) a r e observed and' counted, use <I as the vat ue f o r Wexposed X excysted" fn the formula for .ca lcu lat in .9 X i nac t i va t i on .

.* . 13
VI. BIBLIOGRAPHY . .
American Pub1 Ic .Heal th Associat lon; Amerlcan Water Works Association; Mater Polutlon Control Federation. Standard t lethods for the Examina- t i o n o f !.later and Wastewater, 16th ed. (1985). . -- Belosevlc, !!. L G.H. Faubert . Giardia murls: correlat ion between ora l dosage, course o f i n f e c t l o n , a n d o p h o r o l t e d i s t r l b u t l o n I n t h e mouse mall lntest lne. . Exp. Parasltol. , 56:93 (1983). .
6. *I
Erlandsen, L.S. and L A . Heyer. Giardia and Giard1asls.- Plenum Press, tlew York, (1984).
Faubert, G.H. e t a1. Comparatlve studies on the pattern o f i n f e c - t i on w i th G ia rd ia spp. i n Mongol Ian gerb i ls . 3. Paras l to l .,' 69:802 (1983). . .
Feely, D.E. A simp1 i f ed method fo r I n v i t r o e x c y s t a t i o n o f Giardia muris. J. Parasi to1 . , 72:474-475 (198') 7 Feely, D.E. Induct ion o f e x c y s t d t l o n o f . 6 i t r d i a m u r i s b y Cop. 62nd Annual lr teeting of the Amerlcan Society o m m l s t s , f lnco ln, Nebraska, Abstract No. 91 (1987).
Gonzalez-Castro, J. , Bermejo-Vicedo, H.T. and .Palaclos-Gonzalez , F. . 3esenquistaniento y c u l t i v o de Giard ia muris.. Rev. Iber. Parasi to l . , Melvin, C.H. and t1.M. Brooke. Laboratory Procedures for the Diagnosis o f In test ina l Paras i tes. 3rd ed., HHS Pub1,ication No. ( C X ) 82-8282 (1982) . Miale, J.B. Laboratory Nedicine Hematology, 3rd ed. C. V. Mosby Company, S t . Louis , Missour j (1967) . Roberts-fhomson, I.C. e t a1.. G i a r d i a s i s I n t h e mouse:. an anlmal . model . Gastroenterol ., 71:57 (1976). '
Sauch, J.F. P u r l f l c a t l o n o f G i a r d i a m u r i s c y s t s b y .velocity sedi- mentation. Appl . Environ. N i C m , 4 8 : 4 5 4 (1984).
-
46:21-25 (1986). - .
Sauch, J.F. A new method for excystat ion o f Giard ia . Advances i n Giardia Research. U n i v e r s i t y o f Calgary, Calgar-ada ( I n Press).
' Schaefer, 111, 'F.W., Rice, E.W., L Hoff , J.C. Factors promoting . I n v i t r o ' e x c y s t a t i o n o f G i a r d i a m u r i s c y s t s . Trans. Roy. SOC. Trop. E d m . , 78:795 (1984) .

VII, TECHNICAL CONTACTS:
A. Eugene Y. R Ice Hlcroblological Treatment Branch RIsk Reductlon Englnetrlng Laboratory U.S. Envlronmental Protectlon Agency 26 Uest Martin Luther Klng Orlve Clnclnnatl Ohio 15268
Phone: (513) 569-7233
B. Frank W. Schaefer , I11 Paras1 tology and Immunology Sranch Envlronmental t lonltorlng Systems Laboratory U. 5. Envl ronmental Protec t lon Agency 26 Uest Har t ln Luther King Dr ive Clnclnnat l , 3h lo 45268
' - .
Phone: (513) 569-7222
.

1s
Appendix A! Use o f the Hemocytometer
Suspension Dens1 t y Detennlnation Uslng the Improved ?Ieubauer (Bright-1 ine) Hemocytometer
The hemocytometer conslsts o f two chambers separated by a transverse trench and bordered bl la teral ly by l o n g i t u d i n a l trenches. Each chamber i s ruled and conslsts of n l n e squares, each 1 x 1 x 0.1 m'wlth a volume of 0.1 m3. Each square m I s bordered by a trlple 1 lne, The center 1 Ine o f the three Is the boundary 1 Ine o f the square. (See ,
Figure 1). .- According t o the U. S. Bureau o f Standards ' requlrements, *the Cover
glass must be free of vlslble defects and must be optically plane on both sides w l t h i n p l u s Or llinus 0.002 m. ONLY HEWOCYTOMETER COVER GLASSES M A Y BE. USED. ORDINARY COVER GLASSES AND S F R A T C H E D H E M O C Y T O M E m r S
R E UNACCEPTABLE, as they Introduce errors l n t o the voTwe relationships.
The suspe?lslon t o be counted must be evenly distrlbuted and free o f large debris, so t h a t the chamber floods properly. Ihe suspension t o be counted should contain 0.012 Tween 20 solution to prevent Gla rd ia cysts froln sticking and causing Improper hemocytometer chamber fl- Cyst suspenslons should be adjusted SO t h a t .there are a t o t a l of 60 t o 100 cysts i n the four corner countlng squares. Counts are statdstically accurate, I n th i s range. If the Suspension Is too numerous t o be counted , then I t must be diluted sufficfently t o b r l n g i t into this range. In some cases, the suspension wlll be too dllute after concentr3tlon t o give a stbt ls t l - cally re1 i a b l e count. I n . the 69-1'30 be done abou t t h l s s l t u a t l o n other ab1 e.
To use the hemocytometer:
1. Dilute or concentrate the
2.
cyst range, There i s n o t h i n g t h a t can t h a n t o record the result as question-.
suspenslon as requlred,
Apply a clean cover glass t o the hemocyto,neter and load the hemocytometer chamber w l t h 8-10 u l of vortexed suspenslon per chamber. I f thls operatlon has been properly executed, the l i q u i d should amply f i l l the ent l re chamber w l t h o u t bubbles or overflowing I n t o the surroundlng moats. Repeat thls step w l t h a clean, dry hemocytometer and cover glass, i f loadlng has been Incorrectly done. See step (12) below for the hemocytocneter cleanlng procedure.
3. !b not attempt t o adjust the cover glass, apply c l lps , or In any way dlsturb the chamber a f t e r I t has been fl l led. Allow the Glardia cys ts to se t t le 30 t o 60 seconds before starting the count.
4. . The G i a r d i a cysts may be counted uslng a magnlficatlon 200-6OOX.
5. :4ove. the chamber so the ruled area i s centered underneath i t .
6. Then locate the ob' ctive clo e t o the tgver ~ l t \ \ w t ~ ~ ~ ~ ~ ~ ~ ~ ~ ~ l e watch- * l n g .It from the s t f e o f ratger t h a n roug

16
7. FOCUS UP from the coverslip u n t i l the hemocytometer rul Ing appears .
8. A t each of the four corners o f the chanber i s a 1 m2 dlvided * ,-. i n t o 16 squares i n whlch Giardia cysts are to be counted (see Ffgure 1). Beglnnlng w i t h m o p row o f four, squares, count A t h a hand t a l l y counter i n the directions indicated I n Figure 2. Avold c o u n t i n g Giardia cysts twice by count ing only those touching the top a n d m u n d a r y lines and none of those touch- i n 3 the lower a n d right boundary llnes. Coun t each square mm f n - this fashfon.
. . . 1
.%
9. The formula for detcnnlnlng the number o f Giardia cys,rs per m l suspenslon Is:
# of cysts counted 10 a o f sq. mm counted x x '- x r e d i l u t i o n fac tor 1 000 mm3
I cystslml
. 1'3. 'Record the result on a data sheet sinilar t o t h a t shown I n Figure 3.
counted, and then averaged for each Glardla cyst suspenslon t o achleve opt lmal countlng accuracy.
11. A t o t a l of s i x .different hemocytometer chambers w s t be loaded, .
12. After each use, the hemocytometer and coversl l p must be cleaned immediately t o prevent the cysts and debrls from drying on I t . Since this apparatus Is preclsely machined, abrasives cannot be used t o clean I t as they w l l l disturb the f l o o d i n g a n d u a e relationships.
a. Rinse the hemocytometer and cover glass f l rs t w l t h . . t a p
b, 3ry and pol I s h the hemocytomet.er chamber and cover glass
water, then 702 ethanol and flnally w l t h acetone.
w l t h lens paper. Store i t I n a secure place.
13. A number o f factors are known t o Introduce errors In to hemocyto- meter counts. These include: c
/ a.' Inadequate suspenslon m i x i n g before f l o o d i n g the chamber.
b. Irregular f l l l l n g of the chamber, trapped air bubbles,
c. Chamber coversllp not f l a t .
d. Inaccurately rut ed chamber.
dust, o r 011 on the chamber or covers1 ip .
e. The enumeration procedure. loo many or t o o few Giardia cysts per square, s k i p p i n g or recounting some G i a r d i a cysts.
. .
17
f. Tota l number of Glardla cysts counted is * too low to g l v t statistical .coi? ' i7Ke In resul t .
9. Error i n r e c o r d i n g t a l l y .
* 1. Inadequate cleaning and removal o f cysts froln the previous count.
j. A l l o w i n g f i l l e d chamber t o 'tlt too long so t h a t chamber SUS- p e n s i o n d r l e t and concentrates.

18
Figure 1. Hemocytometer p h t f o t m r u t i n g . Squares 1, 2, 3, and 4 a r e used t o count Giardia cysts. (From M l a l c , 1967)
F igure 2. Manner o f count ing G iard ia cys ts in 1 square m. Dark. cysts are counted and l igh t cys ts are o m i t t e d . ( A f t e r H i a l e , 1967)
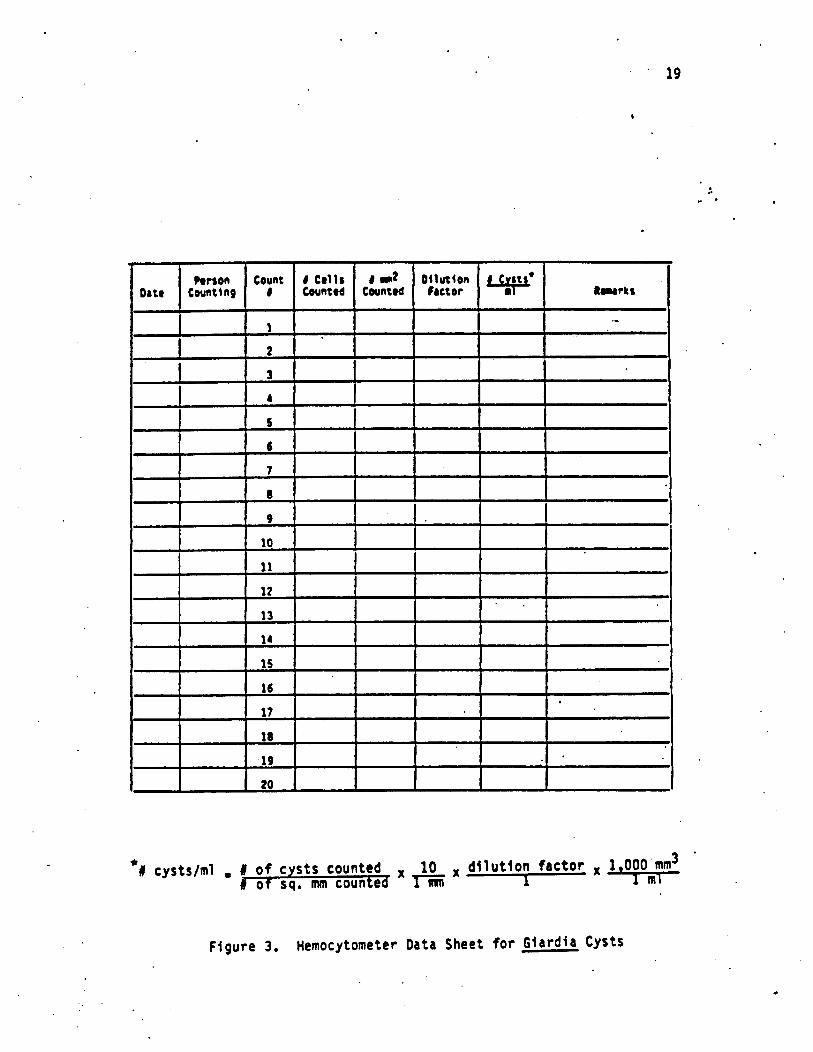
t i cystslml I I o f cysts counted x 10 di lut lon factor 1 000'mm'
o f sq. mm counted EZ x x
Figure 3. Hemocytometer Data Sheet f o r Giardia Cysts
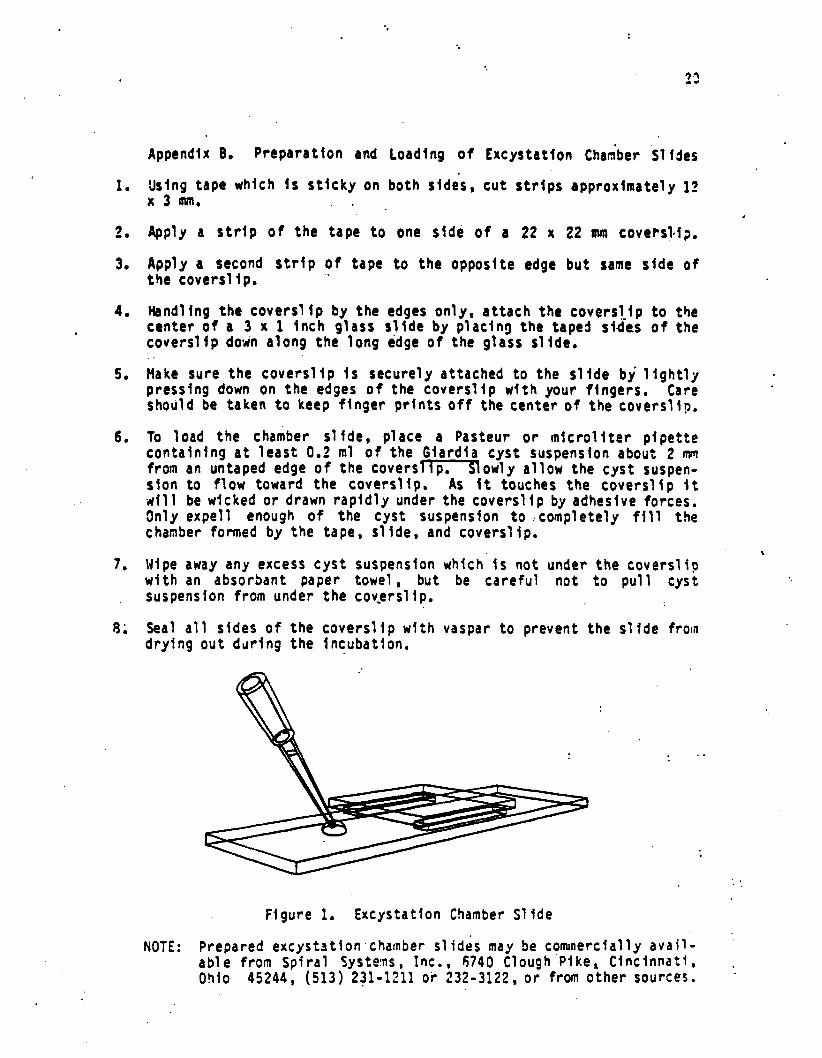
1.
2.
3.
4.
5.
6.
7.
8;
Appendlx 8. PreparatlOn and Loading of Excystatlon Cham'ber Slldes
fJslng tape whlch I S st lcky on bo th sldes, cut strlps approximately 11 x 3 mm. . .
Apply a st r lp of the tape to one side of a 22 x 22 nun covetsl.l?.
Apply a second strip of tape t o the opposite edge b u t same s ide of the coversl lp.
Y n d l l n g the coversl i p by the edges only, attach the coversl-lp to the center o f a 3 x 1 Inch glass sl lde by placing the taped sldcs o f the coversllp dodn along the long edge of the glass st Ide.
Hake sure the coversllp Is securely attached t o the s l lde b y l l g h t l y presslng down on the edges o f the coverslip w l t h your fingers. Care should be taken t o keep flnger prlnts off the center of the coversllp.
To load the chamber sl ide, place a Pasteur or microllter pipette contalnlng a t l ea s t 0.2 m l o f the Glardla cyst suspensfon about 2 mm from an untaped edge o f the c o v e t s m o w l y al low the cyst suspen- sion t o flow toward the coversl l p . As I t touches the coversl i p i t d i l l be wlcked or drawn rap ld ly under the coversllp by adhesfve forces, 3nly expel1 enough of the cyst suspension to .completely f i l l the chamber formed by the tape, sl ide, a n d coversl ip .
Wipe away any excess cyst suspenslon whlch I s n o t under the coverslip w l t h an absorbant paper towel, b u t be careful n o t t o p u l l cyst suspenslon from under the covgrslip.
Seal a l l sides o f the coverslip w l t h vaspar t o prevent the s l i de frola drying o u t d u r i n g the Incubation.
I
Figure 1. Excystatlon Chamber $1 i d e
NOTE: Prepared excystst1on.cha:nber sl i d i s may be comnerclally a v a i l - able f rom Splral System, Inc . , 6740 C l o u g h Pike, C i n c l n n a t f , Ohio 45244, (513) 231-1211 or 232-3122. or from other sources.

APPEII9IX 6-2
DETERMINI NG CHLORAHIIIE INACTIVATION OF VIRUS
FOR THE SURFACE WATER 'IREATHEN1 RULE
Microbiological Treatment Branch Risk Reduction Engineering Laboratory .
and
Paras i to logy and Immunology Branch . Environmental Honitor ing Systems Laboratory
U.S. Envfronmental Protection Agency . 26 gest Mar t in Luther K ing Dr ive
C inc innat i , Ohio 45268

TABLE 3F CONfEtllS
..

3
The Surface water Treatment Rule requlres 99.99? or greater , temoval / l n a c t l v a t l o n of vlruses. The fo l low ing p ro toco l may be used t o determine the percentage o f v l rus l nac t l va t l on ob ta lned by a t reatment p lant us ing chloramfne dlsinfectlon.
I. UTERIALS
A. Mater ia ls for D i s i n f e c t i o n
1. 2. 3. 4. 5. 6. 7. 8. 9.
10. 11. 12.
Stock ch lo t lne so lu t ion Stock ammonia s o l u t f o n S t l r r l n g d e v i c e Incubator or water ba th fo r less than rmb len t tehpera ture Hater f ro in t reatment p lant ?4S2 bacter lophage Assorted glassware Assorted pipettes Aqueous, s t e r i l e sod ium th losu l fa te so lu t ion Ref r igera tor Vortex mixer Tlmer
E. Nate r la l s f o r MS2 Assay
1. 2. 3 . 4, 5 . 6, 7. 8. 9.
10. 11 . 12 .
US2 bacteriophage and i t s Escher ichia col i : host Assorted glassware Assorted pipettes Incubator , 3 7 O C qe f r l ge ra to r P e t r i dishes, 100 x 15 mm, s t e r i l e Vortex mlxer Water bath, 4 5 O C S t e r l l e r u b b e r s p a t u l a EDTA, disodium s a l t Lysozyme, c r y s t a l l i z e d from egg whi te Centr i fuge wi th swinging bucket rotor
-

. .
I f . REAGENTS AND MEDIA
4
A. tryptone-Yeast Ex t rac t (TYE) Broth . I ng red ien t Amount Bacto t ryptone 10.0 9 - Yeast e x t r a c t 1.0 g 61 ucose 1.0 , g Na C1 8.0 g 1.0 M CaC12 . 2.0 m l
Dlssolve I n d l s t l l l e d water t o a t o t a l volume o f 1.0 l l t e r , then add 0.3 ml of 6.0 M NaOH. fhls medium should..be s t e r l - l l r e d e i t h e r by autoc lav lng f o r 15 minutes a t 121OC or f i l t r a t l o n t h r o u g h a 0.22 urn poros i t y membrane and then s tored a t approximately 4'C. * I t Is used I n preparlng bac ter ia l hos t suspens ions fo r v i ra l assays.
8. Tryptone-Yeast Extract (TYE) Agar
Ing red ien t Amount BE b r o t h .1.0 l i t e r Agar 15.0 g
The a g a r s h o u l d b e ' a d d e d t o t h e b r o t h p r l o r t o . s t e r i l i z a - t i on . The medium should be s t e r i l i z e d by autoclaving for 15 minutes a t 1 2 1 O C . This medium I s used t o prepare s lant t ubes f o r maintenance of bacter ia l s tock cu l tures. The prepared s lant tubes should be stored' at approximately 4'C.
C. S o t t o m Agar for aacteriophage Assay. '
Agar 15.0 g Na C1 2.5 9 KC1 2.5 9 1.0 M CaC12 1.0 m l
D l sso l ve t he i ng red ien ts i n d l s t l l l ed wa te r t o a t o t a l volume o f 1 1 I t e r . The medlum should be s t e r l l l t e d . by . au toc lav lng f o r 15 minutes a t 121OC. Af ter autoc lav lng and coo l i ng , s to re a t 4'C. I m n e d l a t e l y p r i o r t o use, l i q u e f y the medium by heating. Add approxlmately 15 ml o f I i que - f led agar in to : each Petr i d ish. This 'bot tom layer serves as an anchoring substrate for the top agar layer.

4
0. fop Agar for Bacterlpphage Assay
Ing red len t Amount Bac to t r yp tone 10.0 9
E. Sa l t
Agar Ha C1 Yeast e x t r a c t G1 ucose 1.0 M CaC12
* 0.0 g 8.0 9 . 1.0 9 l,o g 1.0 m l
D lsso lve the Ingredients I n d i s t l l l e d w a t e r t o a t o t a l volume o f 1 l i t e r . T h i s medlum should be s t e r i l i z e d b y au toc lav ing 15 rnlnutes a t 121OC. Af te r coo l ing , ' s to re a t 4OC u n t i l needed i n bacteriophage assays. Imnediately p r i o r to. use i n assays, 1 iquefy the mediun by heat lng and then cool t o and main ta in a t a temperature of 45OC.
31 1 uent for Bacter iophage Assay
I n g r e d i e n t Amount
1,O M CaCl2 2.0 m l ka c1 8*5 9
D i s s o l v e I n d i s t i l l e d w a t e r t o a t o t a l volume o f 1 l i t e r . Th is d l luent should be s t e r i l l z e d e i t h e r b y a u t o c l a v l n g f o r 15 minutes a t 121'C or f i l t r a t i o n t h r o u g h ' a 0.22 Jm
p o r o s i t y membrane. Store a t room temperature.
F. CaCl2, 1.0 M
I n g r e d i e n t Amount 2aC1 2 11.1 9
D i s s o l v e i n d l s t l l l e d w a t e r t o a t o t a l v o l u q e o f 100 m l . Autoclave 15 mlnutes a t 1 2 1 O C o r f i l t e r s t e r i l i z e t h e so lu t i on t h rough a 0.22 um p a r o s l t y membrane. S to re a t room temperature.
G. Sodlum Th iosu l fa te , 1%
I n g r e d i e n t Amount 3odium th iosul fa te 1.0 9
D lsso lve the sodium t h i o s u l f a t e I n 50 ml d l s t l l l e d water. Ad jus t the volume t o 100 m l .u l th a d d i t i o n a l d i s t i l l e d water. F i l t e r s t e r i l i z e t h e s o l u t l o n t h r o u g h a '5.22 ;Im p o r o s i t y membrane or autoc lave 15 m inu tes a t 121OC. Store a t room temperature.
. " .

!
111, MS2 BACTERIOPHAGE ASSAY '
1. MS2 bacteriophage: catalog number 15597-81, Amerlcan Type Cul ture Col lec t ion , 12301 Parklawn Drlve, Rockvllle, M D -20352
2. Bacter ia l host : Escherlchla col i catalog number 15597, ' American Type Culture ~ollection-'
8. Growth and Majntenance of Microorganism
1. Prepara t lon of bac te r la l hos t s tock cultures .-
Inocula te hos t bac te r ia on to TYE a g a r s l a n t tubes, Incubate 24 hours a t 37OC t o a l l ow bac te r l a l growth, and then r e f r lge r - a t e a t 4 O C . A t monthly Intervals the cu l tured bac te r la l hosts should be t r a n s f e r r e d t o a new TYE agar s lan t .
2. Preparat lon o f bacterlophage stock suspenslon
Helt top agar and na ln ta ln a t 45OC. Add 3 m l of the agar to a 13 x 100 mn t e s t tube cpntalned I n a rack I n a 45°C water bath. Add 0.5 t o 1.0 ml .of the bacterlophage suspenslon d i l u t e d so t h a t the hos t bac te r ia l "lawn" wlll show nearly complete lysis a f te r overn lght Incubat lon; Add .0.1 t o 0.2 m l *
o f a TYE broth culture ' o f the host bacter ia that has been Incubated overnlght. M i x gent ly a n d pour the contents on the su r face o f bottom agar contained I n a Pe t r i d l s h t h a t has. been prepared previously. Rock the P e t r i d l s h to spread the added material evenly over the agar surface. After the top aga r so l ld l f i e s ( abou t 15 mlnutes), Invert the Pe t r i d i s h and incubate overnight a t 37OC. Repeat the above procedure '
so t h a t a minimum of 5 b u t no more than 10 Petri d lshes a re prepared . Following thls lncubat lon and uslng a s ter l le rubber spatula , gent ly sc rape the top and bottom agar l ayers In to a l a rge . beaker. Add t o this pool of agar l ayers an amount of TYE b r o t h s u f f l c l e n t t o y i e ld a t o t a l volume of 80 m l . To thls mixture add 0.4 g of EDTA (disodium s a l t ) and 0.052 g of *
lysozyme ( c r y s t a l l f z e d from egg white). Incubate this mixture a t room temperature for 2 hours w l t h continuous m i x i n g . Then centrifuge the mlxture f o r 15 mlnutes a t 3.,000 x g. Carefully remove the upper f l u i d layer . Thls f l u i d 'layer COnSt i t . u t eS a
'vlral stock suspension for use In subsequent testing and assays. me viral s tock suspenslon my be divided in to a1 lquots and s tored e i ther f rozen Or a t 4 O C .
. .
C. Per#ormance of Sacterlophage Assay
A two-week supply o f Pe t r i d i shes may be poured w i t h bottom agar ahead of time and r e f r i g e r a t e d i n v e r t e d a t 1'C. I f s tored i n a r e f r l g e r a t o r , a l l o w agar p l a t e s t o e q u i l i b r a t e t o room temperature
before use. Elghteen hours prlor t o beglnnlng a bacterlophage assay, prepare a bacterial host tuspenslon by l n o c u l a t l n g 5 m l of TYE b r o t h w l t h a small amount o f bacferla taken dlrectly from a slant tube culture. Incubate the broth contalnlng thls bacterlal : Inoculum overnlght (approxlmately 19 hours) a t 3 7 O C lmmedlately ' prior t o use I n bacterlophage assays a s descrlbed below. fhls type o f broth culture should be prepared freshly for each 'day's bacterlophage assays. If necessary, a volune greater t h a n 5 ml can be prepared I n a slmllar manner.
On t h e day of assay, melt a sufflclent amount of t o p aga r and aa ln t a ln a t 4 5 O C In a water bath. Place t e s t tubes (13 x 100 mm) I n a rack I n the same water ba th and allow to warn, then-add 3 m l of t o p aga r t o each tube. Inoculate the t e s t tubes containing t o p agar w l t h the bacterlophage samples (0.5 t o 1.0 m l of the sample/tube) plus 0.1 t o 0.2 m l of the overnlght bacterial host suspension. Dllute the bacterlophage samples from 10'1 t o 1Y4 In salt diluent prior t o lnoculatlon and assay each d i l u t i o n I n t r ip l lca te . In additlon, assay the unlnoculated salt dlluent as a negatlve control . Agltate the test tubes contalnlng t o p a g a r , bacteriophage inoculu'II, and bacterial host suspension gently on a vortex mixer, and pour the contents of each o n t o a hardened bottom aga r layer contalned I n an approprlately numbered dish . Quickly rock the Petrl dishes t o spread the added aaterlal evenly, .
a n d place on a f l a t surface a t room temperature whlle the a g a r present I n the added material so l ld l f les (approximately 15 m i n - utes). Invert and incubate the dishes a t 3 7 O C overntght (approxl- mately 13 hours). The focal areas of viral Infection w h i c h develop d u r i n g t h i s I n c u b a t i o n are referred to 'as "plaques" a n d , i f possible, should be enumerated Immediatly ,after the lncubatioq. I f necessary, the incubated Petri dishes can be refrfgerated a t 4 O C overnlght prior t o plaque enumeration. As a general rule, c o u n t only those plates t h a t contaln between 29 and 200 plaques.

3
IV. DISINFECTION P~OCEDURE
A.
8.
C.
D.
E.
f.
G.
H.
1.
J.
K.
lhe treatment p l a n t water t o be used should be the water influent Into t9e chloramine disinfectton u n i t process used i n the p l a n t . I f chloramine disinfection is perfoned a t more t h a n one p o i n t i n the treatment process, t o g . pref i l t ra t ion and postfi l tratlon, the procedure should simulate as closely as possible actual treatment practice.
Prepare stock ammonia and chlorine solutions t o .be added to . the treatqent p l a n t water to achieve the same stoichiometric t e l a t ion - shlp between chlorine and ammonla t h a t is used i n the water treatment p l a n t . These solutlons s h o u l d be concenttated enough so t h a t no more than 2 ml of each solutlon wll l be added to the treatment plant water belng dlslnfected.
Deternine the contact time by the methods described I n the Surface Water Treatnent Rule and/or the associated Guidance Manual.
Rinse two 600 m l beakers w i t h treatment p l a n t water t o remove any extraneous materlal t h a t may cause disinfectant deaand. Then add. 400 m l treatment p l a n t water t o the beaker. The' f l r s t beaker w f l l be seeded w i t h H92 before the contents are chloraninated, The second beaker wlll be an indlgenous virus control and wf 11 be chloramlnated w l t h o u t a d d l t l o n of extraneous. phage.
H i x the contents of the beaker short of producing a vortex i n t h e center and continue u n t i l the conc?usion of the experiment,
Equilfbrate the 600 ml beakers and their contents as we17 as t h e disinfectant reagents t o the deslred experimental temperature.
Dilute the s tock MS2 bacteriophage so t h a t the bacteriophage con- cen t ra t lon ' Is 1 t o 5 x 10⁸ PFU/ml. ,
Add 1.0 m l of the diluted MS2 bacteriophage t o the contents of the f i r s t 600 m l beaker.
Remove a 10 m l sample from the contents. of the f l rs t beaker a f te r 2 minutes of mix ing . Assay the MS2 bacterlophage concentration i n this sample w i t h i n 4 hours and record the resul t t as PFU/ml. *
This value is the i n i t l a l MS2 concentratlon..
Remove a 10 m l Sample from the contents of the second beaker a f t e r 2 minutes of mixing . Assay the l n d i enous bacteriophage concentration I n this sample w i t h i n 4 hours s a t the same tlme as you assay the sample from the flrst beaker) and record the' . results as QFU/ml . This value i s the I n i t i a l unseeded concentra- t lon.
Add the disinfectant reagents to the contents of b o t h beakers using the same sequence, tlme, a n d concentrations as are used in the a,ctual treatment p l a n t operations.

9
L, J u s t p r i o r t o the end o f the contact t ime, remove a volume o f saa- p l e adequate f o r d e t e n i n a t i o n o f t h e d i s i n f e c t a n t r e s i d u a l con- cen t ra t i on from both beakers. Use methods p resc r ibed i n t he Surface Water t reatnent Rule for the determinat ion of combined ch lw ine . This residual should be the tame (22oX) as the res idual present i n the t reatment p lant operat ion.
H. ‘ A t the end o f the exposure time , remove a 10 m l sample from the f i r s t 600 m l beaker and n e u t r a l i z e w i t h 0.25 m l o f 1.0% aqueous, s t e r i l e sodium th iosu l fa te . Assay fo r t he HS2 bacteriophage *
su rv ivors dnd record the resu l ts as PFU/ml. f h l s v a l u e i s t h e exposed NS2 concentration.
N. A t t he end o f t h e exposure time, remove a 10 m l sample from the second 600 ml beaker and n e u t r a l i r e w i t h 0.25 ml of 1.0% aqueous, s t e r l l e sodium th iosu l fa te . Assay for the ind lgenous bacter io- pha3e su rv l vo rs and record the resu l ts as PFU/ml. ‘This value i s the exposed unseeded concentration.
Y. PROCEDURE FOR DETERMINING INACTIYATION
A. Calcu lat ion o f Percentage Inact ivat ion
Use the fo l low ing fo rmula to ca lcu la te the percent inac t lva t ion o f MS2:
1. ‘z I n a c t i v a t i o n = 190% - [(exposed HS2/ in i t la l FlS2) x 1903
I lsing values from Sect ion IV steps I, J , M and N c a l c u l a t e i n i t i a l MS2 and exposed HS2 as f o l 1 ows:
2. I n i t i a l 1.152 (PFU/ml) - I - J.
3 . Exposed MS2 (PFU/ml) * M - N. I f the number of PFU/ml i n exposed MS2 i s zero, i.e., no plaques a r e produced a f t e r assay of und l lu ted and d i l u t e d samples, use <1 PFU/ml as the value i n t h e above formula.
B. Comparison o f Percentage Inact ivat ion to Loglb o f I n a c t
682 i n a c t i v a t i o n Is e q u i v a l e n t t o 0.5 l o g l o i n a c t l v a t i o n 90% i n a c t i v a t i o n i s e q u i v a l e n t t o 1 l o g l o l n a c t l v a t l o n 99% i n a c t i v a t i o n i s e q u i v a l e n t t o 2 l o g l o i n a c t i v a t i o n 99.9% l n a c t l v a t l o n Is equ iva len t t o 3 l o g l o I n a c t i v a t i o n
i v a t ion.

. . * . 10
VI. BIBLIOGRAPHY
Adams, M.H. Bacteriophages. Interscience Publ.ishers, New York e1959).
American Publ ic Heal th Associat ion; American Water Works Association; Vater Pol lut ion Control Federat lon. Standard I:ethods for t he Exrmina- t i o n o f Water and Wastewater, 16 th ed, t1985) . Grabow, W.O.K. e t a l . I n a c t i v a t i o n o f hepat i tus A virus,.other enter- *
i c v i r u s e s and i n d i c a t o r organisms I n water by chlor inat ion. Water Sci. Techno1 e ) 17:657 (1985)
Jacangelo, J.D.; Q l i v i e r i , V.?.; L Kawata, K. Mechan*lsm o f I nac t i va - t i o n o f microorganisms by combined chlorlne, AWUARF Ript., Denver, CO (1987) .
Safe Drinking Water Committee. The d i s f n f e c t i o n of d r i n k i n g water. In : Drink ing Water and Health, Nat ional Academy Press, Washfngton, D.C., 2:5 (1980) .
. .
.-
Shah, P. & McCamish, J. R e l a t i v e r e s i s t i n c e of p o l i o v i r u s 1 and 'co l i - phages f 2 and T2 i n water. Appl . Microbio l . 24:658 (1972).
U.S. Environmental Protect ion Agency. Guidance Manual f o r Compliance . w i t h t h e F i l t r a t i o n and D i s i n f e c t i o n Requirements for Publfc Water Systems Using Surface \ later Sources. Appendix G, U.S. EPA, O f f i c e o f Water, C r i t e r i a and Standards D iv i s ion , Washington, D.C. (1988) .
Ward, N . R . ; Wolfe, R.L.; S Olson, S.H. E f f e c t o f pH, a p p l i c a t i o n technique, and c h l o r i n e - t o - n i t r o g e n r a t i o on d i s i n f e c t a n t a c t i v i t y o f inorganic ch loramines wi th pure cu l ture 'bacter ia , . Appl. Environ. Microbio l . , 45:508 (1984) , . *
.
VII. TECHHICAL CONTACTS:
11
. a
A. Donald B e n a n :!icroblological Treatment Branch Risk Reduction Engineering Laboratory U.S. Environmental ' rotection Agency 26 West Mart in Luther King Dr ive Cincinnati Ohio 45268
Phone: (513) 569-7235
9. Chtiston 3. Hurst ?l icroblotogical Treatment Branch Risk Reduction Engineering Laboratory U.S. Environmental Protect ion Agency 26 Vest Martin Luther King Drive C inc innat i Ohio 45269
Phone: (513) 569-7331
..

6.3 DETERMINING CHLORINE DIOXIDE INACTIVATION OF GIARDrA CYSTS UYO VIRUS
G i a r d t a ’
.. . *
The basis for the chlorjne dioxide CT values for Giardia cysts in the Guidance Clanual is given i n Appendix F.1.2. The CT values are based on data collected mainly at pH 7, Very little data was available at other pHs. A review of data from Hoff (1986) indicates that the disinfection efficiency of chlorine dioxide for bacteria m d virusej increases .
approxiarately 2 to 3 fold as pH increases from 7 to 9. Data on which the CT values in the SWTR are based indicate that at 25 C,. E, aauti_2 cyst inactivation CTs were approximately 2 fold higher at pH 7 than at pH 9 (Leahy, 1985). In addition, the data also indicate that chlorine dioxide efficiency increases ai disinfectant concentration increases within the range studied.
Because the data on effects of chlorine dioxide concentration and water pH on Giardia cyst inactivation efficiency +re very lidted, they. .
were not considered in calculating the Eiardtn cyst CT values in Appendix E. However, the data suggest that site specific conditions, i,e. water . pH and disinfectant concentration, can have significant effects on chlorine dioxide effectiveness. Therefore, the option of allowing the Primacy Agency to consider the use of lower CT values, by individual systems has been provided.
This approval should be based on acceptable experimental data p&ided by the system. The data should be collected using the protocol provided in Appendix G-1 for determining Giardfa cyst inactivation by chloramine with appropriate changes in Section I V A,;B, I and J to reflect the use of chlorine dioxide rather than chloramines, This procedure can be used for any disinfectant which can be prepared in an aqueous solution
. and !s stable over the course o f the testing. To do this, chloramine should be replaced with the test disinfectant in ’the above noted sections.
(.
.
Y(tus The basis for the chlorine dfoxfde CT values for virus in Appendix
F.2.2 consists of limited data from Sobsey (1988). Because the pH 9 data available were very limited, the Cf values are 4ased on the pH 6 data with a safety factor of 2 applied. As indicated previously, m i & 'of data .
' from a nutnber of studies (Hoff, 1986) shows that chlorine dioxide efficiency increases 2.to 3 fold as pH increases frola 7 to 9.
Because the virus CT values for chlorfne dioxide are very conserva- tive and most systems operate at water pHs higher than those bn whfch the Gf values are based, the option.of allowing the Prilaacy Agency to constder the use of lower CT values has been provided.
fhfs approval shou1.d be based on .acceptable cxperilaental .data provided by the system. The data should be collected using the protocol provided in Appendix 6.2 with appropriate changes in Sectfons - I A,1 and 2 and IV A , B, D, K, and L to reflect the use of chlorine dioxide rather than chloramines. This procedure can be used for any disinfectant which can be prepared in an aqueous solution and is stable over the course 07 the testing. To do this, chloramine should be ivplactd with the test disinfectant in the above noted sectionsb
REFERENCE S
Hoff, J.C. Inactivation of Microbial Agents By Chemical Disinfectant's, .?- EPA/600/52-86/067, U S . Environmental Protection Agenc I Water Engineering Research Laboratory, Cincinnati, Ohio, Septembtr, 198i.
Leahy, 3.6. Inactivation of wardia Furis Cysts by Chlorine and Chlorine Dioxide. Thesis, Department of civil Engineering, Ohio State University,
.-
1985 b
Sobsey, M.D. Detection and Chlorine Disinfection of Hepatitis A Virus'in Water. CR813024, EPA Quarterly Report, Dec. 1988.
6.3 - 2
6.4 DETERMING OZONE INACTIVATION OF GIARDIA CYSTS AND VIRUS
G. 4.1 BACKGROUND
The bas is for t h e ozone CT values are g iven i n Appendices F.1.2 (Giard ia cysts) and F.2.4 (Virus). As Indicated, both sets o f CT values are based on l i m i t e d d a t a and because o f th is , the va lues es tab l i shed a re conservat ive and employ l a rge sa fe ty f ac to rs . I n add i t i on , t he -d i f f e rence between t h e way the laboratory experiments used to' develop the CT values and how ozone i s ',used ' in water t reatment presents a p r o b l m w i t h t r a n s l a t i n g t h e d a t a f o r f i e l d use. The laboratory s tud ies were conducted using steady state ozone concentrat ions wi th ozone con t inua l l y added dur ing the contact per iod. In cont rast , s teady s ta te ozone concentrat ions a re no t ma in ta ined i n f i e ld use. Also, t he e f fec t i veness o f ozone contac tor r used i n f i e l d a p p l i c a t i o n s may vary from each o ther and from the m ix ing e f f i c i enc ies app l i ed i n t he l abo ra to ry exper imen ts used t o es tab l i sh t he CT values.
The n e t e f f e c t o f a l l o f these d i f fe rences I s t o limit t h e a p p l i - c a b i l i t y o f t h e CT values i n t h e SWTR and Guidance Manual t o i n d i v i d u a l systems. There fore , the op t ion o f a l low ing the h imacy Agency to cons ide r t h e use o f l o w e r CT values by indiv idual systems has been provided.
This approval should be based. on acceptable' experimental data provided by the system. I n general, the procedures provided i n Appendix G . l for determin ing Giardia c y s t i n a c t i v a t i o n and Appendix 6.2 fo r de termin ing v i rus inac t iva t ion can be used. However, un l ike ch loramines ozone i s n o t a s tab le d i s in fec tan t . Because of ozone's rap id d iss ipat ion, a p i l o t s t u d y must be used i n l i e u o f t h e batch system t o demonstrate the d i s i n f e c t i o n e f f i c i e n c y . General considerations for c o n d u c t i n g p i l o t s t u d i e s t o d e m o n s t r a t e t h e d i s i n f e c t i o n a b i l i t y o f ozone or any o the r uns tab le d i s in fec tan t a re enumerated below.
6.4.2 GENERAL CONSIDERATIONS FOR PILOT -TEST
A. A l l microorganisms, reagents and media are repared as i n - d ica ted in sect ions G.l f o r G i a r d i a and 6.2 P or v i rus .
G.4-1

. .
I
8. The disinfectant should be pre ared, measured and added t o t h e t e s t water as it' would be a 8 ded t o t h e water a t t h e ,water treatment plant .
C . Specific reactor design should be a function of the disinfec- t a n t and r e f l e c t how the .d is infectant Is added a t t h e wat'cr treatment plant. Provisi.ons should be lade to de tern ine . concentration of d is in fec tan t and m ic rob ia l l u rv t va l t o be ' measured with contact time..
- An example o f conducting a p i l o t t e s t f o r a plug flow kac to r us ing
ozone or another unstable disinfectant i s provided below.
0 ua Flo- P r o t a d
The s ize o f the p lug flow reactor can be. approximated from the tab le below. Glass, s ta in less s tee l , copper, p last ic tub ing or other material 1 '
compatible with the disinfectant can be used t o construct the plug flow . reactor. Table 1 shows the approximate length of pipe for a' plug flow ,
r e a c t o r t o y i e l d 10 minutes contact at flow rates between 50 and 500 ml/min. Depending on pipe s ize and mater ia l an economical reactor can. be constructed.
T U L E 1. APPROXIHATE LENGTH AND OIAYCTLR OF ? l P E BASED ON FLOW
...
LINEAR ?l!E*LtNGTH. METERS MQllMl ? l P E DIAYETER, at
t Low TIYE VOLUlE 0.6 1.2 . 1.8. 2.54 2 3.81 5. 08 ml/mln Y i k LITERS CC 0.28 . 1.31 2.54 5.07 11.40 20.27
50 10 0. I IO0 17.7 4 . 4 2 .0 ' 1.0 0. 4 0 .2 .............................................*...............*....*..*......*.....*.... 100 10 1 1000 35.4 8 . 8 . 3.9 .2 .0 0.9 0.5 200 10 2 2000 70.7 17.7 7.9 3.9 1.8 1.0 300 10 3 3000 106.1 26.1 . 11.8 5 .9 2.6 1. 5 400 10 4 4000 141. I IS. 4 15. 7 1.9 I. 5 2.0 500 10 5 IO00 176.8 . 44.2 ' 19..6 9.9 4 . 4 . 2.5
Addit ional information on the des ign o f spec i f ic p i lo t s tud ies can be found i n the following references by Thompson (1982) , Hontgornery .(1985) , and AI-Ani (1985) .
plug flow reactor cyst suspension, 2x10' c y s t s / t r i a l '
G 4-2

. Cyst quanti ty - cysts are prepared as indicated i n 6.1. 'io' C Y S t S / d X 20,000 a1 2x10' cysts required/tr ia l ,
MS2 stock, 2x101'/trial ' 2-20 1 i t e r (5 gal) carboy
t e s t water pump, mid range 200 ml/min disinfectant generator d is in fectant pump, a i d range 10-20 ml/min dis infectant residual reagents and equipnent
.-
I€sumww A. Reactor conditions
1.
2.
3.
4.
5.
Test Water Flow rate= 200 ml/nin ( t h i s nay vary from 50 t o 500 ml/min with 20 1 reservoir total experimental t ime= 100 min) Dis in fectant flow gas-requires specif ic contactor designed fo r d i s in fec tan t . Liquid.10 t o 20 ml/min Temperature con t ro l 1 ed Prepare 20 l i t e r r e s e r v o i r (5 gal). o f . tes t water a t the pH and temperature of the CT t r i a l . Do not add microorganisms Prepare 20 l i t e r r e s e r v o i r (5 ga l ) o f tes t water and equi- l i b r a t e t o t h e temperature o f t h e CT t r i a l . Add Giard ia cys ts a t an i n i t i a l d e n s i t y o f 10' cysts/ml and/or MS2 bacter- i a l v i r u s a t an i n i t i a l d e n s i f y o f 10' PFU/ml. .Mix thoroughly and adjust pH t o t h e pH o f t h e CT t r i a l . Continuous mixing o f the test water feed stock should be carr ied out over the course o f t h e CT t r i a l t o prevent the Eiardip cysts from s e t t l i n g .
B. Dis in fec t i on Procedure - P r i o r t o D i s i n f e c t i o n T r i a l 1. Determine contact t ime for the sample ports i n the p lug flgw
reactor under condit ions of the CT t r i a l by methods described i n the SWTR.
2. Deternine disinfectant concentrat ion with no microorganisms i n the feed test water.
G .4-3

C. C f Trial Procedure 1. Stayt test water feed without cysts and or virus (approx. 200
lal/min) , start disinfectant feed (gas or liquid). .
Allow system to equilibrate. Monitor disinfectant residual by appropriate. method during this time. Samples for disinfectant residual should be taken directly into tubes or bottles containing reagents to fix the disinfectant at the tiae the sample is collected. - Keep a plot of disinfectant residual vs running time to evaluate steady state conditions.
2. After the disinfectant residual has stabilized, switch to the reservoir containing the test microorganism(s) .
3. Allow system to equilibrate for a time = 3 X final contact time. exampl e final contact time 110 min, allow 30 mln.
4. Monitor disinfectant residual by appropriate method during this time. If the disinfectant residual is stable begin chemical and biological sampling for calculation of C f .
a. Chemi cal 5. Sampling
A sufficient volume (about 250 la1 should be collected from the sampling tap prior to.the biological composite . to determine:
PH Residual disinfectant - Samples should be collected directly into tubes or bottles containing reagents to fix the disinfectant at the time the sample 1s collected,
b. Biological Samples f o r microbial analysis are collected as short time composite samples over a 10 to 20 minute time period. Several trials may run for a given 20 l i t e r test water preparation as long as sufficient equil ibra-
G .4-4

tion and flow recovery times a n allowed between. z
trials. - Zero time samples should be collected as 250 a1 composite samples either directly frm the test water 'feed reservoir or in line prior to the addi- tion of the disinfectant.
- Four 250 a1 samples are a 2 1 sterile bottle agent for the particular sample i s thorou hly mixed upon collection and
the order of collection should be P m longest to shortest contact time to minimize flow changes due to sampling.
stored at 4 C. I P multiple sample orts are used,
..
6. Eiardb cyst recovery and assay. Concentrate the 1000 ml composite sample by filtration according to the method given in section G.1. Record and report the data as described in section 6.1. The expected cysts/smple i s given below: Cysts/sample = 4 x 250 ml X 10' cyst/ml = fxlO'cyst/sample.
Before filtration for Biardip, remove 10.0 rnl from the biological composite sample to a sterile screw cap culture tube containing 2 to 3 drops chloroform. Assay for MS2, record and kport the virus data according to the methods and procedures described in 6.2. Be sure to correct the Giardia sample voluan to 990 al.
Calculate CT in a manner described in Section G.1 for and Section 6.2 for virus. The residual disinfectant should be the average of the four residual determinations performed prior to the individual samples collected for the biological composite and th'e time should be the time determined for. the . .
sample port under similar flow conditions.
7. Virus Assay
8. Calculation of CT
6.4-5

REFERENCES
A1-Ani, C.S.U., F i l t r a t i o n of W Cysts and other substances: Volume 3. Rapid Rate F i l t r a t i o n (EPA/600/2-85/027) 1985.
lkntgoncry, Jams M. Consulting Enginters Inc., u r t r e a m t P r i n c u e s u , John Wi ley and Sons , Hay 1982.
Wallis, P.M., Davies, J.S. , Nuthonn, R. ,Bichanin-Happin, J.U., Roach, P.D. , and Van Roodeloon, A. Removal and Inact ivat ion of --Cysts i n a Mobile Water Treatment Plant Under F ie ld Conditions: Prelfminary Results. I n n m d i a ResearCh. P.M. WalliS and B.R. Hamand, ads, Union o f -Press, p. 137-144, 1989.
Wolfe, R.L. , Stewart, M.H., Lihge, S.L., and k G u i n , H.J., Disinfection of Model Indfcator Organisms fn a Drinking Uater Pilot Plant by Using PEROXONE, Applied Environmental Microbiology, Vol 55, 1989, pp .2230-2241,
* Olivieri, V.P. and Sykora, J.L., Fie ld and Evaluation o f CT for Determining the Adequacy o f D i s i n f e c t i h . American Water Works Association Water . Qua l i t y Technology Conference. I n press, 1989.

APPENDIX H
SAMPLING FREQUENCY FOR TOTAL COLIFORMS IN THE DISTRIBUTION SYSTEM

Population Served
25 to 1,000 1,001 to 2,500
3,301 to 4,100
4,901 to 5,800 5,801 to 6,700 6,701 to 7,600 7,601 to 8,500
12,901 to 17,200
2,501 to 3,300
4,101 to 4,900
8,501 to 12,900
17,201 to 21,500 21,501 to 25,000 25,001 to 33,000 33,001 to 41,000 41,001 to 50,000
' 50,001 to 59,000
Notes: - 1.
2.
8
TABLE X-1
TOTAL COLIFORM SAMPLING REQUIREMENTS BASE0 UPON POPULATION -
Minimtmr Number
:f:z2f1,2,3) . Population Served
1 59,001 to 70,000 2 70,001 to 83,000 3 83,001 to 96,000 4 96,001 to 130,000 5 130,001 to 220,'OOO
7 320,001 to 450,000 8 450,001 to 600,000 9 600,001 to 780,000
10 780,001 to 970,000 15 970,001 to 1,230,000 20 1,230,001 to 1,520,000
6 220,001 to 320,000
25 1,520,001 to 1,850,000 30 1,850,001 t o 2,270,000 40 . 2,270,001 to 3,020,000
60 3,960,001 or more 50 3,020,001 to 3,960,000
Minimum Number
of Samples Per Month
70 80 90
100 120
' 150 180 210 240 2 70
. 300 330
, 360 390 . 420 450
, 480
Non-cornunity systems using all or part surface water and community' systems must monitor total coliform at this frequency. A non- community water system using ground water and serving 1,000 persons or fewer must monitor quarterly, beginning 5 years after the rule's promulgation, although this can be reduced to yearly if a ranitary survey shows no defects. A non-community water system serving pore than 1,000 persons during any month, or a non-community water system using rurface water, must monitor at the same frequency as a l ike- sized cornunity public water system for each month the system provides water to the public.
Unfiltered surface water systems must 'analyze one. coliform sample each day the turbidity exceeds 1NTU.

TABLE n-1
TOTAL COLIFORM SAMPLING REQUIREMENTS .. BASED UPON POPULATION (Continued) . -
3 , Systems collecting fewer than 5 88UIpleS p u month on a regular basis must conduct sanitary surveys. Colaanrnity and non-community systems must conduct the in i t ia l sanitary surveys w i t h i n 5 and 10 years of ptamulg@tion, respectively. Subsequent surveys must be conducted every 5 yearst except for non-conununfty systems using protected and dis infected ground water, wkich have up t o 10 years to conduct subsequent sunteys.
. . . .
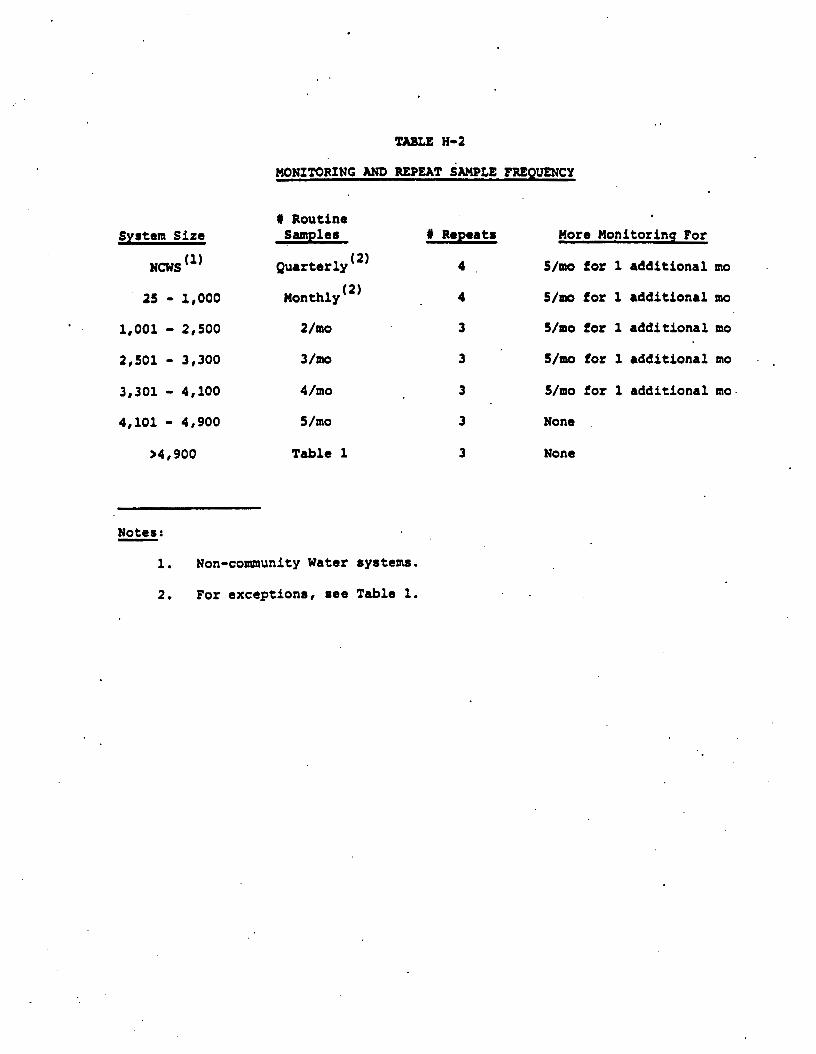
. . TABLE H-2
MONITORING AND REPEAT SAMPLE FREQUENCY
I Routine System Size Samples Y Repeats More Monitoring For
NCWS (l) Quarterly 4 . S/mo for 1 additional mo (2)
25 1,000 Monthly 4 5/mo for 1 additional mo (2 )
1,001 0 2,500 2/mo 3 9/mo for 1 additional mo
2,501 3,300 3 / m 3 5/mo for 1 additional mo . .
3,301 - 4,100 4/mo 3 S/mo for 1 additional mo.
4,101 0 4,900 5/mo
>4 , 900 Table 1
3 None
3 None
- Notes:
1. Non-community Water systems.
2. For exceptions, see Table 1.

APPENDIX I MA1 NTAI N I NG REDUNDANT DISINFECTION CAPABILITY
. .

APPENDIX I
The SWTR requires that unf i l tered water systcms. provide kdundant dis infect ion components t o ensure the continuous appl icat ion o f a disinfectant t o the water entering the distr ibution systun. I n many' systems, both f i l t e r e d and unf i l tered, a primary disinfectant i s used t o provide the overall inactivation/maoval and a secondary k i d u a l i s . applied t o maintain a residual ' in the d istr ibut ion system. As o u t l i n e d i n Sections 3.2.4 and 5.5.4, redundancy of the d is infect ion tystcar(s) i s . . recomnended t o ensure that the overal l tnatment requirement of %log Elarm cyst and 4-log virus Mmoval/inactivation i s achieved, and a residual i s maintained entering the distribution part icularly important for unfi l tered supplies where bar r ie r i s d is infect ion. Redundancy o f components i s for d is infect ion dur ing rout ine repairs, maintenance possible fai lures.
system. This i s . the only treatment necessary t o i l i o w and inspection and
I n reviewing water d is infect ion faci l i t ies for compliance w i th redundancy requirements, the following items should be checked:
I . m e r a l e
A. Are the capac i t ies o f a l l cocaponents of both the primary system and the backup system equal t o or greater than the requi red capaci t i t s ?
Some systcms may have two or more units that provide the required dosa e rates when a l l u n i t s a n o erating. In these
. cases, an ad 8 i t i o n a l u n i t i s needed as .I ackup, during the downtime o f any of the operating units. The backup must have a capacity equal t o or greater than that of the largest
8. Are adequate safety precautions being 'followed, relative to
C. A r e redundant components being exercised or alternated wi th
D. Are a l l components being properly maintained?
E. Are c r i t i c a l spare parts on hand t o repai r d is in fect ion
- on- l ine uni t .
the type o f disinfectant being used?
the primary components?
equipment? ' .
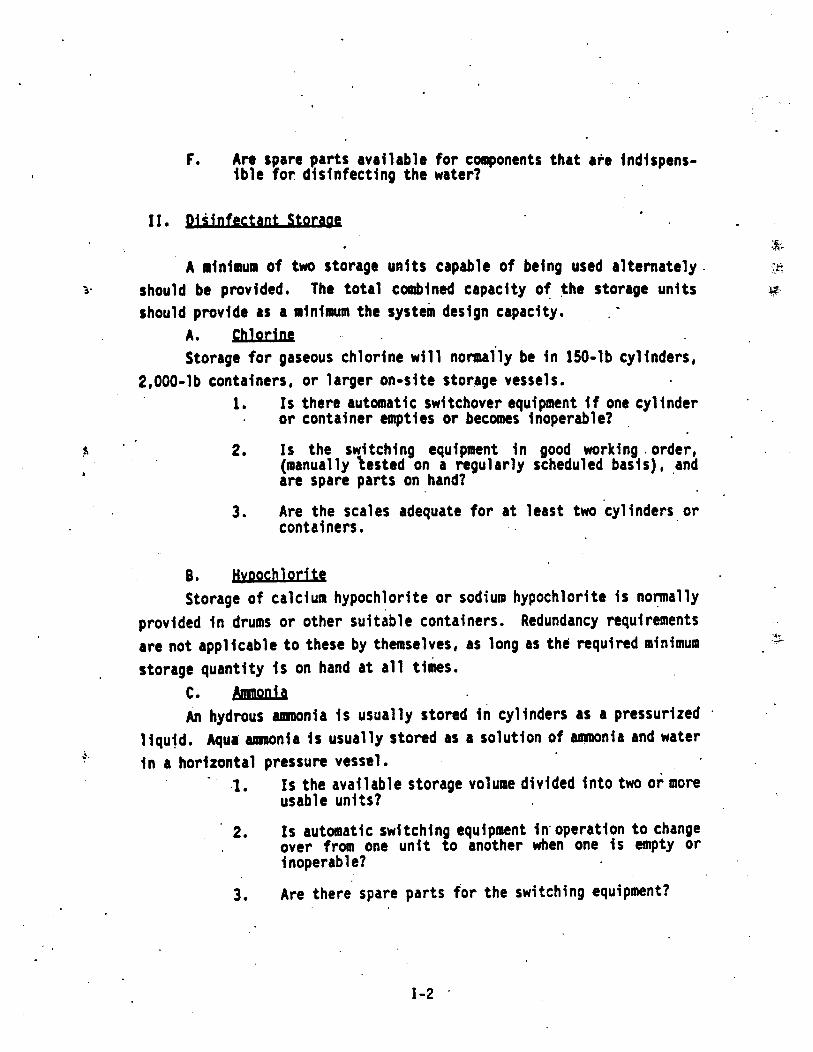
F. A r e spare parts available for components that are indirpens- ible for disinfecting the water?
11. Pisinfectant s t o m *" A ninilaua o f two storage units capable of being used alternately . ?& 'L-
3- should be provided. The total combined capacity of the storage units w should provide as a minimum the systein design capacity.
A * Chlotinc Storage for gaseous chlorine will normally be in 150-1b cylinders,
1. Is there automatic switchovct equipment if one cylinder 2,000-1b containers, or larger on-site storage vessels.
. or container empties or becomes inoperable? ,
2. Is the switching equipment in good working .order, (manually tested on a regularly scheduled basis), .and are spare parts on hand?
3. Are the scales adequate for at least two cylinders or containers.
B o HYPQmw& Storage of calcium hypochlorite or sodium hypochlorite is normally
provided in drums or other suitable containers. Redundancy requiremnts are not applicable to these by thcraselves, as long as the required minimum storage quantity is on hand at a1 1 ti&.
-4 *r
c. m An hydrous asmonia is usually stored i n cylinders as a pressurized .
liquld. Aqua' a m n i a is usually stond as a solution of Mmonia and water in a horizontal pressure vessel. I. Is the available storage volume divided into two o r more
usable units?
2.
- .
' 2. 1s autmatic switching equipment imoperation to change Over from one unit to another when one is empty Or inoperable?
3. Are there spare parts for the switching equipment?

111. &watiu Ozone and chlorine dioxide are not stored on-site. Rather, because
of their reactivity, they are'generated and used irmcdiately. . . To satisfy the redundancy requirements for these disinfectants it i s
recomnended that two generating units, or two sets o f units, capable o f supplying the required feed rate be provided. In systems where there is. mre than one generation system, a standby unit should be available for *times the on-line units need repair. The backup unit should have a capacity equal to or greater than the unit(s) It MY, replace.
A. nkinuhu . .
Chlorine, sodium chlorite, ,or sodium hypochlorite should be stored
8. Ozone Are all generation components present and in working order for both
c * Comnon Is switchover and automatic , start-up equipment installed and
operable to change from the primary generating unit(s) to the redundant unit (s)?
in accordance with storage guide1 ines previously described.
the primary and the redundant units (whether using air or oxygen)? .
IV. feed Svstems Redundancy in feed systems requires two separate units, or systems, .
* each capable of supplying the required dosage of 'disinfectant. If more than one unit is needed to apply the required feed rate, a spare unit should be available to replace any of the operating units during times o f malfunction.. The replacement unit should, therefore, have a capacity equal to 3r greater than that of the largest unit which It may replacei This requirement applies to all disinfection methods, and i s best implemented by housing the on-line and redundant components in separate rooms, enclosures , or areas , as appropriate. .
In reviewing these systems for redundancy, the following components should be checked:
. A. Chlorim 1. Evaporators
. 2. Chlorinators 3. Injectors
I -3

c
8. MvDachloFIte . . 1. Mixing tanks and mixers 2. Chemical feed pmps and controls 3. In jectors
\ c. Oronc 1 . Dissolut ion quipncnt , .including compressor and del ivery
plping systems -
u
0. - 1. Chlorine feed equipment 2. Sodium chlor i te mixing and metering equipnrtnt 3. Day tank and mixer . 4. Metering pumps 5. I f a package C10, u n i t i s used, two w s t be provided .
E. - 1. Chlorine feed equipment . ,
2. Amnonia feed equipment, including applicabie equipment for either:
a. Anhydrous amon i:a ( ’ . . b o Aqua amnonia (solut
v. . .-
Thq best method of monitoring a d is in fec t ion fac i l i t y fo r continuous ’
. P
operation i s by continuous recording equipment. To improve re\ iab i l i . ty , it i s suggested that dupl icate continuous monitors are present for backup i n the event-of monitor fai lure. However; if there i s a f a i l u r e i n t h e noni tor i rg system fo r ind ica t ing tha t a continuous residual i s being. maintained, the SWTR allows systems t o take grab samples every four hours for up t o f i v e days during monitor repair. For systems without 24 hour s ta f f ing it will not be prac t i ca l t o t ake grab samples and redundant
”. monitoring equipment i s recommended. Fai lure of continuous m n i t o r i n g would be a v io la t ion o f a monitoring requirement, not a treatment requirement .
. .
A. n l o r i n e ’ * 1. Does t h e f a c i l i t y have a continuous monitor for chlorine
residual at the disinfection system s i te w i th an alarm
I -4

'or i nd ica tor to show when the monitor i s not function- . ing? For added assurance, the provision of a backup ' moni tor ing un i t is a lso reconacnded. * -
2. Is there instrumentation i n place t o . automatically switch from one Inonitor to the o ther i f t h e f i r s t one f a i 1 s?
8. HvDochtoritt S a m as for chlor ine system. c. Orone
.-
1. Does t h e f a c i l i t y have a continuous ozone monitor with automatic switchover capability and alarms?
2. Does t h e f a c i l i t y have a continuous ozone residual Inanitor with automatic switchover capability and alarms?
D * - 1. Does t h e f a c i l i t y have a continuous chlorine dioxide
2. Does t h e f a c i l i t y have a continuous chlorine dioxide
monitor with automatic switchover.capabi1 i t y and alarms? .
residual monitor with automatic switchover capability : and alarms?
E. 1. Does t h e f a c i l i t y have a continuous asmoni;a I foni tor wi th
automatic switchover capabi 1 i t y and alarm?
2. Does t he f ac i l i t y a l so have a continuous chlor ine residual monitor on-site with automatic switchover capabi 1 i ty and a1 anus?
VI. powtr luopl~ A permanently i ns ta l l ed standby generator, capable o f running a l l
. e lec t r i ca l equipment a t the d is in fect ion s ta t ion, and equipped for automatic start-up on power fa i lu re , should be on-site and functional.
A l ternat ives to a standby generator, 'such as a feed l i n e from a d i f ferent power source, a re acceptable i f they can be shown t o have equal r e l i a b i l i t y .
1-5

VII. Al#ulik Indicators,and alarms, both local and remote, should be capable
promptly . a le r t ing operat ing and supervisory personnel of prob condi ti ons .
A. Lacat Lights, butters, and horns should be insta l led and functioning
alert on-si te personnel t o problem conditions. 8. Remote .-
o f 1-
Alarrn signals should be relayed t o a central control panel which i s manned 24 hours per day and whose operators can no t i f y response personnel imcdiately. .
c. 7 . . A minimum l i s t o f problem conditions which should have indicators
and alarms, both loca l ly and a t a 24-hour per day switchboard, are as follows:
VIII. fhcl
1. 2. 3. 4. 5.
Disinfectant leak Feeder pump f a i lure Power outage Generator or alternate power source on Disinfectant residual less than setpoint value
.-
Maximum re1 iab i 1 i t y i s ensured when redundant units are separated ,
from primary units. The type o f separation should be appropriate to t he typ.e o f potential malfunction. For example, any area within a bui ld ing subject t o a chlorine leak should have primary components separated from redundant components by an a i r t i g h t enclosure, L e * , separate rooms o f varying sizes.
I X . w a r a t e F a c i l i t v . Under certain condit ions, such as locat ion o f a dis infect ion
f a c i l i t y . i n an area of h igh earthquake potential', the most re l i ab le Fans o f providing.redundant f a c i l i t i e s may be t o house them i n a completely separate structures a t a di f ferent s i te.
I -6

APPENDIX J
WATERSHED CONTROL PROGRAM
.

APPENDIX J "
The following i s a guideline for documenting a watershed control - program. The SWTR only requires a watershed control program for unfi l tered supplies. A watershed control program can also benef i t a f i l t e r e d system by providing protecti,on for aaintaining the source water qual i ty, minimizing the level of d is infect ion to be provided. I t i t therefore recormended t h a t a l l systems conduct the basic elements o f a watershed control program. However, the scope o f t he .program should increase as the complexity and size of the watershed/ system increases. The program could be more or less comprehensive than th is ou t l ine , and w i 11 be determined on a case-by-case basis by the u t i 1 i t y and the Primacy Agency, In addi t ion to the gu ide l ines below, a wellhead protection program could be the basis of a watershed control program i n many states; All o f the elements found below would also be par t of a local wellhead protection program.
A. Hatershed DesctiDtion
1. Geographical location and physical features o f the watershed.
2. Location of major components o f the water system i n relat ionship t o the watershed.
3. H drology: Annual pnci .p i tat ion patterns, stream flow
4. Agreements and del ineation of land use/ownership.' .
8. _. I d e n t i f i c a t i o n o f the Watershed Characteristics Md A c t i v i t i e s b b
1 Naturally Occurring:
c K aracterist ics, etc.
a. Effect of precipi tat ion; terrain, soi l types and
b. Animal populations (detcrfbc) -- include a dis- cussion o f the m d i a contamination potential, any other microbial contamination transmitted by animals
land cover
3-1

. . i
e. Other - any o ther ac t i v i t y which can adversely a f f ect water qual i t y
2 . Wan-Wade:
a. Point sources o f contamination such as wastewater . treatment plant, industrial discharges, barnyard,
The impact o f these sources on the microbiological qual i ty o f the water source should be evaluated. i n cases r e s u l t i n i n i d e n t i f i a b l e degradation, the discharges shou e d be eliminated i n order t o minimize the treatment of the water needed.
1 ..a
Q.-
feedlots, or pr ivate sept ic systems . ,.. -<
b, Nonpoint Source o f Contamination:
1) Road construction - major highways, r a i l - roads
2) Pesticide usage
3) Logging
4) Grazing animals
5) Dischar e t o ground water which recharges
6) Recreation *activit ies
7) Potential for unauthorized a c t i v i t y i n t h e *
the sur 9 ace source ->.- rh. ZI ...
. watershed
8) Describe any other human a c t i v i t y i n t h e watershed and i ts po ten t ia l impact on water ,
qual i ty
It should be noted that grat in animals i n the watershed may lead t o the presence o 9 ~ s D o r i d i ~ i n t h e water. CryptosoridiUm i s a pathogen which may resu l t i n a disease outbreak upon ingestion. No information i s available on i t s resistance to various. disinfectants, therefore it i s recomnendcd that grat ing should not be penni t t e d on watersheds o f non-fi 1 ter ing systems I Sewage discharges will introduce viruses into the water source which may be occluded i n s o l i d s and protected from inactivation through disinfection. It is, there- fore, recomncndcd that sewage dischar es should not.be permitted within watersheds of non-fi P tc r ing suppl lese
. . Although it i s preferable to not have grazing or sewa e discharges within the watershed, Primacy. Agencies w i 9 1
3 -2

need t o evaluate the impact .of these activit ies on a case-by-case basis . In cases where there i s a, long detention time and a high degree o f d i l u t i o n between the po in t o f t he ac t i v i t y and the water intake, these activ- i t i e s way be permissible for unfi l tered. supplies. The u t i l i t y should set r i o r i t i e s t o address the impacts i n B.1. and 2.# consi 8 ering their health si .gnif icance rnd the abi 1 i t y to con t ro l them.
.-
C. m t r o ' l of D e t r f m t a l A c t ~ v i t i = ~ m n 3 s
Depending on the act iv i t ies occurr ing wi th in the wcrtershed, various techniques could be used to e l iminate or miniaize the i r e f fec t . Describe h a t techniques are being used t o control the effect of act iv i t ies /events ident i f ied i n 8.1. and 2. i n i t s yearly report.
Example:
Wivity: Logging i n t h e watershed.
m a c m n t Derision: Develop program t o minimize impact o f logging.
procedurq: Establish .agreements with logging compan'ies to maintain pract ices which will minmize adverse . impacts on water . qual i ty. These practices should include:
- l i m i t i n g access to l q g i n g s i t e s - ensurin cleanup o f s i t e s - control 9 lng erosion from site.
jbn i tor ing: - Periodically review 1ogging.practices t o . ensure they are consistent with the agreement between t h e u t i l i t y and the logging companies.
Example:
B t i v i t y : P o i n t sources o f discharge w i th in the watershed . -nt Decision: . Eliminate those discharges or. minimize t h e i r impact.
procedures: Act ively p.art ic ipate in the review of . discharge pennits t o a l e r t t h e reviewing agency o f the potential (actual) impacts of the discharge and lobby f o r i t s e l i m i n a t i o n or s t r i c t con t ro l .
. .
3-3
.
0.
E.
i t o r i u : Conduct special monitoring t o ensure E n d i t ions of the permit are met and t o document adverse . effects on water qual i ty. I -
Monitortna 1. Routiqe: M i n i m specif icat ions for mnitor ing several
raw water qua l i t y parameters a re l i s ted i n Section 3.1. Describe when, where and bow these samples w i 11 be col lected. These n s u l t s will be used to evaluate nhether the source may continue t o be Used without f i l t r a t i o n .
2. Specific: Routine mnitoring may not provide informa- t i o n about a l l parameters of interest. For example, it may be valuable t o conduct special studies t o measure contaminants suspected o f being resent (Giardia, pesti- cides, fuel products, enteric v P ruses, etc.). Frequent presence o f either Giardia or e n t e r i c 4 r u s e s I n raw water samples p r io r t o d i s in fec t i on would indicate an inadequate watershed control program. Moni to t ing may also be useful t o assess the effect iveness of specif ic ,
control techniques, and t o a u d i t rocedures. or opera- t i ona l requirements ins t i tu ted w P t h in t he watershed. U t i l i t i e s are encoura ed t o conduct additional monitor- ing as necessary t o a 4 d them in con t ro l l i ng t he qua1 i t y o f the source water.
Ooerat i orlf
- . .c
1 . Management ,-
a. Organizational structure '
b. Personnel and education/cert i f icat ion requirements
2 . Operat i ons
a. Describe system operations and design f l e x i b i l i t y .
b. The u t i 11 t y should conduct some form o f ongoing review or survey i n the watershed t o i d e n t i f y and react to potent ia l impacts on water quality. The
'scope of t h i s review should be documented and agreed upon by the u t i l i t y and Primacy Agency on a case-by-case basi 5.
c
s e t t l i n g basins. Discuss what tr iggers, and who decides t o make, those changes.
3. Annual Report: As part o f the' watershed progfm, .an annual report should be submitted t o the Primacy Agency. The contents o f the report should:
a. Ident i fy special concerns that occurred i n the watershed and how they were handled (example:' herbicide usage, new construction, etc.).
b. Sumarire other act iv i t ies i n 'the watershed such as logging, hunting, water quality monitoring, etc.
c. Project what adverse ac t i v i t i es a re expected t o occur i n the future and describe how t h e u t i 1 i t y expects t o address them.
F. t s /Land Owner-
The goal o f a watershed management program i s t o achieve the highest level of raw water qual i ty practicable. This i s p a r t i c u l a r l y c r i t i c a l t o an unf i l tered surface supply.
1. The u t i l i t y will have maximum opportuni ty to real ize. th is oa l i f they have complete ownershtp o f the * .
waters 1 ed. Describe e f f o r t s t o obtain ownership, such as any speci a1 programs or budget. When complete ownership o f the watershed i s not pract ica l , e f for ts should be taken t o gafn ownership o f c r i t i c a l elements, such as, reservoir or stream shoreline, highly erodable land, and access areas t o water system f a c i l i t i e s .
2. Where ownership o f land i s not possible, written . agreements should be obtained recognizing the watershed as par t o f a publ ic water tu p ly . Maximum f l e x i b i l i t y should be i ven t o t he u t i i t y t o con t ro l l and uses which coul have adverse e f fec t on the water quality. Descri be such agreements.
.
8 f
3. Describe how t h e u t i l i t y ensures that the landowner complies with these agreements.

APPENDIX K
SAN I TARY SURVEY

APPENDIX K - The SUR requires that an on-site inspection be conducted each year
as outlined in Section 3. It is recomnended that at the onset of detennining the classification of a source water that a detailed sanitary survey be Conducted. In addition, it is recomended. tbat a sanitary survey such as contained in this appendix be conducted every 3 to 5 years by both fi ltered and unfi 1 tered systems to ensure that the quality of the water and sewice is maintained. This time period is suggested since the time and effort needed to conduct the c&p&hensive survey aakes it impractical for it to be conducted annually. A periodic 'sanitary survey i s also required under the Total Coliform Rule for systems collecting fewer than 5 samples/month. The survey must be conducted every 5 years for all systems except for protected ground.water systems which disinfect. These systems must conduct the survey every 10 years.
The sanitary survey involves three phases, including planning the survey, conducting the survey and compiling the. final report of the . survey, as will be presented in the following pages.
Plannina the Survey
Prior to conducting or scheduling a sanitary survey, there should be a detailed review 9f the water system's file to prepare for the survey. The review should pay particular attention to past sanitary survey re orts and correspondence . describing reviously identified prob ems and their so1ution.s. These shou d be noted, and action/inaction regarding these problems should.be-specifically verified in the field. Other *
information to review includes: any other correspondence, water system plans, chemical and microbiological sampling results, operating reports, and engineering studies. This review will aid in the familiarization with the system's past. history and present conditions, and the agency's past interac- tions with the. system.
The initial phase of the water quality *view will be carried out prior to conducting the. survey as well , and will consist o f reviewing the water system's monitoring records. Records should be reviewed for compliance with all applicable'microbi-
I ological , inorganic chemical , organic chemical , and radiologi- cal contaminant K L s , and also for compliance with the monitoring requirements for those contaminants. The survey
P P
u- 1

will provide an op ortunity to review these records with the
violations. The survey will also provide an opportunity to review how and where samples are collected, and how field measurements (turbidity, chlorine residual , fluoride, etc.) are made. Points to cover Include: * -
utility, and to d P scuss solutions to any MCL or monitoring
a. Is the system in compliance with all applicable MCLs (organic chemical , inorganic chemical , microbiological and radiological)?
<.
b. Is the system in compliance with all monitoring require- ' +.
men t s? *-
.-
The pre-survey file review should generate a list of items to check in. the field, and a list of questions about the system. It will also help to plan .the fomat o f the survey and to estimate how awch time it may take. The next step is to make the initial contact with the system management to establish the survey date(s) and time. Any records, files, or people that will be referenced during the survey should be mentioned at the outset. Clearly laying out the intent of the survey u front will greatly help in mana ing the system, and wil ensure that the survey goes smooth y without a need for ?peat trips . Q !
- 2. ductipg the Surygy
The on-site portion o f the survey is the most important and will involve interviewing those in charge of managing the . water system as well as the operatws and other technical .
. people. The survey will also review all major system compo- nents from the source(s) to the distribution system. A standard form is frequent1 used to ensure that all major . components and aspects o! each system are ,consistently reviewed. However, when in the field, it i s best to have an . open mind and focus most attention on the specifics of the water s stm, using the form only as a guide. The surveyor should i e certain to be on time when beginning the survey. This consideration will help get the survey started smoothly with the operator and/or manager.
.~
As the survey progresses, any deficiencies that are observed . should be brou ht to the attention of the water system ersonnel , and t R e problem and the corrective measures should !e discussed. It is far better to clarify technical details and solutions while standing next to the problem than it is to do so over the telephone. Points to cover .include:
a. Is the operator competent in performing the necessary . field testing for operational control?
K-2

b. Are testing facilities and equipment adequate, and do reagentf used have an unexpired shelf life?
c. Are field and other analytical instruments properly and n g u l arly cal i brated?
d. Are records of field test results and water quality compliance monitoring results being maintained?
e. Conduct any sampling which will be part of the survey.
Also, detailed notes of the findings and conversations should be taken so that the report of the survey nil 1 be sn accurate reconstruction of the survey.
Specific. components/features o f the rysttln to ?view and some pertinent questions to ask are:
A. - All o f the elements for a source evaluation enumerated below nay also be part o f a Wellhead Protection Program.
1. Description: based on field observations and discussion with the operator, a general charac- terization o f the watershed should be made. Features which could be included in the descrip- tion are:
a. Area o f watershed or recharge area. . .
b. Stream flow.
c. ' Land usage (wilderness, farmland, rural housing,. recreational, ccwnsercial , indus- trial, etc.).
d. Degree o f access by the pub1 ic to watershed.
e. Terrain and toll type.
f. Vegetation.
g. Other.
2. Sources of contamination in the watershed or sensitive areas surrounding wells or well fields should be identified. Not only should this be determined by physically touring and observing the .watershed and its dally uses, but the survey- or should also actively question the water system manager about adverse and potentially adverse
K-3

activities in the watershed. An example of types of contamination Includes:
a. Man Made. .. 1. Point discharges of sewage, stonn-
water, and other wastewater. , . *
2. On-site sewage disposal systems.
3. Recreational activities (swimning,
4. Human habitation.
-
boating, fishing, etc.) . ..
. .
5. Pesticide-usage.
6 . Logging . 7. Highways or other roads f m which
there might be spills. 8. Coamercial or industrial activity.
9. Solid waste or other disposal facili- ties.
10. Barn ards, feed lots, turkey and chic 3: en farms and other concentrated domestic animal activity.
11. Agriculturai activities such as' raz- , tillage, etc., which af ects in! B
. . >-
so 1 erosion, fertilizer usage, etc. - .
. -12. Other . ..
b. Natural ly Occurring . 1. Animal populations, both domestic and
2. Turbidit fluctuations (from precipi-.
3. Fires.
wild.'
tation, T andslides, etc.).
4. . Inorganic contaminants from parent
5. Algae blooms.
materials (e.g., asbestos fibers)
K-4
.
6. Other.
' This l i s t i s by no mans a l l inc lus ive . . The surveyor should r e l y p r i n c i p a l l y on his
observations and thorough questionin regarding the unique properties of cac 1 . watershed t o completely describe &at may contaminate the source water.
3. Source Construction.
a. Surface Intakes. - 1. I s t h e source adequate in' quanti ty?
2. Is the best qual i ty source or loca- t i o n i n t h a t source being used?
3. Is the 'intake protected from i c i n g problems i f appropriate?
4. Is the in take screened t o prevent .* entry o f debris, ,and are screens
maintained?
5. Is animal ac t i v i t con t ro l led w i th in the imed ia te v ic ! nity o f the in take? *
6, Is there a raw water sampling tap?
b. I n f i l t r a t i on Ga l l e r i es .
1. Is the source adequate in quant i ty?
2. Is the best qual i ty source being used?
3. I s t h e l i d over the gallery water-
'4. I s t h e c o l l e c t o r i n sound condit ion
. t i g h t and locked?
and maintained as. necessary? .
5. I s there a raw water sampling tap?
c . Springs . 1. I s t h e source adequate i n quanti ty?
2. I s t he re adequate protection around the spring such as fencing t o control the area wi th in 200 feet?
K- 5

3. Is the s ring constructed t o best capture t R e spring flow and exclude surface water i n f i l t r a t i o n ?
. .
4. Are *there drains to d iver t sur face , . water f m . t he v i c in i t y o f t he .
spring?
5. Is the col lect ion structure of sound construction with no leaks o r cracks?
..-
6. Is there a screened overflow and drain pipe?
- .. .-
7. Is the supply intake located above
8. . Is there a raw water sampling tap?
the f l o o t .and screened?
d. Catchment and Cistern.
1. Is source adequate i n quantity?
2. Is the c istern o f adequate size?
3. Is the catchment area protected frorrl potential contamination?
4. Is the catchment drain properly screened? . .
' 5. Is the catchment area and c is tern of sound construction and i n good condi- ti on?
6. Is catchment constructed o f approved non-toxic, non-leaching material? '
7. Is thecistern protected from contam- ination -- manholes, vents, etc?
8. Is there a raw water tap?
e. Other Surface Sources.
1. Is the source adequate i n quantity?
. 2. Is the best possible source, being used?
3. ' Is the imediate v ic in i ty o f the source protected from contamination?
K-6

4. Is the structure i n good condition
5. Is .there a raw water sampling tap?
and. properly constructed?
4. Pumps, Pulaphouses, and Controls . a. A n a1 1 intake pumps, booster PUGS, and
other pumps of suf f ic ient capaci ty?
b. A r e a l l pumps and controls Operational and raintained properly? -
c. Are check valves, blow o f f vafves, water meters and other a purtenances operated and maintained proper P y?
d. Is emergency power backup with automatic start-up provided and does it work ( t ry it)?
e. Are undergpound compartments and suction we1 1 s waterprbof?
f. Is the in te r io r and exter ior o f . the pump-. house i n good s tpc tu ra l cond i t i on and properly maintained?
g. Are there any safety hazards (e lect r ica l or
h. Is the pumphouse locked and otherwise
i. . Are water production records maintained at
mechanical) i n t h e pumphouse?
protected against vandalism?
the pumphouse?
5. . Watershed Management ( con t ro l l i ng contaminant . sources): The goal o f the watershed mnagement program i s t o i d e n t i f and control contaminant sources i n t h e waters K ed (see 'Section 3.3.1 of. t h i s document, Watershed Control Program") . Under ideal conditions each source o f contmina- t i o n i d e n t i f i e d i n 2 wi1.1 already have been ident i f ied by the u t i l i t y , and some means of control inst i tuted, or a factual determi.nation made t h a t i t s . i . q a c t on water q u a l i t y i s i n s i g - - n i f icant . To assess the degree t o which the watershed management program i s achieving i t s '
goal, the following types of inquiries could be '
made:
' .
.,--
a. I f the watershed i s not ent i re ly owned by t h e u t i l i t y , have wri t ten agnments been
. made with other land owners t o control land usage t o t h e s a t i s f a c t i o n o f t h e u t i l i t 3 A r e appropriate re ulat ions under t e contract of state/ oca1 - department o f 0
i r
? K ' health i n ef fect?
b. Is the u t i l i t y rak ing e f for ts to .obta in as complete ownership o f the watershed as possible? Is e f f o r t directed t o control ,
c r i t i c a l elements?
.*-
I.
c. Are there means by which the'waiershed i s regularly inspected for new sources of contamination or trespassers where access i s 1 imi ted?
d. Are there adquatel 'qual i f ied personnel employed by the .ut T l i t y fo r iden t i f y ing , watershed and water quality problems and who are given the responsibi l i ty to correct these problems?
e. Are raw water quality records kept t o assess trends and t o , assess the impact o f d i f f e r e n t a c t i v i t i e s and contaminant con-
, t r o l techniques i n the watershed?
f. Has the system responded adequately t o concerns expressed about the source or watershed i n past sanitary surveys?
g. Has t h e u t i l i t y i d e n t i f i e d problems i n i t s yearly watershed control reports, and i f
. so, have . these problems been adequately addressed?
h. Ident i f y what other agencies 'have control or j u r i s d i c t i o n i n t h e watershed. Does the u t i l i t y ac t i ve l y i n te rac t w i th these a en- c ies to see tha t the i r po l i c ies or act ! v i - t ies are cons is tent wi th the u t i l i ty 's goal . of maintaining high raw water qual i ty?
1. Disinfection.
a. Is the disinfection equipment and disinfec- tant appropriate for the application (chloramines, chlorine, ozone, and chlorine
K-8
... . . ... .
b.
C.
d.
e.
f.
9.
h.
i.
j.
k.
1.
dioxide are generally accepted disinfec- tants)? Are there back-up disinfection units on line in case of failure, and are they operat i onal ?
Is there auxiliary power with automatic start up in case of power outa e? Is it tested and operated on a n g u 9 ar basis, both with and without load?
It there an adequate quantity of- disinfec- tant on hand and is it properly stored le.g., are chlorine cylinders properly
In the case o f gaseous chlorine, i t there automatic switch over equipment when cylin- ders exp i re?
Are critical spare parts on hand to repair ' '
disinfection equipment?
abeled and chained)?
Is disinfectant feed proportional to water f 1 ow?
Are daily records kept of disinfectant residual near the first customer from which to calculate CTs?
Are production records kept from which to determine CTs?
Are CTs acceptable based'on the level o f treatment provided (see Surface Water Treatment Rule for CT values, and Sections 3 and 5 of this guidance manual for calculation of CT).
Is a disinfectant residual maintained in the distribution system, and are records. kept of daily measurements?
If gas chlorine i s . . used, are adequate safety precautions being followed e.g., exhaust fan with intake within s i x I nches of the floor, self-contained breathing apparatus that is regularly tested, regular safety training for employees, amnonia bottles and/or automatic chlorine detec- tors)? Is the system adequate to ensure
K-9
. .

2. Other.
the safety of both the public 'and the employees i n the event of a chlorine leak?
.. a. Are other .treatment processes appropriate' .
and are they operated t o produce consis- tent ly h igh water qual i ty?
.b. Are pups , chemical feeders, and other mechanical equipment i n good condition and . properly maintained? . . ,
c. A r e controls and instrumentation adequate for the process, operational, we1 1 main- tained and calibrated?
d. A r e accurate records maintained (volume o f water treated; amount o f chemical used,
e. Are adequate supplies o f chemical on hand .
, .
. etc.)?
and properly stored?
f. Are adequate safety devices available and
Sections o f a sanitary survey per ta in ing to systems c o n t a i n i n g f i l t r a t i o n f a c i l i t i e s have been omitted, as th is sect ion o f the guidance document pertains t o non- f i l ter ing systems.
precautions observed?
After water has been treated, water .quality must be protected .and maintained as it flows throu h the d i s t r i bu t i on system t o the customer's tap. The 9 ollow- i n questions pertain t o the water purveyor's a b i l i t t o ma B ntain high water quality during storage and d i s t r r bu- t ion.
1. Storage. c
a. Gravity.
1. Are storage reservoirs covered and otherwise cpnstructed t o prevent. con t ami nat i on?
2. Are a l l overflow lines, Vents, drain- l ines, or cleanout pipes turned down- ward and screened?
K-10
- .. ..
.

3.
' 4.
5.
6.
7,
8.
A r e al l reservoirs inspected regular-
Is the storage capacity adequate for the system?
Does the reservoir (or reservoirs) provide sufficient pressure through- out the system?
Are surface coatings within the res- e rvo i r i n good repai r and acceptable for potable water contact? - Is the hatchcover for the'tank water- t i g h t and locked?
Can the reservoir be iso la ted from the system?
ly?
9. Is adequate safety equipment (caged ladder, OSHA approved safety bel ts,
10. Is t he s i t e fenced, 'locked, or other-
etc.) i n place for climbing the tank?
wise protected against vandal ism?
11. Is the storage reservoir disinfected a f te r repa i rs are made?
12. Is there a scheduled program for *
cleaning storage reservoir sediments, slime on f l o o r and side walls.
b. Hydropneumat i c.
1. Is the storage capacity adequate for the systan?
2. A r e instruments, controls, and equip- ment adequate, operational # and main- s
t a i ned?
3. Are t he i n te r i o r and exter ior surfac- es o f the pressure tank i n good con- d i t ion?
-4. Are tank supports s t ruc tura l l y sound?
5. Does the low pressure cut i n provi.de adequate pressure throughout the
, en t i re system?
K-11

.- .
6. Is the puny cyc le ra te acceptable (not more than 15 cycIcs/hour)?
.
2. Cross Connections.
a.. Is the systela f ree of &norm uncontrolled cross connqctiont?
b. dots t h e u t i l i t y have a cross connection prevention program, including annual test - ing of backflow prevention devices?
"- - r r - . -
e. A r e backflow prevention devices- i ns ta l l ed a t a l l appropriate locations -(wastewater treatment plant, industrial locations, hospitals, etc.)?
3. Other.
a. Are roper pressures and flows maintained
b. 00 all construction materials meet AWWA or
a t a P 1 times of the year?
equivalent standards?
read? c. Are at1 services metered and are meters
d. Are plans for the system available and
e. Does the system have an adequate mainte-
current? - nance program?
- . ,-_ - . Is there evidence o f leakage i n t h e .
- Is there a pressure testing program?
- Is there a regular flushing program?
- Are . valves and hydrants regularly.
...-- - ~ - system?
.
exercised and maintained?
- Are AWWA standards fo r d i s in fec t i on fo l lowed af ter a l l repairs?
. - Are there specific bacteriological c r i t e r i a and l imi ts prescr ibed for new l i n e acceptance or following l i n e repairs?
K- 12

- Describe the corrosion control pro-
- 1s .the .system interconnected w i th
gram.
other systms?
. *
0 .
1. Is there an organization that I s responsible for providing the operation, maintenance, and mnage- rrcnt of the water system?
2. Does the ut i l i ty ' regular ly runaar i ra both current and long-term probleats i d e n t i f i e d i n t h e i r water- shed, or other parts of the system, and define how they intend to 'solve the roblms Le., i s their p lanning mechanism cf P ective; do they follow through with plans?
3. Are customers user fees and are col lec- t ions
4. Are there' suf f ic ient personnel t o operate and
5. Are personnel (including management) adequately' .
manage the system? .
trained, educated, and/or ce r t j f i ed?
6. Are operation and maintenance manuals and aanu- facturers technical specifications readily avail- . able for the system?
7. Are routine preventative mainten'ance schedules established and adhered t o f o r a l l 'components o f the water system? . .
8. Are sufficient tools, supplies, and maintenance parts on hand? . .
9. Are suff icient operation and maintenance records kept and readily av.ailable? .
10. Is an emergency plan avai lable and usable,. and are employees aware o f it?
11. Are a l l f a c i l i t i e s free f m safety defects?
. When the survey i s completed, it i s always preferable to b r i e f l y sumnatire the survey with the operator(s and
; management. The main f indings of the survey shou \ d be reviewed so i t i s clear that there are not misunder- standings about findings/conclusions. It i s also good
K-13
.
to thank the utility for'takin part In the survey, arran ing Interviews with clpp oyees, gathering and
. expla nfng their records, etc. The information and help which the utility can provide an invaluable to a successful survey, and every attwpt should be made to
* continue a positive relationship with the'systm.
P 9
3. A final report of the survey should be completed as soon as possible to foraally notify the system and other a encies of the findings. There is no set or necessaril best o m t for '
doin so, and the length of the report wi 1 depend on the find 9 ngs of the survey and sire of the system.." Since the report may be used for future compliance actions and inspec- tions, ,it should include as a minimum: 1) the date of the survey; 2) who was present during the survey; 3) the findings of the survey; 4) the recoamended improvements to identified problems; and 5) the dates for completion of any improvements. Any differences between the findings discussed at the conclu- sion of the survey and what's included In the flnal report should be discussed-and clarified with the utilit prior to sending out the ,final re o r t . In other words, t e utility should be fully aware o the contents of the final report before receiving it.
r 0
P K
, K-14

APPENDIX L SMALL SYSTEM CONSIDERATIONS

. . ' APPENDIX L 4
Introduetfon Under the provis ions of the SUTR, systems wi th fewer. than 500
service connections may be e l i g i b l e for an exemption. Guidance on the requirements for an exemption i s provided i n Section 9. For systems which a re no t e l i g ib le f o r an exemption, compliance with the SKIR i s mndatory. It i s recognized that the majority (approximately 75 percent) of people i n the United States are served 'by a re la t ive ly smal l number o f la rge systems. However, most water systems in t he Un i ted States are small . For small systems , compl lance with the various provi sfons o f t h e SOWA has t r a d i t i o n a l l y been a problem. Records show small systems, have a di sproport ionately higher i ncidence o f d r i n k i n g water qual f ty and mon i to r ing d i f f i cu l t ies . The'reasons f o r these d i f f i c u l t i e s can general ly be broken down into the fo l lowing three categor ies: - Economics - Treatnrent Technolo ies - Operations ( lack o qua l i f i ed personnel) 9
*
Small water systems typ ica l ly face severe 'economic constraints. Their lack of operating revenues resu l ts i n s ign i f i can t l im i ta t i ons on t h e i r a b i t i t y t o respond t o t h e r e q u i m w n t s o f t h e SDWA. These systems cannot benef i t from the economies of s ta le Clhich are avai lable to larger systems
The second d i f f i cu l t y f ac ing t he small systems has been the lack o f appropriate treatment technologies. Although methods for &ving amst o f . the contaminants known t o occur in drinking water are avai lable, many o f these technologies have only recently been scaled down for the smaller systems .
The t h i r d problem which has t r a d i t i o n a l l y plagued small systems i s the lack o f well trained operators. This deficiency i s the resu l t o f many combined f a c t o r s . F i r s t o f a l l e many o f these operators are' employed only on a part-t ime basis or i f they are employed on a fu l l - t ime basis they have a myriad of.addit iona1 duties. In addit ion, the operator 's technical

. .
background may be limited as well . thi.s results f m the low salary of the position, which is uninviting to qualified operators. Also, in spite of the requirement of retaining certified operators upheld in aany states, '
it seems to be difficult to enforce this requirement in small systems. The purpose of this appendix is to provide assistance to the Primacy
Agency in defining the problems and potential solutions typically associated with small systems. lt is beyond the scope of this document to provide an indepth dicussion o f the needs of small systems. H&ver, over the past several years the needs of the small water systems have been recognized to be of primary concern and n m & s workshops, seminars .and cmittees have been attempting to more clearly deffne workable solutions. A partial listing of the papers,' reports and proceedings which discuss problems and solutions pertaining to small systems beyond that which is possible in this manual is presented in the reference list of this appendix.
Economics One of the most severe constrdints of small systems i s the small
economic base from which to draw funds. Certain treatment and services must be provided for a conmunity regardless of .how. few people are served. Thus, as the number of connections to the system decrease, the cost per connection increases. The economic limitations of small utilitfes makes it difficult to provide needed upgrading of existing facilities or '.an adequate salary to maintain the employment of a qualified operator to monitor and maintain the system. Adding to the severity of, the economic hardships of small systems is the fact that aany of the small water systems are privately owned, with private ownership fncrtasing as system size decreases. The ownership of the plant presents difficulties 'since privately owned systems are subject to rate controls by the local public utility emission, are not eligible for public grants and loans, and may find comnercial loans hard to obtain.
Financing options for small systems include; federal and state loan and grant programs, federal revenue sharing and revenue bonds (for municipal systems) and loans through the United States Small Business Administration.(SBA) and use of industrial development bonds or privatiza-
. L-2
.. .
--F- h_
I -.

. tion (for private utilities). These .options are explained in. greater detail in the "Gu'idance Manual - Institutional Alternatives for .Small Water Systems" (AWA, 1986) . The following paragraphs will explain some existing options which may 'ease the hardship of financing smalj water treatment facilities.
The major cause of small system difficulties arises from the lack of funds and resources. It is therefore in the best interest of small uti 1 ities to expand their econqnric base and the resources a v k lable to them, to achieve the economies of scale available to larger systems.
. Regionalization is the physical or operational union of small systems to effect this goal. This union can be accomplished through the physical. interconnection of two or more small systems or the connection of a smaller system to a pre-exfsting larger system. Water supply systems can also join together for the purchase o f supplies, materials, engineering services, billing and maintenance. The. union of . the small systems increases the population served, thereby dispersing. the operational costs and decreasing the cost per consumer.
' The creation o f utility satellites is another form o f regionaliza- tion. A satel 1 ite uti 1 ity is one which taps into the resources of an .
' existing larger facility without being physically connected to, or 'bwned by, the larger facility. The larger system may provide any of the. following for the smaller system:
. .
.-
1. Varying levels ' of technical operational, or managerial
2. Wholesale treated water with or without additional services.
assistance on a cqntract basis.
3. Assuming ownership, operation 'and maintenance nsponsibflity. when the small system i s physically separate with a separate source .
The formation o f a'sateilite offers @any advantages for both the. satel 1 ite and the parent utility. These advantages include: an improved economy o f scale for satell itcs, an expanded revenue base for the parent 1"' utility, provisions of needed resources to satellites, the retention of the satellites' local autonomy, improved water quality management of the satel 1 ite, improved use o f publ ic funds for publ icly owned satel 1 it+
L-3
4
I n order to c rea te a more def in i te structure for the union of r resources o f water treatment f a c i l i t i e s , water d i s t r i c t s 0ay be created.
Water d i s t r i c t s are formed by county o f f i c i a l s and provide fir the publ ic '
ownership o f t h e u t i l i t i e s . The u t i l i t i e s i n any g i v e n d i s t r i c t would combine resources and/or physically connect systems so t ha t one or two f a c i l i t i e s would provide water for the entire distr ict. The creat ion of - water d i s t r i c t s c r e a t e s e l i g i b i l i t y f o r p u b l i c aonies, has the potent ia l for economies of s ize , fac i l i ta tes the takeover or contract & v i c e s with pub1 i c l y owned non-comnunity systems and small p r iva te ly owned' systems, and offers a tax advantage. Drawbacks include subjection t o p o l i t i c s , a strong local planning effort is needed f o r success, and competit ion with
The cent ra l i za t ion of u t i l i t i e s can be taken one step further through the creation o f county u t i l i t i e s or even s t a t e u t i l i t i e s . The government will create a board which may then act t o acquire, construct, maintain and operate any public water supply within i t s d l s t r i c t , t h e system may provide water on i t s own or purchase water from any municipal
* corporation. The board may adopt and administer rules for the construc- t ion, maintenance, protect ion and use o f public water supplies and the
. f i x a t i o n o f reasonable rates f o r water supplies. The cost of construction and/or upgrading o f f a c i l i t i e s may be defrayed through the issuance o f ..*. I=
bonds and/or property assessment. As with a l l the d l ternat ives, the . ")' IC-
creat ion of government control of t h e u t i l i t i e s has i t s advantages and disadvantages. The ' advantages, inc lude: the cwat ion o f cent ra l management, c rca t fon o f economy o f scale for u t i l i t i e s , e l l g i b i l i t y f o r public grants and loans, savings through centralized purchasing, manage- ment, consultation, planning and technical assistance, and possible provision for pool of trained operators. The disadvantages include the sub jec t i v i t y t o po l i t i cs , t he slow response caused by bureaucracy, and
-. .
' private enterp,ri ses.
\h-
- w:
, competition t o private contractors.
Treatment Technoloaiu . .
use i n small water supply systems. Recently prefabricated package plants and individual treatment units have been developed t o lessen these costs.
The high cost o f available treatment technologies has l im i ted t he i r '
L-4'

At the present time, the treatment technologies which are rvailable to enable systems to comply with the Safe Drinking Uater Act are identified to be the following: - Package plants . - Slow-sand fi lters - Diatomaceous earth filters - Cartridge filtration
A brief discussion of each treatment method is provided'below,
Clarification and filtration units which require minimal assembly in the field can now be manufactured. lo minimize required operator skill level and operational attention, the equipment should be automated.
with alarms and emergency shutdown provisions are features that safeguard water quality and should be provided for unattended plants.
EaduLmm
. Continuous effluent turbidity and disinfectant residual monitoring systems .
$1 ow-Sand Fi 1 tm Slow-sand filters are applicable to small water supply systems,
Their proven record of effective removal of turbidity and Giardia cysts makes them suitable for application where operational attention 4s minimal, Since no chemicals other than a disinfectant are needed, and no mechanical equipment is involved, the required operator skill level is the lowest o f the filtration alternatives available to small systems. 6 Diatomaceous earth (DE) pressure and vacuum filters can be used on
relatively l o w turbidity surface waters (less than 1 to 2 NTU) for removal '
of turbidity and Wardip cysts. DE filters can effectively remove particles as small as 1 micron, but would require coagulating chemicals and special filter aids to provide significant virus nmoval.
C a r t r W e Fi 1 tsrs Cartridge filters using microporous ceramic filter elements with
pore sizes as small as 0.2 uminay be suitable for producing potable water, in combination with disinfection, from raw water supplies containing moderate levels o f turbidity, algae, protozoa and bacteria. The advantage to a small system, is, with the exception of chlorination, that no other chemicals are required. The process i s one of strictly physical removal
L-5
of small par t i c les by s t ra in ing as the water passes through the porous membranes. Other than occasional cleaning or membrane replacement,. :. operational requirements are not complex and do not requi re sk i l led personnel ..+< .--.
-.-
The c r i t e r i a f o r s e l e c t i o n o f a f i l t r a t i o n technology for a small . 4.
.*L conrrnuni t y are essential ly the same as those f o r a larger cotnrnuni t y . That . c
i s , t h e u t i l i t y must f i r s t screen the complete l i s t of ' available al ternat ives to e l iminate those which are e i ther not technical ly sui ted to , the exist ing condit ions (Table 4-1) or not affordable by t h e u t i l i t y . Remaining alternatives should then be evaluated bared on both cost (capital, annual, and l i fe-cycle) and non-cost bases (operatlon and maintenance, technical requirements versus personnel available; f l e x i b i l i - ty regarding future needs; etc.). I n these evaluations it should be noted
--
that even though automated package plants are cost-competitive with 'slow sand f i l t e rs , t he i r ope ra t i on requirements t o achieve optimum performance .
could be complicated. Also, the maintenance requirements for package plants would be mechanically and e lec t r i ca l l y o r ien ted and might require . a malntenance agreement wi th the manufacturer.
measures should be taken t o ensure the del ivery of a reasonably safe water .
t o ' t h e consumers. In add i t ion to the ava i lab le in te r im measures l i s t e d i n Section 9.3, temporary i n s t a l l a t i o n o f mobile f l l t r a t i o n p l a n t s may be possible. These trai ler-mounted units are sometimes avai lable from state agencies f o r emergencies, but more often may be rented or leased from an . equipment manufacturer.
During the process o f i n s t a l l i n g t h e treatment system, in ter im -9 - I.'..
-"
zr
d i f i c a t i o n o f Exis t ina F i l t ra t i ' on S v s m - Small treatment systems that are already i n existence should comply 'I
with the performance c r i t e r i a o f the SWTR. I f the. systems are not'found t o be perfo-ming sat isfactor i ly , modif icat ions to the exist ing process may be required. * Improvement i n treatment eff iciency depends on the type of f i l t r a t i o n system i n use. Operation o f slow sand f i l t e r s c o u l d be checked for bed depth, short-circuiting, excessive hydraulic loading, and for the need t o pretreat the raw water.' I n f i l t r a t i o n g a l l e r i e s , or Sometimes, roughing f i l t e r s ahead of a slow sand f i l t e r may provide for bet ter
L-6 .

performance by reducing the sol ids load on t h e f i l t e r s . However, the design c r i t e r i a and costs for t h i s a l t e rnp t i ve have not yet been defined. S i te spec i f ic s tud ies may be required before roughing f i l ters could be used t o 'achieve compliance with the regula- t ions. Diatmaceous earth . (DE) f i l t e r s should be checked for appropriate precoat and .body feed application, hydraulic loading, grade (size) of DE being used; and possible need for chemical pretreatment. Package p l a n t s w u l d have t o be checked process-by-process, s i m i l a r t o t h e system used for a conventional plant. Other f i l t r a t i o n processes would have t o be checked fo r hyd rau l i c loading rate, appropriateness of t he f i l t e r ma te r ia l (pore s i re) , ' and possible need for addit ional pretreatment;
bistnfectian Dis in fect ion (CT) requirements f o r small systems
several dif ferent ways. The most obvious method o f d i s in fec tan t res idua l i n t he d i s t r i bu t i on system i s t o add one or more addit ional locations. An alternate nethdd i s
can Be act I n mainta inhg a
d is in fec tan t a t t o increase the
d is in fectant dose at . the ex is t ing appl icat ion po int (s) . The l a t t e r a l ternat ive, however, may increase disinfectant byproducts, including THMs, i n t h e system.
I f i t i s a re la t i ve ly shor t d is tance be tken th; 'treatment system and t h e f i r s t customer, additional contact t ime can be provided so t h a t the d is in fectant dose does not have. t o be increased beyond desirable . residuals. Two spec i f i c methods o f . increasing contact time for small systems are 1) i n s t a t l i n g 8 pressure vessel or closed storage vessel , baf f led to p rov ide adequate contact tiw, or 2) constructing a looped pipel ine, on the f in ished water l ine between the f i l t r a t i on -d i s in fec t i on system and t h e f i r s t customer. The f e a s i b i l i t y o f e i the r of these methods w u l d depend on system speci f ics that inc lude s i te , physical condittons, and cost .
IfJt i s not pract ical to provide addi t ional storage t ime to achieve the desired CT, an al ternate, mre ef fec t i ve d is in fec tan t may be used. An . a l ternate d is in fectant may provide a su f f i c i en t CT without a l ter ing the
system configuration.
. .
L-7

? QQmAiQU Water t teatment fac i l i t ies need t o be operated properly i n order to
achieve maximum treatment efficiencies. There i s c u r r e n t l y a lack of wel l trained operators at many small treatment plants. The nain cause i s lack o f awareness o f the importance 'of correct plant operation, lack of training progrdl~s, 'lack o f enforcement of the requirement for amplopent o f a cer t i f ied operator and lack o f funds t o employ such an operator,
Small systems may wish .to implement a c i rcu i t r ider /operator program. I n t h i s program a qual i f ied , cer t i f ied , experienced operator works for several water supply systems. The - r ider can e i the r d i rec t l y .
operate the plants, or provide technical assistance to ind iv idua l p lan t operators;, by act ing as a t ra ine r through on-the-job supervision. The l a t t e r would be preferable since i t could create a pool of well trained operators.
The main cause o f inadequately trained operators i s t he l ack of wel l establ ished t ra in ing programs. Un t i l such t ra in ing .programs are begun,' systems must depend on .other training wan$, such as seminars and books. One resource which may be helpfu l i n running the plant i s .yBasic Management Pr inciples for Small Water Systems - A n ' AWWA.SmalJ-Systems '
Resource Book'' , 1982 . Most package plant manufacturers' equipment manuals include at least
br ief sect ions on operating principles, methods for establ ishing proper . . chemical dosages, instruct ions for operat ing the equipment, and trouble-
shooting gutdes. An ind iv idual who studies these basic instructions and . receives comprehensive start-up t ra in ing should be able to. operate the
. equipment sa t is fac to r i l y . These services are v i t a l t o the successful performance of. a package water treatment plant and should be a requirement. of the package p lant manufacturer. The engineer designing a package plant f a c i l i t y should speci fy that start-up and training services be provided by the manufacturer, and also should consider requiring the eanufacturer t o
. v i s i t t h e p l a n t a t 6-month and 1-year in terva ls a f ter s tar t -up to ad just the equipment, review operations, and retrain operat ing personnel. Further, t h i s program should be ongoing and funds should be budgeted every year for a t least one r e v i s i t by the package plant manufacturer.
?
i
L-8

Another way for.smal1 systems to ob ta in qua l i f ied p lan t opera t ion would be to contract the services of administrative, operations; and/or maintenance personnel from a larger ne ighbor ing u t i l i ty , govsmment *. agencies, service companies or consult ing f i rms. these organizations could supply assistance i n f i n a n c i a l and legal planning, engineering, purchasing accounting :and collection services, laboratory support, licensed operators or operator training, treatment and water qua l i t y assurance, regulatory l ia ison, and/or emergency assistance. .Through the contract ing o f these serv ices the u t i l i ty . prov ides for the resources needed, improves water qual i ty management. and reta ins i t s autonomy. However, i f and when the contract i s terminated, the u t i l i t y r e t u r n s t o i t s or ig inal status.
American Water Works Association. f l P t i c . M w n t Pr inc ip les fo r Small ua te r Svst-, 1982.
American Water Works Association. D e s i D m, 1984.
Kelly, Gidley, Blair and Wolfe, Inc. .Guidance Manual - Jns t i t u t i ona l . A l t e r w i v e s for %a11 Water SYS-. A H A ,Research Foundation Contract
. .
79-84 , 1986. . .
L-9 '
I
APPENDIX M
PROTOCOL FOR DEMONSTRATION b
OF EFFECTIVE TREATMENT:

APPENDIX M
This appendi overa l l e f fec t i ve
PROTOCOL FOR DEMONSTRATION - x presents approaches which can be taken t o demonstrate removal and/or inact ivat ion o f u r d i a cysts. .
or AltcrDptt Tc- ..
Systems using a f i l t rat ion technology other than those enumerated i n the SWTR say demonstrate the effectiveness of the treatment process through p i l o t or f u l l scale test ing. As ,a miniwm, test ing should be conducted when the source exhibits i t s worst case annual conditions. Some systems say have two per iods o f 'worst case' water qual i ty including the
1 * cold water i n winter or algae blooms during the s m e r . P i l o t u n i t s should int lude the fol lowing: - f i l t r a t i o n r a t e o f t h e p i l o t system equal t o f i l t r a t i o n
r a t e on f u l l sca le un i t
'- p i l o t f i l t e r diameter greater than or equal t o 50 times
- media diameter, depth, and' size gradation should be
the media diameter, (Robeck, e t al.1959)
i d e n t i c a l t o f u l l scale,
- coagulant dosing ident ical to fu l l scale
- any mixing and set t l ing occurr ing before f i l t r a t i o n i n t h e f u l l s c a l e p l a n t should be reproduced as c losely as possible i n t he p i l o t . 'H i x inp should be o f t he same G value(s), and the detention tlan f o r s e t t l i n g should be close t o t h e average flow detent ion t ine for the pro jected fu l l sca le p lant .
According t o t h e SWTR, alternate technologies aust be capable o f meeting the same t u r b i d i t y perfonnance c r i t e r i a o f slow sand f i l t r a t i o n systems. Thus t h e f i l t e r e d water from the process should be monitored continuously or w i t h grab samples every four hours fo r tu rb id i ty . . The requirement for meeting t u r b i d i t y performance has been establ ished to
M- 1

ensure t h a t t h e r e will be no in te r fe rence o f tu rb id i ty with. v i rus inactivation through disinfection.
Following the demonstration o f m e t i n g t h e t u r b i d i t y requirements,
! -
> e. the leve l o f E ia rd ia cys t removal achieved must be determined, The,
protocol i n M.2 may be followed for t h i s demonstration. .l t? .y.
M.2 part ic le Size Analvsis O-tration for G i a M a Cv-val C r e a Part ic le s ize analys is may be used t o demonstrate the leve l of
actual Giardia cyst rernoval provided by the system. This debonstration can be done using samples from the f u l l scale plant or a p i l o t unit.
I n t h e case of e i t h e r a f u l l s c a l e or p i l o t sca le demonstration, removal o f par t ic les i n the range o f 5 t o 15 urn i n diameter should be detennined using an e lect ron ic par t ic le counter that has been ca l ibrated wi th la tex spheres. I f a l i g h t blockage device i s used (e.g. M A C ) t h i s cal ibrat ion should have been done dur ing ins ta l la t ion of the device. The cal ibrat ion should be checked before taking measurements for the purposes o f t h i s demonstration. Samples should be di luted appropriately to ensure
. tha t measurements do not re f lect co inc ident error. Coincident error resu l ts when more than one p a r t i c l e passes the detector at one time, causing an inaccurate part ic le count and diameter measurement. An e l e c t r i c a l sensing zone device (e,g. Coulter Counter or flzone) may a lso
. be used. Appropriate di lut ions, electrolyte strength, and ca l i b ra t i on procedures should be followed (these are scheduled t o be ou t l i ned i n t he 17 th ed i t ion o f Standard Methods). When using an e lec t r i ca l sensing zone instrument, an o r i f i c e no larger than 125 urn and no smaller than 40 ' u m
should be used s ince on ly par t ic les between ZS'and 40% o f t h e o r i f i c e diameter are accurately sized and counted (Karuhn e t a1 1975)
Samples ' o f t h e f i l t e r i n f l u e n t and e f f luen t should be taken ' 5
minutes a f te r the backwashed f i l t e r i s placed i n operation, and every 30 1 minutes thereafter for t h e f i r s t 3 hours o f operation, followed by hour ly
samples up u n t i l backwash (Wiesner e t a1 1987). All samples should show a t l e a s t a 2-log removal. The SWTR establishes an overall treatment
0' requirement of 3-1og Giardia cyst removal/ inactivation. Thus, dis infec-
9 .
M-2

. .
tion must be provided to supplement the particulate m v a l and met thls requirement:
Samples from repeated fi lter runs may be averaged at aach'sampl ing time, but samples should not be averaged within one filter run.
Additional suggestions on particle counting technique (Uiesner 1985) :
1) If particle counts are not determined imdiatel upon sampling (within 10 rfnutcs) samples should be di .r uted.
2) For an electrical sensing zone measurement, samples should be diluted 1:s to 1:ZO with a "partlcle-free" electrolyte solution (approximately 18 NaCl) containing 100 particles per ral or fewer.
. .. ,
3) For a light blocka e measurement, particle free water should be used to 8 ilute samples.
4) Dilutions should be done. to produce particle concentra- tions as close to the tolerance for coincident error as possible to minimize background counts.
5) Particle counts should, be determined within'8 hours o f sampl i ng .
6) All sampling vessels should be washed with laboratory detergent, double rinsed in particle free water, and rinsed twice with the water being sampled at the time . o f sampling.
The log reduction of particles in the size range o f . 5 to 15 um in size can be assumed to correspond to the log reduction o f cysts wfifch would be achieved.
M.3 m t r a t i o n for Increased Tutbiditv Allow-
Based upon the requirements of the SWTR, the minimum turbidity performance criteria for systems using conventional treatment or direct filtration is filtered water turbidity. less than or qual to 0.S'NTU in 95 percent o f the measurements taken each month. However, at the dis; cretion o f the Primacy Agency, filtered water turbidity levels of less . .
than or equal to 1 NTU in 95 percent o f the measurements taken every month
M-3
m y be p e m i t t e d 'on a case-by-case basis depending on the capab i l i t y x t he t o ta l system, t o rmove and/or i nac t i va te a t l eas t 99.9 percent
b m b l i a cysts.
!/ o f o f
Treatment p lan ts tha t use set t l ing fo l lowed by f i l t ra t ton, or d i rec t ' f i 1 t r a t i o n a r e general l y capable o f producing a f f l tered water wj th a t u r b i d i t y o f 0.2 NTU or less. The m s t l i k e l y cause of h igh t u rb id i t i es i n t h e f i l t e r e d w a t e r . i s i n c o r r e c t coagulant dosing (O'Melfa, 1974). Regardless o f the t u rb id i t y o f the raw or f inished water, coagulant add i t i on a t some p o i n t p r i o r t o f i l t r a t i o n i s r e q u i r e d t o I e s t a b i l i z e p a r t i c l e s f o r reatoval i n t h e f i l t e r . Only plants documenting continuous coagulant feed p r i o r t o f i l t r a t i o n should be e l i g i b l e for being allowed h i g h e r f i l t e r e d water turb id i t ies than the 0.5 NTU requircment. A t plants that continuously feed coagulant and do n o t m e t t h e 0.5 NTU requirement, a se r ies o f j a r t es ts , and perhaps sand column f i l t r a t i o n t e s t s ( i n batch) should be performed t o evaluate the optimum coagulant dose f o r t u r b i d i t y remov a 1 .
I n t h e event that plants can document continuous coagulant feed, and, af ter running the p lant under conditions deteimined i n batch' test ing t o be op t ima l f o r t u rb id i t y removal, s t i l l do not wet the 0.5 NTU requirement, e f f e c t i v e f i l t r a t i o n s t a t u s may still be appropri.ate. This would fur ther be supported i f i t can be shown t h a t t h e f u l l t c a k p l a n t '
i s capable of achieving a t leas t a 2-109 reduction i n t h e concent,ration of pa r t i c l es between 5 and 15 urn. i n size through part icle size analysis as out l ined i n Section M.2.. Where a f u l l scale plant does not yet ex is t , appropr iately scaled-down p i l o t f i l t e r s might be used f o r such a demons t r a t i on. -
The level of d is infect ion could a lso be considered f o r determining when t o al low a h igher turb id i ty performance c r i t e r i o n f o r a system. For example, if a system achieves 3-109 Giardia cyst inactivation through dis infect ion, as determined by CT values, it may be appropriate t o allow h igher f i l tered water turb id i t ies (i.e., greater than 0.5 NTU but less than 1 NTU i n 95 percent o f t h e measurements and never exceeding 5 NTU).
. .
M-4

. .
The expected leve l of fecal . contamination and Giardia cyst concentrations i n the SOuKe water should, be considered i n the above analysis, High levels of disinfection (e.g., 2 t o 3-109 inac t i va t i on o f Giardia cysts), i n a d d i t i o n t o f i l t r a t i o n which achieves less than 0.5 NTU i n 95 percent o f the anasunments nay be appropriate, depending upon source water qual i ty. Further guidance on the leve l o f d i s i n f e c t i o n t o be provided for various source water conditions i s provided i n Section 4.4.2. . I n al l cases the minimum d i s i n f e c t i o n t o be provided must supplement t h e par t i cu la te removal t o ensure a t l e a s t a 3-log f j s t rmov- al f inact ivat ion.
References American Public Health Association; American Water Works Association; Water Pollution Control Federation. ' tandard Methods for the m i n a t i o n gf Water and Wastewater, 17th ed. (stfpplennt), September 1989.
Coulter Electronics 600 W . 20th Street, Hialeah, FL 33010-2428
Karuhn, R.; Davies, R.; Kaye, B.; Clinch, M. Studies on . the Coul ter Counter Part I . Powder Technology Volume 1 I , 'pp. 157-171, 1975.
O'Melia, C. The Role of Po lye lec t ro l y tes i n F i l t r a t i on Processes, €PA - 67012-74-032, 1974.
Robeck, G.; Woodword, R. L. Pi lo t P lan ts f o r Water Treatment Research, Journal of Sanitary Engineering A X E Vol, 85;SAl; 1, August 1959.
Wiesner, M. "Optimum Water Treatment Plant Configuration Effects o f Raw Water Character ist ics," d issertat ion John Hopkins University, Baltimore, MD, 1985.
Wiesner, M.; Rook, 3. 3.; Fiessin er, F. Optimizing the Placement o f GAC F i l t e r s , J . AWWA VOL 79, pp. 39-4 1 , Dec 1987.
M-5

APPENDIX N
PROTOCOLS FOR POINT-OF-USE DEVICES

ef fectiveners of new technologies as well U point-of-use devicer. The evaluation presented here deals w i t h the removal of pad’culater and . disinfection. In u e a s which pertain to disinfection, the guidelines contained in Appendix G take precedence.
..

CONTRSTS
PREFACE
3. MICROBIOLOGICAL WATER PURIFIER TEST PRodDURES
APPENDIX N-1 SttMMARY FOR BASIS Of STANDARDS AND TEST WATER PARAMETERS
APPENDIX N-2 LIST OF PARTICIPANTS IN TASt FORCE
APPRUDIX N-3 RESPONSE BY REVIEW SUBCOMMITTEE TO PUBLIC COMMENTS .
N-1
N-6
N-8 '
N-21
N-29
N-31
.

I
. .
Registration Division Office of Pesticide Programs
Criteria urd Standards Division Office of Drinking Water
GUIDE STANDARD AND PROTOCOL FOR TESTING MICROBIOLOGICAL WATER PURIFIERS-
UNITED STATES ENVIROMllff3TAL PROTECTION ACEN&
Report of Task Force Submitted April, 1986 Revised April, 1987

1.1 Introduction
..
. . 1. GENERAL - .
The subject of microbiological purification for waters of unknoun micro- biological quality repeatedly presents itself to variety of governmentaf and non-governmental 8goncietr consumer groups, manufactu;ers and others. Exam- '
ples o f possible application of such purification capabilitioi tdclude: - Backp8ckerr and campers
- Non-standard military requirements
- Floods and other natural disasters
- Foreign travel and strtions (howver,'not f o r extreme contamination situations outside of the U.S.)
- Contaminated individual sources, wolls and springs (however, not for . the conversion of waste water to microbiologically potable water)
- Motorhomes and trailers
Batch methods of water purification based on chlorine and iodine disfn- fection or boiling are well known, but miny situations and personal choice.
. call for the consideration of water treatment equipmenet. Federal agencies rpocifically involvod in responding to questions and. problems relating to microbiological purifier equipment include: - Registration Division; Office of Pesticide Programs (OPPI, Environ-
mental Protection Agency (EPA), registration of microbiological purifiers (using chemicals) ;
- Compliance Monitoring . Staff, EPA.3 control of microbiological purifier device claims (non-registerable products such as. ultra- violet units, otonators, chlorine generators, others);
- 'U.S. Army Medical Bioengineering Research and Development Laboratory (USAMBRDL) , U.S. Army Natick Resoarch and' Development Center and other Army and military agencies: .research 8nd development for possible field applications;
- Criteria and Standards Division, Office of Drinking Water (ODWI, ' .
&PA: Consideration of pofnt-of-use technology as acceptable teeh- . ,
nology under the Primary Drinking Water Regulations: consumer information and service;
N- 1

. i
- Drinking Wator Roioarch, Wator Enginooring Rosoarch Laboratory
- Microbiology Wanch, Hoalth Effocts Resoarch Laboratoky ( H E W , PA; t WZRL), SPA; rosponrible for water treatment tochnology rosoarch;
responsale for s tudy of health otfocts related t o drin~cing water * ~
f i l torr . -- .;;7"1
A nuubor o f reprosontativos of tho h v o mrntioned agoncies provided .-- .I
atcollent participation i n tho task form t o dovolop microbiological tosting . - .-.
protocols for wator purffiors. Major participation was also .provided by the
following: -.
"-
, - A tochnical roprosentativo from tho Wator Quality Associ8tiont
- A technical r0prOSentatiVO fro&! tho &WironmBnta1 Hoalth Center, Department of Health and Welfaro of Canadat .nd
0 ~n associate professor (microbiology) from tho Univorsity of . Arizona .
1.2 Basic Principles 1.2.1 Definition
0 As set for th ' in EPA Enforcement Strategy and a8 .upport0d by a Federal
. Trade Commission (FTC) decision (PTC v. S i b c o Products Co. , In& , e t al., NOV. 22, 1965) 0 a u n i t 0 i n order t o bo called a microbiological water purifier0 must ramovo, k i l l or inactivate 'a11 type; of disease-causing micro-' organisms from t h o water, including bacteria, viruses g d protozoan cysts 80
as t o tender the pmcesrod water safe for drinking. Thorofore, t o qualify, a
microbiological water purifier.Pnrst troat or romove a11 types of challenge organisms t o moot spodfiod standards.
&. ,
-r*- -u i
VL .I..
* -. ,^
. 1.2.2 General Guide Tho stwdard and protocol w i l l be a goneral guide and, i n m o m cases, may
present only the minimum features and framework for teating. While baoic features of tho standard and protocol have bien testod, it was not feasible to
' conduct full-flodgoc¶ tes t ing for a l l possible types of wit#. Consequently, .' protocol users should include pre-testing of the i r units in a testing rig,
including the sampling tochniquos t o bo used. Where users of the prototol ' find good reason t o a l t e r or add t o tho guide i n order t o meet specific .
operational problems, t o ,use i n alternate organism or laboratory procedure, or '
t o respond t o innovative treatment un i t s without decreasing the level of
.f

testing or altoring the intont of the protocol, they 8hould feel freo to dc . to . For u t ~ h 8 the OPP Registration Division rnight find it necessary t o mend the guide roamwhat for different types of treatment units. Another example would bo u l t ~ a v i o l o t (U.V. 1 units, which puy have specific =.quire- ments in addition t o t h e guide protocol.
1.2.3 Performance-Based The standard wi1.1 be perfonamce-based, u t i l i z ing raa l i s t ic worst case
challenges and test conditions and uso of the ttandaxd aha11 risult in water qual i ty equivalent to that of a public water rupply meting the microbiological requirements' and intent of the National Primuy Drinking Water Regulations.
1 . 2.4 Exceptions . A microbiological water purifior must remove, kill Or inact ivate a l l .
types of pathogenic organims i f claims are made for any organism. However, an exception for limited claims may be allowed for units ramoving specific organisms to serve a definabli environmental need (i.e., cyst reduction units '
which can be used on otherwise disinfected and microbiologically safe d r ink ing
water, such as a disinfected b u t unfiltered surface water containing cysts. such units are not to be called microbiological water purifiers and should not'
. be used as sole treatment for M untreated raw water.) 1.2.5 Not t o Cover Non-Microbiological Reduction Claims The treatment of water t o achieve removal of a specific chemical or other
non-microbiological substances from vator will not be a par t of this standard.
National Sanitation Foundation (NSF) Standards 42 (Aosthetic~Effects) and 53
(Health Effocts) provide partial guides for chemical removal and other clair&
testing. 1.2.6 Constlvction and Information Exclusions While the standard recommends safe, responsible construction of units
w i t h non-toxic materials for optimum operation, 811 Ach items and associated operational considerations are excluded as being beyond the scope of .the standard. Included i n the exclusion are materials of construction, electrical and safety aspects, design and ' construction details, operational instructions
.and information, and mechanical performance testing. 1.2.7 Research Needs Excluded
N- 3
. .- I
Tho w i d e r t m d u d and protocol must reprosont a practical tenting ' program and not includo resoara. reconm!tOndationr. For .xmrple, considerauqp . of mutant orgdmnu or d ~ f o r o n t i a t i o n betuoon fnjurod urd dead orp.niim; . ' would bo resoarch it- a t this tima and not appropriate for inclusion in the -.c * .
rturdard. . A*- *.
1.2.8 Not t o Conrider Sabotage - *
Esoteric problems which could bo prosonted by a variety of hypothetical .., - *. . -
tOmri8t (Or W e h ) 8ituation8, W l d ~ m i d ~ UI UXlnOCe88&w ' - q l i C a t i o n , and aro not appropriate for lnclurlon in tho standard.
1.2.9 Continuity Tho guide rtandard and protocol w i l l be a l iving docur#nt, subject to
revision and updating w i t h tho onset of now tochnology and knowledge. It is recamended that ' tho responsible authori t ies for registration and drinking wator quali ty review potential noods every two to. three years and .reconvene the task force upon need or upon request from tho water quality industry, to nviow and updato tho standard and testing protocol. .
1.3 Treatment U n i t s Caverage ' 1.3.1 Universe of Possible Treatment Uni t s
A review of treatment units that might be considered as microbiological ' purifiers discloses a number of difforent types covoring treatment principles
ranging from f i l t r a t i o n and chunical disinfection to ultraviolet l i g h t ra-
. .
diation. 1.3.2 Coverage of This Standard In view o f the limited technical data available and in order t o m i t e
, tho work o f the task force, the i n i t i a l coverage i s l b $ t o d , on a pr ior i ty basis, t o threo basic types of microbiological watc'r pur i f ie rs or act$ve components w i t h their principal means of action as follows:
1.3.2.1 Ceramic Fi l t ra t ion Candler or Units (may or may not contain a chemical bacteriostatic agent)
Fil tration, and adsorption, urd chdcal anti-microbial activity i f a chemical i s included.
1.3.2.2 Halogenated Resins and U n i t s
N-4

Chemical disinfection kid possibly f i l t ra t ion . (Notot While not .hcluded i n this guide ,rt.nd&d, halogen product8 for disinfection or . y s t e u usfng halogen addition and f ine f i l t ra t ion m y be tested wing' a m y of its.
elements, io'.. 8 t e s t water p a r . ~ ~ t e r s , microbiological c h a ~ e n g o and reduction requircl~unts, analytical techniqudr and othor pertinent elements.)
. .
1.3.2.3 Ultraviolet (Wl U n i t s
W irradiation w i t h possible add-on treatnwnt for adsorption and f i l t r a - tion (not applicab1e t o w units for t r i a t i n g potable water from public water .upply 8 y S t O M ) 0
1.3.3 Application of Principles t o Other Units ail. only throe types of units are covered i n this standard, the princi-
ples urd approaches outlined should provido UI fn i t ia l guide for tho testing of any of a number of other types of units .nd/or systunr for the .micmbiplog- ical purification of contrminat?d water.
b.
N-5

2. PERFORMANCP: REQUIREMENTS
9
$. 2.1 nicrobiological Water Purifier In order to make the claim o f wmicrobiological water purifier," units
. must be tested and demonstrated tomeet the microbiological reduction require- e.. - S I : '
nmnts of Table 1 according to the test procedures described in Section 3 -,. .
(Appendix N-1) for the.specific type of unit involved. I
.-
2.2 Chemical Health Limits Where silver or sonbe o h m pesticidal chemical is used in a unit, that
chemical concentration in the effluent water murt w e t m y N&tional Primary Drinking Water M a x i m u m Contaminant Level (MCL), additional Federal guidelines . or otherwise be demonstrated not to constitute a threat to health from con- sumption or contact where no HCL exists.
2.3 stability of Pesticidal Chemical Where a pesticidal chemical is used in the treatment unit, the stability
of the chemical for disinfectant effectiveness should be sufficient for the potential shelf 1ife.and the projected use life of the unit based'on manu'fac- turer's data. where stability cannot be assured from historical data and' information, additional tests will be required.
2.4 Performance Limitations 2.4.1 Effective Lifetime The manufacturer must provide an explicit indication or assurance of the . I
unit' I effective use lifetime to w a r n the consumer of potential diminished treatment capability either through:
a. Having the unit terminate discharge of trehted water, or
b. Sounding M alann, or
c. Providing simple, explicit instruction for servicing or replacing units within the reconmended use life (measurable in tarnu of volume throughput, specific time frame or other appropriate m e t h o d ) .
2.4.2 Limitation on Use of Iodine
N-6
. EPA policy initially developed in 1973 and reafiimed i n 1982 (memo of
March 3 , 1982 from J. A. Cotrwo to C. A. Jones, subject: aPolicy on Iodiriq
Disinfection") is that iodine dis in foc t ian i s acceptable for short-term or limited or emergency use but that it is not reco8mnd.d for long-trnn or routine cormunity water rupply application where iodine-containing species may remain i n the drinking water.
8
N-7

3.1 Purpose These tor t8 a re performad on coramic f i l t r a t ion candlos or units, halo-
genatod resins and units and ul t raviolet (W) units in odor to .&stantiate thoir microbiological tomoval capabili t ies over tho offoctive use l i f o of tho
pur i f ior as defined i n Tablo 1 and, whero a pesticidal, chomical is usod, t o determine that ra id chomical is not prosent in the offluont.-at oxcessive levols (soe Soction 3.5.3.4, Appendix #I ,
3.2 Apparatus Three production u n i t s of a typo a r e t o be tested, simultaneously, i f
feasible: othemise, i n a manner as similar t o that as possible. '
Design of the tes t ing rig pus t paral le l and simulate projected field use- conditions. For plumbed-in units a guide for design of the test rig may be taken from "Figure 1: Test Apparatus-Schematic" (p. A-2 of Standard Number 53
"Drinking Water Treatment Uni t s -- Health Effects," National Sanitation Foundation) Otherwise, the t es t r i g must be designed t o simulate f ie ld use
. conditions (worst case1 for the u n i t t o be testod.
3.3 art Waters -- Non-Microbioloiical Parameters . ., I n addition to the microbiological influent challenge8,'the various test '
waters will be constituted w i t h chemical and physical characteristics as f O l l o w 8 :
9
3.3.1 Test water 11 (General Test Water) '
This water is intonded for tho normal non-stressed (non-challenge) phase of tes t ing for a l l un i t s and shall have smcific characterist ics which may easily be obtained by the adjustment of many public mystam tap waters, as follaws:
' a m . It sha l l be free of any chlorine or other disinfectant residual;
b. pH -0 6..5 - 8.5;
C. Total Organic Carbon (Iy)(=) 0.1 - 5.0 W / L t
d. Turbidity 0.1 - 5 W U ;
I
3 i XfCROBIOL6C;ICAL WATER PURIFIER TEST PROCEDURES
N-0

e. Twperatura 20 C . S C; and
f. Total Dissolved Solids (TDS) SO - SO0 lag/&.
3.3.2 Test Water 42 (Challenge Test Water/Haloqen Disinfection) This water is intended for the rtrassed challenge phase of tasting where
units involve halogen di8infeCtantS (halogen resins or other units) and shall have the following specific characteristics:
a. Free of chlorine or other disinfectant residual;
b. (1) .pH 9.0 .2, and -
(2) for iodina-based units a pH of S.0 - .2 (current information indicates that the low pH will be the most savera test for virus reduction by iodine disinfection);
t c. Total Organic Carbon (TOC) not less than 10 mg/t;
d. Turbidity not less than 30 "v;
e. Temperature 4 C 1 C; and
f. Total Dissolved Solids ( T D S ) 1,500 mg/L - 150 mg/L. 3.3.3 Test Water I 3 (Challenge Test Water/Ceramic Candle
or Units With or Without Silver Impregnation)
This water is intended for the stressed challenge phase of testing for 'the indicated units but not for such units when impregnated with a halogen disinfectant (for the latter, use Test Water Y21. It shall have the following specific characteristicsr
a. It shall be free of any chlorine or other disinfectant residual:
b. pH 9.0 - .2; c. Total Organic Carbon (TOC) -- not .less than 10 mg/~;
d. Turbidity -0 not less than 30 "U;
3.3.4 Test Water #4 (Challenge Test Water for Ultravfoiet Units) This water is intended for the stressed phase of testing for t'v units and
shall have the following specific characteristics:
N-9
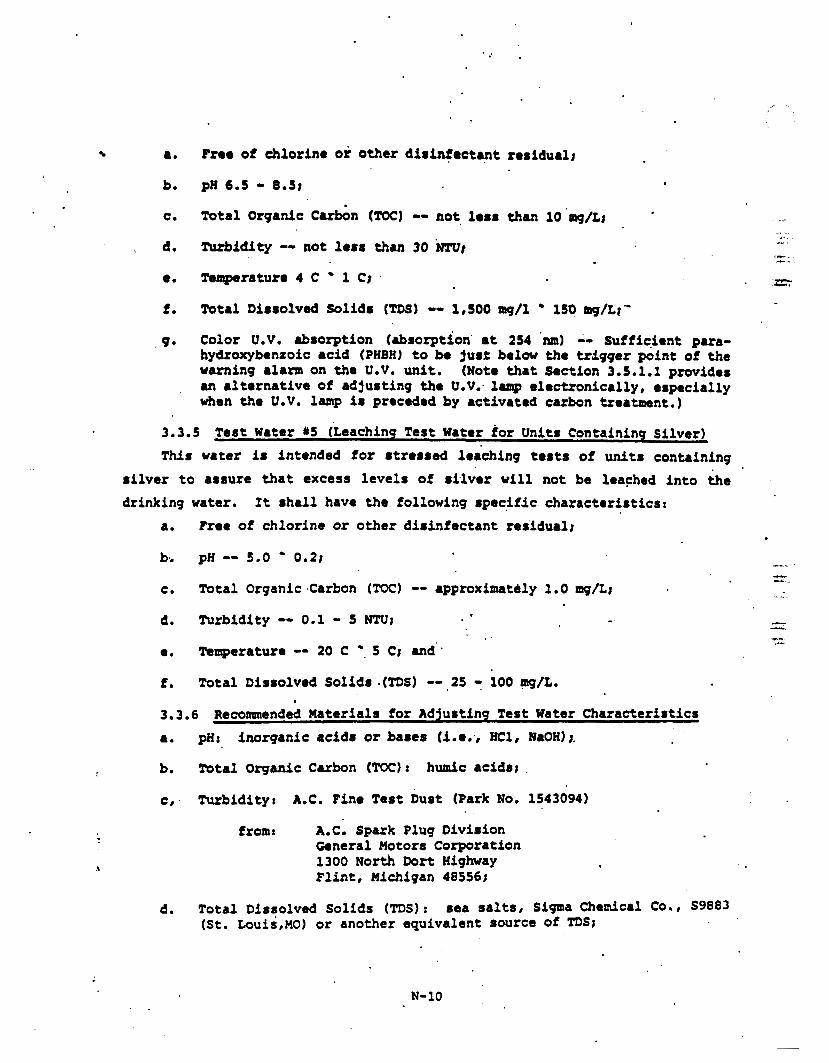
a. Pne of chlorine or other disinfectet residual;
, 9 . Color U.V. absorption (absorption' a t 254 ' n m l 0- Sufficient para- hydroxybenzoic acid (PHBH) t o be jus2 below the trigger point of the warning alarm on the U.V. unit. (Note that Section 3.5.1.1 provides an alternative of adjusting tho U . V , . l u n p electronically, especially when the U.V. lamp is preceded by activated carbon treatment.)
3.3.5 Test Water WS (Leaching Test Water for Uni ts Containing Silver) Thfr water i s intended for stressed le8ching tests of u n i t s containing
silver to assure that excess levels of s i lver w i l l not be leached i n t o the drinking ra te r . It shall have the following specific characteristics:
a. Free of chlorine or other disinfectant residual2
b.. p H -0 5 . 0 0.2; - - .
C . Total Organic Carbon ( T o t ) -0 approximat4ly 1 .O q / L ;
d. Turbidity -0 0.1 - 5 N T v t -. - - e. Temperature 0- 20 C ., 5 Ct and *
- u_
I. - .
. . c.. c
f. Total Dissolved Solids .(TDS) 0- 25 - 100 -/La
3.3.6 Recoxanended Materials for Adjusting Test Water Characteristics a. pU: inorgani c acids or bases (i .e.', E l , NaOH) ;.
b. *tal Organic Cubon (TOC) : humic acidst .
c, Turbidity: A.C. Fine Test Dust (Park No. 1543094)
e
from: A.C. Spatk Plug Division General Motors Corporation 1300 North Dort Highway F l i n t , Michigan 48556;
d. Total Dissolved Solids (TDS): sea salts , Sigma Chemical Co.* S9883 (St, Louis,MO) or another equivalent source of TDS;
N-10

e. ' color U.V., Absorption8 p-hydroxybenzoic acid (grades general purpose reagent).
3.4 Analytical Uethodr -
3.4.1 Microbiological Methods ' Methods i n this section are considered "state-of-the-art" a t the time of
its preparation and rubsequent improvements should be expected. Wethods used for microbiological analyses 8hould be coah t ib l e vith and equal t o or better than those given below.
3.4.1.1 Bacterial Tests
a.
b;
C.
d.
Chosen Organismr Klebsiella terriqena (ATCC-33257).
Method of Production: Test organism w i l l be prepared by overnight growth i n nutrient broth or equivalent t o obtain the organism i n the stationary growth phase (Reference: Asburg, E.D., Methods of Testing Sanitizerr and Bacteriostatic Substances Inx Disinfection, Ster i l izat ion and Presenration, Seymour S. BlocJc, ed., pp. 964-980, 1983). The organism w i l l be collected by centrifugation and washed three times i n phosphate buffered saline before use. Alternatively, the Organisms may be grown overnight on nutrient agar slants 'or equivalent and washed from the s lan ts w i t h phosphate 'buffered saline. The suspensions should be f i l t e red through s t e r i l e Whatman Number 2 f i l t e r paper (or equivalent) to remv'e any bacterial clumps. New batches of organisms must be prep,arcd daily for -use i n challenge testing.
State of Organism; Organisms i n the stationary growth phase and suspended i n phosphate buffered saline w i l l be used.
Assay Techniques: Assay may be by the spread plate, pour pla te or membrane fi lter technique on nutrient agar, M.F.C. or *Endo medium (Standard Methods for the Examination of Water and Wastewater, 1 6 t h edition, 1983, APHA). Each sample dilution w i l l be assayed i n - t r ip l ica te .
3.4.1.2 V i r u s Tests a. Chosen Organisms: Poliovirus type 1 (LScl (Am-VR-SO) , and Rota-
.
virus Strain SA-11 (ATCC-VR-899) or WA (ATCC-VR-2018).
b. Method of Production: A l l stocks should be grown by a m c t h o d described by Smith and Gerba ( i n Methods i n Environmental Virology, pp. 15-47, 1982) and gurif ied by the procedure of Sharp; e t al. (Appl. Microbiol. , 29:94-101 , 1975) , or rfmilar procedure (Bennan and Hoff, Appl. Environ. Microbiol., 481311-323, 1984) as these
. methods w i l l produce largely monodispersed virion particles.
N-11

C. J
2. d.
State of * the Organism Preparation procedure w i l l largely produce monodispersed particles.
Assay Techniques: Poliovirus type 1 may be grown i n the M;M, HA-104 or other cell l ine which w i l l nrpport the grwth of this virus. The rotaviruses s u e best grown i n the M-104 cell lfne. Since both viruses CM be assayed on the MA-104 ce l l l ine , a chgllenge t e s t may consist of .qual amounts of both v i r y e r as a mixture (i.e., the mixture must contain at least 1.0 x 10 /a of each virus) Assays MY be as plaque forming units (PFU) or as frPPrunofluotescence foci (IF) (Smith &d Gerba,~ In: Methods i n Environmental Virolopy8 pp. 15-47, 1982). Each dilution w i l l b. assayed i n Wpl ica te .
a.
I .
b.
C.
d.
3.4.1.3 Cyst Tests . Chosen Organism
1. Giardia famblia o r the related organism, Giardia = t i s , may be used as the challenge cyst.
2. where f i l t r a t i o n i s involved, t e s t s with 4-6 micron spheres or part ic les have been foyd t o be satisfactory and may be used as a substitute fo r t e s t s of occlusion using live organisms (see Table 1) . Spheres or particles may only be used t o evaluate filtration efficacy. Disinfection efficacy can only be evalu- ated w i t h the use of viable Giardia cysts.
Method of Production: Giardia muris may be produced i n laboratory mice and Giardia lamblia may be produced i n Mongolian gerbils; inactivation results based on excystation measurements correlate, wll w i t h animal infactivity results. '
State o f the Organism: Organisms may be separated from fecal material by the procedure described by Sauch (Appl. Environ. nicrobiol., 48:454-45fr 1984) or by the procedure described by Bingham, e t a l . (Exp. Puasi tol . , 47~284-281, 1979). *
Assay Techniques: Cysts u e first 'reconcentrated (300 ml. , m i n i m sample size) according to the method of Rice, Hoff and Schaefer (Agpl. Environ. Microbiol., 43c250-251, 1982). The excystation method described by Schaefer, e t 8l. (Trans. , Royal Soc. of Trop. Mod. L Hyg. 78r795-800, 1984) shall be used t o evaluate Giardia
method described by Bingham and Meyer (Nature, 277,301-302, 1979) or Rice and Schaefer (J. Clln. nicmbiol. , 14: 709-710, 1981) shall be used, Cyst viability may also be determined by an assay, method involving the countinq of trophozoites as well .as intact cysts (Bingham, e t al., Exp. Parasitol., 478264-2918 1979).
- mtis cyst viability., For Giardia lmb l i a cysts, the excystation
3.4.2 Chemical and Physical Methods
N-12

~ l l physical .nd chomical analpus shall be conducted in accordance w i t h procedures in Standard Method8 for the Examination of Water and Wastewatei, 16th Edition, American Public Health At80ciationr Or equivalent.
3.S Test Procedure8 3.5.1 Procedure - Plumbed-in Units A. 1. Install three production units of A type as i n Figure 1
and condition each uni t p r ior to the Wart 0 s . the tes t i n accordance w i t h the manufacturer's instructions w i t h the tes t . water without the addition of the test contaminant. Measure tho flaij ra te through each unit. The unit 'shall be tes ted a t the maximum system prossure of 60 ps i9 r t a t i c and flow rate will not be artif icially controlled. -
2. Test waters s h i l l have the defined characteristics continuously except for t e s t waters 2, 3 and 4 w i t h respect t o turbidi ty . The background non-sampling turb id i ty level w i l l be maintained a t 0.1-5 NTU bu t the turb id i ty shal l be increased . t o the challenge level of not less than 30 NTU i n the following . manner I
- I n the "on" per iodb) p r ior to the sampling "on" period.
- I n the oampling "on" period when the sample actually w i l l be taken. (Note: a t l ea s t 10 u n i t void volumes of t h e 30 NTU water shall pass through the unit prior t o actual sampling so as to provide adequate seasoning and un i - fomlty before sample collection.) .
b. 1. Use appropriate techniqu'es of dilution and insure continual mixing t o prepare a challenge solution containing the bacterial contaminant. Then spike test water continuously w i t h the influent concentration specified in Tabla 1. .
2. Use appropriate techniques t o prepare concentrated virus and Giardia 8uspensions. Food these usp peas ions into the I n f l u e n t stream 80 as t o achieve the influent concentrations specified i n Table 1 i n the following manner:
- I n the "on" period (I;) prior to the sampling "on" period.
- I n the sampling "on" period when the san@le actually w i l l be taken. (Note: a t loast 10 unit void vo1um.r of seeded water shal l pass through the u n i t prior t o sampling so a s ' t o provide adequate seasoning and uniformity before sample' collection.)

c. Rug0 tho 8yStom of' the uncontaminated water w i t h a sufficient flew of con tdna tod test water. S ta r t an operating cycle of 10 p.rcent '
o n r 90 percont off w i t h a 15 t o 40 minute cyclo (marqplo; 3 minutes on, 27 P3nut.r offJ w i t h the contu8inrt.d test water. This cycle shall be continuod for not more than 16 hours pot day (Plfn-innrm daily '
rost period of 8 hours). Tho t o t a l program +hall extend t o 1001 of - ortinrated volume capacity for halogenated resins or units and for
1
.10-1/2 day8 for ceramic candles or unit8 and U.V. units.
d. Sampling: Samples of influent urd offluent water a t the specified sampling points shall bo collect& as shown W l w , for the various unftr; these are minima aunpling plans w h i c h m y be increased i n number by tho investig+tor. All srmples +hall bo collected i n duplicate frob the flowing water during tho sampling "on" portion of the cycle and they shall be one "unit void volume" i n quantity (or of appropriate quantity for analysis) and* toprosent worst care challenge conditions. Effluent 8rmph8 shall usually be collected near tho middle of the sampling "on" period (or the whole volume during one "on" poriod) urcept for samples following the specified "stagnation" periods, for which 8ampling shall be. conducted on the first water volume out of the unit. Each runple w f 11 be taken in duplicate and sha l l be rotained and appropriately preserved, i f required, for chemical or microbiological &nalyris i n the event verification i s required. (For units where the volume of a single "on" period i s insufficient for the required analysis, samples from successive "on" periods may be accumulated u n t i l a sufficient volume has been collected.)
1 (a). Sampling Plan: Halogenated Resins or Units '(Non-iodine Based)
Test Point (I of Estimated Capacity)
s t a r t 25% 50%
After 48 hours stagnation
Tests Active
Test . Influent Agent/ Water Background Residual Hlcrobiological
General X X X X X x X
- .
X X
60% Ch.1- X X 75% ' lenge . X x
100% X
After 48 hours PH - c stagnation 9.0 0.2 X X X
l ( b ) . Sampling Plan: Iodinated Resins o r UnAts
... .
i ---. .*
N-14

Test Point Torts
Active (% of Estimatod Test Capacity) - Water
Influent Agent/ Background Residual HicrobloIoqical
S t a r t Genoral X X 25% X 50% X
Aftor 48 hours stagnation X
60% Chal- 75% lenge
stagnation 9.0 - 0.2 After 48 hours PH -
X X X X
X X
90% Chal- X 100%
X X
x
lenge X After 40 hours PH -
stagnation 5.0 - 0.2 X
2. Sampling Plan: Ceramic Candles o r Units and U.V. Units
Test Point
Start Day 3 (middle)' Day 6 (middle) After 48 hours
stagnation
Tests Test Influent Wa t e r Background
Goneral x - Microbiological . .
X X X
1 x
Chal- lenge
Day 7 (middle) Day 8 (near ond) - x After 48 hours
stagnation X Day 10-1/2 X
(Note: All days are "running days" and exclude stagnation periods. When the units contain s i lver , a leaching test shall be'conducted as shown i n Section 3.5.1.e and silver residual will be matured a t each microbiological 88npling point . 1
X '
N-15
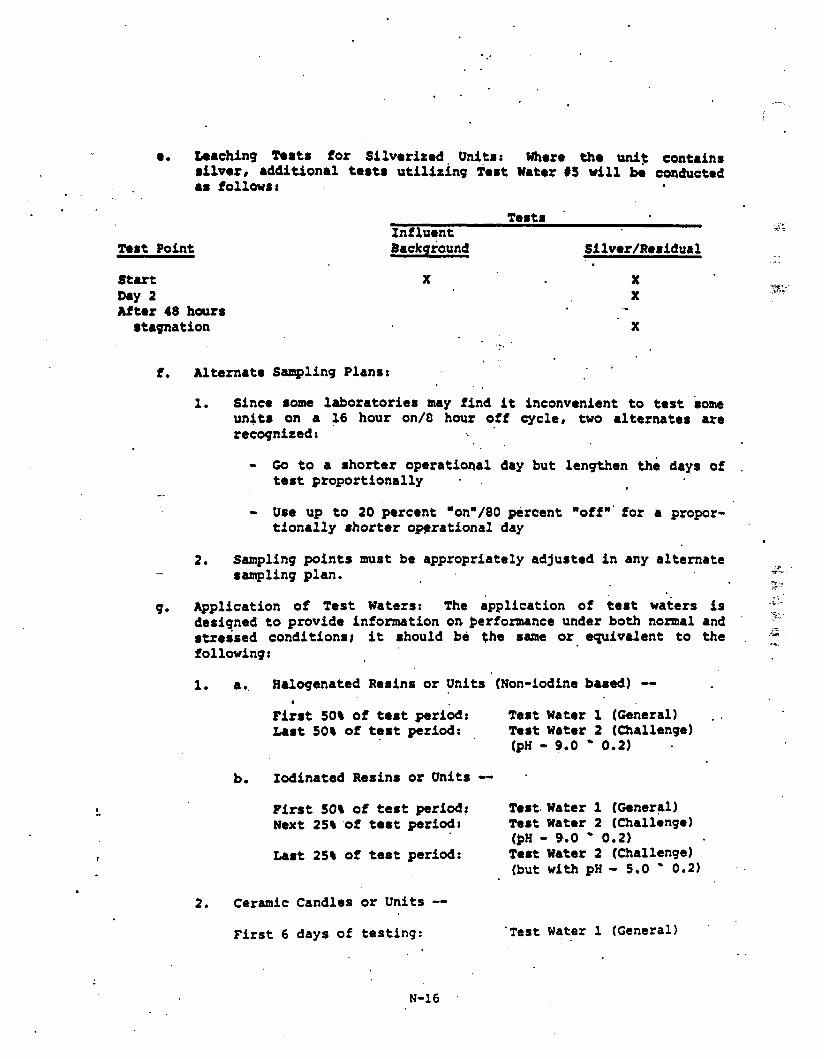
. . . .
,--
e. Lmching Tests for Silverized. Units: where the w i g contains silver, 8dditional tests utilizing Test Water #S w i l l be conducted 88 fO11OWS8
Test Point
stut D.r 2 After 48 hours
stagnation
Tests Influent Background Silver/Residual
.-
X
. . fi ternate Sampling Plans:
1. Since some laboratories may find it inconvenient t o t e s t some u n i t s on a 16 hour on/O hour off cycle, two alternates are recognized:
. .
- Go t o a shorter operational day but lengthen the days of . test proportionally . .
- Use up to 20 percent "on"/80 .percent "off"' f o r a propor- t ionally shorter omrational day
2, sampling points must be appropriately adjusted i n any alternate sampling plan. cs*
Application of Test Waters: The application of t e s t waters i s .I _-
designed t o provide information on performance under both normal and '
stressed conditionsr it should be the same or equivalent to the .
following:
'8 . ? ' * A*
-r.s
.- . ZL
..5"
.*a
1
1. a, Halogenated Resins or Units (Non-iodine bared) -0
* First 50% of t e s t period: Test Water 1 (General) . k s t 50% of test period: . Test Water 2 (Challenge)
(pH - 9.0 * 0.2)
b. Iodinated Resins or Uni ts - First 50% of test periodz Test, Water 1 (General) Next 25% ,of t e s t period: Test Water 2 (Challenge)
Last 25% of t e s t period: Test Water 2 (Challenge) (PH 0 9.0 0.2)
(but W i t h pH 5.0 - 0 .2 )
2. Ceramic Candles o r Units 0-
First 6 days of testing: 'Test Water 1 (General) '
N-16 .

.
h.
i.
j.
k a t 4-1/2 days of testing: Tort Water 3 (Challongo)
3. Ulttaviolot (U.V.) Units - - F i r s t 6 days of tostingr Tort Water 1 (General) k s t 4-1/2 days of . tes t ingr Tor t Water '4 (Challenge)
Analyses and monitoringr
1.
2.
3.
4 0
5.
60
Xicmobiological suqpling ana analysis shal l b. conducted of the spocifiod influent and offluont sanqling p o i n t s during 8aCh ' ,
indicatod sampling pariod.
Tost Water Monitoring: Tho spocified purmoters of tho various t o r t waters (rea Section 3.3) will be measured and recorded a t each microbiological sampling point; the specifiod parameters will be measured a t l e a s t once on non-sampling days when tho units uo being operated.
Background chemical analyses of influent watbr shall bo CMI- ducted a t l e a s t once a t the s t a r t of each t e s t perfad t~ determine the concentration of tho U.S. EOA primary inorganic contaminants, secondary contaminants and routine water para- meters, not otherwise covered i n the described test waters.
I n addition, quality assurance testing shal l be conducted for the seed bacteria under environmental conditions on the first and l a s t days of tes t ing to make sure that there is no rignifi- cant change over the tes t day. Populations w i l l be measured (for oxample, as dispersed i n the supply tank) a t the beginning and ond of the t e s t day to detect possible incidental effects such as proliferation, dio-off, adsorption to surfaces, otc. Rolatively stable bacterial seed populations u o ossential .to an acceptable test program.
when a ,unit contains a halogen o r silver, the active agent rosidual will be nmasured i n the effluent at each microbiologi- cal t o r t (sampling) point.
Silver will additionally be nnasured three timts i n the efflu- en t as specified i n Section 3.5.1.0. . 8
Neuttalization of Disinfection Activity! Immdiately after col- lection, oach t o r t sample must be treatod to neutralize residual disinfectant. For halogrn- and silver-bared disinfectants this may be don. by addftioh of thioglycollate-thiosulfate neutralizer solution (Chambers, e t al. , J . Amor. Water Works Assoc. f4:208-216, 1962). This solution should be propared daily. A l l results are invalid unless .8amples are neutralized immediately upon collection.
Special Provisions for Ceramic Candles or Units :
.

1. provi r ions for rlow flow: Ceramic unfts m y be rubjoc t t o clogging and g roa t ly nducod f l ow mor tho t o r t priod. An attempt should be made t o maintain * manufrcturor ratod or claimid flow t.t.8, b u t -On 8t reducod flaw8 the suapl ing
. program set f o r t h i n Section 3.S.l.d.2 s h a l l bo maintiinod.
2. Cloaning of coramic u n i t 8 8 Unitr should be cloaned According t o ~ u n u f a c t u r o r ~ s d i r o c t f o n s . hro cloanings rhould occur dur ing the period of test ( i n order to provo the uni t ' s durabi l i ty through tho clo.ning procoduro). HOWVO~, n o u t h e timo of microbiological suapling, tho units should not be c loanod un t i l after tho sampling. Further, JW .&ti-microbial chunical (for cloaning or sanitizing) may be 8pplied to the units e i n g - t h o t o r t period unloss tho manufacturer specifios tho same as part of routine maintenarm.
k. Halogenated u n i t s or U.V. u n i t s w i t h mchanical f i l t r a t i o n p r o c e s s o r repara to f r o m tho microbiological d i s in foc t ion canrpononts shall havo '
tho mochanical f i l t r a t i o n components replacod or serviced whon s i g n i f i c a n t flow roduction (clogging) occurs i n accordance w i t h the manufac turer ' s ins t ruc t ions in order t o maintain tho tes t flow rat.. Units w i t h non-renrovablo mechanical f i l t r a t i o n components w i l l be run u n t i l flow i s bolow that considered accoptable for consumer . convenionce. (If promature clogging presents a problem, soma spec ia l i zed un i t s may raqui re a custamizod tes t plan.)'
1. Special Provisions for Ul t r av io l e t (U.V.1 Units:
The u n i t s w i l l be adequatoly challenged by the prescribed test. waterst consequently they w i l l bo operatod a t normal in t ens i ty . However, where the U.V. t roatment component is preceded by act ivated carbon t roatment , the output of t h e U.V. lamp sha l l be adjus t& e lec t ronica l ly , such as by reducing the cur ren t t o ' , t h e lamp or other appropriato mOan.8 t o be j u s t ' abovo the alarm . point . This opt ion shall be ava i l ab le for use under other U.V. configurat ions, a t the choice of the persons rasponsibla for t o s t ing , 8s an a l t o r n a t i v o to M a use of tho U.V. absorbent, p=hydroxybonoic acid.
2. Fail/safer Units w i l l provide and w i l l be t o s t ed for f a i l / s a f e warnings in the evont of water q u a l i t y changes or equipment failures which may i n t e r f e n w i t h its microbiological pu r i f i ca - t ion funct ion.
' 3. Cleaningr mnufacturer ' s guidanco w i t h rospec t t o c l ean ing w i l l be followed.
3.5.2 .Procedure: Non-Plumbed Units a. General: The basic procedures given in Section 3.5.1 s h a l l be used
with necessary adaptations t o allow for the specific design of the
N-18

-.
b.
unit.. I n any evont, tho t es t ing pm'codums shal l provide a' t o s t challenge equivalent t o those for plrtnrbod-in units.
Tort conditions and apparatus should be rdapted t o nflect proposed or actual use conditions i n consultation vith the mmtrfacturer, including flw ra t e and number of pwple t o be sorved per day. I n some u s e s ou i8b le flow or other non-stuadud conditions may be necessary t o r e f l ec t a worst-ease test .
r . -
- .
q..,
3.5.3 Acceptanco and Rocords . . 3.5.3.1 - TO qualify as a microbiological water purifier, a11 three production
units of .a type must continuously meet or excoed- the reduction requinments of
Table 1, within 812Wsble ar#arureaunt tOlOranCeS for not more' than ten percen't of influent/effluent 8-18 pairs, defined as follows:
Virus 2 one order of magnitude Bacteria : ono order of magnitude cysts r one/half order of Mgnitude
3
The geometric moan of a l l microbiologica1 reductions must'mset or exceed , the requirements of Table 1. An example is given as follows:
' - Unit: iodinated resin.
- Number of sample pairs over the completed t e s t program:
- Number of arlowable Samph pairs where log reduction is b s u f f i - .
- Allowable mikmun log reductions in these 3 pairt:
10 per unit - 3 units 30.
cientr 101 of 30 - 3 sample pairs.
, Bactoria - 5 log c - Virus - 3 log - cyst - 2-1/2 log
- Conclusion: If the geometric man of a l l reductions meets o r . exceeds the requirements of Table 1, the indicated i n s u f f i c i e n t
sample pair8 w i l l be allowed.
3.5.3.2 Records
N-19

All prtinent pmcodUr8S.~d data shall ba recorded in a standud f0-t and retained for possible +*vi- until the report 'of results has h e n corn- pletely accepted by review au'thorities, in no case for lass than a year.
3.5.3.3 Scaling UP or Down
Where a manufacturer has several similu units using the saw basic technology and puallel 6struction urd opmration, it may sometimes be .
. appropriate to allow the test of one unit t o ba considered representative of others. Where any 8erious doubt ucists, all units of wuiaus 8izes m y require testing. A "rule of three" i s SUggOSted as a matter of judgment. Scaling up to threa times larger or on-third, based on the s i t e of either the test unit or o f its operative e ~ k n t , may be illoued. ot ow aver, for W'unftsr m y size rcale-up must be accompanied by a pual l e l increase in radiation dose .
.-
3.5.3.4
Where silver or some other chemical i s used in the unit, concentrations a in the effluent water must meet m y National PrLnrry Drinking 'Water Maximum
Contaminant Level ( M C L ) , additional Federal guidelines, or otherwise must not constitute a threat to health where no M C L exists.
N-20

APP-IX N-1
SVMMARY FOR BASIS OF STANDARDS AND TEST WATEk PARAMETERS
A. Microbiological Reductibn Requirements
1 . Bacteria
Current 8tandards for the nricrobiologiul safety of drinking ,-~ water are based on the pterence of coliform bacteria of which ' 3fzs<
Itlebsiella i s a d e r . n(lLIPbers of the genus Klebsiella u a also potential pathogens of m& (Vlassof, 1977) . IUebsiella terrigena i s . designated &s the t es t 0 r g . n i S m sin- it is complonly found i n surface waters (Izmd, e t a l e 1981). .:" - .
jl. iW-3 I
t*li
~xperience with the use of colifona bqcteria to estimate the presence of enteric bacterial pathogens i n dr inking water as per-
. fonmd over the l a s t 75 years indicates a high degree of reliabil- i ty. Requirod testing of more than one bacterial. pathogen appears unjustified since viral and Giardia testing will be required. Enteric viruses and Giardia are known to ba more resistant t o cOmmOn
' disinfectants than enteric bacterial pathogens and viruses are more . _ . res i s tan t to runoval by treatments such as f i l tration. Thus, any
treatment which would give a good removal of both virus and Giardia pathogens would most likely .reduce enteric bacteria below levels considered infectious (Jarroll, e t al . , 1981; Liu, e t a l e , 1971).
me cvcrn t ra t ion of coliform bacteria i n raw sewage is approx- imately 10 /lo0 ml. Cgncentrations i n polluted stream waters have been found t o exceed 10 per 100 E d (Culp, e t al., 1978, Table 10).
Based on the over 10 /lo0 m l concentrations obsemed in highly polluted stream water and a target effluent concentration of less
5
. than 1/100 ml, a 6 log reduction i r recommended. . 2. . virus
I n the United Stafes goncentrations of enteroviruses are ellti- mt8d to range from 10 -10 / l i t e r i n raw revage ( F u r a h a d Schaub, 1,971) Based on this observation it i,s 8Stfmat8d thas' natura3 waters contaminated w i t h raw sewage may contain from 10 to '10 enteric viruses per l i t e r .
There are currently no 8tandardr for viruses i n dr inking water i n the United States. However, EPA 'has proposed a non-enforceable health-based recommended maximum contaminant level (RMCLI of zero for viruses (EPA, 198s). Several individuals and oiganizatfons have developed guidelines for the presence of viruses i n dr inking water '
and various experts have proposed rtandards (WHO, 1979, 1984; Berg, 1971; Melnick, 1976). It has generally been fe l t tha t dr inking
. .

water should bo fro. of infoctious virus rinco oven on. virus is potontially infoctious and maggettod 8tAndardS u o l u g o 1 y based on tr'chnological limits of our dotoction methodology. Cufdolines mggosted by t h o World Hoalth Organization (1984) and othe'rs rocom~~end tha t volumes t o bo tosted be i n tho ordor of .100-1,000 liters and that viruses bo &brant i n thoso volumes.
h & n g a t u g o t r f f l u o n t ' l o v o ~ o f l t r s thrn,ono virus i n 100 l i t o r s of wator and a concontration of 10 mtoric viruses i n 100 tors of sowage-contunimted wators, tho' water purifior units should achiovo a t l o a r t 4 log8 of virus romoval, .-
Tho relativo resistance o f , enter ic v i r u s ~ ~ to d i f for rn t dis- infoctants vuios great ly among the onteric virutos and oven among mombers of the same group ( i . e . , ontiroviruses). For oxamplo, while f2 coliphage is one of tho most rosisturt virus08 ' to inactivation by chlorine it is on. of the most ruscept ibh to inact ivat ion by 020ne (Huakoh and Butler , 1984). Ionic conditions and pH can also affect the relativo rosistance of different virusor to a disinfectant (Engolbrocht, o t &lor 1980). On this 'basis it is f e l t t h a t mote than on. onteric virus rhould bo tosted to onlure t h e efficacy of any disinfoction rystem. Poliovinri type 1 (Strain LSc) was choson as one of the test viruses because it has boen extonrively used . i n disinfection and environmental studies as roprerentative of the enterovirus family. It is rocognizrd that it i s not the most res is tant vi rus ' to inact ivat ion by chlorine, b u t is still resis tant enough to serve as a useful indicator. Rotavirus is 8eleCted as the second test onteric virus since it represents another group of enteric viruses i n nucleic acid composition and size. It is also a major cause of viral gastroenterit is . and has been documented as a cause of water borne gastroenteritis (Gerba, ot a l . , 1985). The human rotavirus or the similar S M a n rotavirus may be used i n the tes t yocodure. A net +log reduction f o r a jo in t challonge of 1 x 10 /t each for poliovirus and rotavirus i s recoamended.
3. Cysts (Protoaoan) I
Over the past several years, giardiasis has consistently been 0110 of the most frequently roported waterbotno diseases t ranht t ted by drinking water i n the United States (Craun, 1984). EPA has proposed a RMCL of zero for Giardia (EPA, 198s). Its occurrence has gonorally boon associatod w i t h treatment deficiencies including ei ther inadoquato or no filtration. Giardiasis has not boen known t o occur f r o m drinking water produced by well-operated f i l t r a t ion treatment plants. Do Walle, o t 81. (19841, i n a rtudy of f i l tration treatment plant efficiencies, cited percent removals for Giardia i n p i lo t plant tests as follows:
- Rapid f i l t r a t i o n w i t h coagulation-sedimentation: 96.6-99.'9%;
- Direc t f i i t ra t ion w i t h coagulation? 9S.9-99.9Q.
N-2 2

?rem . t h i s rosearch and f r o m tho lack of Giardia casos i n rystoms whoto ~ 3 0 q ~ a t o f i l t r a t i o n u t i r t 8 8 1 +log (99.911 nduction requiromnt i s consldored t o be consorvativo and t o provide 8 coaparable level of 'protrction for wator pui i f iors to . ' a wll-oporated f i l t ra t ion t reatment plat . '
Data on environmental lovels for cysts i n natural waters 1s 1Lnit.d bocauso of tho diff lcul t ios of sampling and analysis. Unpublished data indicate vory low lwols from loss than 1/L t o l e s s than 1O/L. Won a 3-1- nduction Wotlld pkvido UI offluont o f less than 1ll00 1?8 Compurblo t o th0't.comwnd.d virus d u c t i o n roquire- montr.
1985) 8 may bo used aq tho chalkengo organism. Tosts w i l l be con- ducted w i t h a challonge of 10 organfrms por l i t e r f o r a 3-log roduction.
Whore the treatment unit or component for cysts is based on the principle of occlusion filtration alono, to s t ing for a 3-1- reduc- tion of 4-6 micron particles or spheres (National Sanitation Founda- t i on Standard S3? as an oxample) is acceptable. Difficulties i n the cyst production and measurement technologies by lesser-equipped laboratorios may require the use o f such alternative tests where applicable.
8. Microbiological Purifier Test Procedures
1. Test Waters
a. The general t o s t water ( t e s t wator #I) i s designed for the nonnal, non-stressed phase of testing w i t h characteristics that may oasily be obtained by the adjustmont of many public system tap waters.
4
b. Test wator #2 is intended for the rtretsed phase of t o s t ing whore units involve halogen disinfoctants.
1. Sinco t h o disinfection activity of some hafogens f a l l s w i t h a r i s ing pH, it i s important t o stross t o s t a t an elevated pH. The reconmended levo1 of 9.0 * 0.2, while exceeding the recannuended secondary lovol (Environmental Protoction Agencyr 1984) i s still w i t h i n a range seen i n some natural waters (Environmmtal Protoction Agency, 1976). However, for iodine-based un i t s , a 8ocond o t r e s s - f u l condition is . provided -- a pH of. 5 .O - 0.2 since current infonnation indicates that tho disinfection act ivi ty of iod ine f a l l s wi th a low pH (National 'Research Council, 1980). While beneath the recoxanended secondary level (Environmental Protection Agency, 19841. a pH Of 5.0
. . N-2 3

i s not unusual in natural waters (mvironlnenta1 Protection Agency, 1976).
.a. organic matter as total organic carbon (Tot) is known to Interfere with halogen disinfection. while this mc is higher than levels in many natural waters, the designated concentration of 10 q / L is cited AS typical in stream waters . (CulpFJesner/Culp, 1978) .
3. High concentrations of turbidity can shield nricroorganihs '
aid interfere w i t h disinfection. While'the recomended level of not less than 30 NTU is in the range'of turbidi- ties m e n in secondary wastewater effluents, this level is also found in many surface' waters, especially during periods 'of heavy rainfall and snow melt (Culp/Wesner/Culp, 1978).
C.
4. Studies with Giardia cysts have shown decreasing halogen . disinfection activity w i t h lower tunperatures (Jarroll, at a1. , 1980); 4 C, a coumon low temperature in many natural waters, is recornmsnded for the stress test.
5. The Mount of dissolved solids ( T D S ) may impact the disinfection effectiveness of units that rely on displace- *
able or exchange elements by displacement of halogens or resins, or it may interfere with adsorptive processes. While TDS levels of 10,000 mg/L are considered unusable for drinking, many supplies with over 2,000 mg/L are.used. for potable purposes (Environmental Protection ,Agency, 1984) . The recommended level of 1,500 mg/L represents a realistic stress challenge.
Test water 13 is intended.for the stressed phase of testing of ceramic filtration candles or units with or without silver impregnation.
1. Since viruses are typically eluted from adsorbing media at high pHs (Environmental Protection Agency, 1978) it may be concluded that a high pH will provide the most stressful testing for a ceramic-type unit; consequently, the high natural water pH of 9.0 is recommended.
a
2. -pert opinion also hold8 that. organic material will interfere w i t h adsorption of viruses. Thus, a high total organic carbon ' level of not less than 10 m g / ~ is recpm- mended.
3. Turbidity may enhance the entrapment 'and removal of. microorganisms but it also may stimulate "short- circuiting" through some, units. A turbidity level of 30 NTU will provide stress at time of sampling but the
5-24

i
non-sampling leve l o f 0.1-5 NTU w i l l allow routino opera- t i o n of uni t s . .. . .
4. Export opinion holds that low wrtor tunperatures and high TDS would most l ikoly i n t e r f o r r w i t h virus reduction by . adsorption; consequently , 8 4 C temperature and 1,500 mg/L TDS are recomendod.
j . - . _
4 - c .
d. Test w r t e r , # 4 i s intondod for tho stressed phase of t o s t i n g f o r u&t rav io lo t (W) units.
1. In gonrral , high Toc, turb id i ty and TDS and' lw teutpora- turo aro consfdored most s t r r s s f u l for W , 'md the in- dicptod challongo lovols 8re the 8s for t o r t water 02.
2. The pH is n o t c r i t i c a l and miry range f r o m 6.5 t o 8.5.
3. In order t o test the W u n i t s 8t their most vulnerable s t age of operation, 8 color challenge ( l i g h t absorption a t 254 run) is t o bo maintained 8t 8 l e v e l where w l i g h t i n t e n s i t y is j u s t above the u n i t ' s low in t ens i ty warning . alarm point. Howevor, an 8ltern.t. t o the absorption challenge i s provided through adjusting the l i g h t in tens i - . t y ou tpu t of the W lamp e lec t ron ica l ly by reCucing
. cur ren t t o the lamp, or o the r appropriate means, t o be j u s t above the alam poin t t this approach would be par t icu lar ly necessary where the W lamp is preceded by act ivated carbon treatment.
e. Test water 05 is intended for the stressed leaching tests of u n i t s c o n t d n i n g s i l v o r . Low pH, TOC, t u rb id i ty , and TDS and higher temperature are f e l t t o be the charac te r i s t ics assoc i - ated w i t h increased loachabi l i ty . The reconmended pH of 5 .O * .2, whi le 'being beneath the roconanended secondary range of 6.S-8.S (Environmental Protection Agency, 1984) is still found i n some na tu ra l waters.
2. Test Procedures c
Tho plan for t e s t i n g and sampling is dosigned to reveal u n i t performance under both "normal" and "stressed* operating conditions. The stressed phase would u t i l i z e a ret of water qua l i t y and opera- t i ons cond i t ions t o g ive the u n i t s a realistic worst case challenge. Tes t ing p lans for a specific model might involve modifications t o the recommanded plan1 more samples*could be taken and analyzed; more uni ts could be studied. The p r inc ip l e of demonstrating adequate performance even under realist ic worst case conditions should be . maintained and the f i n a l s e l e c t e d test procedures should be agreed . as between inves t iga to r s and reviewers or regulators .
. . N-25 '
milo 8oIne aspicts of tho tosting procoduros havo boen U t i l i 2 . d i n .actual U p e r h n t S , tho proposed protocol ha8 not boon verifiod or utilitod for tho various units that my be considerod. Conte- quently, invortigatorr urd usors of thir protocol MY find reasons to altor sane aspects through their practical mxporioncet needed *
changes should bo discussed and cleuod w i t h involvod rrviowerr/- - regulators.
p

REFERENCES:
Berg , G. Integrated approach to the problem of vinrses in water. J . ASCE, 5 Sanit. Eng. Dive 971867-882, 1971.
CulplWesner/Culp. Guidance f o r planning the location of water 8upply intakes downstre- from municipal wastewater treatnwnt fac i l i t i es . EPA Report, Office of Drinking Water. Washington, DC, 1978.
Craun, C. F. 1984 . Waterborne autbroaks of giudiasisr Current status. In: Giardia and qiudiuis. D. L. Erlandsen urd t . A. neyer' Eds. , .,Plenum Press, New York, pp. 243-261, 1984. - DeWalle, P. E.: J. Engeset: Lawrence, W. R w v a l of CPardia lamblia cyst by drinking water treatment plants. .Report No. EPA-600/52-84-069, .Office of Research and Development, Cincinnati, OR, 1984.
Engelbrecht, R. S., e t al . Comparative inactivation of viruses by chlorine. Appl. Environ. Hicrobfol. 40r249-256, 1980.
Environmental Protection Agency. Quality cri teria for water. Washington, X, 1976. ..
Environmental Protection Agency. National secondary drinking water regulations. EPA-570/9-76-000, Washington, DC, 1984.
Environmental Protection Agency. National primary drinking water regulations; synthetic organic chemicals, inorganic chemicals and microorganisms; Proposed rule. Federal Register, Nov. 13, 1985.
Farrah, S. R., and S. A. Schaub. Viruses i n wastewater sludges. In: Viral Pollution of the Environment, G. Berg, Ed. CRC Press, Boca Raton, Florida'. pp. 161-163, 19830
Gerba, C. P.: Rose, J. B.: Singh, S. N. Waterborne gastroenterit is and v i ra l hepatitis. CRC Cri t ical Rev. Environ. Contr. 15:213-236, 1985.
Harakeh, M.; Butler, X. Inactivation of human rotavirus, SA-11 and other enteric viruser in e f f l u e n t by disinfectants. J. Ryg. C a b . 93r157-163, 1984.
Hoff, J. C.: Rice, E. W.: Schaefer, F. W. Comparison of animal infectivity and excystation as measures of Giardia muris cyst inactivation by chlorine. Appl. Environ. Microbial. 50:1115-1117, 1985.
fzard, D.1 Farragut, C.:Gavini, F.; Kerrters, It;; DeLey, J.; k c l e r c , H. Klebsiella terrigena, a new species from water and soil. I n t l . J. Systerbitic Bacteriol. 31:116-127, 1981.
Jakubowski, W. Detection of Giardia cysts i n drinking water. In: Giardia . and Giardiasis, Erlandsen, S. L.; Hcycr, E. A. Edo., Plenum Press, NY. pp. 263-286, 1984.
N-27

. .
. .
Jarroll, E. L.; Bfngham, A. K.; Weyer, E. A. Giardia cyst destruction: Effectiveness of six mall-quantity water dirhfection methods. kn. J. Trop. M . 6 . 2918-11, 1980
. Jarroll, E. L.; Binghm, A. X.; Weyer, E. A. Effect of chlorine Qn Giardia cyst viabil i ty. Appl. Environ. nicrobiol. .43:483-487, 1981.
L i u 8 0. c., et al. Relative resistance ef 20 hwmn enteric viruses to free - chlorine i n PotoMc River water. Procoedings of 13th Water @al i ty Conference
Snoeyink, V.; Griffin, V. E d 8 0 8 pp. 171-1998 1971.
eln nick, J . L. Viruses i n water. In: Viruses in water erg, G.; Bodily, H. L.; Lennotte, E. H.; Welnick, . J . L.; Wetclaf T. G., fdo. Arner. R ; l b l i C Hlth. ASSOC., Washington, DEI pp. 3°11,'1976.
National Research Council. The disinfection of drinking water, I n t Drinking Water and ~ o a l t h , Volumo 2. Washington, DC, pp. SO1378 '1980.
National Sanitation Foundation. Drinking water treatment unitsr Health effects. Standard 53. Ann Arbor, MI, 1982.'..
Vlassoff, L. T. R.lebsie1la. In: Bacterial Indicators/Xealth 'Hazards Associated w i t h Water Hoadley, A. W.; Dutka, E. J . , Edr. American Society for Testing and Materials, Philadelphia, PA. pp. 275-208, 1977.
world Hoalth Organization. Human Viruses i n Water, Technical support Series 639, World Health Organization, Geneva, 1979.
World Health Organiiation. Guidelines for'Drinking Water Quality. Volume 1.. Recommendations. World Health Organization, Geneva, 1984.
N-28

LIST OF PARTICIPANTSr TASK FORCE ON GUIDE STANDARD AND PRoTocoL FOR b TESTING MICROBIOLCCICAL WATER PURIFIERS - ' .
Stephen A. Schaub, Chaimm 0- 0.S. Army Medical Bioengineering Research and , '.
Develment Laboratory (USAHBRDL) 8 ,Fort: f h t r i d r r mryland 21701, FTSZ .t j!
8/935-7207 -0 m: 301/663-7207. "? . ,. ,p.-.
rrt.
Frank A. Ball, J r . , SeCtetUy -- Ctiteria .nd Standards DiViSion, Office of Drinking Water (WH-550) 0 Environntental Protection Agency; Washington, "
D.C. 20460, Phone: 202/382-3037.
Paul Berger, Ph.D. -0 Criteria and Standards Division, Office of Drinking .
Water (WH-SSO), Errvironmental Protection Agency, Washington, D.C. 20460, Phoner 202/382-3039.
ut cas t i l lo -- Disinfectants Branch, Office of Pesticide Programs (TS-767C0, Environmental Protection Agency, Washington, D.C. 20460, Phone: 703/557- 3695 e
Ruth Douglas -0 DiSinfeCtMtS Branch, OffiM of Pesticide Programs (TS-767C), Environmental Protection Agency, Washington, D.C. '20460, Phone:, 703j557- 3675.
A 1 Dufour -- Microbiology Branch, Health Effects Research Laboratory, Environmental Protection Agency, 26 W. St . C l a i r Street, Cincinnati, Ohio 45268, Phones FTS: 8/684-7870 -- Commr f13/569-7870.
Ed Geldreich -- Chief, Microbiological Treatment Branch, Water Engineering Research LabOratoZy, Environmental Protection Agcncy, 26 W. St. Clair Street, Cincinnati, Ohio 45268, Phone: f i S : 8/684-7232 -- corn: 513/569-7232.
Charles Gerba -- Associate Professor, Department of Microbiology and Imunology, University of Arizona, Tucson, Arizona 85721, Phone: 602/621-6906.
John Hoff - Microbiological Treatment Branch, Water Engineering Research . Laboratory, ' Environmental Protection Agene, 26 W. St. Clair Street, Cincinnati, Ohio 45268, Phone: FTS: 8/684-7331 -- Corn: 51WS69-7331.
Art Kaplan -0 Office of Research and Development (RD-681) Environmental Protection Agcncy, Wamhington, D.C. 20460, Phone: 202/382-2583.
' Bala Krishnan -- Office of Rasearch and Devalopmant (RD-681) hvironmcntal Protection Agency, Washington D.C. 20460, Phoner 202/38&2583
John Lea -- Disinfectants Branch, Office of Pesticide Programs (TS-767C)
3- 29
.
. . Environmenfal Protection Agency, Washington, D.C. 20460, Phone: 703/557-3663 . .
Dorothy Portner -0 Dirinfect8ntr Branch, O f f i c e of Pes t ic ide Programs (TS-7674) 0 Environtnentil Protection Agency, Washington, D.C. 20460, Phone: 703/557-0484.
Don Reasoner - Wcrobiologic.1 heatnwnt Branch, Water Engineering Reseuch Lrboratory, Eaviromenta1 Protect ion Agency, 26 W. St. Clair S t r e e t , Cincinnati, Ohio 45268, Phone: 312/654-4000.
P. Regunthan (Regu) -- Everpure, Inc. 8 660 N. Blackhawk Drivo, WGrtmont , I l l i n o i s 605f9, Phone: 312/654-4000.
David Stangel -- Policy and h a l y r i r Branch, O f f i c a of Compliance Honitoring, Environmental Protection Agency, Washington, D.C. # , Phone; 202/382-7845.
Richard Tobfn 0- Monitoring and Criteria Division, Environmental Health Center, Department of Health and Welfare of Canada, Tunnay's Pasture, Ottawa, Ontario, K I A OLt, Canada, Phones 613/990-8982.
N-30

. APPENOIX N-3 .. . c .. - RESPONSE BY REVIEW SUBCOMMITTEE TO PVBLIC COHMENTS ON GUIDE STANDARD. :. AND PROTOCOL FOR TESTING MICROBIOLOCICAL WATER PURIFIERS
. *
A. Recommendation for the use of Giardia l.mblia cysts as a replacement for Giardia muris cysts as the ptOtOZoan cyst tes t organisms.
Recoannendationt
The subconrmittk concurs w i t h tha recoummndation md fur ther endorses the use 02 Giardia lanblia as the preferrod cyrt test for evalua'tion of a l l ' treatment u n i t s and devices. Obviously the use of the protozoan orga- nism 'of actual health concern i n testing is most desirable. Anyone f inding the Giardia lamblia s t r a i n feasible for testing and cost- effective to work w i t h is encouraged t o use same instead of Giardia muris -
8. Substitution of 4-6 micron bead or par t ic le tes ts as an alternate option instead of the Giardia cysts for evaluating devices that rely strictly on occlusion filtration for microbiological removalr Several cornenters criticized the use of beads or particles (e.9.. A.C. fine dus t ) and recommended only use of live Giardia cysts for performance.tests.
Discussion:
The subcolnmittee recognizes and favors the use of the natural human *
parasite, Giardia lamblia, bu t was not aware of any convincing sc ien t i f ic data which would disallow the optional use of testing w i t h beats or part ic les for u n i t s or devices using only occlusion f i l t r a t ion t o remove microorganisms. Previous development of the National Sqnitation Standard. (NSF) S3 (1982) requirement for cyst reduction (using 4.6 micron parti- cles as cyst models) was based on engineering and scientific opffjon and . experimental evidence a t t h a t time. Specifically, Logsdon used radioactive cyst.models i n the in i t ia l phase of a study of removal efficiencies for diatomaceous ear th f i l ters ; subsequent experiments'with Giardia muris cysts confinned the eff cy of the d i omceous earth f i l t e rs . Further studies by Hendridcs and De'WalletH w i t h Giardia lamblia cysts 8180 showed comparable reduction efficiencies for diatomaceous ear th f i l t e rs .
\5?
l .S .A. Schaub; F.A. Bell, Jr.; P. Berger; C. Gqrba; J. Roff; P. Regunathan; and R. Tobin. [Includes additional revision pursuant t o Scientific Advisory Panel review (Federal Insecticide, Fungicide, and Rodenticide Act) . I
.+-.
=#?'
N-3 1 .
Subsoquently confinu8to& para1101 tost ing rosul ts havo &on devoloped vir-a-vis 4-6 microb par t ic lor as coraparod t o Giardia lamblia cysts. Specifically, two n i t s l i s t o d by 'NS? for cyst rrduction (using 4-6 a c r o n p a r t i c l o r ) (" h a w also beon testod .nd l i t f f d for 100% officioncy ,
roductbn (using Giardia lamblia cysts) by Hibler :
1. ntorpure Model QC4-SC 2. Royal Boulton Hade1 F303.
Again we prefor tho US. of the human pathogon? Ciudia lunblia; howver, no urporimontal data has boon providod rogardfag tho lack Qf val idi ty or of failure i n provious tests u t i l i z ing boada or h i c l e s of 4-6 mic6ns. In most cases tho bacterial or vi ra l challongos to occlusion f f l tors ill ropresent a groater problem in terms of laictobiological reduction roquiromcrnts than w i l l cysts. Therefore, without substantiation of deficiencies, the use of 4-6 micron beads or part'iclos i s considered t o bo as foasible as tho US. of l i ve cysts for routino porformanco tosting of' water filtration (occlusion) devices.
: Rocomendation I
Reconmend retaining the optional use of 4-6 micron particles or beads for cyst reduction tosting in occlusion f i l tration dovices only.
References:
(3 1
Logsdon, G . S., o t al . Alternative Fil tration Methods for Removal of Giardia Cysts and Cyst Models, JAUWA, 73(21111-118, 1981.
Logsdon, G. S.: Hondricks, D. W.? o t al. Control of Giardia Cysts by Fi l t ra t ion: The Laboratory's Rose. Prosonted a t tho AWWA Water Quality Technology Conferenco, &comber, 1983.
DeWalle, o t a1. Romoval of Giardia lamblia Cysts by Drinking Water Treatment Plants, Grant No. R806127, Report t o Drinking Water Research Division, U.S. EPA (ORD/HERL), Cincinnati, QUO.
National Sanitation Foundation, Listing of Drinking Water Treatment Units, Standard 53. May, 1986.
Hiblor, C. P. An Evaluation of Filter8 i n the Removal of Giardia lamblia. Water T~ChnOlOgy, pp. 34-36. July, 1984.
C. Alternato assay techniques for cyst tests (Jenson) : Proposed alterations in cys t tests include a different method for separating cysts from fecal material and an assay mathod ' involving the counting of trophozoites' as well as in t ac t cysts. B o t h al terat ions have been used by. Bingham, et al. (e. Parasitol., 471284.291, 1979).
Recommtndation:
N-32

Theso altorations appoar t o bo roasonablo laboratory pro~.duros, suppon- . c ed by e mor-roviowod article and w i l l bo included i n tho Roport as r, options for poSSib10 d e v o l o ~ n t and US. by intorestod laboratories. . a
$ Dm Tho use of pour p la te .tochniquos as an option for %lebsiel.la. terrigena . -. bacteria analyses.
Rocownandation:
The pour plat. technique adds a heat stross fac tor to tho bacteria which . ":. constitutes a possible deficioncy. nW.vor, it i s 4 recognirod standard -- mothod and probably w i l l not adverrely affoct the Xlebsiel'la terrigenq. Consoquontly, it w i l l be added to t he Roport u one of tho acceptable techniques.
E. ' ' Option of using Escherichia coli in l iou of IUebsiella tarrigma for the bacterial torts.
Discusbion:
Appendix N-ll Soction A. 1. of the Guide Standard and Protocol sets for th tho basis for soloction of K. terrigena as the test bacteria. me selection was made along pragmatic line mphasizing the occurrence of X. -terrigena i n surface waters and tha t it would represent the enterz bacteria. It was also pointed out that the t e s t s w i t h virus and Giardia were expected t o be more severe than the bacterial tests. For comprehen- siveness, bacterial tests were included i n the protocol but were not f e l t t o be as crucial as the v i r u s and Giardia tests. 3 '
E. col i , o r any number of other generally acceptod indicator &actctia, .&& . could be used for the t es t program i f they were shown t o 'have good .&.- ,.
tos t ing and survival characteristics (equivalent to X. terrigena) by the interested rosearch laboratory. .w
s. .. -
Reconmendation:
The intent of tho Guide Standard and Pro tocol is t o prbvide a baseline program subject t o modification when properly supported by an interested laboratory. Consequ~ntly~ any laboratory could propose and w i t h ptppcr support (dwmstrating &allonge and t e s t oquivalenky t o X. tetrfgena)
1 use Escherichia co l i o r one of the other onteric bacteria. This idea r: w i l l be includod i n rovised working in Section 1.2.2, "General Guide." I
4 F. Performance requinmantr for Giardia cysts and virus i n relation to the '
EPA-Recommended Mutimum Contamination k v e l s (RMCLs) of zero.
Discussion:
The RMCLs of zero fo r Giardia and viruses which have been proposed by EPA are health goals. They are no enforceable standards sinco to assure the presence of - "no organisms" would require an inf in i te sample. The .

rationale for the rocoma~ndod performance rquiremonts for Giardia cysts and virus is set forth i n Soctions A.2 and A.3 of Appondix A. Wo feel tha t thoso raquirormnts togothot w i t h tho application of realistic worst case tost conditions vi11 provido A conservativo tost for units X O S U l t i C g i n tr0at.d mffluont vator oquioalont t o t ha t o f a public vaser supply mooting the microbiological roquiroments And intont of the National Primary Drinking Water Rogulitions..
. Rocomendation: )r . . Rot.in rocomendod performance (log reduction) r.qu$renunts for cyst and ,
virus roduction.
C. 'Rotavirus and i t 8 proposod assay: On0 c k n t e r s t a t e s t h a t the rota- virus t o s t s u o impractical hcause Amirtharajah (J. AWA, 78(3) :34-49, 1976) c i to s 'no satisfactory colturo proedurer availablo for analysis of those pathogens and, therefore, monitoring would not bo foasible."
Discussionr i
Section 3.4.1.2, 'V i rus Tests" of the Roport, presents means for cul- t u r i n g and assaying rotavirures. This' means f o r doing the rotavirus t e s t s are available and are practical for application in the laboratory. Dr. Amirtharajah was referr ing to the field collection, identification i n the presence of a wide variety of microorganisms, and quantification as not being 'satisfactory.' Laboratory analysis o f rotaviruses is practi- cal but their field monitoring may not yet be foaotble.
Further, the selection of both poliovirus and rotavirus as tort viruses
disinfection resistance of the various enteric viruder havo boen shown t o d i f fe r s ign i f icant ly by virus group arid by s t ra ins of a spocific virus. While a l l onteric vinrser and thoir itrains could not bo economically tested, it was determined by t h o task force that a t l ea s t two dist inct ly different virus types should be tosted 'to achieve mom idoa of the diversity of romoval by the'variouo types o f water p u r i f i o n . Polio ind rota viruses have distinctly difforont physical and c h d c a l charac- teristics repnsontative of tho virusor of concern. Po1iwirui.s are small singlo stranded RNA viruses w i t h genorally good adsorptive proper- ties to surfaces and f i l t e r m d i a Mila rotaviruses are over twice as largo, u e double stranded RNA and . i n soma studies have h e n found t o poasers law potontial for adsorption onto surfaces or fi l ter media. These two viruses also have bean demonstrated to'havo somewhat different disinfection kinotics.
was necessitated by the fact that the surface adsorptive properties and
Recommendation:
Retain the rotavirus test requirements.
H. Definition of microbiological water purifier? One general comment requested redifinition based on "lack of any virus removal "requirement
N-34
i n the EPA primary drinking wator regulations, so that no virus r~duction roquiromont rhould bo includod. Also, f t W.8 claimed that tho separation of purifiers f r o m non-pur$fiors would bo a ~wdisservico t o consumers a d othor users . I(
4 F
?
Discussion:
Viruses are recognizod i n tho &PA regulations vis-a-vis a proposed recom- mended auxfnnrm contuninant level of zero. Since virus monitoring for compliance w i t h a possible ncL is not yet,feasible, a treatment require- mont is necoss.ry. Virus control will be considered i n tho Safo Drinking Water Act f i l t r a t ion and disinfection troatumnt rogblatioai. The roduc- t ion of viruses by troatmont is Ufrcussed by kaireharajah (J. A m , 7833334-49, 1986).
. .
w i t h torpect t o consumers and other users, we feel th%t the current . 'dofinition is appropriate and necessary.' The average consumer cannot be
oxpected t o k n w the difference between virusor 8 bacteria and cysts, or when a raw wator w i l l or w i l l not c0ntai.n m y of these organisms. I n order to protect the average consumer,'.the subject units either alone or with supplementary treatment, should be able to cope w i t h a l l of the specified organism .
Recommendation:
Retain the current definition for microbiological water purifier.
I. coverage of units: Several comments related to the coverage of un i t s . These questions are addressed individually aa follows:
1.
2.
3.
Ultraviolet u n i t s that are used for supplemental treatment of water from public water system taps would not be covered. We agree that such units aro not covered and, parenthetical language has been included i n Section 1.3.2.3 t o c l a r i f y thia point.
A SpOCi81 s t a t u s should bo given t o units which remove Giardia and bacteria bu t not virus. Spocifically, the meaning of Section 1.2.4, aExceptions,a W8S addressed. The %(coptions' section was specif- i ca l ly dovoloped to r e l a t e t o the. p t o b l ~ ~ ~ of public water. systems having disinfoction b u t no f i l t ra t ion on a rurfaco supply. Cysts alone have been found to suntive disinfection treatment and could be ptosent i n such treated waters. I n this case an effective cys t f i l t e r serves an independent, beneficial purpose and should not be required t o be a microbiological water purifier. However, such a unit should not be used as sole treatment for untreated raw water. Additional parenthetical language has been added t o Section 1.2.4.
The entire treatment u n i t or system should be tested, not just a single component. We agree but believe that it is sufficiently clear without providing additional language.
N-35
. 4. Tho protocol should' bo rxpandod to cover units for the roduction of
TCE, EDB and othor chemical pollutants. Wo frl t that. tbo introduc- t ion of non-microbiological claim t o tho mkndud vould mako it l u g o , unwioldy and. duplicativo of . & n e x i s t i n g t h i r d - M y rtanduds and tes t ing progrun (8.0 Soction 1.2.S).
J . Alleged proforonco of National Sanitation ?oundation (NSF). over other 1.boratories for conducting tho microbiological wator purif ior tes t ing protocol. The comnont indicated that w were giving ISF proferential . troatment "to the dotrimant of other lrboratorios well qualified t o porform tho roquired protocol. .-
Discussion:
We havo made appropriate roforances t o u i s t i n g standards (142 and 153) dovoloped by tho NSF standards dovelopmont ptocoss. Standard S3, the health effects standard, W 8 S dovelopod by a broadly based Drinking Water Treatment U n i t s Coannittoo, including reprosontatives from local, Stat. and Foderai health and env i romnta l agoncios, univusitios, professional md technical usociat ions, as well as wator quality industry ropnsentatives. It was adopted in 1982 and the only test from it ut i l ized i n our Report has been substantiated as doscribed i n Part B of this "Response."
Nowhere i n our report have we advocated NSF (or any other laboratory) as the prime or only laboratory for fmplementing "the required protocol."
Roconnnendationr
No action needed.
A. Instruction concerning offective lifotim. One comment described an alternate means fo r detorraining l ifetime whur a ceramic uni t is "brushed" t o ranew its u t4 l i t y and i s gradually reduced i n diameter. A gauge is provided t o measure diamtu and t o dotormino when replacement is needod. *
Recanmenda tion t
Whon a amnufacturer provides a satisfactory "other" means of determining lifetime, this should bo accopted. Appropriate words have been added t o
. Section 2.4.1.C.
L. Coramic candler should not be cleaned .during tosting bocauso some consumers would not clean them and this would provido the awqrtt case test." One comment asserted this point.
Discussion:
There i s some truth t o this proposition. However, the other approach may also have validity. Frequent brushing may reduce fi l tration officiency.
N-36
fn any event where a a inufac turer prescribes f i l t e r cleaning and how' t c do it, and provides a gauge to detenaine lif8tim88 w feel the t e s t i n g program i s bound t o follow the amufac tu re r ' s d i r ec t ions .
Recouanendationr I- --
No change no8ded. *-
M. Scaling up or down. One Conunmt po in t s ou t that one or mor8 nranuf4c- . r
turers may vary r i t e of t rea tment un i t s by increasing or decreasing the 'I&. number of ope ra t ive un i t s rather than the sit8 of the. op.rativ8 unit . he comen t sugges t s a l lw ing scaling bued on site of operat iva unit.
Reconwandation: .-. ..it
. .W8 agree vith the Conment and have 8dded c ld r i fy ing words t o Sec- t i o n 3.5.3.3.
N. Turbid i ty l eve l of "not less that 30 NTV" for ceramic candles or uni t s . me cement states that "Such l e v e l s are impossible to u t i l i z e i n t e s t i n g mechanical f i l t r a t i o n d e v i c e s which w i l l clog e n t i r e l y or require such frequent brushing as t o render. the test kapersible as a practical
.matter."
Discussion:
We recognized the potent ia l "clogging problems" in Sec t ion 3.5.1.a(2) where the 30 NTU water it only t o be app1;ed inunediately before. -4 '
during each sampling event; t h e non-sampling tu rb id i ty l eve l , which w i l l be applied over 90% of the "on" time, is current ly set a t ~ no less than -&- l o m. . *; Turbidi ty l8vels of 30 NTU are' con$aonly found in surface waters during heavy r a i n f a l l or snow melt. Treatment units may be used under these
- circumstances, 80 this challenge level should be n t a i n e d . However, most ..usage w i l l occur under background conditions so the non-sampling
. iwI .e>-, .
tu rb id i ty l eve ls should be 0.1-5 NTW.
2. Change non-sampling t u r b i d i t y t o 0.1-3 Nrm. Appropriate wording changes have be8n introduced i n Section 3.5.l.a(2) and i n Appen- d ix N-1 , Sect ion 'B.
0. Chlorine i n tes t water t 5 . One comen t asserts that chlor ine " tends t o i nc rease s i l ve r ion l eaching ac t iv i ty ' and t h a t a high chlor ine level should 'be included i n the s i lve r l each ing t e s t ; b u t no reference or evidence, however, is provided t o back th i s assertion.
N-3 7

Discussion:
We have no compelling evidence or roason t o ucpoct that chlorino w i 1 . l enhance tho loaching of s i lver . #owovor8 tho proscribed low pH and TES lovels w i l l provide a cloarly sovero t o s t for silvor leaching.
Recommandation:
. No change needed.
P. Umocossary d i f f icu l ty and oxponse of t o s t protocols. Several corawants I
wero made undor this gonoral hoading. Thoro colnwntr we' outlinod .and discussed as fol1awrr
1. TOO many sampling events aro roquirodt sampling of a few uni ts a t start, middle and f inish should be satisfactory: The cornit tee has carafully laid out the standard and protocol and we feel the minimum sampling plan must bo maintained for the consumers' health pro- toction.
2. Three uni t s are too many to studyt parallel tes t ing of .two units should bo satisfactory: For consumer protoction, the Disinfoctanto Branch8 Office of Pesticide Progrsmr, has t radi t ional ly required the tosting of threo units. The d t t e o recognizes .the additional, cost involved in tos t ing a third unit but feels that this w i l l provide a minimum love1 of assurance t o prevent infectious disease and recommends retention of t h e 3-unit requirement.
3. The protocol requires large tanks and micrabiological reoeeding'on a dai ly basis: We feel that the tank size requirements 'are not extreme and can be met by an interestod laboratory. ' W i t h respect t o reseeding, it should be pointod out t h a t virus and cyst seeding need only bo conductrd immediately before and during the sampling "on" period (see section 3.5.1.b (2) 1 8 equivalont to less that 10% of the "on" time. This "spot" seeding for viruses and cysts rocognired the oxpense and .d i f f icu l ty of maintaining large populations of these organisms. Continuous sooding was provided for bactoria bocaure they aro easier t o grow and maintain and Pright have the capacity to grow through somo unit88 givon enough time and opportunity.
4. Challenge lovels of contaminants are too h g h compked t o hown envirornnental conditions and the required 'log reductions exceed Safe ,
Drinking Water Act requirements: As explained i n a footnote t o Tablo I, Section 2, the influent challenges may consti tute greater concentrations than would be anticipatod in source waters. These levels are nocessary t o test properly for the required log reduc- t ions without having to uti l ize sample concentration procedures which are time/labor intensive and which MY, on tkieir own, intro- ' '
duce quantitative errors t o the microbiological assays. As men- tioned i n Part I of this paper, the log reductions for bacteria, virus and Giardia have been suggested for public water system
N-38 .

trmtnrrnt i n a p a w by &irthara j.h (1986, JAWA, 78: 3834-49) me reductions i n . tho .microbiological purifior standard are entirely compatible witb tho reductions cited f o r public wator supply treatment
N-39
. .
APPENDIX 0
GUIDELINES TO EVALUATE OZONE DISINFECTION
.
. Principal Technical Author: Or. Ovadia Lev Division o f Environmental Sciences Hebrew University o f Jerusalem
. Jerusalem, Israel .

. APPENDIX 0
GUIDELINES TO EVALUATE OZONE DISINFECTION - IALuumm
m 0.1 INTRODUCTION
0.1.1 ;Background 0.1.2 Objectives of the Recomnended Guidelines 0.1.3 EPA's Approach in Setting the Reconmended
Guide1 ines 0.1.4 Typical Ozone Disinfection Unlts
0.2 DETERMINATION OF CONTACT TIME (11 0.2.1 Background 0.2.2 1, Analysis 0.2.3 A8ditional Considerations for T,,,:
Multiple Chamber Contactors 0.2.4 Alternative Analysis of Disinfection Kinetics 0.2.5 Continuously Stirred lank Reactor (CSTR) Approach 0.2.6 Segregated Flow Analysis (SFA) 0.2.7 Relative Inactivation of Giardia Cysts and Viruses 0.2.8 Examples of Determining Contact lime (T)
0.2.8.1 Evaluation Using 1 0.2.8.2 Evaluations Using &TR Calculations 0.2.8.3 Evaluations Using SFA
. 0.2.9 Estimating T
0 .3 DETERMINATION OF OZONE CONCENTRATION (C) 0.3.1 Introduction 0.3.2 Direct Measurement o f C 0.3.3 Estimating C Based on Residual Measurements
at the Outlet 0.3.3.1 First Chambers 0.3.3 2 Subsequent Chambers
0.3.4 Estimating C
0.4.1 Introduction 0.4.2 Site Specific Correlations of C with an
0.4.3 Modeling the Performance of Full Scale Operations 0.4.4 Microbial Indicator Studles to Model Inactlvation
0.4 SITE SPECIFIC EVALUATION OF OZONE COkTACTORS
Observable Vari ab1 e 0.4.2.1 Utilizing Off-Gas Measurements
Contactors
0.1-1 0.1.1 0.1-2
0.1-3 0.1-4
0.2-1 0.2-1 0.2-1
. 0.2-3 0.2-7
~ O ~ ' 2 - 9 0.2-10 .0.2-12 0.2-13 0.2-13 *
0.2-16 0.2-18 0.2-21
0.3-1 0.3-1 0.3-2
0.3-6 0.3-6 0.3-7
0.3.-10
0.4-1. 0.4-1
0.4-2 0.4-4 0.4-7
0.4-9
REFERENCES

TABLE OF CONTENTS (Cont i nued)
LuLLEmw
0-1
0-2
0-3
0-4
0-5
0-6
0-7
0-8
0-9
0-10
0-1 1
0-12
0-13
0-14
0-15
. 0-16
0-17
Turbine Contactor, Haworth Water Treatment Plant '
~ l t i p l e - c i a m t w Ozone System, tor h g e t e s
Multiple-Chamber .Ozone System, City o f Tucson, Arizona
Multiple-Chamber Ozone System. East Bay Municipal U t i l i t y D i s t r i c t , Oakland, Ca l i fo rn ia
Schematic o f Deep U-Tube Ozone Contactor
Schematic o f In-Line Stat ic Mixer
Pr inc ipa l o f Segregated Flo; Analysis
Se r tgated Flow Analysis o f an Ozone Contactor
Tracer Study of Sturgeon Bay Ozone Contactor
Segregated Flow Analysis of Ozone Contactor
Segregated Flow Analysis o f Ozone Contact .Chamber
Decision Tree for Est imat ing T
Flow Configurations i n Ozone Contact Chanbers.
D i rec t Measurements for Determining T
Ozone Concentration Profi les
Decision Tree for Estimating T
Example o f Empirical Correlat ion of Residual Ozone '
Hackensack, NJ
Aqueduct F i l t r a t i on P lan t
Bracer Study
- Integrat ion o f Survival Eff iciency.
and . O f f-Gas
Fol lowing enru:
0.1-5
0.1-5
0.1-5
0.1-5
0.1-6
0.1-6
0.2-11
0.2-14
0.2-15
0.2-20 .
0.2-20 *
0.2-21
0.3-1
0.3-5.
0.3-8
0 -3-10
0.4-6

lab1 e No. 0-1
0-2
0-3
0-4
0-5
0-6
0-7
0-8
TABLE' OF CONTENTS (Contlnued)
Foll owl ng
Recommended Procedures to Calculate Contact T h e (T) 0.2-2 Title
Cf Values for Inactivation by Ozone
k Values for Inactlvatlon by Ozone 0.2-7
0.2-7 -
Spread Sheet -Notations for SFA 0.2-18
Segregated Flow Analysis of an Ozone Disinfection Contactor at Hackensack 0.2-20
Correlations to Predict C Based on Outlet Ozone Concentrations 0.3-6
Henry's Constants for Ozone O i 4 - 5
Empirical Correlation Between Cat and yat 0.4-6 . .

0. I INTROOUCTION
0.1.1 W k a r o u n d The'Surface Water Treatment Rule (SUTR) specifies overall hinimrl
removal/inactivation efficiencies by filtration and disinfection for Giardia cysts and viruses. The SUTR uses the "CT' concept to predict inactivation efficiencies of microorganisms by disinfection. "CT" represents the product of contact or exposure time ('Tnj and the concentration of disinfectant ("C') during di.sinfection. The Guidance Manual suggests design, operating and performance criteria for specific surface water quality conditions to provide compliance with the SUR. Appendix C of the Guidance Manual recommended guidelines for the determination of contact time (T,J for the disinfection of drinking water. . f,, is the time defined to assure that 90 percent of the water that'enters . . the disinfection chamber will remain for at 'least T,, minutes. This. appendix recommends additional procedures which may be used for consistent determination of the C and T for systems using disinfection by ozone.
Ozone has unique characteristics and warrants special consideration for estimating inactivation efficiencies. In developing these recommended procedures, €PA addressed the following complications that are specific to ozone dislnfection and distinguish it from other typical disinfection processes.
- Despite the long operational experience with ozone disinfet- tion, the data regarding performance of ozone as a disinfectant are rather limited. Most of the available inactivation rate data are derived from laboratory conditions which are sub- stantially different than full scale continuous operat.ion, generally more so than for other disinfectants.
From a technical point of view, disinfection of drinking water by ozone is more complicated than disinfection by other common disinfectants because of ozone's unique gas-liquid mass transfer characteristics. Ozone requires sophisticated mass transfer equipment to introduce it into water, because of the relatively low ozone concentration in the feed gas. Ozone i s a .powerful oxidant, that reacts rapidly with' organic and inorganic substances present in the water and undergoes auto- decomposition. Therefore, it's residual is much less stable than, that of other disinfectants and dissipates rapidly.
0.1-1

f
..
- Ozone contactors exhiblt more diversified types of flow configurations relative to the flow pattern In contactors for the other disinfectants. The flow configuration often ranges from an almost continuously stirred tank reactor (CSTR) to an almost ideal plug flow.configuration, making the determination of contact time for ozonation more complex than .for other disinfectants.
- Ozone contactors are closed vessels because o f ozone's toxlci- ty. The contactors have limited access for measurement of the ozone concentration profile within the contactor; Gas bubbles also may interfere with the determination o f the dissolved ozone concentration, i f the bubbles are entrapped during tamp1 i ng
- Ozone techno1 ogy is s.ti 1 1 evolving and new types of ozone contactors are being developed. These guidelines should not set unnecessary obstacles that will Inhibit cnglneering progress and prevent innovative designs of disinfection systems.
EPA's procedures for determining C and T for disinfection with ozone differ from those recornended for systems uslng chlorine, chlorunjnes or chlorine dioxide as disinfectants.' The CT evaluation procedures presented in previous chapters of the Guidance Manual are not appropriate for ozone disinfection because they would result in excessive ozone dosages. Excessive ozone doses result in high energy requirements and costs and may lead to unnecessary production o f ozonation by-products which may have associated health risks. Additionally, excess dissolved or entrained ozone should be destroyed or removed before reaching the first drinking water consumer or plant personnel, in order to prevent health risks. Therefore, excessive dosage of ozone may require 8n additional unit operation to destroy the remaining residual ozone.' T h i s process is. expensive and may not be necessary if guidelines .such 'as those presented in this section are used for compliance with the S U R .
0.1.2 M c t i v e s o f the Recommended Guidelines The recommended guidelines were developed to assure compliance w i t h
the SWTR for the whole range of flow rates, flow configurations and water quality conditions that may be encountered with ozone disinfectfon of drinking water. The prlmary goal o f these gu1delines.is to assure

compliance w l th t he S U R even under 'worst case" condltlons. .Ylthout compromlslng this. pr lmary goal , these guideilnes were developed to , meet the fo l low lng c r l te r la :
1. Slmpl ic l ty : The guldellnes . f o r select ln contact t ime (T) and concentratlon (C) have t o be r a s l l y un i erstood by pract l t lo- ners, even by those who do not have an englneerlng background.
2. Implementatlon: The procedure t o estlarate concantratlon and tlme should be eas l l y Implemented, even by water u t l l l t l e s t h a t have only l l m l t e d eng'lneerlng and techno~og lc r~ mans .
3. Economics: The guldellnes should be designed t o arlnlmlze cap i ta l and operating costs and t o ~ l n l m l t e ozone confunaptlon. The guldellnes should be f l ex lb l@ enough t o allow systems t o take advantage of s i te spec i f i c charac ter ls t l cs o f the t rea ted water and the varlous designs o f ozone contactors.
0.1.3 EPA's Amroach in Se t t i na t he Recommended Guldelines EPA i s awate that the current technological knowledge I s l n fu f f l c len t
to formulate a consistent and ef f ic ient s lng le set :of general rules that . will achieve these confl lcting goals and s t i l l guarantee compllance w i th the SWTR. Therefore, EPA developed t w o a l ternat lve sets 6 f guidel ines tha t systems may use depending on thelr technologicdl resources:
- A l te rna t ive 1: General guidel ines which assure'compllance'with the SWTR regardless of the s l te specl f ic condi t i ,ons,
- A l te rna t lve 2: A sophisticated evaluation procedure that w a t e r u t l l l t l e s may use t o take advantage o f t h e l r s l t e s p e c l f i c . condl t lons.
These guidel lnes are considered to be s tate-of - the-ar t . As more lnformatlon becomes avai l able, 'more accurate approaches and models may be . developed. A br le f descr lp t ion o f the current a l ternat ives fo l lows. '
A l te rna t ive 1 - General Guldelines Th ls a l te rna t lve cons ls ts o f a simple set o f general guldel1ne.s tha t
assure compl iance wi th the SWTR even under worst case condlt lons. These ' guidelines were developed t o emphaslre genera l i ty and simp1 i c i t y .
However, they may not r e s u l t i n t h e lowest cost alternative($).

The second and third sections of this Appendix contain detailed descriptions of the general guidelines. Section 0.2 .contains procedures to estimate the contact time (1) and Section 0.3 contiins procdures to ' calculate the concentration (C) in ozone contactors based on simple
' measurements of some parameters. Thr basis for these general guide1 ines 1 s di scussed in two papers (Lev and Reg1 1, 1990a. b) . .
.-
1-
.*-
- .'. -
ternative 2 - Site Saeeific Evrlu&tian P t a c e m This alternative consists of a more sophisticated set of evaluation
procedures to characterize the performance of, ozone contactors and thereby take advantage of site specific conditions. €PA recomnends that systems be given opportunity to' prove by further experimental and analytical data that the performance of their ozone contactors are better than the performance predicted by the first alternative, thereby allowing a system ' *
to minimize costs while providing adequate treatment.
Ozone contactors achieve better performance than that predicted by the first alternative.
Section 0.4 outlines recommended procedures for demonStrating that .
0.1.4 Imical Ozone Dlsinfection Units Several types of ozone contactors are currently .in use .for disinfec-
tion of drinking water in the United'States. Other types of contactors are being designed or are being used for disinfection o f treated sewage effluents. The following characteristics i1lustra.te the diversity of ozone contactors: . . - The capacity of ozonation systems ranges from less than 1
mil 1 ion gal 1 ons per day (mgd) up to 600 mgd.
- The volume of ozone contactors ranges' from less than 35 cubic feet up to more than 35,000 cubic feet for a single chambers.
.. .
- The ozone gas stream may be introduced into the water by several ways including porous diffusers, submerged turbines and gas injectors.
- Ozone contactors include single or multiple gas/liquid contact chambers.
0.1-4.

Four t y p l c a l ozone contactors current ly In use or I n deslgn I n the United States are shown on Flgures 0-1 through 0-4. Flgure 0-1 presents 8 schematic o f an 8splrat lng turblne COnt8CtOr. operatlng I n countercur- rent flow. A t u rb lne ag l ta to r i s used t o Introduce the ozone In to the contactor rnd to mix the l lqu ld phase. Thls u n i t aay serve 8s the first ozone chamber I n a serles of chambers or as a single chamber. The u n l t shown In t h i s f i g u f e i s from the Hackensack Water Company's Haworth Plant a t Haworth, New Jersey. The turbine chamber 1s followed by a react ive chamber t o provlde additional contact tlme. Studies conducted I n the f u l l scale turblne agltated contactor demonstrated that even 'when the ozone demand was high, the dlssolved ozone concentrrt lon was almost constant throughout the. contactor as a resu l t of the vlgorous action o f the turblne
The 600 mgd ozone system o f t h e c i t y of Los Angeles I s comprised of four paral le l contactors each consis t ing o f SIX chambers. A schematlc of. one o f these contactors I s presented on Figure 0-2. (Sto lar ik and Christ ie, 1990) As indicated on th is f igure :
- An oxygen st ream containing a few percent. by weight o f ozone 1s compressed through bubble dif fusers Into the first and t h i r d chambers of the contactor.
. (Schwartz e t a1 , 1990).
- The second and four th chambers are used to provlde contact time, wl thout supply ing rddft lonr l gas t o t h e l l q u l d stream.
- The s l z e o f the first three gas/l iquld contact chambers ' I s
- The f i f t h and s i x t h chambers are the ozonated water channel and
20,400 cubic f e e t each.
the rapld mlxer basins.
- The l i q u l d and gas streams I n t h e f l r s t and t h l r d chambers f low I n a counter-current pattern; the gas .s t ream f l ows upward and the water stream f lows downward.
As i 1 l us t ra ted on Figure 0-3, a s lmi l ar deslgn approach was taken by the C i ty o f Tucson, Arizona. This contactor I s comprised o f ' f i v e
. chambers, all o f which a re equipped w i th gas dl f fusers. The s l x t h chamber - has no d i f f use rs , The f l o w i n a l l SIX chambers i s counter-current f low.
These counter-current chambers a r e separated by narrower co-current 1 i.quid cha'nnels i n which the w a t e r f lows 'upward t o the in1,et o f the next chamber.
0 .1 -5
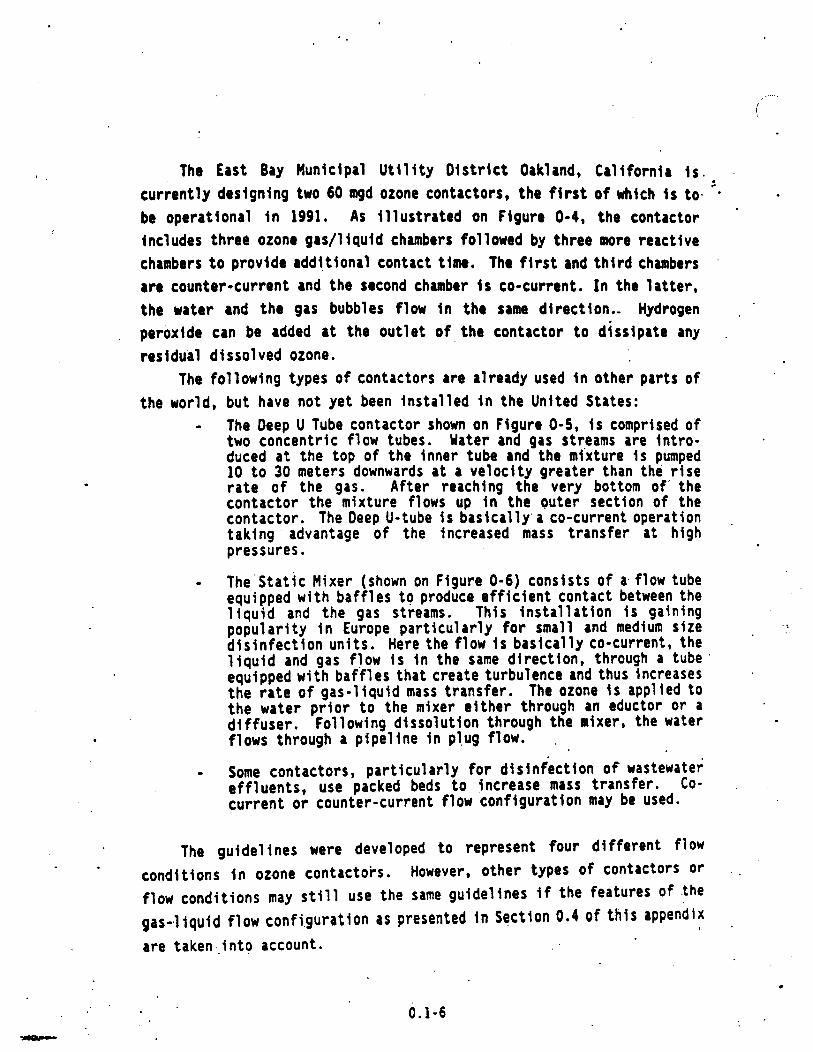
i
The East Bay Hunicipal Utility District Oakland, California is. .
currently designing two 60 W d ozone contactors, the first of which I s to. be operational in 1991. As illustrated on Figure 0-4, the contactor includes three ozone grs/liquid chambers followed by three more reactive chambers to provide addi.tiona1 contact time. The first and third chambers are counter-current rnd the sacond chamber 1s co-current. In the latter, the water rnd the gas bubbles flow in the same direction.- Hydrogen peroxide can be added at the outlet of the contactor to dissipate any . residual dissolved ozone.
The following types of contactors are already used in other parts of the world, but have not yet been installed in the United States:
- The Deep U Tube contactor shown on Figure 0-5, is comprised o f two concentric flow tubes. Water and gas streams are intro- duced at the top of the inner tube and the mi'xture is pumped 10 to 30 meters downwards at a velocity greater than the rise rate of the gas. After reaching the very bottom of' the contactor the mixture flows up in the Outer section of the contactor. The Deep U-tube is basical1y.a co-current operation ,
taking advantage of the increased mass transfer at high pressures.
The'Static Mixer (shown on Figure 0-6) consists of a,flow tube equipped with baffles to produce efficient contact between the liquid and the gas streams. This installation is gaining popularity in Europe particularly for small and medium size disinfection units. Here the flow is basically co-current, the liquid and gas flow is in the same direction, through a tube I
equipped with baffles that create turbulence and thus increases the rate of gas-1 iquid mass transfer. The ozone is applied to the water prior to the mixer either through an eductor or a diffuser. Following dissolution through the mixer, the water flows through a pipeline in pl.ug flow. .
.-
- Some contactors, particularly for disinfection o f wastewater effluents, use packed beds to increase mass transfer. Co- current or counter-current flow configuration may be used.
The guidelines were developed to represent four different flow conditions in ozone contactois. However, other types of contactors or , , '
flow conditions may still use the same guidelines if the features o f .the gas-Uquid flow confi.guration as presented in Section 0.4 o f this appendix are taken .into account.
0.1-6

f RAW WAT€R INLET r EFf LUEWT
FIGURE 0- 1 - * TUR@INIE OZONE CONTACTOR,
HAWORTH WATER TREATMENT PLANT
HACKENSACK, N3
. .
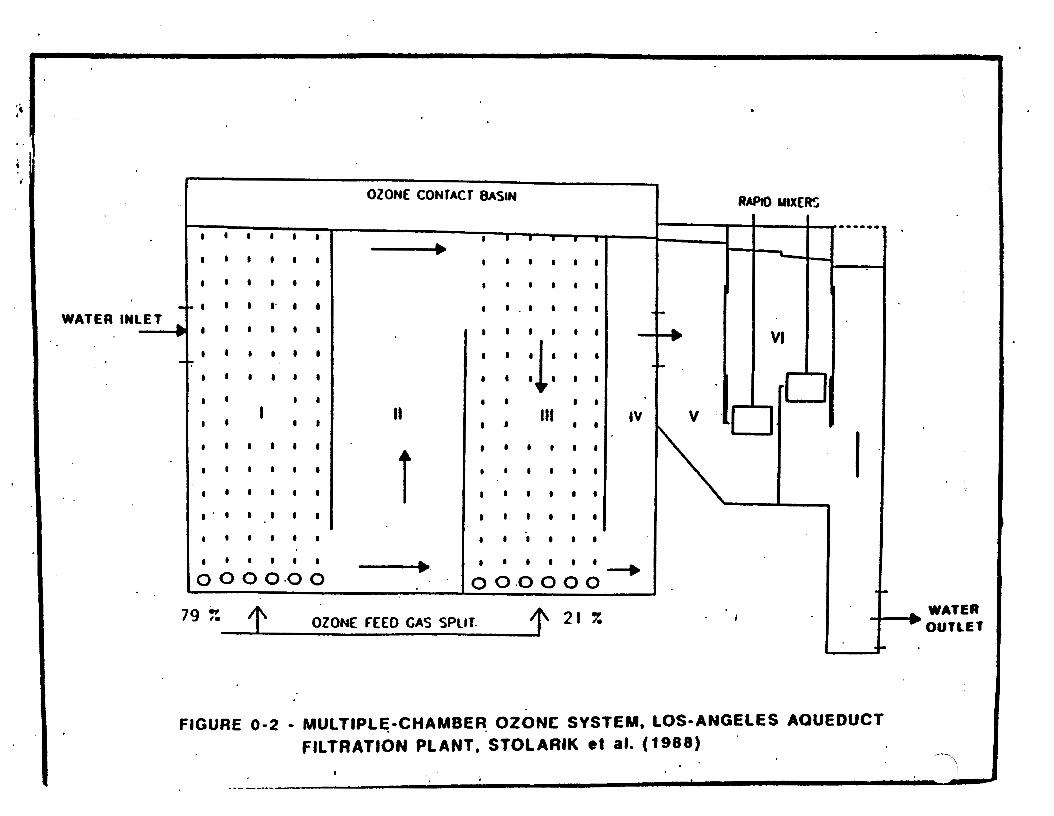
WATER I I . . e e I
l 1 l 1 l l
e 1 * e "' I 8
79 f: OZONE FEED GAS SPLIT. 21
FIGURE 0-2 - MULTIPLE-CHAMBER, OZONE SYSTEM, LOS-ANGELES AOUEOUCT FILTRATION PLANT, STOLARIK et al. (1988) ,--q
I
.-_---
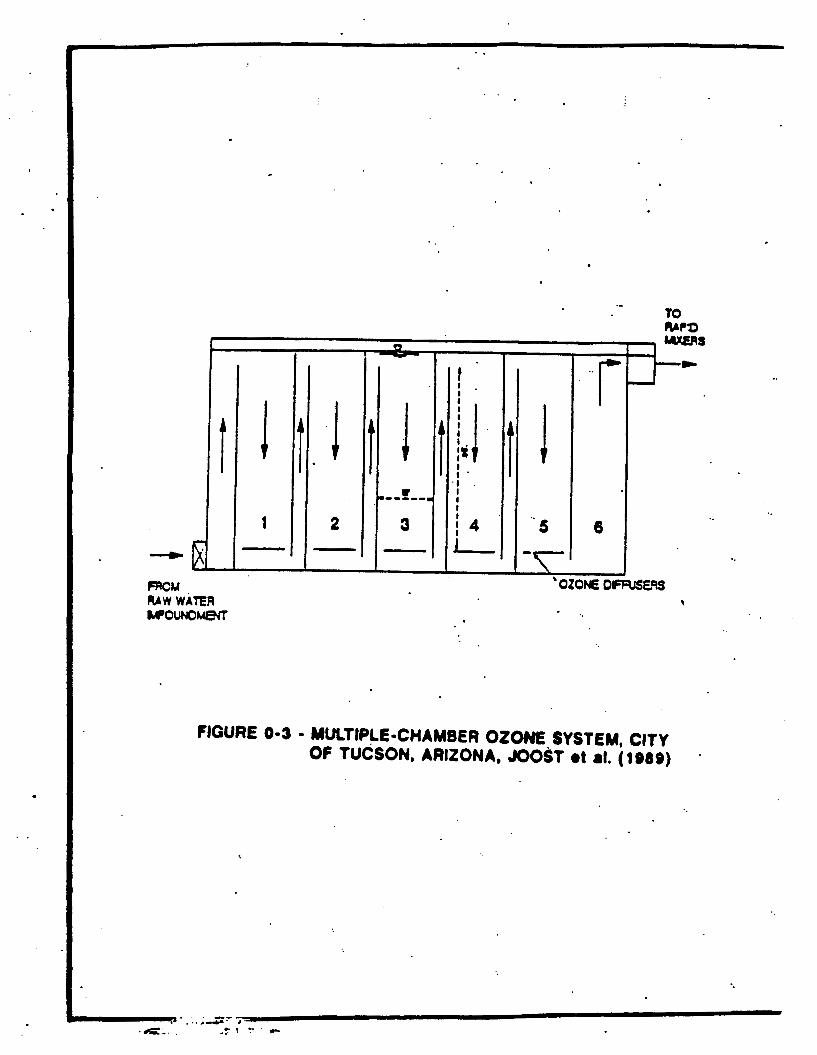
. .
FIGURE 0-3 - MULTIPLE-CHAMBER OZONE SYSTEM, CITY OF TUCSON, ARIZONA, JOOST et rl. (1@89)
t

: 5 4
I-
I t
"a% I
I
- \ t
.. .*

INLET OF WATER
FIOURE 0-5 - SCHEMATIC OF THE DEEP U-TUBE OZONE ' CONTACTOR, ROUSTAN ot rl. (lS87)

. .
1.
i
FIGURE 0-6 - SCHEMATIC OF IN-LINE STATl'C MIXER . .

0.2 DETERMIN ..
ATION OF CONTACT TIME (T
0.2.1 WkU *
The' hydraulic characteristics in ozone contactors range from an almost Continuous Stirred-Tank Reactor (CSTR) to an ideal plug flow configuration. Because the TIo approach may not be adequate for datemain-. ing the inactivation provided for systems resembling a CSTR, and because the T,, approach is overly conservative in other cases, EPA reconmends the following three numerical methods to predict the contact time (1) in ozone contactors:
110 : The T,o method discussed In Appendix C (and in Section 0.2.2) is a good measure to characterize the contact time in most cases. However, this method reduces the possibility o f complying with the SWTR for systems that bave relatively high back-mixing and require high inactivation levels.
Segregated Flow Analysis (SFA): (See Section 0.2.6) This i s an alter-' '
native procedure to calculate the disinfection contact time. This procedure is appl Icable only to systems that have good data from tracer studies of high resolution as explained in Section 0.2.6.
CSTR: The Continuously Stirred-Tank Reactor (CSTR) method described in Section 0.2.5, assumes the ozone contactor behaves as a CSTR. This procedure is extremely conservative. However, no apparent simplified analysis is currently available to make it less conserva- tive. The CSTR approach should be used only when:
- Other predicting techniques are not recomnended,
- The required inactivation level. is very low, or
- Systems cannot afford to get good tracer study data for other methods.
Systems may choose the optimal method for their situation based on the available data to perform the calculations. A discussion of each'fs presented belqw.
0.2.2 Analysis The simplest method o f calculating the contact time, T, of microor-
ganisms in a contactor is by the T,o approach. T,, is defined as the detention time to assure that 90 percent o f the liquid that enters the
0.2-1
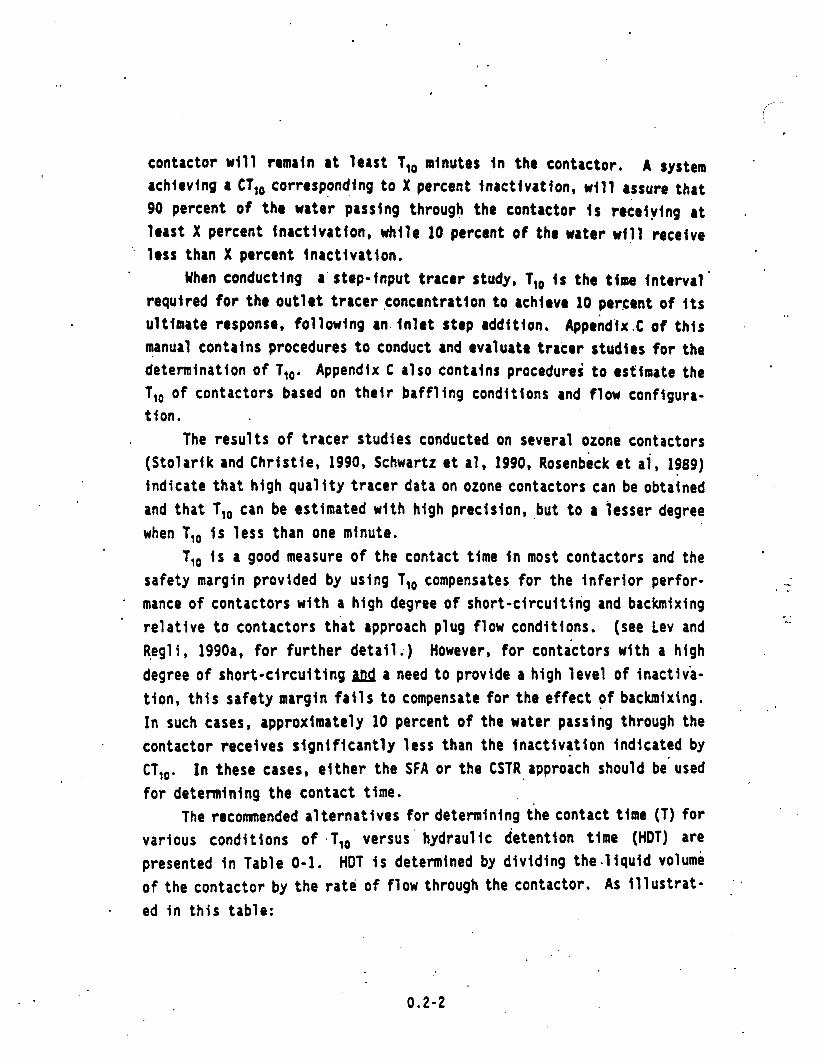
,,. .
contactor Will remain at teast t,, minutes in the contactor, A system achieving a CTl0 corresponding to X percent Inactivation, will assure that 90 percent - o f the water passing through the contactor i s receiving at . least X percent inactlvation, while 10 percent o f the water will receive
When conducting a'rtep-Input tracer study, T,, is the time interval' required for the outlet tracer concentration to achieve 10 per.cent of its ultimate response, following an. inlet step addition. App&jx.C of this manual contains procedures to conduct and evaluate tracer studies for the determination o f T,*. Appendix C also contains procedures t o esflmate the T,, of contactors based on their baffling conditions and flow configura- tfon.
The results of tracer studies conducted on several ozone contactors (Stolarik and Christie, 1990, Schwattz et el, 1990, Rosenbeck et a i , 1989) indicate that high quality tracer data on ozone contactors can be obtained and that T,, can be estimated with high precfsion, ,but to a lesser degree when Tlo is less than one minute.
f, , is a good measure of the contact time in most contactors and the safety margin provided by using T,o compensates for the inferior perfor- --
* mance of contactors with a high degree of short-circuiting and backmixing . relative to contactors that approach plug flow conditions. (see Lev and
Regli, 1990a, for further detail ;) However, for contactors with a high degree of short-circuiting a need to provide a high level of inactiva- tion, this safety margin fails to compensate for the effect of backmixing. In such cases, approximately 10 percent of the water passing through the
' contactor receives significantly less than the inactivation indicated by cf,,. In these cases, either the SFA or the CSTR approach should be' used for determining the contact time.
The recommended alternatlves for determining the contact time (7) for various conditions of ,Tlo versus hydraulic detention time (HOT) are presented fn Table 0-1. HDT is determined by dividing the.liquid volume of the contactor by the rate of flow through the contactor. A S illustrat-
' less than X percent inactivation.
. >
_ I .. .
. .
- ed in this table:
0 . 2 - 2

...
TABLE 0-1
Recomended Procedures to Calculate the Disinfection Contact lime (1)
Recomnded Methods: W O ' 1-f,,
- .
,' '
CSTR'3'
Notes: 1.
2 . .
3 .
$FA'*' ' $FA'"
CSTR'" CSTR'"
Required level of inactivation 4 n logs o f either Giard ia lamblia cysts or viruses whichever value is greater; .. I - I 1 ive organisms in outlet o f ozone contactor and 1, - # live organisms in inlet to ozone contactor
High resolution tracer characterization o f the otone'contactor rrmsfL be available. The CSTR method is extremely conservative and should be avoided when a1 ternat ive approaches are possible.
..
..

- The T,, method I s rpp'llcabte for systems that are required t o achleve less than 8 2.5-109 lnactlvation o f Elprdia cysts even I f the'flow COnflgUratiOn in thelr ozone contactor rpproaches , that of a CSTR, such as dlrlnfection I n contattort using ' turbine agi tators.
- 'Likewise, the T,, approach I s rpproprlrte for systems demon- stratlng T dHOT greater than 113 regardless of the required level o f d!sinfectlon.
- Systems for which the T,, approach Is appropriate to have the optlon of applying elther the SFA or CSTR analysls. The method resultlng In the hlghest T value, or thereby the lowest C value may then be fol 1 owed.
The SFA or CSTR should be used in 1 leu of T,, when the:
- Level of inactlvation required for Elardia cysts and/or viruses is 2.5-l.og or higher
- T,dHDT i s less than 1/3.
Systems should be aware that the 2.5-log lnactlvation guidellne refers to the Inactivation provided by the ozone system alone regardless of '
requlres an overall inactivation o f 3-log and provides 1-log lnactlvation . .... by chlorine, then a 2-log inactivation I s required by ozone and the T,, approach can be used.
Examples for applying the different methods of calculatlon for T are Included In Sectlon 0.2.8.
. . inactivation provided by other dislnfectants. For example, if a system
c
* .. Le
-.,. ii
. 0.2.3 jddltlonal Considerations for I,& Multlole Chamber Contactors Thls section provldes guidelines for computlng T,, for several
contactort I n serles. The main shortcoming of the Tl0 approach I s the. Inherent non-linearity of thls measure. In contrast to the HDT, which is a linear measure, TIo's o f Individual subunlts do not sum up t o give the T,, o f the overall unl t . For example:
- The HOT of two equal CSTRs In series is exactly twice the HDT of each CSTR.
- The T, for the same two CSTRs In series I s more than twice the sum o f the individual .T,,'s.
0.2-3

Thls ralses some practlcal questions:
- How should the T,, of a multiple-chamber contactor be deter- mined using tracer studies?
- Is It necessary to conduct lndlvidual tracer studies for each chamber or I s It sufflclent to conduct an overall study of the whole contactor?
- How can'the contact t h e o f one chamber be detemlned based on the T,, o f the overall system?
Conducting tracer studies o f indlvidual chambers in a mlttple chamber ozone contactor is llkely to be difficult. In addition, an analysis conducted by Lev and Regli (1990a) Indicates that the computation o f the contact. time (1) based on tracer studles of the indlvldual chambers
by summing the TtOs of the separate chambers may be up to 9.5 times'higher than one designed by the overall 1,; approach. Therefore, EPA recommends the use of an overall tracer study o f the whole contactor,' In order to lower operation costs and to avoid overly complex tracer studies.
Disinfection credits for a multiple chamber contactor should be based only on the active chambers, those which have a detectable ozone resldual, Based on the recommendation to use overall tracer studles, guidelines are needed for determining the disinfection credit for the active part o f a system based on overall tracer studies. The average concentration in the individual chambers of a multiple-chamber system may deviate considerably from one another. Therefore, systems must be able to assign contact times for each chamber.
,Lev and Reg1 i, (1990a) evaluated the consequences of uslng a 1 inear approxfmat ion based on relative contact chamber volumes and overall T,, of
. I s likely to lead to over design. The excess volume o f a system deslgned .
the contactor to ozone contactor:
determine the contact time of individual chambers in an
0.2-4

Where:
floachukr .I An approximation for the contact time o f one chamber.
c . *
TlO. t o t r l = T,,, o f the entire mu1 ti-chamber ozone contactor as determined by tracer studies .-
Vchrrkr = Volume o f the individual chamber
" to t r l = Overall volume o f the mu1 ti -chamber ozone conta- ctor
. -.
. They demonstrated that such linear' extrapolation may lead to an underesti- mate of the required 1. This underestimate can be significant when the concentration in the different chambers deviate considerably from' each other. This would be the case when'the residual ozone concentration in one chamber i s reko.
Considering the various safety marglns that are included in the T,,, approach, and considering the practical complexity involved in conducting separate tracer studies, EPA recommends the use of the linear ipproxima- tion described in Equation 1 provided that the volume of the portion of the contactor that has zero residual ozone is' less than half of the h
overall volume of the ozone contactor:
-.
.-
. ._*
V i N C t l v e c h r k J " t o t r 1 < 0.3
Where:
Vinrct ive a r = The volume o f the chambers in the' contactor where the ozone concen$ration is. zero
V t o t r l = The volume of the chambers with a residual
The following examples illustrate the computation of the overall * inactivation performance o f multiple-chamber systems using the linear
approximation. of Equation 1:
- . An'ozone contactor has three chambers in series. Each chamber has a volume o f 353 cubic feet.
0.2-5

- The average ozone concentratlon i n each chamber i s :
- First chamber: C,-0 w/L ozone.
- Second chamber: Cpl mg/L ozone.
- Thlrd chamber; C, 4 . 5 ng/L ozone.
- C,, C and C, are the average conontratlons, determined as
- The ut11 1 t y measured T,, = 5 lnln for the entl re 'brone con- descrfbed i n Section 0.3 .
tactor. - The volumetric fractlon of the chamber which has no orone
residual I s V,/(V +Y2+V ) ) - 0.33 which 1s less than the 0.5 guideline. Thereiore ft i s permisslble t o use Equatlon i i n order t o estimate the CT achieved I n the ozone contactor. .
I
- The total CT achieved by the ozone contactor is:
CT = (11[(5)(10)/(30)1 + (0*5)[(5)(10)/(30)] 2.5
- The CT achieved by the ozone contactor i s 2.5 mg-min/L.
Example 0.2-2 Linear amroximat ion not a m 1 icable
- An ozone contactor conslsts of :
- A chamber w i t h a volume o f 70 cubic feet and equipped
- Fol lowed by a second' chamber w i t h a volume of 200 cubic
- The first chamber has an ozone reoldual of 0.5 q / L and the
w i t h a turbine agi tator
feet .
second chamber has an ozone residual of zero
- The Tl0,total - 8 min for both chambers a t the peak flow ra te - The volumetric fraction of the chamber w i t h no ozone residual
i s 200/270 - 0.74 whlch i s greater then 0.5 o f the total volume, Therefore, the use of Equation 1 t o approximate the T,o of the chamber that contalns an ozone residual I s not recommended.
- The system may estimate I t s performance by either the CSTR approach taking into account only the detention time of the first chamber or conduct tracer studies of the f lrst chamber.
0.2-6

i *
0.2.4 Alternative Analvsis of Disinfection Kinetics The CSTR and'the $FA rpproaches utilize the Chick-Yatson inactivation
rule directly rather than relying on the CT rpproach. The 'following section describes this alternative rpproach to represent the disinfection kinetics.
The Guidance Manual recomnends that systems should calculate the inactivation level In their disinfection contactors by the C? approach. Table 0-2 presents CT data corresponding to specified inactivation levels of giardia cysts and viruses by ozone. An a1 ternative way to present the same information is by tables of the kinetic coefficlents used to calculate the CT values.
The CT values presented in Table 0-2 were calculated based on batch- reactor experimental information that was fitted into a logarithmic correlation according to a first order Chick-Watson's rule (Chick', 1907; Watson 1908; and Hoff, 1987):
. .
log( I/Io) - k CT (2 )
Where: 1/10 Survival ratio of the Giardia cysts or viruses c - Residual concentration of ozone in mg/L
J - Exposure time in min.
k - A 'kinetic coefficient which characterizes the specific rate of inactivation o f the aicroorgan- *
isms at the appropriate temperature and pH.
Solving Equation 2 for k yields:
Equation 3 can be used to calculate k values corresponding to the CT values in Table 0-2. Table 0-3 summarizes these4c values. Equation 3 may also be used to translform inactivation levels (I&) to CT values and vice versa.
The following example illustrates the use of the values presented in Table 0-3 to calculate, the performance o f multiple-chamber ozone contactors:
0.2-7
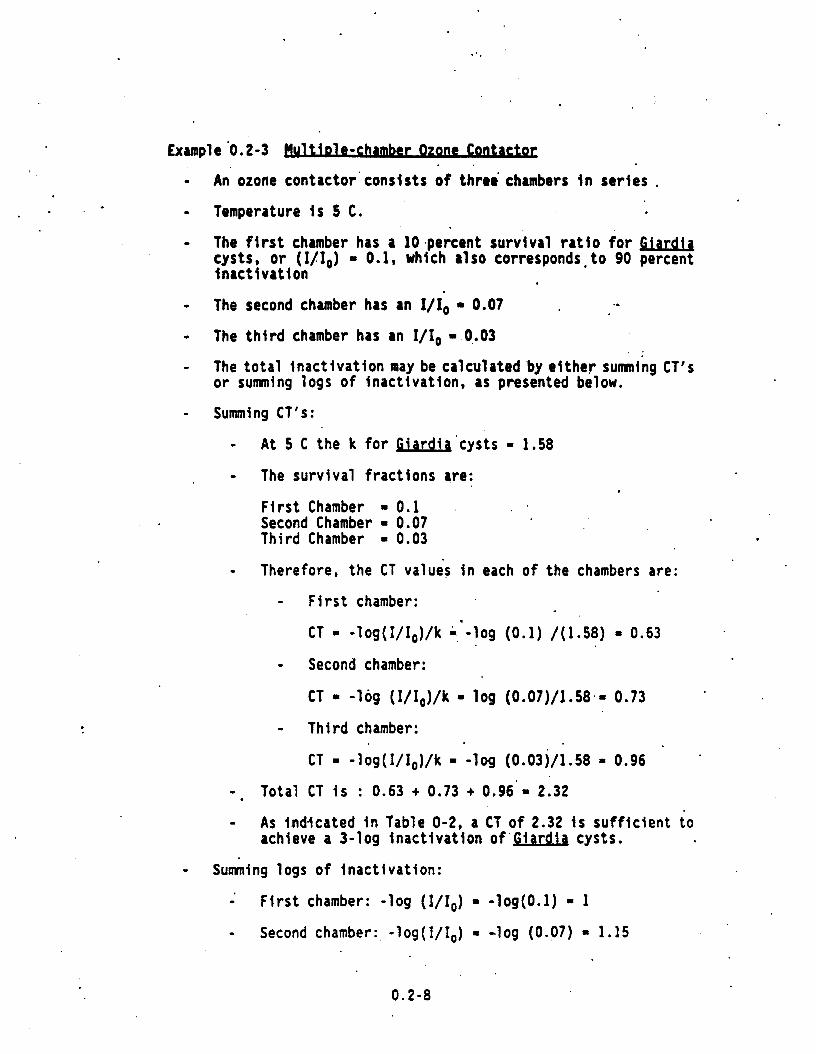
...
Example '0.2-3 ?!ultiD!e-chrmber Qzgm Contactor
- An ozofie contactor'consists o f three chambers in series . - Temperature is S C.
- The flrst chamber has a 10 .percent rurvlval ratio for Giardia cysts, or (111,) = 0.1. which rlso corresponds. to 90 percent inactivation
- The second chamber has an I/I, = 0.07 1.
- The third chamber has an I& =.0,.03
- The total inactivation may be calculated by either sumning CT's
- Summing CT's:
or summing logs o f inactivation, as presented .below.
- At 5 C the k for Eiardia'cysts - 1.58 - The survival fractions are:
First Chamber = 0.1 Second Chamber - 0.07 Third Chamber - 0.03
- Therefore, the CT values in each o f the chambers are:
- First chamber:
CT -log( I/Io)/k 4. -109 (0.1) /(1.58) 0.63
- Second chamber:
CT * -log ( I / Io) /k log (0.07)/1.58.= 0.73
- Third chamber:
CT -lOg(I/I~)/k -109 (0.03)/1.58 - 0.96 - Total CT is : 0.63 t 0.73 + 0.96 - 2.32 - As inddcated in Table 0-2, a CT o f 2.32 is sufficient to
achieve a 3-log inactivation of'Eiardb cysts.
- Summing logs o f inactivation:
-' First chamber: -log (I/I,) = -log(O.l) - 1 - Second ch,amber:, - log ( I/&,) - -log (0.07) 1.15
0.2-8

TABLE 0-2
Cl VALUES FOR ' INACTIVATION BY OZONE
. -
0.5 log
1 log
1.5 log
2 log
2.5 log '
3 log
Virus I n a c t i v a t i o n
2 log
3 log '
4 log
0.48
0.97
1.5
1.9
2.4
2.9
0.9
1.4
1.8
0.32
0.63
0.95
1.3
1.6
1.9
0.6
0.9
1.2
0.23
0.48
0.72
0.95
1.2
1 .4
0.5
0.8
1 .o
,O* 16
.O. 32
0.48
0.. 63
0.79
0.95
'0.3
0.5
0.6
0.12
. 0.24
0.36
0.48
0.60
0.72
.-
0.25
0.4
0.5
0.08
0.16'
0.24
0.32 '
0.40
0.48
..
' 0.15
0.: 25
0.3

TABLE 0-3
k,Values for Ozone 'Inactivation'''
TEMPERATURE (C) eLslLlL 29 25
Inactivation 1.03 1.58 2.08 3.12 4. ri' 6.25 o f E i a t d i q cysts
Inactivation 2.22 3.33 4.00 6.67 8.00 13.3 o f Viruses
k - -log(I/I, ,) /(Cl) in L/mg-min. When Chick's rule is repre- sented by the formula In(I/I ) -K CT (In stands for the natural logarithm) then k shoufd be calculated by k.= 2.303(K)

- Third chamber: -log(I/I,) - -log (0.03) 0 1.52
- The total logs of inactivation is:
-1Og (I/Io) 0 1 + 1-15 + f.52 I. 3.67,
c . .
- The 3.67-log inactivation o f Giardia cysts I s higher than the required 3-109 inactivation
0.2.5 m u s h S t i r r e d - m e t o r (CSTRI AParoa,& The CSTR method assumes that the f l o w configuration in the ozone .
contactor approaches that of completely stirred reactor. In most cases, this calculation method is the most conservative approach. Studies by Schwartz et a1 (1990) suggest that well-operated turbine contactors approach ideal CSTR characteristics and the CSTR calculation is appropri - ate. In some cases, CSTR calculations offer the only apparent method to evaluate the performance of the ozone contactors. CSTR calculations should be used under the following conditions i f systems have no other means for demonstrating the inactivation efficiency.
- Tracer data are not available,
- The required inactivation level is greater than 2.5-109; ozone disinfection is applied in a single chamber contactor with T,dHDT 1/3.
- If glther the required inactivation level is less than 2.5-log p~ T,dHDT > 1/3 then the inactivatfon predicted by CT, is appropriate provided that tracer data are available. If kigh resolution tracer data are available then the SFA method can be applied regardless of the level of inactivation required or the ratio of T,dHDT.
In some cases, systems may actually ‘receive mort’ credit by using the CSTR approach then by using the T,, approach. High& credits’result when a low level of ozone disinfection such as 0.5-log is requlred and’mixed ’
cont actors are used. When using the CSTR approach, the inactivation performance should be
evaluated for viruses and Eiardla cysts, regardless o f which required CT is higher. : This recommendation results from the influence of. flow characteristics on contactor performance, as discussed in Section 0.2.7.
. . The perf0,rmance equation for a CSTR is based on two important assumptions:
. . 0.2-9

1. . The concentration of disinfectant and ~icroorganitms Is homogeneously distributed in the contactor.
2, First order Chick-Watson's law applies. That is, the rate of inactivation of the microorganisms Is approximately proportion- al to the concentration of the. microorganisms and the concen- tration of disinfectant.
The performance of a CSTR contact chamber It given by: (I/Io) l/(l + 2.3OJ(k)C(HDT)]
- - . , (4)
Where:
k - kinetic coefficient for microorganism inactivation (k values are listed in Table 0-4 (L/mg-min)]
(I/Io) - Survival ratio of organisms
C 0 Averqge concentration of disinfectant (mg/L) . .
HOT - Hydraulic detention time (min)
Equation 4 may also be used to calculate the ozone concentration that is required to achieve a specified'level of inactivation for a given HOT or to compute the HDT required to achieve a desired. inactivation level for a given ozone concentration. Equation 5 restates Equation 4 for use in determining C or HDT
C(HDT) [l-(I/Io)]/[2~303 k (I/Io)J (5)
The effects of mixing on improving disinfection effectiveness may be very significant in CSTR contactors, and are not accounted for in this model.
Examples demonstrating how to calculate the operating conditions necessary to meet the required Inactivation levels by the CSTR approach are included in Section 0.2.8.2.
0.2.6 Seareaated Flow Analvsls t S F A l SFA is a method that i s often used to characterize chemical
reactions. Better approximations may be determined through analysis and modelling o f the specific detai1.s of the flow pattern in the' ozone
0.2-10

contactor, but such modell ing cannot be done based on tracer studies alone, as the SFA can. Comprehensive descriptions of the SFA can be found in several r.eferences including Levenspiel (1972) and Seinfeld and Lapidus (1984). The SFA assumes that the inactivation in a contactor 'can be
'. determined by the product of the probabilities of two events: the probability distributioh for water to remain In the contactor; and the * . . probability distribution for organisms to survive as they pass throuQh the contactor.
The first probability function describes the chances of 8 microor- ganism remaining in the contactor for a specified time period. The water passing through the contactor has a probability distribution, determined by tracer studfes which indicate the detention time for each fraction o f the flow through the contactor.
The second probability function describes the chances of a microbio- logical species surviving following exposure to a disinfectant for a certain amount of time. This probability function is given by the modified Chick's equation: (I/Io) 10*kc'. Each fraction of the flow would
. have a different "t" for which this equation would apply. For example, a virus that is exposed for 1 minute to C-1 mg/L ozone when k-1 L/mg-min has . .,
a -
. 0.1 (IO percent) chances to survive.. The following illustrates the intuitive origin of the SFA approach:
- The flow in an imaginary contactor may be viewed by flow tines. 1
...-
- A microorganism that is introduced at time t-0 will follow one
- for simplicity, consider that only four flow lines exist as represented on Figure 0-7.
- A microorganism that is introduced in the feed to the contactor has some probability (Pl) of following any one of these four 1 ines.
- The microorganism will then remain for a specific detentfon time, characteristic of each flow line, in the contactor. .
- This concept is .presented schematically on Figure 0-7, where . . the flow lines are represented by four different tubes whose . lengths (or detention times) correspond to the lengths of the flow lines on Figure 0-7.
of these flow lines.
0.2-11
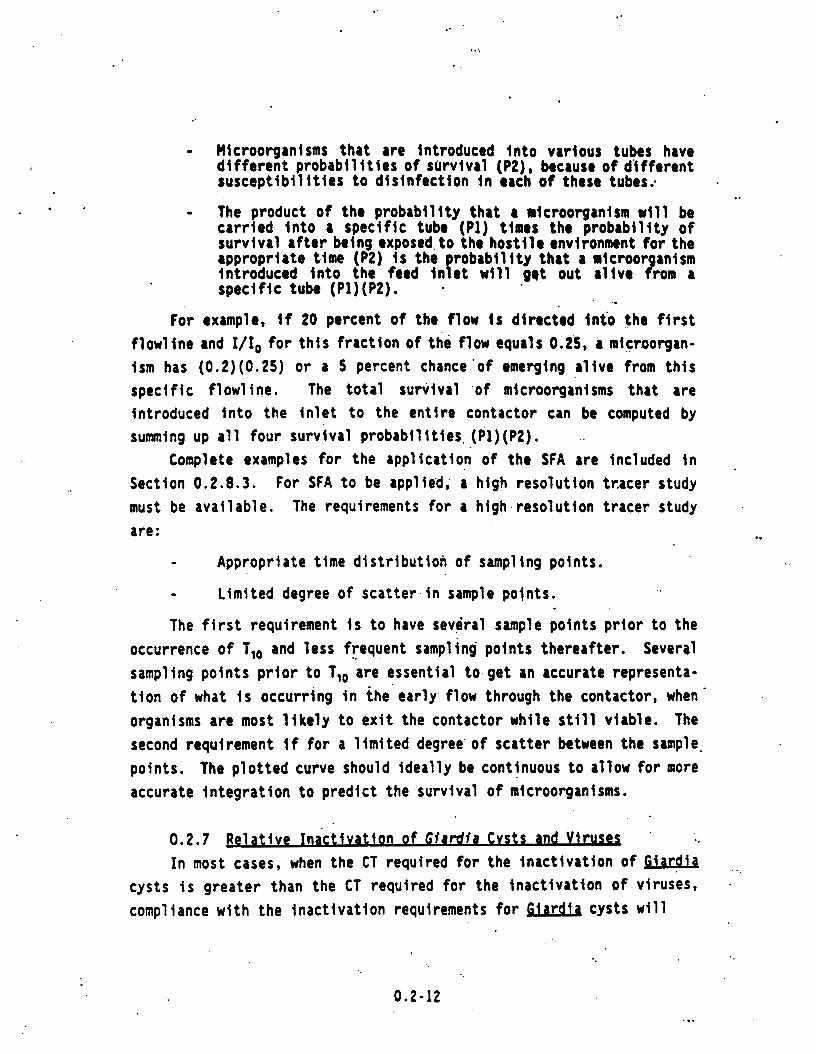
- Microorganisms that are introduced into various tubes have different probabilities of survival (PZ), because of dlfferent susceptibilities to disinfection in each of these tubes..
- The product of the probabil ity that a microorganism wit 1 be carried into a specific tube (Pl) times the probability of survival after being exposed,to the hostile environment for the appropriate time (P2) is the robability that a microorganism introduced into the feed in ! et will 91t out alive f r o m a specific tube (P l ) (P2) .
for example, if 20 percent of the f low I s directed into the first flowline and I/Io for this fraction of the flow equals 0.25, a microorgan- ism has (0.2)(0.25) or a 5 percent chance'of emerging alive from this specific flowline. The total survival 'of microorganisms that are introduced into the Inlet to the entire contactor can be computed by summing up all four survival probabilities. (P l ) (P2) .
Complete examples for the application of the SFA are included in Section 0.2.8.3. For SFA to be applied; a high resolution tracer study must be available. The requirements for a high'resolution tracer study are :
..
.-
.. - Appropriate time distribution of sampling points.
- Limited degree of scatter.in sample points.
The first requirement is to have several sample points prior to the occurrence of T,, and less frequent sampling points thereafter. Several sampling points prior to T,, are essential to.get an accurate representa- tion o f what is occurring in the early. flow through the contactor, when organisms are most likely to exit the contactor while still viable. The second requirement if for a limited degree' of scatter between the sample. points. The plotted curve should ideally be continuous to allow for more accurate integration to predict the survival of microorganisms.
0.2.7 pel ative Inactivation o f G i a r d i a Cvsts and Virus= In most cases, when the CT required for the inactivation o f Giardia
cysts i s greater than the CT required for the inactivation of viruses, . . .
compliance with the inactivation requirements for Giardia cysts will
0.2-12

A, fLOW LlNLS IN A CONTACTOR I
W U T
OUTPUT
0. SCHEMATIC RLPRLSENTATION O f THE fLOW LINES
C. SURVIVAL P R O B A B l l I l Y FOR A N ORGANISM
i 2/10 .1/4 16/320
2 4/10 1/8 16/320
3 1/10 1/16 2/320 *
4 3/10 1/32 ' 2/3Zp
SUM 1 311320
. .
FIGURE 0 - 7 - PRINCIPLE OF SEGREGATED FLOW ANALYSIS

assure compliance with the virus inactivation requirements, Specifically, this is true .when':
The SUTR, however, requires a higher level o f inactivation of viruses than Giardia cysts.' Therefore, ozone contactors that are charaCtrrized by a high degree of turbulence will find that, as the flow configuratlon approaches that of a CSTR (T,dHDT < 1/3), compliance with the virus inactivation requirements may be a more demanding task than meeting the inactivation requirements for Giard ia cysts. Consequently, an ozone contactor that. has a T,dHDT < 1/3 and a low (I/I,) should be checked for
. compliance with the inactivation of viruses as well as for cysts. Another way to understand this is that as the inactivation indicated by CT,, increases, the 10 percent of the water passing through the contactor with less contact time than T,, becomes more significant for iowering the overall inactivation efficiency for all the water passing through the contactor,
0.2.8 Jxambles o f Determinina Contact Time (11 This section presents examples for the application of. the three
general approaches - l,,, SFA, and CSTR - for determining contact time. 0.2.8.1 Evaluafion Usina T,, The following four examples illustrate when the Tlo approach should '
be used and when alternate approaches are appropriate. Procedures for. calculating the required ozone residual based on the T,, approach are outlined in the examples.
Example 0.2-4 m t i v a t i o n Reauired >2.5-1oq The Haworth Water Treatment Plant, Hackensack, New Jersey, uses a
turbine qtone chamber followed by a contact chamber to provide additional contact time. A schematic o f the contactor is shown on Figure 0-1. The treatment .plant provides filtration after the ozone cantactor. For the purposes o f this example, a1 though i t is not the case for Hackensack, the
0.2-13

[/ . % ozone system must provide disinfection for 2-log fiiardia and 3-log virus inactivation to supplement filtration. The following conditlons apply: . . *
Water Temperature 0.5 C CT for 2-109 Giardia = 1.9 mg-min/L CT for 3-log virus = 1.4 mg-min/L
- A tracer study was conducted on one o f the four ozone contact- ors. Figure 0-8 depicts the chart recorder of the raw data
. that were collected during the tracer study.
- The HOT at the flow rate o f the study was 20'ainutes. and the . '
- The 1,dHDT of 0.55, is greater than 1/3, making the T,,
T,, occurs at 11 min.
approach Val id for this system.
_ .
- The CT for $fardip inactivation is the controlling CT because it is greater than the CT for virus inactivation.
- Using the T,, o f 11 min, the residual needed to meet the CT requirement of 1.9 mg/L-min is determined as follows: .
- As a result of using the T approach, the system must maintain an ozone concentration o f b.17 mg/L in the contactor to provide .the necessary dlslnfection.
The applicati'on o f the S A method for this contactor is presented in
. .
Section 0.2.8.3. .
Example 0.2-5 l o w Detention Time. Inactivatlon Reauired ~2.5-1oq A system using slow sand filtration must provide disinfection for 1-
log Giardia cyst and 2-log virus inactivation. The .system has an ozone contactor equipped with a turbine mixer. The folloiing conditions apply;
Water Temperature = 25 c . CT for l - log Eiardia = 0.16 mg-min/L CT for 2-109 virus - 0.15 mg-min/L
, -
- The CT for Giardia.cyst inactivation is greater than the CT for vi.rus inactivation and is therefore the controlling CT.
- A tracer study was conducted for the ozone contactor 'and resulted i n a T,, of 30 seconds.
. . 0.2-14 .
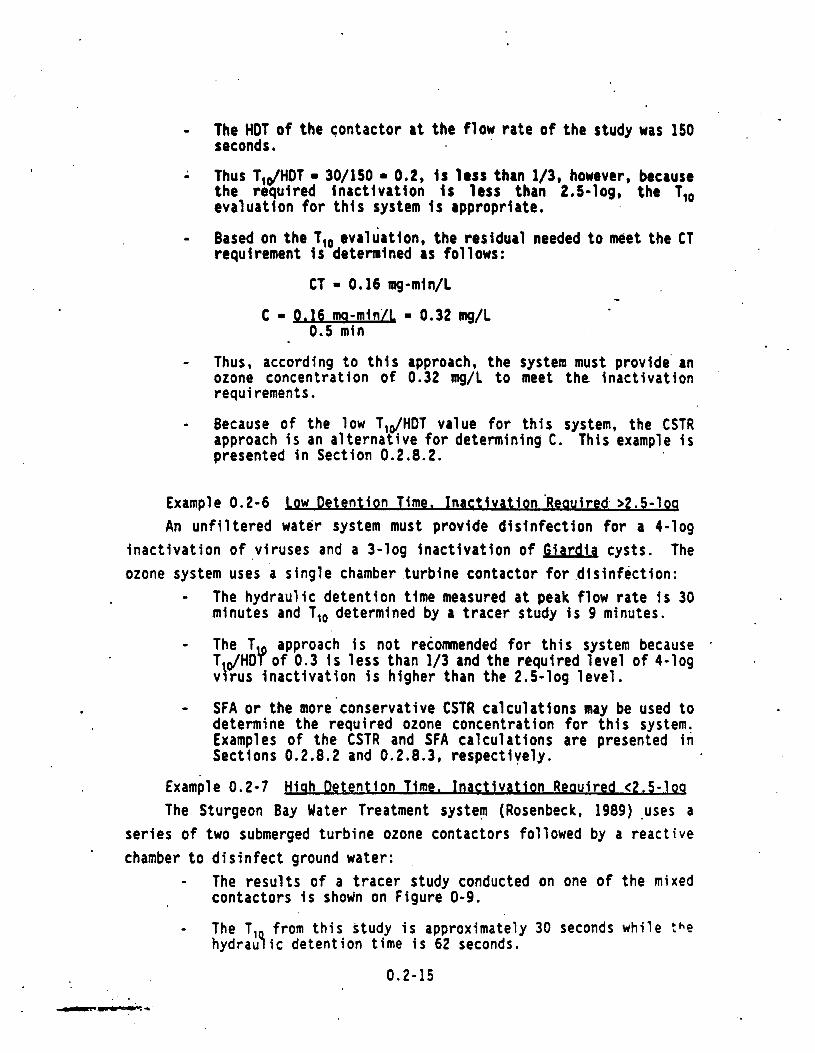
- The HOT of the contactor at the flow rate of the study was 150 seconds.
- Thus T,dHDf - 30/150 - 0.2, is less than 113, however, because the required inactivation i s lest than 2 ,54og , the T,,, evaluation for this system i s appropriate.
- Based on the T,, evaluation, the residual needed to meet the CT requirement is determined as follows:
CT - 0.16 mg-min/L C - 9.16 ma-minll - 0.32 mg/L
0.5 min
- Thus, according to this approach, the system must provide' an ozone concentration of 0.32 mg/L to meet the inactivation requirements.
- Because of the low T,dHDT value for this system, the CSTR approach is an alternative for determining C. This example is presented in Section 0.2.8.2.
Example 0.2-6 l o w Detention Time. Inactivation 'Reauired >2.5-109 An unfiltered water system must provide disinfection for a 4-log
inactivation of viruses and a 3-log inactivation o f Giardia cysts. The ozone system uses a single chamber .turbine contactor for ,disinfection:
- The hydraulic detention time measured at peak flow rate is 30 minutes and T,, determined by a tracer study is 9 minutes.
- The T approach i s not recommended for this system because T dHD? of 0.3 is less than 1/3 and the required level of 4-log virus inactivation is higher than the 2.5-log level.
- SFA or the more conservative CSTR calculatfons may be used to determine the required ozone concentration for this system. Examples o f the CSTR and SFA calculations are presented in Sections 0.2.8.2 and 0.2.8.3, respectively.
Example 0.2-7 Hiah Detention Time. Inactivation Reauired <2.5-loq The Sturgeon Bay Water Treatment system (Rosenbeck, 1989) .uses a
series of two submerged turbine ozone contactors followed by a reactive chamber to disinfect ground water:
- The results of a tracer study conducted on one o f the mixed contactors is shown on Figure 0-9.
- The T, from this study is approximately 30 seconds while t h o hydraulic detention time is 62 seconds.
0.2-15

- T d H o T m 30/62 = 0.48 which Is reater than 1/3. Therefore, tbe T,@ approach Is approprlrte I or thls system.
In this case, the SFA method Is not recomnended as an alternative to the T,, approach because of the nlnimal detentlon times Inethe contactor. With such a short period for the collectlon of simples, the data are lnsufficlent for the SFA method. The resolution of the tracer studies, apparent in Figure 0-9, will lead to an .overly, contervatlve'estiutate of the inactivation if differentiation is conducted by 8 forward algorithm.
0.2.8.2 Evaluations Usina CSTR Calculatiou The following two examples demonstrat? the CSTR approach. One illus-
. trates the benefit of the CSTR analysls over the T,, analysis. The other identifies conditions for which the CSTR. approach . . Is not practical.
Example 0.2-8 bw Detention Time. Inactivation Reauired (2.5-10q The system identified in Example 0.2-5 is a slow .sand filtration.
plant, using ozone to provide for a 1-109 Eiardla cyst inactivation. Chlorine provides the 2-109 virus Inactivation. Because the level of inactivation required from ozone disinfection is less'than e2.5-109, the system may 'choose any method for the detdrmlnation of the * . contact time.
- A tracer study conducted on the ozone contactor resulted in a . T,, of 30 tec for a. HDT o f 1.50 sec.
- The fraction of T,dHOT is 0.2, which Is less than 1/3, indicating that the CSTR approach may be appropriate.
- Chlorine provides disinfectfon for the viwses, therefore the CSTR calculation for the ozone disinfectfon requirements will
' be based on Elardlq cyst inactivation.
- The following conditions apply:
Water Temperature m 25 C * CT for 1-1,og Giardia cyst 0.16 rirg-min/L
.0.2-16 - 7 .
*.- .* : .3-


z 0
i w 0 Z
- 0 0 W c3
0 E
2 8
f N
' 3
a 0 z
10 30 so 170
. .

.
- The parameters are determined as follows: +
1. From Table 0 - 3 , k,,, 6.25 for C T 0.16 min/L at 25c - *
2. For 1-109 inactivation, I/I, 0.1
3. HOT - 150 see or 2.3 min
- C is detertiined as follows: C(HDT) - (0.9]/[(2.303)(6.25) (0.l)J - 0.625 mg-min/L
. C- 0.625/2.5 - 0.25 mg/L
Thus, according to the CSTR approach, the system must provide an ozone concentration of 0.25 mg/L to meet the inactivation requirements. For this case, the system would prefer to use the CSTR approach rather than the T,, approach since the T,o approach would require a 0.32 mg/L ozone residual, as shown in Example 0.2-5.
Example 0.2-9 L o w Detention lime. Inactivation Reauired >2.5-l0q An unfiltered water system must provide disinfection for 4-109
inactivation 'of viruses and 3-log inactivation of Bardia cysts. The system uses a single chamber turbine ozone contactor. Hydraulic'detention time measured at peak flow rate is 30 minutes and T,, determined by tracer studies is 9 minutes. T,dHDT i s less than 1/3 and greater than 2.5-log inactivation is required, therefore the T,, approach should not be used. The CSTR or SFA methods are appropriate.
- The C S T R calculation must be conducted for both Giardia cysts
- Compute the C required for inactivation of $fardid cysts:
and viruses to determine the controlling parameter
- k cysts - 6.25 (Table 0 - 3 ) .
- For 3-log inactivation, 1/10 - 0.001 - Using the CSTR equation:
C(HD1) - (1-0.001 ]/[2.303(6.25)(0.001) J 69.5 mg-min/L
C - (69.5'mg-min/L)/(30 min) - 2.3 mg/L .

- Compute the required C for Inactivation of viruses:
- IC,,,- - 13.3 (Table 0-3)
- For 4-log Inactivation I/Ie = 0.001
- Applying the CSTR Equation:
C(H0T) [1 - 0.0001]/[(2.303) (6.25) (O.OOOl)] - 326 q-min/L C - (326 mg-mln/L)/(30 min) - 10.8 q / L
.-
As indicated, virus Inactivation i s the controlling parameter, requiring a C of 10.8 mg/L. Because of the hlgher ozone residual needed for the virus inactivation, this example illustrates why systems shbuld verify compliance with the inactivation requirements for viruses as we11 as for the inactivation requirements for Giardia cysts. Since'obtaining an ozone residual of 10.8 mg/L is unrealistic, this example illustrates how stringent disinfection conditions can become assuming CSTR character- istics. Consequently, the SFA would result in a more feasible residual' requirement for this system.
0.2.8.3 m u a t l o n s Usina SF4 The S A method can be conducted on spread sheets. Table 0-4 presents
the calculation procedure in spread sheet notations for a step tracer input:
- The first column of Table 0-4 represents the sequenti,al numbering o f consecutive tracer study measurements or digital measurement points fed into the. computer.
- The second column represents the time Interval that elapsed between the step change in tracer concentration and' the sampling o f the specific tracer point.
- The third column represents the tracer effluent concentration at a point in time determined by the analyzer (spectropho- tometer conductivity meter, etc.) reading.
- The fourth column represents the tracer response on a scale of 0-1. where 0 corresponds to background reading of the analyzer and 1 to ultimate response after a long time interval. In other words, it is C /t&, where C,, is the tracer concentra- tion in the outlet 8 the contactor and C,, is the baseline tracer concentration in the inlet.
0.2-18

si!q . F(0.
n t n hn fn' I I ,A0
TRACER CURVE FROM STEP INPUT *
NOTE: GUIDANCE FOR CONDUCTING TRACER STUDIES IS GIVEH IN APPENDIX C
i
TABLE 0-4 -SPREAD SHEET NOTATIONS OF SEGREGATED FLOW ANALYSIS FOR A STEP TRACER

. . . _ .
- The fifth column represents the fornard derivative of the F(t) response. It is the slope of the tracer curve at a specific t iae interval, or the rate rt which C,/C, ctian e t with respect to time at different intervals in time. .kote t!at by forward evaluation of the derivative: E(t) - [f(t+dt)- F(t)]/dt the E(t) curve i s shifted by half a dt 'toward the origin.
margin to the calculation. * Systems can reduce this safety margin by collecting more tracer points at the initial period of the tracer response, when the response is starting to increase.
. . - This method of differentiation introduces an inherent safety'
. .
- This period has the largest effect on the accuracy of the tracer analysis because most of the contribution to the total survival of microorganisms comes from the organisms that remain only for short time interval in the contactor.
- The sixth column represe'nts Chick's inactivation rule, computed at the concentration and the appropriate
- The seventh column represents the survival expectancy function (Es(t) - E(t)(lO"e') which is the product of columns 5 and 6.
- The eighth column represents the organism survival in each segment passing through the contactor, It is also known as the integral o f the survival expectancy function (Et presented in the 7th column).
- The survival ratio (I/I,,) is ' the sum of column 8. This represents the sum of organi3m. survival In all the water segments passing through the contactor.
tion i .e., quadratic integration). Other integration methods can a I so be used.
- Table 0-4 illustr'ates only one f o k of performing the integra- -
- The corresponding 'log inactivation and the corresponding calculated CT may be computed by the procedures outlined in Section 0.2.4.
The following examples illustrate the use of the SFA method to calculate conditions in ozone contactors, and a situation where SFA cannot be used.
Example 0.2- 10 Jurbi ne Cont acm As noted in Example 0.2-4, the ozone system at Haworth Water
Treatment Pl ant, uses a turbine ozone chamber foll owed by a react.i ve
0.2-19 :.--
.,. ~
a- *-.

chamber to provlde.addl t lona1 contact tlme. A tracer study was conducted on one o f the COntaCtOrS resu l t i ng I n a T,, Value o f 11, minutes for a HOT of 20 minutes. Uslng the same condltlons as the above c l t e d ixample, the SFA will be conducted on the t racer data. The fo l l ow ing I l l us t fa tes a step by step procedure f o r conducting a SFA:
. .
- The d lg i t l zed t race r response (f(1)) I s deplcted I n Figure 0-10
- I stands for the consecutlve numbering o f randomly chosen
as a funct ion of t (1 ) where: .- .
points from .the tracer study chart, and
- t( i) i s t h e corresponding time coordlnate.
- The slope o f the tracer curve, also known as the density of the expectancy function, E ( t ) approximated by the fo l lowing equation I s depicted i n Flgure 0-10.
E ( i ) - [F(i+l)-F(i)l/[t(~+l)-t(l)] - The d ig i t i zed po ln ts were no t t rans la ted In to a smooth curve
i n order t o avoid numeric comprornlses. '
- The surv iva l expectancy (Es(t)) was then calculated by Es(i)=Et (i) ( 10*kc"i') and summed to g i ve t he su rv i va l ra t i o ( I / I o ) as shown i n Table 0-5.
- Figure 0-11 depic ts the in tegrat ion f o r conditions where the ozone residual i s C - 0.15 m g / L .
- The cumu la t i ve sup iva l ra t l o i s 0.00982 which I s below 0.Oi assuring compliance wit.h the 2-109 o r 99 percent inact ivat ion requirement for Giard ia cysts . A s u r v i v a l . r a t i o of cO.01 corresponds t o an inact ivat ion of greater than 99 percent o r 2-109.
The residual value determined from this method I s lower than C-0.17 *
mg/L predicted by the T,, approach presented i n Example 0.2-4. Although th is example only shows a small d i f fe rence I n C values needed, other cases may r e s u l t i n a greater reduction of C compared t o t h e C resu l t i ng from the T,, approach.
0.2-20
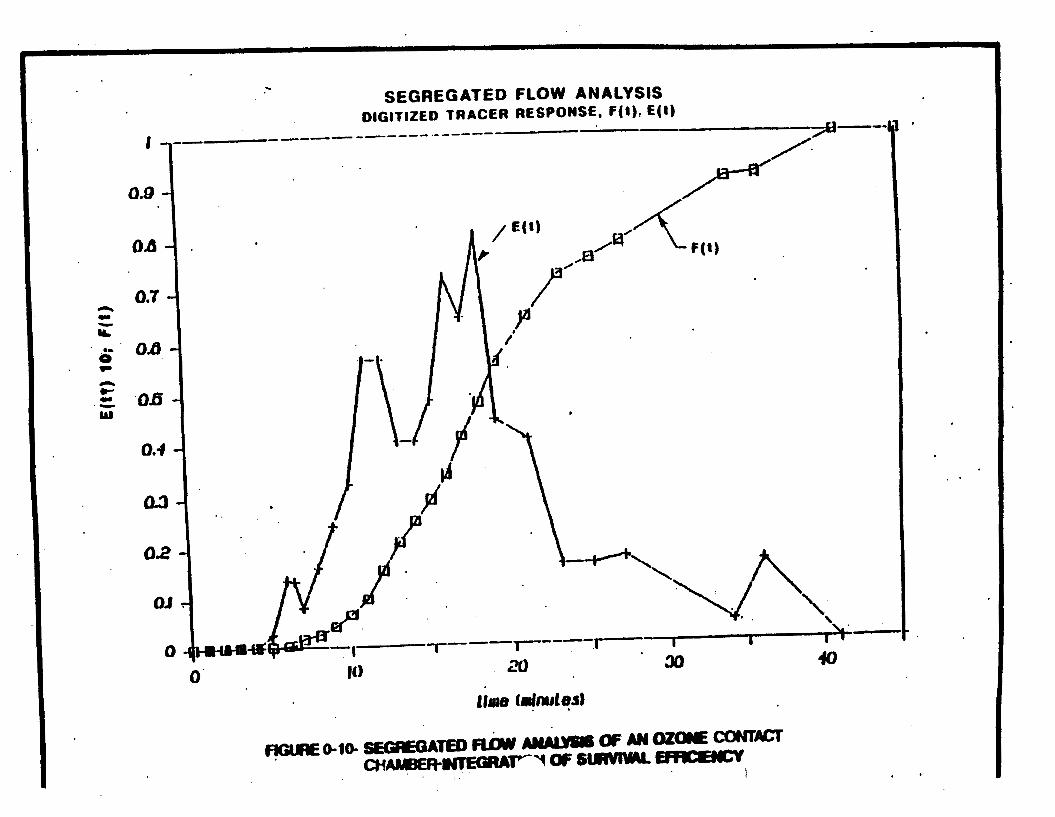
. *

TABLE 0-5 .. Segregated Flow Analysls . *
o f an Ozone Dlslnfactlon Contactor at Hackensack .
0 0.0 0.000 0.000 0.000 0.000 0 000 0.000 0.002 0.014 0.013 0.008 0.016 0.024 0.032 0.056
1 2 3 4 5 6 6.5 7 0 . 9 10 1 1 12 13 14 15 16
. 17 . 18
19 21 23 25 27 34 36
' 41 45
0.0 0.0 0.0 0.0 0.0 0.3 0.5 2.0 3.0 5.0 8.0 12.0 19.0 26.0 31 . O 36.0 42.0 51 .o 59.0 69.0 80.0 90.0 94.0 98.0 113.0 114.0 124.0 124.0
0.000 0.000 0.000 0.000 0.000 0.002 .O. 004 0.016 0.024 0.040 0.065 0.097 0.153 0.210 0.250 0.290 0.339 0.411 0.476 0.556 0.645 0.726 0.758 0.790 0.911 0.919 1.000 1.0000
1,000 0.708 0.502 0.355 0.252 0.178 0.126 0.106 0.089 0.063 0.045 0.032 0.022
0 00000 0.00000 0.00000 0.00000 0.00000 0.00043 0.00173 0,00143' 0.00072 0.00102 0.00108 0.00102 0.00127
. - 0.00000 0.00000 '
0 00000 0.00000 0.00000 0.00013 0.00035 0.00215 0.00072 . .0.00204 . 0.00324 0.00408 0.00889
0.056 0.016 0.00090 ' 0.00630 0.040 0.040 0.048 0.073 0.065 0.081 0.044 0.040 0.016 0.016 0.017 0.004 0.016 0.000 0.000
0.011 0.008 0.006 0.004 0.003 0.002 0.001 0.001 0.000 0.000 0.000 0.000 0.000 0.000 0.000
0.00045 0.00032 0.00029 0.00027 0.00018
0.00006 0.00003 0.00001 0.00000 0.00000 0.00000 0.00000 0 ~00000 0.00000 .
0.00016
0.00225 0.00160 0.00174 0.00243 0.00144 0.00160 0.00066 0.00030 0.00004 0.00000 0 00000 0.00000 0.00000. 0.00000 '
0.00000
s(E,)Pt . + - I / I , 0.00982
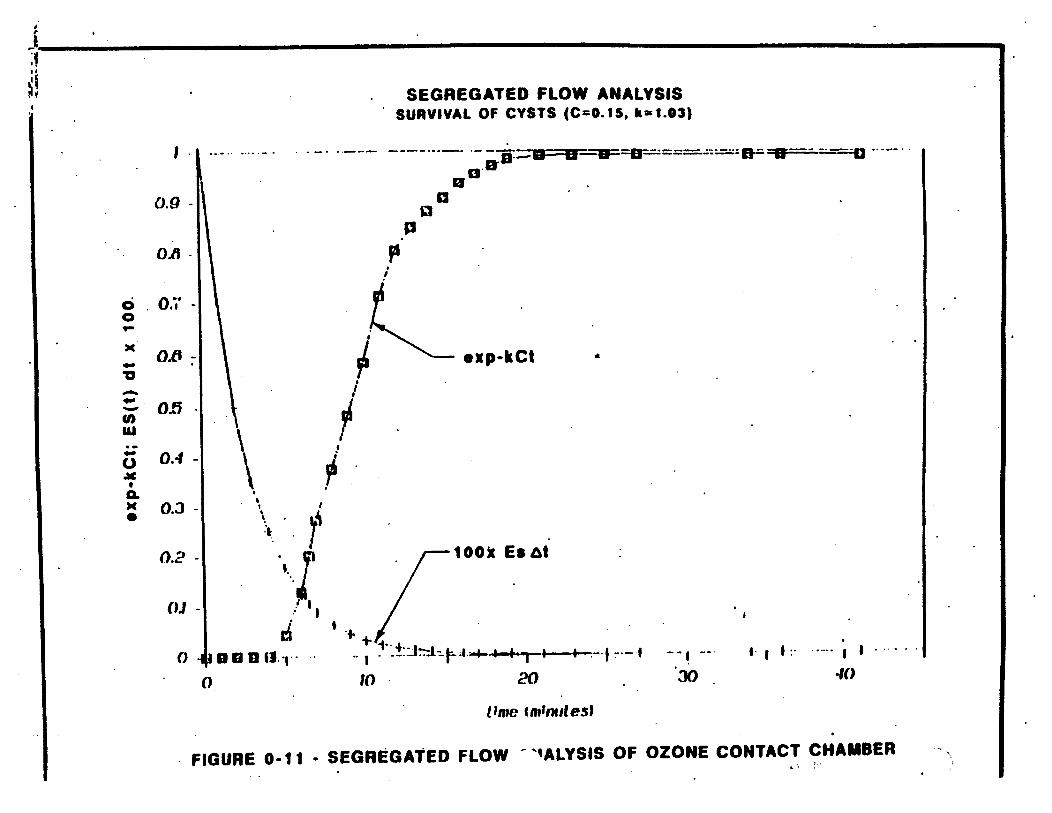
0 0 P
X
U Y
~- c
v) w - 0.5
0.2
0
. SEGREGATED FLOW ANALYSIS ' SURVIVAL OF CYSTS (c=O.lS, k ~ 1 . 0 3 )
__... - . .
II a P
r' i
p' . '
FIGURE 0-1 1 - SEGREGATED FLOW -'qALYSIS OF OZONE CONTACT CHAMBER -x...
. . b i . I ,

0.2.9 ESTIMATING T . .
The results of this section are turmrdritcd in Figure , 0 4 2 . The .
decision tree shows the appllcable methods o f estimating f for each approach, and provides a quick m a n s to compare alternatives and mdkc d
selection.
0.2-21

I
* I NO
FIGURE 0- f 2 - DECISION TREE FOR ESTIMATING T
' 0.3 .DETERMINATION OF OZONE CONCENTRATION (C)
0.3.1 Jntroductiu This section presents ways to wasure or estimate the- ozone
concentration, C, for the calculation of CT. An alternative, more 0
elaborate concept, requiring better characterlzation of the hydrodynamics of the ozone contactor Is presented in Section 0.4 of this appendix.
€PA recommends use. of the average dlssolvtd ozone concentration in the water for C for all types of ozone contactors. The average concentra- tion may be determined by m e of following methods:
1. Direct measurement of the concentration profile of dissolved ozone in each contact chamber
2. Indirect prediction of the average concentration by assuming a set o f conservative correlations between an observed variable such as the concentration of ozone in the outlet from the ozone chamber and the average concentration within the ozone chamber.
The application of these methods to estimate the average concentra- tion should take into account the gas/liquid flow configuration in the . ozone contactor. The next section presents a short discussion of the types of liquid/gas contact in ozone chambers, followed by two sections that describe the methods to estimate the average concentration in the chamber based on simple measurements.
Classification of Ozone Chamber2 Ozone contactors currently in use or in design stage in the US may
be classified into four types of flow configurations as illustrated on. Figure 0-13. This, o f course, does not preclude the use of other types of contactors. The four configurations are as follows:
1. Continuously Stirred-Tank Reactor (CSTR):
Ozone contactors using turbine agitators, where the water may be,considered uniformly mixed as shown on Figure 0-13, diagram 1.' Studies conducted in a full scale turbine contact chamber indicate that turbine contactors may. be considered Uniformly
0 . 3 - 1

2.
3.
i
mixed (Schwartz. et, a1 , 1990) This study was conducted in the first contact chamber under conditions of high ozone demand. Therefore, it is assumed that under less stringent kinetic conditions, turbine contactors can still be considered uniform- ly mixed. '
Counter-Current Flow Chambers
In these chambers, the water flows opposite the direction o f , the gas bubbles. For example, the first and third chambers in the Cos-Angeles ozone trert~nent system, as shown on Figure 0-2. Co-Current F1 ow Chambers
-
. .
4.
In these 'chambers, the gas bubbles and the water flow in the same direction. For example, the Deep U-Tube contactor shown in Figure 0-5 and the Static Hixer contactor. This is the case also for the conventional gas/l iquid contact chambers such as the second contact chamber in the configuration designed for the East Bay MUD water disinfection system, as shown on Figure 0-4
Reactive Flow Chambers
In these chambers, no gas (and ozone) is.being introduced into . the chamber or conduit . The second and fourth thambers of the Los Angeles water disinfection system are reactive chambers (Figure 0-2).
. .
0.3.2 Qirect Measurement of € Direct measurement of the dissolved ozone concentration is the
preferred method to determine the ozone concentration in ozone contact chambers. However, very little full scale experience is currently available with this type of measurement. Some guidelines were developed based on the limited studies conducted at the Haworth, NJ (Schwartz et a1 . 1990) and Los Angeles water treatment systems (Stolarik and Christie, . 1990). The guidelines developed for direct 'measurement of ozone concentration in the liquid phase are detailed in the following sections.
' Anal Yte Each Chamber SeDaratel y
Every chamber of a multiple-chamber unit should be analyzed separate- ly. Different chambers in series exhibit different ozone consumption rates and reactivities .and, therefore, are likely to have different dissolved ozone prof i 1 es.
0.3-2
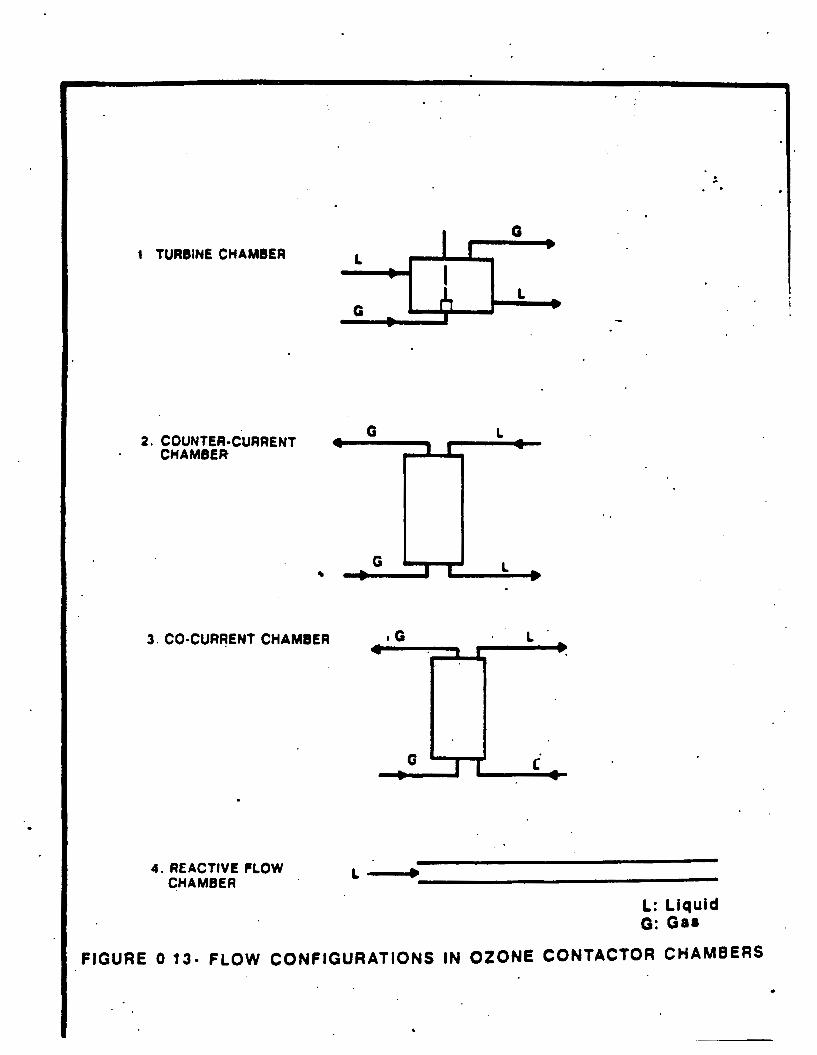
.
1 TURBINE CHAMeEA
2. COUNTER-CURRENT CHAMBER
4. REACTIVE FLOW CHAMBER
3 . CO-CURRENT CHAMBER
L d
L: Llquid 0: Gar
.

Avoid Interference From Gas Bubbles Gas bubbles may strongly interfere with the measurement of Ozone
concentration, particularly if some bubbles are carried into the sampling ,
. taps. This interference may be reduced by directing the tamp1 irig port .-.
opposite to the direction of the bubble flk In order to prevent gas from ."
entering the sampling tube. Additionally, the operator should verify, by , ."* 4. .
visual inspection, that the sample water does not contain gas bubbles. 9.- v
Systems using in-situ ozone analyzers should be careful to prevent direct contact of gas bubbles with the measuring probe which I s usually 9 gas permeable membrane. Such contact may bias 'the measurements and give high results.
binimize Distan~ge to Qrone Analvzers Minimize the distance frpm the sampling ports to the Ozone analyzer
to limit ozone consumption by reducing agents in the water. This conslderat ion is particularly important when evaluating the concentration ..
,' profile in chambers with high ozone demand such as the first chamber .in multiple-chamber units.
..d . provide ProDer SDacial Distribution The vertical profile of the ozone concentration in ozone contact 1 -F %.
-i..
-~.. ~
chambers should be measured in at least five vertical locations and at least two different horizontal locations for each vertical sampling point
: within the contact chamber. Each sample should represent the time averaged concentration at the specific location. This may be achieved by sampling a large volume of water into a contafner and analyzlng the water by the indigo trisulfonate method (Bader and Hoigne, 1982). In-situ. measurement of ozone should be carried out over a sufficient time interval to suppress temporal fluctuations. Such instruments should be initially calibrated by the indigo trisulfonate method. Facilities that have more than 25 percent deviation between the average concentration at two horizontal locations should collect addltlonal measurements at a third location. The average of a1 1 measurements may tie taken as the average concentration of dissolved ozone in the ozone contact chamber. For systems with a .'symmetrical vertical distrlbutlon of ozone Concentration
.s . .-
the vertical. sampling points should be equidistant. Systems with an ,asymmetrical distribution of avallable sarnpllng points can perform an integration of the data, to estimate the rverage concentration in the '
chamber. An example of this 1s given at the end of this section.. Some contact chambers, such as the Deep U-Tube chambers, static
mixers and reactive flow chambers have a high length to width ratio, where the length of the chamber in the direction of fluid flow is greater than four times the cross section length. These chambers have more uniform radial concentration profiles, , el iminoting the need to hasure the concentration at various vertical or horizontal locations. Therefore, measuring the concentration profile at several points along the flow path should be sufficient to accurately. determine the average concentration.
I
Select Reoresentative Locations All sampling positions should be placed in representative locations,
avoiding stagnant zones and zones near the wall. Measurements in stagnant '
' locations will lead to low values of the average reqidual concentrations. . While measurements at the wall may result in, either an underestimate or overestimate of the residual depending on the ozone flow pattern.
Systems having two or more identical parallel ozone contact chambers may determine the average ozone concentration by measuring the concentra- tion profile at one horizontal location in each contact chamber. These systems should, however, show by dual or triple horizontal measurements in at 1,east one of the parallel chambers that the measurement in the particular horizontal location adequately represents the concentration profile in the contact chamber.
-. -
amDle 0.3-1 A system with a co-current chamber with dimensions of 10' X 10' x 20'
was sampled to determine the average concentration in the chamber. In accordance with the recommended guidelines, the' following samples' were taken:
. .
0.3-4
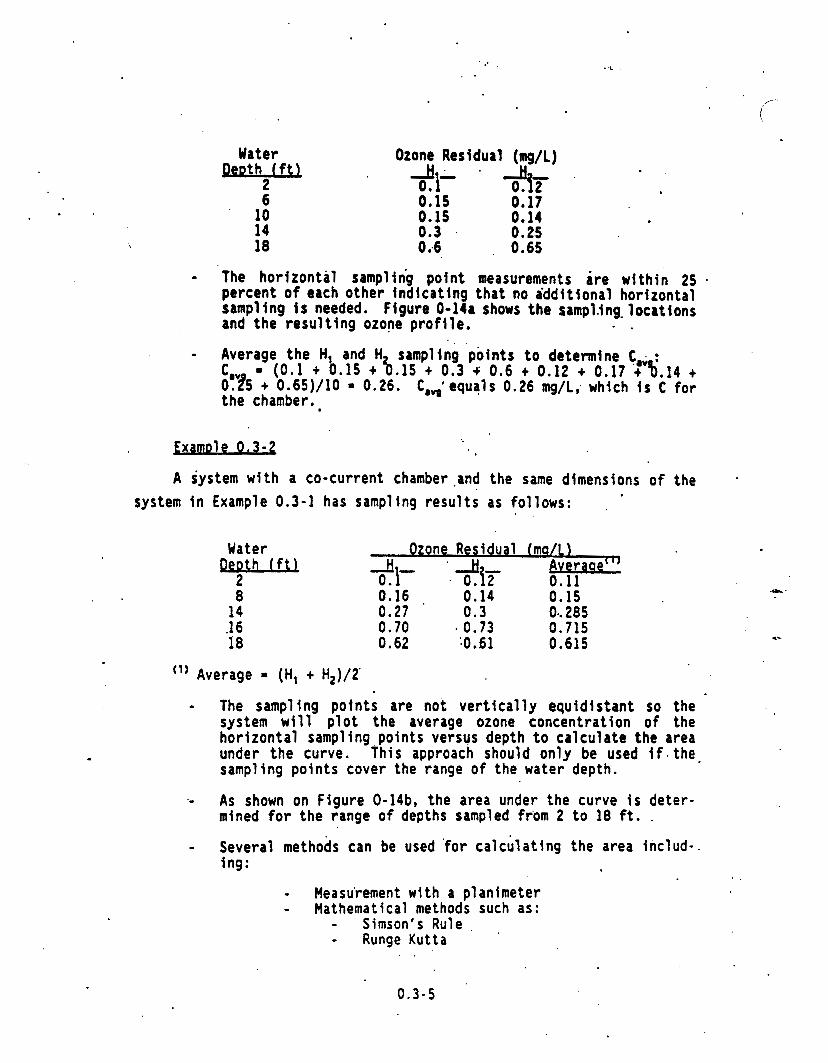
.. .
Water Ozone Residual (mg/L)
6 0.15 0.17 ' 10 0.15 0.14
14 0.3 0.25 18 0 ..6 , 0.65
PeDth (ftl 2 +io . *T
- The horizontal sampling point measurements are within 25 percent of each other indicating that no additional horizontal tamp1 ing is needed. Figure 0 4 4 r shows the tamplrlng. locations and the resulting ozone profile. - .
- Average the H and H sampling points to determine C,. : C,, = ( 0 . 1 t b . 1 5 + b . l 5 + 0 . 3 + 0 . 6 t 0 .12 + 0.17 +?.14 + O.& t 0.65)/10 = 0.26. C,,,,'aquals 0.26 mg/L; which is C for the chamber
DamDle 0.3-2
A system with a co-current chamber .and the same dimensions of the *
system in Example 0 .3 -1 has sampling results as follows: * . . '
Water Ozone Residual (ma/L) QeDth (ftl -- H Ai- ll!aLa&
2 0.f ' 0.12 0.11 8 0.16 , 0.14 0.15
14 0.27 0 . 3 0.. 285 .I 6 0.70 * 0 . 7 3 0.715 18 0.62 :0.61 0.615
5.1.
.. (') Average - (H, t H,)/2
- The sampling points are not verticaily equidistant so the system will plot the average ozone concentration o f the horizontal sampling ,points versus depth to calculate the area under the curve. This approach should only be used if. the, sampling points cover the range of the water depth.
.- As shown on Figure 0-14b, the area under the curve is deter- mined for the range of depths sampled fr'om 2 to 18 ft. .
- Several methods can be used 'for calculating the area includ-
* .
i ng : - Measurement with a planimeter - Mathematical methods such as: - Simson's Rule . . - Runge Kutta
0 .3 -5

SAMPLING LOCATIONS
a. EOUlOISlAWT SAMPLING
SAMPLINO LOCATIONS
'0 2 I ' 8 0
b. SKEWED SAMPLIWG
10
11
It
OZONE PROFILC
I I I I I 0.2 0.8 1.0 (al@!l)
OZONE CO~CENTRATION
ozone PROFILE
0 I- - h
0 0.2 0.G 1.0 (mgil)
OZOClE C'ONCENT'RATION
FIGURE 044 - DIRECT MEASUREMENTS FOR DETERMINING C

The area under the curve is in units of */Loft. C,, is deter- mined as:
area tma/L-ftl range of depth sampled (ft)
For this data, use o f a planimeter results in an area of 5.44 mg/L-ft, with the concentration determined as follows:
5.44 ma/L - ft = 0.34 mg/L 18 ft - 2 ft .-
. .
. 0'.3.3 Fstimatina C Based on Residual Heasurpments at the Outlet For many systems, measuring ozone profiles in their ozone chamber may
be impractical because of physical constraints. These systems may estimate C in the chamber based on measurements of the ozone residual at the outlet from the chamber. €PA has established correlations for
'different types of gas-liquid contact configurations currently in use in ozone contactors. These relationshi'ps were derived based on conservative assumptions regarding the type of flow configuration .in the contactor. . ' . Due to the highly reactive nature o f ozone the values for C vary slightly
. between first chambers and subsequent chambers. The recommended concentrations for first and subsequent chambers are summarized in Table 0-6.
0.3.3.1 first Chambers A first chamber is the chamber in which ozone is initially intro-
duced. In establishing guidelines for determining C values for the first ozone contact chamber, the following items were considered:
1. The relationship between C and the outlet concentration in the first chamber of a multiple-chamber system (or single chamber]. may be very sensitive to the reaction order of the ozone consumption kinetics.
. The average concentration in the contactor may be less than 10 percent of the outlet concentration. This was demonstrated in pilPt plant studies conducted in a multiple chamber system by Stolarik and Christie, 1990. Therefore, general relationships
. between the residual ozone concentration at the outlet from a first (or single) ozone contact chamber and the average concentration i,n this .chamber cannot be developed.
0.3-6 . .
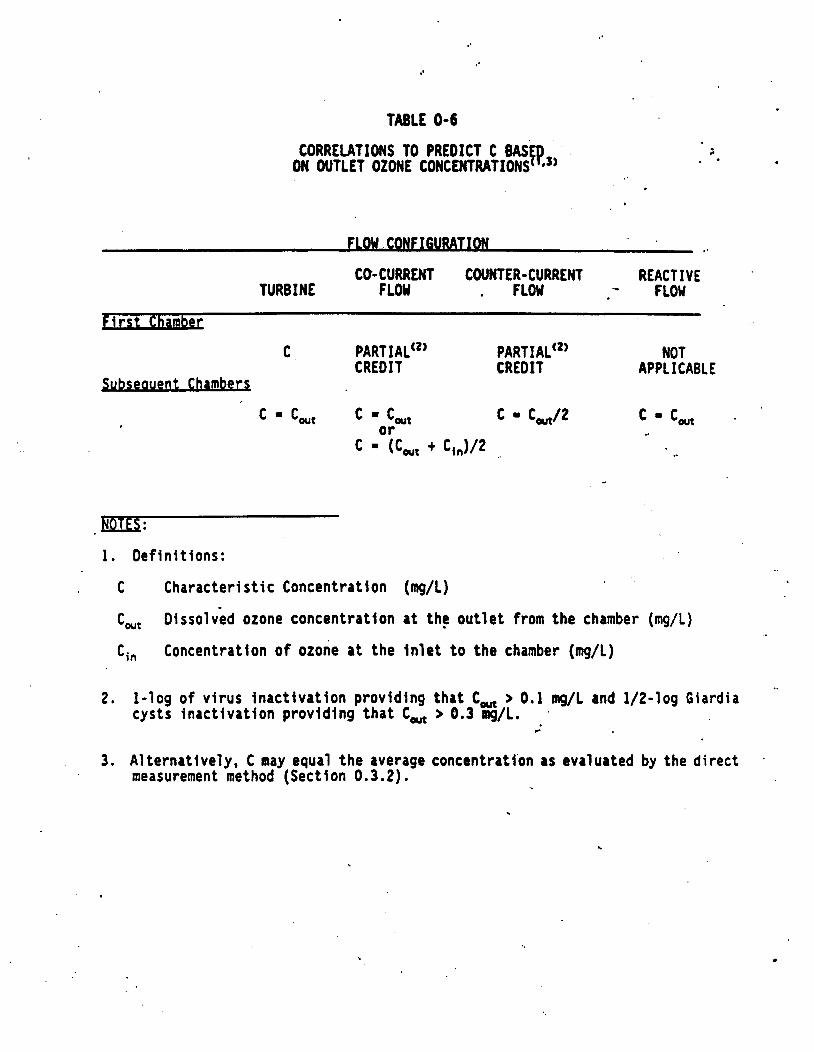
TABLE 0-6
CORRELATIONS TO PREDICT C BASfp - . r
ON OUTLET OZONE CONCENTRATIONS . *
FLW CONFIGURATION
CO-CURRENT COUNTER-CURRENT REACT I VE TURBINE FLOU . FLW -.- FLOW
First Chamber C PART I AL(~) PARTIAL'^) NOT
CREDIT CREDIT APPLICABLE - 1. Definitions:
C Characteristic Concentration (mg/L)
cwt Dissolved ozone concentration at the outlet from the chamber (mg/L)
Cin Concentration of ozone at the inlet to the chamber (mg/L)
2. l - log o f virus inactivation providing that C, > 0.1 mg/L and 1/2-l0g Giardia cysts inactivation providing that C, > 8.3 q/L. '
3. Alternatively, C may equal the average concentrati'on as evaluated by the direct .
measurement method (Section 0.3.2).

2. The rate of disinfectlon of vlruses (coliphage) by ozone often decreases with respect to contact time whereby the fni tial inactivation rate It very frst m d deteriorates afterwards.
3. Pilot plant experiments reported by Wolfe et a1 , ,( 1989) * suggest that the inactlvrtion of organisms Including MS2 bacteriophages, murit cysts, R2A bacteria and E. Coli, in the first chamber of a multiple-chamber reactor is very rapid even when high ozone d m n d waters are used.
Considering these items, EPA recoraaends a general guiaeline of crediting the first ozone chamber with CT credits .equivalent to 1-log virus inactivation and 0.5-log E i a r m cyst Inactivation, provlded that the residual concentration measured at the outlet from the first contact chamber exceeds 0.1 m g / L and 0.3 m g / L , respectively, regardless of the. contactor configuration. However, this guideline does assume .that the volume of the first chamber i s, equal to the volume of subsequent chambers. The credit for 1-log virus inactivation at an outlet residual of 0.1 mg/L may appear conservative with respect to HS2 bacteriophage data, however, ' only limited data for ozone inactivation of the animal viruses of concern is currently available. Preliminary test results indicate khat bacterio- phage may not be an appropriate indicator for virus inactivation.by ozone (Finch, 1990).
Systems may prove higher performance of their first contact chambers by measuring the concentration profiles in the first chamber, as outlined ,
in Section 0.3.2 or ,by applying the more sophistic'ated methods that are presented in Section 0.4.
u
0.3.3.2 w s e a u e n t u m b e r s . The correlations In fable 0-6 are based on analysis of the dissolved
concentration profile in Iiquid/gas contacting chambers. All correlations rely on the accurate measurement o f ozone concentration outside of the gas/liquid contacting regime. Concentrations at the outlet from the ozone
. contact chambers can be measured accurately without interferences from the ozone bubbles.. The correlations represent the highest possible estimate of C . that can be supported without site-specific test data. These estimates are conservative and systems may choose to determine C based on
0.3-7

direct measurement of the concentration profile in the contact chamber,'or use one of the procedures reconmended in Section 0.4.
Correlations were ,developed for the four types of flow configura- tions:
- Turbine - Counter Current Flow - Co-current Flow - Reactive Flow
Iiuhm .-
For turbine chambers or rigorously mixed chambers, the flow characteristics in the chamber approach that o f a CSTR and,. therefore, the concentration at the outlet from the contactor (Cwt) is assumed to be representative o f the dissolved concentration of ozone in the liquid phase (C). Currently, contactors using turbine agitators appear to approx.imate CSTR characteristics '(Schwartz et a1 1990). Other systems with f,,,/HDT values less than 0.33 may use the same correlations.. This correlation is applicable to every chamber, including turbine contactors used for first. chambers or as a single chamber contactor.
The measurement of ozone concentration in the gas phase is a possible alternative for determining C although such correlations will be highly
. site specific. A procedure to develop site specific correlations between the average ozone concentration and the off-gas concentration is presented . .
' in Section 0.4.2.1.
counter-Current FW In counter-current flow, the water flows opposite to the direction
of bubble rise. Measurement of the concentration profile in such systems revealed that the concentration in the liquid phase uniformly increased with depth in the ozone chamber as shown in Figure 0-15. The maximum concentration in the chamber is achieved near the water outlet from the ozone chamber.
Heasurement of the ozone concentration in an ideal plug flow chamber reveals that the average concentration is only 25 to 50 percent o f the outlet concentration' for these chambers under' typical operating condi - tions. Add'itional contributions to the average concentration that are n o t
accounted for by the plug flow analysis, include the contribution o f
0.3-8
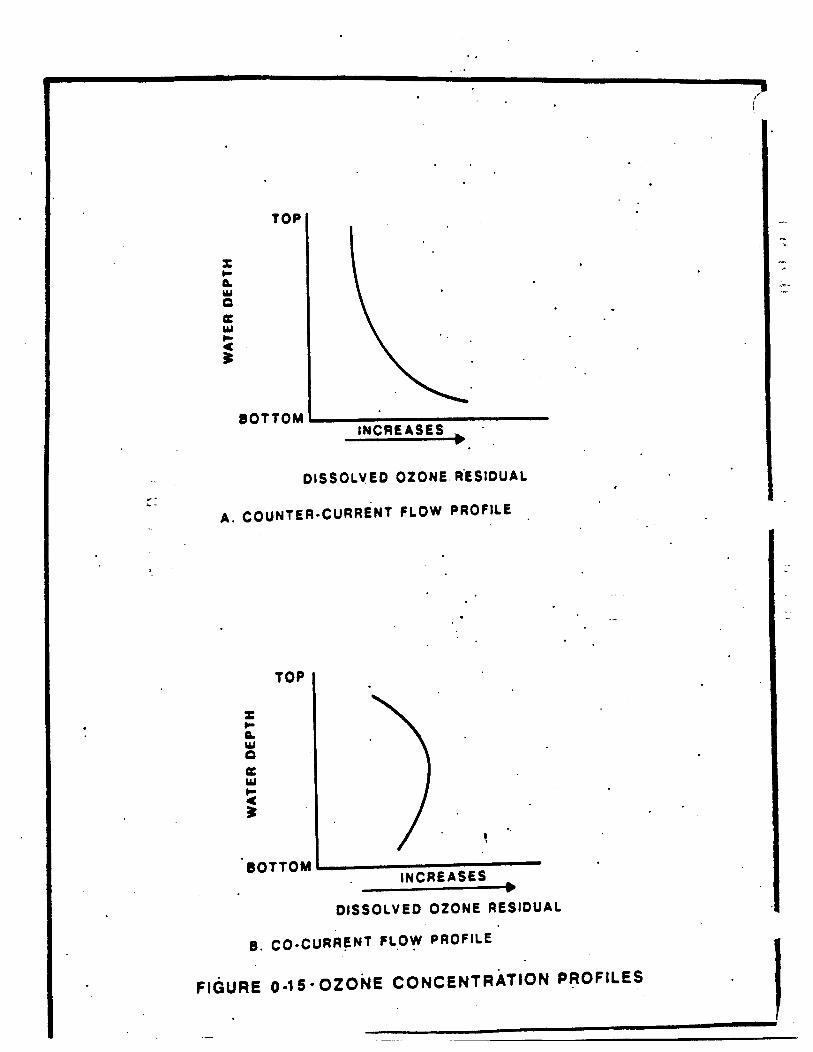
. .
X c 0 ul 0
w c a
z
TOP
8OTTOM I INCREASES
TOP
t c Q w 0
w c a
a 3
8 O t T O M
DISSOLVED OZONE RESIDUAL
8 . CO-CURRENT FLOW . . PROFILE
FIGURE 0-1 5.0zoi.c~ CONCENTRATION PROFILES I

. turbulence and the, contribution of the inlet concentration. Based on these considerations, EPA reconmends the use of one-half the outlet concentra- tion of ozone as an estimate for C.
The measurement of ozone concentration in the off gas, is a possible alternative for determining the average ozone concentration although the correlations will be highly site specific. A procedure to develop site specific correlations between the average ozone concentration and the off- gas concentration is presented in Section 0.4.2.1.
.
o-Current F1 ow In co-current flow, both' the water and gas flow' in the same
direction. The ozone concentration profile in co-current operation increases until it reaches a maximum and then decreases along the contact chamber as shown on Figure 0-15. The dissolved ozone concentration increases at the beginning of the column due to dominant mass transfer from the ozone rich bubbles. Then the gas phase becomes depleted of ozone and the impact of ozone consumption in the liquid phase. dominates the '
ozone profile. C can be estimated as the concentration o f dissolved ozone at the outlet or by the average of the inlet and outlet concentrations o f dissolved ozone, whichever is higher. This estimate should still be conservative, particularly for systems exhibiting high transfer efficien- cies.
The measurement of ozone concentration in the off gas is a possible * altepnative for determining the average ozone concentration although the
correlations will be highly site specific: A procedure to develop site specific correlations between the average ozone concentration and the off- gas concentration is presented in Section 0.4.2.1.
Reactive F1 ow In ozone chambers operated in a reactive .flow configuration, the
water contains dissolved ozone residual from previous chambers but no additional ozone is being introduced. Reactive flow chambers are used: for other disinfectants, such as chlorine, chlorine dioxide and chloramin- es; for the decay of ozone following a contactor or a static mixer; and for combining ozone with hydrogen peroxide.
0.3-9 ,. *.. .*
For static mixers, the mixer acts 8s a turbine chamber with the pipeline following the mixer acting as the reactive chamber. The pipeline is in effect the second chamber and the guldelines In Table 0-6 apply for '
the determination of C. * The contact time In the pipeli,ne can be calculated by assuming plug flow.
In order to be consistent with the recomendrtlons for monitoring other disinfectants in reactive flow chambers, and,in order to assure compliance under worst case conditions, the use of the residual outlet from the chamber (C,) is recommended as 8 conservatdve measure of C. The CT for reactive flow chambers may be estimated by dividi.ng the chamber into subunits, measuring the concentration at the end o f each subunit, and adding the CT credits.
* Estimates of C based on the outlet concentration were conservatively developed based on avail able test data. EPA's recommended values for C are summarized in Table 0-6. A system may choose to perform additional testing for direct measurement of ozone residuals to support a higher value, if appropriate. In addition, a reactive. flow chamber may be . subdivided into smaller units with ozone measurements at the end of each unit t o improve CT credit.
0.3.4 btimatina F; The results of this section are sunmarired in' Figure 0-16. The .
decision tree shows the applicable methods of estimating C 'for each flow configuration, and provides a quick means to compare alternatives and make a selection.
. .
. 0.3-10 . .. ..+ . --.

I"" c=ccuroR 1
NOTES 1. CREDIT FOR 1-log MRUS W E N Can > 0.1 mg/L . AN0 0.5 -lag INACllVAnW
WEN C u , > O.hg/L FOR FIRST CHAMSRS. . I
2. OETERMlNATlON OF CAVO IN SECTION 0.3.2 AND VourlH IN SECTION 0.4.2
3. FOR FIRST OR SUBSEQUENT CI ?AMBERS.
FIGURE 0-16- DECISION TREE FOR ESTIMATING. C
. .

0.4 SITE-SPEC IF IC EVALUATION OF OZONE CONTACTORS
0.4.1 fntroduction The second set of guidelines is designed to prevent systems from
costly over-design and use of overdoses of ozone, by performing site specific characterization of their ozone contactors. This approach was partially utilized in the previous two sections by recomnding a direct measurement of the ozone concentration profile and by allowing systems to use the SFA or CSTR approaches. In this section the site specific evaluation procedure will be further developed by presenting additional options to improve disinfection credits or simplify monitoring procedures. EPA recommends the following three alternatives for site specific eval uat i ons :
- E.stimating C by measurement of another variable - Model ing performance of field scale operation - Use of microbial indicator studies
C may be estimated by measuring an easily uionitored (observable) *
variable. Systems should develop site specific correlations between C and another observable parameter such as the gas or llquid concentration exiting (Cwt) the .chamber and monitor this observable parameter instead of C. Guidelines to develop such site specific correlations are presented in Section 0.4.2
Model 1 ing the performance of full ' scale operations is an a1 ternative to the separate C and T approach. The first procedure separated the analysis into two separate issues related to 'determining C and T. Extensive modelling of the system may predict higher inactivation levels, even for the sade C and T. EPA recommends that systems construct' mathematical models of their ozone contactors to predict the disinfection performance, provided that the models are confirmed by experimental observation of the actual ozone concentration profile in the contact chambers, as dfscussed in Section 0.4.3.
Microbial indicator studies may be used to determine the inactivation of viruses and Giardia cysts in ozone contactors. EPA recomnends that systems be allowed to evaluate the performance of their disinfection systems by spiking a pilot of the contactor with an indicator microorgan-
. ism and predicting the actual inactivation of.Eiardia cysts and viruses 0.4-1

based on the inactivation of the indicator microorganisms. Guidelines to conduct such pi lot scale performance evaluations are presented i.n Section 0.4.4.
. .
0.4.2 Site SOeCific Correlation of C with an Observable Variable . .w.:-. *-.-
Section 0.3 recommends determining the concentration of Ozone in . 2 3 .
contactors by one of the following ways:
1. Measure the concentration profile in the chambers and determine the average dissolved ozone concentration for C.
2. Measure the dissolved. concentration of ozone In' the water outlet from each chamber (C, ) and estimate C by the correla- tions presented in Tables 0-8.
This section presents an alternative method to determine C. The SWTR requires unfi 1 tered systems to report a daily CT for their
disinfection systems. Similar requirements may ' be specified by the Primacy Agency for filtered systems. ' Measuring the concentration In the ozone chambers each day may be difficult. Determining the ozone concentration in a chamber by continuous or daily measurements of other
_ ' variables is probably preferable. Likewise, many systems may prefer to monitor the'otone concentration in the off gas (Ymt) or via the applied ozone dose rather than monitor C,. However, based on available data, .a non-site specific correlation between the average ozone concentration in the chamber and an observable variable other than C, could not be devel oped.
€PA encourages systems to develop such site specific correlations and use them instead o f the general procedures. These correlations may be developed in one of the following ways:
1. Determine site specific.correlations between C and another variable that can be easily monitored. Heasureyhe variable, estimate C and then use the correlations presented in Tables' 0-6 to pre%;'ct C.
2. Determine site specific correlations directly between C and another variable such as the ozone concentration In the o f f gas (Yout) or CWt. Measure that variable and estimate C.
0.4-2

Correlatio.ns between C or C, and a measurable parameter may vary in complexity from a simple empirical linear correlation to a highly sophisticated mathematical model accounting for the ozone concentration profile in the contact chamber. Development of appropriate correlations depends on the engineering capabilities of the utility. .Therefore, EPA does not recommend any particular mathematical relationships. However, the following sections present guidelines to rss*l st systems. In-developing appropri ate correl at ions.
. .
brrelations for Soecific C h a m b The correlations should refer to a specific contact chamber and
should be verified to fit the perfomance of this chamber. For example, a correlation for the first chamber should not 'be ustd to predict C in the second chamber of a mu1 tiple-chamber system.
k v e l o o i n a the Correl at ion When fitting the correlation with experimental data, a record of the
following variables should be kept:
a.
b.
C.
d.
d.
e.
f.
9.
Water flow rate
Gas flow rate
Ozone concentration in the gas feed
Ozone transfe'r efficiency
Water temperature and pH
Concentrations of all major .inorganic' reducing agents; if they constitute a substantial. proportion o f the total ozone demand, such as iron( 1.1) and manganese, * TOC, alkal in-ity and turbidity.
C,, or. whatever is being correlated
The measurable variables such as ozone dosage or C,,
The system should also record the dependent (C or Cat) and indepen- dent measurable variables.
. 0 . 4 - 3
4 The correlation should be evaluated with at least I 90 percent *
confidence level. Since confidence margins are very sensftfve . t o the number o f observations used to develop the relationship, this &irement will prevent the use of correlations that are based on 8 1 imited amount of observations. On the other hand, because systems usually make daily records of most of the parameters needed to develop a correJation, the number of observations will usually be very high, thereby, providing a high confidence level for the correlation. Simple procedures to determine confidence intervals are presented in statistlcal textbooks.
The correlation must be checked periodically, such as monthly, as an additional precaution against unexpected shifts in water conditions.
The correlation should be applied only to conditions that are within the parametric range for which the correlation was developed, as noted. in the second guideline. Interpolation is permitted but extrapolation is not. Correlations developed during the winter time should not be used to . evaluate performance in the summer.
€PA believes that by permitting such correlations, systems will be encouraged to apply sophisticated mathematical models in order to decrease the confidence interval and administer smaller doses of .orone. €PA also 'Iu'.
expects that systems will develop correlations between C in the contactors ' . . % and measurable parameters to simplify their operations. Small or lesser equtpped systems will then be able to use these relation'ships to estimate the performance of their ozone contactors. EPA intends to follow advances in this field and issue updated examples and guidelines regarding the selection of efficient site specific correlations. .
>g, ." ,.
dfi r
"r;p i € b ~
.a
,P-... .s:
* a
0.4.2.1 ytilirina Off-Gas Measurements In ozone contactors, the gas and 1 iquid streams equil ibrate when .the
contact between the gas and liquid is intimate enough -and for sufficient time, otherwise the concentration in the water phase will be much lower than the equilibrium concentration. It can be assumed that close to equilibrium conditions are reached, when the transfer efficiency in' the contactors is greater than, 85 percent ((Y,,,-Yw)/Yfn >. 0.85). When the
' . transfer efficiency i s greater than 85'percent,.sysSems may use solubility
0 .4 -4

constant data to calculate CWt from the contactor, based on the ozone concentration in the off gas. fhis may lead to a slight over estimate of the concentration in the liquid phase but this over estimate is justified, in view of the better reliability of gas phase measurements.
Henry's constants for ozone at various temperatures are presented in Table 0-7. The residual concentration of ozone may be estimated by:
Where:
you, - The concentration of ozone in the gas phase (ppm - volume or partial pressure-atm)
c,t. - The concentration of ozone in the liquid phase (mg/L 1
H = Henry's constant (atm/mg/L)
When applying off-gas model1 iq, 1 iquid phase measurements must' be made periodically to check the correlation, as the ozone transfer efficiency has a high impact on the results of this correlation.
Systems must be cautioned against the use of off-gas measurements for multiple chamber contactors with a common headspace. As noted previously, modelling must be specific to individual chambers. Thus, if a contactor has a common head space between chambers, na distinction can be made as to the concentration in each chamber. Therefore, off-gas measurements for modelling are recommended for use with single chamber contactors.
fxamDl e 0.4- I The Metropolitan Water District of Southern California conducted
off-gas monitoring on a single chamber co-current flow pilot contactor to determine the dissolved ozone concentration:
- ' Operating conditions were as follows': source water: Colorado River
feed gas ozone ,concentration = 2 percent by weight
off gas ozone concentration - 0.185 p.ercent by weight (or 0.123 percent by volume)
0 . 4 - 5

- transfer efficiency 90.8 percent
- temperature = 16.5 C
- observed ozone residual = 1.04 mg/L
- Henry's constant 16.5.C - 0.001179 rtm/mg/L z . .
- The ozone residual estimated from the off gas concentration i s :
C,*Y,/H - 0.00123/0.001179 = 1.04 mg/L
- The measured residual is the same' IS that predicted by ,the off-gas measurement indicating that this approach is appropri- ate for this system.
Example 0.4-2 1 - t
A system using two counter-current contact chambers in series wants to, predict C,, in the second chamber by the concentration of ozone in the.
. off-gas (Y,), Daily observations of the pertinent parameters during the first month of operatio'n are presented in Table 0-8.
- The'system chose to correlate CWt and Y,, by linear empirical correl at i on.
- The daily observations, and the best linear fit are presented
- The 90 percent confidence interval is presented by the lower
in Figure 0-17.
line in Figure 0-17.
- The system may use the 90 percent confidence level line to
- For example when Y, - 0.4 percent then the system may use C,,. = 0.36 mg/L.
- Al'though the best estimate is C,, - 0.4 mg/L, the system should predict C,, = 0.36 mg/L.
- Now, according to.Table 0-6, the system may predict C using the recommended guide1 ine of C - C,,/2 - (0 .36) /2 - 0.18 mg/L.
- The system measures the ozone concentration at the chamber outlet monthly, to check the model correlation.
estimate C,, based on measurements of Y,.. ..

TABLE 0-7
* HENRY'S CONSTANTS FOR OZONE"'
Water Temperature
( O C 1 Henry's Constant ' -
0 1,940 5 2,180
10 2,480
20 3,760 15 2,880
25 4,570 30 5,980
Henry's Constant atm/ma/l ozone1
0.00073 0.00082 0.00093
0,00141 0.00171 0.00224
'0.00108 *
~~
NOTE: EPA, 1986

i TABLE 00.8
Emp? rl crl Correl a t ion Between C, md Y,
h u t Lt 0.5 0.5 0.47 0.43 0.38 0.41 0.39 0.4 0.28 0.32 0.2 0.17 0.25 0.23 0.32 0.27 0.29 0.27 0.2 . 0.18 0.22 0.2
' 0.30 0.33 0.32 0.34 0.28 0.27 0.29 0.32 0.4 0.42 0.47 * 0.45 0.35 0.37 0.30 0.29 0.20 0.17 0.15 1.19 0.12 0.20 0.17 0.17 0.14 0.16 0.13 0.12 0.25 0.27 0.29 0.32 0.30 0.29 0.22 0.20 0.22 0.20
2.0 2.8 2.5 2.3 2.4 2.6 2.0 2.4 2.0 2.0 1.9 1.8 1.9 1.9 . 2.5 2.4 2.3 2.4 1.9 1.9 2.0 '
1.9 1.9 2.0 1.9 1.9 1.9 1.8 1.9 1.9
Ism3 20 1s 17 18 18 20 20 21 18 17 18 20 17 18 18 19 19 21 19 19 19
18 17 18 17 17 18
2.0 2.0
.2 -0 2.0 2.0 2.0 2.0 1.9 1.9 2.0 2.1 2.0 . 2.0
.1.8 . 1.9
1.9 1.8 1.9 1.8 1.8 2.0 2.0 1.9 2.0
, 2.0 2.0 2.1 2.0 2.0 1.9

C 0 c. *4 9 c C u
. . . .
0.2
Ott p s coni:c:raf t a d i o r a UkiJ
FIGURE 0-17- EXAMPLE OF EMPIRICAL CORRELATION OF RESIDUAL OtONE..AND OFF GAS

- If thls system had the means to monitor the concentration profile in the contactor rnd determine C directly it could develop a correlation between C and Y, instead o f usin9 Table 0-6.
0.4.3 Bodelina the Performance of Full Scale O m r a t l o w . Hore extensive site specific mathematical modelling of the actual -*-,
. ...
performance of the ozone contactor may determine higher inactivation levels than those determined by the separate C and T approach..therrfore, systems should be allowed to use such advanced laodrlling, provided that these models are confirmed by direct measurement o f the dissolved ozone
-?x... -- *.
profile in the contactor. Only after the model is confirmed to correctly estimate the concentration profile in the contactor can it be used to estimate the inactivation performance of the contactor. Systems with multiple chamber contactors must develop models for each of the chambers.
Various types of mathematical models for reaction-diffusion systems were reported (Danckwerts, 1976) and some were shown to be applicable for ozone contactors (Gurol and Singer, 1982). This. section deliberately avoids giving preference to any type o f mathematical modelling in order to encourage engineering innovations. The guidelines presented below may. help systems to select appropriate modelling that will be consistent with the requirements of the SWTR.
treated in the contactor. The rate of ozone reaction and decomposition ’
should be based on batch experiments, on-site pilot plant Columns, or
The model should account for the ozone demand o f the water being .
”... - .-
f u l l -scale measurements. The model should represent the actual flow distribution in the ozone
contact chambers by incorporating a dispersion term and/or a three. dimensional velocity distribution term in the contactor.
The modelled profile of the concentration of dissolved ozone in the contactor should fit the actual distributton .of dissolved ozone, as verified by direct measurements., with a variation of less than 10 to 20 percent. This difference between the model and measured residual allows for the inherent inaccuracies in measuring the actual ozone residual The mathematically modelled cgncentration profile should not be used without comparing it with actual measurements. Even elaborate mathematical model’s i
. .
0 . 4 - 7

are not consldered rel lable enough t o estlmate the concentration d ls t r lbu t lons o f d lsso lved gasses i n complex gas/l iquld operatlons, wl thout addi t ional ver l f leat lon of the rc tua l concentrat lon prof l le I n the contactor.
I n a d d l t l o n t o t h e above guldellnes, the model may a l t o account for o ther phenomena t h a t may affect the performance o f the ozone contact’ . chambers, such as: the effects of varylng bubble dlrmeter durlng I t s movement tt irough the contactor, the effect of stagnant regions I n the contactor and the v!rlation of the hydrostatic pressure.
For example, a system may use the two fllm theory coupled with react ion k inet ics to est imate the performance o f an ozone contact chamber. Using the two .film theory the re levant d l f ferent la l equat lons are:
L dC/dr - M t + Mr + Md
L dI/dZ Md - KC1
Where:
C = Concentrat ion of dissolved ozone (mg/L)
G = Gas f l ow rate per cross sect lon of the contactor (m2.Kg . gas/mln)
I =
L *
Y =
z =
M t =
Mr =
Concentration o f the ta rge t microorganism ( i i a r d b o r viruses)
Water f14w rate per cross section area o f the reactor (Kg w a t - er/mln.m )
Concentratlon o f ozone i n the gas phase (mg/L)
length coordinate of the contactor
An expresslon for ozone transfer from the bubble phase t o the ,
water phase. For example, k,a(C -C) where k,a stands for the volumetrlc mass transfer coe/f lcdent, C, ,re resents the in te r fac ia l concent ra t lon o f ozone, given by so P u b i l l t y data (Tab1 e 0- IO).
A? expression f o r the r a t e o f ozone consumption I n t h e water due t o auto-decomposition and the ozone demand o f t he t rea ted wa te r . For example, Mr- k,C -k,(C) (R) . Where k, and k, are k ine t i c coe f f i c i en ts , and R represents the variable ozone demand, such as TOC. An additional equation may be required t o represent the var iat ion of R along the contactor.
0.4-8

(c-- ?ld An expression for the dispersion by turbulence and bubble f l o w . .
o f dis3olved ozone in the specific contactor. For example, t Dd*C/dz the dispersion coefficient (0) may be evaluated by’. analysis of tracer study data. The third equation describing the microorganism concentration (dI/dt) should incorporate the same dispersion coefficient (0). 2
KCI- Chick’s inactivation term (K-2.303k, where k = Chick-Watson‘s inactivation Coefficient presented in Table 0-4, C represents the local concentration of ozone and I represents the concen- tration of microorganisms) -
-a ..-.
The validity of these equations is subject to the appropriate boundary conditions at the bottom and top of the contactor. The signs o f the various terms depend on the definition of . coordinates and the type of flow configurattqn (co-current or counter-current now configuration).
6.4.4 Hicrobial Indicator Studies to Model Inactivation Contactorr According to the recommendations in Appendix G , systems may
. demonstrate the actual performance of a disinfection system rather than .
rely on the CT approach. The procedures out1 ined in Appendix G recommend the use of Giardia muris cysts as indicators of U r d i a inactivation and bacteriophage (MS2) as indicators for virus inpctlvation by disinfection in general. However, recent data indicate that MS2 phages may be substantially more sensitive to, ozone disinfection than pathogenic viruses, and therefore are not a good indicator for determining adequate
: ozonation conditions for inactivating pathogenic viruses (Finch, 1990). Additional research i s needed to determltie’ which coliphage species, if any, can be used as an appropriate indicator for virus inactivation by ozone. Pilot scale inactivation experiments using appropriate indicator microorganisms ‘can serve as powerful tools to ,indicate the performanre o f . the ozone contactors. This .section contains guidelines for conducting indicator ‘studies. At this time, full-scale testing ‘with indicator organisms is not feasible because o f the high volume of organisms needed and the concern for introducing organisms into the finished water. However, with’ the development of naturally occurring indicators such as resistant species of coliphage, demonstration on the f u l h c a l e l e v e l may
be feasible in.”the future.
. . 0.4-9

Systems may determine the performance of their dlsinfectlon basins by demonstrrtlng 'levels of inrctlvrtion of indicator microorganisms such as Eiardia murfs cysts, or other indicator microorganisms provided that such demonstrations are based on solid engineering principles. The following steps can be used for conducting indicator studies:
1. ch Exoerimenu On-site batch disinfection experiments are recmended wlth treated
water spiked with indicator mic'roorganisms to determine the lnactivatlon kinetics of the indicator used in the pilot scale experiments. Hicroor- ganisms should be used as Indicators preferably in the range where' the inactivation kinetics approximate Chlck's law'. Thls protocol assumes that within the desired Inactivation range, the inactivation kinetics wilt approximate Chick's law. I b i s important to note that other disinfection kinetic models , not yet apparent, may be developed to more accurately predict ozone inactivation efficiency than the Chick-Watson model.'.
'. Evidence that other models may be more appropriate is shown with data r
generated by several researchers for different organisms '(Wolfe, R.L. et . al, 1989; finch G . , et a1 1988; finch G . and Smith, O.W. 1989).
2. Pilot Scale Indicator LxDerimentt Pilot-scale experiments should then be conducted using Identical
strains o f biological indicators to those used in the batch experiments. The pilot-scale experiments should be repeated under identical gas and water flow conditions with and without introducing ozone into the gas stream. The actual performance may then be calculated by subtracting the .
inactivation achieved in the control experiment (without ozone) from the inactivation achieved In the ozone dislnfection experiments.
3. 1 1 i n Systems may choose direct or indirect methods to interpret the
inactivation performance of ozone contactors based on indicator studies. The direct method is more conservative and simple while the indirect method i s more accurate but requires mathematical model1 i n g o f the cootactors. The two procedures are outlined below:
0.4-10
. .
a . Determine k, where k i s Chick-Yatson's inac t lva t ion coe f f l c i en t o I d the i n i c r t o r microorganlsm) from batch test data wfth the expression:
( I/IO),d,crror S u r v i v a l r a t l o o f i n d l c r t o r mlcroorganism 8 S determined by batch experiments;
C
t
= Dlssolved ozone concentrrtlon I n the batch
= t l m e (mlnutes) elapsed from the beginnlng
experlment (mg/L)
of the batch experlment
Note: This assumes that the inact ivat lon data will provide a reasonable f i t f o r t h i s equatlon. If t h l s I s not true, then the fol lowlng i s not appl.icable and other re lat lon- ships should be developed.
b. Determine the d ls in fec t lon performance o f t h e p i l o t sca le d ls ln fec t lon system on the indicator microorganism
c. Calcu late the inact ivat ion o f E iard lq cysts or v l ruses (I/I,,) using the appropriate k' values from fable .O-3:
( 1/10) indicrtor'
log(I / I t j ) = 109(I/Io)ind,e,tor (k'/k,) 8 * ( k t ' k) (7 )
109 (I/IO). = log (I/IO)lndlmtor (kl < k) (8)
This equatlon still represents an approxlmation because It neglects '
d ispersion ef fects. The laws used In de r l v ing t he above equations are based on conservat ive s lml lar i ty approaches. Yhen the indlc.ator microorganlsm i s l e s s r e s i s t a n t t o ozone dis lnfect ion than the target organf sm (k, > k) , then the plug flow operatlon. represents the more conservrt lve predlct lon approach. Equatlon 7 I s based on the assumption that the f low conf lgurat ion I n the chamber approaches plug flow. Yhen the. Indicator mlcroorganism I s more vulnerable then the target riricroorganism (k, > k) then the CSTR approach provides a more conservative estimate. Equation 4 represents a conservative approximation t o t h e CSTR s i m i l a r i t y
, .
0.4-11 '
I
--

.. .
rule. A lore accurate determination o f the inactivation perfonpance of the contactor rnay,be calculated by the following apprO8ch:
2. Jndirect determination of the disinfection n e r f o m
a. Determine k, (where k is Chick-Watson's inactivation coefficient of the indicator microorganism) from batch test data with the expression: '
log( 1/10) ld,cr;or -k&t where : ( I/IO),d(crtor Survival ratio of indicator&cro-organisms
as determined 'by batch experiments.
C - Dissolved ozone concentration in the batch experiment (mg/L)
t time (minutes) elapsed from the beginning of the batch experiment
b. Determine the disinfection. performance of the pilot scale inactlvation level of the indicator microorganism
e. Determine the actual concentration profile in the disinfection chamber (see Section 0.3.2).
d. Construct a mathematital model that estimates the concentration profile in the contactor as discussed in Section 0.4.3
(I/lO) Indlcr;or*
e. Confirm the fiathematical model by fitting its parameters such as dispersion or kinetic coefficients to describe accurately the concentration profile of ozone in the contactor and the overall inactivation of the indicator
. microorganism. A model that predicts within 10-20. percent the Inactivation of the .indicator microorganism and the concentration profile o f dissolved ozone tn the contactor would be considered to be valid and can be used by incorporating k values from Table 0-3 to estimate the inactivation of cysts or viruses in the contactor.
0.4-12

4
REFERENCES
Badcr, 'H. 8nd 3. Hoigne, Determination of Ozone in Water b i the Indigo ' Method, A Submitted Standard Method, Ozone: Science and Engineering, pp
Carns, K, Design of East Bay Hunicipal Utility District ozone disinfection . plants in Oakland Ca., presented at €PA workshop on Ozone CT, Cincinnati, '
OH., Feb. 1990
Chick, H., An investigation of the laws of disinfection, J. Hygiene, 8, 92 ( 1908)
Danckwerts, P.V. Gas Liquid Reactions, McGraw Hill Inc. (1976)
449-456, 1982, 9
Finch, C.R., Smith, D.W., Stiles, M.E., Dose Response of ficherichla in Ozone Demand-free Phosphate Buffer, Water Research Vol. 22, No.12, pp.
Finch, G., University of Alberta, Canada, Private Communication (1990).
Hoff, 3 . C. , Strengths and weaknesses of using CT values. to evaluate disinfection practice, in assurance of adequate disinfection, or X-T or not C-T, AWWA seminar proceedings, Annual AWWA Conference, Kansas City, pp. 9 (1987)
Gurol M.D. and P.C. Singer, Kinetics o f ozone decomposition, A dynamic approach , Env. Sci . b Tech. , 16, 377 (1982) .
Joost, R.Dcr L.A. Jackson and L.J. Bollyky, Optimization of ozone contactors for drinking water disinfection, Proceedings:of the 9th Ozone World Congress, L.J. Bollyky, Editor, New York, NY, vol 1, pp. 551 (1989).
Lev, 0. and S. Reg1 i , Compliance of ozone disinfection systems with the Surface Water Treatment Rule, Selection of characteristic exposure time (T ) , submitted to J. of Env. Eng. ASCE (1990a)
Lev, 0. and S. Aegli, Compliance of ozone disinfection systems with the Surface Water Treatment Rule, Selection of characteristic concentration. (C), submitted to 3. of Env. Eng. ASCE (1990b)
1563-1570, 1988.
. .
Levenspiel , O., Chemical Reaction Engineering, 2nd ed. Wiley, New York, NY , (1972).
Perry R . H . , Perry's Chemical Engineering Handbook, 'McGraw Hill Book Company, New York, NY (1963)
Richards, 0. A. and Fleischman, M. , Ozone transfer to aqueous systems i n ' a static mixer, 2nd Symposium on ozone technology, Montreal, Canada, R. G.
Rice, P. Pichet and M. A. Vincent, eds, p. 57 (1975).
c

.
Rice, R. EPA, In preprratlon, Source Document: Ozone Treatment of Drinklng .Water, EPQ625/1-86/021 Rosenbeck, G.1, McMahon Associates, Inc. Prlvate comnunlcatfon (1989)
Schwartr, B. , Hackensack Water Company; Prlvate comnunlcatlon (1989) Schwartz, B., L.C. Fung and C. N. Weng, Dctermlnatlon of ozone concentra- tion In turbine contactor, presented at '€PA Workshop on Ozone CJ, Clncinnatl, OH, , Feb.. 1990 Seinfeld 3, H. and Lapidus L. , Matheaatlcrl methods In Chcalcal' Englneer- Ing, Vol . 3, Process Modeling Estlmation and Identiflcatlon, Prentice Hall Inc. (1984). Stolarik, G . L . and J. D. Christie, Projection of ozone C-T values, Los Angeles Aqueduct Filtration Plant, presented at I n k Ozone Assoc, Conf, ,
Monroe, Mich., April 1987.
Stolarik, G.L. and 3. 0. Christie, Projection of ozone C-T values, .Los Angeles Aqueduct Flltration Plant, presented at EPA workshop on Ozone CT, Cincinnati, OH. , Feb. 1990
.-
. . Treybal, R.E . , Mass-transfer operatlons, McGraw-HI11 Book Company, 3rd ed. ( 1980)
Watson, H . E . , A note on the varlatlon of the rate of disinfection with change i n the concentration of the dislnftctant, 3. Hygiene, 8, 536 (1908)'
Wolfe, R.L , M . H . Stewart, K.N. Scott and M. J. HcGuire, Inactivation- o f Giardia Muris and indicator organisms seeded in surface.water supplies by peroxone and ozone, Env. Sci . and Tech. , 23, 744 (1989)
' Yuteri C. and Curol ,M.b. Evaluation of kinetic parameters for the oronation of organic micropollutants, Yat. Sei. & Tech. 21, 465 (1989)