Guidance for the compilation and reporting of data on ...
92
EUROPEAN COMMISSION EUROSTAT Directorate E: Sectoral and regional statistics Unit E-2: Environmental statistics and accounts; sustainable development Guidance for the compilation and reporting of data on packaging and packaging waste according to Decision 2005/270/EC (Note: The Commission Delegated Decision on average loss rates is currently being finalised, future versions of this guidance will contain further details on the published legal act.) Version of 21 May 2021
-
Upload
khangminh22 -
Category
Documents
-
view
0 -
download
0
Transcript of Guidance for the compilation and reporting of data on ...

EUROPEAN COMMISSION EUROSTAT Directorate E: Sectoral and regional statistics Unit E-2: Environmental statistics and accounts; sustainable development
Guidance for the compilation and reporting of data on packaging and packaging waste
according to Decision 2005/270/EC
(Note: The Commission Delegated Decision on average loss rates is currently being finalised, future versions of this
guidance will contain further details on the published legal act.)
Version of 21 May 2021
Guidance for the compilation and reporting of data on packaging and packaging waste ____________________________ 1
Contents
1 Introduction ..................................................................................................................... 2
2 Scope and definitions ..................................................................................................... 3
3 Due date for data submission and application of the stricter compilation rules ................ 4
4 Guidance for the completion of the reporting tables ........................................................ 8
4.1 Completing Table 1 on generation and recycling of packaging waste ...................... 8 4.1.1 Waste generation ............................................................................................10
4.1.2 Recycling ........................................................................................................12
4.1.3 Repair of wooden packaging ...........................................................................16
4.1.4 Recovery .........................................................................................................16
4.2 Completing Table 1a on reporting attainment of the old recycling targets ...............18 4.3 Completing Table 2 for adjusting the recycling targets based on 3-yearly average
share of reusable sales packaging ..........................................................................21 4.4 Completing Table 3 on reusable packaging ............................................................23
5 Guidance for the completion of the quality report ...........................................................26
5.1 Packaging waste generated and recycled ...............................................................26 5.2 Composite packaging .............................................................................................26 5.3 Variation from the data submitted for the previous data year ..................................27 5.4 Data verification ......................................................................................................27
6 Good practice examples for collecting packaging placed on the market data ................28
7 Good practice examples for collecting packaging waste recycling data .........................29
Appendices ..........................................................................................................................30
Appendix 1 Reference manual: Good practice examples for collecting packaging placed
on the market data ........................................................................................................30
A.1.1 Collecting packaging PoM data ...............................................................................30
A.1.1.1 Data sources and data collection methods ..................................................30
A.1.1.2 How to address data collection issues .........................................................31
A.1.2 Calculating packaging PoM ....................................................................................33
A.1.2.1 Identifying inaccurate data ...........................................................................33
A.1.2.2 How to address inaccurate data ...................................................................35
A.1.3 Reporting of data from waste analysis ....................................................................39
Appendix 2 Reference manual: Reporting of data on packaging waste recycling ...........41
A.2.1 Difference in reporting rules ....................................................................................41
A.2.2 Correctly identifying the calculation points ..............................................................44
A.2.2.1 Plastic packaging .........................................................................................44

Guidance for the compilation and reporting of data on packaging and packaging waste ____________________________ 2
A.2.2.2 Paper and cardboard packaging ..................................................................47
A.2.2.3 Glass packaging ..........................................................................................48
A.2.2.4 Metal packaging ..........................................................................................49
A.2.2.5 Wooden packaging ......................................................................................50
A.2.2.6 Fabric/ textile packaging ..............................................................................51
A.2.2.7 Composites packaging ................................................................................51
A.2.3 Allowable measurement methods ...........................................................................52
A.2.4 Obtaining data at the measurement points ..............................................................55
A.2.5 Metals from incinerator bottom ash (IBA) ................................................................58
A.2.5.1 Correctly identifying the calculation point .....................................................59
A.2.5.2 Allowable measurement methods and obtaining data at the measurement
points 60
A.2.5.3 Losses within the incineration process .........................................................62
A.2.6 Identifying the national packaging proportion in multi-stream treatment plants ........65
A.2.6.1 Sampling standards and methodologies ......................................................68
A.2.7 Measuring the amounts of packaging composted ...................................................70
A.2.7.1 Processes where recycling and energy recovery of biowaste are combined 72
A.2.8 Guidance on proving compliance with requirement to ensure all waste outside the
EU is treated under broadly equivalent conditions .........................................................72
A.2.8.1 A definition of “broadly equivalent conditions” ..............................................73
A.2.8.2 Guidance on establishing whether broadly equivalent conditions are in place
75
A.2.8.3 Guidance on common statistical issues .......................................................77
A.2.8.4 Information sharing ......................................................................................78
A.2.9 Applying the average loss methodology ..................................................................78
A.2.9.1 Application of average loss rates (ALRs) .....................................................78
A.2.9.2 Approaches to calculating ALRs ..................................................................80
A.2.9.3 Tracking ALRs through the recycling chain ..................................................81
A.2.9.4 Data collection and verification ....................................................................82
Appendix 3 List of relevant documents ...........................................................................83
Appendix 4 Suggestion for detailed questionnaire for reusable packaging to be sent by
the Member States to the economic operators in the sector. .........................................84

Guidance for the compilation and reporting of data on packaging and packaging waste ____________________________ 1
Glossary of Abbreviations
ALR Average loss rate
APCR Air pollution control residues
AR Authorised Representative
BAT Best Available Techniques
DRS Deposit return scheme
EEE Electronic and electrical equipment
EPR Extended producer responsibility
EU European Union
IBA Incinerator bottom ash
OECD Organisation for Economic Co-operation and Development
MRF Material recovery facility
MSWI Municipal Solid Waste Incinerator
PPWD Packaging and Packaging Waste Directive
PAYT Pay-as-you-throw
PoM Placed on market
PRO Producer responsibility organisation
WEEE Waste electronic and electrical equipment
WTO World Trade Organisation

Guidance for the compilation and reporting of data on packaging and packaging waste ____________________________ 2
1 Introduction
The purpose of this document is to provide guidance to Member States1 on the reporting of
packaging waste data, pursuant to the requirements laid down in Commission Decision
2005/270/EC as amended by Implementing Decision (EU) 2019/665 establishing the formats
relating to the database system pursuant to European Parliament and Council Directive
94/62/EC on packaging and packaging waste [referred to in this document as Decision
2005/270].2 In particular, this guidance highlights important considerations relating to the
calculation of packaging waste generated and recycled. Guidance is also provided to support
Member States in the completion of the quality check report (hereafter referred to as the
‘quality report’).
In March and April 2020, the Waste Statistics Working Group and the Committee on waste
established under Article 39 of Directive 2008/98/EC – Packaging and Packaging Waste
Directive – were consulted on a draft version of this guidance document and the
accompanying Excel file with the questionnaire and quality report. The comments received
were considered for the guidance published in 2020.
Because of the feedback received from countries during the validation of the 2018 reference
year, the following changes have been introduced to the guidance document:
Use of Table 1 and Table 1a was clarified. Table 1 is the new format for reporting on packaging and packaging waste. It must be used in all cases. Table 1a is only to be used if Table 1 contains data according to the new rules but a Member State wants to prove compliance with the old targets until 2025 (inclusive) using the old rules. In addition, for plastic materials contained in packaging waste, if a Member State has reported recycling tonnages in Table 1 using the old calculation rules, and those tonnages include both material and other recycling, Table 1a should be used to report only the material that is recycled back into plastics.
A flow chart was added to guide Member States through the process of completing Table 1, and Table 1a where appropriate, for the 2018 and 2019 reference years. In addition, further clarifying text relating to Table 1 and Table 1a was added as needed throughout.
The text was amended to recognise the adoption and approval of the own resources decision as of 1 January 2021, which has the impact that for plastic packaging waste, cross-checks between the amount of packaging placed on market (PoM) and the amount generated as waste will be required on an annual basis.
The text was amended to remove obsolete references to the R1 energy recovery formula, and instead recognise that all energy recovery (not just R1 energy recovery) should be reported.
Additional text was added to Appendix A.2.2.1.1 to make clearer that the calculation point cannot be before any further processing steps, particularly in reference to washing stages.
1 As Decision 2005/270/EC and Directive 94/62/EC are incorporated into the EEA Agreement, this guidance note also applies to Iceland, Liechtenstein and Norway.
2 For the consolidated version see https://eur-lex.europa.eu/legal-content/EN/TXT/?qid=1583325017136&uri=CELEX:02005D0270-20190426

Guidance for the compilation and reporting of data on packaging and packaging waste ____________________________ 3
The text in appendix A.2.2.1.2 has been modified in order to make clearer the reporting of recovery of plastic packaging following chemical processes
The text in Section 4.1.2 was updated to improve clarity, and to provide additional guidance on correct reporting of biodegradable waste entering composting or anaerobic digestion processes, and end-of-waste materials to be used as fuels, and whether these can be counted as recycling.
Various updates to wording were made in order to improve the clarity of the guidance, and to dates in order to make the guidance relevant for reporting of 2019 data.
In addition, some appendix content was moved to the main report to improve understanding
of particular issues.
The main changes introduced to the Excel questionnaire (including quality report) were:
Worksheet ‘Basic instructions’: The information has been improved. A flow chart was added to guide Member States through the process of completing Table 1, and Table 1a where appropriate, for the 2018 and 2019 reference years. There is no need to fill in any cell in this worksheet.
Several changes were made to footnotes in Table 1 and Table 1a to improve the information, particularly in relation to reporting according to the old calculation rules.
Worksheet ‘Getting started’: Reporting country, year, contact person and institution must be included in this sheet.
All tables include the button ‘Validate questionnaire’ on the top left-hand corner of the worksheet, because the sender must confirm that there are no pending errors. Totals and averages are permanently locked. Only metal totals can be unlocked to supersede the formulas with a value.
Some issues with the validation rules have been fixed.
This guidance document will be further improved and expanded as more experience
becomes available with data collection and reporting. For revised versions of this guidance
document, please check https://ec.europa.eu/eurostat/web/waste/methodology.
2 Scope and definitions
The reporting obligation is based on the implementing decisions for Directive 94/62/EC, as
described in the introduction.
Packaging is defined in Article 3(1) of Directive 94/62/EC on packaging and packaging waste
(hereafter: the Directive)3, as last amended by Directive 2018/8524, as:
“all products made of any materials of any nature to be used for the containment, protection,
handling, delivery and presentation of goods, from raw materials to processed goods, from
the producer to the user or the consumer. ‘Non-returnable’ items used for the same purposes
shall also be considered to constitute packaging.”
3 OJ L 365, 31.12.1994, p. 10; for the consolidated version see https://eur-lex.europa.eu/legal-content/EN/TXT/PDF/?uri=CELEX:01994L0062-20180704&from=EN
4 OJ L 150, 14.6.2018, p. 141
Guidance for the compilation and reporting of data on packaging and packaging waste ____________________________ 4
Packaging therefore consists of sales packaging or primary packaging, grouped packaging
or secondary packaging, and transport packaging or tertiary packaging (as set out in Article
3).
Article 3(1) of the Directive further clarifies that items as per the above definition shall
constitute packaging:
“unless the item is an integral part of a product and it is necessary to contain, support or
preserve that product throughout its lifetime and all elements are intended to be used,
consumed or disposed of together”, including “items designed and intended to be filled at the
point of sale and ‘disposable’ items sold, filled or designed and intended to be filled at the
point of sale” as well as “packaging components and ancillary elements integrated into
packaging”.
The Directive further defines packaging waste in Article 3(2) as “any packaging or packaging
material covered by the definition of waste laid down in Article 3 of Directive 2008/98/EC,
excluding production residues”.
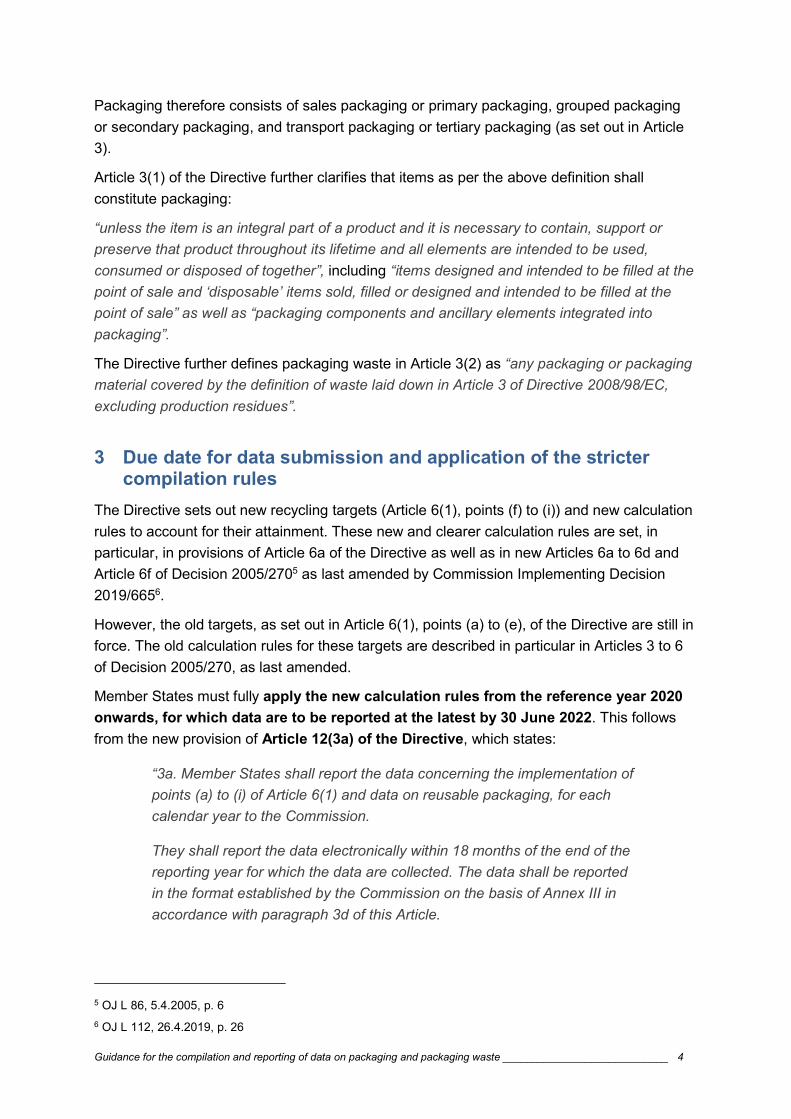
3 Due date for data submission and application of the stricter compilation rules
The Directive sets out new recycling targets (Article 6(1), points (f) to (i)) and new calculation
rules to account for their attainment. These new and clearer calculation rules are set, in
particular, in provisions of Article 6a of the Directive as well as in new Articles 6a to 6d and
Article 6f of Decision 2005/2705 as last amended by Commission Implementing Decision
2019/6656.
However, the old targets, as set out in Article 6(1), points (a) to (e), of the Directive are still in
force. The old calculation rules for these targets are described in particular in Articles 3 to 6
of Decision 2005/270, as last amended.
Member States must fully apply the new calculation rules from the reference year 2020
onwards, for which data are to be reported at the latest by 30 June 2022. This follows
from the new provision of Article 12(3a) of the Directive, which states:
“3a. Member States shall report the data concerning the implementation of
points (a) to (i) of Article 6(1) and data on reusable packaging, for each
calendar year to the Commission.
They shall report the data electronically within 18 months of the end of the
reporting year for which the data are collected. The data shall be reported
in the format established by the Commission on the basis of Annex III in
accordance with paragraph 3d of this Article.
5 OJ L 86, 5.4.2005, p. 6
6 OJ L 112, 26.4.2019, p. 26

Guidance for the compilation and reporting of data on packaging and packaging waste ____________________________ 5
The first reporting period concerning the targets set out in points (f) to (i) of
Article 6(1) and data on reusable packaging shall start in the first full
calendar year after the adoption of the implementing act that establishes
the format for reporting, in accordance with paragraph 3d of this Article,
and shall cover the data for that reporting period. “
The implementing act that establishes the format for reporting was adopted on 17 April 2019
(Commission Implementing Decision (EU) 2019/665). Therefore, the first reference year for
reporting (i.e. the first reporting period) on the new targets will be year 2020. Member States
shall report the data electronically within 18 months of the end of that reporting year
for which the data will be collected, that is, at the latest by 30 June 2022.
It should be noted that Commission Implementing Decision 2019/665 amended Commission
Decision 2005/270/EC and replaced the “old” format for reporting in Decision 2005/270 with
a new one. Therefore, “the format established in Commission Decision 2005/270/EC” that
should be used for the reporting on Article 6(1) points (a) to (i) is now the new reporting
format as established by Commission Implementing Decision 2019/665.7
In addition, Article 12(3b) of the Directive states:
“3b. The data reported by Member States in accordance with this Article
shall be accompanied by a quality check report and a report on the
measures taken pursuant to Article 6a(3) and (8), including detailed
information about the average loss rates where applicable.”
Member States must thus accompany their report for the reference year 2019 – the
report which is due by 30 June 2021 – by a quality check report as set out in Decision
2005/270.
Member States must continue showing compliance with the old targets as set out in Article
6(1), points (a) to (e), of the Directive until the moment that they have to show compliance
with the new targets as laid down in Article 6(1) points (f) and (g) on 31 December 2025.
While not expressly required8, Member States are encouraged to apply the new
calculation rules for reporting on both old and new targets already now (i.e. in 2021 for
the reporting period 2019) for reasons of administrative efficiency and transparency, and for
communication reasons. However, even in 2022 and thereafter, when reporting according to
the new calculation rules for the new targets becomes mandatory, Member States can
choose to report the attainment of the old targets based upon the old calculation rules. Any
Member State that wishes to continue reporting on the attainment of the old targets based on
the old rules must fill in a separate table. This means completing Table 1a in addition to
Table 1. Those that wish to report attainment of the old and the new recycling targets based
on the new calculation rules need to complete only Table 1.
7 This was clarified also at the TAC meeting on 19 February 2019.
8 Article 6e of Commission Decision 2005/270/EC as amended by the Commission Implementing Decision 2019/665 provides for the possibility to apply these new calculation rules.

Guidance for the compilation and reporting of data on packaging and packaging waste ____________________________ 6
This follows from the following legal provisions:
Article 6e of Decision 2005/270:
“For the purposes of calculating and verifying attainment of the targets set
in points (a) to (e) of Article 6(1) of Directive 94/62/EC [i.e. the old targets],
Member States may apply the calculation rules laid down in Articles 6a to
6d” [i.e. the new calculation rules].”
Article 9(5) of Decision 2005/270:
“5. Where, for the purposes of verifying compliance with the targets set in
points (a) to (e) of Article 6(1) of Directive 94/62/EC [i.e. the old targets], a
Member State does not apply the calculation rules laid down in Articles 6a
to 6d [i.e. a Member State decides not to use the new calculation rules],
that Member State shall submit the data for verifying compliance with the
targets set in points (a) to (e) of Article 6(1) of Directive 94/62/EC
separately by using the format laid down in Table 1 of the Annex.”
For that purpose, Eurostat offers a simplified Table 1a in the questionnaire (see Section 4.2).
Member States should only use Table 1a if they have reported recycling tonnages in Table 1
using the new calculation rules, but still wish to continue reporting on the attainment of the
old targets until 2025 (inclusive), based on the old calculation rules. In such case, for plastic
materials contained in packaging waste, it is only possible to report the material that is
recycled back into plastics. This is because attainment against the old targets for plastics,
Article 6(1) point (e) (iv) of the Directive 94/62/EC, counts exclusively material that is
recycled back into plastics.
In addition to the above, until 2019 reference year (inclusive), Member States have another
option for reporting under Table 1a (generation and recycling of packaging waste):
Reporting Table 1 using the old calculation rules. A small minority of countries include
under plastic recycling, packaging waste recycled into materials other than plastics. Only
in such case, Table 1a should be used to report only the material that is recycled back
into plastics (i.e. not including ‘other’ recycling tonnages).
Member States should use the flow chart presented in Figure 3-1 to help guide them through
the process of completing Table 1 and Table 1a where appropriate. It presents the decisions
around reporting that Member States need to make and the required actions that follow from
these decisions, in terms of which tables they should complete; it also presents the outcomes
in terms of how compliance will be measured.

Guidance for the compilation and reporting of data on packaging and packaging waste ____________________________ 7
Figure 3-1: Flow Chart Guide to Completing Table 1 and Table 1a where appropriate
While Member States can choose the calculation rules under which they will report for the
“old” targets, they must – already from 2020 onwards (i.e. including for the reporting period
2019 with deadline 30 June 2021) – use the new format for reporting on packaging and
packaging waste as set out in Decision 2005/270.
This follows from Article 12(3d) of the Directive, which states:
“By 31 March 2019, the Commission shall adopt implementing acts laying
down the format for reporting data in accordance with paragraph 3a of this
Article. For the purposes of reporting on the implementation of points (a) to
(e) of Article 6(1) of this Directive, Member States shall use the format
established in Commission Decision 2005/270/EC.”

Guidance for the compilation and reporting of data on packaging and packaging waste ____________________________ 8
4 Guidance for the completion of the reporting tables
This guidance will assist in the completion of the reporting tables in the Excel questionnaire.
Once the required fields of each table are filled in, Member States must verify the data
before submitting the questionnaire. This is done by clicking on the button ‘Validate
questionnaire’ on the top left-hand corner of each worksheet. It is of the utmost importance to
confirm that there are no pending errors (see 'ErrorLog' worksheet), since a questionnaire
with errors (marked in the Excel file as red shadowed cells) will be rejected.
4.1 Completing Table 1 on generation and recycling of packaging waste
Table 1 of the questionnaire requires data on waste generation, recycling, repair of wooden
packaging and recovery of packaging to be completed. An image of Table 1 can be found in
Figure 4-1 below.
Below the table, the subsequent sections provide a summary of how to complete the table for
each key component:
Section 4.1.1 ‘Waste generation’;
Section 4.1.2 ‘Recycling’;
Section 4.1.3 ‘Repair of wooden packaging’ and
Section 4.1.4 ‘Recovery’.
Note, as indicated above, Table 1 is the new format for reporting on packaging and
packaging waste. Table 1 must be used in all cases. Member States are encouraged to
report according to the new calculation rules for reference year 2019 already. However, if this
is not possible and only data according to the old rules can be provided for 2019, Table 1
must still be used for reporting. In this case, as highlighted in footnote 7 to the table,
provision of separate data for aluminium and steel packaging would be voluntary (in line with
the old rules). Also, for reference year 2019, as highlighted in footnote 3 to the table, the
three different recycling columns should be filled in as well as possible, but it might not be
possible to fill all in as the split was not required under the old rules.

Guidance for the compilation and reporting of data on packaging and packaging waste ___________________________________________________________________________________ 9
Figure 4-1: Table 1 – Generation and recycling of packaging waste

Guidance for the compilation and reporting of data on packaging and packaging waste _________________________ 10
4.1.1 Waste generation
The following points of guidance are additional to the instructions provided in the Excel
template for reporting against Table 1 in Annex I of Decision 2005/270 (reporting on the
recycling targets set in Article 6 of Directive 94/62/EC).
There are two main approaches to calculating packaging waste generated: based on
packaging placed on the market (PoM), or based on waste analysis.
Clarification on composite packaging
Note that the following principle applies under both approaches. According to Article 6c(2) of
Decision 2005/270:
“composite packaging and other packaging composed of more than one material shall be
calculated and reported per material contained in the packaging. Member States may
derogate from this requirement where a given material constitutes an insignificant part of the
packaging unit, and in no case more than 5 % of the total mass of the packaging unit.”
Therefore, for the purposes of reporting waste generation data in this table, the amounts
generated of each material should be reported under the respective packaging material
category. Where the derogation is applied, the mass of each given material constituting less
than 5% need not be calculated and reported separately, but rather, can be reported under
the predominant material in that packaging unit by weight. The application of the derogation
should be detailed in the Quality Report under question 3.1.5.
As an example, if a composite packaging unit had the following composition:
75% paperboard, 21% plastic, and 4% aluminium
Moreover, if the derogation would be applied, then the 4% aluminium would be assigned to
the predominant material that is paperboard, so you would report the unit weight x 21% for
weight of plastic and x 79% for paperboard.
If a product had two exactly equal ‘predominant materials’, e.g. 48% plastic, 48% paperboard
and 4% aluminium, apportion the material <5% equally, so the weights of plastic and
paperboard would be the unit weight x 50% in both cases.
It should be noted, however, that this allocation is a derogation not a requirement, and
Member States should split out the materials in all cases if known. This would make the
statistics more accurate.
Also, note that compostable or biodegradable plastics should be included in the total
‘Plastics’ figures, not ‘Other’.
4.1.1.1 Waste generation – waste analysis
Member States can use waste composition analysis to calculate packaging waste generated.
Waste analysis provides information about the amounts and types of materials in a particular
waste stream. The results give a breakdown of the total composition of waste, which has
been sampled. An overview of the approach to waste analyses is given in Section A.1.3.

Guidance for the compilation and reporting of data on packaging and packaging waste _________________________ 11
4.1.1.2 Waste generation – placed on the market
The data for waste generation should be gathered from relevant stakeholders in the country,
such as extended producer responsibility (EPR) schemes that register packaging placed on
the market for compliance purposes. If there are multiple schemes, data from all schemes
must be gathered to ensure the amounts are not under-estimated. See Section 6 below for
further guidance on data requirements relating to plastic packaging placed on the market.
Data could also be obtained from other sources, e.g. based on production and import
statistics and factors to estimate the amount of packaging associated to these product flows.
Where possible, estimates for correcting data that does not cover all packaging waste
generated should be made. This should include corrections for e.g. underreporting of units
that do report to an EPR scheme, for under-coverage due to legally exempt units (de
minimis), ‘free riding’, private imports or internet trade. These should be made and added to
the total waste generation to provide an accurate figure (see Appendix 1 for further details).
A description of the approach taken can be given as part of the responses to questions 3.1.2
and 3.1.3 of the quality report (see Section 5 for further details on completing the quality
report).
4.1.1.3 Requirement to cross-check data on waste generation
According to Article 6f of Decision 2005/270, data shall be verified by appropriate measures,
in particular:
“the amount of packaging waste generated shall be subject to verification
and cross-checking, including by using data on the amount of packaging
placed on the market, relevant data on waste and composition analyses of
mixed municipal waste.”
In essence, this requires using data from both of the approaches outlined above in sections
4.1.1.1 and 4.1.1.2 – please refer to the guidance therein. Therefore, both PoM data and
data from waste analyses should be generated in each Member State for comparison and
verification.
If PoM data is the primary method used, then waste analyses should be carried out at least
once every 5 years in order to establish the type and proportion of packaging waste
generated. This should be conducted at least once before the reporting of data for reference
year 2025, when compliance with the new recycling targets is first to be proved. These
factors, relating to the proportion of different types of packaging in certain types of waste,
should be used for the annual cross-checks.
Through such cross-checking, Member States should identify, for each material, the gap
between what is recorded as PoM and what is measured in waste. The likely reasons for this
difference are the change in weight between PoM and waste due to differences in natural
humidity, contamination, free-riders and the use of de minimis reporting.
As of 1 January 2021, a Member State contribution based on non-recycled plastic packaging
waste became a new revenue source to the EU budget, following the adoption and approval

Guidance for the compilation and reporting of data on packaging and packaging waste _________________________ 12
of the own resources decision9. As a result, for plastic packaging waste, the cross-checks
between the amount of packaging PoM and the amount generated as waste will be required
on an annual basis. Waste analyses do not have to be carried out on an annual basis, but
the periodically derived factors (see above) should be applied to different waste arisings in a
given year.
In order to narrow the gap between the two methods, Member States should ensure that all
possible data inaccuracies and errors are corrected. Such inaccuracies are noted in sections
4.1 and 4.2, and above. A detailed explanation should be provided (in sections 3.1 and 3.3 of
the Quality Report) to demonstrate the process of cross-checking, and, if there is a remaining
gap between waste analysis and PoM data, to clearly explain the reasons why.
Improvements in the two methods need to be identified and implemented (e.g. improved
methods to correct for under-coverage) so that the differences get reduced to plausible
amounts.
4.1.2 Recycling
As Article 6a(1a) of the Directive states, for packaging waste to be classified as ‘recycled’,
waste materials must be reprocessed into “products, materials or substances”.
Member States can count biodegradable packaging waste entering composting or anaerobic
digestion processes as recycling under certain circumstances, as stated in Article 6a(4):
“biodegradable packaging waste that enters aerobic or anaerobic treatment
may be counted as recycled where that treatment generates compost,
digestate, or other output with a similar quantity of recycled content in
relation to input, which is to be used as a recycled product, material or
substance. Where the output is used on land, Member States may count it
as recycled only if this use results in benefits to agriculture or ecological
improvement.”
Further guidance on how to comply with the methodological requirements of the Directive
and of Decision 2005/270 is set out in Section A.2.7 of the Appendix.
Any end-of-waste material which is to be used as fuels or other means to generate energy
cannot be counted as recycling, as defined by Article 6a(5) of Decision 2005/270:
“The amount of packaging waste materials that have ceased to be waste
as a result of a preparatory operation before being reprocessed may be
counted as recycled provided that such materials are destined for
subsequent reprocessing into products, materials or substances to be used
for the original or other purposes. However, end-of-waste materials to be
used as fuels or other means to generate energy, or to be incinerated,
9 Council Regulation (EU, Euratom) 2021/770 of 30 April 2021 on the calculation of the own resource based on plastic packaging waste that is not recycled, on the methods and procedure for making available that own resource, on the measures to meet cash requirements, and on certain aspects of the own resource based on gross national income (OJ L 165, 11.5.2021, p. 15).

Guidance for the compilation and reporting of data on packaging and packaging waste _________________________ 13
backfilled or landfilled, shall not be counted towards the attainment of the
recycling targets.”
The total weight of waste recycled must be equal to the weight of waste at the calculation
points given in Annex II of Decision 2005/270 and be obtained from relevant stakeholders in
the value chain as necessary.
Further information on the relevance of the calculation points to the location of recycling
activities in Table 1 is provided in the Appendix 2 at the end of this guidance. Some key
considerations and best practice in identifying calculation points, the associated
measurement methods that are allowable, and some options for obtaining data at each of the
measurement points are also provided in Appendix 2.
When reporting under the new calculation rules, data should be split into three columns
depending on the location of the recycling activities (recycling in the Member State, recycling
in other Member States and recycling outside the EU); this is reflected in the format of
reporting required in Table 1. Under the old calculation rules this split is not required;
Member States reporting under the old calculation rules for the 2019 reference year should
fill in the three columns (only) if it is possible to do so.
4.1.2.1 Metal packaging and incineration bottom ash
Member States can include ferrous metal or aluminium from incineration bottom ash (IBA) in
the recycled amounts. Further guidance on how to comply with the methodological
requirements is set out in Section A.2.5 of the Appendix.
The 'Metal (total)' row should be equal to the sum of the 'Ferrous metal' and 'Aluminium' rows
(as per footnote 7 to Table 1 in the Excel file). Ferrous metal and/or aluminium separated
from incinerator bottom ash (IBA) shall be reported in the separate rows and shall be
included in the 'Ferrous metal' and/or 'Aluminium' rows (as per footnotes 8 and 9). The ‘Total’
row should be a sum of all the amounts given in the separate rows within the table (with the
exception of the “Ferrous metal from IBA” and “Aluminium from IBA” rows, to ensure there is
no double counting).
The example presented in Figure 4-2Error! Reference source not found. describes how
the cells in Table 1 should be filled in regarding metals from IBA. Eurostat will calculate the
recycling rate as total recycling / generation.

Guidance for the compilation and reporting of data on packaging and packaging waste _________________________ 14
Figure 4-2: Example of Table 1 regarding metals from IBA
4.1.2.2 Composite packaging
According to Article 6c(2) of Decision 2005/270:
“composite packaging and other packaging composed of more than one
material shall be calculated and reported per material contained in the
packaging. Member States may derogate from this requirement where a
given material constitutes an insignificant part of the packaging unit, and in
no case more than 5 % of the total mass of the packaging unit.”
Therefore, for the purposes of reporting generation and recycling data in this table, the
amounts recycled of each material should be reported under the respective packaging
material category (unless the derogation is being appropriately applied). Where the
derogation is applied, the mass of each given material constituting less than 5% need not be
calculated and reported separately, but rather, can be reported under the predominant
material in that packaging unit by weight. The application of the derogation should be
detailed in the quality report under question 3.2.4.
The “Other packaging” row should only be used if the packaging material is another material
category not listed (e.g. fabric etc.). Composite packaging should be reported as per the
point above, and not included in the “Other packaging” row.
4.1.2.3 Accounting for humidity and non-packaging material
Article 6c (e) and (f) of Decision 2005/720 state that:
Waste
generation (a)
Sta
ndar
d
foot
note
s Recycling in the Member
State Sta
ndar
d
foot
note
s Recycling in other Member
States Sta
ndar
d
foot
note
s
Plastic
Wood
Metal (total) (5) 100 80
Ferrous metal 80 70
Aluminium 20 10
Ferrous metal from IBA (6) 10
Aluminium from IBA (7) 5
Glass
Paper and cardboard
Other
Total (4) 100 80
Packaging waste material
Generation Recycling(The total weight of waste of each material type, at the relevant calculation points)
Explanatoryfootnote
Explanatoryfootnote
Explanatoryfootnote
Metal (total) (80) = Ferrous metal (70) + aluminium (10)
Total (80) = Metal (total) (80) ORFerrous metal (70) + aluminium (10) + other materials
= Ferrous metal from IBA (10) + ferrous metal not from IBA (e.g. 60)
= Aluminium from IBA (5) + Aluminium notfrom IBA (e.g. 5)
Recycling Rate = Total Recycling / Generation e.g. = 80 / 100 = 80%

Guidance for the compilation and reporting of data on packaging and packaging waste _________________________ 15
“(e) Where the humidity rate of packaging waste at the measurement point
differs from that of packaging placed on the market, the amount of
packaging at the measurement point shall be corrected in order to reflect
the natural humidity rate of the packaging waste comparable to the
humidity of equivalent packaging placed on the market.
(f) The amount of recycled packaging waste shall exclude non-packaging
materials collected together with the packaging waste, such as waste of the
same material that does not originate from packaging, and residues from
products that the packaging used to contain.”
Therefore, the recycling quantities should be reported at the same natural humidity rate as
the packaging when it is placed on the market, and should not include non-packaging
material or contamination of the packaging from the product. Please refer to Appendix A.2.4
for more information regarding humidity rates and non-packaging material.
4.1.2.4 Average Loss Rates
Under Article 11a of the revised Waste Framework Directive and Article 6a of Directive
94/62/EC, Member States may apply average loss rates (ALRs) when measuring the amount
of packaging recycled. Article 6a of amending Directive 2018/852, states the following:
“average loss rates for sorted waste for various waste types and waste
management practices respectively. Average loss rates shall only be used
in cases where reliable data cannot be otherwise obtained and shall be
calculated on the basis of the calculation rules established in the delegated
act adopted pursuant to Article 11a(10) of Directive 2008/98/EC.”
This exemption rule allows Member States to report waste recycled at an early stage in the
recycling process by calculating the losses, which will occur after first sorting operations.
ALRs should only be used when no other reliable data on the weight of waste at calculation
point are available, such as in the context of shipment and export of waste.
If ALRs are applied, a full description of the approach used to calculate ALRs must be
provided in section 3.2.5 of the quality report. This should include the detail of the sorted
packaging waste to which ALRs are applied, types of sorting plants to which different ALRs
apply, the methodological approach to calculating ALRs at such point(s), including the
statistical accuracy of any surveys used, or the nature of any technical specifications. See
Section A.2.9 of the Appendix for further guidance on ALRs.
4.1.2.5 Reporting of waste exported for recycling
Where waste is exported from the Union for recycling, it should only be accounted for where
there is sound evidence that treatment was carried out under broadly equivalent conditions to
those required under EU environmental law. Section A.2.8 of the Appendix provides
guidance on how such evidence should be obtained. Details regarding this evidence should
be reported under question 4.1.3 of the quality report.
Guidance for the compilation and reporting of data on packaging and packaging waste _________________________ 16
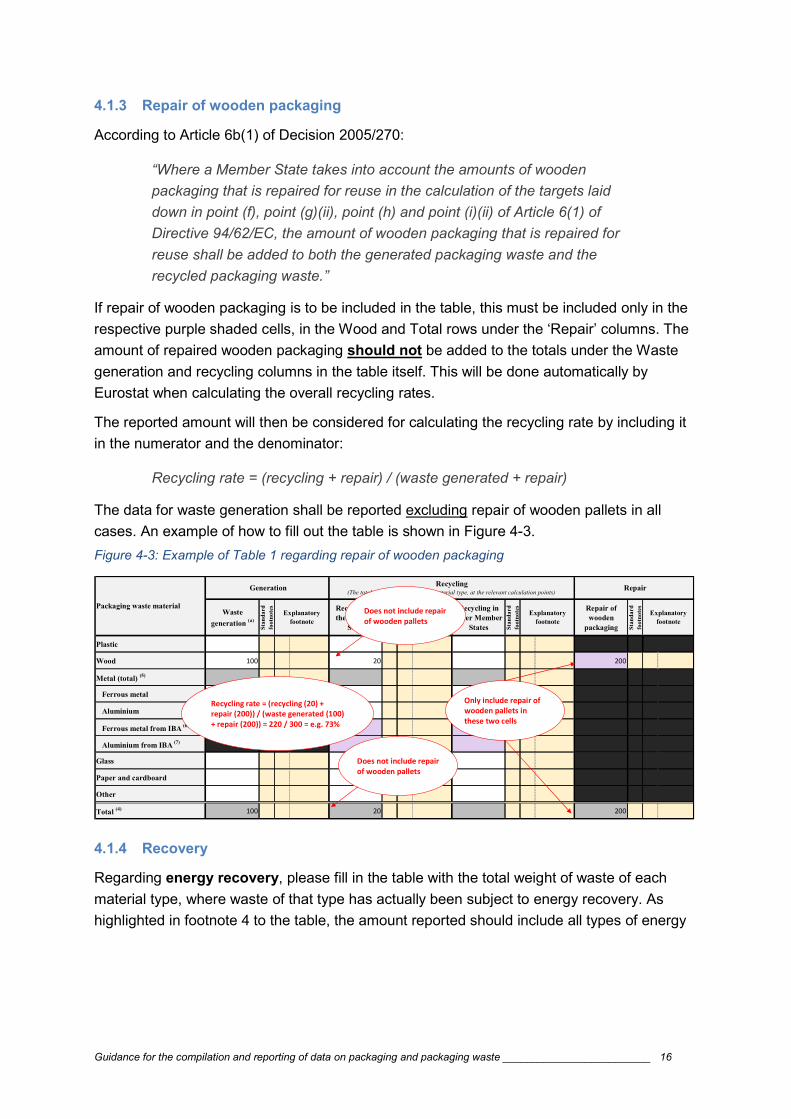
4.1.3 Repair of wooden packaging
According to Article 6b(1) of Decision 2005/270:
“Where a Member State takes into account the amounts of wooden
packaging that is repaired for reuse in the calculation of the targets laid
down in point (f), point (g)(ii), point (h) and point (i)(ii) of Article 6(1) of
Directive 94/62/EC, the amount of wooden packaging that is repaired for
reuse shall be added to both the generated packaging waste and the
recycled packaging waste.”
If repair of wooden packaging is to be included in the table, this must be included only in the
respective purple shaded cells, in the Wood and Total rows under the ‘Repair’ columns. The
amount of repaired wooden packaging should not be added to the totals under the Waste
generation and recycling columns in the table itself. This will be done automatically by
Eurostat when calculating the overall recycling rates.
The reported amount will then be considered for calculating the recycling rate by including it
in the numerator and the denominator:
Recycling rate = (recycling + repair) / (waste generated + repair)
The data for waste generation shall be reported excluding repair of wooden pallets in all
cases. An example of how to fill out the table is shown in Figure 4-3.
Figure 4-3: Example of Table 1 regarding repair of wooden packaging
4.1.4 Recovery
Regarding energy recovery, please fill in the table with the total weight of waste of each
material type, where waste of that type has actually been subject to energy recovery. As
highlighted in footnote 4 to the table, the amount reported should include all types of energy
Waste
generation (a)
Stan
dard
fo
otno
tes Recycling in
the Member State St
anda
rd
foot
note
s Recycling in other Member
States Stan
dard
fo
otno
tes Repair of
wooden packaging St
anda
rd
foot
note
sPlastic
Wood 100 20 200
Metal (total) (5)
Ferrous metal
Aluminium
Ferrous metal from IBA (6)
Aluminium from IBA (7)
Glass
Paper and cardboard
Other
Total (4) 100 20 200
Explanatoryfootnote
Packaging waste material
Generation Recycling(The total weight of waste of each material type, at the relevant calculation points)
Repair
Explanatoryfootnote
Explanatoryfootnote
Explanatoryfootnote
Recycling rate = (recycling (20) + repair (200)) / (waste generated (100) + repair (200)) = 220 / 300 = e.g. 73%
Does not include repair of wooden pallets
Only include repair of wooden pallets in these two cells
Does not include repair of wooden pallets

Guidance for the compilation and reporting of data on packaging and packaging waste _________________________ 17
recovery: both energy recovery at R110 facilities and (other) incineration at waste incinerators
with energy recovery.
Regarding other recovery, please fill in the table with the total weight of waste of each
material type, where waste of that type has actually been subject to other recovery. As
highlighted in footnote 5 to the table, only recovery operations other than Energy Recovery
and Recycling should be included in this column.
In addition, correction factors should also be applied to ensure the weight of packaging
recovered is equivalent to that placed on the market. Correction factors relating to recovery
are described under Article 5 of Decision 2005/270:
“1. For the purposes of calculating and verifying attainment of the targets
set in points (a) to (e) of Article 6(1) of Directive 94/62/EC, the weight of
recovered or recycled packaging waste shall be measured using a natural
humidity rate of the packaging waste comparable to the humidity rate of
equivalent packaging put on the market.
Corrections shall be made to measured data relating to the weight of
recovered or recycled packaging waste, if the humidity rate of that
packaging waste regularly and significantly differs from that of packaging
placed on the market and if this factor risks leading to substantial over- or
underestimates of packaging recovery or recycling rates.
Those corrections shall be limited to exceptional cases, caused by specific
climatic or other conditions.
Significant corrections shall be reported in the descriptions regarding the
data compilation in the data quality check report.
2. For the purposes of calculating and verifying attainment of the targets
set in points (a) to (e) of Article 6(1) of Directive 94/62/EC, the weight of
recovered packaging shall, as far as is practical, exclude non-packaging
materials collected together with the packaging waste.
Corrections shall be made to the data relating to the weight of recovered or
recycled packaging waste, if non-packaging materials in the waste sent to
an effective recovery or recycling process risk leading to substantial over-
or underestimates of packaging recovery or recycling rates.
No corrections shall be made in the case of small amounts of non-
packaging materials, or for such contamination as can regularly be found in
packaging waste.
10 Annex II of the revised Waste Framework Directive and Article 6a of Directive 94/62/EC

Guidance for the compilation and reporting of data on packaging and packaging waste _________________________ 18
Significant corrections shall be reported in the descriptions regarding the
data compilation in the data quality check report.”
Article 6c (e) and (f) of Decision 2005/270 concern corrections for natural rates and the
exclusion of non-packaging material (see Section 4.1.2).
The rules for recycling are somewhat more precise (see Article 6c (e) and (f) of Decision
2005/270). However, to ensure consistency of reported data within the reporting table,
recovery data should be adjusted in the same manner as recycling data to ensure all data
relate to the same approach for reporting clean and dry packaging only. If there is any
deviation from reporting according to a consistent methodology, this should be clearly
outlined in the quality report under question 3.2.6.
Note, the clean and dry concept means the principle and not the reality, indeed most material
going to recovery plants will not be clean and dry, hence why it has to be corrected for to
ensure it approximates the clean and dry amounts that would have been PoM. In addition,
the types of recovery facility used will not affect the composition of the input material;
correction factors still need to be applied even if the plant is R1 compliant.
4.2 Completing Table 1a on reporting attainment of the old recycling targets
The countries should only use Table 1a if they have reported recycling tonnages in Table 1
using the new calculation rules, but still wish to continue reporting on the attainment of the
old targets until 2025 (inclusive), based on the old calculation rules.
In Table 1a, for plastic materials contained in packaging waste, it is only possible to report
the material that is recycled back into plastics. This is because attainment against the old
targets for plastics, as set out in Article 6(1) point (e) (iv) of the Directive 94/62/EC, counts
exclusively material that is recycled back into plastics.
When completing Table 1a, both the packaging waste generated and packaging waste
recycled columns should be filled in (a figure of this table is provided in Figure 4-4 below).
Regarding aspects other than recycling rates under the old targets as set out in Article 6(1) of
Directive 94/62/EC, filling in Table 1 will be sufficient.
The main differences in the old and new reporting rules, with respect to the attainment of the
recycling targets, are summarised in Appendix A.2.1.
Until 2019 reference year (inclusive), it is possible to report plastic recycling tonnages in
Table 1 using the old calculation rules; if those tonnages in Table 1 include both material and
other recycling, they should use Table 1a to report only the material that is recycled back into
plastics (i.e. not including ‘other’ recycling tonnages).
Member States should use the flow chart presented in Figure 3-1 to help guide them through
the process of completing Table 1a where appropriate. It presents the decisions around
reporting that Member States need to make and the required actions that follow from these
decisions, in terms of which tables they should complete; it also presents the outcomes in
terms of how compliance will be measured.

Guidance for the compilation and reporting of data on packaging and packaging waste _________________________ 19

Guidance for the compilation and reporting of data on packaging and packaging waste _________________________ 20
Figure 4-4: Table 1a - Reporting attainment of old targets based on old calculation rules

Guidance for the compilation and reporting of data on packaging and packaging waste _________________________ 21
4.3 Completing Table 2 for adjusting the recycling targets based on 3-yearly average share of reusable sales packaging
Table 2 needs to be completed if a Member State wants to make use – in accordance with
Article 5(2) of Directive 94/62/EC - of the adjusted level for the recycling targets in Article
6(1)(f) to (i) of the Directive. These targets apply from reference years 2025 respectively
2030. Article 5(2) of the Directive states:
“2. A Member State may decide to attain an adjusted level of the targets
referred to in points (f) to (i) of Article 6(1) for a given year by taking into
account the average share, in the preceding three years, of reusable sales
packaging placed on the market for the first time and reused as part of a
system to reuse packaging.
The adjusted level shall be calculated by subtracting:
(a) from the targets laid down in points (f) and (h) of Article 6(1), the share
of the reusable sales packaging referred to in the first subparagraph of this
paragraph in all sales packaging placed on the market, and
(b) from the targets laid down in points (g) and (i) of Article 6(1), the share
of the reusable sales packaging referred to in the first subparagraph of this
paragraph, composed of the respective packaging material, in all sales
packaging composed of that material placed on the market.
No more than five percentage points of such share shall be taken into
account for the calculation of the respective adjusted target level.”
In principle, Table 3 (in columns #4 and #7, see Section 4.4) contains the necessary
information required to calculate the share of reusable sales packaging for completing
Table 2. Completion of Table 3 is obligatory for the reference year 2020 and onwards, and
the first report is due by 30 June 2022. Consequently, from reference year 2023 onwards,
the necessary information to complete Table 2 for three previous years can be derived from
Table 3 as reported for the previous reference years.
If a Member State wishes to see already before how far it is from the 2025 targets - e.g.
calculate the rate for the reference year 2019 - it is possible to complete the data for Table 2
for the three previous reference years (2018, 2017, 2016) if such data is available. Filling in
these earlier years is voluntary. In this case, Table 2 must be completed by the Member
State and shall be coherent with the reporting in Table 3. From reference year 2023
(reporting due by 30 June 2025) onwards, the cells of Table 2 shall not be filled in by the
Member States but will be calculated automatically by Eurostat, based on the information
reported by the Member States in Table 3 (columns #4 and #7, see Section 4.4) in the three
previous years.

Guidance for the compilation and reporting of data on packaging and packaging waste _________________________ 22
Updating values in Table 2 from reference year 2023 onwards
From reference year 2023 onwards, when Table 2 will be completed automatically by
Eurostat from the values reported in Table 3, MS must report updated values for Table 3
(notably columns #4 and #7) if they want to report changes to the share of reusable sales
packaging in Table 2 for any relevant previous year. Please contact Eurostat about the ways
to report such revisions to previously submitted data.
Figure 4-5: Table 2 - Adjusted level of the targets in accordance with Article 5(2) of Directive 94/62/EC

Guidance for the compilation and reporting of data on packaging and packaging waste _________________________ 23
4.4 Completing Table 3 on reusable packaging
Table 3 as established by Decision 2005/270 is displayed in Figure 4-6.
According to Article 12(3)(a) of Directive 94/62/EC, Member States shall report data on
reusable packaging for the first time for the reference year 2020 and the report is due by 30
June 2022. Subsequent reporting is due yearly.
In columns #2 and #4 (as well as #3 and #5 voluntarily), packaging placed on the market
(PoM) for the first time is to be reported. This includes single-use as well as reusable
packaging placed on the market for the first time.
“All packaging” (columns #2 and #3) includes transport, grouped and sales packaging, while
in columns #4 and #5 only sales packaging has to be reported.
In columns #6 and #7, only reusable packaging placed on the market for the first time has to
be reported.11 As “systems for reuse”, only established arrangements (organisational,
technical and/ or financial) shall be considered, which ensure the possibility of reuse. These
include open-loop systems (system, in which reusable packaging is circulated amongst
unspecified companies) and closed-loop systems (system, in which reusable packaging is
circulated by a company or within a known group of co-operating companies). So-called
hybrid systems where packaging remains with the end user without a redistribution system
leading to commercial refilling, shall not apply for consideration of reusable packaging as the
monitoring and validation of data for such hybrid systems is not possible.
The ratio of columns #7 and #4 represents the share of reusable sales packaging. These
values will serve as input to the calculation of the share of reusable sales packaging in
Table 2 if a Member State wishes to adjust the level of the recycling targets12 in accordance
with Article 5(2) of Directive 94/62/EC (see Section 4.3).
Finally, columns #8 and #10 (#9 and #11 voluntarily) ask for the rotations of reusable
packaging performed in the reference year. This value represents the number of times a
packaging is re-filled (first and subsequent refills) in a given year. It is suggested that
information on the number of rotations is either available to the economic operators (for
closed-loop systems) or has to be determined on the basis of studies (for open-loop
systems).
The number of rotations will be different for different sub-categories of each reusable
packaging: e.g. individual plastic water bottles may show different numbers of rotations than
plastic crates or containers. Therefore, for completing columns #8 and #10, it is suggested
that Member States conduct a more detailed collection of data on a disaggregated level,
conduct national validation, but report to Eurostat the aggregated data. A suggestion on how
such a detailed questionnaire may look like is included in Appendix 4.
11 According to Article 3(2) reusable packaging shall be considered to be placed on the market for the first time when newly manufactured reusable packaging is made available on the market for the first time, together with the goods it is intended to contain, protect, handle, deliver or present. Reusable packaging that is reused in subsequent rotations shall not be considered to be placed on the market for the first time.
12 as laid down in Article 6(1)(f) to (i) of Directive 94/62/EC

Guidance for the compilation and reporting of data on packaging and packaging waste _________________________ 24
The data on tonnages collected by or calculated based on the detailed questionnaire for
each sub-category of reusable packaging are then to be summed up and reported in Table 3
columns #8 and #10. Collecting information on the number of rotations is helpful on the
disaggregated level but does not provide meaningful information on the aggregated level of
Table 3, so that columns #9 and #11 may be left blank.

Guidance for the compilation and reporting of data on packaging and packaging waste ___________________________________________________________________________________ 25
Figure 4-6: Table 3 - Reporting on reusable packaging

Guidance for the compilation and reporting of data on packaging and packaging waste _________________________ 26
5 Guidance for the completion of the quality report
Completion of the quality report is a reporting requirement under the Directive. It is
therefore essential that you complete the quality report thoroughly.
Guidance notes for completing the quality report are included alongside the relevant
questions in the Excel template, in the tab “Quality report”. Further instructions and examples
are provided here, with the relevant row and question number in the Excel template
referenced.
In most cases, the structure of the quality report follows the structure set out in the Decision
2005/270. Where there are some differences, the legislative intent is upheld, however,
changes have been introduced to ensure the responses are more accurate and easier to fill
in by the Member States.
5.1 Packaging waste generated and recycled
Verification of data on packaging waste generated (question 3.1.6) and verification of
data on packaging recycling (question 3.2.10)
If “yes” is identified for any of the aspects (cross-check / time-series check / audit), regarding
any of the materials, the instructions provided in the quality report template state that the final
column “verification process” should be used to describe the details of the relevant process.
In responding to both questions 3.1.6 and question 3.2.10, you should include the following:
In case cross-checks are conducted, please describe which other datasets (national or European or other) are used for the cross-check, what the nature of the check is and any margins of error or tolerances identified as acceptable or not acceptable between the data being cross-checked.
For time series checks, please explain the period over which the checks take place, and any other necessary information.
Related to ‘audits’, please describe whether they are voluntary or mandatory. If mandatory, please indicate the legal basis for the audit, the nature of the entities being audited and doing the auditing, the level of training or guidance given to the auditors, and the mechanisms used to fund the audits, including who pays whom. Please, also describe any penalties or further actions resulting from non-compliance with such audits.
5.2 Composite packaging
Description of the methodology to determine per material the amount of recycled
materials contained in composite packaging or packaging composed of multiple
materials, and information on any exemptions applied for materials constituting less
than 5% of the total mass of the packaging unit (question 3.2.4)
A range of methods could be used to determine the composition of wastes composed of
multiple materials at any calculation point, so that the amounts are recorded under the
respective components of packaging waste, as set out in the Table 1 of the questionnaire.

Guidance for the compilation and reporting of data on packaging and packaging waste _________________________ 27
For example, to find out the composition of the products being placed on the market, a
survey could be conducted among producers whose products may become waste. The result
could be assumed equivalent to the composition of such products when they become waste.
The composition would then be applied to the total weight of waste composed of multiple
materials, to calculate the amount of waste recycled per material.
Sampling of a given waste stream could also be carried out at the calculation points to
determine the per-material amounts of recycled materials. In this case, a correction might be
needed for changes in moisture content or contaminants, so that the data is consistent with
the amounts reported as generated wastes.
Where exemptions have been applied for composite materials constituting less than 5% of
the total mass of the packaging unit, all such exemptions should be listed in the response.
5.3 Variation from the data submitted for the previous data year
Explanation detailing the causes of the tonnage difference for any component of
packaging waste generated and recycled which shows greater than a 10% variation
from the data submitted for the previous data year (question 3.3.5)
For each waste category defined in Table 1, e.g. metals, glass, plastic, paper and cardboard,
etc., calculate the % variation in waste treated from the current year of reporting relative to
the previous. For example:
% 𝑉𝑎𝑟𝑖𝑎𝑡𝑖𝑜𝑛 = 100 × (𝑊𝑎𝑠𝑡𝑒 𝑡𝑟𝑒𝑎𝑡𝑒𝑑 − 𝑊𝑎𝑠𝑡𝑒 𝑡𝑟𝑒𝑎𝑡𝑒𝑑 )
𝑊𝑎𝑠𝑡𝑒 𝑡𝑟𝑒𝑎𝑡𝑒𝑑
Where ′𝑌𝑒𝑎𝑟 𝑥′ = the current year of reporting.
5.4 Data verification
This section relates to Section 3.1.4 and 3.1.6 in the quality report. It is recommended that
the data collected is verified using a combination of checks. This will help to identify any
potential issues with the PoM data. If data errors are identified, then Member States can
engage with the organisations providing the data to correct the issues.
The following data verification techniques can be used:
Annual checks should be made by producer responsibility organisations (PROs), and regulators as appropriate, to check any clear anomalies in producer data; e.g. a significant increase or decrease in a particular material quantity from previous years. Ideally, this should be done by an automated software system/algorithm to minimise labour requirements;
Producers should be subject to random third party spot-check auditing by their PROs and less regularly, but in more detail, by the relevant regional or national authorities. These investigations should:
o Check data sources and their reliability;
o Check for any anomalous or suspicious individual packaging weights; and
o Check calculations (e.g. Excel formulae).
It is recommended that PROs be subject to occasional audits by national authorities;

Guidance for the compilation and reporting of data on packaging and packaging waste _________________________ 28
Member States should require producers to, as accurately as possible, assess their suppliers for the weight of PoM; and
Cross-check the data submitted by the PRO/s against other collective sources of data, for example from producer associations and sales data.
Data verification of the kinds listed above should always be undertaken by independent
experts without any conflict of interest in regards to the producer or PRO being audited.
6 Good practice examples for collecting packaging placed on the market data
When collecting PoM data for packaging, Member States should consider the following
points:
Type of data used;
Data sources;
Method for reporting on composite packaging - as stated in Decision 2005/270, Member States are required to report on composite packaging, “including where materials contained in composite packaging and representing less than 5 % of the mass of the packaging unit are not reported separately”;
Method of data collection and calculation; and
Method of estimations and assumptions used where data collection does not cover the whole market.
Appendix 1 provides additional detail on each of these points.
In addition, Member States should assess the quality of the PoM data used. The quality of
the data may be compromised by a number of data collection issues, including:
Data gaps and shortcomings;
Inadequate reflection of import and export data;
Data inaccuracies due to:
o Free riding, typically facilitated by online sales and cross border trade;
o The use of a de minimis threshold for reporting standards; and
o Reliance on inaccurate or incomplete industry data.
Appendix 1 further explains these challenges and recommends approaches that could be
used to reduce data inaccuracies. Examples of how Member States tackle the issue of free
riding are also provided.

Guidance for the compilation and reporting of data on packaging and packaging waste _________________________ 29
7 Good practice examples for collecting packaging waste recycling data
Best practice examples and key considerations related to identifying the calculation points for
packaging materials (including metals from IBA), the allowable measurement methods
associated with each of these, and some options for obtaining data at the measurement
points are provided in Appendix 2. The appendix also provides further detail on identifying
the packaging proportion in multi-stream treatment plants, measuring the amounts of
packaging composted, and examples of the ALRs for packaging. Finally, the appendix
provides guidance on proving compliance with the requirement to ensure that all waste
exported for treatment outside the EU is treated under broadly equivalent conditions, and on
the application of the average loss methodology.
Guidance for the compilation and reporting of data on packaging and packaging waste _________________________ 30
Appendices
Appendix 1 Reference manual: Good practice examples for collecting data on packaging placed on the market data
The following sections relate to reporting in Tables 1, 2 and 3 and to Section 3.1 Packaging
waste generation in the quality report.
As stated in Article 6a of Directive 94/62/EC:
“Member States shall calculate the weight of packaging waste generated
and recycled in a given calendar year. Packaging waste generated in a
Member State may be deemed to be equal to the amount of packaging
placed on the market in the same year within that Member State.”
In order to complete Tables 1, 2 and 3, Member States can use data on packaging placed on
the market (PoM). Accurate data for packaging placed on the market is particularly important
in the context of higher recycling targets. Overestimating PoM could put targets out of reach,
and underestimating could result in a significant drop in the level of actual performance
required to meet a given target.
In order to improve the accuracy of reporting, it is recommended to verify the PoM data using
a combination of checks. This will help to identify potential issues with the PoM data. If data
errors are identified, then Member States can engage with the organisations providing the
data to correct the issues. Appendix Section 5.4 outlines several methods for validating the
data including cross-checking, auditing and evaluation.
These issues related to the collection, calculation and verification of packaging PoM data is
discussed in the sections below.
A.1.1 Collecting packaging PoM data
A.1.1.1 Data sources and data collection methods
This section, and Section A.1.2, relate to question 3.1.1 in the quality report. As stated in
Directive 94/62/EC, Member States can gather data from a variety of ‘economic actors’.
Typically, producers provide information on the amount of packaging PoM through their
Extended Producer Responsibility (EPR) scheme, for example, to one or more Producer
Responsibility Organisations (PROs), which may operate under the scheme. Other data
sources include:
Directly sourcing data from producers;
Independent consulting companies;

Guidance for the compilation and reporting of data on packaging and packaging waste _________________________ 31
Primary data submitted directly to the national authority. This may include data submitted for other administrative purposes, such as under a packaging tax, or production and trade statistics; and
Regional authorities.
Data can be collected in a variety of ways including:
Reports/studies;
Databases;
Forms;
Online registers; and
Surveys.
Member States have different methods of collecting data and there are a number of common
issues with data collection. For example, data collection may not be regular or
comprehensive and data may not have been collected from every relevant producer, either
directly, or through EPR schemes. Reliance on occasional studies and surveys, which may
become quickly out of date, is also a problem.
A.1.1.2 How to address data collection issues
A number of steps should be taken to improve the collection of data by Member States.
These are listed below:
Member States should take the necessary measures to ensure that databases on packaging PoM are established, where not already in place. The databases shall include data based on Annex III in Directive 94/62/EC (total packaging placed on the market, in units or tonnes), and it should be ensured that:
data relate to the entire packaging unit, including separable packaging elements, such as plastic closures on packaging items (e.g. plastic closures on cartons)
the guidance for reporting on reusable packaging placed on the market is adhered to (see Sections 4.3 and 4.4, and Appendix 4);
reporting obligations are established for all relevant producers to report annually on packaging PoM, including any small producers that might otherwise be exempt because they fall under de minimis thresholds under EPR schemes;
PoM estimates are based on annual packaging PoM data from individual producers, to build the picture bottom-up by category and using data that is as accurate as reasonably possible; it should base on sales data, considering the entire packaging unit as explained above, and empty pack weights;
packaging definitions are well elaborated and guidance on these definitions is easily accessible for producers. Refer to definitions and examples of packaging as stated in Directive 94/62/EC; and
clear and easily accessible guidance for producers that provides all the required information in one place and sets out step-by-step actions that need to be taken to ensure the correct data is collected.

Guidance for the compilation and reporting of data on packaging and packaging waste _________________________ 32
In addition, the Commission’s upcoming guidance for EPR schemes will consider whether
Member States should require a more granular EPR fee structure, and associated reporting
structure, based on packaging type. This structure could include several categories for
plastic packaging based on format and polymer.
In order to reflect this, Member States should move to a position where they are collecting
data on the format and type of plastic packaging PoM. Table A-1 gives an example of the
plastic packaging categories as applied by the Fost Plus, Belgium’s largest PRO. Member
States may need to consider the most appropriate level of granularity given their planned
approach to fee modulation.
Table A-1: Example plastic packaging categories by format and polymer
PET - Bottles and Flasks - Transparent no colour
PET - Bottles and Flasks -Transparent blue
PET - Bottles and Flasks -Transparent green
HDPE - Bottles and Flasks
PP - Bottles and flasks and other rigid
PS – Rigid packaging except EPS and XPS
HDPE – Rigid packaging other than bottles and flasks
PET – Transparent, other than no colour, blue or green
PET – Rigid packaging other than bottles and flasks, transparent
PET – Bottles and flasks, opaque
PE – films
Other rigid plastics (except EPS, XPS, compostables)
Other films (except compostables)
EPS, XPS and compostable plastics
Complex packaging of which the majority is plastic
Multi-polymer plastic pouches
Source: Fost Plus
If Member States already have the data on these categories of packaging (and for other
materials), it is recommended that they report the data at this level of detail in the final sheet
of the questionnaire. Whilst a more detailed breakdown by packaging type is not mandatory,
it is desirable. Indeed, it is highly likely that such data will be required from EPR schemes in
the future. It would also be of value to Member State authorities to gather a more detailed
breakdown of packaging generation to aid evaluation of national packaging policies.

Guidance for the compilation and reporting of data on packaging and packaging waste _________________________ 33
A.1.2 Calculating packaging PoM
Even if a thorough and appropriate data collection method is used, the data provided by
producers and the other sources listed in A.1.1.1 may be inaccurately calculated. Moreover,
it is not often clear what methodology is applied by PROs and industry bodies to gather their
own data, or whether they quality assure the data they submit.
A.1.2.1 Identifying inaccurate data
The variety of methodologies, data sources and level of validation for measuring packaging
placed on the market, is problematic. There may be significant inaccuracies in the data
collected due to:
Data gaps and, either intentionally or unintentionally, mis-reported data;
Double-counting of PoM data;
Reliance on inaccurate or incomplete industry data, for example, inadequate sample sizes (to be representative), or on incorrect calculation methods (e.g. confusing kilograms for tonnes);
Inadequate reflection of import and export data, including that by third parties;
Declaring only the predominant packaging material, for example excluding plastic lids from glass jars;
Exclusion of data on reusable plastic packaging items placed on the market for the first time, causing an underestimate of plastic packaging generated.
In addition, Member States should be aware that the following two issues can increase the
risk of inaccurate PoM data:
I. The use of a De Minimis threshold for reporting standards; and
II. Free riding, typically facilitated by online sales and cross border trade.
A.1.2.1.1 Issues with a de minimis threshold
In the Commission’s draft new guidance for EPR schemes, it is recognised that full data
reporting may prove challenging to some smaller producers. For this reason, Member States
may apply a de minimis approach for reporting requirements. Using a de minimis would set a
threshold for the lowest level of reporting required. De minimis thresholds, if applied, will vary
across Member States.
If a de minimis threshold is applied, smaller producers may not have to provide full details
about the exact numbers of packaging PoM. In this situation, the Member State is required to
estimate the number of units PoM below the threshold. Not making such estimates can
compromise the accuracy of PoM data, as it does not provide complete coverage of the
market due to the lack of data on small producers. As a result, plastic packaging generated
would be underestimated, potentially causing an upward bias in recycling rates. If Member
States apply estimates in the case of data collection, which does not cover the whole market,
this needs to be explained in section 3.1.2 of the quality report, including detail on sources of
information, assumptions made and when estimates were used.

Guidance for the compilation and reporting of data on packaging and packaging waste _________________________ 34
A.1.2.1.2 Issues caused by free riding
Free riding typically takes the form of companies selling goods into a country where they are
not contributing to either take-back for separate collection, or funding the subsequent
collection and treatment. The free rider experiences the benefits without accruing the costs.
In this context, the free riders are those who place packaging on the market but do not report
data or take responsibility for the costs of collecting or treating it. This presents a problem for
reporting packaging PoM, because the lack of data on free riders means that the amounts of
packaging PoM are underestimated; there is a risk of reporting substantially inaccurate
values for packaging PoM. This issue applies to those who gather data directly from
producers, and often occurs in the following three ways:
I. Wrong or mis-reported data
Intentional and unintentional under-reporting of packaging PoM by producers reduces the
accuracy of data. Producers may under-report because EPR fees are typically based on the
weight of packaging PoM. Therefore, there is an inherent incentive for companies to choose
‘low’ unit weights for use in packaging calculations in order to minimise the fees they are
required to pay under EPR schemes.
II. Online sales
A 2018 study by the Organisation for Economic Co-operation and Development (OECD) has
shown that online multi-seller platforms are a major contributor to free riding. The most
significant free-riding problem in volume terms appears to relate to large and well-known
multi-seller platforms with fulfilment centres in the EU. The OECD study estimated that online
free-riding accounts for 5% to 10% of all electronic and electrical equipment (EEE) sales.13
As a result, the lack of data on online sales, both from seller websites inside and outside the
EU, means that packaging PoM is understated. It is worth noting that these platforms often
fulfil orders, i.e. have a warehousing operation, in the Member State or a neighbouring
country, which further contributes to the issue.
III. Cross border sales
Cross border sales and purchases can also facilitate free riders. What is placed on the
market in a Member State does not necessarily become waste in that country. This might be
because:
People may purchase a packaged item in one country and take it to another; or
People may purchase items online from companies located in other countries.
In most cases, physical, private imports are unlikely to be of great significance; the flows of
material from one country to another are unlikely to be a significant proportion of the
packaging waste stream. The main exception is where different tax rates generate significant
price differentials for packaged goods; this can be a significant problem, in particular for
13 OECD (2018) Extended Producer Responsibility and the Impact of Online Sales. Available at https://www.oecd.org/environment/waste/policy-highlights-extended-producer-responsibility-and-the-impact-of-online-sales.pdf

Guidance for the compilation and reporting of data on packaging and packaging waste _________________________ 35
smaller EU countries where lower cost goods may be available a short distance away in
another Member State. One example could be alcohol excise duties.
In these situations, the amount of packaged product, which moves across borders is:
Likely to be significant; and
Likely to display a single direction of travel. This means that the flow in one direction is not ‘cancelled out’ by the flow in the opposite direction.
Cross-border trade can therefore lead to inaccurate PoM data and increase the risk of free
riders.
A.1.2.2 How to address inaccurate data
A.1.2.2.1 Following the draft new EPR guidance on de minimis thresholds
If a de minimis is used, it is recommended to set a threshold which minimises the loss of
market data whilst reduces reporting burdens for producers of smaller volumes of packaging.
If deemed necessary, the de minimis threshold should be set so that the vast majority of
packaging accounted for by the PRO is reported to the full standard. Larger producers
should be subject to the full reporting requirements. It is recommended that if a de minimis is
applied, the reporting threshold should be based on annual turnover, rather than tonnes of
packaging PoM, as turnover data is more accessible. In order to reduce reporting burden on
small producers, this turnover threshold is likely to be a few million euros.
It is crucial that the minimum reporting standard does not compromise the Member State’s
ability to obtain accurate data for what is placed on the market. If the minimum reporting
requirements are based on the amount of PoM for a specific type of packaging, the typical
weights applied need to be accurate. It is recommended that Member States review these
weights and thresholds periodically.
Where small producers are not reporting to PROs/compliance schemes, it is recommended
that the Member State requires them to report directly to the relevant authority.
A.1.2.2.2 Identifying and reporting on free riders
A number of steps can be taken to identify and report on free-riders. Online selling is a
particular priority. For online free riders specifically, it is recommended that Member States
should engage with multi-seller platforms as a priority and obtain their commitment to take
action on free-riding.
Concerning who should be considered a multi-seller platform, it is worth noting that the EU
‘Blue Guide’ on the implementation of EU product rules states that:
“where fulfilment service providers provide services … which go beyond
those of parcel service providers, they should be considered as distributors
and should fulfil the corresponding legal responsibilities. Taking into
account the variety of fulfilment houses and the services they provide, the
analysis of the economic model of some operators may conclude that they
are importers.”

Guidance for the compilation and reporting of data on packaging and packaging waste _________________________ 36
This would mean that it is legitimate to require fulfilment service providers to be obligated as
distributors and potentially producers. However, not all multi-seller platforms undertake
fulfilment, for example eBay, a multi-seller platform, which does not have physical distribution
warehouses. Therefore, such sites may not be required to take on producer responsibilities
or full reporting requirements.
The following actions are recommended to identify and report on online free-riders:
1. Place a requirement on e-commerce platforms to:
a. check seller EPR registrations as part of the platform registration and
contractual process; and either
b. prohibit access to those that cannot show appropriate EPR documentation for
the products they sell; or
c. take on the EPR obligations of their sellers, where the platform facilitates
import (fulfils delivery):
i. and the seller is not EPR registered; and/or
ii. the seller falls below a de minimis that excludes them from obligations.
d. provide seller quantity data in EPR product categories to PROs and/or
regulators as appropriate to allow auditing of declared quantities under EPR
registrations.
If a less stringent approach is required, the following is an alternative option:
2. Require online multi-seller platforms to sign up to an e-commerce code of practice.
This practice could be a standard for websites that requires each seller to provide the
Producer Responsibility Organisation registration details, the legal entity address and
contact information, and potentially a logo. This could build on the SafeShops.be
model and similar e-commerce quality labels. This would provide a mechanism for
enforcement authorities and informed consumers to check. It would still require
Member State authorities to verify the validity of registration details however.
In addition, the following complimentary actions are recommended to be taken by Member
States to identify, minimise and report on free-riders in the market. These recommendations
may be included in the Commission’s upcoming guidance for EPR schemes.
1. Implement market surveillance activities to identify those producers that place
unregistered packaging on the market;
2. Mandate an attempt to quantify the data on unregistered packaging PoM and on
cross-border purchases. For example, Member State customs agencies could
conduct surveys to estimate the annual flows of packaging across certain borders,
and compare these figures with sales data from the countries, as well as any
collection scheme like a deposit return scheme (DRS);
3. Producer responsibility organisations, enforcement agencies, customs authorities,
trading standards authorities and tax authorities should share information to identify
Guidance for the compilation and reporting of data on packaging and packaging waste _________________________ 37
and counter free-riding. One example is cross checking customs data with imports
and products that are declared under EPR registration. EPR and VAT registration
could also be linked. Customs authorities could also require an EPR registration and
PRO contract whenever they detect the importation of a product covered by EPR
legislation. This type of interlinking already exists and cross-checking of obligations is
already done automatically where there are relevant databases;
4. Obligations could be placed on couriers and parcel services where the seller does not
have a physical establishment in the country in question. Large couriers and logistics
companies such as UPS, DHL and FedEx would therefore be motivated to ensure
that:
a. the sellers are registered where possible with a PRO or Authorised
Representative (AR); or
b. that any costs incurred by the courier company in fulfilling obligations are
passed on contractually.
5. Harmonisation of EPR regulations and electronic registration. Steps should be taken
to ensure that all producer and distributor registers are electronic, public and, as far
as possible, standardised for each product group. Both the trading name and the
legal entity name of the web site should be required for registration. Harmonisation
will facilitate information exchange and checking for free-riders by PROs and
enforcement authorities;
6. Build into national/territory legislation the ability to prosecute a company for illegal
action in another country/territory to facilitate enforcement. Member States should
consider introducing additional enforcement powers, and enabling private actions, to
prevent illegal online selling; and
7. PROs should be obligated to undertake promotional and awareness raising work
overseas.
Good practice examples
A number of Member States have taken action to tackle free riding. Although some of these
examples relate to waste electrical and electronic equipment (WEEE), the methods used are
still instructive:
In 2019, France made steps to tackle free riders by announcing new obligations for online platforms, as part of the French Circular Economy Law. The Law requires online multi-seller platforms such as Amazon and Alibaba to ensure that the collection and recycling of packaging arising from products marketed and sold on their websites are properly financed (i.e. that sellers are EPR registered). The online platforms will, by default, be held responsible for the EPR obligations of their sellers if they cannot prove this.
In Germany, under the “Gesetz gegen den unlauteren Wettbewerb – UWG” law, a competitor can issue a “warning” (effectively a cease-and-desist letter) and demand compensation from a non-compliant producer, stop the producer from selling non-registered EEE (injunction), and request disclosure of sales and their recipients. The

Guidance for the compilation and reporting of data on packaging and packaging waste _________________________ 38
Federal Environment Agency can also request the “absorption” of profit gained through unfair competition. Germany has also noted that it has plans to roll out an automated procedure for identifying potential free-riders by website keyword search and is assessing the possibility of requiring the online platforms to check the compliance for their sellers and block them, if not compliant (duty of examination). The new German Packaging Law (VerpackG) tackles free-riders in on-line sales via a new centralised office, which manages a packaging register collecting data on actors and the quantities of packaging that they put on the German market.
In Ireland, online sellers of EEE are required to display the EEE producer and EPR registration number. Furthermore, the Environmental Protection Agency (EPA) has an enforcement programme for the WEEE and battery system that includes free-rider investigations. On-the-spot fines can also be used to penalise non-compliant web sites.
A.1.2.2.3 Improving estimates
This section relates to Section 3.1.2 and 3.1.3 in the quality report. Where data is inaccurate,
missing or unavailable, it is often necessary for Member States to use estimates for the
amount of packaging PoM. The accuracy of the estimates clearly depends on the quality of
the data upon which they are based, and this can vary between Member States.
The following steps are proposed to improve current estimation methods:
1. Make substantiated estimates based on monitoring across a representative sample of
producers, for example across those that fall below a de minimis threshold or online
sellers. Statistical modelling could also be used to estimate the number of producers
in a country and the quantity of packaging PoM, as demonstrated — for plastic
packaging — in WRAP’s PlasticFlow 2025 report.14 In a best-case scenario, this would
be a representative survey of the weights of packaging PoM in a Member State.
2. Use targeted stakeholder interviews to:
a. refine the estimates from the above techniques for certain types of producers
who may be significantly different from other producers; and
b. test the validity of the estimated number of producers through industry expert
interviews.
A.1.2.2.4 Harmonisation of data
Although Member States have no obligation to do so, harmonisation of data reporting across
Member States will alleviate the burden for producers. Harmonisation relates to the type, the
format and the frequency of requested data. If possible, Member States should consider if
they can require reporting that aligns with other Member States.
14 WRAP (2018) PlasticFlow 2025: Plastic Packaging Flow Data Report. Available at https://wrap.org.uk/resources/report/plasticflow-2025-plastic-packaging-flow-data-report

Guidance for the compilation and reporting of data on packaging and packaging waste _________________________ 39
A.1.3 Reporting of data from waste analysis
Waste composition analysis typically applies the following methodological steps:
1. Samples of specific waste streams are taken;
2. The sample volume is reduced to a manageable size;
3. Each sample is physically sorted, often by hand, into separate, predetermined
categories; and
4. The amount of waste in each category is calculated using weight.
At present, Member States and Producer Responsibility Organisations (PROs) or similar, use a variety of methods for waste analysis and there are many existing standards and methodological guidance documents for carrying out waste compositional analyses. For example, those given in Section A.2.6.1 of Appendix 2.
It is beyond the scope of this document to provide comprehensive guidance on how waste analysis should be conducted; however, a number of key principles are outlined in the following section.
Key Principles of Waste Composition Analysis
Member States should apply a reasonable and proportionate estimation method in order to determine the quantities of certain waste categories in specific waste streams. It is important to recognise that waste composition analysis provides data for a single, specific point in time and location. There are four key factors to be considered, as they can influence the accuracy of this data:
Scope/number of samples – samples need to be representative of the area or waste stream
in question. Consideration needs to be given to the sampling procedure followed, such as
whether a stratified sampling approach is used;
Size of the individual samples – the size, either by weight or by volume, of each sample should be uniform across the study. When commercial waste is included, the sample size needs to be larger to attain the same level of accuracy, as there is greater variability in the composition of waste between samples than for household waste;
Frequency of sampling – the time of year and day can affect amounts of waste generated. For instance, more plastic beverage bottle waste tends to arise during the summer. The chosen frequency should ensure sufficient account of variation in waste arisings; and
A sufficiently detailed breakdown of the categories which the waste is sorted into, and guidance to ensure the consistent use of categories. More detailed reporting will also be required under fee modulation currently applied by EPR schemes and proposed in the draft new EPR guidance.
For analysis relating to household waste, Member States should consider the following factors when conducting sampling:
Settlement structure, e.g. rural/urban;
Household size/number of occupants;

Guidance for the compilation and reporting of data on packaging and packaging waste _________________________ 40
Household type, e.g. single, low-rise or multi-occupancy, high-rise;
Type of occupant and socio-economic factors, as the income and lifestyle of the occupant will affect the amount and type of waste they generate, e.g. elderly, young family, low/high income etc.;
Waste service in operation, including the type and size of containers used (e.g. large waste containers for several households used together vs individual household waste bins) and the collection cycle (e.g. weekly, door-to-door); and
The influence of pay-as-you-throw (PAYT) / residual waste charging schemes, as the composition can change as the level of the charges increase (i.e. household members put more contaminating material in the recycling bins to avoid the charges).
For waste analysis relating to commercial waste, Member States should consider the
following additional factors when conducting sampling:
The representation of different sectors/business types in the sampling framework;
The representation of different sized businesses in the sampling framework;
The use of on-site audits, and the approach used for very large sites;
Waste service in operation, including the collection cycle.
For practical implementation strategies, it is recommended that Member States refer to the relevant national guidance on waste composition analysis, as well as the Methodology for the Analysis of Solid Waste developed by the European Commission.15
The following elements are also important to ensure high quality data on packaging waste based on waste analysis:
Consideration needs to be given to the difference between the weight of packaging measured at the specific points where composition analysis is undertaken, and the weight at the point of recycling. The principle should be to obtain weights that are equivalent to the weights placed on the market, i.e. the waste fractions should be “pure, clean and dry”. This is to ensure that the weight results obtained by the sampling process are as equivalent as possible to the weight of packaging placed on the market.
To ensure that the grossing up of the sampling results to the totals is based on a well defined stratification approach (as per examples given above). This includes the selection of the waste flows to which the coefficients determined by the sampling are applied.
15 https://www.wien.gv.at/meu/fdb/pdf/swa-tool-759-ma48.pdf

Guidance for the compilation and reporting of data on packaging and packaging waste _________________________ 41
Appendix 2 Reference manual: Reporting of data on packaging waste recycling
A good practice would consist of determining first the treatment category, in order to discard
treatment categories that exclude recycling. Calculation points are important in the
categories that include recycling, as they will help determine the actual share of material that
will undergo recycling.
For filling in recycling data in Table 1, data should be split into three columns depending on
the location of the recycling activities. The important aspect here is where the calculation
point is located. Waste data systems must be set up to ensure data from operators within the
country clearly correspond to the calculation points to identify whether recycling has occurred
in the Member State. If the calculation point has not been reached in the Member State, in
which the waste originates, then data must be gathered from operators further down the
recycling value chain e.g. exporters or recycling companies in other countries.
To ensure that all columns of the table are properly filled out, the waste data systems
mentioned above will need to account for situations in which waste is exported to another
Member State, and subsequently exported outside of the EU. If no exact information is
available on the waste flows, approximations based on studies and research can be used for
the amounts of waste recycled outside the Member State. A description of the approach
taken should be given in Section 3 of the ‘quality report’ (see Section 5 of the guidance for
further details on completing the quality report).
Further information on identifying the calculation points for different packaging materials, as
well as obtaining data and allowable measurement methods, is provided in the sections
under the summary of the difference between the old and new calculation rules.
A.2.1 Difference in reporting rules
Table A-2: Difference in Reporting Rules
Calculation
Rule Element
Old Rules New Rules Key Difference
Point of
Reporting of
Recycled
Amounts
2005/270 (prior to
2019/665)
Article 3(4) The weight of
recovered or recycled
packaging waste shall be
the input of packaging
waste to an effective
recovery or recycling
process. If the output of a
sorting plant is sent to
effective recycling or
recovery processes
without significant losses,
it is acceptable to consider
2005/270 as amended by 2019/665
Article 6c(1) point (a) The amount of
recycled packaging waste shall be
the amount of waste at the
calculation point. The amount of
packaging waste entering the
recycling operation shall include
targeted materials. It may include
non-targeted materials only to the
extent that their presence is
permissible for the specific recycling
operation. The calculation points
applicable to certain packaging
Effective recycling
processes are now
defined by the calculation
points, and losses
between output of sorting
plants and the calculation
points must be deducted,
whether they are
significant or not. This
removes the possibility to
report the recycled
quantities as the input to a
‘recycling process’ after
sorting whereby there are

Guidance for the compilation and reporting of data on packaging and packaging waste _________________________ 42
Calculation
Rule Element
Old Rules New Rules Key Difference
this output to be the
weight of recovered or
recycled packaging waste.
waste materials and certain recycling
operations are specified in Annex II.
Article 6c(1) point (b) Where the
measurement point relates to the
output of a facility that sends
packaging waste for recycling
without further preliminary treatment,
or to the input of a facility where
packaging waste enters the recycling
operation without further preliminary
treatment, the amount of sorted
packaging waste that is rejected by
the recycling facility shall not be
included in the amount of recycled
packaging waste.
significant losses through
the process before the
output materials are
actually reprocessed into
products, materials or
substances
Preliminary
treatment
(no rules, waste removed
from preliminary treatment
at recycling facilities could
be included in the
amounts reported as
recycled.)
Article 6c(1) point (c) Where a facility
carries out preliminary treatment
prior to the calculation point in that
facility, the waste removed during
the preliminary treatment shall not be
included in the amount of recycled
packaging waste reported by that
facility.
Waste removed during
preliminary treatment at
recycling facilities cannot
be included in the
amounts reported as
recycled by that facility
but could be included
further along the recycling
chain.
Biodegradable
packaging
‘organic recycling’ shall
mean the aerobic
(composting) or anaerobic
(biomethanization)
treatment, under
controlled conditions and
using micro-organisms, of
the biodegradable parts of
packaging waste
94/62/EC as amended by 2018/852
4. For the purposes of calculating
whether the targets laid down in
points (f) to (i) of Article 6(1) have
been attained, the amount of
biodegradable packaging waste that
enters aerobic or anaerobic
treatment may be counted as
recycled where that treatment
generates compost, digestate, or
other output with a similar quantity of
recycled content in relation to input,
which is to be used as a recycled
product, material or substance.
Where the output is used on land,
Member States may count it as
recycled only if this use results in
benefits to agriculture or ecological
improvement.
2005/270 as amended by 2019/665
When exactly
biodegradable packaging
treated in composting
and/or digestion plants
can be counted as being
recycled, is further
detailed under the
attainment of the targets.
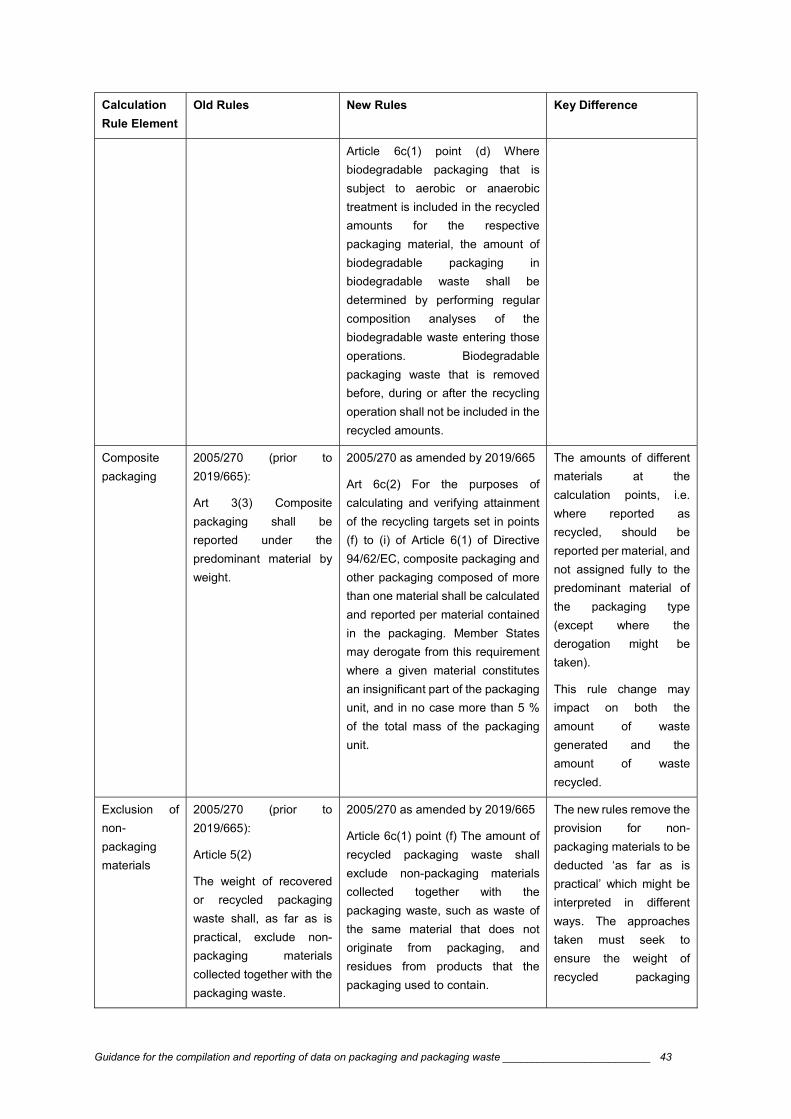
Guidance for the compilation and reporting of data on packaging and packaging waste _________________________ 43
Calculation
Rule Element
Old Rules New Rules Key Difference
Article 6c(1) point (d) Where
biodegradable packaging that is
subject to aerobic or anaerobic
treatment is included in the recycled
amounts for the respective
packaging material, the amount of
biodegradable packaging in
biodegradable waste shall be
determined by performing regular
composition analyses of the
biodegradable waste entering those
operations. Biodegradable
packaging waste that is removed
before, during or after the recycling
operation shall not be included in the
recycled amounts.
Composite
packaging
2005/270 (prior to
2019/665):
Art 3(3) Composite
packaging shall be
reported under the
predominant material by
weight.
2005/270 as amended by 2019/665
Art 6c(2) For the purposes of
calculating and verifying attainment
of the recycling targets set in points
(f) to (i) of Article 6(1) of Directive
94/62/EC, composite packaging and
other packaging composed of more
than one material shall be calculated
and reported per material contained
in the packaging. Member States
may derogate from this requirement
where a given material constitutes
an insignificant part of the packaging
unit, and in no case more than 5 %
of the total mass of the packaging
unit.
The amounts of different
materials at the
calculation points, i.e.
where reported as
recycled, should be
reported per material, and
not assigned fully to the
predominant material of
the packaging type
(except where the
derogation might be
taken).
This rule change may
impact on both the
amount of waste
generated and the
amount of waste
recycled.
Exclusion of
non-
packaging
materials
2005/270 (prior to
2019/665):
Article 5(2)
The weight of recovered
or recycled packaging
waste shall, as far as is
practical, exclude non-
packaging materials
collected together with the
packaging waste.
2005/270 as amended by 2019/665
Article 6c(1) point (f) The amount of
recycled packaging waste shall
exclude non-packaging materials
collected together with the
packaging waste, such as waste of
the same material that does not
originate from packaging, and
residues from products that the
packaging used to contain.
The new rules remove the
provision for non-
packaging materials to be
deducted ‘as far as is
practical’ which might be
interpreted in different
ways. The approaches
taken must seek to
ensure the weight of
recycled packaging

Guidance for the compilation and reporting of data on packaging and packaging waste _________________________ 44
Calculation
Rule Element
Old Rules New Rules Key Difference
excludes non-packaging
materials.
A.2.2 Correctly identifying the calculation points
A.2.2.1 Plastic packaging
A.2.2.1.1 Mechanical recycling
The calculation rules below are defined in Article 6a of the Directive and in Decision
2005/270.
The calculation point for plastic packaging is defined in Annex II of the Decision as:
Plastic separated by polymer that does not undergo further processing before entering pelletisation, extrusion, or moulding operations;
Plastic flakes that do not undergo further processing before their use in a final product.16
As illustrated below in Figure A-1Error! Reference source not found., the definition sets
the calculation point to measure the weight of a product that has been:
ground/flaked (necessary for adequate sorting and washing processes)
sorted (so that the product does not include the weight of materials that are not the required resins (polymers) to be recycled);
washed (so that the product does not include the weight of materials that are not the required resins (polymers) to be recycled); and
dried (so that the weight does not include moisture in excess of the “natural humidity”).
As regards whole loads of material that are rejected from entering a recycling process, they
cannot be counted as recycled for the purposes of the recycling calculation.
In some cases, specific preliminary and recycling operations are integrated into a single
facility whereas in other cases they might be located at different facilities, within the same
company or operated by another company. Where plastics are recycled within an integrated
system, the calculation point may therefore need to be identified between key operations, so
that it is consistent with the calculation points identified in the Commission Implementing
Decision – this may correspond to the production of secondary raw materials at certain
industry specifications.
16 Final products in this context include extruded products, sheet and agglomerates. Other examples of “final products” will be considered on a case-by-case basis, using the principle of equivalence.

Guidance for the compilation and reporting of data on packaging and packaging waste _________________________ 45
Additionally, there may be processes that do not measure the weight of the plastics at the
calculation point because the material is sent onto extrusion or agglomeration processes. It is
permissible to set the measurement points further down the processes, so as to measure the
outputs from extrusion or agglomeration processes. In these cases it is not necessary to
deduct the weight of extruded filtration cake or fine dust that are subsequently disposed of,
as these are considered to be ‘inherent losses’. In some cases, however, extruded filter cake
can be re-ground and reintroduced into the recycling process, where the tolerances for
contamination are relatively high (e.g. polyolefin recycling batches). In such cases, if the
extruded filter cake is subsequently recycled, it can no longer be considered an inherent loss,
and so the measurement method should be developed in such a way that it prevents double
counting (and thereby overestimation of the packaging recycled). See Figure A - 1 below.
Figure A - 1: Plastics calculation point
The calculation point cannot be before any further processing step prior to the material
entering pelletisation, extrusion, or moulding operations. These processing steps include all
types of washing e.g. cold washing, hot washing, and any combination thereof. As such,
although a ‘cold wash only’ process may give rise to both lower quality (i.e. more
contaminated) material and to a higher contribution towards the recycling rate (due to the
mass of the contaminants being included in the material counted as recycled), there is no
specific provision in law for hot washed plastic to be subject to an earlier (pre-hot wash)
calculation point. However, the effect of the difference in mass of contaminants between cold
and hot washed plastic flakes is likely to be extremely small, as even cold washed plastic
entering extrusion processes for lower grade products such as plastic refuse sacks must still
meet high quality standards.
A.2.2.1.2 Chemical recovery
Chemical recovery, commonly referred to as chemical recycling (also known as feedstock
recycling), is the process of breaking down collected plastics into their constituent monomers

Guidance for the compilation and reporting of data on packaging and packaging waste _________________________ 46
and other basic chemical elements (“depolymerisation”). It makes it possible to replace other
materials which would have been used to fulfil a particular function.
Not all of the constituent monomers may, though, be recycled back into new plastic products.
Depending on the industrial process they are used in, those monomers will contribute to
different products, materials or substances; the principal use of the waste packaging
materials will determine whether they can be considered recycling or not.
Article 6c(1) of the Decision takes this into account in the following cases:
- Use as fuels, including co-incineration: if the principal use is as fuel or energy
generation, then nothing should be counted as recycling.
Article 6c(1) (h): “Where packaging waste materials enter recovery operations
whereby those materials are used principally as a fuel or other means to generate
energy, the output of such operations that is subject to material recovery, such as the
mineral fraction of incineration bottom ash or clinker resulting from co-incineration,
shall not be included in the amount of packaging waste recycled, […].”
This also applies for any energy generated from the waste that is used to power the
recycling process itself.
- Use in recovery operations where the principal use is neither as a fuel nor to recover
the target material. Then a mass balance approach should be applied.
Article 6c(1) (i): “Where packaging waste materials enter recovery operations
whereby those materials are not principally used either as a fuel or other means to
generate energy, or for material recovery, but result in output that includes recycled
materials, fuels or backfilling materials in significant proportions, the amount of
recycled waste shall be determined by a mass balance approach which results in
taking account only of waste materials that are subject to recycling”
Member States should outline the full details of the mass balance approach used to
identify any packaging currently reported as recycled from chemical processes as
part of the quality report (under question 2.1). Member States should outline any
quality assurance/chain of custody schemes to be established to ensure the mass
balance is conducted according to the calculation rules put in place.
Use of treated packaging plastic waste in blast furnaces
This industrial process consists of using treated plastic packaging waste to substitute coke or
heavy oil as a reduction agent in blast furnaces. When burned in a controlled atmosphere. It
releases carbon monoxide (CO) and heat. Carbon monoxide is used as a reduction agent to
convert metal ores into pure metals, by capturing the oxygen atoms from metal oxides and
releasing carbon dioxide to the atmosphere.
This particular case should be deemed as “other recovery”, since the principal use is not
material recycling or fuel. No material from the plastic packaging waste ends up in the final
product.

Guidance for the compilation and reporting of data on packaging and packaging waste _________________________ 47
The use of plastic waste in blast furnaces cannot be accounted for as recycling according to
Article 6a(5) of the Directive, as first plastic is incinerated to create carbon monoxide as an
intermediate step which is no further reprocessed into products, materials or substances;
when a chemical reaction has intermediate steps, those intermediate steps should not be
understood as ‘reprocessed into substances’.
“The amount of packaging waste materials that have ceased to be waste as a result
of a preparatory operation before being reprocessed may be counted as recycled
provided that such materials are destined for subsequent reprocessing into products,
materials or substances to be used for the original or other purposes. However, end-
of-waste materials to be used as fuels or other means to generate energy, or to be
incinerated, backfilled or landfilled, shall not be counted towards the attainment of the
recycling targets.”
A.2.2.2 Paper and cardboard packaging
The calculation point for paper and cardboard packaging is indicated in Figure A - 2.
The calculation point for paper and cardboard packaging is defined in Annex II of Decision
2005/270 as follows:
Sorted paper that does not undergo further processing before entering a pulping operation
Paper and cardboard is typically reprocessed into similar materials by being introduced to a
pulping process; the calculation point has been set on the weight of material entering this
process on the basis that this material meets the standards of EN643. This ensures the
requirement for recycling to be ‘high quality’ in Article 6a(1) of the Packaging and Packaging
Waste Directive (PPWD). Material with higher levels of non-fibre contamination than allowed
for under EN643 standards that are introduced to a pulping process would result in an
overstated recycling rate and in these cases, there should be a corresponding deduction
from the mass of the material introduced to the pulping operation.
Paper may also be recycled by other processes than the pulping process.
Certain fractions of the mass of material introduced into the pulping process do not yield
fibres for remanufacturing but result in material sent for disposal or energy recovery such as
screened material from pulp screening or chemicals/inks from the de-inking processes. On
the assumption that material introduced to the pulping operation complies with EN643
standards, the losses from the pulping process onwards count as inherent losses and
therefore it is not necessary to deduct the weight of these losses from the final recycling
reported.

Guidance for the compilation and reporting of data on packaging and packaging waste _________________________ 48
Figure A - 2: Paper / cardboard calculation point
A.2.2.3 Glass packaging
The calculation point for glass is indicated in Figure A - 3. The definition in Annex II of
Decision 2005/270 is as follows:
Sorted glass that does not undergo further processing before entering a glass furnace or the production of filtration media, abrasive materials, glass fibre insulation and construction materials.
Collected end of life glass packaging items require sorting before the material can be
introduced to a glass furnace or any of the other production processes stated in the
definition. The calculation point is set to account for the material entering the glass furnace or
other relevant processes after unwanted material is removed through sorting processes.
It is noted that in the case of glass bottles, some materials (such as aluminium closures) may
count towards recycling targets for other materials (such as aluminium recycling). Therefore,
these materials should not be counted towards the recycling targets for glass, and should be
captured under the metal calculation point (see below).
It is further noted that the production of glass aggregate for backfilling or landfilling counts
does not count towards recycling targets, as set out in Article 6a(5) of the revised PPWD:
(…), end-of-waste materials to be used as fuels or other means to generate energy, or to be incinerated, backfilled or landfilled, shall not be counted towards the attainment of the recycling targets.
However, aggregate used for backfilling can be reported towards recovery targets (as
indicated in the footnote to the “Other recovery” column in Table 1 of Annex 1 in Decision
2005/270).

Guidance for the compilation and reporting of data on packaging and packaging waste _________________________ 49
Figure A - 3: Glass packaging calculation point
A.2.2.4 Metal packaging
The calculation point for metal packaging is indicated in Figure A - 4 (for ferrous metals) and
Figure A - 5 (for aluminium). The definition in Annex II of Decision 2005/270 is as follows:
Sorted metal that does not undergo further processing before entering a metal smelter or furnace.
Collected end of life metals sometimes require sorting before they can be introduced to a
metal smelter or furnace. The calculation point is set to account for the material entering the
metal furnace or other relevant processes after unwanted material is removed through
sorting.
For the purposes of the calculation rules, tinned packaging is acceptable to the operation of
the furnace, as indicated above, and so these tramp elements should not be deducted from
the weight of steel counted as recycled.
It is noted that preliminary treatment of metals (shown in the figure below as a separate step
called “reception facility quality control / pre-sort”) may also take place within the metal
smelting / refining facility itself. Although in such case pre-sorting prior to smelting occurs
within the refining facility, countries have to consider it prior to the calculation point (as the
regular sorting). This is set out in Article 6a(5) of the revised PPWD:
Where a facility carries out preliminary treatment prior to the calculation point in that facility, the waste removed during the preliminary treatment shall not be included in the amount of recycled packaging waste reported by that facility.
Multiple calculation points may be needed for metals given the different flows in the recycling
chain for different types of municipal waste and packaging metal wastes. The output of the
above-mentioned specialised operation is equivalent to the input to the metal smelter or
furnace, so Member States can report at the entry to these plants, if it is easier for them to do

Guidance for the compilation and reporting of data on packaging and packaging waste _________________________ 50
so, or if separately collected metals are sent directly to a smelter or furnace, as long as any
materials removed during preliminary treatment are suitably deducted from the weight of
packaging reported as recycling.
In the case of recycled aluminium closures for glass bottles (see above), the calculation point
can correspond to the output of the glass sorting facility if the separated aluminium fraction is
sent directly for smelting with no prior treatment. In this case, care must be taken to avoid
double counting of this fraction at the point of input into the smelter as well.
Figure A - 4: Steel calculation point
Figure A - 5: Aluminium calculation point
A.2.2.5 Wooden packaging
The calculation point in this case may be the amount of fine material sent off to recycled
board manufacture, or the input waste minus non-target material extracted for recycling,
disposal or thermal recovery, as shown in
Figure A - 6. The definition is as follows.
Sorted wood that does not undergo further treatment before utilisation in particleboard manufacture.
Sorted wood entering a composting operation.

Guidance for the compilation and reporting of data on packaging and packaging waste _________________________ 51
Sorted wood entering a composting operation would need to meet certain criteria to ensure
that the quality of the output compost meets relevant standards. In addition, only food waste
collected separately at source can be counted for recycling, so wood waste composted
should only be counted for recycling if it also originates from segregated sources. Energy
recovery of wood waste does not count as recycling.
Figure A - 6: Wood calculation point
A.2.2.6 Fabric/ textile packaging
The calculation point for textiles is defined as follows:
Sorted textile material that does not undergo further processing before its utilisation for the production of textile fibres, rags or granulates.
The output of a sorting process is a pragmatic point for reporting, and can be reported by the
plant operator to the national authorities.
Chemical recovery of textiles should also be accounted for according to the conditions set
out for plastics in appendix A.2.1.2.2, whereby a mass balance approach is proposed, and
the calculation point becomes the point where chemicals from the process are used as the
basis for manufacturing new plastics (and not as fuel).
Finally, while preparation of textile packaging for reuse counts towards the recycling targets,
reuse of textile packaging (such as cotton/ jute carrier bags) shall not (except reusable sales
packaging up to 5% of the target).
A.2.2.7 Composite packaging
The calculation point for ‘composite packaging and packaging composed of multiple
materials is defined as follows:
Plastic, glass, metal, wood, paper and cardboard and other materials resulting from the treatment of composite packaging or of packaging composed of multiple materials
Guidance for the compilation and reporting of data on packaging and packaging waste _________________________ 52
that do not undergo further processing before reaching the calculation point established for the specific material.
Materials present within composites, e.g. paper, wood, metal, plastic, textiles, should be
captured by calculation points for these specific materials, as separated material would be
sent for further material specific recycling operations. However, for some composite
products, such as beverage cartons, the preliminary treatment process includes a pulping
operation to recover the fibres. If the output was counted, this would not be in line with the
approach for paper and cardboard recycling. However, the input to the recycling plant should
not be used, as some elements, such as the plastics, are generally sent for energy recovery
and not recycling. Therefore, the approach should be to measure the input and deduct any
outputs sent for energy recovery or other material recycling operations.
It is noted that deduction should only occur if the component parts are not insignificant; if
they are <5% of the total item weight, they can be accounted for as being recycled along with
the predominant material of the packaging.
A.2.3 Allowable measurement methods
The measurement method is the approach(es) that is taken to calculate the amount of
recycling at the calculation points defined in the Implementing Decision. The approach could
make use of different measurement points and arithmetic formulas to make the calculation.
In this section, some guidance is given on measuring the amount of recycling at the
calculation points for plastics.
A generalised multi-stage recycling value chain is shown in Figure A - 7. The weight of material at the calculation point should be calculated and reported for each material in line with the reporting formats in the Decision. The following rules should be considered:
The amount of moisture added to the waste after any point at which that waste or product is weighed for inclusion in the denominator (e.g. waste generated) may need to be adjusted for within the amounts reported at the calculation point (see Section A.2.4 below for further detail on this).
It can be assumed that the weight of material at the output of one operation is equivalent to the weight of material at the input to the next operation (except in cases where entire loads are rejected). Consequently, MP3 = MP4 (output from initial sorting = input to further sorting process) and MP6 = MP7 (output from sorting = input to further processes) as shown in Figure A-7.
The weight of material may be calculated at recycling processes further downstream of MP7 if they provides the more practicable points for measurements. In these cases, it is not necessary to deduct inherent losses17 that occur after MP7 from the amount of material calculated as recycled. Some examples of inherent losses that may be relevant to different packaging materials are provided in the table below:
17 losses in weight of materials or substances due to physical or chemical transformation processes inherent in the recycling operation where packaging waste is actually reprocessed into products, materials or substances
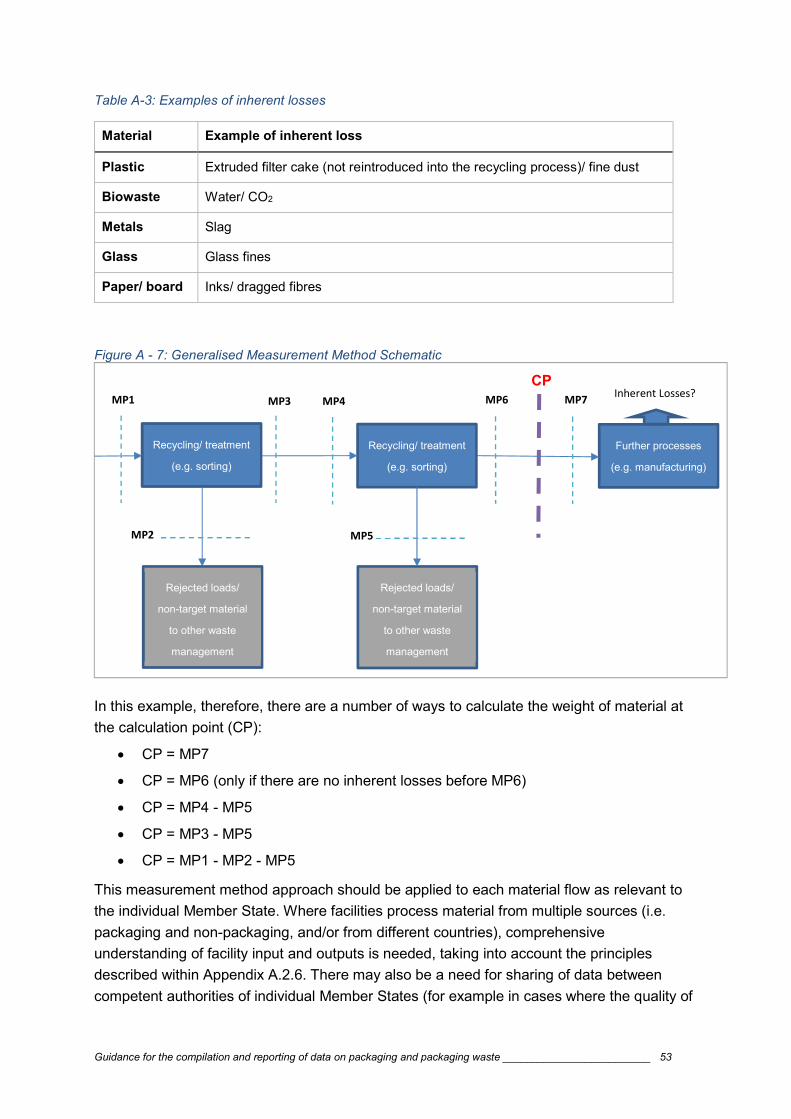
Guidance for the compilation and reporting of data on packaging and packaging waste _________________________ 53
Table A-3: Examples of inherent losses
Material Example of inherent loss
Plastic Extruded filter cake (not reintroduced into the recycling process)/ fine dust
Biowaste Water/ CO2
Metals Slag
Glass Glass fines
Paper/ board Inks/ dragged fibres
Figure A - 7: Generalised Measurement Method Schematic
In this example, therefore, there are a number of ways to calculate the weight of material at
the calculation point (CP):
CP = MP7
CP = MP6 (only if there are no inherent losses before MP6)
CP = MP4 - MP5
CP = MP3 - MP5
CP = MP1 - MP2 - MP5
This measurement method approach should be applied to each material flow as relevant to
the individual Member State. Where facilities process material from multiple sources (i.e.
packaging and non-packaging, and/or from different countries), comprehensive
understanding of facility input and outputs is needed, taking into account the principles
described within Appendix A.2.6. There may also be a need for sharing of data between
competent authorities of individual Member States (for example in cases where the quality of
Recycling/ treatment
(e.g. sorting)
Further processes
(e.g. manufacturing)
CP
Rejected loads/
non-target material
to other waste
management
Recycling/ treatment
(e.g. sorting)
Rejected loads/
non-target material
to other waste
management
Inherent Losses?
MP5
MP1
MP2
MP3 MP4 MP6 MP7

Guidance for the compilation and reporting of data on packaging and packaging waste _________________________ 54
material processed in facilities differs between source countries), as is discussed in Section
A.2.9 on average loss rates.
Example flow diagrams for individual packaging materials are given in Section A.2.2 above.
In this regard, consideration will have to be given to composite packaging (i.e. packaging
composed of more than one material), which, as per Decision 2005/270, must be calculated
and reported per material contained in the packaging, except where a given material
constitutes an insignificant part of the packaging unit, and in no case more than 5% of the
total mass of the packaging unit.
In addition, consideration should be given to the flows of materials from a given recycling
process that are sent for further recycling, but are not primarily being targeted by the
recycling operation for which the material is being accounted for. The different recycling flows
would have to be considered on a national level by the Member States to ensure that such
materials were included in the amounts reported as recycled. The key consideration is that
these output flows may, or may not pass the calculation point related to the other material(s).
This is exemplified in Figure A - 8. In the case of flow 1, material B, which is not primarily
targeted by the recycling operation for material A, is sent to a recycling operation where the
output is prior to the calculation point for that material. In the case of flow 2, material B may
not need further sorting before being accepted as a secondary raw material in further
processes. In this case, although the material has been recycled, it would not be accounted
for under material A or B. Consequently, a clear mechanism is required to understand the
fate of material B to avoid double counting. For example, it may be preferable to set a
calculation point for Material B at the output of the process targeting Material A, if it is clear
that Flow 2 does not pass a calculation point for Material B.

Guidance for the compilation and reporting of data on packaging and packaging waste _________________________ 55
Figure A - 8: Generalised Schematic Related to Cross-material Flows
A.2.4 Obtaining data at the measurement points
As discussed above, a range of measurement points could be defined with certain
associated formulae used to calculate the weight of material recycled at the calculation
points. Some further consideration around obtaining such data is now given.
With regard to packaging, the preferred measurement point is the total output weight of
targeted material(s) (i.e. the recycled material intended to be sold as a secondary raw
material, without further processing). This will generally be a known quantity, as financial
transfers (gate fees or payments for materials) will generally be related to the quantities of
material (in tonnage) purchased or sold. These data could be submitted by plant operators
as actual weight data for this type of measurement point, which corresponds to the
calculation point (see MP 6 in Figure A - 7). Note that any loads rejected after this
measurement point from downstream quality checking procedures would have to be
deducted from the amount to be consistent with Decision 2005/270, so that the amounts
reported as recycled are not overestimated.
Alternatively, the total plant input (i.e. the weight of material received at the plant) can be
used as a measurement point. Once again, this data is likely known as financial transfers are
likely to be made in relation to material quantities recycled / treated. These data could be
Further processes
(e.g. manufacturing)
CP Material A
Extracted Material B (Flow 1)
Recycling/ treatment
(e.g. sorting)
Material A
Material B
Further processes
(e.g. manufacturing)
CP Material B
Recycling/ treatment
(e.g. sorting)
Extracted Material B
(Flow 2)

Guidance for the compilation and reporting of data on packaging and packaging waste _________________________ 56
submitted by plant operators to provide actual weight data for this type of measurement
point. This weight should relate to the amount of material accepted by the plant, and should
not, therefore, include the weight of material rejected after any initial quality checking
procedures.
A final measurement point for packaging is the total output weight of non-targeted material
(i.e. the material outside the scope of the recycling operation). This is very likely to be known
as this material will be sent on to further operations that might include recovery or disposal
operations, and related financial transactions will generally be made on the basis of the
quantity (and quality) of what is sold. These data could be submitted by plant operators to
provide actual weight data for this type of measurement point. Note, that if any non-target
material is sent to a process where material could be extracted and recycled, an appropriate
calculation point would need to be defined to ensure any recycled material is accurately
reported (also see Figure A - 8 above).
Having obtained the data above, moisture within material at the calculation points may need
to be adjusted for in order to ensure the correct weight (dry or wet) of material is compared
with the amount of waste generated. This is particularly important for packaging, for which
waste generation is equivalent to packaging normal state and consistent with what is
reported for the denominator. Moisture is particularly relevant for paper/board, which absorbs
water, although water can also be present in food and drink packaging, and plastic
packaging where the moisture can account for a relatively significant proportion of the overall
weight of the wet item. Moisture limits in technical specifications could be used to form the
basis of factors for correcting the measured data. Article 5 of Decision 2005/270 sets this
requirement:
“…the weight of recovered or recycled packaging waste shall be measured
using a natural humidity rate of the packaging waste comparable to the
humidity rate of equivalent packaging put on the market.
Corrections shall be made to measured data relating to the weight of
recovered or recycled packaging waste, if the humidity rate of that
packaging waste regularly and significantly differs from that of packaging
placed on the market and if this factor risks leading to substantial over- or
underestimates of packaging recovery or recycling rates.”
Accordingly, a natural humidity rate of packaging placed on the market will firstly have to be
established through surveys of each packaging type in each Member State, to be undertaken
periodically. This can be compared against the humidity rate for packaging waste, which
tends to be known by the buyers (who, in many cases, have established specifications with
tolerances for moisture/ humidity content, as this is an important consideration for the
recycling process). For those packaging waste types that exhibit a significant variation in
natural humidity rates (e.g. the packaging waste humidity rate exceeds the natural humidity
rate by 5% or more), more detailed surveys will need to be undertaken, with the aim of
establishing a protocol whereby correction factors can be adopted to adjust for such
variation. The natural humidity rates thereby established should be deducted from the

Guidance for the compilation and reporting of data on packaging and packaging waste _________________________ 57
recycling data received by Member States prior to submission to the Commission, and
should be reviewed every couple of years.
It is noted that the European reprocessing industry (particularly for plastic packaging) has
confirmed that plant operators will hold data relating to the amount at the calculation points
(or relevant measurement points), so Member State authorities will need to ensure they have
the legal means in place to request these data, and systems in place (e.g. electronic
registries) to enable these data to be reported efficiently.
To gather data relating to these measurement points, Member States should therefore
consider establishing electronic registries, in order to gather data directly from the various
operators in the recycling value chain, as supported by Article 6a(3) of the PPWD:
“3. Member States shall establish an effective system of quality control and
traceability of the packaging waste to ensure that the conditions laid down
in point (a) of paragraph 1 of this Article and points (a) and (b) of paragraph
2 of this Article are met. To ensure the reliability and accuracy of the data
gathered on recycled packaging waste, the system may consist of
electronic registries set up pursuant to Article 35(4) of Directive
2008/98/EC, technical specifications for the quality requirements of sorted
waste, or average loss rates for sorted waste for various waste types and
waste management practices respectively.”
Legal requirements to provide data may be needed at the national level to mandate the
submission of the necessary information by private sector operators to the electronic
registries. Until such registers are in place, Member States could rely on other data gathering
approaches, e.g. from extended producer responsibility (EPR) schemes (subject to these
being audited independently to ensure the data is reliable) or surveys of recycling operators
and the development of statistical models.
The current scope of reporting from EPR schemes can be limited, as downstream recycling/
treatment operations may not be under the control of the EPR scheme. If data is, in the short
term, to be gathered through EPR schemes, they would, therefore, most likely need to obtain
data from operators of any further recycling/ treatment plants prior to the calculation points in
order to gather data on all the relevant measurement points. This is exemplified in Figure A -
9 when there are two stages before the calculation point. For example, the ‘data from paper
recyclers’ would have to be obtained by the plant ‘paper sorting into grades’; this plant may
not currently be under the scope of reporting by EPR schemes.

Guidance for the compilation and reporting of data on packaging and packaging waste _________________________ 58
Figure A - 9: Potential data flows via EPR schemes for 2-stage process
The process becomes more complicated when there are three stages before the calculation
point. This is exemplified by Figure A - 10. In this case, data may need to be passed through
intermediate companies for the EPR scheme to be able to report information on all the
measurement points. Direct reporting from all operators in the chain would alleviate this
problem, this is why it is recommended to set up nationwide electronic registries with
mandatory reporting requirements in law.
Figure A - 10: Potential Data Flows via EPR Schemes for 3-stage Process
A.2.5 Metals from incinerator bottom ash (IBA)
Article 6(a)(6) in the revised PPWD outlines that recycled metals separated after incineration
of packaging waste can be included in the reporting of the metal packaging recycling targets,
stating:
“For the purposes of calculating whether the targets laid down in points (f)
to (i) of Article 6(1) have been attained, Member States may take into
account the recycling of metals separated after incineration of waste in
Sorting of mixed recyclables
Paper sorting into grades
Paper mill
Calculation point
Mixed paper/card
EN643
Scope of EPR Scheme Data from paper
recyclers
Sorting of mixed recyclables
Plastic sorting into polymers
Extrusion, pelletisation etc.
Calculation point
Mixed Plastics
Flakes
Further processing
Polymer separated bales
Scope of EPR Scheme Data from plastic
recyclers
Guidance for the compilation and reporting of data on packaging and packaging waste _________________________ 59
proportion to the share of the packaging waste incinerated provided that
the recycled metals meet certain quality criteria laid down in the
implementing act adopted pursuant to Article 11a(9) of Directive
2008/98/EC.”
Article 6(d) in Decision 2005/270, further specifies that
“the amount of recycled metals separated from incineration bottom ash
shall be the mass of metals in the metal concentrate that is separated from
raw incineration bottom ash originating from packaging waste, and shall not
include other materials contained in the metal concentrate such as mineral
adhesions or metals that do not originate from packaging waste” and sets
out the methodology for calculating the mass of recycled metals separated
from incineration bottom ash in Annex III.
This section provides further guidance on the use of the calculation methodology set out in
Annex III.
A.2.5.1 Correctly identifying the calculation point
The key flows of metals are outlined in Figure A - 11. Waste from a range of sources
(municipal, including packaging, as well as commercial and industrial wastes) are input to
Municipal Solid Waste Incinerators (MSWIs) at point 1. At this point, due to the mixing of
wastes, it becomes challenging, if not impossible, to identify the source of waste. The output
of the MSWI includes incinerator bottom ash (IBA), which contains inter alia metallic
elements.
Some processing of the IBA may occur on site. The most common approach is to extract
ferrous (Fe) metals through over-band magnets. Although steel is a Fe metal, Stainless Steel
(StS) is not magnetic, so it is not extracted through over-band magnets, hence it is identified
separately. Some facilities are now also carrying out extraction of non-ferrous (NFe) metals
by using eddy-current separators: however, this is less common and most operators chose to
send IBA to dedicated processors.
At these dedicated IBA processing sites, the IBA is usually separated into an aggregate
fraction for use as a secondary raw material, and two metallic fractions, Fe and a NFe
concentrate, the latter including light and heavy NFe metals and StS. The Fe fraction is
further processed to shred into different fractions for sale as varying grades, with different
technical specifications, to steel plants. The NFe concentrate is sent to specialised metal
recovery companies that extract the different metals from the metal concentrate. These
processes result in a large number of different fractions, of different metals and particle sizes.
The light NFe is almost exclusively aluminium. The heavy NFe would include StS, brass, zinc
and other metals.
Based on this material flow, the calculation point for accounting metals from IBA as being
‘recycled’, in-line with the calculation points discussed above for other metals (see Section
A.2.2.4), should be:

Guidance for the compilation and reporting of data on packaging and packaging waste _________________________ 60
Sorted metal that does not undergo further processing before entering a metal
smelter or furnace
This is represented by point 3 in Figure A - 11, which measures only the weight of metal that
is actually recycled, and therefore takes any losses into account. Examples of these losses
are discussed in the next section.
Figure A - 11: Key Metal Flows
Source: CEWEP
A.2.5.2 Allowable measurement methods and obtaining data at the measurement
points
The measurement method for metals from incinerator bottom ash is set out in Annex III of
Decision 2005/270. The method is designed to take into account the fact that at the point of
input to a furnace or smelter, it may not be possible to determine the source of the material.
Therefore, measurement points are set to measure the metallic outputs from IBA processing
that are sent to furnaces and smelters, and the amount adjusted to take the source of the
waste into account.
It is also important to add that, for the aluminium and steel targets, the weight of material
counted as recycled is not ‘pure’ metal atoms, but an aluminium or steel product that may
contain alloying elements; these alloys may account for a few percent of the total mass of the
metal. These alloying elements are an integral part of the material, and desired by
manufacturers who will mainly use alloyed materials in their products. Thus, the alloys should
not be deducted from the weight of aluminium or steel recycled.
The measurement method is described under the following four steps.
1. Gather data from facilities that separate metal concentrates from raw incineration
bottom ash, and apply the coefficients derived under step 2 to estimate the metallic
amounts only, using the formula in Paragraph 3 of Annex III. Fe fractions can be
Guidance for the compilation and reporting of data on packaging and packaging waste _________________________ 61
reported under the ‘Steel’ packaging fraction – along with StS –, the aluminium
fraction in the metal concentrate under the ‘Aluminium’ packaging fraction.
2. Use the formulae in Paragraph 4 of Annex III to calculate the coefficients needed to
adjust the total metal concentrate figures captured under step 1, which approximate
the concentration of ferrous metals and aluminium resulting from the processing of
metal concentrates extracted by facilities that separate metal concentrates from raw
incineration bottom ash.
3. As per Annex III, these coefficients shall be calculated based on data collected by
regular surveys from facilities that process metal concentrates and from other
facilities that use metals separated from incineration bottom ash to produce metal
products. The coefficients require an understanding of the total plant input and the
total metallic content. These can be determined by studies, spot sampling or available
purity data at the treatment plants based on metal concentrate sale (e.g. metal
concentrate sale as a proportion of total plant input). According to stakeholders, data
should be available at the plant level for the three main fractions, Fe, NFe and StS. At
the Member State level, an average for each of the three key categories should be
calculated. Where sampling was used to determine the metallic element of the
concentrate, these studies should be statistically significant and repeated at least
every 3 years.
4. Apply the coefficients under step 2 to the total amounts of metal concentrate captured
under step 1 to estimate the total amount of Steel and Aluminium recycled from
incinerator bottom ash.
5. Use the formula under Paragraph 5 of Annex III to estimate the mass of recycled
ferrous metals/aluminium originating from packaging waste in all recycled ferrous
metals/aluminium separated from incineration bottom ash. This effectively applies a
further coefficient (proportion of packaging waste) to the figure calculated under step
3.
6. As per Annex III, this shall be determined through sampling surveys of the waste that
enters the incineration operation, which shall be carried out at least every five years
and when there are reasons to expect that the composition of the incinerated waste
has significantly changed.
7. Such sampling already exists in several Member States. For example, in Belgium, the
MSWI operators are required to sample inputs to determine the overall packaging
proportion, and in Estonia operators have to sample 4x per year to determine the
proportion of biodegradable wastes in relation to renewable energy support schemes.
Therefore, input sampling surveys can be carried out without critical impact on
MSWIs. However, to minimise the burden to industry, the surveys could be carried
out through a programme funded by the national government or packaging EPR
schemes (relating to packaging), and the approach should be risk based. For
example, initially a survey should be carried out on an annual basis. If the variation in
the data is small, the survey could then be carried out on a two yearly basis, and
Guidance for the compilation and reporting of data on packaging and packaging waste _________________________ 62
again on a five yearly basis. If any surveys see a significant change in the
proportions, sampling on an annual basis should start again.
8. Without these surveys the proportion of packaging is likely to be inaccurate, and
either over- or understates the amount recycled.
9. Finally, an adjustment factor may be needed to address the reduction in the amount
of material passing through a MSWI. For example, tin plate is oxidised from the
surface of steel cans, and thin aluminium foils also oxidise to some extent (see further
detail in Section A.2.5.3 below). Therefore, if only the input to a MSWI is used in the
calculation, these effects would not be taken into account which might lead to over- or
underestimation of the amount of material counted for under the recycling targets.
This may be particularly relevant for the aluminium packaging target, where thin
packaging foils are more subject to these issues, thereby reducing the relative
proportion of the recovered light NFe metals that are from packaging sources
compared to the input. Member States should seek to assess the significance of such
losses through reviewing relevant evidence and make the necessary adjustments.
The methodological approach(es) taken should be described under question 3.2.11 of the
quality report.
For voluntary reporting of data under the new rules in 2021, where surveys of incinerator
plants, bottom ash and metal concentrates do not currently exist, Member States may use
average values from the survey results under the measurement method study (see Section
6.0 Task 4 of the final study report).18
A.2.5.3 Losses within the incineration process
Metals passing through incinerators undergo, to varying degrees, a number of physical and
chemical transformations. The extent of the transformations depends on the physical and
chemical structures of the metals themselves and how they tolerate the conditions (such as
high temperatures and varying levels of oxygen) to which they are exposed during the
incineration process. These transformations are important to consider in the context of metal
packaging because:
they may reduce the volume of metals which end up in IBA;
they may alter the properties of metals in a way which affects the efficiency of their removal and subsequent recycling; and
the effects may vary across packaging and non-packaging waste streams (where relevant material-specific recycling rates apply).
This could have implications for the calculation of the recycling rate for metal packaging that
is incinerated. Although all metals will undergo transformation to some extent, aluminium is
18 Eunomia et al (2019) Study to Support the Implementation of Reporting Obligations Resulting from the New Waste Legislation Adopted in 2018, Final Report for the European Commission DG Environment under Framework Contract No ENV.B.3/FRA/2017/0005, https://op.europa.eu/en/publication-detail/-/publication/3d72ef00-bcac-11e9-9d01-01aa75ed71a1

Guidance for the compilation and reporting of data on packaging and packaging waste _________________________ 63
of particular interest because it is commonly used for consumer packaging and is one of the
metals commonly removed from IBA for recycling.
The literature indicates that several small-scale laboratory and site-based tests have been
conducted on how aluminium behaves through the incineration and IBA treatment process.
There is still, however, a degree of uncertainty around the exact way losses may occur in the
incinerator. The main transformations that aluminium can undergo are as follows:
The presence of oxygen and high temperatures means that the exposed aluminium may undergo oxidation into aluminium oxide. Aluminium will melt at around 660°C, and this melt often gains an aluminium oxide skin that encloses it, protecting it from further oxidation. 19 This aluminium will form nuggets which will be present in the IBA;
Very fine particles of aluminium/aluminium oxide can be carried up the flue of the incinerator due to convection, and will be transferred mainly into the air pollution control residues (APCR). 20
Some aluminium will react with nitrogen in the air to form aluminium nitride, occurring at around 900°C. 21 It is not clear to what extent this is lost via the flue or whether it remains in the IBA (and if it is in the flue gas, whether it may be found in APCR).
Some aluminium will be lost as a result of volatilisation. 22
Several of the aforementioned tests have sought to determine the influence of different
factors on the rates of oxidation and loss to volatilisation/APCR. Factors, which influence
these transformations include:
The characteristics of the metal packaging itself:
o Surface area to volume ratio. Large pieces of metal which have a small surface area relative to their total mass will experience limited oxidation, whereas small thin pieces of metal with large surface areas will experience far more pronounced, or even complete, oxidation;
o Particle size is an important factor in oxidation (the greater the particle size the lower the rate of oxidation), and some studies have found thickness to be relevant as well (the thicker the particle, the lower the rate of oxidation); 23
19 Bunge, R. (2015) Recovery of Metals from Waste Incinerator Bottom Ash. Institut für Umwelt und Verfahrenstechnik UMTEC, April 2015. http://umtec.hsr.ch/fileadmin/user_upload/umtec.hsr.ch/Dokumente/News/1504_Metals_from_MWIBA__R._Bunge.pdf
20 Hu, Y., Bakker, M.C.M, and de Heij, P.G. (2011). Recovery and distribution of incinerated aluminum packaging waste. Waste Management, 31, 2422-2430.
21 Bunge, R. (2015) Recovery of Metals from Waste Incinerator Bottom Ash. Institut für Umwelt und Verfahrenstechnik UMTEC, April. 2015,http://umtec.hsr.ch/fileadmin/user_upload/umtec.hsr.ch/Dokumente/News/1504_Metals_from_MWIBA__R._Bunge.pdf
22 Biganzoli, L., Gorla, L., Nessi, S. & Grosso, M., (2012). Volatilisation and oxidation of aluminium scraps fed into incineration furnaces. Waste Management, 32, 2266–2272.
23 Biganzoli, L., Gorla, L., Nessi, S. & Grosso, M., (2012). Volatilisation and oxidation of aluminium scraps fed into incineration furnaces. Waste Management, 32, 2266–2272.

Guidance for the compilation and reporting of data on packaging and packaging waste _________________________ 64
o Composition of the packaging (i.e. how much aluminium as compared to other materials such as paper). This can affect the level of oxidation as non-aluminium material can ‘protect’ the aluminium from oxidation;24, 25
The conditions in the incinerator:
o There are differences in the temperature and oxygen availability in different parts of the incinerator and so not all aluminium will undergo the same level of oxidation and/or other transformations;
o IBA processing, such as quenching of the aluminium with water in the bottom ash, can promote oxidation; 26 and
o PH value and salt contamination are also thought to affect oxidation. 27
Oxidation is largely a problem for the recycling potential of the aluminium, because the oxide
cannot actually be recovered in the secondary smelter, and it therefore results in a reduced
mass of aluminium that can ultimately be recycled. There is a small evidence base relating to
quantifying rates of oxidation in aluminium. According to the CEN standard on ‘Packaging.
Requirements for packaging recoverable in the form of energy recovery, including
specification of minimum inferior calorific value’ (EN 13431:2004), thin-gauge aluminium foil
(up to 50 μm thick) is considered recoverable in the form of energy, suggesting that it is
considered to be fully oxidised. However, it is unclear what evidence underpins this
assumption. Laboratory tests have been conducted through which the oxidation level of
different aluminium products in municipal waste were determined for several types of
consumer products: however, these tests measured the incinerator input as compared to the
output of recyclate from IBA, therefore also take into account the effectiveness of bottom ash
removal techniques. What this research did show is a large difference in the recovery rates
between different types of aluminium packaging - thin foil, foil containers and cans (with
recovery factors of 77, 88 and 93 wt.% respectively.) It is not known how representative
these figures are.
Other studies have found similar variability between packaging types, with the average
oxidation levels of the aluminium in the residues of the incineration process as equal to 9.2%
for cans, 17.4% for trays and 58.8% for foils. Compacted beverage cans are characterized
24 López, F., Román, C., García-Díez, I. and Alg, F., (2013) Energetic Valorisation Of Semi-Rigid And Flexible Aluminium Packaging By Oxidation At High Temperature. Braga, Wastes: Solutions, Treatments And Opportunities 2nd International Conference.
25 Biganzoli, L., Gorla, L., Nessi, S. & Grosso, M., (2012). Volatilisation and oxidation of aluminium scraps fed into incineration furnaces. Waste Management, 32, 2266–2272.
26 Biganzoli, L., Gorla, L., Nessi, S. & Grosso, M., (2012). Volatilisation and oxidation of aluminium scraps fed into incineration furnaces. Waste Management, 32, 2266–2272.
27 Hu, Y., Bakker, M.C.M, and de Heij, P.G. (2011). Recovery and distribution of incinerated aluminum packaging waste. Waste Management, 31, 2422-2430.

Guidance for the compilation and reporting of data on packaging and packaging waste _________________________ 65
by a low overall oxidation level (9.2%) compared to the other materials, due to the reduction
in exposed surface area. 28
Additional studies looking at oxidation rates for different packaging types report that oxidation
never exceeds 17%29, and that the oxidation of aluminium limits the recycling factor to a
maximum of 82.5 %30, though another study reports a third of the mass of aluminium being
lost to oxidation. 31
The only available estimation of how much aluminium is lost to APCR estimates this as 10
wt.% from municipal waste.32 However, this is likely to vary according to different waste
compositions and incineration technologies, not to mention, the nature of the flue gas
treatment.
A.2.6 Identifying the national packaging proportion in multi-stream treatment plants
Figure A - 12 provides an example of a recycling value chain for paper where the whole
amount of the waste is in-scope (i.e. all the waste material is national packaging). In this
case, the total weight of recycling at the calculation point can be counted under the
respective target. However, at measurement points further down the recycling value chain,
and closer to the calculation point, waste from different sources may have been mixed. This
means that the weight of material at the calculation point may not wholly relate to national
packaging waste.
28 Biganzoli, L., Gorla, L., Nessi, S. & Grosso, M., (2012). Volatilisation and oxidation of aluminium scraps fed into incineration furnaces. Waste Management, 32, 2266–2272.
29 López, F., Román, C., García-Díez, I. and Alg, F., (2013) Energetic Valorisation Of Semi-Rigid And Flexible Aluminium Packaging By Oxidation At High Temperature. Braga, Wastes: Solutions, Treatments And Opportunities 2nd International Conference.
30 Claassens, H.J.P. CO2 emissions in the recovery and recycling of aluminium from MSWI bottom ash. https://dspace.library.uu.nl/handle/1874/310195
31 Bunge, R. (2015) Recovery of Metals from Waste Incinerator Bottom Ash, Institut für Umwelt und Verfahrenstechnik UMTEC, April 2015, http://umtec.hsr.ch/fileadmin/user_upload/umtec.hsr.ch/Dokumente/News/1504_Metals_from_MWIBA__R._Bunge.pdf, p. 15/16
32 Claassens, H.J.P. CO2 emissions in the recovery and recycling of aluminium from MSWI bottom ash. https://dspace.library.uu.nl/handle/1874/310195

Guidance for the compilation and reporting of data on packaging and packaging waste _________________________ 66
Figure A - 12: Example with total plant input being MSW or packaging
In such circumstances, the total plant output cannot be used to calculate the amount of
material contributing to the specific recycling targets at the calculation point because this
amount would include out of scope material, and therefore, overestimate the recycled
amounts for a given target. Therefore, an approach is needed to calculate the proportion of
the total material that should be counted as national packaging.
If the plant operators cannot easily determine whether the entirety of the waste entering their
plant is [national] packaging, periodic surveys (e.g. at least every 1-2 years) of the supply
chain could be carried out to determine average proportions of in-scope wastes in plant
inputs, or to develop nationally applicable protocols for individual materials, that could be
applied to the total tonnage of all material at the calculation point.
It is important, however, that the classification of packaging wastes and the approaches for
identifying the in-scope material are fit for purpose, recognising that packaging is a part of
most waste streams and the targets are material specific.
In order to ensure sufficient funding for these activities, it may be appropriate seeking for
financing from packaging EPR schemes in accordance with the new requirements around
EPR in Article 8a of the Waste Framework Directive.
Utilising approaches that are solely based upon the proportion of in-scope waste inputs to
plants assumes that the overall plant losses are equivalent to the losses that may occur if the
plant was treating only one packaging stream, in isolation. However, in cases where the
losses associated with packaging wastes are different to those of the other waste streams,
this may lead to inaccurate data being reported. Consequently, a more detailed approach
may be needed to produce reliable data.
Figure A - 13 below provides a concept diagram for the situation where the waste is mixed
prior to a subsequent sorting/treatment phase, and the proportion of non-target material is
different between the ‘in-scope’ and ‘out of scope’ waste streams. In the diagram ‘in-scope’
wastes refer to packaging waste, and ‘out of scope’ refers to non-packaging wastes,
respectively. To calculate the quantity of in-scope wastes recycled, two Source Factors (SFs)
are needed:
SF1: is a factor that describes the proportion of input waste that comes from in-scope sources. As noted above this may be derived from the national waste statistical
Sorting of mixed recyclables
Paper sorting into grades
Paper mill
Calculation point
Mixed paper/card
EN643

Guidance for the compilation and reporting of data on packaging and packaging waste _________________________ 67
system (or from improvements to it) in a straightforward way by sorting plant operators submitting the total inputs to the system from in and out of scope sources. However, in some situations the in and out of scope waste might have been collected together or mixed prior to arrival at the site. In this case, periodic surveys of upstream waste handling processes may need to be carried out in order to determine the factor. For packaging, including biodegradable plastic packaging, sampling of the waste stream may be needed to determine the proportion at the input — sampling methodologies are considered further below.
SF2: is a factor that would be applied to the total stream of non-target material leaving the plant. It would not be possible to identify the source of the material at this point. Firstly, periodic sampling (PS) would have to be carried out at point PS1, in order to determine the characteristics of the waste material in the output non-target stream. Sampling at the input, point PS2, for both in and out of scope wastes would then need to be carried out to estimate the proportion of non-target in both streams. These data would then be used to calculate SF2, assuming that the relative proportions of non-target material at the input were the same as at the output. Sampling would be carried out in accordance with standards and to provide an appropriate level of statistical accuracy (e.g. 95% confidence that results are accurate to within +/- 10%).
If it were not possible to accurately identify the type of waste (packaging) in the waste
streams, batch sampling of each type of wastes may have to be carried out to estimate the
relative proportions of non-target material in each type; i.e. a batch of waste from a known
source, which was wholly packaging, would be run through the plant and total inputs and
outputs measured.
Using this approach, where it proved difficult to sample the output directly (in which case,
sampling of the waste at the calculation point would indicate the quantity directly), the
following calculation could be developed to provide data relating to the amount of in-scope
waste recycled at the calculation point for submission against packaging waste targets:
Recycling (in scope) = Weight plant input × SF1-(Weight non-target × SF2)
Further information on sampling standards and methodologies is given in the following
section.

Guidance for the compilation and reporting of data on packaging and packaging waste _________________________ 68
Figure A - 13: Concept diagram for source calculations
A.2.6.1 Sampling standards and methodologies
Waste sampling needs to be of a high quality and use a consistent minimum standard and
accepted procedures in order to ensure valid results. For example, several standards and
technical reports already exist at an EU level regarding sampling and analysis of waste,
these are:
EN 14899: Framework for the preparation and application of a Sampling Plan;
CEN/TR 15310-1: Characterization of waste. Sampling of waste materials – Part 1: Guidance on selection and application of criteria for sampling under various conditions;
CEN/TR 15310-2: Characterization of waste. Sampling of waste materials – Part 2: Guidance on sampling techniques;
CEN/TR 15310-3: Characterization of waste. Sampling of waste materials – Part 3: Guidance on procedures for sub-sampling in the field;
In-scope
targeted
Out-scope
targeted
Non-target Non-target
Sorting Plant
In-scope
targeted
Out-scope
targeted
Non-target
Further
processing
In-scope (national municipal or packaging)
Out-scope (non-municipal or non-packaging or non-national)
SF1: proportion of input by
source or periodic sampling
SF2: proportion of non-target by source -
periodic sampling of inputs and outputs
Total plant input (weighed)
Total non-targeted outputs (weighed)
Total targeted outputs (weighed)
Total inputs (weighed)
In-scope quantity
calculated
PS1
PS2
Calculation
point

Guidance for the compilation and reporting of data on packaging and packaging waste _________________________ 69
CEN/TR 15310-4: Characterization of waste. Sampling of waste materials – Part 4: Guidance on procedures for sample packaging, storage, preservation, transport and delivery;
CEN/TR 15310-5: Characterization of waste. Sampling of waste materials – Part 5: Guidance on process of sample defining the sampling plan; and
BDS EN 15002: Characterization of waste. Preparation of test portions from the laboratory sample.
These standards cover the entire process of waste sampling, from initial planning and
preparation of a sampling plan through to final testing of collected samples.
In addition to the European CEN standards, Eurostat published a comprehensive Manual on
Waste Statistics, which was developed over several years and utilised the experience of
multiple stakeholders to develop the methodology. The aim of the manual is to ensure that
waste statistics are comparable and harmonised across Member States due to their
importance in EU law. The manual covers the whole process of data collection and statistical
distribution, including waste generation and treatment, data collection, data processing as
well as guidance on approaches to statistical surveying to generate waste statistics.
In addition, in the UK, there is a compulsory testing and reporting scheme in place for
Material Recovery Facilities (MRFs) which sort mixed recyclable waste. The Environmental
Permitting (England and Wales) (Amendment) Regulations 2014 contain requirements for
MRFs to routinely sample and test:
the composition of their input streams by individual supplier; and
their main outputs by material stream e.g. cardboard, paper, etc. (in order to understand the level of not-target materials therein).
MRF operators must report the average (or arithmetic mean) percentage composition of
target material, non-target material and non-recyclable material every quarter. The
organisation, WRAP, has produced guidance regarding how the samples should be taken
and tested.
Finally, initial input from EPR schemes suggests that the use of waste sampling protocols in
order to identify the packaging waste proportion for reporting recycling is already underway in
several Member States. These protocols vary between Member State EPR schemes,
depending on the existing collection and treatment systems, and also by material. However,
they are designed to be aligned with Article 4 of the Decision 2005/270:
“The weight of recovered or recycled packaging waste shall be the input of
packaging waste to an effective recovery or recycling process. If the output
of a sorting plant is sent to effective recycling or recovery processes
without significant losses, it is acceptable to consider this output to be the
weight of recovered or recycled packaging waste.”

Guidance for the compilation and reporting of data on packaging and packaging waste _________________________ 70
A.2.7 Measuring the amounts of packaging composted
According to the calculation rules in Article 6a of the PPWD, biodegradable packaging waste
entering composting or anaerobic digestion processes can be counted as recycling under
certain circumstances:
“4. For the purposes of calculating whether the targets laid down in points
(f) to (i) of Article 6(1) have been attained, the amount of biodegradable
packaging waste that enters aerobic or anaerobic treatment may be
counted as recycled where that treatment generates compost, digestate, or
other output with a similar quantity of recycled content in relation to input,
which is to be used as a recycled product, material or substance. Where
the output is used on land, Member States may count it as recycled only if
this use results in benefits to agriculture or ecological improvement.”
Thus, in practice, in order to include only the amount of biodegradable waste in the
calculation, the non-biodegradable part of the waste that may be removed within or after the
composting/ anaerobic digestion (AD) process has to be subtracted from the amount of
packaging waste measured at input to the process. This can be done by subtracting the
amounts sent off site for recovery or disposal from the amount of material entering the plant.
Therefore, the calculation point should be the entry to a biowaste treatment facility, provided
that all materials sent to other treatment options by the facility are subtracted.
Furthermore, although the term ‘biodegradable’ is used in the applicable legislation, it seems
sensible in the case of packaging to link this to the term ‘compostable’ as currently used in
CEN 13432, thereby discounting material that does not meet the standard, though it may be
difficult to estimate this separately.
Relating to the condition requiring benefits to agriculture or ecological improvement, the use
of compost standards or end of waste criterion could be used to ensure high quality
recycling. The source of the compostable packaging could also be considered. For example,
compostable packaging from source segregated sources would be much more likely to lead
to higher quality outputs. Indeed, only recycling of source segregated biowaste should be
counted under the targets after 2027.
Concerning compostable plastic packaging, a recent study by the Commission found
inconclusive evidence regarding the ecological benefit or otherwise of composting this
material.33 Consequently, the abovementioned rules alone provide the basis of whether
compostable packaging can be counted under the recycling targets or not. If Member States
include any compostable plastic packaging in the amounts recycled, evidence of
benefits to agriculture or ecological improvement where the output was used on land
must be provided along with the quality report. The amounts of compostable plastic
packaging that are included in the total plastic recycling and total plastic waste generation
33 “Relevance of biodegradable and compostable consumer plastic products and packaging in a circular economy” (https://op.europa.eu/s/n3Rv)

Guidance for the compilation and reporting of data on packaging and packaging waste _________________________ 71
figures must also be stated separately in tonnage terms in the quality report. Details can be
provided under question 3.2.3.
However, it may be challenging to identify the amount of compostable packaging waste
entering a biowaste treatment facility if it arrives at the site unseparated from other wastes.
Finally, the amount of compostable packaging in the waste stream may change over time,
particularly given the increase in the use of compostable plastic packaging. Ensuring these
wastes are included in the packaging recycling rates may, therefore, become more important
over time.
Surveys could be carried out on plant inputs to estimate the amount of compostable
packaging entering the plant. Given the rapid changes in the amount of compostable plastics
on the market, the surveys should be carried out on a relatively frequent basis. Indeed,
Article 6c(d) of Decision 2005/270 states that:
“Where biodegradable packaging that is subject to aerobic or anaerobic
treatment is included in the recycled amounts for the respective packaging
material, the amount of biodegradable packaging in biodegradable waste
shall be determined by performing regular composition analyses of the
biodegradable waste entering those operations.”
By way of example, there has been a survey in Italy carried out by the Italian Composting
Association (CIC), in cooperation with the PRO for plastics (COREPLA), which included a
comprehensive sampling programme of input materials at composting sites. This
programme was able to identify a) the amount of fossil-derived plastics (and how much
thereof, were bags or packaging); and b) the amount of compostable plastics ending up in
composting sites. The survey found that the proportion of compostable plastics in the total
weight of material collected through separate food waste collections entering the plants was
1.4%.
In establishing a measurement method for compostable plastic packaging recycled, a key
consideration is the total inherent losses, i.e. the weight of inherent losses, such as
moisture34 and carbon losses from composting processes. The approach would need to take
account of the fact that the moisture content in the waste at the calculation points should be
what it should be in its normal state and consistent with what is reported for the denominator
i.e. waste generated. Therefore, it is necessary to ensure that only moisture relating to the
clean and dry weight is deducted from the weight of material counted as being recycled at
the calculation points, and that moisture removed as an inherent loss in the composting
process is not taken into account.
34 Unlike mechanical recycling, for which recycling data must be adjusted to account for the humidity rate of packaging waste relative to the natural humidity rate of the associated packaging (see Section A.2.4), moisture is considered an inherent loss from the composting process and therefore need not be deducted from any compostable packaging recycling data submitted.

Guidance for the compilation and reporting of data on packaging and packaging waste _________________________ 72
Moreover, it is important that compostable plastic packaging that is not fully composted is not
included in the amounts recycled. This is consistent with Article 6c (d) of 2005/270, which
states that:
“Biodegradable packaging waste that is removed before, during or after the
recycling operation shall not be included in the recycled amounts.”
A.2.7.1 Processes where recycling and energy recovery of biowaste are combined
There are processes which treat separately collected biowastes, or materials derived from
biowaste, that can lead to both material recycling and energy recovery. One example already
discussed above is anaerobic digestion (AD), where the anaerobic degradation of biomass
leads to the generation of methane, which can be used for various purposes (in combined
heat and power generation, or after further cleaning, for use as vehicle fuel, or for injection
into the gas network, typically for use as heating fuel). In this case, subject to the output
material being used as a product, material or substance, then the input material, net of non-
biodegradable rejects, is deemed to be recycled.
As noted above, it is not the intention of the Directive (Art. 6a(5)) to count material as being
recycled where end-of-waste materials are used as fuels or other means to generate energy:
“However, end-of-waste materials to be used as fuels or other means to
generate energy, or to be incinerated, backfilled or landfilled, shall not be
counted towards the attainment of the recycling targets”
Where compostable packaging waste is concerned, therefore, it is clear that sending the
residues from biological treatment for incineration (including pyrolysis and gasification) would
mean that the material could not be considered to have been recycled.
A.2.8 Guidance on proving compliance with requirement to ensure all waste outside the EU is treated under broadly equivalent conditions
Article 4 of Decision 2005/270 states that:
“1. For the purposes of calculating and verifying attainment of the targets
set in points (a) to (e) of Article 6(1) of Directive 94/62/EC, packaging
waste exported out of the Union shall be counted as recovered or recycled
only if there is sound evidence that the recovery and/or recycling took place
under conditions that are broadly equivalent to those prescribed by the
relevant Union legislation.”
In considering how Member States can provide evidence that waste is being exported to
facilities where broadly equivalent conditions apply, it was noted that there is currently no
standard or certification that a facility can obtain that would show that it meets the test of
broad equivalence.
Member States previously expressed interest in the Commission preparing an approved list
of facilities and/or countries where broadly equivalent standards were in place, recognising

Guidance for the compilation and reporting of data on packaging and packaging waste _________________________ 73
that it makes little sense for each Member State to make its own individual assessment if the
standard is to be applied in a consistent manner, and an EU-wide approach could reduce
administrative costs (e.g. around the translation of documents received from waste receiving
countries) and produce greater harmonisation. However, there was also concern regarding
whether this was an appropriate role for the Commission, whether the Commission had the
resources to undertake such assessments, and whether an EU-wide approach might give
rise to problems in relation to World Trade Organisation (WTO) rules on non-discrimination.
The guidance in the following sections has been provided for Member States to assist them
in meeting their obligations under Art. 6a(8) of Packaging and Packaging Waste Directive
regarding recycling exports and proving compliance with this requirement. This includes the
interpretation of the term “broadly equivalent”, establishing whether broadly equivalent
conditions are in place, and addressing potential statistical issues.
A.2.8.1 A definition of “broadly equivalent conditions”
An appropriate definition might be as follows:
“A receiving facility that operates under ‘broadly equivalent conditions’ to
those situated within the EU is one that operates under a system of rules
that broadly replicates the requirements of the acquis that help guard
against, or limit, negative environmental impacts arising from the facility.”
While the language used varies slightly between different pieces of legislation, there is no
significant difference between formulations such as “broadly equivalent conditions” and
“broadly equivalent standards”, not least since, apart from in the case of WEEE, codification
of the implied conditions within a set of standards has not taken place.
It is noted that the relevant standards to be met in order to achieve broad equivalence are
the laws on:
The licensing and operation of waste facilities;
Emissions to air; and
Emissions to water,
Therefore, the standards that are relevant are those that relate to the environment, including
environmental laws focused on human health. These include:
The receiving facility should be subject to a permitting system, in line with Chapter IV of Directive 2008/98/EC;
The receiving facility should be subject to an inspection, record-keeping and enforcement system, in line with Chapter VI of Directive 2008/98/EC;
For processes that fall under Annex I of Directive 2010/75/EU (e.g. the processing of metals, and the handling of any residues that may not be suitable for recycling), the

Guidance for the compilation and reporting of data on packaging and packaging waste _________________________ 74
facility should conform with the requirements of Directive 2010/75/EU35 on industrial emissions regarding permits, inspections, record keeping and enforcement; and
The receiving facility should maintain adequate records to demonstrate the fate of the material it receives (e.g. the proportion that is recycled (and who purchases the material), the quantity that is rejected or lost through processing (and how such material is managed).
In line with the requirements of Article 27 of Directive 2008/98/EC, these requirements shall
also take account of the standards set out in any relevant Best Available Techniques
reference document (BREF), in particular the Best Available Techniques (BAT) Reference
Document for Waste Treatment36 and any sections of BAT Reference Documents for the
production of materials insofar as they relate to techniques specific to the use of waste
material as feedstock, such as the BREFs for:
Pulp, Paper and Board37;
Iron and Steel38; and
Non-ferrous Metals39.
Where receiving facilities within the EU are subject to Directive 2010/75/EU, the permitted
limit values for emissions should be in line with any relevant BAT Reference Documents, as
required by Article 14 of the Directive 2010/75/EU. A key example would be facilities that
process secondary metals.
The use of the term “broad equivalence” rather than “equivalence” implies that the standards
met by receiving facilities need not be identical to those in the EU, or achieve exactly the
same results. However, it would be difficult to demonstrate broad equivalence if any of the
issues covered by EU law are entirely unaddressed in the standards that the facility must
meet, or if those standards (or the performance achieved) are substantially lower than would
be required in the EU.
Recycling facilities that meet these requirements – not necessarily exactly as specified in EU
law, but achieving the same or very similar effect – should be regarded as operating under
conditions that are broadly equivalent to the requirements of the relevant Union
environmental law.”
35 Directive 2010/75/EU of the European Parliament and of the Council of 24 November 2010 on industrial emissions (integrated pollution prevention and control) (OJ L 334, 17.12.2010, p. 17–119)
36 European Commission (2018) Best Available Techniques (BAT) Reference Document for Waste Treatment, 2018, https://ec.europa.eu/jrc/en/publication/eur-scientific-and-technical-research-reports/best-available-techniques-bat-reference-document-waste-treatment-industrial-emissions
37 DG JRC (2015) Best Available Techniques (BAT) Reference Document for the Production of Pulp, Paper and Board, 2015, https://ec.europa.eu/jrc/en/publication/eur-scientific-and-technical-research-reports/best-available-techniques-bat-reference-document-production-pulp-paper-and-board-industrial
38 Joint Research Centre (2013) Best Available Techniques (BAT) Reference Document for Iron and Steel Production, January 2013, https://ec.europa.eu/jrc/en/publication/reference-reports/best-available-techniques-bat-reference-documentforiron-and-steel-productionindustrial-emissions
39 Joint Research Centre (2017) Best Available Techniques (BAT) Reference Document for the Non-Ferrous Metals Industries, 2017, https://op.europa.eu/en/publication-detail/-/publication/c0bc6046-651c-11e7-b2f2-01aa75ed71a1

Guidance for the compilation and reporting of data on packaging and packaging waste _________________________ 75
There is a separate point, which relates to the processes that may handle residues from
recycling facilities that receive waste from EU Member States. Any recycling operation leads
to the generation of some, hopefully small, quantities of residues, and these may be subject
to treatment / disposal operations as opposed to recycling operations. There is an argument
that the ‘broadly equivalent conditions’ should pertain to not only the receiving facility itself,
but also to those facilities which deal with residues. Indeed, there are reasonable economic
and environmental arguments for requiring this.
A.2.8.2 Guidance on establishing whether broadly equivalent conditions are in
place
In order to confirm that broadly equivalent conditions are in place in receiving
countries/facilities, Member States (and the responsible bodies within them) will need to
make more consistent assessments than currently done in practice. A proposed process for
doing so is shown in Figure A - 14.
Figure A - 14: Outline Monitoring and Reporting Process
This process is supplemented by the following guidelines:
Regarding materials that may be of greater or less significance for waste exports, examples include:
o glass and biowaste are rarely exported from the EU, but it may be appropriate to confirm based on a proportionate approach that no such material has been exported;
o exports of plastic and paper are commonplace, and associated with concerns regarding quality, loss rates and leakage. Exports therefore require more careful scrutiny;

Guidance for the compilation and reporting of data on packaging and packaging waste _________________________ 76
o metal recycling operations can give rise to high levels of industrial emissions, and processes that within the EU would be subject to the Industrial Emissions Directive 2010/75/EU, and therefore require scrutiny focused on the emissions from facilities; and
o any recycling operation may give rise to residues and losses that require disposal and Member States should require information regarding the treatment of these materials – which must also take place under broadly equivalent conditions.
Regarding the types of positive evidence that might demonstrate whether, in general, exports to a particular country may be permissible, examples might include:
o Documentary evidence of the existence of an effective system of permitting that applies similar operating requirements and emissions limit values to those in force in the EU;
o Documentary evidence of the existence of an effective system of inspection and enforcement, including steps being taken to deal with non-compliant facilities; and
o Documentary evidence regarding the disposal/treatment arrangements for residues and losses.
Regarding the types of positive evidence that might demonstrate whether, in particular, exports to a particular facility may be permissible, examples might include:
o The facility’s operating permit, showing that it is required to meet appropriate standards regarding site operations, emissions and the handling of residues/losses;
o The facility’s inspection and compliance record, demonstrating that the required standards are in fact being met; and
o Independently audited quality standards met by the facility, potentially providing additional assurance that appropriate procedures are being followed.
On the use of negative evidence that might indicate that, irrespective of other evidence, a country or facility is not applying broadly equivalent conditions, examples might include:
o Inspection or enforcement records indicating that the facility does not meet the required standards;
o Credibly sourced NGO and/or news reports highlighting poor practice in a country, which may undermine the plausibility of documentary evidence regarding the country’s permitting system;
o Concerns regarding specific facilities that may undermine the plausibility of their inspection record, including evidence of:
The absence of appropriate perimeter fencing to ensure that only authorised persons enter the facility;
A lack of proper storage arrangements to prevent waste materials escaping the facility, e.g. as a result of wind or rain;
The use of uncontrolled burning at the facility;

Guidance for the compilation and reporting of data on packaging and packaging waste _________________________ 77
Unabated discharges to the atmosphere from controlled combustion;
Discharges of chemical effluent to local watercourses; and
The use of uncontrolled dumpsites or fly-tipping to dispose of residues and material removed from the recyclate through sorting.
Where concerns arise, it may be appropriate to undertake steps such as seeking additional
information from the country or facility, or visiting a site (if the facility or country is of particular
importance in terms of scale).
If the evidence gathered provides good reason to believe that the receiving facility is not
carrying out recycling operations under broadly equivalent conditions to those that apply
within the EU, the Member State should ensure that no further exports to that facility are
counted as recycled until evidence is obtained that broadly equivalent conditions have been
reinstated reliably.
A.2.8.3 Guidance on common statistical issues
The following guidance relates to addressing common statistical issues.
A Member State declaring that it does not export any recyclate outside the EU should provide an evidence trail that supports this claim – especially where recyclate may be transported to another Member State as an interim destination before being sent to its final treatment destination.
o It remains the responsibility of the originating Member State to evidence that material it claims towards its recycling target has been recycled.
o It is difficult to demonstrate conclusively a negative claim (i.e. that no exports took place). Therefore, such Member States should provide evidence that their material was sent to recycling operations within the EU, for example by providing a comprehensive list of the end destinations for each material stream, the approximate tonnage treated at each, and the means by which they validated that this was in fact the end destination.
Where recyclable waste is transported between Member States prior to export outside the EU, this can give rise to tracking issues. A review of the implementation of the Waste Shipment Regulations40 found that there was significant misreporting. For example, where one Member State’s estimate of waste exports to another Member State do not match the latter’s estimate of imports from the former. Poor traceability undermines the ability of Member States to demonstrate that exported waste is recycled under broadly equivalent conditions, and will need to be addressed for Member States to be able to do so in future.
Therefore, Member States will likely need to monitor the tonnage and destinations (both intermediate and end) of ‘green list’ wastes in order to demonstrate that such material is being recycled under broadly equivalent conditions.
Wherever possible, Member States should obtain from exporters actual data on the quantity of material that is ultimately recycled. Where this is done, Member States should describe how they obtained these data from the overseas facilities receiving
40 https://eur-lex.europa.eu/legal-content/EN/TXT/?uri=CELEX:02006R1013-20180101
Guidance for the compilation and reporting of data on packaging and packaging waste _________________________ 78
the material. However, where material passes through an intermediate destination and perhaps becomes mixed with similar material from other sources, it can become more difficult to calculate the quantity of material originating in a particular Member State that is ultimately recycled.
o Where direct information on rejects, residues and losses cannot be obtained, Member States should adopt an approach to estimating losses. Any such approach should be based on a clear rationale which ensures that the proportion recycled is not overestimated.
o The loss rate for exported waste should not be:
Lower than the estimated percentage of contamination found in material of a particular type that is exported from the Member State;
Lower than the loss rate for material reprocessed domestically, or in neighbouring Member States.
o Where an estimated or default loss rate is used, Member States should explain the basis on which it has been selected and provide a rationale for its use. Further guidance on applying ALRs is provided in the next section.
A.2.8.4 Information sharing
In order to minimise duplication of effort, the sharing of information regarding broadly
equivalent conditions is encouraged. In practice, some Member States already make use of
assessments carried out by others.
While having regard to the commercial confidentiality of contracts that exporters may have
entered into, Member States should publish their assessments of countries and facilities –
including those deemed not to have broadly equivalent standards in place – and respond
positively to requests from other Member States’ authorities to share the evidence on which
their assessment has been based.
The Commission may consider collating and publishing Member States’ assessments; and
may wish to highlight where there are inconsistencies between assessments so that Member
States can review whether an appropriate assessment has been made. The Commission
could also include details regarding the date on which assessments were made, so that other
Member States can decide whether they are sufficiently up to date to be able to be relied
upon. Further details will be provided in the case such as system of information sharing is
setup.
A.2.9 Applying the average loss methodology
A.2.9.1 Application of average loss rates (ALRs)
Under Article 6a(3) of the Packaging and Packaging Waste Directive, ALRs may be applied
in certain circumstances:

Guidance for the compilation and reporting of data on packaging and packaging waste _________________________ 79
“By way of derogation from the first subparagraph, the weight of packaging
waste recycled may be measured at the output of any sorting operation
provided that:
(a) such output waste is subsequently recycled;
(b) the weight of materials or substances that are removed by further
operations preceding the recycling operation and are not subsequently
recycled is not included in the weight of waste reported as recycled.
3. Member States shall establish an effective system of quality control and
traceability of municipal waste to ensure that the conditions laid down in
point (c) of paragraph 1 of this Article and in paragraph 2 of this Article are
met. To ensure the reliability and accuracy of the data gathered on
recycled waste, the system may consist of electronic registries set up
pursuant to Article 35(4), technical specifications for the quality
requirements of sorted waste, or average loss rates for sorted waste for
various waste types and waste management practices respectively.
Average loss rates shall only be used in cases where reliable data cannot
be obtained otherwise […].”
Recital 15 of the Waste Framework Directive provides further guidance:
“(15) The calculation of the recycling targets should be based on the weight
of packaging waste which enters recycling. As a general rule, the actual
measurement of the weight of packaging waste counted as recycled should
be at the point where packaging waste enters the recycling operation.
Nevertheless, in order to limit administrative burdens, Member States
should, under strict conditions and by way of derogation from the general
rule, be allowed to establish the weight of packaging waste recycled on the
basis of measuring the output of any sorting operation. Losses of materials
which occur before the waste enters the recycling operation, for instance
due to sorting or other preliminary operations, should not be included in the
waste amounts reported as recycled. Those losses can be established on
the basis of electronic registries, technical specifications, detailed rules on
the calculation of average loss rates for various waste streams or other
equivalent measures. Member States should report on such measures in
the quality check reports accompanying the data which they report to the
Commission on waste recycling. The average loss rates should preferably
be established at the level of individual sorting facilities and should be
linked to the different main types of waste, different sources (such as
household or commercial), different collection schemes and different types
of sorting processes. Average loss rates should only be used in cases
where no other reliable data are available, in particular in the context of
shipment and export of waste. Losses in weight of materials or substances

Guidance for the compilation and reporting of data on packaging and packaging waste _________________________ 80
due to physical or chemical transformation processes inherent in the
recycling operation where packaging waste is actually reprocessed into
products, materials or substances should not be deducted from the weight
of the waste reported as recycled.”
ALRs should only be used when there is no other reliable data available on material losses
that occur before the calculation point, such as data from electronic registries. The main
instance in which ALRs might be applied is where waste is exported for recycling and reliable
data on such losses cannot be obtained from the operators in the receiving country. In this
case, further conditions as specified under section A.2.9.3 should be applied.
ALRs can be applied at different outputs of sorting processes in the waste management
chain, and are dependent upon the source and type of packaging material. After initial
sorting, different materials are subject to a range of down-stream processes before the
recycling calculation point, each with varying loss rates. This is especially true for plastics as
different polymer types can follow different recycling processes. It is reported that mixed
plastic polymers have high levels of material rejects that are sent for disposal or energy
recovery. In comparison, materials that are easier to sort, such as steel cans, typically have
much lower reject rates. As such, ALRs for mixed plastic packaging should ideally only be
applied after the plastics are separated into different polymer types.
A.2.9.2 Approaches to calculating ALRs
ALRs are calculated as the weight of the average losses from sorted packaging waste up
until the calculation point, in relation to the weight of the sorted packaging waste.
ALRs can be defined and calculated in different ways. For instance, they can be defined at
the national level, by plant type, or on a plant by plant basis. Calculating ALRs can be based
on data collected in the following ways: periodic surveys to sample losses throughout the
chain from output of sorting to the calculation point, using technical specifications regarding
the allowable levels of non-target material in certain material streams at the output of sorting,
and extrapolating loss rates provided in other Member States.
It is recommended that the surveys referred to above should include data from at least one of
the following methods:
representative sampling of the input and output of preliminary treatment of individual batches of sorted waste;
representative sampling of the total input and output of preliminary treatment of sorted waste;
data on the total annual input and output of preliminary treatment of sorted waste which may be calculated as an average of up to three consecutive years.
The most appropriate approach depends upon a number of factors including:
The variation in non-targeted material for in-scope waste streams;
The proportion of input to facilities that is from in-scope waste streams; and
The variation in overall loss rates for different configurations of sorting operation.
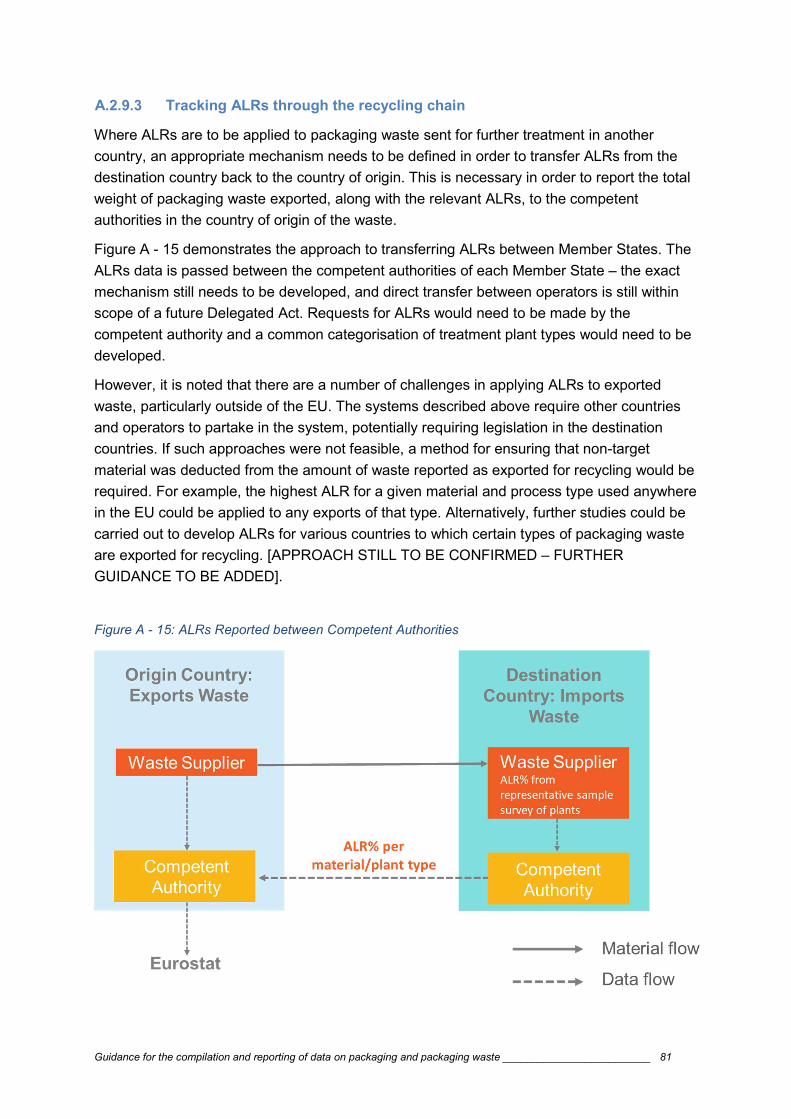
Guidance for the compilation and reporting of data on packaging and packaging waste _________________________ 81
A.2.9.3 Tracking ALRs through the recycling chain
Where ALRs are to be applied to packaging waste sent for further treatment in another
country, an appropriate mechanism needs to be defined in order to transfer ALRs from the
destination country back to the country of origin. This is necessary in order to report the total
weight of packaging waste exported, along with the relevant ALRs, to the competent
authorities in the country of origin of the waste.
Figure A - 15 demonstrates the approach to transferring ALRs between Member States. The
ALRs data is passed between the competent authorities of each Member State – the exact
mechanism still needs to be developed, and direct transfer between operators is still within
scope of a future Delegated Act. Requests for ALRs would need to be made by the
competent authority and a common categorisation of treatment plant types would need to be
developed.
However, it is noted that there are a number of challenges in applying ALRs to exported
waste, particularly outside of the EU. The systems described above require other countries
and operators to partake in the system, potentially requiring legislation in the destination
countries. If such approaches were not feasible, a method for ensuring that non-target
material was deducted from the amount of waste reported as exported for recycling would be
required. For example, the highest ALR for a given material and process type used anywhere
in the EU could be applied to any exports of that type. Alternatively, further studies could be
carried out to develop ALRs for various countries to which certain types of packaging waste
are exported for recycling. [APPROACH STILL TO BE CONFIRMED – FURTHER
GUIDANCE TO BE ADDED].
Figure A - 15: ALRs Reported between Competent Authorities

Guidance for the compilation and reporting of data on packaging and packaging waste _________________________ 82
A.2.9.4 Data collection and verification
In order to ensure that the ALRs used are accurate, measures should be taken to verify the
data used for calculating the ALRs and to ensure that the sampling methods used are highly
accurate. Member States should also take measures to ensure that the sorted waste from
the various facilities surveyed is of comparable quality. Member States should conduct
verification of the evidence from waste recycling operators at least annually.

Guidance for the compilation and reporting of data on packaging and packaging waste _________________________ 83
Appendix 3 List of relevant documents
The relevant legal acts constitute:
European Parliament and Council Directive 94/62/EC of 20 December 1994 on packaging
and packaging waste.
Commission Decision 2005/270/EC of 22 March 2005 establishing the formats relating to the
database system pursuant to Directive 94/62/EC of the European Parliament and of the
Council on packaging and packaging waste
Directive (EU) 2018/852 of the European Parliament and of the Council of 30 May 2018
amending Directive 94/62/EC on packaging and packaging waste
Commission Implementing Decision (EU) 2019/665 of 17 April 2019 amending Decision
2005/270/EC establishing the formats relating to the database system pursuant to European
Parliament and Council Directive 94/62/EC on packaging and packaging waste (notified
under document C(2019) 2805)
Directive (EU) 2018/851 of the European Parliament and of the Council of 30 May 2018
amending Directive 2008/98/EC on waste (Text with EEA relevance)

Guidance for the compilation and reporting of data on packaging and packaging waste _________________________ 84
Appendix 4 Suggestion for detailed questionnaire for reusable packaging to be sent by the Member States to the economic operators in the sector.
Detailed disaggregated questionnaire to economic operators for data on reuse of packaging for a given year
1. General information on reporter
Reporting economic operator or EPR scheme
Company name
Contact person
Contact details
Reporting period
2. Detailed information
Index Relation Unit
Confidential Y/N
(a) System for reuse type Select from given categories
(b) Packaging Free text
(c) Packaging material Select from given categories
(d) Category of packaging Select from given categories
(e) Average specific weight per unit (kg) kg
(f) (h)/(k) Reusable packaging placed on the market for the first time in the reporting period (reporting year)
Tonnes
(g) (i*)*(j) Total number of uses in the system for the reporting year
Number
(h) (g)*(e)/1000 Reusable packaging filled or used in the reporting year
Tonnes
(h*) (g)*(o)/1000 Reusable packaging filled or used, other unit than tonnes e.g. ‘packed volume’ in the reporting year
e.g. 1000 litres
(i) (g)/(j)* (o)/1000 Population of reusable packaging (unit) Tonnes
(i*) (g)/(j) Population of reusable packaging (unit) Number
(j) (g)/(i*) Average number of rotations per year of a single packaging unit
Number

Guidance for the compilation and reporting of data on packaging and packaging waste _________________________ 85
3. Possible additional information (e.g. relevant for life cycle assessment)
(k) (h)/(f) Average number of rotations during lifetime of a single packaging unit
Number
(l) ((h)-(f))/(k)
Reuse ratio %
(m) More detailed description of the packaging material like specific plastic used (PE-LD, PE-LLD, PE-MD, PE-HD, PP, PET, …) or white/ green / brown glass
Free text
(n) Average transport distance per rotation km
(o) Volume of products/ transport provided by one single reusable packaging
Litre
4. Comments to the table above
(a) ‘System for reuse’: established arrangements (organisational, technical and/ or
financial) which ensure the possibility of reuse including open-loop systems and closed-
loop systems. Please select one out of the two different types:
1 ‘Open-loop system’: system in which reusable packaging is circulated amongst unspecified companies or
2 ‘Closed-loop system’: system in which reusable packaging is circulated by a company or a co-operating group of companies.
3 ‘Hybrid system’ shall not apply for consideration of reusable packaging.
(b) Please describe the kind of packaging. Typical types of reusable packaging
include beer bottles; water and/ or soft drink bottles; milk bottles or other containers for
dairy products; crates, boxes, and/ or containers for fruit and vegetables. These typical
kinds of reusable packaging might have different characteristics, for instance regarding
their specific weight or the number of rotations during their lifetime.
(c) Please select exclusively from the following materials: glass, plastic, paper/
cardboard, ferrous metal, aluminium, wood, others.
(d) Please select exclusively from the following categories: sales packaging, grouped
packaging, transport packaging.
(g) ‘Number of uses’ is measured at the point of filling or packing by the claiming
company. It includes the use of all reusable packaging passing the measurement point
(CEN/TR 14520:2007: definition 2.7) regardless if newly manufactured (CEN/TR
14520:2007: definition 2.8) or reused. The claiming company (CEN/TR 14520:2007:
Definition 2.4) is the packer / filler who makes a claim of ‘reusable’ for a type of packaging,
in the circumstances of its intended use.
(h) This means the number of rotations that reusable packaging completes in a given
year multiplied by its mass or, in other words, ‘the mass of reusable packaging filled with
goods’ in one year. The definition is equivalent to that in reporting Table 3 columns #8 and
#10 (see Section 4.4). The sum of the masses of the various kinds of reusable packaging

Guidance for the compilation and reporting of data on packaging and packaging waste _________________________ 86
filled with goods in one year as reported by the economic operators via the detailed
questionnaire equals the aggregated value to be reported to the Commission by the MS
(reporting Table 3 column #8; the same sum for only sales packaging equals the value in
reporting Table 3 column #10).
(h*) Operators might have data available in units other than tonnes. Not all national
reporting systems refer to tonnes of reusable packaging material. For instance, some MS
report on beverages only and report the unit as a ‘litre of packed beverage’. This reporting
unit is most appropriate if the target is also in line with the unit, as the unit better reflects
the environmental impact than the tonnage of packaging used. For instance, when
conducting a life cycle assessment, the functional unit is the volume of packed beverage
and not the tonnes of packaging material.
(i*) ‘population’: total number of a packaging type, empty or filled, in that whole reuse
system (CEN/TR 14520:2007, definition 2.3).
(i) ‘population’, expressed in tonnes
(j) ‘rotation’: cycle undergone by reusable packaging from filling/ loading to
filling/loading (CEN/TR 14520:2007, definition 2.2).
(l) The ‘reuse ratio of reusable packaging’ is the reused packaging filled divided by
reusable packaging filled (the last including newly manufactured) at the measurement
point, over the calculation period. With other words expressed: it is the effectively reused
packaging in relation to the total reusable packaging (which included the newly produced
reusable).
It is measured by the claiming company. The claiming company (CEN/TR 14520:2007:
Definition 2.4) is the packer/ filler who makes a claim of ‘reusable’ for a type of packaging,
in the circumstances of its intended use.
Some of the items in the detailed questionnaire above can in theory be calculated from
other items, as displayed in the second column (‘relations’). However, a precondition for
such calculations is a steady state system. Under conditions when a system is growing,
the indicated relations might not be correct.
Depending on the operator and the reuse system in place, the quality of the data might
vary. Therefore, we propose asking the economic operators to indicate if the figures result
from monitoring/ counting, have been calculated/ derived using the formula for ‘relation’,
or have been estimated from other sources.
Although the data for life cycle assessments are not yet required for the reporting, they will
be relevant for the assessment and in particular, when targets for reuse are implemented.
Therefore, we recommend that MS aim to collect such information as well in order to
provide input for future assessments on targets for the reuse of packaging. Ideally, MS
might even derive national conclusions from this information that should be shared with
other MS and the EC.

Guidance for the compilation and reporting of data on packaging and packaging waste _________________________ 87
As mentioned above, some MS currently report on packed volume in litres for beverages
only. This unit is more meaningful for comparing packaging for beverages than the weight
of the packaging, as reusable packaging is typically heavier than one-way packaging.
Recalculating between weight and volume would be advantageous, as with information on
volumes the market share of total amounts of respective packaging streams can be better
illustrated. This might be of special interest for the planned target setting on the reuse of
packaging in the future.
However, as reporting of packaging currently needs to be in tonnes it is necessary to be
coherent, especially since recycling targets are partly affected by amounts reported on the
reuse of sales packaging according to Article 5(2) of the PPWD.

Guidance for the compilation and reporting of data on packaging and packaging waste ___________________________________________________________________________________ 88
Example of how to complete the proposed detailed questionnaire by economic operators on data on reuse of packaging for a given year In
dex
Relation Unit Reporter 1 Reporter 2 Reporter 3 Reporter 4 Reporter 5 Reporter 6
Confidential Y/N Y Y Y N N Y
(a) System for reuse type Select from given categories
Closed loop Closed loop Closed loop
Open loop Closed loop Closed loop
(b) Packaging Free text Beer bottles Beer/ soft drink crates
Beer casks Pallet Containers
for vegetables
and fruit
Gas bottles
(c) Packaging material Select from given categories
Glass Plastic Aluminium Wood Plastic Ferrous metal
(d) Category of packaging Select from given categories
Sales Sales Transport Transport Transport Sales
(e) Average specific weight per unit (kg)
kg 0.345 m 2.2 m 10 m 25 m 1 m 10 m
(f) (h)/(k)
Reusable packaging placed on the market for the first time in the reporting period (reporting year)
Tonnes 3 680 m 460 m 235 m 120 000 m 900 m 500 m
(g) (i*)*(j) Total number of uses in the system for the reporting year
Number 266 428 000 m 12 000 000 m 1 560 000 m 48 000 000 e 52 000 000 m 3 000 000 m
(h) (g)*(e)/1000 Reusable packaging filled or used in the reporting year
Tonnes 92 000 m 27 500 m 16 400 m 1 200 000 e 67 500 m 30 000 m
(h*) (g)*(o)/1000
Reusable packaging filled or used, other unit than tonnes e.g. ‘packed volume’ in the reporting year
1000 litres 133 300 m n/a m 47 000 m n/a 1 250 000 m
(i*) (g)/(j) Population of reusable packaging (unit)
Number 63 435 238 c 2 643 135 c 120 000 m 9 600 000 e 3 465 000 e 750 000 m
(j) (g)/(i*) Average number of rotations per year of a single packaging unit
Number 4.2 e 4.5 e 13 m 5 e 15 e 4 e
(k) (h)/(f) Average number of rotations during the lifetime of a single packaging unit
Number 25 e 60 e 70 e 10 e 60 e 60 e

Guidance for the compilation and reporting of data on packaging and packaging waste ___________________________________________________________________________________ 89
Ind
ex Relation Unit Reporter 1 Reporter 2 Reporter 3 Reporter 4 Reporter 5 Reporter 6
(l) ((h)-(f))/(h) Reuse ratio 96.0% c 98.3% c 98.6% c 89.6% c 98.7% c 98.3% c
(m)
More detailed description of the packaging material like specific plastic used (PE-LD, PE-LLD, PE-MD, PE-HD, PP, PET, …) or white/ green/ brown glass
Free text Brown glass PP Aluminium Wood PP Steel
(n) Average transport distance per rotation
km 55 e 60 e 40
(o) Volume of products / transport provided by one single reusable packaging
Litre 0.5 30 24
m = monitored
e = estimate
c = calculated as mentioned in 'relation'