Growth Effects of Human Capital and Stages of Economic Development: A Panel Data Investigation of...
23
Growth Effects of Human Capital and Stages of Economic Development: A Panel Data Investigation of Different Country Experiences G. Agiomirgianakis * , D. Asteriou, V. Monastiriotis City University The University of Reading London School of Economics Abstract The empirical literature on the role of human capital (HC) for economic growth has reached strong evidence for a robust positive relationship mainly through cross- country growth regressions. This paper using a large panel of data (93 countries) investigates the growth effects of human capital taking into account the different stages of economic development across countries and identifies those factors that may affect the above effects. Our findings suggest that education has indeed a significant and positive long-run effect on economic growth that is found to be increasing with the level of education. Moreover, the significance of this growth effect depends upon the particular stage of development with countries at the lowest spectrum of economic development obtaining relatively higher growth effects from all levels of education. Next, we find that taxation and technological development are important determinants of human capital productivity. Our findings have a number of straightforward policy implications: first, investment in education – especially tertiary education - can have strong growth-enhancing effects; second, advanced and developing countries should focus more on the provision of tertiary education, while countries with medium levels of economic development need a more strategic government approach that could encourage simultaneously investment in human, as well as, in physical capital; finally, policy measures aiming at enhancing the productivity of human capital must focus their effort into technology penetration and re-distribution policies. Keywords: Human Capital, Economic Growth, Stages of Development, Panel Data J.E.L. Classification: C23, O15, O40, O50 * Address of Correspondence: Dr. G. M. Agiomirgianakis, City University, Department of Economics, EC1V 0HB, London, UK; Tel: (0)20-74778591; Fax: (0)20-7477 8580; E-mail:[email protected] . The first author would like to acknowledge financial support from CNR, Milan Italy (Ref # 9701395.ct.10. 1
Transcript of Growth Effects of Human Capital and Stages of Economic Development: A Panel Data Investigation of...
Growth Effects of Human Capital and Stages of Economic Development:
A Panel Data Investigation of Different Country Experiences
G. Agiomirgianakis*, D. Asteriou, V. Monastiriotis City University The University of Reading London School of Economics
Abstract
The empirical literature on the role of human capital (HC) for economic growth has reached strong evidence for a robust positive relationship mainly through cross-country growth regressions. This paper using a large panel of data (93 countries) investigates the growth effects of human capital taking into account the different stages of economic development across countries and identifies those factors that may affect the above effects. Our findings suggest that education has indeed a significant and positive long-run effect on economic growth that is found to be increasing with the level of education. Moreover, the significance of this growth effect depends upon the particular stage of development with countries at the lowest spectrum of economic development obtaining relatively higher growth effects from all levels of education. Next, we find that taxation and technological development are important determinants of human capital productivity. Our findings have a number of straightforward policy implications: first, investment in education – especially tertiary education - can have strong growth-enhancing effects; second, advanced and developing countries should focus more on the provision of tertiary education, while countries with medium levels of economic development need a more strategic government approach that could encourage simultaneously investment in human, as well as, in physical capital; finally, policy measures aiming at enhancing the productivity of human capital must focus their effort into technology penetration and re-distribution policies.
Keywords: Human Capital, Economic Growth, Stages of Development, Panel Data
J.E.L. Classification: C23, O15, O40, O50
* Address of Correspondence: Dr. G. M. Agiomirgianakis, City University, Department of Economics, EC1V 0HB, London, UK; Tel: (0)20-74778591; Fax: (0)20-7477 8580; E-mail:[email protected]. The first author would like to acknowledge financial support from CNR, Milan Italy (Ref # 9701395.ct.10.
1
1. Introduction
For much of the 20th century, economic growth theory, based on standard
neoclassical analysis, assumed that capital accumulation increases an economy's
growth in the medium term but that the steady state growth is constrained by the rate
of growth of the labour force. This left technical progress, which was assumed
exogenous, as the only driving force of economic growth in the long-run.
Since the mid 1980s, however, following the inspiring work of Romer (1986)
and Lucas (1988), endogenous growth theory identified a number of additional factors
that determine the growth rate of an economy. Increasing returns to scale, innovation,
openness to trade, international R&D and human capital formation are all considered
key factors in explaining the growth process (see e.g. Lucas, 1988 and Turnovsky,
1999, for an excellent review). Consequently, human capital, and in particular that
attained through education, has been introduced as a crucial determinant of economic
growth.1
Following that, voluminous empirical studies tried to investigate quantitatively
the relation between education and economic growth (see e.g. Barro 1999 & 1991;
Barro and Sala-i-Martin, 1995; Chuang, 2000; Krueger and Lindhal, 1999; Temple,
2001 & 1999; Freire-Seren, 1999; Fuente et al, 2000; Storeslettenn et al, 2000; and
Bassanini et al 2001). The general conclusion of these studies indicates that there is a
positive correlation between economic growth and education (but see also Pritchett,
1999, for a different finding). However, most of the existing studies have been carried
out by employing cross sectional data and techniques, mostly for advanced countries
that had solved their most crucial problems of development by the first quarter of the
1 We do not formally present a theoretical model here, since the theoretical aspects of education and growth have been extensively presented in the relevant literature. For a mathematical exposition of the effects of human capital to growth, see Lucas (1988); Mankiw et al (1992); Aghion and Howitt (1998) and Barro and Sala-i-Martin (1995) among others.
2
20th century. Hence, the relationship between the growth effects of human capital and
the level of economic development has largely been overlooked2. This is hardly a
minor omission. Maybe more than any other factor of production, human capital
cannot enhance productivity in isolation of the wider socio-economic and technical
conditions under which the production of goods and services is organised. This has
been widely recognised in the literature of economic development (Otani and
Villanueva, 1990; Deolalikar et al, 1997; McMahon, 1999; Bourguignon and Verdier,
2000; Funke and Strulik, 2000) but has received little attention in the economic
growth literature.3
In our empirical analysis, we employ advanced estimation techniques for
dynamic panel data on a diverse set of countries, with different levels of economic
development and different trends in terms of GDP growth.4 We isolate the human
capital effect on growth at different stages of economic development and try to
identify the factors that make human capital more productive in some countries than
in others. More specifically, our analysis is threefold; first, it examines how and by
how much does education affect economic development; second, it investigates how
the above effect is changing at different stages of economic development and, finally,
it tries to identify factors determining the size of this effect across countries. Our
analysis provides some answers to the above issues that have significant policy
implications at both the national and supra-national levels, when designing
educational and skill-acquisition strategies with the aim of encouraging or inducing
economic growth.
2 Despite that as noted by Zolotas (1977) the adaptation and exploitation of foreign technology into less-developed countries requires a given level of technical knowledge in the labour force that often is not available. 3 Among the few exceptions are Ghosh and Wolf (1998), Judson (1998) and Sorensen (1999). 4 See Appendix 2 for a list of the countries used in the empirical analysis.
3
The paper is organized as follows. Section 2 discusses the empirical
methodology of dynamic panel data (Pooled Mean Group) estimation, as well as, the
estimation of country-specific long-run coefficients. Section 3, presents the empirical
results. Finally, Section 4 concludes the paper with the policy implications of our
findings.
2. Empirical Methodology
As already stated, the aim of this study is to examine the long-run effects of
education on economic growth in a panel of data. Our panel consists of 93 (N=93)
countries, over a period of 28 years (T=28) from 1960-1987. This set of data has
complex dynamics and is characterised by strong trends and non-stationarity.
Therefore, the empirical method to be adopted here needs to be technically
appropriate for the estimation of consistent long-run parameters. This implies that
traditional panel data approaches (e.g., fixed and random effects models) cannot be
used in this case. In the type of data set we are considering, T is sufficiently large to
allow individual country estimation.
Our analysis deviates from the conventional integration/co-integration approach
for two reasons. First, there are only a few tests of co-integration in a panel data
context, while it is also well known that tests of order of integration in panel data do
not reliably distinguish between series that contain a unit root and those that are
stationary with a “near-unit root”. Second, long-run parameters may be consistently
estimated using the traditional autoregressive-distributed lag (ARDL) approach
(Pesaran and Shin, 1998). Moreover, as Pesaran, Shin and Smith (1999) have shown,
this approach yields consistent and asymptotically normal estimates of the long-run
4
coefficients irrespective of whether the underlying regressors are I(1) or I(0).5 Further,
it compares favourably in Monte Carlo experiments with conventional methods of
cointegration analysis.
The above considerations have led us to the adoption of two recently developed
methods for the statistical analysis of dynamic panel data: the Mean Group (MG) and
the Pooled Mean Group (PMG) estimation.6 Indeed, these methods are particularly
suited to the analysis of panels with large time and cross-section dimensions, as they
allow us to distinguish between short- and long-run effects and, hence, remove
business-cycle and other influences from the sample. Consequently, the derived long-
run coefficients describe more accurately the true structural relationships and which
are, of course, of more interest to economic theory and policy makers alike. These
methods are described in detail in appendix 1.
In our empirical investigation we split our sample countries into three groups
of low, middle and high-income countries, according to the World Bank
classification. The classification is based on the official country groupings produced
by the World Bank, as derived from the World Development Indicators 2000 CD-
ROM. This allows us to investigate the differentiated impact that human capital has
on economic growth, at different stages of economic development. However, we also
estimate our model for the whole sample, first imposing a common long-run
coefficient on human capital, and then allowing this coefficient to vary across
countries. We further use these country-specific estimates of the long-run coefficients
of human capital as our dependent variable in a cross-sectional regression, trying to
5 In our analysis the GDP and the Investment variables are clearly trended for all countries and can be assumed to be I(1), hence become stationary after first differencing. Although the order of integration of the education variables is inconclusive, we treat these variables as being I(0), to be consistent with theory and the relevant empirical literature (see e.g. Asteriou and Agiomirgianakis 1999). 6 Note that in the traditional pooled estimators, such as the fixed and random effects, the estimation of long-run parameters is prohibited, and only the intercepts are allowed to differ across countries while
5
associate country differences in these coefficients to specific socio-economic
characteristics.
The growth model that we estimate includes the growth rate of investment made
per employee (∆kit) and the various educational proxies (Hit) (average years of
schooling for the labour force in all three levels of education: primary, secondary and
tertiary) as explanatory variables of GDP growth (∆yit). The source of the data on
education is Nehru and Dhareshwar (1993). Data on investment and output were
derived from the Penn World Tables (5.6).
3. Estimation Results
We initially applied the MG and PMG estimation techniques to the whole
sample, also assuming that all of the long run coefficients are constant across
countries. This hypothesis is not rejected by the data.
3.1. Whole-sample analysis
Table 1 summarises the results. In both MG and PMG cases a positive
relationship between education and growth is found, supporting the theoretical
considerations. The MG estimates provide less information than the PMG ones, but
they also have the expected signs. However, in all cases, the Hausman tests (last two
columns of Table 1) do not reject the restriction of common long-run coefficients, so
pooling the data (by using the PMG estimator) appears to be a preferable and more
informative procedure. We thus focus on the PMG estimates. The coefficient for the
growth rate of per capita capital is positive and statistically highly significant for all
three alternative specifications. More importantly, the human capital coefficients are
all other coefficients and error variances are constrained to be the same. Therefore, these methods of
6
positive and also highly significant. Thus, human capital is found to have a direct
positive effect on GDP growth. This finding is in line with the predictions of
contemporary growth theories7 that identify human capital as an important
determinant of economic growth.
Interestingly, the estimated impact of human capital on growth increases with
the level of education (as represented by the different educational sectors). Increasing
the average primary education of the labour force by one year increases (other things
constant) output growth by 0.05 percentage points. This effect doubles for the case of
secondary education (0.11%) but it increases by five times for the case of tertiary
education (0.27%)8. Thus, not only there is clear evidence that human capital affects
growth positively, but, it is also observed that higher levels of education are
associated with higher rates of economic growth, with the implication that human
capital has non-linear or cumulative growth effects.
3.2. Analysis by country-groups
Having established a robust positive relationship between human capital and
growth, it is interesting to further investigate how this relationship changes for
different stages of economic development. Our sample of 93 countries includes
remarkably diverse economies, from small Third World countries (e.g. Rwanda) to
large open and highly advanced economies (e.g. USA). Despite the fact that the
assumption about the poolability of the coefficients (see Hausman tests in Table 1)
cannot be rejected, as it will become evident in the next sub-section (3.2), the growth
effects of human capital can be very different across structurally different groups of
estimation are not applicable to our case. 7 i.e. the endogenous growth theory or the augmented neoclassical model (e.g. Mankiw et al 1992). 8 Our results are in line with Barro (1999) although quantitatively different given the different samples and time periods.
7
countries. To investigate this possibility, we split our sample-countries into three
groups, following the World Bank classification of high, middle and low income
countries (see Appendix 2). Using these groups we re-estimate our growth model for
the three alternative human capital variables.
These results are presented in Table 2. All regressions have been estimated with
the PMG procedure, which is clearly approved by the Hausman test (last column of
Table 2), as was the case with the whole-sample regressions. The estimated capital
growth coefficients are always significant and with the correct signs. Interestingly,
these coefficients increase in both magnitude and significance with each income
group. As expected, physical capital is more productive in high-income countries
(around 0.60%) and less so in middle-income (0.54%) and low-income countries
(around 0.46%).
The results are more interesting for the case of the human capital estimates. Not
surprisingly, for high-income countries primary education is insignificant. Secondary
education is at the margin of significance, with a positive effect, which is almost
identical to the corresponding effect obtained for the low-income group. On the other
hand, the impact of tertiary education in high-income countries is highly significant
and very large, almost one and a half times larger than that estimated from the whole-
sample regression (Table 1). For the middle-income group the first two educational
levels appear to be highly insignificant. Only tertiary education has a statistically
significant effect. Still, this effect is only significant at the 5% level and is very close
to that obtained from the whole-sample estimation (0.30% against 0.27%).
Finally, for the low-income group all educational levels matter. Higher levels of
education appear more productive than lower ones. More strikingly, the productivity
of tertiary education is two and a half times that of the other two educational
8
categories. Moreover, it is 1.4 times bigger than in the high-income group and 1.8
times bigger than in the middle-income group of countries. Clearly, this result reflects
the relative shortage of skills in this group. Further, the significance of the growth
effect of primary education can be taken to reflect the high illiteracy rates in this
group of countries, where (primary) education might be having a strong threshold
effect. Clearly, human capital has a differential impact on economic growth and this
impact depends upon the stage of development that each country has attained. Our
findings may also suggest the existence of diminishing returns to spending on formal
education in advanced economies also found in other studies (e.g., Hanushek and
Kim, 1995; OECD, 2001).
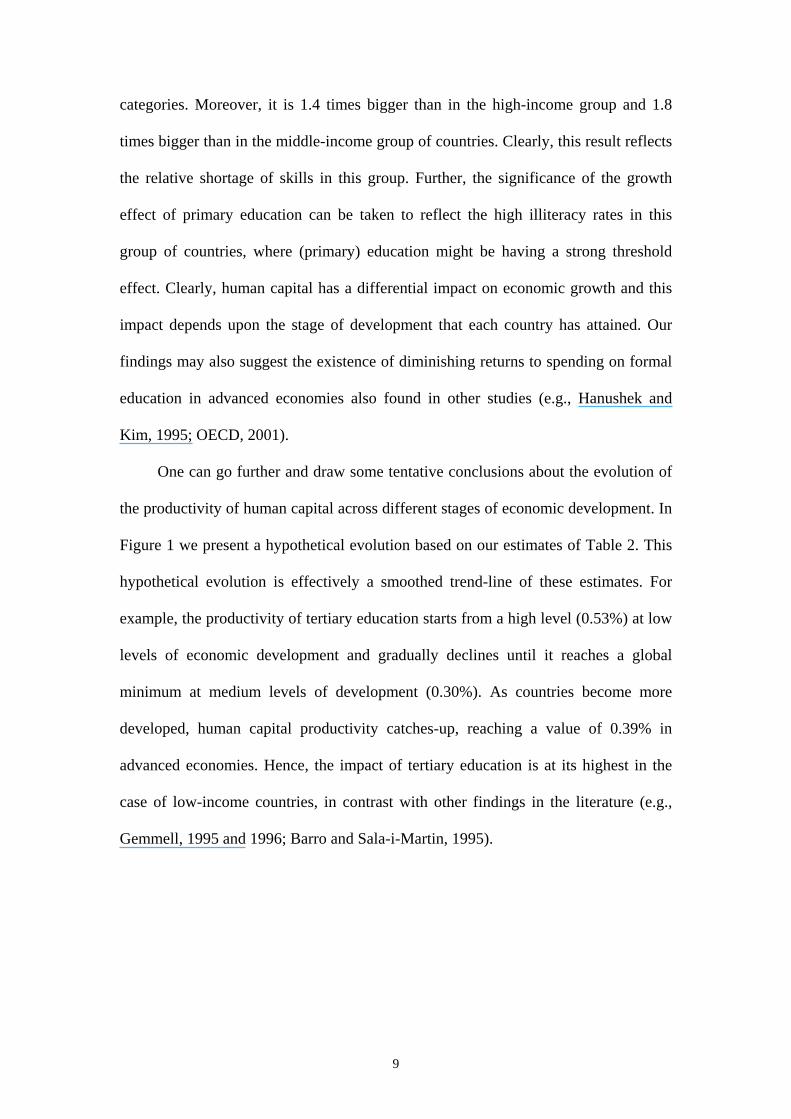
One can go further and draw some tentative conclusions about the evolution of
the productivity of human capital across different stages of economic development. In
Figure 1 we present a hypothetical evolution based on our estimates of Table 2. This
hypothetical evolution is effectively a smoothed trend-line of these estimates. For
example, the productivity of tertiary education starts from a high level (0.53%) at low
levels of economic development and gradually declines until it reaches a global
minimum at medium levels of development (0.30%). As countries become more
developed, human capital productivity catches-up, reaching a value of 0.39% in
advanced economies. Hence, the impact of tertiary education is at its highest in the
case of low-income countries, in contrast with other findings in the literature (e.g.,
Gemmell, 1995 and 1996; Barro and Sala-i-Martin, 1995).
9
Figure 1. Human capital productivity and stages of economic development
-0.2
0
0.2
0.4
0.6
0.8
Primary Secondary Tertiary
MiddleLow High
Stage of econom ic development
Hum
an c
apita
l pro
duct
ivity
For middle-income countries education is a far less important factor, as at this
stage of development physical capital infrastructure is possibly the most important
determinant of growth. This does not necessarily refute the assumption about the
“strategic complementarity” between the two types of capital (Nickel and Nicolitsas,
1997). Rather, it suggests that their relationship can vary at different levels of
economic development, making the achievement of the appropriate combination of
physical and human capital a crucial policy responsibility9. The impact of secondary
and tertiary education catches up again for high-income countries, with some signs of
convergence. Clearly, if human capital has an important effect into economic growth
that varies from one stage of economic development to another, then this raises the
issue of what determines the evolution of human capital productivity across different
9 Sorensen (1999) suggests another reason, i.e. that R&D could be activated after a threshold and being relatively more important than education at some stage of economic development.
10
stages of economic development. Thus, in the next sub-section (3.3) we turn the focus
of our analysis to the determinants of human capital productivity.
3.3. The determinants of human capital productivity
In order to further investigate the country differences in the growth effect of
human capital, we re-estimate the whole-sample regression of Table 1, this time
allowing for country-specific estimates of the long-run human capital coefficients.10
This produces a series of 93 human capital coefficients that we further have attempted
to regress on a number of social, demographic and economic indicators in a cross-
sectional regression. However, this exercise is largely constrained by data availability.
We use data derived from the World Bank World Development Indicators
database, which contains information on a wide range of socio-economic and
demographic characteristics. As our dependent variable is an average over time of the
country-specific growth effects of human capital, we average each time-series from
our World Bank based dataset, to produce a set of cross-sectional series. Missing
values is the main problem with such a procedure, as to the extent that there is a
systematic pattern in the non-availability of data, this will generate a non-random bias
in our results.11 As there is no formal way to deal with this problem, we treat the
findings obtained from this exercise with a lot of caution, as merely indicative. It is
interesting to note, however, that in our estimating sample for the final cross-section,
10 This exercise was only performed for the case of tertiary education. The country-specific estimates are presented in appendix 2. Detailed results are available upon request. 11 For example, if poorer countries have systematically missing values for the early years of our sample (e.g., the 1960s) and since, as expected, social and economic conditions have improved over the course of time in all of our sample countries, then averaging over time will artificially reduce the gap between poor and rich countries in the measured socio-economic indicators. In this respect, our averaging can only understate the impact of socio-economic characteristics on human capital productivity.
11
which due to data availability included only three fourths of the original sample, all
three-income groups are analogously represented.12
Our results from the best fitting regression are reported in Table 3. Despite our
reservations, the performance of the regression is very satisfactory. The right-hand
side variables have been selected on the basis of their explanatory power, using a
stepwise backward deletion procedure, among a large number of possible alternatives.
The candidate variables covered a wide range of social (e.g., illiteracy, health
conditions, pollution, use of cars), economic (e.g., FDI flows, savings, tax rates,
public investment), demographic (e.g., fertility rates, age and gender composition of
population, urbanisation) and technological conditions (e.g., size of R&D sector,
high-tech exports, etc). All of these wider factors are reflected in our final selected
variables, which explain around half of the cross-country variation in human capital
productivity. Further, all specification tests suggest that the estimates are robust, as
there is no indication of heteroskedasticity (Cook-Weisberg test), non-normality
(Shapiro-Wilk test) or mis-specification (Ramsey RESET test).
Additionally, with few exceptions most of the estimated coefficients are
significant even at the 1% level. Further diagnostics suggested that, if anything, there
is little evidence of multicollinearity. Note also that, due to averaging, our results are
independent of any business cycle effects and are very unlikely to suffer from
simultaneity or endogeneity problems. Finally, it must be noted that the omission of
specific variables is only of minor importance so far as our right-hand side variables
are successful in covering the whole range of socio-economic and demographic
factors that can be reasonably assumed to affect human capital productivity. This,
however, implies that our estimates cannot be interpreted as pure and direct effects,
12 In the original sample, high, middle and low income countries represent the 31%, 38% and 31% of the sample, respectively. In the smaller cross-sectional sample the corresponding percentages are 31%,
12
but rather as broad indicators of the impact that should be attributed to the wider
factors that the corresponding variables represent. For example, the estimated impact
of internet penetration can only be interpreted as an indicator of the effect that
technology penetration in everyday life (that the former attempts to control for) has on
human capital productivity and not as a direct effect of internet use.
With these remarks about the economic interpretation of our findings, these
seem to be generally consistent with the discussion of the previous sub-section. The
level of technology penetration and socio-economic development, as captured by the
use of internet and the share of savings to GDP, are found to have a positive impact
on the productivity of human capital. On the other hand, electric power consumption
enters with a highly significant negative coefficient, plausibly capturing an adverse
agglomeration effect (congestion diseconomies). It must be noted, however, that a
large number of other socio-demographic and technological indicators consistently
failed to be significant. Illiteracy, fertility rates and age dependency ratios, as well as
the use of cars and mobile phones or the levels of water pollution and CO2 emissions,
were among them.
As expected, the size of the agricultural sector was found to be negatively
related to human capital productivity. Taxation on income, profits and capital gains
also enters with a negative sign, suggesting that human capital is less productive in
countries with more progressive tax systems and, thus, more redistribution-supportive
governments. Probably the same “egalitarian government” effect is also reflected in
the obtained coefficient for health expenditure. This implicitly raises from yet another
perspective the old question about the trade-off between equality and efficiency
(Okun, 1975). More interestingly, however, it can be taken as evidence suggesting
44% and 25%.
13
that educational inequality increases human capital productivity, given the rather
convincing evidence about the relationship between economic inequalities and
inequalities in access to education (Steedman, 1996; OECD and Statistics Canada,
2000). The implication of this result is that inequalities in economic and educational
opportunities might positively affect the productivity of human capital (which has
also been suggested in different strands of literature –for example, Walde, 2000;
Lloyd-Ellis, 2000). This result attributes an extra role to policy in adopting non-
conflicting educational and growth strategies.
Another interesting finding relates to the estimated effect of population density.
The negative sign obtained here is casting some doubt on the hypothesis that human
capital accumulation and productivity increase with the density of human
interaction,13 Finally, the share of physicians in the population has a strong positive
effect. Surprisingly this is the only technology-related indicator that added any
significant information on the model, as the R&D-related variables (i.e., R&D
spending and employment shares) were almost always insignificant. As a final note, it
must be emphasised that also insignificant were a number of variables related to
education (e.g., government spending on education and school enrolments). We
interpret this as an indication that our human capital productivity estimates (the
dependent variable) are unbiased and independent from any possible external human
capital effects (see Sakellariou, 2001).
In this section we have tried to investigate the determinants of human capital
from a large number of candidate variables. Our findings suggest that the level of
technology penetration, socio-economic development and health conditions, as
captured by the use of internet; the share of savings to GDP and the number of
14
physicians are found to have a positive impact on the productivity of human capital.
On the other hand, population density, taxation, health expenditure and the size of the
agriculture sector are found to be negatively related.
4. Conclusions
The growth effect of education is an issue that has been studied extensively in
the last two decades. This paper has provided some further evidence to the results
obtained so far in the literature, using a large panel of data for three groups of
countries at different stages of economic development. Given the long time-
dimension of the data, our investigation, by utilising contemporary panel data
estimation techniques, not only took into account country-specific (fixed) effects but
also, and more importantly, allowed each country to follow its own short-run
dynamics. Hence, the obtained coefficients for the human capital variables can
arguably be considered as revealing a long-run structural relationship between human
capital and growth.
Our findings suggest that human capital affects growth positively and that
higher levels of education are associated with higher rates of economic growth,
suggesting the existence of a non-linear or cumulative growth effect for human
capital. Moreover, human capital has a differential impact on economic growth and
this impact depends upon the stage of development that each country has attained.
We have also tried to investigate the determinants of human capital among a
large number of candidate variables. Our findings suggest that the level of technology
penetration, socio-economic development and health conditions, as captured by the
use of internet; the share of savings to GDP and the number of physicians are found to
13 See e.g. Lucas, 1988. At this point it should be noted that Beauchemin (2001, p.412), finds that countries with large school-aged populations, generate slow flows of resources into public education
15
have a positive impact on the productivity of human capital. On the other hand,
population density, taxation, health expenditure and the size of Agriculture sector are
found to be negatively related.
We conclude that government intervention in providing higher (university)
education can be a crucial factor for economic development and sustained economic
growth. Nevertheless, strong attention must be placed on the factors identified above,
in order for the beneficial growth-effects of human capital accumulation to be
maximised.
resulting a fall into education quality and economic growth.
16
References
Aghion P. and Howitt (1998) Endogenous Growth Theory, MIT press, Cambridge Massachusetts.
Asteriou D. and G. M Agiomirgianakis (1999) “Human Capital and Economic
Growth: Time Series Evidence from Greece” Brunel University Discussion Paper 99-09.
Barro R. (1991), “Economic Growth in a Cross Section of Countries”, Quarterly
Journal of Economics, 106 (2), pp.407-443. Barro R. (1999), “Human capital and Growth in Cross-Country Regression” Swedish
Economic Policy Review 6. Barro R.J. and X. Sala-i-Martin (1995), Economic Growth, McGraw Hill. Bassanini A and S. Scarpetta (2001) “Does Human Capital Matter in OECD
countries?” Evidence from Pooled Mean-Group Estimates, OECD, Economics Department working paper No 282.
Beauchemin K. (2001), “Growth or Stagnation? The role of Public Education”
Journal of Development Economics, 64, pp.389-416. Bourguignon F. and T. Verdier (2000), “Is Financial Openness Bad for Education? A
Political Economy Perspective on Development”, European Economic Review, 44, pp.891-903.
Chuang Y. (2000), “Human Capital, Exports and Economic Growth: a Causality
Analysis for Taiwan”, Review of International Economics, 8 (4), pp.712-720. Deolalikar A, R. Hasan, H. Khan and M.G. Quibria (1997), “Competitiveness and
Human Resource Development in Asia”, Asian Development Review, 15 (2), pp.131-161.
Freire-Seren J. (1999) “Human Accumulation and Economic Growth”, Universitat
Autonoma de Barcelona, working paper 435.99. Fuente A. and R. Domenech (2000), “Human Capital in growth regression: How
much difference does data quality make?” Universidad de Valencia Departamento de Analisisn Economico, mimeo.
Funke M and H. Strulik (2000), “On Endogenous Growth With Physical Capital
Human Capital And Product Variety”, European Economic Review, 44 pp.491-515.
Gemmell N. (1995), “Endogenous Growth, the Solow Model and Human Capital”,
Economics of Planning, 28, pp.169-183.
17
Gemmell N. (1996), “Evaluating the Impacts of Human Capital Stocks and Accumulation on Economic Growth: Some New Evidence”, Oxford Bulletin of Economics and Statistics, 58 (1), pp.9-28.
Ghosh A. and H. Wolf (1998), “Thresholds and Context Dependence in Growth”,
NBER Working Paper No6480. Hanushek E. and D. Kim (1995), “Schooling, Labour Force Quality and Economic
Growth”, NBER Working Paper No5399. Judson R. (1998), “Economic Growth and Investment in Education: How Allocation
Matters”, Journal of Economic Growth, 3 (4), pp.337-359. Krueger A. and M. Lindahl (1999), “Education for Growth in Sweden and the
World”, NBER Working Paper No7190. Lloyd-Ellis, H. (2000), “Public Education, Occupational Choice, and the Growth-
Inequality Relationship”, International Economic Review, 41(1), pp.171-201. Lucas, R.E. (1988) “On the Mechanics of Economic Development” Journal Of
Monetary Economics, 22, pp. 3-4. Mankiw N. G., D. Romer and D. N. Weil (1992) “A Contribution to the Empirics of
Economic Growth”, Quarterly Journal of Economics, 107, pp. 407-437. McMahon W. (1999), Education and Development: Measuring the Social Benefits,
Oxford University Press. Nehru V. and A. Dhareshwar (1993) “A New Database on Physical Capital Stock:
Sources, Methodology and Results” Rivista de Analisis Economico, 8 (1), pp.37-59.
Nickell S. and D. Nicolitsas (1997), “Human Capital Investment and Innovation: what
are the connections?”, CEP Discussion Paper, No372, Centre for Economic Performance, LSE.
OECD (2001), The Well-being of Nations: The Role of Human and Social Capital,
Paris. OECD and Statistics Canada (2000), Literacy in the Information Age, Final Report of
the International Adult Literacy Survey, Paris. Okun A. (1975), Equality and Efficiency: the big trade-off, Brookings Institution,
Washington DC. Otani I. and D. Villanueva (1990), “Long-term Growth in Developing Countries and
its Determinants: An Empirical Analysis”, World Development, 18 (6), pp.769-783.
18
Pesaran M.H. and Y. Shin (1998), “An Autoregressive Distributed Lag Modelling Approach to Cointegration Analysis”, in S. Strom, A. Holly and P. Diamond (eds.), Centennial Volume of Ragnar Frisch, Cambridge University Press.
Pesaran M.H., Y. Shin and R.P. Smith (1999) “Pooled Mean Group Estimation of
Dynamic Heterogeneous Panels” Journal of American Statistical Association, Vol. 94, pp. 621-634.
Pritchett L. (1999), Where Has All the Education Gone?, The World Bank,
Washington D.C. Romer P. (1986) “Increasing Returns and Long Run Growth” Journal of Political
Economy, 94, pp. 1002-1037. Sakellariou C. (2001), “Identifying the External Effects of Human Capital: a two-
stage approach”, Applied Economics Letters, Vol.8, pp.191-194. Sorensen A. (1999), “R&D, Learning and Phases of Economic Growth”, Journal of
Economic Growth, 4 (4), pp.429-445. Steedman H. (1996), “Measuring the Quality of Educational Outputs: A Note”, CEP
Discussion Paper No302, LSE, UK. Storesletten K. and F. Zilibotti (2000), “Education, Education Policy And Growth”,
Swedish Economic Policy Review , 7 , pp.39-70 Temple J. (1999), “ A Positive Effect of Human Capital on Growth” Economics
Letters, 65, pp.131-134. Temple J. (2001), “Growth Effects of Education and Social Capital in the OECD”, in
J.F. Helliwell (ed), The Contribution of Human and Social Capital to Sustained Economic Growth and Well-being: International Symposium Report, Human Resources Development, Canada and OECD.
Turnovsky S (1999), “Economic Growth in Open Economies”, Journal of Economic
Dynamics and Control, 23, pp. 671-673. Walde K. (2000), “Egalitarian and Elitist Education Systems as the Basis for
International Differences in Wage Inequality”, European Journal of Political Economy, 16(3), pp.445-68.
Zolotas X (1977) International Monetary Issues And Development Policies, Bank of
Greece, Athens.
19
Appendix 1: The MG and PMG estimation methods
MG estimation derives the long-run parameters for the panel from an average of the long-run parameters from ARDL models for individual countries. For example, if the ARDL is the following
ititiitiiti ezdxLbyLa ++= )()( (1) for country i, where i=1,….,N, then the long-run parameter for country i is
)1()1(
i
ii d
b=θ (2)
and the MG estimator for the whole panel will be given by
∑=
=N
iiN 1
ˆ1 θθ (3)
It can be shown that MG estimation with sufficiently high lag orders yields super-consistent estimators of the long-run parameters even when the regressors are I(1) (see Pesaran, Shin and Smith, 1999). The PMG method of estimation, introduced by Pesaran, Shin and Smith (1999) occupies an intermediate position between the MG method, in which both the slopes and the intercepts are allowed to differ across country, and the classical fixed effects method, in which the slopes are fixed and the intercepts are allowed to vary. In PMG estimation, only the long-run coefficients are constrained to be the same across countries, while the short-run coefficients are allowed to vary. Setting this out more precisely, the unrestricted specification for the ARDL system of equations for t=1,2,…T time periods and i=1,2,…N countries for the dependent variable y is
it
m
ji
n
jjtiijjtiijit xyy εµδλ ++′+= ∑ ∑
= =−−
1 0,, (4)
where xij is the (k×1) vector of explanatory variables for group i and µi represents the fixed effects. In principle the panel can be unbalanced and m and n may vary across countries. This model can be reparametrised as a VECM system
it
m
ji
n
jjtiijjtiijtiitiiit xyxyy εµγγβθ ++′+∆+′−=∆ ∑ ∑
−
=
−
=−−−−
1
1
1
0,,1,1, )( (5)
where the βI s are the long-run parameters and θi s are the error correction parameters. The pooled group restriction is that the elements of β are common across countries, so that
it
m
ji
n
jjtiijjtiijtitiiit xyxyy εµγγβθ ++′+∆+′−=∆ ∑ ∑
−
=
−
=−−−−
1
1
1
0,,1,1, )( (6)
All the dynamics and the ECM terms are free to vary. Estimation of this model is by maximum likelihood. Again it is proved that under some regularity assumptions, the parameter estimates of this model are consistent and asymptotically normal for both stationary and non-stationary I(1) regressors. Both MG and PMG estimations require selecting the appropriate lag length for the individual country equations. This selection was made using the Schwarz Bayesian Criterion.
20
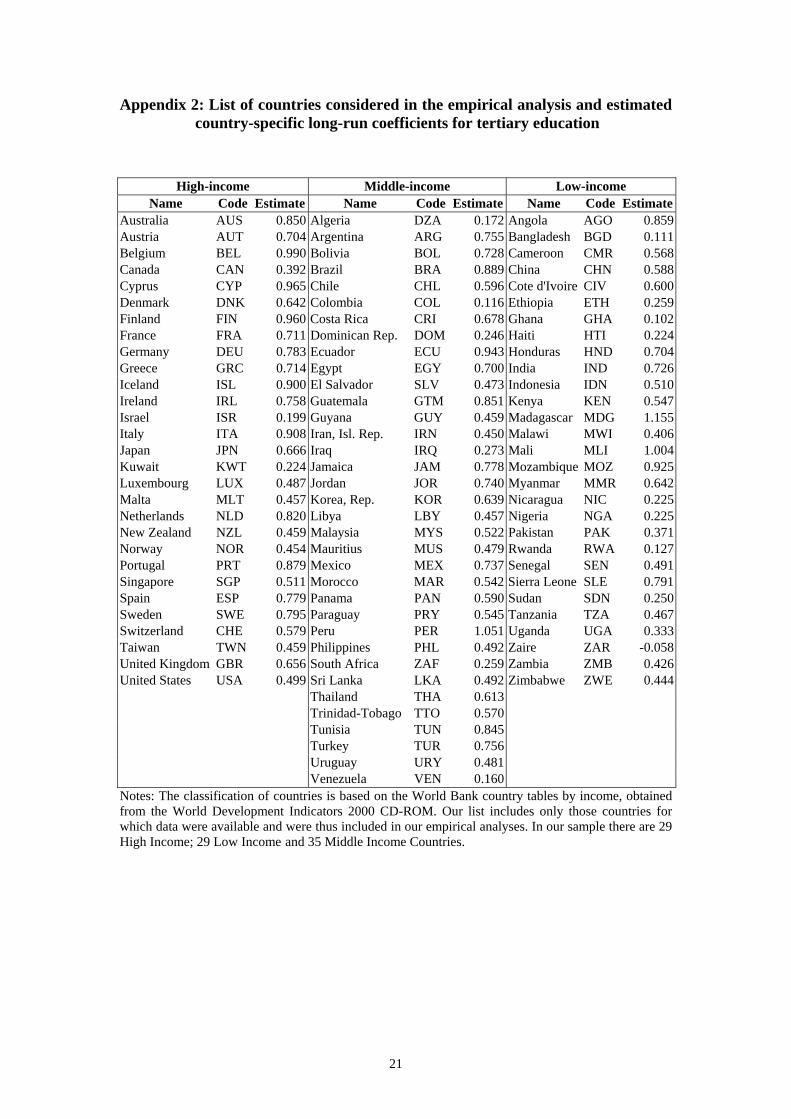
Appendix 2: List of countries considered in the empirical analysis and estimated country-specific long-run coefficients for tertiary education
High-income Middle-income Low-income Name Code Estimate Name Code Estimate Name Code Estimate
Australia AUS 0.850 Algeria DZA 0.172 Angola AGO 0.859Austria AUT 0.704 Argentina ARG 0.755 Bangladesh BGD 0.111Belgium BEL 0.990 Bolivia BOL 0.728 Cameroon CMR 0.568Canada CAN 0.392 Brazil BRA 0.889 China CHN 0.588Cyprus CYP 0.965 Chile CHL 0.596 Cote d'Ivoire CIV 0.600Denmark DNK 0.642 Colombia COL 0.116 Ethiopia ETH 0.259Finland FIN 0.960 Costa Rica CRI 0.678 Ghana GHA 0.102France FRA 0.711 Dominican Rep. DOM 0.246 Haiti HTI 0.224Germany DEU 0.783 Ecuador ECU 0.943 Honduras HND 0.704Greece GRC 0.714 Egypt EGY 0.700 India IND 0.726Iceland ISL 0.900 El Salvador SLV 0.473 Indonesia IDN 0.510Ireland IRL 0.758 Guatemala GTM 0.851 Kenya KEN 0.547Israel ISR 0.199 Guyana GUY 0.459 Madagascar MDG 1.155Italy ITA 0.908 Iran, Isl. Rep. IRN 0.450 Malawi MWI 0.406Japan JPN 0.666 Iraq IRQ 0.273 Mali MLI 1.004Kuwait KWT 0.224 Jamaica JAM 0.778 Mozambique MOZ 0.925Luxembourg LUX 0.487 Jordan JOR 0.740 Myanmar MMR 0.642Malta MLT 0.457 Korea, Rep. KOR 0.639 Nicaragua NIC 0.225Netherlands NLD 0.820 Libya LBY 0.457 Nigeria NGA 0.225New Zealand NZL 0.459 Malaysia MYS 0.522 Pakistan PAK 0.371Norway NOR 0.454 Mauritius MUS 0.479 Rwanda RWA 0.127Portugal PRT 0.879 Mexico MEX 0.737 Senegal SEN 0.491Singapore SGP 0.511 Morocco MAR 0.542 Sierra Leone SLE 0.791Spain ESP 0.779 Panama PAN 0.590 Sudan SDN 0.250Sweden SWE 0.795 Paraguay PRY 0.545 Tanzania TZA 0.467Switzerland CHE 0.579 Peru PER 1.051 Uganda UGA 0.333Taiwan TWN 0.459 Philippines PHL 0.492 Zaire ZAR -0.058United Kingdom GBR 0.656 South Africa ZAF 0.259 Zambia ZMB 0.426United States USA 0.499 Sri Lanka LKA 0.492 Zimbabwe ZWE 0.444
Thailand THA 0.613 Trinidad-Tobago TTO 0.570 Tunisia TUN 0.845 Turkey TUR 0.756 Uruguay URY 0.481 Venezuela VEN 0.160
Notes: The classification of countries is based on the World Bank country tables by income, obtained from the World Development Indicators 2000 CD-ROM. Our list includes only those countries for which data were available and were thus included in our empirical analyses. In our sample there are 29 High Income; 29 Low Income and 35 Middle Income Countries.
21
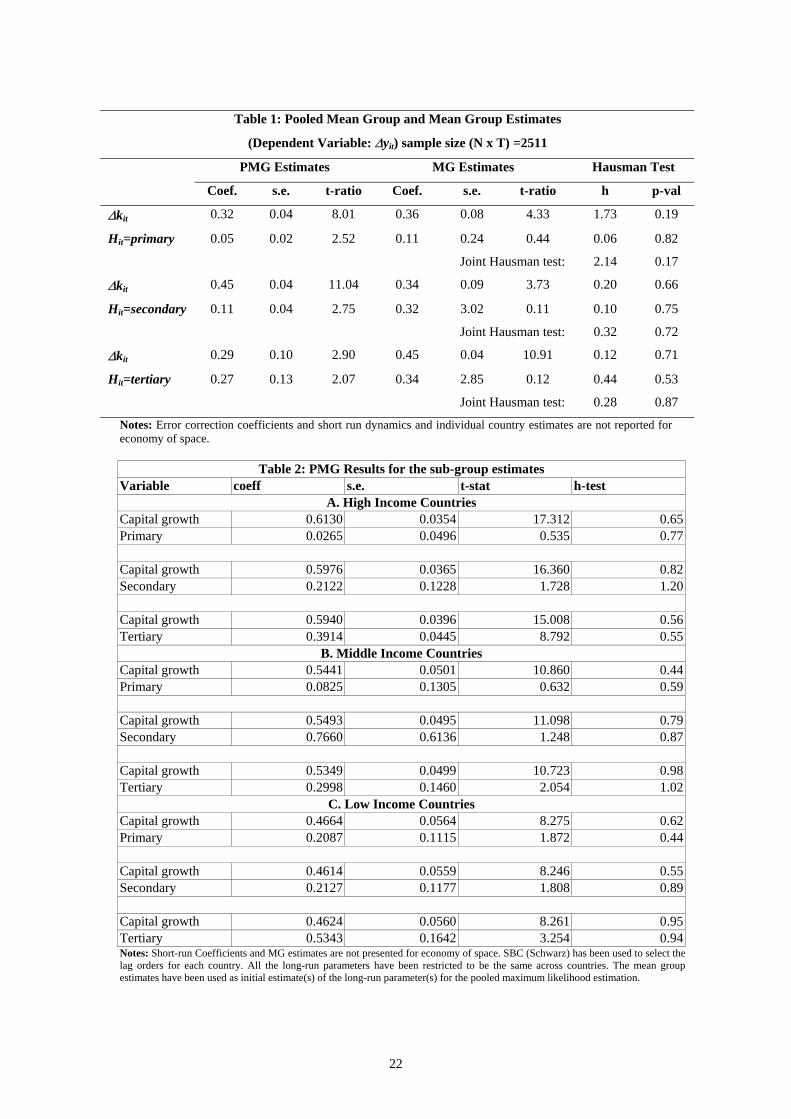
Table 1: Pooled Mean Group and Mean Group Estimates
(Dependent Variable: ∆yit) sample size (N x T) =2511
PMG Estimates MG Estimates Hausman Test
Coef. s.e. t-ratio Coef. s.e. t-ratio h p-val
∆kit 0.32 0.04 8.01 0.36 0.08 4.33 1.73 0.19
Hit=primary 0.05 0.02 2.52 0.11 0.24 0.44 0.06 0.82
Joint Hausman test: 2.14 0.17
∆kit 0.45 0.04 11.04 0.34 0.09 3.73 0.20 0.66
Hit=secondary 0.11 0.04 2.75 0.32 3.02 0.11 0.10 0.75
Joint Hausman test: 0.32 0.72
∆kit 0.29 0.10 2.90 0.45 0.04 10.91 0.12 0.71
Hit=tertiary 0.27 0.13 2.07 0.34 2.85 0.12 0.44 0.53
Joint Hausman test: 0.28 0.87
Notes: Error correction coefficients and short run dynamics and individual country estimates are not reported for economy of space.
Table 2: PMG Results for the sub-group estimates Variable coeff s.e. t-stat h-test
A. High Income Countries Capital growth 0.6130 0.0354 17.312 0.65Primary 0.0265 0.0496 0.535 0.77
Capital growth 0.5976 0.0365 16.360 0.82Secondary 0.2122 0.1228 1.728 1.20
Capital growth 0.5940 0.0396 15.008 0.56Tertiary 0.3914 0.0445 8.792 0.55
B. Middle Income Countries Capital growth 0.5441 0.0501 10.860 0.44Primary 0.0825 0.1305 0.632 0.59
Capital growth 0.5493 0.0495 11.098 0.79Secondary 0.7660 0.6136 1.248 0.87
Capital growth 0.5349 0.0499 10.723 0.98Tertiary 0.2998 0.1460 2.054 1.02
C. Low Income Countries Capital growth 0.4664 0.0564 8.275 0.62Primary 0.2087 0.1115 1.872 0.44
Capital growth 0.4614 0.0559 8.246 0.55Secondary 0.2127 0.1177 1.808 0.89
Capital growth 0.4624 0.0560 8.261 0.95Tertiary 0.5343 0.1642 3.254 0.94Notes: Short-run Coefficients and MG estimates are not presented for economy of space. SBC (Schwarz) has been used to select the lag orders for each country. All the long-run parameters have been restricted to be the same across countries. The mean group estimates have been used as initial estimate(s) of the long-run parameter(s) for the pooled maximum likelihood estimation.
22
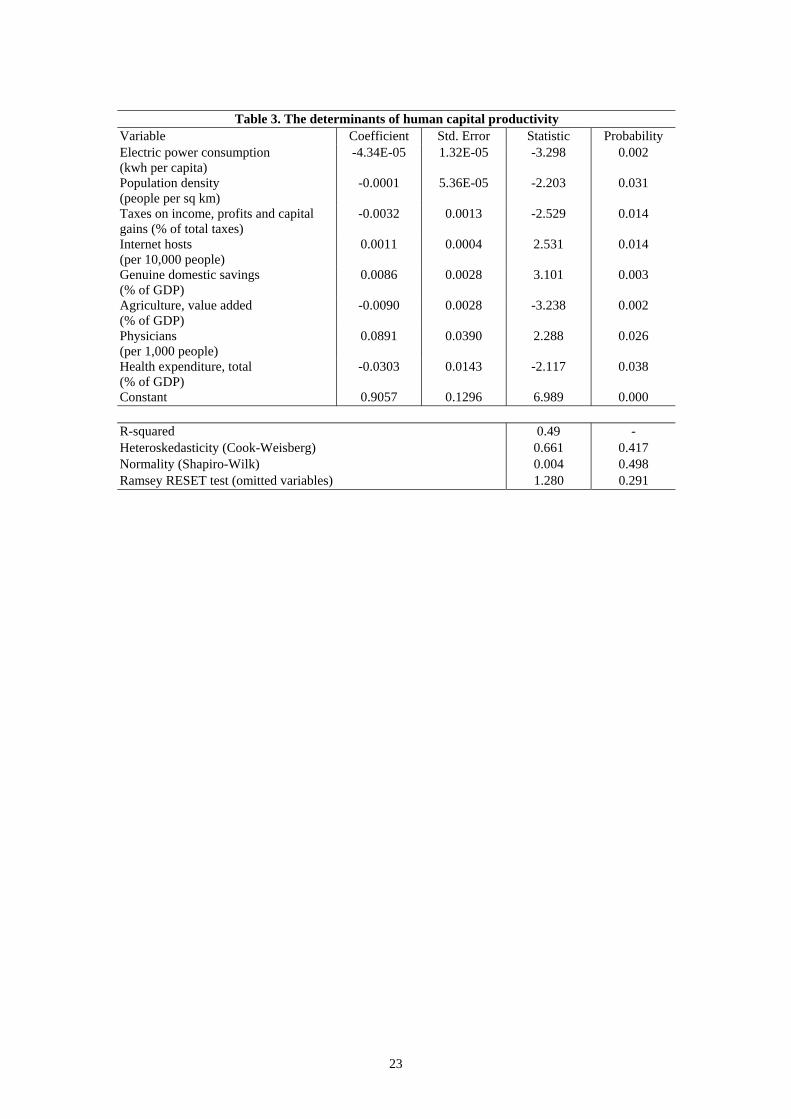
Table 3. The determinants of human capital productivity
Variable Coefficient Std. Error Statistic Probability Electric power consumption (kwh per capita)
-4.34E-05 1.32E-05 -3.298 0.002
Population density (people per sq km)
-0.0001 5.36E-05 -2.203 0.031
Taxes on income, profits and capital gains (% of total taxes)
-0.0032 0.0013 -2.529 0.014
Internet hosts (per 10,000 people)
0.0011 0.0004 2.531 0.014
Genuine domestic savings (% of GDP)
0.0086 0.0028 3.101 0.003
Agriculture, value added (% of GDP)
-0.0090 0.0028 -3.238 0.002
Physicians (per 1,000 people)
0.0891 0.0390 2.288 0.026
Health expenditure, total (% of GDP)
-0.0303 0.0143 -2.117 0.038
Constant 0.9057 0.1296 6.989 0.000
R-squared 0.49 - Heteroskedasticity (Cook-Weisberg) 0.661 0.417 Normality (Shapiro-Wilk) 0.004 0.498 Ramsey RESET test (omitted variables) 1.280 0.291
23