Ground-based network observation of Asian dust events of April 1998 in east Asia
16
Ground-based network observation of Asian dust events of April 1998 in east Asia Toshiyuki Murayama, 1 Nobuo Sugimoto, 2 Itsushi Uno, 3 Kisei Kinoshita, 4 Kazuma Aoki, 5 Naseru Hagiwara, 1 Zhaoyan Liu, 2 Ichiro Matsui, 2 Tetsu Sakai, 6 Takashi Shibata, 6 Kimio Arao, 7 Byung-Ju Sohn, 8 Jae-Gwang Won, 9 Soon-Chang Yoon, 9 Tao Li, 10 Jun Zhou, 10 Huanling Hu, 10 Makoto Abo, 11 Kengo Iokibe, 12 Ryuji Koga, 12 and Yasunobu Iwasaka 6 Abstract. We coordinated a ground-based network that has been in use since 1997 to observe Asian dust during springtime. Huge Asian dust events that occurred in the middle of April 1998 were captured by this network. In this paper we present the organization of the network; a description of the instruments, including the lidar, sky radiometer, and optical particle counter; and the results of the observation, and offer discussions regarding the transport mechanism of Asian dust in east Asia using an on-line tracer model. We discussed the time series of the surface concentration and the height distribution of the dust. A cutoff cyclone generated during the dust episode was responsible for trapping and sedimentation during the transportation of the Asian dust, particularly in the southern parts of China and Japan. Horizontal dust images derived from NOAA/AVHRR clearly revealed the structure of the vortex. The lidar network observation confirmed the general pattern of dust height distribution in this event; the height of the major dust layer was about 3 km over Japan but was higher (4 to 5 km) in Seoul and Hefei. A thin dust layer in the upper troposphere was also commonly observed in Hefei and Japan. Evidence of the coexistence of dust and cirrus was shown by the polarization lidar. The lidar network observation of Asian dust and satellite remote sensing provide key information for the study of the transport mechanism of Asian dust. Further extension of the lidar network toward the interior of the continent and the Pacific Rim would reveal the greater global mechanism of the transportation. 1. Introduction Asian dust is commonly called “yellow sand” in China, Ko- rea, and Japan in their languages of Huang Sha, Hwang Sa, and Kosa. It is a well-known phenomenon during the spring season in east Asia. In fact, Asian dust has been a matter of meteorological concern in east Asia. The transport mechanism and the optical properties of Asian dust have been studied using ground-based instruments such as lidar, a Sun photom- eter, sky radiometer, and an optical particle counter (OPC) in the last two decades [Iwasaka et al., 1983; Kai et al., 1988; Nakajima et al., 1989; Tanaka et al., 1989; Jinhuan and Jinhui, 1994]. Since the dust particles have distinguishable physical and optical properties, including a yellow color (UV absorb- ing), large size, and nonsphericity, it is relatively easy to obtain the signature of Asian dust using ground-based instruments such as lidar and sky radiometers. Asian dust rising from the dust storms that occur in the arid regions at high altitudes (1 to 2 km or more) in China and Mongolia is easily delivered into the free troposphere during the spring by the westerlies. It travels a long distance and sometimes reaches North America beyond the Pacific, as in April 1998. Satellite remote sensors such as the Sea-viewing Wide Field-of-view Sensor (SeaWiFS) and the Total Ozone Mapping Spectrometer (TOMS) revealed daily images of this traveling Asian dust plume [Husar et al., this issue]. Mineral dust plays an important role from a climate study point of view, as do anthropogenic aerosols, especially when we consider the global trend of desertification caused by land development [Sokolik and Toon, 1996; Tegen et al., 1996]. Asian dust has a significant effect on the atmospheric radiation budget because of the large emission amount [Uematsu et al., 1983; Iwasaka et al., 1983]. Thus a systematic study of Asian dust is required to clarify the optical properties related to climate forcing. 1 Department of Physics, Tokyo University of Mercantile Marine, Koto, Tokyo, Japan. 2 Atmospheric Environment Division, National Institute for Envi- ronmental Studies, Tsukuba, Ibaraki, Japan. 3 Research Institute for Applied Mechanics, Kyushu University, Ka- suga, Fukuoka, Japan. 4 Faculty of Education, Kagoshima University, Kagoshima, Japan. 5 Institute of Low Temperature Science, Hokkaido University, Sap- poro, Hokkaido, Japan. 6 Solar-Terrestrial Environment Laboratory, Nagoya University, Chikusa, Nagoya, Aichi, Japan. 7 Faculty of Environmental Studies, Nagasaki University, Nagasaki, Japan. 8 Department of Earth Sciences, Seoul National University, Seoul, Korea. 9 Department of Atmospheric Sciences, Seoul National University, Seoul, Korea. 10 Anhui Institute of Optics and Fine Mechanics, Hefei, Anhui, China. 11 Graduate School of Electrical Engineering, Tokyo Metropolitan University, Tokyo, Japan. 12 Faculty of Engineering, Okayama University, Okayama, Japan. Copyright 2001 by the American Geophysical Union. Paper number 2000JD900554. 0148-0227/01/2000JD900554$09.00 JOURNAL OF GEOPHYSICAL RESEARCH, VOL. 106, NO. D16, PAGES 18,345–18,359, AUGUST 27, 2001 18,345
Transcript of Ground-based network observation of Asian dust events of April 1998 in east Asia

Ground-based network observation of Asian dust eventsof April 1998 in east Asia
Toshiyuki Murayama,1 Nobuo Sugimoto,2 Itsushi Uno,3 Kisei Kinoshita,4
Kazuma Aoki,5 Naseru Hagiwara,1 Zhaoyan Liu,2 Ichiro Matsui,2 Tetsu Sakai,6
Takashi Shibata,6 Kimio Arao,7 Byung-Ju Sohn,8 Jae-Gwang Won,9
Soon-Chang Yoon,9 Tao Li,10 Jun Zhou,10 Huanling Hu,10 Makoto Abo,11
Kengo Iokibe,12 Ryuji Koga,12 and Yasunobu Iwasaka6
Abstract. We coordinated a ground-based network that has been in use since 1997 toobserve Asian dust during springtime. Huge Asian dust events that occurred in the middleof April 1998 were captured by this network. In this paper we present the organization ofthe network; a description of the instruments, including the lidar, sky radiometer, andoptical particle counter; and the results of the observation, and offer discussions regardingthe transport mechanism of Asian dust in east Asia using an on-line tracer model. Wediscussed the time series of the surface concentration and the height distribution of thedust. A cutoff cyclone generated during the dust episode was responsible for trapping andsedimentation during the transportation of the Asian dust, particularly in the southernparts of China and Japan. Horizontal dust images derived from NOAA/AVHRR clearlyrevealed the structure of the vortex. The lidar network observation confirmed the generalpattern of dust height distribution in this event; the height of the major dust layer wasabout 3 km over Japan but was higher (4 to 5 km) in Seoul and Hefei. A thin dust layerin the upper troposphere was also commonly observed in Hefei and Japan. Evidence ofthe coexistence of dust and cirrus was shown by the polarization lidar. The lidar networkobservation of Asian dust and satellite remote sensing provide key information for thestudy of the transport mechanism of Asian dust. Further extension of the lidar networktoward the interior of the continent and the Pacific Rim would reveal the greater globalmechanism of the transportation.
1. Introduction
Asian dust is commonly called “yellow sand” in China, Ko-rea, and Japan in their languages of Huang Sha, Hwang Sa,and Kosa. It is a well-known phenomenon during the springseason in east Asia. In fact, Asian dust has been a matter of
meteorological concern in east Asia. The transport mechanismand the optical properties of Asian dust have been studiedusing ground-based instruments such as lidar, a Sun photom-eter, sky radiometer, and an optical particle counter (OPC) inthe last two decades [Iwasaka et al., 1983; Kai et al., 1988;Nakajima et al., 1989; Tanaka et al., 1989; Jinhuan and Jinhui,1994]. Since the dust particles have distinguishable physicaland optical properties, including a yellow color (UV absorb-ing), large size, and nonsphericity, it is relatively easy to obtainthe signature of Asian dust using ground-based instrumentssuch as lidar and sky radiometers.
Asian dust rising from the dust storms that occur in the aridregions at high altitudes (1 to 2 km or more) in China andMongolia is easily delivered into the free troposphere duringthe spring by the westerlies. It travels a long distance andsometimes reaches North America beyond the Pacific, as inApril 1998. Satellite remote sensors such as the Sea-viewingWide Field-of-view Sensor (SeaWiFS) and the Total OzoneMapping Spectrometer (TOMS) revealed daily images of thistraveling Asian dust plume [Husar et al., this issue]. Mineraldust plays an important role from a climate study point of view,as do anthropogenic aerosols, especially when we consider theglobal trend of desertification caused by land development[Sokolik and Toon, 1996; Tegen et al., 1996]. Asian dust has asignificant effect on the atmospheric radiation budget becauseof the large emission amount [Uematsu et al., 1983; Iwasaka etal., 1983]. Thus a systematic study of Asian dust is required toclarify the optical properties related to climate forcing.
1Department of Physics, Tokyo University of Mercantile Marine,Koto, Tokyo, Japan.
2Atmospheric Environment Division, National Institute for Envi-ronmental Studies, Tsukuba, Ibaraki, Japan.
3Research Institute for Applied Mechanics, Kyushu University, Ka-suga, Fukuoka, Japan.
4Faculty of Education, Kagoshima University, Kagoshima, Japan.5Institute of Low Temperature Science, Hokkaido University, Sap-
poro, Hokkaido, Japan.6Solar-Terrestrial Environment Laboratory, Nagoya University,
Chikusa, Nagoya, Aichi, Japan.7Faculty of Environmental Studies, Nagasaki University, Nagasaki,
Japan.8Department of Earth Sciences, Seoul National University, Seoul,
Korea.9Department of Atmospheric Sciences, Seoul National University,
Seoul, Korea.10Anhui Institute of Optics and Fine Mechanics, Hefei, Anhui,
China.11Graduate School of Electrical Engineering, Tokyo Metropolitan
University, Tokyo, Japan.12Faculty of Engineering, Okayama University, Okayama, Japan.
Copyright 2001 by the American Geophysical Union.
Paper number 2000JD900554.0148-0227/01/2000JD900554$09.00
JOURNAL OF GEOPHYSICAL RESEARCH, VOL. 106, NO. D16, PAGES 18,345–18,359, AUGUST 27, 2001
18,345

A number of ground-based lidars have been operated re-cently in the East Asia region. It is consequently possible toform a network to observe the vertical profiles of aerosols atmultiple locations. This lidar network should provide usefulinformation for studying the transport mechanism of tropo-spheric aerosols, particularly when combined with the satelliteremote sensing data. The combination of a lidar and a skyradiometer and/or a Sun photometer should give complemen-tary and thus quantitative information about the radiativecharacteristics of aerosols in clear daytime. We have beenexchanging information through the Internet (e-mail andWorld Wide Web) during the spring since 1997 from ground-based observations of Asian dust events by lidars, Sun pho-tometers, sky radiometers, and optical particle counters(OPCs) [Murayama et al., 1998]. This seasonal campaign inJapan is currently named LINK-J (Lidar Network for Kosaobservation in Japan). Figure 1 shows the observation sites ofthe lidars, sky radiometers, and OPCs in Japan, Korea, andChina which are described in this paper. Some lidars and skyradiometers observed the same events during the large Asiandust event in April 1998. The recent development of transportmodels and computer resources enables us to simulate how thedust is emitted into the atmosphere and transported. Thetransport models are effective for understanding the phenom-enon over a wide coverage area and for estimating the quan-titative amounts, e.g., total emission of dust, while the exper-imental data are indispensable for validation and for somecalibrations to improve the accuracy of the model.
In this paper we describe the results of ground-based obser-vations in east Asia by lidars, sky radiometers, and OPCs dur-ing Asian dust events in April 1998. We also discuss the data ofsuspended particulate matter (SPM or PM10, defined in sec-tion 3.3) and the dust images derived from NOAA/AVHRR.We compare the results of the observations with the transportmodel.
2. Meteorological ConditionHuge dust storms successively occurred in the mid-April
1998, caused by frontal activity on the Asian continent [Husar
et al., this issue]. The dates of dust storm occurrences at themeteorological stations near the source region are provided inFigure 2. These were read from the weather message(SYNOP); information near the Takla Makan desert region isapparently lacking.
Tanaka [1998] described the relation between the cutoff low(or cutoff cyclone) and the Asian dust during this event usingthe visible satellite image of GMS 5. The cutoff low generatedover the west of Beijing, which had a cold air mass at 2238C at500 hPa on April 16, 1998, moved southwestward, accompa-nied behind by Asian dust. One feature of a cutoff low is itsslow traveling speed. The movement of the cutoff low readfrom the weather map at 500 hPa is indicated in Figure 2. Thecutoff low brought hail to the west of Japan. It disappearedover the Pacific to the east of Japan on April 19, 1998. Ageneral description of a cutoff low is given by Palmen [1951]and Ogura [1993].
As described in section 4.2, not only the cutoff low but alsothe cold front that crossed over Japan brought Asian dust.Asian dust was observed widely in Japan under a high-pressuresystem after the passage of the traveling low. This pattern, i.e.,Asian dust behind a cold front, is often observed for Asian dustevents [Kai et al., 1988; Tanaka et al., 1989].
3. Ground-Based Observations in East AsiaThe importance of international cooperation is increasing in
aerosol studies as demonstrated by the Aerosol Characteriza-tion Experiment (ACE) [Bates et al., 1998]. Since Asian dust isa typical aerosol in the free troposphere in the east Asia regionand a matter of concern to several countries, it is an importantsubject for international cooperative studies. We exchangedinformation on Asian dust among our observation sites for thepresent study. One of the authors, J. Zhou, in Hefei, China,related the occurrence of severe dust storm events on April 17,1998. This announcement triggered observations at Japanesesites in advance of the appearance of Asian dust over Japan.Thus information from regions near the source is very impor-
Figure 1. Location of ground-based observation sites.
Figure 2. Meteorological information during the dust epi-sode of April 1998. The numbers indicate the dates of the duststorm occurrences at the observatories (solid circles). The solidline shows the pass of the cutoff low marked every 12 hours at500 hPa. The dashed circles roughly represent the Takla Ma-kan and Gobi deserts.
MURAYAMA ET AL.: NETWORK OBSERVATION OF ASIAN DUST18,346

tant for network observations, unless the instruments are con-tinuously operated in unattended mode. The Asian dust eventcontinued for an extraordinarily long period in Japan fromApril 18 to 23. In this section we present the data obtained bythe lidars, sky radiometers, and the OPCs in China, Korea, andJapan. The location of the sites and the corresponding instru-ments are listed in Table 1. There is no time difference be-tween Korea and Japan; the LT is nine hours in advance ofUTC in those counties, while the LT in China is eight hours inadvance of UTC.
3.1. Observation by Lidar
The setup and performances of the lidar systems in thenetwork observation differed depending on the site, becausethe lidars had been prepared by the participating organizationsseparately for their own purposes. A common feature of thelidars is the laser wavelengths which are generated by Nd:YAGlasers (355, 532, and 1064 nm) or Nd:YLF lasers (523 nm). Thedetails of each lidar system and the data analysis method arepresented in the references cited below. In this paper we report
the observation results at each site with a visible laser wave-length (532 or 523 nm).
3.1.1. In China. Lidar observations of the stratosphericand tropospheric aerosols have been carried out routinely atthe Anhui Institute of Optics and Fine Mechanics (AIOFM),located 15 km west of Hefei [Hu et al., 1998; Zhou, 1998]. The“L300 lidar” was operated during the Asian dust events ofApril 16 and 18, 1998. The observation wavelength was 532 nm.Profiles of the extinction coefficient were derived with Fer-nald’s method [Fernald, 1984]. The boundary condition wasgiven near the tropopause, and an extinction to backscatterratio (the lidar ratio S1, as defined later) of 50 was used [Zhou,1998]. The vertical extinction profiles obtained on April 16 and18, 1998, are shown in Figure 3 with both linear and logarith-mic scales. The vertical resolution is 30 m. The dust layer wasmainly concentrated in the troposphere lower than 5 km inaltitude, and the extinction coefficient reached 0.5 km21 ormore near ground level. A floating layer that peaked around 3km was commonly seen. Another feature was the presence ofa thin dust layer in the higher troposphere (6 to 10 km), which
Figure 3. Vertical profiles of aerosol extinction coefficient in linear and logarithmic scales on April 16 and18, 1998, over Hefei, China.
Table 1. Ground-Based Observation Sites and Instruments
Site Institute Latitude, Longitude, msl Instruments
Hefei AIOFM. 31.318N, 117.168E, 31m lidarSeoul SNU. 37.468N, 126.658E, 150m lidarAnmyon Do SNU. 36.528N, 126.328E, 47m sky radiometerNagasaki Nagasaki Univ. 32.788N, 129.878E, 16m OPCOkayama Okayama Univ. 34.688N, 133.958E, 7m sky radiometerNagoya Nagoya Univ. 35.158N, 136.978E, 75m lidarTokyo TUMM 35.668N, 139.808E, 3m lidar, sky radiometer
TMU 35.628N, 139.388E, 135m OPCTsukuba NIES 36.058N, 140.128E, 23m lidar, sky radiometerSapporo Hokkaido Univ. 43.088N, 141.348E, 15m sky radiometer
18,347MURAYAMA ET AL.: NETWORK OBSERVATION OF ASIAN DUST

Plate 1. Time-to-height indication (THI) of the range-corrected backscattering intensity (in arbitrary units)obtained by the CML of NIES in Tsukuba during April 15 to 25, 1998. The signals from clouds (white regions)often exceeded the upper scale.
Plate 2. THI of the range-corrected backscattering intensity and the depolarization ratio on April 19–20 and22, 1998, obtained at TUMM in Tokyo. (a) Range-corrected backscattering intensity, (b) depolarization ratio.The black portion gives the values that exceeded the maximum of the scale.
MURAYAMA ET AL.: NETWORK OBSERVATION OF ASIAN DUST18,348

had an extinction coefficient peak of the order of 0.01 km21.This feature will be discussed in section 5.3.
3.1.2. In Korea. Seoul National University (SNU) inSeoul has routinely operated a micropulse lidar (MPL) tomonitor the troposphere [Yoon and Won, 1998]. The MPL is acommercial lidar developed by Spinhirne [1995] and manufac-tured by SES Inc. (Maryland, United States) [Lee et al., 1997].The emitting laser wavelength is 523 nm generated from aNd:YLF laser. The MPL was continuously operated during theperiod of April 18 to 20, 1998, and the Asian dust plume wasobserved [Yoon et al., 1999]. Details of the analytical procedureused to derive the extinction coefficient profiles from the MPLwere described by Yoon and Won [1998]. A typical verticalprofile on April 19, 1998, is shown in Figure 4. The verticalresolution was 30 m. A floating dust layer with a peak around2 km and that spread to 5 km is seen. This structure is similarto the lidar observation in Hefei.
3.1.3. In Japan. Several lidars were operated during theAsian dust event in Japan, including a polarization lidar (532nm) from Okayama University in Okayama (the preliminaryresults of the Okayama lidar were presented in a previousreport [Murayama et al., 1998]), a Raman lidar (355, 532, 1064nm) from the Solar Terrestrial Environmental (STE) Labora-tory of Nagoya University in Nagoya [Shibata et al., 1996], apolarization lidar (532 nm) from Tokyo University of Mercan-tile Marine in Tokyo (TUMM) [Murayama et al., 1999a], and acompact Mie lidar (532 nm)) [Matsui and Sugimoto, 1997] andhigh spectral resolution lidar (HSRL, 532 nm) [Liu et al., 1999]from the National Institute of Environmental Studies (NIES)in Tsukuba. A polarization lidar is a Mie-scattering lidar thatcan measure the polarization properties of backscattering. It isuseful detecting ice phases in clouds [Sassen, 1999] and also fordetecting a dust layer [Kobayashi et al., 1985; Murayama et al.,1998] since the cross-polarized component is sensitive to thenonsphericity of the scatter. A Raman lidar can obtain thewater vapor mixing ratio and aerosol optical properties; watervapor can have a significant effect on the optical properties and
the evolution of aerosols [Ansmann et al., 1992; Whiteman etal., 1992; Sakai et al., 2000]. A HSRL can separately measurethe Mie and Rayleigh backscattering components and thusyield backscattering and extinction coefficients without the as-sumption that is necessary for a conventional Mie lidar analysis[Shipley et al., 1983]. We will first describe some continuouslidar observations of the dust episode and then report onsimultaneous observations in Japan.
The compact Mie lidar (CML) at NIES has been operated ina continuous mode (5 min of data acquisition with 10-minintermissions) through an equipped window on the roof of thelidar container, which enables continuous measurement with-out dependence on weather conditions. The data obtained arevery useful as a comparison with the model prediction sincethere is no interruption of data. Plate 1 shows the time toheight indication (THI) of the range-corrected lidar signal, i.e.,the attenuated backscattering intensity, including the Mie andRayleigh components, obtained by the CML during the Asiandust episode. The overlapping between the field of view of thereceiver and the laser beam (called the overlapping function) isnot complete below a height of about 400 m. The verticalrecording resolution is 7.5 m. The range-corrected backscat-tering in arbitrary units does not have a clear physical meaning.However, it is useful to see the full vertical structure of thetroposphere, including aerosols and clouds, the optical prop-erties of which are so different that it is difficult to treat themin a uniform way. The CML and HRSL at NIES observed theleading edge of the aerosol layer at an altitude of about 6 kmaround 1300 UTC, April 19, 1998. The high concentration ofaerosols was thereafter continuously observed below 3 km untilApril 23, 1998.
TUMM polarization lidar was operated continuously in To-kyo on April 20 and 22, 1998. The lidar has two polarization-diverse telescopes to expand the dynamic range of detection;one is dedicated to short-range detection and the other tolong-range. The overlapping function of the lidar became unityabove 150 m in height in the measurements, and the depolar-ization ratio was usable above 27 m in height. The data acqui-sition time for one profile was 10 min. Plate 2 shows the THIsof the range-corrected backscatter intensity and the depolar-ization ratio. The vertical resolution of the record was 6 m butwas reduced to 18 m above 2 km to improve the signal-to-noiseratio. Here we define the depolarization ratio as the ratio ofthe backscattered signals of the perpendicular to the parallelpolarization of backscattered lights with the emitted linearpolarized laser. These data reveal a higher depolarization ratiothan usual (normally less than several percent) in the lowertroposphere [Murayama et al., 1996], and the dust was mostlybelow 3 km during the dust episode. Another striking featureseen in Plate 2 is the complete negative correlation betweenthe backscattering intensity and the depolarization ratio below2 km, where the dust mixed with boundary layer (urban) aero-sols. This feature was interpreted by the external mixture of thedust with the anthropogenic aerosols. A detailed explanationwill be provided elsewhere.
Simultaneous lidar measurements were performed atNagoya (STE), Tokyo (TUMM), and Tsukuba (NIES) around1230 UTC, April 20, 1998. The scattering ratio, depolarizationratio, and relative humidity are shown in Figure 5 with theradiosonde data obtained at Tateno (Tsukuba) at 1200 UTC.The scattering ratio R( z) at the altitude z is defined as
R~ z! 5 @b1~ z! 1 b2~ z!#/b2~ z! , (1)
Figure 4. Vertical profile of the aerosol extinction coefficienton April 19, 1998, over Seoul, Korea.
18,349MURAYAMA ET AL.: NETWORK OBSERVATION OF ASIAN DUST

where b1 and b2 are the backscattering coefficients by aerosols(subscript 1) and air molecules (subscript 2). The extinctioncoefficient of aerosol s1 is converted to the backscatteringcoefficient of aerosols with the lidar ratio S1, i.e., s1 5 b1 zS1. However, S2 (5s2/b2) for the air-molecule scattering isknown as 8p/3 from the Rayleigh-scattering theory. The back-scattering coefficient b2 is evaluated from the air density pro-files given by the atmospheric model or the radiosonde data.The vertical resolution of the HSRL was 150 m. The data ofthe STE Raman lidar had a vertical resolution of 330 m, whichwas smoothed by taking the running mean of the recorded30-m resolution data to improve the signal-to-noise ratio. Thescattering ratio at TUMM was obtained by Fernald’s methodwith the atmospheric density evaluated from the radiosondedata. Here we assumed the R( z) to be 1.05 at z 5 6 km as theboundary condition, and the extinction coefficient was solveddownward with a uniform lidar ratio S1 of 45. In the depolar-ization ratio at TUMM shown in Figure 5b, 1% was subtractedfrom the raw value to correct the expected offset [Murayama etal., 1999a].
The dust heights obtained by these data were below 3 km,which corresponds to the temperature inversion (Figure 5c).The dust concentration in Nagoya should have been somewhathigher than in the Tokyo region, as indicated by the scatteringratio and depolarization ratio. The humidity obtained by Ra-man lidar shows the proportional behavior of the scatteringratio in this layer. A thin but high depolarizing layer lay be-tween 5.5 and 8.0 km in altitude, which was considered to be athin dust layer and not ice crystals because the relative humid-ity was less than 30%. This is also supported by the moderatetemporal behavior of lidar backscattering from this layer ob-served in Tokyo (Plate 2). We will discuss the role of thishigh-altitude thin dust layer in section 5.2.
3.2. Observation by Sky Radiometer
We used a common sky radiometer in addition to the lidar;the procedure of the data analysis is described below. The skyradiometer was designed by Nakajima et al. [1996] and manu-factured by Prede Co. Ltd. (Tokyo, Japan, model POM-01).The apparatus can measure direct and diffused solar radiationin almucantar mode at several observation wavelengths, e.g.,315, 400, 500, 675, 870, 940, and 1020 nm. The 315 and 940 nmchannels are designed to retrieve the column contents of ozoneand water vapor, respectively. The other channels are used forretrieval of the aerosols. We performed a unified analysis ofthe sky radiometer data using a program developed by Naka-jima et al. [1996]. It is known that the optical thickness and sizedistribution of aerosols are relatively insensitive to the refrac-tive index used in the present analysis and that the forwardscattering is not sensitive to the nonsphericity of the particles[Pollack and Cuzzi, 1980]. Therefore we used normalized ra-diance data from 48 to 308 in scattering angle for the inversionand a fixed refractive index m 5 1.55 2 0.01i as the inputparameter, which is often used for dust-like aerosols [Naka-jima et al., 1989]. We used a ground albedo of 0.1 for all thechannels as the input parameter. The locations of the skyradiometer sites are shown in Figure 1. The sky radiometer wasinstalled at the background-monitoring site in Anmyon Do inKorea, which is an island located off the west coast of theKorean peninsula. In Japan, we used the data obtained atSapporo, Tsukuba, Tokyo, and Okayama.
Figure 6 shows the derived aerosol optical thickness (AOT)at 500 nm and the Angstrom exponent (a) after fitting theempirical formula [Angstrom, 1961] for the AOTs at all theobservation wavelengths during the dust episode. We canclearly see the indication of Asian dust events at all sites; the
Figure 5. Simultaneous lidar observations at Nagoya, Tokyo, and Tsukuba around 1230 UTC April 20, 1998.(a) Scattering ratio at 532 nm, (b) depolarization ratio at 532 nm, and (c) relative humidity. The measurementdurations were 1233 to 1303, 1228 to 1309, and 1205 to 1305 in UTC for Nagoyo, Tokyo, and Tsukuba.Temperature and relative humidity profiles by radiosonde observation at Tateno (Tsukuba) are also indicatedin Figure 5c.
MURAYAMA ET AL.: NETWORK OBSERVATION OF ASIAN DUST18,350

Angstrom exponent became lower than the usual value of 1.5.For example, the rapid increase of Asian dust in the air col-umn, as indicated by a low a and high AOT, is clearly seen inthe Sapporo data on April 20. Figure 7 shows the retrieved
volume size distributions in the air columns for representativecases. We can see that the coarse mode radius commonlylocates around 2 mm. This result is consistent with previousreports on the size of Asian dust in Japan [Arao and Ishizaka,
Figure 6. Aerosol optical thickness at 500 nm (AOT500) and the Angstrom exponent (Alfa) derived fromthe sky radiometers from April 15 to 23, 1998, in Korea and Japan.
18,351MURAYAMA ET AL.: NETWORK OBSERVATION OF ASIAN DUST
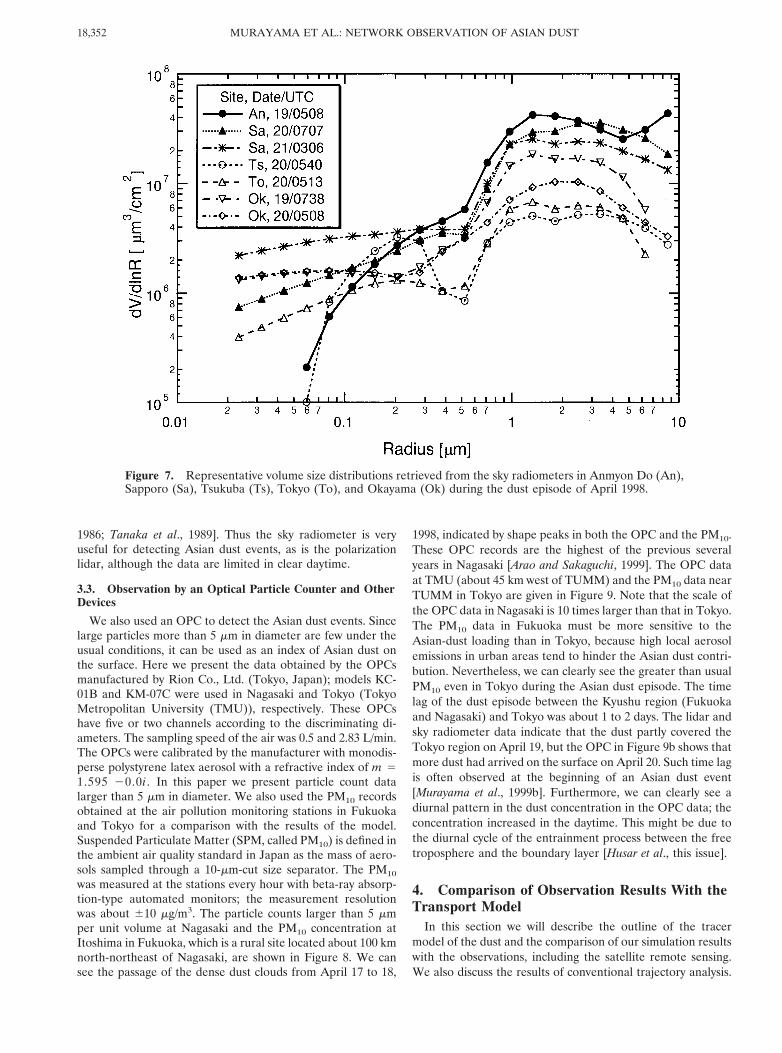
1986; Tanaka et al., 1989]. Thus the sky radiometer is veryuseful for detecting Asian dust events, as is the polarizationlidar, although the data are limited in clear daytime.
3.3. Observation by an Optical Particle Counter and OtherDevices
We also used an OPC to detect the Asian dust events. Sincelarge particles more than 5 mm in diameter are few under theusual conditions, it can be used as an index of Asian dust onthe surface. Here we present the data obtained by the OPCsmanufactured by Rion Co., Ltd. (Tokyo, Japan); models KC-01B and KM-07C were used in Nagasaki and Tokyo (TokyoMetropolitan University (TMU)), respectively. These OPCshave five or two channels according to the discriminating di-ameters. The sampling speed of the air was 0.5 and 2.83 L/min.The OPCs were calibrated by the manufacturer with monodis-perse polystyrene latex aerosol with a refractive index of m 51.595 20.0i . In this paper we present particle count datalarger than 5 mm in diameter. We also used the PM10 recordsobtained at the air pollution monitoring stations in Fukuokaand Tokyo for a comparison with the results of the model.Suspended Particulate Matter (SPM, called PM10) is defined inthe ambient air quality standard in Japan as the mass of aero-sols sampled through a 10-mm-cut size separator. The PM10
was measured at the stations every hour with beta-ray absorp-tion-type automated monitors; the measurement resolutionwas about 610 mg/m3. The particle counts larger than 5 mmper unit volume at Nagasaki and the PM10 concentration atItoshima in Fukuoka, which is a rural site located about 100 kmnorth-northeast of Nagasaki, are shown in Figure 8. We cansee the passage of the dense dust clouds from April 17 to 18,
1998, indicated by shape peaks in both the OPC and the PM10.These OPC records are the highest of the previous severalyears in Nagasaki [Arao and Sakaguchi, 1999]. The OPC dataat TMU (about 45 km west of TUMM) and the PM10 data nearTUMM in Tokyo are given in Figure 9. Note that the scale ofthe OPC data in Nagasaki is 10 times larger than that in Tokyo.The PM10 data in Fukuoka must be more sensitive to theAsian-dust loading than in Tokyo, because high local aerosolemissions in urban areas tend to hinder the Asian dust contri-bution. Nevertheless, we can clearly see the greater than usualPM10 even in Tokyo during the Asian dust episode. The timelag of the dust episode between the Kyushu region (Fukuokaand Nagasaki) and Tokyo was about 1 to 2 days. The lidar andsky radiometer data indicate that the dust partly covered theTokyo region on April 19, but the OPC in Figure 9b shows thatmore dust had arrived on the surface on April 20. Such time lagis often observed at the beginning of an Asian dust event[Murayama et al., 1999b]. Furthermore, we can clearly see adiurnal pattern in the dust concentration in the OPC data; theconcentration increased in the daytime. This might be due tothe diurnal cycle of the entrainment process between the freetroposphere and the boundary layer [Husar et al., this issue].
4. Comparison of Observation Results With theTransport Model
In this section we will describe the outline of the tracermodel of the dust and the comparison of our simulation resultswith the observations, including the satellite remote sensing.We also discuss the results of conventional trajectory analysis.
Figure 7. Representative volume size distributions retrieved from the sky radiometers in Anmyon Do (An),Sapporo (Sa), Tsukuba (Ts), Tokyo (To), and Okayama (Ok) during the dust episode of April 1998.
MURAYAMA ET AL.: NETWORK OBSERVATION OF ASIAN DUST18,352

4.1. Outline of the Model
An on-line tracer model coupled with a Regional Atmo-spheric Modeling System (CSU-RAMS) [Pielke et al., 1992]was developed to study the natural dust and trace gas trans-port. The tracer model was strongly coupled with a compre-hensive meteorological model, since regional meteorologicalconditions such as precipitation, cloud microphysics, and thediurnal cycle of boundary layer turbulence play significant rolesin the advection and diffusion of tracers. The on-line tracermodel was built into the RAMS, and it ran with the same timestep as the RAMS. The dust emission area was the area wherethe Matthews vegetation type [Matthews, 1983] is assigned tothe desert. Most of the Gobi and Takla Makan deserts areindexed as source regions.
We used the dust roll-up scheme proposed by Gillette [1978];that is, the dust mass loading Fdust is defined by
Fdust 5 C~U 2 Utr!U2, (2)
where C is the emission constant, U is the surface wind speed,and Utr is the critical wind speed of the dust roll-up (Utr 5 6.5m/s was used in this study, and Fdust 5 0 if U , Utr). The dustlift-up height (mixed layer) was determined from the verticalprofile of the potential temperature. The RAMS built-in hor-
izontal and vertical advection and turbulent diffusion schemewere used for the dust. The dust dry deposition velocity vg wasdetermined to be vg 5 CDU10, where CD is the bulk-transfercoefficient derived from the RAMS surface-layer scheme, andU10 is the wind speed at a 10 m height. A simple dust washoutscheme as a function of the surface precipitation rate was alsoincluded in the transport model study.
The model study was conducted for the period from April 13to 30, 1998, using four-dimensional data assimilation (4DDA)based on ECMWF global analysis data. A model domain cov-ering all of the China-Korea-Japan area was designed by apolarstereographics coordinated system (centered at 1108E,408N; horizontal grid spacing of 120 km and 60 3 56 gridsystem). The model top was placed at 18 km with a 23 verticalgrids system.
4.2. Comparison Between NOAA/AVHRR Image and ModelCalculation
Satellite images are useful for studying the horizontal exten-sion of Asian dust over land and sea, together with the lidardata, which is valuable for studying the vertical structure. Dur-ing the Asian dust events in mid-April 1998, dense dust abovethe Chinese continent was seen in the visible-band images ofthe GMS-5/VISSR [Murayama et al., 1998] and SeaWiFS as a
Figure 8. (a) PM10 at Fukuoka. (b) The particle countslarger than 5 mm in diameter per liter measured by the OPC atNagasaki during the dust episode of April 1998. The dustconcentrations every 3 hours simulated by the model (dashedcurve) are superposed in Figure 8a.
Figure 9. Same as in Figure 8 except the locations. (a) ThePM10 at Koto (near TUMM) in Tokyo and the simulation(dashed curve). (b) The particle counts larger than 5 mm indiameter per liter by the OPC at TMU in Tokyo.
18,353MURAYAMA ET AL.: NETWORK OBSERVATION OF ASIAN DUST

Plate 3. (a) AVI image of the brightness temperature difference at 1755 UTC, April 17, 1998. (b) Thesimulated column average concentration of dust, wind vector, and potential temperature at an altitude of3000 m at 1800 UTC, April 17, 1998.
Plate 4. Same as Plate 3 except the time. (a) The AVI image at 1733 UTC, April 19, 1998. (b) Thesimulation at 1800 UTC, April 19, 1998. The red region at the left top corner of the simulated column averageconcentration exceeded the maximum scale.
MURAYAMA ET AL.: NETWORK OBSERVATION OF ASIAN DUST18,354

dust storm in a cloud-free area. Transportation of the dusttoward the east, extending and diffusing with time over theYellow Sea, Korea, and the Japanese Islands to the PacificOcean, was detected by means of the brightness temperaturedifference of AVHRR-4 and AVHRR-5 of the NOAA satel-lites [Kinoshita et al., 1999].
The diffused Asian dust in the visible and near-infrared bandimages that reflected the solar radiation in daytime was gen-erally rather vague with a weak signal [Murayama, 1988]. TheSeaWiFS sensor provided improved information with highersensitivity to the aerosol in shorter wavelengths, though carefuldistinction from the effect of the ocean color was required[Fukushima et al., 1999]. In contrast, the split window methodthat shows the differences between the AVHRR-4 andAVHRR-5 channels (10.5 to 11.5 and 11.5 to 12.5 mm) wasfound to be very effective to detect the extension of the Asiandust aerosol with varying density in day and night. The splitwindow method has been utilized to estimate the vaporamount to ascertain the sea surface temperature [Inoue, 1990].There is an opposite emissivity difference of lithic dust andaerosol in the 11 and 12 mm bands against water vapor[Takashima et al., 1987], and this is useful for detecting them[Prata, 1989; Imasu, 1992].
Plates 3a and 4a show two examples of the NOAA/AVHRRimages of Asian dust around Japan. These are the brightnesstemperature differences of channels 4 and 5 in the form of theAerosol Vapor Index (AVI), defined as AVI 5 n(5) 2n(4) 1 200, where a 10-bit value n(i) of thermal infraredband i is related to the brightness temperature t(i) in centi-grade as t(i) 5 250 1 0.1n(i), for i 5 4 and 5. The bright
parts in the gray scale images of the AVI correspond to highAVI domains with dense aerosol, while the dark parts show thedomains of dense vapor above the opaque surface. Very brightdomains with t(4) ,, t(5) were seen above northern Chinaand the Yellow Sea in the images on April 16, 1998 (not shownhere), indicating very dense Asian dust aerosol. In the imagesfrom April 17 and 19, shown in Plates 3a and 4a, the Asian dustwas somewhat diffused compared with previous days. How-ever, its extension over Japan is clearly seen in both images; inPlate 3a, a bright dust domain is seen as a brush stroke sweep-ing over Kyushu Island in western Japan due to the cutoff lowmentioned in section 2, while the Asian dust extends in Plate4a over all of Japan and the Pacific Ocean up to the front linein the southeast corner, which separates the dust-free vapor-rich domain of oceanic atmosphere, as on 18 April (not shownhere). The sequential changes of the Asian event in the AVIimages on these days conform very well to the model calcula-tions. Plates 3b and 4b show the calculated wind vector andpotential temperature at altitude z 5 3000 m and the dustcolumn-averaged concentration (contour) for April 17 and 19,1998, by the model. The cutoff low was observed behind thiscold front (over the main China Plain), and its vortex trappeda huge amount of dust and moved slowly to the east.
4.3. Comparison With Ground-Based Observation
A very severe dust storm was observed on April 14 to 15,1998, at Xinjian Province, China, and the satellite imageclearly captured the onset of this dust front and dust cloud.The daily dust flux simulated in the model indicated that morethan 50% of the total dust emission between April 13 and 23
Plate 5. Time-to-height cross section of the dust concentration and the potential temperature (contour line)over Tokyo given by the model during the dust episode.
18,355MURAYAMA ET AL.: NETWORK OBSERVATION OF ASIAN DUST
occurred within the two days of April 14 and 15. The daily dusttransport simulated by the on-line tracer model clearly re-vealed an eastward traveling strong low-pressure system andcold-frontal line was responsible for this strong dust episode.The model analysis also indicates that it took 3 days to travelfrom the foot of Shandong Peninsula to Tokyo, as mentionedin section 2, and this slow movement of the cutoff vortexagreed with the dust peak time lag observed at several Japa-nese observation sites.
The numerical results were compared with the lidar obser-vations, ground-based PM10 observations, and the OPC data inJapan. The calculated surface dust concentrations at Fukuokaand Tokyo are given in Figures 8 and 9. The peaked concen-tration in Fukuoka and the time lag of the dust episode arereproduced. The sharply peaked dust concentration must havebeen formed by the vortex; there was a banded structure ofdust concentration along the vortex. This tendency was alsoseen in the dust image obtained from NOAA/AVHRR (Plate3a).
A time-to-height cross-section analysis, shown in Plate 5,indicated that (1) a dense dust layer existed at a height below2 to 3 km (within the planetary boundary layer (PBL)), whichagrees well with the lidar observations shown in Plates 1, 2, andFigure 5, and (2) the dust concentration correlated with thepotential temperature variation. A strong descending motionand temperature subsidence on the west side of the cutoffvortex was responsible for the dust episodes in the southernparts of China and Japan. However, the effect seemed to beless in Tokyo because the vortex was getting weaker. A sensi-tivity analysis conducted by introducing the daily independentdust emission (i.e., the daily dust emission is treated as a
different tracer) indicated that the dust episode over Japan wasbrought by the dust emission on April 14 and 15.
4.4. Comparison With Trajectory Model Analysis
We cannot know precisely how the dust was transportedsince the tracer model was an Eulerian analysis. Thus trajec-tory analysis still plays a complementary role to the tracermodel, although we must keep in mind the accuracy limitationsdue to the coarse grid and time intervals of the global dataobtained. We utilized the Trajectory Analysis Model (EORC-TAM) developed by the Earth Observation Research Center(EORC) of the National Space Development Agency of Japan(NASDA) for the analysis [Matsuzono et al., 1998], and EC-MWF global atmospheric data (the resolutions of grid andtime were 2.58 3 2.58 and 12 hours). The second-order Runge-Kutta method was used for the time integral of the differentialequations of particle motion. We can perform both an insen-tropic analysis and an analysis using the vertical wind to tracethe height of an air mass.
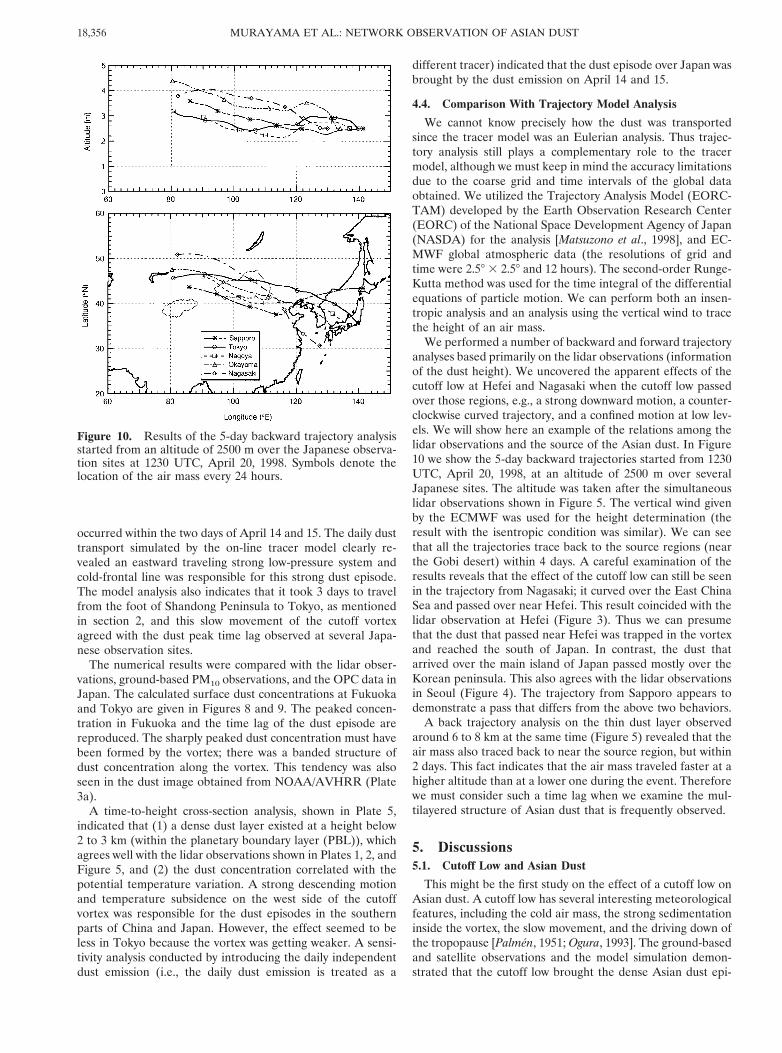
We performed a number of backward and forward trajectoryanalyses based primarily on the lidar observations (informationof the dust height). We uncovered the apparent effects of thecutoff low at Hefei and Nagasaki when the cutoff low passedover those regions, e.g., a strong downward motion, a counter-clockwise curved trajectory, and a confined motion at low lev-els. We will show here an example of the relations among thelidar observations and the source of the Asian dust. In Figure10 we show the 5-day backward trajectories started from 1230UTC, April 20, 1998, at an altitude of 2500 m over severalJapanese sites. The altitude was taken after the simultaneouslidar observations shown in Figure 5. The vertical wind givenby the ECMWF was used for the height determination (theresult with the isentropic condition was similar). We can seethat all the trajectories trace back to the source regions (nearthe Gobi desert) within 4 days. A careful examination of theresults reveals that the effect of the cutoff low can still be seenin the trajectory from Nagasaki; it curved over the East ChinaSea and passed over near Hefei. This result coincided with thelidar observation at Hefei (Figure 3). Thus we can presumethat the dust that passed near Hefei was trapped in the vortexand reached the south of Japan. In contrast, the dust thatarrived over the main island of Japan passed mostly over theKorean peninsula. This also agrees with the lidar observationsin Seoul (Figure 4). The trajectory from Sapporo appears todemonstrate a pass that differs from the above two behaviors.
A back trajectory analysis on the thin dust layer observedaround 6 to 8 km at the same time (Figure 5) revealed that theair mass also traced back to near the source region, but within2 days. This fact indicates that the air mass traveled faster at ahigher altitude than at a lower one during the event. Thereforewe must consider such a time lag when we examine the mul-tilayered structure of Asian dust that is frequently observed.
5. Discussions5.1. Cutoff Low and Asian Dust
This might be the first study on the effect of a cutoff low onAsian dust. A cutoff low has several interesting meteorologicalfeatures, including the cold air mass, the strong sedimentationinside the vortex, the slow movement, and the driving down ofthe tropopause [Palmen, 1951; Ogura, 1993]. The ground-basedand satellite observations and the model simulation demon-strated that the cutoff low brought the dense Asian dust epi-
Figure 10. Results of the 5-day backward trajectory analysisstarted from an altitude of 2500 m over the Japanese observa-tion sites at 1230 UTC, April 20, 1998. Symbols denote thelocation of the air mass every 24 hours.
MURAYAMA ET AL.: NETWORK OBSERVATION OF ASIAN DUST18,356

sode by trapping the dust while it was traveling. The dustheight remained below about 3 km during the episode exceptin the beginning, which was observed by the lidar network inJapan and also appeared in the model calculation. The dustheight observed in Hefei and Seoul was somewhat higher thanin Japan. After dissipation of the cutoff low over the Pacific onApril 19, 1998, the subsequent high-pressure system mighthave continuously brought a downward current, or the dustmight be mainly transported in the PBL from the southwest.The mechanism is complicated and more studies are requiredto clarify it.
5.2. Importance of Ground-Based Network Observations
The Asian dust that occurred in April of 1998 was observedwidely in East Asia. Asian dust events are frequently observedin the southwest of Japan, but heavy dust was observed even inSapporo during the event of April 1998, as indicated by the skyradiometer data (Figure 6). The images of SeaWiFS indicatethat the main part of the Asian dust that reached the WestCoast of the United States passed over the northern part ofSapporo [Husar et al., this issue].
Our study of Asian dust using network operation is in anearly stage. However, it shows promise for understanding thedetails of the transport mechanism of Asian dust using themodel simulation presented here. The present model givescomprehensive information about the dust, including any tem-poral change of the surface concentration, the vertical heightdistribution of the dust at selected sites, and the horizontaldistribution of the column dust concentration. Those elementsare then compared with the ground-based and satellite obser-vations. In a sense, each observation functions as a piece of ajigsaw puzzle of the overall image of the Asian dust. Theobservation and the model generally complement each other.The observation is factual and therefore valuable but limited inspace and time, while the model can cover a wide area andtime series but requires validation by observation. The lidarnetwork is a powerful tool that provides a time-to-height crosssection of the dust concentration in three dimensions, whichthus raises the standards for the model results.
5.3. Role of the Thin Dust Layer in the Upper Atmosphere
The continuous measurement by the polarization lidar atTUMM on April 20 shows that the layer can be traced back toa cirrus cloud from an earlier time (Plate 2). The cirrus anddust apparently coexisted at that time, although the signal-to-noise ratio in the depolarization ratio is too low to discuss thisquantitatively, as shown in Plate 2b. The air temperature wherethe cirrus existed (higher than 9 km in altitude) was below2408C. Cirrus apparently tends to appear at the top region ofa thin dust layer. Sassen [1999] introduced another example ofTUMM polarization lidar data that suggested a dust-cirrusinteraction on March 19, 1998. Thus we can infer that Asiandust acts as the ice nuclei of a cirrus cloud in the uppertroposphere [Isono et al., 1959]. A thin dust layer in the hightroposphere was also seen in the observations of Hefei (Figure3). The peak concentration of the thin dust layer in Hefei wason the same order as the dust layer observed in Japan; that is,the extinction coefficient was of the order of 0.01 km21, whichcan be converted to R 5 1.5 at an altitude of about 8 km withS1 5 50. The partial optical depth integrated from 6 to 12 kmin altitude in Figure 3 was 0.026 and 0.054 for April 16 and 18,1998. The model simulation also indicated an extended distri-bution to the high troposphere as seen in Plate 5. Thus the dust
in the higher troposphere injected by Asian dust events wassmall in optical thickness but would have a significant impacton the Earth’s radiation budget when we consider its role incirrus formation. The cirrus cloud is considered to be a highlyuncertain component of the climate system [e.g., Sassen, 1997].Polarization lidar is quite useful for studying the dust-cirrusinteraction with high temporal resolution.
6. Conclusion and SummaryWe explored a ground-based network observation of Asian
dust in the east Asia region and successfully observed the hugeAsian dust event that occurred in April 1998. The on-linetransport model fairly well reproduced the observations of thevertical distribution of dust obtained by the lidar, the horizon-tal distribution of the dust concentration derived from NOAA/AVHRR, and the surface dust concentration given by OPCand PM10. The simulation and the trajectory analysis led us toconclude that the effect of the cutoff vortex was responsible forthe dust episode, especially in the southern part of Japanduring the early stage. The transport height was below 3 km inthe middle of Japan. The associated subsistence of the poten-tial temperature under the traveling high must have caused thelower dust height, even after dissipation of the vortex into thePacific east of Tokyo on April 19. The dust that passed nearHefei was apparently involved in the vortex. The air mass overKorea might have passed over the southwest of Japan.
We have provided direct evidence by polarization lidar ob-servation that Asian dust interacts with cirrus. “A night with ahazy moon” (Oborozukiyo in Japanese) is used as a springseason word in haiku in Japan. This meteorologically impliesthat optically thin clouds like cirrus appear more often in thespring than in other seasons. Asian dust might have beenenhancing cirrus activity in the spring since ancient times.
The successful ground-based network observations of Asiandust during the spring from 1997 to 1999 should encouragefurther extension of the network toward the inner region of theAsian continent, i.e., near the dust source region and PacificRim regions, to resolve global climate issues.
Acknowledgments. We thank NASDA EORC for utilization of thetrajectory analysis model system. We thank T. Nakajima of the Centerfor Climate System Research (CCSR), University of Tokyo, for pro-viding his skyrad.pack code for the analysis of the sky radiometer data.We also thank the Tokyo metropolitan government and Fukuoka pre-fecture government for providing the PM10 data. We acknowledge theJapan Meteorological Agency for providing the weather chart andaerological data with CD-ROMs. We used the numerical data of theseashore line made by T. Watanabe of the National Research Institutefor Far Seas Fisheries. The source data of NOAA/AVHRR was ob-tained at the receiving station in Kagoshima University. Developmentof the dust transport model was partly supported by Research andDevelopment Applying Advanced Computational Science and Tech-nology of Japan Science and Technology Corporation (ACT-JST). Theresearch activity at TUMM was partly supported by the Grant-in-Aidfor Scientific Research (C) 09640521 by the Ministry of Education,Science, Sports, and Culture and the joint research program of theCenter of Environmental Remote Sensing (CEReS), Chiba University(10-11) and (11-6). The Japan-Korea Basic Scientific Promotion Pro-gram, sponsored jointly by the Japan Society for the Promotion ofSciences (JSPS) and Korea Science and Engineering foundation(KOSEF), in part supported this work.
ReferencesAngstrom, A., Techniques of determining the turbidity of the atmo-
sphere, Tellus, 13, 214–223, 1961.
18,357MURAYAMA ET AL.: NETWORK OBSERVATION OF ASIAN DUST

Ansmann, A., M. Riebesell, U. Wandinger, C. Weitkamp, E. Voss, W.Lahmann, and W. Michaelis, Combined Raman elastic-backscatterLIDAR for vertical profiling of moisture, aerosol extinction, back-scatter, and LIDAR ratio, Appl. Phys., B55, 18–28, 1992.
Arao, K., and Y. Ishizaka, Volume and mass of yellow sand dust in theair over Japan as estimated from atmospheric turbidity, J. Meteorol.Soc. Jpn., 64, 79–94, 1986.
Arao, K., and C. Sakaguchi, Yellow sand events measured by anoptical particle counter at Nagasaki University in 1996–1998 (inJapanese), J. Environ. Stud. Nagasaki University, 1, 175–186, 1999.
Bates, T. S., B. J. Huebert, J. L. Gras, B. Griffiths, and P. A. Durkee,The International Global Atmospheric Chemistry (IGAC) project’sfirst Aerosol Characterization Experiment (ACE 1)—Overview, J.Geophys. Res., 103, 16,297–16,318, 1998.
Fernald, G. F., Analysis of atmospheric lidar observations: Some com-ments, Appl. Opt., 23, 652–653, 1984.
Fukushima, H., T. Ohtake, M. Toratani, I. Uno, and B. J. Sohn,Distribution of Asian dust aerosol around Japan and over the Pacificestimated from the SeaWiFS data in April, 1998 (in Japanese), Conf.Remote Sens. Soc. Jpn., 27, 39–40, 1999.
Gillette, D., A wind tunnel simulation of the erosion of soil: Effect ofsoil texture, sand-blasting, wind speed, and soil consolidation on thedust production, Atmos. Environ., 12, 1735–1743, 1978.
Hu, H., J. Zhou, and Y. Wu, Lidar measurements of stratosphericaerosol over Hefei, China during 1991–1996, Proc. SPIE, vol 3504,184–186, 1998.
Husar, R. B., et al., Asian dust events of April 1998, J. Geophys. Res.,this issue.
Imasu, R., Determination of high concentration area of atmosphericaerosols using 2 channel satellite infrared images (in Japanese),Aerosol Res., 7, 125–134, 1992.
Inoue, T., The relationship of sea surface temperature and water vaporamount to convection over the western tropical Pacific revealedfrom split window measurements, J. Meteorol. Soc. Jpn., 68, 589–606, 1990.
Isono, K., M. Komabayashi, and A. Ono, The nature and origin of icenuclei in the atmosphere, J. Meteorol. Soc. Jpn., 37, 211–233, 1959.
Iwasaka, Y., H. Minoura, and K. Nagaya, The transport and spatialscale of Asian dust-storm clouds: A case study of the dust-stormevent of April 1979, Tellus, 35B, 189–196, 1983.
Iwasaka Y., M. Yamato, R. Imasu, and A. Ono, Transport of Asiandust (KOSA) particles; Importance of weak KOSA events on thegeochemical cycle of soil particles, Tellus, Ser. B, 40, 494–503, 1988.
Jinhuan, Q., and S. Jinhui, Optically remote sensing of the dust stormand the analysis, Chinese J. Atm. Sci., 18, 1–10, 1994.
Kai, K., Y. Okada, O. Uchino, I. Tabata, H. Nakamura, T. Takasugi,and Y. Nikaidou, Lidar observation of a Kosa (Asian dust) overTsukuba, Japan during the spring of 1986, J. Meteorol. Soc. Jpn., 66,457–472, 1988.
Kinoshita, K., M. Nishinosono, T. Yano, N. Iino, and I. Uno, Detectionand analysis of Kosa using NOAA/AVHRR data (in Japanese),Conf. Remote Sens. Soc. Jpn., 26, 253–256, 1999.
Kobayashi, A., S. Hayashida, K. Okada, and Y. Iwasaka, Measure-ments of the polarization properties of KOSA (Asian dust storm)particles by a laser radar in spring 1983, J. Meteorol. Soc. Jpn., 63,144–149, 1985.
Lee, H. S., I. H. Hwang, J. D. Spinhirne, and V. S. Scott, Micropulselidar for aerosol and cloud measurement, in Advances in Atmo-spheric Remote Sensing With Lidar, edited by A. Ansmann, R. Neu-ber, P. Rairoux, and U. Wandinger, pp. 7–10, Springer-Verlag, NewYork, 1997.
Liu, Z., I. Matui, N. Sugimoto, High-spectral-resolution lidar using aniodine absorption filter for atmospheric measurements, Opt. Eng.,38, 1661–1670, 1999.
Matsui, I., and N. Sugimoto, Continuous measurement of troposphericaerosols and clouds with a compact Mie scattering lidar, Tech. Dig.,CLEO/Pacific Rim ’97, Chiba, Japan, 235, 1997.
Matthews, E., Global vegetation and land use: New high-resolutiondata bases for climate studies, J. Clim. Appl. Meteorol., 22, 474–487,1983.
Matuzono, T., T. Sano, and T. Ogawa, Development of the trajectoryanalysis model (EORC-TAM), EORC Techn. Rep., 1, 55–68, 1998.
Murayama, N., Dust cloud “Kosa” from the east Asian dust storms in1982–1988 as observed by the GMS satellite, Meteorol. Satell. Cent.Tech Note, 17, 1–8, 1988.
Murayama, T., M. Furushima, A. Oda, N. Iwasaka, and K. Kai, De-
polarization ratio measurements in the atmospheric boundary layerby lidar in Tokyo, J. Meteorol. Soc. Jpn., 74, 571–578, 1996.
Murayama, T., et al., Lidar network observation of Asian dust (Asiandust) in Japan, Proc. SPIE, 3504, 8–15, 1998.
Murayama, T., H. Okamoto, N. Kaneyasu, H. Kamataki, and K. Miura,Application of lidar depolarization measurement in the atmosphericboundary layer: Effects of dust and sea-salt particles, J. Geophys.Res., 104, 31,781–31,792, 1999a.
Murayama, T., et al., Lidar network observation of Asian dust overJapan in 1999 Spring (abstract), Int. Laser Sens. Symp., 20th, 29–32,1999b.
Nakajima, T., M. Tanaka, M. Yamano, M. Shiobara, K. Arao, Y.Nakanishi, Aerosol optical characteristics in the yellow sand eventsobserved in May, 1982 at Nagasaki, part II, Models, J. Meteorol. Soc.Jpn., 67, 269–291, 1989.
Nakajima, T., G. Tonna, R. Rao, P. Boi, Y. Kaufman, and B. Holben,Use of sky brightness measurements from ground for remote sensingof particulate polydispersions, Appl. Opt., 35, 2672–2686, 1996.
Niimura, N., K. Okada, X. B. Fan, K. Kai, K. Arao, G. Y. Shi, and S.Takahashi, Formation of Asian dust-storm particles mixed internallywith sea salt in the atmosphere, J. Meteorol. Soc. Jpn., 76, 275–288,1998.
Ogura, Y., Kminari to seturi-teikiatsu (in Japanese), Kisho, 37(6),32–35, 1993.
Palmen, E., The aerology of extratropical disturbances, in Compen-dium of Meteorology, edited by T. F. Malone, pp. 599–620, Am.Meteorol. Soc., Boston, Mass., 1951.
Pielke, R. A., et al., A comprehensive meteorological modeling sys-tem—RAMS, Meteorol. Atmos. Phys., 49, 69–91, 1992.
Pollack, J. B., and J. N. Cuzzi, Scattering by nonspherical particle sizecomparable to a wavelength: A new semi-empirical theory and itsapplication to tropospheric aerosols, J. Atmos. Sci., 37, 868–881,1980.
Prata, A. J., Observations of volcanic ash clouds in the 10–12 micro inwindow using AVHRR/2 data, Int. J. Remote Sens., 10, 751–761,1989.
Sakai, T. T. Shibata, S. A. Kwon, Y. S. Kim, K. Tamura, and Y.Iwasaka, Free tropospheric aerosol backscatter, depolarization ra-tio, and relative humidity measured with the Raman lidar at Nagoyain 1994–1997: Contributions of aerosols from the Asian continentand Pacific Ocean, Atmos. Environ., 34, 431–442, 2000.
Sassen, K., Contrail-cirrus and their potential for regional climatechange, Bull. Am. Meteorol. Soc., 78, 1885–1903, 1997.
Sassen, K., The lidar backscatter depolarization technique for cloudand aerosol research in Light Scattering by Nonspherical Particles:Theory, Measurements, and Geophysical Applications, edited by M. L.Mishchenko, J. W. Hovenier, and L. D. Travis, pp. 393–416, Aca-demic, San Diego, Calif., 1999.
Shibata, T., T. Sakai, M. Hayashi, T. Ojio, S. A. Kwon, and Y. Iwasaka,Raman lidar observations: Simultaneous measurements of watervapor, temperature and aerosol vertical profiles, part I, J. Geomagn.Geoelectr., 48, 1127–1135, 1996.
Shipley, S. T., D. H. Tracy, E. W. Eloranta, J. T. Trauger, J. T. Sroga,F. L. Roesler, and J. A. Weinman, High spectral resolution lidar tomeasure optical scattering properties of atmospheric aerosols, 1,Theory and instrumentation, Appl. Opt., 22, 3716–3724, 1983.
Sokolik, I. N., and O. B. Toon, Direct radiative forcing by anthropo-genic airborne mineral aerosols, Nature, 381, 681–683, 1996.
Spinherne, J. D., Compact eye safe lidar systems, Rev. Laser Eng., 23,112–118, 1995.
Takashima, T., and K. Masuda, Emissivity of quartz and Sahara dustpowders in the infrared region (7–17 mm), Remote Sens. Environ., 23,51–63, 1987.
Tanaka, M., M. Shiobara, T. Nakajima, M. Yamano, and K. Arao,Aerosol optical characteristics in the yellow sand events observed inMay, 1982 at Nagasaki, part I, Observations, J. Meteorol. Soc. Jpn.,67, 267–278, 1989.
Tanaka, T., Kannreiuzu to Kosa (in Japanese), Kisho, 42, 6, 20–21,1998.
Tegen, I., A. A. Lacis, and I. Fung, The influence on climate forcing ofmineral aerosols from disturbed soils, Nature, 380, 419–422, 1996.
Uematsu, M., R. A. Duce, J. M. Prospero, L. Chen, J. T. Merrill, andR. L. McDonald, Transport of mineral aerosol from Asia over theNorth Pacific Ocean, J. Geophys. Res., 88, 5343–5352, 1983.
Yoon, S. C., and J. G. Won, Monitoring of atmospheric aerosols in
MURAYAMA ET AL.: NETWORK OBSERVATION OF ASIAN DUST18,358

Seoul using a micropulse lidar, in 19th International Laser RadarConference, NASA/CP-1998-207671/PT1, pp. 83–85, 1998.
Whiteman, D. N., S. H. Melfi, and R. A. Ferrare, Raman lidar systemfor the measurement of water vapor and aerosols in the Earth’satmosphere, Appl. Opt., 31, 3068–3082, 1992.
Yoon, S. C., J. G. Jhun, and J. G. Won, Aerosol and yellow-sandmonitoring with a micropulse lidar in Seoul, Tech. Dig., CLEO/Pacific Rim ’99, Seoul, Korea, 1054–1055, 1999.
Zhou, J., Optical properties of tropospheric aerosols derived fromlidar measurements over Hefei, Proc. SPIE, 3501, 112–117, 1998.
N. Hagiwara and T. Murayama, Department of Physics, Tokyo Uni-versity of Mercantile Marine, 2-1-6 Etchujima, Koto, Tokyo, Japan.([email protected])
Z. Liu, I. Matsui, and N. Sugimoto, Atmospheric Environment Di-vision, National Institute for Environmental Studies, Tsukuba, Ibaraki,Japan.
I. Uno, Research Institute for Applied Mechanics, Kyushu Univer-sity, Kasuga, Fukuoka, Japan.
K. Kinoshita, Faculty of Education, Kagoshima University, Ka-goshima, Japan.
K. Aoki, Institute of Low Temperature Science, Hokkaido Univer-sity, Sapporo, Hokkaido, Japan.
Y. Iwasaka, T. Sakai, and T. Shibata, Solar-Terrestrial EnvironmentLaboratory, Nagoya University, Chikusa, Nagoya, Aichi, Japan.
K. Arao, Faculty of Environmental Studies, Nagasaki University,Nagasaki, Japan.
B.-J. Sohn, Department of Earth Sciences, Seoul National Univer-sity, Seoul, Korea.
J.-G. Won and S.-C. Yoon, Department of Atmospheric Sciences,Seoul National University, Seoul, Korea.
H. Hu, T. Li, and J. Zhou, Anhui Institute of Optics and FineMechanics, Hefei, Anhui, China.
M. Abo, Graduate School of Electrical Engineering, Tokyo Metro-politan University, Tokyo, Japan.
K. Iokibe and R. Koga, Faculty of Engineering, Okayama Univer-sity, Okayama, Japan.
(Received January 27, 2000; revised August 10, 2000;accepted August 29, 2000.)
18,359MURAYAMA ET AL.: NETWORK OBSERVATION OF ASIAN DUST

18,360