Kone Annual Report 1998
52
Annual Report 1998
-
Upload
khangminh22 -
Category
Documents
-
view
0 -
download
0
Transcript of Kone Annual Report 1998

Annual Report 1998
List of Contents350
300
250
200
150
100
50
During the spring, KONE built the
world’s longest elevator test shaft and
a high-rise elevator laboratory in the
former service shaft of a limestone
mine in Lohja, Finland. The shaft
extends 333 meters into the ground,
making it possible to test elevators for
250-500 meter tall buildings under
conditions that correspond closely to
those in actual installations.
1 Highlights
2 Company Profile
3 Board of Directors and Auditors
4 Corporate Senior Management
5 Message from the President
6 Review by Market Area
13 Report on Operations
21 Sales and Personnel by Country
22 Accounting Principles
23 Consolidated Statement of Income
24 Consolidated Balance Sheet
26 Consolidated Statement of Cash Flows
27 Notes on the ConsolidatedFinancial Statement
30 Five-year Summary in Figures 1994-1998
31 Parent Company: Statement of Income
32 Parent Company: Balance Sheet
34 Parent Company: Statement of Cash Flows
35 Notes on the Parent CompanyFinancial Statement
39 Calculation of Key Figures
40 Board of Directors’ Proposal to theAnnual General Meeting
40 Auditors’ Report
41 Consolidated Income Statement andBalance Sheet in Euros
42 Parent Company Shares and Shareholders
44 Remote Monitoring Eliminates Guessworkin Maintenance
46 Addresses
49 To Parent Company Shareholders
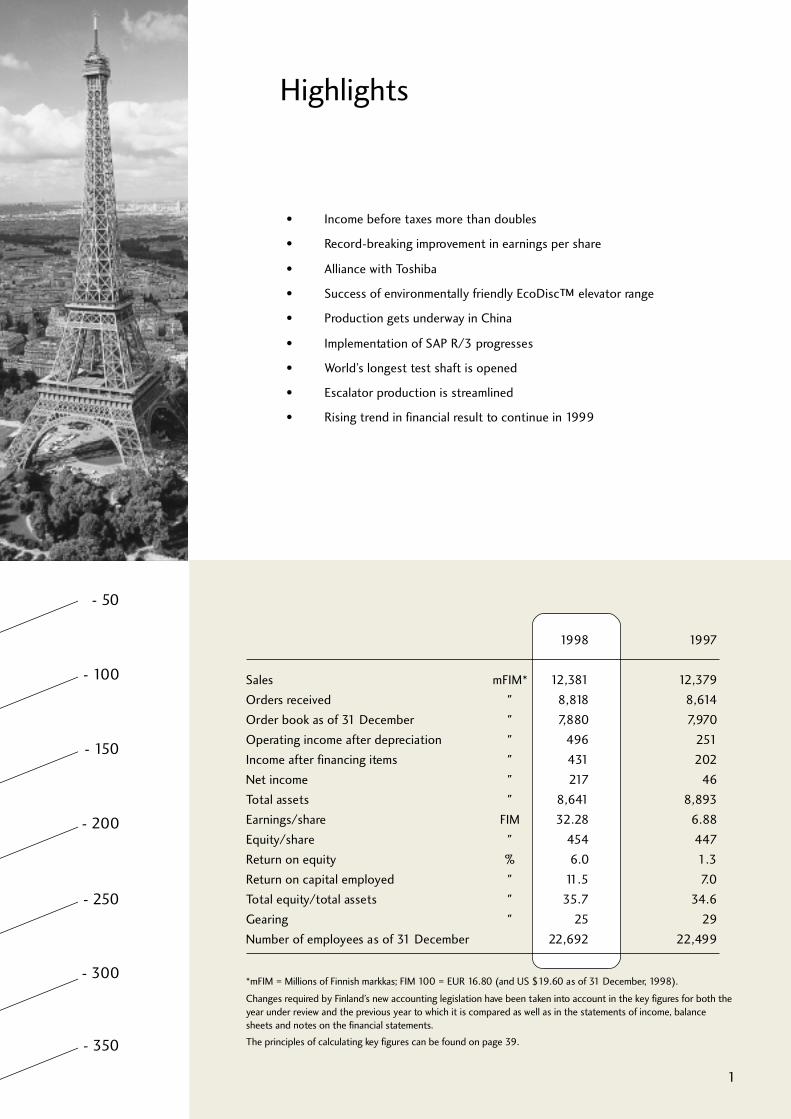
Highlights
• Income before taxes more than doubles
• Record-breaking improvement in earnings per share
• Alliance with Toshiba
• Success of environmentally friendly EcoDisc™ elevator range
• Production gets underway in China
• Implementation of SAP R/3 progresses
• World’s longest test shaft is opened
• Escalator production is streamlined
• Rising trend in financial result to continue in 1999
- 50
- 100
- 150
- 200
- 250
- 300
- 350
1
1998 1997
Sales mFIM* 12,381 12,379Orders received " 8,818 8,614Order book as of 31 December " 7,880 7,970Operating income after depreciation " 496 251Income after financing items " 431 202Net income " 217 46Total assets " 8,641 8,893Earnings/share FIM 32.28 6.88Equity/share " 454 447Return on equity % 6.0 1.3Return on capital employed " 11.5 7.0Total equity/total assets " 35.7 34.6Gearing " 25 29Number of employees as of 31 December 22,692 22,499
*mFIM = Millions of Finnish markkas; FIM 100 = EUR 16.80 (and US $19.60 as of 31 December, 1998).
Changes required by Finland’s new accounting legislation have been taken into account in the key figures for both theyear under review and the previous year to which it is compared as well as in the statements of income, balancesheets and notes on the financial statements.
The principles of calculating key figures can be found on page 39.
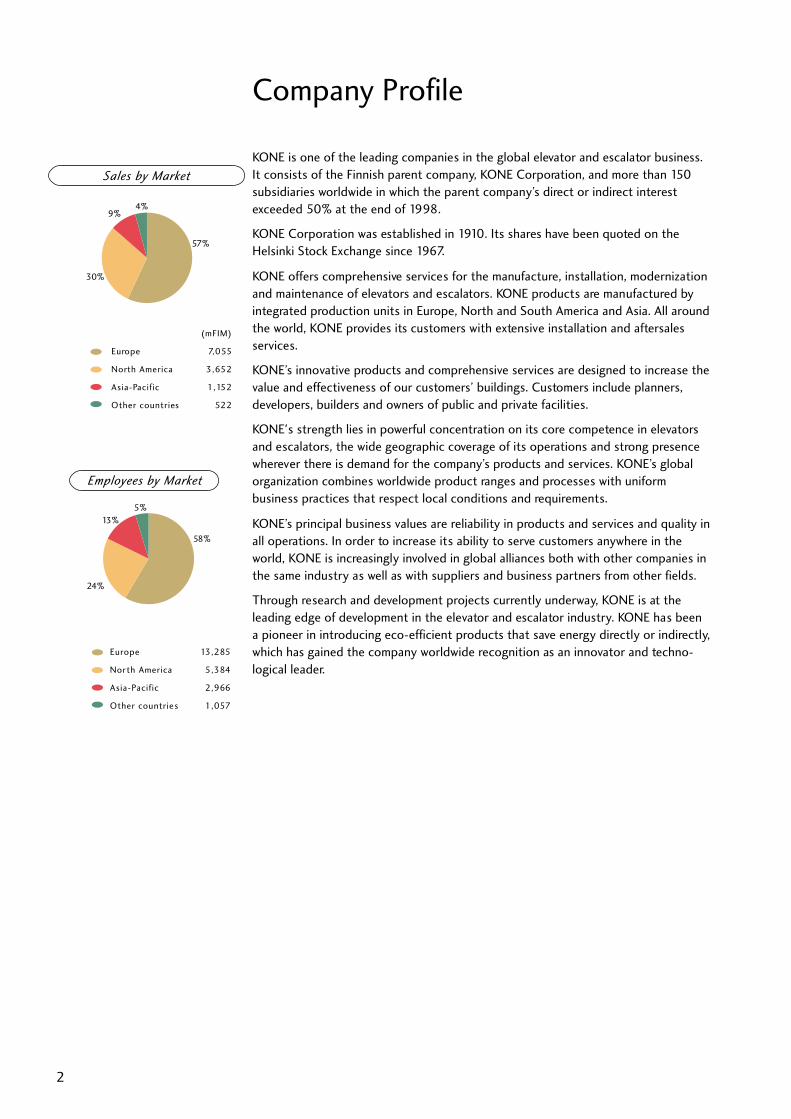
Company Profile
Sales by Market
(mFIM)
Europe 7,055
North America 3,652
Asia-Pacific 1,152
Other countries 522
Employees by Market
Europe 13,285
North America 5,384
Asia-Pacific 2,966
Other countries 1,057
2
57%
30%
9%4%
58%
24%
13%5%
KONE is one of the leading companies in the global elevator and escalator business.It consists of the Finnish parent company, KONE Corporation, and more than 150subsidiaries worldwide in which the parent company’s direct or indirect interestexceeded 50% at the end of 1998.
KONE Corporation was established in 1910. Its shares have been quoted on theHelsinki Stock Exchange since 1967.
KONE offers comprehensive services for the manufacture, installation, modernizationand maintenance of elevators and escalators. KONE products are manufactured byintegrated production units in Europe, North and South America and Asia. All aroundthe world, KONE provides its customers with extensive installation and aftersalesservices.
KONE’s innovative products and comprehensive services are designed to increase thevalue and effectiveness of our customers’ buildings. Customers include planners,developers, builders and owners of public and private facilities.
KONE's strength lies in powerful concentration on its core competence in elevatorsand escalators, the wide geographic coverage of its operations and strong presencewherever there is demand for the company’s products and services. KONE’s globalorganization combines worldwide product ranges and processes with uniformbusiness practices that respect local conditions and requirements.
KONE’s principal business values are reliability in products and services and quality inall operations. In order to increase its ability to serve customers anywhere in theworld, KONE is increasingly involved in global alliances both with other companies inthe same industry as well as with suppliers and business partners from other fields.
Through research and development projects currently underway, KONE is at theleading edge of development in the elevator and escalator industry. KONE has beena pioneer in introducing eco-efficient products that save energy directly or indirectly,which has gained the company worldwide recognition as an innovator and techno-logical leader.
3
Permanent Committees
The Board of Directors has created two permanent committees. Deputy Boardchairman Antti Herlin serves as chairman of both committees, and Board secretaryTapio Hakakari serves as secretary. During the year under review the committees metseveral times.
The Audit Committee directs and supervises KONE’s internal auditing. In addition tothe chairman and secretary, KONE Corporation’s auditor, Liisa Mononen sits on theAudit Committee. Director of Internal audit Urpo Paasovaara reports on audit resultsto the committee.
The Executive Resources Committee includes the chairman, secretary, consultant UrpoKauranne and quality director Helena Terho. Board chairman Pekka Herlin alsoparticipates in the committee’s work. The committee’s responsibilities include makingdecisions about senior management appointments and compensation.
Pekka Herlin, 66
D.Sc. (Econ.) H.C.Chairman, July 1996-Chairman & CEO, 1987-June 1996President & CEO, 1964-1986Member of the Board, 1954-
Antti Herlin, 42
Deputy Chairman & CEO, July 1996-Member of the Board, 1991-
Board of Directors and Auditors
Auditors
Liisa Mononen,Authorized Public AccountantSVH PriceWaterhouseCoopers Oy,Authorized Public Accountants
Deputies
Antti Helenius,Authorized Public AccountantTauno Haataja,Authorized Public Accountant
Ilkka Herlin, 40
Ph.D.Member of the Board, 1990-
Gerhard Wendt, 64
Ph.D.President 1989-1994Member of the Board, 1979-
Iiro Viinanen, 55
President, Chairman of the Boards,Pohjola Insurance CompanyMember of the Board, 1997-
Anssi Soila, 49
President,1995-2 Feb. 1999Deputy Member of the Board, 1995-
Pekka Herl in I lkka Herl in I iro Vi inanen
Gerhard WendtAntti Herl in
Dr. Gerhard Crommeresigned from the Boardof Directors as of 3 June,1998.
Corporate Senior Management
4
Jean-Pierre Chauvarie
President
J-P. Chauvarie
Europe
Heimo Mäkinen
Americas
Neil Padden
Asia-Pacific
Lauri Björklund
Sourcing & Manufacturing
Klaus Cawén
General Counsel &Acquisitions
Michel Chartron
Service Business
Jussi Itävuori
Human Resources &Communication
Raine-Peter Joutsen
New Elevator Business
Pekka Kemppainen
Technology
Heiko Körnich
Escalator Business
Trevor Nink
Business Development & IT
Aimo Rajahalme
Finance
Helena Terho
Quality
(l-r): Kemppainen, Rajahalme, Björklund, Nink, Cawén, Joutsen, Padden, Mäkinen,Körnich, Terho, Char tron, Chauvarie ja Itävuori
Jean-Pierre ChauvariePresident
5
Message from the President
Companies throughout the world are experiencing a period of tremendous change.The pace of globalization of the world’s economies is accelerating, with the resultthat competitive conditions are becoming increasingly open. This development isaffecting not only us but our customer base. Through continuous renewal, we mustfind to respond innovatively to our customers’ changing requirements.
In the spring of 1996 we were the first company to introduce revolutionary machine-room-less MonoSpace® elevators. Now the machine-room-less elevator is rapidlybecoming a new standard for the elevator industry. During 1998 we extended theapplication of our space-and energy-saving EcoDisc™ hoisting machine solution tolarger and faster elevators for the worldwide market.
During 1998 we continued the process of integrating the best features of theproducts and processes of our two escalator manufacturing companies, Germany’sO&K Rolltreppen and Montgomery KONE of the United States. Our first completelyglobal product’s introduction to the market is linked to this development project.
We continued to streamline our delivery processes and develop our maintenanceconcepts. Tailored, performance-based maintenance contracts represent a signifi-cant step forward. Remote monitoring linked to state-of-the-art data transmissionmakes it possible to monitor individual elevator performance in real time andrespond with appropriately focused maintenance measures.
Our most significant development project in progress is the harmonization of centralbusiness processes. We are implementing the standardization of systems, processes,tools and business practices throughout our organization.
In addition to harmonizing and streamlining our own operations and tightening ourglobal organization, we continued during 1998 to expand the collaboration we hadbegun with Japan’s Toshiba. The agreement concerning our MonoSpace® elevatorshas led to this innovation’s rapid breakthrough in the Japanese market. Developmentprojects currently underway will deepen and expand the alliance between KONE andToshiba.
After producing a financial result in 1997 that was slightly better than that for 1996,we more than doubled our result in 1998. We opened a new factory in Kunshan,China and built the world’s longest high-speed elevator test shaft and laboratory. Weare better prepared than ever to confront our competitors on the global market.Now we are also prepared to create a strong international image for the KONEbrand.
I would like to take this opportunity to thank KONE’s employees all over the worldfor work well done which enabled us to reach the targets we set for ourselves in1998. We did so despite instability in several important markets and under condi-tions in which major changes in our processes and procedures placed great demandson our personnel and financial resources. By the time the new millennium is upon us,most of these changes will have been completed, and our company will be strongerthan ever.
Jean-Pierre ChauvariePresident
6
Review by Market AreaEurope
During 1998 the European Union was an island of economic stability in a turbulentworld buffeted by the Asian crisis, the collapse of the Russian economy, and difficul-ties in Latin America.
In Euroland, currency exchange rates remained exceptionally stable. Interest ratescontinued to fall, reaching a historically low level at the end of the year. This trendreflected the prevailing confidence in the European economy and its new commoncurrency, the euro.
New elevator and escalator demand remained at approximately the previous year’ssatisfactory level. In some countries, such as the United Kingdom, Spain, the Nether-lands, and Finland, demand increased in 1998. Deliveries of elevators and escalatorswere slightly above the 1997 levels.
KONE’s machine-room-less MonoSpace® elevator, introduced to European marketsduring 1996, continued to conquer new markets. The sales figures for the newEcoDisc™ elevators - now available in all European countries - surpassed the 5000mark in 1998. In just two years the MonoSpace® concept has already become thestandard against which the latest generation of elevators is measured.
During the year under review, the range of applications for EcoDisc™ hoisting-machine technology was expanded to include larger elevators and applications fortaller buildings. Although the EcoDisc™ hoisting machines required for such
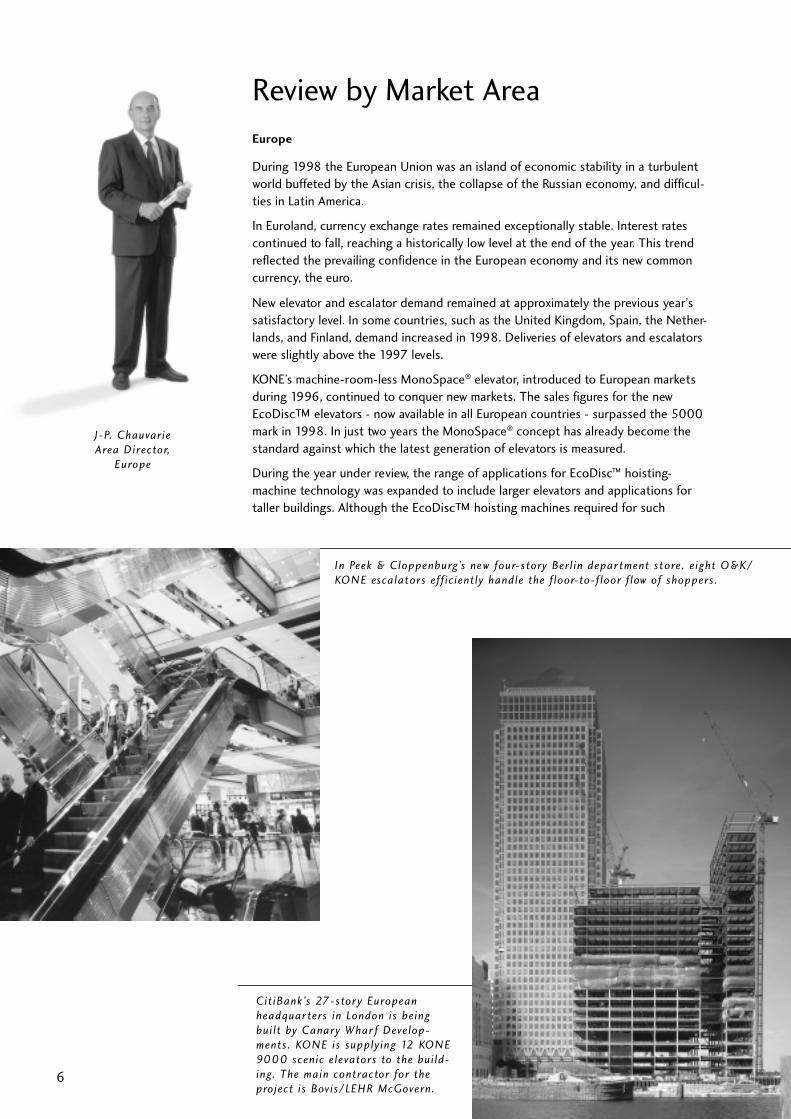
In Peek & Cloppenburg’s new four-story Berl in depar tment store, e ight O&K/KONE escalators eff ic iently handle the f loor-to-f loor f low of shoppers.
Cit iBank’s 27-stor y Europeanheadquar ters in London is beingbui lt by Canary Whar f Develop-ments. KONE is supplying 12 KONE9000 scenic elevators to the bui ld-ing. The main contractor for theproject is Bovis/LEHR McGovern.
J-P. ChauvarieArea Director,
Europe
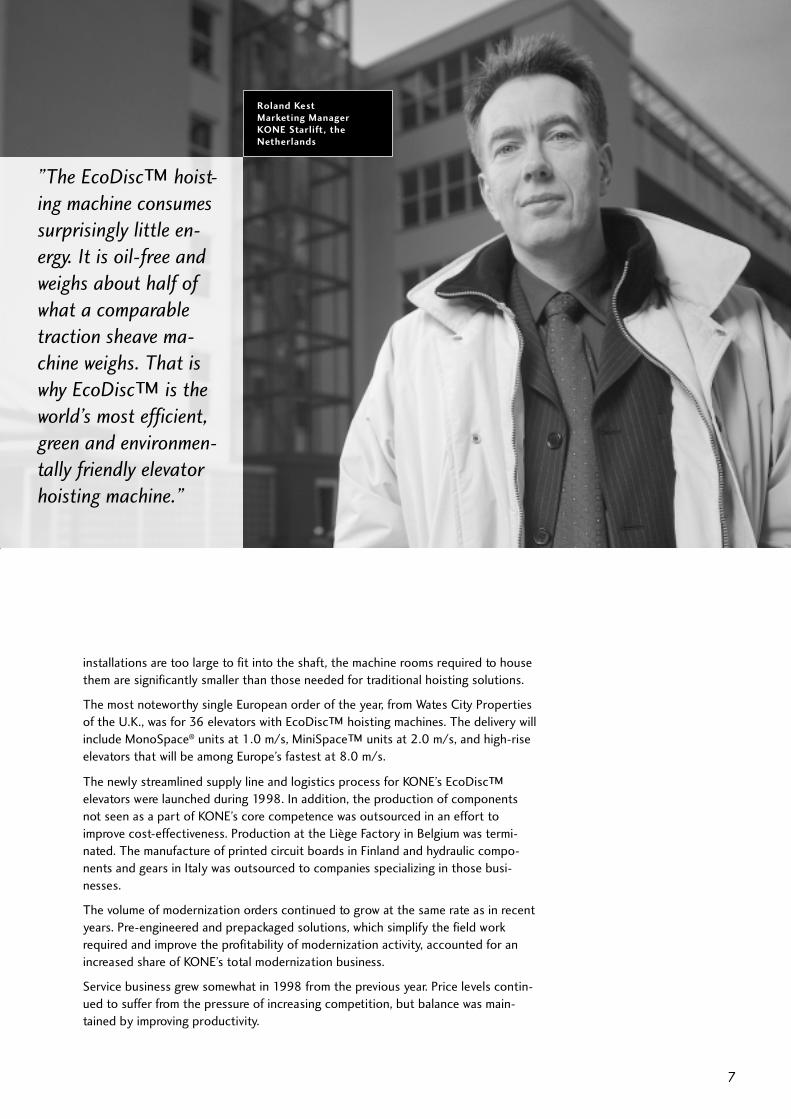
Roland KestMarketing ManagerKONE Starlift, theNetherlands
installations are too large to fit into the shaft, the machine rooms required to housethem are significantly smaller than those needed for traditional hoisting solutions.
The most noteworthy single European order of the year, from Wates City Propertiesof the U.K., was for 36 elevators with EcoDisc™ hoisting machines. The delivery willinclude MonoSpace® units at 1.0 m/s, MiniSpace™ units at 2.0 m/s, and high-riseelevators that will be among Europe’s fastest at 8.0 m/s.
The newly streamlined supply line and logistics process for KONE’s EcoDisc™elevators were launched during 1998. In addition, the production of componentsnot seen as a part of KONE’s core competence was outsourced in an effort toimprove cost-effectiveness. Production at the Liège Factory in Belgium was termi-nated. The manufacture of printed circuit boards in Finland and hydraulic compo-nents and gears in Italy was outsourced to companies specializing in those busi-nesses.
The volume of modernization orders continued to grow at the same rate as in recentyears. Pre-engineered and prepackaged solutions, which simplify the field workrequired and improve the profitability of modernization activity, accounted for anincreased share of KONE’s total modernization business.
Service business grew somewhat in 1998 from the previous year. Price levels contin-ued to suffer from the pressure of increasing competition, but balance was main-tained by improving productivity.
7
”The EcoDisc™ hoist-
ing machine consumes
surprisingly little en-
ergy. It is oil-free and
weighs about half of
what a comparable
traction sheave ma-
chine weighs. That is
why EcoDisc™ is the
world’s most efficient,
green and environmen-
tally friendly elevator
hoisting machine.”
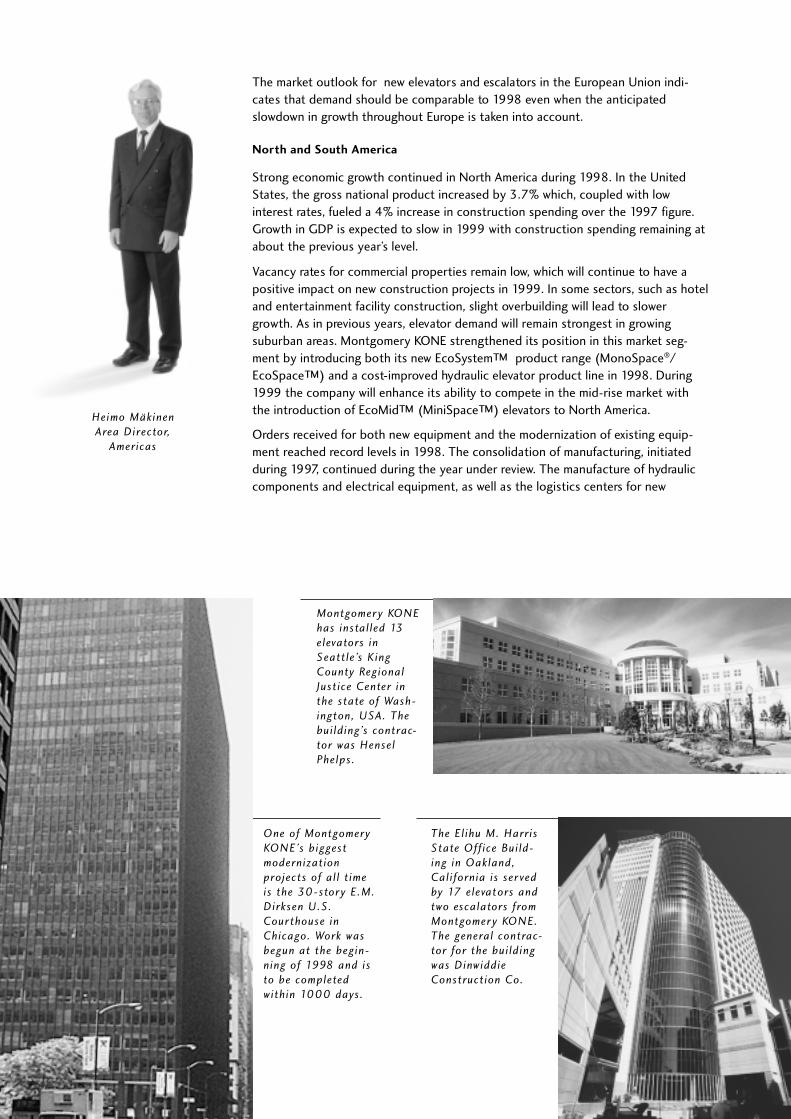
Heimo MäkinenArea Director,
Americas
8
Montgomer y KONEhas instal led 13elevators inSeattle’s KingCounty RegionalJustice Center inthe state of Wash-ington, USA. Thebui lding’s contrac-tor was HenselPhelps.
One of MontgomeryKONE’s biggestmodernizationprojects of al l t imeis the 30-stor y E.M.Dirksen U.S.Cour thouse inChicago. Work wasbegun at the begin-ning of 1998 and isto be completedwithin 1000 days.
The El ihu M. HarrisState Off ice Bui ld-ing in Oakland,California is ser vedby 17 elevators andtwo escalators fromMontgomer y KONE.The general contrac-tor for the bui ldingwas DinwiddieConstruction Co.
The market outlook for new elevators and escalators in the European Union indi-
cates that demand should be comparable to 1998 even when the anticipated
slowdown in growth throughout Europe is taken into account.
North and South America
Strong economic growth continued in North America during 1998. In the United
States, the gross national product increased by 3.7% which, coupled with low
interest rates, fueled a 4% increase in construction spending over the 1997 figure.
Growth in GDP is expected to slow in 1999 with construction spending remaining at
about the previous year’s level.
Vacancy rates for commercial properties remain low, which will continue to have a
positive impact on new construction projects in 1999. In some sectors, such as hotel
and entertainment facility construction, slight overbuilding will lead to slower
growth. As in previous years, elevator demand will remain strongest in growing
suburban areas. Montgomery KONE strengthened its position in this market seg-
ment by introducing both its new EcoSystem™ product range (MonoSpace®/
EcoSpace™) and a cost-improved hydraulic elevator product line in 1998. During
1999 the company will enhance its ability to compete in the mid-rise market with
the introduction of EcoMid™ (MiniSpace™) elevators to North America.
Orders received for both new equipment and the modernization of existing equip-
ment reached record levels in 1998. The consolidation of manufacturing, initiated
during 1997, continued during the year under review. The manufacture of hydraulic
components and electrical equipment, as well as the logistics centers for new

Todd Zimmerman
Sales Manager
Montgomery KONE,
Naples, Florida
9
elevators and modernizations have been concentrated in McKinney, Texas while car
and door production has been consolidated in Arkansas City, Kansas. All escalator
and autowalk manufacture for North America is now located in the Moline, Illinois
escalator factory, which is expanding by 60%.
Montgomery KONE Inc.’s service business growth remained steady during the year
under review. The most noteworthy service contract was a national agreement to
service all of the JC Penney chain’s elevators and escalators, which results in the
addition of 800 units by 2001 to the 1400 already under KONE care.
Canada’s economy experienced an upturn during 1998, leading to an increase in
orders. Particularly encouraging was the success of the EcoSystem™ product line in
Canada.
Latin American markets were highly turbulent during the year under review. KONE
nevertheless maintained its market position in these countries, largely thanks to the
positive reception given to MonoSpace® and improvements in maintenance opera-
tions.
Asia-Pacific
The Asian economic crisis hit particularly hard in property business and construc-
tion. Although some positive signs of recovery are emerging for Asian economies
later in 1999, a couple of years will be needed for the recovery of elevator and
escalator markets.
”EcoSystem™ is the first
elevator design break-
through in decades. Its
environmental benefits are
reflective of our leadership
role in the green building
trend.”
10
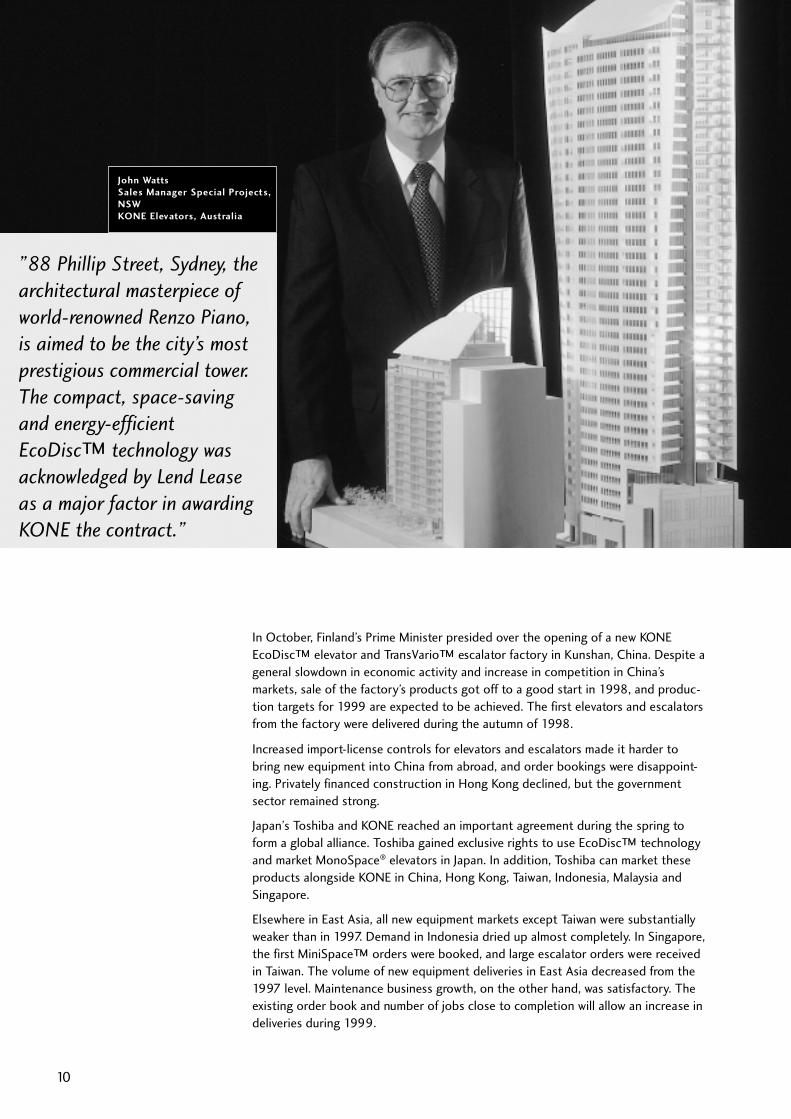
”88 Phillip Street, Sydney, the
architectural masterpiece of
world-renowned Renzo Piano,
is aimed to be the city’s most
prestigious commercial tower.
The compact, space-saving
and energy-efficient
EcoDisc™ technology was
acknowledged by Lend Lease
as a major factor in awarding
KONE the contract.”
In October, Finland’s Prime Minister presided over the opening of a new KONE
EcoDisc™ elevator and TransVario™ escalator factory in Kunshan, China. Despite a
general slowdown in economic activity and increase in competition in China’s
markets, sale of the factory’s products got off to a good start in 1998, and produc-
tion targets for 1999 are expected to be achieved. The first elevators and escalators
from the factory were delivered during the autumn of 1998.
Increased import-license controls for elevators and escalators made it harder to
bring new equipment into China from abroad, and order bookings were disappoint-
ing. Privately financed construction in Hong Kong declined, but the government
sector remained strong.
Japan’s Toshiba and KONE reached an important agreement during the spring to
form a global alliance. Toshiba gained exclusive rights to use EcoDisc™ technology
and market MonoSpace® elevators in Japan. In addition, Toshiba can market these
products alongside KONE in China, Hong Kong, Taiwan, Indonesia, Malaysia and
Singapore.
Elsewhere in East Asia, all new equipment markets except Taiwan were substantially
weaker than in 1997. Demand in Indonesia dried up almost completely. In Singapore,
the first MiniSpace™ orders were booked, and large escalator orders were received
in Taiwan. The volume of new equipment deliveries in East Asia decreased from the
1997 level. Maintenance business growth, on the other hand, was satisfactory. The
existing order book and number of jobs close to completion will allow an increase in
deliveries during 1999.
John Watts
Sales Manager Special Projects,
NSW
KONE Elevators, Australia
11
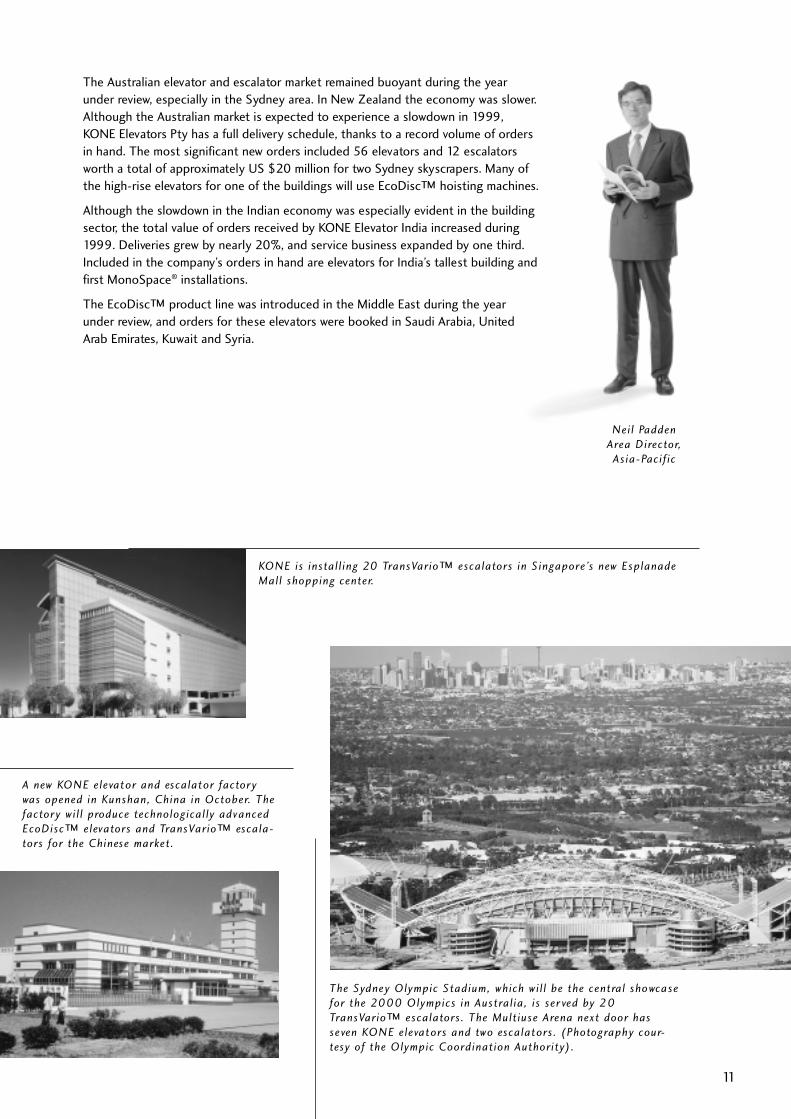
KONE is instal l ing 20 TransVario™ escalators in Singapore’s new EsplanadeMall shopping center.
A new KONE elevator and escalator factor ywas opened in Kunshan, China in October. Thefactor y wi l l produce technological ly advancedEcoDisc™ elevators and TransVario™ escala-tors for the Chinese market.
The Sydney Olympic Stadium, which wi l l be the central showcasefor the 2000 Olympics in Austral ia, is ser ved by 20TransVario™ escalators. The Mult iuse Arena next door hasseven KONE elevators and two escalators. (Photography cour-tesy of the Olympic Coordination Authority).
Nei l PaddenArea Director,Asia-Pacif ic
The Australian elevator and escalator market remained buoyant during the year
under review, especially in the Sydney area. In New Zealand the economy was slower.
Although the Australian market is expected to experience a slowdown in 1999,
KONE Elevators Pty has a full delivery schedule, thanks to a record volume of orders
in hand. The most significant new orders included 56 elevators and 12 escalators
worth a total of approximately US $20 million for two Sydney skyscrapers. Many of
the high-rise elevators for one of the buildings will use EcoDisc™ hoisting machines.
Although the slowdown in the Indian economy was especially evident in the building
sector, the total value of orders received by KONE Elevator India increased during
1999. Deliveries grew by nearly 20%, and service business expanded by one third.
Included in the company’s orders in hand are elevators for India’s tallest building and
first MonoSpace® installations.
The EcoDisc™ product line was introduced in the Middle East during the year
under review, and orders for these elevators were booked in Saudi Arabia, United
Arab Emirates, Kuwait and Syria.

In many ways 1998 was filled with positive developments for KONE: revenues, orders
received and the financial result all reached targeted levels; new and more competi-tive products were launched; and the efficiency of both field operations and supply
lines was improved through process streamlining.
The value of net sales during the period under review totaled FIM 12,381 million
compared to FIM 12,379 million a year earlier. When adjusted for changes in cur-rency exchange rates, the increase from 1997 was 5%. New equipment accounted
for 39% of sales (1997: 41%) and maintenance and modernization business for 61%(1997: 59%).
The value of orders received, exclusive of maintenance business, totaled FIM 8,818million compared to FIM 8,614 million for the previous year. This represents agrowth of 6% when adjusted for changes in currency rates. The value of orders in
hand, exclusive of maintenance business, was FIM 7,880 million at the end of 1998,having stood at FIM 7,970 a year earlier.
There were no major changes in corporate structure during the year under review.Acquisition activity focused on strengthening market share in Germany, where the
end of the year saw KONE acquire Gustav Ad Koch Maschinenfabrik KG, with annualsales exceeding FIM 100 million, and 75% of Hages-Aufzüge GmbH, whose turnover
is more than FIM 50 million.
The new Ravens Stadium, one ofBalt imore’s largest construction projectsever, was completed in 1998. Montgom-er y KONE del ivered 12 elevators and twoescalators to the Mar yland, USA sportsfaci l i ty.
On the banks of the Danube River,opposite the old center of Vienna,a new high-rise section of town isbeing bui lt . KONE instal led theelevators for the exclusive high-rise ‘Obel ix Tower’ residentialbui lding, which was completedduring 1998.
Report on Operations
12
(mFIM)
(mFIM)
(mFIM)
Sales
Orders received
Order book
3000
6000
9000
0
94 95 96 97 98
12000
2500
5000
7500
0
94 95 96 97 98
10000
7200
5400
1800
3600
0
94 95 96 97 98
9000

Production of elevators and escalators in China was launched in September at thenew Kunshan Factory. Hydraulic component and gear manufacturing in Italy andprinted circuit board production in Finland were outsourced to specialist companies
in those businesses. The elevator factory in Liège, Belgium and the escalator factoryin Newport News, Virginia, U.S.A. were closed.
During the year under review KONE entered into a strategic alliance with Toshiba ofJapan. Toshiba began to market elevators based on KONE’s EcoDiscTM technology in
Japan and several other Asian nations. Other steps were also taken to broaden anddeepen cooperation between the two companies.
The development of the year-end financial result was especially positive. Operatingincome for the whole of 1998 totaled FIM 496 million (1997: 251 million). Income
after financing items more than doubled the previous year’s figure, reaching FIM 431million (1997: FIM 202 million). Net income for the period under review was FIM 217million (1997: FIM 46 million). Earnings per share stood at FIM 32.28 (1997: FIM
6.88).
KONE’s Board of Directors proposes to the Annual General Meeting that a dividendof FIM 10 per class A share (1997: FIM 9) and FIM 11 per class B share (1997: FIM10) be declared for 1998. A total of FIM 72.7 million (1997: FIM 66.0 million) is
proposed to be made available for dividend distribution.
Dr. Gerhard Cromme resigned from KONE Corporation’s Board of Directors as of
June 3, 1998. After the closing of the 1998 books president Anssi Soila resigned onFebruary 2, 1999, and the same day the Board named European area director Jean-
Pierre Chauvarie as his successor.
13
”The Tokyo Metro, where Toshibainstallers are handling the installa-tion of KONE MonoSpace® eleva-tors for stations on a new circularsubway line, is the first concreteexample of cooperation betweenKONE and Toshiba. Both companiesare striving to enlarge and deepenthe recently-begun cooperation be-tween them.”
Yasuko Oda and Katsunori Sato
Subway Line 12 project, Tokyo
KONE Japan
Products and Markets
On the whole, demand for new elevators and escalators developed favorably whileregional and national markets exhibited plenty of variation. In the United States,
construction activity continued to be strong and a record volume of orders for newequipment was booked. In Europe, growth was vigorous in, among other places, theU.K., Spain and Finland. Major high-rise elevator orders were obtained in Australia,
but demand was weak in East Asia (with the exception of China).
A new product family based on KONE’s EcoDiscTM hoisting machine technology and
covering most residential and office-building elevator needs was introduced early in1998. The range of applications for KONE’s MonoSpace® machine-room-less
elevators was extended up to 16 floors and for larger MiniSpaceTM units up to morethan twice that height.
The marketing of these latest-generation elevators spread throughout the countrieswhere KONE has operations. Space- and energy-saving elevators have been enthusi-
astically received by architects and builders. Over 5,000 elevators relying onEcoDiscTM technology were sold in Europe during 1998, representing more than halfof KONE’s total number of units sold on that continent. During the second half of
the year, sales also got off to a promising start in the United States, China andJapan.
During the year under review, several noteworthy skyscraper projects were launched.In Australia and the U.K. KONE booked its first orders for high-rise elevators based
on EcoDiscTM technology. Deliveries will begin before the end of 1999.
Demand for escalators and autowalks grew somewhat in Europe and North America.
In the United States, airport and stadium construction remained strong. In Europe,
14
(as % of turnover)
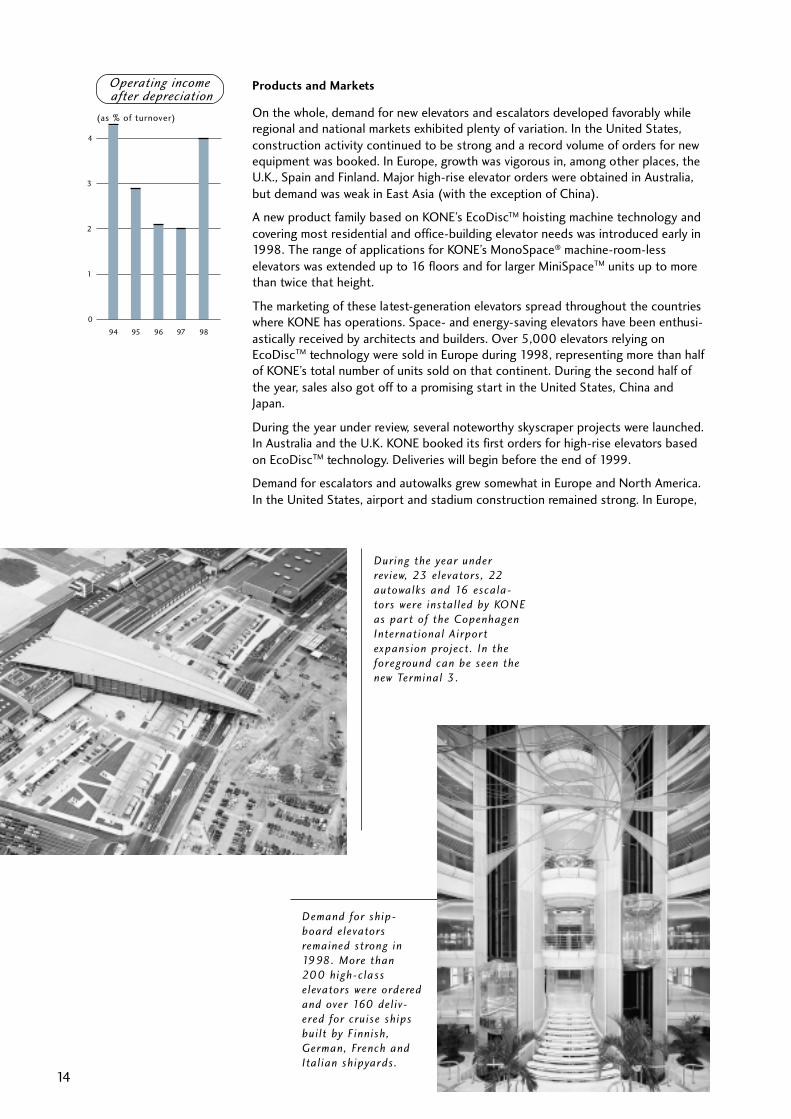
Demand for ship-board elevatorsremained strong in1998. More than200 high-cla sselevators were orderedand over 160 del iv-ered for cruise shipsbui lt by Finnish,German, French andItal ian shipyards.
During the year underreview, 23 elevators, 22autowalks and 16 escala-tors were instal led by KONEas par t of the CopenhagenInternational Airpor texpansion project. In theforeground can be seen thenew Terminal 3.
Operating income after depreciation
1
2
3
0
94 95 96 97 98
4
100
200
300
0
94 95 96 97 98
400
investment in local transportation compensated for the decline in investment in theoffice-building and department-store sectors. Demand in most Asian countries, on
the other hand, was weak.
Demand for modernization developed well in Europe and especially in the UnitedStates, where the growth was more than one fifth above the previous year’s level.Measures to improve the safety of existing elevators in Europe and the strong U.S.
economy spurred the increase in modernization business. The role of KONE’sindustrialized packaged solutions designed to satisfy the most common moderniza-
tion requirements is increasing, which has a positive impact on the productivity ofmodernization operations.
More detailed information and observations about different markets can be found inthe section of this Annual Report on pages 6-11 entitled, ”Review by Market Area”.
Sales
The geographical distribution of KONE’s net sales for 1998, totaling FIM 12,381
million, is presented in the chart on page 16. Compared to the previous year, Europeand North America garnered greater shares while Asia’s percentage decreased.
The value of deliveries of new elevators and escalators in 1998 totaled FIM 4,889million (1997: FIM 5,023 million), representing 39% of total sales. Deliveries of new
equipment increased somewhat in Europe and North America compared withvolumes for the previous year. In Southeast Asia deliveries decreased, but growth
continued in Australia.
15
Financial result
Income after financing items
Net income
(mFIM)
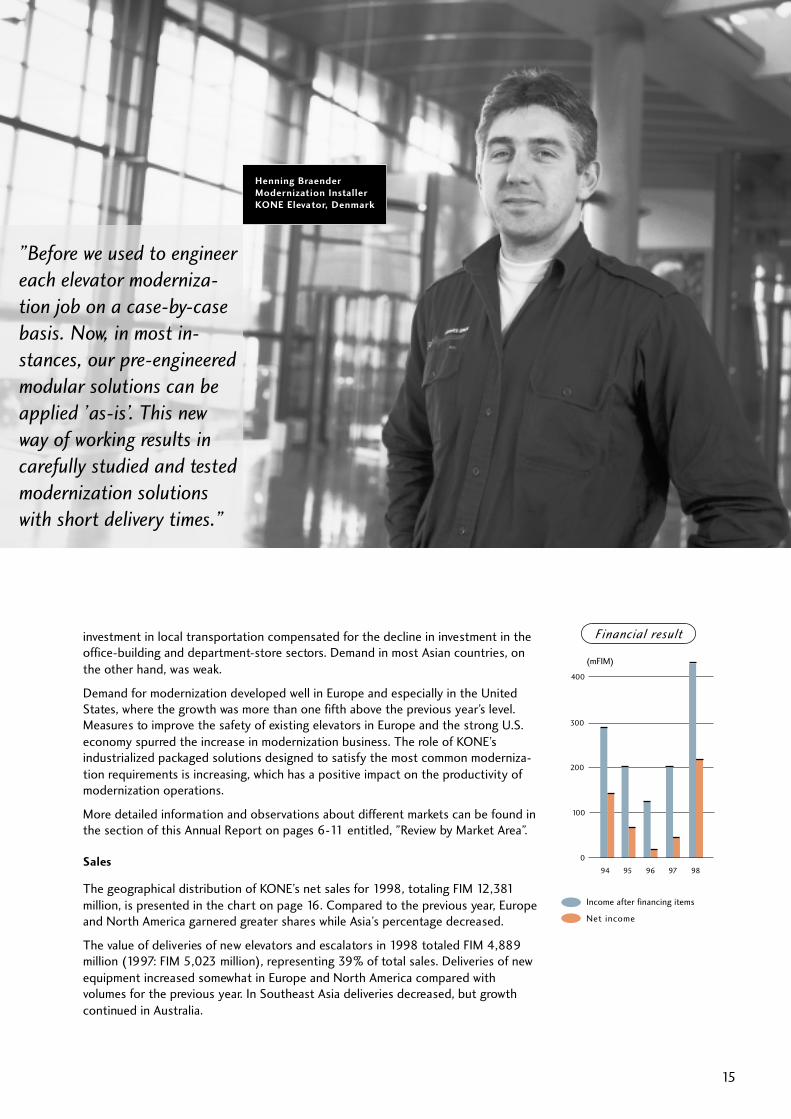
Henning Braender
Modernization Installer
KONE Elevator, Denmark
”Before we used to engineer
each elevator moderniza-
tion job on a case-by-case
basis. Now, in most in-
stances, our pre-engineered
modular solutions can be
applied ’as-is’. This new
way of working results in
carefully studied and tested
modernization solutions
with short delivery times.”

Net interest paid
Sales from the maintenance and modernization side of the business totaled FIM7,492 million (1997: FIM 7,356 million). Modernization activity continued to expand
in Europe and North America. The growth in maintenance operations, which ac-counted for more than 40% of total sales worldwide, remained stable. At the end of
1998, the total number of elevators and escalators under maintenance contract wasnearly 450,000.
Sales and personnel by country are presented on page 21 of this Annual Report.
Sales by Market
1998 mFIM 1998 % 1997 mFIM 1997 %
Europe 7,055 57 6,909 55
North America 3,652 30 3,526 29
Asia Pacific 1,152 9 1,354 11
Other 522 4 590 5
Total 12,381 100 12,379 100
The Parent Company, KONE Corporation, recorded sales totaling FIM 1,651 million
(1997: FIM 1,403 million). The value of exports from Finland was FIM 1,019 million(1997: FIM 1,013 million).
16
(as % of turnover)
0,3
0,6
0,9
0
94 95 96 97 98
1,2
Sam Uskali
Installation Manager
KONE Corp., Finland
”Because KONE MonoSpace®
elevators don’t require a machine
room, they create significant
space savings and make it easier
to design buildings. These and
other features combine to make
MonoSpace® an unbeatable solu-
tion for environmentally aware
markets.”

15
30
45
0
94 95 96 97 98
60
GearingFinance, Financial Result and Consolidated Balance Sheet
KONE’s 1998 income before taxes more than doubled the comparable 1997 figure.Instrumental in the improvement of profitability were new and more competitive
products, reorganized production and supply lines, and the discontinuation ofunprofitable activities. On the other hand, major projects related to the develop-ment of KONE’s global data management and production systems have created
heavy costs in their current phases of implementation and weighed heavily on thefinancial result. In addition to internal actions taken by KONE, favorable market
conditions in certain European countries, North America and Australia have had apositive impact on the result.
KONE’s operating income totaled FIM 496 million (1997: FIM 251 million) andincome after financing items was FIM 431 million (1997: 202 million). Net incomewas FIM 217 million (1997: FIM 46 million). Earnings per share nearly quintupled to
FIM 32.28 (1997: FIM 6.88).
KONE’s net debt at the end of 1998 totaled FIM 768 million, having stood at FIM904 a year earlier. Total equity as a share of total assets increased to 36% andgearing to 25%. There were no significant changes in financing arrangements during
the year under review. After the closing of the 1998 books, however, the Board ofDirectors began preparing a subordinated bond issue in order to strengthen KONE’s
capital structure.
KONE’s foreign-exchange order book and projected six-month currency needs are
covered in accordance with company policy. Loans by subsidiaries are in eachsubsidiary’s own country’s currency. Risk related to the translation of foreign subsid-iaries’ assets and debts has been reported in such a way that changes in currency
(%)
At the end of 1998 the instal lation of 116escalators, 31 elevators and two autowalks in11 stations of the London Underground’sJubi lee Line extension was close to comple-tion. Work on this project, the largestescalator del ivery of al l t ime, was begun in1994. Pictured here are escalators beinginstal led in the London Bridge UndergroundStation.
KONE is supplying 29elevators at speeds up to6.0 m/s for the 24-stor yheadquarters of the ABNAMRO Bank in Amsterdam,the Netherlands.
17

Capital expenditure intangible assets and
depreciation
values do not affect KONE’s equity structure.
KONE’s distributable equity is FIM 2,195.6 million. The parent company’s distribut-
able equity from the previous year stands at FIM 3,196 million and net income from1998 at FIM 126 million. The Board of Directors proposes to the Annual General
Meeting that a dividend of FIM 10 be paid on each of the 1,161,647 outstandingclass A shares and FIM 11 on each of the 5,556,533 class B shares. The date ofrecord for dividend distribution is 3 March, 1999. It is proposed that dividends be
payable from 8 March, 1999. If the Annual General Meeting of 26 February, 1999approves the proposal, dividends will total FIM 72.7 million (1997: FIM 66.0 mil-
lion).
Key figures as well as shareholder information pertaining to the Report on Opera-
tions can be found on pages 30 and 42.
Personnel
The total number of KONE employees at the end of 1998 was 22,692. A year earlier
the comparable figure was 22,499. The increase was greatest in China, where a newfactory was opened in September.
The distribution of employees by job category indicates that 57% worked in mainte-nance and modernization, 23% in new equipment sales and installation, 14% inmanufacturing and 7% in R&D or administration. The largest geographical concen-
tration was in the United States, with 4,952 employees. The average number ofemployees during 1998 was 22,596 (1997: 22,153).
(mFIM)
Capital expenditure
Depreciation
100
200
300
400
0
94 95 96 97 98
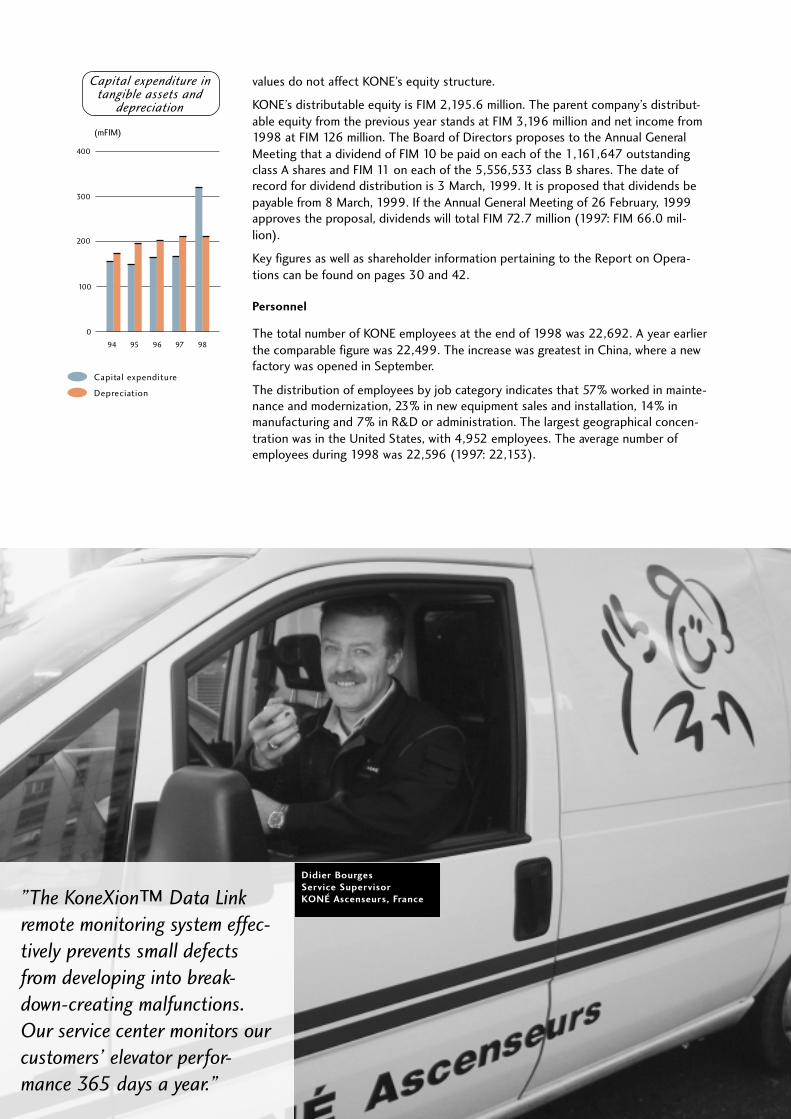
”The KoneXion™ Data Link
remote monitoring system effec-
tively prevents small defects
from developing into break-
down-creating malfunctions.
Our service center monitors our
customers’ elevator perfor-
mance 365 days a year.”
Didier Bourges
Service Supervisor
KONÉ Ascenseurs, France
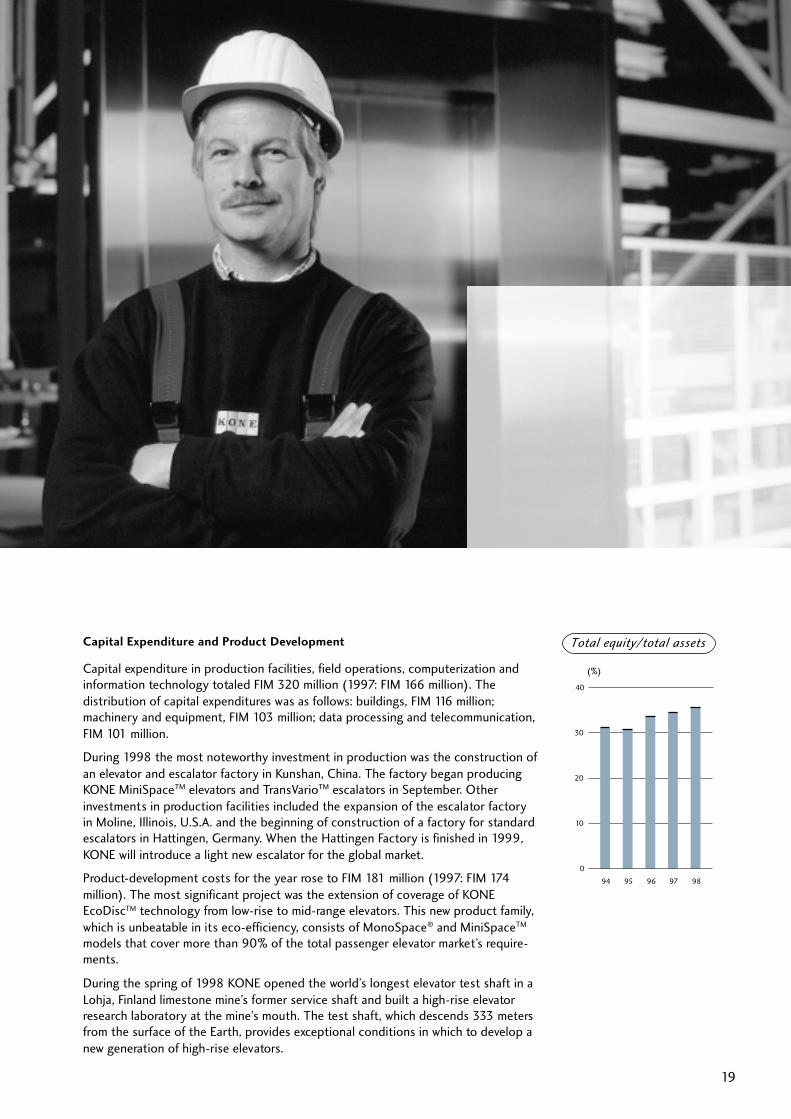
Total equity/total assetsCapital Expenditure and Product Development
Capital expenditure in production facilities, field operations, computerization andinformation technology totaled FIM 320 million (1997: FIM 166 million). The
distribution of capital expenditures was as follows: buildings, FIM 116 million;machinery and equipment, FIM 103 million; data processing and telecommunication,
FIM 101 million.
During 1998 the most noteworthy investment in production was the construction of
an elevator and escalator factory in Kunshan, China. The factory began producingKONE MiniSpaceTM elevators and TransVarioTM escalators in September. Other
investments in production facilities included the expansion of the escalator factoryin Moline, Illinois, U.S.A. and the beginning of construction of a factory for standardescalators in Hattingen, Germany. When the Hattingen Factory is finished in 1999,
KONE will introduce a light new escalator for the global market.
Product-development costs for the year rose to FIM 181 million (1997: FIM 174
million). The most significant project was the extension of coverage of KONEEcoDiscTM technology from low-rise to mid-range elevators. This new product family,
which is unbeatable in its eco-efficiency, consists of MonoSpace® and MiniSpaceTM
models that cover more than 90% of the total passenger elevator market’s require-ments.
During the spring of 1998 KONE opened the world’s longest elevator test shaft in a
Lohja, Finland limestone mine’s former service shaft and built a high-rise elevatorresearch laboratory at the mine’s mouth. The test shaft, which descends 333 metersfrom the surface of the Earth, provides exceptional conditions in which to develop a
new generation of high-rise elevators.
19
(%)
10
20
30
0
94 95 96 97 98
40
Capital expenditure intangible assets and
depreciation
values do not affect KONE’s equity structure.
KONE’s distributable equity is FIM 2,195.6 million. The parent company’s distribut-able equity from the previous year stands at FIM 3,196 million and net income from1998 at FIM 126 million. The Board of Directors proposes to the Annual GeneralMeeting that a dividend of FIM 10 be paid on each of the 1,161,647 outstandingclass A shares and FIM 11 on each of the 5,556,533 class B shares. The date ofrecord for dividend distribution is 3 March, 1999. It is proposed that dividends bepayable from 8 March, 1999. If the Annual General Meeting of 26 February, 1999approves the proposal, dividends will total FIM 72.7 million (1997: FIM 66.0 mil-lion).
Key figures as well as shareholder information pertaining to the Report on Opera-tions can be found on pages 30 and 42.
Personnel
The total number of KONE employees at the end of 1998 was 22,692. A year earlierthe comparable figure was 22,499. The increase was greatest in China, where a newfactory was opened in September.
The distribution of employees by job category indicates that 57% worked in mainte-nance and modernization, 23% in new equipment sales and installation, 14% inmanufacturing and 7% in R&D or administration. The largest geographical concen-tration was in the United States, with 4,952 employees. The average number ofemployees during 1998 was 22,596 (1997: 22,153).
(mFIM)
Capital expenditure
Depreciation
100
200
300
400
0
94 95 96 97 98
”The KoneXion™ Data Link
remote monitoring system effec-
tively prevents small defects
from developing into break-
down-creating malfunctions.
Our service center monitors our
customers’ elevator perfor-
mance 365 days a year.”
Didier BourgesService SupervisorKONÉ Ascenseurs, France

21
Sales and Personnel by Country in 1998
Sales mFIM % Number of %
employees
USA 3,458 24.2 4,952 21.8
Germany 1,600 11.2 1,670 7.4
Finland 1,592 11,1 1,706 7.5
France 1,395 9.8 2,389 10.5
Italy 1,304 9.1 2,257 9.9
United Kingdom 848 5.9 1,164 5.1
Netherlands 537 3.8 717 3.2
Sweden 512 3.6 834 3.7
Australia 441 3.1 751 3.3
Austria 419 2.9 524 2.3
China 400 2.8 959 4.2
Belgium 334 2.3 568 2.5
Brazil 208 1.5 472 2.1
Canada 208 1.5 432 1.9
Denmark 197 1.4 319 1.4
Norway 131 0.9 191 0.8
Spain 126 0.9 290 1.3
Singapore 110 0.8 105 0.5
Malaysia 61 0.4 143 0.6
Mexico 53 0.4 236 1.0
Taiwan 50 0.3 96 0.4
Turkey 45 0.3 91 0.4
Czech Republic 42 0.3 163 0.7
Switzerland 40 0.3 31 0.1
India 36 0.3 805 3.5
South Africa 31 0.2 137 0.6
Venezuela 29 0.2 157 0.7
Philippines 21 0.1 98 0.4
Russia 19 0.1 284 1.3
Poland 17 0.1 25 0.1
Argentina 11 0.1 40 0.2
Slovak Republic 9 0.1 52 0.2
Japan 6 0.0 9 0.0
Hungary 4 0.0 10 0.0
Others 1 0.0 15 0.1
Total 14,295 100.0 22,692 100.0
Intracorporate sales (1,914)
Corporate net sales 12,381
Principles of consolidation
22
The consolidated accounts include the parent company and thosecompanies in which the parent company held directly or indirectly morethan 50 % of the voting power at the end of the year. Subsidiariesacquired during the financial year have been included in the consoli-dated financial statements from the date of acquisition. Holdings inhousing and real estate companies whose consolidation is not relevantto providing a true and fair view of KONE's net income and financialposition have not been included in the consolidated financial state-ments.
Investments in associated companies have been accounted for in theconsolidated financial statements under the equity method. Anassociated company is a company in which the group holds 20-50 % ofthe voting power and has a participating interest of at least 20%.
Investments in other companies are stated at cost. The book value ofinvestments has been reduced, where necessary, to estimated netrealizable value.
Intracorporate transactions have been eliminated in the consolidatedfinancial statements.
Intracorporate shareholdings have been eliminated by deducting theamount of each subsidiary's equity at the time of acquisition from theacquisition cost of its shares. The difference between a subsidiary'sacquisition cost and its equity at the time of acquisition has beenentered as goodwill. The value of elevator and escalator maintenancecontracts acquired is also included as goodwill.
The KONE group's share of the profit or loss of an associated companyis shown in the Consolidated Statement of Income as a separate item.The dividends received from the associated companies are not includedin the consolidated statement of income. The KONE group's share ofthe associated companies' shareholders' equity at the date ofacquisition, adjusted by changes in the associated companies' equityafter the date of acquisition, is shown in the Balance Sheet under"shares and participating interests".
In certain countries, tax legislation allows allocations to be made tountaxed reserves. These allocations are not subject to taxation oncondition that the corresponding deductions have also been made inthe accounts.
In the consolidated financial statements, the yearly allocations -reserves as well as the difference between the depreciation according toplan and depreciation accepted by tax laws - have been added to netincome, excluding the change in the calculative deferred tax liability. Thedeferred tax liability is determined from the accumulation of untaxedreserves. The accumulation of untaxed reserves, excluding thecalculative deferred tax liability, is included in the shareholders' equityin the Consolidated Balance Sheet.
Minority shares are shown as a separate item in the ConsolidatedStatement of Income and Balance Sheet. The minority share in theStatement of Income is calculated from the income before allocation tountaxed reserves but after taxes adjusted by the change in thecalculative deferred tax liability. The minority share in the Balance Sheetis calculated from the sum of shareholders' equity and accumulation ofuntaxed reserves, of which the calculative deferred tax liability has beendeducted.
The financial statements of foreign subsidiaries have been convertedinto Finnish markkas at the rates current on the last day of the year.Translation differences resulting from translation of assets and liabilitiesin the financial statements of foreign subsidiaries have been included asa separate item under shareholders' equity.
Foreign currency items
Foreign exchange items and derivatives made to cover foreign exchangeand interest rate risks have been valued at the December 31st rates.The changes in value of foreign currency items have been included inthe Statement of Income as interest or exchange rate differencesaccording to the periodizing of the hedged item. Exchange ratedifferences resulting from derivatives and loans intended as hedges onassets and liabilities in foreign subsidiaries have been entered astranslation differences under shareholders' equity.
Debiting principle
The sale of products is debited at the time when they have beenhanded over to the customer and the sale of services when they havebeen carried out.
Research and development costs
Research and development costs are charged to income during the yearin which they are incurred.
Pension settlements and costs
Pensions are generally handled for KONE companies by outside pensioninsurance companies. Pension costs and changes in pension obligationsare charged to the Statement of Income.
Leasing
Leasing charges are entered as rental costs in the Statement of Income.Remaining leasing contract charges are entered in section 18 of Noteson the Consolidated Financial Statements under "Contingent liabilitiesand pledged assets". Leasing contract conditions do not differ fromnormal conditions.
Extraordinary items
One-time items of significance that arise from other than ordinaryactivities are shown under "Extraordinary items".
Taxes
The provision for income taxes includes current income taxes payableaccording to local tax regulations as well as changes in deferred taxesusing current tax rates in accordance with the new accountinglegislation. All potential deferred tax liabilities are reported, but as aprudent measure only those deferred tax assets which seem certain tobe realized are stated. Taxes also include dividend-related taxes andtaxes from previous years.
Valuation and depreciation of fixed assets
Fixed assets are stated at cost. In addition, certain land and buildingscan be stated at revalued amounts. These values are regularly reviewed.A predetermined plan is used in carrying out depreciation of fixedassets. Depreciation is based on the estimated useful economic life ofvarious assets as follows:
- Buildings 5-40 years
- Machinery and equipment 4-10 years
- Goodwill 5-20 years
- Other long-term expenses 4- 5 years
Depreciation of goodwill is generally carried out over five years. Whenconsiderable goodwill is created by the acquisition of a subsidiary orcreation of an associated company which results in KONE's acquiringsignificant market share, the depreciation period can be greater thanfive but no more than twenty years.
Inventories
Inventories are valued at no more than the likely sales price accordingto FIFO principles. Raw materials and supplies, however, are valued atstandard costs. Semi-manufactures have been valued at variableproduction costs. Work in progress includes direct labor and materialcosts as of 31st December, as well as a proportion of indirect costsrelated to production and installation of orders included in work inprogress.
Provision for liabilities and charges
Future expenses to which companies have committed themselves andwhich will produce no future income are charged against income as aprovision for liabilities and charges. The same concerns those futurelosses which seem certain to be realized.
Consolidated Statement of Income
23
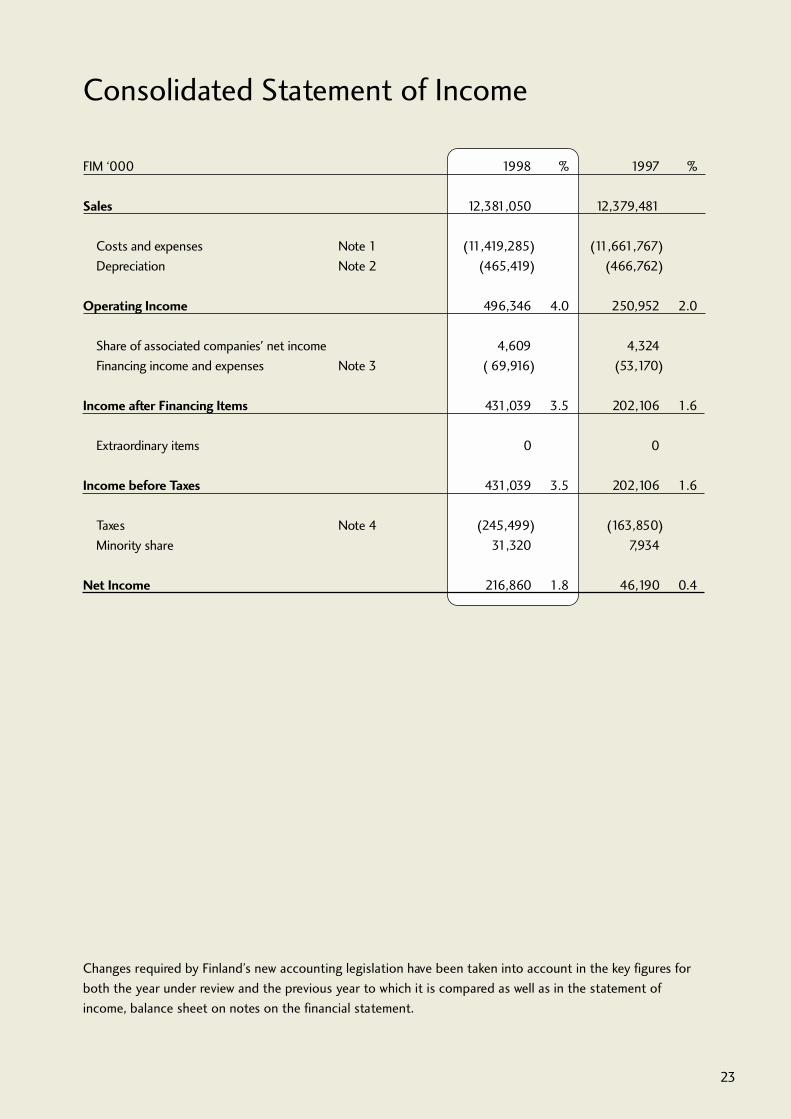
Changes required by Finland’s new accounting legislation have been taken into account in the key figures for
both the year under review and the previous year to which it is compared as well as in the statement of
income, balance sheet on notes on the financial statement.
FIM ‘000 1998 % 1997 %
Sales 12,381,050 12,379,481
Costs and expenses Note 1 (11,419,285) (11,661,767)
Depreciation Note 2 (465,419) (466,762)
Operating Income 496,346 4.0 250,952 2.0
Share of associated companies' net income 4,609 4,324
Financing income and expenses Note 3 ( 69,916) (53,170)
Income after Financing Items 431,039 3.5 202,106 1.6
Extraordinary items 0 0
Income before Taxes 431,039 3.5 202,106 1.6
Taxes Note 4 (245,499) (163,850)
Minority share 31,320 7,934
Net Income 216,860 1.8 46,190 0.4
Consolidated Balance Sheet
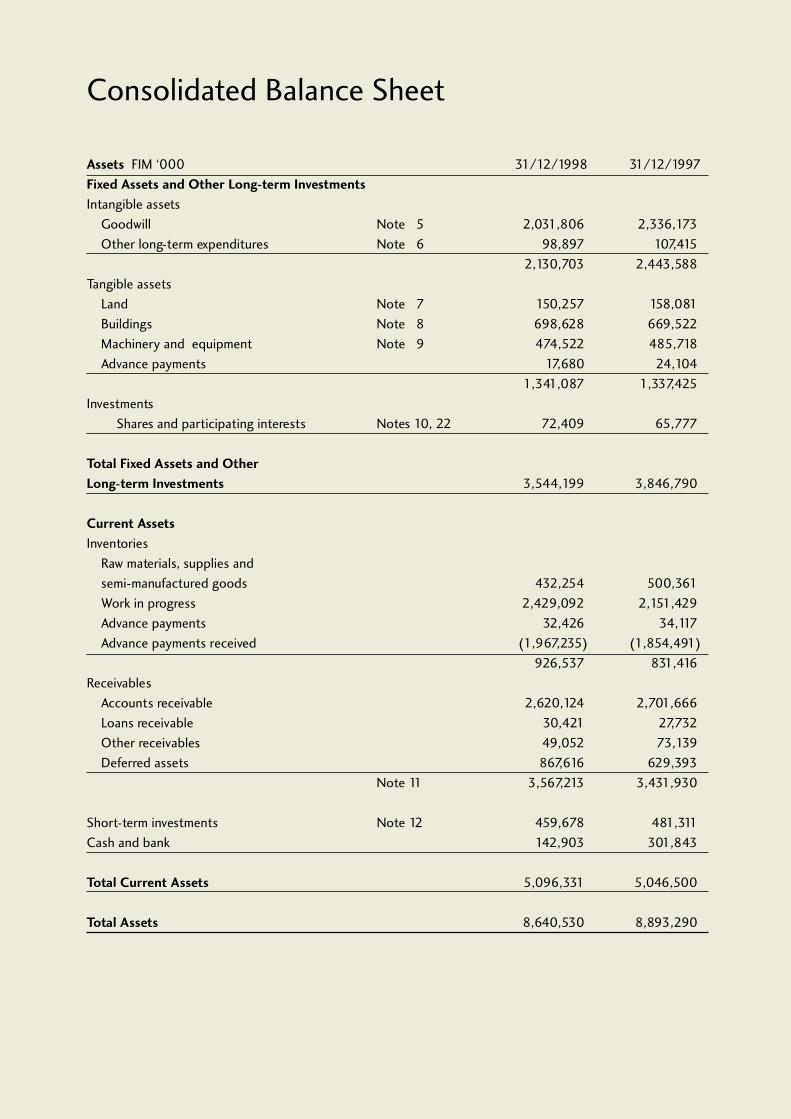
Assets FIM ‘000 31/12/1998 31/12/1997
Fixed Assets and Other Long-term Investments
Intangible assets
Goodwill Note 5 2,031,806 2,336,173
Other long-term expenditures Note 6 98,897 107,415
2,130,703 2,443,588
Tangible assets
Land Note 7 150,257 158,081
Buildings Note 8 698,628 669,522
Machinery and equipment Note 9 474,522 485,718
Advance payments 17,680 24,104
1,341,087 1,337,425
Investments
Shares and participating interests Notes 10, 22 72,409 65,777
Total Fixed Assets and Other
Long-term Investments 3,544,199 3,846,790
Current Assets
Inventories
Raw materials, supplies and
semi-manufactured goods 432,254 500,361
Work in progress 2,429,092 2,151,429
Advance payments 32,426 34,117
Advance payments received (1,967,235) (1,854,491)
926,537 831,416
Receivables
Accounts receivable 2,620,124 2,701,666
Loans receivable 30,421 27,732
Other receivables 49,052 73,139
Deferred assets 867,616 629,393
Note 11 3,567,213 3,431,930
Short-term investments Note 12 459,678 481,311
Cash and bank 142,903 301,843
Total Current Assets 5,096,331 5,046,500
Total Assets 8,640,530 8,893,290
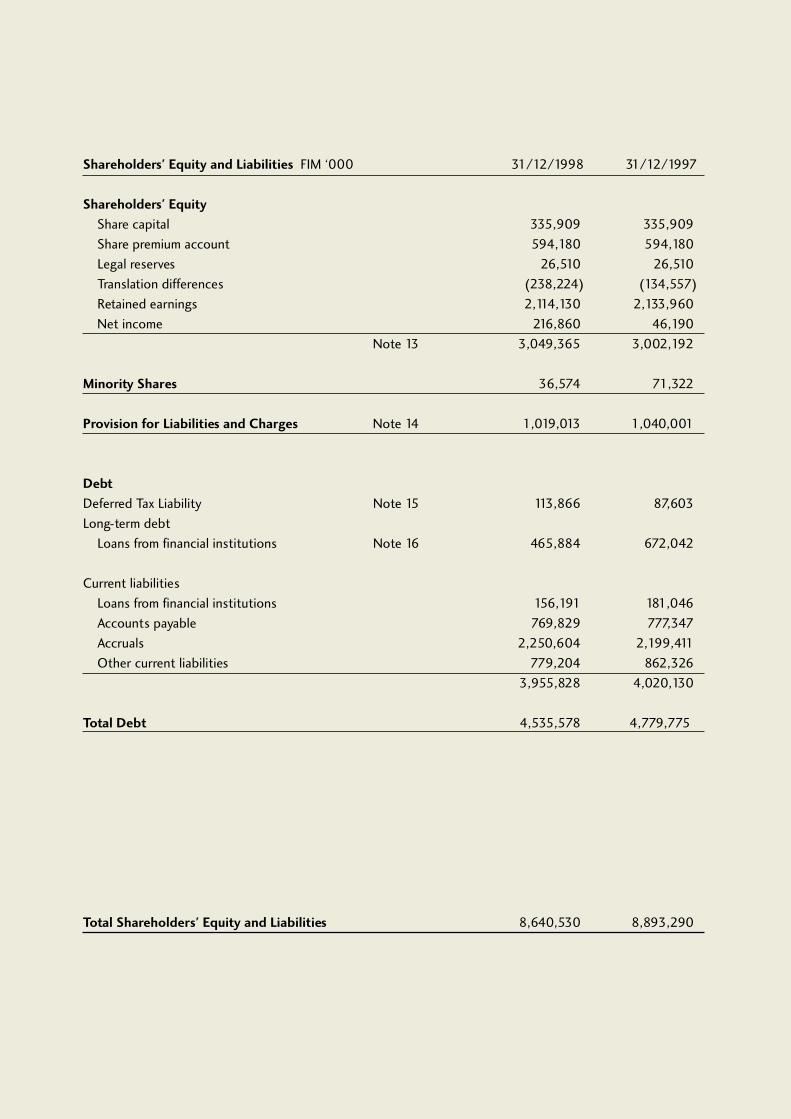
Shareholders' Equity and Liabilities FIM ‘000 31/12/1998 31/12/1997
Shareholders' Equity
Share capital 335,909 335,909
Share premium account 594,180 594,180
Legal reserves 26,510 26,510
Translation differences (238,224) (134,557)
Retained earnings 2,114,130 2,133,960
Net income 216,860 46,190
Note 13 3,049,365 3,002,192
Minority Shares 36,574 71,322
Provision for Liabilities and Charges Note 14 1,019,013 1,040,001
Debt
Deferred Tax Liability Note 15 113,866 87,603
Long-term debt
Loans from financial institutions Note 16 465,884 672,042
Current liabilities
Loans from financial institutions 156,191 181,046
Accounts payable 769,829 777,347
Accruals 2,250,604 2,199,411
Other current liabilities 779,204 862,326
3,955,828 4,020,130
Total Debt 4,535,578 4,779,775
Total Shareholders' Equity and Liabilities 8,640,530 8,893,290

Consolidated Statement of Cash Flows
26
FIM million 1998 1997
Cash receipt from customers 12,580 12,498
Cash paid to suppliers and employees (11,738) (11,169)
Cash flow from financial items (62) (48)
Cash flow from taxes and other items (288) (224)
Cash Flow from Operating Activities 492 1,057
Capital expenditure (380) (211)
Proceeds from sale of fixed assets 32 28
Fixed assets of new subsidiaries (2) ( 13)
Cash Flow from Investing Activities (350) ( 196)
Cash Flow after Investing Activities 142 861
Change in current creditors, net ( 85) (159)
Change in long-term debt, net (182) (476)
Minority share 0 68
Dividends paid (66) (63)
Other financing activities 41 (150)
Cash Flow from Financing Activities (292) (780)
Change in Net Cash (150) 81
Cash and bank as of 31 December 143 302
Exchange difference (9) 13
Cash and bank as of 1 January 302 208
Change in Net Cash (150) 81
Reconciliation of Net Income to Cash Flow
from Operating Activities
Net Income 217 46
Depreciation 465 467
Minority interest (31) (8)
Income before Change in Working Capital 651 505
Change in receivables (242) 114
Change in payables 363 576
Change in inventories (280) (138)
Cash Flow from Operating Activities 492 1,057
In drawing up the Cash-flow Statement, the impact of variations in exchange rates has been eliminated by
adjusting the beginning balance to reflect the exchange rates prevailing at the time of the closing of the books
for the period under review.

Consolidated Statement of Income
CONSOLIDATED STATEMENT OF INCOME
(FIM million)
CONSOLIDATED BALANCE SHEET (FIM million)
27
1. Cost and expenses
1998 1997
Change of work in progress (342.1) (137.4)
Materials and supplies 3,495.9 3,413.2
External services 542.4 516.8
Salaries of boards of directors and
managing directors 55.9 55.5
Wages and other salaries 3,557.3 3,613.0
Pension costs 590.0 619.2
Other personnel expenses 1,204.6 1,199.8
Other expenses 2,342.5 2,447.3
Other business income (27.2) (65.6)
Total 11,419.3 11,661.8
2. Depreciation
1998 1997
Goodwill 222.4 221.3
Other long-term expenditures 31.5 34.4
Buildings 35.3 36.2
Machinery and equipment 176.2 174.9
Total 465.4 466.8
3. Financing income and expenses
1998 1997
Dividends received 2.8 2.1
Interest received 41.8 43.6
Other financing income 0.2 43.6
Interest paid (103.7) (135.2)
Other financing expenses (11.0) (7.3)
Total ( 69.9) ( 53.2)
4. Taxes
1998 1997
Revenue-based taxes 327.6 300.5
Change in deferred tax
liabilities and assets ( 82.0) (134.7)
Tax credit on dividends (0.1) (1.9)
Total 245.5 163.9
5. Goodwill
1998 1997
Acquisition cost as of 1 January 3,480.3 3,540.1
Increase 65.0 42.2
Decrease - -
Accumulated depreciation (1,513.5) (1,246.1)
Total as of 31 December 2,031.8 2,336.2
6. Other long-term expenditures
1998 1997
Acquisition cost as of 1 January 285.2 277.7
Increase 24.9 31.1
Decrease ( 0.2) (22.1)
Accumulated depreciation (211.0) (179.3)
Total as of 31 December 98.8 107.4
7. Land
1998 1997
Acquisition cost as of 1 January 153.3 150.7
Accumulated revaluation 4.9 4.9
Increase - 23.7
Decrease ( 7.9) (21.2)
Total as of 31 December 150.3 158.1
8. Buildings
1998 1997
Acquisition cost as of 1 January 963.0 953.2
Accumulated revaluation 75.4 75.4
Increase 115.5 45.0
Decrease (28.2) (12.3)
Accumulated depreciation (427.1) (391.8)
Total as of 31 December 698.6 669.5
9. Machinery and equipment
1998 1997
Acquisition cost as of 1 January 1,781.7 1,697.5
Increase 205.1 131.1
Decrease ( 9.4) (16.2)
Accumulated depreciation (1,502.9) (1,326.7)
Total as of 31 December 474.5 485.7
28
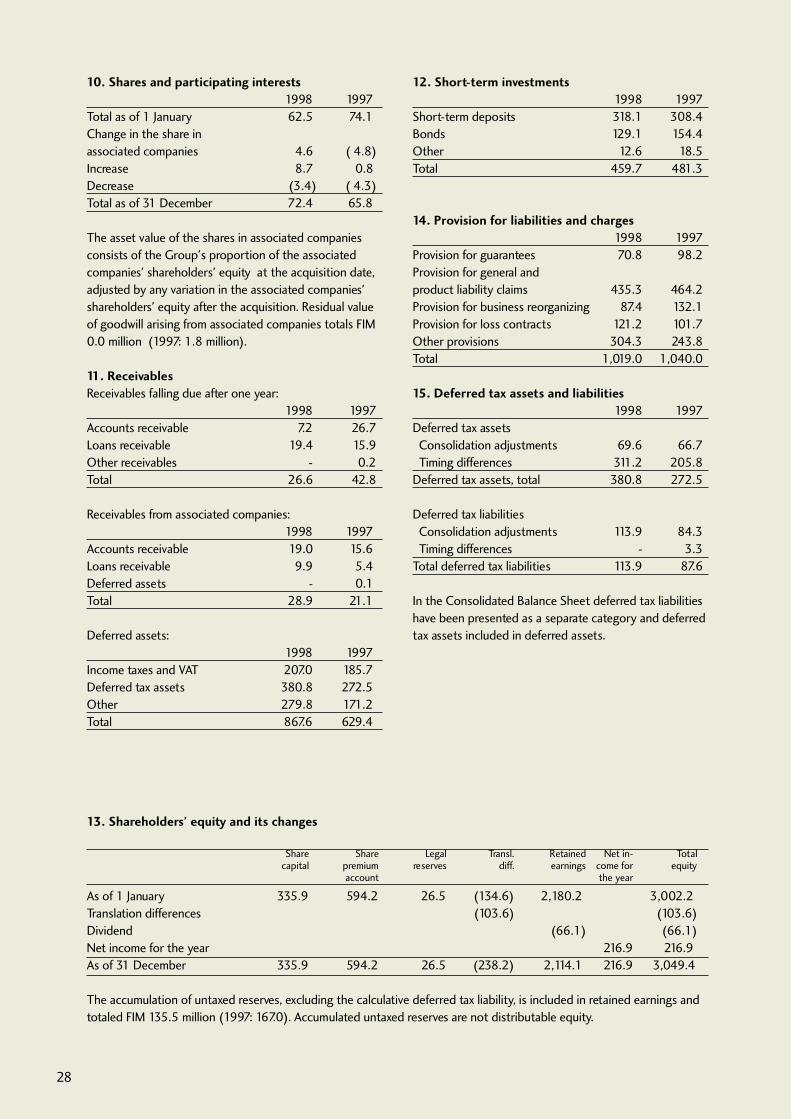
13. Shareholders' equity and its changes
Share Share Legal Transl. Retained Net in- Totalcapital premium reserves diff. earnings come for equity
account the year
As of 1 January 335.9 594.2 26.5 (134.6) 2,180.2 3,002.2
Translation differences (103.6) (103.6)
Dividend (66.1) (66.1)
Net income for the year 216.9 216.9
As of 31 December 335.9 594.2 26.5 (238.2) 2,114.1 216.9 3,049.4
The accumulation of untaxed reserves, excluding the calculative deferred tax liability, is included in retained earnings and
totaled FIM 135.5 million (1997: 167.0). Accumulated untaxed reserves are not distributable equity.
10. Shares and participating interests
1998 1997
Total as of 1 January 62.5 74.1
Change in the share in
associated companies 4.6 ( 4.8)
Increase 8.7 0.8
Decrease (3.4) ( 4.3)
Total as of 31 December 72.4 65.8
The asset value of the shares in associated companies
consists of the Group's proportion of the associated
companies' shareholders' equity at the acquisition date,
adjusted by any variation in the associated companies'
shareholders' equity after the acquisition. Residual value
of goodwill arising from associated companies totals FIM
0.0 million (1997: 1.8 million).
11. Receivables
Receivables falling due after one year:
1998 1997
Accounts receivable 7.2 26.7
Loans receivable 19.4 15.9
Other receivables - 0.2
Total 26.6 42.8
Receivables from associated companies:
1998 1997
Accounts receivable 19.0 15.6
Loans receivable 9.9 5.4
Deferred assets - 0.1
Total 28.9 21.1
Deferred assets:
1998 1997
Income taxes and VAT 207.0 185.7
Deferred tax assets 380.8 272.5
Other 279.8 171.2
Total 867.6 629.4
12. Short-term investments
1998 1997
Short-term deposits 318.1 308.4
Bonds 129.1 154.4
Other 12.6 18.5
Total 459.7 481.3
14. Provision for liabilities and charges
1998 1997
Provision for guarantees 70.8 98.2
Provision for general and
product liability claims 435.3 464.2
Provision for business reorganizing 87.4 132.1
Provision for loss contracts 121.2 101.7
Other provisions 304.3 243.8
Total 1,019.0 1,040.0
15. Deferred tax assets and liabilities
1998 1997
Deferred tax assets
Consolidation adjustments 69.6 66.7
Timing differences 311.2 205.8
Deferred tax assets, total 380.8 272.5
Deferred tax liabilities
Consolidation adjustments 113.9 84.3
Timing differences - 3.3
Total deferred tax liabilities 113.9 87.6
In the Consolidated Balance Sheet deferred tax liabilities
have been presented as a separate category and deferred
tax assets included in deferred assets.
29
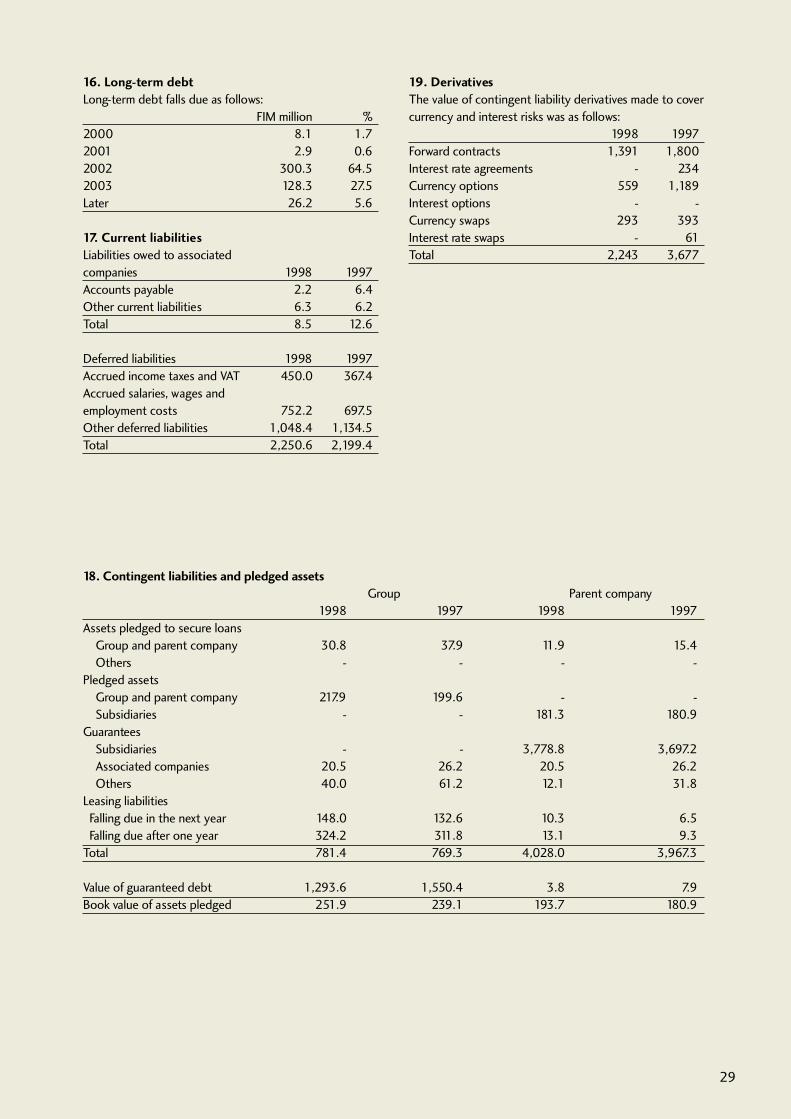
16. Long-term debt
Long-term debt falls due as follows:
FIM million %
2000 8.1 1.7
2001 2.9 0.6
2002 300.3 64.5
2003 128.3 27.5
Later 26.2 5.6
17. Current liabilities
Liabilities owed to associated
companies 1998 1997
Accounts payable 2.2 6.4
Other current liabilities 6.3 6.2
Total 8.5 12.6
Deferred liabilities 1998 1997
Accrued income taxes and VAT 450.0 367.4
Accrued salaries, wages and
employment costs 752.2 697.5
Other deferred liabilities 1,048.4 1,134.5
Total 2,250.6 2,199.4
19. Derivatives
The value of contingent liability derivatives made to cover
currency and interest risks was as follows:
1998 1997
Forward contracts 1,391 1,800
Interest rate agreements - 234
Currency options 559 1,189
Interest options - -
Currency swaps 293 393
Interest rate swaps - 61
Total 2,243 3,677
18. Contingent liabilities and pledged assets
Group Parent company
1998 1997 1998 1997
Assets pledged to secure loans
Group and parent company 30.8 37.9 11.9 15.4
Others - - - -
Pledged assets
Group and parent company 217.9 199.6 - -
Subsidiaries - - 181.3 180.9
Guarantees
Subsidiaries - - 3,778.8 3,697.2
Associated companies 20.5 26.2 20.5 26.2
Others 40.0 61.2 12.1 31.8
Leasing liabilities
Falling due in the next year 148.0 132.6 10.3 6.5
Falling due after one year 324.2 311.8 13.1 9.3
Total 781.4 769.3 4,028.0 3,967.3
Value of guaranteed debt 1,293.6 1,550.4 3.8 7.9
Book value of assets pledged 251.9 239.1 193.7 180.9
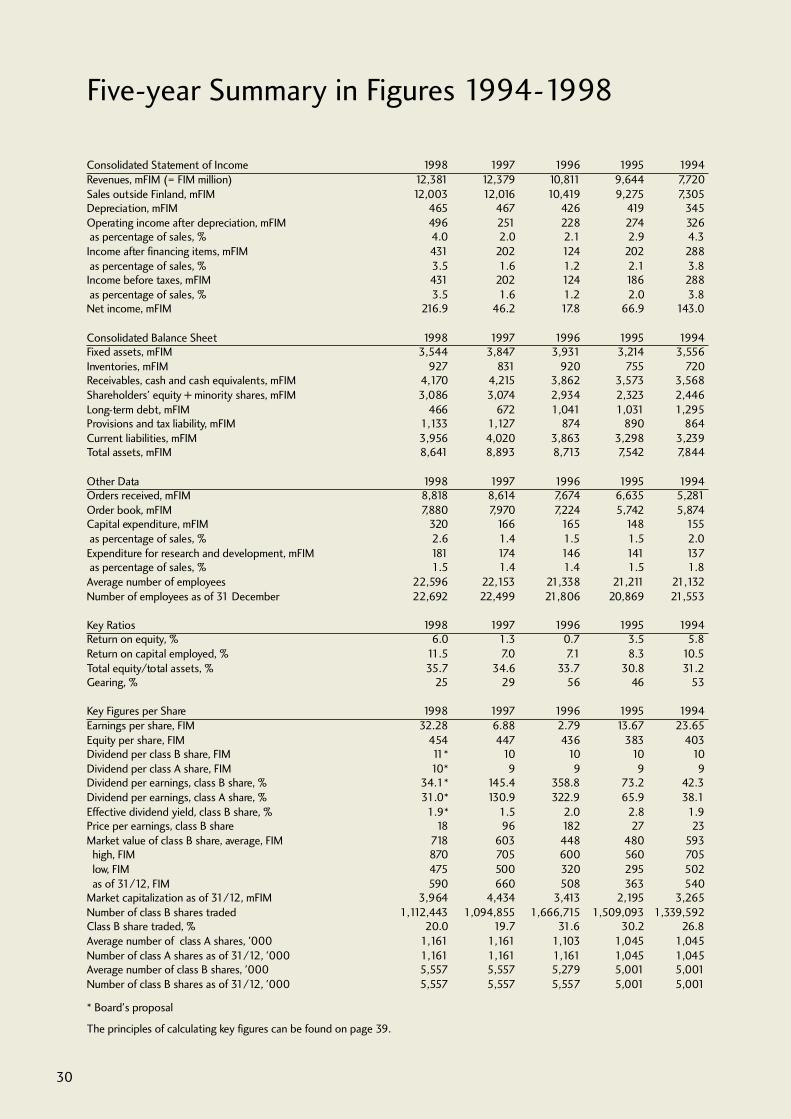
Five-year Summary in Figures 1994-1998
30
Consolidated Statement of Income 1998 1997 1996 1995 1994Revenues, mFIM (= FIM million) 12,381 12,379 10,811 9,644 7,720Sales outside Finland, mFIM 12,003 12,016 10,419 9,275 7,305Depreciation, mFIM 465 467 426 419 345Operating income after depreciation, mFIM 496 251 228 274 326 as percentage of sales, % 4.0 2.0 2.1 2.9 4.3Income after financing items, mFIM 431 202 124 202 288 as percentage of sales, % 3.5 1.6 1.2 2.1 3.8Income before taxes, mFIM 431 202 124 186 288 as percentage of sales, % 3.5 1.6 1.2 2.0 3.8Net income, mFIM 216.9 46.2 17.8 66.9 143.0
Consolidated Balance Sheet 1998 1997 1996 1995 1994Fixed assets, mFIM 3,544 3,847 3,931 3,214 3,556Inventories, mFIM 927 831 920 755 720Receivables, cash and cash equivalents, mFIM 4,170 4,215 3,862 3,573 3,568Shareholders' equity + minority shares, mFIM 3,086 3,074 2,934 2,323 2,446Long-term debt, mFIM 466 672 1,041 1,031 1,295Provisions and tax liability, mFIM 1,133 1,127 874 890 864Current liabilities, mFIM 3,956 4,020 3,863 3,298 3,239Total assets, mFIM 8,641 8,893 8,713 7,542 7,844
Other Data 1998 1997 1996 1995 1994Orders received, mFIM 8,818 8,614 7,674 6,635 5,281Order book, mFIM 7,880 7,970 7,224 5,742 5,874Capital expenditure, mFIM 320 166 165 148 155 as percentage of sales, % 2.6 1.4 1.5 1.5 2.0Expenditure for research and development, mFIM 181 174 146 141 137 as percentage of sales, % 1.5 1.4 1.4 1.5 1.8Average number of employees 22,596 22,153 21,338 21,211 21,132Number of employees as of 31 December 22,692 22,499 21,806 20,869 21,553
Key Ratios 1998 1997 1996 1995 1994Return on equity, % 6.0 1.3 0.7 3.5 5.8Return on capital employed, % 11.5 7.0 7.1 8.3 10.5Total equity/total assets, % 35.7 34.6 33.7 30.8 31.2Gearing, % 25 29 56 46 53
Key Figures per Share 1998 1997 1996 1995 1994Earnings per share, FIM 32.28 6.88 2.79 13.67 23.65Equity per share, FIM 454 447 436 383 403Dividend per class B share, FIM 11* 10 10 10 10Dividend per class A share, FIM 10* 9 9 9 9Dividend per earnings, class B share, % 34.1* 145.4 358.8 73.2 42.3Dividend per earnings, class A share, % 31.0* 130.9 322.9 65.9 38.1Effective dividend yield, class B share, % 1.9* 1.5 2.0 2.8 1.9Price per earnings, class B share 18 96 182 27 23Market value of class B share, average, FIM 718 603 448 480 593 high, FIM 870 705 600 560 705 low, FIM 475 500 320 295 502 as of 31/12, FIM 590 660 508 363 540Market capitalization as of 31/12, mFIM 3,964 4,434 3,413 2,195 3,265Number of class B shares traded 1,112,443 1,094,855 1,666,715 1,509,093 1,339,592Class B share traded, % 20.0 19.7 31.6 30.2 26.8Average number of class A shares, '000 1,161 1,161 1,103 1,045 1,045Number of class A shares as of 31/12, '000 1,161 1,161 1,161 1,045 1,045Average number of class B shares, '000 5,557 5,557 5,279 5,001 5,001Number of class B shares as of 31/12, '000 5,557 5,557 5,557 5,001 5,001
* Board's proposal
The principles of calculating key figures can be found on page 39.
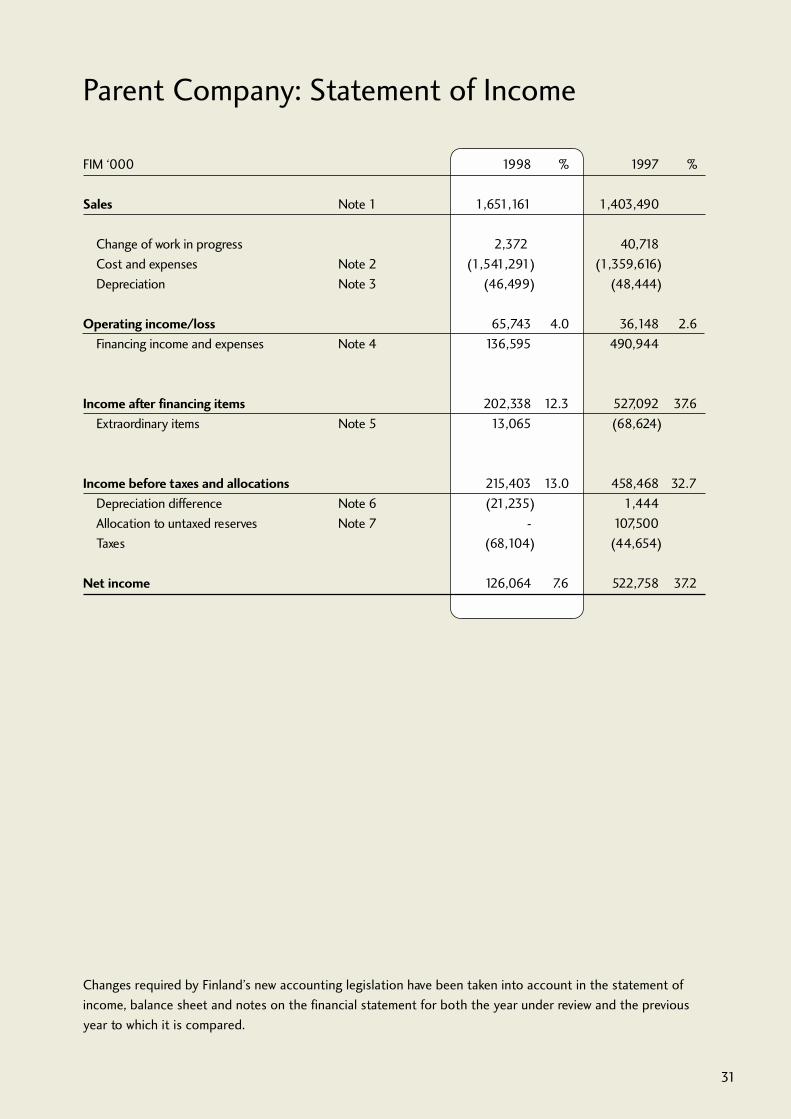
Parent Company: Statement of Income
31
Changes required by Finland’s new accounting legislation have been taken into account in the statement of
income, balance sheet and notes on the financial statement for both the year under review and the previous
year to which it is compared.
FIM ‘000 1998 % 1997 %
Sales Note 1 1,651,161 1,403,490
Change of work in progress 2,372 40,718
Cost and expenses Note 2 (1,541,291) (1,359,616)
Depreciation Note 3 (46,499) (48,444)
Operating income/loss 65,743 4.0 36,148 2.6
Financing income and expenses Note 4 136,595 490,944
Income after financing items 202,338 12.3 527,092 37.6
Extraordinary items Note 5 13,065 (68,624)
Income before taxes and allocations 215,403 13.0 458,468 32.7
Depreciation difference Note 6 (21,235) 1,444
Allocation to untaxed reserves Note 7 - 107,500
Taxes (68,104) (44,654)
Net income 126,064 7.6 522,758 37.2
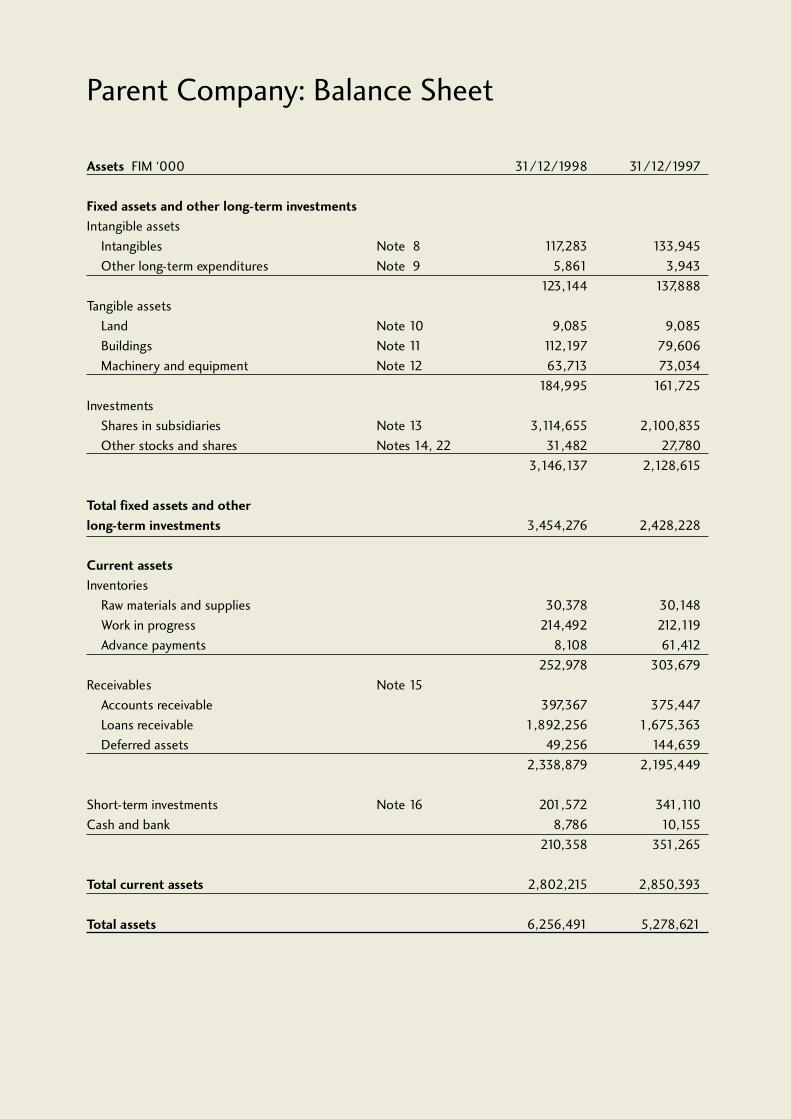
Parent Company: Balance Sheet
Assets FIM ‘000 31/12/1998 31/12/1997
Fixed assets and other long-term investments
Intangible assets
Intangibles Note 8 117,283 133,945
Other long-term expenditures Note 9 5,861 3,943
123,144 137,888
Tangible assets
Land Note 10 9,085 9,085
Buildings Note 11 112,197 79,606
Machinery and equipment Note 12 63,713 73,034
184,995 161,725
Investments
Shares in subsidiaries Note 13 3,114,655 2,100,835
Other stocks and shares Notes 14, 22 31,482 27,780
3,146,137 2,128,615
Total fixed assets and other
long-term investments 3,454,276 2,428,228
Current assets
Inventories
Raw materials and supplies 30,378 30,148
Work in progress 214,492 212,119
Advance payments 8,108 61,412
252,978 303,679
Receivables Note 15
Accounts receivable 397,367 375,447
Loans receivable 1,892,256 1,675,363
Deferred assets 49,256 144,639
2,338,879 2,195,449
Short-term investments Note 16 201,572 341,110
Cash and bank 8,786 10,155
210,358 351,265
Total current assets 2,802,215 2,850,393
Total assets 6,256,491 5,278,621

33
Shareholders' equity and liabilities FIM ‘000 31/12/1998 31/12/1997
Shareholders' equity
Share capital 335,909 335,909
Share premium account 594,180 594,180
Retained earnings 3,195,897 2,739,158
Net income 126,064 522,758
Note 17 4,252,050 4,192,005
Untaxed reserves Note 18 39,351 17,918
Provision for liabilities and charges Note 19 31,643 33,807
Liabilities Note 20
Long-term debt Note 21
Loans from financial institutions 5,200 117,349
Current liabilities
Loans from financial institutions 12,123 4,223
Advances received 119,791 180,908
Accounts payable 174,657 138,664
Other current liabilities 277,889 428,853
Accruals 1,343,787 164,894
1,928,247 917,542
Total debt 1,933,447 1,034,891
Total shareholders’ equity and liabilities 6,256,491 5,278,621
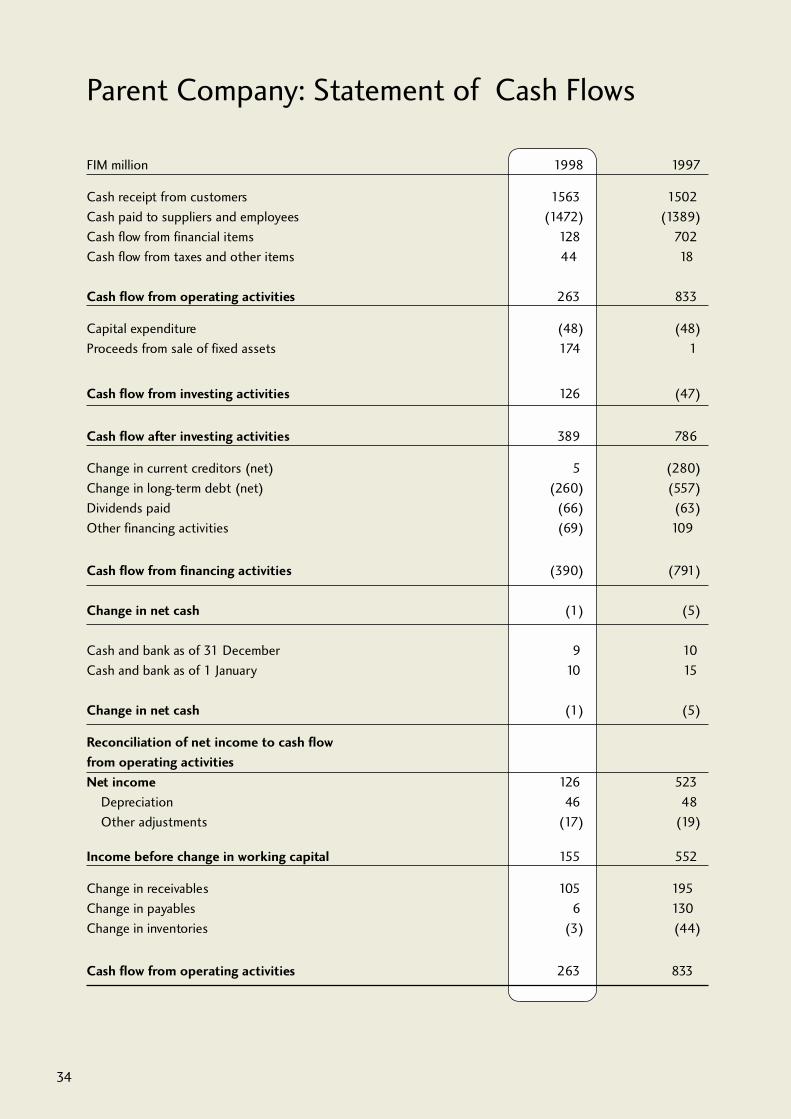
Parent Company: Statement of Cash Flows
34
FIM million 1998 1997
Cash receipt from customers 1563 1502
Cash paid to suppliers and employees (1472) (1389)
Cash flow from financial items 128 702
Cash flow from taxes and other items 44 18
Cash flow from operating activities 263 833
Capital expenditure (48) (48)
Proceeds from sale of fixed assets 174 1
Cash flow from investing activities 126 (47)
Cash flow after investing activities 389 786
Change in current creditors (net) 5 (280)
Change in long-term debt (net) (260) (557)
Dividends paid (66) (63)
Other financing activities (69) 109
Cash flow from financing activities (390) (791)
Change in net cash (1) (5)
Cash and bank as of 31 December 9 10
Cash and bank as of 1 January 10 15
Change in net cash (1) (5)
Reconciliation of net income to cash flow
from operating activities
Net income 126 523
Depreciation 46 48
Other adjustments (17) (19)
Income before change in working capital 155 552
Change in receivables 105 195
Change in payables 6 130
Change in inventories (3) (44)
Cash flow from operating activities 263 833
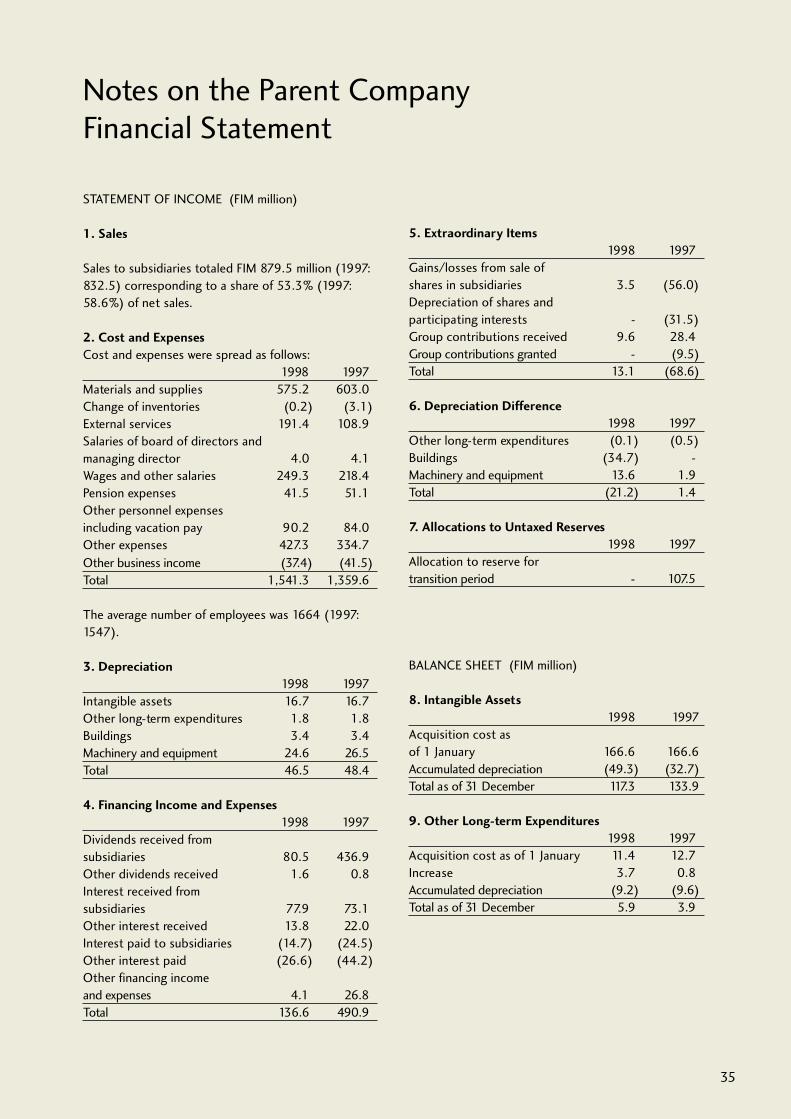
Notes on the Parent CompanyFinancial Statement
35
STATEMENT OF INCOME (FIM million)
1. Sales
Sales to subsidiaries totaled FIM 879.5 million (1997:
832.5) corresponding to a share of 53.3% (1997:
58.6%) of net sales.
2. Cost and Expenses
Cost and expenses were spread as follows:
1998 1997
Materials and supplies 575.2 603.0
Change of inventories (0.2) (3.1)
External services 191.4 108.9
Salaries of board of directors and
managing director 4.0 4.1
Wages and other salaries 249.3 218.4
Pension expenses 41.5 51.1
Other personnel expenses
including vacation pay 90.2 84.0
Other expenses 427.3 334.7
Other business income (37.4) (41.5)
Total 1,541.3 1,359.6
The average number of employees was 1664 (1997:
1547).
3. Depreciation
1998 1997
Intangible assets 16.7 16.7
Other long-term expenditures 1.8 1.8
Buildings 3.4 3.4
Machinery and equipment 24.6 26.5
Total 46.5 48.4
4. Financing Income and Expenses
1998 1997
Dividends received from
subsidiaries 80.5 436.9
Other dividends received 1.6 0.8
Interest received from
subsidiaries 77.9 73.1
Other interest received 13.8 22.0
Interest paid to subsidiaries (14.7) (24.5)
Other interest paid (26.6) (44.2)
Other financing income
and expenses 4.1 26.8
Total 136.6 490.9
5. Extraordinary Items
1998 1997
Gains/losses from sale of
shares in subsidiaries 3.5 (56.0)
Depreciation of shares and
participating interests - (31.5)
Group contributions received 9.6 28.4
Group contributions granted - (9.5)
Total 13.1 (68.6)
6. Depreciation Difference
1998 1997
Other long-term expenditures (0.1) (0.5)
Buildings (34.7) -
Machinery and equipment 13.6 1.9
Total (21.2) 1.4
7. Allocations to Untaxed Reserves
1998 1997
Allocation to reserve for
transition period - 107.5
BALANCE SHEET (FIM million)
8. Intangible Assets
1998 1997
Acquisition cost as
of 1 January 166.6 166.6
Accumulated depreciation (49.3) (32.7)
Total as of 31 December 117.3 133.9
9. Other Long-term Expenditures
1998 1997
Acquisition cost as of 1 January 11.4 12.7
Increase 3.7 0.8
Accumulated depreciation (9.2) (9.6)
Total as of 31 December 5.9 3.9
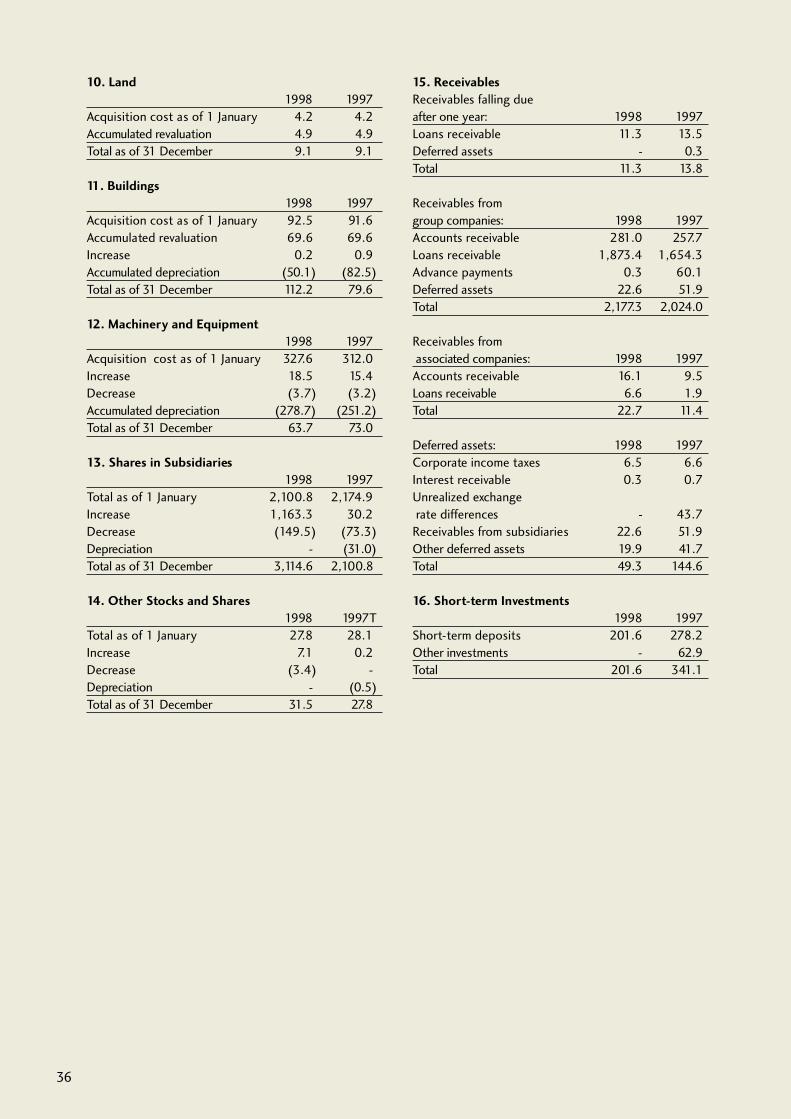
36
10. Land
1998 1997
Acquisition cost as of 1 January 4.2 4.2
Accumulated revaluation 4.9 4.9
Total as of 31 December 9.1 9.1
11. Buildings
1998 1997
Acquisition cost as of 1 January 92.5 91.6
Accumulated revaluation 69.6 69.6
Increase 0.2 0.9
Accumulated depreciation (50.1) (82.5)
Total as of 31 December 112.2 79.6
12. Machinery and Equipment
1998 1997
Acquisition cost as of 1 January 327.6 312.0
Increase 18.5 15.4
Decrease (3.7) (3.2)
Accumulated depreciation (278.7) (251.2)
Total as of 31 December 63.7 73.0
13. Shares in Subsidiaries
1998 1997
Total as of 1 January 2,100.8 2,174.9
Increase 1,163.3 30.2
Decrease (149.5) (73.3)
Depreciation - (31.0)
Total as of 31 December 3,114.6 2,100.8
14. Other Stocks and Shares
1998 1997T
Total as of 1 January 27.8 28.1
Increase 7.1 0.2
Decrease (3.4) -
Depreciation - (0.5)
Total as of 31 December 31.5 27.8
15. Receivables
Receivables falling due
after one year: 1998 1997
Loans receivable 11.3 13.5
Deferred assets - 0.3
Total 11.3 13.8
Receivables from
group companies: 1998 1997
Accounts receivable 281.0 257.7
Loans receivable 1,873.4 1,654.3
Advance payments 0.3 60.1
Deferred assets 22.6 51.9
Total 2,177.3 2,024.0
Receivables from
associated companies: 1998 1997
Accounts receivable 16.1 9.5
Loans receivable 6.6 1.9
Total 22.7 11.4
Deferred assets: 1998 1997
Corporate income taxes 6.5 6.6
Interest receivable 0.3 0.7
Unrealized exchange
rate differences - 43.7
Receivables from subsidiaries 22.6 51.9
Other deferred assets 19.9 41.7
Total 49.3 144.6
16. Short-term Investments
1998 1997
Short-term deposits 201.6 278.2
Other investments - 62.9
Total 201.6 341.1
37
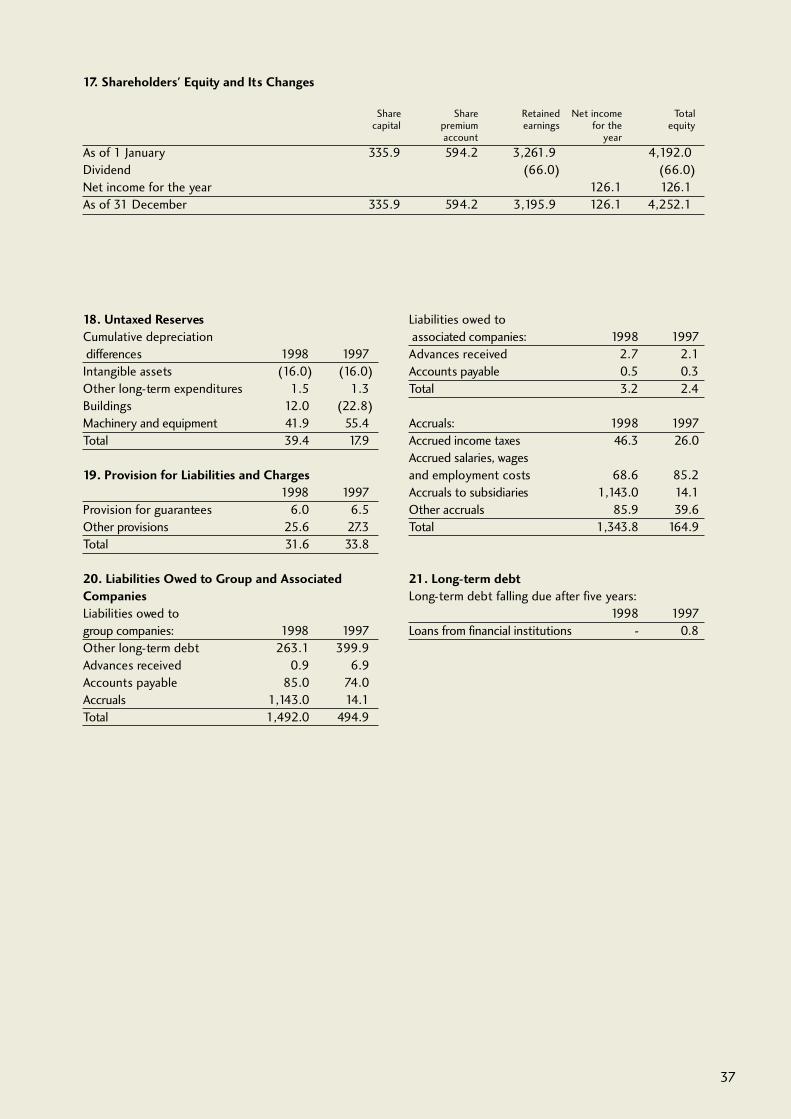
18. Untaxed Reserves
Cumulative depreciation
differences 1998 1997
Intangible assets (16.0) (16.0)
Other long-term expenditures 1.5 1.3
Buildings 12.0 (22.8)
Machinery and equipment 41.9 55.4
Total 39.4 17.9
19. Provision for Liabilities and Charges
1998 1997
Provision for guarantees 6.0 6.5
Other provisions 25.6 27.3
Total 31.6 33.8
20. Liabilities Owed to Group and Associated
Companies
Liabilities owed to
group companies: 1998 1997
Other long-term debt 263.1 399.9
Advances received 0.9 6.9
Accounts payable 85.0 74.0
Accruals 1,143.0 14.1
Total 1,492.0 494.9
17. Shareholders' Equity and Its Changes
Share Share Retained Net income Totalcapital premium earnings for the equity
account year
As of 1 January 335.9 594.2 3,261.9 4,192.0
Dividend (66.0) (66.0)
Net income for the year 126.1 126.1
As of 31 December 335.9 594.2 3,195.9 126.1 4,252.1
Liabilities owed to
associated companies: 1998 1997
Advances received 2.7 2.1
Accounts payable 0.5 0.3
Total 3.2 2.4
Accruals: 1998 1997
Accrued income taxes 46.3 26.0
Accrued salaries, wages
and employment costs 68.6 85.2
Accruals to subsidiaries 1,143.0 14.1
Other accruals 85.9 39.6
Total 1,343.8 164.9
21. Long-term debt
Long-term debt falling due after five years:
1998 1997
Loans from financial institutions - 0.8
38
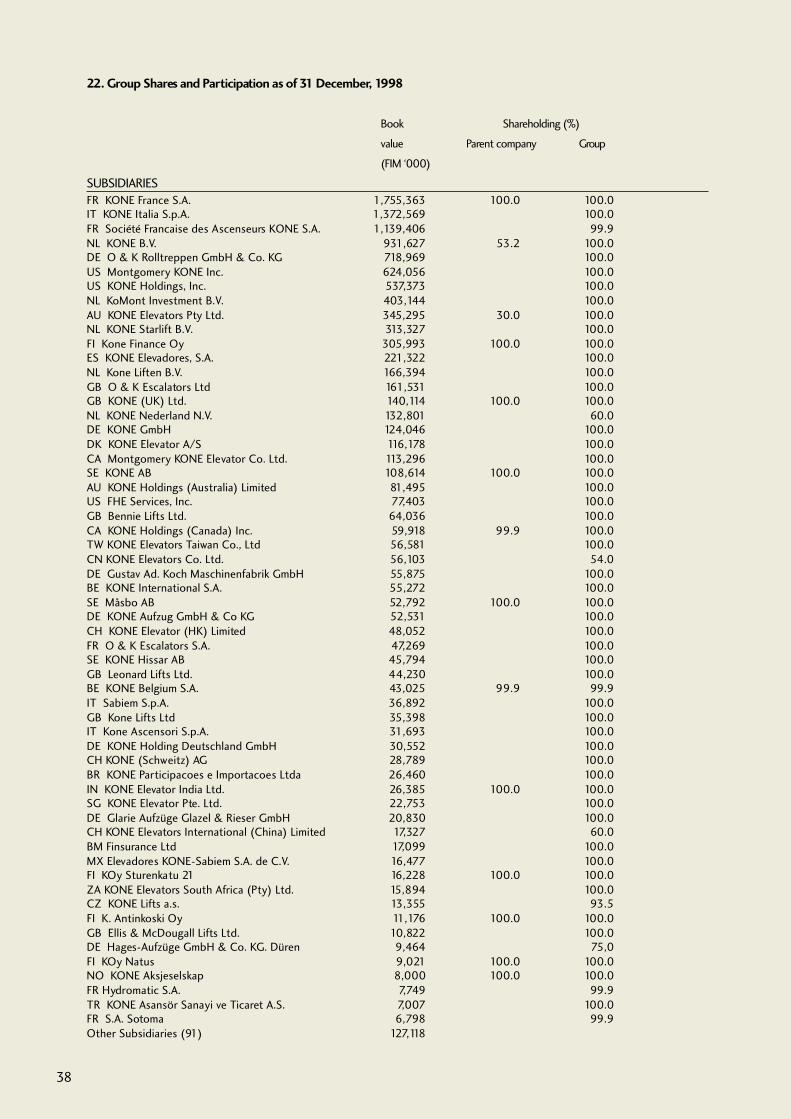
22. Group Shares and Participation as of 31 December, 1998
Book Shareholding (%)
value Parent company Group
(FIM ‘000)
SUBSIDIARIES
FR KONE France S.A. 1,755,363 100.0 100.0IT KONE Italia S.p.A. 1,372,569 100.0FR Société Francaise des Ascenseurs KONE S.A. 1,139,406 99.9NL KONE B.V. 931,627 53.2 100.0DE O & K Rolltreppen GmbH & Co. KG 718,969 100.0US Montgomery KONE Inc. 624,056 100.0US KONE Holdings, Inc. 537,373 100.0NL KoMont Investment B.V. 403,144 100.0AU KONE Elevators Pty Ltd. 345,295 30.0 100.0NL KONE Starlift B.V. 313,327 100.0FI Kone Finance Oy 305,993 100.0 100.0ES KONE Elevadores, S.A. 221,322 100.0NL Kone Liften B.V. 166,394 100.0GB O & K Escalators Ltd 161,531 100.0GB KONE (UK) Ltd. 140,114 100.0 100.0NL KONE Nederland N.V. 132,801 60.0DE KONE GmbH 124,046 100.0DK KONE Elevator A/S 116,178 100.0CA Montgomery KONE Elevator Co. Ltd. 113,296 100.0SE KONE AB 108,614 100.0 100.0AU KONE Holdings (Australia) Limited 81,495 100.0US FHE Services, Inc. 77,403 100.0GB Bennie Lifts Ltd. 64,036 100.0CA KONE Holdings (Canada) Inc. 59,918 99.9 100.0TW KONE Elevators Taiwan Co., Ltd 56,581 100.0CN KONE Elevators Co. Ltd. 56,103 54.0DE Gustav Ad. Koch Maschinenfabrik GmbH 55,875 100.0BE KONE International S.A. 55,272 100.0SE Måsbo AB 52,792 100.0 100.0DE KONE Aufzug GmbH & Co KG 52,531 100.0CH KONE Elevator (HK) Limited 48,052 100.0FR O & K Escalators S.A. 47,269 100.0SE KONE Hissar AB 45,794 100.0GB Leonard Lifts Ltd. 44,230 100.0BE KONE Belgium S.A. 43,025 99.9 99.9IT Sabiem S.p.A. 36,892 100.0GB Kone Lifts Ltd 35,398 100.0IT Kone Ascensori S.p.A. 31,693 100.0DE KONE Holding Deutschland GmbH 30,552 100.0CH KONE (Schweitz) AG 28,789 100.0BR KONE Participacoes e Importacoes Ltda 26,460 100.0IN KONE Elevator India Ltd. 26,385 100.0 100.0SG KONE Elevator Pte. Ltd. 22,753 100.0DE Glarie Aufzüge Glazel & Rieser GmbH 20,830 100.0CH KONE Elevators International (China) Limited 17,327 60.0BM Finsurance Ltd 17,099 100.0MX Elevadores KONE-Sabiem S.A. de C.V. 16,477 100.0FI KOy Sturenkatu 21 16,228 100.0 100.0ZA KONE Elevators South Africa (Pty) Ltd. 15,894 100.0CZ KONE Lifts a.s. 13,355 93.5FI K. Antinkoski Oy 11,176 100.0 100.0GB Ellis & McDougall Lifts Ltd. 10,822 100.0DE Hages-Aufzüge GmbH & Co. KG. Düren 9,464 75,0FI KOy Natus 9,021 100.0 100.0NO KONE Aksjeselskap 8,000 100.0 100.0FR Hydromatic S.A. 7,749 99.9TR KONE Asansör Sanayi ve Ticaret A.S. 7,007 100.0FR S.A. Sotoma 6,798 99.9Other Subsidiaries (91) 127,118
39
Calculation of Key Figures
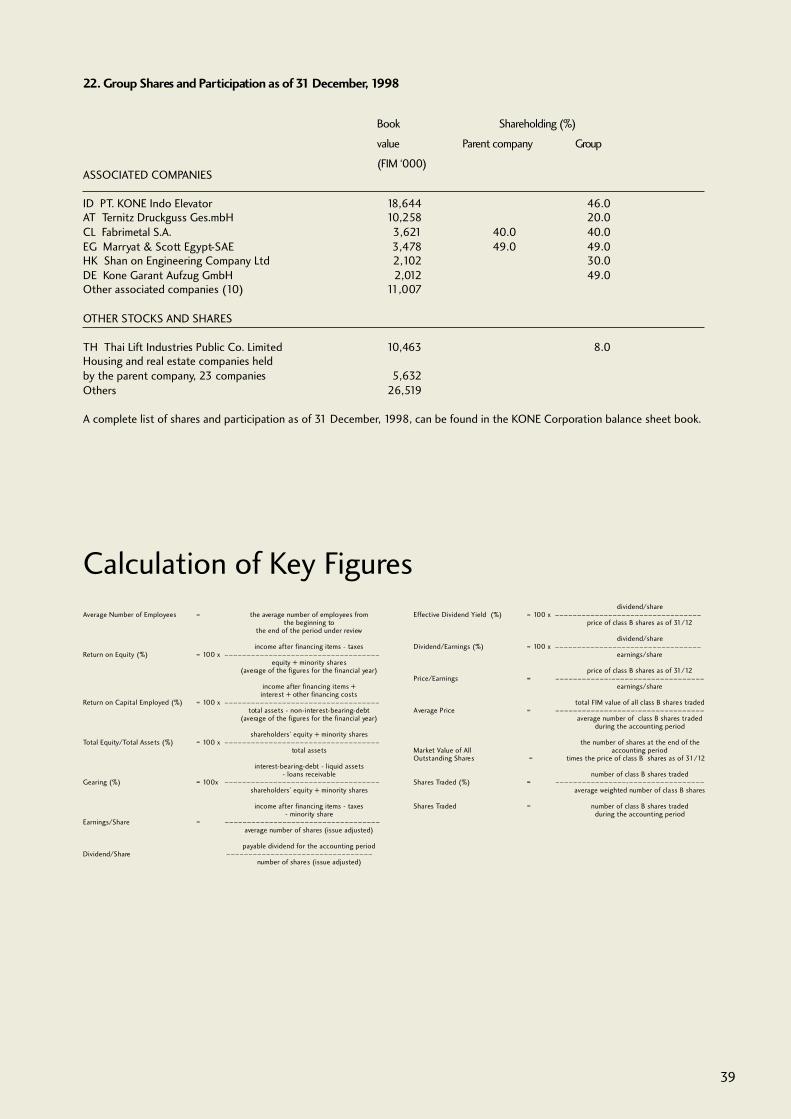
22. Group Shares and Participation as of 31 December, 1998
Book Shareholding (%)
value Parent company Group
(FIM ‘000)
Average Number of Employees = the average number of employees fromthe beginning to
the end of the period under review
income after financing items - taxesReturn on Equity (%) = 100 x –––––––––––––––––––––––––––––––––––
equity + minority shares(average of the figures for the financial year)
income after financing items +interest + other financing costs
Return on Capital Employed (%) = 100 x –––––––––––––––––––––––––––––––––––total assets - non-interest-bearing-debt
(average of the figures for the financial year)
shareholders’ equity + minority sharesTotal Equity/Total Assets (%) = 100 x –––––––––––––––––––––––––––––––––––
total assets
interest-bearing-debt - liquid assets- loans receivable
Gearing (%) = 100x –––––––––––––––––––––––––––––––––––shareholders’ equity + minority shares
income after financing items - taxes- minority share
Earnings/Share = –––––––––––––––––––––––––––––––––––average number of shares (issue adjusted)
payable dividend for the accounting periodDividend/Share –––––––––––––––––––––––––––––––––
number of shares (issue adjusted)
dividend/shareEffective Dividend Yield (%) = 100 x –––––––––––––––––––––––––––––––––
price of class B shares as of 31/12
dividend/shareDividend/Earnings (%) = 100 x –––––––––––––––––––––––––––––––––
earnings/share
price of class B shares as of 31/12Price/Earnings = ––––––––––––-–––––––––––––––––––––
earnings/share
total FIM value of all class B shares tradedAverage Price = ––––––––––––––––––-–––––––––––––––
average number of class B shares tradedduring the accounting period
the number of shares at the end of theMarket Value of All accounting periodOutstanding Shares = times the price of class B shares as of 31/12
number of class B shares tradedShares Traded (%) = ––––––––––––––––-–––––––––––––––––
average weighted number of class B shares
Shares Traded = number of class B shares tradedduring the accounting period
ASSOCIATED COMPANIES
ID PT. KONE Indo Elevator 18,644 46.0AT Ternitz Druckguss Ges.mbH 10,258 20.0CL Fabrimetal S.A. 3,621 40.0 40.0EG Marryat & Scott Egypt-SAE 3,478 49.0 49.0HK Shan on Engineering Company Ltd 2,102 30.0DE Kone Garant Aufzug GmbH 2,012 49.0Other associated companies (10) 11,007
OTHER STOCKS AND SHARES
TH Thai Lift Industries Public Co. Limited 10,463 8.0Housing and real estate companies heldby the parent company, 23 companies 5,632Others 26,519
A complete list of shares and participation as of 31 December, 1998, can be found in the KONE Corporation balance sheet book.

40
Board of Directors’ Proposal to theAnnual General MeetingKONE’s distributable equity as of 31 December, 1998 is FIM 2,195.6 million.The parent company’s distributable equity on 31 December, 1998 is FIM3,321,961,127.76 of which net profit from the accounting period under review isFIM 126,064,410.06.
The Board of Directors proposes to the Annual General Meeting that a dividendof FIM 10 be paid on the 1,161,647 class A shares and FIM 11 on the5,556,533 class B shares, for a total of FIM 72,738,333.00. The Board ofDirectors further proposes that the rest (FIM 3,249,222,794.76) be retainedand carried forward.
The Board proposes that the dividends be payable from 8 March, 1999. Thoseshareholders who have not transferred their stock certificates to the paperlessbook entry security system by 3 March, 1999 will only receive their dividendsafter the transfer has been completed.
Helsinki, 5 February, 1999
Pekka Herlin Antti Herlin
Ilkka Herlin Gerhard Wendt
Iiro Viinanen
Jean-Pierre Chauvarie
President
To the shareholders of Kone Corporation
We have audited the accounts, the financial statements and the corporate gover-nance of Kone Corporation for the financial year 1998. The financial statementsprepared by the Board of Directors and the Managing Director include, both for thegroup and the parent company, a report on operations, an income statement, abalance sheet and notes to the accounts. Based on our audit we express an opinionon these financial statements and on corporate governance.
We have conducted the audit in accordance with Finnish Standards on Auditing.Those standards require that we perform the audit to obtain reasonable assurancewhether the financial statements are free of material misstatement. An audit includesexamining on a test basis evidence supporting the amounts and disclosures in thefinancial statements, assessing the accounting principles used as well as evaluatingthe overall financial statement presentation.
In our opinion the financial statements have been prepared in accordance with theAccounting Act and other rules and regulations relevant to the preparation offinancial statements, and give a true and fair view of Kone Corporation's and theGroup of Companies' results and financial position. The financial statements can beapproved and the members of the Board of Directors and the Managing Director ofthe parent company can be discharged from liability for the financial year audited byus. The proposal of the Board of Directors concerning the disposal of the profit forthe year is in compliance with the Companies' Act.
We have reviewed the interim reports published during the financial year. In ouropinion they have been properly prepared.
Helsinki, 5th February 1999
Liisa Mononen SVH Pricewaterhouse Coopers Oy
Authorised Public Accountant Authorised Public Accountants
Jukka Ala-Mello
Authorised Public Accountant
Auditors’ Report

41
Consolidated Income Statementand Balance Sheet in EurosIncome Statement, € million 1998 1997
Sales 2,082.3 2,082.1
Costs and expenses (1,998.8) (2,039.9)
Operating income 83.5 42.2
Financing income and expenses (11.0) (8.2)
Income after financing items 72.5 34.0
Extraordinary items 0.0 0.0
Income before taxes 72.5 34.0
Taxes (41.3) (27.6)
Minority share 5.3 1.3
Net income 36.5 7.8
Balance Sheet, € million 31/12/1998 31/12/1997
Fixed assets 596.1 647.0
Inventories 155.8 139.8
Receivables, deposits and cash 701.3 708.9
Assets, total 1,453.2 1,495.7
Shareholders’ equity 512.9 504.9
Minority shares 6.2 12.0
Provision for liability and charges 182.0 174.9
Deferred tax liability 19.2 14.7
Long-term debt 78.4 113.0
Current liabilities 654.7 676.1
Shareholders´equity and liabilities, total 1,453.2 1,495.7
Other data 1998 1997
Orders received, € million 1,483.1 1,448.8
Order book 31/12, € million 1,325.3 1,340.5
Net debt 31/12, € million 131.0 152.0
Earnings/share, € 5.4 1.2
Equity/share 31/12, € 76.3 75.2
The figures in Finnish markkas have been translated into euros using the official exchange rate (1 EUR = FIM
5.94573).
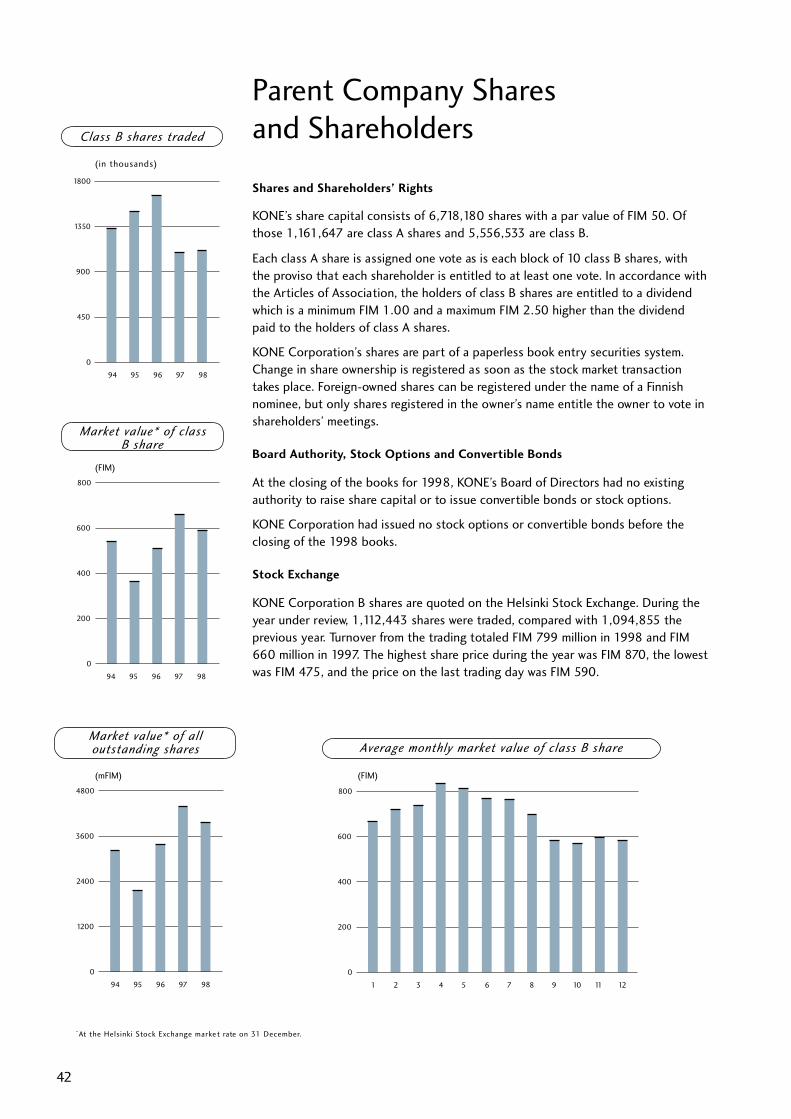
Parent Company Sharesand Shareholders
(in thousands)
Market value* of classB share
(FIM)
Market value* of alloutstanding shares
(mFIM)
Average monthly market value of class B share
42
(FIM)
Class B shares traded
*At the Helsinki Stock Exchange market rate on 31 December.
Shares and Shareholders’ Rights
KONE’s share capital consists of 6,718,180 shares with a par value of FIM 50. Of
those 1,161,647 are class A shares and 5,556,533 are class B.
Each class A share is assigned one vote as is each block of 10 class B shares, with
the proviso that each shareholder is entitled to at least one vote. In accordance with
the Articles of Association, the holders of class B shares are entitled to a dividend
which is a minimum FIM 1.00 and a maximum FIM 2.50 higher than the dividend
paid to the holders of class A shares.
KONE Corporation’s shares are part of a paperless book entry securities system.
Change in share ownership is registered as soon as the stock market transaction
takes place. Foreign-owned shares can be registered under the name of a Finnish
nominee, but only shares registered in the owner’s name entitle the owner to vote in
shareholders’ meetings.
Board Authority, Stock Options and Convertible Bonds
At the closing of the books for 1998, KONE’s Board of Directors had no existing
authority to raise share capital or to issue convertible bonds or stock options.
KONE Corporation had issued no stock options or convertible bonds before the
closing of the 1998 books.
Stock Exchange
KONE Corporation B shares are quoted on the Helsinki Stock Exchange. During the
year under review, 1,112,443 shares were traded, compared with 1,094,855 the
previous year. Turnover from the trading totaled FIM 799 million in 1998 and FIM
660 million in 1997. The highest share price during the year was FIM 870, the lowest
was FIM 475, and the price on the last trading day was FIM 590.
450
900
1350
0
94 95 96 97 98
1800
200
400
600
0
94 95 96 97 98
800
1200
2400
3600
0
94 95 96 97 98
4800
200
400
600
0
1 2 3 4 5
800
6 7 8 9 10 11 12
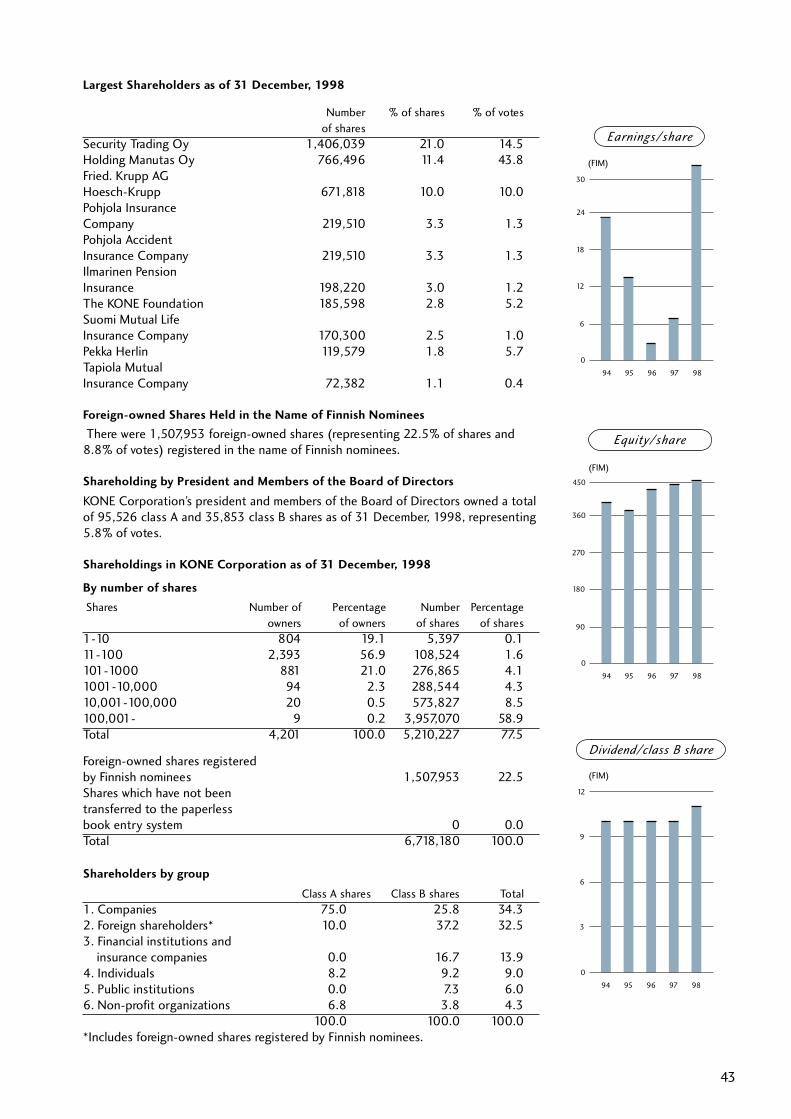
(FIM)
Equity/share
(FIM)
Dividend/class B share
(FIM)
43
Earnings/share
Largest Shareholders as of 31 December, 1998
Number % of shares % of votes
of shares
Security Trading Oy 1,406,039 21.0 14.5Holding Manutas Oy 766,496 11.4 43.8Fried. Krupp AGHoesch-Krupp 671,818 10.0 10.0Pohjola InsuranceCompany 219,510 3.3 1.3Pohjola AccidentInsurance Company 219,510 3.3 1.3Ilmarinen PensionInsurance 198,220 3.0 1.2The KONE Foundation 185,598 2.8 5.2Suomi Mutual LifeInsurance Company 170,300 2.5 1.0Pekka Herlin 119,579 1.8 5.7Tapiola MutualInsurance Company 72,382 1.1 0.4
Foreign-owned Shares Held in the Name of Finnish Nominees
There were 1,507,953 foreign-owned shares (representing 22.5% of shares and8.8% of votes) registered in the name of Finnish nominees.
Shareholding by President and Members of the Board of Directors
KONE Corporation’s president and members of the Board of Directors owned a totalof 95,526 class A and 35,853 class B shares as of 31 December, 1998, representing5.8% of votes.
Shareholdings in KONE Corporation as of 31 December, 1998
By number of shares
Shares Number of Percentage Number Percentage
owners of owners of shares of shares
1-10 804 19.1 5,397 0.111-100 2,393 56.9 108,524 1.6101-1000 881 21.0 276,865 4.11001-10,000 94 2.3 288,544 4.310,001-100,000 20 0.5 573,827 8.5100,001- 9 0.2 3,957,070 58.9Total 4,201 100.0 5,210,227 77.5
Foreign-owned shares registeredby Finnish nominees 1,507,953 22.5Shares which have not beentransferred to the paperlessbook entry system 0 0.0Total 6,718,180 100.0
Shareholders by group
Class A shares Class B shares Total
1. Companies 75.0 25.8 34.32. Foreign shareholders* 10.0 37.2 32.53. Financial institutions and insurance companies 0.0 16.7 13.94. Individuals 8.2 9.2 9.05. Public institutions 0.0 7.3 6.06. Non-profit organizations 6.8 3.8 4.3
100.0 100.0 100.0*Includes foreign-owned shares registered by Finnish nominees.
0
94 95 96 97 98
6
12
18
30
24
0
94 95 96 97 98
90
180
270
450
360
0
94 95 96 97 98
3
6
9
12
Imagine three elevators in three adjacent buildings, all the same height. One buildingis crowded with businesses and restaurants so that its elevators keep runningvirtually non-stop all day and evening long. The second is in an office buildingoccupied by companies that work from nine to five and don’t receive many visitors.The third building is largely vacant while awaiting major refurbishment. It is clearthat the elevator in the first building will handle much heavier traffic than the othertwo and that the third will not be used much at all. Yet until now, those elevatorswould have been likely to receive similar kinds and amounts of service becauseservice visits were assigned - often by law - according to the calendar.
Now that situation is changing, to the benefit of everyone concerned. KONE isintroducing performance-based maintenance to the market. Behind this concept is abasic change in business philosophy: customers should pay for the reliability andavailability of their equipment, not for service visits. KONE’s responsibility, which wasonce defined by the number of service visits and the time it took to respond tobreakdowns, now becomes optimizing the performance of equipment, enabling us toaccurately prioritize our time in order to achieve an even higher level of quality andvalue for our customers.
Remote Monitoring Makes the Difference
It has never been very easy to know exactly how much service an elevator needs.Modern data monitoring and processing, however, are turning estimation intoscience. Just as automakers can predict what kind of service is required after so manymiles or kilometers have been driven, an elevator company can tell what service isneeded according to the usage the elevator has received and the current perfor-mance of its components. Until now, that information simply hasn’t been availableon an elevator-by-elevator basis.
KONE’s KoneXion™ Data Link, introduced to the market last year, collects andtransmits the data needed to provide the most efficient maintenance to the KONE24-hour service center. In addition, it immediately warns the service center whensomething out of the ordinary occurs.
A malfunction may occur in a component that does not immediately prevent theelevator from functioning but could cause problems later on. Even passengers usingthe elevator would not be aware of such a situation, but KONE’s KoneXion™ DataLink would pick it up, inform the service center, and set in motion a chain of correc-tive actions. In many cases, the potential problem will be solved before any outsideKONE realizes it ever existed. Furthermore, the serviceperson responding to the callwill have received valuable information about the situation before driving to the siteand will be able to ensure that the appropriate tools and spare parts are takenalong.
KONE’s KoneXion™ Data Link also helps prevent unnecessary service visits causedby false alarms. If someone sends a false alarm by pushing the emergency button inthe elevator, KONE’s KoneXion™ Data Link will recognize that the elevator is stillrunning and inform the service center.
Modern Service EliminatesGuesswork
44

▼
45
Full Responsibility
Knowing precisely how much an elevator has been used and what condition keycomponents are in makes it possible for service resources to be allocated where andwhen they are most needed. Instead of providing too much attention to someelevators and too little to others, service personnel will be able to focus their effortswhere they will do the customer the most good.
Building owners and managers will also benefit from KONE’s KoneXion™ Data Linkby being able to follow the performance history of their equipment. If their contractis based on the availability and performance of their equipment, they will be able tosee that they are getting what they paid for. This transparency is necessary to justifytransferring full responsibility for the equipment’s performance to KONE and ensuresthat full and accurate information is available when decisions about upgrades andmodernizations are made.
Safety First
Safety continues to be our highest priority. In many countries, codes and govern-mental regulations have required two-way voice communication for many years. Inaddition, from the summer of 1999, all new elevators installed in EU countries willhave to be equipped with a voice communication system. KONE has offered itsKoneXion™ Voice Link to customers since the early 1990s as an add-on to new orexisting installations. This voice-based communication system between the elevatorand a 24-hour service center has proven easier to use and more reliable than anormal telephone connection.
KoneXion™ Voice Link can easily be expanded to include KONE’s KoneXion™Data Link. The former is reactive, proving useful when elevator operation is inter-rupted and a passenger requires assistance. KONE’s KoneXion™ Data Link isproactive, monitoring operations and signalling the need for service attention evenwhen no one is using the equipment. In addition to helping out when a problemoccurs, it triggers actions that prevent potentially dangerous situations or costlydisruptions from occurring in the first place.
KONE’s KoneXion™ Data Link remote monitoring can be added to existing eleva-tors regardless of which company was the original manufacturer of the equipment.The only requirement for installation of KONE’s KoneXion™ Data Link is a servicecontract with KONE.
▼
Addresses
46
(The number following the country name is the country code for use in dialing interna-
tional telephone calls.)
■ Subsidiary ▼ Joint Venture ● Other
HEAD OFFICE:KONE CorporationKartanontie 1P.O. Box 8FIN-00331 Helsinki☎ +358 204 751Tfx +358 204 75 4309
CORPORATE OFFICES:Munkkiniemen puistotie 25P.O. Box 8FIN-00331 Helsinki☎ +358 204 751Tfx +358 204 75 4496
EUROPE
AUSTRIA (43-):
■ KONE Sowitsch AGForchheimergasse 34Postfach 140A-1231 Wien☎ (0)1 86 367-0Tfx (0)1 86 367-221Harald Lyon
BELGIUM (32-):■ KONE Belgium S.A.Chaussée de Louvain, 1048B-1140 Brussels☎ (0)2 730 9211Tfx (0)2 730 9289Laurent Gielis
■ KONE International S.A.Avenue E. VanNieuwenhuyse, 6B-1160 Brussels☎ (0)2 67 69 211Tfx (0)2 67 69 391
CZECH REPUBLIC (420-):
■ KONE Lifts a.s.Pod sancemi 196CS-18074 Prague 9☎ (0)2 66 00 41 11Tfx (0)2 68 44 915Pierre Laforte
DENMARK (45-):
■ KONE Elevator A/SRebslagervej 8-16DK-2400 Copenhagen NV☎ 35 87 80 00Tfx 35 87 80 01Juha Mennander
ESTONIA (372-):▼ AS KandurMustamäe tee 18 A10617 Tallinn☎ (2)6 200 701Tfx (2)6 200 702Arvo Kost
FINLAND (358-):
● KONE CorporationExport and JointVenture OperationsMunkkiniemen puistotie 25P.O. Box 8FIN-00331 Helsinki☎ (0)204 751Tfx (0)204 75 4319Kari Malmström
● KONE BU2Hyvinkää UnitsKuumolankatu 1P.O. Box 670FIN-05801 Hyvinkää☎ (0)204 751Tfx (0)204 75 3290Teppo Raitis
● KONE Elevators FinlandSturenkatu 21P.O. Box 51FIN-00511 Helsinki☎ (0)204 7551Tfx (0)204 75 5751Tor-Erik Sandelin
■ KONE FinanceMunkkiniemen puistotie 25P.O. Box 8FIN-00331 Helsinki☎ (0)204 751Tfx (0)204 75 4432Helga Lavonen-Ronkainen
FRANCE (33-):
■ Société Française desAscenseurs KONÉCentre d'AffairesObjectif 22, rue Louis ArmandF-92661 Asnières Cedex☎ (0)1 41 32 12 50Tfx (0)1 47 93 51 81Eric Maziol
■ O&K Escalators S.A.Zone Industriellede la MartinerieF-36130 Diors☎ (0)2 5422 1377Tfx (0)2 5422 2112José Auclerc
GERMANY (49-):
■ KONE Aufzug GmbHSüdfeldstrasse 20D-30453 Hannover(PF 910564,D-30425 Hannover)☎ (0)511 21480Tfx (0)511 2148 250Manfred Eiden
■ O&K RolltreppenGmbH & Co. KGNierenhofer Strasse 10D-45525 Hattingen(Postfach 800647,D-45506 Hattingen)☎ (0)2324 205 00Tfx (0)2324 205 215Horst Marks
HUNGARY (36-):
■ KONE Felvonó Kft.Frangepán u. 12-14H-1139 Budapest☎ (0)1 340 9260Tfx (0)1 329 1411Ferenc Dobos
ITALY (39-):
■ KONE Ascensori S.p.A.Via Figino, 41I-20016 Pero (Milano)☎ 02 339 231Tfx 02 339 0752Roberto Pecchioli
● KONE Ascensori S.p.A.BU1/Pero WorksVia Figino, 41I-20016 Pero (Milano)☎ 02 339 231Tfx 02 3391 0275Franco Bergamini
■ KONE Italia S.p.A.Via Emilia Ponente, 129I-40133 Bologna☎ 051 6470 111Tfx 051 311 645Roberto Pecchioli
LATVIA (371-):
■ SIA KONE Lifti LatvijaDzerbenes iela 27 aLV-1006 Riga☎ (0)7 554 268Tfx (0)7 542 528Vladimir Grigorenko
LUXEMBOURG (352-):
■ KONE Luxembourg s.à.r.l.128, rue du KiemL-8030 Strassen☎ (0)4 55 160Tfx (0)4 55 029Fran(ois Vanherck
NETHERLANDS (31-):
■ KONE Starlift B.V.Rijn 102267 DB Leidschendam(P.O. Box 430,2260 AK Leidschendam)☎ (0)70 317 1000Tfx (0)70 317 1400Jan Willem Hoving
47
NORWAY (47-):
■ KONE AksjeselskapKjelsåsveien 172 DN-0884 Oslo(P.O. Box 163 Kjelsås,N-0411 Oslo)☎ 22 58 7000Tfx 22 58 7001Knut Hovind
POLAND (48-):
■ KONE ElevatorsPoland Sp.zo.o.18 Taborowa St.02-699 Warsaw☎ (0)22 853 3488Tfx (0)22 843 4883Esko Kilpinen
RUSSIA (7-):
■ ZAO KONE LiftsChisty pereulok 11/7119034 Moscow☎ 095 241 0566Tfx 095 230 2422Jukka Kylmälä
■ ZAO KONE LiftsSt. PetersburgLisichanskaya ul. 19197342 St. Petersburg☎ 812 246 9075Tfx 812 327 8769Alexei Samkovich
SLOVAK REPUBLIC (421-):
■ KONE Lifts s.r.o.Puchovská 1683505 Bratislava☎ (0)7 4488 9784 or 4488 7381Tfx (0)7 4488 4536Tatjana Dzubinova
SLOVENIA (386-):
● KONE Sowitsch AGRegional Office SloveniaBrnc̆i c̆eva Strasse 5Sl-1231 Ljubljana -Crnuc̆e☎ (0)61 161 4194Tfx (0)61 161 4195
SPAIN (34-):
■ KONE Elevadores, S.A.C/ Enrique Larreta, 5-1°28036 Madrid☎ 91 314 41 81Tfx 91 314 99 25Sergio Neira
SWEDEN (46-):
■ KONE Hissar ABHaukadalsgatan 3S-164 96 Kista☎ (0)8 752 35 00Tfx (0)8 751 23 80Sten Alfredsson
SWITZERLAND (41-):
■ KONE (Schweiz) AGZürichstrasse 46(Postfach 368)CH-8303 Bassersdorf☎ (0)1 838 38 38Tfx (0)1 838 38 88Esa Mäenpää
TURKEY (90-):
■ KONE Asansör Sanayive Ticaret A.S.Bulgurlu Caddesi 3281190 Kisikli, ÜsküdarIstanbul☎ (0)216 326 18 48Tfx (0)216 339 31 79Cüneyt Isin
UKRAINE (380-):
● KONE RepresentativeOffice6A, Leontovicha Str., #3252030 Kiev☎ (0)44 247 6616Tfx (0)44 228 2974Erkki Mäkelä
UNITED KINGDOM (44-):
■ KONE Lifts Ltd.168-170 WellingtonRoad SouthHounslow, MiddlesexTW4 5JN☎ (0)181 572 8000Tfx (0)181 572 8389William H. Orchard
■ O&K Escalators Ltd.Worth Bridge RoadKeighley, West YorkshireBD21 4YA☎ (0)1535 662 841Tfx (0)1535 680 498Robert P. Chapman
■ Ellis & McDougallLifts Ltd.86, Broad StreetGlasgow G40 2PX☎ (0)141 554 7604Tfx (0)141 554 6762Kenneth McDougall
NORTH AMERICA
CANADA (1-):
■ Montgomery KONEElevator Co. Ltd.80 Horner AvenueToronto, OntarioM8Z 4X8☎ 416 252 6151Tfx 416 252 3624Thomas Rönnholm
U.S.A. (1-):
■ Montgomery KONE Inc.One Montgomery CourtMoline, IL 61265☎ 309 764 6771Tfx 309 743 5623Heimo Mäkinen
■ FHE Services, Inc.47-36 36th StreetLong Island City,NY 11101-1800☎ 718 361 7200Tfx 718 361 0074Neil Mullane
LATIN AMERICA
ARGENTINA (54-):
■ KONE Ascensores S.A.Charlone 838 (1427)Capital FederalPcia Buenos Aires☎ (0)11 554 2737Tfx (0)11 777 90 40Hector Reboredo
BRAZIL (55-):
■ KONE Elevadores LtdaAv. Dr. João Batistade Souza Soares, 4009Jardim Colônia Paraiso(Caixa Postal 1652)12236-660 São Josédos Campos - SP☎ (0)12 331 29 66Tfx (0)12 331 48 59Wagner Barbosa
CHILE (56-):
▼ Fabrimetal S.A.San Gerardo, 1125Recoleta, Santiago☎ (0)2 621 6052Tfx (0)2 621 8935Rodolfo Schaub
MEXICO (52-):
■ Elevadores KONE-Sabiem S.A. de C.V.Calle Clavel No. 227Col. Atlampa, DelegaciónCuauhtémoc06450 México, D.F.☎ (0)5 547 02 78Tfx (0)5 541 51 28Roberto Demaria
VENEZUELA (58-):
■ KONE Ascensores C.A.Torre Express, Piso 10Calle 3-ACaracas(Apartado deCorreos 60093,Chacao, Caracas)☎ (0)2 243 5808Tfx (0)2 243 1489Tx (31) 23373 saven vcOrlando Alcantara
ASIA
CHINA (86-):
■ KONE Elevators Co., Ltd.668 Xiao Lin RoadChengbei, KunshanJiangsu 215316☎ (0)520 779 4550Tfx (0)520 779 4551Matti Hyytiäinen
HONG KONG SAR (852-):
■ KONE Elevator (H.K.) Ltd.9/F Tower II, CheungSha Wan Plaza833 Cheung Sha Wan RoadKowloon☎ 2 786 6500Tfx 2 786 3125Mats Norin
● KONE Far East Operations9/F Tower II, CheungSha Wan Plaza833 Cheung Sha Wan RoadKowloon☎ 2 786 6500Tfx 2 786 3125Tx (802) 36274 kone hx
˘
48
INDIA (91-):
■ KONE Elevator India Ltd.50 Vanagaram Road,AyanambakkamChennai 602 102☎ (0)44 625 7419Tfx (0)44 625 7235Tx (81) 4122023 beko inA. Sankarakrishnan
INDONESIA (62-):
▼ PT. KONE Indo ElevatorJl. Berbek Industri I/23Waru, Sidoarjo 61256East Java☎ 31 849 1946Tfx 31 849 1950Rahardjo Budialim
JAPAN (81-):
■ KONE Japan Co., Ltd.Toyo Building 9F1-2-4 Koishikawa,Bunkyo-ku,Tokyo 112-0002☎ (0)3 3817 7811Tfx (0)3 3817 7877Thomas Hietto
MALAYSIA (60-):
■ KONE Elevator(M) Sdn. Bhd.122-124, 3/F,Taman Sri SetapakJalan Gombak53000 Kuala Lumpur☎ (0)3 424 2855Tfx (0)3 424 8842Andy K.H. Seo
PHILIPPINES (63-):
■ KPI Elevators, Inc.Suite 903, King's Court1 Building2129 Pasong Tamo cornerDe La Rosa Streets1275 Makati City(P.O. Box 3558, MakatiCentral PostOffice, Metro Manila)☎ (0)2 811 29 29Tfx (0)2 811 24 66
SAUDI ARABIA (966-):
▼ Arabian Elevator &Escalator Co. Ltd.(P.O. Box 14326,Jeddah 21424)Villa No. 36, NearSands HotelAl-Andalus District,Jeddah☎ (0)2 660 88 06Tfx (0)2 661 03 73Fahad I. Mira
SINGAPORE (65-):
■ KONE Elevator Pte. Ltd.19 Lorong 8 Toa Payoh#05-00 Vicplas Building319255 Singapore☎ 258 5622Tfx 258 8734Johnson See
TAIWAN R.O.C. (886-):
■ KONE ElevatorsTaiwan Co. Ltd.3/F No. 7 Sec. 2Nanking East Rd.Taipei☎ (0)2 2523 3882Tfx (0)2 2563 77 01Randall Leu
THAILAND (66-):
▼ Thai Lift IndustriesPublic Co. Ltd.Thai Lift Building239 Rimklongprapa RoadBangsue, Bangkok 10800☎ (0)2 913 3370...86Tfx (0)2 913 3391...93Yuth Tuangtong
UNITED ARAB EMIRATES(971-):
● KONE Middle EastGIBCA Ltd.,KONE Lift Division(P.O. Box 21474, Dubai)B.M.T.C. Bldg, 1st FloorMurraqabat Road,Port SaidDubai☎ (0)4 69 31 98Tfx (0)4 68 17 87Paavo Pelkonen
Gra
phic
des
ign
Kau
ppam
aino
s B
ozel
l Oy
• P a
ste-
up P
aino
juss
it O
y •
Prin
ted
in F
inla
nd b
y Pu
naM
usta
19
99
AFRICA
EGYPT (20-):
▼ Marryat & ScottEgypt S.A.E.(P.O. Box 104 Dokki,Cairo 2)20 Abu Bakr ElSedik StreetMohandessien, Dokki, Giza☎ (0)2 337 3226Tfx (0)2 335 5634Tx (91) 92198 ramse unMostafa El Nahas
SOUTH AFRICA (27-):
■ KONE ElevatorsSouth Africa (Pty) Ltd.Cor. Hilliard & EarpStreets, OphirtonJohannesburg 2091☎ (0)11 493 75 39Tfx (0)11 493 77 08David Fryers
OCEANIA
AUSTRALIA (61-):
■ KONE Elevators Pty Ltd(Locked Bag 9, Alexandria,NSW 1435)205 Euston Road,Alexandria, NSW 2015☎ (0)2 9577 7000Tfx (0)2 9577 7399Peter O’Connor
NEW ZEALAND (64-):
● KONE Elevators Pty Ltd,N.Z. Region81 Union StreetAuckland☎ (0)9 303 9600Tfx (0)9 309 3882Martin Shepherd
To Parent Company Shareholders
Annual General Meeting
The Annual General Meeting of KONE Corporation will be held at the Hotel
Kalastajatorppa, Helsinki, on Friday, February 26, 1999 at 11:00 a.m.
Shareholders wishing to participate in the business of the meeting are to have
their KONE shareholdings registered on the KONE shareholder list at Suomen
Arvopaperikeskus Oy no later than February 22, 1999 and notify the Head Office
by telephone (+358 204 75 4215) or in writing (fax: +358 204 75 4309,
address KONE Corporation, P.O. Box 8, FIN-0033l Helsinki) no later than February
22, 1999.
A shareholder may attend and vote at the meeting in person or by proxy. However,
in accordance with Finnish practice, the company does not send forms of proxy to
its shareholders. Shareholders wishing to vote by proxy should submit their own
forms of proxy to the company.
Payment of Dividends
The Board of Directors’ proposal for distribution of profits can be found on page
40. Only those who have been registered as share owners at Suomen
Arvopaperikeskus Oy by the March 3, 1999 date of record of dividend distribu-
tion are entitled to dividends. The date proposed by the Board of Directors for
payment of dividends is March 8, 1999.
Those shareholders whose stock certificates have not yet been transferred to the
paperless book entry securities system by March 3, 1999 will receive their divi-
dends only after the transfer has been completed.
Announcements to Shareholders
In accordance with the Articles of Association, announcements to shareholders are
published in at least two daily Helsinki newspapers chosen by the Board of
Directors.
Financial Reporting
KONE Corporation will publish the following financial reports during 1999:
- Annual Report 1998 (in February-March 1999): in Finnish, Swedish, English,
German, French, Russian and Chinese.
- Interim Report (June 4) covering January-April, 1999 operations: in Finnish,
Swedish and English.
- Interim Report (October 1) covering January-August, 1999 operations: in
Finnish, Swedish and English.
These reports are mailed directly to all registered shareholders of the parent
company.
This Annual Report is available in English, French, German, Swedish, Finnish,
Russian and Chinese from: KONE Corporation, Corporate Communications, P.O.
Box 8, FIN-00331 Helsinki, Finland. Tel. +358 204 75 4348.
Fax +358 204 75 4515.
KONE Corporation
P.O. Box 8
FIN-00331 Helsinki, Finland
Tel. +358 204 751
Fax +358 204 75 4496
http://www.kone.com