Grid-tied solar system - Cal Poly Digital Commons
62
GRID-TIED SOLAR SYSTEM by Virginia Yan SENIOR PROJECT ELECTRICAL ENGINEERING DEPARTMENT CALIFORNIA POLYTECHNIC STATE UNIVERSITY SAN LUIS OBISPO December 2018
-
Upload
khangminh22 -
Category
Documents
-
view
2 -
download
0
Transcript of Grid-tied solar system - Cal Poly Digital Commons

GRID-TIED SOLAR SYSTEM
by
Virginia Yan
SENIOR PROJECT
ELECTRICAL ENGINEERING DEPARTMENT
CALIFORNIA POLYTECHNIC STATE UNIVERSITY
SAN LUIS OBISPO
December 2018
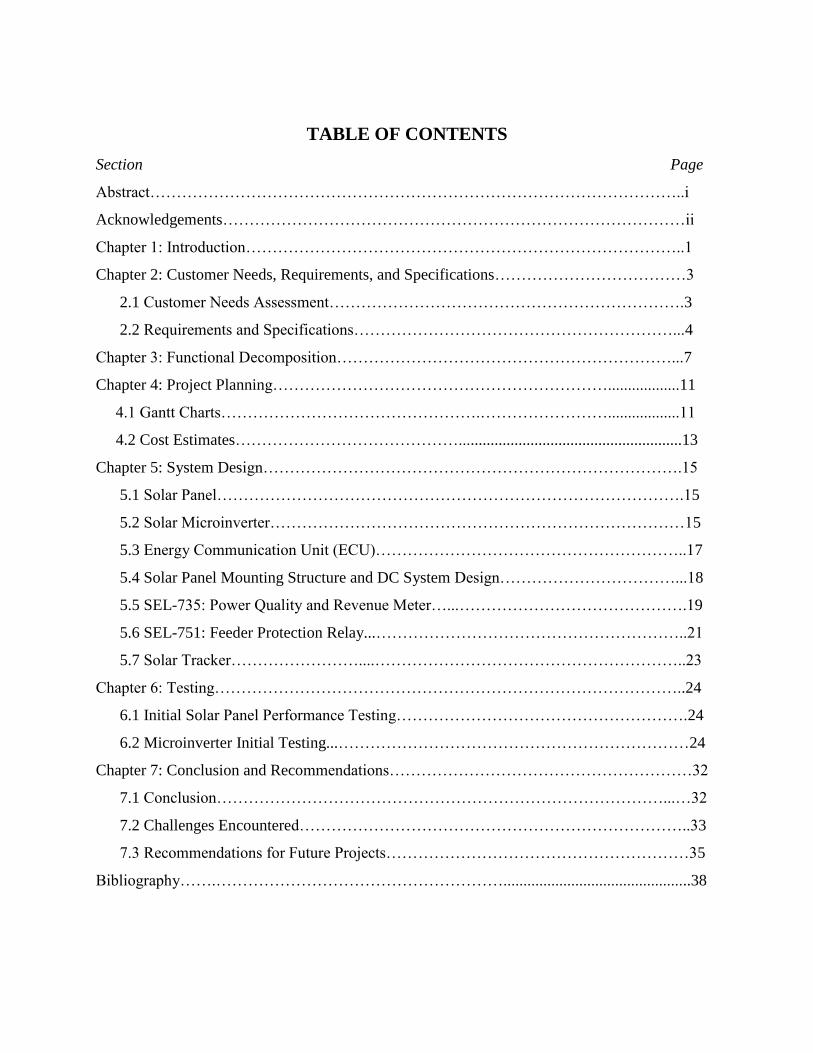
TABLE OF CONTENTS
Section Page
Abstract………………………………………………………………………………………..i
Acknowledgements……………………………………………………………………………ii
Chapter 1: Introduction………………………………………………………………………..1
Chapter 2: Customer Needs, Requirements, and Specifications………………………………3
2.1 Customer Needs Assessment………………………………………………………….3
2.2 Requirements and Specifications……………………………………………………...4
Chapter 3: Functional Decomposition………………………………………………………...7
Chapter 4: Project Planning………………………………………………………..................11
4.1 Gantt Charts………………………………………….……………………..................11
4.2 Cost Estimates……………………………………........................................................13
Chapter 5: System Design…………………………………………………………………….15
5.1 Solar Panel…………………………………………………………………………….15
5.2 Solar Microinverter……………………………………………………………………15
5.3 Energy Communication Unit (ECU)…………………………………………………..17
5.4 Solar Panel Mounting Structure and DC System Design……………………………...18
5.5 SEL-735: Power Quality and Revenue Meter…...…………………………………….19
5.6 SEL-751: Feeder Protection Relay...…………………………………………………..21
5.7 Solar Tracker……………………....…………………………………………………..23
Chapter 6: Testing……………………………………………………………………………..24
6.1 Initial Solar Panel Performance Testing……………………………………………….24
6.2 Microinverter Initial Testing...…………………………………………………………24
Chapter 7: Conclusion and Recommendations…………………………………………………32
7.1 Conclusion…………………………………………………………………………...…32
7.2 Challenges Encountered………………………………………………………………..33
7.3 Recommendations for Future Projects…………………………………………………35
Bibliography…….………………………………………………...............................................38
i
Appendices
A. Bill of Materials……….………………………………………………………......................41
B. Solar Microinverter Initial Test Start Program………………………………………............43
C. Accessing EMA Website and EMA App…………………………………….........................46
D. Senior Project Analysis………………………………………………………........................48
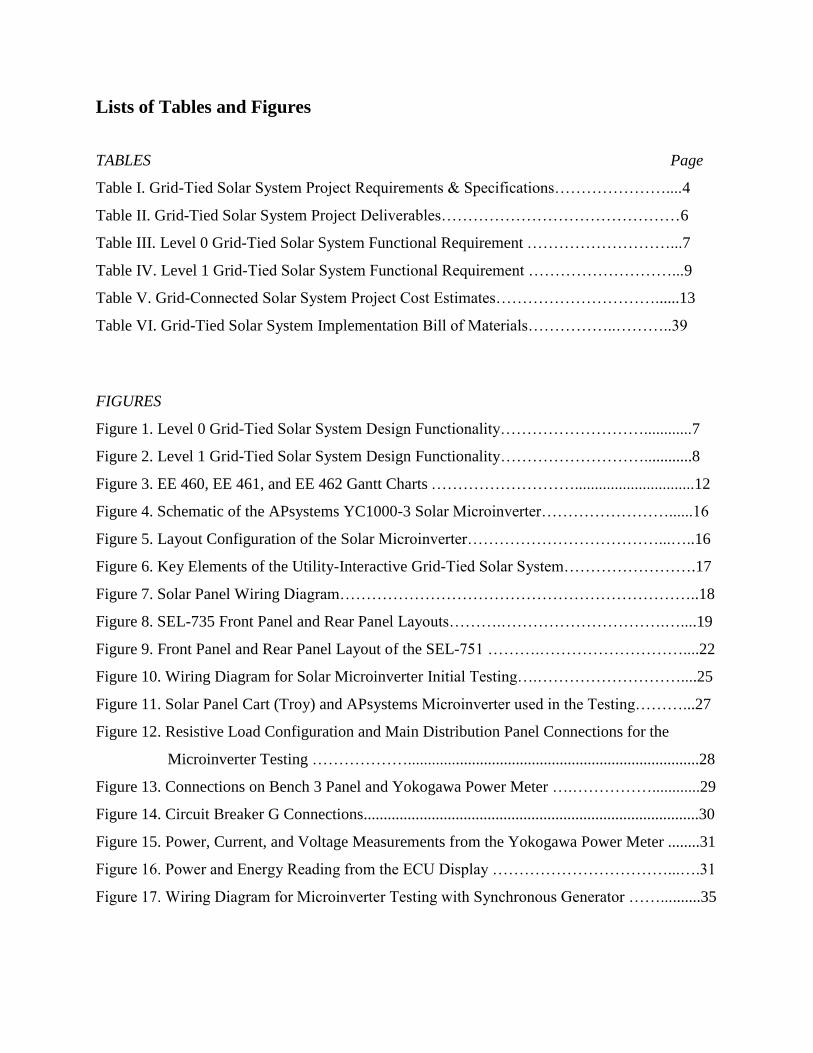
Lists of Tables and Figures
TABLES Page
Table I. Grid-Tied Solar System Project Requirements & Specifications…………………....4
Table II. Grid-Tied Solar System Project Deliverables………………………………………6
Table III. Level 0 Grid-Tied Solar System Functional Requirement ………………………...7
Table IV. Level 1 Grid-Tied Solar System Functional Requirement ………………………...9
Table V. Grid-Connected Solar System Project Cost Estimates…………………………......13
Table VI. Grid-Tied Solar System Implementation Bill of Materials……………..………..39
FIGURES
Figure 1. Level 0 Grid-Tied Solar System Design Functionality………………………............7
Figure 2. Level 1 Grid-Tied Solar System Design Functionality………………………............8
Figure 3. EE 460, EE 461, and EE 462 Gantt Charts ………………………..............................12
Figure 4. Schematic of the APsystems YC1000-3 Solar Microinverter……………………......16
Figure 5. Layout Configuration of the Solar Microinverter………………………………...…..16
Figure 6. Key Elements of the Utility-Interactive Grid-Tied Solar System…………………….17
Figure 7. Solar Panel Wiring Diagram…………………………………………………………..18
Figure 8. SEL-735 Front Panel and Rear Panel Layouts……….………………………….…....19
Figure 9. Front Panel and Rear Panel Layout of the SEL-751 ……….………………………....22
Figure 10. Wiring Diagram for Solar Microinverter Initial Testing….………………………....25
Figure 11. Solar Panel Cart (Troy) and APsystems Microinverter used in the Testing………...27
Figure 12. Resistive Load Configuration and Main Distribution Panel Connections for the
Microinverter Testing ……………….........................................................................28
Figure 13. Connections on Bench 3 Panel and Yokogawa Power Meter ….……………............29
Figure 14. Circuit Breaker G Connections....................................................................................30
Figure 15. Power, Current, and Voltage Measurements from the Yokogawa Power Meter ........31
Figure 16. Power and Energy Reading from the ECU Display ……………………………...….31
Figure 17. Wiring Diagram for Microinverter Testing with Synchronous Generator ……..........35
i
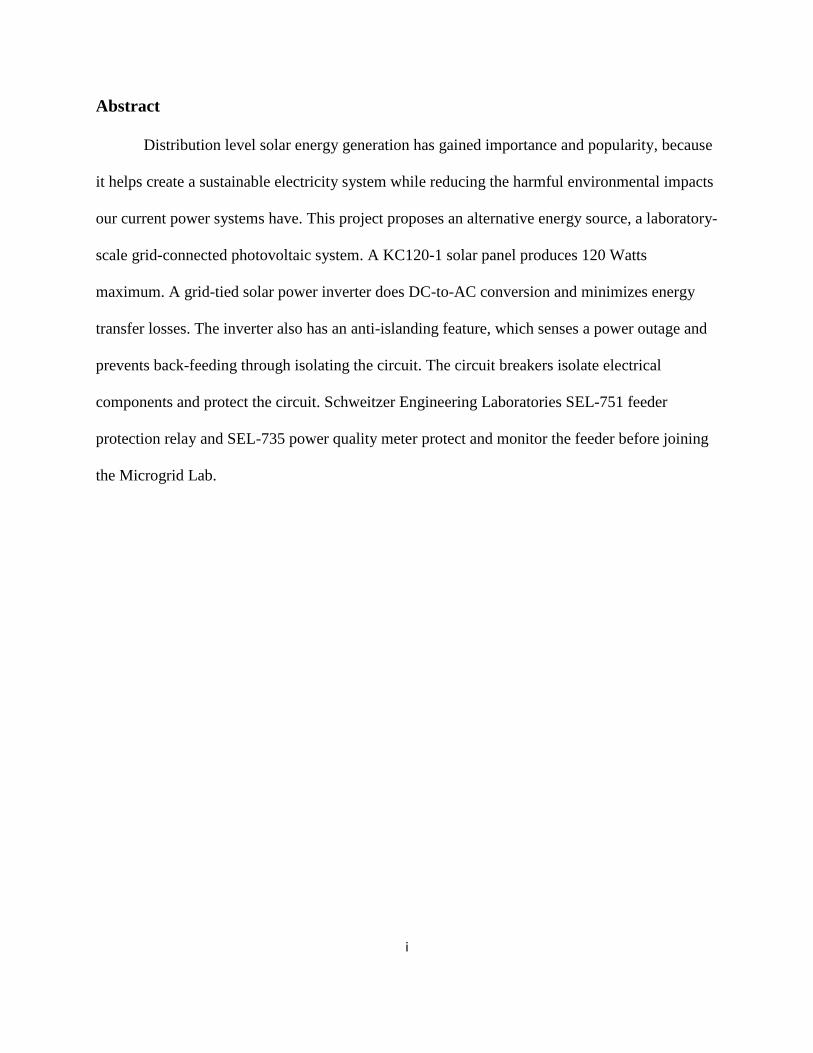
Abstract
Distribution level solar energy generation has gained importance and popularity, because
it helps create a sustainable electricity system while reducing the harmful environmental impacts
our current power systems have. This project proposes an alternative energy source, a laboratory-
scale grid-connected photovoltaic system. A KC120-1 solar panel produces 120 Watts
maximum. A grid-tied solar power inverter does DC-to-AC conversion and minimizes energy
transfer losses. The inverter also has an anti-islanding feature, which senses a power outage and
prevents back-feeding through isolating the circuit. The circuit breakers isolate electrical
components and protect the circuit. Schweitzer Engineering Laboratories SEL-751 feeder
protection relay and SEL-735 power quality meter protect and monitor the feeder before joining
the Microgrid Lab.

ii
Acknowledgements
I would like to express gratitude to Professors Dr. Ali Shaban, Dr. Majid Poshtan, Dr.
Taufik, and Dr. Ahmad Nafisi for maintaining the Microgrid Project and supporting
undergraduate and graduate students with their projects and theses. Without their efforts, the
students would not have such an environment conducive to investigate simulation results,
explore the effects of renewable energy resources integration, design and implement projects to
minimize emissions, or model power systems protection schemes.
Dr. Ali Shaban has provided much technical assistance, advice and criticism invaluable
to the project. His patience and willingness to help students with his deep power systems
background have contributed to the completion of this report. It is truly a privilege to have
worked with him.
I gratefully acknowledge the assistance of Dr. Majid Poshtan. He spent his personal time
helping me troubleshoot the system setup and the microinverter. He has provided many helpful
feedbacks and come up with alternative solutions to achieve desired results.
Dr. Taufik provided solar panels needed to implement and test the system. Special thanks
to Dr. Taufik for giving so much help and suggestions on how to simulate the solar panels with a
DC power supply for a successful microinverter testing.
I express my sincere gratitude to Mr. Do Vo. His insights and technical knowledge have
been indispensable to the project. We’ve developed a very productive collaboration and a caring
friendship. His devotion made it possible for me to build the foundation of this project and enrich
my learning experience. It was a pleasure working with him.

iii
Without Mr. Jaime Carmo’s help, I would not have been able to purchase, deliver, and
assemble the mechanical parts necessary to build the solar panel structures. The design and
implementation process became less overwhelming with his support.
Mr. Robert Randle is always willing to aid and very understanding. He reached out to Mr.
Chad Eastep, a network analyst at Cal Poly regarding the router registration in a timely manner.
He also helped me install ETAP for a computer simulation and address the issue with the ECU
not connecting to the school network.
I also want to thank the technicians at Mustang ‘60 and Aero Hangar machine shops
because they provided a safe environment for me to use the machines. They gave very helpful
tips including how to safely and efficiently cut and drill into metal bars and other mechanical
parts.
Schweitzer Engineering Laboratories donated SEL-751 and SEL-735 equipment, which
made it possible to implement the design.
This report is respectfully dedicated to my mother Yanqing Yan. Her unconditional love
and support have helped me stay motivated and become more dedicated. She has made many
sacrifices to allow the start and completion of this project.

1
Chapter 1. Introduction
Modern power systems have become more complex with unprecedented technological
change and the increase of electricity demand. Therefore, the power systems become more
vulnerable to utility power-related issues and natural disturbances. There has been an increasing
number of disturbance events like wildfires, extreme heat events, hurricanes, and tornados,
which have affected millions of U.S. citizens and lost more than $10 billion [1]. Potential cyber-
attacks have also become a huge concern because the power grids are more dependent on
computers and data-sharing. Without adequate power systems protection training, future
engineers do not have the technical knowledge and skills required to design, implement, operate,
and maintain a reliable power system. Understanding the importance of power-system
protection, more universities start offering power systems protection courses at the graduate
and/or postgraduate levels. The University of Saskatchewan, a Canadian public research
university, offered the first power-system protection course 54 years ago [2].
In comparison, California Polytechnic State University, San Luis Obispo, developed the
Microgrid Protection Student Laboratory (MPSL), which provides electrical engineering students
the opportunities to learn power system protection theories through hands-on experiences. The
MPSL emphasizes modern microprocessor-based relays utilization for overcurrent, overvoltage,
directional comparison, and phase comparison protection. Students also gain practical experience
by applying fault detection schemes in transformers, three-phase induction motors, and
transmission lines. The MPSL also gives students the chance to design, implement, and test a
proposed power systems project using other electrical equipment and devices like solar panels,
power quality metering equipment, protection relays, circuit breakers, and batteries.

2
Modern power systems have drastically decreased their dependence on fossil fuels and
conventional energy sources, because renewable energy sources like solar energy have become
more acceptable and affordable [3]. The solar generation system integration to the utility grid
becomes more popular nowadays since it can help achieve sustainable development goals. This
paper proposes a grid-connected solar system, which absorbs sunlight, applies energy
conversion, and feeds the electricity to the utility grid. The project focuses on how rooftop solar
installations benefit and hinder the Microgrid Lab, how they impact the power grid regarding
electric power quality and electricity reliability.

3
Chapter 2. Customer Needs, Requirements & Specifications
Chapter 2 assesses the main customer needs and list of marketing requirements and
engineering specifications generated based on the customer needs.
2.1 Customer Needs Assessment
This project should provide Cal Poly Microgrid Lab users reliable and uninterrupted
electrical power. Applying fault detection and protection knowledge and utilizing protective
relaying equipment help meet customer needs. After asking the professors, students, and staff
who use the Microgrid Lab regularly, the customers requested a reliable and high-quality system,
which provides uninterrupted electricity. The customers also require user-friendly equipment.
The equipment should have reasonable cost and meet IEEE safety standards which improve
overall reliability.

4
2.2 Requirements and Specifications
Table I shows the marketing requirements and engineering specifications, which satisfy
minimum customer needs. Most requirements and specifications optimize and maintain the
system performance.
Table I. Grid-Tied Solar System Project Requirements and Specifications
Marketing
Requirements
Engineering
Specifications Justification
4 1. The implementation cost (without
labor cost) should not exceed
$8,000.
Schweitzer Engineering Laboratories,
Inc previously donated the protective
relay and power quality meter. The
Microgrid Lab currently has 3 unused
solar panels. Through researching
parts costs online, cost estimates are
generated and the most pessimistic
cost (excluding labor costs) does not
exceed $8,000. Table II shows the
cost estimates calculated.
1,5 2. The peak inverter efficiency
should exceed 91%.
Peak efficiency calculates the ratio
between AC power output and DC
power input. A typical pure sine-wave
solar inverter can achieve this
efficiency. Through researching, the
normal peak inverter efficiency varies
between 94% and 96% [4]. The
inverter power efficiency can reach
94% via PSpice design sensitivity
analysis.
1,2,3,5 3. The entire system must operate in
temperature range: -20°C ~ 65°C.
The system must maintain its
performance in a stochastic
environment [5]. Through researching
product characteristics and electrical
ratings, most equipment can meet this
operational requirement.
1,2,3,4 4. Electrical components should fit
inside a 3’x 3’ x 2’ transportable
box.
A 100lbs student can easily carry the
box around campus alone. It can also
fit inside the Microgrid Lab. This
specification satisfies customer need
of user-friendly. The design’s
5
accessibility allows technicians to
easily test and repair the system.
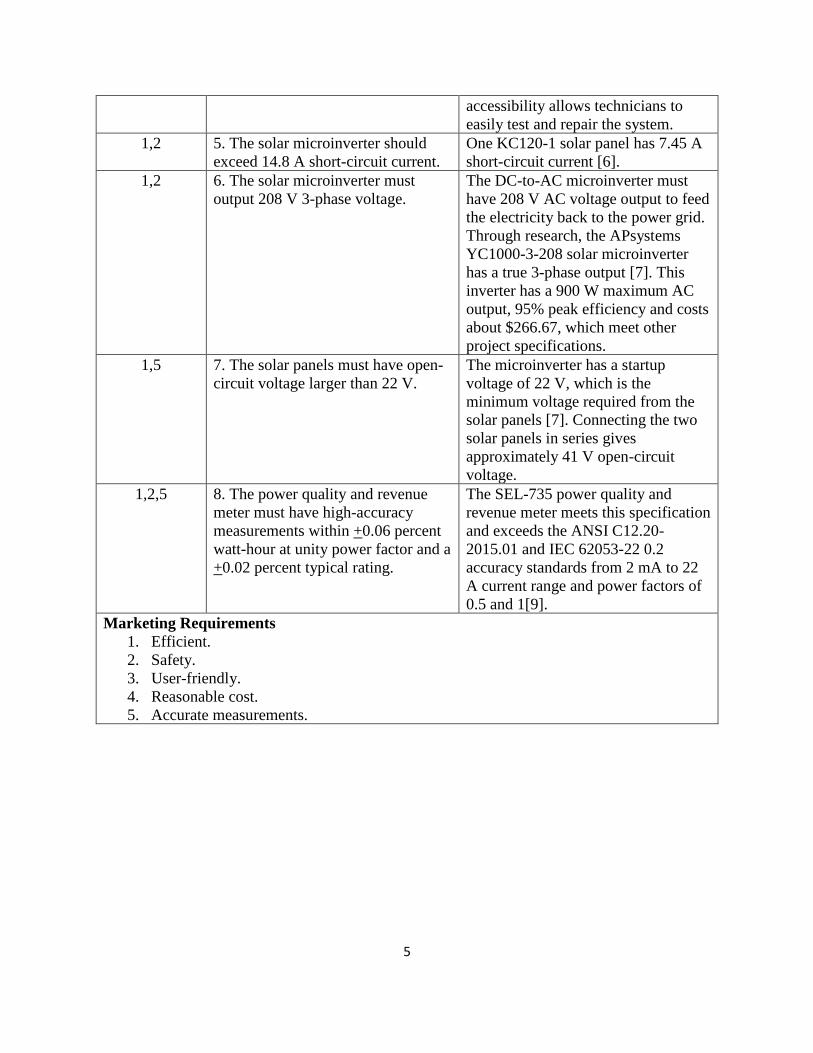
1,2 5. The solar microinverter should
exceed 14.8 A short-circuit current.
One KC120-1 solar panel has 7.45 A
short-circuit current [6].
1,2 6. The solar microinverter must
output 208 V 3-phase voltage.
The DC-to-AC microinverter must
have 208 V AC voltage output to feed
the electricity back to the power grid.
Through research, the APsystems
YC1000-3-208 solar microinverter
has a true 3-phase output [7]. This
inverter has a 900 W maximum AC
output, 95% peak efficiency and costs
about $266.67, which meet other
project specifications.
1,5 7. The solar panels must have open-
circuit voltage larger than 22 V.
The microinverter has a startup
voltage of 22 V, which is the
minimum voltage required from the
solar panels [7]. Connecting the two
solar panels in series gives
approximately 41 V open-circuit
voltage.
1,2,5 8. The power quality and revenue
meter must have high-accuracy
measurements within +0.06 percent
watt-hour at unity power factor and a
+0.02 percent typical rating.
The SEL-735 power quality and
revenue meter meets this specification
and exceeds the ANSI C12.20-
2015.01 and IEC 62053-22 0.2
accuracy standards from 2 mA to 22
A current range and power factors of
0.5 and 1[9].
Marketing Requirements
1. Efficient.
2. Safety.
3. User-friendly.
4. Reasonable cost.
5. Accurate measurements.
6
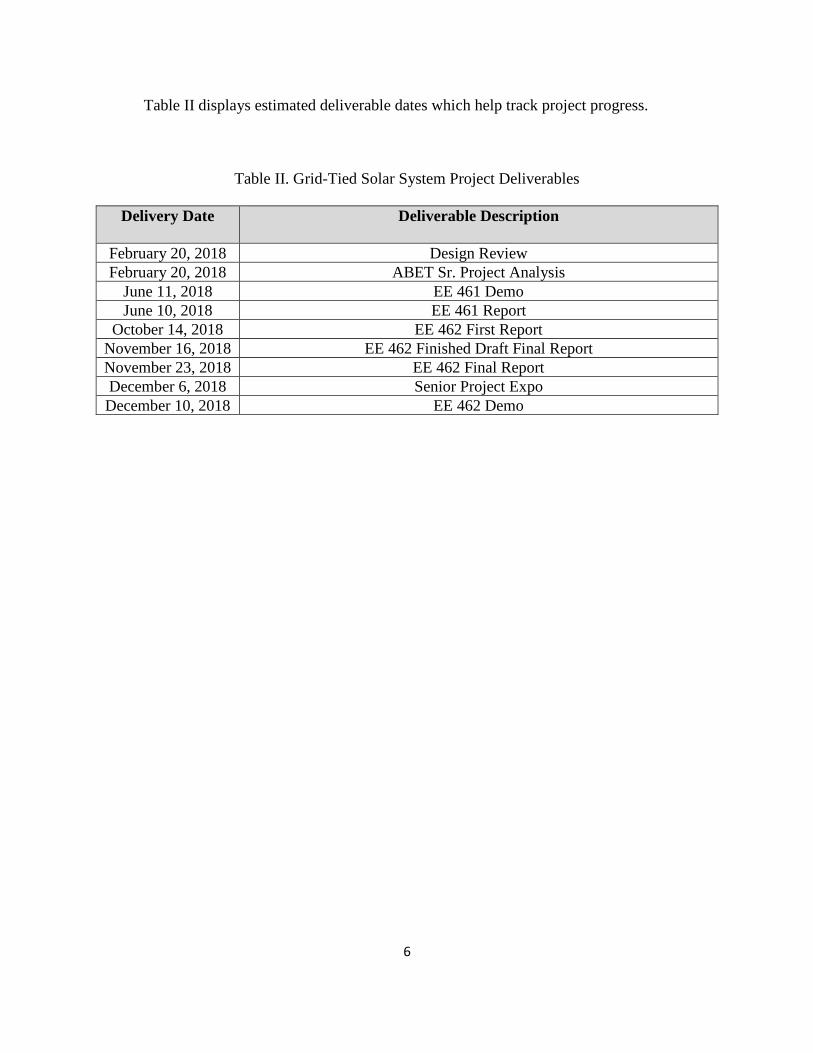
Table II displays estimated deliverable dates which help track project progress.
Table II. Grid-Tied Solar System Project Deliverables
Delivery Date Deliverable Description
February 20, 2018 Design Review
February 20, 2018 ABET Sr. Project Analysis
June 11, 2018 EE 461 Demo
June 10, 2018 EE 461 Report
October 14, 2018 EE 462 First Report
November 16, 2018 EE 462 Finished Draft Final Report
November 23, 2018 EE 462 Final Report
December 6, 2018 Senior Project Expo
December 10, 2018 EE 462 Demo
7
Chapter 3. Functional Decomposition
Chapter 3 describes the level 0 and level 1 grid-tied solar system design functionality and
functional requirements.
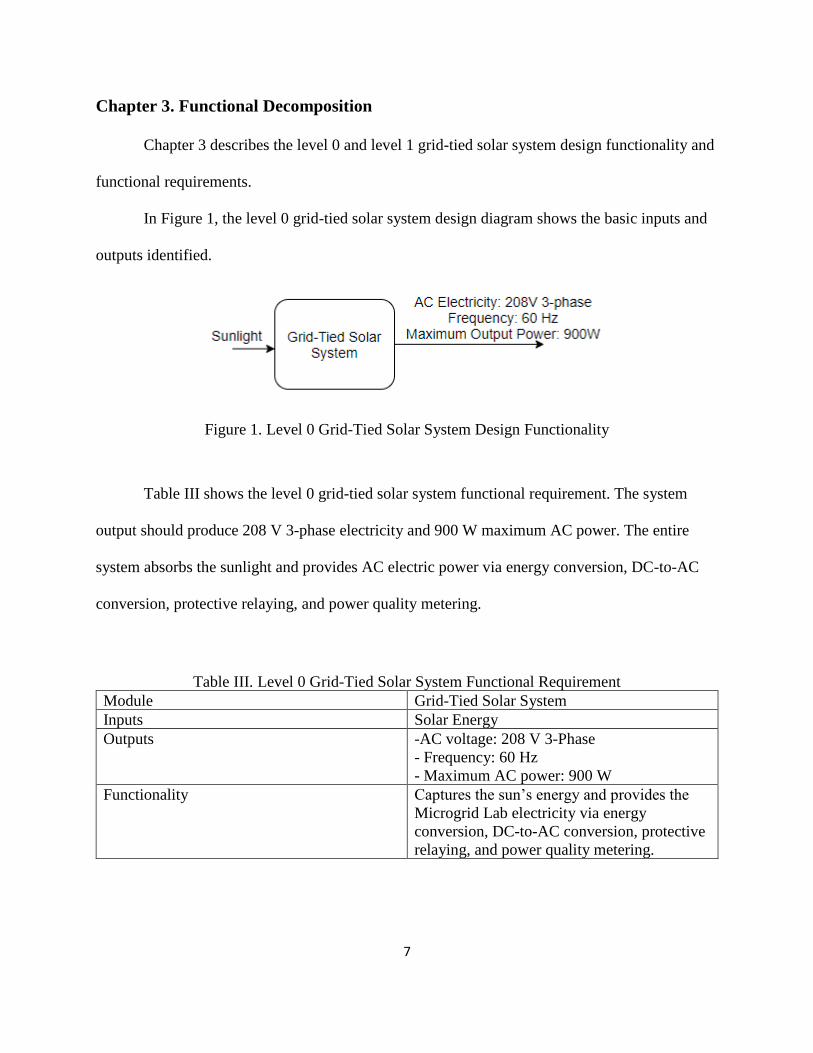
In Figure 1, the level 0 grid-tied solar system design diagram shows the basic inputs and
outputs identified.
Figure 1. Level 0 Grid-Tied Solar System Design Functionality
Table III shows the level 0 grid-tied solar system functional requirement. The system
output should produce 208 V 3-phase electricity and 900 W maximum AC power. The entire
system absorbs the sunlight and provides AC electric power via energy conversion, DC-to-AC
conversion, protective relaying, and power quality metering.
Table III. Level 0 Grid-Tied Solar System Functional Requirement
Module Grid-Tied Solar System
Inputs Solar Energy
Outputs -AC voltage: 208 V 3-Phase
- Frequency: 60 Hz
- Maximum AC power: 900 W
Functionality Captures the sun’s energy and provides the
Microgrid Lab electricity via energy
conversion, DC-to-AC conversion, protective
relaying, and power quality metering.
8
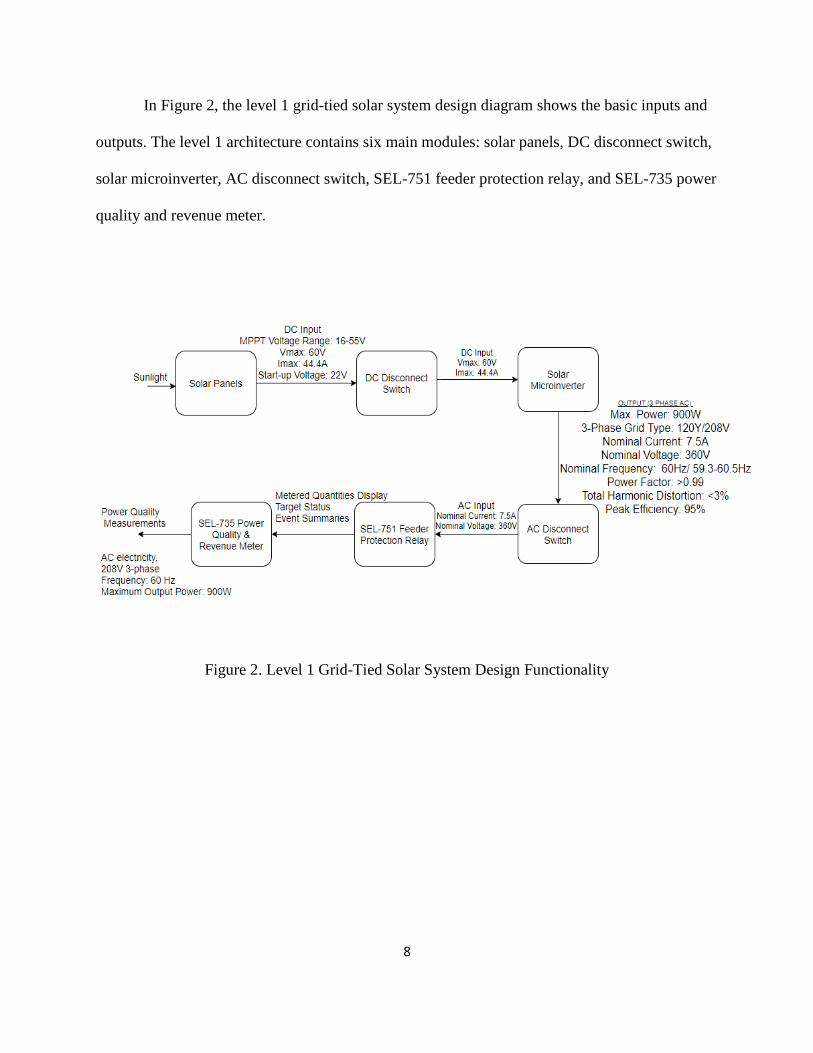
In Figure 2, the level 1 grid-tied solar system design diagram shows the basic inputs and
outputs. The level 1 architecture contains six main modules: solar panels, DC disconnect switch,
solar microinverter, AC disconnect switch, SEL-751 feeder protection relay, and SEL-735 power
quality and revenue meter.
Figure 2. Level 1 Grid-Tied Solar System Design Functionality

9
Table IV shows the level 1 grid-tied solar system functional requirements, which contain
all the subsystems. Each module has inputs, the corresponding outputs, and main functions. The
solar panels absorb solar energy and converts it to DC voltage. The DC disconnect switch
isolates the solar panels from the other parts of the circuit when power outages or other
disturbances occur. The solar microinverter does the DC-to-AC three-phase voltage conversion
and outputs AC three-phase voltage and current. The AC disconnect switch disconnects the solar
panels and solar inverter from the rest of the circuit when a fault is detected. SEL-751 feeder
protection relay has AC current and voltage inputs. It provides voltage, current, and temperature
protection, logs the measurements, and provides contactor control [8]. The SEL-735 power
quality meter also measures AC current and voltage signals and identifies any power system
anomalies [9].
Table IV. Level 1 Grid-Tied Solar System Functional Requirements
a) Solar Panel Functional Requirements
Module Solar Panel x 2
Inputs Sunlight
Outputs -Max. Power: 240 W
-Operating Voltage: 33.8 V (DC)
-Max. Current: 7.10 A
-Start-up Voltage: 22 V
Functionality Absorb sunlight and apply energy conversion.
b) DC Disconnect Switch Functional Requirements
Module DC Disconnect Switch
Inputs -Max. Voltage: 60 V
-Max. Current: 44.4 A
Outputs -Max. Voltage: 60 V
-Max. Current: 44.4 A
Functionality Separates the solar panels and the rest of the
circuit when a power outage or natural
disturbances occur.

10
c) Solar Microinverter Functional Requirements
Module Solar Microinverter
Inputs -Max. Voltage: 60 V
-Max. Current: 44.4 A
Outputs -Output Current: 2.50 A x 3-phase
-Output Voltage: 208 V x 3-phase
-Maximum Output Power: 900 W
Functionality Does DC-to-AC three-phase conversion.
d) AC Disconnect Switch Functional Requirements
Module AC Disconnect Switch
Inputs -Output Current: 2.50 A x 3-phase
-Output Voltage: 208 V x 3-phase
Outputs -Output Current: 2.50 A x 3-phase
-Output Voltage: 208 V Y x 3-phase
Functionality Disconnects the circuit when a power outage
or natural disturbances occur.
e) SEL-751 Feeder Protection Relay Functional Requirements
Module SEL-751 Feeder Protection Relay
Inputs -Output Current: 2.50 A x 3-phase
-Output Voltage: 208 V x 3-phase
Outputs -Metered Quantities Display
-Target Status
-Event Summaries
Functionality Provides voltage, current, and temperature
protection. It logs data and provides contactor
control.
f) SEL-735 Power Quality & Revenue Meter Functional Requirements
Module SEL-735 Power Quality & Revenue Meter
Inputs -Output Current: 2.50 A x 3-phase
-Output Voltage: 208 V x 3-phase
Outputs -Power Quality Measurements
-AC Electric Power, 208 V/60 Hz
-Output Current: 2.50 A x 3-phase
-Output Voltage: 208 V x 3-phase
- Maximum Output Power: 900 W
Functionality Generates power meter reports, identifies
power system anomalies and diagnose system
problems.
11
Chapter 4. Project Planning
Chapter 4 suggests 3 separate Gantt charts, whch provides adequate time to complete the
senior project. It also estimates the total parts cost and labor costs of the project.
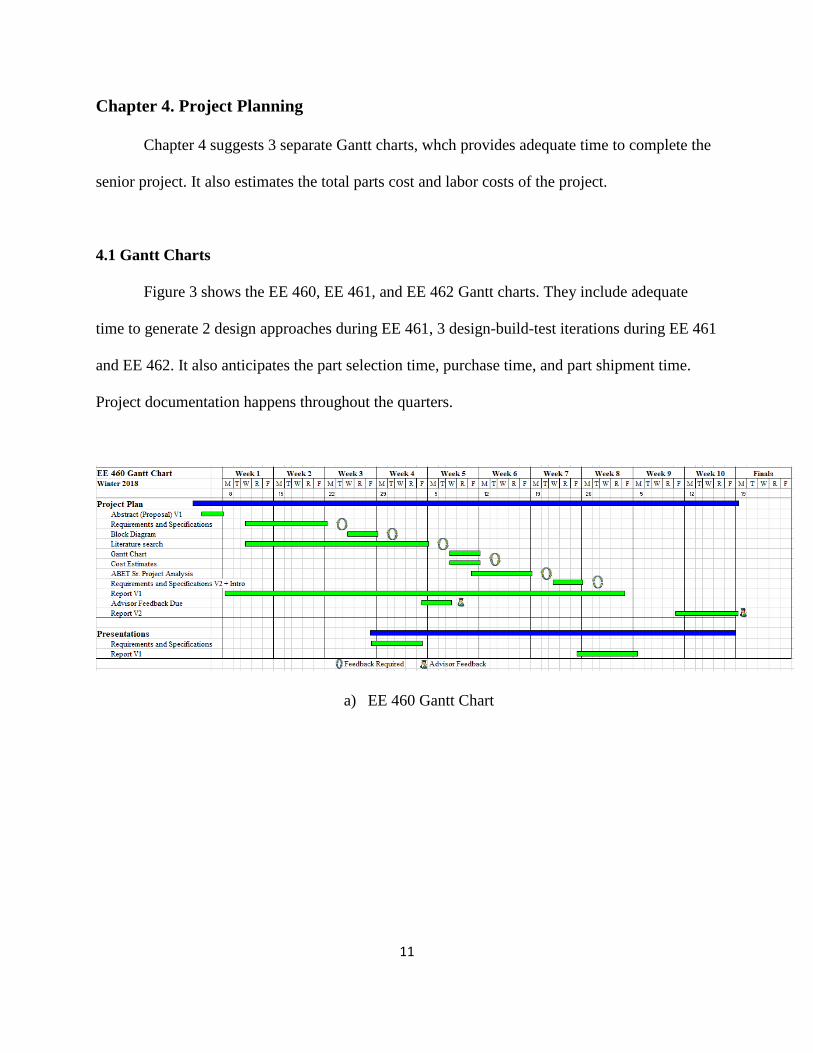
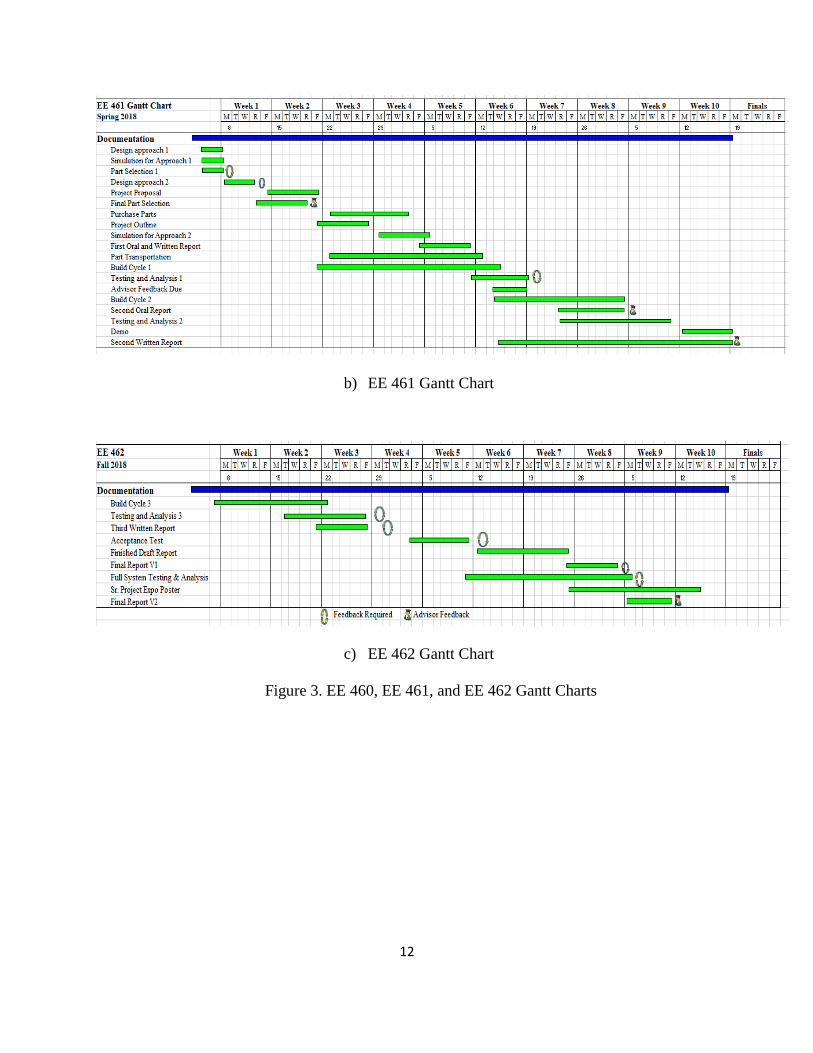
4.1 Gantt Charts
Figure 3 shows the EE 460, EE 461, and EE 462 Gantt charts. They include adequate
time to generate 2 design approaches during EE 461, 3 design-build-test iterations during EE 461
and EE 462. It also anticipates the part selection time, purchase time, and part shipment time.
Project documentation happens throughout the quarters.
a) EE 460 Gantt Chart
12
b) EE 461 Gantt Chart
c) EE 462 Gantt Chart
Figure 3. EE 460, EE 461, and EE 462 Gantt Charts
13
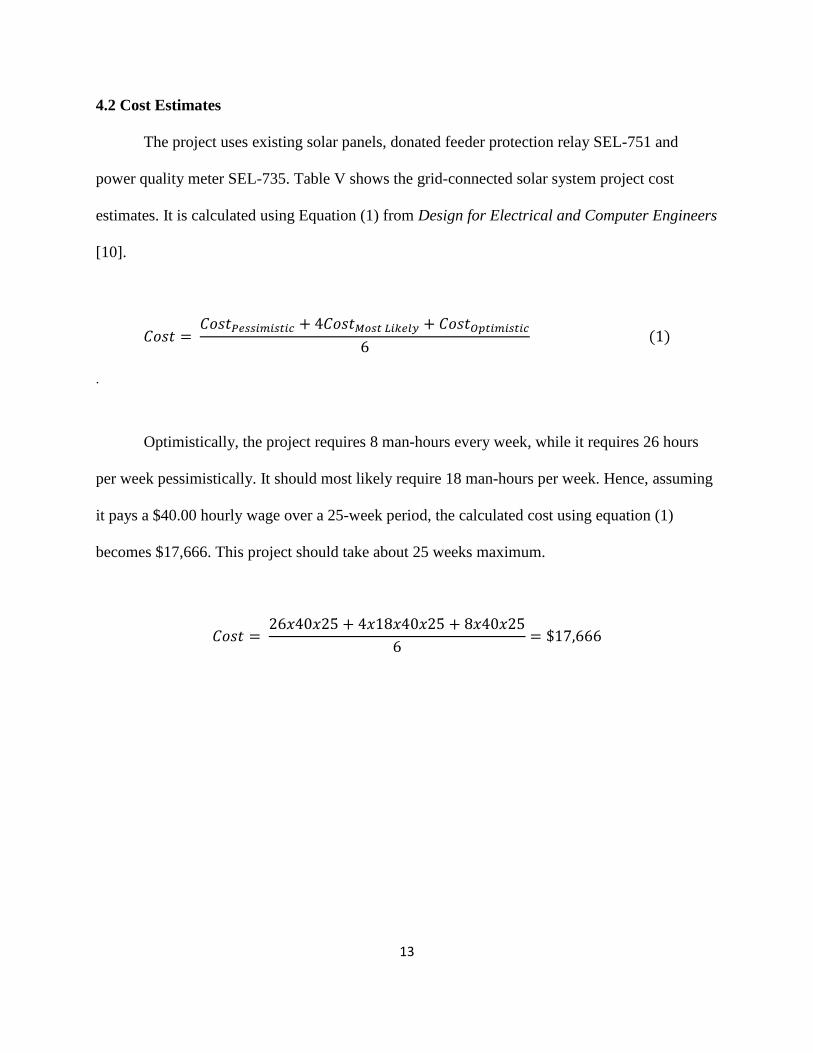
4.2 Cost Estimates
The project uses existing solar panels, donated feeder protection relay SEL-751 and
power quality meter SEL-735. Table V shows the grid-connected solar system project cost
estimates. It is calculated using Equation (1) from Design for Electrical and Computer Engineers
[10].
𝐶𝑜𝑠𝑡 = 𝐶𝑜𝑠𝑡𝑃𝑒𝑠𝑠𝑖𝑚𝑖𝑠𝑡𝑖𝑐 + 4𝐶𝑜𝑠𝑡𝑀𝑜𝑠𝑡 𝐿𝑖𝑘𝑒𝑙𝑦 + 𝐶𝑜𝑠𝑡𝑂𝑝𝑡𝑖𝑚𝑖𝑠𝑡𝑖𝑐
6 (1)
.
Optimistically, the project requires 8 man-hours every week, while it requires 26 hours
per week pessimistically. It should most likely require 18 man-hours per week. Hence, assuming
it pays a $40.00 hourly wage over a 25-week period, the calculated cost using equation (1)
becomes $17,666. This project should take about 25 weeks maximum.
𝐶𝑜𝑠𝑡 = 26𝑥40𝑥25 + 4𝑥18𝑥40𝑥25 + 8𝑥40𝑥25
6= $17,666
14
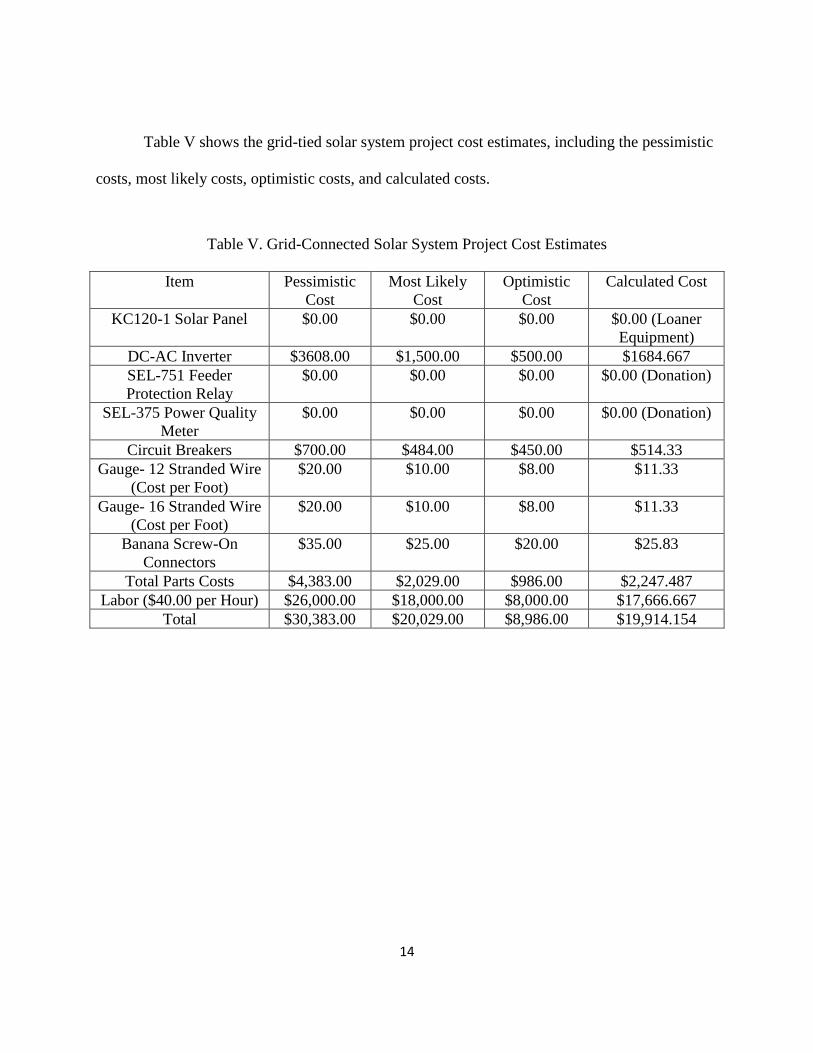
Table V shows the grid-tied solar system project cost estimates, including the pessimistic
costs, most likely costs, optimistic costs, and calculated costs.
Table V. Grid-Connected Solar System Project Cost Estimates
Item Pessimistic
Cost
Most Likely
Cost
Optimistic
Cost
Calculated Cost
KC120-1 Solar Panel $0.00 $0.00 $0.00 $0.00 (Loaner
Equipment)
DC-AC Inverter $3608.00 $1,500.00 $500.00 $1684.667
SEL-751 Feeder
Protection Relay
$0.00 $0.00 $0.00 $0.00 (Donation)
SEL-375 Power Quality
Meter
$0.00 $0.00 $0.00 $0.00 (Donation)
Circuit Breakers $700.00 $484.00 $450.00 $514.33
Gauge- 12 Stranded Wire
(Cost per Foot)
$20.00 $10.00 $8.00 $11.33
Gauge- 16 Stranded Wire
(Cost per Foot)
$20.00 $10.00 $8.00 $11.33
Banana Screw-On
Connectors
$35.00 $25.00 $20.00 $25.83
Total Parts Costs $4,383.00 $2,029.00 $986.00 $2,247.487
Labor ($40.00 per Hour) $26,000.00 $18,000.00 $8,000.00 $17,666.667
Total $30,383.00 $20,029.00 $8,986.00 $19,914.154

15
Chapter 5. System Design
In chapter 5, major elements of the system design are examined in terms of their capabilities,
requirements, and limitations.
5.1 Solar Panel
Kyocera model KC120-1 is used to generate DC electricity. It has a 120 Watts maximum
power, 7.45 A short-circuit current, and 21.5 V open-circuit voltage [6]. This project uses 2 solar
panels connected in series to energize the microinverter. The minimum voltage required to
energize the inverter is 22 VDC. With the solar panels in series, it gives 43 V maximum open-
circuit voltage.
5.2 Solar Microinverter
The solar microinverter is the APsystems commercial microinverter YC1000-3-208, which
has a maximum of 900 W AC output and a true 3-phase 208 V output [7]. It has a total of 4
channels and uses Maximum Power Point Tracking (MPPT) technique to maximize power
extraction in the PV system. Figure 4 shows the APsystems YC1000-3-208 solar microinverter
schematic. The microinverter contains DC-to-DC and DC-to-AC conversion features as well as
the Electromagnetic Interference (EMI) filtering feature. The EMI filter is used to reduce high
frequency noise which may cause electromagnetic interference. There is no additional grounding
required since the equipment ground is provided in the AC bus cable. Ground fault protection is
integrated into the microinverter.

16
Figure 4. Schematic of the APsystems YC1000-3-208 Solar Microinverter [28]
Two series-connected solar panels are plugged to the leftmost channel (channel 4), which
is next to the antenna mounting thread. The other two solar panels are connected to channel 3, as
shown in Figure 5. Figure 5 also displays the layout configuration of the microinverter. MC4
connectors are used to connect the DC input cables to the microinverters.
Figure 5. Layout Configuration of the Solar Microinverter [28]
17
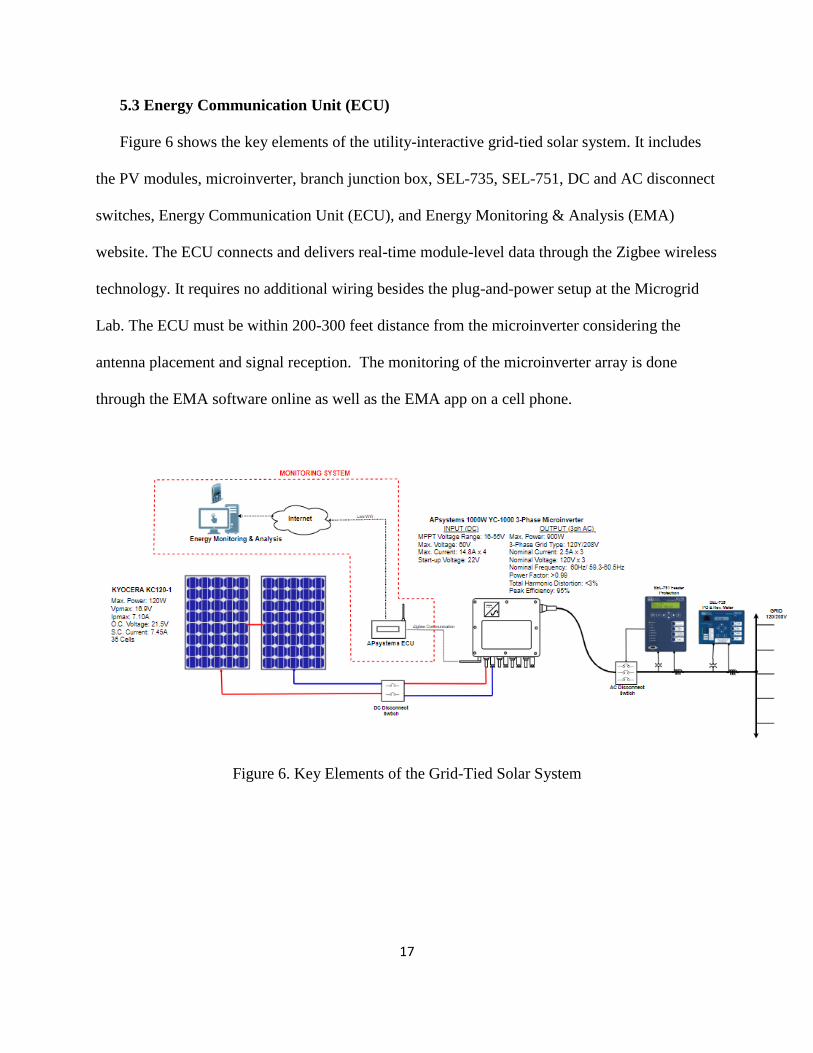
5.3 Energy Communication Unit (ECU)
Figure 6 shows the key elements of the utility-interactive grid-tied solar system. It includes
the PV modules, microinverter, branch junction box, SEL-735, SEL-751, DC and AC disconnect
switches, Energy Communication Unit (ECU), and Energy Monitoring & Analysis (EMA)
website. The ECU connects and delivers real-time module-level data through the Zigbee wireless
technology. It requires no additional wiring besides the plug-and-power setup at the Microgrid
Lab. The ECU must be within 200-300 feet distance from the microinverter considering the
antenna placement and signal reception. The monitoring of the microinverter array is done
through the EMA software online as well as the EMA app on a cell phone.
Figure 6. Key Elements of the Grid-Tied Solar System
18
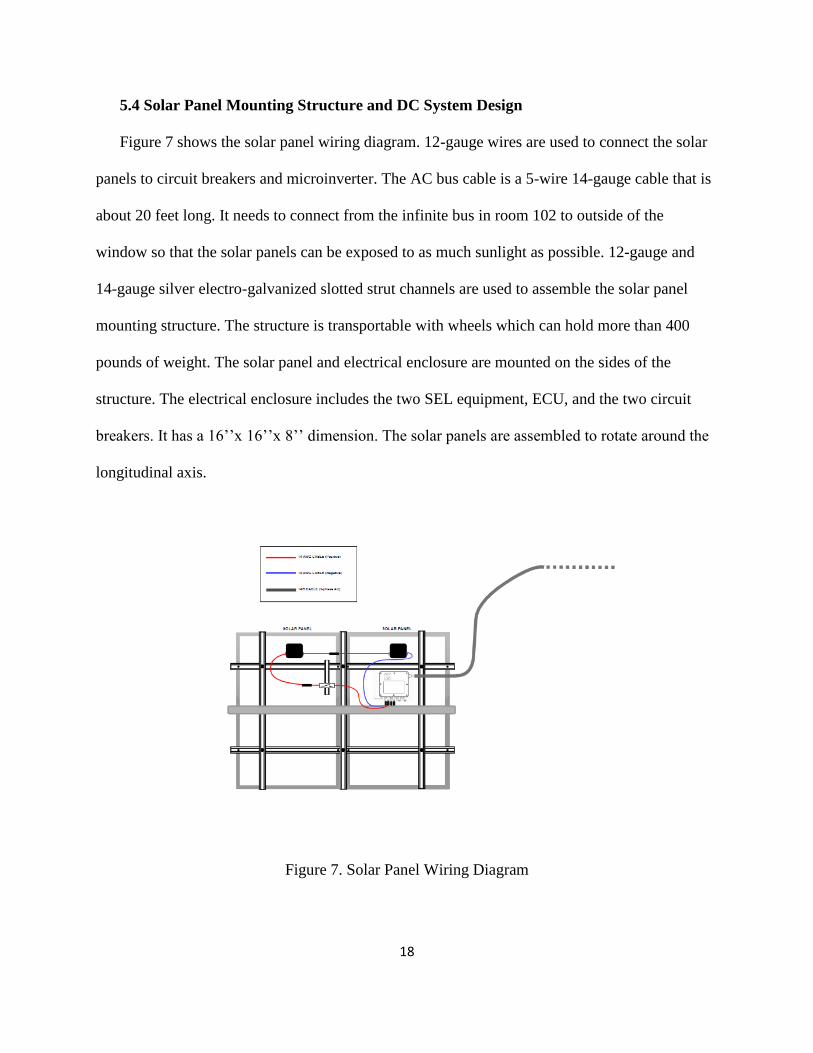
5.4 Solar Panel Mounting Structure and DC System Design
Figure 7 shows the solar panel wiring diagram. 12-gauge wires are used to connect the solar
panels to circuit breakers and microinverter. The AC bus cable is a 5-wire 14-gauge cable that is
about 20 feet long. It needs to connect from the infinite bus in room 102 to outside of the
window so that the solar panels can be exposed to as much sunlight as possible. 12-gauge and
14-gauge silver electro-galvanized slotted strut channels are used to assemble the solar panel
mounting structure. The structure is transportable with wheels which can hold more than 400
pounds of weight. The solar panel and electrical enclosure are mounted on the sides of the
structure. The electrical enclosure includes the two SEL equipment, ECU, and the two circuit
breakers. It has a 16’’x 16’’x 8’’ dimension. The solar panels are assembled to rotate around the
longitudinal axis.
Figure 7. Solar Panel Wiring Diagram

19
5.5 SEL-735: Power Quality and Revenue Meter
SEL-735 Power Quality and Revenue Meter provides accurate revenue metering. It generates
power quality reports to help identify and troubleshoot power quality disturbance, with
compliance to IEC 61000-4-30 Class A. It records standard current measurements as well as
fault current measurements. Figure 8 shows the SEL-735 front panel and rear panel layouts. The
front panel shows the meter status, pushbuttons, and measurements. The pushbuttons also allow
user to do manual meter settings and communication settings. The back panel shows the different
parts that made up the meter, the inputs, and outputs. There are three ways to wire the SEL-735
meter, which are 3-element, four-wire wye-connection, 2-element, three-wire delta-connection,
and 2 1/2-element, four-wire wye-connection. This report will explore the four-wire wye
connection wiring methods.
a) SEL-735 Front Panel Layout

20
b) SEL-735 Rear Panel Layout
Figure 8. SEL-735 Front Panel and Rear Panel Layouts [9]

21
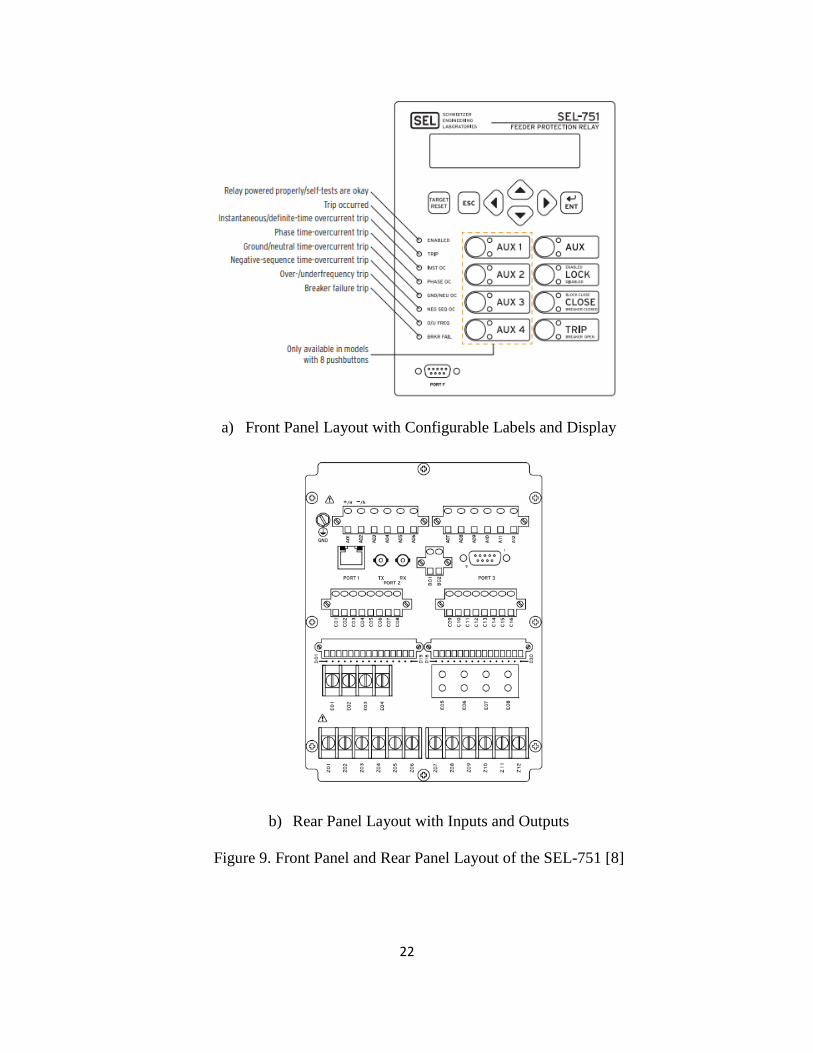
5.6 SEL-751A: Feeder Protection Relay
The SEL-751A Feeder Protection Relay is suitable for medium and high-voltage
protection. It is commonly used for overcurrent protection, under- and overvoltage
protection, over- and under-frequency protection and is useful for many more protection
schemes. Figure 9 shows the front panel and rear panel layouts of the SEL-751. In Figure
9a), the front panel layout shows the display, buttons, and the LEDs which indicated the
status of the electrical system. The front panel can display measurements, calculated values,
input and output status, device status, and configuration parameters. It shows the type of trip
that has occurred through turning on the LEDs on the left.
The LEDs are programmable and the 8 pushbuttons on the lower-right side of the panel
are the operator controls. The operator control functions can be changed using SELogic
control equations. The AUX operator control pushbuttons are used to enable and disable
user-programmed auxiliary control. The LOCK operator control pushbutton engages or
disengages the lock function. The device state TRIP and CLOSE are unchangeable unless the
lock function is disengaged. The CLOSE pushbutton allows the operator to close the circuit
and the TRIP pushbutton opens the circuit breaker. The rear panel shows the digital and
analog inputs and outputs, and communication ports.
22
a) Front Panel Layout with Configurable Labels and Display
b) Rear Panel Layout with Inputs and Outputs
Figure 9. Front Panel and Rear Panel Layout of the SEL-751 [8]

23
5.7 Solar Tracker
A single-axis solar tracker has been installed on one of the solar panel carts to track sunlight.
It is designed to withstand 150 kg of weight and solar panels with 1 kW power. The linear
actuator can handle a maximum of 3 A current, and the solar tracking controller can handle a
maximum of 8 A current. It is waterproof and lightweight, but it requires 12 VDC to run the
controller. It has two modes of operations: automatic and manual modes. When it is in automatic
mode, the linear actuator moves depending on how much sunlight the light sensor senses. When
it is in manual mode, a remote is used to determine how much the solar panels are tilted.

24
Chapter 6. Testing
Chapter 6 examines the grid-tied solar system tests performed and test results. Initial solar
panel performance testing is included in section 6.1. In section 6.2, the microinverter initial
testing setup design, lab setup details, procedure, and test outcomes are described.
6.1 Initial Solar Panel Performance Testing
Open-circuit voltage of each solar panel varied from 20.95 V to 21.04 V, but the total open-
circuit voltage of two series-connected solar panels was measured to be around 42 V. The
measured open-circuit voltage yields a 2.33% error when compared to the nominal open-circuit
voltage.
6.2 Microinverter Initial Testing
The initial testing of the YC1000-3-208 microinverter was performed with one solar panel
cart, which could provide up to 240 W power. Assuming the full capacity of the solar panels is
not reached due to factors like weather conditions, degradation of the solar panels, shade, and
solar panel angle, about 200 W is used to calculate the load needed for testing. Using Equation
(2), the equivalent resistance of the load in each phase is calculated to be approximately 216 Ω.
𝑅 =𝑉2
𝑃
3
=(120𝑉)2
(200𝑊)/3= 216 Ω (2)
25
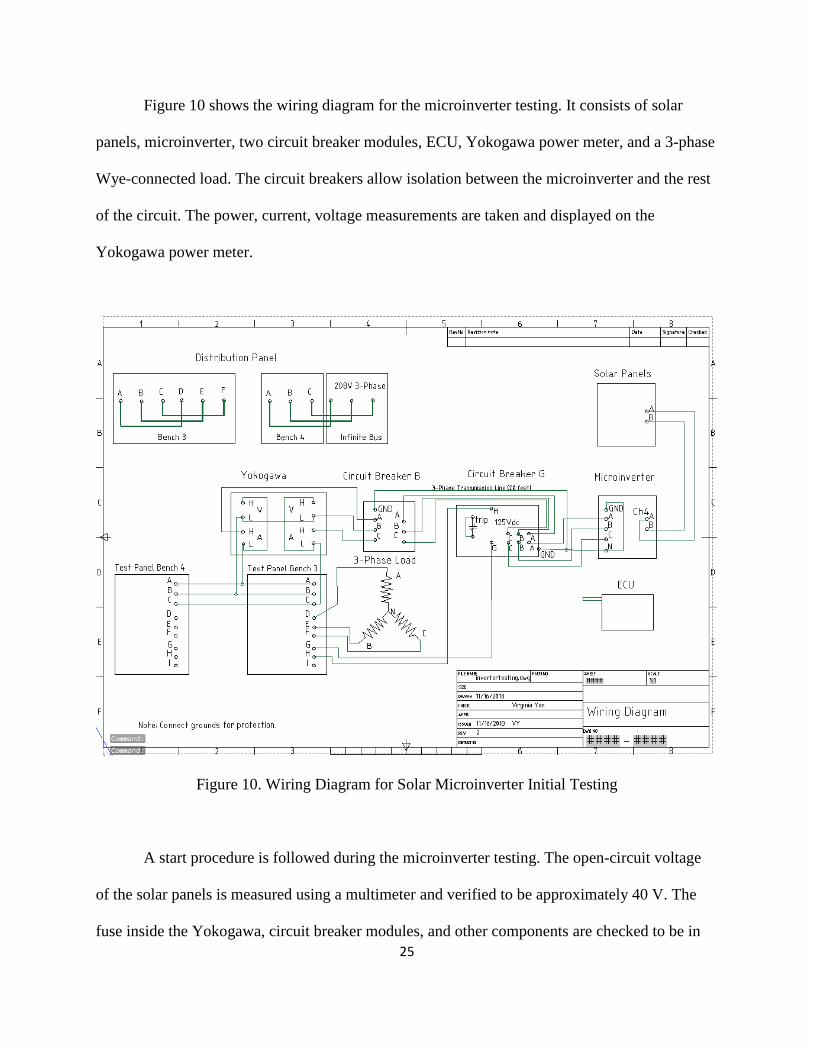
Figure 10 shows the wiring diagram for the microinverter testing. It consists of solar
panels, microinverter, two circuit breaker modules, ECU, Yokogawa power meter, and a 3-phase
Wye-connected load. The circuit breakers allow isolation between the microinverter and the rest
of the circuit. The power, current, voltage measurements are taken and displayed on the
Yokogawa power meter.
Figure 10. Wiring Diagram for Solar Microinverter Initial Testing
A start procedure is followed during the microinverter testing. The open-circuit voltage
of the solar panels is measured using a multimeter and verified to be approximately 40 V. The
fuse inside the Yokogawa, circuit breaker modules, and other components are checked to be in
26
good conditions. All the mechanical and electrical connections are made and double-checked
before powering on the system. First, the DC and AC sources on the main distribution panel are
turned on. Then the circuit breaker B on the AC side is closed. DC disconnect switch under the
solar panels is then closed to verify that the LED on the microinverter blinks green 3 times. After
closing the circuit breaker G on the DC side, the entire system is powered on and connected. The
line voltages are verified to be around 208 V by measuring the circuit breaker terminals AB, BC,
and CA with a Fluke multimeter. After 5 minutes of the safety delay, the LED is verified to flash
green with a 10-second gap, which means the PV system is producing power and communicating
with the ECU. This procedure is followed without the 3-phase resistive load initially to ensure
the system is running. The load is then added to the system by switching on sources D, E, and F
on Bench 3.
Figure 11 shows the setup used on the DC side in the initial testing. Two Kyocera
KC120-1 solar panels, an APsystems YC-1000-3-208 microinverter, a DC disconnect switch,
and a circuit breaker module are used in the testing.

27
Figure 11. Solar Panel Cart (Troy) and APsystems Microinverter Used in the Testing
The resistive load configuration to achieve approximately 216 Ω resistance is a Wye-
connected load comprises 3 resistors in series on each line as shown in Figure 12a). Each resistor
was measured to have about 72 Ω resistance. During the setup, the equivalent resistance of the
load in each line was measured to be around 216 Ω. The Wye-connection was already made
internally, and the white wire was the neutral wire. On the main distribution panel, sources A, B,
and C were connected to D, E, and F on Bench 3 so that the circuits can be further protected and
can be isolated by the switches on the test panel for troubleshooting. Sources A, B, and C on
Bench 4 are connected to the 3-phase 208 V terminals on the main distribution panel. The main
distribution panel connections are displayed in Figure 12b).
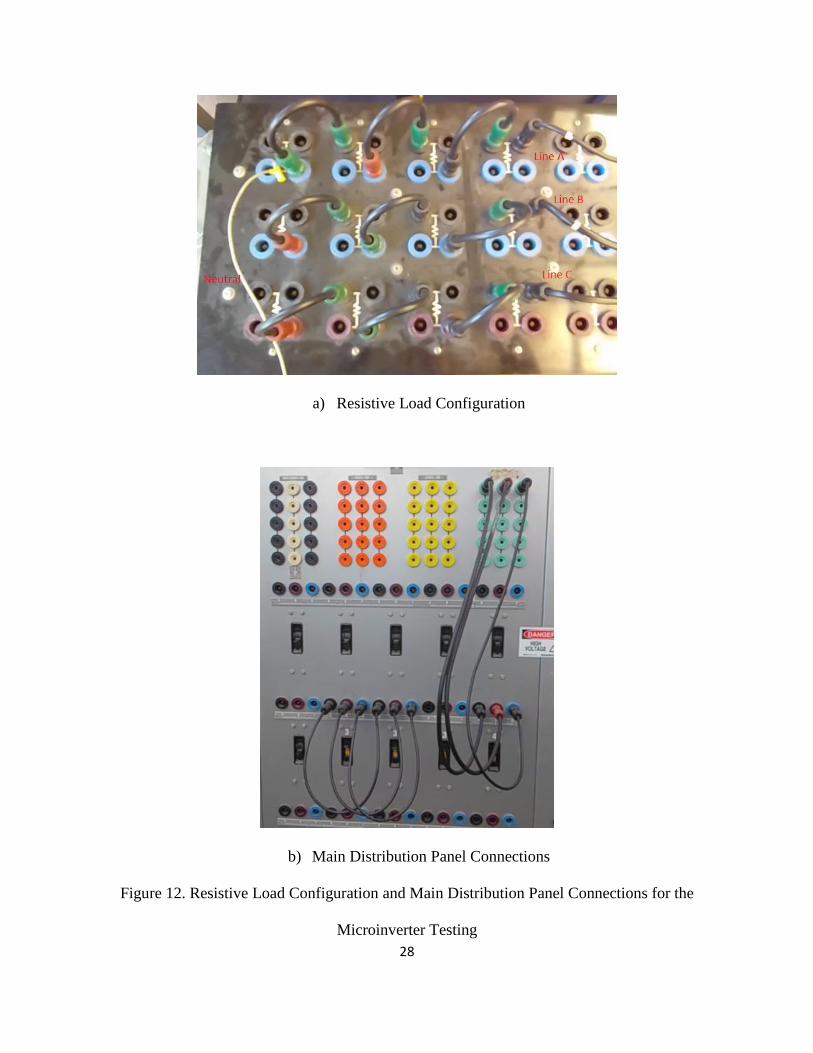
28
a) Resistive Load Configuration
b) Main Distribution Panel Connections
Figure 12. Resistive Load Configuration and Main Distribution Panel Connections for the
Microinverter Testing

29
Figure 13 shows the test panel and Yokogawa connections for the microinverter system
testing inside the Microgrid Lab. Sources A, B, and C on Bench 3 are connected to the sources
A, B, and C on Bench 4 using banana-to-banana wires. Sources D, E, and F are connected to the
3-phase load, which allows the load to be isolated from the system with the internal switch.
Sources A, B, and C are also connected to the Yokogawa power meter. Sources G and H
provides about 125 V DC to the circuit breaker G.
Figure 13. Connections on Bench 3 Panel and Yokogawa Power Meter
30
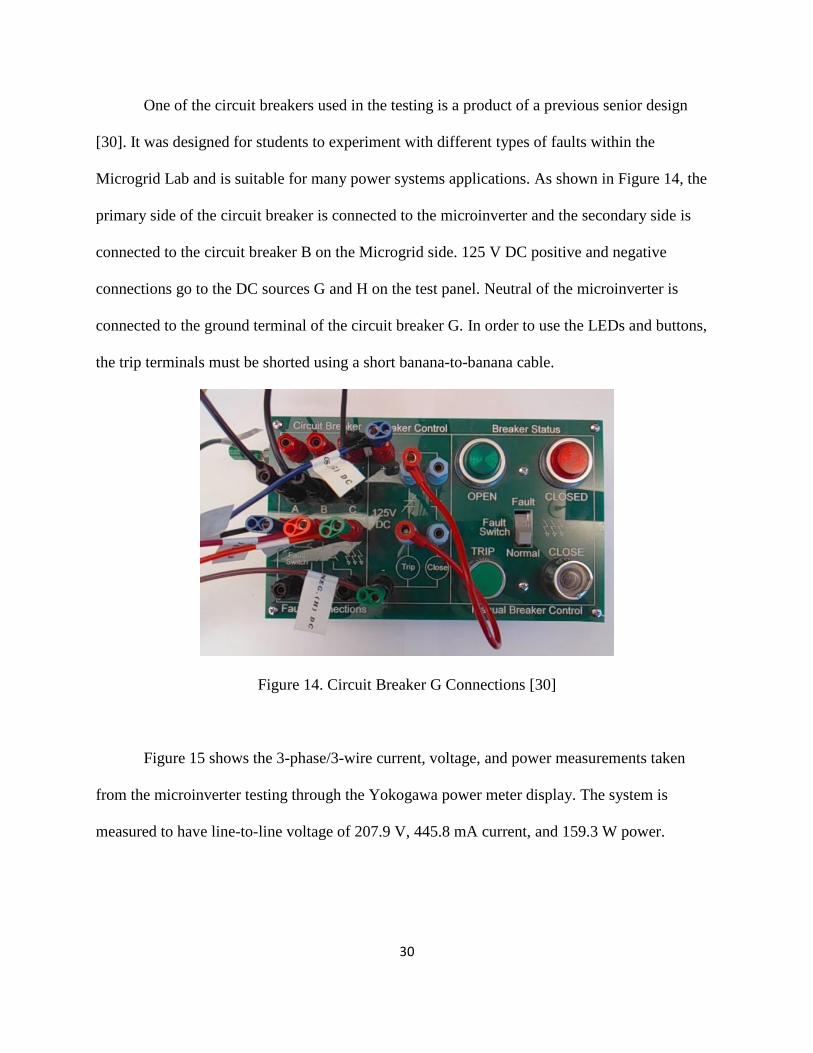
One of the circuit breakers used in the testing is a product of a previous senior design
[30]. It was designed for students to experiment with different types of faults within the
Microgrid Lab and is suitable for many power systems applications. As shown in Figure 14, the
primary side of the circuit breaker is connected to the microinverter and the secondary side is
connected to the circuit breaker B on the Microgrid side. 125 V DC positive and negative
connections go to the DC sources G and H on the test panel. Neutral of the microinverter is
connected to the ground terminal of the circuit breaker G. In order to use the LEDs and buttons,
the trip terminals must be shorted using a short banana-to-banana cable.
Figure 14. Circuit Breaker G Connections [30]
Figure 15 shows the 3-phase/3-wire current, voltage, and power measurements taken
from the microinverter testing through the Yokogawa power meter display. The system is
measured to have line-to-line voltage of 207.9 V, 445.8 mA current, and 159.3 W power.
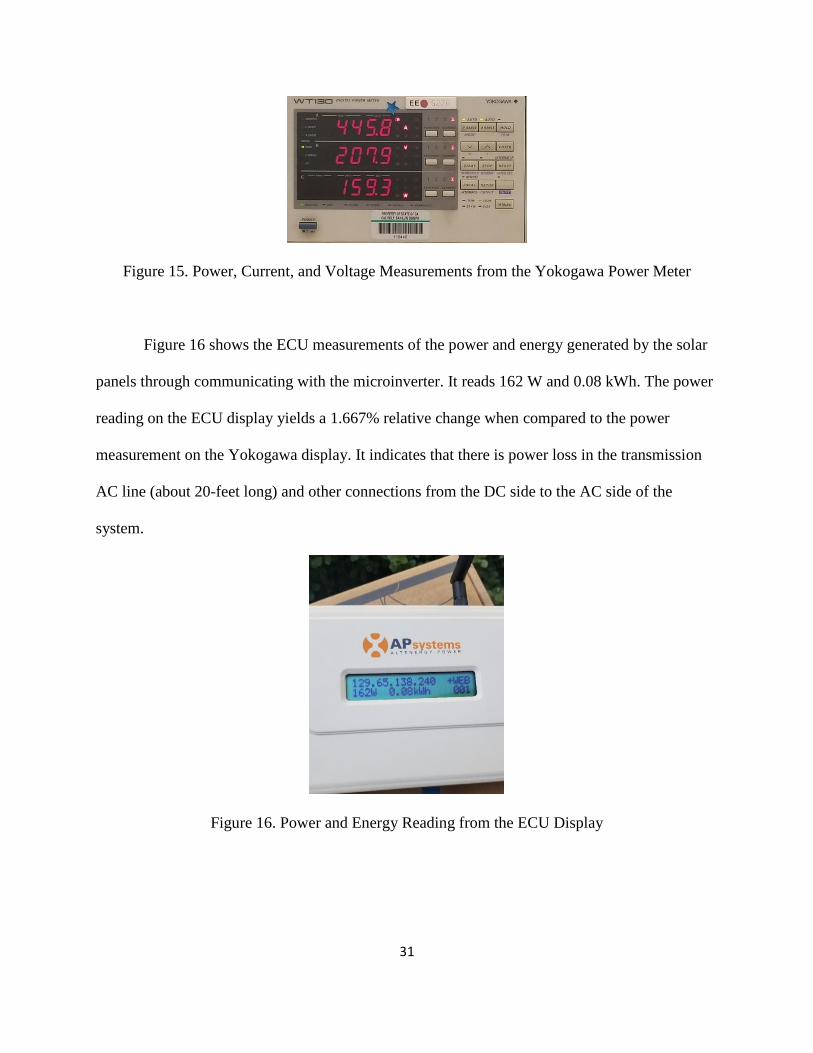
31
Figure 15. Power, Current, and Voltage Measurements from the Yokogawa Power Meter
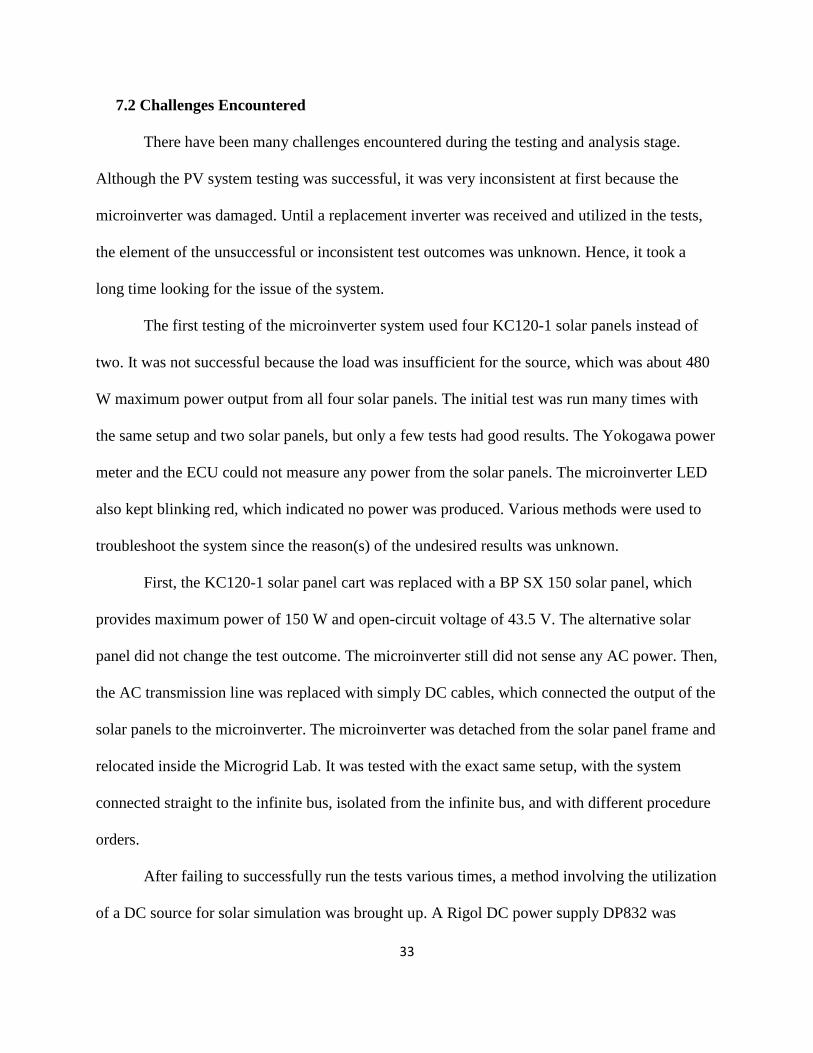
Figure 16 shows the ECU measurements of the power and energy generated by the solar
panels through communicating with the microinverter. It reads 162 W and 0.08 kWh. The power
reading on the ECU display yields a 1.667% relative change when compared to the power
measurement on the Yokogawa display. It indicates that there is power loss in the transmission
AC line (about 20-feet long) and other connections from the DC side to the AC side of the
system.
Figure 16. Power and Energy Reading from the ECU Display

32
Chapter 7: Conclusion and Recommendations
This chapter draws conclusions about the grid-tied solar system test results, and key
challenges faced previously, and makes recommendations to help continue the integration of the
system into the Microgrid Lab.
7.1 Conclusion
This project proposes the integration of a grid-connected solar system to the Cal Poly
Microgrid Lab. The solar system design is based on the identified customer needs, marketing
requirements, and engineering specifications in the definition and planning stage. Two Kyocera
KC120-1 solar panels, which output a maximum of 240 Watts power, are connected in series to
meet the startup voltage requirement of the APsystems YC1000-3-208 microinverter. A three-
phase Y-connected resistive load is connected to the system to balance the power produced from
the PV. The load is calculated and measured to have about 216 Ω resistance per phase. The
APsystems ECU-3Z is used to communicate with the microinverter through Zigbee
communication protocol and send real-time reports to the EMA. The voltage, frequency, and
power measurements on the Yokogawa power meter during tests matched theory and the
reported values from the ECU with a 5% maximum relative difference.
The satisfactory outcomes of the initial solar system performance test indicate the success
of the grid-tied solar system development and integration. The system is able to absorb sunlight,
apply DC-to-AC energy conversion, and push the AC electricity to the utility grid. Meanwhile,
the developed system is relatively cost-effective since it costs nearly half of the estimated
budget.
33
7.2 Challenges Encountered
There have been many challenges encountered during the testing and analysis stage.
Although the PV system testing was successful, it was very inconsistent at first because the
microinverter was damaged. Until a replacement inverter was received and utilized in the tests,
the element of the unsuccessful or inconsistent test outcomes was unknown. Hence, it took a
long time looking for the issue of the system.
The first testing of the microinverter system used four KC120-1 solar panels instead of
two. It was not successful because the load was insufficient for the source, which was about 480
W maximum power output from all four solar panels. The initial test was run many times with
the same setup and two solar panels, but only a few tests had good results. The Yokogawa power
meter and the ECU could not measure any power from the solar panels. The microinverter LED
also kept blinking red, which indicated no power was produced. Various methods were used to
troubleshoot the system since the reason(s) of the undesired results was unknown.
First, the KC120-1 solar panel cart was replaced with a BP SX 150 solar panel, which
provides maximum power of 150 W and open-circuit voltage of 43.5 V. The alternative solar
panel did not change the test outcome. The microinverter still did not sense any AC power. Then,
the AC transmission line was replaced with simply DC cables, which connected the output of the
solar panels to the microinverter. The microinverter was detached from the solar panel frame and
relocated inside the Microgrid Lab. It was tested with the exact same setup, with the system
connected straight to the infinite bus, isolated from the infinite bus, and with different procedure
orders.
After failing to successfully run the tests various times, a method involving the utilization
of a DC source for solar simulation was brought up. A Rigol DC power supply DP832 was

34
connected to the microinverter to test if it was functioning. Channels 1 and 2 can output 30 V
maximum and 3 A maximum, which gives 180 W if both channels are run. The microinverter
responded but the voltages on both channels of the power supply were fluctuating a lot and kept
changing between constant current and constant voltage modes, even after the current limit was
adjusted. The reason for this was suspected to be because the MPPT of the microinverter was
trying to match the internal impedance of the power supply. The first few tests with the DC
power supply did push about 70 W to the grid, but it dissipated within less than a second.
An alternative way to simulate the PV was to use sources G and H from the test panel as
a DC source with a power rheostat to adjust its voltage. However, the microinverter LED stayed
red, indicating that there was an electrode assembly ground fault.
There also have been challenges planning the meeting time due to the time conflicts of
the students and faculty, and the lab availability. Other factors such as weather conditions, shade,
and location are also constraints on the success of testing.

35
7.3 Recommendations for Future Projects
Troubleshooting the PV system took most of the project time in the last quarter. Due to
inadequate planning and lack of technical experiences, the system with the SEL equipment did
not have enough time to be implemented and tested unfortunately. This gives future students the
opportunity to continue this project by integrating the grid-tied solar system to the Microgrid
with SEL-735 and SEL-751. Since the basic framework has been built, studies on fault detection
and protection can be done by simulating the system in ETAP and MATLAB, implementing the
simulations with various experiment setups, and comparing the actual measurements with the
simulated results.
A modern microgrid should be able to operate either connected or disconnected from the
main grid; it should have two major modes: grid-connected mode and island mode. In grid-
connected mode, the system is a lot easier to control and protect since it’s relatively small in
terms of scale. Critical demand-supply balance becomes a challenge of operating the Microgrid
in island mode since the voltage and frequency of the system must be maintained at 208 V and
60 Hz. Hence, it requires an elegant approach to run the solar system tests with it isolated from
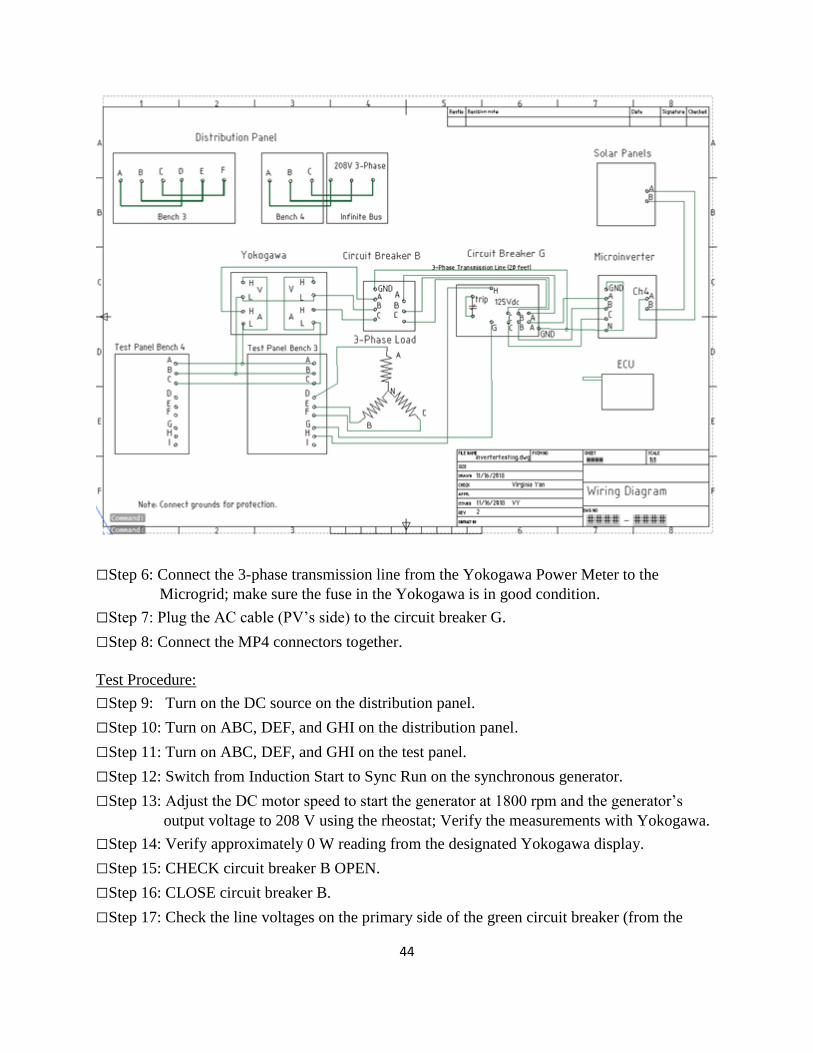
the infinite bus. Figure 17 shows the wiring diagram to test the system with a synchronous
generator. It consists of a DC motor starter, a DC motor, a synchronous generator, power
rheostat, a Yokogawa power meter, 2 circuit breaker modules, a 3-phase Wye-connected
resistive load, and a microinverter. The DC motor starter is needed to protect the DC motor from
potential damage caused by ultra-high current and torque during starting. DC motor is coupled to
the synchronous generator as a prime mover to run the synchronous generator. The rheostat is
used to adjust the field current. The circuit breaker allows isolation between the microinverter

36
and the rest of the circuit. The Yokogawa then displays the voltage, current, frequency, and
power measurements.
Figure 17. Wiring Diagram for Microinverter Testing with Synchronous Generator
To eliminate more limitations such as weather, temperature, sun exposure, and time
which can affect the solar system test results, a photovoltaic emulator is preferred to simulate the
solar panels since they have similar electrical characteristics and the output power is controllable.
High power programmable DC power supplies such as B&K Precision power supplies
PVS10005, PVS60085, and PVS60085MR have built-in Solar Array Simulation (SAS) function,
which can simulate the output of a solar array and changes in irradiance conditions [32].

37
Overall system testing with the SEL relays will be performed and studied after the
microinverter testing. The SEL relays will be tested with the factory default settings. The
objective of the testing is to ensure the overall system is implemented successfully with all the
equipment and devices working together.

38
Bibliography [1] U.S. Department of Energy. “Chapter 3: Enabling Modernization of the Electric Power
System,” in Quadrennial Technology Review, pp.9. Sept. 2015. [Online]. Available:
https://www.energy.gov/sites/prod/files/2017/03/f34/qtr-2015-chapter3.pdf. [Accessed:
March 9, 2018].
[2] M. Sachdev. “A Hands-On Learning and Training Program in Power System Protection,” in
IET Sixth International Conference on Developments in Power System Protection, pp.122-
125. 1997.
[3] U.S. Energy Information Administration. “Fossil Fuels Still Dominate U.S. Energy
Consumption Despite Recent Market Share Decline,” www.eia.gov, July 1, 2016. [Online].
Available: https://www.eia.gov/todayinenergy/detail.php?id=26912. [Accessed: Feb. 25,
2018].
[4] L. Lalonde. “Don’t Judge a Solar PV System’s Efficacy by Inverter Efficiency Alone,”
ElectronicDesign, p. 4, Oct. 5, 2011. [Online]. Available: http://www.electronicdesign.com/
energy/don-t-judge-solar-pv-system-s-efficacy-inverter-efficiency-alone. [Accessed: Feb.
26, 2018].
[5] E. Skinkis. “Cal Poly Sustainable Power for Electrical Resources (SuPER) Microcontroller
Integration,” Senior Project, California Polytechnic State University, San Luis Obispo,
California, United States, 2016.
[6] Kyocera, KC120-1: High Efficiency Multicrystal Photovoltaic Module. Scottsdale, Arizona:
Kyocera. Available: https://www.kyocerasolar.com/dealers/product-center/archives/spec-
sheets/KC120-1.pdf. [Accessed: Apr. 20, 2018].
[7] APsystems, YC1000-3 Commercial Microinverter. Washington: Seattle. June 13, 2017.
[8] SEL, SEL-751 Feeder Protection Relay. Pullman, Washington: Schweitzer Engineering
Laboratories, INC. Available: https://cdn.selinc.com/assets/Literature/Product%20Literature
/Data%20Sheets/751_DS_20171206.pdf?v=20180124-065248. [Accessed: Feb. 28, 2018].
[9] SEL, SEL-735 Power Quality and Revenue Meter. Pullman, Washington: Schweitzer
Engineering Laboratories, INC. Available: https://cdn.selinc.com/assets/Literature /Product
%20Literature/Data%20Sheets/735_DS_20180208.pdf?v=20180223-064827. [Accessed:
Feb. 28, 2018].
[10] R. Ford and C. Coulston, Design for Electrical and Computer Engineers, McGraw-Hill,
2007.
[11] Commoner, the Closing Circle: Nature, Man, and Technology. New York: Alfred A. Knopf,
1972, pp. 16-24.
[12] M. Friedman. “The Corporation [4/23] Externalities,” YouTube, Jan. 23, 2007 [Video file].
Available: https://www.youtube.com/watch?v=aCGTD5Bn1m0&t=34s. [Accessed: Feb.
19, 2018].
[13] E. Brown, “Improving Permit Review and Approval for Small Solar Photovoltaic (PV)
Systems,” California Solar Permitting Guidebook. June 2012. [Online]. Available:
http://opr.ca.gov/docs/California_Solar_Permitting_Guidebook.pdf. [Accessed: March
9, 2018].
[14] IEEE Board of Directors, IEEE Code of Ethics, 2006. http://portal.ieee.org/web/aboutus/
Ethics/code.html, cited 02-19-18.
[15] J. Bentham, An Introduction to the Principles of Morals and Legislation, Batoche Books:
Kitchener, Canada, 2000, pp. 14.
[16] C. Fleddermann, Engineering Ethics, Prentice-Hall, Inc: New Jersey, 1999, pp.36.
39
[17] NC State University, “Health and Safety Impacts of Solar Photovoltaics,” NC Clean Energy
Technology Center, p.5-8. [Online]. Available: https://nccleantech.ncsu.edu/wp-content/
uploads/Health-and-Safety-Impacts-of-Solar-Photovoltaics-2017_white-paper.pdf.
[Accessed: March 9,2018].
[17] C. Schwegler, “Rule 21: California’s Electric Grid Just Got Smarter,” Solar Industry, p. 4,
October 26, 2017. [Online]. Available: https://solarindustrymag.com/rule-21-californias-
electric-grid-just-got-smarter.
[18] L. Hadjidemetriou, E. Kyriakides, Y. Yang, F. Blaabjerg, “A Synchronization Scheme for
Single-Phase Grid-Tied Inverters Under Harmonic Distortion and Grid Disturbances,” in
IEEE Trans. Power Electron., vol. 32, no. 4, pp. 2784-2793. Apr. 2017.
[19] L. Castaner and S. Silvestre. Modelling Photovoltaic Systems Using PSpice. England: John
Wiley & Sons Ltd, 2002, pp. 215-242.
[20] Renogy, RNG-BATT-AGM12-100 (12V 100AH/10HR): Absorbent Glass Mat (AGM)
Specifications. Ontario, California: Renogy. Available: https://www.renogy.com/template/
files/Specifications/RNG-BATT-AGM12-100.pdf. [Accessed: February 5,2018].
[21] M. Pahlevaniezhad, S. Eren, P. Jain. “Observer-Based Control System for Grid-Connected
DC/AC Converters With LCL-Filter.” United States Patent and Trademark Office 9,729,085
B2, Aug. 8, 2018.
[22] A.E.W.G.Kahlane, L. Hassaine, M. Kherchi. “LCL Filter Design for Photovoltaic Grid-
Connected Systems,” in Revue des Energies Renouvelables SIENR’14 Ghardaia. 2014,
Aliers, Algeria. [Online]. Available: http://www.cder.dz/download/sienr2014_31.pdf.
[Accessed: February 5, 2018].
[23] H. Chiu, Y. Lo, C. Yang, S. Cheng, C. Huang, C. Chuang, M. Kuo, Y. Huang, Y. Jean, Y.
Huang. “A Module-Integrated Isolated Solar Microinverter,” in IEEE Trans. Ind. Electron.,
vol. 60, no. 2, pp. 781-788. Feb. 2013.
[24] S. Kumar, B. Singh. “A Multipurpose PV System Integrated to a Three-Phase Distribution
System Using an LWDF-Based Approach,” in IEEE Trans. Power Electron., vol. 33, no. 1,
pp. 739-748. Jan. 2018.
[25] S. Mirhassani, H. Ong, W.T. Chong, K.Y. Leong. “Advances and Challenges in Grid-Tied
Photovoltaic Systems,” in Renewable and Sustainable Energy Reviews, vol. 49. pp. 121-131.
Apr. 2014.
[26] Y. Wang, F. Wang. “Novel Three-Phase Three-Level-Stacked Neutral Point Clamped Grid-
Tied Solar Inverter with a Split Phase Controller,” in IEEE Trans. Power Electron., vol. 28,
no. 6, pp. 2856-2866. June 2013.
[27] K. Mansfield. “Comparison of Single-Stage and Two-Stage Grid-Tied Inverters,” M.S.
thesis, University of Central Florida, Florida, United States, 2007.
[28] APsystems, Installation/User Manual: YC1000-3 Commercial Microinverter. Washington:
Seattle. June 16, 2017.
[29] “ECO-WORTHY 1KW Single Axis Solar Tracker Complete Kit Sunlight Track,”
Amazon.com. [Online]. Available: https://www.amazon.com/gp/product/B00FF1KHAW/
ref=oh_aui_detailpage_o01_s00?ie=UTF8&psc=1.
[30] A. Barley, J. Chung, A. Scozzari. “Lab-Scale Circuit Breaker Module for Power System
Laboratories,” California Polytechnic State University, San Luis Obispo. June 12, 2017.
[31] bp solar, BP SX 150: 150-Watt Multicrystalline Photovoltaic Module. Houston, Texas: BP
Solar Global Marketing Department. Available: http://abcsolar.com/pdf/bpsx150.pdf.
[Accessed: Jan. 15, 2018].

40
[32] B&K Precision Corp., High Power Programmable DC Power Supplies: PVS Series. Yorba
Linda, California: B&K Precision Corporation. Available: https://bkpmedia.s3.amazonaws.
com/downloads/datasheets/en-us/PVS_series_datasheet.pdf. [Accessed: December 8, 2018].
41
Appendix A - Bill of Materials
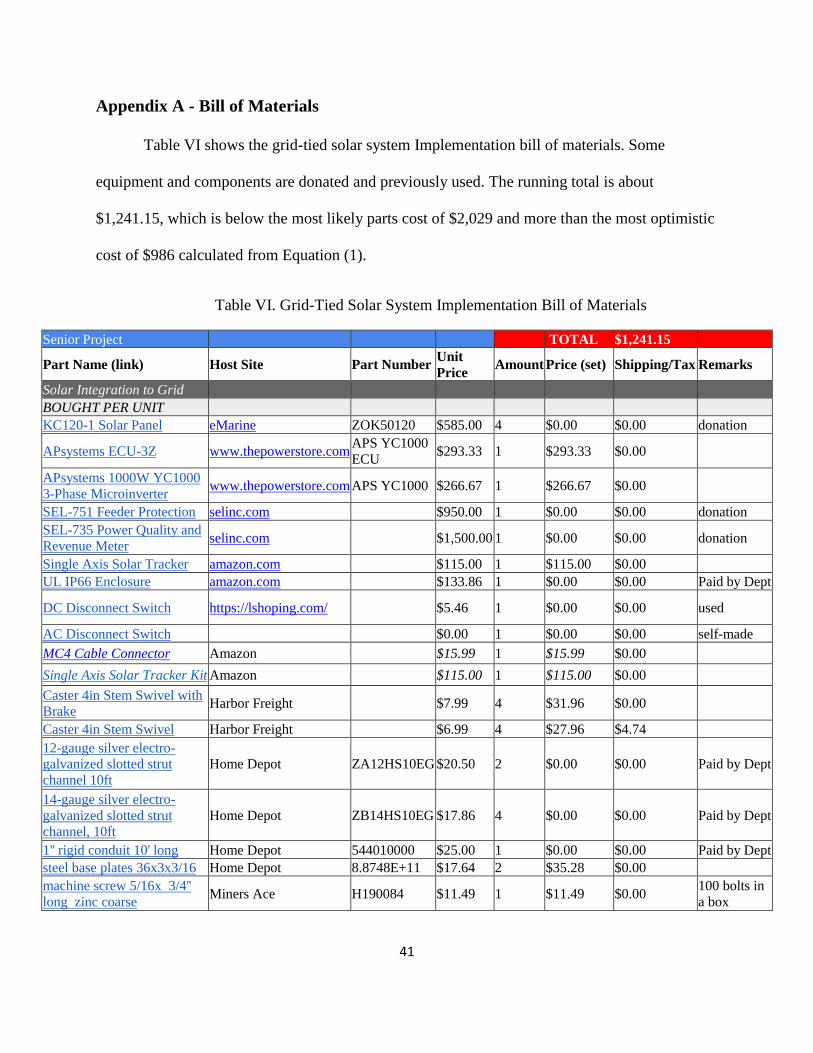
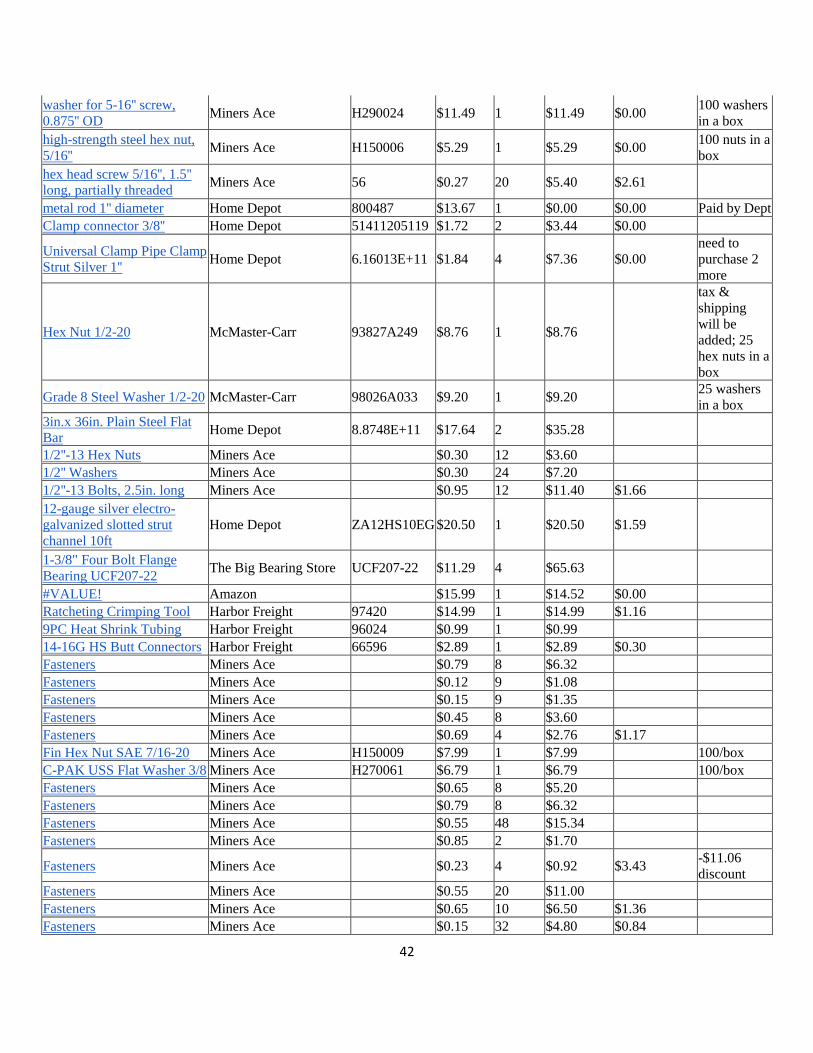
Table VI shows the grid-tied solar system Implementation bill of materials. Some
equipment and components are donated and previously used. The running total is about
$1,241.15, which is below the most likely parts cost of $2,029 and more than the most optimistic
cost of $986 calculated from Equation (1).
Table VI. Grid-Tied Solar System Implementation Bill of Materials
Senior Project TOTAL $1,241.15
Part Name (link) Host Site Part Number Unit
Price Amount Price (set) Shipping/Tax Remarks
Solar Integration to Grid
BOUGHT PER UNIT
KC120-1 Solar Panel eMarine ZOK50120 $585.00 4 $0.00 $0.00 donation
APsystems ECU-3Z www.thepowerstore.com
APS YC1000
ECU $293.33 1 $293.33 $0.00
APsystems 1000W YC1000
3-Phase Microinverter
www.thepowerstore.com APS YC1000 $266.67 1 $266.67 $0.00
SEL-751 Feeder Protection selinc.com $950.00 1 $0.00 $0.00 donation
SEL-735 Power Quality and
Revenue Meter
selinc.com $1,500.00 1 $0.00 $0.00 donation
Single Axis Solar Tracker amazon.com $115.00 1 $115.00 $0.00
UL IP66 Enclosure amazon.com $133.86 1 $0.00 $0.00 Paid by Dept
DC Disconnect Switch https://lshoping.com/ $5.46 1 $0.00 $0.00 used
AC Disconnect Switch $0.00 1 $0.00 $0.00 self-made
MC4 Cable Connector Amazon $15.99 1 $15.99 $0.00
Single Axis Solar Tracker Kit Amazon $115.00 1 $115.00 $0.00
Caster 4in Stem Swivel with
Brake Harbor Freight $7.99 4 $31.96 $0.00
Caster 4in Stem Swivel Harbor Freight $6.99 4 $27.96 $4.74
12-gauge silver electro-
galvanized slotted strut
channel 10ft
Home Depot ZA12HS10EG $20.50 2 $0.00 $0.00 Paid by Dept
14-gauge silver electro-
galvanized slotted strut
channel, 10ft
Home Depot ZB14HS10EG $17.86 4 $0.00 $0.00 Paid by Dept
1'' rigid conduit 10' long Home Depot 544010000 $25.00 1 $0.00 $0.00 Paid by Dept
steel base plates 36x3x3/16 Home Depot 8.8748E+11 $17.64 2 $35.28 $0.00
machine screw 5/16x 3/4''
long zinc coarse Miners Ace H190084 $11.49 1 $11.49 $0.00
100 bolts in
a box
42
washer for 5-16'' screw,
0.875'' OD
Miners Ace H290024 $11.49 1 $11.49 $0.00 100 washers
in a box
high-strength steel hex nut,
5/16''
Miners Ace H150006 $5.29 1 $5.29 $0.00 100 nuts in a
box
hex head screw 5/16'', 1.5''
long, partially threaded
Miners Ace 56 $0.27 20 $5.40 $2.61
metal rod 1'' diameter Home Depot 800487 $13.67 1 $0.00 $0.00 Paid by Dept
Clamp connector 3/8'' Home Depot 51411205119 $1.72 2 $3.44 $0.00
Universal Clamp Pipe Clamp
Strut Silver 1'' Home Depot 6.16013E+11 $1.84 4 $7.36 $0.00
need to
purchase 2
more
Hex Nut 1/2-20 McMaster-Carr 93827A249 $8.76 1 $8.76
tax &
shipping
will be
added; 25
hex nuts in a
box
Grade 8 Steel Washer 1/2-20 McMaster-Carr 98026A033 $9.20 1 $9.20 25 washers
in a box
3in.x 36in. Plain Steel Flat
Bar
Home Depot 8.8748E+11 $17.64 2 $35.28
1/2''-13 Hex Nuts Miners Ace $0.30 12 $3.60
1/2'' Washers Miners Ace $0.30 24 $7.20
1/2''-13 Bolts, 2.5in. long Miners Ace $0.95 12 $11.40 $1.66
12-gauge silver electro-
galvanized slotted strut
channel 10ft
Home Depot ZA12HS10EG $20.50 1 $20.50 $1.59
1-3/8" Four Bolt Flange
Bearing UCF207-22
The Big Bearing Store UCF207-22 $11.29 4 $65.63
#VALUE! Amazon $15.99 1 $14.52 $0.00
Ratcheting Crimping Tool Harbor Freight 97420 $14.99 1 $14.99 $1.16
9PC Heat Shrink Tubing Harbor Freight 96024 $0.99 1 $0.99
14-16G HS Butt Connectors Harbor Freight 66596 $2.89 1 $2.89 $0.30
Fasteners Miners Ace $0.79 8 $6.32
Fasteners Miners Ace $0.12 9 $1.08
Fasteners Miners Ace $0.15 9 $1.35
Fasteners Miners Ace $0.45 8 $3.60
Fasteners Miners Ace $0.69 4 $2.76 $1.17
Fin Hex Nut SAE 7/16-20 Miners Ace H150009 $7.99 1 $7.99 100/box
C-PAK USS Flat Washer 3/8 Miners Ace H270061 $6.79 1 $6.79 100/box
Fasteners Miners Ace $0.65 8 $5.20
Fasteners Miners Ace $0.79 8 $6.32
Fasteners Miners Ace $0.55 48 $15.34
Fasteners Miners Ace $0.85 2 $1.70
Fasteners Miners Ace $0.23 4 $0.92 $3.43 -$11.06
discount
Fasteners Miners Ace $0.55 20 $11.00
Fasteners Miners Ace $0.65 10 $6.50 $1.36
Fasteners Miners Ace $0.15 32 $4.80 $0.84

43
Appendix B - Solar Microinverter Initial Test Start Program
Solar Microinverter Initial Test Start Program
By Virginia Yan, Do Vo
Updated Time: 11/29/2018
This start program is meant for the testing of YC1000-3-208 microinverter to the Cal Poly
Microgrid Lab.
Note: APsystems microinverters are designed to only operate when they can sense power coming
from the grid. Even if they are plugged into the PV array, they will not turn themselves on until
they can read power from the grid. When DC power is first applied to the unit, it flashes red
once, and then green three times.
Preparation Procedure:
Step 1: Setup PV portable cart Troy at a spot where the solar panels are directly exposed to the
sunlight.
Step 2: Verify open-circuit voltage (about 40 V for two panels).
VOC = ______________ V
Step 3: Lay the 3-phase transmission line along the pavement from PVs to the Microgrid Lab.
Step 4: Connect the solar tracker controller to a 12-V battery and turn on the power; make sure
it is in automatic mode by pressing the “Set” button on the remote.
Step 5: Plug the AC cable (Microgrid side) into the Yokogawa Power Meter with the following
setup:
44
Step 6: Connect the 3-phase transmission line from the Yokogawa Power Meter to the
Microgrid; make sure the fuse in the Yokogawa is in good condition.
Step 7: Plug the AC cable (PV’s side) to the circuit breaker G.
Step 8: Connect the MP4 connectors together.
Test Procedure:
Step 9: Turn on the DC source on the distribution panel.
Step 10: Turn on ABC, DEF, and GHI on the distribution panel.
Step 11: Turn on ABC, DEF, and GHI on the test panel.
Step 12: Switch from Induction Start to Sync Run on the synchronous generator.
Step 13: Adjust the DC motor speed to start the generator at 1800 rpm and the generator’s
output voltage to 208 V using the rheostat; Verify the measurements with Yokogawa.
Step 14: Verify approximately 0 W reading from the designated Yokogawa display.
Step 15: CHECK circuit breaker B OPEN.
Step 16: CLOSE circuit breaker B.
Step 17: Check the line voltages on the primary side of the green circuit breaker (from the

45
Microgrid Lab).
VAB = __________V, VBC = ___________V , VCA= ___________V
Step 18: CHECK circuit breaker G OPEN.
Step 19: Connect Troy to channel 4 of the microinverter (nearest the antenna mounting
thread).
Step 20: CLOSE the DC disconnect switch.
Step 21: Verify 3 short green blinks.
Step 22: CLOSE circuit breaker G.
Step 23: Wait for 5 minutes of the safety delay.
Start time: ___________ End time: ___________
Step 24: CHECK line voltages on the secondary side (from PV).
V’AB = __________V, V’BC = ___________V, V’CA= ___________V
Step 25: Verify flashing fast green lights (2-sec gap).
(It indicates that microinverter is producing power with no ECU)
Step 26: Record voltage, current, and power measurements from the Yokogawa.
Step 27: Record ECU readings; check EMA report to verify power measurements.
Step 28: TRIP circuit breaker G.
Step 29: TRIP DC disconnect switch.
Step 30: Disconnect MC4 connectors from the microinverter.
Step 31: Disconnect the AC cable connections.
Step 32: Turn off power in Microgrid Lab and disconnect all components.
Step 33: Fold Troy and locate it to the PES room (R101).
46
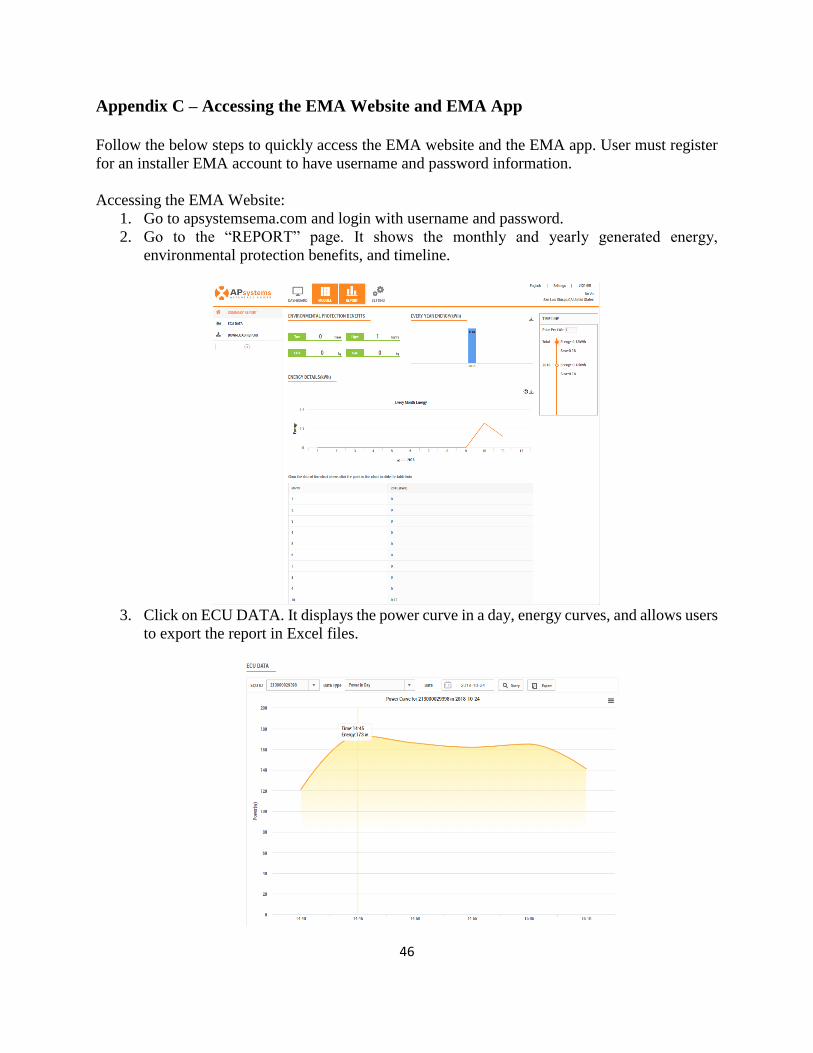
Appendix C – Accessing the EMA Website and EMA App
Follow the below steps to quickly access the EMA website and the EMA app. User must register
for an installer EMA account to have username and password information.
Accessing the EMA Website:
1. Go to apsystemsema.com and login with username and password.
2. Go to the “REPORT” page. It shows the monthly and yearly generated energy,
environmental protection benefits, and timeline.
3. Click on ECU DATA. It displays the power curve in a day, energy curves, and allows users
to export the report in Excel files.
47
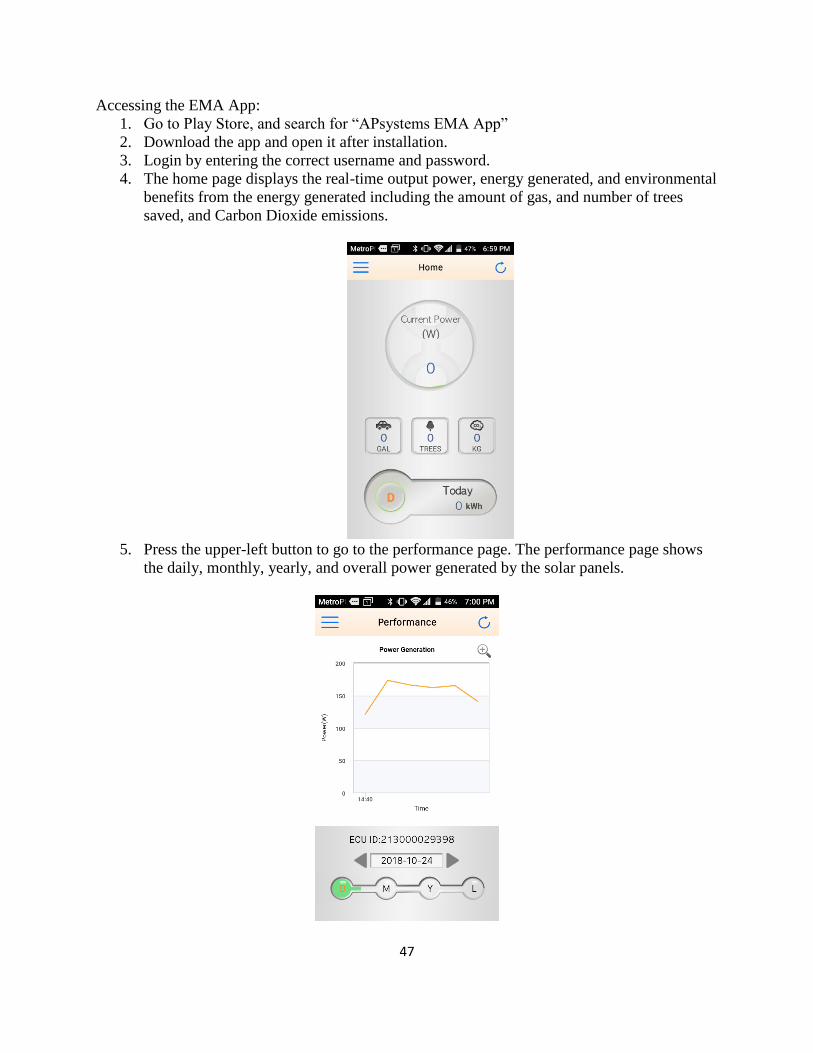
Accessing the EMA App:
1. Go to Play Store, and search for “APsystems EMA App”
2. Download the app and open it after installation.
3. Login by entering the correct username and password.
4. The home page displays the real-time output power, energy generated, and environmental
benefits from the energy generated including the amount of gas, and number of trees
saved, and Carbon Dioxide emissions.
5. Press the upper-left button to go to the performance page. The performance page shows
the daily, monthly, yearly, and overall power generated by the solar panels.

48
Appendix D – Senior Project Analysis
Project Title: Grid-Tied Solar System
Student’s Name: Virginia Yan
Student’s Signature: Virginia Yan
Advisor’s Name: Ali O. Shaban
1. Functional Requirements Summary
Distribution level solar energy generation has gained importance and popularity, because it
helps create a sustainable electricity system while reducing the harmful environmental impacts
our current power systems have. This project proposes an alternative energy source, a laboratory-
scale grid-connected photovoltaic system. A KC120-1 solar panel produces approximately 120
Watts A grid-tied solar power inverter does DC-to-AC conversion and minimizes energy transfer
losses. The inverter also has an anti-islanding feature, which senses a power outage and prevents
back-feeding through isolating the circuit. The circuit breakers isolate electrical components and
protect the circuit. Schweitzer Engineering Laboratories SEL-751 Feeder protection relay and
SEL-735 power quality meter protect and monitor the feeder before joining the Microgrid Lab.
2. Primary Constraints
The most significant challenge involves the DC-to-AC inverter, which must output 208 V
AC voltage to feed the electricity back to the utility grid. After intensive research, an alternative
method includes a DC-to-AC single-phase inverter and an AC single-phase/three-phase inverter.
However, the additional power losses become significant. Then purchasing a DC-to-AC three-
phase grid-tied inverter, through research, costs $2,000 minimum because most are commercially
rated. Therefore, they require commercially rated solar panels, which can output 225Vdc
minimum. It changes the entire design topology and the equipment used.

49
Another difficulty encountered includes the synchronization between the solar panel and the
utility grid. Lacking relevant knowledge makes it difficult to determine the most suitable
solution. Most IEEE journals focus on the synchronization scheme for only single-phase grid-
tied inverters.
Moreover, solutions involving eliminating harmonic distortion and grid disturbances also
play a significant role. Many IEEE journals suggest using LCL filtering and some other
alternative methods, but the final decision requires more research and discussion.
3. Economic
When considering human capital, students gain understanding in power systems
fundamentals during the process, which increases their competitiveness in the job market. It can
potentially boost their income and the Cal Poly electrical engineering program. Having
uninterrupted electric power, students, staff, and faculty increase their productivity and work
performance. The efficient use of manufactured capital helps the Microgrid Lab reduce resource
use, enhance efficiency and sustainable development. Commoner’s law of ecology suggests:
“everything connects to everything else [11].” Re-using solar panels, SEL protective relays and
power quality meters, and other loaner devices not only reduce manufacturing costs, but also
positively impacts financial capital. The project uses sunlight as an alternative energy, which
systematically reduces dependence on fossil fuels. The natural capital includes renewable
energy, which reflects the zero-emissions production goal.
The project costs accrue when the first design-build-test cycle begins because purchasing
parts and tools cost money. The labor costs also accrue because the entire process uses

50
approximately 442 man-hours. Benefits accrue after the project ends and the design gets
implemented and manufactured.
Pacific Gas and Electric (PG&E), Schweitzer Engineering Laboratories (SEL), other
electrical manufacturers, and the Cal Poly electrical engineering department pay for the project.
Table V gives the total project cost estimation. It estimates the project cost about $19,914.154
including labor costs and parts costs.
The college gains profit when a new power systems protection theory laboratory coursework
becomes established and students can register for the course. This can potentially become a
project-based laboratory course and let other tech companies donate more relevant lab
equipment. Cal Poly electrical engineering department also profits if companies use the
protection strategies or systems.
The products emerge after the final implementation and analysis process end. In Figure 3, the
Gantt charts show that the project requires approximately 25 weeks, which allow adequate
development time and different design approaches. Optimistically, the product designs estimate a
20-year lifetime, assuming minimum maintenance and upgrades occur when necessary. The
maintenance costs exist when the overcurrent protection, overvoltage protection, and other fault
detection fail to work.
4. If Commercially Manufactured:
An estimated 500 devices or systems are manufactured and sold per year at an estimated
manufacturing cost of $4,000. A target purchase price ranges from $8,000 to $12,000, which
means profits can reach $8,000 per year. Other companies can license successful protection
methods and apply them to their product or services.

51
5. Environmental
Nobel Prize winner Milton Friedman defines externality as the effect between two
individuals/corporations’ transaction on third parties [12]. The project has positive external
impacts on San Luis Obispo community and other communities because it uses renewable
energy and does energy conversion. However, “there is no such thing as a free lunch [9].” The
project connects to the entire proposed Microgrid Lab project, which uses transformers,
generators, and motors. They all have emissions which can harm the environment. Additionally,
the part transportation has indirect negative environmental effects.
The project uses PG&E electricity directly and the electricity converted from sunlight. The
project improves PG&E services, because it uses renewable energy and provides uninterrupted
electricity. Solar generation makes the main grid more efficient and durable. If successfully
implemented, the project has a positive impact on other species because it improves
sustainability by reducing ecological footprint.
6. Manufacturability
The main issue with manufacturing this product involves high initial manufacturing cost,
which can bring less profits than expected. Due to the lack of DC-to-AC three-phase non-
commercial inverters, technical difficulties arise. When lowering the inverter costs, power losses
and harmonics become the tradeoffs. A more effective and efficient method requires more
discussion and analysis.
A new grid-tied solar system requires the homeowners to have electrical permits or licensed
electricians [13]. California state law also charges the agency for permit processing and
inspection. This fee and labor costs must be considered when installing the system. Additionally,

52
regulatory requirements and the permitting process involve strenuous effort because they require
many paperwork.
7. Sustainability
The challenges include successfully synchronizing and feeding the current to the main grid.
Significant power losses could occur during the process.
The project uses sunlight as an alternative energy, which improves sustainability. Re-using
the equipment and devices for future projects and proper equipment disposal also help achieve
sustainability. Over time, the power systems protection scheme may experience significant
challenge because the equipment degrades. Hence, IEEE and/or NEC safety standards require
regular and consistent maintenance.
8. Ethical
The project provides Cal Poly students a platform to develop their power systems knowledge.
Thus, it serves the last IEEE Code of Ethics because it helps students “in their professional
development” [14].
The system actively promotes utilitarianism, the greatest good for the greatest number via re-
using solar panels, protection relays, and other electrical equipment [15]. It reduces the improper
equipment disposal and help achieve a sustainable future. It also promotes beneficence, because
it provides reliable and safe electric power. If the project documentation and strategies contribute
to the potential power systems protection laboratory coursework, it also benefits future Cal Poly
students.

53
To meet the non-maleficence framework, a cost-benefit analysis may be conducted because
the design involves dangerous elements like high current and voltage above 120V. However, it
becomes crucial when doing the cost-benefit analysis involving human lives, because the Ford
Pinto tragedies should not get repeated [16]. The Ford Motor Company chose not to upgrade the
Pinto’s fuel system design, which caused 180 deaths. All engineers should identify any immoral
practices related to safety issues and enhance their ethical sensibilities. Reinforcing the IEEE
Code of Ethics should provide a guideline and safety boundaries. This design contains safety
features like overcurrent protection and overvoltage protection via circuit breakers and protection
relays.
9. Health and Safety
One safety concern involves the implementation stage, because it deals with voltage above
120V and high current. Students should always take proper electrical safety precautions when
implementing the design. They must follow Cal Poly’s laboratory safety guidelines and must
have one other person in the lab.
Modern PV panels are mostly silicon-based, and they have been concluded to pose very little
to no risk of toxicity to public health and safety [17]. However, some minor PV cells contain
lead, which is very toxic and especially harmful to children. Some older PV panels still have
solder that contains lead, but more modern PV panel manufacturers have changed to use lead-
free solder.

54
10. Social and Political
In 2005, the Energy Policy Act established IEEE 1547 as the national standard for the
interconnection of distributed resources in the United States. The latest standard updated allowed
inverter manufacturers to provide certain capabilities like the anti-islanding feature.
Interconnection requirements traditionally required the inverter to shut down during power
outages for safety purposes [18]. However, the loss of solar generation greatly increased as more
solar panels got installed. The costs became massive especially when the 2016 wildfire in
Southern California prevented 1,200MW solar generation. The project implements solar inverter
with anti-islanding feature, which can potentially impact the Cal Poly community during power
outages. PG&E and its employees, Cal Poly, and Schweitzer Engineering Laboratories hold
direct stakes because they receive financial benefits directly. Electrical manufacturers which
donated the equipment and devices receive tax deductions. Cal Poly electrical engineering
students also benefit directly, because the knowledge they gain can increase their future income
and career. The San Luis Obispo community also indirectly benefit from solar generation
because it creates clean, renewable energy and has positive impacts on the environment.
The project primarily provides electrical engineering students a platform to apply power
systems protection theory and fundamentals. Such a small scale has little real benefit or profit
except educational benefits. Students do not actually get paid during the process. Inequities may
occur here. However, it is then paid off in their future careers.
11. Development
Through the literature search performed, basic comprehension of modelling electrical
systems and fault detection were gained. Although most IEEE journals and conference papers

55
did not provide solutions to implement DC-to-AC three-phase inverters, the resources help
reduce harmonic distortion and power losses and improve power quality [19].