GreeSE Papers - London School of Economics
26
GreeSE Papers Hellenic Observatory Discussion Papers on Greece and Southeast Europe Paper No. 129 October 2018 Who saved Greek youth? Parental support to young adults during the great recession Rebekka Christopoulou, Maria Pantalidou
-
Upload
khangminh22 -
Category
Documents
-
view
4 -
download
0
Transcript of GreeSE Papers - London School of Economics

GreeSE Papers
Hellenic Observatory Discussion Paperson Greece and Southeast Europe
Paper No. 129
October 2018
Who saved Greek youth?Parental support to young adults during the great recession
Rebekka Christopoulou, Maria Pantalidou
All views expressed in this paper are those of the authors and do not necessarily represent the views of the Hellenic Observatory or the LSE © Rebekka Christopoulou and Maria Pantalidou
Who saved Greek youth?
Parental support to young adults during the great recession
Rebekka Christopoulou and Maria Pantalidou
GreeSE Paper No.129
Hellenic Observatory Papers on Greece and Southeast Europe
i
Contents
Abstract____________________________________________________________ ii 1. Introduction______________________________________________________ 1 2. Empirical Strategy _________________________________________________3 2.1 Data__________________________________________________________3 2.2. Methods______________________________________________________6 3. Results _________________________________________________________ 11
3.1 Conditional correlations of intergenerational dependency and youth unemployment ___________________________________________________7 3.2. Changes in the dependency-unemployment correlations after the beginning of the crisis______________________________________________________12
4. Conclusion_______________________________________________________15

ii
Who saved Greek youth?
Parental support to young adults during the great recession
Rebekka Christopoulou* and Maria Pantalidou†
ABSTRACT
We use data from the Greek Labour Force Survey to calculate, by region and year, the share of youths who coreside with their parents as a proxy of mutual dependence between parents and adult children, and the share of youths who coreside with their parents and also receive cash transfers as a proxy of one-way dependence of youths on parents. Using panel data analysis, we examine the correlation of each variable with the youth unemployment rate. We find that familial interdependence was strong before the crisis and intensified further during the crisis while at the same time it was transformed from two- to one-directional. Parents stepped in to shelter unemployed and vulnerable youths, mostly young men, and did so by providing housing rather than cash.
Keywords:
Living arrangements, parental coresidence, intergenerational cash transfers, youth unemployment, great recession, Greece
* University of Macedonia, Thessaloniki, Greece, [email protected] † Athens University of Economics and Business, Athens, Greece, [email protected]
1
1. Introduction
The Greek ‘great recession’ has been widely documented as the most severe and prolonged recession in the advanced world during peacetime. Over 2009-2015 the Greek economy lost all growth since its eurozone entry, with GDP per capita contracting to levels not seen since 1999 and unemployment rates climaxing at 27%. Not surprisingly, youths were among those affected particularly hard. Youth unemployment peaked at shocking rates in 2013; exceeding 58% among 15-24 year-olds, 43% among 25-29 year-olds, and 30% among 30-34 year-olds (Eurostat LFS-series).
This disproportionate deterioration in labor market outcomes and the consequent economic distress put youths at an increased risk of depression and suicide (Drydakis 2015, Economou 2013 & 2016) while, among those who kept their sanity, many fled the country to look for work elsewhere, with the trend including mostly the high-skilled (see, for example, Ifanti et al. 2014 for the brain drain of young Greek doctors). The majority did remain, however, and somehow managed to pull through even though there were hardly any public safety nets on which they could rely (Matsaganis 2013 & 2015). In this paper we study the only safety net that has been consistently available to struggling youths both before and during the recent crisis: that of the Greek family. Our main research question is whether Greek families have increased their support to their young members during the crisis and, if so, to what degree and in what form. In investigating this question, we also provide evidence on the demographic, economic, and cultural factors that instigate intergenerational dependency.
The transition to adulthood for young Greeks has traditionally been slow and supported to a great extent by the family. Researchers have shown that Greece fits well into the standard South-North divide of European families according to which youths in Southern Europe continue to coreside with their parents well beyond their adulthood, even at periods of rather favorable economic and labor market conditions, whereas those in Northern Europe leave their parental home much earlier (e.g. see Iacovou 2002 for evidence from the mid-90s). While families in Southern Europe also give young adults cash transfers, the predominant form of support they provide is in terms of housing, in contrast to Northern Europe where the data show the opposite pattern (Albertini et al. 2007 study cross-country differences in 2004; Isengard et al. 2017 do the same for 2015). This latter distinction, however, is relatively muted in the case of Greece. In comparison to Italy and Spain, for example, the difference in prevalence of coresidence and intergenerational transfers in Greece is small. Thus, the Greek family can be seen as a special case of the South-European paradigm, supporting vulnerable youths by providing cash or shelter or both, as needed.
Focusing on living arrangements, Giuliano (2007) argued for and empirically substantiated a cultural interpretation for the observed cross-country patterns, whereby familial coresidence depends on social norms about family structure. Strong and close-knit family ties in South European countries yield higher intergenerational coresidence rates, whereas the emphasis on individualism and independence in countries of Northern Europe yields lower coresidence rates. Although this interpretation is broadly convincing, economic factors are also at play. A large empirical literature has demonstrated that young adults decide whether or not to leave their

2
parental home based on rental prices (Börsch-Supan 1986, Haurin et al. 1993, Ermisch & DiSalvo 1997, Ermisch 1999, Rogers & Winkler 2014), their own labor outcomes and incomes as well as those of their parents (McElroy 1985, Becker et al. 2010, Manacorda & Moretti 2006, Chiuri & Del Boca 2010, Dettling & Hsu 2014, Engelhardt et al. 2016), and general economic cycles or labor market conditions (Card & Lemiux 2000, Lee & Painter 2013, Bitler & Hoynes 2015, Matsudaira 2016, Wiemers 2017). Economic factors are also highly responsible for the determination of intrafamily financial transfers. Young adults are more likely to receive cash from their parents when their parents’ income is high, their own income is low, or when they face borrowing constraints (Cox 1990, Cox and Jappelli 1990, Rosenzweig and Wolpin 1994, McGarry and Schoeni 1995, Altonji et al. 1997, Schoeni 1997, Zilcha 2003, McGarry 2016) – though some findings suggest that, all else equal, parents may give more generous transfers when their children’s incomes are higher in exchange for receiving reciprocal support from them at old age or when in need (Cox 1987, Cox and Rank 1992).
What our paper adds to this large literature is the unique perspective of the Greek experience. Given that Greek families have a long tradition of supporting young adult members, the tremendous variation in economic conditions before and during the great recession allows us to reassess the influence of economic factors relative to that of culture on intergenerational dependency. Specifically, we draw data from the Labor Force Survey (LFS) to create a panel of the 13 Greek regions and 15 years (from 2002, when the country entered the eurozone, until the end of the great recession in 2016) and we use this panel to test (i) the long-run relationship of the youth unemployment rate with the share of youths who live with their parents (which measures familial interdependence); (ii) the long-run relationship of the youth unemployment rate with the share of youths who live with their parents and receive intrahousehold monetary transfers (which measures youth dependence on parents); and (iii) whether there is a structural break in these two relationships related to the crisis. This exercise serves as a close counterpart to a different study, where we focus specifically on living arrangements and test for structural breaks at a more disaggregated level of analysis, i.e. by using pooled cross-sections of the individual-level LFS data (Christopoulou and Pantalidou 2017).
Apart from our own work, there is no other Greek-specific study that has comprehensively examined the role of the family as a fallback mechanism for young adults and its dynamic evolution. The only relevant paper by Karagiannaki (2011) provides an informative outlook on the living arrangements of individuals ages 65 and older before Greece’s entry to the eurozone but, in comparison to our research, its focus is rather narrow as it analyzes only coresidence outcomes and only for those youths who live with elderly parents. Among the cross-country studies that include Greece, none tests for the cyclicality of familial support by exploiting temporal variation (e.g. Albertini et al. 2007 and Isengard et al. 2017 rely on cross-country variation at a certain point it time). Finally, among other country-specific studies that do test for cyclicality effects, none finds a statistically significant change of intergenerational dependency during a recession period. Our study is also distinct in this regard.
Indeed, our analysis shows that a two-way intergenerational dependency has characterized the Greek families before the crisis; that is, the generation that had the

3
means supported the generation in need. This dependency, however, has strengthened further during the crisis and has turned asymmetrical, with young people becoming mostly recipients rather than providers of support. Thus, despite the pre-existing cultural component behind the family safety net, when labor market conditions became critically adverse, families responded cyclically, taking extra action to shield their young members from the impact of the crisis. Notably, families responded by providing housing only (instead of both housing and monetary transfers), which was most likely by necessity not by choice, as the generalized economic hardship also affected older adults. Another interesting result is that the crisis induced families to protect young men more than young women, a result which further illustrates the role of cultural norms. Unlike men, stereotypical young women coreside with their parents and receive their financial support irrespective of the crisis; i.e. even when there are employment opportunities in the labor market that would enable them to live independently.
The paper is structured as follows: section 2 gives a description of the data, presents descriptive statistics, and discusses the method of estimation; section 3 presents our results; and section 4 provides concluding remarks.
2. Empirical Strategy
2.1 Data
As we mentioned already, we derive the data with which we conduct our analysis from the Greek Labor Force Survey. The LFS is conducted quarterly every year by the Hellenic Statistical Authority on a random representative sample of individuals and covers detailed information on a variety of demographic characteristics and financial outcomes, including household composition, employment status, and sources of non-labor income. Taking the second quarter of the LFS as representative for each year, we use the mother ID, father ID, and spouse ID variables to identify those youths (ages 18-35) who coreside with their parents or parents-in-law. We also use self-reports of income sources to identify those youths who receive cash transfers from other household members3. With these data we calculate the share of youths who coreside and the share of youths who coreside and receive transfers4 for each of the 13 Greek regions in each year over 2002-2016. Likewise, for each region and year, we calculate the youth unemployment rate using self-reports of employment status.
3 This variable refers to income from other household members and not specifically from parents, because the LFS data do not allow us to identify who exactly is the donor of the cash transfer. This is somewhat problematic for our analysis, as we cannot tell apart married youths who live with their parents but share financial resources with their spouses from married youths who rely on their parents for both cash and shelter. 4 The LFS data does not allow us to identify youths who receive cash transfers from their parents when they live independently.
4
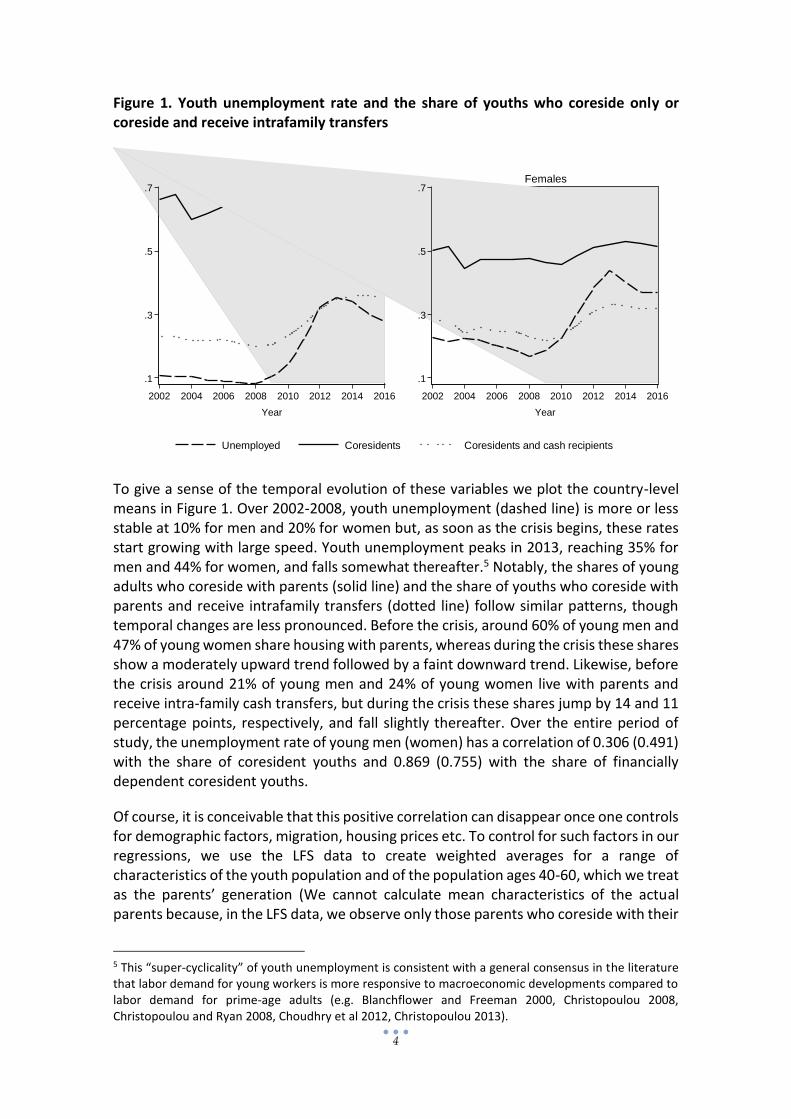
Figure 1. Youth unemployment rate and the share of youths who coreside only or coreside and receive intrafamily transfers
To give a sense of the temporal evolution of these variables we plot the country-level means in Figure 1. Over 2002-2008, youth unemployment (dashed line) is more or less stable at 10% for men and 20% for women but, as soon as the crisis begins, these rates start growing with large speed. Youth unemployment peaks in 2013, reaching 35% for men and 44% for women, and falls somewhat thereafter.5 Notably, the shares of young adults who coreside with parents (solid line) and the share of youths who coreside with parents and receive intrafamily transfers (dotted line) follow similar patterns, though temporal changes are less pronounced. Before the crisis, around 60% of young men and 47% of young women share housing with parents, whereas during the crisis these shares show a moderately upward trend followed by a faint downward trend. Likewise, before the crisis around 21% of young men and 24% of young women live with parents and receive intra-family cash transfers, but during the crisis these shares jump by 14 and 11 percentage points, respectively, and fall slightly thereafter. Over the entire period of study, the unemployment rate of young men (women) has a correlation of 0.306 (0.491) with the share of coresident youths and 0.869 (0.755) with the share of financially dependent coresident youths.
Of course, it is conceivable that this positive correlation can disappear once one controls for demographic factors, migration, housing prices etc. To control for such factors in our regressions, we use the LFS data to create weighted averages for a range of characteristics of the youth population and of the population ages 40-60, which we treat as the parents’ generation (We cannot calculate mean characteristics of the actual parents because, in the LFS data, we observe only those parents who coreside with their
5 This “super-cyclicality” of youth unemployment is consistent with a general consensus in the literature that labor demand for young workers is more responsive to macroeconomic developments compared to labor demand for prime-age adults (e.g. Blanchflower and Freeman 2000, Christopoulou 2008, Christopoulou and Ryan 2008, Choudhry et al 2012, Christopoulou 2013).
.1
.3
.5
.7
2002 2004 2006 2008 2010 2012 2014 2016
Year
Males
.1
.3
.5
.7
2002 2004 2006 2008 2010 2012 2014 2016
Year
Females
Unemployed Coresidents Coresidents and cash recipients

5
children and not those whose children have left the household.6) We complement these data with regional indicators from other sources, namely the growth rate of real GDP, net migration per capita, and two rental price indexes measuring the minimum and maximum rental cost in each region; i.e. the cost in the upmarket and down-market neighborhoods, respectively. We draw data on GDP growth and net migration from the Eurostat, whereas the rental price indexes are our own calculations as there are no available indicators of housing or rental cost at the regional level for Greece. Several drawbacks of the regional indicators, including the fact that none is available for the entire period of interest, render them imperfect for the purpose of our study. We provide further details and plot the data in Christopoulou and Pantalidou (2017).
Table 1. Weighted means and frequencies of selected variables
Males Females
2005 2009 2013 2005 2009 2013
Unemployed (rate) 0.09 0.10 0.35 0.22 0.19 0.44
Coresidents 0.62 0.60 0.65 0.47 0.47 0.52
Coresidents and cash recipients 0.22 0.21 0.35 0.26 0.22 0.33
Age 27.2 27.3 27.5 27.1 27.4 27.3
Married 0.25 0.21 0.18 0.43 0.40 0.35
Have child(ren) 0.16 0.14 0.13 0.33 0.33 0.28
Divorced/widowed 0.00 0.00 0.01 0.02 0.02 0.02
Housewifes 0.16 0.15 0.10
Students 0.18 0.20 0.20 0.19 0.21 0.23
Completed education (years) 11.7 11.9 12.4 12.3 12.6 13.1
Residents in city 0.42 0.42 0.40 0.44 0.44 0.42
Residents in rural area 0.18 0.17 0.19 0.15 0.14 0.16
Income earners from assets 0.02 0.01 0.03 0.03 0.02 0.02
Income earners from benefits 0.01 0.01 0.02 0.02 0.03 0.03
Disabled 0.01 0.01 0.01 0.01 0.01 0.01
6 A drawback of this approach is that we match youths who have moved out from their home region to the parents’ generation in the region of their current residence.

6
In Table 1, we present summary statistics of the demographic trends for the young population in selected years. Specifically, we report statistics for 2009, the year that marked the beginning of the crisis, and for 2005 and 2013, which correspond to four years before and after 2009. The statistics show that the crisis has not only coincided with an increase in the interdependence of youths and parents regarding housing and income, but also with changes in marital outcomes, fertility, educational attainment, and place of residence. Specifically, after 2009 young women appear to abstain from their traditional role as home-makers: the downward trend in the share of women who are married accelerates, and the share of young women who have children or self-report as housewives drops. While no changes in marital outcomes are apparent for young men, both men and women increased their duration of studies and moved from the cities to rural areas after the crisis started.
2.2. Methods
The first step of our empirical analysis is to test whether the correlation of the youth unemployment rate and intergenerational dependency survives when we condition both on the observable control factors we mentioned above and on region-specific and year-specific unobservables. To do this, we estimate two-way fixed-effects panel-data models of the following form:
rttrrt XUY rt11rt (1)
where rtY is a measure of intergenerational dependency (either the share of coresident
youths or the share of youths who coreside and receive some income from other household members) in region r and year t; U is the youth unemployment rate; X is a vector that includes all other explanatory variables, i.e. the macro-level indicators and the characteristics and outcomes of youths and prime-age adults ages 40-60 (the
population we treat as the parents’ generation); r represents the unobserved time-
invariant region-effect, t is the region-specific year-effect, and rth is the error term. In
every case, we estimate (1) for men and women separately.
Our second step is to test whether the relationship between Y and U changes after the beginning of the crisis. To do this, we modify (1) in two equivalent ways:
rttrrtrt XCrisisUCrisisUY rt222rt *)1(* (2)
rttrrtrt XCrisisUUY rt333rt * (3)
where 1 is an all-ones vector and Crisis is a dummy variable that takes values zero in all years before 2009 and one in all other years (i.e. during the crisis). These two equations
give the same information in slightly different forms. The coefficients 2 and 3 are equal and reflect the correlation of Y and U before the crisis; γ2 gives the correlation of Y and

7
U during the crisis; and γ3 is the difference between 2 and γ2. All other coefficient estimates of the two equations are equal. Essentially, equation (2) tests the statistical significance of the correlation between Y and U separately in the pre-crisis and crisis periods, whereas equation (3) is an easy way to test the statistical significance of the difference in the correlation between Y and U between the two periods.
3. Results
3.1. Conditional correlations of intergenerational dependency and youth unemployment
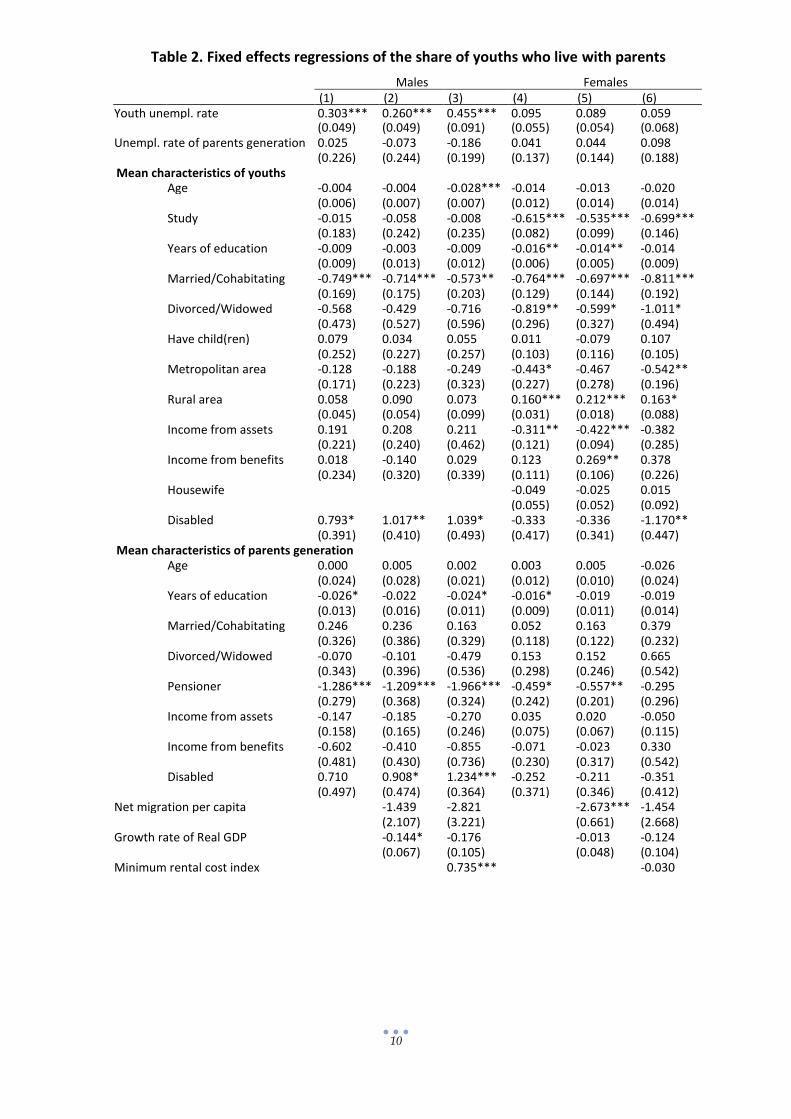
We start with the estimation of equation (1) using the percentage of youths who share a home with their parents as the dependent variable. Table 2 reports the results from three alternative specifications estimated separately for men (columns 1-3) and women (columns 4-6). For each gender, the first specification includes only those control variables that we construct from the LFS data and, thus, the estimation sample covers the entire period of interest from 2002 to 2016. The second specification adds to the set of regressors the net migration per capita and the real GDP growth indicators, both of which are unavailable for 2016, and therefore the sample size decreases from 195 to 182. Finally, the third specification includes the two rental cost indexes as additional control variables. These indexes are missing in all years before 2007, which causes the sample size to decrease further to 117 observations and to be dominated by the period of the crisis. Despite this loss of observations, the third specification is our preferred one because it is the most conservative and maintains maximum precision.
Encouragingly, we find that the conditional correlation between youth coresidence and unemployment rate is robust irrespective of the specification we estimate. While for young men the correlation is always positive and statistically significant, for young women it is statistically indistinguishable from zero, and gender differences are always significant. The estimated coefficient in the preferred specification for young men implies that, for every increase in the youth unemployment rate by 1 percentage point, the share of coresident youths increases by an average of 0.445 percentage points.
For all other explanatory variables, the results show slight differences across specifications, but virtually all statistically significant coefficients are plausible. Focusing on the preferred specification we find that, for men, coresidence decreases with the mean age of the youth population; the share of youths who are married; and the share of pensioners and the mean years of education in the parents’ generation. In contrast, coresidence among young men increases with the share of disabled both in the youth population and in the parent’s generation, and with the rental cost in the down-market neighborhoods. For women, coresidence decreases with the share of youths who live in urban areas and the share of youths who are married, divorced, or enrolled in education, and increases with the share of youths who live in rural areas and with the rental cost in the up-market neighborhoods. A somewhat puzzling result, which goes contrary to what we find for men, is that disability and coresidence rates for women are negatively

8
associated; i.e. in years and regions where the share of disabled young women is higher the share of young women who live with their parents is lower.
The differences in the results between men and women point to factors that may influence intergenerational coresidence which we have not effectively addressed. To start with, coresidence may be unresponsive to youth unemployment because it is simply determined by cultural norms, which may well be gender-specific. The result that coresidence among young women is lower in years and regions with more young rural residents or less young urban residents is consistent with this explanation. Rural societies are typically more traditional and young women who live in such societies are under stricter parental supervision and may not be allowed to live independently.7 Also consistent with this explanation is the result that coresidence among young males decreases with the rental cost in the down-market neighborhoods, whereas coresidence among young women decreases with the cost in the up-scale neighborhoods. Assuming that the cheaper neighborhoods are relatively unsafe, young women who adhere to cultural gender stereotypes will arguably avoid living there.
Moreover, coresidence may be driven by the dependency of parents on their children rather than the reverse – a fact that could also be culture-related and gender-specific. In the regressions of Table 2 we have tried to address reverse causality by controlling for the unemployment rate of the parents’ generation, which is statistically insignificant in all cases, and a range of other characteristics of that generation. It is reasonable, however, that the mismatch between the actual parents and the parents’ generation imposed by the data limitations render these controls inadequate. Limiting the estimation sample to those young people who live with their parents and receive intrafamily cash transfers is one way to circumvent this problem. These youths are plausibly the (net) beneficiaries rather than the (net) benefactors of the coresidence arrangement and, therefore, their population share can be treated as a measure of youth dependency on their parents, as opposed to the share of coresident youths which captures both directions of intergenerational dependency.
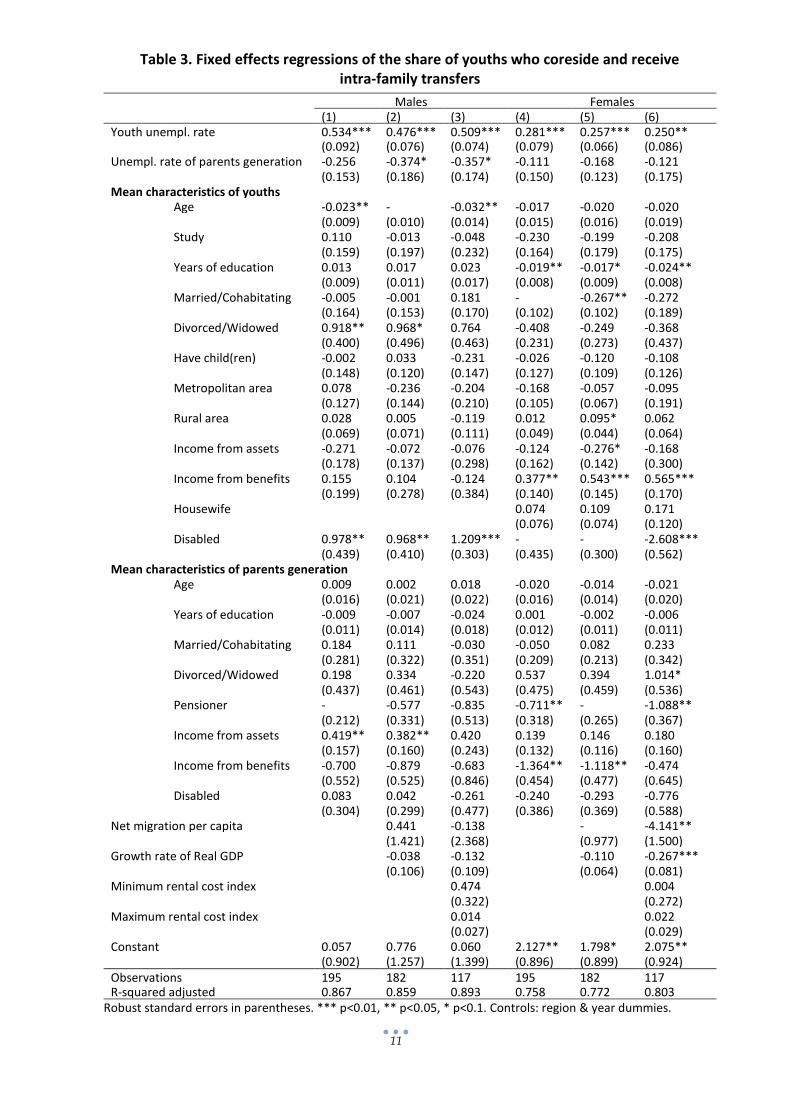
We present the corresponding estimation results in Table 3. That is, we estimate equation (1) using the percentage of youths who share a home with their parents and receive intrafamily transfers as the dependent variable, and report the same specifications as in Table 2 and in the same order. Again, the conditional correlations of interest are robust across specifications but, this time, they are positive and statistically significant for both men and women, though magnitudes differ significantly between genders. The preferred specification suggests that, for every increase in the unemployment rate of young men by 1 percentage point, the share of young men who depend on parents for both housing and income increases by an average of 0.509
7 It is also common to interpret the region-specific fixed-effects as reflecting cultural differences, because culture is presumed to change slowly over time. However, in our results this reasoning proves too simplistic. In Tables A1 and A2 in the Appendix we report estimates of the region-specific effects that correspond to the regressions of Tables 2 and 3, respectively. The results are mixed for both men and women, and it is not straightforward to link either the regional differences for each gender or the resulting gender differences within region to corresponding differences in cultural norms (e.g. there is not clear divide in the results between touristic and non-touristic regions or between regions with large cities, like Athens and Thessaloniki, and regions with smaller towns.)
9
percentage points, whereas the corresponding increase for young women is only 0.250 percentage points.
The results of Table 3 allow us to gain insight into the influence of both reverse causality and unobserved cultural factors on the relationship of interest. First, the fact that, for young men, the estimated conditional correlations between youth dependency and unemployment are of similar magnitude with those reported in Table 2 suggests that reverse causality is not an important issue. In contrast, for women, the correlation is statistically insignificant in Table 2 and significantly positive in Table 3 which suggests that reverse causality plays a role. Excluding from the estimation sample those young women who may coreside with parents to provide rather than receive support causes the conditional correlation to increase. It follows that, for the excluded sample, the unemployment-coresidence relationship is negative; i.e. young women are more likely to coreside with dependent parents when youth labour market conditions are favorable and vice versa. This makes good sense considering that, when labour market conditions are favourable, young women can find work and earn income with which they can support parents in need.
Second, our finding that reverse causality is relevant only in the case of women illuminates the role of culture in intergenerational dependency. It suggests that it is mostly women, not men, who act as carers for vulnerable parents – a gender-role that is consistent with the paradigm of South European familism, according to which “most of the caring needs of individuals—children, infirm older and disabled persons, but also healthy adult men—are defined as best served by the caring of wives, mothers, and/or daughters” (Saraceno 1994, p. 60), but it is also prevalent in countries outside Southern Europe (see, for example, Mellor 2001 for evidence from the US). Even after we address reverse causality, gender differences in the conditional correlations persist, suggesting that young women’s dependency on parents is less responsive to labor market conditions than that of young men. Considering our lack of suitable controls for cultural norms, this result is also consistent with a cultural interpretation: young women may live with and off their parents irrespective of the available employment opportunities simply because they are culturally bound to do so. Notably, in Christopoulou and Pantalidou (2017) – our closely related paper, where we focus on coresidence and control for reverse causality and cultural influences more formally – we reach similar conclusions.
10
Table 2. Fixed effects regressions of the share of youths who live with parents Males Females
(1) (2) (3) (4) (5) (6) Youth unempl. rate 0.303*** 0.260*** 0.455*** 0.095 0.089 0.059 (0.049) (0.049) (0.091) (0.055) (0.054) (0.068) Unempl. rate of parents generation 0.025 -0.073 -0.186 0.041 0.044 0.098 (0.226) (0.244) (0.199) (0.137) (0.144) (0.188) Mean characteristics of youths Age -0.004 -0.004 -0.028*** -0.014 -0.013 -0.020 (0.006) (0.007) (0.007) (0.012) (0.014) (0.014) Study -0.015 -0.058 -0.008 -0.615*** -0.535*** -0.699*** (0.183) (0.242) (0.235) (0.082) (0.099) (0.146) Years of education -0.009 -0.003 -0.009 -0.016** -0.014** -0.014 (0.009) (0.013) (0.012) (0.006) (0.005) (0.009) Married/Cohabitating -0.749*** -0.714*** -0.573** -0.764*** -0.697*** -0.811*** (0.169) (0.175) (0.203) (0.129) (0.144) (0.192) Divorced/Widowed -0.568 -0.429 -0.716 -0.819** -0.599* -1.011* (0.473) (0.527) (0.596) (0.296) (0.327) (0.494) Have child(ren) 0.079 0.034 0.055 0.011 -0.079 0.107 (0.252) (0.227) (0.257) (0.103) (0.116) (0.105) Metropolitan area -0.128 -0.188 -0.249 -0.443* -0.467 -0.542** (0.171) (0.223) (0.323) (0.227) (0.278) (0.196) Rural area 0.058 0.090 0.073 0.160*** 0.212*** 0.163* (0.045) (0.054) (0.099) (0.031) (0.018) (0.088) Income from assets 0.191 0.208 0.211 -0.311** -0.422*** -0.382 (0.221) (0.240) (0.462) (0.121) (0.094) (0.285) Income from benefits 0.018 -0.140 0.029 0.123 0.269** 0.378 (0.234) (0.320) (0.339) (0.111) (0.106) (0.226) Housewife -0.049 -0.025 0.015 (0.055) (0.052) (0.092) Disabled 0.793* 1.017** 1.039* -0.333 -0.336 -1.170** (0.391) (0.410) (0.493) (0.417) (0.341) (0.447) Mean characteristics of parents generation Age 0.000 0.005 0.002 0.003 0.005 -0.026 (0.024) (0.028) (0.021) (0.012) (0.010) (0.024) Years of education -0.026* -0.022 -0.024* -0.016* -0.019 -0.019 (0.013) (0.016) (0.011) (0.009) (0.011) (0.014) Married/Cohabitating 0.246 0.236 0.163 0.052 0.163 0.379 (0.326) (0.386) (0.329) (0.118) (0.122) (0.232) Divorced/Widowed -0.070 -0.101 -0.479 0.153 0.152 0.665 (0.343) (0.396) (0.536) (0.298) (0.246) (0.542) Pensioner -1.286*** -1.209*** -1.966*** -0.459* -0.557** -0.295 (0.279) (0.368) (0.324) (0.242) (0.201) (0.296) Income from assets -0.147 -0.185 -0.270 0.035 0.020 -0.050 (0.158) (0.165) (0.246) (0.075) (0.067) (0.115) Income from benefits -0.602 -0.410 -0.855 -0.071 -0.023 0.330 (0.481) (0.430) (0.736) (0.230) (0.317) (0.542) Disabled 0.710 0.908* 1.234*** -0.252 -0.211 -0.351 (0.497) (0.474) (0.364) (0.371) (0.346) (0.412) Net migration per capita -1.439 -2.821 -2.673*** -1.454 (2.107) (3.221) (0.661) (2.668) Growth rate of Real GDP -0.144* -0.176 -0.013 -0.124 (0.067) (0.105) (0.048) (0.104) Minimum rental cost index 0.735*** -0.030
11
transfers
Table 3. Fixed effects regressions of the share of youths who coreside and receive
intra-family transfers
Males Females (1) (2) (3) (4) (5) (6)
Youth unempl. rate 0.534*** 0.476*** 0.509*** 0.281*** 0.257*** 0.250** (0.092) (0.076) (0.074) (0.079) (0.066) (0.086) Unempl. rate of parents generation -0.256 -0.374* -0.357* -0.111 -0.168 -0.121 (0.153) (0.186) (0.174) (0.150) (0.123) (0.175) Mean characteristics of youths Age -0.023** -
0.034*** -0.032** -0.017 -0.020 -0.020
(0.009) (0.010) (0.014) (0.015) (0.016) (0.019) Study 0.110 -0.013 -0.048 -0.230 -0.199 -0.208 (0.159) (0.197) (0.232) (0.164) (0.179) (0.175) Years of education 0.013 0.017 0.023 -0.019** -0.017* -0.024** (0.009) (0.011) (0.017) (0.008) (0.009) (0.008) Married/Cohabitating -0.005 -0.001 0.181 -
0.339*** -0.267** -0.272
(0.164) (0.153) (0.170) (0.102) (0.102) (0.189) Divorced/Widowed 0.918** 0.968* 0.764 -0.408 -0.249 -0.368 (0.400) (0.496) (0.463) (0.231) (0.273) (0.437) Have child(ren) -0.002 0.033 -0.231 -0.026 -0.120 -0.108 (0.148) (0.120) (0.147) (0.127) (0.109) (0.126) Metropolitan area 0.078 -0.236 -0.204 -0.168 -0.057 -0.095 (0.127) (0.144) (0.210) (0.105) (0.067) (0.191) Rural area 0.028 0.005 -0.119 0.012 0.095* 0.062 (0.069) (0.071) (0.111) (0.049) (0.044) (0.064) Income from assets -0.271 -0.072 -0.076 -0.124 -0.276* -0.168 (0.178) (0.137) (0.298) (0.162) (0.142) (0.300) Income from benefits 0.155 0.104 -0.124 0.377** 0.543*** 0.565*** (0.199) (0.278) (0.384) (0.140) (0.145) (0.170) Housewife 0.074 0.109 0.171 (0.076) (0.074) (0.120) Disabled 0.978** 0.968** 1.209*** -
1.361*** -1.598***
-2.608*** (0.439) (0.410) (0.303) (0.435) (0.300) (0.562) Mean characteristics of parents generation Age 0.009 0.002 0.018 -0.020 -0.014 -0.021 (0.016) (0.021) (0.022) (0.016) (0.014) (0.020) Years of education -0.009 -0.007 -0.024 0.001 -0.002 -0.006 (0.011) (0.014) (0.018) (0.012) (0.011) (0.011) Married/Cohabitating 0.184 0.111 -0.030 -0.050 0.082 0.233 (0.281) (0.322) (0.351) (0.209) (0.213) (0.342) Divorced/Widowed 0.198 0.334 -0.220 0.537 0.394 1.014* (0.437) (0.461) (0.543) (0.475) (0.459) (0.536) Pensioner -
0.905*** -0.577 -0.835 -0.711** -
0.984*** -1.088**
(0.212) (0.331) (0.513) (0.318) (0.265) (0.367) Income from assets 0.419** 0.382** 0.420 0.139 0.146 0.180 (0.157) (0.160) (0.243) (0.132) (0.116) (0.160) Income from benefits -0.700 -0.879 -0.683 -1.364** -1.118** -0.474 (0.552) (0.525) (0.846) (0.454) (0.477) (0.645) Disabled 0.083 0.042 -0.261 -0.240 -0.293 -0.776 (0.304) (0.299) (0.477) (0.386) (0.369) (0.588) Net migration per capita 0.441 -0.138 -
3.128*** -4.141**
(1.421) (2.368) (0.977) (1.500) Growth rate of Real GDP -0.038 -0.132 -0.110 -0.267*** (0.106) (0.109) (0.064) (0.081) Minimum rental cost index 0.474 0.004 (0.322) (0.272) Maximum rental cost index 0.014 0.022 (0.027) (0.029) Constant 0.057 0.776 0.060 2.127** 1.798* 2.075** (0.902) (1.257) (1.399) (0.896) (0.899) (0.924) Observations 195 182 117 195 182 117 R-squared adjusted 0.867 0.859 0.893 0.758 0.772 0.803
Robust standard errors in parentheses. *** p<0.01, ** p<0.05, * p<0.1. Controls: region & year dummies.

12
Few of the remaining explanatory variables in Table 3 are statistically significant,
especially when one looks at the preferred specification. Interestingly, the share of
young men who depend on parents for both housing and income has a significant
association with the unemployment rate in the parents’ generation and in the expected
direction. The more adverse the labour market conditions for the parents’ generation
the lower the share of dependent young men. Dependency of young men also decreases
with the average age in the youth population and increases with the share of disabled
youths.
Contrary to men, whether young women rely on parents for housing and income is
unrelated to the unemployment rate in the parents’ generation. The share of dependent
young women increases with the share of young women who receive income from
benefits and with the share of divorced or widowed individuals in the parents’
generation, and it decreases with youth educational attainment, the share of pensioners
in the parent’s generation, net migration per capita, and the growth rate of real GDP.
The odd result that dependency among young women decreases as the share of disabled
young women increases, which we observed in Table 2, is also present here. We are
inclined to interpret this result as a spurious correlation caused by a confounding
variable that is not immediately evident, searching for which is beyond the scope of this
analysis.
3.2 Changes in the dependency-unemployment correlations after the beginning of the
crisis
We next test whether and to what degree the conditional correlations between
dependency and unemployment change after the beginning of the economic crisis. In
Table 4 we report estimates of equations (2) and (3) using as the dependent variable
both the share of coresident youths (panel A) and the share of financially dependent
coresident youths (panel B). These estimates result from specifications that control for
all available characteristics of youths, all available characteristics of the parent’s
generation, net migration, and GDP growth (i.e. they correspond to the specifications
reported in columns (2) and (5) in Tables 2 and 3). The reason we choose this
specification is because it is the most conservative among those that leave a large
13
enough sample to allow for a viable test (this concerns the pre-crisis sample
particularly). As always, we estimate regressions for young men and women separately.
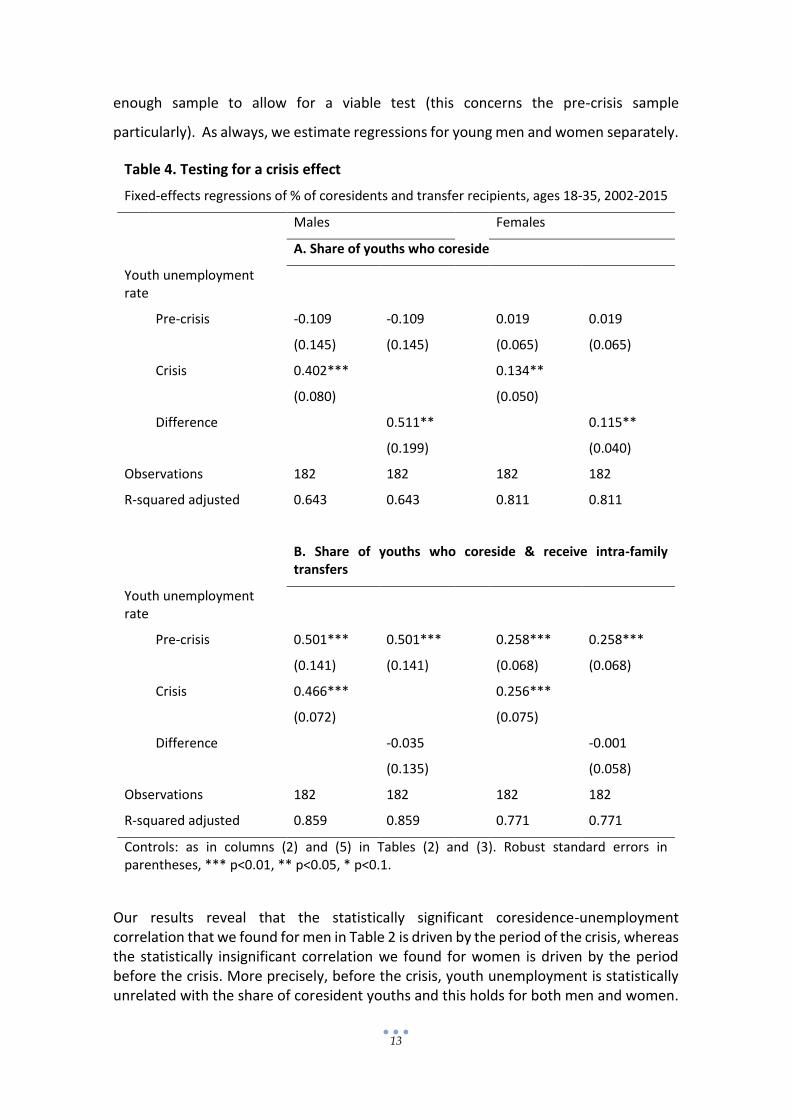
Table 4. Testing for a crisis effect
Fixed-effects regressions of % of coresidents and transfer recipients, ages 18-35, 2002-2015
Males Females
A. Share of youths who coreside
Youth unemployment rate
Pre-crisis -0.109 -0.109 0.019 0.019
(0.145) (0.145) (0.065) (0.065)
Crisis 0.402*** 0.134**
(0.080) (0.050)
Difference 0.511** 0.115**
(0.199) (0.040)
Observations 182 182 182 182
R-squared adjusted 0.643 0.643 0.811 0.811
B. Share of youths who coreside & receive intra-family transfers
Youth unemployment rate
Pre-crisis 0.501*** 0.501*** 0.258*** 0.258***
(0.141) (0.141) (0.068) (0.068)
Crisis 0.466*** 0.256***
(0.072) (0.075)
Difference -0.035 -0.001
(0.135) (0.058)
Observations 182 182 182 182
R-squared adjusted 0.859 0.859 0.771 0.771
Controls: as in columns (2) and (5) in Tables (2) and (3). Robust standard errors in parentheses, *** p<0.01, ** p<0.05, * p<0.1.
Our results reveal that the statistically significant coresidence-unemployment correlation that we found for men in Table 2 is driven by the period of the crisis, whereas the statistically insignificant correlation we found for women is driven by the period before the crisis. More precisely, before the crisis, youth unemployment is statistically unrelated with the share of coresident youths and this holds for both men and women.
14
During the crisis, the correlation becomes statistically significant for both genders – though, once again, it is much higher for men than for women, reminding us the pertinence of culture and reverse causality. The difference in the correlations between periods is also statistically significant for both genders.
The implication is that the crisis has caused the intergenerational dependency in the Greek families to strengthen; i.e. it has led to an increase in the share of youths who coreside with their parents because they cannot afford to live independently. We note that it is possible that there is a small pre-crisis correlation between coresidence and unemployment that is not picked up by the data due to their aggregate nature and the short time-span of the sub-periods. Regardless, the main message remains: the beginning of the crisis coincides with a structural break that leaves more vulnerable young Greeks sharing housing with parents. This finding is to our knowledge unique in the empirical literature and stems from the severity of the Greek recession and the shortage of alternative safety nets for young Greeks. To give an example, Bitler and Hoynes (2015) carried out the same test for structural breaks using data from the United States over 1981-2014; i.e. their sample included both the recessions of the 1980s and the recent ‘great’ recession, but none of their structural-break hypotheses was supported by their results.
Interestingly, our result does not survive when we limit the sample to those young coresidents who receive some income from other family members. The conditional correlations between youth unemployment and the share of youths who live with and off their parents are statistically significant both before and during the crisis, and statistically equal when comparing the two periods. This result has two important implications. First, it implies that the exceptionally adverse labor market conditions for young adults brought about by the crisis caused more Greek families to provide housing for their young adult members, but it did not cause more Greek families to provide both housing and income. The economic hardship induced by the crisis, however, was so generalized that this does not come as a surprise. Adults of all ages saw significant cuts in their wages (Christopoulou and Monastiriotis 2014, 2016) and older individuals saw cuts in pensions and increases in the retirement age (Leventi and Matsagkanis 2016). Financially supporting their young members was, thus, not an option for most Greek families.
The second implication is that reverse causality for young men, which could not be detected before breaking the sample into sub-periods, is evidently present before the crisis. Excluding from the sample of coresident youths those who do not receive cash transfers (i.e. those who potentially coreside in order to support vulnerable parents) causes the pre-crisis correlation to increase for both men and women, whereas during the crisis this happens for women only. Thus, reverse causality is relevant for both genders before the crisis, but during the crisis it disappears completely for men and weakens for women. To put it in simpler terms, the intergenerational dependency before the Greek crisis ran both directions; i.e. better-off youths would support parents in need and better-off parents would support youths in need. However, after the crisis started, the intergenerational dependency for men became one-directional, with youths being on the receiving end of support, whereas, for women, it remained two-directional but also skewed towards youths. This result is clearly symptomatic of the
15
disproportionate economic distress imposed on the younger relative to the older generations during the crisis.
4. Conclusion
This paper was motivated by the observation that, despite the extremely adverse conditions in the youth labor market during the Greek crisis, the youth population endured. We examined whether and to what degree this became possible due to intrafamilial support, given that the Greek family has traditionally operated as the primary safety net available to vulnerable youths. To carry out our analysis, we estimated correlations of youth unemployment with two main variables: the share of young people who coreside with their parents, as a proxy of two-way intergenerational dependence, and the share of young people who coreside with their parents and receive intrafamilial transfers, as a proxy of one-way dependence (of youths on their parents).
Our results showed that the influence of youth unemployment on coresidence is virtually non-existent before the crisis and positive and significant thereafter. In contrast, youth unemployment and the share of financially dependent coresident youths have a positive and significant correlation throughout the period of study and there is no change in this correlation after the beginning of the crisis. In both cases, the correlations are higher for men relative to women and are conditional on a range of characteristics of young people and their parents’ generation and on several other regional indicators that capture developments outside the labor market.
These results have a number of important implications. They confirm that familial interdependence was the norm in Greece well before the crisis, but they also show that the crisis worked to reinforce this interdependence and altered its nature. Before the crisis, financially comfortable youths would support vulnerable parents and financially comfortable parents would support vulnerable youths. During the crisis, youths became mostly beneficiaries and parents became mostly benefactors. In fact, to protect their adult children from the impact of the crisis, parents responded by providing housing and not by providing both housing and income, which is telling of their own financial difficulties. Interestingly, parents “rescued” more young men than women, but this was likely because young women were already safely protected in the parental nest, adhering to their traditional gender-role.

16
References
Albertini, Marco, Martin Kohli and Claudia Vogel (2007) “Intergenerational transfers of
time and money in European families: common patterns – different regimes?” Journal of European Social Policy, 17(4): 319-334.
Altonji, Joseph G., Fumio Hayashi and Laurence Kotlikoff (1997) “Parental Altruism and
Inter Vivos Transfers: Theory and Evidence.” Journal of Political Economy,105(6): 1121-1166.
Becker S. O. et al. (2010) “Youth Emancipation and Perceived Job Insecurity of Parents
and Children.” Journal of Population Economics, 23(3): 1047-1071.
Bilter, Marianne, and Hoynes Hilary (2015) “Living Arrangements, Doubling Up, and the
Great Recession: Was This Time Different?” American Economic Review: Papers & Proceedings, 105(5): 166-170.
Blanchflower, David G. and Richard B. Freeman (2000) “The Declining Economic Status
of Young Workers in OECD Countries.” In: Blanchflower, D., and R. Freeman, (2000): Youth Employment and Joblessness in Advanced Countries, Chicago: University of Chicago Press, 19-59.
Börsch-Supan, Alex (1986) “Household Formation, Housing Prices, and Public Policy
Impacts.” Journal of Public Economics 30: 145-164.
Card, David and Lemieux, Thomas (2000) “Adapting to Circumstances: The Evolution of
Work, School, and Living Arrangements among North American Youth.” In: Blanchflower, D., and R. Freeman, (2000): Youth Employment and Joblessness in
Advanced Countries, Chicago: University of Chicago Press, 171-214.
Chiuri, Maria, and Daniela Del Boca (2010) “Home-leaving decisions of daughters and
sons.” Review of Economics of the Household.” 8(3): 393-408.
Choudhry, Misbah T., Enrico Marelli and Marcello Signorelli (2012) “Youth
unemployment rate and impact of financial crises”, International Journal of Manpower, 33(1): 76-95
Christopoulou, Rebekka (2008) “The youth labor market problem in cross-country
perspective” In: Gregory DeFreitas, Young Workers in the Global Economy: Job Challenges in North America, Europe and Japan. Cheltenham, UK: Edward Elgar, 21-58.
Christopoulou, Rebekka (2013) “Why Have Labor Market Outcomes of Youth in
Advanced Economies Deteriorated?” The B.E. Journal of Economic Analysis & Policy, De Gruyter, 13(1): 203-238.
Christopoulou, Rebekka and Maria Pantalidou (2017) “The parental home as labor
17
market insurance for young Greeks during the crisis.” GreeSE working paper. London School of Economics, Forthcoming.
Christopoulou, Rebekka and Paul Ryan (2008) “Youth Outcomes in the Labor Markets of
Advanced Economies Decline, Deterioration, and Causes” In: Schoon Ingrid and Silbereisen Rainer K. (2008): Transitions from school to work, London: Cambridge University Press, 67-94.
Christopoulou, Rebekka and Vassilis Monastiriotis (2014) “The Greek public sector wage
premium before the crisis: size, selection and relative valuation of characteristics.” British Journal of Industrial Relations, 52(3): 579-602.
Christopoulou, Rebekka and Vassilis Monastiriotis (2016) “Public-private wage duality
during the Greek crisis” Oxford Economic Papers, 68(1): 174-196.
Cox, Donald (1987) “Motives for Private Income Transfers.” Journal of Political Economy,
95(3): 508-46.
Cox, Donald (1990) “Intergenerational Transfers and Liquidity Constraints.” The
Quarterly Journal of Economics, 105(1): 187–217
Cox, Donald and Mark R. Rank (1992), “Inter-vivos Transfers and Intergenerational
Exchange.” The Review of Economics and Statistics, 74(2): 305-14.
Cox, Donald and Tullio Jappelli (1990) “Credit Rationing and Private Transfers: Evidence
from Survey Data.” The Review of Economics and Statistics, 72(3): 445-454
Dettling, Lisa, and Joanne Hsu (2014) “Returning to the Nest: Debt and Parental Co-
Residence among Young Adults.” Federal Reserve Board, working paper 80.
Drydakis, Nick (2015) “The effect of unemployment on self-reported health and mental
health in Greece from 2008 to 2013: A longitudinal study before and during the financial crisis.” Social Science & Medicine, 128: 43-51.
Economou, Marina et al (2016) “Suicidal ideation and suicide attempts in Greece during
the economic crisis: an update”. World Psychiatry, 15(1): 83-84.
Economou, Marina et al. (2013) “Major depression in the Era of economic crisis: A
replication of a cross-sectional study across Greece” Journal of Affective Disorders, 145(3): 308-314
Engelhardt, G. V., Eriksen, M. D. and Greenhalgh-Stanley, N. (2016) “The Impact of
Employment on Parental Coresidence.” Real Estate Economics. doi:10.1111/1540-6229.12152
Ermisch, John F. (1999) “Prices, Parents, and Young People's Household Formation.”
Journal of Urban Economics, 45(1): 47-71.
Ermisch, John, and Pamela Di Salvo, (1997) “The Economic Determinants of Young
People's Household Formation” Economica, 64(256): 627-644.
18
Giuliano, Paola (2007) “Living Arrangements in Western Europe: Does Cultural Origin
Matter?” Journal of the European Economic Association, 5(5): 927-952.
Haurin, D., P. Hendershott and D. Kim. (1993) “The Impact of Real Rents and Wages on
Household Formation.” Review of Economics and Statistics 75: 284-293
Iacovou, Maria (2002) “Regional differences in the transition to adulthood.” Annals of
the American Academy of Political and Social Science. 580: 40-69.
Ifanti, Amalia A. et al. (2014) “Physicians’ brain drain in Greece: A perspective on the
reasons why and how to address it.” Health Policy, 117(2): 210-215
Isengard, Bettina, Ronny König & Marc Szydlik (2017) “Money or
space? Intergenerational transfers in a comparative perspective.” Housing Studies, DOI:10.1080/02673037.2017.1365823
Lee, Kwan, and Gary Painter (2013) “What happens to household formation in a
recession?” Journal of Urban Economics, 76: 93-109.
Leventi, Chrysa and Manos Matsaganis (2016) “Disentangling Annuities and Transfers in
Pension Benefits: Evidence from Greece.” 15th Conference on Research on Economic Theory and Econometrics Tinos
Manacorda, Marco and Enrico Moretti (2006) “Why Do Most Italian Youths Live with
Their Parents? Intergenerational Transfers and Household Structure.” Journal of the Euro-pean Economic Association, 4(4): 800-829.
Matsaganis, Manos (2013) “The Greek crisis: social impact and policy responses.” Berlin:
Friedrich-Ebert-Stiftung.
Matsaganis, Manos (2015) “Youth unemployment and the Great Recession in Greece” In:
Dolado, Juan J., No Country for Young People? Youth Labor Market Problems in Europe, London: Centre for Economic Policy Research, 77-87.
Matsudaira, Jordan (2016) “Economic conditions and the living arrangements of young
adults: 1960 to 2011.” Journal of Population Economics, 29(1): 167-195.
McElroy, Marjorie B. (1985) “The Joint Determination of Household Membership and
Market Work: The Case of Young Men.” Journal of Labor Economics, 3(3): 293-316.
McGarry, Kathleen (2016) “Dynamic aspects of family transfers.” Journal of Public
Economics, 137: 1-13.
McGarry, Kathleen and Robert F. Schoeni (1995) “Transfer Behavior in the Health and
Retirement Study: Measurement and the Redistribution of Resources within the Family.” The Journal of Human Resources, Special Issue on the Health and Retirement Study: Data Quality and Early Results, 30: S184-S226
Mellor, Jennifer (2001) “Long-term care and nursing home coverage: are adult children

19
substitutes for insurance policies?” Journal of Health Economics, 20(4): 527-547.
Rogers, William H. and Anne E. Winkler (2014) “How Did the Housing and Labor Market
Crises Affect Young Adults' Living Arrangements?” Institute for the Study of Labor, discussion paper 8568
Rosenzweig, Mark, and Kenneth Wolpin (1994) “Parental and Public Transfers to Young
Women and Their Children.” The American Economic Review, 84: 1195-1212.
Saraceno, Chiara (1994) “The Ambivalent Familism of the Italian Welfare State,” Social
Politics: International Studies in Gender, State & Society, 1(1): 60–82.
Schoeni, Robert F. (1997) “Private Interhousehold Transfers of Money and Time: New
Empirical Evidence.” Review of Income and Wealth, 43(4): 423–448.
Wiemers, Emily E. (2017) “The Celtic Tiger and home leaving among Irish young adults”
Review of Economics of the Household, 15: 199-222.
Zilcha, Itzhak (2003) “Intergenerational transfers, production and income distribution”
Journal of Public Economics, 87, 489–513

20
Appendix
Table A1. Region-specific fixed-effects from the regressions presented in Table 2
(1) (2) (3) (4) (5) (6)
Kentriki Makedonia 0.155 0.193 0.269* 0.352*** 0.370*** 0.345***
(0.121) (0.150) (0.160) (0.105) (0.114) (0.125)
Dytiki Makedonia 0.058** 0.056* 0.156*** 0.054*** 0.038** 0.068**
(0.027) (0.029) (0.051) (0.017) (0.018) (0.030)
Ipeiros 0.061** 0.056* 0.186*** 0.007 0.000 0.030
(0.030) (0.032) (0.055) (0.017) (0.018) (0.033)
Thessalia 0.099*** 0.097*** 0.117*** 0.070*** 0.072*** 0.072***
(0.028) (0.031) (0.030) (0.014) (0.016) (0.023)
Ionia Nisia 0.018 0.015 -0.265** -0.040* -0.052** -0.020
(0.040) (0.042) (0.103) (0.023) (0.024) (0.085)
Dytiki Ellada 0.039 0.036 -0.232** 0.047*** 0.036** 0.067
(0.026) (0.028) (0.099) (0.017) (0.018) (0.085)
Sterea Ellada 0.064** 0.061* 0.130*** 0.012 0.020 0.013
(0.029) (0.032) (0.036) (0.015) (0.015) (0.026)
Attiki 0.243 0.287 0.366 0.534*** 0.564*** 0.448**
(0.189) (0.235) (0.250) (0.157) (0.171) (0.194)
Peloponnisos 0.112*** 0.109*** 0.040 0.043*** 0.049*** 0.035
(0.033) (0.037) (0.052) (0.015) (0.015) (0.041)
Voreio Aigaio 0.031 0.018 -0.041 -0.022 -0.024 -0.010
(0.030) (0.034) (0.048) (0.016) (0.018) (0.046)
Notio Aigaio 0.051** 0.050* 0.155*** -0.009 -0.011 -0.088**
(0.024) (0.028) (0.043) (0.015) (0.016) (0.040)
Kriti 0.041* 0.043 0.128*** -0.005 0.001 -0.010
(0.024) (0.026) (0.040) (0.014) (0.013) (0.029)
Note: reference category is Anatoliki Makedonia and Thraki.

21
Table A2. Region-specific fixed-effects from the regressions presented in Table 3
(1) (2) (3) (4) (5) (6)
Kentriki Makedonia 0.023 0.197* 0.204 0.137 0.082 0.068
(0.103) (0.108) (0.141) (0.098) (0.100) (0.140)
Dytiki Makedonia 0.043** 0.049** 0.107** 0.062*** 0.043** 0.061*
(0.021) (0.023) (0.045) (0.017) (0.020) (0.035)
Ipeiros 0.060*** 0.060** 0.125** 0.029* 0.015 0.029
(0.021) (0.024) (0.048) (0.016) (0.021) (0.043)
Thessalia 0.039** 0.031 0.035 0.039*** 0.037** 0.040
(0.018) (0.023) (0.029) (0.014) (0.015) (0.027)
Ionia Nisia 0.016 0.018 -0.141 -0.043 -0.070** -0.059
(0.031) (0.032) (0.125) (0.029) (0.028) (0.108)
Dytiki Ellada 0.024 0.029 -0.152 0.029 0.016 0.015
(0.020) (0.024) (0.119) (0.019) (0.020) (0.109)
Sterea Ellada 0.053** 0.043* 0.065* 0.015 0.016 0.029
(0.023) (0.025) (0.033) (0.015) (0.015) (0.028)
Attiki 0.019 0.276 0.265 0.178 0.101 0.047
(0.160) (0.170) (0.239) (0.149) (0.152) (0.218)
Peloponnisos 0.053** 0.045 -0.000 0.017 0.011 0.017
(0.026) (0.029) (0.060) (0.019) (0.018) (0.050)
Voreio Aigaio 0.012 0.010 -0.062 0.003 -0.013 -0.005
(0.020) (0.026) (0.060) (0.021) (0.023) (0.056)
Notio Aigaio 0.018 0.015 0.058 -0.016 -0.024 -0.053
(0.019) (0.022) (0.043) (0.019) (0.019) (0.045)
Kriti 0.006 -0.004 0.049 -0.016 -0.016 -0.029
(0.018) (0.020) (0.037) (0.016) (0.016) (0.036)
Note: reference category is Anatoliki Makedonia and Thraki.
22
Previous Papers in this Series
128: Antigone Lyberaki, Platon Tinios, Long-term Care, Ageing and Gender in the
Greek Crisis, September 2018
127. Persefoni Zeri, Charalambos Tsekeris, Theodore Tsekeris, Investigating the
Macedonia Naming Dispute in the Twitter Era: Implications for the Greek Identity
Crisis, July 2018
126. Roumanias Costas, Skouras Spyros, Christodoulakis Nikos Crisis and Extremism:
Can a Powerful Extreme Right Emerge in a Modern Democracy? Evidence from
Greece’s Golden Dawn, June 2018
125. Christopoulou Rebekka, Monastiriotis Vassilis Did the crisis make the Greek
economy less inefficient? Evidence from the structure and dynamics of sectoral
premia, May 2018
124. Glyniadaki Katerina Judge, Nudge, or Engage? Gender-related pressures and
responses among street-level bureaucrats working with migrants, April, 2018
123. Chalari Athanasia, Serifi Panagiota, The Crisis Generation: the effect of the Greek
Crisis on Youth Identity Formation, March, 2018
122. Christopoulou Rerbekka, Pantalidou, Maria, The parental home as labour market
insurance for young Greeks during the crisis, February, 2008
121. Stavridis Stelios, Greek parliamentarians and Greek foreign policy (2004-2014),
January 2018
120. Huliaras Asteris, Sotiropoulos Dimitris, The crisis in Greece: The semi-rentier
state hypothesis, January 2018
119. Zafiropoulou Maria, Pérez Alejandro, Christodoulopoulou Archontia, Peeva
Radina, Marini Ioanna, Winners and Losers of the Greek Crisis as a Result of a Double
Fragmentation and Exclusion: a Discourse Analysis of Greek Civil Society, December
2017
http://www.lse.ac.uk/Hellenic-Observatory/Assets/Documents/Publications/GreeSE-Papers/GreeSE-125.pdf
http://www.lse.ac.uk/Hellenic-Observatory/Assets/Documents/Publications/GreeSE-Papers/GreeSE-125.pdf
http://www.lse.ac.uk/Hellenic-Observatory/Assets/Documents/Publications/GreeSE-Papers/GreeSE-125.pdf
http://www.lse.ac.uk/Hellenic-Observatory/Assets/Documents/Publications/GreeSE-Papers/GreeSE-121.pdf
http://www.lse.ac.uk/Hellenic-Observatory/Assets/Documents/Publications/GreeSE-Papers/GreeSE-120.pdf
http://www.lse.ac.uk/Hellenic-Observatory/Assets/Documents/Publications/GreeSE-Papers/GreeSE-120.pdf
http://www.lse.ac.uk/Hellenic-Observatory/Assets/Documents/Publications/GreeSE-Papers/GreeSE-119.pdf