Great Indian Food Paradox: Trends and Patterns
13
Give to AgEcon Search The World’s Largest Open Access Agricultural & Applied Economics Digital Library This document is discoverable and free to researchers across the globe due to the work of AgEcon Search. Help ensure our sustainability. AgEcon Search http://ageconsearch.umn.edu [email protected] Papers downloaded from AgEcon Search may be used for non-commercial purposes and personal study only. No other use, including posting to another Internet site, is permitted without permission from the copyright owner (not AgEcon Search), or as allowed under the provisions of Fair Use, U.S. Copyright Act, Title 17 U.S.C.
-
Upload
khangminh22 -
Category
Documents
-
view
2 -
download
0
Transcript of Great Indian Food Paradox: Trends and Patterns

Give to AgEcon Search
The World’s Largest Open Access Agricultural & Applied Economics Digital Library
This document is discoverable and free to researchers across the globe due to the work of AgEcon Search.
Help ensure our sustainability.
AgEcon Search http://ageconsearch.umn.edu
Papers downloaded from AgEcon Search may be used for non-commercial purposes and personal study only. No other use, including posting to another Internet site, is permitted without permission from the copyright owner (not AgEcon Search), or as allowed under the provisions of Fair Use, U.S. Copyright Act, Title 17 U.S.C.
Agricultural Economics Research ReviewVol. 29 (Conference Number) 2016 pp 31-42DOI: 10.5958/0974-0279.2016.00031.8
Great Indian Food Paradox: Trends and Patterns
P.C. Meena, Sanjiv Kumar, K. Srinivas, Ranjit Kumar, B. Ganesh Kumar,N. Sivaramane and A. Dhandapani
ICAR-National Academy of Agricultural Research Management, Hyderabad - 500 030, Telangana
Abstract
According to Nutritional Intake survey series, conducted by the National Sample Survey Organization,there has been slow, but steady decline in consumption of calories and protein, but the fat consumptionhas been increasing in both rural and urban India. Unlike calorie and protein, the difference in fat intakein rural and urban India is pronounced. Across the states of the country, the states in north-east andeastern regions seem lagging in terms of nutrition — moving further away from the desirable levels andare much below the national average too. In terms of calorie intake, 68 per cent of country’s populationremains undernourished and between 2004-05 and 2009-10, there has been an increase of about 55million people who have deficit intake of calories. With rise in food expenditure among rural and urbanmasses, there has been less than proportionate increase in calorie and protein intake. However, a propensityto consume more of fat has been witnessed with rise in food expenditure. The study has suggested togenerate awareness among the masses about the ‘smart’ diet.
Key words: Food consumption, nutrients intake, calories, cost of energy
JEL Classification: Q18
IntroductionEven after witnessing substantial progress in most
of our endeavours like technology, art, science, defence,industrialization, etc., the basic needs of vast majorityof population of the country are yet to be fulfilled, i.e.availability and affordability of hygienic and nutritiousfood. According to the World Bank report (2011) –“South Asia still has the highest rates and the largestnumber of undernourished children in the world”, andalso “the high economic growth experienced by SouthAsian countries has not made an impact on thenutritional status of South Asian children”.
Nevertheless, there has been some improvementin most of the indicators over the past few decades.Though the desired levels are yet to be achieved, therehas been marked improvement in the quantity of foodbeing consumed, not necessarily its quality.
This paper highlights some of the insights fromvarious reports published by the NSS under the series,‘Nutritional Intake in India’. The report mainly focuseson the quantity of energy, measured in kilo calories(kcal) being consumed, intake of nutrients like protein,fat and their sources among various socio-economicclasses for India as a whole and also at the state level.
Given the vast geographical spread, alteringtopography and rich history, one thing the country hasinherited is “diversity” which is ubiquitous in ournation, be it culture, taboos, tradition, life-style, etc.and the “diet” is no exception. This paper highlightthis diversity in the Indian diets and more importantly,how far we are from the required diet or in other words,how close are we to malnutrition? It is important tounderstand the true meaning of malnutrition also, whichis most commonly treated at par with under-nutrition.Malnutrition shows improper diet and can be eitherexcess or deficiency of different nutrients.
*Author for correspondenceEmail: [email protected]
32 Agricultural Economics Research Review Vol. 29 (Conference Number) 2016
International Conference on Nutrition (ICN, 1992)described six important determinants of mal-nutrition,these are: (i) production, mainly agricultural and foodproduction, (ii) preservation of food from wastage andloss, including value addition through processing, (iii)population, which refers to both child spacing in afamily and also to population density in a local area ora country, (iv) poverty, which suggests economic causesof malnutrition, (v) politics, as political ideology,political choices and political actions influencenutrition, and (vi) pathology, which is the medical termfor disease, since disease, especially infection,adversely influences nutritional status.
Data SourceThe National Sample Survey Organization releases
series on ‘Nutritional Intake in India’ on quinquennialbasis. The state-wise data for the years 2004-05 and2009-10 have been used for the present analysis.However, wherever required, the data for the previousrounds were also referred for better understanding andanalysis.
Apart from data, it is equally important tounderstand the theoretical background and basicconcepts associated with nutrition. These are explainedin Annexure I.
Per Capita vs Per Consumer Unit
The NSS report contains data in two units, viz. percapita and per consumer. In this paper, the consumerunit data have been used, the reason being a moreappropriate representation of the dietary intake.
One consumer unit, as defined by NSS, is anormative rate of equivalence of a given age-sexspecific person in relation to a ‘standard’ male persondoing sedentary work in the age group 20-39 years.All other age and sex are adjusted according to theconsumer unit. This gives a truer representation becausethe needs of an individual in terms of calories varywidely with their age, sex, height, weight and activitylevel. All this is not taken into account when onecomputes in term of per capita, in which each individualis treated as the same one unit.
MPCE Classes
The MPCE (monthly per capita consumerexpenditure) is the expenditure done in one month by
a household to which the person belongs. This reflectsthe standard of living of the household. Further, theseMPCEs are grouped into decile classes. The first decileof the distribution of MPCE over the population ofany region or domain is the level of MPCE below which10 per cent of the population lie, the second decile, thelevel below which 20 per cent of the population lie,and so on.
Results and DiscussionTrend in Consumption of Nutrients
The economic poverty and lack of purchasingpower are believed to be the two major factorsresponsible for the low dietary intake and chronicunder-nutrition. India defined poverty line on the basisof energy intake of the population and initiatedinterventions aimed at improving the purchasing power,access to subsidized food, essential goods and servicesto people below poverty line. The government hasundertaken various development measures likeMahatma Gandhi National Rural EmploymentGuarantee Act (MGNREGA), Food Security Bill, etc.to address this. The NSSO consumer expenditure dataon energy intake of urban and rural areas on inter-temporal basis provide a useful platform for assessingthe impact of these interventions on energy intake.
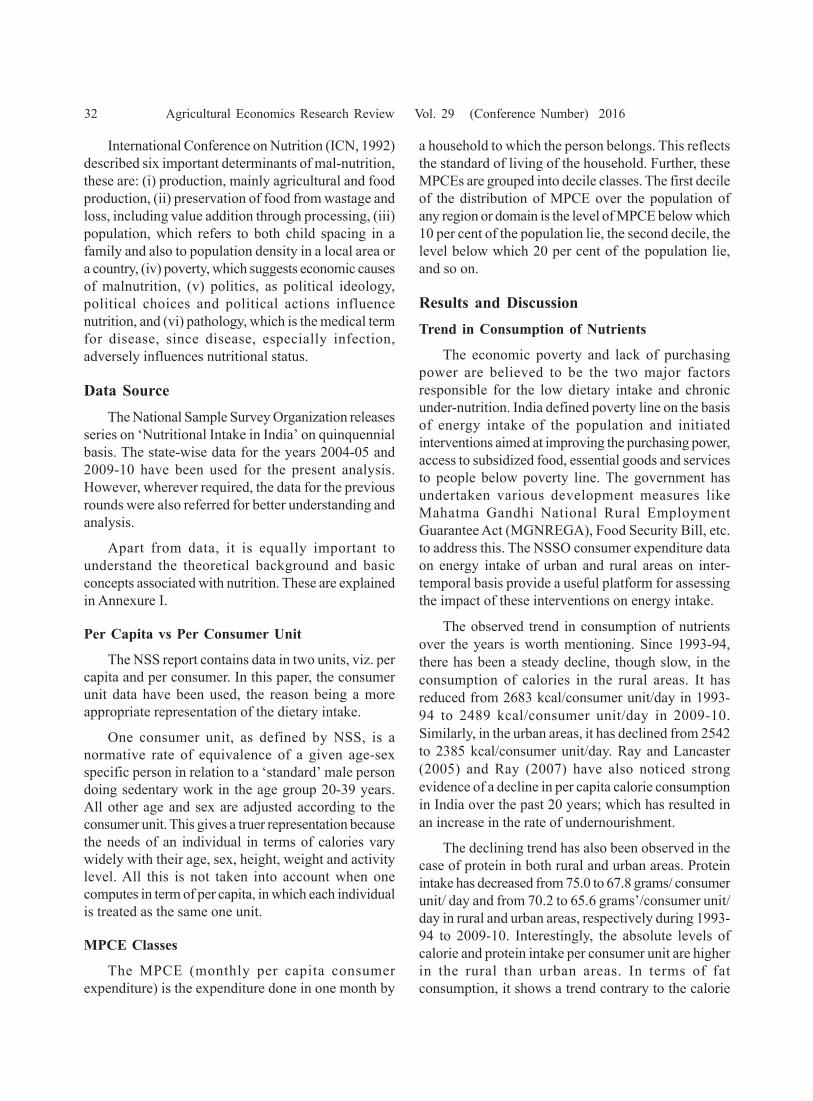
The observed trend in consumption of nutrientsover the years is worth mentioning. Since 1993-94,there has been a steady decline, though slow, in theconsumption of calories in the rural areas. It hasreduced from 2683 kcal/consumer unit/day in 1993-94 to 2489 kcal/consumer unit/day in 2009-10.Similarly, in the urban areas, it has declined from 2542to 2385 kcal/consumer unit/day. Ray and Lancaster(2005) and Ray (2007) have also noticed strongevidence of a decline in per capita calorie consumptionin India over the past 20 years; which has resulted inan increase in the rate of undernourishment.
The declining trend has also been observed in thecase of protein in both rural and urban areas. Proteinintake has decreased from 75.0 to 67.8 grams/ consumerunit/ day and from 70.2 to 65.6 grams’/consumer unit/day in rural and urban areas, respectively during 1993-94 to 2009-10. Interestingly, the absolute levels ofcalorie and protein intake per consumer unit are higherin the rural than urban areas. In terms of fatconsumption, it shows a trend contrary to the calorie
Meena et al. : Great Indian Food Paradox: Trends and Patterns 33
and protein intake over the years. The increase in fatconsumption has been from 39.1 to 47.2grams/consumer unit/ day and from 51.6 to 58.7 grams/consumer unit/day in the rural and urban areas,respectively in a span of 16 years ending 2009-10. It isnoteworthy that unlike calorie and protein intake, thefat consumption has been higher in the urban areasand the gap in fat intake between rural and urban peopleis also wider than that of calorie and protein intake.
Some researchers argue that the lower levels ofenergy intake are neither due to poor access to food asfood supply has been adequate, nor due to economicconstraints because prices of food in general and ofcereals in particular, have been low. The decline inenergy intake might be due to the reduction in energyexpenditure attributable to the changes in lifestyle andreduction in physical activity (Ramachandran, 2008).The reduction in physical activity and therefore,optimum energy requirement may be the crucial factorin the on-going nutritional transition in India. Similarobservations have also been made by Rao (2000),Mittal (2007), Deaton and Dreze (2009) and Li andEli (2010). They indicated that people consume fewercalories because their energy needs have declined overtime due to improvement in the epidemiologicalenvironment, changes in occupational structures andmechanization of agricultural work. While they do notoffer any direct evidence in support of the hypothesis,they do indicate that anthropometric measures such asheight-for-age, weight-for-height, and weight-for-ageamong children and adult body mass index (BMI) haveshown improvement over time in India.
Under such views and counter-views, it is really apuzzle whether declining calorie levels are really amatter of concern. It is also to be noted that therequirements of energy and nutrients have a timedimension too, which means under the given socio-economic conditions in a particular period, the validityof the same was established. Given the changes overyears in living style and improvement in standard ofliving, such parameters cannot be accepted inperpetuity and call for a re-assessment.
Improving dietary knowledge has the potential toprevent obesity and overweight in the country(Shimokawa, 2012). There is no doubt that fat isrequired for the body, however, beyond a level, the fatcontent in the body is counter-productive. The trendof increasing fat intake needs to be arrested byspreading awareness through suitable means aboutimplications of mal-nutrition (obesity) and other healthcomplications due to higher levels of fat intake,especially, by the urban population.
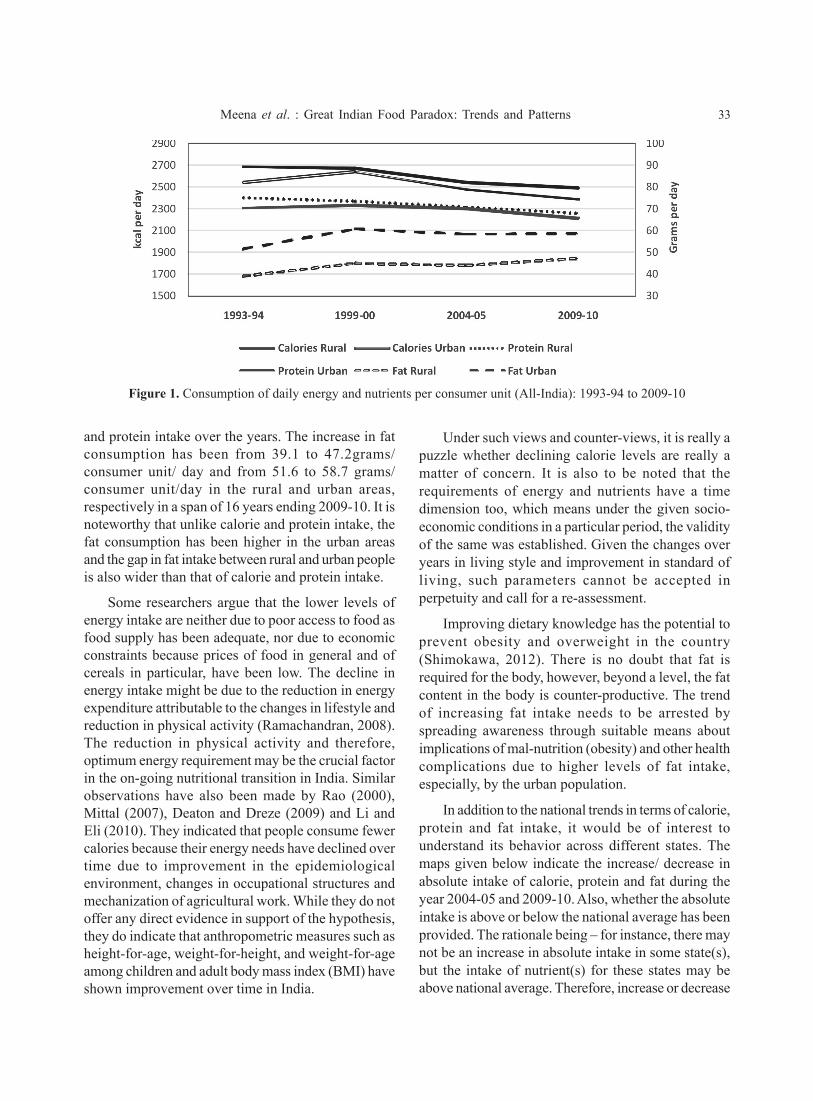
In addition to the national trends in terms of calorie,protein and fat intake, it would be of interest tounderstand its behavior across different states. Themaps given below indicate the increase/ decrease inabsolute intake of calorie, protein and fat during theyear 2004-05 and 2009-10. Also, whether the absoluteintake is above or below the national average has beenprovided. The rationale being – for instance, there maynot be an increase in absolute intake in some state(s),but the intake of nutrient(s) for these states may beabove national average. Therefore, increase or decrease
Figure 1. Consumption of daily energy and nutrients per consumer unit (All-India): 1993-94 to 2009-10
34 Agricultural Economics Research Review Vol. 29 (Conference Number) 2016
in intake has to be considered in conjunction with thepresent levels of nutrients intake. Accordingly, fourcategories, as mentioned in Table 1, were prepared tounderstand the present intake level of nutrients withrespect to national average and the trend from 2004-05 to 2009-10.
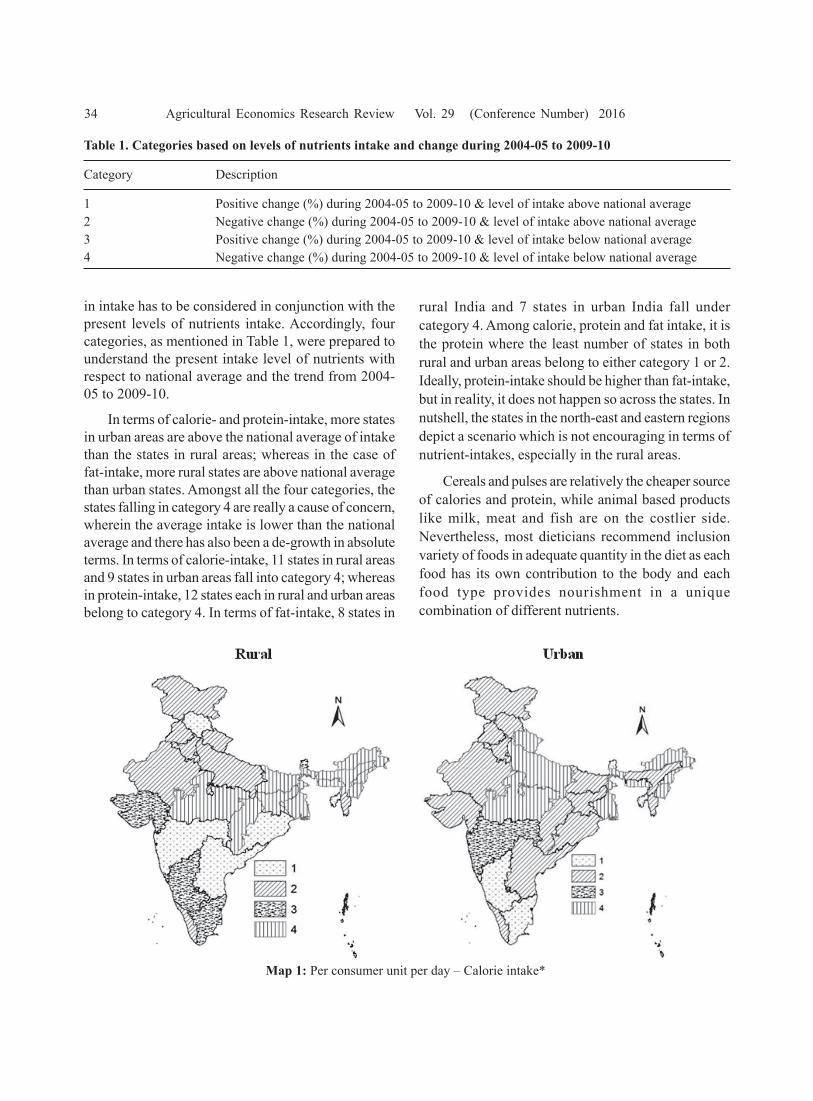
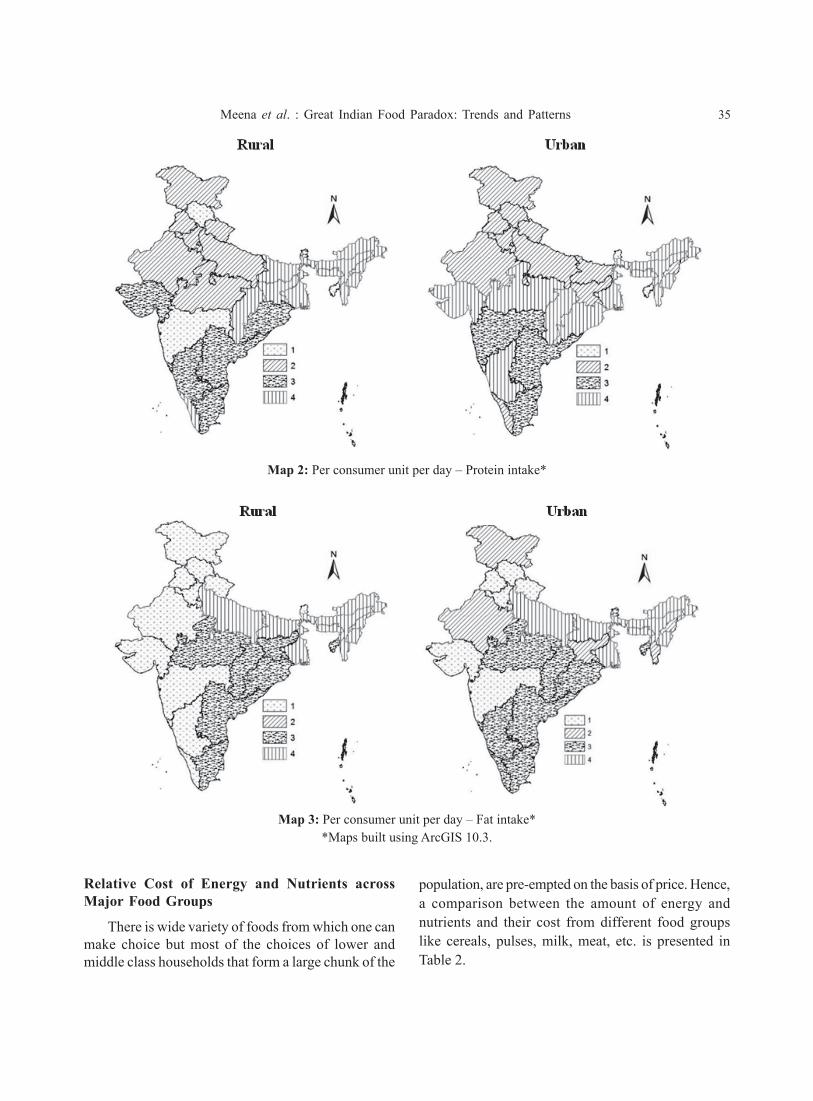
In terms of calorie- and protein-intake, more statesin urban areas are above the national average of intakethan the states in rural areas; whereas in the case offat-intake, more rural states are above national averagethan urban states. Amongst all the four categories, thestates falling in category 4 are really a cause of concern,wherein the average intake is lower than the nationalaverage and there has also been a de-growth in absoluteterms. In terms of calorie-intake, 11 states in rural areasand 9 states in urban areas fall into category 4; whereasin protein-intake, 12 states each in rural and urban areasbelong to category 4. In terms of fat-intake, 8 states in
rural India and 7 states in urban India fall undercategory 4. Among calorie, protein and fat intake, it isthe protein where the least number of states in bothrural and urban areas belong to either category 1 or 2.Ideally, protein-intake should be higher than fat-intake,but in reality, it does not happen so across the states. Innutshell, the states in the north-east and eastern regionsdepict a scenario which is not encouraging in terms ofnutrient-intakes, especially in the rural areas.
Cereals and pulses are relatively the cheaper sourceof calories and protein, while animal based productslike milk, meat and fish are on the costlier side.Nevertheless, most dieticians recommend inclusionvariety of foods in adequate quantity in the diet as eachfood has its own contribution to the body and eachfood type provides nourishment in a uniquecombination of different nutrients.
Table 1. Categories based on levels of nutrients intake and change during 2004-05 to 2009-10
Category Description
1 Positive change (%) during 2004-05 to 2009-10 & level of intake above national average2 Negative change (%) during 2004-05 to 2009-10 & level of intake above national average3 Positive change (%) during 2004-05 to 2009-10 & level of intake below national average4 Negative change (%) during 2004-05 to 2009-10 & level of intake below national average
Map 1: Per consumer unit per day – Calorie intake*
Meena et al. : Great Indian Food Paradox: Trends and Patterns 35
Map 2: Per consumer unit per day – Protein intake*
Map 3: Per consumer unit per day – Fat intake**Maps built using ArcGIS 10.3.
Relative Cost of Energy and Nutrients acrossMajor Food Groups
There is wide variety of foods from which one canmake choice but most of the choices of lower andmiddle class households that form a large chunk of the
population, are pre-empted on the basis of price. Hence,a comparison between the amount of energy andnutrients and their cost from different food groupslike cereals, pulses, milk, meat, etc. is presented inTable 2.
36 Agricultural Economics Research Review Vol. 29 (Conference Number) 2016
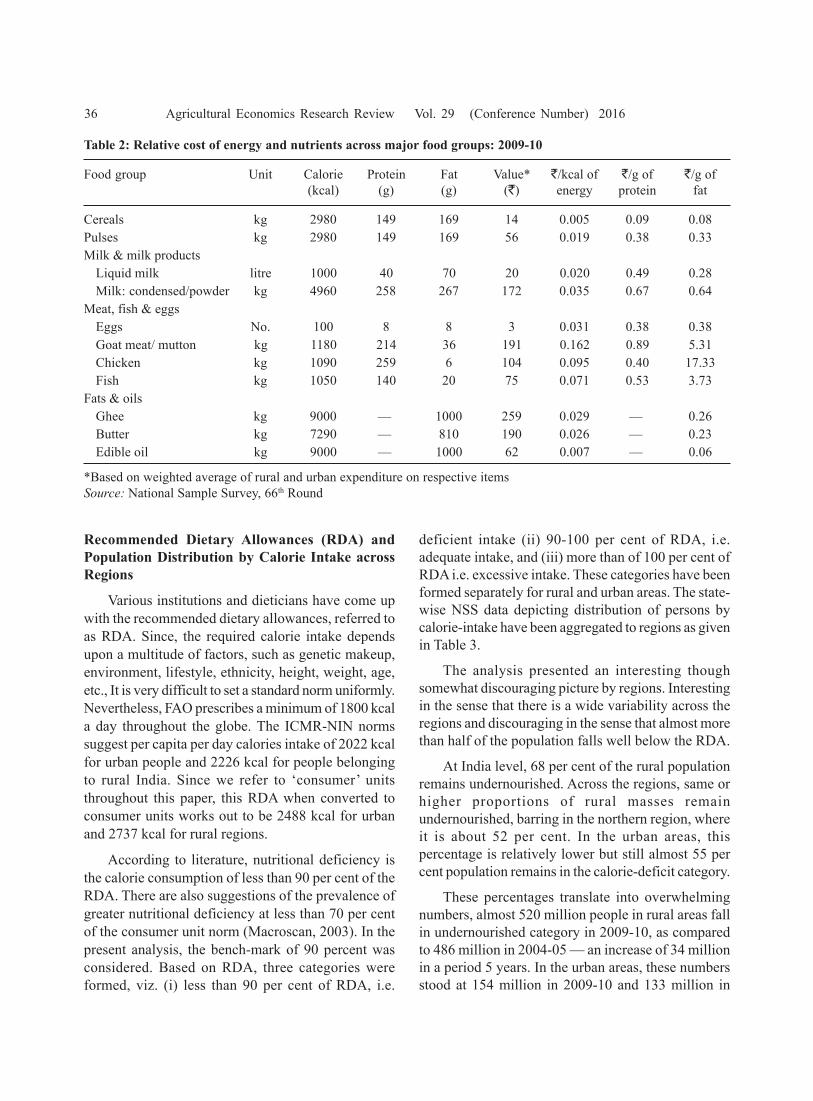
Table 2: Relative cost of energy and nutrients across major food groups: 2009-10
Food group Unit Calorie Protein Fat Value* `/kcal of `/g of `/g of(kcal) (g) (g) (`) energy protein fat
Cereals kg 2980 149 169 14 0.005 0.09 0.08Pulses kg 2980 149 169 56 0.019 0.38 0.33Milk & milk products
Liquid milk litre 1000 40 70 20 0.020 0.49 0.28Milk: condensed/powder kg 4960 258 267 172 0.035 0.67 0.64
Meat, fish & eggs Eggs No. 100 8 8 3 0.031 0.38 0.38Goat meat/ mutton kg 1180 214 36 191 0.162 0.89 5.31Chicken kg 1090 259 6 104 0.095 0.40 17.33Fish kg 1050 140 20 75 0.071 0.53 3.73
Fats & oils Ghee kg 9000 — 1000 259 0.029 — 0.26Butter kg 7290 — 810 190 0.026 — 0.23Edible oil kg 9000 — 1000 62 0.007 — 0.06
*Based on weighted average of rural and urban expenditure on respective itemsSource: National Sample Survey, 66th Round
Recommended Dietary Allowances (RDA) andPopulation Distribution by Calorie Intake acrossRegions
Various institutions and dieticians have come upwith the recommended dietary allowances, referred toas RDA. Since, the required calorie intake dependsupon a multitude of factors, such as genetic makeup,environment, lifestyle, ethnicity, height, weight, age,etc., It is very difficult to set a standard norm uniformly.Nevertheless, FAO prescribes a minimum of 1800 kcala day throughout the globe. The ICMR-NIN normssuggest per capita per day calories intake of 2022 kcalfor urban people and 2226 kcal for people belongingto rural India. Since we refer to ‘consumer’ unitsthroughout this paper, this RDA when converted toconsumer units works out to be 2488 kcal for urbanand 2737 kcal for rural regions.
According to literature, nutritional deficiency isthe calorie consumption of less than 90 per cent of theRDA. There are also suggestions of the prevalence ofgreater nutritional deficiency at less than 70 per centof the consumer unit norm (Macroscan, 2003). In thepresent analysis, the bench-mark of 90 percent wasconsidered. Based on RDA, three categories wereformed, viz. (i) less than 90 per cent of RDA, i.e.
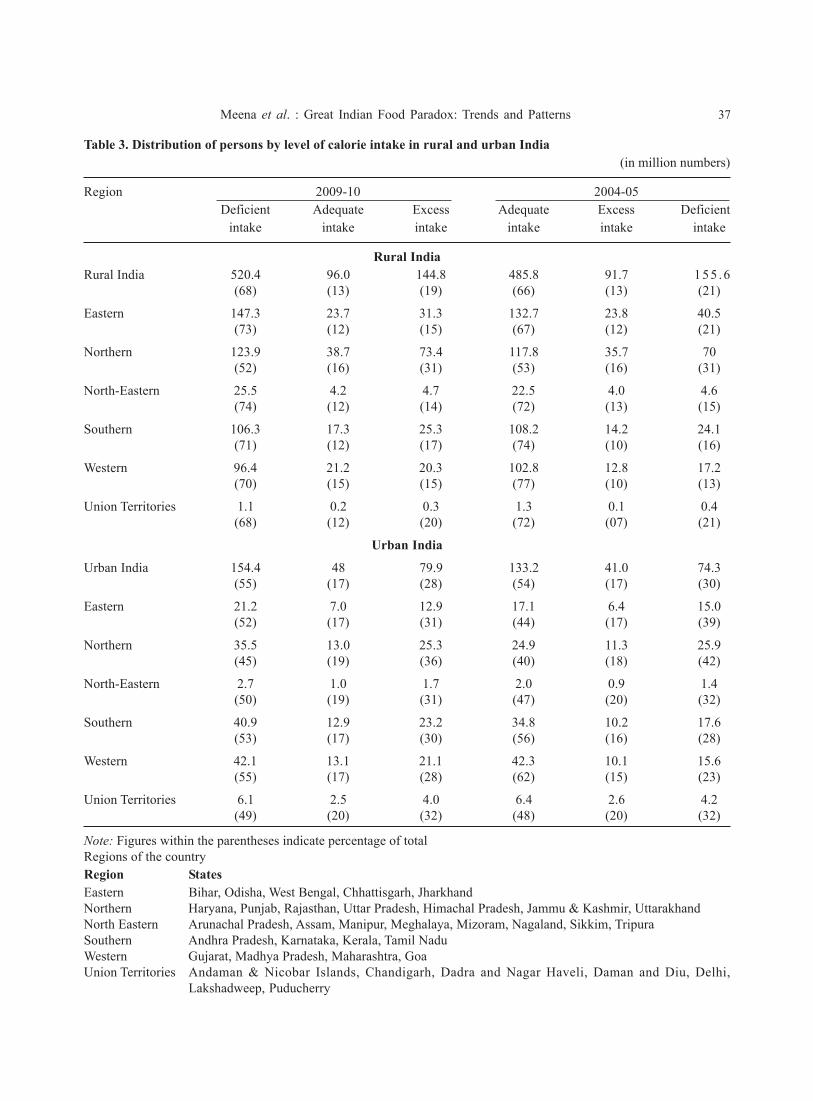
deficient intake (ii) 90-100 per cent of RDA, i.e.adequate intake, and (iii) more than of 100 per cent ofRDA i.e. excessive intake. These categories have beenformed separately for rural and urban areas. The state-wise NSS data depicting distribution of persons bycalorie-intake have been aggregated to regions as givenin Table 3.
The analysis presented an interesting thoughsomewhat discouraging picture by regions. Interestingin the sense that there is a wide variability across theregions and discouraging in the sense that almost morethan half of the population falls well below the RDA.
At India level, 68 per cent of the rural populationremains undernourished. Across the regions, same orhigher proportions of rural masses remainundernourished, barring in the northern region, whereit is about 52 per cent. In the urban areas, thispercentage is relatively lower but still almost 55 percent population remains in the calorie-deficit category.
These percentages translate into overwhelmingnumbers, almost 520 million people in rural areas fallin undernourished category in 2009-10, as comparedto 486 million in 2004-05 — an increase of 34 millionin a period 5 years. In the urban areas, these numbersstood at 154 million in 2009-10 and 133 million in
Meena et al. : Great Indian Food Paradox: Trends and Patterns 37
Table 3. Distribution of persons by level of calorie intake in rural and urban India(in million numbers)
Region 2009-10 2004-05Deficient Adequate Excess Adequate Excess Deficient
intake intake intake intake intake intake
Rural IndiaRural India 520.4 96.0 144.8 485.8 91.7 155 .6
(68) (13) (19) (66) (13) (21)
Eastern 147.3 23.7 31.3 132.7 23.8 40.5(73) (12) (15) (67) (12) (21)
Northern 123.9 38.7 73.4 117.8 35.7 70(52) (16) (31) (53) (16) (31)
North-Eastern 25.5 4.2 4.7 22.5 4.0 4.6(74) (12) (14) (72) (13) (15)
Southern 106.3 17.3 25.3 108.2 14.2 24.1(71) (12) (17) (74) (10) (16)
Western 96.4 21.2 20.3 102.8 12.8 17.2(70) (15) (15) (77) (10) (13)
Union Territories 1.1 0.2 0.3 1.3 0.1 0.4(68) (12) (20) (72) (07) (21)
Urban India
Urban India 154.4 48 79.9 133.2 41.0 74.3(55) (17) (28) (54) (17) (30)
Eastern 21.2 7.0 12.9 17.1 6.4 15.0(52) (17) (31) (44) (17) (39)
Northern 35.5 13.0 25.3 24.9 11.3 25.9(45) (19) (36) (40) (18) (42)
North-Eastern 2.7 1.0 1.7 2.0 0.9 1.4(50) (19) (31) (47) (20) (32)
Southern 40.9 12.9 23.2 34.8 10.2 17.6(53) (17) (30) (56) (16) (28)
Western 42.1 13.1 21.1 42.3 10.1 15.6(55) (17) (28) (62) (15) (23)
Union Territories 6.1 2.5 4.0 6.4 2.6 4.2(49) (20) (32) (48) (20) (32)
Note: Figures within the parentheses indicate percentage of totalRegions of the countryRegion StatesEastern Bihar, Odisha, West Bengal, Chhattisgarh, JharkhandNorthern Haryana, Punjab, Rajasthan, Uttar Pradesh, Himachal Pradesh, Jammu & Kashmir, UttarakhandNorth Eastern Arunachal Pradesh, Assam, Manipur, Meghalaya, Mizoram, Nagaland, Sikkim, TripuraSouthern Andhra Pradesh, Karnataka, Kerala, Tamil NaduWestern Gujarat, Madhya Pradesh, Maharashtra, GoaUnion Territories Andaman & Nicobar Islands, Chandigarh, Dadra and Nagar Haveli, Daman and Diu, Delhi,
Lakshadweep, Puducherry
38 Agricultural Economics Research Review Vol. 29 (Conference Number) 2016
2004-05, depicting a rise of 21 million. The change inpercentage terms in rural and urban areas is hardly 1-2per cent between 2004-05 and 2009-10, however, thistranslates into a huge increase of 55 million people inthe deficient nutrient-intake category during this period.
Propensity to Consume
An interesting perspective could be drawn whenthe propensity towards consumption of calories, proteinand fat vis-à-vis expenditure of food is analysed. Theelasticity coefficients across the regions were estimatedto examine the changes in the inclination of theconsumers towards different nutrients with rise inconsumer expenditure. The study has revealed that withrise in consumer expenditure, there was a higherpropensity to spend on non-food commodities.According to Consumer Expenditure Survey reports
of different NSS rounds, the shares of food expenditurein total spending have been estimated at 59.4 per cent,55.0 per cent and 53.6 per cent in the years 1999-2000,2004-05 and 2009-10, respectively in rural areas. Theseproportions were 48.1 per cent, 42.5 per cent and 40.7per cent in urban areas for the same reference years.Therefore, with increase in the level of income andimprovement in lifestyles, there has been adiversification in the consumption basket — from food-based items to non-food items. This phenomenonlogically leads to a situation where increase inexpenditure does not proportionately leads to the risein expenditure on food items.
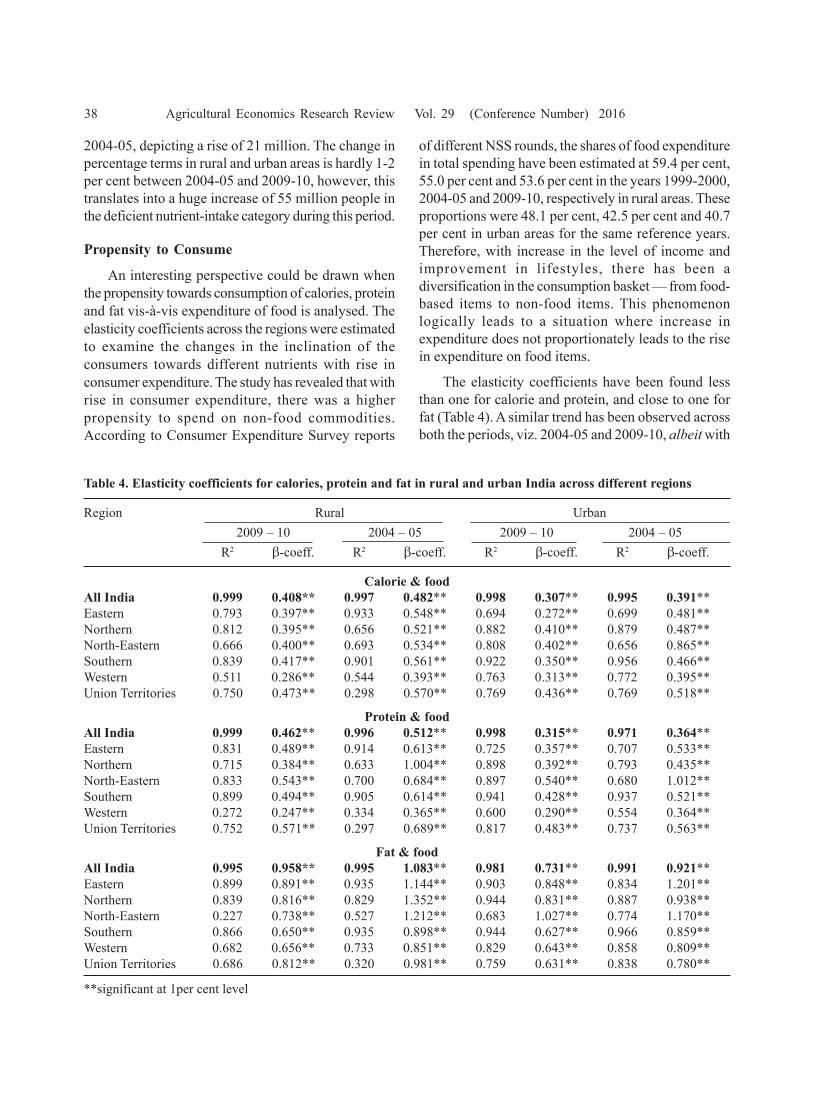
The elasticity coefficients have been found lessthan one for calorie and protein, and close to one forfat (Table 4). A similar trend has been observed acrossboth the periods, viz. 2004-05 and 2009-10, albeit with
Table 4. Elasticity coefficients for calories, protein and fat in rural and urban India across different regions
Region Rural Urban2009 – 10 2004 – 05 2009 – 10 2004 – 05
R2 β-coeff. R2 β-coeff. R2 β-coeff. R2 β-coeff.
Calorie & foodAll India 0.999 0.408** 0.997 0.482** 0.998 0.307** 0.995 0.391**Eastern 0.793 0.397** 0.933 0.548** 0.694 0.272** 0.699 0.481**Northern 0.812 0.395** 0.656 0.521** 0.882 0.410** 0.879 0.487**North-Eastern 0.666 0.400** 0.693 0.534** 0.808 0.402** 0.656 0.865**Southern 0.839 0.417** 0.901 0.561** 0.922 0.350** 0.956 0.466**Western 0.511 0.286** 0.544 0.393** 0.763 0.313** 0.772 0.395**Union Territories 0.750 0.473** 0.298 0.570** 0.769 0.436** 0.769 0.518**
Protein & foodAll India 0.999 0.462** 0.996 0.512** 0.998 0.315** 0.971 0.364**Eastern 0.831 0.489** 0.914 0.613** 0.725 0.357** 0.707 0.533**Northern 0.715 0.384** 0.633 1.004** 0.898 0.392** 0.793 0.435**North-Eastern 0.833 0.543** 0.700 0.684** 0.897 0.540** 0.680 1.012**Southern 0.899 0.494** 0.905 0.614** 0.941 0.428** 0.937 0.521**Western 0.272 0.247** 0.334 0.365** 0.600 0.290** 0.554 0.364**Union Territories 0.752 0.571** 0.297 0.689** 0.817 0.483** 0.737 0.563**
Fat & foodAll India 0.995 0.958** 0.995 1.083** 0.981 0.731** 0.991 0.921**Eastern 0.899 0.891** 0.935 1.144** 0.903 0.848** 0.834 1.201**Northern 0.839 0.816** 0.829 1.352** 0.944 0.831** 0.887 0.938**North-Eastern 0.227 0.738** 0.527 1.212** 0.683 1.027** 0.774 1.170**Southern 0.866 0.650** 0.935 0.898** 0.944 0.627** 0.966 0.859**Western 0.682 0.656** 0.733 0.851** 0.829 0.643** 0.858 0.809**Union Territories 0.686 0.812** 0.320 0.981** 0.759 0.631** 0.838 0.780**
**significant at 1per cent level
Meena et al. : Great Indian Food Paradox: Trends and Patterns 39
varying magnitude across the regions. It may be seenthat between 2004-05 and 2009-10, there has been analmost uniform fall in elasticity coefficients across allthe nutrients. The results of elasticity coefficients alsoindicate that the rise in food expenditure increases thepropensity to consume more of fat than of calorie, orprotein. It may be partly attributed to the increasingtrend of consuming processed foods, which aregenerally high in fat-content. However, in-depth studyis required to substantiate this argument.
The analysis by regions has revealed that elasticitycoefficients are on the higher side in the North-Eastern,Southern regions and Union Territories for both calorieand protein intake. In fat-intake, the Eastern, Northernand North-Eastern regions indicate a higher propensityto spend in comparison to other regions. Interestingly,the coefficients for calorie, protein and fat intake havebeen found lower in the Western region.
ConclusionsThere is a great Indian paradox that has been
baffling the researchers and policymakers for quitesometime. The decline in calorie-intake levels over theyears is hard to explain when most of the factorsaffecting the intake levels have shown a positive trend.The rising income, better productivity, availability andaccessibility of food grains and government schemesand policies make it difficult to discern this oxymoronbehaviour. There can be a multitude of views for thisbehaviour but it is difficult to pin point a single reasonexplaining the observed phenomenon. Most probably,it is due to the higher preference for spending onconsumer durables and non-food items. It means whena basic level of food requirement is met, people attachless importance to food and start spending more onnon-food items. Another reason could be the lack ofawareness about balanced nutrition among most of thepeople. Nonetheless, people in the urban centres arebecoming conscious about the importance of propernutrition. It may take several years before it spreadsevenly throughout the urban India and then finallytrickles down to the rural areas. It requires activeparticipation of people, governments, NGOs, healthcare providers and other stake holders.
The calorie-intake has waned down from 2683kcal/consumer unit/day in 1993-94 to 2489 kcal/consumer unit/day in 2009-10. Similarly, in the urban
areas also it has declined from 2542 to 2385 kcal/consumer unit/day. The protein-intake has alsofollowed a similar suit in both rural as well as urbanareas where it has dwindled from 75.0 to 67.8 grams/consumer unit/ day and from 70.2 to 65.6 grams/consumer unit/day in rural and urban areas, respectivelyover this period. The fat-intake, on the contrary, hasbeen rising. This reflects the increase in consumptionof fatty processed foods and increasing popularity ofsuch foods across masses, especially among the youths.The increase in fat-intake has been from 39.1 to 47.2grams/consumer unit/day and from 51.6 to 58.7 grams/consumer unit/day in the rural and urban areas,respectively in the span of 16 years. These trends aretaking the majority of population away from thequintessential diet, which is desirable for a healthyliving.
At all-India level about 68 per cent of the ruraland 55 per cent of the urban population has showndeficient intake of calories per day. In 2009-10, therehas been an increase of 2 per cent in the number ofpersons having deficient intake in the urban areas, andof 1 per cent in rural India from 2004-05. Given themagnanimity of our country, even a small shift of 1per cent, results in coercion of an overwhelmingnumber of people (about 20 million) into the nutrient-deficient category.
Since India is a country full of diversity, the intakelevel of different foods also varies largely. The analysisof the intake level data of various regions namely,Northern, Eastern, Western, Southern, North-Easternand Union Territories elicits interesting observations.In general, the eastern and north-eastern regions of thecountry seem lagging in having proper diet. It will beinteresting to study whether this is due to lower incomelevels of people or the food habits. For instance, in theurban Gujarat, where people are comparatively betteroff economically, are found to have inadequate proteinsin their diets.
The computation of propensity to consumedifferent nutrients with rise in consumer expenditurehas revealed that people are most affectionate andliberal towards fat than towards protein and calorieintake. It again partially reflects the unawarenessamong the society at large. The coefficient of elasticityshows that energy and nutrient intake do not increasein tandem with rise in consumer expenditure, but interms of fat intake, the same is close to unity.
40 Agricultural Economics Research Review Vol. 29 (Conference Number) 2016
Therefore, making proper nutrition available andaffordable to masses remains one of the leadingchallenges that the country faces today. With the risingincidences of lifestyle diseases, spreading awarenessthrough active participation of all the stakeholders hasto be given paramount importance. It is vital toinculcate appropriate food habits right from childhoodand dissipating information through schools could bea welcome step. We, as a nation, do not have shortageof food today, but sadly people are not able to makethe right choice. We have made our gadgets smart,without which also we can survive, but it’s high timenow that we make our diets also ‘SMART’.
ReferencesDeaton A. and Dreze, J. (2009) Nutrition in India: Facts
and interpretations. Economic and Political Weekly,44(7):42-65.
ICN (International Conference on Nutrition) (1992) HumanNutrition in the Developing World. FAO CorporateDocument Repository. Available at: http://www.fao.org/docrep/w0073e/w0073e03.htm
Li, Nicholas and Eli, Shari (2010) In Search of India’sMissing Calories: Energy Requirements and CalorieConsumption, downloaded from http://emlab.berkeley.edu/~webfac/emiguel/e271_f10/Li.pdf
Macroscan (2003) The Calorie Consumption Puzzle. TheEconomic Research Foundation, New Delhi. February 11.
Mittal, S. (2007) What affects changes in cerealconsumption? Economic and Political Weekly,42(5):444-447.
NIN (National Institute of Nutrition) (2011) DietaryGuidelines for Indians – A Manual, Indian Council ofMedical Research, Hyderabad.
Ramachandran, Prema (2008) Changing food consumptionpattern in India. Bulletin of the Nutrition Foundationof India, 29 (2):1-5.
Rao, C.H.H. (2000) What affects changes in cerealconsumption? Economic and Political Weekly, 35(4):201-206.
Ray, R. (2007) Changes in food consumption and theimplications for food security and undernourishment:India in the 1990s. Development and Change 38(2):321-343.
Ray, R. and Lancaster, G. (2005) On setting the poverty linebased on estimated nutrient prices: condition of sociallydisadvantaged groups during the reform period,Economic and Political Weekly, 40(1): 46-56.
Shimokawa, Satoru (2012) When does dietary knowledgematter to obesity and overweight prevention? FoodPolicy, 38 (1): 35-46.
World Bank (2011) An Urgent Call for Action:Undernourished Children of South Asia. Available at:<http://www.worldbank.org/poverty/>
Meena et al. : Great Indian Food Paradox: Trends and Patterns 41
Annexure I
Energy and nutrients
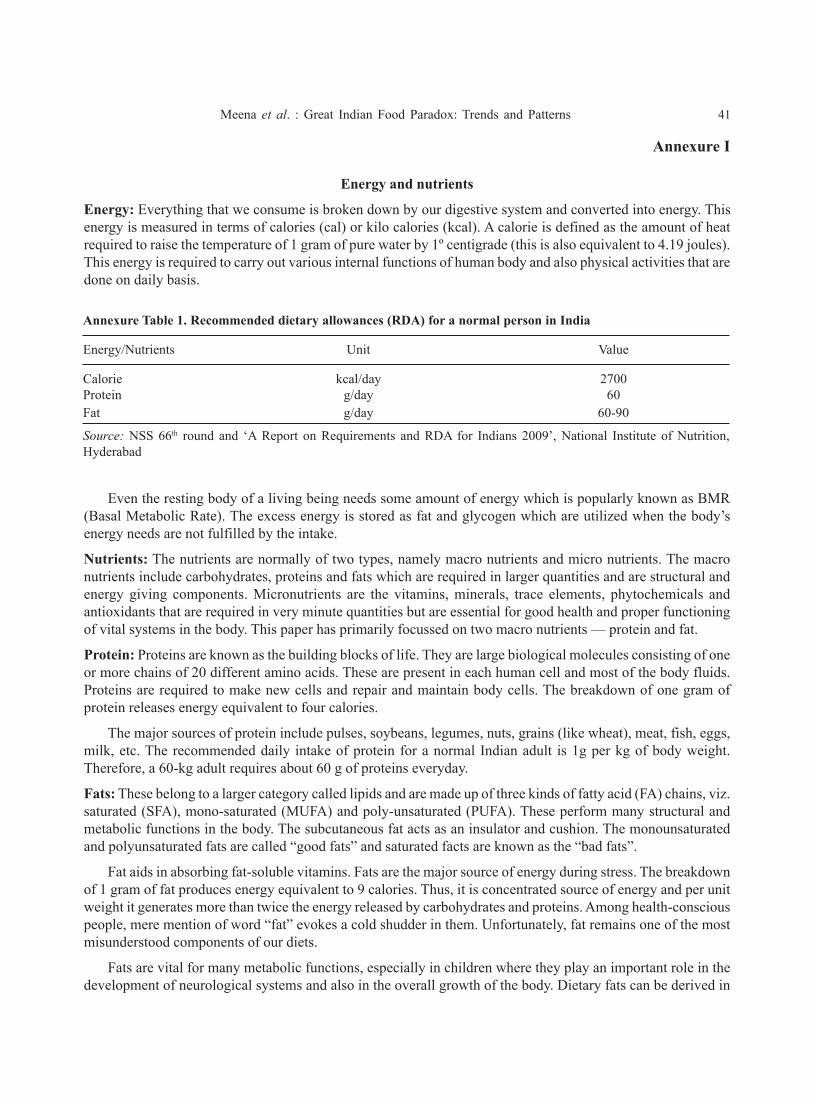
Energy: Everything that we consume is broken down by our digestive system and converted into energy. Thisenergy is measured in terms of calories (cal) or kilo calories (kcal). A calorie is defined as the amount of heatrequired to raise the temperature of 1 gram of pure water by 1º centigrade (this is also equivalent to 4.19 joules).This energy is required to carry out various internal functions of human body and also physical activities that aredone on daily basis.
Annexure Table 1. Recommended dietary allowances (RDA) for a normal person in India
Energy/Nutrients Unit Value
Calorie kcal/day 2700Protein g/day 60Fat g/day 60-90
Source: NSS 66th round and ‘A Report on Requirements and RDA for Indians 2009’, National Institute of Nutrition,Hyderabad
Even the resting body of a living being needs some amount of energy which is popularly known as BMR(Basal Metabolic Rate). The excess energy is stored as fat and glycogen which are utilized when the body’senergy needs are not fulfilled by the intake.
Nutrients: The nutrients are normally of two types, namely macro nutrients and micro nutrients. The macronutrients include carbohydrates, proteins and fats which are required in larger quantities and are structural andenergy giving components. Micronutrients are the vitamins, minerals, trace elements, phytochemicals andantioxidants that are required in very minute quantities but are essential for good health and proper functioningof vital systems in the body. This paper has primarily focussed on two macro nutrients — protein and fat.
Protein: Proteins are known as the building blocks of life. They are large biological molecules consisting of oneor more chains of 20 different amino acids. These are present in each human cell and most of the body fluids.Proteins are required to make new cells and repair and maintain body cells. The breakdown of one gram ofprotein releases energy equivalent to four calories.
The major sources of protein include pulses, soybeans, legumes, nuts, grains (like wheat), meat, fish, eggs,milk, etc. The recommended daily intake of protein for a normal Indian adult is 1g per kg of body weight.Therefore, a 60-kg adult requires about 60 g of proteins everyday.
Fats: These belong to a larger category called lipids and are made up of three kinds of fatty acid (FA) chains, viz.saturated (SFA), mono-saturated (MUFA) and poly-unsaturated (PUFA). These perform many structural andmetabolic functions in the body. The subcutaneous fat acts as an insulator and cushion. The monounsaturatedand polyunsaturated fats are called “good fats” and saturated facts are known as the “bad fats”.
Fat aids in absorbing fat-soluble vitamins. Fats are the major source of energy during stress. The breakdownof 1 gram of fat produces energy equivalent to 9 calories. Thus, it is concentrated source of energy and per unitweight it generates more than twice the energy released by carbohydrates and proteins. Among health-consciouspeople, mere mention of word “fat” evokes a cold shudder in them. Unfortunately, fat remains one of the mostmisunderstood components of our diets.
Fats are vital for many metabolic functions, especially in children where they play an important role in thedevelopment of neurological systems and also in the overall growth of the body. Dietary fats can be derived in

42 Agricultural Economics Research Review Vol. 29 (Conference Number) 2016
the form of visible fats such as vegetable oils, vanaspati, ghee, butter and invisible fats which are present as anintegral component of various foods. The food from animal sources and processed foods are rich in invisible fats.The small amounts of invisible fats add up to a significant level in our daily diet – about 15 g in rural populationand 30 g among urban middle and high income groups (NIN, 2011).
The recommended total fat (visible + invisible) intake should be around 20-30 per cent of the total calories.Therefore, for a healthy Indian adult of 60-kg body weight it works out to be 60-90 grams of fat every day.