Govt V.Y.T. PG Autonomous College, Durg(C.G.) Gender Audit
24
Govt V.Y.T. PG Autonomous Coll ege, Durg(C.G.) CPE Phase-lll, DBT-Star College Ph. /Fax: 0788-2359688, Website: www.sovtsciencecoll egedurg.ac.in Gender Audit The Gender Audit recommends ways ofaddressing gender gaps by suggesting possible improvements and innovations. It strives to document good practices and ensures whether the college fbllows the govt rules, implement policies and execute them to achieve gender equality. The Getrd€r Audit slso h€lps to ideDti$ strengths and weaktresses while promoting general equality isrues. A geDder audit is a tool to assess ifgender equality has been institutionalized in an organization It assesses ifgender concems have been mains[eamed in the institution's policies, structures, processes, activities and provision ofsewices, and budgets. A gender audit interrogates the organizational culfure which, consciously or unconsciously discriminate against women in the system, whether they are faculty, administration and support staff or students l) To evaluate ifgender concems are mains(eamed in all areas ofthe College's activities. 2) To identiry areas where imbalance exists in mainstreaming the concems ofwomen 3 ) To identify equity measures that can lead to gender equalityie Bridging tle gender gap if any. 4) To address both men and women, girls and youth in gender-responsive interventions foste ng gender equality is all aspects. 5) To recommerld ideas to implement in the future strategy ofthe College The VYTPG College was accorded 'A+' status by NAAC in 2017, recognized as a college with potential fbr excellence by UGC, and recognized as a 'Star College' by DBT , lndia. The college is recogniz-ed as College with Potential for Excellence under (CPE )Phase Ill by UGC , New Delhi and had been declared as the Centrc for Excellence itr Scieoce bv the Gofi. of Dlrg (c G.) o 9i Au G 2 o ,r,EE*- i!:rxl. \,. i- l.i-.\, -. J. -:.r.' ilou--! e,ldiiye, gsig tt"a$l
-
Upload
khangminh22 -
Category
Documents
-
view
1 -
download
0
Transcript of Govt V.Y.T. PG Autonomous College, Durg(C.G.) Gender Audit

Govt V.Y.T. PG Autonomous College, Durg(C.G.)CPE Phase-lll, DBT-Star College
Ph. /Fax: 0788-2359688,Website: www.sovtsciencecoll egedurg.ac.in
Gender Audit
The Gender Audit recommends ways ofaddressing gender gaps by suggesting possibleimprovements and innovations. It strives to document good practices and ensures whether thecollege fbllows the govt rules, implement policies and execute them to achieve gender equality.The Getrd€r Audit slso h€lps to ideDti$ strengths and weaktresses while promoting generalequality isrues.
A geDder audit is a tool to assess ifgender equality has been institutionalized in an organizationIt assesses ifgender concems have been mains[eamed in the institution's policies, structures,processes, activities and provision ofsewices, and budgets. A gender audit interrogates theorganizational culfure which, consciously or unconsciously discriminate against women in thesystem, whether they are faculty, administration and support staff or students
l) To evaluate ifgender concems are mains(eamed in all areas ofthe College's activities.2) To identiry areas where imbalance exists in mainstreaming the concems ofwomen3 ) To identify equity measures that can lead to gender equalityie Bridging tle gender gap if
any.4) To address both men and women, girls and youth in gender-responsive interventions
foste ng gender equality is all aspects.
5) To recommerld ideas to implement in the future strategy ofthe College
The VYTPG College was accorded 'A+' status by NAAC in 2017, recognized as a college withpotential fbr excellence by UGC, and recognized as a 'Star College' by DBT , lndia. The collegeis recogniz-ed as College with Potential for Excellence under (CPE )Phase Ill by UGC , NewDelhi and had been declared as the Centrc for Excellence itr Scieoce bv the Gofi. of
Dlrg(c G.) o
9i
AuG
2o
,r,EE*-i!:rxl. \,. i- l.i-.\, -. J. -:.r.' ilou--!
e,ldiiye, gsig tt"a$l

Chhattisgarh. lts mission is to provide qualiry education to all by means ofhard work dedicationand devotion to all students inespective ofclass, caste and gender and religious faitl Over theyears the college has grown adding flew subjecs and scaling new heights in terms ofqualityeducation. As dre only A+ college ofChhattisgarh it holds the unique disrinction of being Lhe
lead college ofthe region. The total student stlenglh this session is nearll, 7000 in which thereare more number ofgirls.Each year since 2016 there has been a rise in the number ofgirlstudents. It has 23 departments and is a research centre I6 subjects where the number ofwomenresearch scholars is more than nren. The college has its o$r setup to check theinstitutionalization ofgender equality present in the policies, programmes, structures andservices provided to all stakeholders. The last gender audit was done by the college for $eperiod 201 l-?016. This report of V.Y.T.P.G Autonomous College for the period 2016-202 I isthe report ofan intemal gender audit.
The leam comprises oflhe follorving rnembers:
Coodinator, IQACCoordinator UGCConvenor- Equal Opportunity CellPresidenL Chhattisgafi Educational Research and
Welfare Society5. Dr Somali Gupta6. Dr. J.P Sao
7. Dr. S.D. Deshmulh
: Every 4- 5 years
All facilities ofthe college are comDron to both gerders lor e,g. Security measures,Parking lot, Study rooms, Canteetr , Medical checkups, etc.Fo the following, separate
provision has been made lbr women a,rd girls:
l. Separate washrooms lbr women t'aculty and girls, with Sanitary napkin vending machifle.incinerator and raaste bins lbr sanitary products.
2. Girls common room with dressing room and reading /rest room facilities.3. Medical check-up facilities fbr gi.ls.4. Access for women admin stalJto ticulty colunon room.5. Adequate lighting on the campus, irr corridors and classrooms, common areas, toilets.6. Display of POSH Policy and Complaint Mechanism on lnfomation Boards.
(,
L Dr Jagjeet Kaur Saluja2. Dr Anupama Asthana3. Dr Qamar Talat4. vinita Vaishnav
qcum(c G.)
Cr.
o*@ qr$t-If,.".,,,.-,,.
!-d:iega UU,rl ,C - , --"

7. Mandatory awareness programs on gender held every year for all students, faculty,
administrative and support stat'fat stad olthe academic year and onc€ during the year as
part ofthe orientation. It includes legai dghts, understanding ofgender, responsibilities ofmer and youth in relation to opposite gender, POSH Act, reproductive health awareness
8. Adequate security arrangements and personn€l in campus and common areas daylnight
9. CCTV cameras are placed at sensitive points within the campus especially in the library,
neaa lhe main gate, parking lol, corridors.
10. Women's Cell set up to review POSH Policy. grievance redressal for women, gender
orientation trainiflg for all students
11. Self-defence tmining, health awareness and talks for women and girls thrcughout the
year.
I ndicators l'o r Ct'ndel Autlit
. Gender-ratio oftotal studeflt population
r Gender ratio of faculty population (permanent/Regularo
. Gender-disaggregated data and ratio ofguest faculty invited to take sessions
r Gender disaggregation ofstudent population (various academic levels UG, PG, Ph D)
. Gender disag$egated data ofresearch proposals fiom faculty received/accepted, fiom
students received/accePted. Cender disag$egation ofteam evaluating research studies, viva voce, etc.(DRC
Committee). Gender balance in intersectional pe$pecrive (students who ate SC/ST, OBC, minorities)
. Gender profile in Arts/Science/Commerce disciplines
. Gender disaggegation ofAwards and prizes rcceived academic and extracurdcular
activities.. Inclusion ofgeflder in curriculum and syllabus of General subjects such as Geneml
Englishlangrlge, Hindi Language,(Photocopies ofthe list ofcontrnts of 1"ryear, 2nd Year
& 3'd Year English language course books)
. Composition of ICC Committee to deal with sexual harassment
. Wrilen Gender Polic) for the insliltltion
. Number ofgender sensitization/Gender equity progmms/workshops for studeDts and
faculty in a year.
. Genderiisaggregation in NSS volunteers.
. Cender representation in Student Council
. Gender-disaggregated data on Student participation in Sports/Cultu@l activities .
. Trained certified woman Counsellor available to counsel faculty arrd students'
c
i oOrrril(c c)
Nul.a( I

Govt. V.Y.T. PG Autonomous College
Durg, (C.G.)
Gender Disaggregated Data
CPE Phase-lll, DBT-Star CollegePh./Fax: 0788-2359688,
Website: www.sovtscienceco llesed u rq.ac.in
(-AutoGa -..-/
\jOUL V- I. r -r. u,,1-!'.Il,,j:i l.J.i6
HlfrueEC&)Durg(c G)
o.:
o

G8T.Pil T
Students strength Frcm 2016-2021
Student strength UG (20L6-2021)
a
7000
6000
5000
1000
20ocr
r00t)
> The graph 1. shows year wise (2016-2021) the strength of male and femalestudents and the total number of admissions inclusive of all categories and inall the streams , lt indicates that the number of students increased in everynew session but there is steep increase in the numbet in lhe yeat 2020-2021 .
. The tolal number of boys students were slightly more in the tour session from2016 to 2020 but girls admission outnumbered boys in this current session.
-Girts
2016 2017
1935
1903
3838
20L7 2014
7129
1956
4085
207A'2019
2396
2203
4599
2019 2020
2421
2338
4165
2020 2021
2467
2917
5844
Durg(c.G)
AUI(,a
;\.2J
Fa'nclpa,&E[ W-tf G,Autonomor$
(&).tr.'.ga Crrg (c.G )

s8.tPH 2
Catcgorl'wisc Girl's strength in Undergraduate studies from 2016-2021
,.LI .L.l rl..
35oO
1000
2500
2000
1500
1000
500
0
ro8c
rST
II .I20t6 7477
574
)s6
892
176
1902
2017 2018
448
1004
2ta
246
1956
2018 2019
509
I ll0741
320
2)41
2019 2020
237
1197
2s3
350
1031
2420 242!
617
1561
147
400
2914
This graph shows ycar wisc (2016-2021) thc strcngth of fetnaie studetrts ir1 all categories
taken adnrission in different streams- It indicates that the number ol'students il]creased inevery new session but there is steep increase in the number in the year 2020-2021
) The number girls students liom general category is more or less remained same
except in the session 2019-2020 which recorded their downfall in thc admission.) ln case of OBC, the trends show rising in their numbers since 2016 to 2020 that is
from 256 nunrber to 1561. This shows the interest in seeking admission in our college
and the awareness by the girls of this category.
) Total number of students ftom ST category are increasing considerably in every
session .
> The total number ofgirls studens ofthe SC category showed decrease in the numtrer
frorl:, 2017 to 2021 as compared to 2016 when there slrength was 892 and in thiscurre[t session is 400.
Dur0(c.G.)
t->
a
o !:.tu{i. !: i. t.:' .-j,, .i.,(aii'rr:: - 1:{'
€**si asig ts.GJ
L]
(

GR.APU 3
Categorl'wise Boy's strength in [Indergraduate studies
3500
1000
2r00
2000
1500
1000
,LI2020 zazl
t::
,l-.8,LI,J.l .[.50rl
0
!oBcrsC
asT
2016 2017
467
188
7019
206
1935
2017 2018
llt1135
212
21t\
2019 2020
1400
274
300
2422
461
1400
254
271
2192
620
1485
348
408
2861
This graph shows year rvise (2016-2021) the strength of male studcnts in all categories
taken admission in different streams. It indicates that the number of students increased
from 193-5 to 2861 .
> The number of boys students from gcneral catcgory is more or less remaincd same
during the session 2016-2017.2018-2019, ZOl9-2020, but dccrcased in the scssion
2017-2018, but this session the graph shou,s maximum number of admission as
compared to last ft)ur yea6.> In case of OBC, the trends shows rjsing in theil numbers since 2016 to 2021 that is
from I 88 number to 1485.
> Total number of students from ST category are increasing considerably in eve4year.
> The total number of boys students ofthe SC categoty showed decrease in the flumberAom 2017 to 2021 as compared to 2016 *hen there stretrgth wasl079 and in thissession their strength is 348
bcu(g(c.G)
\uto.J_
oa
:{ i,, " :

QRi.PII 4
Percentrge of Cender str€ngth in UC
2020-202L 2079-2020
20L8-2019 zo77-2018
2016-20L7
Thc graph 4 is showing the ratio of strength of boys and girl's students of the fiveycars Aom2016 to 2021 in undergraduate classcs. The graph indicates the number of boys studeffsoutnumbered girls in th€ year 2016 to 2020.
> ln this curent session, the number ofgirls students outnumbered boys' sfudelts.i The number of girls sludents number was lowesl in lhe session 2017 to 2019 but
increased by almost 2olo in the session 2020.
(,
'iold- V f t.Pu.Aulcnr,ii;L:sebrBaugE-GJ
(C LarD'lrg
c
7
a
;
> In the ycar 2016-2017 thc diffcrcnce was less than l9lo
@@@@
@@ l*il @
@@
G8.fr.PH 5
Category wise Girls strength in PG
350
154
200
150
50
100
0 il I I llr CateSorywrse Eirls strergth in PG
!Categorywise girls strength ln PG
.Cate8orywEe Eirle nre.6th in PG
rCategorywise gtls nrength in PG
2016-l7
190
72
227
66
201?-18
110
206
96
201819
77?
100
66
96
2019-20
165
331
114
2n10-27
T2
241
86
72
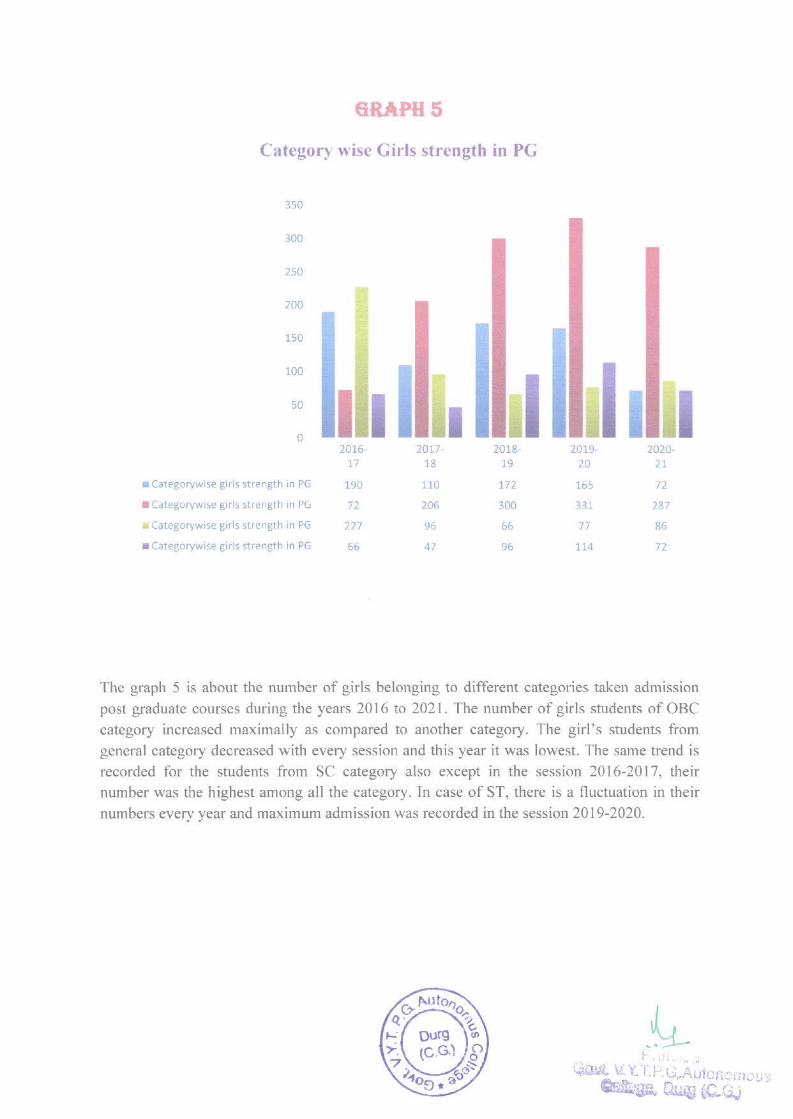
The graph 5 is about the number of girls belonging to diflerent categories taken admission
post gaduate courses duriog the years 2016 to 2021. The number ofgirls students of OBCcategory increased maximally as compared to another category. The girl's students fromgeneral category decreascd with every session and this year it was lowest. The same trend isrecorded for the students from SC category also excepl in the session 2016-2017, theirnumber was the highest among all the category. In case of ST, there is a fluctuation in theirnumbers every year and maximum admission was recorded in the session 2019-2020.
I[,t r
Drrrg(c G)
a
;
Cr.Nll
a$S, \lY-l.l: G.Autoc-"- ,",.&ess, ftu{tdcJ- '

sR.il.PIt 6
Category" wis€ Boy's strength in PG
100
250
200
r50
100
roBc
I5T
IT il50 llr ltI2017 2018
118
216
95
a7
2018 2019
214
6l
.Gen IOBC bSC lsl
2419-1010
62
27a
61
2024-2421
241
86
12
The graph 6 is showing the number ofboys belonging to different categories taken admission
in the post graduate couses durjng the years 2016 lo 2021. The number of boys students
belonging to OBC category increased drastically dttring last five years as compared toanother category. The boys students from general category showing decreasing pamenr.
lox'est in the session 2019-2020 and highest in 2016-2017. ]'he same tend is recorded for thc
students from SC category also except in the session 2016-2017 when their number was the
highest among all the category. ln case of S'1. there is a fluctuation in their numbem every
year and maximum admission was recorded in dre session 2017-2018 and lo$'est in the
session 2019-2020.
(c G)DUTS
q.
Fi.
C,,AU
G$$. .t r:-,.!' -..A.:3',,r.,,,-'Lr!gr*irEsi 0erg 8Q-G.)
0 tl
t\ )
L

GRAPU 7
(ienrltr ratio in PU
1A
60
5A
40
l0
20
r0
02016-2077
11-57
67.44
2017-2014
50.2
498
20:18 2019
4115
58 8s
2019,2020
40.1
59.3
2020-2021
40,27
59.73
The gaph 7 is showing the strength of boys and girls studcnts'percentage. The number ofgirls studerts is increased as compared to boy students in pursuing post graduate studies. The
number ofboys was recorded highest in the year 2017-2018 and lowest in the sessioo 2016-
2017. ht 2Dl6-2017 the enrollment of girl's students was recorded highest and lowest in2017-2018. lhc data indicates wide gap betwcen boys and girls students seeking post
gnaduate sfudies.
?,
oat \_,
(iitt1. ',.1-i1i--i- ..,..,r,, ,',, ,,,.-.-t^i{}rJi{ :'r1rS ti.,,.rJ
(c.G)Durg

e8.*.PH IGender liatio in NSS
Chart Title180
160
140
120
100
80
60
4A
20
0
aEoys 112
1I4
2018 2019 2AI9 2024
Gender Batio ln NSS
16S tl4164 774
2017.?018 1010 2A27
110
115
The enrollment of girls and boys students in NSS was shown in graph 8. The number ofboysis more than girls except ln the year 2017-18 where 50.4402 of girls wcre cnrolled. ln the
session 2019-2020, equal numher ol'girls and boys pa(icipated and in the session 2016-17
or y 40olo girls students enrolled in NSS.
Ir\ nourg(c G)
Cr7
'9.X,J
a.F
liiE6:e" t{.?. r .a ,:. ,.-. ir . ir: r rr: i ..r,Js
&bgit &,e io",,.r

GSAPU 9
Gender Ratio in \CC
120
100
80
60
40
2A
02017 2018
106
51
2018 201! 2419-?A2A
Gender Ralio. n NCC
106 106
sl 53
)0)4.7021
106
53
The above graph shows the tiend in the enrollment of boys and girls in NCC. The $aphshows that boys oumumbered girls in every session. In the session 2016-2017 the gap was
nanow but with the girls number remained conslant at 53 only but boys enrollment increased
from 56 in the session 2017-2ll'l ro 106 in the last four session.
Oulg(c.G)
Au
i
f"*$a [,:,j if.;
I
,ila
t

GRT.PH 10
Gender Ratio in lndian Youth Red Cross Society
lndian Youth Red Cross Society140
120
100
80
60
4A
20
0 rrf II I I I2017 18
23
46
2018 1S
50
80
130
2019.20
48
76
202G21
48
76
L24
2075 77
5Z
32
a4
2021 22
14
aGlrls.BoV! r Iotal
The above graph shows the trend in the enrollment ofboys and girls il1 lndiar Youth Red
Cross Society. The trend shows a moderate to increasing participarion from girls tfuoughout
th€ years. ln stark contrast the enro[nent ofbol,s has decreased in the recent years fiom an alltime high in 2018-19. The total panicipation shows decrease in eruolment aftcr a sudden
surge in 2018-I9.
ourg(c G)
Fut
og"
oqt7
W,**l.u; *'
r
tll I

GEAPH IIGender Ratio in Sports
300
250
200
r50
100
50
02076-77
168
92
260
2071-74
165
234
201819
177
73
244
2019-20
177
94
271
2020-2021-
0
The participation ol'lhe boys are considerably more in sports as compared to girls. The graph
l0 clearly shows that thc participation of boys ilcreased \4ith years. The girls paniciparionalso increased in the year 2019-2020 as comparcd to 201 7 to 2019 rvhich recorded fall in the
number. Due to advent ol COVID- l 9 , the college remained closed for the studelts so sports
rclated activities was not organizedduring the session 2020-2021 .
AU
Durg(c G)
a
i. I'iir'i :'tfi3I{ v,y.T. ir. ii..Airlo r.:r rrro t! 5
e$l&OIe&si
l
I I
a

G8.[PH 12
Cender Ratio in Ph-D. Proqram:
Chart Title30
25
2A
15
10
5
0 rrllr fiild rl ll II .ll ..ilhM Lro Polli
Bd'" .hFni aonr alel ( Iro,o 6"oio a"oer ts.nd, t,ro.r,,n.,,"i", *. "t \o.o zoojo!
e! ,r., Le r^ 1'(r s! auhr .r:". %r v
3
5
10
1a
9
186l 15
14
17 161910
11
11
4138 1l
11 73
T}is guph shows the enrollment of research scholars liom 2016 to 2021. The percentage ofgirls is 6l% and boys is 3970. In Geology and Microbiology Department there is no hoys
students. Only in Zoology depaflment the number ofboys are more than girls. Rest in most ofthe depanments the girls enrollment is more as compared to boys.
uNu
at:
39%
Orrrgrc G)
9:,,
o ...-
.,,. rrdlr. i-t[ g- i,
F*'

r_2000
1000t)
6000
200cr
a
r5eresl 11071
crl5 (UG) Boys{llc)
GRAPH 13
C;erder r',rtio in t C, PC &Ph.l). Progrxm f'ronr 2lll6-2(l2l
11725
11071
2852
175
-
!24
-6i.lt(Pc)28\2 7247 175 1?4
,(,
2
(c.G)t)rlrg
Aul0.a
**o*.it*o**- 't

500
600
400
300
100
100
ASAPII I4(icndcr Ratio in Cultural Activities organized from 2016-2021
I02076-2011
191
400
t017-2018
\67
439
2018 2019
98
466
2019 2420
727
482
2020-1021
5la4
Chart Title
rGirls
t'he Sraph shows that the girls far out number the boys in cultural activitics which includes
dramalics. solo and group songs and dance, anchoring aDd other cultural activities. Total girlsparticipation in last five years increased as compared to boys.
I{1..\_-, ,(CL l
wIgo
7
AU
e
;
&&s:" i,,lrJi3$l-..J
L
lzex
| 251$

GRAPII 15
Gcmlcr Ratio in Sludent Council (President. Vice-President. Secretary,&jointSecretary) fiorn 2016-2021
Total number of Boys and Girls
l53
?52
151
0.5
0
.Grrls
2D77 ZOTa
1
l
2018-2019
0
2019.2020
1
l
2016.2017
1
aGirls
The Sraph ofthe sludcnt colmcil is a clear indication that thc girls of the institrition are much
ahead in academics and leadership roles. They have bcen holding 69% of the seats in the
student councilwhich is because oftheir high marks in academics.
J\"-.2./
*'SJ*i&;uili:';
Boys
lr%
Girls59%
ourg(c G)
F
.2
(r.. NU
I1
\

c8r.PH r6Gender Ratio in Regular Staff
Gender Ratio Among Teaching Staff (2018-2019)9
8
1
6
5
3
2
1
0 II' il Il '1",t
,T ilt Ir,'l ,1,,,,l---Po[l--Ant
Hin Ene sdn i(rl Hin. : Ph\ hro: .o Eraooloe holo mBl
BY
Colnlo
Mrc I ot Mat rmarob Bot Zool ech Geohemtlonool any ogy nololoey atic Te.ocy gy s hnol
ogY
0111231411176140200000
40I2217t01502803131)1481
1
1
t
M.le4L%
(cG)Durg
aa
,.-/ibL lf,dT-F$.--1..-.....
e,rlqffi,ElJi]Gc,,
t;"."hI sg*

t4
t2
10
8
6
2
0
Gender Ratio Among Teaching staff (2019-2020)
Ill.rrr,r,ll.,.ll,,,r
rFEm:le 2 8 0,1 2 31114 A
aMale 4 0 I 2 2 1 I I 0 2 !
HNENB
phy Cy Scie logv
Ant mp Mic Biot Matrma Co
hro ute rob Bot Zoo ech Geo he tion mmpol r oiol a.v loey nol logvmatT€c ercoBy Scie o6y oEy ics hno e
ocv
10167742000203102314
Eco
000111
Frrl(,.- )-
qui*,lLhs*"o
@F*
O$tq(c G)
a

Gender Ratio Among Teaching Staff 2020-2021
9
8
6
5
l2
1
0 It ll I ril, t[,1,,,,lf ili *,
to Geosoc t ca a,., Psy ph, che
! phv BY s.re o8ry iry
co rntoAnt mp Mic Biol Mnlrma cohro ute rob aot 2oo e.h6eo he tonmmpol r oiol aDv oey nollogymat Te. er(ogv s.le ogy ogv ics hno e
logv
01211110 2 s O 20310? 2 I11117 0 31312 2 4 8 7 A 24 7 0 0 210 0 0 0 0
The graph I I and tables arc about the number of regular teaching staff in different
departments. I'he number of female staff is more than male stall Some departmenls like
English, Psychologv and Microbiology having only female teaching slaff wheteas
depaatments like Commerce, Sports. Lib€ry. Ceology, Computer science and Law is havi[gmale staffl Some departments havc more female staffand rvhile in Biotechnology depaftment
has equal number of male and female staff.Overall, ln the last five years the number oIfenrale teaching staff enormously increased.
,U
4t,
59%
c),'J
htl
aOurqI
4
- - _-..!,j,ciO.rl|{[. v.Y. I.PG,.AulrnomousCATgge. DUg TGGJ
hl
\

68APII 1?
Gender Ratio in Non-Teaching Staff
12
l0
8
6
?
02016 2019
l)2019.2020
11
5
2020 2021
11
Chart Title
The Graph I 3 is indicating the gender ratio of Class 3 Staff from 2018 to 2021. The numberof female staffis almost halfthe number ofthe male staff. In 2020-202lthe number of tbmale
staffdecreased as cotrpared to previous years and male staff decreased as compared to 2018-2019.
q.
I cxns(c Gj
A\.t
tl
h*--
FGI
\\
I

Govt V.Y.T. PG Autonomous College, Durg (C.G.)
REPORT
Externalcender Audit Team
It may be concluded that in each field girls have proved to be ahead of boys specially inthose areas which require mental, intellectual and creative capacities.
The enrolment of girls from all section ofsociety is increasing and there is no gender
issues complaints.
The analysis shows that gender equity goals and objective are included in all the policies,progmmmes of the college and staff also reFrrted that they have no problems related togender criterion.Gender equality and gender sens:tivity amongst students is encouraged by Women-s
Cell, VishakhaSamti. and Equal Opportuniry cell by organisingvarious programmes each
year.
Nlembers ofthe External Auditing C-ommittee
Name Designation Signature
N4^.1 RAf n2
3
' l<.P--) 1b
,a,r-\ h-q-[ h-a (Tcr' i A, 11 .(a' r l(
PA((
b" P","$.collC1 )
o+aC
R*.,Pu t
1)
Observations:
. The number ofgirls enrolled sircc 2016 shows an increase .
. In post graduate coulses the percentage ofgirls is more than boys.
. ln the Co Curricular and Ertracurricular activities more number of girls participate
. The academic rcsults show that pass p€rcentage ofgirls is more than boys
. Currently more number of girls are engaged wirh research in this centle.
. Tlte are more number ofuomen faculty members than men.
. The percentage of merit positions show that girls are more meritorious than boys.
Suggestions:
. lncrease the number ofprograms that would promote entrepreneurship amongst the gir1s.. Encofage the participation of more number of girls in the spnrts activities.. Inffoduce more self-emplopent tainings for girls from remote villages.. Girls hostels may be increased as there are many girls from villages and states.
Cooclusion:
ordarr)