GOVERNMENT OF NATIONAL CAPITAL TERRITORY OF ...
140
GOVERNMENT OF NATIONAL CAPITAL TERRITORY OF DELHI DIRECTORATE OF ECONOMICS & STATISTICS, 3 RD FLOOR, B-WING, VIKAS BHAWAN-II, CIVIL LINES, DELHI – 110054 Website:WWW.delhi.gov.in
-
Upload
khangminh22 -
Category
Documents
-
view
0 -
download
0
Transcript of GOVERNMENT OF NATIONAL CAPITAL TERRITORY OF ...

GGOOVVEERRNNMMEENNTT OOFF NNAATTIIOONNAALL CCAAPPIITTAALL TTEERRRRIITTOORRYY OOFF DDEELLHHII
DIRECTORATE OF ECONOMICS & STATISTICS,
3RD FLOOR, B-WING, VIKAS BHAWAN-II, CIVIL LINES, DELHI – 110054 Website:WWW.delhi.gov.in

PREFACE
In the recent past emphasis on empowerment of women has gained prominence with the increasing awareness of the need and has been recognized as the key factor for bringing about improvements in the status of women and to secure equality among men and women in society, in order to understand and tackle gender issue positively, it is necessary to have an idea about men and women on various aspects. This publication “Women and Men in Delhi – 2010” is an effort towards this end.
The present publication “Women and Men in Delhi – 2010” is first of it kinds is brought out by the Directorate of Economics & Statistics, Delhi. This
compilation provides valuable statistical data on different prominent gender indicators like Population, Health, Economics Status, Education, Employment Crime against Women and Empowerment of Women reflecting the status of both men and women. The publication is presented in seven sections and efforts have been made to include up-to-date and reliable data on the topics. This has been possible with the willingness and cooperation of the data source agencies.
The publication has been prepared under the guidance of Shri N.T. Krishna, Deputy Director and has been prepared by SH. D.B.Gupta, Assistant
Director, Smt. Charnajeet Kaur, Assistant Director, and assisted by Smt. Urmila Bhalla, Statistical Assistant, Miss Sunita Mehta, Statistical Assistant, Miss Neetu Bharti, Statistical Assistant to prepare the manuscripts. The untiring efforts made by Shri M. W. Deshkar, Statistical Assistant, Shri Ritesh Kumar, DEO, in the preparation of tables and graphs deserves commendation. I hope the publication would meet the felt need of planners, policy makers, research workers, women welfare organization and academicians
working in the field of women empowerment. Comments/suggestions for further improvements in the content and quality of the publication would be
highly valued. Delhi DR. B.K. SHARMA
Date: JULY, 2011 DIRECTOR

TTEEAAMM
SSHH.. NN..TT.. KKRRIISSHHNNAA :: DDEEPPUUTTYY DDIIRREECCTTOORR
SSHH.. DD..BB.. GGUUPPTTAA :: AASSSSIISSTTAANNTT DDIIRREECCTTOORR
SSMMTT.. CCHHAARRAANNJJEEEETT KKAAUURR :: AASSSSIISSTTAANNTT DDIIRREECCTTOORR
SSMMTT.. UURRMMIILLAA BBHHAALLLLAA :: SSTTAATTIISSTTIICCAALL AASSSSIISSTTAANNTT
MMIISSSS.. SSUUNNIITTAA MMEEHHTTAA :: SSTTAATTIISSTTIICCAALL AASSSSIISSTTAANNTT
SSHH.. MM..WW.. DDEESSHHKKAARR :: SSTTAATTIISSTTIICCAALL AASSSSIISSTTAANNTT
MMIISSSS NNEEEETTUU BBHHAARRTTII :: SSTTAATTIISSTTIICCAALL AASSSSIISSTTAANNTT
SSHH.. RRIITTEESSHH KKUUMMAARR :: DDEEOO,, GGRRAADDEE--BB

Sl.No. Items Page Nos.
1 Introduction 1-8
2 Demographic Profile 9-20
3 Health & Family Welfare 21-68
4 Economic Status 69-77
5 Education 78-96
6 Employment & Unemployment 97-103
7 Crime 104-114
8 Women Empowerment 115-130
9 Concept and Definitions (Appendix) 131-134
1 Demographic Profile1.1 Sex wise population in Delhi According to population Census 10
1.2 Population in Delhi by Sex & Sector according to Population Census 11
1.3 Population of Female By Specific Age Group During Census Years 1971-2001 in Delhi 12
1.4 Female target groups in population (in million) of States/union Territories-2001 13
1.5 Female Population across State/UTs under census year 14
1.6 District-wise Population as per census year 1961 - 2011 in Delhi 15
1.7 Sex Ratio Year & Sector-wise in Delhi (Female per 1000 males) 16
1.8 Comparision of Sex ratio at birth among States/U.T for the year 2005 17
1.9 Share of Scheduled Caste Population to total Population of Delhi by Sector and Sexwise 18
1.10 Decennial Growth Rate of Population in Delhi 19
1.11 Sex Ratio (Females per 1,000 Males) of Total Population and aged 0-6 years, 1961-2011 20
2 Health and Family Welfare2.1 Sex-wise total number of birth in Delhi 23
2.2 Sex-wise Birth , Death and infant mortality rate in Delhi(CRS) 24
2.3 Birth Death & Infant Mortality Rate State / Union Territory wise 25
2.4 Infant live births & deaths In Delhi 26
2.5 Infant Death by Age and Sex - 2009, Delhi 27
2.6 Distribution of Infant Deaths in Delhi 28
2.7 Under Five Death Rates by Sex and Residence India and Bigger States, 2007 29
2.8 Death by Sex and Age, 1991-2009 in Delhi 30
2.9 Maternal Death Rate in Delhi 31
2.10 Maternal Mortality Ratio in states & Union Territory 32
2.11 Sector Wise Maternal Death by age in Delhi during 2009 33
2.12 Mother receving Antenatal and post Natal care in Delhi 34
2.13 Percentage of Mother receiving Antenatal care 35
2.14
Antenatal Care Indicators by StateAmong women with a live birth in the five years
preceding the survey, percentage who received different types of antenatal care (ANC)
during the pregnancy for their most recent live birth by state, India, 2005-06
36
2.15Maternal care indicators for births during the three years preceding the survey by
residence in India 37
2.16 Maternal care indicators by state 38
2.17 Family welfare programme users (by methods) in Delhi 39
2.18 Achievements of Family Welfare Programme State/U.T. 40
CONTENTS
STATISTICAL TABLES

2.19Effiective couple protection Rate (CPR) due to all methods as on 31st March - India &
States41
2.20Effective Couples Protection Rate (CPR) Due To All Methods As On 31st March, Delhi Vis-
Avis India42
2.21 Sex preference of women with two children living, wanting no more children (%) in Delhi 43
2.22 Sex preference of women with two children living, wanting no more children (%), 2006 44
2.23 Live birth Sector-wise by the type of attention at delivery in Delhi 45
2.24 Sectro-wise (total & %) Live birth by the type of attention at Delivery in Delhi 46
2.25 Institutional and Non-Institutional Birth in Derlhi 47
2.26 Safe Delivery and Assissted Delivery among Women, 2007-08 48
2.27 Live birth by age of Mother in Delhi 49
2.28 Percentage of women age 15-19 years who are already mother or are pregnant in Delhi 50
2.29 Incidence of Early Marriage, 2006 and Early Motherhood in India, 2001 51
2.30Decision making by ever married women aged 15-49 Years on own health care (%) 1998-
9952
2.31 Total Fertility Rate (15-49 Years female) 53
2.32 Percentage distribution of Births by Age of Mother in Delhi 54
2.33 Teenage pregnancy and motherhood by state 55
2.34 Anaemia among children & women in Delhi 56
2.35 Prevalence of anaemia among women-States 57
2.36 Prevalence Of Anaemia in children by State 58
2.37Anaemia among children 0-72 months 2002, and 6-35 months (Percentage), 2006 by
State59
2.38 Nutritional Status of children by State 60
2.39 Immunization 61
2.40 HIV prevalence in different population group in Delhi 62
2.41 District HIV Prevalence in Delhi - National HIV Sentinel Surveillance 2003-2006 62
2.42 HIV Prevalence at Sentinel Sites Delhi 1999-2004 63
2.43 HIV Prevalence at Sentinel Sites Delhi 2004 63
2.44 State wise HIV Prevalence among ANC and STD Clinic Attendees, 2003-2007 64
2.45 State wise HIV Prevalence among IDU, MSM & FSW, 2003-2006 65
2.46 State wise HIV Prevalence (%) among ANC, STD, IDU, MSM and FSW, 2007 66
2.47 State-wise Adult HIV Prevalence 67
2.48 State-wise percent distribution of HIV infections in 2006 by age group 68
3 Economic Status3.1 Workers & Non-workers by Gender according to Census year in Delhi 70
3.2Distribution of Main workers, Marginal workers and Total Workers by Gender according to
Census years in Delhi71
3.3 Work Participation Rate, Main and Marginal Workers by sex (Percentage), 1991 and 2001 72
3.4Percentage for total workers, Marginaql workers and non-workers to total population by
sex,1991 and 2001 in Delhi73
3.5Distribution Of No. Of Persons Usually Working In Agricultural Establishments
By Sex, Enterprise Type and Location in Delhi74
3.6Distribution of main workers, marginal workers and total workers by gender and sector of
Delhi according to 2001 census75
3.7 Distribution of Employment by gender and type of worker in Delhi 76
3.8 Distribution of Employment by Sex, Sector and Type of Establishments in Delhi 77
4 Education 4.1 Literacy Rate by Sex - 1931 - 2011 in Delhi according to Census years 79
4.2 Sex-wise Literacy rate Sector-wise accordig to 1991 & 2001 Census in Delhi 80
4.3 Literacy Rate - States and union Territories 81
4.4 Enrolment in Primary Secondary & Territiary in Delhi 82
4.5% Share of girls enrolment in Primary, Secondary and tertiary Educational Institution in
Delhi83

4.6Gross Enrolment Ratio(All Categories of students) in the age group 6-11, 11-14 and 14-18
years during 2007-08 as on 30-09-2007 (provisional)84
4.7 State/UT wise gross enrollment ratio in schools for general education (2006-07) 85
4.8 School Drop-out Rate in Classes (I-V), (I-VIII) and (I-X) in Delhi from 2004-05 to 2007-08 86
4.9 Drpout Rates in Classes (I-V), (I-VIII) and (i-X) for the year 2007-08 in India 87
4.10 Results Of Central Board Of Secondary Examination In Delhi & India 88
4.11 Higher Education Enrolment In Delhi 89
4.12 Number of Teachers by School Categories in Delhi 90
4.13Number of Teachers States & Union Territories wise in 2007-08 (Provisional) as on
30.09.200791
4.14Number of Teachers in Educational Institutions States & Union Territories wise
(By Stage of Institutions)92
4.15 Higher Education Teching Faculty in Delhi 93
4.16 Gender Parity Index - States & UT's 94
4.17 Gender Parity Index in Primary Enrolement (I-V) 95
4.18 School attendance ratio 96
5 Employment & Unemployment5.1 Employment & Unemployment In Delhi 98
5.2 Job seeker registered with employment exchange sex wise in Delhi 99
5.3Job Seekers Registered With Employment Exchanges By States And Union Territories Of
India100
5.4 Female Employees In Delhi 101
5.5 Group-wise female employees in Government of NCT of Delhi 102
5.6 Women employment in organised sector by State/Union Territories 103
6 Crime
6.1Head-wise % share of Crime Against Women in Delhi against All India and within Delhi
during 2003-2009105
6.2Head-wise Incidents of Crime Against Women in India & Delhi during 2003-2009 and
Percentage Variation in 2009 over 2008106
6.3 Proportion of Crime against Women (IPC) towards total IPC crimes in india 107
6.4 Age-Group-wise victims of incest ( Rape ) Cases During 2009 108
6.5 Incidence of crimes committed against women during-2009 111
6.6 Distribution of Suicidal deaths Categorised By Sex & Age Group-2008 (State, UTs - Wise) 114
7 Women Empowerment7.1 General Election to the Legislative Assembly in NCT of Delhi-2008 116
7.2General Election to the Legislative Assembly in NCT of Delhi-2008 No. of Contesting
Candidates-Male/Female Break up119
7.3 Party-wise Performance of Women Candidates in Assembly Elections-2008 120
7.4Constituency- Wise Male, Female And Service Electors - General Lok Sabha Election -
2009 In Delhi121
7.5 No. of Persons Contesting In General Lok Sabha Election 2009 In Delhi 122
7.6 List of Successful Candidates In General Lok Sabha Election - 2009 In Delhi 123
7.7Party-wise Performance of Women Candidates in General lok Sabha elections-2009 in
Delhi124
7.8 Number of persons contesting and elected in various general elections 125
7.9 Performance of Women Candidates in General Eelction in States/UTs - 2004 126
7.10 Number of electors and percentage voting in various general elections 127
7.11 Women's participation in polls in States/UTs - 2004 128
7.12 Party-wise Performance of Women Candidates in General Elections-2004 129
7.13 Women's autonomy (States/Uts) 130

1
INTRODUCTION
Over the last few decades, there has come about a great awareness,
particularly in the developed countries including India, of the fact that gender discriminatory practices are neither conducive to the development process nor
to the stature of women. The current decade has witnessed some very
important developments in the women’s onwards march towards equality with men and it is increasingly acknowledged that each is the complement of the
other in the Indian Society. In the recent past the focus has decisively shifted from welfare of women to empowerment of women, which has been
recognized as the key factor for brining about improvements in the status of women. The various constitutional, legislative and other administrative
measures in this direction are briefly mentioned below:
1. CONSTITUTIONAL PROVISIONS
The Constitution of India not only grants equality to women but also empowers the State to adopt measures of positive discrimination in
favour of women for neutralizing the cumulative socio-economic,
educational and political disadvantages faced by them. Fundamental Rights, among others ensures equality before the law, equal protection
to laws, prohibits discrimination against any citizen on grounds of religion, race, caste, sex or place of birth, and guarantees equality of
opportunity to all citizens in matters relating to employment. Articles 14, 15, 15(3), 16, 39(a), 39(b), 39(c) and 42 of the Constitution of
India are of specific importance in this regard.
2. LEGISLATIVE PROVISIONS
Important social legislation relating to women are:
i) The maternity Benefit Act, 1961:
ii) The Medical Termination of Pregnancy Act, 1971:
iii) The Dowry Prohibition Act, 1961: iv) The immoral Traffic(Prevention) Act, 1986:
v) The indecent Representation of Women (Prohibition) Act, 1986 vi) The Commission of Sati(Prevention) Act, 1987

2
3. SPECIAL INITIATIVES FOR WOMEN
i) Delhi Commission for Women
Delhi Commission for Women is constituted with the aim to investigate and examine all matters relating to the safeguards
provided for women under the constitution and other laws. The Commission functions in the manner of a Civil Court and strives to
ensure airns envisaged in the Act through its various programmes like Sahyogini, Mahila Panchayats, Rape Crisis Cell, Mobile Help
Line and Pre Marital Counseling Cell. The jurisdiction of the Commission is within National Capital Territory of Delhi.
ii) Reservation for Women in Local Self-Government
The 72nd and 73rd Constitutional Amendment Acts passed in 1992
by Parliament require one-third of the total seats in all elected offices in local bodies whether in rural areas or urban areas to be
allocated to women.
iii) The National Plan of Action for the Girl Child (1991-2000
AD)
The plan of Action is to ensure survival, protection and development of the girl child with the ultimate objective of
building up a better for the girl child
iv) National Policy for the Employment of Women, 2001.
The Department of Women & Child Development in the Ministry of Human Resources Development has prepared a “National policy
for the empowerment of Women” in the year 2001. The goal of this policy is to bring about the advancement, development and
empowerment of women

3
4. SPECIAL INITIATIVES/PROGRAMMES/SCHEMES FOR WOMEN IN DELHI
I GENDER BUDGETING IN DELHI:
Government of Delhi has also been preparing gender budget as a part of budget document. The details for the year 2008-09 to 2011-12 are
as follows:
Annual Plan Total plan
budget (Rs. in Lakhs)
Of which flow
to women component
(Rs. in Lakhs)
% increase
2008-09* 9619.39 502.23 --
2009-10** 11300.00 619.35 23.32
2010-11** 11400.00 806.91 30.28
2011-128*** 13600.00 943.53 16.93
*Actual ** RE ***BE
II LADLI:
The scheme envisages to enhance the social status of a girl child in the society as well as in the family; to ensure proper education & to make
the girl child self-reliant; to ensure economic security for a girl child & to protect the girl child from discrimination & deprivations. The eligibility
conditions for financial assistance of a girl child are as under:
1. The girl child born on or after 01.01.08 parent must be a bona fide resident of the National Capital Territory of Delhi for at
least three years preceding the date of application. The girl child must have been born in Delhi as shown by the birth certificate
issued by Registrar (Births & Deaths). The annual income of the parents of the child should not exceed Rs.1,00,000/-; The parents
of the girl child shall submit the application within one year from
the date of birth of the child, as applicable.
2. The girl child in Delhi who are currently studying in a Govt./MCD/NDMC or Govt. recognized school in Delhi, who were
born in Delhi as shown by the birth certificate issued by Registrar (Births & Deaths) ,who have been admitted in Classes I, VI, IX, or

4
XII or passed Class X in the academic year 2009-10 onwards,
whose parents have been residing in Delhi for at least 3 years prior to the date of application, whose parents’ income is less
than Rs. 1,00,000/- per annum, All such girl children shall receive payments of Rs. 5,000/- at every stage as mentioned below in the
form of long-term fixed deposits. The above-mentioned deposits shall be en cashable only after the child attains 18 years and has
at least passed Class X. The parents of the girl child shall submit the application within 90 days from the date of admission, as
applicable.
Characteristics of Financial Assistance:
1. The competent Authority may, subject to the provisions of these rules, release grant, in the form of a long-term Fixed Deposit,
i) Payment of Rs.11,000/- if the girl child is born in a Hospital/ Nursing Home in the NCT of Delhi.
ii) Payment of Rs.10,000/- if the girl child is born outside the above mentioned Hospitals/ Nursing Homes/institutions.
iii) Payment of Rs.5000/- on admission of the child in Class I. iv) Payment of Rs.5000/- on admission of the child in Class VI.
v) Payment of Rs.5000/- on admission of the child in Class IX. vi) Payment of Rs.5000/- on the child’s passing the Class X.
vii) Payment of Rs.5000/- on admission of the child in Class XII.
2. The long term fixed deposit receipts granted under the above mentioned rules shall be made in the name of the girl child,
encashable only after the said girl child has attained the age of eighteen years, has passed Class X as a regular student or has
taken admission in Class XII.
3. The onus for getting the subsequent periodical fixed deposits will
be on the parents/ guardians of the child and shall be made only when the parents/guardians produce the report card and
attendance/ admission certificate from a Govt./MCD/NDMC or Govt. recognized school.
4. The financial assistance shall be restricted up to two girl children
in a family.

5
5. In case of the death of girl child before attaining the age of
eighteen years, the long term fixed deposit receipt shall be forfeited and deposited back in the treasury of the Government.
6. No loan or other credit facility can be extended on the long term
fixed deposit receipt.
7. The long term fixed deposit receipt shall be non- transferable/ nonrefundable and ineligible for pre-mature encashment.
Procedure for release of financial assistance:
1. The Deptt. of Education will provide a district-wise list of all the
girls who are admitted in Class I, VI, IX & XII or passed Class X in schools run by Deptt. of Education/MCD/NDMC schools and
recognized schools in Delhi to the Deptt. of Social Welfare or
Deptt. of Women and Child Development.
2. The Competent Authority shall forward a copy of the sanction order issued by it under these rules, along with a copy of the
application to the bank authorized for this purpose for issuing a long term fixed deposit receipt of rupees six/ five thousand or
subsequent payments, as the case may be, in the name of the girl child.
3. The long term fixed deposit receipt shall be given to the applicant
and a scanned copy of the long term fixed deposit receipt shall be maintained in an electronic depository by the Competent
Authority or any agency designated by the Government for this purpose.
4. The authorized bank shall provide a copy of the long-term fixed deposit receipt to the Competent Authority.
5. On the maturity of the long term fixed deposit receipt, that is, on
attaining the age of eighteen years and having attended the school up to Class XII as a regular student and passed Class X,
the accumulated amount will be paid to the girl child through an account payee cheque in her name.
6. The Competent Authority shall reconcile the expenditure with the
concerned authorized banks after every six months.

6
During 2009-10 numbers of beneficiaries under this scheme were
163000 and total expenditure incurred was Rs.8750 lakhs.
III Financial Assistant to Women in Distress:
The aim of this scheme is to provide social security by way of financial
assistance to widows in the age group of 18 to below 60 years. Government of NCT of Delhi has started this new scheme “Pension To
Widows” from 2009-10. It may be mentioned that widows above age of 60 years are covered under another scheme of Old Age Pension to
Senior Citizens. Widows who are domiciled in Delhi and have been residing in Delhi for more than 5 years continuously preceding the date
of application are eligible under the scheme.
Till 31/03/08, the widow pension was paid quarterly @ Rs.600/- per
month per head through ECS by RBI. From April 2008, the amount of pension has been enhanced from Rs.600/- to Rs.1000/ -pm as per
Budget announcement 2009-10. Widow pension was being provided to those widows whose family income from all sources does not exceed
Rs.48,000/- p.a. (Rs. Forty eight thousand per annum). Now the family income ceiling has been enhanced from existing Rs.48000/- to
Rs.60000/- per annum from April 2008.
During 2009-10 expenditure incurred in this scheme is Rs.4000 lakhs.
IV SCHEME OF ADOLESCENT GIRLS
(KISHORI SHAKTI YOJANA):
The objective of the scheme is to improve the nutritional and health
status of adolescent girls I the age group of 11-18 years; to provide the required literacy and innumeracy skills through the non-formal stream
of education; to train and equip the adolescent girls to improve/upgrade home-based and vocational skills; to promote awareness of health,
hygiene, nutrition and family welfare, home management and child care and to take all measure as to facilitate their marrying only after
attaining the age of 18 years and if possible, ever later; to gain a better understanding of their environment related social issues and the impact
on their lives and to encourage adolescent girls to initiate various activities to be productive and useful members of the society.

7
The beneficiaries are provided supplementary nutrition through ICDS
under the Supplementary Nutrition Programme. From the financial year 2007-08, this scheme has been implemented in all ICDS projects.
Presently, this scheme is implemented in 34 projects out of 55 ICDS projects as per the administrative approval granted by the Government
of India for implementation of this scheme.
During 2009-10 expenditure incurred under this scheme was Rs.102.00 lakh. During 2010-11 there is a physical target of 8850 beneficiaries to
be covered under this programme. A provision was kept to provide supplementary nutrition @ 5.50/- per day from plan funds.
V NATIONAL PROGRAMME FOR ADOLESCENT GIRLS:
Under this scheme, Additional Central Assistance (ACA) is provided by Govt. of India. Under this scheme, Six kg Wheat is provided to the
adolescent’s girls who are under weight through Fair Price Shops (FPS). This facility is given to only those girls whose family falls under BPL.
Presently this scheme is being implemented in the following 6 ICDS projects: (i) Alipur, (ii) Sultanpuri, (iii) Mongolpuri, (iv) Kanjhawla, (v)
Narela, (vi) Jahangirpuri.
During 2009-10 an expenditure of Rs.30.00 lakh was incurred under this scheme.
VI. FINANCIAL ASSISTANCE TO POOR WIDOWS FOR PERFORMING MARRIAGE OF THEIR DAUGHTERS AND ORPHAN GIRL
The aim of the scheme is to provide financial assistance of Rs.20,000/- to the poor widows for performing marriage of their daughters so as to
enable them to meet expenses involved in solemnizing marriage of their daughters also to orphan girls for their marriage. The family income
sealing is enhanced from existing Rs.48000/- to Rs.60000/- per annum w.e.f. April 2008. This assistance is paid up to two daughters only.
During 2009-10 an expenditure of Rs.427.00 lakh was incurred under
this scheme.

8
VII. FINANCIAL ASSISTANCE TO LACTATING AND NURSING
MOTHERS BELONGING TO WEAKER SECTION OF SOCIETY -
The objective of the scheme is to provide financial assistance to the mothers of newly born children belonging to weaker section of society
for nourishing meals, who cannot afford to have balanced diet after delivery because malnutrition is widely prevalent in poor families. This
assistance is meant for providing good nourishment to the lactating mothers throughout the period of lactation. The quantum of assistance
will be Rs.500/-only and will be restricted to the mother for one child only.
VIII BHAGIDARI: NEW INITIATIVES IN SOCIAL DEVELOPMENT
The objective of the scheme is to provide package of services in the area of empowerment of women, care of elderly etc. through NGOs and
in collaboration with other departments. Some of the programmes
covered under Bhagidari are as follows:
i) Stree Shakti – an experiment for realizing the worth & strength of women & to develop them as Stree Shakti.
ii) Gender Resource Center: (Stree Kosh) – which acts as focal point for
all issues concerning well being of women in general and to equip them for their socio-economic empowerment.
An expenditure of Rs.1729.52 lakh has been incurred during 2009-10
under this scheme.

9
DEMOGRAPHIC PROFILE
� The percentage of female from total population was always lower
in Delhi since the beginning of the century. It has steadily
declined in between 1911 to 1921 after that, it has constant till
1941 as 42%. Thereafter, it shown an increasing trend and as
per the provisional result of 2011 census it has been observed
46%
� The number of women per 1000 men in Delhi has decreased
steadily upto 1941after that it increased continuously upto 1991
but it decreased in 2001 and as per the provisional result of 2011
census it has been observed 866 which is highest between 1901
to 2011.
� Whereas in India the number of women per 1000 men in 1981
was 934, declined to 927 in 1991 and again the figure for 2001
(933) showed moderate improvement compared to 1991 figure
(927) and now it is 940 in 2011
� The sex ratio during 2001 in rural areas of Delhi was 806 females
per 1000 males, whereas in urban areas the sex ratio was 822.
The sex ratio in the 0-6 age group has declined sharply from 915
in 1991 to 868 in 2001. Though the share of female population
remains 45% during 1981, 1991 and 2001 census.
� In Delhi, during 2001 census about 33.48% of the total female
population was in the age group of 0-14 years, 9.79% in the age
group of 15-19 years as compared to 36.30% and 9.30% in the
corresponding age group in 1991. The percentage of women in
60 years and above age groups has increased from 4.75% to
5.66% in the year 2001 as compared to the year 1991.
� Percentage of Scheduled caste female out of total population is
declined from 9% in 1991 to 8% in 2001 Census. Similarly
Scheduled caste men also declined from 10% in 1991 census to
9% during 2001 census.

Male Female Total
1 2 3 4 5 6
1901 217921 187898 405819 46 862
1911 230865 182986 413851 44 793
1921 281777 206675 488452 42 733
1931 369497 266749 636246 42 722
1941 535236 382703 917939 42 715
1951 986538 757534 1744072 43 768
1961 1489378 1169234 2658612 44 785
1971 2257515 1808183 4065698 44 801
Sex Ratio (Female
per 000 male)
PopulationCensus Year
% of Female
population
Table No. 1.1 Sex wise population in Delhi According to population Census
1981 3440081 2780325 6220406 45 808
1991 5155512 4265132 9420644 45 827
2001 7607234 6243273 13850507 45 821
2011* 8976410 7776825 16753235 46 866
*provisional
54 56 58
58
58
57
56
56
55
55
55
54
46 44 42
42
42
43
44
44
45
45
45
46
0
10
20
30
40
50
60
70
80
90
100
1901 1911 1921 1931 1941 1951 1961 1971 1981 1991 2001 2011
Po
pu
lati
on
(%
)
Years
Sex-wise population in Delhi (in %)
MALE FEMALE
10

Male Female Total
% Share of
Female
Population
Sex Ratio
(Female Per
'000 Male)
Male Female Total
% Share of
Female
Population
Sex Ratio
(Female Per
'000 Male)
1 2 3 4 5 6 7 8 9 10 11
1901 117872 96243 214115 45 817 100049 91655 191704 48 916
1911 136740 101204 237944 43 740 94125 81782 175907 46 869
1921 182054 122366 304420 40 672 99723 84309 184032 46 845
1931 267979 179463 447442 40 670 101518 87286 188804 46 860
1941 414821 280865 695686 40 677 120415 101838 222253 46 846
1951 819432 617702 1437134 43 754 167106 139832 306938 46 837
1961 1327386 1032022 2359408 44 777 161992 137212 299204 46 847
1971 2028091 1618932 3647023 44 798 229424 189251 418675 45 825
1981 3190248 2577952 5768200 45 808 249833 202373 452206 45 810
1991 4630456 3841169 8471625 45 830 525056 423963 949019 45 807
2001 7085147 5820633 12905780 45 822 522087 422640 944727 45 806
Census
Year
Table No. 1.2 Population in Delhi by Sex & Sector according to Population Census
Urban Rural
11

0-14 15-19 22-24 25-29 30-39 40-49 50-5960 &
Above
Age Not
StatedTotal
1 2 3 4 5 6 7 8 9 10 11
741063 185147 182126 153992 238026 149311 80423 77622 473 1808183
(40.98) (10.24) (10.07) (8.52) (13.16) (8.26) (4.45) (4.29) (0.03) (100.00)
1044615 284525 316911 263779 358278 240489 141321 127407 3000 2780325
(37.57) (10.23) (11.40) (9.49) (12.89) (8.65) (5.08) (4.58) (0.11) (100.00)
1548145 396603 444675 439608 627947 365501 220616 202551 19486 4265132
(36.30) (9.30) (10.43) (10.31) (14.72) (8.57) (5.17) (4.75) (0.46) (100.00)
1981
1991
Table No. 1.3 Population of Female By Specific Age Group During Census Years 1971-2001 in Delhi
Census
Year
Age Group
1971
12
(36.30) (9.30) (10.43) (10.31) (14.72) (8.57) (5.17) (4.75) (0.46) (100.00)
2090238 611482 612254 614207 1000469 618241 334748 353184 8450 6243273
(33.48) (9.79) (9.81) (9.84) (16.02) (9.90) (5.36) (5.66) (0.14) (100.00)
2001
0-1433.48
15-199.79
22-249.81
25-299.84
30-3916.02
40-499.90
50-595.36
60 & Above 5.66
Age Not Stated0.14
Female Population by Specific Age Group - Census-2001
12

State/Union Territory
Early
Childhood
0-6 Yrs
Girl Child
0-19 Yrs
Adolescent
Girl
11-18 Yrs
Reproductive
Age
15-44 Yrs
Economically
Active
15-59 Yrs
Old Age
60+Yrs
1 2 3 4 5 6 7
A & N Islands 0.02 0.07 0.03 0.09 0.10 0.01
Andhra Pradesh 4.98 15.54 6.26 18.25 22.68 3.03
Arunachal Pradesh 0.10 0.27 0.10 0.23 0.28 0.02
Assam 2.21 6.12 2.28 6.07 7.23 0.76
Bihar 8.15 19.74 6.16 16.60 20.53 2.58
Chandigarh 0.05 0.16 0.06 0.21 0.25 0.02
Chhattisgarh 1.75 4.71 1.75 4.60 5.75 0.81
Dadra & Nagar Haveli 0.02 0.05 0.02 0.05 0.06 0.00
Daman & Diu 0.01 0.03 0.01 0.03 0.04 0.00
Delhi 0.94 2.70 1.07 3.18 3.79 0.35
Goa 0.07 0.22 0.09 0.34 0.43 0.06
Gujarat 3.53 10.24 4.07 11.89 14.58 1.87
Haryana 1.50 4.45 1.80 4.61 5.49 0.79
Himachal Pradesh 0.37 1.21 0.52 1.44 1.80 0.28
Jammu & Kashmir 0.72 2.31 0.98 2.22 2.70 0.31
Jharkhand 2.43 6.35 2.19 5.71 7.06 0.79
Karnataka 3.49 10.77 4.49 12.56 15.56 2.14
Kerala 1.86 5.57 2.38 8.17 10.44 1.85
Lakashadweep 0.00 0.01 0.01 0.01 0.02 0.00
Madhya Pradesh 5.20 13.66 4.85 12.71 15.51 2.19
Maharashtra 6.52 19.18 7.75 21.96 27.04 4.52
Manipur 0.15 0.47 0.20 0.54 0.65 0.07
Meghalaya 0.23 0.61 0.22 0.51 0.61 0.05
Mi zoram 0.07 0.20 0.08 0.21 0.25 0.02
Nagaland 0.14 0.48 0.21 0.47 0.55 0.04
Orissa 2.61 7.74 3.09 8.59 10.61 1.54
Pondicherry 0.06 0.18 0.08 0.25 0.31 0.04
Punjab 1.41 4.61 1.99 5.56 6.80 1.08
Rajasthan 5.07 13.17 4.65 11.70 14.29 1.98
Sikkim 0.04 0.12 0.05 0.12 0.15 0.01
Tamil Nadu 3.51 11.18 4.73 15.64 19.90 2.77
Tripura 0.21 0.69 0.30 0.76 0.91 0.12
Uttar Pradesh 15.12 39.12 13.47 33.16 40.78 5.47
Uttrakhand 0.65 1.92 0.78 1.90 2.35 0.33
West Bengal 5.59 16.57 6.48 18.56 22.74 2.92
India 78.82 220.40 83.19 228.89 282.24 38.85
Table No. 1.4 Female target groups in population (in million) of States/union Territories-2001
Source: 11th Issue Women & Men in India, 2007. Central Statistical Organization, Ministry of Statistics &
Programme implemetation, Government of India.
13

1981 1991 2001 2011* 1981 1991 2001 2011*
Andhra Pradesh 49.4 49.3 49.4 49.79 975 972 976 992
Arunachal Pradesh 46.3 46.2 47.2 47.0 862 859 894 920
Assam 48.0 48.3 48.81 923 934 954
Bihar 45.4 47.7 47.9 47.8 946 911 919 916
Chhattisgarh 49.7 49.77 988 991
Delhi 44.7 45.3 45.1 46.41 808 827 821 866
Goa 49.5* 49.1 49.0 49.18 * 967 961 968
Gujarat 48.5 48.3 47.9 47.86 942 934 919 918
Haryana 46.5 46.3 46.3 46.73 870 865 862 877
Himachal Pradesh 49.3 49.4 49.2 49.33 973 976 969 974
Jammu & Kashmir 47.1 48.0 47.2 46.88 892 894 883
Jharkhand 48.5 48.63 942 947
Karnataka 49.0 48.9 49.1 49.19 963 960 965 968
Kerala 50.8 50.9 51.4 52.01 1032 1036 1058 1084
Madhya Pradesh 49.5 48.2 47.9 48.18 941 931 919 930
Maharashtra 48.4 48.3 48.0 48.06 937 934 923 925
Manipur 49.3 49.0 49.3 49.67 971 958 972 987
Meghalaya 48.8 49.0 49.3 49.64 954 955 972 986
Mi zoram 47.9 48.0 48.3 49.37 919 921 934 975
Nagaland 46.8 48.0 48.3 48.21 934 927 934 931
Orissa 49.5 49.3 49.3 49.45 981 971 972 978
Punjab 46.8 46.9 46.7 47.17 879 882 876 893
Rajasthan 47.9 47.7 47.9 48.09 919 910 919 926
Sikkim 35.5 46.7 46.7 47.06 878 876 889
Tamil Nadu 49.4 49.3 49.7 49.87 977 974 988 995
Tripura 48.6 48.6 48.7 49 946 945 949 961
Uttar Pradesh 46.9 46.8 47.3 47.59 885 879 898 908
Uttrakhand 49.0 49.05 961 963
West Bengal 47.7 47.9 48.3 48.62 911 917 934 947
A & N Islands 43.2 45.0 45.8 46.74 760 818 845 878
Chandigarh 43.5 44.1 43.7 44.98 769 790 776 818
Dadra & Nagar Haveli 49.3 49.0 44.8 43.65 974 969 812 775
Daman & Diu * 49.2 41.5 38.2 981* 969 709 618
Lakashadweep 49.4 48.5 48.7 48.61 975 943 949 946
Pondicherry 49.6 49.5 50.0 50.94 985 979 1000 1038
India 46.8 48.0 48.3 48.46 934 927 934 940
*provisional
Source: Census of India
India/State/UTs Sex Ratio female "000male% of Female Population
Table No. 1.5 Female Population across State/UTs under census year
14

Persons Males FemalesSex
RatioPersons Males Females
Sex
RatioPersons Males Females
Sex
RatioPersons Males Females
Sex
RatioPersons Males Females Sex Ratio
1 2 3 4 5 6 7 8 9 10 3 4 5 6 7 8 9 10 7 8 9 10
NCT OF TOTAL 4065698 2257515 1808183 801 6220406 3440081 2780325 808 9420644 5155512 4265132 827 1.4E+07 7607234 6243273 821 16753235 8976410 7776825 866
DELHI RURAL 418675 229424 189251 825 452206 249833 202373 810 949019 525056 423963 807 944727 522087 422640 810
URBAN 3647023 2028091 1618932 798 5768200 3190248 2577952 808 8471625 4630456 3841169 830 1.3E+07 7085147 5820633 822 NA
NORTH
WESTTOTAL 450419 249059 201360 808 991186 550143 441043 802 1777968 975772 802196 822 2860869 1571689 1289180 820 3651261 1960677 1690584 862
RURAL 157277 85501 71776 839 185277 101861 83416 819 296126 164430 131696 801 265363 146741 118622 808
URBAN 293142 163558 129584 792 805909 448282 357627 798 1481842 811342 670500 826 2595506 1424948 1170558 821 NA
NORTH TOTAL 653224 367178 286046 779 657609 365162 292447 801 686654 377450 309204 819 781525 427882 353643 826 883418 472260 411158 871
RURAL 7913 4353 3560 818 12744 6977 5767 827 31980 17813 14167 795 46585 25724 20861 811
URBAN 645311 362825 282486 779 644865 358185 286680 800 654674 359637 295037 820 734940 402158 332782 827 NA
NORTH TOTAL 157262 88897 68365 769 487466 270231 217235 804 1085250 590860 494390 837 1768061 956078 811983 849 2240749 1188307 1052442 886
EAST RURAL 19311 10804 8507 787 16991 9447 7544 799 148699 81746 66953 819 141547 76558 64989 849
URBAN 137951 78093 59858 766 470475 260784 209691 804 936551 509114 427437 840 1626514 879520 746994 849 NA
EAST TOTAL 306232 167359 138873 830 623850 340906 282944 830 1023078 554122 468956 846 1463583 794074 669509 843 1707725 906721 801004 883
RURAL 6156 3395 2761 813 13491 7588 5903 778 100337 55563 44774 806 18223 10119 8104 801
URBAN 300076 163964 136112 830 610359 333318 277041 831 922741 498559 424182 851 1445360 783955 661405 844
NEW TOTAL 164702 96564 68138 706 144115 83853 60262 719 168669 94071 74598 793 179112 99956 79156 792 133713 73846 59867 811
DELHI RURAL 0 0 0 0 0 0 0 0 0 0 0 0 0 0 0 0
URBAN 164702 96564 68138 706 144115 83853 60262 719 168669 94071 74598 793 179112 99956 79156 792 NA
CENTR
ALTOTAL 691738 380009 311729 820 691223 374851 316372 844 656533 350715 305818 872 646385 350831 295554 842 578671 305926 272745 892
RURAL 0 0 0 0 0 0 0 0 0 0 0 0 0 0 0 0
URBAN 691738 380009 311729 820 691223 374851 316372 844 656533 350715 305818 872 646385 350831 295554 842 NA
WEST TOTAL 572973 312409 260564 834 958931 524056 434875 830 1433038 775265 657773 848 2128908 1163084 965824 830 2531583 1349685 1181898 876
RURAL 47090 25730 21360 830 41145 22768 18377 807 103481 56744 46737 824 86794 49366 37428 758
URBAN 525883 286679 239204 834 917786 501288 416498 831 1329557 718521 611036 850 2042114 1113718 928396 834 NA
SOUTH- TOTAL 479189 267517 211672 791 679170 380668 298502 784 1087573 605962 481611 795 1755041 983615 771426 784 2292363 1248700 1043663 836
WEST RURAL 128750 69977 58773 840 129908 71054 58854 828 194186 107075 87111 814 225454 123279 102175 829
URBAN 350439 197540 152899 774 549262 309614 239648 774 893387 498887 394500 791 1529587 860336 669251 778 NA
SOUTH TOTAL 589956 328523 261433 796 986856 550211 436645 794 1501881 831295 670586 807 2267023 1260025 1006998 799 2733752 1470288 1263464 859
RURAL 52175 29664 22511 759 52560 30138 22512 747 74210 41685 32525 780 160761 90300 70461 780
URBAN 537781 298859 238922 799 934206 520073 414133 796 1427671 789610 638061 808 2106262 1169725 936537 801 NA
source: census of india *PROVISINAL
Charge NoDistrict/Tah
sil
Table No. 1.6 District-wise Population as per census year 1971 - 2011 in Delhi1991 2001 2011*1971 1981
15

Year Urban Rural Delhi
1961 777 847 785
1971 798 825 801
1981 808 810 808
1991 830 807 827
2001 822 806 821
Source: Population Statistics 2001, DES, Delhi
Table No. 1.7 Sex Ratio Year & Sector-wise in Delhi (Female per 1000 males)
SEX RATIO YEAR & SECTOR-WISE IN DELHI (FEMALE PER 1000 MALES)
740
760
780
800
820
840
860
1961 1971 1981 1991 2001
777
798
808
830
822
847
825
810
807
806
785
801
808
827
821
SE
X R
AT
IO
YEAR
Urban Rural Delhi
16

Sl. No. India/State/U.T. 2003 2004 2005 Rank in 2005
1 2 3 4 5 6
India 868 872 876
1 Andhra Pradesh 973 972 987 2
2 Arunachal Pradesh 812 864 799 29
3 Assam 750 NA 732 32
4 Bihar 826 801 793 30
5 Chhattisgarh 926 919 939 10
6 Goa 931 931 931 13
7 Gujarat 835 824 846 23
8 Haryana 814 796 827 25
9 Himachal Pradesh 877 872 866 20
10 Jammu & Kashmir 925 934 923 14
11 Jharkhand NA 840 830 24
12 Karnataka 924 858 943 8
13 Kerala 951 946 949 7
14 Madhya Pradesh 841 864 855 22
15 Maharashtra 808 811 NA NA
16 Manipur 923 1004 1011 1
17 Meghalaya 875 1011 918 15
18 Mi zoram 926 945 940 9
19 Nagaland 971 977 980 3
20 Orissa 950 927 934 12
21 Punjab 789 794 790 31
22 Rajasthan 833 820 805 28
23 Sikkim 935 956 954 5
24 Tamil Nadu 920 936 935 11
25 Tripura 1202 NA NA NA
26 Uttar Pradesh NA NA NA NA
27 Uttrakhand NA 845 864 21
28 West Bengal 889 903 906 17
1 A & N Islands 1003 935 967 4
2 Chandigarh 807 786 826 26
3 Dadra & Nagar Haveli 932 879 918 16
4 Daman & Diu 915 906 869 18
5 Delhi 823 823 822 27
6 Lakashadweep 991 843 869 19
7 Pondicherry 942 936 950 6
Table No. 1.8 Comparision of Sex ratio at birth among States/U.T for the year 2005
Union Territories
Source: Vital Statistics of India based on the Civil Registration system - Special Report 2002-2005
(Page No. 23 Office of The Registrar General, India, Ministry of Home Affairs, Government of India )
17

Male Female Total Male Female Total Male Female Total
1 2 3 4 5 6 7 8 9 10
152343 119900 272243 37127 32185 69312 189470 152085 341555
11% 12% 12% 23% 23% 7% 7% 6% 13%
295492 235207 530699 57528 47471 104999 353020 282678 635698
15% 15% 15% 25% 25% 25% 9% 7% 16%
561464 456167 1017631 57086 46926 104012 618550 503093 1121643
18% 18% 18% 23% 23% 23% 18% 18% 18%
Year
Table No. 1.9 Share of Scheduled Caste Population to total Population of Delhi
by Sector and Sexwise
1961
1971
1981
Urban SC Population Rural SC Population Total SC Population
864729 722398 1587127 113961 93748 207709 978690 816146 1794836
19% 19% 19% 22% 22% 22% 10% 9% 19%
1163682 991195 2154877 101500 86878 188378 1265182 1078073 2343255
16% 17% 17% 19% 21% 20% 9% 8% 17%
Source: Population Statistics 2001, DES, Delhi
2001
1991
18

Male Female Total Decennial Growth
1901 217921 187898 405819 --
1911 230865 182986 413851 1.98
1921 281777 206675 488452 18.03
1931 369497 266749 636246 30.26
1941 535236 382703 917939 44.27
1951 986538 757534 1744072 90.00
1961 1489378 1169234 2658612 52.44
1971 2257515 1808183 4065698 52.93
1981 3440081 2780325 6220406 53.00
1991 5155512 4265132 9420644 51.45
2001 7607234 6243273 13850507 47.02
2011* 8976410 7776825 16753235 20.96
*provisional
Source: Population Statistics 2001, DES, Delhi
Table No. 1.10 Decennial Growth Rate of Population in Delhi
YearPopulation
19

India/State Year Total PopulationPopulation
0-6 Years
1961 943 976
1971 931 964
1981 935 962
1991 927 945
2001 933 927
2011* 940 914
1961 785 923
1971 801 909
1981 808 926
1991 827 915
2001 821 868
2011* 866 866
*provisional
Source: Registrar General of India
Delhi
India
Table No. 1.11 Sex Ratio (Females per 1,000 Males)
of Total Population and aged 0-6 years, 1961-2011
20

21
HEALTH AND FAMILY WELFARE
� During 2009 a total of 3.54 lakh births were registered and
among them 52.22% were male and 47.78% female.
Percentage of female birth decreased from 50.11% to 47.78%
during the year 2008 and 2009. Birth rate of females works out
to 9.68 per thousand female populations during 2009 as against
9.5 in 2001.
� Sex ratio at birth in Delhi as per Civil Registration System was
867 in 1991, which came down to 809 in 2001. Thereafter, it
has been rising and in 2008 it has increased to 1004 which shows
that the society welcomes a girl child. It has decreased to 915 in
2009.
� Death rate of female per thousand of population worked out to
be 2.38 during 2009 as against 2.14 in 2001.
� NFHS 2006 found that two child norm is gradually being accepted
but this is more so among women who have two sons living. In
Delhi 91.6% of women with 2 sons want no more children.
� Infant mortality rate per thousand live births in 2009 was 18.96.
(11.40 among males and 7.56 among females), as against 18.38
in the year 2008. (22.52 among males & 14.27 among females),
which shows increase in total infant mortality rate.
� The total fertility rate (15-49 years female) was 2.10 during
2005-06 (NFHS-3) and was 2.37 during 1998-99 (NFHS-II) which
shows decline in total fertility rate.
� Maternal death has declined from 238 per one lakh live births
during 2001 to 151 per one lakh live birth during 2009 and
maternal mortality rate per thousand live births has increased
from 0.41 during 1991 to 0.43 in 2009.
� Medical Institutions have accounted for more than two-thirds
(75.64%) of the delivery cases during 2009. The share of
institutional births has risen significantly during the recent past.
It was only 54.56% in 1991 and has increased to 62.11% by

22
2001 and thereafter crossed 70% mark within a short period of
time.
� Out of total registered births during 2009, only 1.74% were from
mothers in the age group of 15-19 years, as against 4.41% in
1991. 84.69% of births were given by the mothers in the age
group of 20-29 years followed by 11.16% by the mothers in the
age group of 30-34 years, while mothers in the age group of 35
and above gave birth to only 2.41% of the total births.
� As per NFHS-III (2005-06), 50% of women aged 15-19 years
were found pregnant or were already mothers. 44.3% of women
suffer from anemia (NFHS-III, 2005-06) as compared to 55.3%
in India.
� There is high prevalence of anemia among children. 63.2% of
children between the age group of 6-35 months were suffering
from anemia during 2006 in rural sector 70.9% and in urban
sector 71.4% as compared to 79.2% (total), 81.2% (rural) and
72.7% (urban) in India.
� 75.1% of mothers has atleast three antenatal case visits from
their last birth (NFHS-III, 2005-06) as compared to 68.9%
during 1998-99 (NFHS-II) and 72.2% during NFHS-I (1992-93),
showing an improvement in ANC visits. 39.5% of mothers
consumed IFA for 90 days or more when they were pregnant
with their first child (NFHS-III, 2005-06).
� Similarly, 58.4% of mothers received postnatal care from health
personnel within two days of delivery (NFHS-III).
� During 2009-10, family welfare programme users (by method)
for ICD was 9.43%, sterilization was 8.68%, oral pills 79.65%
and condoms 2.21% as compared to 54.20%, 25.31%, 4.26%,
16.23% respectively for each method during 1990-91.
Comparison shows tremendous rise in the method of oral pills
(from 4.26% to 79.65%).
� In 2007 as per National Aids Control Society HIV prevalence in
Delhi is 0.25% for Antenatal Clinic and for STD (Sexually
Transmitted Diseases) HIV prevalence is 5.20%. For female sex
worker (FSW) HIV prevalence is 3.15% whereas, for IDU
(injecting drug user) it is 10.10%.

YEAR TOTAL BIRTH MALE FEMALE SEX RATIO
1 2 3 4 5
1991 272020145694
(53.56)
126326
(46.44)867
2001 296287163816
(55.29)
132471
(44.71)809
2002 300659164184
(54.61)
136475
(45.39)831
2003 301165165173
(54.84)
135992
(45.10)823
2004 305974167849
(54.86)
138125
(45.14)823
2005 324336178031
(54.89)
146305
(45.11)822
2006 322750176242
(54.61)
146508
(45.39)831
2007 322044174289
(54.12)
147755
(45.88)848
TABLE NO. 2.1 SEX-WISE TOTAL NUMBER OF BIRTH IN DELHI
23
2007 322044(54.12) (45.88)
848
2008 333908166583
(49.89)
167325
(50.11)1004
2009 354482185131
(52.22)
169351
(47.78)915
Source: Annual report on Registration of Birth & Death 2009, DES, Delhi
867
809 831 823 823 822 831 848
1004
915
0
200
400
600
800
1000
1200
1991 2001 2002 2003 2004 2005 2006 2007 2008 2009
Sex Ratio
23

Male Female Total Male Female Total Male Female Total
1 2 3 4 5 6 7 8 9 10
2001 11.74 9.5 21.22 3.67 2.14 5.81 27.20 19.90 23.93
2002 11.42 9.49 20.92 3.71 2.28 5.99 18.94 13.06 16.27
2003 11.13 9.16 20.29 3.68 2.24 5.92 21.00 13.06 17.42
2004 10.99 9.04 20.03 3.47 2.12 5.59 15.21 10.50 13.08
2005 11.33 9.31 20.61 3.73 2.27 5.99 15.19 10.10 12.89
2006 10.9 9.06 19.95 3.96 2.16 6.11 20.44 15.17 18.05
2007 10.47 8.88 19.35 3.81 2.26 6.07 29.23 20.98 25.44
2008 9.73 9.78 19.51 3.98 2.31 6.29 22.52 14.27 18.38
2009 10.53 9.68 20.21 3.98 2.38 6.36 11.40 7.56 18.96
Source: Office of Chief Registrar, Births & Deaths Delhi, (CRS)
Table No. 2.2 Sex-wise Birth , Death and infant mortality rate in Delhi (CRS)
YearBirth Rate Death Rate Infant Mortality Rate
(Per thousand live birth)
24
Source: Office of Chief Registrar, Births & Deaths Delhi, (CRS)
Male
Fe…
0.00
5.00
10.00
15.00
20.00
25.00
30.00
20012002
20032004
20052006
20072008
2009
27.2
0
18.9
4
21.0
0
15.2
1
15.1
9
20.4
4
29.2
3
22.5
2
11.4
0
19.9
0
13.0
6
13.0
6
10.5
0
10.1
0
15.1
7
20.9
8
14.2
7
7.5
6
Infa
nt M
ort
alit
y R
ate
Years
Sex-wise infant mortality rate in Delhi
Male Female
24

Birth Rate Death Rate
Infant
Mortality
Rate
Birth Rate Death Rate
Infant
Mortality
Rate
Birth Rate Death Rate
Infant
Mortality
Rate1 5 6 7 8 9 10 11 12 13
India 23.5 7.5 57.0 23.1 7.4 55.0 22.8 7.4 53.0
Andhra Pradesh 18.9 7.3 56.0 18.7 7.4 54.0 18.4 7.5 52.0
Arunachal Pradesh 22.5 5.0 7.0 22.2 5.1 37.0 21.8 5.2 32.0
Assam 24.6 8.7 67.0 24.3 8.6 66.0 23.9 8.6 64.0
Bihar 29.9 7.7 60.0 29.4 7.5 58.0 28.9 7.3 56.0
Chhattisgarh 26.9 8.1 61.0 26.5 8.1 59.0 26.1 8.1 57.0
Delhi 18.4 4.7 37.0 18.1 4.8 36.0 18.4 4.8 35.0
Goa 15.1 7.4 15.0 14.7 7.2 13.0 13.6 6.6 10.0
Gujarat 23.5 7.3 53.0 23.0 7.2 52.0 22.6 6.9 50.0
Haryana 23.9 6.5 57.0 23.4 7.2 55.0 23.0 6.9 54.0
Himachal Pradesh 18.8 6.8 50.0 17.4 7.1 47.0 17.7 7.4 44.0
Jammu & Kashmir 18.7 5.9 52.0 19.0 5.8 51.0 18.8 5.8 49.0
Jharkhand 26.2 7.5 49.0 26.1 7.3 48.0 25.8 7.1 49.0
Karnataka 20.1 7.1 48.0 19.9 7.3 47.0 19.8 7.4 45.0
Kerala 14.9 6.7 15.0 14.7 6.8 13.0 14.6 6.6 12.0
Madhya Pradesh 29.1 8.9 74.0 28.5 8.7 72.0 28.0 8.6 70.0
Maharashtra 18.5 6.7 35.0 18.1 6.6 34.0 17.9 6.6 33.0
Manipur 13.4 4.5 11.0 14.6 4.4 12.0 15.8 5.0 14.0
Meghalaya 24.7 8.0 53.0 24.4 7.5 56.0 25.2 7.9 58.0
Mi zoram 17.8 5.5 25.0 18.2 5.2 23.0 17.8 5.1 37.0
Nagaland 17.3 4.8 20.0 17.4 5.0 21.0 17.5 4.6 26.0
Orissa 21.9 9.3 73.0 21.5 9.2 71.0 21.4 9.0 69.0
Punjab 17.8 6.8 44.0 17.6 7.0 43.0 17.3 7.2 41.0
Rajasthan 28.3 6.9 67.0 27.9 6.8 65.0 27.5 6.8 63.0
Sikkim 19.2 5.6 33.0 18.1 5.3 34.0 18.4 5.2 33.0
Tamil Nadu 16.2 7.5 37.0 15.8 7.2 35.0 16.0 7.4 31.0
Tripura 16.6 6.3 36.0 17.1 6.5 39.0 15.4 5.9 34.0
Uttar Pradesh 30.1 8.6 71.0 29.5 8.5 59.0 29.1 8.4 67.0
Uttrakhand 21.0 6.7 43.0 20.4 6.8 48.0 20.1 6.4 44.0
West Bengal 18.4 6.2 38.0 17.9 6.3 37.0 17.5 6.2 35.0
Table No. 2.3 Birth, Death & Infant Mortality Rate State/Union Territory wise
Indian States Union
Territory
2006 20082007
Source : Compendium of Selected indicators of indian Economy 2009, M/O Statistics and Programme Implementation, CSO, Govt. of India
25

Male Female Total Male Female Total
1 2 3 4 5 6 7
1991 145694 126326 272020 5432 3374 8806
2000 174347 143029 317376 4049 3343 7392
2001 163816 132471 296287 4455 2636 7091
2002 164184 136475 300659 3109 1782 4891
2003 165173 135992 301165 3469 1776 5245
2004 167849 138125 305974 2553 1450 4003
2005 178031 146305 324336 2705 1477 4182
2006 176242 146508 322750 3603 2222 5825
2007 174289 147755 322044 5094 3100 8194
2008 166583 167325 333908 3751 2387 6138
2009 185131 169351 354482 4041 2680 6721
Source: Office of Chief Registrar, Births & Deaths Delhi,
Table No 2.4 Live births & infant deaths in Delhi
Year
Live Births Infant Death
26

Male Female Total Male Female Total Male Female Total
1 2 3 4 5 6 7 8 9 10
Under One Week 92 44 136 2319 1349 3668 2411 1393 3804
One week to One Month 50 31 81 532 370 902 582 401 983
One Month but below Three Months 37 31 68 284 272 556 321 303 624
Three Months to Six Months 49 30 79 343 252 595 392 282 674
Six Months to One Year 39 28 67 296 273 569 335 301 636
Not Stated 0 0 0 0 0 0 0 0 0
Total 267 164 431 3774 2516 6290 4041 2680 6721
Source: Annual Report on Registration of Birth & Death, 2009, DES, Delhi
Table No. 2.5 Infant Death by Age and Sex - 2009, Delhi
Rural Urban Combined
Age
27

Year
Neonatal Death
(Infants below 1
month
Neonatal
Mortality Rate
Post-natal deaths
(Infant 1-12
months
Post-natal
Mortality Rate
Total Infant
Deaths (Infant
0-12 Months)
Infant Mortality
Rate
% of Infant
Deaths to Total
Deaths
1 2 3 4 5 6 7 8
1991 5728 21.06 3078 11.32 8806 32.37 14.53
2001 4213 14.22 2878 9.71 7091 23.93 8.74
2002 3115 10.36 1776 5.91 4891 16.27 5.68
2004 2774 9.07 1229 4.02 4003 13.08 4.69
2005 3183 9.81 999 3.08 4182 12.89 4.44
2006 3756 11.64 2069 6.41 5825 18.05 5.89
2007 4917 15.27 3277 10.18 8194 25.44 8.11
2008 4485 13.43 1653 4.95 6138 18.38 5.70
2009 4887 13.79 1834 5.17 6721 18.96 6.00
Source : Office of Chief Registrar, Birth & Death, DES, Delhi
Table No. 2.6 Distribution of Infant Deaths in Delhi
28

Total Male Female Total Male Female Total Male Female
1 2 3 4 5 6 7 8 9 10 11
India 16.0 15.2 16.9 18.0 17.1 19.0 9.6 9.0 10.2
1 Andhra Pradesh 14.6 14.7 14.5 17.1 17.3 16.9 8.7 8.6 8.8
2 Assam 18.2 16.8 19.6 19.1 17.5 20.8 10.1 10.4 9.8
3 Bihar 18.9 17.7 20.1 19.5 18.3 20.8 12.7 12.3 13.3
4 Chhattisgarh 16.9 16.6 17.3 17.9 17.6 18.2 11.9 11.3 12.4
5 Delhi 8.4 8.0 8.8 9.2 9.4 8.9 8.2 7.7 8.8
6 Gujarat 15.1 13.9 16.5 18.5 17.2 19.9 9.2 8.3 10.3
7 Haryana 15.2 14.2 16.3 16.8 15.5 18.3 11.2 11.1 11.2
8 Himachal Pradesh 9.6 12.5 6.6 10.1 13.1 6.9 3.5 4.3 2.5
9 Jammu & Kashmir 12.4 12.5 12.3 13.4 13.4 13.3 8.0 8.2 7.8
10 Jharkhand 13.7 13.6 13.9 14.9 14.7 15.1 7.9 8.0 7.8
11 Karnataka 12.1 12.5 11.8 14.5 14.9 14.1 7.7 7.8 7.5
12 Kerala 2.8 2.9 2.7 2.9 3.1 2.7 2.4 2.1 2.6
13 Madhya Pradesh 23.5 22.3 24.8 26.3 24.9 27.7 12.7 12.0 13.4
14 Maharashtra 8.5 8.3 8.7 10.2 10.1 10.3 5.9 5.5 6.4
15 Orissa 20.0 19.7 20.4 21.2 20.8 21.6 11.7 11.4 11.9
16 Punjab 11.1 10.3 12.1 12.7 11.6 14.1 8.5 8.2 8.8
17 Rajasthan 19.5 18.2 21.1 22.0 20.5 23.7 10.8 9.8 11.9
18 Tamil Nadu 8.4 8.7 8.2 9.2 9.6 8.8 7.3 7.3 7.4
19 Uttar Pradesh 22.3 20.1 24.9 23.4 21.1 26.0 16.8 14.7 19.2
20 West Bengal 9.2 9.3 9.1 10.0 10.2 9.8 6.4 6.1 6.8
Source: Statistics on Women in India 2010, National Institute of Public Cooperation and Child Development
S. N India & Bigger States
Table No. 2.7 Under Five Death Rates by Sex and Residence India and Bigger States, 2007
Total Rural Urban
29

Male Female Male Female Male Female Male Female Male Female Male Female Male Female Male Female
1 2 3 4 5 6 7 8 9 10 11 12 13 14 15 16 17
1991 5432 3374 1527 1282 1416 1033 2789 1898 7228 3722 9528 4516 0 0 87 44
1992 5654 3377 1462 1270 1368 1066 2640 1883 7282 3572 10078 4775 0 0 92 55
1993 4934 2926 1525 1233 1253 1039 2670 2083 7694 3881 10177 4946 0 0 393 256
1994 4772 2977 1556 1410 1363 1078 2666 2096 8164 4096 11265 5451 0 0 628 265
1995 5127 3083 1425 1263 1474 1026 2952 2269 8761 4357 11300 5491 0 0 136 46
1996 5025 3514 1478 1396 1483 1145 3288 2495 10527 4907 11702 5511 0 0 130 69
1997 4626 2869 1287 1163 1205 995 2758 2181 9350 4416 12040 5659 0 0 131 50
1998 5454 3442 1705 1537 1316 1096 3062 2488 12281 4712 14041 6412 0 0 144 39
1999 3958 2707 975 685 1430 1063 2488 2099 7429 4564 14273 7933 0 0 1874 874
2000 4548 3568 1289 888 1170 858 2035 1693 6457 3968 13609 8128 15930 10606 3494 1617
2001 4448 2643 1297 1121 1427 1118 2681 2183 10074 4908 14459 6726 14850 10991 1158 1016
2002 3109 1782 1635 835 1673 1171 2378 2019 6961 3899 14948 6723 17419 12666 5282 3676
2003 2677 1773 1845 1272 1619 1983 2091 1681 5900 3543 7763 4274 7596 4812 288 148
2004 2553 1450 2761 1924 2308 1715 3248 2504 9989 4820 15864 7350 16072 12410 221 189
2005 2705 1477 2876 2113 2732 2086 3681 2683 11273 5450 17563 8175 16749 12964 975 685
2006 3603 2222 2574 1340 2487 1490 4592 2399 12638 5112 19241 8200 18718 13871 175 246
2007 5094 3100 1394 1107 1668 1261 3629 2467 12190 5600 22754 10856 16558 12877 174 245
2008 3751 2387 1346 1062 1539 995 3648 2293 13880 6211 25960 12380 17909 14239 0 0
2009 4041 2680 1869 1407 1851 1322 3909 2835 14108 6478 25796 12421 18501 14795 0 0
Source: Annual Report on Registration of Birth & Death, 2009, DES, Delhi
Table No. 2.8 Death by Sex and Age, 1991-2009 in Delhi
YearBelow 1 Year 1-4 Years 5-14 Years 15-24 Years 25-44 Years 45-65 Years 66 & Above Age Not Stated
30

Male Female Total
1 2 3 4 5 6
1991145694
(53.56%)
126326
(46.44%)272020 113 0.41
2001163816
(55.29%)
132471
(44.71%)296287 238 0.80
2002164184
(54.61%)
136475
(45.39%)300659 41 0.13
2003165173
(54.84%)
135992
(45.16%)301165 32 0.10
2004167849
(54.86%)
138125
(45.14%)305974 282 0.92
2005178031
(54.89%)
146305
(45.14%)324336 134 0.41
2006176242
(54.61%)
146508
(45.39%)322750 99 0.30
174289 147755
Table No. 2.9 Maternal Death Rate in Delhi
YearLive Births Maternal
Deaths
Maternal
Mortality Rate
2007174289
(54.12%)
147755
(45.88%)322044 83 0.25
2008166583
(49.87%)
167325
(50.11%)333908 67 0.20
2009185131
(52.23)
169351
(47.77)354482 151 0.43
Figures in bracket are percentage to total
Source: Annual report Births & Deaths - 2009 DES, Delhi
0.41
0.80
0.13
0.10
0.92
0.41 0.300.25
0.20
0.43
0
0.1
0.2
0.3
0.4
0.5
0.6
0.7
0.8
0.9
1
1991 2001 2002 2003 2004 2005 2006 2007 2008 2009
Mate
rnal M
ort
ali
ty R
ate
Years
Maternal Mortality Rate
31

1999-2001 2001-03 2004-06
1 2 3 4
Andhra Pradesh 220 195 154
Arunachal Pradesh NA NA NA
Assam 398 490 480
Bihar 400 371 312
Goa NA NA NA
Gujarat 202 172 160
Haryana 176 162 186
Himachal Pradesh NA NA NA
Jammu & Kashmir NA NA NA
Karnataka 266 228 213
Kerala 149 110 95
Madhya Pradesh 407 379 335
Maharashtra 169 149 130
Manipur NA NA NA
Meghalaya NA NA NA
Mi zoram NA NA NA
Nagaland NA NA NA
Orissa 424 358 303
Punjab 177 178 192
Rajasthan 501 445 388
Sikkim NA NA NA
Tamil Nadu 167 134 111
Tripura NA NA NA
Uttar Pradesh 539 517 440
West Bengal 218 194 141
A & N Islands NA NA NA
Chandigarh NA NA NA
Dadra & Nagar Haveli NA NA NA
Daman & Diu NA NA NA
Delhi NA NA NA
Lakashadweep NA NA NA
Pondicherry NA NA NA
India 327 301 254
State/Union Territory
Source: Statistics on Women in India 2010
Maternal Mortality Ratio(per 100,000 Live Births)
Table No. 2.10 Maternal Mortality Ratio in states & Union Territory
32

Age Group Urban Rural Total
1 2 3 4
Below 15 Years 0 0 0
15-24 Years 22 3 25
25-34 Years 44 1 45
35-44 Years 52 3 55
45-54 Years 25 1 26
55 & Above 0 0 0
Not Stated 0 0 0
Total 143 8 151
Source: Annual Report on Registration of Birth & Death, 2009, DES, Delhi
Table No. 2.11 Sector Wise Maternal Death by age in Delhi during 2009
33

S.No Year*Mother who had at least 3
Antenatal visit for last birth(%)
Mother who consumed IFA
for 90 days when pregnant
(%)
Mother who received post
Natal care within 2 days of
delivery(%)
1 2 3 4 5
11992-93
NFHS (1) 72.2 N.A. N.A.
21998-99
NFHS (2)68.9 N.A. N.A.
32005-06
NFHS (3)75.1 39.5 58.4
* (for birth in the last 3 years of survey)
Source : National Family Health Survey-III, International Institute for Population Science, M/O Health & Family Welfare, Govt. of India
Table No. 2.12 Mother receving Antenatal and post Natal care in Delhi
34

NFHS-3
(2005-06
NFHS-2
(1998-99)
NFHS-1
(1992-93)
NFHS-3
(2005-06
NFHS-2
(1998-99)
NFHS-1
(1992-93)
75.1 68.9 72.2 52 44.2 43.9
Source : National Family Health Survey-III, International Institute for Population Science, M/O Health & Family Welfare, Govt. of India
Table no. 2.13 Percentage of Mother receiving Antenatal care
Mother who had at least 3 Antenatal visit for last birth (for last birth to ever
married women in the three years preceeding the syrvey)
Delhi India
Percentage of Mother Receiving Antenatal Care
75.1
52
68.9
44.2
72.2
43.9
0
10
20
30
40
50
60
70
80
Delhi India
Pe
rce
nta
ge
NFHS-3 NFHS-2 NFHS-1
35

State
Percentage
who had at
least one
ANC visit
Percentage
who had
three or
more ANC
visits
Percentage
with an
ANC visit in
the first
trimester of
pregnancy
Percentage
who received
information
about specific
pregnancy
complications
Percentage
who received
two or more
TT injections
during the
pregnancy
Precentage who
received one TT injection
during the pregnancy
and at least one or more
in the three years prior to
the pregnancy
Percentage
given or
bought IFA
Percentage
who took
IFA for at
least 90
days
Percentage
who took
an intestinal
parasite
drug
India 76.4 52 43.9 36 76.3 1.5 65.1 23.1 3.8NorthDelhi 88.8 75.1 63.8 72.4 90.3 0.5 77.6 39.5 5.9Haryana 88.3 59.2 51.4 41.1 83.4 0.7 61.3 26.7 1.1Himachal Pradesh 86.4 62.6 56.8 64.3 72.1 5.3 84.2 37.5 2.8Jammu& Kashmir 84.6 73.5 54.8 31.0 81.0 1.4 67.6 27.6 1.6Punjab 88.9 74.8 60.4 63.6 83.8 0.6 65.5 27.9 2.5Rajasthan 74.9 41.2 34.0 29.8 65.2 57.7 13.1 1.4Uttaranchal 69.4 44.9 43.3 38.2 68.5 1.7 62.6 26.4 2.5CentralChhattisgarh 88.5 54.2 46.0 38.3 74.6 2.7 74.6 20.7 1.1Madhya Pradesah 79.5 40.7 39.3 34.3 70.6 3.2 62.8 12.4 3.2Uttar Pradesh 66.0 26.6 25.7 14.2 64.5 1.4 53.2 8.8 2.1EastBihar 34.1 17.0 18.7 15.8 73.2 1.3 29.7 9.7 3.7Jharkhand 58.9 35.9 33.2 23.4 67.6 1.3 49.5 14.2 4.9Orissa 86.9 61.8 48.3 37.6 83.3 0.1 83.1 33.8 4.3West Bengal 91.9 62.0 38.6 40.8 90.9 1.4 81.9 25.7 4.4Noerh EastArunachal Pradesh 52.6 35.5 24.2 32.3 40.1 0.5 47.7 11.2 4.0Assam 70.7 39.3 40.0 20.8 65.4 1.4 62.1 16.2 2.4Manipur 86.3 68.6 64.5 38.6 79.2 2.3 65.2 13.1 2.8Meghalya 67.6 54.0 32.6 28.1 51.8 1.6 54.7 16.7 2.7Mizoram 74.3 59.3 42.9 51.4 51.4 10.9 61.9 24.7 4.0Nagaland 57.8 32.7 29.2 24.5 50.7 1.7 25.6 3.5 1.4Sikkim 89.3 70.1 57.9 70.9 81.1 2.2 86.4 38.7 2.3Tripura 78.3 60.0 47.2 42.9 74.9 0.3 68.8 18.0 4.1West Goa 97.3 94.9 85.7 60.1 86.8 1.2 87.4 68.6 10.1Gujrat 86.7 67.5 55.0 59.4 80.4 1.8 82.4 37.0 7.1Maharastra 90.8 75.1 62.1 46.2 85.1 1.7 80.9 31.4 3.7SouthAndhra Pradesh 94.3 85.4 66.1 49.9 85.3 0.4 76.6 41.2 4.6Karnatka 89.3 79.5 70.9 47.6 78.6 0.9 74.3 39.3 6.8Kerala 94.4 93.6 91.9 72.9 88.7 1.9 96.4 75.1 10.1Tamil Nadu 98.6 95.9 75.3 84.4 95.9 2.0 91.9 41.6 6.5
Source : National Family Health Survey-III, International Institute for Population Science, M/O Health & Family Welfare, Govt. of India
Table No. 2.14 Antenatal Care Indicators by StateAmong women with a live birth in the five years preceding the survey, percentage who received
different types of antenatal care (ANC) during the pregnancy for their most recent live birth by state, India, 2005-06
36

NFHS-1
(1992-93)
NFHS-2
(1998-99)
NFHS-3
(2005-06)
Urban
% who received ANC1 83.00 86.50 90.70
% who had atleast 3 ANC visits1 66.80 70.10 73.80
% who received ANC within the first trimester1 40.90 55.80 63.00
% of births delivered in a health facility2 58.40 65.10 69.40
% of deliveries assisted by health personnel2.3 66.40 73.30 75.30
Rural
% who received ANC1 59.20 59.90 72.20
% who had atleast 3 ANC visits1 37.30 36.90 42.80
% who received ANC within the first trimester1 20.20 26.70 36.10
% of births delivered in a health facility2 16.70 24.70 31.10
% of deliveries assisted by health personnel2.3 25.90 33.50 39.90
Total
% who received ANC1 64.60 65.80 76.90
% who had atleast 3 ANC visits1 43.90 44.20 50.70
% who received ANC within the first trimester1 24.90 33.10 43.00
% of births delivered in a health facility2 26.10 33.60 40.80
% of deliveries assisted by health personnel2.3 35.10 42.40 48.80
1. Based on the last birht ot ever-married women in the three years preceding the survey
2. Based on the last two birht ot ever-married women in the three years preceding the survey
3. Doctor, auxiliary nurse midwife, nurse, midwife, lady health visitor, or other
Source: Women & Men (Eleventh issue), CSO, M/O Statistics & Progamme Implementation, Govt. of India
Table No. 2.15 Maternal care indicators for births during the three years preceding
the survey by residence in India
37

Maternal care indicators for births during the five years preceding the survey by state, india, 2005-06
State
Percentage who
received alll
recommended
types of
antenatal care
Percentage of
births delivered
in a health facility
Percentage of
deliveries
assisted by
health personnel
Percentage of
deliveries with a
postnatal check-
up
Percentage of
deliveries with a
postnatal check-
up within two
days of borth
India 15 38.7 46.6 41.2 37.3
North
Delhi 29 58.9 64.1 60.9 58.4
Haryana 14.7 35.7 48.9 57.6 55.9
Himachal Pradesh 17.4 43 47.8 50.6 43.2
Jammu& Kashmir 17.5 50.2 56.5 51.6 48.4
Punjab 19.6 51.3 68.2 63.7 62
Rajasthan 8.6 29.6 41 31.8 28.9
Uttaranchal 16.1 32.6 38.5 35.8 32.4
Central
Chhattisgarh 11.3 14.3 41.6 36.5 28.4
Madhya Pradesah 2.2 26.2 32.7 33.8 28.5
Uttar Pradesh 4.1 20.6 27.2 14.9 13.3
East
Bihar 5.8 19.9 29.3 17.8 15.9
Jharkhand 7.5 18.3 27.8 19.6 17
Orissa 18.4 35.6 44 40.9 33.3
West Bengal 12.3 42 47.6 44.3 40.7
Noerh East
Arunachal Pradesh 6.5 28.5 30.2 23.7 22.7
Assam 9.6 22.4 31 15.9 13.9
Manipur 10.5 45.9 59 50.1 46.4
Meghalya 8.1 29 31.1 33.2 28.8
Mizoram 8.7 59.8 65.4 53.5 50.6
Nagaland 1.9 11.6 24.7 11.8 10.6
Sikkim 22.2 42.2 53.7 52.4 44.9
Tripura 10.6 46.9 48.8 33.7 30.3
West
Goa 55.7 92.3 94 82.8 75.5
Gujrat 25.6 52.7 63 61.4 56.5
Maharastra 21.6 64.6 68.7 64 58.7
South
Andhra Pradesh 28.2 64.4 74.9 73.3 64.1
Karnatka 29.6 64.7 69.7 66.9 58.5
Kerala 63.6 99.3 99.4 87.4 84.9
Tamil Nadu 34 87.8 90.6 91.3 87.2
Table No. 2.16 Maternal care indicators by state
Source : National Family Health Survey-III, International Institute for Population Science,
M/O Health & Family Welfare, Govt. of India
38

Male Female Total
1 2 3 5 6 7 8
1990-9171454
(54.20)1749 31619
33368
(25.31)
5612
(4.26)
21394
(16.23)
131828
(100)
2000-0164863
(22.16)1951 34243
36194
(12.37)
179033
(61.17)
12572
(4.30)
292662
(100)
2001-0263421
(19.36)1788 37277
39065
(11.93)
211891
(64.69)
13155
(4.07)
327532
(100)
2002-0365304
(19.16)2011 37089
39100
(11.48)
222204
(65.21)
14142
(4.15)
340750
(100)
2003-0462528
(22.91)1712 37557
39269
(14.39)
157247
(57.61)
13884
(5.09)
272928
(100)
2004-0558984
(23.80)2060 37581
39641
(16.00)
137560
(55.51)
11612
(4.69)
247797
(100)
2005-0655810
(25.00)1616 32552
34166
(15.30)
122594
(54.89)
10742
(4.81)
223312
(100)
2006-0753003
(24.80)1320 27426
28746
(13.45)
119549
(55.95)
12377
(5.80)
213675
(100)
2007-0846020
(18.68)5447 23791
29238
(11.87)
158613
(64.40)
12443
(5.05)
246314
(100)
2008-0939687
(15.26)5282 24149
29431
(11.32)
181412
(69.77)
9476
(3.64)
26006
(100)
35238 32434 297358 8255 373285
Table No. 2.17 Family welfare programme users (by methods) in Delhi
SterilizationYears
Insertion of
Contraceptive Device
Oral Pills
(Cycles)
Condoms
('000)Total
2009-10
35238
(9.43)6687 25747
32434
(8.68)
297358
(79.65)
8255
(2.21)
373285
(100)
Source : Delhi Statistical Hand Book- 2010, DES Delhi
P.S. figures in the bracket depicts Percentage to total
71
45
4
64
86
3
63
42
1
65
30
4
62
52
8
58
98
4
55
81
0
53
00
3
46
02
0
39
68
7
35
23
8
33
36
9
36
19
4
39
06
5
39
10
0
39
26
9
39
64
1
34
16
6
28
74
6
29
23
8
29
43
1
32
43
4
56
12
17
90
33
21
18
91
22
22
04
15
72
43
13
75
60
12
25
94
11
95
49
15
86
13
18
14
12
29
73
58
21
39
4
12
57
2
13
15
5
14
14
2
13
88
4
11
61
2
10
74
2
12
37
7
12
44
3
94
76
82
55
0
50000
100000
150000
200000
250000
300000
350000
1990-91 2000-01 2001-02 2002-03 2003-04 2004-05 2005-06 2006-07 2007-08 2008-09 2009-10
Nu
mb
ers
Years
Family Wefare programme users (by methods )in Delhi
Insertion of Contraceptive Device Sterilization Oral Pills (Cycles) Condoms('000)
39

Number Rate Number Rate Number Rate
1 2 3 4 5 6 7 8 9
1991-92 4090039 80827473 93.5 4346271 46437174 53.7 17240359 20.0
1996-97 3870226 102483288 107.5 5680671 76434294 80.5 22464352 23.6
1997-98 4238514 106721802 110.5 6172904 82607198 85.5 23190523 24.0
1998-99 4206726 110928528 113 6082558 88689756 90.4 24392339 24.9
1999-00 4595466 115523994 115.9 6199845 94889601 95.2 25882987 26.0
2000-01 4735149 120259143 118.8 6047275 100936876 25843521 25.5
2001-02 4827265 125086408 121.8 6272545 107209421 104.4 26480568 25.6
2002-03 4903388 129989796 124 6148036 113357457 108.2 32016650 24.8
2003-04 4924824 134914620 130.9 6114667 119472124 116.1 33764698 32.8
2004-05 4920144 139834764 129.6 6169003 125641127 116.4 33482977 31.0
2005-06 4692031 144526795 131.9 6168268 131809395 120.3 35227074 32.1
2006-06(p) 4514092 149040887 134 5945859 137755254 123.9 35725995 32.1
Andhra pradesh 767593 18517484 229.4 402032 6746827 83.6 1108602 13.7
Aunachal pradesh 1427 37318 31.9 2777 59800 51.2 2487 2.1
Assam 17282 1955885 68.2 32560 982109 34.3 77434 2.7
Bihar 119977 8410487 92.7 79968 4599631 50.7 100466 1.1
Chattisgarh 133094 792741 35.1 117371 723369 32 527016 23.3
Goa 5325 147482 98.8 2539 78327 52.5 11270 7.6
Gujrat 267549 9137509 166.2 464484 9628572 175.1 1320466 24.0
Haryana 85751 3026994 129.8 153850 4464841 191.5 456126 19.6
Himachal Pradesh 26445 1077558 166.9 28963 947874 146.8 121001 18.7
Jammu & Kashmir 17985 622477 56.9 28875 476248 43.5 37382 3.4
Jharkhand 101297 475896 16.2 27673 395955 13.5 184893 6.3
Karnataka 375303 1.0566E+14 187.8 291134 7038623 125.1 475895 8.5
Kerala 127701 11554382 171.2 68772 2437863 73.3 190705 5.7
Madhya Pradesh 366842 20356775 174 461265 11059634 166.6 1914568 28.8
Maharashtra 595728 97215 194.2 421584 11669236 111.3 738177 7.0
Manipur 185 44363 42.1 3362 191476 83 2216 1.0
Meghalaya 2533 89980 18 2076 53871 21.8 4963 2.0
Mizoram 2342 28421 95.1 2609 56859 60.1 15389 16.3
Nagaland 972 4945468 13.4 1564 42390 20 1329 0.6
Orissa 93739 3643282 127.2 161574 4223557 108.6 555923 14.3
Punjab 93758 6572452 139.8 335263 9566240 367.1 564483 21.7
Rajasthan 288089 26949 105.5 303358 4937211 79.3 2560688 41.1
Sikkim 1471 13316251 46.8 1437 3282 55.9 6558 11.4
Tamil Nadu 356936 220756 204.4 359056 9472556 145.4 273875 4.2
Tripura 3303 14053895 64.8 2201 75028 22 33207 9.7
Uttar pradesh 429441 219772 76.7 1855238 41147898 224.5 2564322 14.0
Uttrakhand 32767 10223976 23.8 140899 8012118 86.9 159413 17.3
West Bengal 136757 102 74842 2971210 34.9 1274728 15.0
A&N Islands 988 46754 111.6 904 35883 85.6 4093 9.8
Chandigarh 2385 91253 82.7 4237 178716 162 10716 9.7
D.& N. Haveli 978 26108 98.2 195 5590 21 11269 42.4
Daman&Diu 500 11618 53.8 272 5489 25.4 2551 11.8
Dehli 28746 1191280 74.4 53003 1871282 116.8 180881 11.3
Lakshadeep 40 1392 19.3 45 1873 26 825 11.5
Puducherry 10483 269715 245.6 3506 118432 107.9 12314 11.2
Other Agencie4s
Ministry of Defence 13459 699214 - 6168 333106 - 23072 -
Ministry of Railways 4921 845612 - 4203 324278 - 33940 -
Commercial
distribution- - - - - - 20162752 -
Source: Statistical Abstract India - 2007 43rd Edition, CSO Page No. 590
State:2006-07(p)
Unoin Territory
Table no 2.18 ACHIEVEMENTS OF FAMILY WELFARE PROGRAMME STATE/U.T.
Cumulative number
of IUD inserttions(1)
Cumulative number
of sterlisations(1)
No. of conventional
contraceptive users during
the year
Number of
sterlisations
during the year
Number of IUD
insertions
during the year
Year/ State / U.T
40

Table No. 2.19 Effiective couple protection Rate (CPR) due to all methods as on 31st March - India & States
States/Uts 1980 1985 1990 1995 2000 2001 2002 2003 2004 2005 2006 2007 2008
1 2 3 4 5 6 7 8 9 10 11 12 13 14
Andhra Pradesh 25.6 32.0 42.9 49.4 52.8 55.5 56.9 59.3 61.0 62.4 63.3 63.9 66.3
Arunachal Pradesh 1.8 4.4 9.6 12.9 14.0 15.6 15.6 15.9 15.3 15.5 15.7 15.9 15.6
Assam 19.3 24.9 28.2 22.6 15.2 14.1 12.9 12.6 12.4 12.4 11.6 10.7 9.6
Bihar 12.4 17.2 28.3 22.4 21.2 17.4 17.3 17.3 15.2 16.6 13.8 13.5 13.9
Goa 16.3 23.0 33.2 34.8 23.9 30.4 30.6 35.0 34.4 31.8 31.1 30.8 30.3
Gujarat 31.3 45.5 56.5 61.0 52.8 51.2 50.2 50.5 50.6 50.2 49.4 49.3 50.7
Haryana 29.1 45.8 58.9 56.0 49.4 47.1 46.0 45.0 44.1 43.3 42.6 41.9 41.4
Himachal Pradesh 24.4 35.7 50.1 57.9 46.9 52.9 51.6 51.3 50.6 50.5 49.1 48.0 47.1
Jammu & Kashmir 11.0 15.8 21.7 19.2 14.4 14.1 14.3 14.7 15.3 15.9 15.9 16.4 16.9
Karnataka 22.3 32.8 46.0 52.7 56.3 57.8 57.8 57.6 57.0 56.7 56.4 55.8 54.9
Kerala 28.9 38.1 54.4 50.7 39.6 40.3 39.2 38.9 38.4 37.8 37.5 36.3 34.9
Madhya Pradesh 21.7 29.5 39.4 48.0 45.9 46.9 47.3 48.6 48.4 47.2 49.9 51.1 50.8
Maharashtra 34.5 51.8 54.4 54.1 49.3 47.9 48.1 48.3 48.5 48.8 48.4 47.6 46.4
Manipur 10.1 18.1 26.4 23.0 17.8 19.8 17.3 16.5 15.6 14.5 14.1 11.7 9.9
Meghalaya 6.4 5.7 5.2 4.3 4.7 6.0 6.4 7.1 7.7 8.1 8.1 8.2 8.1
Mi zoram 11.5 23.8 39.1 47.3 34.3 38.7 40.4 41.9 43.3 42.8 41.5 40.2 36.8
Nagaland 0.9 2.3 4.6 9.0 8.2 7.7 9.5 11.3 10.3 9.2 8.8 8.3 7.9
Orissa 26.9 32.8 40.7 40.6 37.6 36.7 35.0 33.2 31.9 32.0 31.0 30.5 29.7
Punjab 23.5 48.9 73.2 79.1 65.5 63.9 63.2 59.9 57.4 56.5 56.1 55.0 53.5
Rajasthan 13.3 19.8 30.0 30.2 36.1 37.9 38.1 40.5 42.9 45.0 46.3 47.1 47.9
Sikkim 7.4 11.5 19.9 21.7 21.5 22.4 23.5 23.8 25.0 26.6 27.7 26.2 26.8
Tamil Nadu 28.2 36.1 57.1 54.8 50.4 50.3 49.6 49.1 49.6 49.0 48.4 47.3 46.6
Tripura 10.1 11.2 17.0 23.8 23.4 26.9 29.0 27.0 27.2 22.2 22.0 19.4 17.8
Uttar Pradesh 11.5 17.1 33.3 37.1 38.0 37.9 37.4 37.1 36.8 36.0 35.2 34.6 34.1
West Bengal 21.4 27.3 33.1 35.7 32.2 33.3 32.8 32.1 31.1 31.3 30.8 29.9 30.2
A & N Islands 13.4 27.1 40.4 44.0 38.4 43.4 44.6 43.0 42.0 40.1 37.1 34.5 31.2
Chandigarh 27.3 37.0 43.1 40.9 33.5 34.8 34.0 32.2 30.6 29.1 28.1 24.9 23.5
Dadra & Nagar Haveli 13.5 31.4 48.8 41.2 27.5 23.7 23.1 22.7 21.7 35.6 31.1 33.2 27.9
Daman & Diu 12.4 22.4 30.0 37.0 29.3 27.1 26.3 25.8 25.0 24.3 22.7 22.7 22.4
Delhi 34.8 35.6 41.7 40.6 27.0 27.7 27.4 27.1 26.1 24.9 23.7 23.0 21.9
Lakashadweep 8.2 9.9 9.0 8.0 7.2 8.6 8.0 9.0 6.4 7.5 7.3 8.4 8.5
Pondicherry 37.1 52.4 60.3 64.8 58.4 71.2 75.1 76.9 76.8 75.6 73.7 71.4 68.4
All India 22.3 32.1 43.3 45.8 46.2 45.6 45.7 47.1 47.2 46.6 46.7 46.2 46.5
Union Territory
Source : Compendium of Selected indicators of indian Economy 2009, M/O Statistics and Programme Implementation, CSO, Govt. of India
41

Delhi India
1 2 3
1980 34.8 22.3
1985 35.6 32.1
1990 41.7 43.3
1991 40.4 44.1
1992 42.2 43.6
1993 43.1 43.5
1994 41.7 45.4
1995 40.6 45.8
1996 37.4 46.5
1997 33.9 45.4
1998 29.5 48.4
1999 34.2 48.6
2000 27.0 46.2
2001 27.7 45.6
2002 27.4 45.7
2003 27.1 47.1
2004 26.1 47.2
2005 24.9 46.6
2006 23.7 46.7
2007 23.0 46.2
Sources: Women & Men (Eleventh issue), CSO, M/O Statistics & Progamme Implementation, Govt. of India (for 2007)
Selected Socio-Economics Statistics India - 2008, CSO, M/O Statistics & Progamme Implementation, Govt. of India
YearCouple Protection Rate (CPR)
Table No. 2.20 Effective Couples Protection Rate (CPR) Due To All Methods As On 31st March, Delhi Vis-Avis India
42

NFHS-3
(2005-06)
NFHS-2
(1998-99)
NFHS-1
(1992-93)
Married Women with 2 living children,
wanting no more children91.6 84.3 78.2
(a) Two Sons 95.2 90.1 86.8
(b) One son, one daughter 94.6 89.3 86.0
(c) Two daughter 70.7 52.9 43.8
Table No. 2.21 Sex preference of women with two children living,
wanting no more children in Delhi (%)
Source : National Family Health Survey-III, International Institute for Population Science,
M/O Health & Family Welfare, Govt. of India
43

T R U T R U T R U T R U
India 83.2 79.9 88.9 88.9 88.6 92.1 88.1 85.3 92.8 62.1 54.4 74.7
Andhra Pradesh 91.5 91.2 92.0 94.1 94.7 92.8 93.6 93.5 93.9 85.0 83.2 88.5
Arunachal Pradesh 72.2 71.4 73.8 85.0 85.0 * 76.0 76.7 74.4 45.5 * *
Assam 82.9 79.8 93.8 85.2 82.8 94.2 89.7 87.6 96.5 67.1 60.3 87.2
Bihar 60.2 56.1 80.2 77.4 75.6 85.7 67.5 62.4 92.0 20.0 15.6 41.9
Chhattisgarh 75.3 71.2 87.2 85.7 83.3 94.4 77.3 73.1 88.4 46.8 33.3 73.0
Delhi 91.6 * * 95.2 * 94.6 * * 70.7 * *
Goa 82.5 81.4 83.2 86.3 89.1 84.2 84.8 84.7 84.9 71.7 63.8 77.4
Gujarat 85.7 83.6 87.9 94.8 96.0 93.3 90.1 86.0 93.7 48.8 50.0 47.5
Haryana 87.8 87.8 87.6 97.4 97.7 96.7 91.8 91.4 92.7 25.8 17.9 *
Himachal Pradesh 96.3 96.2 96.6 99.5 99.5 98.8 99.4 99.4 99.4 63.7 62.0 74.1
Jammu & Kashmir 77.6 71.5 87.1 84.9 81.6 90.8 82.5 73.5 94.2 38.6 34.1 46.4
Jharkhand 64.3 55.6 82.7 79.9 72.7 96.5 69.3 60.5 85.8 32.1 22.7 51.4
Karnataka 88.4 87.8 89.2 92.7 92.5 93.1 91.4 90.9 92.3 76.9 72.9 80.8
Kerala 88.0 85.5 93.0 87.5 84.5 92.8 90.9 89.3 94.5 86.4 82.8 92.6
Madhya Pradesh 81.9 79.9 86.0 92.1 92.5 91.2 89.7 87.1 94.3 37.6 27.8 57.0
Maharashtra 88.0 87.4 88.5 95.5 97.5 93.1 92.8 94.2 91.5 55.1 36.5 69.2
Manipur 64.5 60.2 72.7 68.8 62.1 81.0 75.8 75.5 76.4 24.3 19.6 35.0
Meghalaya 36.0 27.3 55.4 33.1 25.9 45.5 44.2 36.2 61.4 27.1 14.3 60.7
Mi zoram 43.0 35.0 48.0 51.4 * 63.6 51.7 51.2 51.9 35.4 * 35.7
Nagaland 57.8 52.1 67.7 62.2 57.5 67.9 60.7 53.5 75.0 46.7 40.5 57.7
Orissa 82.3 79.5 94.3 90.3 89.2 94.8 87.6 85.0 97.5 53.2 48.5 78.9
Punjab 91.2 90.8 91.7 96.5 97.9 94.1 95.3 95.1 95.7 43.4 31.6 *
Rajasthan 72.8 64.6 85.3 83.9 79.2 92.1 77.7 68.9 90.5 33.1 18.2 51.4
Sikkim 95.8 95.8 95.7 97.9 98.6 95.7 97.0 97.2 96.6 88.8 88.6 *
Tamil Nadu 94.6 94.1 95.2 96.3 96.0 96.7 95.9 96.0 95.7 90.0 85.6 94.4
Tripura 92.3 92.6 91.2 93.8 94.9 89.3 94.4 94.6 93.8 84.4 83.0 88.5
Uttarakhand 86.3 85.7 87.5 93.0 93.0 93.0 91.3 91.1 91.7 49.4 40.6 60.7
Uttar Pradesh 64.2 58.6 76.3 73.7 71.4 78.3 72.2 66.5 84.2 30.8 21.3 51.9
West Bengal 89.4 87.2 95.2 93.5 91.9 97.6 92.9 91.3 96.9 74.3 86.8 68.9
Source: International institute for Population Science, (2006), NFHS-3 2005-06 India, Mumbai, P-3
(Statistics on Women in India 2007, National Institute of Public Cooperation and Child Development)
Married women
wanting no more
children, with one
son, one daughter
living(%)
Married women
wanting no more
children, with two
daughters living(%)
India/State/UTs
Table No. 2.22 Sex preference of women with two children living,
wanting no more children (%), 2006
Married women with
2 living children,
wanting no more
children (%)
Married women
wanting no more
children, with two
sons living(%)
Note: *Not shown on fewer than 25 unweighted cases.
44

Physiciaan,
Nurse,
Trained Mid-
Wife
Untrained
Mid-WifeOthers
Physiciaan,
Nurse,
Trained Mid-
Wife
Untrained
Mid-WifeOthers
1 2 3 4 5 6 7 8 9 10
1991 272020 2028 1831 22791 66 146393 21803 76464 642
2001 296287 10351 16421 1229 0 173669 86369 8215 33
2002 300659 12025 17300 1783 0 188968 73195 7351 37
2003 301165 6451 4210 1505 640 208533 70102 8885 839
2004 305974 6520 4271 1523 645 212386 50741 29045 843
2005 324336 7638 0 379 3942 231463 1041 61758 18115
2006 322750 9528 382 814 1634 241952 14337 41179 12924
2007 322044 12284 315 1028 3095 227870 16644 43611 17197
2008 333908 9450 757 1342 3655 235804 26972 35700 20228
2009 354482 12413 119 1188 3443 255706 25349 41257 15007
Source: Annual Report on Registration of Birth & Death, 2009, DES, Delhi
Table No. 2.23 Live birth Sector-wise by the type of attention at delivery in Delhi
Year Total Births
Domicliary
Rural Urban
Institutional Institutional
Domicliary
45

InstitutiionalNon-
Institutional Total Institutiional
Non-
Institutional Total Institutiional
Non-
Institutional Total
1 2 3 4 5 6 7 8 9 10
19912028
(7.59)
24690
(92.41)
26718
(100%)
146393
(59.68)
98909
(40.32)
245302
(100%)
148421
(54.56)
123599
(45.44)
272020
(100%)
200110851
(36.97)
17650
(63.03)
28501
(100%)
173669
(64.73)
94617
(35.27)
268286
(100%)
184020
(62.11)
112267
(37.89)
296287
(100%)
200212025
(38.66)
19083
(61.34)
31108
(100%)
188968
(70.10)
80583
(29.90)
269551
(100%)
200993
(66.85)
99666
(33.15)
300659
(100%)
20036451
(50.37)
6355
(49.63)
12806
(100%)
208533
(72.32)
79826
(27.68)
288359
(100%)
214984
(71.38)
86181
(28.62)
301165
(100%)
20046520
(50.31)
6439
(49.69)
12959
(100%)
212386
(72.48)
80629
(27.52)
293015
(100%)
218906
(71.54)
87068
(28.46)
305974
(100%)
20057638
(63.87)
4321
(36.13)
11959
(100%)
231463
(74.10)
80914
(25.90)
312377
(100%)
239101
(73.72)
85235
(26.28)
324336
(100%)
20069528
(77.10)
2830
(22.90)
12358
(100%)
241952
(77.95)
68440
(22.05)
310392
(100%)
251480
(77.92)
71270
(22.08)
322750
(100%)
200712284
(73.46)
4438
(26.54)
16722
(100%)
227870
(74.63)
77452
(25.37)
305322
(100%)
240154
(74.52)
81890
(25.43)
322044
(100%)
20089450
(62.15)
5754
(37.85)
15204
(100%)
235804
(73.99)
82900
(26.01)
318704
(100%)
245254
(73.45)
88654
(26.55)
333908
(100%)
200912413
(72.32)
4750
(26.68)
17163
(100%)
255706
(75.80)
81613
(24.20)
337319
(100%)
268119
(75.64)
86363
(24.36)
354482
(100%)
Table No. 2.24 Sectro-wise (total & %) Live birth by the type of attention at Delivery in Delhi
YearRural Urban Combined
46
(72.32) (26.68) (100%) (75.80) (24.20) (100%) (75.64) (24.36) (100%)
Source : Annual Report on registration of Birth & Death, 2009, DES Delhi
0
5000
10000
15000
20000
25000
1991 2001 2002 2003 2004 2005 2006 2007 2008 2009
20
28
10
85
1
12
02
5
64
51
65
20
76
38
95
28
12
28
4
94
50 12
41
3
24
69
0
17
65
0
19
08
3
63
55
64
39
43
21
28
30
44
38
57
54
47
50
Nu
mb
er
Years
Live Birth By The Type Of Attention At Delivery (Rural)
Institutiional Non-Institutional
0
50000
100000
150000
200000
250000
300000
1991 2001 2002 2003 2004 2005 2006 2007 2008 2009
14
63
93
17
36
69
18
89
68
20
85
33
21
23
86
23
14
63
24
19
52
22
78
70
23
58
04
25
57
06
98
90
9
94
61
7
80
58
3
79
82
6
80
62
9
80
91
4
68
44
0
77
45
2
82
90
0
81
61
3
Nu
mb
er
Years
Live Birth By The Type Of Attention At Delivery (Urban)
Institutiional Non-Institutional
46

Physician/Nurse/Trained
MidwifeUntrained Midwife Others
1 2 3 4 51991 54.56 8.69 36.49 0.26
2001 62.11 34.69 3.19 0.01
2002 66.85 30.1 3.04 0.01
2003 71.38 24.67 3.45 0.5
2004 71.54 17.98 9.99 0.49
2005 73.72 0.32 19.16 6.8
2006 77.92 4.56 13.01 4.51
2007 74.57 5.27 13.86 6.30
2008 73.45 8.31 11.09 7.15
2009 75.64 7.18 11.97 5.21
Year
Percentage of BirthNon-Institutional & Type of Medical Attention
Table No. 2.25 Institutional and Non-Institutional Birth in Delhi
Institutional Birth
Source : Annual Reports, Birth & Death - 2009, DES, Delhi
100%
Institutional and Non-Institutional Birth (in %)
47
0%
10%
20%
30%
40%
50%
60%
70%
80%
90%
1991 2001 2002 2003 2004 2005 2006 2007 2008 2009
Years
Institutional Birth Physician/Nurse/Trained Midwife Untrained Midwife Others
47

Total Rural Urban Total Rural Urban
1 2 3 4 5 6 7 8
India 52.6 43.4 75.8 47.0 37.8 70.5
1 Andhra Pradesh 75.6 70.0 93.4 71.8 65.7 90.9
2 Arunachal Pradesh 48.9 43.8 68.5 47.7 42.5 67.7
3 Assam 40.9 37.6 73.1 35.3 32.0 66.8
4 Bihar 31.9 29.7 59.9 27.7 25.6 54.3
5 Chhattisgarh 29.6 24.1 64.6 18.8 13.2 48.4
6 Delhi 71.8 61.3 72.6 68.6 56.9 69.6
7 Goa 97.8 98.9 96.8 96.3 97.8 95.1
8 Gujarat 62.1 54.5 86.7 56.5 48.1 83.7
9 Haryana 53.4 48.0 69.6 46.9 42.2 61.4
10 Himachal Pradesh 51.0 48.8 73.8 48.2 46.1 71.1
11 Jammu & Kashmir 59.1 54.4 87.5 55.0 49.9 85.9
12 Jharkhand 25.0 21.0 64.3 17.8 13.4 59.3
13 Karnataka 71.5 66.7 84.7 65.1 59.7 79.8
14 Kerala 99.4 99.3 99.9 99.4 99.3 99.9
15 Madhya Pradesh 50.1 43.4 76.7 47.1 40.8 72.2
16 Maharashtra 69.4 61.1 90.1 63.6 54.1 87.3
17 Manipur 55.8 48.1 90.3 41.1 33.8 73.6
18 Meghalaya 29.0 25.2 63.6 24.4 20.6 58.9
19 Mi zoram 63.5 50.7 88.2 55.9 40.4 85.7
20 Nagaland NA NA NA 0.0 0.0 0.0
21 Orissa 50.9 47.4 78.3 44.3 40.4 74.4
22 Punjab 77.1 74.5 83.5 63.3 59.7 72.3
23 Rajasthan 52.7 48.2 73.7 45.5 40.7 67.7
24 Sikkim 56.9 55.1 90.3 49.8 48.0 83.4
25 Tamil Nadu 95.6 93.9 98.2 94.1 91.8 97.6
26 Tripura 47.3 42.7 92.1 46.3 41.6 92.1
27 Uttar Pradesh 30.1 27.0 47.1 24.5 22.1 38.1
28 Uttarakhand 35.5 30.1 66.7 30.0 25.2 58.5
29 West Bengal 51.6 46.1 82.8 49.2 43.4 81.3
30 A & N Islands 77.5 73.5 91.7 76.3 72.4 89.8
31 Chandigarh 78.5 57.2 82.1 73.6 50.8 77.4
32 Dadra & Nagar Haveli 47.1 36.6 90.1 46 35.6 88.6
33 Daman & Diu 69.4 63.6 80.1 64 60.2 71.2
34 Lakashadweep NA NA NA 0 0 0
35 Pondicherry 99.4 98 99.9 99.1 97.4 99.6
Source: Statistics on Women in India 2010
Table No. 2.26 Safe Delivery and Assissted Delivery among Women, 2007-08
Union Territory
Births Assisted by
Doctor/Nurse/Health Personnel
(%)
Institutional Deliveries (%)S.No. India/States/Uts
48

Year Below 14 15-19 23-24 25-29 30-34 35-39 40-4445 &
Above
Age not
stated
1 2 3 4 5 6 7 8 9 10
1991 2 12741 121782 94763 28407 8648 2016 569 3094
2001 0 5450 94339 121138 24546 6040 763 78 43933
2002 0 4764 88578 113324 24909 6342 745 43 61965
2003 0 7756 134886 110422 29561 6719 643 66 11112
2004 0 7155 141803 117401 30783 7110 672 65 985
2005 0 7310 151208 125066 31970 7619 556 75 532
2006 0 6362 147047 128049 30244 6604 609 53 3782
2007 0 6342 156862 120428 30940 6751 584 63 74
2008 0 6367 166499 120964 32165 7225 595 90 0
2009 0 6164 162331 137855 39550 7674 687 83 128
Source: Annual Report on Registration of Birth & Death, 2009, DES, Delhi
Table No. 2.27 Live birth by age of Mother in Delhi
49
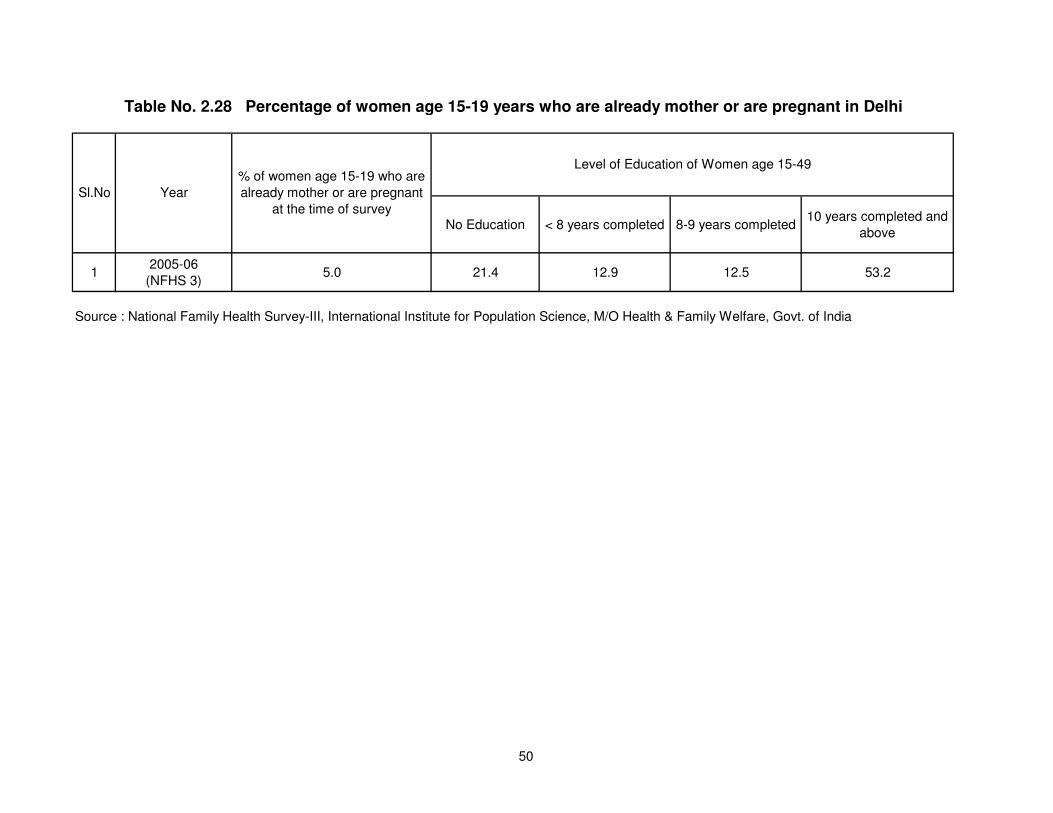
No Education < 8 years completed 8-9 years completed10 years completed and
above
12005-06
(NFHS 3) 5.0 21.4 12.9 12.5 53.2
Source : National Family Health Survey-III, International Institute for Population Science, M/O Health & Family Welfare, Govt. of India
Level of Education of Women age 15-49
Table No. 2.28 Percentage of women age 15-19 years who are already mother or are pregnant in Delhi
YearSl.No
% of women age 15-19 who are
already mother or are pregnant
at the time of survey
50

Total Rural Urban
India 44.5 52.5 28.1 296790
1 Andhra Pradesh 54.7 61.4 41.2 12848
2 Arunachal Pradesh 40.6 39.8 42.5 267
3 Assam 38.0 41.3 23.3 7045
4 Bihar 60.3 65.2 37.3 31665
5 Chhattisgarh 51.8 60.3 25.4 4060
6 Delhi 21.2 41.1 61.6 2348
7 Goa 11.7 7.8 14.6 127
8 Gujarat 33.5 37.9 27.3 12300
9 Haryana 39.8 42.8 33.3 7605
10 Himachal Pradesh 12.3 12.2 13.6 1280
11 Jammu & Kashmir 14.0 17.1 4.9 5159
12 Jharkhand 61.2 71.0 33.6 5713
13 Karnataka 41.2 49.4 28.0 11822
14 Kerala 15.4 19.4 9.2 3504
15 Madhya Pradesh 53.0 62.0 31.1 16211
16 Maharashtra 38.8 48.9 28.9 15672
17 Manipur 12.7 13.2 11.7 349
18 Meghalaya 24.5 28.1 15.6 458
19 Mi zoram 20.6 25.0 16.9 115
20 Nagaland 21.1 23.7 14.6 464
21 Orissa 36.3 38.7 24.3 8565
22 Punjab 19.4 20.4 17.7 8387
23 Rajasthan 57.1 65.7 35.8 21156
24 Sikkim 30.1 34.5 15.9 129
25 Tamil Nadu 21.5 26.1 17.2 15896
26 Tripura 41.0 41.7 37.8 728
27 Uttar Pradesh 53.0 61.1 30.0 73408
28 Uttarakhand 22.6 24.7 16.3 1987
29 West Bengal 53.3 62.6 31.5 27082
Union Territories
30 Andaman & Nicobar Islands 74
31 Dadra & Nagar Haveli 19
32 Daman & Diu 18
33 Lakshadweep 4
34 Pondicherry 112
35 Chandigarh 213
Source: International institute for Population Science, (2006), NFHS-3 2005-06 India, Mumbai, P-3
# National Centre for Advocacy Studies (2005). Parliament Digest Monsoon Session 2005: Bridging the gap between
Parliament and People: Gender, Agriculture, Natural Resources, Social Development Indicators, New Delhi P-2.
Source: Statistics on Women in India 2007, National Institute of Public Cooperation and Child Development
S.No.
Table No. 2.29 Incidence of Early Marriage, 2006 and Early Motherhood in India, 2001
Percentage Women 20-24 Years
Married before 18 years 2006No. of Ever Married Mothers
Below 15 Years of Age 2001#India/State
51

S.No. India/StateDecision making on health care by married women aged
15-49 years (%)
1 India 51.6
2 Delhi 68.7*
Source: NFHS-2 1998-99, India, Mumbai, P-44
* Delhi ranks 9th on all India basis
Table No. 2.30 : Decision making by ever married women aged 15-49 Years on own
health care (%) 1998-99
Source: Statistics on Women in India 2007, National Institute of Public Cooperation & Child Development
52

India/StateNFHS-1
(1992-03)
NFHS-2
(1998-99)
NFHS-3
(2005-06)
India 3.39 2.85 2.68
Andhra Pradesh 2.59 2.25 1.79
Arunachal Pradesh 4.25 2.52 3.03
Assam 3.53 2.31 2.42
Bihar N.A 3.7 4
Chhattisgarh N.A 2.79 2.62
Delhi 3.02 2.4 2.13
Goa 1.9 1.77 1.79
Gujarat 2.99 2.72 2.42
Haryana 3.99 2.88 2.69
Himachal Pradesh 2.97 2.14 1.94
Jammu & Kashmir N.A 2.71 2.38
Jharkhand N.A 2.76 3.31
Karnataka 2.85 2.13 2.07
Kerala 2 1.96 1.93
Madhya Pradesh N.A 3.43 3.12
Maharashtra 2.86 2.52 2.11
Manipur 2.76 3.04 2.83
Meghalaya 3.73 4.57 3.8
Mi zoram 2.3 2.89 2.86
Nagaland 3.26 3.77 3.74
Orissa 2.92 2.46 2.37
Punjab 2.92 2.21 1.99
Rajasthan 3.63 3.78 3.21
Sikkim N.A 2.75 2.02
Tamil Nadu 2.48 2.19 1.8
Tripura 2.67 1.87 2.22
Uttar Pradesh N.A 4.06 3.82
Uttarakhand N.A 2.61 2.55
West Bengal 2.92 2.29 2.27
Source: NFHS-National Family Health Survey
Table No. 2.31 Total Fertility Rate (15-49 Years female)
53

15-19 20-24 25-29 30-34 35 & Above
1 2 3 4 5 6
1991 4.41 44.45 34.94 10.70 5.50
2001 1.84 31.84 40.89 8.28 17.15
2002 1.58 29.46 37.69 8.28 22.99
2003 2.58 44.78 36.66 9.82 6.16
2004 2.34 46.34 38.37 10.06 2.89
2005 2.25 46.62 38.56 9.86 2.71
2006 1.97 45.56 39.67 9.37 3.43
2007 1.97 48.71 37.39 9.61 2.32
2008 1.91 49.86 36.23 9.63 2.37
2009 1.74 45.79 38.90 11.16 2.41
Table No. 2.32 Percentage distribution of Births by Age of Mother in Delhi
Year
Age Group of Mothers in Years
54
2009 1.74 45.79 38.90 11.16 2.41
Source: Annual Report on Registration of Birth & Death, 2009, DES, Delhi
0
10
20
30
40
50
60
1991 2001 2002 2003 2004 2005 2006 2007 2008 2009
Perc
en
tag
e
Years
Percentage distribution of Births by Age of Mother in Delhi
15-19 20-24 25-29 30-34 35 & Above
54

Have had a live birthAre pregnant pregnant
with first child
Percentage who have
begun childbearing
1 2 3 4
India 12.1 3.9 16
North
Delhi 3.8 1.2 5
Haryana 7.5 4.6 12.1
Himachal Pradesh 2.1 0.9 3.1
Jammu & Kashmir 13.4 0.8 4.2
Punjab 3.6 1.9 5.5
Rajasthan 12.6 3.4 16
Uttaranchal 3.6 2.6 6.2
Central
Chhattisgarh 11.2 3.4 14.6
Madhya Pradesah 10.6 3 13.6
Uttar Pradesh 11.2 3.1 14.3
East
Bihar 19.3 5.7 25
Jharkhand 19.3 6.8 27.5
Orissa 19.3 4.1 14.4
West Bengal 19.3 6 25.3
Northeast
Arunachal Pradesh 12.4 3 15.4
Assam 13.1 3.2 16.4
Manipur 5.2 2.1 7.3
Meghalya 6.7 1.5 8.3
Mizoram 7.7 2.5 10.1
Nagaland 5.5 3.9 7.5
Sikkim 8.7 3.2 12
Tripura 14 4.5 18.3
Goa 2.6 1.1 3.6
Gujrat 8.9 3.7 12.7
Maharastra 11.1 2.9 13.8
South
Andhra Pradesh 12.7 5.4 18.1
Karnatka 12.8 4.3 17
Kerala 2.9 2.9 5.8
Tamil Nadu 4.8 2.9 7.7
Source-National Family Health Survey (NFHS-3) Vol.-I
Percentage of women age 15-19 who have had a live birth or who are pregnant with their first child and
percentage who have begun child , bearing ,by state , india 2005-06
State
Percentage who
Table No. 2.33 Teenage pregnancy and motherhood by state :
55

S.No YearChildren aged 6-35 month
who are anaemic (%)
Ever married women aged
15-49 year who are
anaemic(%)
Pregnant women aged 15-
49 year who are anaemic
(%)
Ever married men aged 15-
49 year who are anaemic
(%)
1 2 3 4 5 6
11992-93
NFHS (1)N.A N.A N.A N.A
21998-99
NFHS (2) 69 40.5 34.7 N.A
32005-06
NFHS (3) 63.2 43.4 29.9 18.9
Table No. 2.34 Anaemia among children & women in Delhi
NFHS (3)
Source : National Family Health Survey-III, International Institute for Population Science, M/O Health & Family Welfare, Govt. of India
69.0
40.534.7
63.2
43.4
29.9
0
10
20
30
40
50
60
70
80
Children aged 6-35 month who are anaemic Ever married women aged 15-49 year who are anaemic
Pregnant women aged 15-49 year who are anaemic
Perc
en
tag
e
Anaemia among children & women in Delhi
NFHS2 NFHS3
56

India/State
Mid anaemia Moderate anaemia Severe anaemia
1 2 3 4 5
Andhra Pradesh 39.0 20.6 3.3 62.9
Arunachal Pradesh 36.6 12.5 1.6 50.6
Assam 44.8 21.2 3.4 69.4
Bihar 50.5 15.9 1.0 67.4
Chhattisgarh 39.9 15.7 1.9 57.5
Delhi 35.2 8.8 0.2 44.3
Goa 29.6 7.8 0.6 38.0
Gujarat 36.2 16.5 2.6 55.3
Haryana 37.6 16.7 1.7 56.1
Himachal Pradesh 31.6 10.5 1.2 43.3
Jammu & Kashmir 37.3 13.1 1.6 52.1
Jharkhand 49.6 18.6 1.3 69.5
Karnataka 34.4 15.1 2.0 51.5
Kerala 25.8 6.5 0.5 32.8
Madhya Pradesh 40.8 14.1 1.0 56.0
Maharashtra 32.8 13.9 1.7 48.4
Manipur 30.1 5.1 0.5 35.7
Meghalaya 32.8 12.6 1.8 47.2
Mi zoram 29.1 8.8 0.7 38.6
Nagaland - - - -
Orissa 44.9 14.9 1.5 61.2
Punjab 26.2 10.4 1.4 38.0
Rajasthan 35.2 15.4 2.5 53.1
Sikkim 42.1 16.2 1.7 60.0
Tamil Nadu 37.4 13.6 2.2 53.2
Tripura 49.0 14.8 1.3 65.1
Uttarakhand 40.4 13.3 1.5 55.2
Uttar Pradesh 35.1 13.2 1.6 49.9
West Bengal 45.8 16.4 1.0 63.2
India 38.6 15.0 1.9 55.3
Source: NFHS-National Family Health Survey-III, 2005-06
Source: Women & Men (Eleventh issue), CSO, M/O Statistics & Progamme Implementation, Govt. of India
Table No. 2.35 Prevalence of anaemia among women-States
TotalPercentage of women with:
57

Mild Moderate Severe Any Anaemia
(10.0-10.9/g/dl) (7.0-9.9g/dl) (<7.0g/dl) (< 11.0 g/dl)
India 26.3 40.2 2.9 69.5
North
Delhi 26.3 30.0 0.7 57.0
Haryana 25.8 42.2 4.3 72.3
Himachal Pradesh 25.7 26.8 2.2 54.7
Jammu& Kashmir 25.8 30.4 2.4 58.6
Punjab 21.7 38.1 6.6 66.4
Rajasthan 22.8 40.2 6.7 69.7
Uttaranchal 28.5 30.6 2.3 61.4
Central
Chhattisgarh 24.0 45.2 2.0 71.2
Madhya Pradesah 27.1 43.6 3.4 74.1
Uttar Pradesh 25.4 45.0 3.6 73.9
East
Bihar 29.6 46.8 1.6 78.0
Jharkhand 29.3 39.1 1.9 70.3
Orissa 28.9 34.5 1.6 65.0
West Bengal 30.0 29.4 1.5 61.0
Noerh East
Arunachal Pradesh 27.1 29.1 0.8 56.9
Assam 28.7 38.7 2.2 69.6
Manipur 25.6 15.2 0.3 41.1
Meghalya 31.7 31.7 1.0 64.4
Mizoram 23.5 20.0 0.6 44.2
Sikkim 28.9 29.5 0.8 59.2
Tripura 27.5 34.6 0.7 62.9
West
Goa 19.5 17.1 1.5 38.2
Gujrat 25.0 41.1 3.6 69.7
Maharastra 21.9 39.6 1.8 63.4
South
Andhra Pradesh 23.7 43.5 3.6 70.8
Karnatka 28.6 38.6 3.2 70.4
Kerala 23.5 20.5 0.5 44.5
Tamil Nadu 27.1 34.6 2.6 64.2
Excludes Nagaland
Source : National Family Health Survey-III, International Institute for Population Science,
M/O Health & Family Welfare, Govt. of India
Table No. 2.36 Prevalence Of Anaemia in children by State
Note: Table is based on children who is stayed in the household the night before the interview. Prevalence
of anaemia, based on haemoglobin levels, is adujested for altitude using formula in CDC (1998).
Haemoglobin in g/dl = grams per decilitre
State
percentage of children is 6- 59 months classifed as having Anaemia, according to state, India , 2005-06
Anaemia status by haemoglobin level
58

T R U Moderate (%) Severe (%) Total (%)
India 79.2 81.2 72.7 39 3 42
1 Andhra Pradesh 79.0 82.7 72.0 38 3 41
2 Arunachal Pradesh 66.3 64.3 71.7 - - -
3 Assam 76.7 77.4 70.4 - - -
4 Bihar 87.6 89.0 75.8 41 43
5 Chhattisgarh 81.0 82.1 75.6 48 4 52
6 Delhi 63.2 70.9 71.4 - - -
7 Goa 49.3 49.2 49.4 - - -
8 Gujarat 80.1 83.6 73.8 43 1 44
9 Haryana 82.5 83.3 79.8 54 5 59
10 Himachal Pradesh 58.8 59.8 49.1 39 2 41
11 Jammu & Kashmir 68.1 67.3 72.0 - - -
12 Jharkhand 77.7 80.5 65.9 33 0 33
13 Karnataka 82.7 84.3 79.4 35 4 39
14 Kerala 55.7 57.9 51.3 5 0 5
15 Madhya Pradesh 82.6 84.9 75.2 44 3 47
16 Maharashtra 71.9 76.8 65.7 53 3 56
17 Manipur 52.8 52.5 53.6 - - -
18 Meghalaya 68.7 69.8 61.1 - - -
19 Mi zoram 51.7 58.5 44.4 - - -
20 Nagaland NA NA NA - - -
21 Orissa 74.2 75.8 63.2 37 4 41
22 Punjab 80.2 80.0 80.5 48 6 54
23 Rajasthan 79.6 80.1 77.5 36 2 38
24 Sikkim 56.9 56.5 59.2 - - -
25 Tamil Nadu 72.5 71.0 74.2 27 4 31
26 Tripura 67.9 67.8 68.5 - - -
27 Uttar Pradesh 85.1 85.7 82.5 41 2 43
28 Uttarakhand 61.5 62.0 60.2 21 1 22
29 West Bengal 69.4 71.9 58.2 24 4 28
Source: Statistics on Women in India 2007, National Institute of Public Cooperation and Child Development
Table No. 2.37 Anaemia among children 0-72 months 2002, and 6-35 months (Percentage), 2006 by State
Children Aged 6-35 Months with any
Anaemia 2006 (%) Anaemia among children (0-72 months) 2002
S.No. India/State/Uts
59

Percentage
below -3SD
Percentage
below-2SD
Mean Z-Score
(SD)
Percentage
below -3SD
Percentage
below-2SD
Percentage
above + 2 SD
Mean Z-Score
(SD)
Percentage
below -3SD
Percentage
below-2SD
Percentage
above + 2 SD
Mean Z-Score
(SD)
India 23.7 48 -1.9 6.4 19.8 1.5 -1 15.8 42.5 0.4 -1.8
North
Delhi 20.4 42.2 -1.6 7.0 15.4 4.0 -0.5 8.7 26.1 1.0 -1.3
Haryana 19.4 45.7 -1.8 5.0 19.1 1.4 -1.0 14.2 39.6 0.2 -1.7
Himachal Pradesh 16.0 38.6 -1.5 5.5 19.3 1.1 -1.0 11.4 36.5 0.5 -1.6
Jammu& Kashmir 14.9 35.0 -1.3 4.4 14.8 2.3 -0.7 8.2 25.6 0.5 -1.3
Punjab 17.3 36.7 -1.5 2.1 1.5 -0.5 8.0 24.9 0.5 -1.2
Rajasthan 22.7 43.7 -1.7 7.3 20.4 1.6 -1.1 15.3 39.9 0.4 -1.7
Uttaranchal 23.1 44.4 -1.8 5.3 18.8 2.3 -0.9 15.7 38.0 0.3 -1.7
Central
Chhattisgarh 24.8 52.9 -2.0 5.6 19.5 1.3 -1.1 16.4 47.1 0.0 -1.9
Madhya Pradesah 26.3 50.0 -2.0 12.6 35.0 1.0 -1.6 27.3 60.0 0.1 -2.3
Uttar Pradesh 32.4 56.8 -2.2 5.1 14.8 1.2 -0.8 16.4 42.4 0.1 -1.8
East
Bihar 29.1 55.6 -2.1 8.3 27.1 0.3 -1.4 24.1 55.9 0.1 -2.2
Jharkhand 26.8 49.8 -1.9 11.8 32.3 0.6 -1.5 26.1 56.5 0.2 -2.2
Orissa 19.6 45.0 -1.7 5.2 19.5 1.7 -1.0 13.4 40.7 0.5 -1.7
West Bengal 17.8 44.6 -1.7 4.5 16.9 1.9 -0.9 11.1 38.7 0.5 -1.6
Noerh East
Arunachal Pradesh 21.7 43.3 -1.6 6.1 15.3 3.4 -0.7 11.1 32.5 0.6 -1.4
Assam 20.9 46.5 -1.8 4.0 13.7 1.2 -0.8 11.4 36.4 0.3 -1.6
Manipur 13.1 35.6 -1.4 2.1 9.0 2.2 -0.6 4.7 22.1 0.5 -1.2
Meghalya 29.8 55.1 -2.0 19.9 30.7 2.6 -1.2 27.7 48.8 0.2 -2.0
Mizoram 17.7 39.8 -1.6 3.5 9.0 4.3 -0.3 5.4 19.9 1.2 -1.1
Nagaland 19.3 38.8 -1.4 5.2 13.3 4.7 -0.5 7.1 25.2 0.8 -1.2
Sikkim 17.9 38.3 -1.4 3.3 9.7 8.3 -0.1 4.9 19.7 1.3 -0.9
Tripura 14.7 35.7 -1.5 8.6 24.6 2.2 -1.2 15.7 39.6 0.1 -1.7
West
Goa 10.2 25.6 -1.1 5.6 14.1 4.3 -0.7 6.7 25.0 1.9 -1.1
Gujrat 25.5 51.7 -2.0 5.8 18.7 1.2 -1.0 16.3 44.6 0.1 -1.8
Maharastra 19.1 46.3 -1.8 5.2 16.5 2.8 -0.9 11.9 37.0 0.9 -1.6
South
Andhra Pradesh 18.7 42.7 -1.7 3.5 12.2 2.2 -0.7 9.9 32.5 0.6 -1.5
Karnatka 20.5 43.7 -1.7 5.9 17.6 2.6 -1.0 12.8 37.6 0.5 -1.6
Kerala 6.5 24.5 -1.1 4.1 15.9 1.2 -0.9 4.7 22.9 0.4 -1.2
Tamil Nadu 10.9 30.9 -1.1 8.9 22.2 3.6 -1.0 6.4 29.8 1.9 -1.3
includes children who are below - 3 stardard deviation (SD) from the international reference population median.
Source: National Family Health Survey - (3) Vol. 1
Table No. 2.38 Nutritional Status of children by State
percentage of children under age 5 years classifed as malnourished according to three anthropometric indices of nutritional status: height-for-age, weight-for-height and weight-for age, according to
state, India, 2005-06
Note: Table is based on children who is stayed in the household the night before the interview. Each of the indices is expressed in standard deviation units (SD) from the median of the 2006 WHO
internationl reference population. Table is based on children with vaild dates of birth (month and year) and vaild measerment of both height and weight
Weight-for-age
State
Height-for-age Weight-for-height
60

India/StateNFHS-1
(1992-93)
NFHS-2
(1998-99)
NFHS-3
(2005-06)
India 35.4 42.0 43.5
Andhra Pradesh 45.0 58.7 46.0
Arunachal Pradesh 22.5 20.5 28.4
Assam 19.4 17.0 31.4
Bihar 10.7 11.0 32.8
Chhattisgarh NA NA 48.7
Delhi 57.8 69.8 63.2
Goa 74.9 82.6 78.6
Gujarat 49.8 53.0 45.2
Haryana 53.5 62.7 65.3
Himachal Pradesh 62.9 83.4 74.2
Jammu & Kashmir 65.7 56.7 66.7
Jharkhand NA NA 34.2
Karnataka 52.2 60.0 55.0
Kerala 54.4 79.7 75.3
Madhya Pradesh 29.2 22.4 40.3
Maharashtra 64.1 78.4 58.8
Manipur 29.1 42.3 46.8
Meghalaya 9.7 14.3 32.9
Mi zoram 56.4 59.6 46.5
Nagaland 3.8 14.1 21.0
Orissa 36.1 43.7 51.8
Punjab 61.9 72.1 60.1
Rajasthan 21.1 17.3 26.5
Sikkim NA 47.4 69.6
Tamil Nadu 64.9 88.8 80.9
Tripura 19.0 NA 49.7
Uttar Pradesh 19.8 21.2 23.0
Uttarakhand NA NA 60.0
West Bengal 34.2 43.8 64.3
Source: Statistical abstract 2010, Dte. of Eco. & Stat.
Table No. 2.39 Immunization
61

2003 2004 2005 2006 2007 2008
Antenatal clinic (ANC) 0.13 0.38 0.25 0.00 0.2 0.2
Sexually Trasmitted Disease (STD) 6.52 7.98 9.15 2.00 4.38 3.16
Female Sex Worker (FSW) 1.61 4.60 3.15 2.80 - -
Men who have sex with Men (MSM) 27.42 6.67 20.40 12.27 11.73 7.93
Injecting Drug Users (IDU) 14.40 17.60 22.80 10.00 10.2 18.4
Source : National HIV Sentinel Surveillance 2003-2008
District Name Site Category2003 2004 2005 2006 2007 2008
1. Cental STD 7.20 9.20 9.20 8.80 5.6 3.14
2. East STD 7.77 8.46 9.09 2.00 1.79 2.97
3. New Delhi ANC - - - 0.00 0.25 0.25
FSW - - - 7.33 - -
ANC 0.25 0.50 0.25 0.00 - -
IDU - 17.60 22.80 18.80 20 30.4
FSW - 8.00 8.43 14.00
STD 5.85 7.50 10.00 6.40 5.31 5.43
ANC 0.00 0.00 0.25 0.00 0 0.25
MSM 27.42 6.70 39.60 32.80 - -
FSW - - 1.60 1.60 1.6 0.8
MSM - - - 2.00 3.2 7.29
FSW - - - 1.20 0.4 2.4
ANC 0.25 0.25 0.75 0.25 0.5 0
STD 2.40 4.80 3.20 2.00 - -
ANC 0.00 0.50 0.00 0.25 - -
IDU - - - 1.20 0.4 6.4
FSW - - - 0.40 0.4 1.61
IDU 14.40 - - - 5.2 0.8
MSM - - 1.20 2.00 0 0
FSW .1.61 1.20 1.20 0.80 2 8.87
STD - - - 1.20 3.27 4
Source : Delhi HIV Surveillance Fact - Sheet
9. West
7. South
Table No.2.40 HIV prevalence in different population group in Delhi
4. North
5. North East
6. North West
8. South West
Table 2.41 District HIV Prevalence in Delhi - National HIV Sentinel Surveillance 2003-2008
62

ESI GTB LNJP Safdarjung GTBKasturba
GandhiSafdarjung SGM
1999 - - - 0.8 0.0 - 0.3 0.3
2000 - 3.3 4.4 2.0 0.0 - 0.3 0.3
2001 7.4 5.8 2.8 6.4 0.0 0.3 0.0 0.3
2002 7.3 2.9 3.6 0.8 0.3 0.3 0.0 0.5
2003 7.8 5.8 7.2 2.4 0.0 0.3 0.0 0.3
2004 8.5 7.5 9.2 4.8 0.0 0.5 0.5 0.3
2005 9.1 10.0 9.2 3.2 0.3 0.3 0.0 0.8
2006 1.2 6.4 8.8 4.4 0.0 0.0 0.3 0.3
2007 1.8 5.3 5.6 5.2 0.0 0.3 0.0 0.0
2008 2.97 5.43 3.14 0.8 0.25 0.5 0.0 0.0
Source: Delhi State AIDS Control Society
<20 20-29 30-44 45+ Migrant Non-Migrant Illiterate Literate
STD 7.4 8.2 6.8 8.6 5.4 8.3 7.2 8.0 7.2
ANC 0.3 0.3 0.3 0.8 0.0 0.0 0.4 0.0 0.5
Source: Delhi State AIDS Control Society
Age Migrant Status Literacy
Total
Table No.2.42: HIV Prevalence at Sentinel Sites Delhi 1999-2008
(Percent testing positive for HIV)
Years
Table No.2.43: HIV Prevalence at Sentinel Sites Delhi 2004
Nmae of the Hospital
STD ANC
Nmae of the Hospital
63

2003 2004 2005 2006 2007 2003 2004 2005 2006 2007
1 A & N Islands 0.50 0.00 0.00 0.17 0.25 1.80 1.60 0.40 0.80 1.33
2 Andhra Pradesh 1.25 1.63 1.75 1.26 1.00 21.47 16.40 22.80 24.40 17.20
3 Arunachal Pradesh 0.00 0.20 0.46 0.00 0.00 0.45 0.00 0.00 0.42 0.00
4 Assam 0.00 0.00 0.00 0.00 0.00 1.20 0.80 0.89 0.50 0.50
5 Bihar 0.00 0.00 0.00 0.50 0.25 0.40 1.20 0.00 0.40 0.40
6 Chandigarh 0.50 0.50 0.00 0.25 0.25 0.80 1.80 1.00 1.66 0.42
7 Chhattisgarh 0.58 0.00 0.25 0.00 0.25 2.13 2.80 2.77 2.58 3.33
8 D & N Haveli 0.13 0.00 0.25 0.00 0.50 - - - - -
9 Daman & Diu 0.33 0.38 0.13 0.00 0.13 - - - - -
10 Delhi 0.13 0.38 0.25 0.00 0.25 6.52 7.98 9.15 2.00 5.20
11 Goa 0.50 1.13 0.00 0.50 0.18 14.62 16.02 14.01 8.60 5.60
12 Gujarat 0.25 0.13 0.25 0.50 0.25 4.47 3.60 2.00 3.31 2.40
13 Haryana 0.26 0.00 0.13 0.13 0.00 1.20 0.93 1.30 0.81 0.00
14 Himachal Pradesh 0.00 0.13 0.13 0.00 0.00 0.40 0.00 0.40 0.60 0.00
15 Jammu & Kashmir 0.00 0.08 0.00 0.00 0.00 2.60 0.16 0.00 0.00 0.20
16 Jharkhand 0.00 0.00 0.13 0.00 0.00 0.13 0.13 0.00 0.40 0.40
17 Karnataka 1.25 1.25 1.00 1.00 0.50 10.40 12.00 13.60 7.57 8.40
18 Kerala 0.00 0.33 0.25 0.13 0.38 1.88 2.78 2.82 1.23 1.60
19 Lakshdweep 0.00 0.00 0.00 0.00 0.00 0.00 0.00 0.00 0.00 0.00
20 Madhya pradesh 0.00 0.25 0.25 0.00 0.00 1.81 1.80 0.47 0.47 1.72
21 Maharashtra 0.75 0.75 1.00 0.75 0.50 12.00 10.80 12.80 10.00 11.62
22 Manipur 1.00 1.38 1.00 1.25 0.75 13.00 7.20 12.20 4.80 4.08
23 Meghalaya 0.35 0.00 0.00 0.00 0.00 0.26 0.00 0.00 1.18 2.21
24 Mizoram 0.97 1.50 0.88 1.00 0.75 3.80 1.00 3.00 3.07 7.13
25 Nagaland 1.13 0.95 1.50 0.93 0.60 0.98 1.72 3.48 0.00 3.42
26 Orissa 0.00 0.50 0.25 0.50 0.00 2.40 2.80 4.00 2.80 1.60
27 Pondicherry 0.13 0.25 0.25 0.25 0.00 2.45 5.74 4.22 4.03 3.22
28 Punjab 0.00 0.25 0.13 0.00 0.00 1.60 1.16 1.07 0.27 1.60
29 Rajasthan 0.00 0.00 0.13 0.00 0.00 6.08 2.92 5.60 1.60 2.00
30 Sikkim 0.21 0.00 0.25 0.10 0.09 0.00 0.00 0.86 0.00 0.00
31 Tamil Nadu 0.50 0.67 0.50 0.25 0.25 9.64 8.40 9.20 8.00 8.00
32 Tripura 0.00 0.25 0.00 0.42 0.25 2.80 0.73 1.26 0.45 0.40
33 Uttar Pradesh 0.00 0.25 0.00 0.00 0.00 0.55 0.80 0.40 0.62 0.48
34 Uttarakhand 0.00 0.00 0.00 0.00 0.00 0.00 0.37 0.00 0.00 0.00
35 West Bengal 0.50 0.50 0.84 0.00 0.00 1.61 0.88 2.16 1.01 0.80
Source: National Aids Control Organization, M/O Health & Family Welfare, Govt. of India
Note: The presented volues are median prevalence unless where the number of sites is 3 or less, in which case, mean (Percent positivity) is
presented.
Table 2.44: State wise HIV Prevalence among ANC and STD Clinic Attendees, 2003-2007
ANC STD
Name of State/UTS.
No
64

2003 2004 2005 2006 2003 2004 2005 2006 2003 2004 2005 2006
1 A & N Islands - - - - 1.25 - - - - 0.50 0.40 -
2 Andhra Pradesh - - - - 13.20 16.00 6.45 10.25 20.00 16.97 12.97 7.32
3 Arunachal Pradesh - - - 0.00 - - - - - - - 0.00
4 Assam 5.56 4.48 7.86 2.86 - - - 0.78 0.00 0.00 0.76 0.46
5 Bihar - - - 0.20 1.60 1.60 0.40 0.30 4.80 0.20 2.24 1.68
6 Chandigarh - 4.80 9.20 17.60 - 1.36 1.60 4.80 0.60 0.80 0.67 0.67
7 Chhattisgarh - - - - - - - - - - - 1.57
8 D & N Haveli - - - - - - - - - - - -
9 Daman & Diu - - - - - - - - - - - -
10 Delhi 14.4 17.60 22.80 10.00 27.42 6.67 20.40 12.27 1.61 4.60 3.15 2.80
11 Goa - - - - 9.09 1.68 4.90 4.80 30.15 - - -
12 Gujarat - - - - - 6.80 10.67 11.20 - 9.20 8.13 6.40
13 Haryana - - - 0.00 - - - 0.00 - - 2.00 1.19
14 Himachal Pradesh - - - - - - - 0.44 - 0.80 0.00 0.66
15 Jammu & Kashmir 0.00 0.00 0.00 2.50 - - - - - - - 0.00
16 Jharkhand - - - 0.40 - - - - - 0.00 0.80 0.88
17 Karnataka 2.8 0.00 - 3.60 10.8 10.00 11.61 19.20 14.4 21.60 18.39 8.64
18 Kerala - 2.58 5.19 9.57 - 0.89 3.20 0.64 1.94 - - 0.32
19 Lakshdweep - - - - - - - - - - - -
20 Madhya pradesh - - - - - - - - - - 1.82 1.07
21 Maharashtra 22.89 29.20 12.80 20.40 18.8 11.20 10.40 15.60 54.29 41.69 23.62 19.57
22 Manipur 24.47 21.00 24.10 19.80 29.2 14.00 15.60 10.40 12.8 12.40 10.00 11.60
23 Meghalaya 0.00 0.00 0.00 3.33 - - - - - - - -
24 Mizoram 6.4 6.80 4.80 3.05 - - - - - 13.69 14.00 10.40
25 Nagaland 8.43 3.22 4.51 2.39 - - - - 4.4 4.44 10.80 16.40
26 Orissa - - - 10.40 - - - - - 5.18 2.60 1.00
27 Pondicherry - - - - - 5.22 5.60 2.47 - 1.94 0.28 1.44
28 Punjab - - - 13.80 - - - 4.80 - - - 1.36
29 Rajasthan - - 0.00 - - - - 0.00 3.92 2.31 3.72 2.55
30 Sikkim - - 0.48 0.20 - - - - - - - -
31 Tamil Nadu 63.81 39.92 18.00 24.20 4.2 6.80 6.20 5.60 8.8 4.00 5.49 4.62
32 Tripura - - 10.92 0.00 - - - - - - - -
33 Uttar Pradesh - - - 4.63 - - - - 6.60 8.00 3.50 1.52
34 Uttranchal - - - - - - - - - - - -
35 West Bengal 2.61 3.83 7.41 4.64 - 1.33 0.54 6.60 6.47 4.11 6.80 6.12
Source: National Aids Control Organization, M/O Health & Family Welfare, Govt. of India
Note: The presented values are mean prevalence (Precent positivity) among each high risk group
FSW
Table 2.45: State wise HIV Prevalence among IDU, MSM & FSW, 2003-2006
IDU MSM
Name of State/UTS.
No
65

S.
NoName of State/UT
Antentatal
ClinicSTD Clinic IDU MSM FSW
1 A & N Islands 0.25 1.33 - - -
2 Andhra Pradesh 1.00 17.20 3.71 17.04 9.74
3 Arunachal Pradesh 0.00 0.00 0.00 - -
4 Assam 0.00 0.50 2.41 2.78 0.44
5 Bihar 0.25 0.40 0.60 0.00 3.40
6 Chandigarh 0.25 0.42 8.64 3.60 0.40
7 Chhattisgarh 0.25 3.33 - - 1.43
8 D & N Haveli 0.50 - - -
9 Daman & Diu 0.13 - - - -
10 Delhi 0.25 5.20 10.10 11.73 3.15
11 Goa 0.18 5.60 - 7.93 -
12 Gujarat 0.25 2.40 - 8.40 6.53
13 Haryana 0.13 0.00 0.80 5.39 0.91
14 Himachal Pradesh 0.00 0.00 - 0.00 0.87
15 Jammu & Kashmir 0.00 0.20 - - -
16 Jharkhand 0.00 0.40 - - 1.09
17 Karnataka 0.50 8.40 2.00 17.60 5.30
18 Kerala 0.38 1.60 7.85 0.96 0.87
19 Lakshdweep 0.00 0.00 - - -
20 Madhya pradesh 0.00 1.72 - - 0.67
21 Maharashtra 0.50 11.62 24.40 11.80 17.91
22 Manipur 0.75 4.08 17.90 16.40 13.07
23 Meghalaya 0.00 2.21 4.17 - -
24 Mizoram 0.75 7.13 7.53 - 7.20
25 Nagaland 0.60 3.42 1.91 - 8.91
26 Orissa 0.00 1.60 7.33 7.37 0.80
27 Pondicherry 0.00 3.22 - 2.00 1.30
28 Punjab 0.00 1.60 13.79 1.22 0.65
29 Rajasthan 0.13 2.00 - - 4.16
30 Sikkim 0.09 0.00 0.47 - 0.00
31 Tamil Nadu 0.25 8.00 16.80 6.60 4.68
32 Tripura 0.25 0.40 0.00 - -
33 Uttar Pradesh 0.00 0.48 1.29 0.40 0.78
34 Uttranchal 0.00 0.00 - - -
35 West Bengal 0.00 0.80 7.76 5.61 5.92
Source: National Aids Control Organization, M/O Health & Family Welfare, Govt. of India
Table 2.46: State wise HIV Prevalence (%) among ANC, STD, IDU, MSM and FSW, 2007
66

2002 2003 2004 2005 2006
Andhra Pradesh 1.16 1.13 1.10 1.08 1.05
Karnataka 0.85 0.84 0.82 0.81 0.81
Maharashtra 1.08 0.98 0.89 0.80 0.74
Manipur 2.42 2.20 2.01 1.83 1.67
Nagaland 2.00 1.83 1.62 1.45 1.26
Tamil Nadu 0.93 0.73 0.59 0.47 0.39
Goa 1.01 0.92 0.84 0.77 0.73
Gujarat 0.54 0.51 0.48 0.45 0.43
Pondicherry 0.50 0.43 0.47 0.50 0.55
Arunachal Pradesh 0.18 0.13 0.09 0.07 0.05
Assam 0.08 0.06 0.04 0.03 0.03
Bihar 0.10 0.11 0.12 0.13 0.16
Chhattisgarh 0.59 0.43 0.31 0.22 0.17
Delhi 0.35 0.32 0.30 0.27 0.27
Haryana 0.50 0.32 0.21 0.14 0.10
Himachal Pradesh 0.03 0.03 0.03 0.03 0.03
Jammu & Kashmir 0.02 0.02 0.02 0.03 0.04
Jharkhand 0.07 0.07 0.08 0.09 0.11
Kerala 0.59 0.39 0.25 0.17 0.13
Madhya pradesh 0.17 0.15 0.13 0.12 0.11
Meghalaya 0.19 0.14 0.10 0.07 0.06
Mizoram 1.13 0.99 0.91 0.82 0.74
Orissa 0.06 0.08 0.11 0.15 0.22
Punjab 0.18 0.16 0.14 0.12 0.12
Rajasthan 0.05 0.07 0.09 0.12 0.17
Sikkim 0.24 0.17 0.13 0.09 0.08
Tripura 0.41 0.29 0.21 0.15 0.12
Uttar Pradesh 0.14 0.13 0.13 0.11 0.11
Uttranchal 0.09 0.08 0.08 0.07 0.08
West Bengal 0.10 0.13 0.16 0.21 0.03
A & N Islands 0.81 0.66 0.54 0.44 0.37
Chandigarh 0.45 0.42 0.38 0.35 0.34
D & N Haveli
Daman & Diu
Lakshdweep
India 0.45 0.43 0.41 0.39 0.36
Table No. 2.47 State-wise Adult HIV Prevalence
Source : India HIV Estimates - 2006 P-17
State/UtsAdult prevalence (15-19)
< results as there are no valid sites
< 100 Cases
67

<15 15-49 >49 Number in Lakh
Andhra Pradesh 2.07 90.58 7.36 5.26
Karnataka 2.25 91.28 6.48 2.76
Maharashtra 3.44 87.27 9.29 4.95
Manipur 3.23 88.23 8.53 0.25
Nagaland 2.99 87.60 9.41 0.19
Tamil Nadu 3.34 86.33 10.33 2.46
Goa 2.75 87.54 9.71 0.07
Gujarat 2.13 89.78 8.10 1.44
Pondicherry 2.47 91.55 5.98 0.04
Arunachal Pradesh 2.63 86.85 10.52 0.02
Assam 2.39 90.15 7.46 0.09
Bihar 1.78 93.53 4.99 0.74
Chhattisgarh 1.60 87.25 9.15 0.38
Delhi 3.73 86.64 9.63 0.30
Haryana 2.83 89.08 8.09 0.39
Himachal Pradesh 2.49 91.05 6.46 0.01
Jammu & Kashmir 1.61 93.10 5.29 0.02
Jharkhand 1.83 93.19 4.98 0.18
Kerala 2.00 87.99 10.01 0.62
Madhya pradesh 3.29 87.88 8.83 0.46
Meghalaya 2.62 89.11 8.27 0.02
Mizoram 2.65 88.24 9.11 0.05
Orissa 0.89 95.29 3.82 0.48
Punjab 2.29 89.04 8.67 0.20
Rajasthan 1.36 94.78 3.86 0.56
Sikkim 2.79 87.96 9.25 0.01
Tripura 2.30 88.38 9.32 0.05
Uttar Pradesh 3.30 89.51 7.19 1.13
Uttranchal 3.02 90.92 6.06 0.04
West Bengal 0.84 95.24 3.92 1.49
A & N Islands 1.87 88.21 9.92 0.02
Chandigarh 5.07 85.05 9.89 0.03
D & N Haveli
Daman & Diu
Lakshdweep
India 3.80 88.7 7.5 24.7
Table No. 2.48 State-wise percent distribution of HIV infections in 2006 by age group
< 100 Cases
No results as there are no valid sites
Source : India HIV Estimates - 2006 P-17
State/UtsPercent Distribution
68

69
ECONOMIC STATUS
� During 2001 census year, percentage of total worker increase to
32.82% as compared to 31.64% in 1991. There was marked
improvement of female worker in rural area. During 1991 there
was 5.46% female worker in rural area which rose to 10.8%
during 2001
� As per fifth economics census 2005 in Delhi sex-wise distribution
of employment indicates that 10724 (87.46%) male and only
1538 (12.54%) female are employed in Agricultural
establishments. Proportion of female employment in own
account Agricultural establishments was 36.42% where as, it was
about 6.27% in establishments (H).
� Sex wise breakup of employment sector-wise indicates that in
rural 8927 (12.74%) were female and 61136 (87.26%) were
male, whereas in urban 364336 (10.45%) were female and
3121988 (89.55%) were male according to 5th Economic Census
2005.
� As per NSS 62nd round July 2005-06 it is seen that female worker
account for 5.36% of working owner and 3.07% of hired workers
and in other category of workers their share is limited to only
8.77%.

Male Female Total Male Female Total Male Female Total
1 2 3 4 5 6 7 8 9 10
19611489378
(56.02)
1169234
(43.98)
2658612
(100)
778282
(91.09)
76169
(8.91)
854451
(100)
711096
(3941)
1093065
(60.58)
1804161
(100)
19712257515
(55.53)
1808183
(44.47)
4065698
(100)
1142434
(93.00)
85963
(7.00)
1228397
(100)
1115081
(39.30)
1722220
(60.70)
2837301
(100)
19813440081
(55.30)
2780325
(44.70)
6220406
(100)
1811965
(90.50)
190227
(9.50)
2002192
(100)
1628116
(38.60)
2590098
(61.40)
4218214
(100)
19915155512
(54.73)
4265132
(45.27)
9420644
(100)
2666385
(89.46)
314076
(10.54)
2980461
(100)
2489127
(38.65)
3951056
(61.35)
6440183
(100)
20017607234
(54.92)
6243273
(45.08)
1385050
7 (100)
3960101
(87.12)
585133
(12.88)
4545234
(100)
3647133
(39.19)
5658140
(60.81)
9305273
(100)
Table No. 3.1 Workers & Non-workers by Gender according to Census year in Delhi
Year
Total Population Workers Non- Workers
(54.92) (45.08) 7 (100) (87.12) (12.88) (100) (39.19) (60.81) (100)
Sources : Population Statistics, 2001, 1991- DES, Delhi
Figures within brackets are % to Total
2658612 4065698
6220406
9420644
1385050
854451
1228397
2002192
2980461 4
545234
1804161
2837301 4218214
6440183
9305273
0
1000000
2000000
3000000
4000000
5000000
6000000
7000000
8000000
9000000
10000000
1961 1971 1981 1991 2001
Po
pu
lati
on
Years
Workers & Non-workers by Gender according to Census year in Delhi
Total Population Workers Non- Workers
70

Total Male Female Total Male Female Total Male Female
1 2 3 4 5 6 7 8 9 10
2002192 1811965 190227 1986399 1805100 181299 15793 6865 8928
100.00% 90.50% 9.50% 100.00% 90.87% 9.13% 100.00% 43.47% 56.53%
2980461 2666385 314076 2968377 2660967 307410 12084 5418 6666
100.00% 89.46% 10.54% 100.00% 89.64% 10.36% 100.00% 44.84% 55.16%
4545234 3960101 585133 4317516 3794345 523171 227718 165756 61962
100.00% 87.13% 12.87% 100.00% 87.88% 12.12% 100.00% 72.79% 27.21%Source : Population Statistics, 1991, 2001, DES, Delhi
1981
1991
2001
Table No. 3.2 Distribution of Main workers, Marginal workers and Total Workers by Gender according to Census years in Delhi
YearTotal Workers Main Workers Marginal Workers
90.8
7
89.6
4
Distribution of Main and Marginal Workers by Gender according to Census years in Delhi
90.8
7
89.6
4
87.8
8
9.1
3
10.3
6
12.1
2
43.4
7
44.8
4
72.7
9
56.5
3
55.1
6
27.2
1
0.00
10.00
20.00
30.00
40.00
50.00
60.00
70.00
80.00
90.00
100.00
1981 1991 2001
Main Workers Male Main Workers Female Marginal Workers Male Marginal Workers Female
71

F M F M F M F M F M F M
India 15.90 50.90 14.68 45.50 6.30 0.60 10.99 6.59 77.70 48.40 74.32 48.07
1 Andhra Pradesh 30.00 55.10 25.21 50.71 0.40 0.30 9.72 5.74 65.70 44.50 65.07 43.56
2 Arunachal Pradesh 35.60 53.50 28.33 46.90 1.90 0.20 8.13 4.60 62.50 46.20 63.55 49.31
3 Assam 12.60 48.40 9.68 42.35 0.90 1.10 11.12 7.58 78.40 50.60 79.20 50.07
4 Bihar 10.00 47.60 8.76 40.72 4.90 0.30 10.07 7.01 85.10 52.10 81.16 52.27
5 Chhattisgarh - - 22.28 45.44 - - 17.15 7.54 - - 59.06 47.03
6 Delhi 7.20 51.60 8.19 50.06 0.20 0.10 0.96 2.15 92.60 48.30 90.85 47.79
7 Goa 16.80 48.30 14.79 47.89 3.80 1.30 7.46 6.97 79.50 50.40 77.76 45.14
8 Gujarat 13.70 53.20 14.53 51.25 12.20 0.40 13.50 3.77 74.00 46.40 71.97 44.98
9 Haryana 6.00 48.30 13.37 43.62 4.70 0.30 13.94 6.86 89.20 51.50 72.69 49.57
10 Himachal Pradesh 19.40 49.10 21.08 43.30 15.50 1.60 22.61 11.40 65.20 49.40 56.31 45.30
11 Jammu & Kashmir - - 7.28 41.30 - - 14.68 8.53 - - 78.04 50.17
12 Jharkhand - - 10.00 37.22 - - 16.41 11.00 - - 73.60 51.79
13 Karnataka 22.70 53.50 20.92 51.92 6.70 0.60 10.96 4.95 70.60 45.90 68.12 43.13
14 Kerala 12.80 44.80 10.74 41.89 3.00 2.80 4.54 8.48 84.20 52.40 84.72 49.64
15 Madhya Pradesh 22.80 51.50 17.31 44.87 9.90 0.80 15.79 6.76 67.30 47.70 66.90 48.38
16 Maharashtra 26.50 51.20 24.10 48.65 6.60 0.90 8.49 4.85 66.90 47.80 67.41 46.51
17 Manipur 32.70 44.20 23.22 39.83 6.30 1.10 17.29 9.08 61.00 54.70 59.49 51.09
18 Meghalaya 30.70 49.50 23.80 40.40 4.30 0.50 11.22 7.36 65.10 49.90 64.98 52.24
19 Mi zoram 34.00 49.60 31.82 49.29 9.60 4.30 15.82 8.16 56.50 46.10 52.37 42.55
20 Nagaland 37.30 46.70 30.01 40.73 4.80 0.60 8.24 6.10 62.50 62.00 61.75 53.18
21 Orissa 12.10 52.90 8.60 43.07 8.70 0.90 16.02 9.68 69.10 79.20 75.38 47.25
22 Punjab 2.80 54.10 11.92 49.97 1.60 0.10 6.76 4.13 95.60 45.80 81.32 45.90
23 Rajasthan 13.00 48.50 16.83 43.81 14.40 0.80 16.66 6.26 72.60 50.70 66.52 49.93
24 Sikkim 28.60 50.80 26.09 50.89 1.80 0.40 12.51 6.69 69.60 48.70 61.41 42.42
25 Tamil Nadu 25.10 56.10 23.79 52.28 4.80 0.30 7.52 5.78 68.90 70.10 68.68 41.94
26 Tripura 10.10 47.00 10.70 45.24 3.60 0.60 10.32 5.57 86.20 52.50 78.98 49.19
27 Uttarakhand - - 16.24 38.13 - - 10.85 8.29 - - 72.91 55.58
28 Uttar Pradesh 7.5 49.30 6.10 39.58 4.90 0.40 10.18 7.68 87.70 50.30 83.72 52.74
29 West Bengal 8.00 50.70 8.86 47.32 3.30 0.70 9.22 6.91 88.80 48.60 81.92 45.77
Union Territories
30 Andaman & Nicobar Islands 8.00 52.30 9.85 50.70 5.10 1.10 6.60 6.03 86.90 46.70 83.55 43.27
31 Dadra & Nagar Haveli 31.30 55.90 25.30 58.62 17.50 1.60 13.38 3.77 51.20 42.50 61.32 37.62
32 Daman & Diu 12.00 50.70 13.07 63.84 10.10 1.00 5.27 1.72 76.80 48.40 81.66 34.44
33 Lakshadweep 5.90 41.00 4.77 33.20 1.70 3.10 2.42 9.31 92.40 55.80 92.81 57.49
34 Pondicherry 14.30 50.10 14.57 50.52 0.90 0.40 2.43 2.76 84.80 49.40 83.00 46.72
35 Chandigarh 10.30 54.20 12.87 54.77 0.10 0.10 0.85 1.33 89.60 45.70 86.28 43.90
2001
Source: India, M/o HRD, Deptt. of Women and Child Development (2004), GOI, II and III perodic report on the
convention on the elimnation of all forms of discrmination against Women : CEDAW periodic report,
New Delhi P.102
Non-Workers
1991 2001
Table No. 3.3 Work Participation Rate, Main and Marginal Workers
by sex (Percentage), 1991 and 2001
2001
Main Workers Marginal Workers
1991
S.No. India/State
1991
72

Table No. 3.4 Percentage for total workers, Marginaql workers and non-workers to total population by sex,1991 and 2001 in Delhi
1991 2001 1991 2001 1991 2001 1991 2001
1 2 3 4 5 6 7 8 9 10
Persons 31.64 32.82 31.51 31.17 0.13 1.64 68.36 67.18
Male 51.72 52.06 51.61 49.88 0.11 2.18 48.28 47.94
Female 7.36 9.37 7.21 8.38 0.15 0.99 92.64 90.63
Persons 29.12 31.87 28.75 28.97 0.37 2.9 70.88 68.13
Males 48.23 49.42 48.06 46.08 0.17 3.34 51.77 50.58
Females 5.46 10.18 4.84 7.83 0.62 2.35 94.54 89.82
Persons 31.92 32.89 31.82 31.33 0.1 1.55 68.08 67.11
Males 52.12 52.25 52.02 50.16 0.1 2.09 47.88 47.75
Females 7.57 9.31 7.47 8.42 0.1 0.89 92.43 90.69
Urban
Total/ Rural/
Urban
Persons/Male/
FemaleTotal Workers Main Workers Marginal Workers Non-Workers
Percentage to Total Population
Total
Rural
73

S.NO. TYPE OF ENTERPRISE R U R A L U R B A N T O T A L
A. Own Account Establishments
468 1154 1622
(58.50) (65.91) (63.58)
332 597 929
(41.50) (34.09) (36.42)
800 1751 2551
(100.00) (100.00) (100.00)
B. Establishment (H)
730 8372 9102
(87.01) (94.36) (93.73)
109 500 609
(12.99) (5.64) (6.27)
839 8872 9711
(100.00) (100.00) (100.00)
C. All Establishments
1198.00 9526.00 10724.00
(73.09) (89.67) (87.46)
441 1097 1538
(26.91) (10.33) (12.54)
1639 10623 12262
(100.00) (100.00) (100.00)
Note : Figures in ( ) indicate percentage to total
Source : Fifth Economic Census 2005 in Delhi
(i) Male
(ii) Female
Total
Table No. 3.5 : Distribution Of No. Of Persons Usually Working In Agricultural Establishments
By Sex, Enterprise Type and Location in Delhi
(i) Male
(ii) Female
Total
(i) Male
(ii) Female
Total
74

Female Male Total Female Male Total Female Male Total
1 2 3 4 5 6 7 8 9 10
1.Main Workers 33105 240572 273677 490066 3553773 4043839 523171 3794345 4317516
1.1 Cultivator 4777 16780 21557 2065 7688 9753 6842 24468 31310
1.2 Agricultural labour 1006 3897 4903 1548 4178 5726 2554 8075 10629
1.3 House hold Industry 1236 4654 5890 18023 102064 120087 19259 106718 125977
1.4 Other workers 26086 215241 241327 468430 3439843 3908273 494516 3655084 4149600
2. Marginal Workers 9927 17460 27387 52035 148296 200331 61962 165756 227718
2.1 Cultivator 3171 1973 5144 578 399 977 3749 2372 6121
2.2 Agricultural labour 1399 2053 3452 596 1096 1692 1995 3149 5144
2.3 House hold Industry 842 537 1379 7409 5267 12676 8251 5804 14055
2.4 Other workers 4515 12897 17412 43452 141534 184986 47967 154431 202398
3. Total Workers 43032 258032 301064 542101 3702069 4244170 585133 3960101 4545234
3.1 Cultivator 7948 18753 26701 2643 8037 10680 10591 26790 37381
3.2 Agricultural labour 2405 5950 8355 2144 5274 7418 4549 11224 15773
3.3 House hold Industry 2708 5191 7899 25432 107331 132763 28140 112522 140662
3.4 Other workers 30601 228138 258739 511882 3581377 4093259 542483 3809515 4351998
Source : Population Statistics - 2001, DES, Delhi
Table No. 3.6 Distribution of main workers, marginal workers and total workers by gender and sector of Delhi according to 2001 census
Rural Urban CombinedCategories of workers
75

S.NO. SECTOR MALE FEMALE TOTAL
106571 6038 112609
(94.64) (5.36) (100.00)
332525 10536 343061
(96.93) (3.07) (100.00)
23617 2251 25868
(91.30) (8.70) (100.00)
462713 18825 481538
(96.09) (3.91) (100.00)
Table No. 3.7 : Distribution of Employment by gender and type of worker in Delhi
Source: NSS 62nd Round "UNORGANISED MANUFACTURING ENTERPRISES IN DELHI"
(JULY 2005 – JUNE 2006) STATE SAMPLE
1
2
3
Working Owner
Hired Workers
Others
Total
Nature of Women Employment in Unorganised Manufacturing Sector in Delhi
Working Owner
32.07%
Hired Workers
55.97%
Others
11.96%
76

Male Female Total Male Female Total Male Female Total
AGRICULTURAL
468 332 800 1154 597 1751 1622 929 2551
58.50% 41.50% 100.00% 65.91% 34.09% 100.00% 63.58% 36.42% 100.00%
730 109 839 8372 500 8872 9102 609 9711
87.01% 12.99% 100.00% 94.36% 5.64% 100.00% 93.73% 6.27% 100.00%
1198 441 1639 9526 1097 10623 10724 1538 12262
73.09% 26.91% 100.00% 89.67% 10.33% 100.00% 87.46% 12.54% 100.00%
NON-AGRICULTURAL
16341 1351 17692 335865 25702 361567 352206 27053 379259
92.36% 7.64% 100.00% 92.89% 7.11% 100.00% 92.87% 7.13% 100.00%
43597 7135 50732 2776597 337537 3114134 2820194 344672 3164866
85.94% 14.06% 100.00% 89.16% 10.84% 100.00% 89.11% 10.89% 100.00%
59938 8486 68424 3112462 363239 3475701 3172400 371725 3544125
ESTABLISHMENTS (H
Urban Combined
Table No. 3.8 Distribution of Employment by Sex, Sector and Type of Establishments in Delhi
OAE
ESTABLISHMENTS (H)
TOTAL
OAE
S.No Type of Establishment
Number of Workers
Rural
A
B
59938 8486 68424 3112462 363239 3475701 3172400 371725 3544125
87.60% 12.40% 100.00% 89.55% 10.45% 100.00% 89.51% 10.49% 100.00%
TOTAL ESTABLISHMETS
16809 1683 18492 337019 26299 363318 353828 27982 381810
90.90% 9.10% 100.00% 92.76% 7.24% 100.00% 92.67% 7.33% 100.00%
44327 7244 51571 2784969 338037 3123006 2829296 345281 3174577
85.95% 14.05% 100.00% 89.18% 10.82% 100.00% 89.12% 10.88% 100.00%
61136 8927 70063 3121988 364336 3486324 3183124 373263 3556387
87.26% 12.74% 100.00% 89.55% 10.45% 100.00% 89.50% 10.50% 100.00%
C
OAE
ESTABLISHMENTS (H
TOTAL
Source : Report on Fifth Economic Census 2005 in Delhi (DES)
TOTAL
77

78
� During 2011 census literacy rate increased steadily to about 86%
as compared to 82% during 2001 and 75% during 1991 census.
Female literacy rate also shows small rise to 81% in 2011 as
compared to 75% during2001 and 67% during 1991 census.
� Gap in literacy rate of male and female in Delhi also decrease
steadily from 15.02 to 12.62 and further to 10.10 during Census
1991, 2001, and 2011 respectively.
� The Statistics of the Ministry of Human Resources Development
show that in Delhi during year 2007-08 Girls Gross Enrolment
ratio in primary classes increased to 110.1 (age group 6-11
years), 102.4 in class VI-VIII (age group 11-14 years) and 58.0
in classes IX-XII (age group 14-18 years) as compared to the
corresponding figures of 105.9 (Classes I-V), 96.9 (classes VI-
VIII) and 57.0 (classes IX-XIII) during 2006-07.
� % share of girl enrolment in primary schools remains almost
49% from 2001 to 2007, but there is a sharp rise in enrolment of
girls in middle classes. During 2006-07 enrolment rose to 67%
as compared to 49% during 2001-02 & in Secondary education
enrolment of girl dropped to 46% as compared to 48% during
2001-02.
� Dropout rate in Delhi at different levels at school education are
significantly more for girls as compared to boys. For instance, in
2007-08 at secondary education level (Classes I-X) the female
dropout rate was about 38.4% as compared to male dropout rate
of 33.8%.There is no dropout at primary & Middle Secondary
Education Level in 2007-08.
� Results of Central Board of Secondary Examination also show the
pass percentage of girl is always higher than the boys since 1999
to 2011.
� % of female teachers in school (primary, middle & secondary
level) is always higher than male teachers and is constantly
increasing since 2001-02. The number of female teachers in
schools was 71.23% during 2007-08 as compared to 61.03%
during 2001-02.
EDUCATION

No. % No. % No. %
1 2 3 4 5 6 7 8
1931 636246 73377 19.86 16095 6.03 89472 14.06
1941 917939 171233 31.99 58370 15.25 229603 25.01
1951 1744072 424118 42.99 244955 32.34 669073 38.36
1961 2658612 904801 60.75 497497 42.55 1402298 52.75
1971 4065698 1438268 63.71 863337 47.55 2301605 56.61
1981 6220406 2352883 68.4 1475443 53.07 3828326 61.54
Male Female
Table No 4.1 Literacy Rate by Sex - 1931 - 2011 in Delhi according to Census years
Total
Literate Persons
YearTotal
Population
1991 9420644 3539500 82.01 2342797 66.99 5882297 75.29
2001 13850507 5700847 87.33 3963917 74.71 9664764 81.67
2011* 1970510 7210050 91.03 5553302 80.93 12763352 86.34
*PROVISIONAL,RGI
Source: Population Statistics - 2001, DES, Delhi.
32.0
43.0
60.863.7
68.4
82.087.3
91.0
15.3
32.3
42.647.6
53.1
67.0
74.780.9
0
10
20
30
40
50
60
70
80
90
100
1941 1951 1961 1971 1981 1991 2001 2011
Census/Sex -wise Literacy Rate (%)
Male Female
79

Persons Male Female Persons Male Female
1 2 3 4 5 6 7
Total 75.29 82.01 66.99 81.82 87.37 75
Rural 8.54 5.61 2.93 78.75 87.15 68.23
Urban 91.46 54.56 36.9 82.04 87.38 75.49
Source: Population Statistics - 2001, DES, Delhi.
Sector
Table No. 4.2 Sex-wise Literacy rate Sector-wise accordig
to 1991 & 2001 Census in Delhi
1991 2001
80
Source: Population Statistics - 2001, DES, Delhi.
5.62.9
54.6
36.9
87.2
68.2
87.4
75.5
0.0
10.0
20.0
30.0
40.0
50.0
60.0
70.0
80.0
90.0
100.0
Male Female Male Female
Perc
en
tag
e
Sex-wise Literacy rate Sector-wise accordig to 1991 & 2001 Census in Delhi
1991 2001
80

Female Male TotalGap
(3-2)Female Male Total
Gap
(7-6)Female Male Total
Gap
(11-10)1 2 3 4 5 6 7 8 9 10 11 12 13
Andhra Pradesh 32.7 55.1 44.1 22.4 50.4 70.3 60.5 19.9 59.7 75.6 67.7 15.9
Arunachal Pradesh 29.7 51.5 41.6 21.8 43.5 63.8 54.3 20.3 59.6 73.7 67.0 14.1
Assam 43.0 61.9 52.9 NA 54.6 71.3 63.3 16.7 67.3 78.8 73.2 11.5
Bihar 22.0 51.4 37.5 29.4 33.1 59.7 47.0 26.6 53.3 73.4 63.8 20.1
Chhatisgarh 27.5 58.1 42.9 30.6 51.9 77.4 64.7 25.5 60.6 81.5 71.0 10.9
Goa 67.1 83.6 75.5 16.6 75.4 88.4 82.0 13.1 81.8 92.8 87.4 11
Gujarat 48.6 73.1 61.3 24.5 58.6 80.5 70.0 21.9 70.7 87.2 79.3 16.5
Haryana 40.5 69.1 55.9 28.6 45.7 78.5 67.9 32.8 66.8 85.4 76.6 18.6
Himachal Pradesh 52.1 75.4 63.9 23.2 67.4 85.4 76.5 17.9 76.6 90.8 83.8 14.2
Jammu & Kashmir NA NA NA NA 43.0 66.6 55.5 23.6 58.0 78.3 68.7 20.3
Jharkhand - - - - 38.9 67.3 53.6 28.4 56.2 78.5 67.6 22.3
Karnataka 44.3 67.3 56.0 22.9 56.9 76.1 66.6 19.2 68.1 82.9 75.6 14.8
Kerala 86.1 93.6 89.8 7.5 87.9 94.2 90.9 6.3 92.0 96.0 93.9 4
Madhya Pradesh 29.4 58.5 44.7 29.2 50.3 76.1 63.7 25.8 60.0 80.5 70.6 20.5
Maharashtra 52.3 76.6 64.9 24.2 67.0 86.0 76.9 18.9 75.5 89.8 82.9 14.3
Manipur 47.6 71.6 59.9 24.0 60.5 80.3 70.5 19.8 73.2 86.5 79.9 13.3
Meghalaya 44.9 53.1 49.1 8.3 59.6 65.4 62.6 5.8 73.8 77.2 75.5 3.4
Mi zoram 78.6 85.6 82.3 7.0 86.8 90.7 88.8 4.0 89.4 93.7 91.6 4.3
Nagaland 54.8 67.6 61.7 12.9 61.5 71.2 66.6 9.7 76.7 83.3 80.1 6.6
Orissa 34.7 63.1 49.1 28.4 50.5 75.4 63.1 24.8 64.4 82.4 73.5 18
Punjab 50.4 65.7 58.5 15.3 63.4 75.2 69.7 11.9 71.3 81.5 76.7 10.2
Rajasthan 20.4 55.0 38.6 34.6 43.9 75.7 60.4 31.9 52.7 80.5 67.1 27.8
Sikkim 46.7 65.7 56.9 19.1 60.4 76.0 68.8 15.6 76.4 87.3 82.2 10.9
Tamil Nadu 51.3 73.8 62.7 22.4 64.4 82.4 73.5 18.0 73.86 86.81 80.33 12.95
Tripura 49.7 70.6 60.4 20.9 64.9 81.0 73.2 16.1 83.15 92.18 87.75 9.03
Uttar Pradesh 24.4 54.8 40.7 30.5 42.2 68.8 56.3 26.6 59.26 79.24 69.72 19.98
Uttrakhand 41.6 72.8 57.8 31.2 59.6 83.3 71.6 23.7 70.7 88.33 79.63 17.63
West Bengal 46.6 67.8 57.7 21.3 59.6 77.0 68.6 17.4 71.16 82.67 77.08 11.51
A & N Islands 65.5 79.0 73.0 13.5 75.2 86.3 81.3 11.1 81.84 90.11 86.27 8.27
Chandigarh 72.3 82.0 77.8 9.7 76.5 86.1 81.9 9.7 81.38 90.54 86.43 9.16
Dadra & Nagar Haveli 27.0 53.6 40.7 26.6 43.0 73.3 60.0 30.3 65.93 86.46 77.65 20.53
Daman & Diu 59.4 82.7 71.2 23.3 70.4 88.4 81.1 18.0 79.59 91.48 87.07 11.89
Delhi 67.0 82.0 75.3 15.0 74.7 87.3 81.7 12.6 80.93 91.03 86.34 10.1
Lakashadweep 72.9 90.2 81.8 17.3 80.5 92.5 86.7 12.1 88.25 96.11 92.28 7.86
Pondicherry 65.6 83.7 74.7 18.1 73.9 88.6 81.2 14.7 81.22 92.12 86.55 10.88
India 39.3 64.1 52.2 24.8 53.7 75.3 64.8 21.6 65.46 82.14 74.04 16.68
*PROVISIONAL
Source: Office of Registrar General India
Excludes paomata and Purul sub-division of Senapati district of Manipur
11th Issue - Women & Men page 88
Note: Literacy Rates estimated on the basis of population age 7 years and above. Literacy Rates for 1991 exclude
Jammu & Kashmir
Table No. 4.3 Literacy Rate - States and union Territories
STATE/UNION
TERRITORY
1991 2001 2011*
81

Boys Girls Total Boys Girls Total Boys Girls Total Boys Girls Total
2005-06 937711 849100 1786811 466898 419362 886260 353620 337487 691107 1758229 1605949 3364178 47.74
2006-07 882968 768051 1651019 468942 419553 888495 404398 352056 756454 1756308 1539660 3295968 46.71
2007-08 896591 777969 1674560 509189 446244 955433 414159 360675 774834 1819939 1584888 3404827 46.55
2008-09 897235 788278 1685513 521525 446652 968177 451990 387566 839556 1870750 1622496 3493246 46.45
Source: Delhi Statistical Hand Book-2010
Table No. 4.4 Enrolment in Primary Secondary & Territiary in Delhi
No. of Students
Primary Middle Sec./Sr.Sec Total% of
girlsYear
82

Year Primary Middle Sec./Sr.Sec.
1 2 3 4
2005-06 47.52 47.32 48.83
2006-07 46.52 47.22 46.54
2007-08 46.46 46.71 46.55
2008-09 46.77 46.13 46.16
Enrolment in Educational Institutions
Table No. 4.5 % Share of girls enrolment in Primary, Secondary and tertiary Educational Institution in Delhi
Source: Delhi Statistical Hand Book-2010
83

Boys Girls Total Boys Girls Boys Girls Total
1 Andhra Pradesh 95.3 95.7 95.5 77.9 76.5 77.3 54.3 48.6 51.5
2 Arunachal Pradesh 149 136.6 143 100.9 87.7 94.4 52.4 46.1 49.4
3 Assam 129.3 130.1 129.7 73.4 76.9 75.1 35.1 35.1 31.5
4 Bihar 114.5 93.6 104.4 53.1 38.8 46.2 24.2 24.2 19.9
5 Chhattisgarh 128.8 122.2 125.5 95.2 84.4 89.8 39.5 29.5 34.6
6 Goa 131.1 127.9 129.6 92.1 85.1 88.7 58.2 58.4 58.3
7 Gujarat 130.3 114.6 12.3 85.3 70.2 78.2 47.2 37.4 42.6
8 Haryana 87.6 93.8 90.4 75.4 76.1 75.7 52.3 49.4 51
9 Himachal Pradesh 111.7 111.7 111.7 115.4 113.1 114.3 81.6 76.5 79.1
10 Jammu & Kashmir 105.7 100.6 183.2 73 60.2 66.8 39.1 32.4 35.8
11 Jharkhand 153.6 154.2 153.9 60.6 54.9 57.9 17.2 12.1 14.8
12 Karnataka 107.2 105 106.1 91.5 89 90.2 55.3 53.7 54.5
13 Kerala 91.6 93 92.3 101.6 98.5 100.1 49.9 50.5 50.2
14 Madhya Pradesh 154.5 152.3 153.4 104.2 95.5 100 56.3 37.9 47.6
15 Maharashtra 103.5 100 101.8 88.5 85 86.8 59 53.6 56.5
16 Manipur 176 170.3 173.2 107.6 100.9 104.3 52.3 49.6 51
17 Meghalaya 193.5 189.5 191.5 99.7 107 103.3 28.5 31.3 29.9
18 Mi zoram 169.7 164.3 167.1 88.5 86.8 87.7 45.7 45.5 45.6
19 Nagaland 92.5 92.5 92.5 58.9 61.3 60.1 22.7 23.3 23
20 Orissa 116.9 117.1 117 82.8 77.3 80.1 45.6 38.6 42.2
21 Punjab 93.5 92 92.8 70.3 67.6 69.1 38.8 40.3 39.4
22 Rajasthan 121.4 114.9 118.3 92.8 68.7 81.4 49.1 28.6 39.4
23 Sikkim 149.3 146.7 148 67.6 81.9 74.6 32.6 33.8 33.2
24 Tamil Nadu 116.4 115.9 1161.1 114.3 111 112.7 70 74.1 72
25 Tripura 149.4 146.2 147.8 88 87.6 87.8 46.2 43.6 44.9
26 Uttar Pradesh 111 116.6 113.7 71.1 64.2 67.8 57.9 47 52.9
27 Uttaranchal 114.4 125.2 119.4 91.2 94.6 92.8 70.1 59.3 64.8
28 West Bengal 113.3 112.5 112.9 70.2 72.3 71.2 40.7 34 37.5
29 A & N Islands 99 104.9 101.8 107 97.1 102 51.3 53.3 52.3
30 Chandigarh 102.4 89.5 96.1 82.7 80.1 81.5 60.1 61.3 60.6
31 Dadra & Nagar Haveli 173.2 174.5 173.8 108.7 87.6 98.9 59.4 37.6 48.5
32 Daman & Diu 146.1 125.8 135.9 114.5 96 105.3 63.6 92 74.9
33 Delhi 108.3 110.1 109.1 97.5 102.4 99.7 56.3 58 57.1
34 Lakashadweep 62.3 58.5 60.4 56.9 52.1 54.5 38.8 55.3 45.4
35 Pondicherry 154.7 134.8 144.4 120.6 103.9 112 82.1 80.7 81.4
115.9 113.2 114.6 80.6 74.1 77.5 49.2 41.4 45.5
Annual Report 2009-10 M/o. H.R.D. GOIIndia
Table No. 4.6 Gross Enrolment Ratio(All Categories of students) in the age group 6-11, 11-14 and 14-18 years during 2007-08
as on 30-09-2007 (provisional)
S.No State/UtsClasses I - V (6-11 Years) Classes VI - VIII (11-14 Years) Classes IX - XII (14-18 Years)
84

Boys Girls Total Boys Girls Total Boys Girls Total1 Andhra Pradesh 96.3 96.6 96.5 76.6 74.3 75.5 53.1 46.1 49.7
2 Arunachal Pradesh 143.6 129.3 136.6 91.1 78.2 84.7 51.3 42.3 47
3 Assam 97.6 99.2 98.4 67.6 63.5 65.6 35.2 27.8 31.6
4 Bihar 106.3 82.3 94.7 45.8 31.5 39 16 9.2 12.8
5 Chhattisgarh 127.2 119.1 123.2 92.7 82.3 87.6 38.5 28.7 33.76 Goa 121.6 117.5 119.6 96.5 90.5 93.6 56.2 56.1 56.1
7 Gujarat 127.9 111.3 120.1 82.5 67.5 75.4 45.8 36 41.2
8 Haryana 86.6 90.2 88.2 79.1 81.7 80.3 46.5 45.2 45.9
9 Himachal Pradesh 113.2 113 113.1 109.3 106.3 107.9 82.4 74.9 78.8
10 Jammu & Kashmir 105.8 100.3 103.1 70.9 58.4 64.9 38.4 31.8 35.2
11 Jharkhand 117.8 105.4 111.7 58.8 45.4 52.3 17.3 12.3 14.9
12 Karnataka 108.4 105.5 107 90.6 86.8 88.8 53.2 50.2 51.7
13 Kerala 93.1 93.8 93.4 101 96.8 98.9 69.7 74.6 72.1
14 Madhya Pradesh 153.7 146.9 150.4 101.6 90 96 49.9 33.3 42.1
15 Maharashtra 116.1 111 113.6 100.9 102.1 101.5 57.7 53 55.5
16 Manipur 166.7 160.4 163.6 106.1 99.1 102.6 52.2 49.1 50.7
17 Meghalaya 183.2 180.5 181.8 98.1 105.5 101.8 38.1 39 38.6
18 Mi zoram 162.4 155.4 158.9 87.5 85.9 86.7 46.2 46 46.1
19 Nagaland 91 89.5 90.2 59.7 61.9 60.8 23.3 24.1 23.7
20 Orissa 116.4 111.7 114.1 79.1 70.3 74.8 45.4 37.8 41.621 Punjab 78.1 85.4 81.3 68.1 70.1 69 41 38.5 39.922 Rajasthan 123.1 116.9 120.2 89.7 63.6 77.3 44.4 24.7 35.1
23 Sikkim 143.5 144.6 144.1 67.6 79.1 73.2 32.7 33.7 33.2
24 Tamil Nadu 117.8 117.8 117.8 110.3 108.1 109.2 65.8 69 67.425 Tripura 146.1 139.6 142.9 86.3 86.1 86.2 43.7 38 41
26 Uttar Pradesh 117.9 109.2 113.7 59.6 46.9 53.6 42 28 35.5
27 Uttaranchal 119.2 125.7 122.3 91.4 92.8 92.1 64.4 57.9 61.3
28 West Bengal 102.1 103.4 102.8 70 71.9 70.9 38.4 30 34.4
29 A & N Islands 105.2 106.8 106 104.4 101.6 103.1 50.5 52.8 51.630 Chandigarh 64.7 57.4 61.1 46.7 50.4 48.3 32.3 38.6 35.1
31 Dadra & Nagar Haveli 159.8 157 158.5 101.9 74.8 88.9 44.6 30.1 37.7
32 Daman & Diu 141.8 131 136.6 122.1 114.5 118.5 71.2 69.5 70.4
33 Delhi 105.7 105.9 105.8 90.4 96.9 93.3 55.5 57 56.2
34 Lakashadweep 59.4 60.4 59.9 59.2 58.9 59.1 41.4 48 44.4
35 Pondicherry 152.5 133.2 142.4 114.8 101.4 108 78.7 78.4 78.5114.4 107.8 111.2 77.4 69.5 73.6 44.4 36.4 40.6India
Annual Report 2008-09 M/o. H.R.D. GOI
S.No
Table No. 4.7 Gross Enrolment Ratio(All Categories of students) in the age group 6-11, 11-14 and 14-18 years during 2006-07
State/Uts Classes I - V (6-11 Years) Classes VI - VIII (11-14 Years) Classes IX - XII (14-18 Years)
85

Boys Girls Total Boys Girls Total Boys Girls Total
1 2 3 4 5 6 7 8 9 10
2004-05 -9.27 -1.47 -5.37 27.71 28.53 28.12 45.04 48.84 46.92
2005-06 0.98 9.48 5.1 12.54 20.22 16.34 46.37 46.15 46.26
2006-07 -5.7 4.0 -1.0 20.7 26.4 23.5 31.4 39.3 35.3
2007-08 0 0 0 0 0 0 33.8 38.4 36
Source : 2007-08 - Annual Report 2009-10, Ministry of HRD
Source : 2004-05 -Statistics on Women in India 2007, National Institute of Public Cooperation and child Development
Source : 2005-06 - Annual Report 2007-08, Ministry of HRD
Source : 2006-07 - Annual Report 2008-09, Ministry of HRD
Table No. 4.8 School Drop-out Rate in Classes (I-V), (I-VIII) and (I-X) in Delhi from 2004-05 to 2007-08
Year
Classes I - V Classes I - VIII Classes I - X
86

Boys Girls Total Boys Girls Total Boys Girls Total
1 2 3 4 5 6 7 8 9 10
Andhra Pradesh 19.1 18.5 18.8 47.7 49.8 48.7 62.3 64.0 63.1
Arunachal Pradesh 39.7 42.6 41 48.1 47.9 48.0 63.7 62.2 63.0
Assam 22.3 22.1 22.2 75.2 71.6 73.5 75.1 76.3 75.7
Bihar 44.6 49.7 46.9 63.6 57.2 70.7 78.3 81.5 79.5
Chhattisgarh 30.7 32.8 31.7 - - - - - -
Goa 0 0 0 -1.5 4.2 1.2 42.0 35.6 38.9
Gujarat 28.6 24.8 26.9 44.5 53 48.2 57.5 61.2 59.1
Haryana 0 0 0 4.5 8.8 6.5 34.0 39.2 36.4
Himachal Pradesh 1.6 4.4 2.9 0.0 0.0 0.0 26.1 34.2 30.2
Jammu & Kashmir -4.4 -6.5 -5.3 40.9 40.0 40.5 63.6 64.5 64.0
Jharkhand 12.7 5.5 9.4 - - - - - -
Karnataka 9.1 8.3 8.7 33.1 34.8 33.9 49.9 48.8 49.4
Kerala 0.0 0.0 0.0 0.0 0.0 0.0 1.5 -2.6 -0.5
Madhya Pradesh 0.0 0.0 0.0 30.2 30.0 46.1 58.0 66.2 61.6
Maharashtra 17.7 20.2 18.9 28.3 32.8 30.5 43.4 49.2 46.2
Manipur 35.8 39.3 37.5 41.0 42.9 41.9 47.9 40.8 44.6
Meghalaya 37.2 35.5 36.4 62.5 58.3 60.4 76.8 75.5 76.1
Mi zoram 46.5 44.8 45.7 61.7 59.3 606.0 73.2 69.5 71.4
Nagaland 36.8 39.2 38 46.8 46.4 46.6 74.6 73.4 74.0
Orissa 24.3 21.9 23.2 62.6 59.7 61.3 65.1 64.3 64.7
Punjab -2.9 3.1 -0.1 25.6 26.5 26.0 50.0 50.0 50.0
Rajasthan 45.5 47.9 46.6 62.2 62.5 62.3 70.2 73.6 71.5
Sikkim 26.2 12.5 19.7 68.1 61.7 64.9 80.6 79.3 80.0
Tamil Nadu 8.1 8.9 8.5 9.5 8.7 9.1 38.9 36.5 37.7
Tripura 24.3 20.6 22.6 55.3 54.1 54.8 73.5 73.3 73.4
Uttar Pradesh 36.3 31.3 33.9 31.0 13.6 28.6 30.3 19.6 26.2
Uttrakhand 21.8 17.6 19.8 - - - - - -
West Bengal 36.5 35.2 35.9 65.0 62.7 63.9 71.4 74.4 72.8
A & N Islands 9.7 11.2 10.4 17.2 14.4 15.9 32.4 30.3 31.4
Chandigarh 0 0.0 0 0.0 0.0 0.0 35.7 41.5 38.5
Dadra & Nagar Haveli 13.1 24.1 18.5 24.5 46.7 34.9 52.7 62.1 57.0
Daman & Diu 14.1 19.2 16.5 11.5 17.7 14.3 31.8 29.5 30.7
Delhi 0 0.0 0.0 0.0 0.0 0.0 33.8 38.4 36.0
Lakashadweep -3.5 9.2 2.6 0.0 0.0 0.0 26.3 35.7 30.7
Pondicherry 0.0 0.0 0.0 0.0 0.0 0.0 5.2 -0.9 2.2
India 26.2 24.8 25.5 44.3 41.4 43.0 56.4 57.3 56.8
Source: Annual Report 2009-10 Ministry of HRD
Table No. 4.9 Drpout Rates in Classes (I-V), (I-VIII) and (I-X) for the year 2007-08 in India
States/Union TerritoryClasses I-V Classes I-VIII Classes I-X
87

BOYS GIRLS TOTAL BOYS GIRLS TOTAL BOYS GIRLS TOTAL BOYS GIRLS TOTAL
1 2 3 4 5 6 7 8 9 10 11 12 13
1999 46.94 50.92 48.78 64.50 63.96 64.27 62.67 75.77 68.86 70.80 79.39 74.49
2000 48.46 51.85 50.03 65.57 65.12 65.37 64.75 78.91 71.48 72.11 81.94 76.35
2001 48.16 51.54 49.72 66.84 66.29 66.61 66.68 77.40 71.75 71.42 80.22 75.20
2002 53.59 56.47 54.91 69.64 69.24 69.53 64.86 77.74 71.04 70.91 80.86 75.20
2003 57.67 59.57 57.47 67.49 68.75 68.02 68.75 81.22 74.63 68.62 80.33 73.59
2004 57.54 62.32 59.75 71.46 73.28 72.22 69.43 82.58 75.75 71.29 82.28 76.00
2005 59.41 62.51 60.84 74.13 75.26 74.60 72.59 82.99 77.61 73.78 83.17 77.80
2006 67.23 69.10 68.11 76.77 77.70 77.16 75.12 83.51 79.16 75.93 84.41 79.55
2007 76.75 77.68 77.18 84.24 84.72 84.44 78.28 85.88 81.93 77.37 85.02 80.64
2008 82.10 83.75 82.87 86.46 87.96 87.08 80.65 86.93 83.69 77.59 85.41 80.91
2009 87.21 88.25 87.70 88.18 89.78 88.84 80.80 88.04 84.25 77.40 85.94 81.00
2010 88.15 90.05 89.04 88.30 90.68 89.29 81.12 89.13 84.97 75.90 85.28 79.87
2011 95.43 96.33 95.85 96.28 97.08 96.61 81.58 89.72 85.45 76.78 86.57 80.88
Source: Statistical Abstract, 2010, Dte. of Economics & Satistics, Delhi
TABLE NO. 4.10 RESULTS OF CENTRAL BOARD OF SECONDARY EXAMINATION IN DELHI & INDIA
PASS PERCENTAGE
INDIA
PASS PERCENTAGE
YEAR
SECONDARY
DELHI
SR. SECONDARY
DELHI INDIA
PASS PERCENTAGE PASS PERCENTAGE
88

Boys Girls Total Boys Girls Total Boys Girls Total
2001-02 92979 77106 170085 146451 62770 209221 239430 139876 379306 36.87
2002-03 98520 83355 181875 174791 84610 259401 273311 167965 441276 38.06
2003-04 87426 81138 168564 139332 151177 290509 226758 232315 459073 50.6
2004-05 163765 96867 260632 187004 98263 285267 350769 195130 545899 35.74
2005-06 77692 79138 156830 205004 108089 313093 282696 187227 469923 39.84
2006-0785265 78794 164059 - - - 85265 78794 164059 48.02
2007-08 74755 74822 149577- - -
74755 74822 149577 50.02
2008-09 (*) 168177 93635 261812
- - -
168177 93635 261812 35.76
Source:Stat.Abstract-2008, Dte. Of Economics & Stats.
(*) Source: Delhi Statistical Hand Book - 2009Book 2010
IGNOU Combined % of Girls
Students
Table No. 4.11 Higher Education Enrolment In Delhi
Number of Students
Year
Universities, Collages &
Other Institutions
89

Male Female Total Male Female Total Male Female Total Male Female Total
1 2 3 4 5 6 7 8 9 10 11 12 13
8258 14680 22938 2872 5333 8205 22734 33039 55773 33864 53052 86916
(36.0) (64.0) (100.0) (35.0) (65.0) (100.0) (41.0) (59.0) (100.0) (39.0) (61.0) (100.0)
7408 15203 22611 1911 6384 8295 19530 38485 58015 28849 60072 88921
(33.0) (67.0) (100.0) (23.0) (77.0) (100.0) (34.0) (66.0) (100.0) (32.0) (68.0) (100.0)
7630 15300 22930 2468 6724 9192 20032 39031 59063 30130 61055 91185
(33.0) (67.0) (100.0) (27.0) (73.0) (100.0) (34.0) (66.0) (100.0) (33.0) (67.0) (100.0)
7560 15415 22975 2473 6737 9210 20064 39082 59146 30097 61234 91331
(33.0) (67.0) (100.0) (27.0) (73.0) (100.0) (34.0) (66.0) (100.0) (33.0) (67.0) (100.0)
6728 19228 25956 1823 5403 7226 20248 40901 61149 28799 65532 94331
(26.0) (74.0) (100.0) (25.0) (75.0) (100.0) (33.0) (67.0) (100.0) (30.0) (70.0) (100.0)
7467 16440 23907 1611 6237 7848 20788 41996 62784 29866 64673 94539
(31.0) (69.0) (100.0) (20.0) (80.0) (100.0) (33.0) (67.0) (100.0) (32.0) (68.0) (100.0)
6233 15645 21878 1572 7240 8812 20911 48210 69121 28716 71095 99811
(29.0) (71.0) (100.0) (18.) (82.0) (100.0) (30.0) (70.0) (100.0) (29.0) (71.0) (100.0)
2008-09* 7693 18539 26232 1580 6293 7873 21065 50133 71198 30338 74965 105303
(29.0) (71.0) (100.0) (20.0) (80.0) (100.0) (30.0) (70.0) (100.0) (29.0) (71.0) (100.0)
2005-06
2006-07
2007-08
2001-02
2002-03
2003-04
2004-05
*Delhi Statistical hand book 2010
Number of Teachers
Source : Stat.Abstract-2008,Dte.of Eco.& Stats.
Table No. 4.12 Number of Teachers by School Categories in Delhi
Primary Middle Sec./Sr.Sec TotalYear
10 11 11
11
8 10 10
7
28
25
25 25 29
25
22 25
62
64 6
4
64 62
65
68
68
39
32 33 3331
3229 29
0
10
20
30
40
50
60
70
80
2001-02 2002-03 2003-04 2004-05 2005-06 2006-07 2007-08 2008-09
Share (%) of Male, Female and Female Teachers in Delhi
Middle Primary Sec./Sr.Sec Male Female
90

Male Female Total Male Female Total Male Female Total
1 Andhra Pradesh 87704 79355 167059 62735 48214 110949 126984 758703 202687
2 Arunachal Pradesh 2940 1269 4209 3200 1740 4940 3508 1297 4805
3 Assam 76718 42206 118924 62326 18040 80366 58842 22040 80882
4 Bihar 93893 53000 146893 66110 35671 101781 36260 6462 42722
5 Chhattisgarh 55131 21394 76525 25435 10406 35841 20111 9399 29510
6 Goa 428 3503 3931 640 1725 2365 2043 2418 4461
7 Gujarat 26406 17074 43480 90263 105330 195593 56971 21674 78645
8 Haryana 15277 14847 30124 9873 8641 18514 45921 39991 85912
9 Himachal Pradesh 16676 14057 30733 20114 12740 32854 14097 7282 21379
10 Jammu & Kashmir 18822 13077 31899 29136 21096 50232 17898 11621 29519
11 Jharkhand 46759 17282 64041 49140 20003 69143 7824 4720 12544
12 Karnataka 25879 45998 71877 86318 101822 188140 63258 48944 112202
13 Kerala 10278 30699 40977 13920 32018 45938 30849 80237 111086
14 Madhya Pradesh 201421 90641 292062 111475 30920 142395 63734 39727 103461
15 Maharashtra 76237 115576 191813 114363 90180 204543 201955 93328 295283
16 Manipur 4712 2966 7678 5045 3520 8565 6853 4863 11716
17 Meghalaya 7557 6477 14034 5072 4335 9407 3096 2504 5600
18 Mi zoram 3472 3336 6808 5459 3125 8584 3208 1489 4697
19 Nagaland 4995 2961 7956 3703 2101 5804 5194 3828 9022
20 Orissa 66050 41521 107571 29569 12026 41595 65288 20010 85298
21 Punjab 13427 22900 36327 6672 7398 14070 27498 36218 63716
22 Rajasthan 85668 37901 123569 138939 60778 199717 109471 40586 150057
23 Sikkim 3171 3741 6912 1031 1012 2043 1398 1014 2412
24 Tamil Nadu 42371 120421 162792 27259 41248 68507 402273 49373 89646
25 Tripura 6196 1659 7855 6713 1763 8476 12045 5658 17703
26 Uttar Pradesh 190338 141314 331652 63179 24761 87940 155233 34007 189240
27 Uttaranchal 22420 26019 48439 12704 7279 19983 25052 10253 35305
28 West Bengal 108552 43459 152011 4612 1748 6360 98951 42944 141895
29 A & N Islands 390 617 1007 313 455 768 1340 1527 2867
30 Chandigarh 76 372 448 35 356 391 1038 4878 5916
31 Dadra & Nagar 254 186 440 425 616 1041 233 239 472
32 Daman & Diu 81 414 495 76 1558 231 184 150 334
33 Delhi 6233 17093 23326 1572 7240 8812 20911 48210 69121
34 Lakashadweep 120 83 203 96 65 161 278 132 410
35 Pondicherry 658 2485 3143 519 865 1384 2634 4252 6886
1321310 1035903 2357213 1058041 719392 1777433 1330433 776978 2107411
Source: Annual report 2009-10, Deptt of School Education and Literacy, Deptt. Of Higher Education, Ministry of Human Resource Development, Govt. of IndiaTotal
Table No. 4.13 Number of Teachers States & Union Territories wise in 2007-08 (Provisional) as on 30.09.2007
S.No State/UtsPrimary School Middle/ Upper primary Schhol Secondary/ Higher Secondary School
91

1 2 3 4 5 6 7 8 9 10 11 12 13
1990-91 1395642 422402 243715 71726 944327 318471 128584 38009 1170748 375144 140816 37613
1991-92 1402227 420800 241474 70927 952213 326330 126821 38550 1207608 401225 149370 43900
1992-93 1396800 452371 277093 84545 947638 330963 137663 44915 1210155 393592 165195 54430
1993-94 1396267 447134 227112 65990 992032 367242 137715 39166 1282851 445427 161578 46299
1994-95 1455217 465806 232598 64865 1003547 361615 152304 48131 1306340 444739 158101 46691
1995-96 1525200 510998 248943 84039 1024482 371391 157059 52241 1360581 463995 171271 51024
1996-97 1538528 515049 258110 88520 1039769 378724 160711 52233 1370324 483029 170563 58719
1997-98 1610446 555262 271726 98634 1066759 386144 170118 58291 1431123 497022 179661 55017
Andhra Pradesh 117146 38539 4327 1825 53339 20608 5170 3005 112165 45011 5072 3082
Arunachal
Pradesh1421 221 1716 676 1045 182 1336 389 1745 299 1184 262
Assam 56029 14864 28831 7817 19405 2959 32481 6496 18107 3734 47633 11716
Bihar 101975 20395 13906 1628 90384 20788 8939 1828 44159 6734 1428 302
Goa 2704 1750 282 261 753 490 58 48 7413 4279 565 397
Gujarat 33560 16241 923 686 131950 61963 7805 5341 64194 15380 559 282
Haryana 40874 20748 2351 1414 8585 3046 860 467 54976 24718 2174 1274
Himachal Pradesh 21409 8916 4720 2093 6288 1477 73 49 20887 7066 350 210
Jammu &
Kashmir12865 5095 11887 4256 11966 4284 13008 5365 17654 5987 8903 3363
Karnataka 65725 24023 0 0 118102 52022 0 0 76012 18461 0 0
Kerala 45662 32241 838 297 47034 31487 2311 1350 103188 68673 682 383
Madhya Pradesh 141372 34531 73310 26264 66212 16876 34692 12475 55245 15194 26142 7998
Maharashtra 156224 83356 20824 15707 169268 68357 7985 3379 223300 67411 5872 1899
Manipur 4485 1261 4985 2011 2013 548 4577 1782 3422 1070 6731 2718
Meghalaya 4025 1716 6612 3160 1000 437 3441 1334 2191 1199 3129 1227
Mi zoram 3604 1759 1120 463 3488 734 1245 426 1267 264 1551 407
Nagaland 2842 984 3965 1228 1500 360 3341 1632 2103 985 3136 1079
Orissa 109488 26865 1552 643 34099 5483 4815 241 50613 10391 5864 1544
Punjab 46356 28324 15 15 13300 6450 180 143 60979 31340 441 345
Rajasthan 90915 24790 9039 3991 93364 22106 15672 6357 88545 23661 6048 3331
Sikkim 1300 509 2182 1074 821 263 841 347 1255 502 1325 407
Tamil Nadu 115686 47799 0 0 64 395 31358 0 0 129823 56152 0 0
Tripura 5681 3523 8516 2430 1302 344 5245 1193 6159 2029 11734 3479
Uttar Pradesh 295999 72416 13002 6440 95587 20787 7925 2231 133827 25388 6917 1065
West Bengal 96408 23206 56300 13776 19733 5675 8019 2346 82100 20101 32096 8190
A. & N. Island 735 319 80 70 710 365 19 13 2518 1191 27 14
Chandigarh 895 595 0 0 476 422 0 0 3908 3095 0 0
D. & N. Haveli 243 86 8 0 478 273 17 10 231 94 17 16
Daman and Diu 329 185 29 27 181 68 0 0 280 100 12 7
Delhi 32519 19034 0 0 8189 4959 0 0 58304 34443 0 0
Lakshadweep 182 73 3 1 226 87 16 6 340 66 50 6
Puducherry 1788 898 403 381 1568 886 47 38 4213 2004 19 14
Source: Statistical Abstract India 2007, CSO, Government of India page 576
Union Territory
State:
Total Women Total WomenTotal Women
Trained Untrained
Total Women Total Women
Table No. 4.14 Number of Teachers in Educational Institutions States & Union Territories wise
(By Stage of Institutions)Primary/Basic Schools(1)
Trained Untrained Trained UntrainedYears/State/U.T.
Middle/Sr. Basic School High/Higher Secondary
Total Women
92

Male Female Total Male Female Total Male Female Total
2001-02 6897 4698 11595 179 90 269 7076 4788 11864 40.36
2002-03 7642 4918 12560 173 91 264 7815 5009 12824 39.06
2004-05 8737 5851 14588 173 91 264 8910 5942 14852 40.01
2005-06 8377 5851 14228 173 91 264 8468 5942 14492 41.00
2006-07 8377 5851 14228 173 91 264 8550 5942 14492 41.00
2007-08 1299 483 1782 1299 483 1782 27.1
Delhi Statistical Handbook 2010
% of
Female
Teachers
Year
Table No. 4.15 Higher Education Teching Faculty in Delhi
Universities, Colleges & other
InstitutionsIGNOU Total
No. of persons
93

I-V VI-VIII I-VIII IX-XII I-XII Hr.Edu
1 Andhra Pradesh 1.00 0.97 0.99 0.87 0.96 0.63
2 Arunachal Pradesh 0.90 0.86 0.89 0.83 0.89 0.69
3 Assam 1.02 0.94 0.99 0.79 0.97 0.49
4 Bihar 0.77 0.69 0.76 0.58 0.76 0.25
5 Chhattisgarh 0.94 0.89 0.92 0.75 0.90 0.76
6 Goa 0.97 0.94 0.96 1.00 0.96 1.36
7 Gujarat 0.87 0.82 0.86 0.79 0.84 0.81
8 Haryana 1.04 1.03 1.04 0.97 1.02 0.96
9 Himachal Pradesh 1.00 0.97 0.99 0.91 0.96 1.05
10 Jammu & Kashmir 0.95 0.82 0.91 0.83 0.89 0.90
11 Jharkhand 0.89 0.77 0.87 0.71 0.87 0.68
12 Karnataka 0.97 0.96 0.97 0.94 0.97 0.73
13 Kerala 1.01 0.96 0.99 1.07 1.01 1.14
14 Madhya Pradesh 0.96 0.89 0.94 0.67 0.90 0.49
15 Maharashtra 0.96 1.01 0.98 0.92 0.97 0.76
16 Manipur 0.96 0.93 0.95 0.94 0.95 0.86
17 Meghalaya 0.99 1.08 1.01 1.02 1.01 0.89
18 Mi zoram 0.96 0.98 0.96 1.00 0.97 0.66
19 Nagaland 0.98 1.04 1.00 1.03 1.01 0.73
20 Orissa 0.96 0.89 0.94 0.83 0.92 0.25
21 Punjab 1.09 1.03 1.07 0.94 1.04 0.97
22 Rajasthan 0.95 0.71 0.88 0.56 0.83 0.59
23 Sikkim 1.01 1.17 1.05 1.03 1.04 0.84
24 Tamil Nadu 1.00 0.98 0.99 1.05 1.01 0.72
25 Tripura 0.96 1.00 0.97 0.87 0.96 0.73
26 Uttar Pradesh 0.93 0.79 0.90 0.67 0.87 0.69
27 Uttrakhand 1.05 1.02 1.04 0.90 1.01 0.95
28 West Bengal 1.01 1.03 1.02 0.78 0.98 0.65
29 A & N Islands 1.02 0.97 1.00 1.05 1.02 1.39
30 Chandigarh 0.89 1.08 0.96 1.19 1.03 1.53
31 Dadra & Nagar Haveli 0.98 0.73 0.91 0.67 0.89 -
32 Daman & Diu 0.92 0.94 0.93 0.98 0.94 1.31
33 Delhi 1.00 1.07 1.03 1.03 1.03 1.05
34 Lakashadweep 1.02 1.00 1.01 1.16 1.06 0.00
35 Pondicherry 0.87 0.88 0.88 1.00 0.91 0.79
0.94 0.90 0.93 0.82 0.91 0.69
Table No. 4.16 Gender Parity Index - States & UT's
INDIASource : Abstract of Selected Educational Statistics 2006-2007, Min of HRD
All Categories StudentsSl. No. States?Uts
94

S.No. India/Delhi Gender Parity All India Ranking
1 Delhi 1.00 10th ranking
2 India 0.94
Source: Abstract of Selected Educational Statistics 2006-2007
Table No. 4.17 Gender Parity Index in Primary Enrolement (I-V)
95

Male Femnale Total Male Femnale Total
Urban 73.9 73.7 73.8 1.00 82.9 80.7 81.9 0.97
Rural 72.9 69.4 71.2 0.95 85.6 81.2 83.5 0.95
Total 73.2 70.5 71.9 0.96 84.9 81.1 83.1 0.95
Urban 61.4 59.5 60.5 0.97 71.5 70.1 70.8 0.98
Rural 54.7 40.1 47.2 0.73 64.8 47.7 56.0 0.74
Total 56.8 45.6 51.2 0.80 66.9 54.1 60.5 0.81
Source: National Family Health Survey - 3 (2005-06)
Note: In this table, children's age refers to their age at the start of the 2005-06 school year (assumed here to be
April 2005)
1 The NAR for primary school (standards 1-5) is the percentage of the primary-school age population (6-10)
years) that is attending primary school. The NAR for middle, secondary and higher secondary school (standards
6-12) is the percentage of the population in the appropriate age group for those school levels (11-17 years) that
is attending those school levels. By definition the NAR cannot exceed 100.0 percent.
2. The GAR for primary school (standards (1-5) is the total number of primary school student, expressed as a
percentage of the official primary-school-age population (6-10 years). The GAR for middle, secondary and
higher secondary school stantards 6-12) is the total number of students in those school levels, expressed as a
percentage of the official population that is the appropriate age to be attending those school levels. If there are
significant number of overage and underage students at a given level of schooling, the GAR can exceed 100.0
3 The Gender Parity Index for primary school is the ratio of the primary school NAR (GAR) for females to the
NAR (GAR) for males. The Gender Parity Index for middle, secondary and higher secondary school is the ratio
of the NAR (GAR) for females to the NAR (GAR) for males at those levels of school.
Gender
Parity Index3
PRIMARY SCHOOL
MIDDLE, SECONDARY AND HIGHER SECONDARY SCHOOL
Table No. 4.18 School attendance ratio
Net attendance ratios (NAR), gross attendance ratios (GAR) and Gender Parity Index (GPI) for the de facto
household population by level of schooling and sex, according to residence, India, 2005-06
ResidenceNet attendance ratio
1Gross attendance ratio
2
Gender Parity
Index3
96

97
EMPLOYMENT & UNEMPLOYMENT
� Percentage share of women employees in Delhi Government has
been increasing steadily over the years. But still the share of
women employees is less than men employees.
� During 2009 out of 86683 total working employees in various
departments of Government of NCT of Delhi, 32066 (36.99%)
are female employees as compared to 40.1% during 2008. out of
4476 employees under Group ‘A’ there are 1337 female
employees which constitute 29.7% as compared to 29.1% during
2008. The percentage of female employees in Group ‘B’, ‘C’, ‘D’
are 48.99%, 33.95% and 36.99% respectively.
� The number of job seekers registered with employment
exchanges gives an idea of the extent of educated
unemployment. Percentage of female job seekers registered in
employment exchanges in Delhi increase to 28.2% in 2009 as
compared 27.64% in 2000. Whereas, male job seekers are 71.8
% in 2009 as compared to 72.36% in 2000.
� It is seen that unemployment rate in respect of female had
considerably increased which is a healthy indicator of increase in
the female employment.
� Employment rate in respect of both female and male has
increased in 2007-2008 as compared to 2005-2006.
� labour force in respect of female has decreased from 88 to 79
and male has increased to 580 during 2007-2008 as compared to
568 during 2005-2006.

Male Female Combined Male Female Combined Male Female Combined
1 2 3 4 5 6 7 8 9 10
NSS 55TH Round (July 1999 - June 2000) 530 99 335 493 51 293 70 487 126
NSS 57TH Round (July 2001 - June 2002) 834 96 485 788 84 455 55 125 62
NSS 58TH Round (July 2002 - Dec. 2002) 784 79 474 738 77 447 47 3 27
NSS 59TH Round (Jan. 2003 - Dec. 2003) 768 102 466 735 95 444 33 7 22
NSS 61ST Round (July 2004 - June 2005) 544 79 335 528 75 325 30 46 32
NSS 62ND Round (July 2005 - June 2006) 568 88 353 546 84 339 39 46 40
NSS 64TH Round (July 2007 - June 2008) 580 79 355 549 74 337 52 60 53
Source: Statistical Abstract, 2010, Dte. of Economics & Statistics, Delhi
Table No. 5.1 EMPLOYMENT & UNEMPLOYMENT IN DELHI
NSS RoundLabour Force Employment Rate Unemployment
Per thousand population
53
0
83
4
78
4
76
8
54
4
56
8
58
0
99
96
79 1
02
79 88
79
33
5
48
5
47
4
46
6
33
5
35
3
35
5
0
100
200
300
400
500
600
700
800
900
55th 57th 58th 59th 61Sst 62nd 64th
Labour Force
Male Female Combined
49
3
78
8
73
8
73
5
52
8
54
6
54
9
51 8
4
77 95
75 84
74
29
3
45
5
44
7
44
4
32
5
33
9
33
7
0
100
200
300
400
500
600
700
800
900
55th 57th 58th 59th 61Sst 62nd 64th
Employment Rate
Male Female Combined7
0
55
47
33
30 39 52
48
7
12
5
3 7
46
46 60
12
6
62
27
22 32 40 53
0
100
200
300
400
500
600
55th 57th 58th 59th 61Sst 62nd 64th
Unemployment
Male Female Combined
98

Number Percentage Number Percentage Number Percentage
1 2 3 4 5 6 7
2000 273780 27.64 716887 72.36 990667 100
2001 281512 27.98 724730 72.02 1006242 100
2002 296122 27.96 762883 72.04 1059005 100
2003 303957 27.66 795020 72.34 4098977 100
2004 205059 32.23 431141 67.77 636200 100
2005 205814 30.54 468038 69.46 673852 100
2006 182885 32.84 373982 67.16 556867 100
2007 153929 34.09 297566 65.90 451495 100
2008 169699 33.48 337220 66.52 506919 100
2009 129991 28.2 330812 71.8 460803 100
Source: Delhi Statistics Hand Book, 2010, DES, Delhi
Table No. 5.2 Job seeker registered with employment exchange sex wise in Delhi
Number of live registered
Female Male Total Persons
Years
99

(in thousand)
Female Male Person Female Male Person Female Male Person
1 2 3 4 5 6 7 8 9 10 11
1 Andhra Pradesh 631.3 1900.5 2531.8 630.1 1797.5 2427.6 622.4 1796.2 2418.6
2 Arunachal Pradesh 7.3 15.3 22.6 7.8 17.3 25.1 9.3 20.9 30.2
3 Assam 343.0 1289.0 1632.0 395.9 1364.9 1760.8 423.1 1420.1 1843.2
4 Bihar 118.8 1448.5 1567.3 107.5 1354.3 1461.8 210.3 1536.6 1746.9
5 Chhattishgarh 164.0 737.9 901.9 184.8 803.7 988.5 208.8 842.1 1050.9
6 Goa 31.7 69.0 100.7 32.2 68.6 100.8 33.0 68.8 101.8
7 Gujrat 179.2 747.6 926.8 175.2 679.4 854.6 174.4 627.1 801.5
8 Haryana 168.0 764.4 932.4 209.6 855.1 1064.7 222.2 898.2 1120.4
9 Himachal Pradesh 275.8 594.0 869.8 284.3 627.0 911.3 260.2 505.8 766.0
10 Jammu & Kashmir 16.8 95.6 112.4 17.5 98.5 116.0 16.5 89.1 105.6
11 JharKhand 169.6 1224.2 1393.8 135.1 1073.8 1208.9 131.9 1122.3 1254.2
12 Karnataka 382.6 1185.4 1568.0 326.2 992.1 1318.3 280.1 863.4 1143.5
13 Kerala 2153.2 1599.2 3752.4 2106.9 1521.7 3628.6 2191.5 1585.8 3777.3
14 Madhya Pradesh 364.1 1666.7 2030.8 403.0 1757.9 2160.9 282.6 1623.5 1906.1
15 Maharashtra 902.1 3489.0 4391.1 826.7 3165.1 3991.8 772.1 2880.1 3652.2
16 Manipur 117.4 340.3 457.7 138.9 393.4 532.3 160.1 419.8 579.9
17 Meghalaya 14.9 22.4 37.3 15.3 22.7 38.0 12.9 19.2 32.1
18 MiZoram 12.1 22.8 34.9 12.4 22.0 34.4 16.8 26.1 42.9
19 Nagaland 12.1 31.9 44.0 12.7 31.6 44.3 11.6 31.0 42.6
20 Orissa 192.9 664.1 857.0 189.8 643.4 833.2 212.9 678.4 891.3
21 Punjab 131.3 346.0 477.3 128.4 334.7 463.1 133.7 320.6 454.3
22 Rajasthan 101.9 692.2 794.1 100.7 692.9 793.6 108.4 673.2 781.6
23 Sikkim 0.0 0.0 0.0
24 Tamil Nadu 1709.0 2797.5 4506.5 1528.9 2152.3 3681.2 1848.8 2410.2 4259.0
25 Tripura 138.5 239.4 377.9 146.3 253.4 399.7 157.1 270.1 427.2
26 Uttarakhand 52.0 260.7 312.7 61.2 317.7 378.9 89.2 374.9 464.1
27 Uttar Pradesh 180.2 1717.5 1897.7 179.1 1692.2 1871.3 696.8 2414.0 3110.8
28 West Bengal 1830.2 5166.0 6996.2 1934.9 5357.0 7291.9 2089.4 5802.9 7892.3
29 Andaman & Nicobar 13.1 25.5 38.6 12.9 26.1 39.0 13.0 27.0 40.0
30 Chandigrah 16.6 48.0 64.6 13.6 42.4 56.0 12.8 39.2 52.0
31 Dadra & Nagar Haveli 1.9 4.6 6.5 1.9 4.6 6.5 1.9 4.8 6.7
32 Delhi 205.1 431.1 636.2 205.8 465.6 671.4 182.9 374.0 556.9
33 Daman & Diu 2.6 7.3 9.9 2.9 7.7 10.6 2.9 8.0 10.9
34 Lakashadweep 3.3 7.8 11.1 3.5 7.7 11.2 3.5 7.7 11.2
35 Pondicherry 69.1 94.6 163.7 73.6 97.8 171.4 80.4 101.8 182.2
10711.6 29746.1 40457.7 10605.6 28742.2 39347.8 11673.5 29882.9 41556.4
Source : Selected Socio Economic Statistics, M/O Statistics and Programme Implementation, CSO, Govt. of India
20052004 2006
No. on Live register as at the end of the year
Table No. 5.3 JOB SEEKERS REGISTERED WITH EMPLOYMENT EXCHANGES
BY STATES AND UNION TERRITORIES OF India
Note : No employment exchange is functioning in Sikkim.
Sl.No. State/Union Territory
India
100

A B C D TOTAL A B C D TOTAL
1 2 3 4 5 6 7 8 9 10 11
965 10945 8483 2204 22597 67 97 1001 380 1545
4.27% 48.44% 37.54% 9.75% 100.00% 4.34% 6.28% 64.79% 24.60% 100.00%
1134 11587 8610 1951 23282 75 108 1005 387 1575
4.87% 49.77% 36.98% 8.38% 100.00% 4.76% 6.86% 63.81% 24.57% 100.00%
1289 11461 7988 2339 23077 86 127 1032 397 1642
5.59% 49.66% 34.61% 10.14% 100.00% 5.24% 7.73% 62.85% 24.18% 100.00%
1172 15335 9602 2162 28271 169 310 2676 1382 4537
4.15% 54.24% 33.96% 7.65% 100.00% 3.72% 6.83% 58.98% 30.46% 100.00%
1058 15223 8154 1858 26293 188 301 2612 1656 4757
4.02% 57.90% 31.01% 7.07% 100.00% 3.95% 6.33% 54.91% 34.81% 100.00%
1303 15546 8708 3031 28588 205 404 2254 1468 4331
4.56% 54.38% 30.46% 10.60% 100.00% 4.73% 9.33% 52.04% 33.90% 100.00%
1136 15645 8890 2761 28432 219 417 2239 1419 4294
4.00% 55.03% 31.27% 9.71% 100.00% 5.10% 9.71% 52.14% 33.05% 100.00%
1162 17110 8860 3667 30799 174 431 2059 2025 4689
3.77% 55.55% 28.77% 11.91% 100.00% 3.71% 9.19% 43.91% 43.19% 100.00%
1337 17589 10248 2892 32066 217 340 1789 1763 4109
4.17% 54.85% 31.96% 9.02% 100.00% 5.28% 8.27% 43.54% 42.91% 100.00%
Souruce :Census of Employees in Government of Delhi and Autonoumous Bodies, 2008Bodies 2009
2001
2002
2003
Table No. 5.4 FEMALE EMPLOYEES IN DELHI
Year
Delhi Government
GROUP
Autonomous Bodies
GROUP
2009
2008
2004
2005
2006
2007
70
Group wise % share of Female Employees in Delhi Government Deptts.
A B C D
4 5 6 4 4 5 4 4 4
48 50 5054
5854 55 56 55
38 3735 34
31 30 3129
32
10 8 108 7
11 10 129
0
10
20
30
40
50
60
70
2001 2002 2003 2004 2005 2006 2007 2008 2009
A B C D
4 5 5 4 4 5 5 4 5
6 7 8 7 69 10 9 8
65 64 6359
5552 52
44 44
25 25 24
3035 34 33
43 43
0
10
20
30
40
50
60
70
2001 2002 2003 2004 2005 2006 2007 2008 2009
Group wise % share of Female Employees in Autonomous Bodies Delhi
A B C D
101

Total
Working
Female
Employees % to Total
Total
Working
Female
Employees % to Total
Total
Working
Female
Employees % to Total
1 2 3 4 5 6 7 5 6 7
Group A 3847 1136 29.5 3993 1162 29.1 4476 1337 29.87
Group B 31921 15645 49.0 33958 17110 50.4 35903 17589 48.99
Group C 25215 8890 35.3 25690 8860 34.5 30182 10248 33.95
(i) Safai Karmachari 2266 1015 44.8 2225 988 44.4 2452 672 27.41
(ii) Other than Safai
Karmachari13415 1746 13.0 10987 2679 24.4 13670 2220 16.24
Total 76664 28432 37.0 76853 30799 40.1 86683 32066 36.99
Source: Census of Employees, DES 2009, Delhi
Category
2007 2008 2009
Group D
Table No. 5.5 Group-wise Female Employees in Government of NCT of Delhi
102

States/UT
Total
Employed
(Lakhs)
% of Women
employment
to total
Total
Employed
(Lakhs)
% of Women
employment
to total
Total
Employed
(Lakhs)
% of Women
employment
to total1 2 3 4 5 6 7
Andhra Pradesh 20.6 23.3 20.4 23.0 19.9 22.1
Assam 11.0 30.0 11.1 33.3 11.5 33.0
Bihar 5.3 5.7 5.3 5.7 4.3 4.7
Chhattishgarh 3.4 11.8 3.4 11.8 3.4 11.8
Goa 0.5 20.0 1.1 18.2 1.3 15.4
Gujrat 16.2 13.6 16.9 13.6 17.6 13.6
Haryana 6.5 15.4 6.5 15.4 6.5 15.4
Himachal Pradesh 3.0 16.7 3.2 15.8 3.2 15.6
Jammu & Kashmir 2.1 9.5 2.1 9.5 2.1 9.5
JharKhand 10.4 7.7 10.4 7.7 14.9 7.4
Karnataka 18.2 30.8 18.6 31.2 19.2 30.7
Kerala 12.0 41.7 11.4 39.5 11.1 38.7
Madhya Pradesh 11.0 12.7 10.7 13.1 10.6 13.2
Maharashtra 35.6 15.7 35.4 16.1 36.1 16.9
Manipur 0.8 25.0 0.8 25.0 0.8 25.0
Meghalaya 0.8 25.0 0.8 25.0 0.8 25.0
MiZoram 0.4 25.0 0.4 25.0 0.4 25.0
Nagaland 0.7 14.3 0.7 14.3 0.8 2.0
Orissa 7.5 14.7 7.5 14.7 7.4 16.2
Punjab 8.3 16.9 7.7 16.9 8.4 17.9
Rajasthan 11.8 14.4 11.8 15.3 12.1 15.7
Tamil Nadu 22.8 30.3 22.8 31.1 22.4 32.1
Tripura 1.2 25.0 1.2 25.0 1.5 20.0
Uttar Pradesh 21.2 10.4 20.9 10.5 20.9 11.0
Uttarakhand 2.6 11.5 2.6 11.5 2.6 15.4
West Bengal 20.0 10.5 20.4 10.8 20.3 11.3
Andaman & Nicobar 0.4 25.0 0.4 25.0 0.4 25.0
Chandigrah 0.9 22.2 0.9 22.2 0.9 22.2
Daman & Diu 0.1 9.0 0.1 9.0 0.2 8.9
Delhi 8.4 15.5 8.3 15.7 8.3 15.7
Pondicherry 0.6 16.7 0.6 16.7 0.1 16.7
India 264.4 18.6 264.6 19.0 269.9 19.0
2005 2006
Source : Selected Socio Economic Statistics, M/O Statistics and Programme Implementation, CSO, Govt. of India
Table No 5.6 Employment in organised sector by State/Union Territories
2004
103

104
CRIME
� Crimes committed against women are prevalent in every region
and society in one form or the other irrespective of the social or
economic status of the women. As per the data of 2009 of
National Crime Record Bureau, Ministry of Home Affairs, among
the crime committed against women in Delhi kidnapping
abduction shares the highest percentage 39.00% followed by
torture(30.10%).28% cases are of sexual harassment and 13%
cases are that of molestation, 11% cases are of rape and 3.3%
cases are of dowry death. There were only 0.64% cases of
Immoral Traffic and 0.14% cases of dowry prohibition.
� During 2009 in Delhi there were 47 victims of rape who are less
than 10 years, 72 in the age group of 10-14 years, 188 in the
age group of 14-18 years, 141 in the age group of 18-30 years,
20 in the age group of 30-50 years and 1 in the age group
greater than 50 years.
� Suicide death of women during 2008 was 39% as compared to
61% of men. There were 18 suicide death of female in the age
group of 0-14 years, 347 suicide deaths in the age group of 15-
29 years, 115 in the age group of 30-44 years, 25 in the age
group of 45-59 years and only 3 female suicide deaths in the age
group of 60 years and above.

2003 2004 2005 2006 2007 2008 2009
1 Rape (Sec 376 IPC) 3.09 3.02 3.58 3.22 2.88 2.17 2.2
2Kidnapping and Abduction
(Sec. 363 toSec.373 IPC)5.99 5.66 7.02 6.12 5.72 4.95 6.4
3 Dowry Death (Sec. 302/304B IPC) 2.09 1.79 1.68 1.80 1.71 1.58 1.7
4 Torture (Sec. 498A IPC) 2.39 2.16 2.27 2.74 2.35 1.71 1.4
5 Molestation (Sec. 354 IPC) 1.48 1.74 2.23 1.96 2.24 1.51 1.4
6 Sexual Harassment (Sec. 509 IPC) 0.85 1.30 2.25 1.44 1.53 1.06 1.07
7 Importation of Girls (Sec. 366B IPC) 0.00 0.00 0.67 0.00 0.00 0.00 0
8 Sati Prevention Act, 1987 0.00 0.00 0.00 0.00 0.00 0.00 0
9Immoral Traffic(Prevention)
Act, 19560.83 2.14 2.56 2.47 1.77 2.26 1.09
10Indescent Representation of
Women(Prohibition) Act, 19860.00 0.00 0.03 0.06 0.00 0.00 0
11 Dowry Prohibition Act,1961 0.52 0.31 0.28 0.33 0.28 0.34 0.106
2.33 2.38 2.80 2.76 2.59 2.01 2.08
1 Rape (Sec 376 IPC) 14.93 14.99 15.12 13.71 12.45 11.83 11.00
2Kidnapping and Abduction
(Sec. 363 toSec.373 IPC)24.28 23.96 25.42 23.46 24.29 28.85 39.00
3 Dowry Death (Sec. 302/304B IPC) 3.96 3.43 2.62 3.01 2.87 3.28 3.30
4 Torture (Sec. 498A IPC) 36.90 34.10 30.43 38.03 37.20 35.22 30.10
5 Molestation (Sec. 354 IPC) 14.90 16.34 17.51 15.80 18.07 15.52 13.00
6 Sexual Harassment (Sec. 509 IPC) 3.20 3.54 5.17 3.17 3.48 3.30 28.00
7 Importation of Girls (Sec. 366B IPC) 0.00 0.00 0.02 0.00 0.00 0.00 0.00
8 Sati Prevention Act, 1987 0.00 0.00 0.00 0.00 0.00 0.00 0.00
9Immoral Traffic(Prevention)
Act, 19561.40 3.35 3.47 2.46 1.31 1.52 0.64
10Indescent Representation of
Women(Prohibition) Act, 19860.00 0.00 0.02 0.02 0.00 0.00 0.00
11 Dowry Prohibition Act,1961 0.43 0.30 0.21 0.33 0.33 0.48 0.14
100.00 100.00 100.00 100.00 100.00 100.00 100.00
Source : Crime India (NCRB)
105
Head wise % Share of Crime Against Women in Delhi
Total
Table No. 6.1 Head-wise % share of Crime Against Women in Delhi against All India and within Delhi during
2003-2009
Sl.No. Head of CrimeYear
Head wise % Share of Crime Against Women in Delhi against All India
Total

2003 2004 2005 2006 2007 2008 2009 2003 2004 2005 2006 2007 2008 2009
1 Rape (Sec 376 IPC) 15847 18233 18359 19348 20737 21467 21397 -0.3 490 551 658 623 598 466 469 0.6
2Kidnapping and Abduction
(Sec. 363 toSec.373 IPC)13296 15578 15750 17414 20416 22939 25741 12.2 797 881 1106 1066 1167 1136 1655 45.6
3 Dowry Death (Sec. 302/304B IPC) 6208 7026 6787 7618 8093 8172 8383 2.6 130 126 114 137 138 129 141 9.3
4 Torture (Sec. 498A IPC) 50703 58121 58319 63128 75930 81344 89546 10.1 1211 1254 1324 1728 1787 1387 1283 -7.4
5 Molestation (Sec. 354 IPC) 32939 34567 34175 36617 38734 40413 38711 -4.2 489 601 762 718 868 611 552 -9.6
6 Sexual Harassment (Sec. 509 IPC) 12325 10001 9984 9966 10950 12214 11009 -9.9 105 130 225 144 167 130 118 -9.2
7 Importation of Girls (Sec. 366B IPC) 46 89 149 67 61 67 48 -28.3 0 0 1 0 0 0 0 0.0
8 Sati Prevention Act, 1987 0 0 1 0 0 1 0 -100.0 0 0 0 0 0 0 0 0.0
9Immoral Traffic(Prevention)
Act, 19565510 5748 5908 4541 3568 2659 2474 -6.9 46 123 151 112 63 60 27 -55.0
10Indescent Representation of
Women(Prohibition) Act, 19861043 1378 2917 1562 1200 1025 845 -17.6 0 0 1 1 0 0 0 0.0
11 Dowry Prohibition Act,1961 2684 3592 3204 4504 5623 5555 5650 1.7 14 11 9 15 16 19 6 -68.4
%
Variation
in 2008
over 2009
Delhi
YearYear
%
Variatio
n
in 2009
over
2008
Table No. 6.2 Head-wise Incidents of Crime Against Women in India & Delhi during 2003-2009 and Percentage Variation in 2009 over 2008
Crime HeadSl. No.
All India
106
11 Dowry Prohibition Act,1961 2684 3592 3204 4504 5623 5555 5650 1.7 14 11 9 15 16 19 6 -68.4
140601 154333 155553 164765 185312 195856 203804 4.1 3282 3677 4351 4544 4804 3938 4251 7.9Source: Crime India(N.C.R.B)
Total
0
10000
20000
30000
40000
50000
60000
70000
80000
90000
100000
2003 2004 2005 2006 2007 2008 2009
Incidents of crime aganist Women in All India under
IPC Rape (Sec 376 IPC)
Kidnapping and Abduction
(Sec. 363 toSec.373 IPC)
Dowry Death (Sec. 302/304B
IPC)
Torture (Sec. 498A IPC)
Molestation (Sec. 354 IPC)
Sexual Harassment (Sec. 509
IPC)
Importation of Girls (Sec.
366B IPC) 0
200
400
600
800
1000
1200
1400
1600
1800
2000
2003 2004 2005 2006 2007 2008 2009
Incidents of crime aganist Women in All Delhi under
IPC Rape (Sec 376 IPC)
Kidnapping and
Abduction
(Sec. 363 toSec.373 IPC)
Dowry Death (Sec.
302/304B IPC)
Torture (Sec. 498A IPC)
Molestation (Sec. 354
IPC)
106

Sl.No. Year Total IPC CrimesCrime Against
Women (IPC Cases)
Percentage to total
IPC crimes
1 2003 1716120 131364 7.6
2 2004 1832015 143615 7.8
3 2005 1822602 143523 7.9
4 2006 1878293 154158 8.2
5 2007 1989673 174921 8.8
6 2008 2093379 186616 8.91
Table No. 6.3 Proportion of Crime against Women (IPC) towards total IPC crimes in India
7 2009 2121345 203804 9.61
Source: Crime India (N.C.R.B)
131364
143615
143523
154158
174921
186616
203804
10000
60000
110000
160000
210000
260000
2003 2004 2005 2006 2007 2008 2009
Crime Against Women (Number of IPC Cases)
107

Sl.No. State/UT
No. of
Cases
Reported
Upto 10
Years
10-14
Years
14-18
Years
18-30
Years
30-50
Years
Above
50 Years
Total
Victims
1 2 3 4 5 6 7 8 9 10
1 ANDHRA PRADESH 2 0 0 2 0 0 0 2
2 ARUNACHAL PRADESH 0 0 0 0 0 0 0 0
3 ASSAM 9 0 0 0 7 2 0 9
4 BIHAR 1 0 0 0 1 0 0 1
5 CHHATTISGARH 107 1 27 27 30 20 2 107
6 GOA 1 0 0 1 0 0 0 1
7 GUJRAT 18 1 2 3 10 2 0 18
8 HARYANA 12 2 2 0 7 1 0 12
9 HIMACHAL PRADESH 10 1 2 5 1 1 0 10
10 JAMMU & KASHMIR 4 0 1 0 2 1 0 4
11 JHARKHAND 22 0 0 0 16 6 0 22
12 KARNATAKA 18 0 0 0 17 1 0 18
13 KERALA 18 3 3 7 4 1 0 18
14 MADHYA PRADESH 14 1 1 9 2 1 0 14
15 MAHARASHTRA 76 5 3 19 47 3 0 77
16 MANIPUR 0 0 0 0 0 0 0 0
17 MEGHALAYA 5 1 2 1 1 0 0 5
18 MIZORAM 3 2 1 0 0 0 0 3
19 NAGALAND 0 0 0 0 0 0 0 0
20 ORISSA 6 0 1 0 5 0 0 6
21 PUNJAB 8 0 2 3 3 0 0 8
22 RAJASTHAN 36 2 3 7 20 4 0 36
23 SIKKIM 0 0 0 0 0 0 0 0
24 TAMIL NADU 4 1 0 3 0 0 0 4
25 TRIPURA 0 0 0 0 0 0 0 0
26 UTTAR PRADESH 2 1 0 1 0 0 0 2
27 UTTARAKHAND 6 0 3 1 2 0 0 6
28 WEST BENGAL 3 0 0 1 1 1 0 3
385 21 53 90 176 44 2 386
29 A & N ISLAND 0 0 0 0 0 0 0 0
30 CHANDIGARH 0 0 0 0 0 0 0 0
31 D & N HAVELI 0 0 0 0 0 0 0 0
32 DAMAN & DIU 0 0 0 0 0 0 0 0
33 DELHI 19 3 3 5 6 2 0 19
34 LAKSHADEEP 0 0 0 0 0 0 0 0
35 PUDUCHERRY 0 0 0 0 0 0 0 0
19 3 3 5 6 2 0 19
404 24 56 95 182 46 2 405
Source : Crime India (NCRB) Contd.
Table No. 6.4 Age-Group-wise victims of incest ( Rape ) Cases During 2009
STATES
UNION TERRITORIES
TOTAL (STATE)
TOTAL (Uts)
TOTAL ( ALL-INDIA )
108

Sl.No. State/UT
No. of
Cases
Reported
Upto 10
Years
10-14
Years
14-18
Years
18-30
Years
30-50
Years
Above
50 Years
Total
Victims
1 2 11 12 13 14 15 16 17 18
1 ANDHRA PRADESH 1186 41 167 206 642 116 14 1186
2 ARUNACHAL PRADESH 59 4 12 0 42 1 0 59
3 ASSAM 1622 1 6 3 1223 375 14 1622
4 BIHAR 928 12 19 32 764 101 0 928
5 CHHATTISGARH 869 79 200 60 430 93 7 869
6 GOA 46 1 11 20 15 2 0 49
7 GUJRAT 415 14 25 47 298 30 1 415
8 HARYANA 591 17 25 70 423 53 3 591
9 HIMACHAL PRADESH 173 11 14 50 83 15 0 173
10 JAMMU & KASHMIR 233 0 0 3 175 51 2 231
11 JHARKHAND 697 4 0 5 478 210 0 697
12 KARNATAKA 491 39 49 18 344 37 4 491
13 KERALA 550 30 42 150 249 69 10 550
14 MADHYA PRADESH 2984 75 290 695 1403 510 11 2984
15 MAHARASHTRA 1407 126 118 344 666 154 8 1416
16 MANIPUR 31 5 5 2 9 9 1 31
17 MEGHALAYA 107 18 21 18 40 7 3 107
18 MIZORAM 80 3 2 3 42 30 0 80
19 NAGALAND 22 0 0 0 17 5 0 22
20 ORISSA 1017 6 23 57 742 182 7 1017
21 PUNJAB 503 34 46 128 255 43 1 507
22 RAJASTHAN 1483 26 52 281 836 285 4 1484
23 SIKKIM 18 4 5 5 2 2 0 18
24 TAMIL NADU 592 27 34 117 390 22 2 592
25 TRIPURA 190 10 22 51 79 28 0 190
26 UTTAR PRADESH 1757 42 416 165 911 223 0 1757
27 UTTARAKHAND 105 1 0 2 87 15 0 105
28 WEST BENGAL 2333 6 18 84 1834 391 0 2333
20489 636 1622 2616 12479 3059 92 20504
29 A & N ISLAND 18 2 3 7 5 1 0 18
30 CHANDIGARH 29 3 8 10 8 0 0 29
31 D & N HAVELI 4 0 2 0 2 0 0 4
32 DAMAN & DIU 1 1 0 0 0 0 0 1
33 DELHI 450 44 69 183 135 18 1 450
34 LAKSHADEEP 1 0 0 0 1 0 0 1
35 PUDUCHERRY 1 0 0 1 0 0 0 1
504 50 82 201 151 19 1 504
20993 686 1704 2817 12630 3078 93 21008
Source : Crime India (NCRB) Contd.
Table 6.4: Age-Group-wise victims of other ( Rape ) Cases During 2009
STATES
TOTAL (STATE)
TOTAL (Uts)
TOTAL ( ALL-INDIA )
109

Sl.No. State/UT
No. of
Cases
Reported
Upto 10
Years
10-14
Years
14-18
Years
18-30
Years
30-50
Years
Above
50 Years
Total
Victims
1 2 19 20 21 22 23 24 25 26
1 ANDHRA PRADESH 1188 41 167 208 642 116 14 1188
2 ARUNACHAL PRADESH 59 4 12 0 42 1 0 59
3 ASSAM 1631 1 6 3 1230 377 14 1631
4 BIHAR 929 12 19 32 765 101 0 929
5 CHHATTISGARH 976 80 227 87 460 113 9 976
6 GOA 47 1 11 21 15 2 0 50
7 GUJRAT 433 15 27 50 308 32 1 433
8 HARYANA 603 19 27 70 430 54 3 603
9 HIMACHAL PRADESH 183 12 16 55 84 16 0 183
10 JAMMU & KASHMIR 237 0 1 3 177 52 2 235
11 JHARKHAND 719 4 0 5 494 216 0 719
12 KARNATAKA 509 39 49 18 361 38 4 509
13 KERALA 568 33 45 157 253 70 10 568
14 MADHYA PRADESH 2998 76 291 704 1405 511 11 2998
15 MAHARASHTRA 1483 131 121 363 713 157 8 1493
16 MANIPUR 31 5 5 2 9 9 1 31
17 MEGHALAYA 112 19 23 19 41 7 3 112
18 MIZORAM 83 5 3 3 42 30 0 83
19 NAGALAND 22 0 0 0 17 5 0 22
20 ORISSA 1023 6 24 57 747 182 7 1023
21 PUNJAB 511 34 48 131 258 43 1 515
22 RAJASTHAN 1519 28 55 288 856 289 4 1520
23 SIKKIM 18 4 5 5 2 2 0 18
24 TAMIL NADU 596 28 34 120 390 22 2 596
25 TRIPURA 190 10 22 51 79 28 0 190
26 UTTAR PRADESH 1759 43 416 166 911 223 0 1759
27 UTTARAKHAND 111 1 3 3 89 15 0 111
28 WEST BENGAL 2336 6 18 85 1835 392 0 2336
20874 657 1675 2706 12655 3103 94 20890
UNION TERRITORIES :
29 A & N ISLAND 18 2 3 7 5 1 0 18
30 CHANDIGARH 29 3 8 10 8 0 0 29
31 D & N HAVELI 4 0 2 0 2 0 0 4
32 DAMAN & DIU 1 1 0 0 0 0 0 1
33 DELHI 469 47 72 188 141 20 1 469
34 LAKSHADEEP 1 0 0 0 1 0 0 1
35 PUDUCHERRY 1 0 0 1 0 0 0 1
523 53 85 206 157 21 1 523
21397 710 1760 2912 12812 3124 95 21413
Table 6.4: Age-Group-wise victims of Rape Cases ( Total) (Sec. 376 IPC) During 2009
STATES
In Meghalaya,there ara 13 victims (upto 18 years of age) in one rape case (No. 508(8)2007 u/s 376 IPC regd. By
Source:National Crime Report Bureau
TOTAL (STATE)
TOTAL (Uts)
TOTAL ( ALL-INDIA )
110

I R P I R P I R P I R P
1 2 3 4 5 6 7 8 9 10 11 12 13 14
1 Andhra Pradesh 832.99 1188 1.4 5.6 1526 1.8 5.9 546 0.7 6.5 11297 13.6 12.6
2 Arunachal Pradesh 12.2 59 4.8 0.3 28 2.3 0.1 0 0.0 0.0 13 1.1 0.0
3 Assam 305.28 1631 5.3 7.6 2092 6.9 8.1 170 0.6 2.0 4398 14.4 4.9
4 Bihar 957.5 929 1.0 4.3 1986 2.1 7.7 1295 1.4 15.4 2532 2.6 2.8
5 Chhattisgarh 241.6 976 4.0 4.6 229 0.9 0.9 128 0.5 1.5 893 3.7 1.0
6 Goa 16.91 47 2.8 0.2 22 1.3 0.1 3 0.2 0.0 21 1.2 0.0
7 Gujarat 574.37 433 0.8 2.0 1162 2.0 4.5 24 0.0 0.3 5506 9.6 6.1
8 Haryana 242.43 603 2.5 2.8 659 2.7 2.6 281 1.2 3.4 2617 10.8 2.9
9 Himachal Pradesh 66.29 183 2.8 0.9 122 1.8 0.5 1 0.0 0.0 284 4.3 0.3
10 Jammu & Kashmir 129.09 237 1.8 1.1 825 6.4 3.2 12 0.1 0.1 196 1.5 0.2
11 Jharkhand 305.44 719 2.4 3.4 517 1.7 2.0 295 1.0 3.5 710 2.3 0.8
12 Karnataka 582.04 509 0.9 2.4 408 0.7 1.6 264 0.5 3.1 3185 5.5 3.6
13 Kerala 346.62 568 1.6 2.7 173 0.5 0.7 20 0.1 0.2 4007 11.6 4.5
14 Madhya Pradesh 708.98 2998 4.2 14.0 841 1.2 3.3 858 1.2 10.2 3983 5.6 4.4
15 Maharashtra 1087.01 1483 1.4 6.9 926 0.9 3.6 341 0.3 4.1 7681 7.1 8.6
16 Manipur 26.71 31 1.2 0.1 97 3.6 0.4 0 0.0 0.0 25 0.9 0.0
17 Meghalaya 25.77 112 4.3 0.5 26 1.0 0.1 0 0.0 0.0 24 0.9 0.0
18 Mi zoram 9.96 83 8.3 0.4 0 0.0 0.0 0 0.0 0.0 4 0.4 0.0
19 Nagaland 22.23 22 1.0 0.1 10 0.4 0.0 0 0.0 0.0 0 0.0 0.0
20 Orissa 404.33 1023 2.5 4.8 799 2.0 3.1 384 0.9 4.6 2047 5.1 2.3
21 Punjab 269.81 511 1.9 2.4 513 1.9 2.0 126 0.5 1.5 1061 3.9 1.2
22 Rajasthan 660.56 1519 2.3 7.1 2310 3.5 9.0 436 0.7 5.2 10371 15.7 11.6
23 Sikkim 6.04 18 3.0 0.1 6 1.0 0.0 0 0.0 0.0 6 1.0 0.0
24 Tamil Nadu 671.06 596 0.9 2.8 1133 1.7 4.4 194 0.3 2.3 1460 2.2 1.6
25 Tripura 35.67 190 5.3 0.9 92 2.6 0.4 29 0.8 0.3 815 22.8 0.9
26 Uttar Pradesh 1955.22 1759 0.9 8.2 5078 2.6 19.7 2232 1.1 26.6 8566 4.4 9.6
27 Uttarakhand 96.81 111 1.1 0.5 247 2.6 1.0 94 1.0 1.1 361 3.7 0.4
28 West Bengal 892.13 2336 2.6 10.9 2187 2.5 8.5 506 0.6 6.0 16112 18.1 18.0
Total(States) Union 11327.87 20953 1.8 97.9 21726 1.9 94.7 8036 0.7 98.3 79860 7.0 98.2
29 A & N Islands 4.23 18 4.3 0.1 14 3.3 0.1 1 0.2 0.0 21 5.0 0.0
30 Chandigarh 10.97 29 2.6 0.1 36 3.3 0.1 2 0.2 0.0 51 4.6 0.1
31Dadra & Nagar
Haveli2.75 4 1.5 0.0 9 3.3 0.0 0 0.0 0.0 3 1.1 0.0
32 Daman & Diu 1.94 1 0.5 0.0 0 0.0 0.0 0 0.0 0.0 3 1.5 0.0
33 Delhi 177.82 469 2.6 2.2 1655 9.3 6.4 141 0.8 1.7 1283 7.2 1.4
34 Lakashadweep 0.71 1 1.4 0.0 0 0.0 0.0 0 0.0 0.0 0 0.0 0.0
35 Pondicherry 10.97 1 0.1 0.0 13 1.2 0.1 0 0.0 0.0 10 0.9 0.0
Total(Uts) Total 209.39 523 2.5 2.4 1727 8.2 6.7 144 0.7 1.7 1371 6.5 1.5
11694.44 21397 1.8 100.0 25741 2.2 100.0 8383 0.7 100.0 89546 7.7 100.0
Source: National Crime Report Bureau I=Incidence R=Rate of Crime P=Percentage Share
Contd…
Source: National Crime Report Bureau I=Incidence R=Rate of Crime P=Percentage Share
Rape (sec.376 IPC)
States:
Territories:
(All-India)
Kidnapping&
Abduction
(Sec.363-369,371-
373IPC)
Cruelty By Husband
And Relatives
(Sec.498A IPC)
Dowry Death
(Sec.304B IPC)
Table No. 6.5 Incidence of crimes committed against women during-2009
Estimated
Mid-year
Population (In
Lakhss)
Sl. No. State/UT
111

1 2
1 Andhra Pradesh
2 Arunachal Pradesh
3 Assam
4 Bihar
5 Chhattisgarh
6 Goa
7 Gujarat
8 Haryana
9 Himachal Pradesh
10 Jammu & Kashmir
11 Jharkhand
12 Karnataka
13 Kerala
14 Madhya Pradesh
15 Maharashtra
16 Manipur
17 Meghalaya
18 Mi zoram
19 Nagaland
20 Orissa
21 Punjab
22 Rajasthan
23 Sikkim
24 Tamil Nadu
25 Tripura
26 Uttar Pradesh
27 Uttarakhand
28 West Bengal
Total(States) Union
29 A & N Islands
30 Chandigarh
31Dadra & Nagar
Haveli
32 Daman & Diu
33 Delhi
34 Lakashadweep
35 Pondicherry
Total(Uts) Total
Source: National Crime Report Bureau I=Incidence R=Rate of Crime P=Percentage Share
States:
Territories:
(All-India)
Table No. 6.5 Incidence of crimes committed against women during-2009
Sl. No. State/UT
I R P I R P I R P I R P
15 16 17 18 19 20 21 22 23 24 25 26
5147 6.2 13.3 3520 4.2 32.0 0 0.0 0.0 0 0.0 0.0
58 4.8 0.1 6 0.5 0.1 0 0.0 0.0 0 0.0 0.0
1342 4.4 3.5 10 0.0 0.1 1 0.0 2.1 0 0.0 0.0
726 0.8 1.9 12 0.0 0.1 31 0.0 64.6 0 0.0 0.0
1598 6.6 4.1 152 0.6 1.4 0 0.0 0.0 0 0.0 0.0
37 2.2 0.1 10 0.6 0.1 0 0.0 0.0 0 0.0 0.0
727 1.3 1.9 114 0.2 1.0 0 0.0 0.0 0 0.0 0.0
451 1.9 1.2 605 2.5 5.5 0 0.0 0.0 0 0.0 0.0
318 4.8 0.8 37 0.6 0.3 0 0.0 0.0 0 0.0 0.0
972 7.5 2.5 371 2.9 3.4 0 0.0 0.0 0 0.0 0.0
276 0.9 0.7 83 0.3 0.8 6 0.0 12.5 0 0.0 0.0
2186 3.8 5.6 64 0.1 0.6 2 0.0 4.2 0 0.0 0.0
2540 7.3 6.6 395 1.1 3.6 0 0.0 0.0 0 0.0 0.0
6307 8.9 16.3 728 1.0 6.6 1 0.0 2.1 0 0.0 0.0
3196 2.9 8.3 1099 1.0 10.0 0 0.0 0.0 0 0.0 0.0
39 1.5 0.1 2 0.1 0.0 0 0.0 0.0 0 0.0 0.0
72 2.8 0.2 1 0.0 0.0 1 0.0 2.1 0 0.0 0.0
61 6.1 0.2 1 0.1 0.0 0 0.0 0.0 0 0.0 0.0
11 0.5 0.0 0 0.0 0.0 0 0.0 0.0 0 0.0 0.0
2697 6.7 7.0 210 0.5 1.9 1 0.0 2.1 0 0.0 0.0
319 1.2 0.8 33 0.1 0.3 0 0.0 0.0 0 0.0 0.0
2485 3.8 6.4 24 0.0 0.2 0 0.0 0.0 0 0.0 0.0
10 1.7 0.0 0 0.0 0.0 0 0.0 0.0 0 0.0 0.0
1242 1.9 3.2 501 0.7 4.6 0 0.0 0.0 0 0.0 0.0
384 10.8 1.0 5 0.1 0.0 0 0.0 0.0 0 0.0 0.0
2782 1.4 7.2 2524 1.3 22.9 0 0.0 0.0 0 0.0 0.0
119 1.2 0.3 249 2.6 2.3 0 0.0 0.0 0 0.0 0.0
1942 2.2 5.0 108 0.1 1.0 5 0.0 10.4 0 0.0 0.0
38044 3.4 98.3 10864 1.0 98.7 48 0.0 100.0 0 0.0 0.0
30 7.1 0.1 7 1.7 0.1 0 0.0 0.0 0 0.0 0.0
26 2.4 0.1 2 0.2 0.0 0 0.0 0.0 0 0.0 0.0
2 0.7 0.0 1 0.4 0.0 0 0.0 0.0 0 0.0 0.0
4 2.1 0.0 1 0.5 0.0 0 0.0 0.0 0 0.0 0.0
552 3.1 1.4 118 0.7 1.1 0 0.0 0.0 0 0.0 0.0
0 0.0 0.0 0 0.0 0.0 0 0.0 0.0 0 0.0 0.0
53 4.8 0.1 16 1.5 0.1 0 0.0 0.0 0 0.0 0.0
667 3.2 1.7 145 0.7 1.3 0 0.0 0.0 0 0.0 0.0
38711 3.3 100.0 11009 0.9 100.0 48 0.0 100.0 0 0.0 0.0
Contd… Contd…
Source: National Crime Report Bureau I=Incidence R=Rate of Crime P=Percentage Share
Sexual Harassment
(Eve-Teasing)
(Sec.509 IPC)
Importation of Girls
(Sec.366B IPC)
Molesstation
(Sec.354 IPC)
Sati Prevention
Act. 1987
Table No. 6.5 Incidence of crimes committed against women during-2009
112

1 2
1 Andhra Pradesh
2 Arunachal Pradesh
3 Assam
4 Bihar
5 Chhattisgarh
6 Goa
7 Gujarat
8 Haryana
9 Himachal Pradesh
10 Jammu & Kashmir
11 Jharkhand
12 Karnataka
13 Kerala
14 Madhya Pradesh
15 Maharashtra
16 Manipur
17 Meghalaya
18 Mi zoram
19 Nagaland
20 Orissa
21 Punjab
22 Rajasthan
23 Sikkim
24 Tamil Nadu
25 Tripura
26 Uttar Pradesh
27 Uttarakhand
28 West Bengal
Total(States) Union
29 A & N Islands
30 Chandigarh
31Dadra & Nagar
Haveli
32 Daman & Diu
33 Delhi
34 Lakashadweep
35 Pondicherry
Total(Uts) Total
Source: National Crime Report Bureau I=Incidence R=Rate of Crime P=Percentage Share
States:
Territories:
(All-India)
Table No. 6.5 Incidence of crimes committed against women during-2009
Sl. No. State/UT
I R P I R P I R P I R P
27 28 29 30 31 32 33 34 35 36 37 38
279 0.3 11.3 704 0.8 83.3 1362 1.6 24.1 25569 30.7 12.5
0 0.0 0.0 0 0.0 0.0 0 0.0 0.0 164 13.4 0.1
37 0.1 1.5 0 0.0 0.0 40 0.1 0.7 9721 31.8 4.8
40 0.0 1.6 0 0.0 0.0 1252 1.3 22.2 8803 9.2 4.3
9 0.0 0.4 1 0.0 0.1 16 0.1 0.3 4002 16.6 2.0
23 1.4 0.9 1 0.1 0.1 0 0.0 0.0 164 9.7 0.1
41 0.1 1.7 0 0.0 0.0 2 0.0 0.0 8009 13.9 3.9
90 0.4 3.6 0 0.0 0.0 6 0.0 0.1 5312 21.9 2.6
5 0.1 0.2 0 0.0 0.0 4 0.1 0.1 954 14.4 0.5
6 0.0 0.2 2 0.0 0.2 3 0.0 0.1 2624 20.3 1.3
1 0.0 0.0 0 0.0 0.0 414 1.4 7.3 3021 9.9 1.5
329 0.6 13.3 1 0.0 0.1 904 1.6 16.0 7852 13.5 3.9
314 0.9 12.7 24 0.1 2.8 8 0.0 0.1 8049 23.2 3.9
19 0.0 0.8 1 0.0 0.1 91 0.1 1.6 15827 22.3 7.8
271 0.2 11.0 1 0.0 0.1 50 0.0 0.9 15048 13.8 7.4
0 0.0 0.0 0 0.0 0.0 0 0.0 0.0 194 7.3 0.1
1 0.0 0.0 0 0.0 0.0 0 0.0 0.0 237 9.2 0.1
1 0.1 0.0 0 0.0 0.0 0 0.0 0.0 150 15.1 0.1
3 0.1 0.1 0 0.0 0.0 0 0.0 0.0 46 2.1 0.0
14 0.0 0.6 0 0.0 0.0 945 2.3 16.7 8120 20.1 4.0
59 0.2 2.4 0 0.0 0.0 9 0.0 0.2 2631 9.8 1.3
62 0.1 2.5 106 0.2 12.5 3 0.0 0.1 17316 26.2 8.5
1 0.2 0.0 0 0.0 0.0 0 0.0 0.0 41 6.8 0.0
716 1.1 28.9 2 0.0 0.2 207 0.3 3.7 6051 9.0 3.0
0 0.0 0.0 0 0.0 0.0 2 0.1 0.0 1517 42.5 0.7
39 0.0 1.6 0 0.0 0.0 274 0.1 4.8 23254 11.9 11.4
6 0.1 0.2 0 0.0 0.0 1 0.0 0.0 1188 12.3 0.6
63 0.1 2.5 2 0.0 0.2 46 0.1 0.8 23307 26.1 11.4
2429 0.2 98.2 845 0.1 100.0 5639 0.5 99.8 199171 17.6 97.7
1 0.2 0.0 0 0.0 0.0 0 0.0 0.0 92 21.7 0.0
4 0.4 0.2 0 0.0 0.0 0 0.0 0.0 150 13.7 0.1
0 0.0 0.0 0 0.0 0.0 1 0.4 0.0 20 7.3 0.0
4 2.1 0.2 0 0.0 0.0 0 0.0 0.0 13 6.7 0.0
27 0.2 1.1 0 0.0 0.0 6 0.0 0.1 4251 23.9 2.1
0 0.0 0.0 0 0.0 0.0 0 0.0 0.0 1 1.4 0.0
9 0.8 0.4 0 0.0 0.0 4 0.4 0.1 106 9.7 0.1
45 0.2 1.8 0 0.2 0.0 11 0.1 0.2 4633 22.1 2.3
2474 0.2 100.0 845 0.1 100.0 5650 0.5 100.0 203804 17.4 100.0
Total
Table No. 6.5 Incidence of crimes committed against women during-2009
Source: National Crime Report Bureau I=Incidence R=Rate of Crime P=Percentage Share
Immoral Trafic(P)
Act. 1956
Indecent Representation
of Women (P) Act. 1986
Dowry Prohibition
Act. 1961
113

Male Female Male Female Male Female Male Female Male Female Male Female
Andhra Pradesh 91 122 2714 1882 3669 1584 2477 738 770 307 9721 4633 14354 67.7 32.3Arunachal Pradesh 2 0 43 19 25 13 7 1 0 0 77 33 110 70.0 30.0Assam 28 17 716 503 772 360 398 120 56 19 1970 1019 2989 65.9 34.1Bihar 35 33 218 165 202 145 97 40 57 23 609 406 1015 60.0 40.0Chhattisgarh 65 82 1125 854 1156 478 685 218 217 65 3248 1697 4945 65.7 34.3Goa 0 3 55 54 84 26 29 10 15 11 183 104 287 63.8 36.2Gujarat 25 39 1250 1090 1422 786 787 347 251 168 3735 2430 6165 60.6 39.4Haryana 47 39 687 274 774 255 322 85 144 29 1974 682 2656 74.3 25.7Himachal Pradesh 6 10 140 103 115 57 116 25 40 18 417 213 630 66.2 33.8Jammu & Kashmir 1 1 56 80 63 51 41 1 16 0 177 133 310 57.1 42.9Jharkhand 20 31 171 113 238 108 134 50 39 7 602 309 911 66.1 33.9Karnataka 54 80 2198 1657 2870 1261 2303 690 791 318 8216 4006 12222 67.2 32.8Kerala 26 42 1016 666 2048 692 2001 637 1039 402 6130 2439 8569 71.5 28.5Madhya Pradesh 75 80 1592 1833 1501 945 815 305 382 101 4365 3264 7629 57.2 42.8Maharashtra 47 74 3036 2412 3725 1251 2247 458 834 290 9889 4485 14374 68.8 31.2Manipur 0 1 11 7 12 2 0 1 0 0 23 11 34 67.6 32.4Meghalaya 0 1 19 11 27 12 10 2 1 2 57 28 85 67.1 32.9Mi zoram 0 0 12 2 16 3 7 1 0 0 35 6 41 85.4 14.6Nagaland 0 0 2 8 20 2 10 0 0 0 32 10 42 76.2 23.8Orissa 114 55 1044 720 1021 596 713 259 263 119 3155 1749 4904 64.3 35.7Punjab 8 10 204 106 249 83 130 18 52 9 643 226 869 74.0 26.0Rajasthan 118 68 1162 658 1415 549 748 230 159 59 3602 1564 5166 69.7 30.3Sikkim 2 0 70 26 69 26 65 13 10 6 216 71 287 75.3 24.7Tamil Nadu 30 83 2563 2215 3265 1781 2314 964 871 339 9043 5382 14425 62.7 37.3Tripura 9 14 152 143 167 96 89 51 25 6 442 310 752 58.8 41.2Uttar Pradesh 60 69 768 1083 758 519 419 151 174 87 2179 1909 4088 53.3 46.7Uttrakhand 8 3 37 61 35 15 20 8 4 0 104 87 191 54.5 45.5West Bengal 275 241 2806 3004 3327 2160 1593 902 368 176 8369 6483 14852 56.3 43.7Total (States) 1146 1198 23867 19749 29045 13856 18577 6325 6578 2561 79213 43689 122902 64.5 35.5Union Territories: 0.0A & N Islands 0 0 31 23 32 13 21 5 14 4 98 45 143 68.5 31.5Chandigarh 0 0 22 16 19 7 16 2 1 0 58 25 83 69.9 30.1
Dadra & Nagar 1 0 11 15 11 6 8 6 1 1 32 28 60 53.3 46.7Daman & Diu 0 0 4 1 4 0 6 1 0 3 14 5 19 73.7 26.3Delhi 16 18 371 347 286 115 97 25 25 3 795 508 1303 61.0 39.0Lakashadweep 0 0 0 0 0 0 0 0 0 0 0 0 0 0.0 0.0Pondicherry 2 0 90 105 122 46 94 9 26 13 334 173 507 65.9 34.1Total (UTs) 19 18 529 507 474 187 242 48 67 24 1331 784 2115 62.9 37.1Total (All India) 1165 1216 24396 20256 29519 14043 18819 6373 6645 2585 80544 44473 125017 64.4 35.6Source : Crime India (NCRB)
Female
%
Table. No. 6.6 Distribution of Suicidal deaths Categorised
By Sex & Age Group-2008 (State, UTs - Wise)
30-44 Years 45-59 Years 60- Years & Above Total
States:
State/UTUpto 14 Years 15-29 Years
TotalMale
%
114

115
WOMEN EMPOWERMENT
� An important aspect in the empowerment of the women is the
extent of their involvement in the process of decision making
whether in the household or in the government.
� In the 2004 General Election, about 53.6% of women electros
and about 62.2% of male electors participated in the elections.
Even though the share of women in the total number of
contestants in the general elections has been lower than men,
the winning percentage (i.e. the number of winning contestants
out of the total contestants) has been higher for women (12.7%)
than that for men (9.8%)
� In the 2008 general election to the Legislative Assembly in NCT
of Delhi there were about 44% of women electros and nearly
56% of male electros. The percentage share of women which is
about 9% in the total number of contestants in the Assembly
election has been very low as compared to 91% of men share.
Out of the total winning contestants share of women goes to only
4% where as male winning contestants was 96%.
� As per NFHS-III (2005-06) in Delhi out of total married women
74.2% usually participate in decision making on own health
care, 67.3% in making major household purchase, 75.7%
purchasing of daily household needs and 74.9% visits to her
family and relatives. 52% of married women are involved in
decision making in all four decisions.

Male Female Male Female Male Female
1- Narela 107957 84494 192451 123 75 198 108080 84569 192649
2- Burari 108370 81742 190112 12 6 18 108382 81748 190130
3- Timarpur 83103 69545 152648 18 13 31 83121 69558 152679
4- Adarsh Nagar 78190 59230 137420 15 7 22 78205 59237 137442
5- Badli 99029 73246 172275 29 0 29 99058 73246 172304
6- Rithala 99355 83544 182899 39 6 45 99394 83550 182944
7- Bawana (SC) 134148 103602 237750 136 58 194 134284 103660 237944
8- Mundka 104074 83424 187498 99 25 124 104173 83449 187622
9- Kirari 91371 66819 158190 22 7 29 91393 66826 158219
10- Sultanpur Majra (SC) 73230 59191 132421 12 3 15 73242 59194 132436
11- Nangloi Jat 96490 75244 171734 47 17 64 96537 75261 171798
12- Mangol Puri (SC) 77771 65287 143058 40 14 54 77811 65301 143112
13- Rohini 78973 72591 151564 83 54 137 79056 72645 151701
14- Shalimar Bagh 79592 68131 147723 14 7 21 79606 68138 147744
Total Electors
Statement 7.1: General Election to the Legislative Assembly in NCT of Delhi-2008
Name of the Assembly
ConstituencyTotal Total Total
General Electors Service Electors
15- Shakur Basti 72943 65218 138161 11 9 20 72954 65227 138181
16- Tri Nagar 79847 62986 142833 21 8 29 79868 62994 142862
17- Wazirpur 89366 67093 156459 11 7 18 89377 67100 156477
18- Model Town 81550 63989 145539 9 4 13 81559 63993 145552
19- Sadar Bazar 81958 65811 147769 6 4 10 81964 65815 147779
20- Chandni Chowk 59273 48645 107918 22 13 35 59295 48658 107953
21- Matia Mahal 60667 53503 114170 7 1 8 60674 53504 114178
22- Ballimaran 77419 60759 138178 3 1 4 77422 60760 138182
23- Karol Bagh (SC) 76759 65316 142075 23 0 23 76782 65316 142098
24- Patel Nagar (SC) 86142 68161 154303 6 5 11 86148 68166 154314
25- Moti Nagar 78866 59983 138849 37 27 64 78903 60010 138913
26- Madipur (SC) 77230 65543 142773 14 0 14 77244 65543 142787
27- Rajouri Garden 70387 63053 133440 29 13 42 70416 63066 133482
28- Hari Nagar 76487 66462 142949 86 69 155 76573 66531 143104
29- Tilak Nagar 70895 65935 136830 24 16 40 70919 65951 136870
30- Janakpuri 77299 67135 144434 106 74 180 77405 67209 144614
31- Vikaspuri 137761 107840 245601 113 55 168 137874 107895 245769
Source:Deptt. of Chief Electoral Office, Govt. of Delhi Cont..........
116

Male Female Male Female Male Female
Total Electors
Statement 7.1: General Election to the Legislative Assembly in NCT of Delhi-2008
Name of the Assembly
ConstituencyTotal Total Total
General Electors Service Electors
32- Uttam Nagar 89043 73407 162450 108 32 140 89151 73439 162590
33- Dwarka 75768 57685 133453 48 14 62 75816 57699 133515
34- Matiala 121957 100950 222907 53 37 90 122010 100987 222997
35- Najafgarh 93301 79379 172680 250 92 342 93551 79471 173022
36- Bijwasan 61819 50293 112112 65 28 93 61884 50321 112205
37- Palam 86375 70488 156863 18 15 33 86393 70503 156896
38- Delhi Cantt 41896 33178 75074 119 66 185 42015 33244 75259
39- Rajinder Nagar 77434 60397 137831 17 11 28 77451 60408 137859
40- New Delhi 75085 60591 135676 8 7 15 75093 60598 135691
41- Jangpura 59156 50326 109482 27 17 44 59183 50343 109526
42- Kasturba Nagar 81260 61566 142826 85 67 152 81345 61633 142978
43- Malviya Nagar 65573 54578 120151 12 8 20 65585 54586 120171
44- R.K. Puram 70747 56257 127004 105 68 173 70852 56325 127177
45- Mehrauli 80732 63446 144178 59 26 85 80791 63472 144263
46- Chhatarpur 92052 63336 155388 69 27 96 92121 63363 155484
47- Deoli (SC) 96949 72230 169179 31 10 41 96980 72240 169220
48- Ambedkar Nagar (SC) 67493 55337 122830 25 14 39 67518 55351 122869
49- Sangam Vihar 86734 57698 144432 23 8 31 86757 57706 144463
50- Greater Kailash 79071 67173 146244 127 94 221 79198 67267 146465
51- Kalkaji 82027 61796 143823 40 23 63 82067 61819 143886
52- Tughlakabad 89067 54105 143172 20 12 32 89087 54117 143204
53- Badarpur 116514 82671 199185 17 7 24 116531 82678 199209
54- Okhla 125437 84139 209576 45 22 67 125482 84161 209643
55- Trilokpuri (SC) 75223 62393 137616 27 12 39 75250 62405 137655
56- Kondli (SC) 75839 59749 135588 11 7 18 75850 59756 135606
57- Patpar Ganj 89470 70377 159847 40 22 62 89510 70399 159909
58- Laxmi Nagar 89751 71356 161107 17 12 29 89768 71368 161136
59- Vishwas Nagar 87178 75363 162541 60 43 103 87238 75406 162644
Source:Deptt. of Chief Electoral Office, Govt. of Delhi Cont..........
117

Male Female Male Female Male Female
Total Electors
Statement 7.1: General Election to the Legislative Assembly in NCT of Delhi-2008
Name of the Assembly
ConstituencyTotal Total Total
General Electors Service Electors
60- Krishna Nagar 90975 79584 170559 19 12 31 90994 79596 170590
61- Gandhi Nagar 82387 64165 146552 17 8 25 82404 64173 146577
62- Shahdara 81800 70943 152743 32 22 54 81832 70965 152797
63- Seema Puri (SC) 77655 65479 143134 29 21 50 77684 65500 143184
64- Rohtas Nagar 86309 75024 161333 0 0 0 86309 75024 161333
65- Seelampur 81711 65761 147472 5 4 9 81716 65765 147481
66- Ghonda 89005 70169 159174 1 0 1 89006 70169 159175
67- Babarpur 83238 69020 152258 0 0 0 83238 69020 152258
68- Gokalpur (SC) 86283 68099 154382 30 26 56 86313 68125 154438
69- Mustafabad 94318 74166 168484 17 7 24 94335 74173 168508
70 Karawal Nagar 110830 81969 192799 38 14 52 110868 81983 192851
Grand Total 5963964 4758165 10722129 2931 1513 4444 5966895 4759678 10726573
Source:Deptt. of Chief Electoral Office, Govt. of Delhi
0
2000000
4000000
6000000
8000000
10000000
12000000
General Electors Service Electors Total Electors
5963964
2931
5966895
4758165
1513
4759678
10722129
4444
10726573
Nu
mb
ers
Sector
Total Numbers of Electors including Service Electors in the Legislative Assembly in NCT of Delhi-2008
Male Female Total
118

Female Male Total Female Male Total Female Male Total Female Male Total Female Male Total Female Male Total
1- Narela 1 11 12 1 8 9 0 1 1 36- Bijwasan 0 5 5 0 2 2 0 1 1
2- Burari 3 21 24 3 18 21 0 1 1 37- Palam 1 8 9 1 5 6 0 1 1
3- Timarpur 1 15 16 1 13 14 0 1 1 38- Delhi Cantt 1 15 16 1 13 14 0 1 1
4- Adarsh Nagar 0 13 13 0 11 11 0 1 1 39- Rajinder Nagar 1 11 12 0 9 9 0 1 1
5- Badli 0 14 14 0 11 11 0 1 1 40- New Delhi 10 15 25 9 14 23 1 0 1
6- Rithala 0 13 13 0 11 11 0 1 1 41- Jangpura 2 8 10 2 6 8 0 1 1
7- Bawana (SC) 1 5 6 1 3 4 0 1 1 42- Kasturba Nagar 1 8 9 1 6 7 0 1 1
8- Mundka 0 16 16 0 14 14 0 1 1 43- Malviya Nagar 1 9 10 0 8 8 1 0 1
9- Kirari 2 21 23 1 19 20 0 1 1 44- R.K. Puram 2 7 9 1 6 7 1 0 1
10- Sultanpur Majra
(SC)1 10 11
1 7 8 0 1 145- Mehrauli 2 11 13
2 8 10 0 1 1
11- Nangloi Jat 0 11 11 0 9 9 0 1 1 46- Chhatarpur 0 11 11 0 8 8 0 1 1
12- Mangol Puri (SC) 0 6 60 3 3 0 1 1
47- Deoli (SC) 1 5 61 2 3 0 1 1
13- Rohini 0 7 70 5 5 0 1 1
48- Ambedkar Nagar
(SC)0 6 6
0 3 3 0 1 1
14- Shalimar Bagh 1 9 10 1 7 8 0 1 1 49- Sangam Vihar 1 15 16 1 13 14 0 1 1
15- Shakur Basti 1 5 6 1 3 4 0 1 1 50- Greater Kailash 3 8 11 3 6 9 0 1 1
16- Tri Nagar 1 13 14 1 11 12 0 1 1 51- Kalkaji 1 6 7 1 4 5 0 1 1
17- Wazirpur 0 11 11 0 9 9 0 1 1 52- Tughlakabad 2 11 13 2 8 10 0 1 1
18- Model Town 0 11 11 0 9 9 0 1 1 53- Badarpur 0 8 8 0 6 6 0 1 1
19- Sadar Bazar 0 15 15 0 13 13 0 1 1 54- Okhla 0 19 19 0 16 16 0 1 1
20- Chandni Chowk 2 14 162 12 14 0 1 1
55- Trilokpuri (SC) 1 7 80 5 5 0 1 1
21- Matia Mahal 3 16 19 3 13 16 0 1 1 56- Kondli (SC) 1 11 12 1 8 9 0 1 1
22- Ballimaran 1 12 13 1 10 11 0 1 1 57- Patpar Ganj 0 10 10 0 8 8 0 1 1
23- Karol Bagh (SC) 1 9 10 1 7 8 0 1 1 58- Laxmi Nagar 2 8 10 2 6 8 0 1 1
24- Patel Nagar (SC) 2 9 11 1 8 9 0 1 1 59- Vishwas Nagar 0 13 13 0 11 11 0 1 1
25- Moti Nagar 2 12 14 1 11 12 0 1 1 60- Krishna Nagar 3 15 18 2 14 16 0 1 1
26- Madipur (SC) 1 5 6 1 3 4 0 1 1 61- Gandhi Nagar 0 9 9 0 7 7 0 1 1
27- Rajouri Garden 1 21 22 1 18 19 0 1 1 62- Shahdara 2 12 14 2 10 12 0 1 1
28- Hari Nagar 0 10 10 0 8 8 0 1 1 63- Seema Puri (SC) 1 11 12 1 9 10 0 1 1
29- Tilak Nagar 4 10 14 3 9 12 0 1 1 64- Rohtas Nagar 0 12 12 0 9 9 0 1 1
30- Janakpuri 0 10 10 0 8 8 0 1 1 65- Seelampur 1 14 15 1 12 13 0 1 1
31- Vikaspuri 0 20 20 0 18 18 0 1 1 66- Ghonda 0 3 3 0 0 0 0 1 1
32- Uttam Nagar 3 11 14 3 9 12 0 1 1 67- Babarpur 0 13 13 0 10 10 0 1 1
33- Dwarka 0 14 14 0 12 12 0 1 1 68- Gokalpur (SC) 0 10 10 0 7 7 0 1 1
34- Matiala 3 12 15 2 11 13 0 1 1 69- Mustafabad 1 16 17 1 14 15 0 1 1
35- Najafgarh 0 14 14 0 11 11 0 1 1 70 Karawal Nagar 5 18 23 5 16 21 0 1 1
(Sub-Total 1-35) 35 426 461 30 352 382 0 35 35 Sub-Total 36-70) 46 368 414 40 289 329 3 32 35
81 794 875 70 641 711 3 67 70
Source:Deptt. of Chief Electoral Office, Govt. of Delhi
ForfietedWinner Winner
Total
Name of the
Assembly
Constituency
Contestents Name of the
Assembly
Constituency
ContestentsForfieted
Table 7.2: General Election to the Legislative Assembly in NCT of Delhi-2008 No. of Contesting Candidates-Male/Female Break up
119

% of women
candiates
Contested Won Won
1 BJP 4 0 0%
2 BSP 2 0 0%
3 All India Minorities Front 3 0 0%
4 Samajwadi Party 3 0 0%
5 INC 8 3 38%
6 Independents & Others 61 0 0%
Total 81 3 4%
Source:Deptt. of Chief Electoral Office, Govt. of Delhi
Tabel No.: 7.3 Party-wise Performance of Women Candidates in Assembly Elections-2008
Sl.
No.Parties
Women Candidates
120

MALE FEMALE TOTAL MALE FEMALE TOTAL MALE FEMALE TOTAL
01- CHANDNI CHOWK 783434 629930 1413364 111 60 171 783545 629990 1413535
02- NORTH EAST DELHI 930985 745821 1676806 157 95 252 931142 745916 1677058
03- EAST DELHI 892621 711676 1604297 313 185 498 892934 711861 1604795
04-NEW DELHI 766657 605549 1372206 565 375 940 767222 605924 1373146
05-NORTH WEST DELHI (SC) 1002036 795207 1797243 634 304 938 1002670 795511 1798181
06- WEST DELHI 919425 767105 1686530 781 416 1197 920206 767521 1687727
07- SOUTH DELHI 890768 651073 1541841 388 183 571 891156 651256 1542412
TOTAL 6185926 4906361 11092287 2949 1618 4567 6188875 4907979 11096854
Source:Deptt. of Chief Electoral Office, Govt. of Delhi
TABLE NO. 7.4 CONSTITUENCY- WISE MALE, FEMALE AND SERVICE ELECTORS - GENERAL LOK SABHA ELECTION -
2009 IN DELHI
GENERAL ELECTORS SERVICE ELECTORS TOTAL ELECTORS NO. & NAME OF
PARLIAMENTARY
CONSTITUENCY:-
121

NO. & NAME OF PARLIAMENTARY
CONSTITUENCYMALE CONTESTANTS FEMALE CONSTESTANTS TOTAL CONTESTANTS
01- CHANDNI CHOWK 37 4 41
02- NORTH EAST DELHI 15 1 16
03- EAST DELHI 15 2 17
04-NEW DELHI 36 4 40
05-NORTH WEST DELHI (SC) 13 3 16
06- WEST DELHI 13 2 15
07- SOUTH DELHI 13 2 15
TOTAL 142 18 160
Source:Deptt. of Chief Electoral Office, Govt. of Delhi
TABLE NO. 7.5 NO. OF PERSONS CONTESTING IN GENERAL LOK SABHA ELECTION 2009 IN DELHI
122

01- CHANDNI CHOWK Sh. Kapil Sibal Male Indian National Congress
02- NORTH EAST DELHI Sh. Jai Prakash Agarwal Male Indian National Congress
03- EAST DELHI Sh. Sandeep Dixit Male Indian National Congress
04-NEW DELHI Sh. Ajay Makan Male Indian National Congress
05-NORTH WEST DELHI (SC) Smt. Krishna Tirath Female Indian National Congress
06- WEST DELHI Sh.Mahabal Mishra Male Indian National Congress
07- SOUTH DELHI Sh.Ramesh Kumar Male Indian National Congress
Source:Deptt. of Chief Electoral Office, Govt. of Delhi
NO. & NAME OF PARLIAMENTARY
CONSTITUENCY
TABLE NO. 7.6 LIST OF SUCCESSFUL CANDIDATES IN GENERAL LOK SABHA ELECTION - 2009 IN DELHI
WINNER SEX PARTY
123

% of women
candidates
Contested Won won
1 BJP 1 0 0%
2 INC 1 1 100%
3 Independents & Others 16 0 0%
18 1 6%
Source:Deptt. of Chief Electoral Office, Govt. of Delhi
Total
Table No. 7.7 Party-wise Performance of Women Candidates in
General lok Sabha elections-2009 in Delhi
PartiesWoment candidates
Sl. No.
124

Total
number
contesting
Electred % Wining
Total
number
contesting
Electred % Wining
First 1952 489 1874 3.8 NA NA NA NA NA NA
Second 1957 494 1518 3.1 45 27 60.0 1473 467 31.7
Third 1962 494 1985 4.0 70 35 50.0 1915 459 24.0
Fourth 1967 520 2369 4.6 67 30 44.8 2302 490 21.3
Fifth 1971 520 2784 5.4 86 21 24.4 2698 499 18.5
Sixth 1977 542 2439 4.5 70 19 27.1 2369 523 22.1
Seventh 1980 542 4620 8.5 142 28 19.7 4478 514 11.5
Eighth 1984 542 5574 10.3 164 42 25.6 5406 500 9.2
Ninth 1989 529 6160 11.3 198 27 13.6 5962 502 8.4
Tenth 1991 521 8699 16.7 325 37 11.4 8374 484 5.8
Eleventh 1996 543 13952 25.7 599 40 6.7 13353 503 3.8
Twelveth 1998 543 4750 8.7 274 43 15.7 4476 500 11.2
Thirteentha
1999 543 5155 8.9 296 52 17.6 4859 494 10.2
Fortheenth 2004 543 5435 10.0 355 45 12.7 5080 498 9.8
Source: Election Commission of India, New Delhi
Note: 1. Total number of contestants include the number of candidated elected unopposed, if any.
2. Data relates to Lok Sabha Elections
a Figures include Lok Sabha bye-elections upto December, 2003
NA Not Available.
(11th issue of Women & Men in India, 2007)
% number
of
contestants
per seat
Tabel No.: 7.8 Number of persons contesting and elected in various general elections
General
ElectionYear
No. of
seats
available
for
election
Total
number
contesting
Female Male
125

State/UT No. of Seats Contestants Elected Securities forfeited
Andhra Pradesh 42 21 3 9
Arunachal Pradesh 2 0 0 0
Assam 14 6 0 7
Bihar 40 14 3 11
Chhattisgarh 11 12 1 10
Goa 2 1 0 1
Gujarat 26 11 1 3
Haryana 10 8 1 1
Himachal Pradesh 4 2 1 1
Jammu & Kashmir 6 4 1 5
Jharkhand 14 13 1 9
Karnataka 28 10 2 7
Kerala 20 15 2 11
Madhya Pradesh 29 30 2 16
Maharashtra 48 29 5 11
Manipur 2 1 0 2
Meghalaya 2 0 0 0
Mi zoram 1 0 0 0
Nagaland 1 0 0 0
Orissa 21 9 2 3
Punjab 13 10 2 9
Rajasthan 25 17 2 9
Sikkim 1 0 0 0
Tamil Nadu 39 23 4 17
Tripura 2 0 0 0
Uttar Pradesh 80 61 7 37
Uttarakhand 5 5 0 4
West Bengal 42 34 4 24
A & N Islands 1 1 0 1
Chandigarh 1 1 0 1
Dadra & Nagar Haveli 1 1 0 1
Daman & Diu 1 0 0 0
Delhi 7 15 1 12
Lakashadweep 1 0 0 0
Pondicherry 1 1 0 0
All India 543 355 45 239
Source: Election Commission of India, General Elections, 2004 (14th Lok Sabha)
(11th issue of Women & Men in India, 2007)
Tabel No.: 7.9 Performance of Women Candidates in General Eelction in States/UTs - 2004
126

Female Male Total Female Male Total
Firsta 1952 NA NA 173.2 NA NA 61.2
Seconda 1957 NA NA 193.7 NA NA 62.2
Third 1962 102.4 113.9 216.4 46.6 62.0 55.0
Fourth 1967 119.4 129.6 249.0 55.5 66.7 61.3
Fifth 1971 NA NA 274.1 NA NA 55.3
Sixth 1977 154.2 167.0 321.2 54.9 65.6 60.5
Seventh 1980 170.3 185.2 355.6 51.2 62.2 56.9
Eighth 1984 192.3 208.0 400.3 59.2 68.4 64.0
Ninth 1989 236.9 262.0 498.9 57.3 66.1 61.9
Tenth 1991 234.5 261.8 498.4 51.4 61.6 56.7
Eleventh 1996 282.8 309.8 592.6 53.4 62.1 57.9
Twelveth 1998 289.2 316.7 605.9 57.9 65.7 61.9
Thirteenth 1999 295.7 323.8 619.5 55.6 63.9 59.9
Fortheenth 2004 322.0 349.5 671.5 53.6 62.2 58.1
Source: Election Commission of India, New Delhi
Note: 1. Sex-wise break up of electors is not available for the first, second and fifth General Elections.
2. Data relates to Lok Sabha Elections
a Calculated on the basis of valid votes polled.
NA Not Available.
(11th issue of Women & Men in India, 2007)
Tabel No.: 7.10 Number of electors and percentage voting in various general elections
General
ElectionYear
Total number of electors
(Figures in Million)% of electors participating in the election
127

Women Total
Andhra Pradesh 25791224 17384444 67.40 69.95
Arunachal Pradesh 332470 183909 55.32 56.35
Assam 7193283 4701710 65.36 69.11
Bihar 23506264 12134913 51.62 58.02
Chhattisgarh 6814700 3100827 45.50 52.09
Goa 465320 264934 56.94 58.77
Gujarat 16333302 6543424 40.06 45.18
Haryana 5659926 3554361 62.80 65.72
Himachal Pradesh 2053167 1211994 59.03 59.71
Jammu & Kashmir 2899880 841489 29.02 35.2
Jharkhand 7898175 3801786 48.13 55.69
Karnataka 18986838 11962519 63.00 65.14
Kerala 10957045 7567329 69.06 71.45
Madhya Pradesh 18361940 7124280 38.80 48.09
Maharashtra 30223732 15263748 50.50 54.38
Manipur 790456 512834 64.88 67.41
Meghalaya 640720 377125 58.86 52.69
Mi zoram 276505 170000 61.48 63.6
Nagaland 494319 446002 90.23 91.77
Orissa 12460298 7929405 63.64 66.06
Punjab 7963105 4794658 60.21 61.59
Rajasthan 16563357 7290569 44.02 49.97
Sikkim 136199 102890 75.54 77.95
Tamil Nadu 23982970 13642797 56.89 60.81
Tripura 954854 604452 63.30 67.08
Uttar Pradesh 50295882 20720447 41.20 48.16
Uttarakhand 2724433 1197917 43.97 48.07
West Bengal 22639342 17066370 75.38 78.04
A & N Islands 110143 70284 63.81 63.66
Chandigarh 235246 117886 50.11 51.14
Dadra & Nagar Haveli 57622 40904 70.99 69.04
Daman & Diu 39637 29751 75.06 70.16
Delhi 3809550 1697944 44.57 47.09
Lakashadweep 19153 16122 84.17 81.52
Pondicherry 326009 244202 74.91 76.07
All India 321997066 172714226 53.64 58.07
Source: Election Commission of India, General Elections, 2004 (14th Lok Sabha)
Note: Women Voters also include particpation in subsequent bye-election
1. Figure is for undived state
a. Electors figure relate to general elections to State Assembly held after Lok Sabha General Election in 2004
(11th issue of Women & Men in India, 2007)
Tabel No.: 7.11 Women's participation in polls in States/UTs - 2004
State/UT Women Electors Women Voters Poll (%)
128

Contested WonSecurities
forfeitedWon
Securities
forfeited
1 BJP 30 10 3 33.33 10.00 6940884
2 BSP 20 1 16 5.00 80.00 1081843
3 CPI 2 - 1 0.00 50.00 292866
4 CPM 8 5 1 62.50 12.50 2730678
5 INC 45 12 5 26.67 11.11 11922098
6 NCP 5 2 3 40.00 60.00 787051
I National Parties 110 30 29 27.27 26.36 23755420
II State parties 66 14 33 21.21 50.00 10241047
III Registeres (Unrecognised Parties) 62 1 60 1.61 96.77 928616
IV Independents 117 117 0.00 100.00 744908
Total 355 45 239 12.68 67.32 35669991
Source: Election Commission of India, General Elections, 2004 (14th Lok Sabha) (11th issue of Women & Men in India, 2007)
Tabel No.: 7.12 Party-wise Performance of Women Candidates in General Elections-2004
Parties
Women Candidates % of women candiates
Valid votes
129

Own
Health
Care
Making
major
household
purcahses
Purchasing
daily
household
needs
Visits to
her family
and
relatives
In all four
decisions
In none of
the four
decisions
Andhra Pradesh 61.8 52.7 60.4 66.5 40.4 24.3 66.6
Arunachal Pradesh 68.7 74.1 86.7 90.4 53.5 2.7 57.7
Assam 80.0 72.0 70.0 80.9 60.9 11.6 38.6
Bihar 53.4 50.6 58.4 54.4 32.7 27.2 66.8
Chhattisgarh 47.9 67.3 63.4 61.2 26.8 18.4 42.4
Delhi 74.2 67.3 75.7 74.9 52.0 10.4 73.5
Goa 67.5 67.3 74.6 84.5 47.0 7.5 99.0
Gujarat 63.2 53.3 66.2 70.4 36.6 13.1 77.7
Haryana 71.7 54.7 60.8 69.2 41.7 13.2 47.9
Himachal Pradesh 66.5 56.5 61.5 58.3 39.2 17.4 51.0
Jammu & Kashmir 43.5 44.9 46.9 43.4 25.2 37.3 77.3
Jharkhand 61.2 59.8 64.7 65.5 41.8 19.5 74.6
Karnataka 53.3 50.5 56.4 55.9 35.2 26.9 82.4
Kerala 75.3 61.8 65.9 78.4 47.2 10.8 47.7
Madhya Pradesh 51.7 48.3 54.9 50.2 29.4 27.1 45.7
Maharashtra 67.8 61.2 70.6 74.2 45.4 12.7 61.1
Manipur 87.4 81.4 85.2 86.0 69.4 3.4 40.0
Meghalaya 87.5 82.5 84.1 87.3 77.3 9.3 52.2
Mi zoram 91.9 79.6 86.0 89.5 70.4 2.3 27.6
Nagaland 90.7 82.1 87.2 93.7 73.1 1.4 43.9
Orissa 64.7 57.8 61.3 63.6 41.8 17.0 46.0
Punjab 76.8 48.2 56.5 68.5 37.4 11.2 41.1
Rajasthan 51.9 40.5 49.2 44.0 22.8 31.4 40.2
Sikkim 79.5 76.6 78.3 83.7 58.7 5.5 57.8
Tamil Nadu 73.2 63.3 77.8 76.7 48.8 8.2 41.2
Uttarakhand 60.8 49.4 56.4 56.0 36.0 24.6 56.2
Uttar Pradesh 64.2 52.9 55.6 50.3 33.7 22.0 73.1
West Bengal 59.6 37.5 46.9 48.4 23.9 25.7 51.5
All India 62.2 52.9 60.1 60.5 31.6 24.4 59.6
(11th issue Women & Men in India, 2007), CSO, Government of India
Tabel No.: 7.13 Women's autonomy (States/Uts)
% with
access to
money
Source: National Family Health Survey-III, 2005-06
Note: Figures given the precentage of currently married women involved in household decision making alone or jointly
with their hushands, and percentage with access to money by slected background characteristics for States/UTs during
2005-06.
State/UT
% involved in decision making on: % who participate
130

131
Appendix
CONCEPTS AND DEFINITIONS
Some important concepts used in this publication are defined as
follows:
1. Birth: “birth” means live-birth or still birth.
2. Live Birth: “live birth” means the complete expulsion or extraction from
its mother of a product of conception, irrespective of the duration of pregnancy, which after such expulsion or extraction, breathers or shows
any other evidence of life, and each product of such birth is considered live-born.
3. Still-Birth: “still birth” means foetal death where a product of conception
has attained at least the prescribed period of gestation.
4. Death: “death” means the permanent disappearance of all evidence of life at any time after live birth has taken place.
5. Foetal Death: “foetal death” means absence of all evidence of life prior to
the complete expulsion or extraction from its mother of a product of
conception irrespective of the duration of pregnancy.
6. Birth Rate: The annual birth rate is defined as “Number of births in a year divided by Mid-year population and multiplied by one thousand”.
7. Death Rate: The annual death rate is defined as “Number of deaths in a
year divided by Mid-year population and multiplied by one thousand”.
8. Infant Mortality Rate: Infant mortality rate serves as one of the best indices to the general “healthiness” of a society. It is similar to age-
specific death rate for infants under 1 year of age. The annual infant mortality rate is defined as “Number of deaths under 1 year of age which
occurred among the population divided by Number of live birth which occurred among the population and multiplied by one thousand”.
9. Maternal Death Rate: Maternal death rate is defined as maternal deaths per thousand live births. The Maternal death rate is defined as “Number
of maternal deaths divided by Number of live births and multiplied by one thousand”.
10. Neo Natal Mortality Rate: The neo-natal mortality rate, like the infant
mortality rate, is similar to an age specific rate. It is a rate used to

132
measure the risk of death during the first month of life and is defined as
“Number of deaths of infants under the age of 1 month which occurred among the population divided by Number of live birth which occurred
among the population and multiplied by one thousand”.
11. Couples Effectively Protected: Couples effectively protected is defined
as the use effectiveness levels of different methods which is indicative of the effective coverage of the eligible couple of all the methods of
contraception under family planning. The effectiveness is taken to be 100% in case of sterilization and oral pills, 95% in case of IUD and 50% in
case of conventional contraceptives.
12. General Fertility Rate: General Fertility rate is defined as number of live births per thousand women in the reproductive age group (15-49 years) in
a given year.
13. Literacy and Education Literate: A person who can read and write in
any language is literate. A person who can merely read but cannot write is not literate. It is not necessary that the person should have received
any formal education or should have passed any minimum educational standard. All children of age below seven years have been treated as
illiterate even though some of them may be attending schools and may be able to read and write a few words.
14. Literacy rate: Literacy rate of the population is defined as the percentage
of illiterates in the age group of seven years and above. For different age groups the percentage of illiterates in that age group gives the literacy
rate.
15. Educational level: The highest level of education a person has
completed.
16. Employed and Unemployed: According to usual status approach, (with a reference period of 365 days) adopted by National Sample Survey
Organization (NSSO) a person is considered as working or employed if he/she is engaged relatively for a longer time, during the reference period
of last 365 days in any one or more of the work activities. He/she was considered as seeking or available for work or unemployed if he/she was
not working but was either seeking or available for work for a relatively longer period of the specified reference period.
17. Work Participation: Participation in any economically productive
activity. Work may be physical or mental in nature. It involves not only work but also effective supervision and direction of work.

133
18. Main worker: A person who has worked for a major part of the year preceding the date of enumeration, i.e. one who was engaged in any
economically productive activity for 183 days or more, i.e. six months or more, in previous year.
19. Marginal worker: A person who has done some work in the year
preceding the date of enumeration but does not qualify to be called a ‘main worker’ i.e. period of work is less than 183 days.
20. Non-worker: A person who has not worked at all in the year preceding
the date of enumeration.
21. Cultivator: A person engaged as employer, single worker or family worker in cultivation of undernoted crops on land owned or held from
government or private persons or institutions for payment in money, kind
or share. Cultivation includes supervision or direction of cultivation. Cultivation includes ploughing, sowing and harvesting and production of
cereals and millet crops such as wheat, paddy, jowar, bajra, ragi, etc. and pulses, raw jute and kindred fiber crop, cotton, etc. Cultivation does not
include growing of fruits and vegetables, keeping orchard or groves or working in plantations like tea, coffee, rubber, cinchona and medicinal
plants.
22. Agricultural Labourer: A person who works in another person’s land for wages in cash or kind or share crop is regarded as an agricultural
labourer. Such a person has no risk in cultivation but merely works in another person’s land for wages and has no right of lease or contract on
the land on which he works.
23. Household Industry: An industry conducted by one or more members of
the household at home or within the village in rural areas and within the premises of the house where the household lives in urban areas. It should
be smaller than the scale of a registered factory and should be engaged in manufacturing, processing, servicing and repairs of goods.
24. Own Account Establishment (OAE): OAE is an establishment having no
hired worker and is owned and operated with the help of household members only.
25. Labour Force: Comprises of employed and unemployed and the number
of the such persons per 1000 persons in the population constitute its rate.
26. Work Participation rate: Refers to number of persons employed per 1000 persons in the population.

134
27. Unemployment rate: refers to number of persons unemployed per 1000
persons in the labour force.
28. Gross Enrolment Ratio: Gross Enrolment ratio measures what percentage of the total population in the relevant age-group is being
covered by the various educational programmes being run in the country, i.e.
Gross enrolment Enrolment at stage I
Ratio at stage I =-- --------------------------------------- * 100 Population in the age group corresponding to the I stage Two stage are: primary (Classes I-V) and middle (Classes VI-VIII).
The corresponding age-group for these stages are 6-10 years and 11-13
years respectively. Therefore, gross enrolment ratio for primary stage (I-V) is
Total Enrolment in Classes I-V = -- --------------------------------------- * 100 Total Population in the age group 6-11 years
While interpreting these figures it should by noted that there may be
many students outside the age group 6-11 enrolled in classes’ I-V. Therefore, enrolment ratios in some age groups can be more than 100.
29. Dropout rate: Dropout at primary stage during a given year is defined as
the ratio of the difference of enrolment in class I in the fourth year preceding and the enrolment in class V during the year to the enrolment
in the class I in the fourt year preceding. In mathematical terms, these rates for primary (I-V), middle (I-VIII) and secondary (I-X) stages are
explained below:
Enrolment in class I preceding four year (i.e. 1987-88)
Drop out rates at minus Enrolment in class V during the year (1991-92)
Primary stage = ------------------------------------------------------------ x 100
during 1991-92 Enrolment in class I preceding four year (i.e. 1987-88)
Enrolment in class I preceding 7 years (i.e. 1984-85)
Drop out rates at minus Enrolment in class VIII during the year (1991-92)
Elementary stage = ------------------------------------------------------------ x 100
during 1991-92 Enrolment in class I preceding 7 year (i.e. 1984-85)
Enrolment in class I preceding 9 years (i.e. 1982-83)
Drop out rates at minus Enrolment in class X during the year (1991-92)
Secondary stage = ------------------------------------------------------------ x 100
during 1991-92 Enrolment in class I preceding 9 year (i.e. 1982-83)