Governance factors in the identification of global conservation priorities for mammals
9
Research Governance factors in the identification of global conservation priorities for mammals Johanna Eklund 1 , Anni Arponen 1 , Piero Visconti 2,3 and Mar Cabeza 1,4, * 1 Metapopulation Research Group, Department of Biosciences, University of Helsinki, PO Box 65, 00014 Helsinki, Finland 2 Australian Research Council Centre of Excellence for Coral Reef Studies, James Cook University, Townsville, Queensland, Australia 3 Global Mammal Assessment programme, Department of Biology and Biotechnologies, Sapienza Universita ` di Roma, Viale dell’Universita ` 32, 00185 Rome, Italy 4 Biodiversity and Global Change Lab, Museo Nacional de Ciencias Naturales, CSIC, C/Jose ´ Gutie ´rrez Abascal 2, 28006 Madrid, Spain Global conservation priorities have often been identified based on the combination of species rich- ness and threat information. With the development of the field of systematic conservation planning, more attention has been given to conservation costs. This leads to prioritizing developing countries, where costs are generally low and biodiversity is high. But many of these countries have poor gover- nance, which may result in ineffective conservation or in larger costs than initially expected. We explore how the consideration of governance affects the selection of global conservation priori- ties for the world’s mammals in a complementarity-based conservation prioritization. We use data on Control of Corruption (Worldwide Governance Indicators project) as an indicator of governance effectiveness, and gross domestic product per capita as an indicator of cost. We show that, while core areas with high levels of endemism are always selected as important regardless of governance and cost values, there are clear regional differences in selected sites when biodiversity, cost or governance are taken into account separately. Overall, the analysis supports the concentration of conservation efforts in most of the regions generally considered of high priority, but stresses the need for different conservation approaches in different continents owing to spatial patterns of governance and economic development. Keywords: spatial conservation prioritization; mammals; good governance; corruption; conservation effectiveness 1. INTRODUCTION Nearly one quarter of mammal species are globally threatened or already extinct [1]. Despite major conser- vation efforts, mammals continue to decline, and at faster rates than birds, with threats such as habitat loss and hunting being still ineffectively addressed [2]. During the last 500 years, 76 mammal species have been lost, and the rate is accelerating [1]. These numbers call for additional conservation efforts and careful identification of priorities. Global conservation priorities have typically been identified based on information on species richness, endemism and areas under most threat [3 – 5]. These ‘hotspot’ priorities have been criticized by the rising field of systematic conservation planning [6], which addresses resource allocation problems with quantita- tive objectives through optimization techniques. Such an approach is customizable to include a number of rel- evant factors. Mammals, in particular, have been the target of several applications of this type, accounting for conservation costs [7], human pressure [8], latent extinc- tion risk [9] and opportunity costs to limit conflicts between conservation and agricultural activity [10]. The field of systematic conservation planning has brought along a strong focus on the need to account for economic costs in the conservation planning process. This is necessary in a world of limited resources, but comes with its own problems (see [11] for a more com- prehensive discussion on the topic). At global scales, when costs are considered, developing countries tend to be prioritized as they offer high biological diversity with potentially low land acquisition and management costs [12]. However, socio-political differences between countries are arguably no smaller or less important than the economical ones. It has indeed been shown that conservation outcomes correlate with socio-political factors [13,14], with low values for socio-political * Author for correspondence ([email protected].fi). Electronic supplementary material is available at http://dx.doi.org/ 10.1098/rstb.2011.0114 or via http://rstb.royalsocietypublishing.org. One contribution of 14 to a Theme Issue ‘Global strategies for the conservation of mammals’. Phil. Trans. R. Soc. B (2011) 366, 2661–2669 doi:10.1098/rstb.2011.0114 2661 This journal is q 2011 The Royal Society
Transcript of Governance factors in the identification of global conservation priorities for mammals
Phil Trans R Soc B (2011) 366 2661ndash2669
doi101098rstb20110114
Research
Autho
Electron101098
One conconserva
Governance factors in the identification ofglobal conservation priorities for mammals
Johanna Eklund1 Anni Arponen1 Piero Visconti23
and Mar Cabeza141Metapopulation Research Group Department of Biosciences University of Helsinki PO Box 65
00014 Helsinki Finland2Australian Research Council Centre of Excellence for Coral Reef Studies James Cook University
Townsville Queensland Australia3Global Mammal Assessment programme Department of Biology and Biotechnologies Sapienza
Universita di Roma Viale dellrsquoUniversita 32 00185 Rome Italy4Biodiversity and Global Change Lab Museo Nacional de Ciencias Naturales CSIC CJose Gutierrez
Abascal 2 28006 Madrid Spain
Global conservation priorities have often been identified based on the combination of species rich-ness and threat information With the development of the field of systematic conservation planningmore attention has been given to conservation costs This leads to prioritizing developing countrieswhere costs are generally low and biodiversity is high But many of these countries have poor gover-nance which may result in ineffective conservation or in larger costs than initially expectedWe explore how the consideration of governance affects the selection of global conservation priori-ties for the worldrsquos mammals in a complementarity-based conservation prioritization We use dataon Control of Corruption (Worldwide Governance Indicators project) as an indicator of governanceeffectiveness and gross domestic product per capita as an indicator of cost We show that whilecore areas with high levels of endemism are always selected as important regardless of governanceand cost values there are clear regional differences in selected sites when biodiversity cost orgovernance are taken into account separately Overall the analysis supports the concentration ofconservation efforts in most of the regions generally considered of high priority but stresses theneed for different conservation approaches in different continents owing to spatial patterns ofgovernance and economic development
Keywords spatial conservation prioritization mammals good governance corruptionconservation effectiveness
1 INTRODUCTIONNearly one quarter of mammal species are globallythreatened or already extinct [1] Despite major conser-vation efforts mammals continue to decline and atfaster rates than birds with threats such as habitat lossand hunting being still ineffectively addressed [2]During the last 500 years 76 mammal species havebeen lost and the rate is accelerating [1] These numberscall for additional conservation efforts and carefulidentification of priorities
Global conservation priorities have typically beenidentified based on information on species richnessendemism and areas under most threat [3ndash5] Theselsquohotspotrsquo priorities have been criticized by the risingfield of systematic conservation planning [6] which
r for correspondence (cabezacchelsinkifi)
ic supplementary material is available at httpdxdoiorgrstb20110114 or via httprstbroyalsocietypublishingorg
tribution of 14 to a Theme Issue lsquoGlobal strategies for thetion of mammalsrsquo
2661
addresses resource allocation problems with quantita-tive objectives through optimization techniques Suchan approach is customizable to include a number of rel-evant factors Mammals in particular have been thetarget of several applications of this type accounting forconservation costs [7] human pressure [8] latent extinc-tion risk [9] and opportunity costs to limit conflictsbetween conservation and agricultural activity [10]
The field of systematic conservation planning hasbrought along a strong focus on the need to account foreconomic costs in the conservation planning processThis is necessary in a world of limited resources butcomes with its own problems (see [11] for a more com-prehensive discussion on the topic) At global scaleswhen costs are considered developing countries tendto be prioritized as they offer high biological diversitywith potentially low land acquisition and managementcosts [12] However socio-political differences betweencountries are arguably no smaller or less importantthan the economical ones It has indeed been shownthat conservation outcomes correlate with socio-politicalfactors [1314] with low values for socio-political
This journal is q 2011 The Royal Society
2662 J Eklund et al Governance in conservation planning
governance indicators corresponding to poor conserva-tion outcomes For example the numbers of AfricanElephants and Black Rhinos could be explained by cor-responding national values of a corruption indicator[15] and additional correlative relationships supportingthis fact have been found for the Protected Area Manage-ment Effectiveness Index and the Human DevelopmentIndex [16] and tropical protected area effectiveness andcorruption levels [17]
Many countries with high species richness and ende-mism could offer low costs for conservation but alsosuffer from inefficient governance political instabilityand higher levels of corruption [13] Thus while thebenefit-to-cost ratio of conservation may be apparentlygreater in developing regions of the world because oftheir lower costs for land acquisition and managementit is often exactly in these countries that the lack of goodgovernance impeding effective conservation is most acute
To date governance has rarely been accounted for inconservation planning approaches (but see [14] and[18]) However governance should not be disregardedeven though we lack decent models on how corruptionimpacts on conservation success and the relationshipbetween the two still is rather unexplored [1920] Theproblem is the lack of empirical data to explore thisrelationship which could then be used in quantitativeprioritizations either by penalizing the effectiveness ofconservation actions or by increasing the costs for carry-ing them out Despite the lackof quantitative measures toaccount for this socio-political dimension many stillacknowledge the importance of it [8102122]
The aim of this study is to compare mammal conser-vation priorities in relation to governance and economicindicators The availability of recently completed habitatsuitability models for terrestrial mammals [23] allows forthe exploration of this on a global scale but with fine res-olution data The global focus allows us to explore the fullvariation in costs for conservation and governance Weapplied a systematic conservation planning approachaimed at prioritizing important mammal conservationregions while accounting for mammal diversity onlymammal diversity conditional to costs mammal diversitypenalized by governance and various combinations ofthese Here we assume that corruption has a negativeimpact on conservation effectiveness but see sect4 foralternative hypotheses Our study allows the explorationof trade-offs between these factors and it also generatesbalanced solutions that consider biodiversity togetherwith economical costs and quality of governance Butfirst and foremost it contributes to the debate on theimportance of considering governance issues whenaiming at effective conservation planning
2 MATERIAL AND METHODS(a) Mammal species distribution data
Distribution data for the worldrsquos terrestrial mammalscome from habitat suitability models [23] This highresolution dataset contains the modelled distributionsof 5086 mammal species and is based on the globalmammal assessment led by the International Unionfor Conservation of Nature [1] The data were usedat a resolution of 018 and this resulted in 3600 1800 grid cells
Phil Trans R Soc B (2011)
(b) Cost data
Unlike Bode et al [22] and Wilson et al [18] we chosenot to use the cost model derived in Balmford et al[12] to estimate conservation costs at national levelbecause it reflects differences in the types of conserva-tion projects that have been so far funded in differentnationsmdashwealthy nations engaging in more costly con-servation actions (restoration etc) than the poor onesIndeed it results in a variation of seven orders ofmagnitude in costs between countries Instead as inother prioritization approaches [24] we use a moregeneral indicator of cost gross domestic product(GDP) per capita which has a variation of ca threeorders of magnitude We used the nominal GDP percapita instead of GDP at Purchasing Power Paritybecause global conservation prioritizations are likelyto be relevant for international non-governmentalorganizations or donor investments from industrializedcountries [25] and thus investments must be madeusing market exchange rates Economic and populationdatawere obtained from the World Development Report2009 [26] and used to calculate GDP (nominal) percapita This information was available for 182 countries
(c) Governance data
The most comprehensive and publicly available measureof governance is the Worldwide Governance Indicators(WGI) project [27] which incorporates many of theother available assessments on governance (InternationalCountry Risk Guide Freedom House Country Policyand Institutional Assessment and most of the sourcesalso used by Transparency International in formingtheir composite indicator) These data are available fora larger set of countries and territories than individualindexes used previously in conservation studies (eg[15]) The WGI-dataset includes data on six dimensionsof governance (voice and accountability political stab-ility and absence of violenceterrorism governmenteffectiveness regulatory quality rule of law and controlof corruption) for 212 countries and territories over theperiod 1996ndash2007 These aggregated indicators arebased on several hundred individual variables quantify-ing perceptions of governance drawn from separatedata sources constructed by different non-governmentalorganizations privatendashpublic agencies and individuals(such as Afrobarometro World Economic ForumGallup World Poll and Reporters without Borders)The aggregated indicators are weighted averages of theunderlying data The dataset has been used in some con-servation studies [2428] showing a strong positivecorrelation between national governance quality scoresand GDP per capita implying that many developingcountries suffer from poor governance All six govern-ance factors are strongly correlated [2428] We choseto use a single factor control of corruption as corruptionhas been shown to be related to conservation out-comes [15] and also to influence the effectiveness ofdevelopment aid [29]
(d) Prioritization with ZONATION
Global mammal priorities were identified with the con-servation planning software ZONATION [3031] Theruns were performed with ZONATION 3 development
Governance in conservation planning J Eklund et al 2663
version which is to be publicly released in 2011ZONATION produces a hierarchical prioritization ofthe landscape based on the biological value of sitesaccounting for complementarity The algorithm pro-ceeds by removing the least valuable cell from thelandscape minimizing marginal loss of conservationvalue
We used a variant of ZONATION (Basic core-areaZONATION) that encourages the representation of allspecies The local biodiversity value of a cell is basedon the species that has the highest proportion of its distri-bution remaining in the specific cell In other words thealgorithm removes first cells with species that have widedistributions and aims at retaining equal amounts ofhabitat for all species When a cost layer (in this studyconsisting of GDP andor corruption scoresmdashseebelow) is used cell removal is based on local biodiversityvalue divided by cell cost The Core-Area ZONATION
resembles the lsquogain metricrsquo of Wilson et al [18] in thata speciesrsquo distribution in a cell is valued relative to itstotal distribution but with two main differences (i) ascells are progressively removed the importance of theoccurrences of initially widely distributed speciesincreases and (ii) it produces a continuous ranking ofthe whole landscape instead of using fixed targets forspecies representation or constraints for resource use
Countries lacking the socio-political and economicdata were masked out of the analysis resulting in179 countries used in our analyses (see electronic sup-plementary material table S1 for the list of countries)Most of the excluded countries were small and unlikelyto influence the general patterns in the results but theabsence of countries such as Afghanistan Iraq andSomalia should be noted when interpreting the resultsSpecies endemic to these countries were thus notincluded in the analysis which meant having 5016species in our results instead of the 5086 in the fulldataset
Data are not available for linking governance scores toeffectiveness of mammal conservation or to realizedcosts via empirically derived functions In the absenceof such models we chose to incorporate governancescores in our objective function as increased costsbased on the assumption that in countries where thelevel of corruption is high only part of the resources willend up being used for the intended purpose We exploredhow relative differences in cost and governance variablesinfluence global conservation priorities We re-scaledboth variables to vary between 0 and 100 Eight differentconservation scenarios were produced one by lettingonly the biodiversity data drive the selection (referredto as the Biodiversity-only scenario technically corre-sponding to cost layer values being equal everywhere)and seven scenarios by weighting and combining differ-ently GDP and corruption data into a cost layer Weconsider two extreme scenarios (Economic cost scenarioand Governance scenario) by giving the maximumweight of 1 to one of the variables and the minimumweight of 0 to the other The equal weighting of econ-omic costs and governance was also considered (giving05 weights to both) and various weightings betweenthese values (01 025 075 09) always summing upto one (eg weight of 01 for governance weight of 09for economic cost) A final cost index was calculated as
Phil Trans R Soc B (2011)
a combination of the two by a simple additive approach
subject to Ci frac14 ECi wEC thornGi wG
wEC thornWG frac14 1
where Ci is the total cost considered for the grid cell i ECi
is the economic cost class of cell i (based on GDP percapita) Gi is the governance cost class and wEC andwG are weights given to the economic cost or the govern-ance classes respectively as explained above Thesedifferent weighting schemes gave each country differentcost-corruption indexes that were used as cost layers inthe ZONATION runs
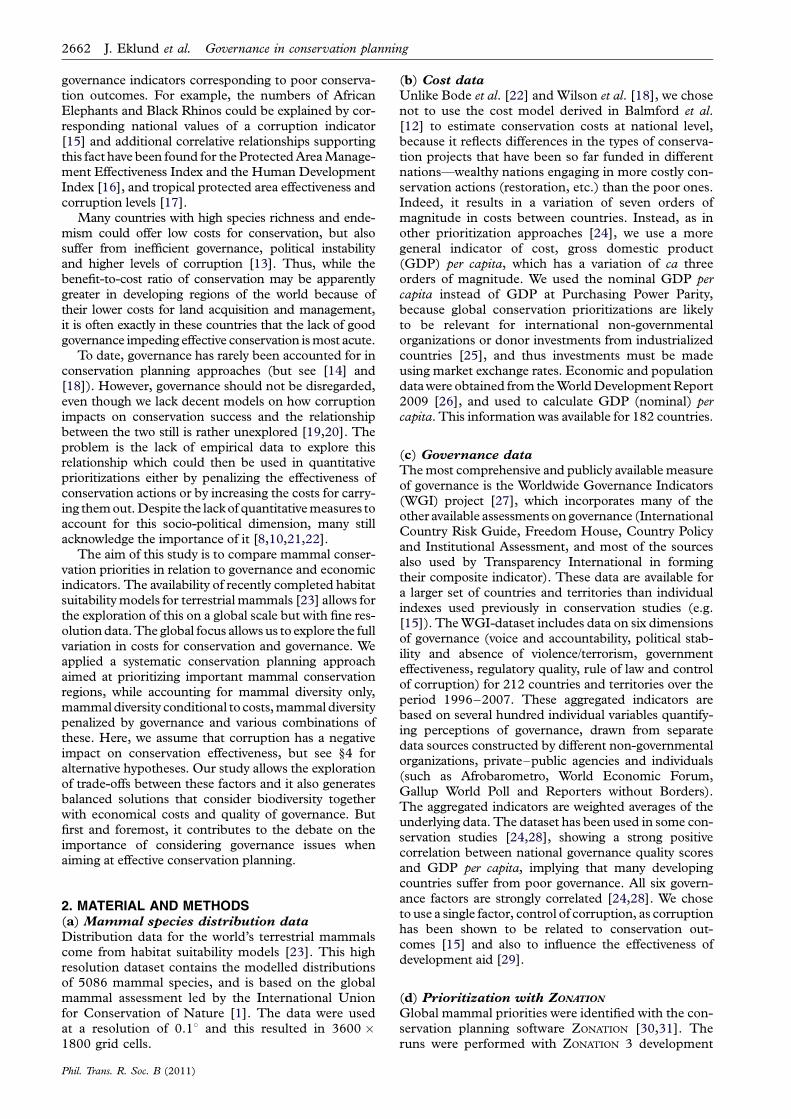
3 RESULTSA comparison of the most extreme scenarios (Biodiver-sity-only Economic cost and Governance scenarios)showed important continental differences in priorities(figure 1a and table 1 see also electronic supplementarymaterial table S1 for detailed results) Africa includedmany areas that stood out as priorities when economiccosts were considered but not when only biodiversitywas accounted for (in blue) In South America severalpriorities represented important areas for biodiversitybut higher costs combined with poor governanceprevented them from being prioritized in the other scen-arios (yellow) But variation in both costs and governancewere large in South America which showed in the pri-ority map as higher variation in the colour patternsRegions in the Northern Hemisphere and Australiastood out as important biodiversity areas with good gov-ernance (orange) but high costs prevented these regionsfrom being selected when GDP per capita was con-sidered With highest penalties to poor governancesome well-governed but expensive and partly less biodi-verse areas eg in Australia and the Boreal regiongained more emphasis (red)
If we focus on the top 10 per cent priorities in eachscenario the area that overlapped in all eight scenariosis small covering only 568 per cent of the total landarea Common priorities characterized by countriesor regions with high endemism were particularlycommon in Africa (overlap between the three extremescenarios is shown in black in figure 1a) Coincidencewas lowest between prioritizations done with the Gov-ernance versus the Economic cost scenario (black thornpurple in figure 1a) as would be expected given thecorrelation between GDP per capita and Control ofCorruption (Kendallrsquos tau 0557 p 0001) Particu-larly parts of Africa and Southeast Asia showed largerproportions of low cost areas important for biodiver-sity but which are poorly governed (green in figure 1a)
When looking further than the top 10 per cent frac-tion across all scenarios a larger number of nationsbecame important figure 1b shows summed ranksacross all scenarios illustrating areas that were importantwith higher certainty no matter how costs and govern-ance were considered (in red) and areas that were leastvaluable (in dark blue) Note that areas with intermediatesummed rank values could either denote regions moresensitive to assumptions about influence of governanceor cost (ie more variation between the differentscenarios) or areas of consistently intermediate priority
biodiversity
governance
costbiodiversity and governancebiodiversity and cost
governance and cost
biodiversity and governance and cost
(a)
summed rankvalue
high 7 99882
low 0 0003998
(b)
Figure 1 Spatial distribution of conservation priority areas selected in a complementarity analysis with different scenarios(a) Top 10 priorities from the three most extreme scenarios biodiversity only (yellow) costs only (blue) and governance
only (red) Areas of overlap between combinations of the scenarios are also shown biodiversity thorn governance (orange) bio-diversity and GDP (green) GDP and governance (purple) Areas identified as top 10 priorities across all three scenarios areshown in black (b) Sum of ranks across all eight scenarios Dark red indicates higher priorities across all scenarios dark bluelow priority across all scenarios Intermediate colours indicate either intermediate importance or variable importance
2664 J Eklund et al Governance in conservation planning
Correlation of cell ranks between different solutionswere in accordance with the results in figure 1a (elec-tronic supplementary material table S2) They werevery high between the closest scenario variants (egthe 01 weighting versus Governance scenarios is
Phil Trans R Soc B (2011)
0994 p 1215) and lowest between the Economiccost and Governance scenarios (0587 p 1215)
Each scenario aimed at maximizing a particular objec-tive which included only biodiversity or a combinationof biodiversity and costndashgovernance constraints The
Tab
le1
Fiv
eco
un
trie
sw
ith
larg
est
are
as
inth
eto
p10
frac
tion
wit
hth
ed
iffe
ren
tp
riori
tiza
tion
scen
ari
os
Are
ais
giv
enin
thou
san
ds
of
squ
are
kilom
etre
sT
he
ove
rlap
colu
mn
giv
esth
e
are
ath
atove
rlaps
bet
wee
nth
eth
ree
extr
eme
solu
tion
s(g
ove
rnan
ce
cost
b
iod
iver
sity
)w
hic
hco
rres
pon
ds
toth
eb
lack
are
as
infi
gu
re1a
bio
div
ersi
tyco
stco
st09
cost
07
5co
st05
cost
02
5co
st01
gove
rnan
ceove
rlap
Bra
zil
1504
Chin
a893
Bra
zil
1452
Bra
zil
1533
Bra
zil
1468
Au
stra
lia
1840
Au
stra
lia
2207
Au
stra
lia
2387
Bra
zil
658
US
1034
Ind
on
esia
888
Chin
a1044
Chin
a958
Au
stra
lia
1268
Bra
zil
1288
US
1392
US
1401
Chin
a515
Au
stra
lia
946
Ind
ia855
Ind
on
esia
799
Ind
on
esia
731
US
993
US
1276
Bra
zil
1157
Bra
zil
989
Ind
on
esia
484
Chin
a936
Con
go
DR
844
Mex
ico
656
Au
stra
lia
716
Ch
ina
826
Ch
ina
705
Chin
a631
Can
ad
a683
Mex
ico
312
Ind
on
esia
699
Bra
zil
669
Ind
ia578
Mex
ico
688
Ind
on
esia
661
Ind
on
esia
595
Can
ad
a579
Chin
a551
Per
u288
Governance in conservation planning J Eklund et al 2665
Phil Trans R Soc B (2011)
strongest penalties for governance resulted in more costlysolutions measured as the mean GDP per capita ofselected units but in the scenarios with intermediateweightings for cost and governance the overall cost ofthe solution was low (figure 2a) and similar to the costof the solution when using biodiversity only Solutionsbased on scenarios where GDP per capita has a high con-tribution resulted in the largest overall corruption levelwithin the top priorities These levels of corruptionwere much higher than the average corruption levelacross all nations (figure 2b) Those scenarios accountingfor governance in the planning achieved substantialreductions in overall corruption levels In turn the inter-mediate Economic costndashGovernance scenarios (05weighting) had a cost distribution similar to the biodiver-sity-only solution and provided an improvement incorruption levels compared with the biodiversity-onlysolution without incurring much increase in GDPper capita values
There were small differences in the protection levels ofspecies across scenarios (figure 3ab) In terms of averageproportion of the distribution protected the GDP percapita-constrained solution achieved smallest overall cov-erage of species distributions while the most extremegovernance penalty resulted in intermediate levels Theintermediate Economic costndashGovernance scenarios per-formed very similarly to the biodiversity-only solutionNonetheless all solutions achieved coverage of all specieswhen 5 per cent or more of the worldrsquo terrestrial surfacewas protected (figure 3b) The Biodiversity-only scenarioretained species furthest as the fraction of protectedarea decreased with most other scenarios achievingvery similar results Only the GDP per capita-constrainedsolution differed notably from other schemes starting tolose species coverage at larger fractions of area protected(figure 3b)
4 DISCUSSIONWe have shown that there are important trade-offsbetween governance and cost and that taking govern-ance into account in the planning of conservationpriorities albeit simplistically can make a large differ-ence Interestingly we have shown that these trade-offsvary in space some continents being more affectedthan others Despite this some regions are identifiedas priorities with any of the scenarios and thus weurge conservation efforts in these areas We do not rec-ommend neglecting poorly governed nations andwant to stress that different conservation approachesare needed in different regions
Our intermediate Economic costndashGovernancescenarios seem to provide desirable levels of govern-ance with only a minor increase in cost and are thussolutions that should be preferred It is noteworthythat much more of the area important for biodiversityoverlaps with the governance-based priorities thanwith the cost-based (more orange than green infigure 1a) Instead cost-based priorities includemuch area that would not be prioritized in any otherscenario This illustrates the risks of focusing largelyon economic costs [11] with funds being divertedfrom the most important biodiversity regions to areaswhere they might end up in the wrong hands or
GDP per capita
0 20 40 60 80 100
corruption0 20 40 60 80 100
econ
gov
biodiv
econ
(a)
(b)
econ 09ndashgov 01
econ 075ndashgov 025
econ 05ndashgov 05
econ 025ndashgov 075
econ 01ndashgov 09
econ 09ndashgov 01
econ 075ndashgov 025
econ 05ndashgov 05
econ 025ndashgov 075
econ 01ndashgov 09
gov
biodiv
115 99 87920 068 40 020 59 973 79 926
260 181 101 022 ndash057 ndash137
Figure 2 Distribution of GDP values (a) and governance scores (b) for all cells in top 10 fractions achieved with each of theeight scenarios Mean and 95th percentiles across all nations in the dataset are shown as reference (solid line and dashed line
respectively) The units on x-axes are given both as the scaled values used in our calculations (below) and as the original GDPand Control of Corruption indicator values (above the panels)
2666 J Eklund et al Governance in conservation planning
anyhow used ineffectively Incorporating costs into theprioritization process can be misleading if other socio-political constraints are not considered as well
Important areas identified by other mammalconservation prioritization approaches also maintainhigh priority in our analysis (eg [810] see also simi-larities with Wilson et al [18]) Our highest priorityregions contain areas that despite poor governanceare necessary to achieve global mammal conservationbecause of their high levels of endemism eg theAndes Mexico Western Ghats Madagascar PapuaNew Guinea Indonesia Philippines Sri Lanka etcHotspot regions such as Japan California and theMediterranean basin are high priorities for biodiversityand also well-governed but high costs would preventthem from being prioritized in a cost-based analysisThe top 10 per cent of the priorities identified by theBiodiversity-only Economic cost and Governance scen-arios overlapped by 40 42 and 32 per cent respectivelywith the Biodiversity Hotspots [4]
We chose to incorporate governance in our prioritiza-tion as an additional cost This is based on the
Phil Trans R Soc B (2011)
perception that the apparent low costs of conservationin corrupt countries are not real only a fraction of theinvested conservation funds will be spent effectively onthe intended purpose Thus to achieve the proposedgoals additional investments should be made resultingin increased conservation costs This is likely to be truebut not the whole truth In poorly governed countrieseven the conservation actions that end up beingimplemented may not be effective owing to poachingand other illegal activities and corruption can act asan incentive for overexploitation of resources So nomatter how much economic resource is spent the out-comes may remain unsatisfactory An alternative (buttechnically largely equivalent) conservation prioritiza-tion approach would instead penalize the conservationoutcomes based on quality of governance (ie assumethat only a fraction of the biodiversity features can beprotected effectively if the level of corruption is high)Wilson et al [18] used a factor for lsquoinvestment successrsquoderived from data on government ineffectiveness Butno matter which approach is chosen empirical data tolink effectiveness to such indicators (added cost or
landscape protected ()
no s
peci
es u
nrep
rese
nted
0
1000
2000
3000
4000
5000
0
1000
2000
3000
4000
5000
012345
landscape protected ()
frac
tion
of s
peci
es d
istr
ibut
ions
rep
rese
nted
0
02
04
06
08
10(a)
(b)
020406080
05 04 03 02 01 0
100
065
070
075
080
085
09029 27 25 23 21
Figure 3 Species representation in all eight scenarios (a) Mean proportion of speciesrsquo distributions remaining protected atdecreasing fractions of area protected (b) number of species entirely unprotected at decreasing fractions of area protectedNote that the insets show a magnification corresponding to a particular range of percentage of landscape protected between
20ndash30 for (a) and 0ndash05 in (b) (see the range of values on top of the inset) Dashed line biodiversity only long dashedline governance only solid line economic 01ndashgovernance 09 dotted line economic 025ndashgovernance 075 solid line withfilled circles economic 05ndashgovernance 05 solid line with open circles economic 075ndashgovernance 025 solid line withfilled inverted triangles economic 09ndashgovernance 01 solid line with open inverted triangles economic cost only
Governance in conservation planning J Eklund et al 2667
effective conservation outcomes) are still required toachieve more reliable results
On the other hand our results showed dramaticimpact of corruption penalties to spatial priorities con-trasting with the findings of Wilson et al [18] Thesedifferences can arise for at least two reasons (i) alarger variation in cost data used by Wilson et al [18]resulted in stronger influence of cost with respect toother factors and (ii) the temporal variability in in-vestment effectiveness considered by Wilson et alrsquosdynamic approach where investments made in periodsof government ineffectiveness were considered to failand others to succeed despite following periods ofineffectiveness
Phil Trans R Soc B (2011)
Corruption and its influence on effectiveness of con-servation programmes has been identified as one ofthe lsquoOne hundred questions of importance to theconservation of global biological diversityrsquo [32] If theassumptions about the positive relationship betweengood governance and conservation effectiveness holdlow cost solutions will not necessarily lead to effectiveuse of resources many of the countries that offer lowcost investments for conservation actions are alsothe ones that suffer most from corruption Yet littleeffort has gone to date into considering governance inevaluating global conservation priorities
A better understanding of the relationship betweengovernance and conservation outputs and governance
2668 J Eklund et al Governance in conservation planning
and effective conservation costs will eventually allow fora better parametrization of the conservation approachpresented here Nevertheless in the meantime lessonscan perhaps be learnt from the field of aid effectivenesswhere the discussion on how to account for governancefactors has received major attention in the recent pastStudies have shown that aid will only lead to develop-ment (which should be considered the main aim ofdevelopment assistance) in better governed countries[33ndash35] That is aid effectiveness seems to be con-ditional on the quality of institutions and policiesBetter governed countries can use aid money moreeffectively and therefore achieve expected developmentoutcomes These findings still debated [3637] haveled to questions of selectivity versus conditionality[3839] should aid be given based on certain policyconditions (ex ante) or should it only be given towhere it is likely to succeed (ex post) These ideas maynot apply directly to conservation but there are clearanalogies should conservation investments be directedto regions with favourable conservation conditions orshould biodiversity needs drive conservation prioritiesbut effectiveness be enhanced in problematic regionsin different ways
Corruption can have complex both positive andnegative effects on biodiversity and these effects arelikely to be different at different scales Possible positiveeffects could be that a corrupt government is less likely toinvest in infrastructure development in rural areas thatwould affect biodiversity negatively [20] Corruptcountries experience inefficient economies and are lesslikely to attract foreign direct investments by multi-national corporations and industries to exploit theirnatural resources [20] But wealthy nations do tend todisplace the exploitative industries to poor countrieswhich might mean that the poor but less corruptcountries could face higher threats from industrialactivities On the other hand slow economic growth islikely to affect local peoplesrsquo livelihoods negatively andthis might again increase overexploitation on a localscale We have ignored the potential positive effects ofpoor governance in this study but our conservationplanning framework could account both for positiveand negative effects once the relationship betweengovernance and conservation effectiveness is betterunderstood
To conclude we do not suggest that allocation ofconservation resources should follow the priority mapsproduced in our analyses although they may givesome indication of regions that may deserve further con-siderations before large conservation investmentsare made We warn about the use of economic costs inconservation prioritization exercises when this isdetached from other socio-economic factors as thismay result in resources being poured into either regionsless important for biodiversity or ineffective projectsRather than neglecting poorly governed nationsour find-ings stress the need for developing and applying differentconservation approaches in different regions [40] Weneed to find less costly ways of working in the expensiveand well-governed regions (eg North America Austra-lia) perhaps building on volunteer-based conservationprogrammes or comprehensive land use planningapproaches Low cost and well-governed regions may
Phil Trans R Soc B (2011)
be most suitable targets for the traditional externalconservation investments Valuable areas suffering frompoor governance (eg Sub-Saharan Africa Papua NewGuinea) must not be abandoned especially as manyof these areas also face the highest predicted loss of suit-able habitat for mammals in the future [41] Africa inparticular with its high mammal diversity and highpredicted future threats in addition to high levels ofcorruption presents a specific challenge to the conserva-tion community Conservation projects might usefullyfocus on conservation education and engagement oflocal people through setting up social-learning insti-tutions [42] with the aim of changing things fromwithin the society Finally we want to stress the needfor furthering the mechanistic understanding of theeffects of governance on conservation effectiveness
We thank LUOVAmdashFinnish School in Wildlife BiologyConservation and Management (JE) the EU FP7 SCALESproject (lsquoSecuring the Conservation of biodiversity acrossAdministrative Levels and spatial temporal and EcologicalScalesrsquo project no 226852 AA) and IDP Australia andJames Cook University (PV) for funding We also thankJarno Leppanen and Atte Moilanen for assistance with datahandling and software technicalities
REFERENCES1 IUCN 2008 Mammals on the IUCN Red List See
httpwwwiucnredlistorgmammals2 Hoffmann M et al 2010 The impact of conservation on
the status of the worldrsquos vertebrates Science 330 1503ndash1509 (doi101126science1194442)
3 Hoekstra J M Boucher T M Ricketts T H ampRoberts C 2005 Confronting a biome crisis globaldisparities of habitat loss and protection Ecol Lett 823ndash29 (doi101111j1461-0248200400686x)
4 Myers N Mittermeier R A Mittermeier C G
da Fonseca G A B amp Kent J 2000 Biodiversity hot-spots for conservation priorities Nature 403 853ndash858(doi10103835002501)
5 Brooks T M Mittermeier R A da Fonseca G A BGerlach J Hoffmann M Lamoreux J F Mitterme-
ier C G Pilgrim J D amp Rodrigues A S L 2006Global biodiversity conservation priorities Science 31358ndash61 (doi101126science1127609)
6 Margules C R amp Pressey R L 2000 Systematic con-
servation planning Nature 405 243ndash253 (doi10103835012251)
7 Balmford A Gaston K J Rodrigues A S L amp James A2000 Integrating costs of conservation into internationalpriority setting Conserv Biol 14 597ndash605 (doi101046
j1523-1739200000000-i2x)8 Ceballos G Ehrlich P R Soberon J Salazar I amp
Fay J P 2005 Global mammal conservation whatmust we manage Science 309 603ndash607 (doi101126science1114015)
9 Cardillo M Mace G M Gittleman J L amp Purvis A2006 Latent extinction risk and the future battlegroundsof mammal conservation Proc Natl Acad Sci USA 1034157ndash4161 (doi101073pnas0510541103)
10 Carwardine J Wilson K A Ceballos G Ehrlich P R
Naidoo R Iwamura T Hajkowicz S A amp PossinghamH P 2008 Cost-effective priorities for global mammal con-servation Proc Natl Acad Sci USA 105 11 446ndash11 450(doi101073pnas0707157105)
11 Arponen A Cabeza M Eklund J Kujala H ampLehtomaki J 2010 Costs of integrating economics and
Governance in conservation planning J Eklund et al 2669
conservation planning Conserv Biol 24 1198ndash1204(doi101111j1523-1739201001539x)
12 Balmford A Gaston K J Blyth S James A amp Kapos
V 2003 Global variation in terrestrial conservation costsconservation benefits and unmet conservation needsProc Natl Acad Sci USA 100 1046ndash1050 (doi101073pnas0236945100)
13 Eklund J 2009 Socio-political and economic factors as
constraints for global conservation priorities MScthesis University of Helsinki Helsinki Finland
14 McBride M F Wilson K A Bode M amp PossinghamH P 2007 Incorporating the effects of socioeconomic
uncertainty into priority setting for conservation invest-ment Conserv Biol 21 1463ndash1474 (doi101111j1523-1739200700832x)
15 Smith R J Muir R D J Walpole M J Balmford A ampLeader-Williams N 2003 Governance and the loss of
biodiversity Nature 426 67ndash70 (doi101038nature02025)
16 Leverington F Hockings M amp Costa K L 2008Management effectiveness evaluation in protectedareas report for the project lsquoGlobal study into manage-
ment effectiveness evaluation of protected areasrsquoAustralia The University of Queensland GattonIUCN WCPA TNC WWF
17 Wright S J Sanchez-Azofeifa G A Portillo-QuinteroC amp Davies D 2007 Poverty and corruption compromise
tropical forest reserves Ecol Appl 17 1259ndash1266(doi10189006-13301)
18 Wilson K A Evans M C Di Marco M GreenD C Boitani L Possingham H P Chiozza F amp
Rondinini C 2011 Prioritizing conservation investmentsfor mammal species globally Phil Trans R Soc B 3662670ndash2680 (doi101098rstb20110108)
19 Smith R J amp Walpole M J 2005 Should conservation-ists pay more attention to corruption Oryx 39 251ndash256
(doi101017S0030605305000608)20 Ferraro P 2005 Corruption and conservation the
need for empirical analyses A response to Smith ampWalpole Oryx 39 1ndash3 (doi101017S003060530500075X)
21 Ceballos G amp Ehrlich P R 2006 Global mammal dis-tributions biodiversity hotspots and conservation ProcNatl Acad Sci USA 103 19 374ndash19 379 (doi101073pnas0609334103)
22 Bode M Wilson K A Brooks T M Turner W R
Mittermeier R A McBride M F Underwood E Camp Possingham H P 2008 Cost-effective global conser-vation spending is robust to taxonomic group ProcNatl Acad Sci USA 105 6498ndash6501 (doi101073
pnas0710705105)23 Rondinini C et al 2011 Global habitat suitability
models of terrestrial mammals Phil Trans R Soc B366 2633ndash2641 (doi101098rstb20110113)
24 Lee T M amp Jetz W 2008 Future battlegrounds for con-
servation under global change Proc R Soc B 2751261ndash1270 (doi101098rspb20071732)
25 Bruner A G Gullison R E amp Balmford A 2004Financial costs and shortfalls of managing and expandingprotected-area systems in developing countries Bio-science 54 1119ndash1126 (doi1016410006-3568(2004)054[1119FCASOM]20CO2)
Phil Trans R Soc B (2011)
26 World Bank 2009 World Development Report 2009reshaping economic geography Washington DC TheWorld Bank
27 Kaufmann D Kraay A amp Mastruzzi M 2008Governance matters VII aggregate and individual gov-ernance indicators 1996ndash2007 World Bank PolicyResearch Working Paper no 4654 Washington DCThe World Bank
28 OrsquoConnor C Marvier M amp Kareiva P 2003 Biologi-cal vs social economic and political priority-setting inconservation Ecol Lett 6 706ndash711 (doi101046j1461-0248200300499x)
29 Schudel C J W 2008 Corruption and bilateral aid adyadic approach J Confl Resolution 52 507ndash526(doi1011770022002708316646)
30 Moilanen A Franco A M A Early R I Fox RWintle B amp Thomas C D 2005 Prioritizing mul-
tiple-use landscapes for conservation methods for largemulti-species planning problems Proc R Soc B 2721885ndash1891 (doi101098rspb20053164)
31 Moilanen A Kujala H amp Leathwick J R 2009 TheZONATION framework and software for conservation
prioritization In Spatial conservation prioritization quanti-tative methods and computational tools (eds A MoilanenK H Wilson amp H P Possingham) pp 196ndash210Oxford UK Oxford University Press
32 Sutherland W J et al 2009 One hundred questions
of importance to the conservation of global biologicaldiversity Conserv Biol 23 557ndash567 (doi101111j1523-1739200901212x)
33 Burnside C amp Dollar D 2004 Aid policies and
growth revisiting the evidence World Bank PolicyResearch Working Paper no 3251 The World Bank(See httpinfoworldbankorggovernancewgipdfGovernanceMattersVIIpdf)
34 Burnside C amp Dollar D 2000 Aid policies and
growth Am Econ Rev 90 847ndash86835 Svensson J 1999 Aid growth and democracy Econ
Polit 11 275ndash297 (doi1011111468-034300062)36 Easterly W 2003 Can foreign aid buy growth J Econ
Perspect 17 23ndash48 (doi101257089533003769204344)
37 Easterly W Levine R amp Roodman D 2000 New data newdoubts a comment on Burnside and Dollarrsquos lsquoaid policiesand growthrsquo NBER Working Paper no 9846 CambridgeMA USA National Bureau of Economic Research
38 Dijkstra A G 2002 The effectiveness of policy condi-
tionality eight country experiences Dev Change 33307ndash334 (doi1011111467-766000256)
39 Pronk J P 2001 Aid as a catalyst Dev Change 32611ndash629 (doi1011111467-766000219)
40 Smith R J Adams W M amp Leader-Williams N2010 Another entangled bank making conservationtrade-offs more explicit In Trade-offs in conservation decid-ing what to save (eds N Leader-Williams W M Adams ampR J Smith) pp 365ndash376 Oxford UK Blackwell
Publishing41 Visconti P et al 2011 Future hotspots of terrestrial
mammal loss Phil Trans R Soc B 366 2693ndash2702(doi101098rstb20110105)
42 Smith R J Verissimo D Leader-Williams N
Cowling R M amp Knight A T 2009 Let the localslead Nature 462 280ndash281 (doi101038462280a)
2662 J Eklund et al Governance in conservation planning
governance indicators corresponding to poor conserva-tion outcomes For example the numbers of AfricanElephants and Black Rhinos could be explained by cor-responding national values of a corruption indicator[15] and additional correlative relationships supportingthis fact have been found for the Protected Area Manage-ment Effectiveness Index and the Human DevelopmentIndex [16] and tropical protected area effectiveness andcorruption levels [17]
Many countries with high species richness and ende-mism could offer low costs for conservation but alsosuffer from inefficient governance political instabilityand higher levels of corruption [13] Thus while thebenefit-to-cost ratio of conservation may be apparentlygreater in developing regions of the world because oftheir lower costs for land acquisition and managementit is often exactly in these countries that the lack of goodgovernance impeding effective conservation is most acute
To date governance has rarely been accounted for inconservation planning approaches (but see [14] and[18]) However governance should not be disregardedeven though we lack decent models on how corruptionimpacts on conservation success and the relationshipbetween the two still is rather unexplored [1920] Theproblem is the lack of empirical data to explore thisrelationship which could then be used in quantitativeprioritizations either by penalizing the effectiveness ofconservation actions or by increasing the costs for carry-ing them out Despite the lackof quantitative measures toaccount for this socio-political dimension many stillacknowledge the importance of it [8102122]
The aim of this study is to compare mammal conser-vation priorities in relation to governance and economicindicators The availability of recently completed habitatsuitability models for terrestrial mammals [23] allows forthe exploration of this on a global scale but with fine res-olution data The global focus allows us to explore the fullvariation in costs for conservation and governance Weapplied a systematic conservation planning approachaimed at prioritizing important mammal conservationregions while accounting for mammal diversity onlymammal diversity conditional to costs mammal diversitypenalized by governance and various combinations ofthese Here we assume that corruption has a negativeimpact on conservation effectiveness but see sect4 foralternative hypotheses Our study allows the explorationof trade-offs between these factors and it also generatesbalanced solutions that consider biodiversity togetherwith economical costs and quality of governance Butfirst and foremost it contributes to the debate on theimportance of considering governance issues whenaiming at effective conservation planning
2 MATERIAL AND METHODS(a) Mammal species distribution data
Distribution data for the worldrsquos terrestrial mammalscome from habitat suitability models [23] This highresolution dataset contains the modelled distributionsof 5086 mammal species and is based on the globalmammal assessment led by the International Unionfor Conservation of Nature [1] The data were usedat a resolution of 018 and this resulted in 3600 1800 grid cells
Phil Trans R Soc B (2011)
(b) Cost data
Unlike Bode et al [22] and Wilson et al [18] we chosenot to use the cost model derived in Balmford et al[12] to estimate conservation costs at national levelbecause it reflects differences in the types of conserva-tion projects that have been so far funded in differentnationsmdashwealthy nations engaging in more costly con-servation actions (restoration etc) than the poor onesIndeed it results in a variation of seven orders ofmagnitude in costs between countries Instead as inother prioritization approaches [24] we use a moregeneral indicator of cost gross domestic product(GDP) per capita which has a variation of ca threeorders of magnitude We used the nominal GDP percapita instead of GDP at Purchasing Power Paritybecause global conservation prioritizations are likelyto be relevant for international non-governmentalorganizations or donor investments from industrializedcountries [25] and thus investments must be madeusing market exchange rates Economic and populationdatawere obtained from the World Development Report2009 [26] and used to calculate GDP (nominal) percapita This information was available for 182 countries
(c) Governance data
The most comprehensive and publicly available measureof governance is the Worldwide Governance Indicators(WGI) project [27] which incorporates many of theother available assessments on governance (InternationalCountry Risk Guide Freedom House Country Policyand Institutional Assessment and most of the sourcesalso used by Transparency International in formingtheir composite indicator) These data are available fora larger set of countries and territories than individualindexes used previously in conservation studies (eg[15]) The WGI-dataset includes data on six dimensionsof governance (voice and accountability political stab-ility and absence of violenceterrorism governmenteffectiveness regulatory quality rule of law and controlof corruption) for 212 countries and territories over theperiod 1996ndash2007 These aggregated indicators arebased on several hundred individual variables quantify-ing perceptions of governance drawn from separatedata sources constructed by different non-governmentalorganizations privatendashpublic agencies and individuals(such as Afrobarometro World Economic ForumGallup World Poll and Reporters without Borders)The aggregated indicators are weighted averages of theunderlying data The dataset has been used in some con-servation studies [2428] showing a strong positivecorrelation between national governance quality scoresand GDP per capita implying that many developingcountries suffer from poor governance All six govern-ance factors are strongly correlated [2428] We choseto use a single factor control of corruption as corruptionhas been shown to be related to conservation out-comes [15] and also to influence the effectiveness ofdevelopment aid [29]
(d) Prioritization with ZONATION
Global mammal priorities were identified with the con-servation planning software ZONATION [3031] Theruns were performed with ZONATION 3 development
Governance in conservation planning J Eklund et al 2663
version which is to be publicly released in 2011ZONATION produces a hierarchical prioritization ofthe landscape based on the biological value of sitesaccounting for complementarity The algorithm pro-ceeds by removing the least valuable cell from thelandscape minimizing marginal loss of conservationvalue
We used a variant of ZONATION (Basic core-areaZONATION) that encourages the representation of allspecies The local biodiversity value of a cell is basedon the species that has the highest proportion of its distri-bution remaining in the specific cell In other words thealgorithm removes first cells with species that have widedistributions and aims at retaining equal amounts ofhabitat for all species When a cost layer (in this studyconsisting of GDP andor corruption scoresmdashseebelow) is used cell removal is based on local biodiversityvalue divided by cell cost The Core-Area ZONATION
resembles the lsquogain metricrsquo of Wilson et al [18] in thata speciesrsquo distribution in a cell is valued relative to itstotal distribution but with two main differences (i) ascells are progressively removed the importance of theoccurrences of initially widely distributed speciesincreases and (ii) it produces a continuous ranking ofthe whole landscape instead of using fixed targets forspecies representation or constraints for resource use
Countries lacking the socio-political and economicdata were masked out of the analysis resulting in179 countries used in our analyses (see electronic sup-plementary material table S1 for the list of countries)Most of the excluded countries were small and unlikelyto influence the general patterns in the results but theabsence of countries such as Afghanistan Iraq andSomalia should be noted when interpreting the resultsSpecies endemic to these countries were thus notincluded in the analysis which meant having 5016species in our results instead of the 5086 in the fulldataset
Data are not available for linking governance scores toeffectiveness of mammal conservation or to realizedcosts via empirically derived functions In the absenceof such models we chose to incorporate governancescores in our objective function as increased costsbased on the assumption that in countries where thelevel of corruption is high only part of the resources willend up being used for the intended purpose We exploredhow relative differences in cost and governance variablesinfluence global conservation priorities We re-scaledboth variables to vary between 0 and 100 Eight differentconservation scenarios were produced one by lettingonly the biodiversity data drive the selection (referredto as the Biodiversity-only scenario technically corre-sponding to cost layer values being equal everywhere)and seven scenarios by weighting and combining differ-ently GDP and corruption data into a cost layer Weconsider two extreme scenarios (Economic cost scenarioand Governance scenario) by giving the maximumweight of 1 to one of the variables and the minimumweight of 0 to the other The equal weighting of econ-omic costs and governance was also considered (giving05 weights to both) and various weightings betweenthese values (01 025 075 09) always summing upto one (eg weight of 01 for governance weight of 09for economic cost) A final cost index was calculated as
Phil Trans R Soc B (2011)
a combination of the two by a simple additive approach
subject to Ci frac14 ECi wEC thornGi wG
wEC thornWG frac14 1
where Ci is the total cost considered for the grid cell i ECi
is the economic cost class of cell i (based on GDP percapita) Gi is the governance cost class and wEC andwG are weights given to the economic cost or the govern-ance classes respectively as explained above Thesedifferent weighting schemes gave each country differentcost-corruption indexes that were used as cost layers inthe ZONATION runs
3 RESULTSA comparison of the most extreme scenarios (Biodiver-sity-only Economic cost and Governance scenarios)showed important continental differences in priorities(figure 1a and table 1 see also electronic supplementarymaterial table S1 for detailed results) Africa includedmany areas that stood out as priorities when economiccosts were considered but not when only biodiversitywas accounted for (in blue) In South America severalpriorities represented important areas for biodiversitybut higher costs combined with poor governanceprevented them from being prioritized in the other scen-arios (yellow) But variation in both costs and governancewere large in South America which showed in the pri-ority map as higher variation in the colour patternsRegions in the Northern Hemisphere and Australiastood out as important biodiversity areas with good gov-ernance (orange) but high costs prevented these regionsfrom being selected when GDP per capita was con-sidered With highest penalties to poor governancesome well-governed but expensive and partly less biodi-verse areas eg in Australia and the Boreal regiongained more emphasis (red)
If we focus on the top 10 per cent priorities in eachscenario the area that overlapped in all eight scenariosis small covering only 568 per cent of the total landarea Common priorities characterized by countriesor regions with high endemism were particularlycommon in Africa (overlap between the three extremescenarios is shown in black in figure 1a) Coincidencewas lowest between prioritizations done with the Gov-ernance versus the Economic cost scenario (black thornpurple in figure 1a) as would be expected given thecorrelation between GDP per capita and Control ofCorruption (Kendallrsquos tau 0557 p 0001) Particu-larly parts of Africa and Southeast Asia showed largerproportions of low cost areas important for biodiver-sity but which are poorly governed (green in figure 1a)
When looking further than the top 10 per cent frac-tion across all scenarios a larger number of nationsbecame important figure 1b shows summed ranksacross all scenarios illustrating areas that were importantwith higher certainty no matter how costs and govern-ance were considered (in red) and areas that were leastvaluable (in dark blue) Note that areas with intermediatesummed rank values could either denote regions moresensitive to assumptions about influence of governanceor cost (ie more variation between the differentscenarios) or areas of consistently intermediate priority
biodiversity
governance
costbiodiversity and governancebiodiversity and cost
governance and cost
biodiversity and governance and cost
(a)
summed rankvalue
high 7 99882
low 0 0003998
(b)
Figure 1 Spatial distribution of conservation priority areas selected in a complementarity analysis with different scenarios(a) Top 10 priorities from the three most extreme scenarios biodiversity only (yellow) costs only (blue) and governance
only (red) Areas of overlap between combinations of the scenarios are also shown biodiversity thorn governance (orange) bio-diversity and GDP (green) GDP and governance (purple) Areas identified as top 10 priorities across all three scenarios areshown in black (b) Sum of ranks across all eight scenarios Dark red indicates higher priorities across all scenarios dark bluelow priority across all scenarios Intermediate colours indicate either intermediate importance or variable importance
2664 J Eklund et al Governance in conservation planning
Correlation of cell ranks between different solutionswere in accordance with the results in figure 1a (elec-tronic supplementary material table S2) They werevery high between the closest scenario variants (egthe 01 weighting versus Governance scenarios is
Phil Trans R Soc B (2011)
0994 p 1215) and lowest between the Economiccost and Governance scenarios (0587 p 1215)
Each scenario aimed at maximizing a particular objec-tive which included only biodiversity or a combinationof biodiversity and costndashgovernance constraints The
Tab
le1
Fiv
eco
un
trie
sw
ith
larg
est
are
as
inth
eto
p10
frac
tion
wit
hth
ed
iffe
ren
tp
riori
tiza
tion
scen
ari
os
Are
ais
giv
enin
thou
san
ds
of
squ
are
kilom
etre
sT
he
ove
rlap
colu
mn
giv
esth
e
are
ath
atove
rlaps
bet
wee
nth
eth
ree
extr
eme
solu
tion
s(g
ove
rnan
ce
cost
b
iod
iver
sity
)w
hic
hco
rres
pon
ds
toth
eb
lack
are
as
infi
gu
re1a
bio
div
ersi
tyco
stco
st09
cost
07
5co
st05
cost
02
5co
st01
gove
rnan
ceove
rlap
Bra
zil
1504
Chin
a893
Bra
zil
1452
Bra
zil
1533
Bra
zil
1468
Au
stra
lia
1840
Au
stra
lia
2207
Au
stra
lia
2387
Bra
zil
658
US
1034
Ind
on
esia
888
Chin
a1044
Chin
a958
Au
stra
lia
1268
Bra
zil
1288
US
1392
US
1401
Chin
a515
Au
stra
lia
946
Ind
ia855
Ind
on
esia
799
Ind
on
esia
731
US
993
US
1276
Bra
zil
1157
Bra
zil
989
Ind
on
esia
484
Chin
a936
Con
go
DR
844
Mex
ico
656
Au
stra
lia
716
Ch
ina
826
Ch
ina
705
Chin
a631
Can
ad
a683
Mex
ico
312
Ind
on
esia
699
Bra
zil
669
Ind
ia578
Mex
ico
688
Ind
on
esia
661
Ind
on
esia
595
Can
ad
a579
Chin
a551
Per
u288
Governance in conservation planning J Eklund et al 2665
Phil Trans R Soc B (2011)
strongest penalties for governance resulted in more costlysolutions measured as the mean GDP per capita ofselected units but in the scenarios with intermediateweightings for cost and governance the overall cost ofthe solution was low (figure 2a) and similar to the costof the solution when using biodiversity only Solutionsbased on scenarios where GDP per capita has a high con-tribution resulted in the largest overall corruption levelwithin the top priorities These levels of corruptionwere much higher than the average corruption levelacross all nations (figure 2b) Those scenarios accountingfor governance in the planning achieved substantialreductions in overall corruption levels In turn the inter-mediate Economic costndashGovernance scenarios (05weighting) had a cost distribution similar to the biodiver-sity-only solution and provided an improvement incorruption levels compared with the biodiversity-onlysolution without incurring much increase in GDPper capita values
There were small differences in the protection levels ofspecies across scenarios (figure 3ab) In terms of averageproportion of the distribution protected the GDP percapita-constrained solution achieved smallest overall cov-erage of species distributions while the most extremegovernance penalty resulted in intermediate levels Theintermediate Economic costndashGovernance scenarios per-formed very similarly to the biodiversity-only solutionNonetheless all solutions achieved coverage of all specieswhen 5 per cent or more of the worldrsquo terrestrial surfacewas protected (figure 3b) The Biodiversity-only scenarioretained species furthest as the fraction of protectedarea decreased with most other scenarios achievingvery similar results Only the GDP per capita-constrainedsolution differed notably from other schemes starting tolose species coverage at larger fractions of area protected(figure 3b)
4 DISCUSSIONWe have shown that there are important trade-offsbetween governance and cost and that taking govern-ance into account in the planning of conservationpriorities albeit simplistically can make a large differ-ence Interestingly we have shown that these trade-offsvary in space some continents being more affectedthan others Despite this some regions are identifiedas priorities with any of the scenarios and thus weurge conservation efforts in these areas We do not rec-ommend neglecting poorly governed nations andwant to stress that different conservation approachesare needed in different regions
Our intermediate Economic costndashGovernancescenarios seem to provide desirable levels of govern-ance with only a minor increase in cost and are thussolutions that should be preferred It is noteworthythat much more of the area important for biodiversityoverlaps with the governance-based priorities thanwith the cost-based (more orange than green infigure 1a) Instead cost-based priorities includemuch area that would not be prioritized in any otherscenario This illustrates the risks of focusing largelyon economic costs [11] with funds being divertedfrom the most important biodiversity regions to areaswhere they might end up in the wrong hands or
GDP per capita
0 20 40 60 80 100
corruption0 20 40 60 80 100
econ
gov
biodiv
econ
(a)
(b)
econ 09ndashgov 01
econ 075ndashgov 025
econ 05ndashgov 05
econ 025ndashgov 075
econ 01ndashgov 09
econ 09ndashgov 01
econ 075ndashgov 025
econ 05ndashgov 05
econ 025ndashgov 075
econ 01ndashgov 09
gov
biodiv
115 99 87920 068 40 020 59 973 79 926
260 181 101 022 ndash057 ndash137
Figure 2 Distribution of GDP values (a) and governance scores (b) for all cells in top 10 fractions achieved with each of theeight scenarios Mean and 95th percentiles across all nations in the dataset are shown as reference (solid line and dashed line
respectively) The units on x-axes are given both as the scaled values used in our calculations (below) and as the original GDPand Control of Corruption indicator values (above the panels)
2666 J Eklund et al Governance in conservation planning
anyhow used ineffectively Incorporating costs into theprioritization process can be misleading if other socio-political constraints are not considered as well
Important areas identified by other mammalconservation prioritization approaches also maintainhigh priority in our analysis (eg [810] see also simi-larities with Wilson et al [18]) Our highest priorityregions contain areas that despite poor governanceare necessary to achieve global mammal conservationbecause of their high levels of endemism eg theAndes Mexico Western Ghats Madagascar PapuaNew Guinea Indonesia Philippines Sri Lanka etcHotspot regions such as Japan California and theMediterranean basin are high priorities for biodiversityand also well-governed but high costs would preventthem from being prioritized in a cost-based analysisThe top 10 per cent of the priorities identified by theBiodiversity-only Economic cost and Governance scen-arios overlapped by 40 42 and 32 per cent respectivelywith the Biodiversity Hotspots [4]
We chose to incorporate governance in our prioritiza-tion as an additional cost This is based on the
Phil Trans R Soc B (2011)
perception that the apparent low costs of conservationin corrupt countries are not real only a fraction of theinvested conservation funds will be spent effectively onthe intended purpose Thus to achieve the proposedgoals additional investments should be made resultingin increased conservation costs This is likely to be truebut not the whole truth In poorly governed countrieseven the conservation actions that end up beingimplemented may not be effective owing to poachingand other illegal activities and corruption can act asan incentive for overexploitation of resources So nomatter how much economic resource is spent the out-comes may remain unsatisfactory An alternative (buttechnically largely equivalent) conservation prioritiza-tion approach would instead penalize the conservationoutcomes based on quality of governance (ie assumethat only a fraction of the biodiversity features can beprotected effectively if the level of corruption is high)Wilson et al [18] used a factor for lsquoinvestment successrsquoderived from data on government ineffectiveness Butno matter which approach is chosen empirical data tolink effectiveness to such indicators (added cost or
landscape protected ()
no s
peci
es u
nrep
rese
nted
0
1000
2000
3000
4000
5000
0
1000
2000
3000
4000
5000
012345
landscape protected ()
frac
tion
of s
peci
es d
istr
ibut
ions
rep
rese
nted
0
02
04
06
08
10(a)
(b)
020406080
05 04 03 02 01 0
100
065
070
075
080
085
09029 27 25 23 21
Figure 3 Species representation in all eight scenarios (a) Mean proportion of speciesrsquo distributions remaining protected atdecreasing fractions of area protected (b) number of species entirely unprotected at decreasing fractions of area protectedNote that the insets show a magnification corresponding to a particular range of percentage of landscape protected between
20ndash30 for (a) and 0ndash05 in (b) (see the range of values on top of the inset) Dashed line biodiversity only long dashedline governance only solid line economic 01ndashgovernance 09 dotted line economic 025ndashgovernance 075 solid line withfilled circles economic 05ndashgovernance 05 solid line with open circles economic 075ndashgovernance 025 solid line withfilled inverted triangles economic 09ndashgovernance 01 solid line with open inverted triangles economic cost only
Governance in conservation planning J Eklund et al 2667
effective conservation outcomes) are still required toachieve more reliable results
On the other hand our results showed dramaticimpact of corruption penalties to spatial priorities con-trasting with the findings of Wilson et al [18] Thesedifferences can arise for at least two reasons (i) alarger variation in cost data used by Wilson et al [18]resulted in stronger influence of cost with respect toother factors and (ii) the temporal variability in in-vestment effectiveness considered by Wilson et alrsquosdynamic approach where investments made in periodsof government ineffectiveness were considered to failand others to succeed despite following periods ofineffectiveness
Phil Trans R Soc B (2011)
Corruption and its influence on effectiveness of con-servation programmes has been identified as one ofthe lsquoOne hundred questions of importance to theconservation of global biological diversityrsquo [32] If theassumptions about the positive relationship betweengood governance and conservation effectiveness holdlow cost solutions will not necessarily lead to effectiveuse of resources many of the countries that offer lowcost investments for conservation actions are alsothe ones that suffer most from corruption Yet littleeffort has gone to date into considering governance inevaluating global conservation priorities
A better understanding of the relationship betweengovernance and conservation outputs and governance
2668 J Eklund et al Governance in conservation planning
and effective conservation costs will eventually allow fora better parametrization of the conservation approachpresented here Nevertheless in the meantime lessonscan perhaps be learnt from the field of aid effectivenesswhere the discussion on how to account for governancefactors has received major attention in the recent pastStudies have shown that aid will only lead to develop-ment (which should be considered the main aim ofdevelopment assistance) in better governed countries[33ndash35] That is aid effectiveness seems to be con-ditional on the quality of institutions and policiesBetter governed countries can use aid money moreeffectively and therefore achieve expected developmentoutcomes These findings still debated [3637] haveled to questions of selectivity versus conditionality[3839] should aid be given based on certain policyconditions (ex ante) or should it only be given towhere it is likely to succeed (ex post) These ideas maynot apply directly to conservation but there are clearanalogies should conservation investments be directedto regions with favourable conservation conditions orshould biodiversity needs drive conservation prioritiesbut effectiveness be enhanced in problematic regionsin different ways
Corruption can have complex both positive andnegative effects on biodiversity and these effects arelikely to be different at different scales Possible positiveeffects could be that a corrupt government is less likely toinvest in infrastructure development in rural areas thatwould affect biodiversity negatively [20] Corruptcountries experience inefficient economies and are lesslikely to attract foreign direct investments by multi-national corporations and industries to exploit theirnatural resources [20] But wealthy nations do tend todisplace the exploitative industries to poor countrieswhich might mean that the poor but less corruptcountries could face higher threats from industrialactivities On the other hand slow economic growth islikely to affect local peoplesrsquo livelihoods negatively andthis might again increase overexploitation on a localscale We have ignored the potential positive effects ofpoor governance in this study but our conservationplanning framework could account both for positiveand negative effects once the relationship betweengovernance and conservation effectiveness is betterunderstood
To conclude we do not suggest that allocation ofconservation resources should follow the priority mapsproduced in our analyses although they may givesome indication of regions that may deserve further con-siderations before large conservation investmentsare made We warn about the use of economic costs inconservation prioritization exercises when this isdetached from other socio-economic factors as thismay result in resources being poured into either regionsless important for biodiversity or ineffective projectsRather than neglecting poorly governed nationsour find-ings stress the need for developing and applying differentconservation approaches in different regions [40] Weneed to find less costly ways of working in the expensiveand well-governed regions (eg North America Austra-lia) perhaps building on volunteer-based conservationprogrammes or comprehensive land use planningapproaches Low cost and well-governed regions may
Phil Trans R Soc B (2011)
be most suitable targets for the traditional externalconservation investments Valuable areas suffering frompoor governance (eg Sub-Saharan Africa Papua NewGuinea) must not be abandoned especially as manyof these areas also face the highest predicted loss of suit-able habitat for mammals in the future [41] Africa inparticular with its high mammal diversity and highpredicted future threats in addition to high levels ofcorruption presents a specific challenge to the conserva-tion community Conservation projects might usefullyfocus on conservation education and engagement oflocal people through setting up social-learning insti-tutions [42] with the aim of changing things fromwithin the society Finally we want to stress the needfor furthering the mechanistic understanding of theeffects of governance on conservation effectiveness
We thank LUOVAmdashFinnish School in Wildlife BiologyConservation and Management (JE) the EU FP7 SCALESproject (lsquoSecuring the Conservation of biodiversity acrossAdministrative Levels and spatial temporal and EcologicalScalesrsquo project no 226852 AA) and IDP Australia andJames Cook University (PV) for funding We also thankJarno Leppanen and Atte Moilanen for assistance with datahandling and software technicalities
REFERENCES1 IUCN 2008 Mammals on the IUCN Red List See
httpwwwiucnredlistorgmammals2 Hoffmann M et al 2010 The impact of conservation on
the status of the worldrsquos vertebrates Science 330 1503ndash1509 (doi101126science1194442)
3 Hoekstra J M Boucher T M Ricketts T H ampRoberts C 2005 Confronting a biome crisis globaldisparities of habitat loss and protection Ecol Lett 823ndash29 (doi101111j1461-0248200400686x)
4 Myers N Mittermeier R A Mittermeier C G
da Fonseca G A B amp Kent J 2000 Biodiversity hot-spots for conservation priorities Nature 403 853ndash858(doi10103835002501)
5 Brooks T M Mittermeier R A da Fonseca G A BGerlach J Hoffmann M Lamoreux J F Mitterme-
ier C G Pilgrim J D amp Rodrigues A S L 2006Global biodiversity conservation priorities Science 31358ndash61 (doi101126science1127609)
6 Margules C R amp Pressey R L 2000 Systematic con-
servation planning Nature 405 243ndash253 (doi10103835012251)
7 Balmford A Gaston K J Rodrigues A S L amp James A2000 Integrating costs of conservation into internationalpriority setting Conserv Biol 14 597ndash605 (doi101046
j1523-1739200000000-i2x)8 Ceballos G Ehrlich P R Soberon J Salazar I amp
Fay J P 2005 Global mammal conservation whatmust we manage Science 309 603ndash607 (doi101126science1114015)
9 Cardillo M Mace G M Gittleman J L amp Purvis A2006 Latent extinction risk and the future battlegroundsof mammal conservation Proc Natl Acad Sci USA 1034157ndash4161 (doi101073pnas0510541103)
10 Carwardine J Wilson K A Ceballos G Ehrlich P R
Naidoo R Iwamura T Hajkowicz S A amp PossinghamH P 2008 Cost-effective priorities for global mammal con-servation Proc Natl Acad Sci USA 105 11 446ndash11 450(doi101073pnas0707157105)
11 Arponen A Cabeza M Eklund J Kujala H ampLehtomaki J 2010 Costs of integrating economics and
Governance in conservation planning J Eklund et al 2669
conservation planning Conserv Biol 24 1198ndash1204(doi101111j1523-1739201001539x)
12 Balmford A Gaston K J Blyth S James A amp Kapos
V 2003 Global variation in terrestrial conservation costsconservation benefits and unmet conservation needsProc Natl Acad Sci USA 100 1046ndash1050 (doi101073pnas0236945100)
13 Eklund J 2009 Socio-political and economic factors as
constraints for global conservation priorities MScthesis University of Helsinki Helsinki Finland
14 McBride M F Wilson K A Bode M amp PossinghamH P 2007 Incorporating the effects of socioeconomic
uncertainty into priority setting for conservation invest-ment Conserv Biol 21 1463ndash1474 (doi101111j1523-1739200700832x)
15 Smith R J Muir R D J Walpole M J Balmford A ampLeader-Williams N 2003 Governance and the loss of
biodiversity Nature 426 67ndash70 (doi101038nature02025)
16 Leverington F Hockings M amp Costa K L 2008Management effectiveness evaluation in protectedareas report for the project lsquoGlobal study into manage-
ment effectiveness evaluation of protected areasrsquoAustralia The University of Queensland GattonIUCN WCPA TNC WWF
17 Wright S J Sanchez-Azofeifa G A Portillo-QuinteroC amp Davies D 2007 Poverty and corruption compromise
tropical forest reserves Ecol Appl 17 1259ndash1266(doi10189006-13301)
18 Wilson K A Evans M C Di Marco M GreenD C Boitani L Possingham H P Chiozza F amp
Rondinini C 2011 Prioritizing conservation investmentsfor mammal species globally Phil Trans R Soc B 3662670ndash2680 (doi101098rstb20110108)
19 Smith R J amp Walpole M J 2005 Should conservation-ists pay more attention to corruption Oryx 39 251ndash256
(doi101017S0030605305000608)20 Ferraro P 2005 Corruption and conservation the
need for empirical analyses A response to Smith ampWalpole Oryx 39 1ndash3 (doi101017S003060530500075X)
21 Ceballos G amp Ehrlich P R 2006 Global mammal dis-tributions biodiversity hotspots and conservation ProcNatl Acad Sci USA 103 19 374ndash19 379 (doi101073pnas0609334103)
22 Bode M Wilson K A Brooks T M Turner W R
Mittermeier R A McBride M F Underwood E Camp Possingham H P 2008 Cost-effective global conser-vation spending is robust to taxonomic group ProcNatl Acad Sci USA 105 6498ndash6501 (doi101073
pnas0710705105)23 Rondinini C et al 2011 Global habitat suitability
models of terrestrial mammals Phil Trans R Soc B366 2633ndash2641 (doi101098rstb20110113)
24 Lee T M amp Jetz W 2008 Future battlegrounds for con-
servation under global change Proc R Soc B 2751261ndash1270 (doi101098rspb20071732)
25 Bruner A G Gullison R E amp Balmford A 2004Financial costs and shortfalls of managing and expandingprotected-area systems in developing countries Bio-science 54 1119ndash1126 (doi1016410006-3568(2004)054[1119FCASOM]20CO2)
Phil Trans R Soc B (2011)
26 World Bank 2009 World Development Report 2009reshaping economic geography Washington DC TheWorld Bank
27 Kaufmann D Kraay A amp Mastruzzi M 2008Governance matters VII aggregate and individual gov-ernance indicators 1996ndash2007 World Bank PolicyResearch Working Paper no 4654 Washington DCThe World Bank
28 OrsquoConnor C Marvier M amp Kareiva P 2003 Biologi-cal vs social economic and political priority-setting inconservation Ecol Lett 6 706ndash711 (doi101046j1461-0248200300499x)
29 Schudel C J W 2008 Corruption and bilateral aid adyadic approach J Confl Resolution 52 507ndash526(doi1011770022002708316646)
30 Moilanen A Franco A M A Early R I Fox RWintle B amp Thomas C D 2005 Prioritizing mul-
tiple-use landscapes for conservation methods for largemulti-species planning problems Proc R Soc B 2721885ndash1891 (doi101098rspb20053164)
31 Moilanen A Kujala H amp Leathwick J R 2009 TheZONATION framework and software for conservation
prioritization In Spatial conservation prioritization quanti-tative methods and computational tools (eds A MoilanenK H Wilson amp H P Possingham) pp 196ndash210Oxford UK Oxford University Press
32 Sutherland W J et al 2009 One hundred questions
of importance to the conservation of global biologicaldiversity Conserv Biol 23 557ndash567 (doi101111j1523-1739200901212x)
33 Burnside C amp Dollar D 2004 Aid policies and
growth revisiting the evidence World Bank PolicyResearch Working Paper no 3251 The World Bank(See httpinfoworldbankorggovernancewgipdfGovernanceMattersVIIpdf)
34 Burnside C amp Dollar D 2000 Aid policies and
growth Am Econ Rev 90 847ndash86835 Svensson J 1999 Aid growth and democracy Econ
Polit 11 275ndash297 (doi1011111468-034300062)36 Easterly W 2003 Can foreign aid buy growth J Econ
Perspect 17 23ndash48 (doi101257089533003769204344)
37 Easterly W Levine R amp Roodman D 2000 New data newdoubts a comment on Burnside and Dollarrsquos lsquoaid policiesand growthrsquo NBER Working Paper no 9846 CambridgeMA USA National Bureau of Economic Research
38 Dijkstra A G 2002 The effectiveness of policy condi-
tionality eight country experiences Dev Change 33307ndash334 (doi1011111467-766000256)
39 Pronk J P 2001 Aid as a catalyst Dev Change 32611ndash629 (doi1011111467-766000219)
40 Smith R J Adams W M amp Leader-Williams N2010 Another entangled bank making conservationtrade-offs more explicit In Trade-offs in conservation decid-ing what to save (eds N Leader-Williams W M Adams ampR J Smith) pp 365ndash376 Oxford UK Blackwell
Publishing41 Visconti P et al 2011 Future hotspots of terrestrial
mammal loss Phil Trans R Soc B 366 2693ndash2702(doi101098rstb20110105)
42 Smith R J Verissimo D Leader-Williams N
Cowling R M amp Knight A T 2009 Let the localslead Nature 462 280ndash281 (doi101038462280a)
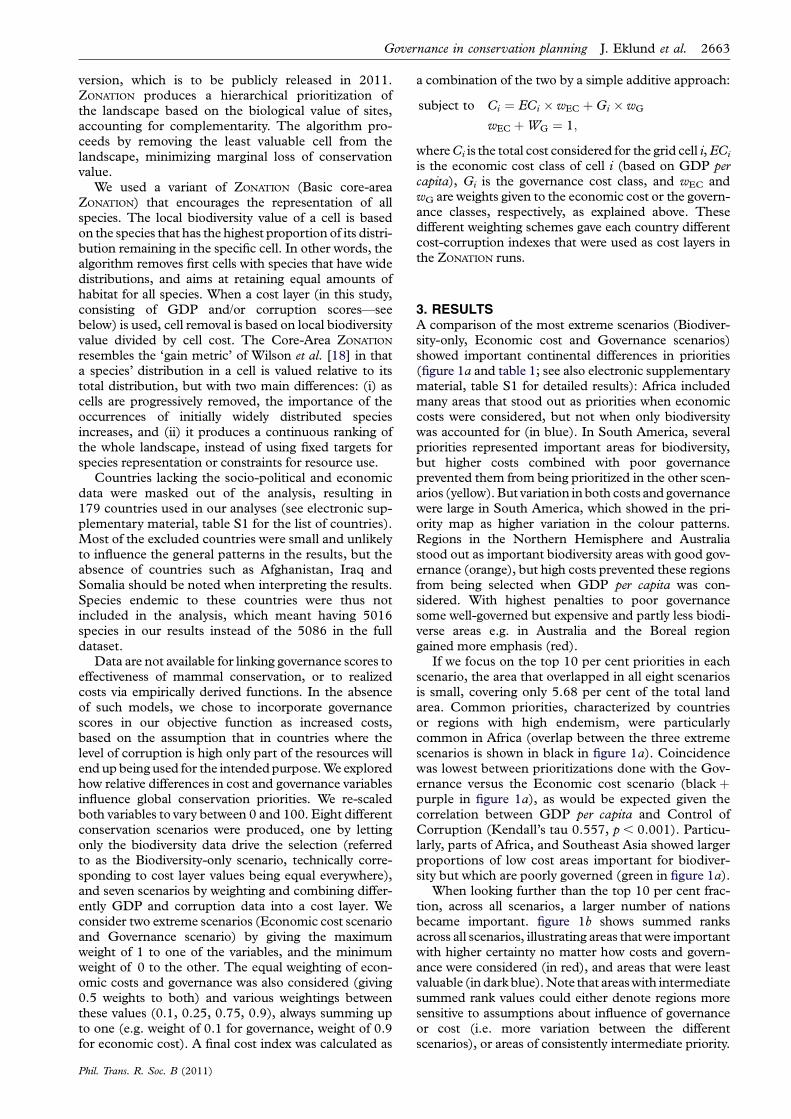
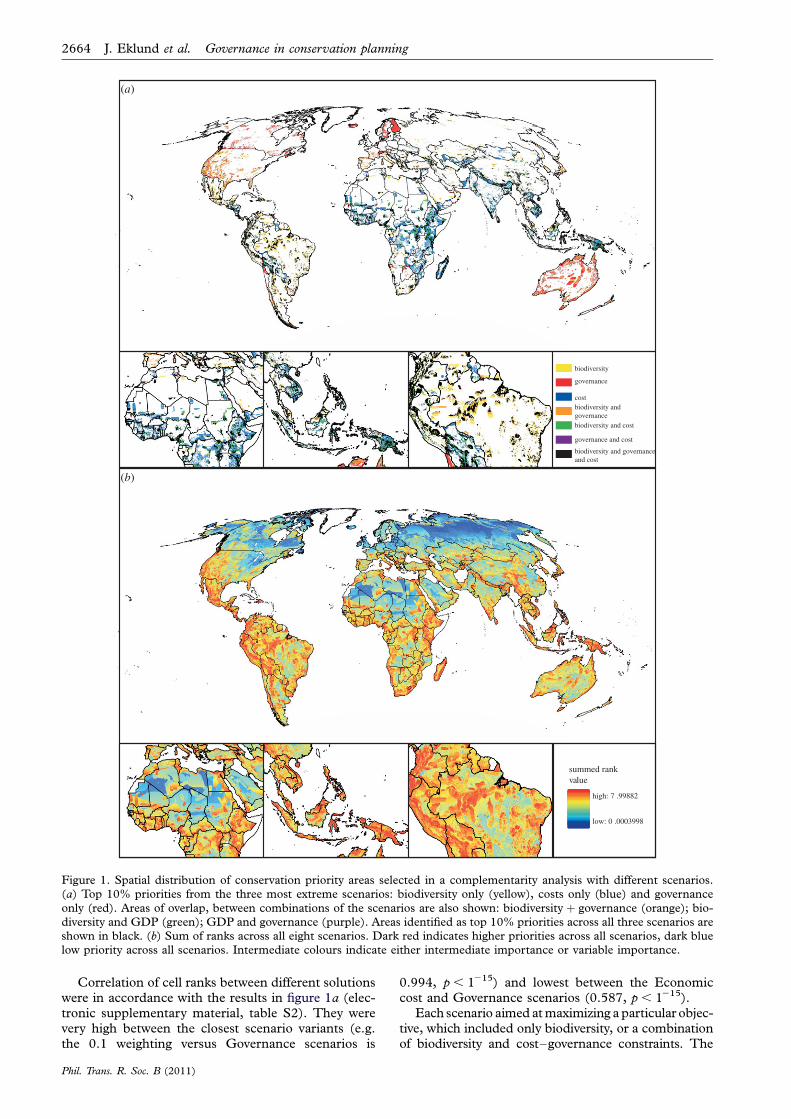
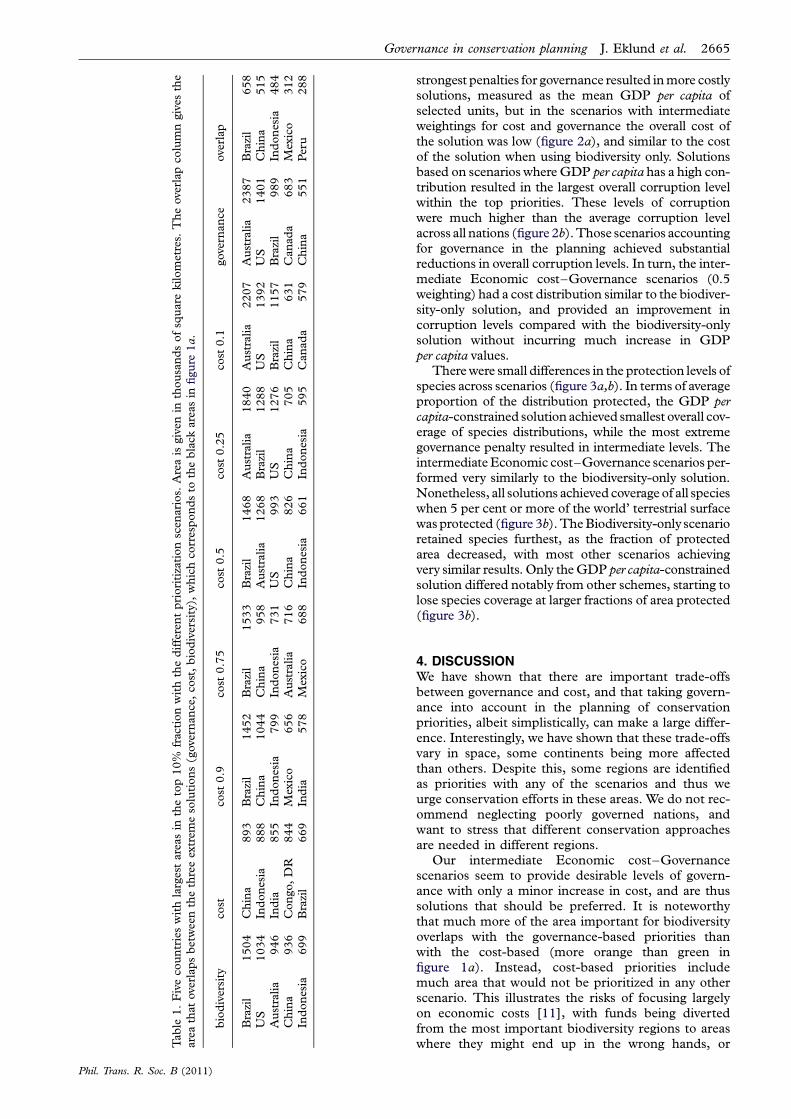
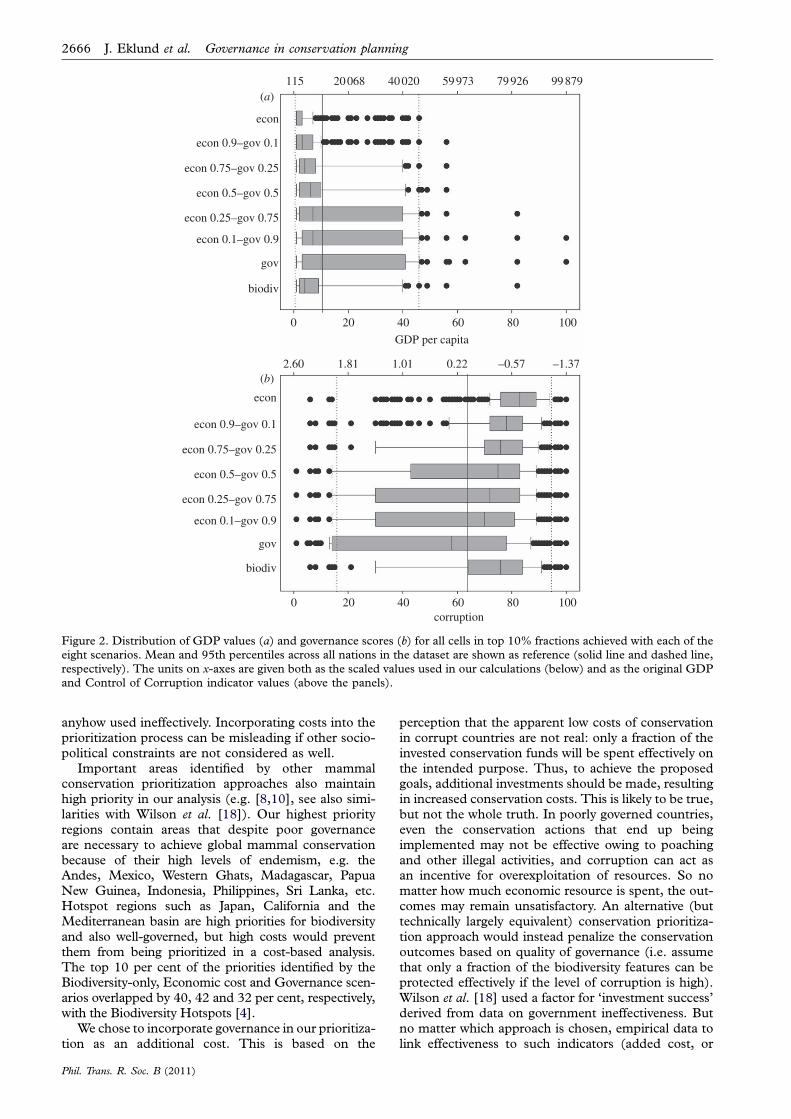

landscape protected ()
no s
peci
es u
nrep
rese
nted
0
1000
2000
3000
4000
5000
0
1000
2000
3000
4000
5000
012345
landscape protected ()
frac
tion
of s
peci
es d
istr
ibut
ions
rep
rese
nted
0
02
04
06
08
10(a)
(b)
020406080
05 04 03 02 01 0
100
065
070
075
080
085
09029 27 25 23 21
Figure 3 Species representation in all eight scenarios (a) Mean proportion of speciesrsquo distributions remaining protected atdecreasing fractions of area protected (b) number of species entirely unprotected at decreasing fractions of area protectedNote that the insets show a magnification corresponding to a particular range of percentage of landscape protected between
20ndash30 for (a) and 0ndash05 in (b) (see the range of values on top of the inset) Dashed line biodiversity only long dashedline governance only solid line economic 01ndashgovernance 09 dotted line economic 025ndashgovernance 075 solid line withfilled circles economic 05ndashgovernance 05 solid line with open circles economic 075ndashgovernance 025 solid line withfilled inverted triangles economic 09ndashgovernance 01 solid line with open inverted triangles economic cost only
Governance in conservation planning J Eklund et al 2667
effective conservation outcomes) are still required toachieve more reliable results
On the other hand our results showed dramaticimpact of corruption penalties to spatial priorities con-trasting with the findings of Wilson et al [18] Thesedifferences can arise for at least two reasons (i) alarger variation in cost data used by Wilson et al [18]resulted in stronger influence of cost with respect toother factors and (ii) the temporal variability in in-vestment effectiveness considered by Wilson et alrsquosdynamic approach where investments made in periodsof government ineffectiveness were considered to failand others to succeed despite following periods ofineffectiveness
Phil Trans R Soc B (2011)
Corruption and its influence on effectiveness of con-servation programmes has been identified as one ofthe lsquoOne hundred questions of importance to theconservation of global biological diversityrsquo [32] If theassumptions about the positive relationship betweengood governance and conservation effectiveness holdlow cost solutions will not necessarily lead to effectiveuse of resources many of the countries that offer lowcost investments for conservation actions are alsothe ones that suffer most from corruption Yet littleeffort has gone to date into considering governance inevaluating global conservation priorities
A better understanding of the relationship betweengovernance and conservation outputs and governance
2668 J Eklund et al Governance in conservation planning
and effective conservation costs will eventually allow fora better parametrization of the conservation approachpresented here Nevertheless in the meantime lessonscan perhaps be learnt from the field of aid effectivenesswhere the discussion on how to account for governancefactors has received major attention in the recent pastStudies have shown that aid will only lead to develop-ment (which should be considered the main aim ofdevelopment assistance) in better governed countries[33ndash35] That is aid effectiveness seems to be con-ditional on the quality of institutions and policiesBetter governed countries can use aid money moreeffectively and therefore achieve expected developmentoutcomes These findings still debated [3637] haveled to questions of selectivity versus conditionality[3839] should aid be given based on certain policyconditions (ex ante) or should it only be given towhere it is likely to succeed (ex post) These ideas maynot apply directly to conservation but there are clearanalogies should conservation investments be directedto regions with favourable conservation conditions orshould biodiversity needs drive conservation prioritiesbut effectiveness be enhanced in problematic regionsin different ways
Corruption can have complex both positive andnegative effects on biodiversity and these effects arelikely to be different at different scales Possible positiveeffects could be that a corrupt government is less likely toinvest in infrastructure development in rural areas thatwould affect biodiversity negatively [20] Corruptcountries experience inefficient economies and are lesslikely to attract foreign direct investments by multi-national corporations and industries to exploit theirnatural resources [20] But wealthy nations do tend todisplace the exploitative industries to poor countrieswhich might mean that the poor but less corruptcountries could face higher threats from industrialactivities On the other hand slow economic growth islikely to affect local peoplesrsquo livelihoods negatively andthis might again increase overexploitation on a localscale We have ignored the potential positive effects ofpoor governance in this study but our conservationplanning framework could account both for positiveand negative effects once the relationship betweengovernance and conservation effectiveness is betterunderstood
To conclude we do not suggest that allocation ofconservation resources should follow the priority mapsproduced in our analyses although they may givesome indication of regions that may deserve further con-siderations before large conservation investmentsare made We warn about the use of economic costs inconservation prioritization exercises when this isdetached from other socio-economic factors as thismay result in resources being poured into either regionsless important for biodiversity or ineffective projectsRather than neglecting poorly governed nationsour find-ings stress the need for developing and applying differentconservation approaches in different regions [40] Weneed to find less costly ways of working in the expensiveand well-governed regions (eg North America Austra-lia) perhaps building on volunteer-based conservationprogrammes or comprehensive land use planningapproaches Low cost and well-governed regions may
Phil Trans R Soc B (2011)
be most suitable targets for the traditional externalconservation investments Valuable areas suffering frompoor governance (eg Sub-Saharan Africa Papua NewGuinea) must not be abandoned especially as manyof these areas also face the highest predicted loss of suit-able habitat for mammals in the future [41] Africa inparticular with its high mammal diversity and highpredicted future threats in addition to high levels ofcorruption presents a specific challenge to the conserva-tion community Conservation projects might usefullyfocus on conservation education and engagement oflocal people through setting up social-learning insti-tutions [42] with the aim of changing things fromwithin the society Finally we want to stress the needfor furthering the mechanistic understanding of theeffects of governance on conservation effectiveness
We thank LUOVAmdashFinnish School in Wildlife BiologyConservation and Management (JE) the EU FP7 SCALESproject (lsquoSecuring the Conservation of biodiversity acrossAdministrative Levels and spatial temporal and EcologicalScalesrsquo project no 226852 AA) and IDP Australia andJames Cook University (PV) for funding We also thankJarno Leppanen and Atte Moilanen for assistance with datahandling and software technicalities
REFERENCES1 IUCN 2008 Mammals on the IUCN Red List See
httpwwwiucnredlistorgmammals2 Hoffmann M et al 2010 The impact of conservation on
the status of the worldrsquos vertebrates Science 330 1503ndash1509 (doi101126science1194442)
3 Hoekstra J M Boucher T M Ricketts T H ampRoberts C 2005 Confronting a biome crisis globaldisparities of habitat loss and protection Ecol Lett 823ndash29 (doi101111j1461-0248200400686x)
4 Myers N Mittermeier R A Mittermeier C G
da Fonseca G A B amp Kent J 2000 Biodiversity hot-spots for conservation priorities Nature 403 853ndash858(doi10103835002501)
5 Brooks T M Mittermeier R A da Fonseca G A BGerlach J Hoffmann M Lamoreux J F Mitterme-
ier C G Pilgrim J D amp Rodrigues A S L 2006Global biodiversity conservation priorities Science 31358ndash61 (doi101126science1127609)
6 Margules C R amp Pressey R L 2000 Systematic con-
servation planning Nature 405 243ndash253 (doi10103835012251)
7 Balmford A Gaston K J Rodrigues A S L amp James A2000 Integrating costs of conservation into internationalpriority setting Conserv Biol 14 597ndash605 (doi101046
j1523-1739200000000-i2x)8 Ceballos G Ehrlich P R Soberon J Salazar I amp
Fay J P 2005 Global mammal conservation whatmust we manage Science 309 603ndash607 (doi101126science1114015)
9 Cardillo M Mace G M Gittleman J L amp Purvis A2006 Latent extinction risk and the future battlegroundsof mammal conservation Proc Natl Acad Sci USA 1034157ndash4161 (doi101073pnas0510541103)
10 Carwardine J Wilson K A Ceballos G Ehrlich P R
Naidoo R Iwamura T Hajkowicz S A amp PossinghamH P 2008 Cost-effective priorities for global mammal con-servation Proc Natl Acad Sci USA 105 11 446ndash11 450(doi101073pnas0707157105)
11 Arponen A Cabeza M Eklund J Kujala H ampLehtomaki J 2010 Costs of integrating economics and
Governance in conservation planning J Eklund et al 2669
conservation planning Conserv Biol 24 1198ndash1204(doi101111j1523-1739201001539x)
12 Balmford A Gaston K J Blyth S James A amp Kapos
V 2003 Global variation in terrestrial conservation costsconservation benefits and unmet conservation needsProc Natl Acad Sci USA 100 1046ndash1050 (doi101073pnas0236945100)
13 Eklund J 2009 Socio-political and economic factors as
constraints for global conservation priorities MScthesis University of Helsinki Helsinki Finland
14 McBride M F Wilson K A Bode M amp PossinghamH P 2007 Incorporating the effects of socioeconomic
uncertainty into priority setting for conservation invest-ment Conserv Biol 21 1463ndash1474 (doi101111j1523-1739200700832x)
15 Smith R J Muir R D J Walpole M J Balmford A ampLeader-Williams N 2003 Governance and the loss of
biodiversity Nature 426 67ndash70 (doi101038nature02025)
16 Leverington F Hockings M amp Costa K L 2008Management effectiveness evaluation in protectedareas report for the project lsquoGlobal study into manage-
ment effectiveness evaluation of protected areasrsquoAustralia The University of Queensland GattonIUCN WCPA TNC WWF
17 Wright S J Sanchez-Azofeifa G A Portillo-QuinteroC amp Davies D 2007 Poverty and corruption compromise
tropical forest reserves Ecol Appl 17 1259ndash1266(doi10189006-13301)
18 Wilson K A Evans M C Di Marco M GreenD C Boitani L Possingham H P Chiozza F amp
Rondinini C 2011 Prioritizing conservation investmentsfor mammal species globally Phil Trans R Soc B 3662670ndash2680 (doi101098rstb20110108)
19 Smith R J amp Walpole M J 2005 Should conservation-ists pay more attention to corruption Oryx 39 251ndash256
(doi101017S0030605305000608)20 Ferraro P 2005 Corruption and conservation the
need for empirical analyses A response to Smith ampWalpole Oryx 39 1ndash3 (doi101017S003060530500075X)
21 Ceballos G amp Ehrlich P R 2006 Global mammal dis-tributions biodiversity hotspots and conservation ProcNatl Acad Sci USA 103 19 374ndash19 379 (doi101073pnas0609334103)
22 Bode M Wilson K A Brooks T M Turner W R
Mittermeier R A McBride M F Underwood E Camp Possingham H P 2008 Cost-effective global conser-vation spending is robust to taxonomic group ProcNatl Acad Sci USA 105 6498ndash6501 (doi101073
pnas0710705105)23 Rondinini C et al 2011 Global habitat suitability
models of terrestrial mammals Phil Trans R Soc B366 2633ndash2641 (doi101098rstb20110113)
24 Lee T M amp Jetz W 2008 Future battlegrounds for con-
servation under global change Proc R Soc B 2751261ndash1270 (doi101098rspb20071732)
25 Bruner A G Gullison R E amp Balmford A 2004Financial costs and shortfalls of managing and expandingprotected-area systems in developing countries Bio-science 54 1119ndash1126 (doi1016410006-3568(2004)054[1119FCASOM]20CO2)
Phil Trans R Soc B (2011)
26 World Bank 2009 World Development Report 2009reshaping economic geography Washington DC TheWorld Bank
27 Kaufmann D Kraay A amp Mastruzzi M 2008Governance matters VII aggregate and individual gov-ernance indicators 1996ndash2007 World Bank PolicyResearch Working Paper no 4654 Washington DCThe World Bank
28 OrsquoConnor C Marvier M amp Kareiva P 2003 Biologi-cal vs social economic and political priority-setting inconservation Ecol Lett 6 706ndash711 (doi101046j1461-0248200300499x)
29 Schudel C J W 2008 Corruption and bilateral aid adyadic approach J Confl Resolution 52 507ndash526(doi1011770022002708316646)
30 Moilanen A Franco A M A Early R I Fox RWintle B amp Thomas C D 2005 Prioritizing mul-
tiple-use landscapes for conservation methods for largemulti-species planning problems Proc R Soc B 2721885ndash1891 (doi101098rspb20053164)
31 Moilanen A Kujala H amp Leathwick J R 2009 TheZONATION framework and software for conservation
prioritization In Spatial conservation prioritization quanti-tative methods and computational tools (eds A MoilanenK H Wilson amp H P Possingham) pp 196ndash210Oxford UK Oxford University Press
32 Sutherland W J et al 2009 One hundred questions
of importance to the conservation of global biologicaldiversity Conserv Biol 23 557ndash567 (doi101111j1523-1739200901212x)
33 Burnside C amp Dollar D 2004 Aid policies and
growth revisiting the evidence World Bank PolicyResearch Working Paper no 3251 The World Bank(See httpinfoworldbankorggovernancewgipdfGovernanceMattersVIIpdf)
34 Burnside C amp Dollar D 2000 Aid policies and
growth Am Econ Rev 90 847ndash86835 Svensson J 1999 Aid growth and democracy Econ
Polit 11 275ndash297 (doi1011111468-034300062)36 Easterly W 2003 Can foreign aid buy growth J Econ
Perspect 17 23ndash48 (doi101257089533003769204344)
37 Easterly W Levine R amp Roodman D 2000 New data newdoubts a comment on Burnside and Dollarrsquos lsquoaid policiesand growthrsquo NBER Working Paper no 9846 CambridgeMA USA National Bureau of Economic Research
38 Dijkstra A G 2002 The effectiveness of policy condi-
tionality eight country experiences Dev Change 33307ndash334 (doi1011111467-766000256)
39 Pronk J P 2001 Aid as a catalyst Dev Change 32611ndash629 (doi1011111467-766000219)
40 Smith R J Adams W M amp Leader-Williams N2010 Another entangled bank making conservationtrade-offs more explicit In Trade-offs in conservation decid-ing what to save (eds N Leader-Williams W M Adams ampR J Smith) pp 365ndash376 Oxford UK Blackwell
Publishing41 Visconti P et al 2011 Future hotspots of terrestrial
mammal loss Phil Trans R Soc B 366 2693ndash2702(doi101098rstb20110105)
42 Smith R J Verissimo D Leader-Williams N
Cowling R M amp Knight A T 2009 Let the localslead Nature 462 280ndash281 (doi101038462280a)
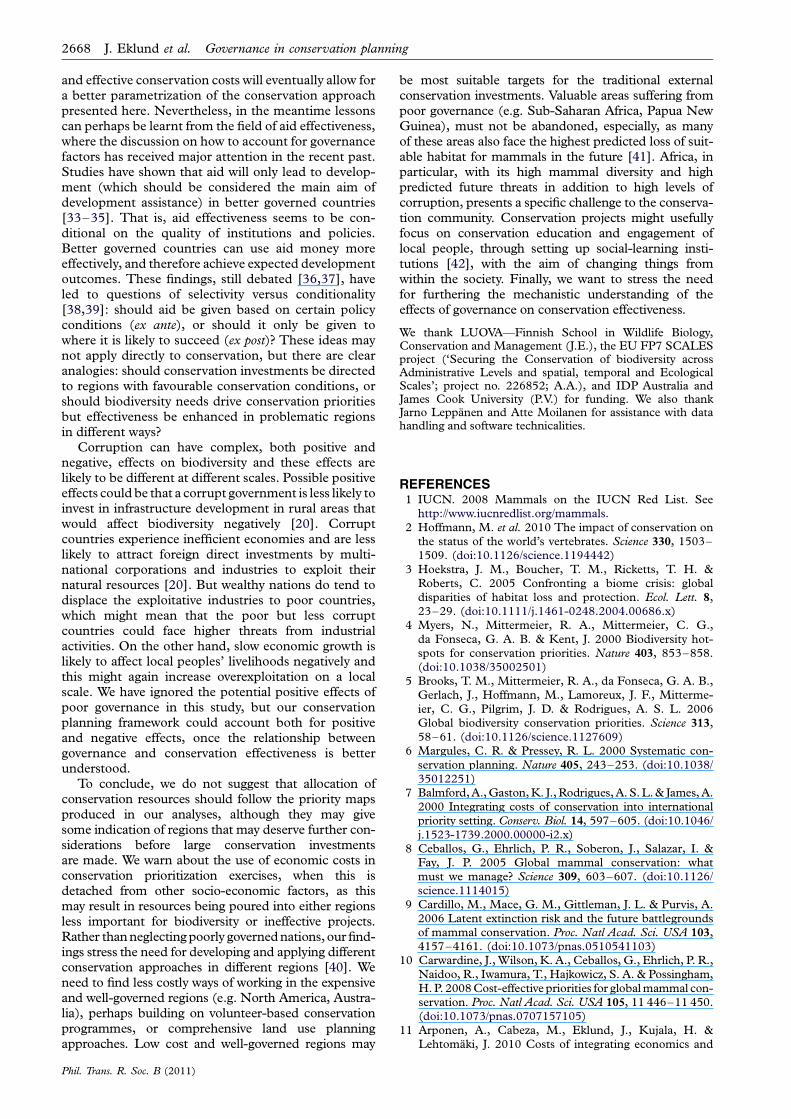