Gout-Guideline-Appendix6-NMA-Regarding-Use-of-ULT-2020 ...
83
1 SUPPLEMENTARY APPENDIX 6: Network Meta-Analyses (NMA) to Support Decision-Making Regarding Use of ULT 2020 American College of Rheumatology Guideline for the Management of Gout PICO 10: For patients diagnosed with gout with an indication for ULT, what is the relative impact of starting allopurinol, febuxostat, probenecid, allopurinol/lesinurad 200mg combination, febuxostat/lesinurad 200mg combination, pegloticase, or no treatment? Evidence from randomized clinical trials Summary We found 21 studies (reported in 31 publications) addressing this question (1-31). Note that some agents could not be analyzed in the NMA (or not analyzed for all possible outcomes) because their outcomes were reported differently which precluded their ability to be pooled, or the comparisons between interventions were not connected to the rest of the network. As a result, pegloticase was not included in the NMA for the outcome gout flares (due to different measurement of gout flares) and tophus (not connected to the network). We summarize results about how Pegloticase compares to placebo for the outcome tophus. The summary of the evidence below is informed by the synthesis of the data provided in Table 1 below. The evidence shows: - There may be no differences among the (non-placebo) drugs regarding their effectiveness to reduce the risk of gout flares for patients followed between 6-13 months (assessed in final month of the trial) - Allopurinol 300 mg, febuxostat 40 mg, and febuxostat 80 mg are the most effective drugs for reducing the risk of gout flares up to 2 years. Probenecid 2g may also be among the most effective. - Patients on placebo have the highest risk of gout flares up to 2 years of treatment. - Febuxostat 240 mg has the greatest risk of gout flares during the first 3 months of ULT therapy. Febuxostat 120 mg may have higher risk of gout flares during the first 3 months of ULT therapy. - Allopurinol 300 mg, Allopurinol 300mg + Lesinurad 200mg, Febuxostat 40 mg (including extended release), Febuxostat 80 mg (including extended release), Febuxostat 80 mg + Lesinurad 200 mg and placebo may have the lowest risk of gout flares during the first 3 months of ULT therapy - We are uncertain about how biweekly and monthly Pegloticase 8 mg compares to other drugs for gout flares, because the trial assessing the effects of Pegloticase measured gout flares in a different way.
-
Upload
khangminh22 -
Category
Documents
-
view
1 -
download
0
Transcript of Gout-Guideline-Appendix6-NMA-Regarding-Use-of-ULT-2020 ...

1
SUPPLEMENTARY APPENDIX 6: Network Meta-Analyses (NMA) to Support Decision-Making
Regarding Use of ULT
2020 American College of Rheumatology Guideline for the Management of Gout
PICO 10: For patients diagnosed with gout with an indication for ULT, what is the relative
impact of starting allopurinol, febuxostat, probenecid, allopurinol/lesinurad 200mg
combination, febuxostat/lesinurad 200mg combination, pegloticase, or no treatment?
Evidence from randomized clinical trials
Summary We found 21 studies (reported in 31 publications) addressing this question (1-31).
Note that some agents could not be analyzed in the NMA (or not analyzed for all possible outcomes) because
their outcomes were reported differently which precluded their ability to be pooled, or the comparisons
between interventions were not connected to the rest of the network. As a result, pegloticase was not included
in the NMA for the outcome gout flares (due to different measurement of gout flares) and tophus (not
connected to the network). We summarize results about how Pegloticase compares to placebo for the outcome
tophus. The summary of the evidence below is informed by the synthesis of the data provided in Table 1
below.
The evidence shows:
- There may be no differences among the (non-placebo) drugs regarding their effectiveness
to reduce the risk of gout flares for patients followed between 6-13 months (assessed in
final month of the trial)
- Allopurinol 300 mg, febuxostat 40 mg, and febuxostat 80 mg are the most effective drugs
for reducing the risk of gout flares up to 2 years. Probenecid 2g may also be among the
most effective.
- Patients on placebo have the highest risk of gout flares up to 2 years of treatment.
- Febuxostat 240 mg has the greatest risk of gout flares during the first 3 months of ULT
therapy. Febuxostat 120 mg may have higher risk of gout flares during the first 3 months
of ULT therapy.
- Allopurinol 300 mg, Allopurinol 300mg + Lesinurad 200mg, Febuxostat 40 mg
(including extended release), Febuxostat 80 mg (including extended release), Febuxostat
80 mg + Lesinurad 200 mg and placebo may have the lowest risk of gout flares during
the first 3 months of ULT therapy
- We are uncertain about how biweekly and monthly Pegloticase 8 mg compares to other
drugs for gout flares, because the trial assessing the effects of Pegloticase measured gout
flares in a different way.

2
- There may not be differences among the non-placebo drugs analyzed regarding their
efficacy for the outcome tophus up to 2 years
- Biweekly and monthly Pegloticase 8 mg may be more effective than placebo regarding
their efficacy for the outcome tophus up to 6 months. Biweekly Pegloticase 8 mg may be
more effective than monthly Pegloticase 8 mg for this outcome.
- Allopurinol 300mg and Febuxostat 80mg (extended release) are among the most effective
for achieving serum urate levels <6 mg/d up to 2 years. Allopurinol 300mg + Lesinurad
200mg, Febuxostat 40mg (extended release), Febuxostat 30mg bid, Febuxostat 120mg,
and Febuxostat 240mg may also be among the most effective. All the other drugs are less
effective than the above mentioned, but all are more effective than placebo.
- Compared to placebo, Febuxostat 120mg increases the risk of serious adverse events.
There may be no differences among any of the drugs in the risk of any serious adverse
events when compared to placebo.
- There may be no differences among any of the drugs in the risk of cardiovascular-related
serious adverse events when compared to Febuxostat 80mg.
- Most trials investigating allopurinol randomized patients to allopurinol 300 mg/d (or
200mg/d), in a fixed dose. Few studies reported on >300 mg dosages. No apparent
differences existed between these trials, and therefore all studies were combined.
The overall quality of the evidence is MODERATE

3
Contents Summary ......................................................................................................................................... 1
Results ............................................................................................................................................. 7
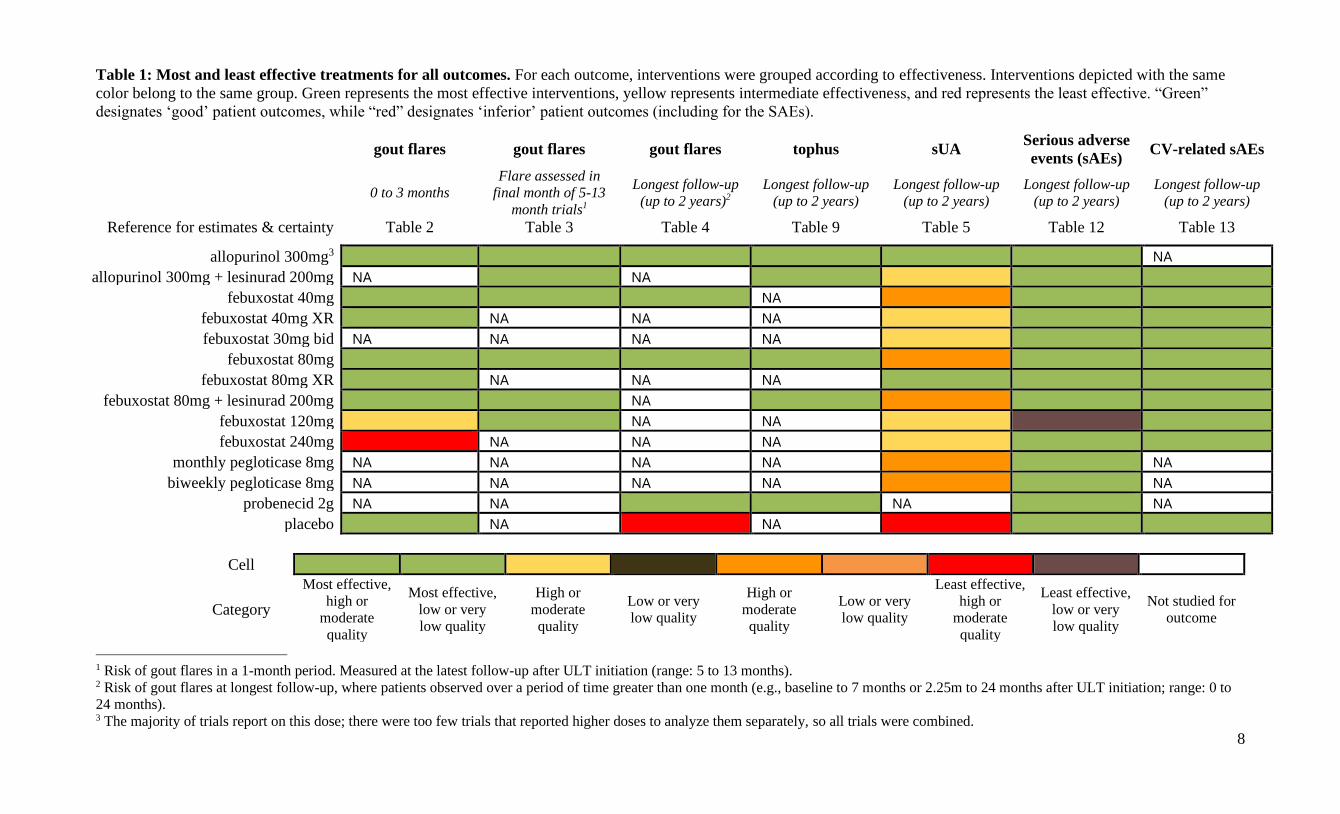
Table 1: Most and least effective treatments for all outcomes. For each outcome,
interventions were grouped according to effectiveness. Interventions depicted with the same
color belong to the same group. Green represents the most effective interventions, yellow
represents intermediate effectiveness, and red represents the least effective. “Green” designates
‘good’ patient outcomes, while “red” designates ‘inferior’ patient outcomes (including for the
SAEs). .......................................................................................................................................... 8
Figure 1: Network plot for proportion of patients with at least 1 gout flare, 0 to 3 months
follow-up (range: 28 days to 3 months). .................................................................................. 9
Table 2: Estimates and certainty for proportion of patients with at least 1 gout flare, 0 to
3 months follow-up (range: 28 days to 3 months). ................................................................ 10
Figure 2: Network plot for proportion of patients with at least 1 gout flare, at latest
follow-up (range: 5 to 13 months). Patients were observed for 1 month period only. ...... 12
Table 3: Estimates and certainty for proportion of patients with at least 1 gout flare, at
latest follow-up (range: 5 to 13 months). Patients were observed for 1 month period only.
................................................................................................................................................... 13
Figure 3: Network plot for proportion of patients with at least 1 gout flare, at longest
follow-up (range: from baseline or 2.25 months up to 7 or 24 months). Patients were
observed for >1 month period. ............................................................................................... 15
Table 4: Estimates and certainty for proportion of patients with at least 1 gout flare, at
longest follow-up (range: from baseline or 2.25 months up to 7 or 24 months). Patients
were observed for >1 month period. ...................................................................................... 16
Figure 4: Network plot for proportion of patients with serum urate <6.0mg/dL at longest
follow-up (range: 28 days to 24 months) ............................................................................... 17
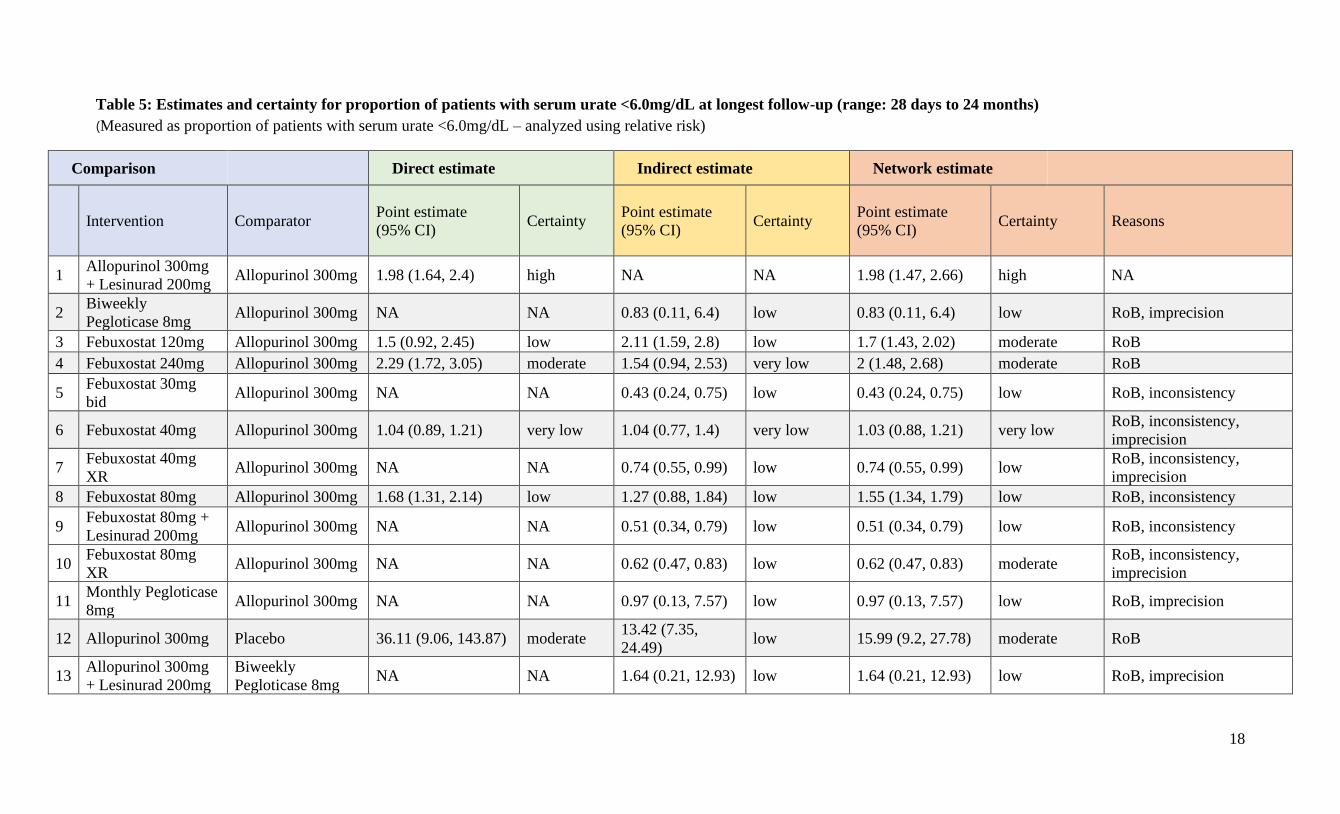
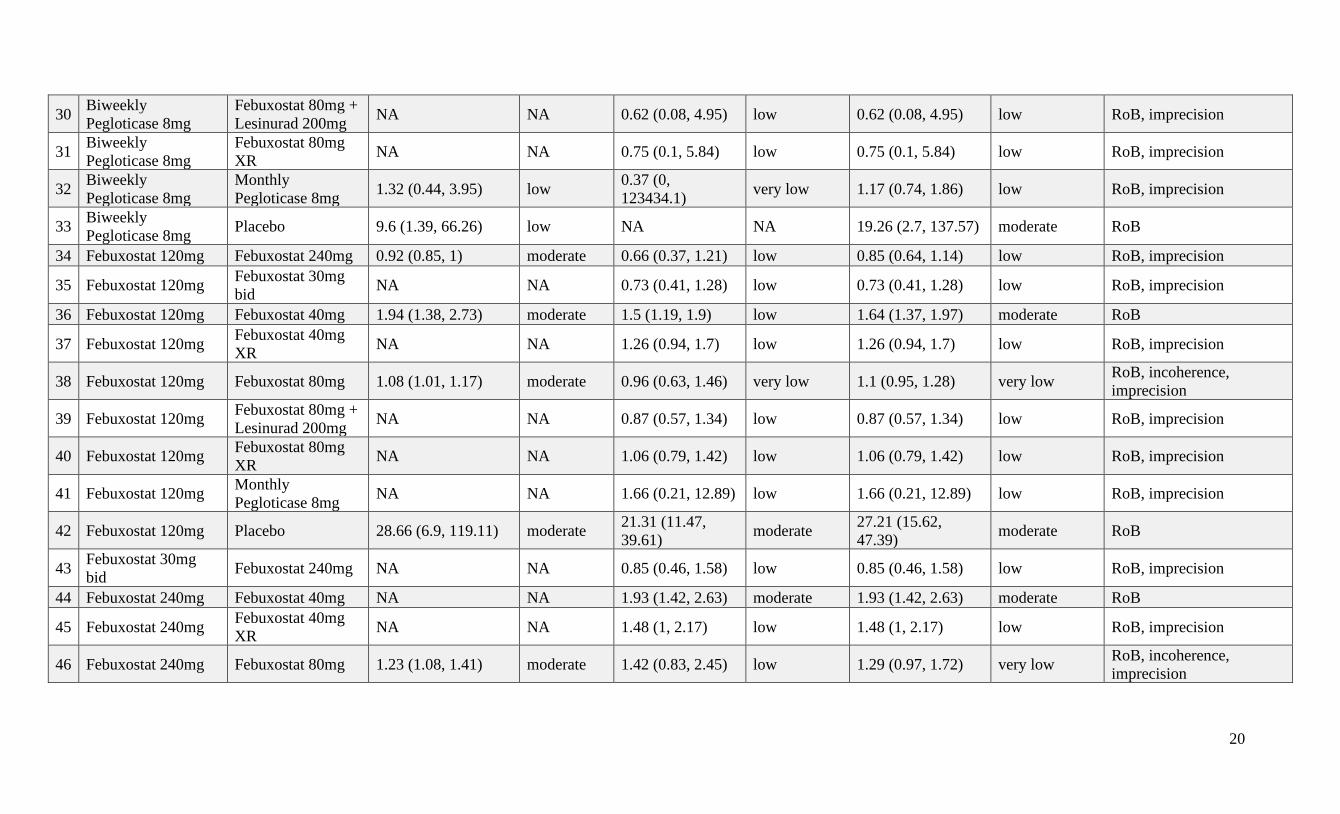
Table 5: Estimates and certainty for proportion of patients with serum urate <6.0mg/dL
at longest follow-up (range: 28 days to 24 months) .............................................................. 18
4
Table 6: Estimates and certainty for proportion of patients with pain closest to 3 months
(follow up: 28 days). ................................................................................................................ 23
Table 7: Estimates and certainty for change in pain score at longest follow-up (0 to 6.25
months). .................................................................................................................................... 24
Table 8: Estimates and certainty for change patient global assessment as measured on
100mm visual analogue scale at longest follow-up (0 to 6.25 months) ................................ 25
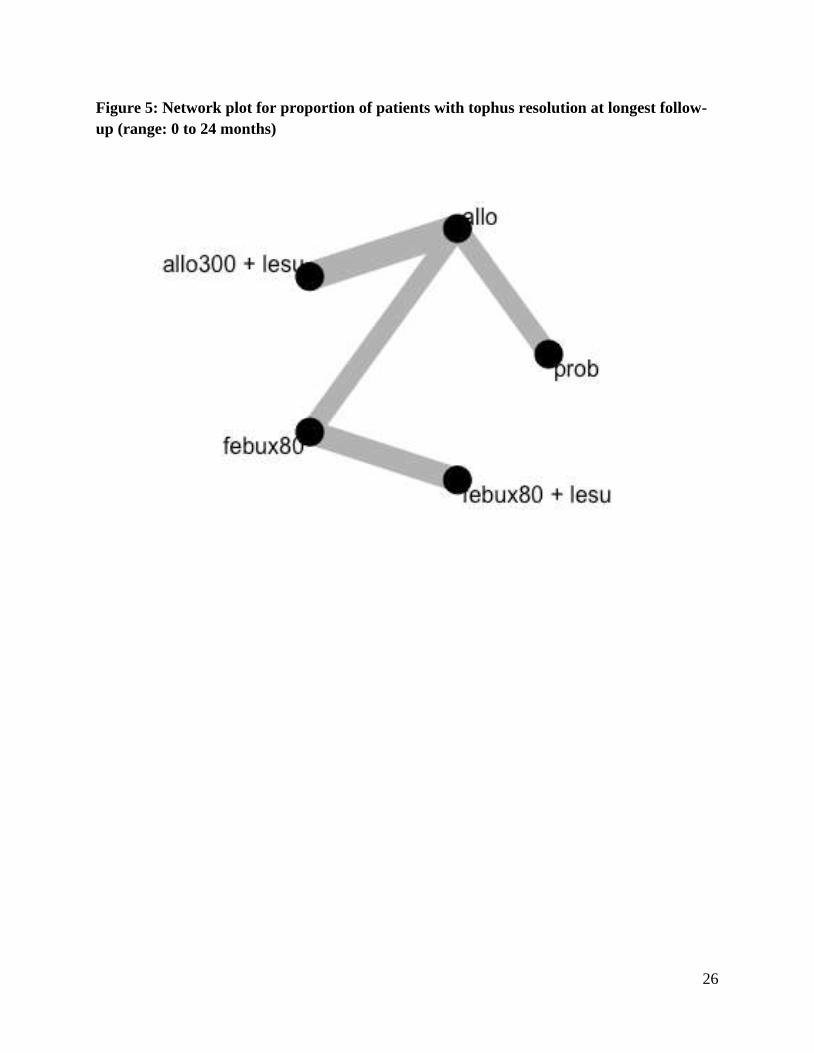
Figure 5: Network plot for proportion of patients with tophus resolution at longest
follow-up (range: 0 to 24 months) .......................................................................................... 26
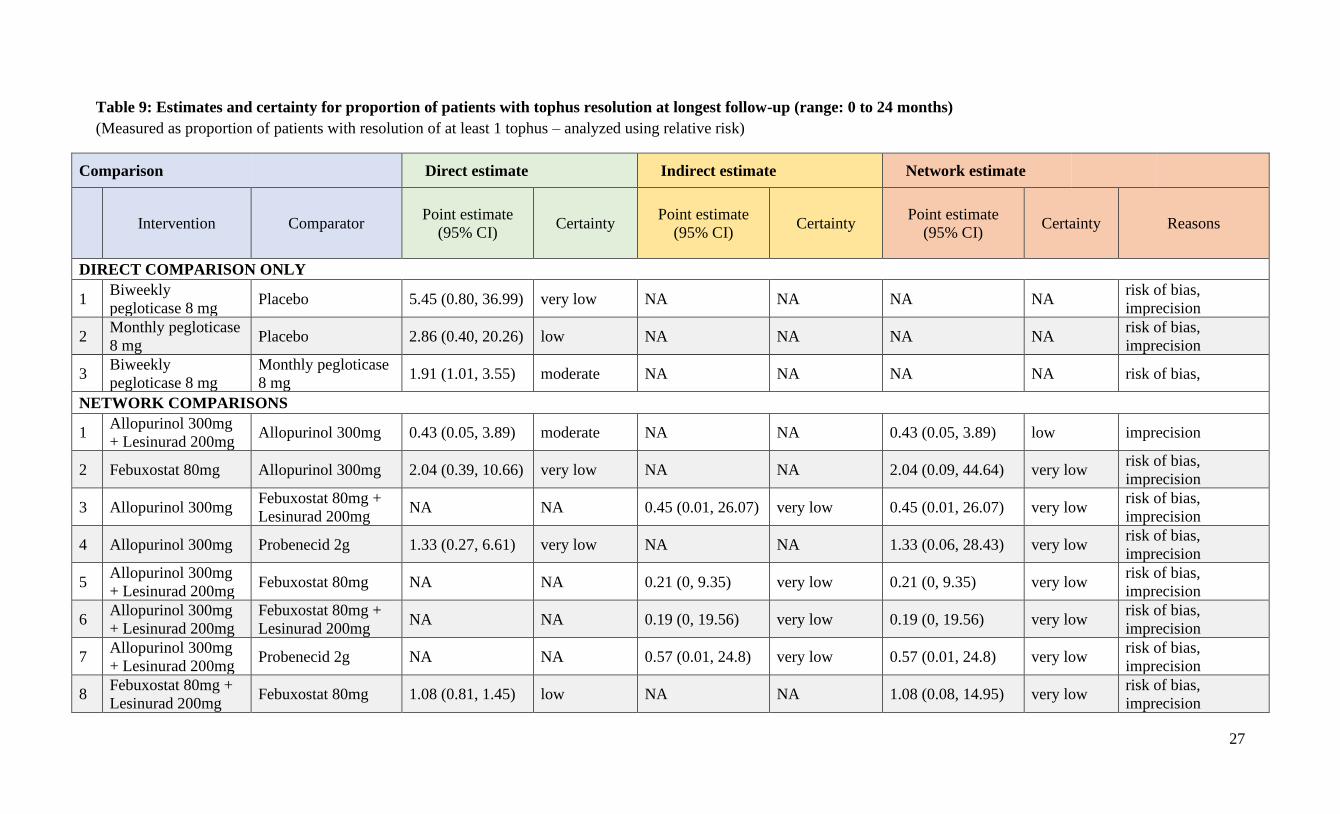
Table 9: Estimates and certainty for proportion of patients with tophus resolution at
longest follow-up (range: 0 to 24 months) ............................................................................. 27
Table 10: Estimates and certainty for change in health-related quality of life at longest
follow-up (0 to 6.25 months) ................................................................................................... 29
Table 11: Estimates and certainty for change in activity limitation at longest follow-up (0
to 6.25 months). ........................................................................................................................ 30
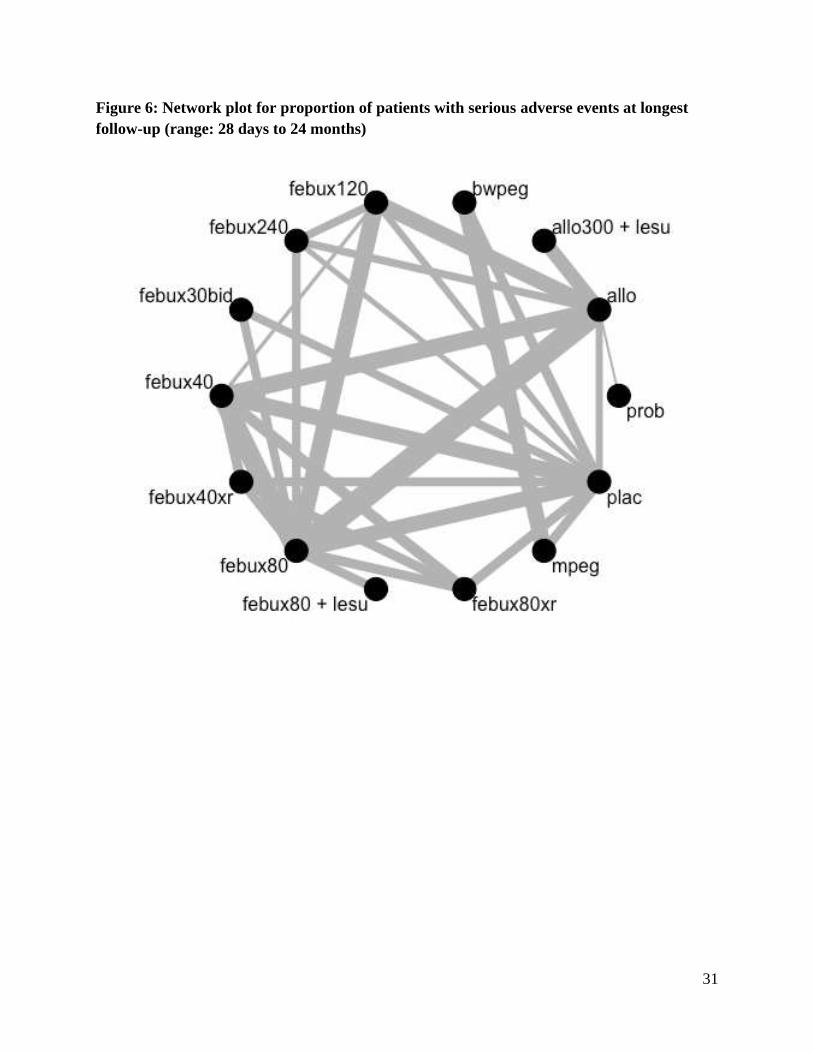
Figure 6: Network plot for proportion of patients with serious adverse events at longest
follow-up (range: 28 days to 24 months) ............................................................................... 31
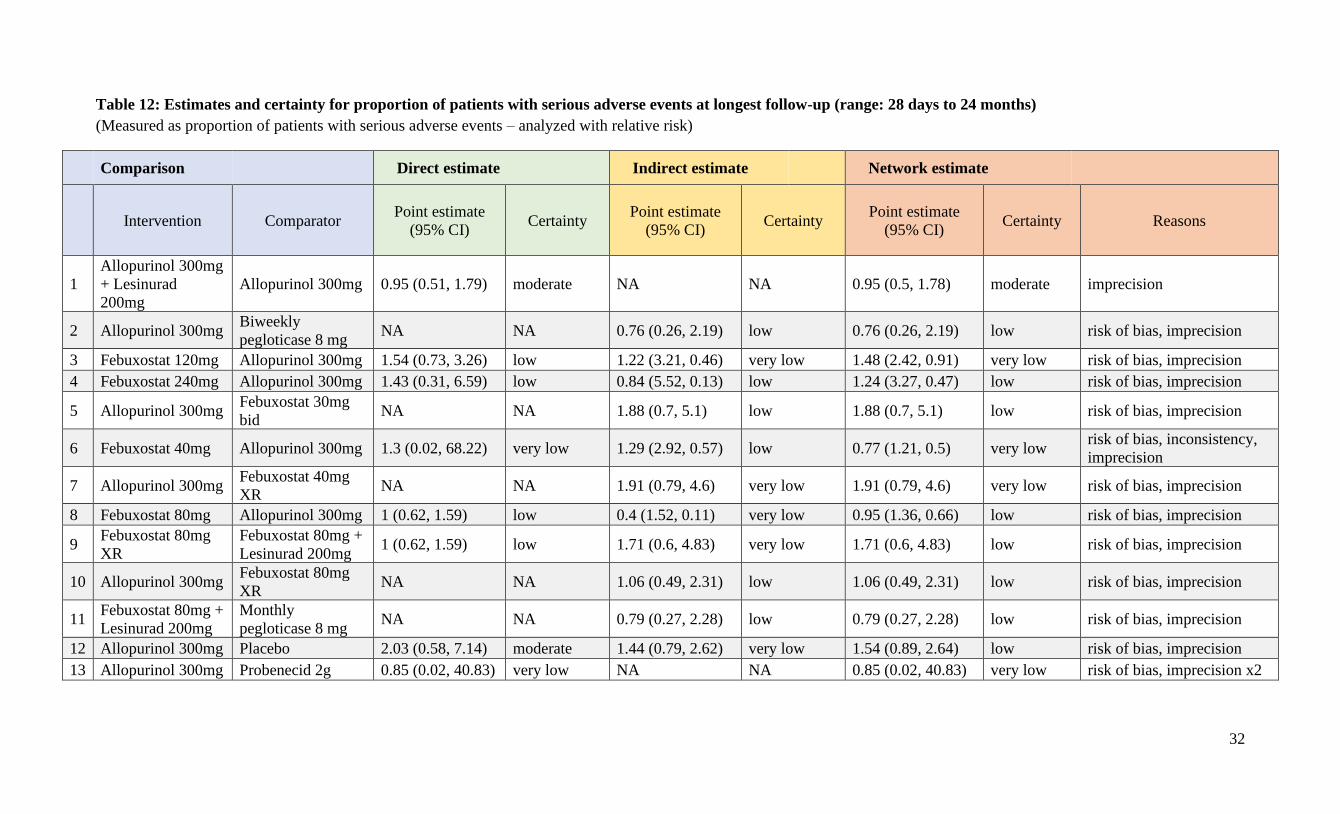
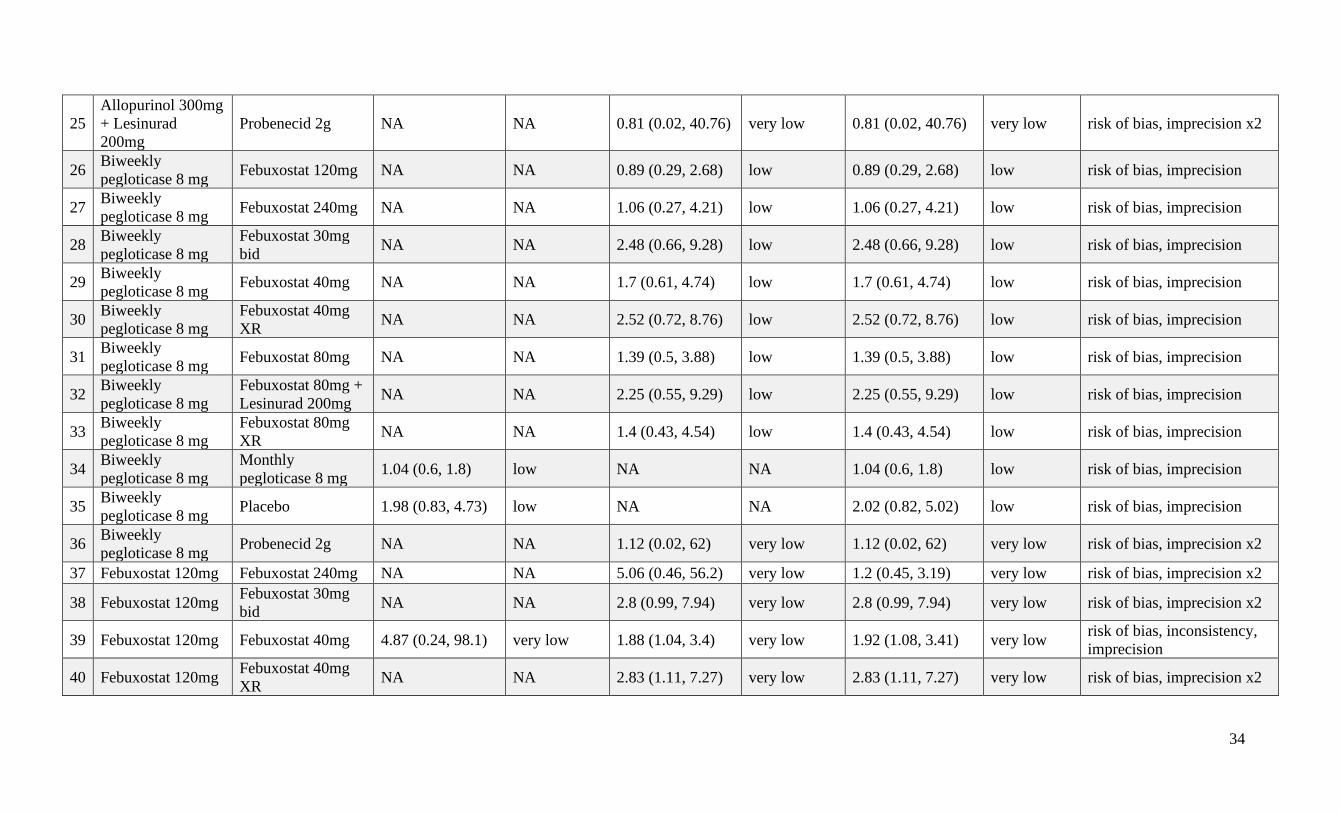
Table 12: Estimates and certainty for proportion of patients with serious adverse events
at longest follow-up (range: 28 days to 24 months) .............................................................. 32
Figure 7: Network plot for proportion of patients with cardiovascular-related serious,
Longest follow-up (range: 28 day to median of 32 months) ................................................ 38
Table 13: Estimates and certainty for proportion of patients with cardiovascular-related
serious, longest follow-up (range: 28 day to median of 32 months) .................................... 39
Figure 8: Risk of bias assessment ........................................................................................... 43
Figures 9a-l: Forest plots for proportion of patients with at least 1 gout flare, 0 to 3
months follow-up (range: 28 days to 3 months).................................................................... 44
Figure 9a: Allopurinol 300 mg vs. placebo ........................................................................... 44
Figure 9b: Any dose of febuxostat vs. placebo. ..................................................................... 44
Figure 9c: Any dose of febuxostat vs. allopurinol 300mg ..................................................... 45
Figure 9d: Any dose of febuxostat vs. febuxostat 40mg. ........................................................ 45
Figure 9e: Any dose of febuxostat vs. febuxostat 80mg. ........................................................ 46
Figure 9f: Any dose of febuxostat vs. febuxostat 240mg. ...................................................... 47
Figure 9g: Febuxostat 80mg XR vs. febuxostat 40mg XR. .................................................... 47
Figure 9h: Lesinurad 200mg + febuxostat 80mg vs. febuxostat 80mg.................................. 47
Figure 9k: Network forest plot with placebo as comparator. ................................................ 48
5
Figure 9l: Network forest plot with allopurinol 300mg as comparator. ............................... 48
Figures 10a-c: Forest plots for proportion of patients with at least 1 gout flare, at latest
follow-up (range: 5 to 13 months). Patients were observed for 1 month period only. ...... 49
Figure 10a: Any dose of febuxostat vs. allopurinol 300mg. .................................................. 49
Figure 10b: Any dose of febuxostat vs. febuxostat 80mg. ...................................................... 49
Figure 10c: Lesinurad 200mg + allopurinol 300mg vs. allopurinol 300mg. ........................ 49
Figure 10d: Network forest plot with allopurinol 300mg as comparator. ............................ 50
Figures 11a-g: Forest plots for proportion of patients with at least 1 gout flare, at longest
follow-up (range: from baseline or 2.25 months up to 7 or 24 months). Patients were
observed for >1 month period. ............................................................................................... 51
Figure 11a: Any dose of febuxostat 40mg vs. placebo. ......................................................... 51
Figure 11b: Any dose of febuxostat vs. allopurinol 300mg. .................................................. 51
Figure 11c: Any dose of febuxostat vs. febuxostat 80mg. ...................................................... 51
Figure 11d: Allopurinol 300mg vs. probenecid 2g. ............................................................... 52
Figure 11e: Lesinurad 200mg + febuxostat 80mg vs. febuxostat 80mg. ............................... 52
Figure 11f: Network forest plot with allopurinol 300mg as comparator. ............................. 52
Figure 11g: Network forest plot with placebo as comparator. ............................................. 53
Figures 12a-m: Forest plots for proportion of patients with serum urate <6.0mg/dL at
longest follow-up (range: 28 days to 24 months) .................................................................. 53
Figure 12a: Allopurinol 300mg vs. placebo. ......................................................................... 53
Figure 12b: Any dose of febuxostat vs. placebo .................................................................... 54
Figure 12c: Any dose of febuxostat vs. allopurinol 300mg. .................................................. 55
Figure 12d: Any dose of febuxostat vs. febuxostat 40mg. ...................................................... 56
Figure 12e: Any dose of febuxostat vs. febuxostat 80mg ....................................................... 57
Figure 12f: Any dose of febuxostat vs. febuxostat 240mg ..................................................... 58
Figure 12g: Febuxostat 80mg XR vs. febuxostat 40mg XR. .................................................. 58
Figure 12h: Pegloticase 8mg vs. placebo. ............................................................................. 58
Figure 12i: Monthly vs. biweekly pegloticase 8mg. .............................................................. 59
Figure 12j: Lesinurad 200mg + allopurinol 300mg vs. allopurinol 300mg. ........................ 59
Figure 12k: Lesinurad 200mg + febuxostat 80mg vs. febuxostat 80mg ................................ 59
Figure 12l: Network forest plot with allopurinol 300mg....................................................... 60
Figure 12m: Network forest plot with placebo as comparator.............................................. 60

6
Figures 13a-c: Forest plots for proportion of patients with subjective adverse event of
pain; closest to 3 months (follow up: 28 days) ...................................................................... 61
Figure 13a: Any dose of febuxostat vs. placebo. ................................................................... 61
Figure 13b: Any dose of febuxostat vs. febuxostat 40mg. ...................................................... 61
Figure 13c: Any dose of febuxostat vs. febuxostat 80mg. ...................................................... 61
Figures 14a-b: Forest plots for change in pain score using 0 to 100 mm visual analogue
scale, at longest follow-up (0 to 6.25 months) ........................................................................ 62
Figure 14a: Pegloticase 8mg vs. placebo. ............................................................................. 62
Figure 14b: Biweekly vs. monthly pegloticase 8mg............................................................... 62
Figures 15a-b: Forest plots for change patient global assessment as measured on 100mm
visual analogue scale at longest follow-up (0 to 6.25 months) ............................................. 63
Figure 15a: Pegloticase 8mg vs. placebo. ............................................................................. 63
Figure 15b: Biweekly vs. monthly pegloticase 8mg............................................................... 63
Figures 16a-f: Forest plots for proportion of patients with tophus resolution at longest
follow-up (range: 0 to 24 months) .......................................................................................... 64
Figure 16a: Allopurinol 300mg vs. probenecid 2g. ............................................................... 64
Figure 16b: Pegloticase 8mg vs. placebo. ............................................................................. 64
Figure 16c: Biweekly vs. monthly pegloticase 8mg. .............................................................. 64
Figure 16d: Lesinurad 200mg + allopurinol 300mg vs. allopurinol 300mg ........................ 65
Figure 16e: Lesinurad 200mg + febuxostat 80mg vs. febuxostat 80mg ................................ 65
Figure 16f: Network forest plot with allopurinol 300mg as comparator. ............................. 65
Figures 17a-b: Forest plot for change in physical component summary (PCS) score of 36-
Item Short Form Health Survey (SF-36) at longest follow-up (0 to 6.25 months) ............ 66
Figure 17a: Pegloticase 8m vs. placebo. .................................................................................. 66
Figure 17b: Biweekly vs. monthly pegloticase 8mg. ................................................................. 66
Figures 18a-b: Forest plots for change in Health Assessment Questionnaire-Disability
Index score (HAQ-DI) at longest follow-up (0 to 6.25 months) ........................................... 67
Figure 18a: Pegloticase 8mg vs. placebo. ................................................................................ 67
Figure 18b: Monthly vs. biweekly pegloticase 8mg............................................................... 67
Figures 19a-n: Forest plots for proportion of patients with serious adverse events at
longest follow-up (range: 28 days to 24 months) .................................................................. 68
Figure 19a: Allopurinol 300mg vs. placebo. ......................................................................... 68
Figure 19b: Any dose of febuxostat vs. placebo. ................................................................... 68

7
Figure 19c: Any dose of febuxostat vs. allopurinol 300mg. .................................................. 69
Figure 19d: Any dose of febuxostat vs. febuxostat 40mg. ...................................................... 69
Figure 19e: Any dose of febuxostat vs. febuxostat 80mg. ...................................................... 70
Figure 19f: Any dose of febuxostat vs. febuxostat 240mg. .................................................... 70
Figure 19g: Febuxostat 80mg XR vs. febuxostat 40mg XR. .................................................. 71
Figure 19h: Allopurinol 300mg vs. probenecid 2g. ............................................................... 71
Figure 19i: Pegloticase 8mg vs. placebo. .............................................................................. 71
Figure 19j: Monthly vs. biweekly pegloticase 8mg. .............................................................. 72
Figure 19k: Lesinurad 200mg + allopurinol 300mg vs. allopurinol 300mg. ........................ 72
Figure 19l: Lesinurad 200mg + febuxostat 80mg vs. febuxostat 80mg. ............................... 72
Figure 19m: Network forest plot with placebo as comparator.............................................. 73
Figure 19n: Network forest plot with allopurinol 300mg as comparator. ............................ 74
Figures 20a-l: Forest plots for proportion of patients with cardiovascular-related serious,
Longest follow-up (range: 28 day to median of 32 months) ................................................ 75
Figure 20a: Allopurinol 300mg vs. placebo. ......................................................................... 75
Figure 20b: Any dose of febuxostat vs. placebo. ................................................................... 75
Figure 20c: Any dose of febuxostat vs. allopurinol 300mg. .................................................. 76
Figure 20d: Any dose of febuxostat vs. febuxostat 40mg. ...................................................... 77
Figure 20e: Any dose of febuxostat vs. febuxostat 80mg. ...................................................... 77
Figure 20f: Any dose of febuxostat vs. Febuxostat 240mg. ................................................... 78
Figure 20g: Febuxostat 80mg XR vs. Febuxostat 40mg XR. ................................................. 78
Figure 20h: Monthly vs. Biweekly pegloticase 8mg. ............................................................. 78
Figure 20i: Lesinurad 200mg + allopurinol 300mg vs. allopurinol 300mg ......................... 78
Figure 20j: Lesinurad 200mg + febuxostat 80mg vs. febuxostat 80mg. ............................... 79
Figure 20k: Network forest plot with placebo as comparator. .............................................. 79
Figure 20l: Network forest plot with allopurinol 300mg as comparator. ............................. 80
References ..................................................................................................................................... 81
Results
8
Table 1: Most and least effective treatments for all outcomes. For each outcome, interventions were grouped according to effectiveness. Interventions depicted with the same
color belong to the same group. Green represents the most effective interventions, yellow represents intermediate effectiveness, and red represents the least effective. “Green”
designates ‘good’ patient outcomes, while “red” designates ‘inferior’ patient outcomes (including for the SAEs).
Cell
Category
Most effective,
high or
moderate
quality
Most effective,
low or very
low quality
High or
moderate
quality
Low or very
low quality
High or
moderate
quality
Low or very
low quality
Least effective,
high or
moderate
quality
Least effective,
low or very
low quality
Not studied for
outcome
1 Risk of gout flares in a 1-month period. Measured at the latest follow-up after ULT initiation (range: 5 to 13 months). 2 Risk of gout flares at longest follow-up, where patients observed over a period of time greater than one month (e.g., baseline to 7 months or 2.25m to 24 months after ULT initiation; range: 0 to
24 months). 3 The majority of trials report on this dose; there were too few trials that reported higher doses to analyze them separately, so all trials were combined.
gout flares gout flares gout flares tophus sUA Serious adverse
events (sAEs) CV-related sAEs
0 to 3 months
Flare assessed in
final month of 5-13
month trials1
Longest follow-up
(up to 2 years)2
Longest follow-up
(up to 2 years)
Longest follow-up
(up to 2 years)
Longest follow-up
(up to 2 years)
Longest follow-up
(up to 2 years)
Reference for estimates & certainty Table 2 Table 3 Table 4 Table 9 Table 5 Table 12 Table 13
allopurinol 300mg3 NA
allopurinol 300mg + lesinurad 200mg NA NA
febuxostat 40mg NA
febuxostat 40mg XR NA NA NA
febuxostat 30mg bid NA NA NA NA
febuxostat 80mg
febuxostat 80mg XR NA NA NA
febuxostat 80mg + lesinurad 200mg NA
febuxostat 120mg NA NA
febuxostat 240mg NA NA NA
monthly pegloticase 8mg NA NA NA NA NA
biweekly pegloticase 8mg NA NA NA NA NA
probenecid 2g NA NA NA NA
placebo NA NA

9
Figure 1: Network plot for proportion of patients with at least 1 gout flare, 0 to 3 months
follow-up (range: 28 days to 3 months).

10
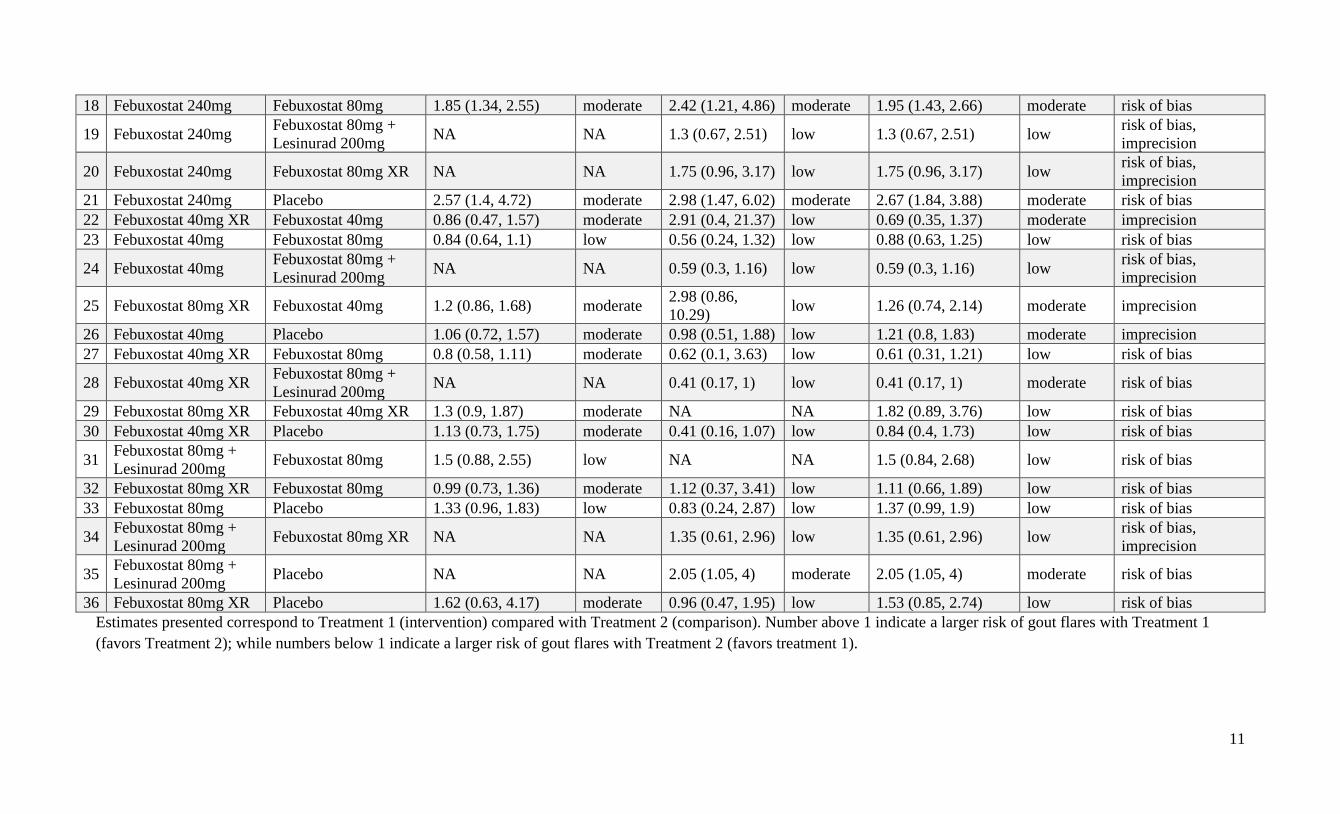
Table 2: Estimates and certainty for proportion of patients with at least 1 gout flare, 0 to 3 months follow-up (range: 28 days to 3 months).
(Measured as proportion of patients with at least 1 gout flare – analyzed using relative risk)
Comparison Direct estimate Indirect estimate Network estimates
Intervention Comparator Point estimate
(95% CI) Certainty
Point estimate
(95% CI) Certainty
Point estimate
(95% CI) Certainty Reasons
1 Febuxostat 120mg Allopurinol 300mg 1.58 (1.05, 2.37) moderate 1.05 (0.59, 1.86) low 1.41 (1.05, 1.9) moderate risk of bias
2 Febuxostat 240mg Allopurinol 300mg 2.25 (1.49, 3.42) moderate 1.22 (0.55, 2.73) low 2.04 (1.47, 2.83) moderate risk of bias
3 Febuxostat 40mg Allopurinol 300mg 0.56 (0.27, 1.18) high 1.19 (0.74, 1.92) low 0.93 (0.63, 1.36) low risk of bias,
imprecision
4 Allopurinol 300mg Febuxostat 40mg XR NA NA 1.56 (0.76, 3.21) low 1.56 (0.76, 3.21) low risk of bias,
imprecision
5 Febuxostat 80mg Allopurinol 300mg 1 (0.67, 1.49) moderate 0.97 (0.42, 2.28) low 1.05 (0.8, 1.37) low risk of bias
6 Allopurinol 300mg Febuxostat 80mg +
Lesinurad 200mg NA NA 0.64 (0.34, 1.21) low 0.64 (0.34, 1.21) low
risk of bias,
imprecision
7 Allopurinol 300mg Febuxostat 80mg XR NA NA 0.86 (0.48, 1.52) low 0.86 (0.48, 1.52) low risk of bias,
imprecision
8 Allopurinol 300mg Placebo 1.15 (0.77, 1.71) low 1.62 (0.89, 2.95) low 1.31 (0.91, 1.88) low risk of bias
9 Febuxostat 120mg Febuxostat 240mg 0.7 (0.56, 0.88) moderate 0.62 (0.24, 0.61) low 0.69 (0.51, 0.94) moderate risk of bias
10 Febuxostat 120mg Febuxostat 40mg 1.63 (0.98, 2.7) low 1.44 (0.86, 2.42) low 1.53 (1.05, 2.22) moderate risk of bias
11 Febuxostat 120mg Febuxostat 40mg XR NA NA 2.21 (1.08, 4.51) moderate 2.21 (1.08, 4.51) moderate risk of bias
12 Febuxostat 120mg Febuxostat 80mg 1.31 (0.99, 1.73) low 1.58 (0.76, 3.26) low 1.35 (1.04, 1.76) moderate risk of bias
13 Febuxostat 120mg Febuxostat 80mg +
Lesinurad 200mg NA NA 0.9 (0.47, 1.7) low 0.9 (0.47, 1.7) low
risk of bias,
imprecision
14 Febuxostat 120mg Febuxostat 80mg XR NA NA 1.21 (0.69, 2.13) low 1.21 (0.69, 2.13) low risk of bias,
imprecision
15 Febuxostat 120mg Placebo 1.72 (1.07, 2.76) moderate 8.78 (2.09,
36.88) moderate 1.85 (1.33, 2.57) moderate risk of bias
16 Febuxostat 240mg Febuxostat 40mg NA NA 2.21 (1.44, 3.37) moderate 2.21 (1.44, 3.37) moderate risk of bias
17 Febuxostat 240mg Febuxostat 40mg XR NA NA 3.19 (1.53, 6.67) moderate 3.19 (1.53, 6.67) moderate risk of bias
11
18 Febuxostat 240mg Febuxostat 80mg 1.85 (1.34, 2.55) moderate 2.42 (1.21, 4.86) moderate 1.95 (1.43, 2.66) moderate risk of bias
19 Febuxostat 240mg Febuxostat 80mg +
Lesinurad 200mg NA NA 1.3 (0.67, 2.51) low 1.3 (0.67, 2.51) low
risk of bias,
imprecision
20 Febuxostat 240mg Febuxostat 80mg XR NA NA 1.75 (0.96, 3.17) low 1.75 (0.96, 3.17) low risk of bias,
imprecision
21 Febuxostat 240mg Placebo 2.57 (1.4, 4.72) moderate 2.98 (1.47, 6.02) moderate 2.67 (1.84, 3.88) moderate risk of bias
22 Febuxostat 40mg XR Febuxostat 40mg 0.86 (0.47, 1.57) moderate 2.91 (0.4, 21.37) low 0.69 (0.35, 1.37) moderate imprecision
23 Febuxostat 40mg Febuxostat 80mg 0.84 (0.64, 1.1) low 0.56 (0.24, 1.32) low 0.88 (0.63, 1.25) low risk of bias
24 Febuxostat 40mg Febuxostat 80mg +
Lesinurad 200mg NA NA 0.59 (0.3, 1.16) low 0.59 (0.3, 1.16) low
risk of bias,
imprecision
25 Febuxostat 80mg XR Febuxostat 40mg 1.2 (0.86, 1.68) moderate 2.98 (0.86,
10.29) low 1.26 (0.74, 2.14) moderate imprecision
26 Febuxostat 40mg Placebo 1.06 (0.72, 1.57) moderate 0.98 (0.51, 1.88) low 1.21 (0.8, 1.83) moderate imprecision
27 Febuxostat 40mg XR Febuxostat 80mg 0.8 (0.58, 1.11) moderate 0.62 (0.1, 3.63) low 0.61 (0.31, 1.21) low risk of bias
28 Febuxostat 40mg XR Febuxostat 80mg +
Lesinurad 200mg NA NA 0.41 (0.17, 1) low 0.41 (0.17, 1) moderate risk of bias
29 Febuxostat 80mg XR Febuxostat 40mg XR 1.3 (0.9, 1.87) moderate NA NA 1.82 (0.89, 3.76) low risk of bias
30 Febuxostat 40mg XR Placebo 1.13 (0.73, 1.75) moderate 0.41 (0.16, 1.07) low 0.84 (0.4, 1.73) low risk of bias
31 Febuxostat 80mg +
Lesinurad 200mg Febuxostat 80mg 1.5 (0.88, 2.55) low NA NA 1.5 (0.84, 2.68) low risk of bias
32 Febuxostat 80mg XR Febuxostat 80mg 0.99 (0.73, 1.36) moderate 1.12 (0.37, 3.41) low 1.11 (0.66, 1.89) low risk of bias
33 Febuxostat 80mg Placebo 1.33 (0.96, 1.83) low 0.83 (0.24, 2.87) low 1.37 (0.99, 1.9) low risk of bias
34 Febuxostat 80mg +
Lesinurad 200mg Febuxostat 80mg XR NA NA 1.35 (0.61, 2.96) low 1.35 (0.61, 2.96) low
risk of bias,
imprecision
35 Febuxostat 80mg +
Lesinurad 200mg Placebo NA NA 2.05 (1.05, 4) moderate 2.05 (1.05, 4) moderate risk of bias
36 Febuxostat 80mg XR Placebo 1.62 (0.63, 4.17) moderate 0.96 (0.47, 1.95) low 1.53 (0.85, 2.74) low risk of bias
Estimates presented correspond to Treatment 1 (intervention) compared with Treatment 2 (comparison). Number above 1 indicate a larger risk of gout flares with Treatment 1
(favors Treatment 2); while numbers below 1 indicate a larger risk of gout flares with Treatment 2 (favors treatment 1).

12
Figure 2: Network plot for proportion of patients with at least 1 gout flare, at latest follow-
up (range: 5 to 13 months). Patients were observed for 1 month period only.

13
Table 3: Estimates and certainty for proportion of patients with at least 1 gout flare, at latest follow-up (range: 5 to 13 months). Patients were observed for 1 month
period only.
(Measured as proportion of patients with at least 1 gout flare – analyzed using relative risk)
Comparison Direct estimate Indirect estimate Network estimate
Intervention Comparator Point estimate
(95% CI) Certainty
Point estimate
(95% CI) Certainty
Point estimate
(95% CI) Certainty Reasons
1 Allopurinol 300mg
+ Lesinurad 200mg Allopurinol 300mg 0.79 (0.4, 1.54) moderate NA NA 0.81 (0.42, 1.6) moderate imprecision
2 Febuxostat 120mg Allopurinol 300mg 0.83 (0.31, 2.21) low 0.4 (0.02, 7.4) very low 0.79 (0.36, 1.75) low risk of bias,
imprecision
3 Febuxostat 40mg Allopurinol 300mg 1.03 (0.33, 3.23) moderate 1.82 (0.22, 15.43) very low 1.13 (0.48, 2.63) moderate imprecision
4 Febuxostat 80mg Allopurinol 300mg 0.99 (0.48, 2.03) low NA NA 0.99 (0.55, 1.8) low risk of bias,
imprecision
5 Febuxostat 80mg +
Lesinurad 200mg Allopurinol 300mg NA NA 1.09 (0.4, 2.99) low 1.09 (0.4, 2.99) low
risk of bias,
imprecision
6 Allopurinol 300mg
+ Lesinurad 200mg Febuxostat 120mg NA NA 1.03 (0.36, 2.9) low 1.03 (0.36, 2.9) low
risk of bias,
imprecision
7 Allopurinol 300mg
+ Lesinurad 200mg Febuxostat 40mg NA NA 0.72 (0.25, 2.13) low 0.72 (0.25, 2.13) low
risk of bias,
imprecision
8 Allopurinol 300mg
+ Lesinurad 200mg Febuxostat 80mg NA NA 0.82 (0.33, 2.01) low 0.82 (0.33, 2.01) low
risk of bias,
imprecision
9 Allopurinol 300mg
+ Lesinurad 200mg
Febuxostat 80mg +
Lesinurad 200mg NA NA 0.75 (0.22, 2.5) low 0.75 (0.22, 2.5) low
risk of bias,
imprecision
10 Febuxostat 120mg Febuxostat 40mg NA NA 0.7 (0.24, 2.08) low 0.7 (0.24, 2.08) low risk of bias,
imprecision
11 Febuxostat 120mg Febuxostat 80mg 1.26 (0.48, 3.29) low 1.59 (0.08, 30.1) low 0.8 (0.36, 1.76) low risk of bias,
imprecision
12 Febuxostat 120mg Febuxostat 80mg +
Lesinurad 200mg NA NA 0.73 (0.23, 2.25) very low 0.73 (0.23, 2.25) low
risk of bias,
imprecision

14
13 Febuxostat 40mg Febuxostat 80mg 0.76 (0.33, 1.72) moderate 0.74 (0.1, 5.22) low 1.14 (0.48, 2.69) moderate imprecision
14 Febuxostat 40mg Febuxostat 80mg +
Lesinurad 200mg NA NA 1.03 (0.32, 3.37) low 1.03 (0.32, 3.37) low
risk of bias,
imprecision
15 Febuxostat 80mg +
Lesinurad 200mg Febuxostat 80mg 1.1 (0.49, 2.48) low NA NA 1.1 (0.49, 2.48) low
risk of bias,
imprecision
Estimates presented correspond to Treatment 1 (intervention) compared with Treatment 2 (comparison). Number above 1 indicate a larger risk of gout flares with Treatment 1
(favors Treatment 2); while numbers below 1 indicate a larger risk of gout flares with Treatment 2 (favors treatment 1).

15
Figure 3: Network plot for proportion of patients with at least 1 gout flare, at longest
follow-up (range: from baseline or 2.25 months up to 7 or 24 months). Patients were
observed for >1 month period.

16
Table 4: Estimates and certainty for proportion of patients with at least 1 gout flare, at longest follow-up (range: from baseline or 2.25 months up to 7 or 24 months).
Patients were observed for >1 month period.
(Measured as proportion of patients with at least 1 gout flare – analyzed using relative risk)
Comparison Direct estimate Indirect estimate Network estimate
Intervention Comparator Point estimate
(95% CI) Certainty
Point estimate
(95% CI) Certainty
Point estimate
(95% CI) Certainty Reasons
1 Febuxostat 40mg Allopurinol 300mg 0.56 (0.22, 1.41) moderate NA NA 0.56 (0.22, 1.41) moderate imprecision
2 Febuxostat 80mg Allopurinol 300mg 0.44 (0.16, 1.17) moderate NA NA 0.44 (0.16, 1.17) moderate imprecision
3 Allopurinol 300mg Placebo NA NA 1.26 (0.54, 2.93) low 1.26 (0.54, 2.93) low risk of bias, imprecision
4 Allopurinol 300mg Probenecid 2g 1.04 (0.57, 1.89) very low NA NA 1.04 (0.57, 1.89) very low risk of bias, imprecision
5 Febuxostat 40mg Febuxostat 80mg 1.29 (0.49, 3.37) moderate NA NA 1.29 (0.49, 3.37) moderate imprecision
6 Febuxostat 40mg Placebo 0.71 (0.52, 0.96) moderate NA NA 0.71 (0.52, 0.96) moderate risk of bias
7 Febuxostat 40mg Probenecid 2g NA NA 0.58 (0.22, 1.57) very low 0.58 (0.22, 1.57) very low risk of bias, imprecision
8 Febuxostat 80mg Placebo NA NA 0.55 (0.2, 1.51) low 0.55 (0.2, 1.51) low risk of bias, imprecision
9 Febuxostat 80mg Probenecid 2g NA NA 0.45 (0.16, 1.3) very low 0.45 (0.16, 1.3) very low risk of bias, imprecision
10 Probenecid 2g Placebo NA NA 1.21 (0.43, 3.41) very low 1.21 (0.43, 3.41) very low risk of bias, imprecision
Estimates presented correspond to Treatment 1 (intervention) compared with Treatment 2 (comparison). Number above 1 indicate a larger risk of gout flares with Treatment 1
(favors Treatment 2); while numbers below 1 indicate a larger risk of gout flares with Treatment 2 (favors treatment 1).

17
Figure 4: Network plot for proportion of patients with serum urate <6.0mg/dL at longest
follow-up (range: 28 days to 24 months)
18
Table 5: Estimates and certainty for proportion of patients with serum urate <6.0mg/dL at longest follow-up (range: 28 days to 24 months)
(Measured as proportion of patients with serum urate <6.0mg/dL – analyzed using relative risk)
Comparison Direct estimate Indirect estimate Network estimate
Intervention Comparator Point estimate
(95% CI) Certainty
Point estimate
(95% CI) Certainty
Point estimate
(95% CI) Certainty Reasons
1 Allopurinol 300mg
+ Lesinurad 200mg Allopurinol 300mg 1.98 (1.64, 2.4) high NA NA 1.98 (1.47, 2.66) high NA
2 Biweekly
Pegloticase 8mg Allopurinol 300mg NA NA 0.83 (0.11, 6.4) low 0.83 (0.11, 6.4) low RoB, imprecision
3 Febuxostat 120mg Allopurinol 300mg 1.5 (0.92, 2.45) low 2.11 (1.59, 2.8) low 1.7 (1.43, 2.02) moderate RoB
4 Febuxostat 240mg Allopurinol 300mg 2.29 (1.72, 3.05) moderate 1.54 (0.94, 2.53) very low 2 (1.48, 2.68) moderate RoB
5 Febuxostat 30mg
bid Allopurinol 300mg NA NA 0.43 (0.24, 0.75) low 0.43 (0.24, 0.75) low RoB, inconsistency
6 Febuxostat 40mg Allopurinol 300mg 1.04 (0.89, 1.21) very low 1.04 (0.77, 1.4) very low 1.03 (0.88, 1.21) very low RoB, inconsistency,
imprecision
7 Febuxostat 40mg
XR Allopurinol 300mg NA NA 0.74 (0.55, 0.99) low 0.74 (0.55, 0.99) low
RoB, inconsistency,
imprecision
8 Febuxostat 80mg Allopurinol 300mg 1.68 (1.31, 2.14) low 1.27 (0.88, 1.84) low 1.55 (1.34, 1.79) low RoB, inconsistency
9 Febuxostat 80mg +
Lesinurad 200mg Allopurinol 300mg NA NA 0.51 (0.34, 0.79) low 0.51 (0.34, 0.79) low RoB, inconsistency
10 Febuxostat 80mg
XR Allopurinol 300mg NA NA 0.62 (0.47, 0.83) low 0.62 (0.47, 0.83) moderate
RoB, inconsistency,
imprecision
11 Monthly Pegloticase
8mg Allopurinol 300mg NA NA 0.97 (0.13, 7.57) low 0.97 (0.13, 7.57) low RoB, imprecision
12 Allopurinol 300mg Placebo 36.11 (9.06, 143.87) moderate 13.42 (7.35,
24.49) low 15.99 (9.2, 27.78) moderate RoB
13 Allopurinol 300mg
+ Lesinurad 200mg
Biweekly
Pegloticase 8mg NA NA 1.64 (0.21, 12.93) low 1.64 (0.21, 12.93) low RoB, imprecision

19
14 Allopurinol 300mg
+ Lesinurad 200mg Febuxostat 120mg NA NA 1.16 (0.82, 1.64) low 1.16 (0.82, 1.64) low RoB, imprecision
15 Allopurinol 300mg
+ Lesinurad 200mg Febuxostat 240mg NA NA 0.99 (0.65, 1.51) low 0.99 (0.65, 1.51) low RoB, imprecision
16 Allopurinol 300mg
+ Lesinurad 200mg
Febuxostat 30mg
bid NA NA 0.85 (0.45, 1.6) low 0.85 (0.45, 1.6) low RoB, imprecision
17 Allopurinol 300mg
+ Lesinurad 200mg Febuxostat 40mg NA NA 1.91 (1.36, 2.68) low 1.91 (1.36, 2.68) low RoB, inconsistency
18 Allopurinol 300mg
+ Lesinurad 200mg
Febuxostat 40mg
XR NA NA 1.46 (0.97, 2.22) low 1.46 (0.97, 2.22) low RoB, imprecision
19 Allopurinol 300mg
+ Lesinurad 200mg Febuxostat 80mg NA NA 1.28 (0.92, 1.78) very low 1.28 (0.92, 1.78) very low
RoB, inconsistency,
imprecision
20 Allopurinol 300mg
+ Lesinurad 200mg
Febuxostat 80mg +
Lesinurad 200mg NA NA 1.02 (0.6, 1.71) low 1.02 (0.6, 1.71) low RoB, imprecision
21 Allopurinol 300mg
+ Lesinurad 200mg
Febuxostat 80mg
XR NA NA 1.23 (0.81, 1.86) low 1.23 (0.81, 1.86) low RoB, imprecision
22 Allopurinol 300mg
+ Lesinurad 200mg
Monthly
Pegloticase 8mg NA NA 1.93 (0.24, 15.3) low 1.93 (0.24, 15.3) low RoB, imprecision
23 Allopurinol 300mg
+ Lesinurad 200mg Placebo NA NA
31.61 (16.87,
59.23) moderate
31.61 (16.87,
59.23) moderate RoB
24 Biweekly
Pegloticase 8mg Febuxostat 120mg NA NA 0.71 (0.09, 5.46) low 0.71 (0.09, 5.46) low RoB, imprecision
25 Biweekly
Pegloticase 8mg Febuxostat 240mg NA NA 0.6 (0.08, 4.72) low 0.6 (0.08, 4.72) low RoB, imprecision
26 Biweekly
Pegloticase 8mg
Febuxostat 30mg
bid NA NA 0.52 (0.06, 4.24) low 0.52 (0.06, 4.24) low RoB, imprecision
27 Biweekly
Pegloticase 8mg Febuxostat 40mg NA NA 1.16 (0.15, 8.97) low 1.16 (0.15, 8.97) low RoB, imprecision
28 Biweekly
Pegloticase 8mg
Febuxostat 40mg
XR NA NA 0.89 (0.11, 6.95) low 0.89 (0.11, 6.95) low RoB, imprecision
29 Biweekly
Pegloticase 8mg Febuxostat 80mg NA NA 0.78 (0.1, 5.98) low 0.78 (0.1, 5.98) low RoB, imprecision
20
30 Biweekly
Pegloticase 8mg
Febuxostat 80mg +
Lesinurad 200mg NA NA 0.62 (0.08, 4.95) low 0.62 (0.08, 4.95) low RoB, imprecision
31 Biweekly
Pegloticase 8mg
Febuxostat 80mg
XR NA NA 0.75 (0.1, 5.84) low 0.75 (0.1, 5.84) low RoB, imprecision
32 Biweekly
Pegloticase 8mg
Monthly
Pegloticase 8mg 1.32 (0.44, 3.95) low
0.37 (0,
123434.1) very low 1.17 (0.74, 1.86) low RoB, imprecision
33 Biweekly
Pegloticase 8mg Placebo 9.6 (1.39, 66.26) low NA NA 19.26 (2.7, 137.57) moderate RoB
34 Febuxostat 120mg Febuxostat 240mg 0.92 (0.85, 1) moderate 0.66 (0.37, 1.21) low 0.85 (0.64, 1.14) low RoB, imprecision
35 Febuxostat 120mg Febuxostat 30mg
bid NA NA 0.73 (0.41, 1.28) low 0.73 (0.41, 1.28) low RoB, imprecision
36 Febuxostat 120mg Febuxostat 40mg 1.94 (1.38, 2.73) moderate 1.5 (1.19, 1.9) low 1.64 (1.37, 1.97) moderate RoB
37 Febuxostat 120mg Febuxostat 40mg
XR NA NA 1.26 (0.94, 1.7) low 1.26 (0.94, 1.7) low RoB, imprecision
38 Febuxostat 120mg Febuxostat 80mg 1.08 (1.01, 1.17) moderate 0.96 (0.63, 1.46) very low 1.1 (0.95, 1.28) very low RoB, incoherence,
imprecision
39 Febuxostat 120mg Febuxostat 80mg +
Lesinurad 200mg NA NA 0.87 (0.57, 1.34) low 0.87 (0.57, 1.34) low RoB, imprecision
40 Febuxostat 120mg Febuxostat 80mg
XR NA NA 1.06 (0.79, 1.42) low 1.06 (0.79, 1.42) low RoB, imprecision
41 Febuxostat 120mg Monthly
Pegloticase 8mg NA NA 1.66 (0.21, 12.89) low 1.66 (0.21, 12.89) low RoB, imprecision
42 Febuxostat 120mg Placebo 28.66 (6.9, 119.11) moderate 21.31 (11.47,
39.61) moderate
27.21 (15.62,
47.39) moderate RoB
43 Febuxostat 30mg
bid Febuxostat 240mg NA NA 0.85 (0.46, 1.58) low 0.85 (0.46, 1.58) low RoB, imprecision
44 Febuxostat 240mg Febuxostat 40mg NA NA 1.93 (1.42, 2.63) moderate 1.93 (1.42, 2.63) moderate RoB
45 Febuxostat 240mg Febuxostat 40mg
XR NA NA 1.48 (1, 2.17) low 1.48 (1, 2.17) low RoB, imprecision
46 Febuxostat 240mg Febuxostat 80mg 1.23 (1.08, 1.41) moderate 1.42 (0.83, 2.45) low 1.29 (0.97, 1.72) very low RoB, incoherence,
imprecision

21
47 Febuxostat 240mg Febuxostat 80mg +
Lesinurad 200mg NA NA 1.03 (0.63, 1.68) low 1.03 (0.63, 1.68) low RoB, imprecision
48 Febuxostat 80mg
XR Febuxostat 240mg NA NA 1.24 (0.85, 1.82) low 1.24 (0.85, 1.82) low RoB, imprecision
49 Febuxostat 240mg Monthly
Pegloticase 8mg NA NA 1.94 (0.25, 15.34) low 1.94 (0.25, 15.34) low RoB, imprecision
50 Febuxostat 240mg Placebo 93.98 (3.15, 2802.4) moderate 28.56 (15.12,
53.95) moderate
31.91 (17.41,
58.45) moderate RoB, imprecision
51 Febuxostat 30mg
bid Febuxostat 40mg NA NA 2.26 (1.29, 3.97) moderate 2.26 (1.29, 3.97) moderate RoB
52 Febuxostat 30mg
bid
Febuxostat 40mg
XR NA NA 1.73 (0.94, 3.17) low 1.73 (0.94, 3.17) low RoB, imprecision
53 Febuxostat 30mg
bid Febuxostat 80mg 1.52 (0.97, 2.39) low
2.04 (0.03,
157.47) very low 1.51 (0.88, 2.6) low RoB, imprecision
54 Febuxostat 30mg
bid
Febuxostat 80mg +
Lesinurad 200mg NA NA 1.2 (0.61, 2.36) low 1.2 (0.61, 2.36) low RoB, imprecision
55 Febuxostat 30mg
bid
Febuxostat 80mg
XR NA NA 1.45 (0.8, 2.66) low 1.45 (0.8, 2.66) low RoB, imprecision
56 Febuxostat 30mg
bid
Monthly
Pegloticase 8mg NA NA 2.28 (0.27, 18.87) very low 2.28 (0.27, 18.87) low RoB, imprecision
57 Febuxostat 30mg
bid Placebo 22.85 (1.48, 353.5) low
36.82 (16.78,
80.81) moderate
37.37 (17.54,
79.62) moderate RoB
58 Febuxostat 40mg
XR Febuxostat 40mg 1.23 (0.97, 1.54) moderate 1.36 (0.8, 2.31) low 1.31 (1, 1.71) low RoB
59 Febuxostat 40mg Febuxostat 80mg 0.68 (0.62, 0.74) moderate 0.72 (0.49, 1.05) very low 0.67 (0.58, 0.77) moderate RoB
60 Febuxostat 40mg Febuxostat 80mg +
Lesinurad 200mg NA NA 0.53 (0.35, 0.81) low 0.53 (0.35, 0.81) moderate RoB
61 Febuxostat 80mg
XR Febuxostat 40mg 1.53 (1.22, 1.91) high 1.55 (0.93, 2.6) low 1.55 (1.19, 2.03) moderate RoB, imprecision
62 Febuxostat 40mg Monthly
Pegloticase 8mg NA NA 1.01 (0.13, 7.83) low 1.01 (0.13, 7.83) low RoB, imprecision
63 Febuxostat 40mg Placebo 11.69 (6.6, 20.71) moderate 10.52 (5.42, 20.4) low 16.54 (9.53, 28.73) moderate RoB

22
64 Febuxostat 40mg
XR Febuxostat 80mg 0.84 (0.7, 1) moderate 0.98 (0.51, 1.87) low 0.87 (0.67, 1.14) low RoB, imprecision
65 Febuxostat 40mg
XR
Febuxostat 80mg +
Lesinurad 200mg NA NA 0.69 (0.43, 1.12) low 0.69 (0.43, 1.12) low RoB, imprecision
66 Febuxostat 80mg
XR
Febuxostat 40mg
XR 1.25 (1.1, 1.42) high NA NA 1.19 (0.89, 1.59) low RoB, imprecision
67 Febuxostat 40mg
XR
Monthly
Pegloticase 8mg NA NA 1.32 (0.17, 10.34) low 1.32 (0.17, 10.34) low RoB, imprecision
68 Febuxostat 40mg
XR Placebo 30.8 (3.51, 269.91) moderate
15.36 (7.87,
29.96) moderate 21.6 (11.96, 39.02) moderate RoB
69 Febuxostat 80mg +
Lesinurad 200mg Febuxostat 80mg 1.26 (0.99, 1.59) moderate NA NA 1.26 (0.84, 1.88) low RoB, imprecisiom
70 Febuxostat 80mg
XR Febuxostat 80mg 1.04 (0.88, 1.23) moderate 1.16 (0.62, 2.18) low 1.04 (0.8, 1.35) low RoB, imprecisiom
71 Febuxostat 80mg Monthly
Pegloticase 8mg NA NA 1.51 (0.19, 11.67) low 1.51 (0.19, 11.67) low RoB, imprecision
72 Febuxostat 80mg Placebo 25.61 (8.87, 73.93) moderate 68.11 (4.51,
1028.69) low
24.73 (14.43,
42.38) moderate RoB
73 Febuxostat 80mg +
Lesinurad 200mg
Febuxostat 80mg
XR NA NA 1.21 (0.75, 1.95) low 1.21 (0.75, 1.95) low RoB, imprecision
74 Febuxostat 80mg +
Lesinurad 200mg
Monthly
Pegloticase 8mg NA NA 1.9 (0.24, 15.26) low 1.9 (0.24, 15.26) low RoB, imprecision
75 Febuxostat 80mg +
Lesinurad 200mg Placebo NA NA
31.11 (15.88,
60.91) moderate
31.11 (15.88,
60.91) moderate RoB
76 Febuxostat 80mg
XR
Monthly
Pegloticase 8mg NA NA 1.57 (0.2, 12.29) low 1.57 (0.2, 12.29) low RoB, imprecision
77 Febuxostat 80mg
XR Placebo 35.29 (3.08, 403.99) moderate
18.18 (9.35,
35.37) moderate 25.69 (14.26, 46.3) moderate RoB
78 Monthly Pegloticase
8mg Placebo 7.2 (1.03, 50.31) low
5.33 x 10¹⁴ (2.98
x 102, 9.54 x 1026) moderate 16.41 (2.28, 118.2) moderate RoB
Estimates presented correspond to Treatment 1 (intervention) compared with Treatment 2 (comparison). Number above 1 indicate a greater number of patients with serum urate
<6.0mg/dL with Treatment 1 (favors Treatment 1); while numbers below 1 indicate a greater number of patients with serum urate <6.0mg/dL with Treatment 2 (favors treatment
2).

23
Table 6: Estimates and certainty for proportion of patients with pain closest to 3 months (follow up: 28 days).
(Measured as proportion of patients with subjective adverse event of pain – analyzed as relative risk)
Comparison Direct estimate Indirect estimate Network estimate
Intervention Comparator Point estimate
(95% CI) Certainty
Point estimate
(95% CI) Certainty
Point
estimate
(95% CI)
Certainty Reasons
1 Febuxostat 40mg Placebo 1.59 (0.27, 9.3) low NA NA NA NA risk of bias, imprecision
2 Febuxostat 80mg Placebo 0.73 (0.11, 5.12) low NA NA NA NA NA
3 Febuxostat 120mg Placebo 0.51 (0.06, 4.2) very low NA NA NA NA risk of bias, imprecision
4 Febuxostat 120mg Febuxostat 40mg 0.32 (0.07, 1.51) low NA NA NA NA NA
5 Febuxostat 40mg Febuxostat 80mg 2.16 (0.39, 11.89) very low NA NA NA NA risk of bias, imprecision
6 Febuxostat 120mg Febuxostat 80mg 0.7 (0.09, 5.43) very low NA NA NA NA risk of bias, imprecision
Estimates presented correspond to Treatment 1 (intervention) compared with Treatment 2 (comparison). Number above 1 indicate a larger risk of pain with Treatment 1 (favors
Treatment 2); while numbers below 1 indicate a larger risk of pain with Treatment 2 (favors treatment 1).

24
Table 7: Estimates and certainty for change in pain score at longest follow-up (0 to 6.25 months).
(Measured using 0 to 100mm visual analogue scale, where higher scores are worse – analyzed using mean difference)
Comparison Direct estimate Indirect estimate Network estimate
Intervention Comparator Point estimate
(95% CI) Certainty
Point
estimate
(95% CI)
Certainty
Point
estimate
(95% CI)
Certainty Reasons
1 Biweekly pegloticase 8
mg
Placebo -12.80 (-27.53, 1.93) very low NA NA NA NA risk of bias, imprecision
2 Monthly pegloticase 8
mg
Placebo -8.30 (-22.33, 5.73) very low NA NA NA NA risk of bias, imprecision
3 Biweekly pegloticase 8
mg
Monthly pegloticase 8
mg
-4.50 (-14.10, 5.10) very low NA NA NA NA risk of bias, imprecision
Estimates presented correspond to Treatment 1 (intervention) compared with Treatment 2 (comparison). Positive numbers indicate a larger reduction of pain levels with Treatment
2 (favors Treatment 2); while negative numbers indicate a larger reduction of pain levels with Treatment 1 (favors treatment 1).

25
Table 8: Estimates and certainty for change patient global assessment as measured on 100mm visual analogue scale at longest follow-up (0 to 6.25 months)
(Measured using 0 to 100mm visual analogue scale, where higher scores are better – analyzed using mean difference)
Comparison Direct estimate Indirect estimate Network estimate
Intervention Comparator Point estimate
(95% CI) Certainty
Point
estimate
(95% CI)
Certainty
Point
estimate
(95% CI)
Certainty Reasons
1 Biweekly pegloticase 8
mg
Placebo 12.69 (0.36, 25.02) moderate NA NA NA NA risk of bias
2 Monthly pegloticase 8
mg
Placebo 13.48 (0.31, 26.65) moderate NA NA NA NA risk of bias
3 Biweekly pegloticase 8
mg
Monthly pegloticase 8
mg
-4.5 (-14.1, 5.1) low NA NA NA NA risk of bias, imprecision
Estimates presented correspond to Treatment 1 (intervention) compared with Treatment 2 (comparison). Positive numbers indicate a larger improvement in patient global
assessment with Treatment 1 (favors Treatment 1); while negative numbers indicate a larger improvement in patient global assessment with Treatment 2 (favors treatment 2).
26
Figure 5: Network plot for proportion of patients with tophus resolution at longest follow-
up (range: 0 to 24 months)
27
Table 9: Estimates and certainty for proportion of patients with tophus resolution at longest follow-up (range: 0 to 24 months)
(Measured as proportion of patients with resolution of at least 1 tophus – analyzed using relative risk)
Comparison Direct estimate Indirect estimate Network estimate
Intervention Comparator Point estimate
(95% CI) Certainty
Point estimate
(95% CI) Certainty
Point estimate
(95% CI) Certainty Reasons
DIRECT COMPARISON ONLY
1 Biweekly
pegloticase 8 mg Placebo 5.45 (0.80, 36.99) very low NA NA NA NA
risk of bias,
imprecision
2 Monthly pegloticase
8 mg Placebo 2.86 (0.40, 20.26) low NA NA NA NA
risk of bias,
imprecision
3 Biweekly
pegloticase 8 mg
Monthly pegloticase
8 mg 1.91 (1.01, 3.55) moderate NA NA NA NA risk of bias,
NETWORK COMPARISONS
1 Allopurinol 300mg
+ Lesinurad 200mg Allopurinol 300mg 0.43 (0.05, 3.89) moderate NA NA 0.43 (0.05, 3.89) low imprecision
2 Febuxostat 80mg Allopurinol 300mg 2.04 (0.39, 10.66) very low NA NA 2.04 (0.09, 44.64) very low risk of bias,
imprecision
3 Allopurinol 300mg Febuxostat 80mg +
Lesinurad 200mg NA NA 0.45 (0.01, 26.07) very low 0.45 (0.01, 26.07) very low
risk of bias,
imprecision
4 Allopurinol 300mg Probenecid 2g 1.33 (0.27, 6.61) very low NA NA 1.33 (0.06, 28.43) very low risk of bias,
imprecision
5 Allopurinol 300mg
+ Lesinurad 200mg Febuxostat 80mg NA NA 0.21 (0, 9.35) very low 0.21 (0, 9.35) very low
risk of bias,
imprecision
6 Allopurinol 300mg
+ Lesinurad 200mg
Febuxostat 80mg +
Lesinurad 200mg NA NA 0.19 (0, 19.56) very low 0.19 (0, 19.56) very low
risk of bias,
imprecision
7 Allopurinol 300mg
+ Lesinurad 200mg Probenecid 2g NA NA 0.57 (0.01, 24.8) very low 0.57 (0.01, 24.8) very low
risk of bias,
imprecision
8 Febuxostat 80mg +
Lesinurad 200mg Febuxostat 80mg 1.08 (0.81, 1.45) low NA NA 1.08 (0.08, 14.95) very low
risk of bias,
imprecision

28
9 Febuxostat 80mg Probenecid 2g NA NA 2.72 (0.04,
209.97) very low 2.72 (0.04, 209.97) very low
risk of bias,
imprecision
10 Febuxostat 80mg +
Lesinurad 200mg Probenecid 2g NA NA
2.94 (0.02,
472.67) very low 2.94 (0.02, 472.67) very low
risk of bias,
imprecision
Estimates presented correspond to Treatment 1 (intervention) compared with Treatment 2 (comparison). Number above 1 indicate a greater number of patients with tophus
resolution with Treatment 1 (favors Treatment 1); while numbers below 1 indicate a greater number of patients tophus resolution with Treatment 2 (favors treatment 2).

29
Table 10: Estimates and certainty for change in health-related quality of life at longest follow-up (0 to 6.25 months)
(Measured using physical component summary (PCS) score of 36-Item Short Form Health Survey (SF-36), where higher scores are better – analyzed using mean difference)
Comparison Direct estimate Indirect estimate Network estimate
Intervention Comparator Point estimate
(95% CI) Certainty
Point
estimate
(95% CI)
Certainty
Point
estimate
(95% CI)
Certainty Reasons
1 Biweekly pegloticase 8
mg
Placebo 4.70 (0.35, 9.05) moderate NA NA NA NA risk of bias
2 Monthly pegloticase 8
mg
Placebo 5.20 (0.95, 9.45) moderate NA NA NA NA risk of bias
3 Biweekly pegloticase 8
mg
Monthly pegloticase 8
mg
-0.5 (-3.33, 2.33) low NA NA NA NA risk of bias, imprecision
Estimates presented correspond to Treatment 1 (intervention) compared with Treatment 2 (comparison). Positive numbers indicate a larger improvement in health-related quality
of life with Treatment 1 (favors Treatment 1); while negative numbers indicate a larger improvement in health-related quality of life with Treatment 2 (favors treatment 2).

30
Table 11: Estimates and certainty for change in activity limitation at longest follow-up (0 to 6.25 months).
(Measured using Health Assessment Questionnaire-Disability Index score (HAQ-DI), where lower scores are better – analyzed using mean difference)
Comparison Direct estimate Indirect estimate Network estimate
Intervention Comparator Point estimate
(95% CI) Certainty
Point
estimate
(95% CI)
Certainty
Point
estimate
(95% CI)
Certainty Reasons
1 Biweekly pegloticase 8
mg
Placebo -0.24 (-0.46, -0.02) moderate NA NA NA NA risk of bias
2 Monthly pegloticase 8
mg
Placebo -0.22 (-0.43, -0.01) moderate NA NA NA NA risk of bias
3 Biweekly pegloticase 8
mg
Monthly pegloticase 8
mg
-0.02 (-0.21, 0.17) low NA NA NA NA risk of bias, imprecision
Estimates presented correspond to Treatment 1 (intervention) compared with Treatment 2 (comparison). Negative numbers indicate a larger improvement in activity limitation with
Treatment 1 (favors Treatment 1); while positive numbers indicate a larger improvement in activity limitation with Treatment 2 (favors treatment 2).
31
Figure 6: Network plot for proportion of patients with serious adverse events at longest
follow-up (range: 28 days to 24 months)
32
Table 12: Estimates and certainty for proportion of patients with serious adverse events at longest follow-up (range: 28 days to 24 months)
(Measured as proportion of patients with serious adverse events – analyzed with relative risk)
Comparison Direct estimate Indirect estimate Network estimate
Intervention Comparator Point estimate
(95% CI) Certainty
Point estimate
(95% CI) Certainty
Point estimate
(95% CI) Certainty Reasons
1
Allopurinol 300mg
+ Lesinurad
200mg
Allopurinol 300mg 0.95 (0.51, 1.79) moderate NA NA 0.95 (0.5, 1.78) moderate imprecision
2 Allopurinol 300mg Biweekly
pegloticase 8 mg NA NA 0.76 (0.26, 2.19) low 0.76 (0.26, 2.19) low risk of bias, imprecision
3 Febuxostat 120mg Allopurinol 300mg 1.54 (0.73, 3.26) low 1.22 (3.21, 0.46) very low 1.48 (2.42, 0.91) very low risk of bias, imprecision
4 Febuxostat 240mg Allopurinol 300mg 1.43 (0.31, 6.59) low 0.84 (5.52, 0.13) low 1.24 (3.27, 0.47) low risk of bias, imprecision
5 Allopurinol 300mg Febuxostat 30mg
bid NA NA 1.88 (0.7, 5.1) low 1.88 (0.7, 5.1) low risk of bias, imprecision
6 Febuxostat 40mg Allopurinol 300mg 1.3 (0.02, 68.22) very low 1.29 (2.92, 0.57) low 0.77 (1.21, 0.5) very low risk of bias, inconsistency,
imprecision
7 Allopurinol 300mg Febuxostat 40mg
XR NA NA 1.91 (0.79, 4.6) very low 1.91 (0.79, 4.6) very low risk of bias, imprecision
8 Febuxostat 80mg Allopurinol 300mg 1 (0.62, 1.59) low 0.4 (1.52, 0.11) very low 0.95 (1.36, 0.66) low risk of bias, imprecision
9 Febuxostat 80mg
XR
Febuxostat 80mg +
Lesinurad 200mg 1 (0.62, 1.59) low 1.71 (0.6, 4.83) very low 1.71 (0.6, 4.83) low risk of bias, imprecision
10 Allopurinol 300mg Febuxostat 80mg
XR NA NA 1.06 (0.49, 2.31) low 1.06 (0.49, 2.31) low risk of bias, imprecision
11 Febuxostat 80mg +
Lesinurad 200mg
Monthly
pegloticase 8 mg NA NA 0.79 (0.27, 2.28) low 0.79 (0.27, 2.28) low risk of bias, imprecision
12 Allopurinol 300mg Placebo 2.03 (0.58, 7.14) moderate 1.44 (0.79, 2.62) very low 1.54 (0.89, 2.64) low risk of bias, imprecision
13 Allopurinol 300mg Probenecid 2g 0.85 (0.02, 40.83) very low NA NA 0.85 (0.02, 40.83) very low risk of bias, imprecision x2

33
14
Allopurinol 300mg
+ Lesinurad
200mg
Biweekly
pegloticase 8 mg NA NA 0.72 (0.21, 2.47) low 0.72 (0.21, 2.47) low risk of bias, imprecision
15
Allopurinol 300mg
+ Lesinurad
200mg
Febuxostat 120mg NA NA 0.64 (0.29, 1.42) low 0.64 (0.29, 1.42) low risk of bias, imprecision
16
Allopurinol 300mg
+ Lesinurad
200mg
Febuxostat 240mg NA NA 0.76 (0.24, 2.42) low 0.76 (0.24, 2.42) low risk of bias, imprecision
17
Allopurinol 300mg
+ Lesinurad
200mg
Febuxostat 30mg
bid NA NA 1.79 (0.55, 5.81) low 1.79 (0.55, 5.81) low risk of bias, imprecision
18
Allopurinol 300mg
+ Lesinurad
200mg
Febuxostat 40mg NA NA 1.22 (0.57, 2.65) very low 1.22 (0.57, 2.65) very low risk of bias, imprecision x2
19
Allopurinol 300mg
+ Lesinurad
200mg
Febuxostat 40mg
XR NA NA 1.81 (0.61, 5.34) low 1.81 (0.61, 5.34) low risk of bias, imprecision
20
Allopurinol 300mg
+ Lesinurad
200mg
Febuxostat 80mg NA NA 1 (0.48, 2.07) low 1 (0.48, 2.07) low risk of bias, imprecision
21
Allopurinol 300mg
+ Lesinurad
200mg
Febuxostat 80mg +
Lesinurad 200mg NA NA 1.62 (0.48, 5.47) low 1.62 (0.48, 5.47) low risk of bias, imprecision
22
Allopurinol 300mg
+ Lesinurad
200mg
Febuxostat 80mg
XR NA NA 1.01 (0.37, 2.74) low 1.01 (0.37, 2.74) low risk of bias, imprecision
23
Allopurinol 300mg
+ Lesinurad
200mg
Monthly
pegloticase 8 mg NA NA 0.75 (0.22, 2.58) low 0.75 (0.22, 2.58) low risk of bias, imprecision
24
Allopurinol 300mg
+ Lesinurad
200mg
Placebo NA NA 1.46 (0.63, 3.35) low 1.46 (0.63, 3.35) low risk of bias, imprecision
34
25
Allopurinol 300mg
+ Lesinurad
200mg
Probenecid 2g NA NA 0.81 (0.02, 40.76) very low 0.81 (0.02, 40.76) very low risk of bias, imprecision x2
26 Biweekly
pegloticase 8 mg Febuxostat 120mg NA NA 0.89 (0.29, 2.68) low 0.89 (0.29, 2.68) low risk of bias, imprecision
27 Biweekly
pegloticase 8 mg Febuxostat 240mg NA NA 1.06 (0.27, 4.21) low 1.06 (0.27, 4.21) low risk of bias, imprecision
28 Biweekly
pegloticase 8 mg
Febuxostat 30mg
bid NA NA 2.48 (0.66, 9.28) low 2.48 (0.66, 9.28) low risk of bias, imprecision
29 Biweekly
pegloticase 8 mg Febuxostat 40mg NA NA 1.7 (0.61, 4.74) low 1.7 (0.61, 4.74) low risk of bias, imprecision
30 Biweekly
pegloticase 8 mg
Febuxostat 40mg
XR NA NA 2.52 (0.72, 8.76) low 2.52 (0.72, 8.76) low risk of bias, imprecision
31 Biweekly
pegloticase 8 mg Febuxostat 80mg NA NA 1.39 (0.5, 3.88) low 1.39 (0.5, 3.88) low risk of bias, imprecision
32 Biweekly
pegloticase 8 mg
Febuxostat 80mg +
Lesinurad 200mg NA NA 2.25 (0.55, 9.29) low 2.25 (0.55, 9.29) low risk of bias, imprecision
33 Biweekly
pegloticase 8 mg
Febuxostat 80mg
XR NA NA 1.4 (0.43, 4.54) low 1.4 (0.43, 4.54) low risk of bias, imprecision
34 Biweekly
pegloticase 8 mg
Monthly
pegloticase 8 mg 1.04 (0.6, 1.8) low NA NA 1.04 (0.6, 1.8) low risk of bias, imprecision
35 Biweekly
pegloticase 8 mg Placebo 1.98 (0.83, 4.73) low NA NA 2.02 (0.82, 5.02) low risk of bias, imprecision
36 Biweekly
pegloticase 8 mg Probenecid 2g NA NA 1.12 (0.02, 62) very low 1.12 (0.02, 62) very low risk of bias, imprecision x2
37 Febuxostat 120mg Febuxostat 240mg NA NA 5.06 (0.46, 56.2) very low 1.2 (0.45, 3.19) very low risk of bias, imprecision x2
38 Febuxostat 120mg Febuxostat 30mg
bid NA NA 2.8 (0.99, 7.94) very low 2.8 (0.99, 7.94) very low risk of bias, imprecision x2
39 Febuxostat 120mg Febuxostat 40mg 4.87 (0.24, 98.1) very low 1.88 (1.04, 3.4) very low 1.92 (1.08, 3.41) very low risk of bias, inconsistency,
imprecision
40 Febuxostat 120mg Febuxostat 40mg
XR NA NA 2.83 (1.11, 7.27) very low 2.83 (1.11, 7.27) very low risk of bias, imprecision x2

35
41 Febuxostat 120mg Febuxostat 80mg 1.42 (0.81, 2.51) very low 3.04 (1.03, 8.96) low 1.56 (0.98, 2.5) very low risk of bias, inconsistency,
imprecision
42 Febuxostat 120mg Febuxostat 80mg +
Lesinurad 200mg NA NA 2.54 (0.86, 7.49) very low 2.54 (0.86, 7.49) very low risk of bias, imprecision x2
43 Febuxostat 120mg Febuxostat 80mg
XR NA NA 1.57 (0.67, 3.68) very low 1.57 (0.67, 3.68) very low risk of bias, imprecision x2
44 Febuxostat 120mg Monthly
pegloticase 8 mg NA NA 1.17 (0.39, 3.56) low 1.17 (0.39, 3.56) low risk of bias, imprecision
45 Febuxostat 120mg Placebo 2.03 (0.31, 13.53) very low 2.25 (1.09, 4.64) very low 2.28 (1.21, 4.29) very low risk of bias, imprecision x2
46 Febuxostat 120mg Probenecid 2g NA NA 1.27 (0.03, 62.5) very low 1.27 (0.03, 62.5) very low risk of bias, imprecision x2
47 Febuxostat 240mg Febuxostat 30mg
bid NA NA 2.34 (0.62, 8.86) low 2.34 (0.62, 8.86) low risk of bias, imprecision
48 Febuxostat 240mg Febuxostat 40mg NA NA 1.6 (0.58, 4.41) low 1.6 (0.58, 4.41) low risk of bias, imprecision
49 Febuxostat 240mg Febuxostat 40mg
XR NA NA 2.37 (0.68, 8.31) low 2.37 (0.68, 8.31) low risk of bias, imprecision
50 Febuxostat 240mg Febuxostat 80mg 0.91 (0.28, 2.98) low 9.74 (0.87,
109.43) low 1.31 (0.5, 3.39) low risk of bias, imprecision
51 Febuxostat 240mg Febuxostat 80mg +
Lesinurad 200mg NA NA 2.12 (0.54, 8.3) low 2.12 (0.54, 8.3) low risk of bias, imprecision
52 Febuxostat 240mg Febuxostat 80mg
XR NA NA 1.32 (0.4, 4.31) low 1.32 (0.4, 4.31) low risk of bias, imprecision
53 Febuxostat 240mg Monthly
pegloticase 8 mg NA NA 0.98 (0.25, 3.91) low 0.98 (0.25, 3.91) low risk of bias, imprecision
54 Febuxostat 240mg Placebo 2.51 (0.2, 31.38) very low 1.58 (0.41, 6.1) very low 1.91 (0.68, 5.38) low risk of bias, imprecision
55 Febuxostat 240mg Probenecid 2g NA NA 1.06 (0.02, 57.15) very low 1.06 (0.02, 57.15) very low risk of bias, imprecision x2
56 Febuxostat 30mg
bid Febuxostat 40mg NA NA 0.69 (0.25, 1.84) low 0.69 (0.25, 1.84) low risk of bias, imprecision
57 Febuxostat 30mg
bid
Febuxostat 40mg
XR NA NA 1.01 (0.3, 3.45) very low 1.01 (0.3, 3.45) low risk of bias, imprecision
58 Febuxostat 30mg
bid Febuxostat 80mg 0.63 (0.23, 1.71) low 0.24 (0.01, 3.85) low 0.56 (0.22, 1.44) low risk of bias, imprecision

36
59 Febuxostat 30mg
bid
Febuxostat 80mg +
Lesinurad 200mg NA NA 0.91 (0.23, 3.53) low 0.91 (0.23, 3.53) low risk of bias, imprecision
60 Febuxostat 30mg
bid
Febuxostat 80mg
XR NA NA 0.56 (0.18, 1.79) low 0.56 (0.18, 1.79) low risk of bias, imprecision
61 Febuxostat 30mg
bid
Monthly
pegloticase 8 mg NA NA 0.42 (0.11, 1.57) low 0.42 (0.11, 1.57) low risk of bias, imprecision
62 Febuxostat 30mg
bid Placebo 0.71 (0.21, 2.44) low 1.69 (0.15, 19.45) low 0.82 (0.31, 2.12) low risk of bias, imprecision
63 Febuxostat 30mg
bid Probenecid 2g NA NA 0.45 (0.01, 24.58) very low 0.45 (0.01, 24.58) very low risk of bias, imprecision x2
64 Febuxostat 40mg
XR Febuxostat 40mg 0.54 (0.17, 1.74) low 2.08 (0.24, 17.83) very low 0.68 (0.3, 1.54) low risk of bias, imprecision
65 Febuxostat 40mg Febuxostat 80mg 0.77 (0.47, 1.26) moderate 0.62 (0.25, 1.54) low 0.82 (0.54, 1.23) moderate imprecision
66 Febuxostat 40mg Febuxostat 80mg +
Lesinurad 200mg NA NA 1.32 (0.46, 3.81) very low 1.32 (0.46, 3.81) very low risk of bias, imprecision x2
67 Febuxostat 80mg
XR Febuxostat 40mg 0.97 (0.23, 4.09) low 4.31 (0.87, 21.23) very low 1.22 (0.6, 2.47) low risk of bias, imprecision
68 Febuxostat 40mg Monthly
pegloticase 8 mg NA NA 0.61 (0.22, 1.71) low 0.61 (0.22, 1.71) low risk of bias, imprecision
69 Febuxostat 40mg Placebo 1.14 (0.59, 2.18) moderate 0.9 (0.37, 2.18) very low 1.19 (0.74, 1.91) moderate imprecision
70 Febuxostat 40mg Probenecid 2g NA NA 0.66 (0.01, 32.45) very low 0.66 (0.01, 32.45) very low risk of bias, imprecision x2
71 Febuxostat 40mg
XR Febuxostat 80mg 0.78 (0.21, 2.87) low 0.18 (0.04, 0.88) low 0.55 (0.24, 1.28) low risk of bias, imprecision
72 Febuxostat 40mg
XR
Febuxostat 80mg +
Lesinurad 200mg NA NA 0.89 (0.25, 3.24) low 0.89 (0.25, 3.24) low risk of bias, imprecision
73 Febuxostat 80mg
XR
Febuxostat 40mg
XR 1.65 (0.64, 4.23) low 3333.33 (0.55, ∞) very low 1.8 (0.73, 4.42) low risk of bias, imprecision
74 Febuxostat 40mg
XR
Monthly
pegloticase 8 mg NA NA 0.41 (0.12, 1.45) low 0.41 (0.12, 1.45) low risk of bias, imprecision
75 Febuxostat 40mg
XR Placebo 0.76 (0.19, 3.13) low 0.67 (0.13, 3.54) low 0.8 (0.34, 1.89) low risk of bias, imprecision

37
76 Febuxostat 40mg
XR Probenecid 2g NA NA 0.45 (0.01, 23.6) very low 0.45 (0.01, 23.6) very low risk of bias, imprecision x2
77 Febuxostat 80mg +
Lesinurad 200mg Febuxostat 80mg 0.62 (0.23, 1.64) low NA NA 0.62 (0.23, 1.64) low risk of bias, imprecision
78 Febuxostat 80mg
XR Febuxostat 80mg 1.22 (0.36, 4.2) low 0.67 (0.2, 2.25) low 0.99 (0.48, 2.07) low risk of bias, imprecision
79 Febuxostat 80mg Monthly
pegloticase 8 mg NA NA 0.75 (0.27, 2.1) low 0.75 (0.27, 2.1) low risk of bias, imprecision
80 Febuxostat 80mg Placebo 1.13 (0.52, 2.43) low 1.85 (0.77, 4.45) low 1.46 (0.9, 2.36) low risk of bias, imprecision
81 Febuxostat 80mg Probenecid 2g NA NA 0.81 (0.02, 39.4) very low 0.81 (0.02, 39.4) very low risk of bias, imprecision x2
82 Febuxostat 80mg +
Lesinurad 200mg
Febuxostat 80mg
XR NA NA 0.62 (0.18, 2.11) low 0.62 (0.18, 2.11) low risk of bias, imprecision
83 Febuxostat 80mg +
Lesinurad 200mg
Monthly
pegloticase 8 mg NA NA 0.46 (0.11, 1.91) low 0.46 (0.11, 1.91) low risk of bias, imprecision
84 Febuxostat 80mg +
Lesinurad 200mg Placebo NA NA 0.9 (0.3, 2.67) low 0.9 (0.3, 2.67) low risk of bias, imprecision
85 Febuxostat 80mg +
Lesinurad 200mg Probenecid 2g NA NA 0.5 (0.01, 27.43) very low 0.5 (0.01, 27.43) very low risk of bias, imprecision x2
86 Febuxostat 80mg
XR
Monthly
pegloticase 8 mg NA NA 0.74 (0.23, 2.43) low 0.74 (0.23, 2.43) low risk of bias, imprecision
87 Febuxostat 80mg
XR Placebo 1.22 (0.32, 4.7) low 1.96 (0.53, 7.22) low 1.45 (0.68, 3.07) low risk of bias, imprecision
88 Febuxostat 80mg
XR Probenecid 2g NA NA 0.8 (0.02, 41.59) very low 0.8 (0.02, 41.59) very low risk of bias, imprecision x2
89 Monthly
pegloticase 8 mg Placebo 1.95 (0.57, 6.66) low NA NA 1.95 (0.78, 4.85) low risk of bias, imprecision
90 Monthly
pegloticase 8 mg Probenecid 2g NA NA 1.08 (0.02, 59.68) very low 1.08 (0.02, 59.68) very low risk of bias, imprecision x2
91 Probenecid 2g Placebo NA NA 1.8 (0.04, 89.29) very low 1.8 (0.04, 89.29) very low risk of bias, imprecision x2
Estimates presented correspond to Treatment 1 (intervention) compared with Treatment 2 (comparison). Number above 1 indicate a larger risk of serious adverse events with
Treatment 1 (favors Treatment 2); while numbers below 1 indicate a larger risk of serious adverse events with Treatment 2 (favors treatment 1).

38
Figure 7: Network plot for proportion of patients with cardiovascular-related serious,
Longest follow-up (range: 28 day to median of 32 months)

39
Table 13: Estimates and certainty for proportion of patients with cardiovascular-related serious, longest follow-up (range: 28 day to median of 32 months)
Comparison Direct estimate Indirect estimate Network estimate
Intervention Comparator Point estimate
(95% CI) Certainty
Point estimate
(95% CI) Certainty
Point estimate
(95% CI) Certainty Reasons
1 Allopurinol 300mg
+ Lesinurad 200mg Allopurinol 300mg 0.95 (0.49, 1.83) moderate NA NA 0.95 (0.49, 1.83) moderate imprecision
2 Febuxostat 120mg Allopurinol 300mg 2.18 (0.19, 24.97) very low 1.01 (0.23, 4.51) low 1.51 (0.51, 4.44) low Risk of bias,
imprecision
3 Febuxostat 240mg Allopurinol 300mg 2.01 (0.04, 102.01) very low 0.14 (0, 3.85) very low 0.67 (0.08, 5.65) very low Risk of bias,
imprecisionX2
4 Febuxostat 30mg
bid Allopurinol 300mg NA NA 4.03 (0.21, 78.34) very low 4.03 (0.21, 78.34) very low
Risk of bias,
imprecisionX2
5 Febuxostat 40mg Allopurinol 300mg 1.04 (0.9, 1.2) moderate 1.32 (0.16, 10.92) very low 1.05 (0.91, 1.21) low Risk of bias,
imprecision
6 Febuxostat 40mg
XR Allopurinol 300mg NA NA 0.37 (0.09, 1.57) very low 0.37 (0.09, 1.57) very low
Risk of bias,
imprecisionX2
7 Febuxostat 80mg Allopurinol 300mg 1.19 (0.44, 3.22) low 1.06 (0.38, 2.97) low 1.3 (0.7, 2.45) low Risk of bias,
imprecision
8 Febuxostat 80mg +
Lesinurad 200mg Allopurinol 300mg NA NA 0.25 (0.02, 2.56) very low 0.25 (0.02, 2.56) very low
Risk of bias,
imprecisionX2
9 Febuxostat 80mg
XR Allopurinol 300mg NA NA 0.65 (0.11, 3.92) low 0.65 (0.11, 3.92) low
Risk of bias,
imprecision
10 Allopurinol 300mg Placebo 0.5 (0.03, 7.93) low 0.74 (0.27, 2.01) low 0.72 (0.29, 1.8) low Risk of bias,
imprecision
11 Allopurinol 300mg
+ Lesinurad 200mg Febuxostat 120mg NA NA 0.63 (0.18, 2.22) low 0.63 (0.18, 2.22) low
Risk of bias,
imprecision
12 Allopurinol 300mg
+ Lesinurad 200mg Febuxostat 240mg NA NA 1.41 (0.15, 13.12) very low 1.41 (0.15, 13.12) very low
Risk of bias,
imprecisionX2
13 Allopurinol 300mg
+ Lesinurad 200mg
Febuxostat 30mg
bid NA NA 3.82 (0.18, 79.86) very low 3.82 (0.18, 79.86) very low
Risk of bias,
imprecisionX2

40
14 Allopurinol 300mg
+ Lesinurad 200mg Febuxostat 40mg NA NA 0.91 (0.46, 1.77) low 0.91 (0.46, 1.77) low
Risk of bias,
imprecision
15 Allopurinol 300mg
+ Lesinurad 200mg
Febuxostat 40mg
XR NA NA 0.35 (0.07, 1.72) low 0.35 (0.07, 1.72) very low
Risk of bias,
imprecisionX2
16 Allopurinol 300mg
+ Lesinurad 200mg Febuxostat 80mg NA NA 0.73 (0.29, 1.8) low 0.73 (0.29, 1.8) low
Risk of bias,
imprecision
17 Allopurinol 300mg
+ Lesinurad 200mg
Febuxostat 80mg
+ Lesinurad
200mg
NA NA 0.24 (0.02, 2.66) very low 0.24 (0.02, 2.66) very low Risk of bias,
imprecisionX2
18 Allopurinol 300mg
+ Lesinurad 200mg
Febuxostat 80mg
XR NA NA 0.62 (0.09, 4.17) very low 0.62 (0.09, 4.17) very low
Risk of bias,
imprecisionX2
19 Allopurinol 300mg
+ Lesinurad 200mg Placebo NA NA 0.68 (0.22, 2.11) low 0.68 (0.22, 2.11) low
Risk of bias,
imprecision
20 Febuxostat 120mg Febuxostat 240mg 0.9 (0.31, 2.62) low 0.05 (0, 23582.8) very low 2.25 (0.27, 18.53) very low Risk of bias,
imprecisionX2
21 Febuxostat 120mg Febuxostat 30mg
bid NA NA 6.08 (0.28, 131.74) very low
6.08 (0.28,
131.74) very low
Risk of bias,
imprecisionX2
22 Febuxostat 120mg Febuxostat 40mg 0.97 (0.02, 47.7) very low 1.49 (0.48, 4.58) low 1.44 (0.49, 4.24) low Risk of bias,
imprecision
23 Febuxostat 120mg Febuxostat 40mg
XR NA NA 0.55 (0.1, 3.02) low 0.55 (0.1, 3.02) low
Risk of bias,
imprecision
24 Febuxostat 120mg Febuxostat 80mg 0.83 (0.24, 2.84) low 8.52 (0.49, 147.11) very low 1.16 (0.43, 3.12) low Risk of bias,
imprecision
25 Febuxostat 120mg
Febuxostat 80mg
+ Lesinurad
200mg
NA NA 0.38 (0.03, 4.38) very low 0.38 (0.03, 4.38) very low Risk of bias,
imprecisionX2
26 Febuxostat 120mg Febuxostat 80mg
XR NA NA 0.99 (0.14, 7.22) low 0.99 (0.14, 7.22) low
Risk of bias,
imprecision
27 Febuxostat 120mg Placebo 2.53 (0.08, 84.65) very low 0.68 (0.13, 3.46) low 1.09 (0.32, 3.71) low Risk of bias,
imprecision
28 Febuxostat 240mg Febuxostat 30mg
bid NA NA 2.7 (0.08, 96.79) very low 2.7 (0.08, 96.79) very low
Risk of bias,
imprecisionX2

41
29 Febuxostat 240mg Febuxostat 40mg NA NA 0.64 (0.08, 5.4) very low 0.64 (0.08, 5.4) low Risk of bias,
imprecision
30 Febuxostat 240mg Febuxostat 40mg
XR NA NA 0.25 (0.02, 2.98) very low 0.25 (0.02, 2.98) very low
Risk of bias,
imprecisionX2
31 Febuxostat 240mg Febuxostat 80mg 0.4 (0.04, 4.02) very low 52.11 (0.01, 4.52 x
105) very low 0.52 (0.06, 4.12) very low
Risk of bias,
imprecisionX2
32 Febuxostat 240mg
Febuxostat 80mg
+ Lesinurad
200mg
NA NA 0.17 (0.01, 3.57) very low 0.17 (0.01, 3.57) very low Risk of bias,
imprecisionX2
33 Febuxostat 240mg Febuxostat 80mg
XR NA NA 0.44 (0.03, 6.55) very low 0.44 (0.03, 6.55) very low
Risk of bias,
imprecisionX2
34 Febuxostat 240mg Placebo 1.02 (0.02, 51.3) very low 0.14 (0, 5.23) very low 0.48 (0.05, 4.37) very low Risk of bias,
imprecisionX2
35 Febuxostat 30mg
bid Febuxostat 40mg NA NA 0.24 (0.01, 4.61) very low 0.24 (0.01, 4.61) very low
Risk of bias,
imprecisionX2
36 Febuxostat 30mg
bid
Febuxostat 40mg
XR NA NA 0.09 (0, 2.23) very low 0.09 (0, 2.23) very low
Risk of bias,
imprecisionX2
37 Febuxostat 30mg
bid Febuxostat 80mg 0.33 (0.01, 7.88) very low 0.01 (0, 15.92) very low 0.19 (0.01, 3.62) very low
Risk of bias,
imprecisionX2
38 Febuxostat 30mg
bid
Febuxostat 80mg
+ Lesinurad
200mg
NA NA 0.06 (0, 2.51) very low 0.06 (0, 2.51) very low Risk of bias,
imprecisionX2
39 Febuxostat 30mg
bid
Febuxostat 80mg
XR NA NA 0.16 (0.01, 4.68) very low 0.16 (0.01, 4.68) very low
Risk of bias,
imprecisionX2
40 Febuxostat 30mg
bid Placebo 0.13 (0.01, 2.66) very low
1.07 x 10³ (0, 8.52
x 1010) very low 0.18 (0.01, 3.2) very low
Risk of bias,
imprecisionX2
41 Febuxostat 40mg
XR Febuxostat 40mg 2.34 (0.12, 46.37) very low 1.91 (0.27, 13.32) very low 2.6 (0.61, 11.11) very low
Risk of bias,
imprecisionX2
42 Febuxostat 40mg Febuxostat 80mg 1.01 (0.42, 2.39) moderate 0.61 (0.22, 1.7) low 0.8 (0.43, 1.5) low Risk of bias,
imprecision
43 Febuxostat 40mg
Febuxostat 80mg
+ Lesinurad
200mg
NA NA 0.26 (0.03, 2.68) very low 0.26 (0.03, 2.68) very low Risk of bias,
imprecisionX2

42
44 Febuxostat 80mg
XR Febuxostat 40mg 1.44 (0.06, 33.71) very low 1.08 (0.08, 14.53) very low 1.46 (0.24, 8.73) low
Risk of bias,
imprecision
45 Febuxostat 40mg Placebo 0.6 (0.15, 2.36) low 0.81 (0.2, 3.26) low 0.75 (0.3, 1.87) low Risk of bias,
imprecision
46 Febuxostat 40mg
XR Febuxostat 80mg 1.58 (0.08, 30.81) very low 2.77 (0.27, 28.48) very low 2.09 (0.5, 8.7) low
Risk of bias,
imprecision
47 Febuxostat 40mg
XR
Febuxostat 80mg
+ Lesinurad
200mg
NA NA 0.68 (0.05, 9.7) very low 0.68 (0.05, 9.7) very low Risk of bias,
imprecisionX2
48 Febuxostat 80mg
XR
Febuxostat 40mg
XR 0.51 (0.05, 5.43) very low NA NA 0.56 (0.11, 3) low
Risk of bias,
imprecision
49 Febuxostat 40mg
XR Placebo 1.22 (0.1, 14.12) very low 2.37 (0.2, 28.54) very low 1.96 (0.45, 8.45) low
Risk of bias,
imprecision
50 Febuxostat 80mg +
Lesinurad 200mg Febuxostat 80mg 3.08 (0.33, 29.19) very low NA NA 3.08 (0.33, 29.15) very low
Risk of bias,
imprecisionX2
51 Febuxostat 80mg
XR Febuxostat 80mg 0.97 (0.04, 22.42) very low 1.53 (0.09, 26.67) very low 1.17 (0.2, 6.88) low
Risk of bias,
imprecision
52 Febuxostat 80mg Placebo 0.78 (0.16, 3.78) low 0.68 (0.13, 3.42) low 0.94 (0.38, 2.29) low Risk of bias,
imprecision
53 Febuxostat 80mg +
Lesinurad 200mg
Febuxostat 80mg
XR NA NA 2.63 (0.15, 45.91) very low 2.63 (0.15, 45.91) very low
Risk of bias,
imprecisionX2
54 Febuxostat 80mg +
Lesinurad 200mg Placebo NA NA 2.9 (0.26, 32.51) very low 2.9 (0.26, 32.51) very low
Risk of bias,
imprecisionX2
55 Febuxostat 80mg
XR Placebo 0.41 (0.04, 4.31) very low 1.29 (0.06, 25.55) very low 1.1 (0.18, 6.65) low
Risk of bias,
imprecision
Estimates presented correspond to Treatment 1 (intervention) compared with Treatment 2 (comparison). Number above 1 indicate a larger risk of serious adverse events with
Treatment 1 (favors Treatment 2); while numbers below 1 indicate a larger risk of serious adverse events with Treatment 2 (favors treatment 1).

43
Figure 8: Risk of bias assessment.

44
Figures 9a-l: Forest plots for proportion of patients with at least 1 gout flare, 0 to 3 months
follow-up (range: 28 days to 3 months).
Figure 9a: Allopurinol 300 mg vs. placebo.
Figure 9b: Any dose of febuxostat vs. placebo.

45
Figure 9c: Any dose of febuxostat vs. allopurinol 300mg.
Figure 9d: Any dose of febuxostat vs. febuxostat 40mg.

46
Figure 9e: Any dose of febuxostat vs. febuxostat 80mg.
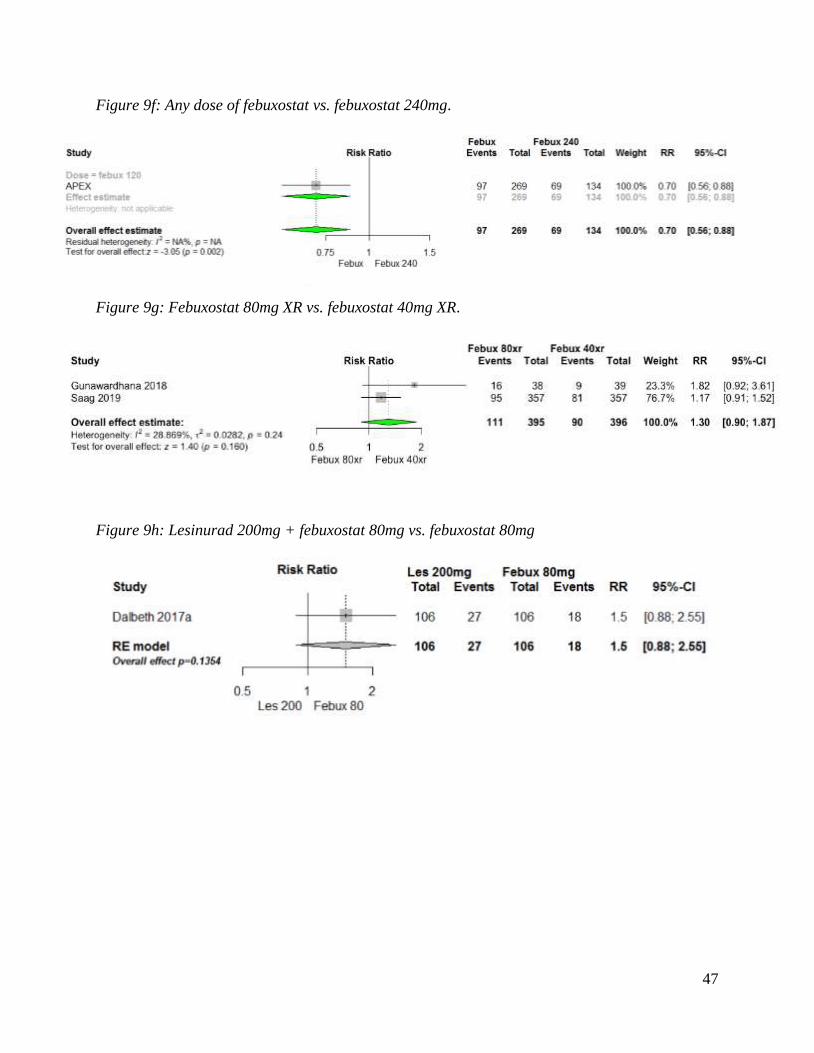
47
Figure 9f: Any dose of febuxostat vs. febuxostat 240mg.
Figure 9g: Febuxostat 80mg XR vs. febuxostat 40mg XR.
Figure 9h: Lesinurad 200mg + febuxostat 80mg vs. febuxostat 80mg

48
Figure 9k: Network forest plot with placebo as comparator.
Figure 9l: Network forest plot with allopurinol 300mg as comparator.
favours ULT favours placebo
favours other favours allopurinol 300mg

49
Figures 10a-c: Forest plots for proportion of patients with at least 1 gout flare, at latest
follow-up (range: 5 to 13 months). Patients were observed for 1 month period only.
Figure 10a: Any dose of febuxostat vs. allopurinol 300mg.
Figure 10b: Any dose of febuxostat vs. febuxostat 80mg.
Figure 10c: Lesinurad 200mg + allopurinol 300mg vs. allopurinol 300mg.

50
Figure 10d: Network forest plot with allopurinol 300mg as comparator.
favours ULT favours allopurinol 300mg

51
Figures 11a-g: Forest plots for proportion of patients with at least 1 gout flare, at longest
follow-up (range: from baseline or 2.25 months up to 7 or 24 months). Patients were
observed for >1 month period.
Figure 11a: Any dose of febuxostat 40mg vs. placebo.
Figure 11b: Any dose of febuxostat vs. allopurinol 300mg.
Figure 11c: Any dose of febuxostat vs. febuxostat 80mg.

52
Figure 11d: Allopurinol 300mg vs. probenecid 2g.
Figure 11e: Lesinurad 200mg + febuxostat 80mg vs. febuxostat 80mg.
Figure 11f: Network forest plot with allopurinol 300mg as comparator.
Les 200 Febux 80
favours other favours allopurinol 300mg

53
Figure 11g: Network forest plot with placebo as comparator.
Figures 12a-m: Forest plots for proportion of patients with serum urate <6.0mg/dL at
longest follow-up (range: 28 days to 24 months)
Figure 12a: Allopurinol 300mg vs. placebo.
favours ULT favours placebo
Placebo Allopurinol

54
Figure 12b: Any dose of febuxostat vs. placebo.

55
Figure 12c: Any dose of febuxostat vs. allopurinol 300mg.
Allo Febux

56
Figure 12d: Any dose of febuxostat vs. febuxostat 40mg.

57
Figure 12e: Any dose of febuxostat vs. febuxostat 80mg.

58
Figure 12f: Any dose of febuxostat vs. febuxostat 240mg.
Figure 12g: Febuxostat 80mg XR vs. febuxostat 40mg XR.
Figure 12h: Pegloticase 8mg vs. placebo.
Febux Febux 240
Placebo Peg 8mg

59
Figure 12i: Monthly vs. biweekly pegloticase 8mg.
Figure 12j: Lesinurad 200mg + allopurinol 300mg vs. allopurinol 300mg.
Figure 12k: Lesinurad 200mg + febuxostat 80mg vs. febuxostat 80mg
Allo 300 Les 200
Monthly Peg Biweekly Peg
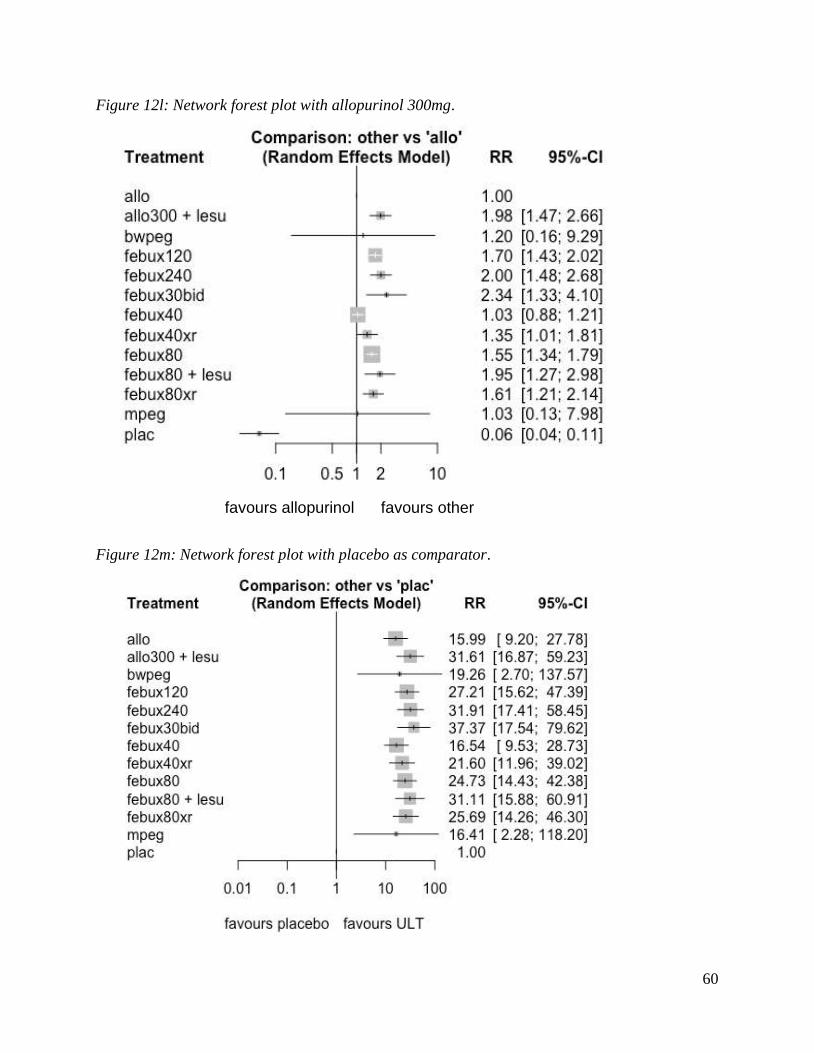
60
Figure 12l: Network forest plot with allopurinol 300mg.
Figure 12m: Network forest plot with placebo as comparator.
favours allopurinol favours other

61
Figures 13a-c: Forest plots for proportion of patients with subjective adverse event of pain;
closest to 3 months (follow up: 28 days)
Figure 13a: Any dose of febuxostat vs. placebo.
Figure 13b: Any dose of febuxostat vs. febuxostat 40mg.
Figure 13c: Any dose of febuxostat vs. febuxostat 80mg.
Febux Febux 40
Febux Febux 80

62
Figures 14a-b: Forest plots for change in pain score using 0 to 100 mm visual analogue
scale, at longest follow-up (0 to 6.25 months)
Figure 14a: Pegloticase 8mg vs. placebo.
Figure 14b: Biweekly vs. monthly pegloticase 8mg.

63
Figures 15a-b: Forest plots for change patient global assessment as measured on 100mm
visual analogue scale at longest follow-up (0 to 6.25 months)
Figure 15a: Pegloticase 8mg vs. placebo.
Figure 15b: Biweekly vs. monthly pegloticase 8mg.
Placebo Peg 8mg
Monthly Biweekly

64
Figures 16a-f: Forest plots for proportion of patients with tophus resolution at longest
follow-up (range: 0 to 24 months)
Figure 16a: Allopurinol 300mg vs. probenecid 2g.
Figure 16b: Pegloticase 8mg vs. placebo.
Figure 16c: Biweekly vs. monthly pegloticase 8mg.
Prob Allo 300
Placebo Peg 8m
Monthly Peg Biweekly Peg

65
Figure 16d: Lesinurad 200mg + allopurinol 300mg vs. allopurinol 300mg
Figure 16e: Lesinurad 200mg + febuxostat 80mg vs. febuxostat 80mg
Figure 16f: Network forest plot with allopurinol 300mg as comparator.
Febux 80 Les 200

66
Figures 17a-b: Forest plot for change in physical component summary (PCS) score of 36-
Item Short Form Health Survey (SF-36) at longest follow-up (0 to 6.25 months)
Figure 17a: Pegloticase 8m vs. placebo.
Figure 17b: Biweekly vs. monthly pegloticase 8mg.
Placebo Peg 8mg
Monthly Peg Biweekly Peg

67
Figures 18a-b: Forest plots for change in Health Assessment Questionnaire-Disability
Index score (HAQ-DI) at longest follow-up (0 to 6.25 months)
Figure 18a: Pegloticase 8mg vs. placebo.
Figure 18b: Monthly vs. biweekly pegloticase 8mg.

68
Figures 19a-n: Forest plots for proportion of patients with serious adverse events at longest
follow-up (range: 28 days to 24 months)
Figure 19a: Allopurinol 300mg vs. placebo.
Figure 19b: Any dose of febuxostat vs. placebo.

69
Figure 19c: Any dose of febuxostat vs. allopurinol 300mg.
Figure 19d: Any dose of febuxostat vs. febuxostat 40mg.

70
Figure 19e: Any dose of febuxostat vs. febuxostat 80mg.
Figure 19f: Any dose of febuxostat vs. febuxostat 240mg.
Febux Febux 240

71
Figure 19g: Febuxostat 80mg XR vs. febuxostat 40mg XR.
Figure 19h: Allopurinol 300mg vs. probenecid 2g.
Figure 19i: Pegloticase 8mg vs. placebo.
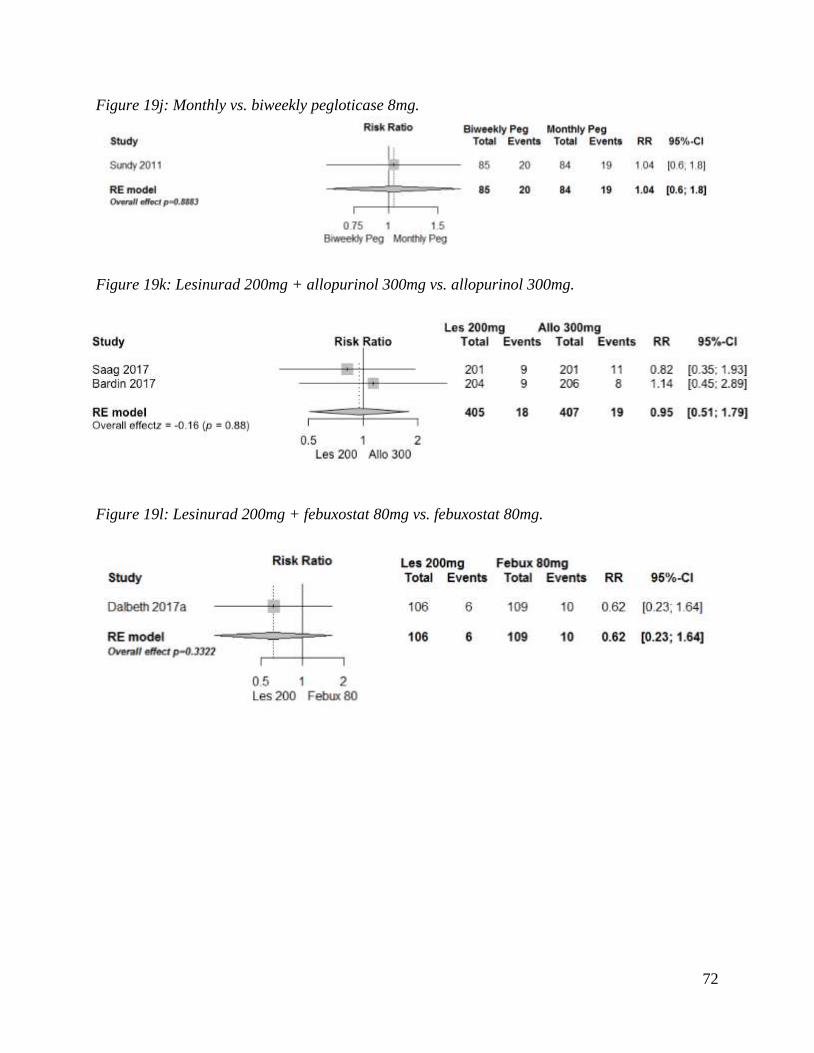
72
Figure 19j: Monthly vs. biweekly pegloticase 8mg.
Figure 19k: Lesinurad 200mg + allopurinol 300mg vs. allopurinol 300mg.
Figure 19l: Lesinurad 200mg + febuxostat 80mg vs. febuxostat 80mg.

73
Figure 19m: Network forest plot with placebo as comparator.

74
Figure 19n: Network forest plot with allopurinol 300mg as comparator.

75
Figures 20a-l: Forest plots for proportion of patients with cardiovascular-related serious,
Longest follow-up (range: 28 day to median of 32 months)
Figure 20a: Allopurinol 300mg vs. placebo.
Figure 20b: Any dose of febuxostat vs. placebo.

76
Figure 20c: Any dose of febuxostat vs. allopurinol 300mg.

77
Figure 20d: Any dose of febuxostat vs. febuxostat 40mg.
Figure 20e: Any dose of febuxostat vs. febuxostat 80mg.

78
Figure 20f: Any dose of febuxostat vs. Febuxostat 240mg.
Figure 20g: Febuxostat 80mg XR vs. Febuxostat 40mg XR.
Figure 20h: Monthly vs. Biweekly pegloticase 8mg.
Figure 20i: Lesinurad 200mg + allopurinol 300mg vs. allopurinol 300mg
Febux Febux 240

79
Figure 20j: Lesinurad 200mg + febuxostat 80mg vs. febuxostat 80mg.
Figure 20k: Network forest plot with placebo as comparator.

80
Figure 20l: Network forest plot with allopurinol 300mg as comparator.

81
References 1. Schumacher HR, Jr., Becker MA, Wortmann RL, Macdonald PA, Hunt B, Streit J, et al.
Effects of febuxostat versus allopurinol and placebo in reducing serum urate in subjects with
hyperuricemia and gout: a 28-week, phase III, randomized, double-blind, parallel-group trial.
Arthritis and rheumatism. 2008;59(11):1540-8.
2. Bardin T, Keenan RT, Khanna PP, Kopicko J, Fung M, Bhakta N, et al. Lesinurad in
combination with allopurinol: a randomised, double-blind, placebo-controlled study in patients
with gout with inadequate response to standard of care (the multinational CLEAR 2 study).
Annals of the rheumatic diseases. 2017;76(5):811-20.
3. Becker MA, Schumacher HR, Jr., Wortmann RL, MacDonald PA, Palo WA, Eustace D,
et al. Febuxostat, a novel nonpurine selective inhibitor of xanthine oxidase: a twenty-eight-day,
multicenter, phase II, randomized, double-blind, placebo-controlled, dose-response clinical trial
examining safety and efficacy in patients with gout. Arthritis and rheumatism. 2005;52(3):916-
23.
4. Wells AF, MacDonald PA, Chefo S, Jackson RL. African American patients with gout:
efficacy and safety of febuxostat vs allopurinol. BMC musculoskeletal disorders. 2012;13:15.
5. Becker MA, MacDonald PA, Hunt B, Gunawardhana L. Treating hyperuricemia of gout:
safety and efficacy of febuxostat and allopurinol in older versus younger subjects. Nucleosides,
nucleotides & nucleic acids. 2011;30(12):1011-7.
6. Becker MA, MacDonald PA, Hunt BJ, Jackson RL. Diabetes and gout: efficacy and
safety of febuxostat and allopurinol. Diabetes, obesity & metabolism. 2013;15(11):1049-55.
7. Becker MA, Schumacher HR, Espinoza LR, Wells AF, MacDonald P, Lloyd E, et al. The
urate-lowering efficacy and safety of febuxostat in the treatment of the hyperuricemia of gout:
the CONFIRMS trial. Arthritis research & therapy. 2010;12(2):R63.
8. Jackson RL, Hunt B, MacDonald PA. The efficacy and safety of febuxostat for urate
lowering in gout patients >/=65 years of age. BMC geriatrics. 2012;12:11.
9. Wortmann RL, Macdonald PA, Hunt B, Jackson RL. Effect of prophylaxis on gout flares
after the initiation of urate-lowering therapy: analysis of data from three phase III trials. Clinical
therapeutics. 2010;32(14):2386-97.
10. Chohan S, Becker MA, MacDonald PA, Chefo S, Jackson RL. Women with gout:
efficacy and safety of urate-lowering with febuxostat and allopurinol. Arthritis care & research.
2012;64(2):256-61.
11. Dalbeth N, Jones G, Terkeltaub R, Khanna D, Kopicko J, Bhakta N, et al. Lesinurad, a
Selective Uric Acid Reabsorption Inhibitor, in Combination With Febuxostat in Patients With
Tophaceous Gout: Findings of a Phase III Clinical Trial. Arthritis & rheumatology (Hoboken,
NJ). 2017;69(9):1903-13.
12. Dalbeth N, Saag KG, Palmer WE, Choi HK, Hunt B, MacDonald PA, et al. Effects of
Febuxostat in Early Gout: A Randomized, Double-Blind, Placebo-Controlled Study. Arthritis &
rheumatology (Hoboken, NJ). 2017;69(12):2386-95.
13. Becker MA, Schumacher HR, Jr., Wortmann RL, MacDonald PA, Eustace D, Palo WA,
et al. Febuxostat compared with allopurinol in patients with hyperuricemia and gout. The New
England journal of medicine. 2005;353(23):2450-61.
14. Gibson T, Kilbourn K, Horner I, Simmonds HA. Mechanism and treatment of
hypertriglyceridaemia in gout. Annals of the rheumatic diseases. 1979;38(1):31-5.

82
15. Goldfarb DS, MacDonald PA, Hunt B, Gunawardhana L. Febuxostat in gout: serum urate
response in uric acid overproducers and underexcretors. The Journal of rheumatology.
2011;38(7):1385-9.
16. Gunawardhana L, Becker MA, Whelton A, Hunt B, Castillo M, Saag K. Efficacy and
safety of febuxostat extended release and immediate release in patients with gout and moderate
renal impairment: phase II placebo-controlled study. Arthritis research & therapy. 2018;20(1):99.
17. Huang X, Du H, Gu J, Zhao D, Jiang L, Li X, et al. An allopurinol-controlled,
multicenter, randomized, double-blind, parallel between-group, comparative study of febuxostat
in Chinese patients with gout and hyperuricemia. International journal of rheumatic diseases.
2014;17(6):679-86.
18. Kim HA, Seo YI, Song YW. Four-week effects of allopurinol and febuxostat treatments
on blood pressure and serum creatinine level in gouty men. Journal of Korean medical science.
2014;29(8):1077-81.
19. Poiley J, Steinberg AS, Choi YJ, Davis CS, Martin RL, McWherter CA, et al. A
Randomized, Double-Blind, Active- and Placebo-Controlled Efficacy and Safety Study of
Arhalofenate for Reducing Flare in Patients With Gout. Arthritis & rheumatology (Hoboken,
NJ). 2016;68(8):2027-34.
20. Saag KG, Becker MA, Whelton A, Hunt B, Castillo M, Kisfalvi K, et al. Efficacy and
Safety of Febuxostat Extended and Immediate Release in Patients With Gout and Renal
Impairment: A Phase III Placebo-Controlled Study. Arthritis & rheumatology (Hoboken, NJ).
2019;71(1):143-53.
21. Saag KG, Fitz-Patrick D, Kopicko J, Fung M, Bhakta N, Adler S, et al. Lesinurad
Combined With Allopurinol: A Randomized, Double-Blind, Placebo-Controlled Study in Gout
Patients With an Inadequate Response to Standard-of-Care Allopurinol (a US-Based Study).
Arthritis & rheumatology (Hoboken, NJ). 2017;69(1):203-12.
22. Saag KG, Whelton A, Becker MA, MacDonald P, Hunt B, Gunawardhana L. Impact of
Febuxostat on Renal Function in Gout Patients With Moderate-to-Severe Renal Impairment.
Arthritis & rheumatology (Hoboken, NJ). 2016;68(8):2035-43.
23. Scott JT. Comparison of allopurinol and probenecid. Annals of the rheumatic diseases.
1966;25(6 Suppl):623-6.
24. Scott JT, Hall AP, Grahame R. Allopurinol in treatment of gout. British medical journal.
1966;2(5509):321-7.
25. Baraf HS, Becker MA, Gutierrez-Urena SR, Treadwell EL, Vazquez-Mellado J, Rehrig
CD, et al. Tophus burden reduction with pegloticase: results from phase 3 randomized trials and
open-label extension in patients with chronic gout refractory to conventional therapy. Arthritis
research & therapy. 2013;15(5):R137.
26. Sundy JS, Baraf HS, Yood RA, Edwards NL, Gutierrez-Urena SR, Treadwell EL, et al.
Efficacy and tolerability of pegloticase for the treatment of chronic gout in patients refractory to
conventional treatment: two randomized controlled trials. Jama. 2011;306(7):711-20.
27. Strand V, Khanna D, Singh JA, Forsythe A, Edwards NL. Improved health-related
quality of life and physical function in patients with refractory chronic gout following treatment
with pegloticase: evidence from phase III randomized controlled trials. The Journal of
rheumatology. 2012;39(7):1450-7.
28. White WB, Chohan S, Dabholkar A, Hunt B, Jackson R. Cardiovascular safety of
febuxostat and allopurinol in patients with gout and cardiovascular comorbidities. American
heart journal. 2012;164(1):14-20.
83
29. White WB, Saag KG, Becker MA, Borer JS, Gorelick PB, Whelton A, et al.
Cardiovascular Safety of Febuxostat or Allopurinol in Patients with Gout. The New England
journal of medicine. 2018;378(13):1200-10.
30. Xu S, Liu X, Ming J, Chen S, Wang Y, Liu X, et al. A phase 3, multicenter, randomized,
allopurinol-controlled study assessing the safety and efficacy of oral febuxostat in Chinese gout
patients with hyperuricemia. International journal of rheumatic diseases. 2015;18(6):669-78.
31. Yu KH, Lai JH, Hsu PN, Chen DY, Chen CJ, Lin HY. Safety and efficacy of oral
febuxostat for treatment of HLA-B*5801-negative gout: a randomized, open-label, multicentre,
allopurinol-controlled study. Scandinavian journal of rheumatology. 2016;45(4):304-11.