Distribution, phylogeography and hybridization between two ...
Upload
independentCategory
view
3download
0
Go east: phylogeographies of Mauremys caspica and M. rivulata –discordance of morphology, mitochondrial and nuclear genomicmarkers and rare hybridization
U. FRITZ,* D. AYAZ,� J. BUSCHBOM,� H. G. KAMI,§ L. F. MAZANAEVA,– A. A. ALOUFI,**
M. AUER,* L. RIFAI,�� T. SILIC�� & A. K. HUNDSDORFER*
*Museum of Zoology (Museum fur Tierkunde), Natural History State Collections, Dresden, Germany
�Department of Biology, Faculty of Science, Ege University, Bornova-Izmir, Turkey
�Institut fur Forstgenetik und Forstpflanzenzuchtung, Bundesforschungsanstalt fur Forst- und Holzwirtschaft, Grosshansdorf, Germany
§Department of Biology, Faculty of Sciences, University of Agricultural Sciences and Natural Resources, Gorgan, Iran
–Department of Zoology, Dagestan State University, Makhachkala, Dagestan, Russia
**Department of Science, Tabuk Teachers College, Tabuk, Saudi Arabia
��Department of Biology, James Madison University, Harrisonburg, VA, USA
��Croatian Herpetological Society Hyla, Zagreb, Croatia
Introduction
Many investigations have analysed the phylogeography
of European biota (reviews in Schmitt, 2007; Weiss &
Ferrand, 2007), providing a detailed understanding of
their Holocene and Pleistocene range fluctuations. By
contrast, comparatively few studies focus on true central
or west Asian species, so that their phylogeography
remains largely unstudied. Most of the information
available is largely a side-effect of studies that examine
widely distributed Palaearctic species or European species
whose ranges extend into Asia (e.g. for reptiles: Kalya-
bina et al., 2001; Kalyabina-Hauf & Ananjeva, 2004;
Ursenbacher et al., 2006; Fritz et al., 2007a,b). The few
studies on reptiles endemic in central or west Asia used
small sample sizes (Macey et al., 1998, 1999; Guo &
Wang, 2007), and hence amounted to phylogenetic
rather than phylogeographic analyses. In this study, we
present phylogeographies for a west Asian terrapin,
Mauremys caspica, and the closely related south-east
European and west Asian species M. rivulata.
Stripe-necked terrapins (genus Mauremys, Geoemydi-
dae) constitute a characteristic element of the fauna of
Correspondence: U. Fritz, Museum of Zoology (Museum fur Tierkunde),
Natural History State Collections Dresden, A. B. Meyer Building, D-01109
Dresden, Germany.
Tel.: +49 (0)351 8926 325; fax: +49 (0)351 8926 327;
e-mail: [email protected]
ª 2 0 0 7 T H E A U T H O R S . J . E V O L . B I O L . 2 1 ( 2 0 0 8 ) 5 2 7 – 5 4 0
J O U R N A L C O M P I L A T I O N ª 2 0 0 7 E U R O P E A N S O C I E T Y F O R E V O L U T I O N A R Y B I O L O G Y 527
Keywords:
chelonian;
gene flow;
hybridization;
phylogeography;
speciation.
Abstract
In recent years many cases of hybridization and introgression became known
for chelonians, requiring a better understanding of their speciation mecha-
nisms. Phylogeographic investigations offer basic data for this challenge. We
use the sister species Mauremys caspica and M. rivulata, the most abundant
terrapins in the Near and Middle East and South-east Europe, as model. Their
phylogeographies provide evidence that speciation of chelonians fits the
allopatric speciation model, with both species being in the parapatric phase of
speciation, and that intrinsic isolation mechanisms are developed during
speciation. Hybridization between M. caspica and M. rivulata is very rare,
suggesting that the increasing numbers of hybrids in other species are caused
by human impact on environment (breakdown of ecological isolation).
Genetic differentiation within M. caspica and M. rivulata resembles the
paradigm of southern genetic richness and northern purity of European biota.
However, in west Asia this pattern is likely to reflect dispersal and vicariance
events older than the Holocene. For M. caspica three distinct Pleistocene
refuges are postulated (Central Anatolia, south coast of Caspian Sea, Gulf of
Persia). Morphologically defined subspecies within M. caspica are not sup-
ported by genetic data. This is one of the few studies available about the
phylogeography of west and central Asian species.
doi:10.1111/j.1420-9101.2007.01485.x
the Near and Middle East and the Mediterranean, being
the most abundant freshwater turtles there. The genus
comprises 10 omnivorous, small- to medium-sized aqua-
tic species, occurring in a doubly disjunct range. Seven
East and South-east Asian species are separated from
their western Palaearctic congeners by a wide distribu-
tional gap, and the ranges of the three western species
are also interrupted by a gap in the central Mediterra-
nean region. Mauremys leprosa is confined to the North
African Maghreb region and the Iberian Peninsula; the
other two species, M. rivulata and M. caspica, occur east of
the gap in the south-eastern Balkans, the Near and
Middle East (Fritz & Havas, 2007). For a long time, the
three western Palaearctic species were thought to be
conspecific (e.g. Loveridge & Williams, 1957; Wermuth &
Mertens, 1977), their allopatric and parapatric ranges
matching the model of geographically vicariant sub-
species (Rensch, 1947; Mayr, 1963). On the basis of
their morphological distinctness, considerable mtDNA
sequence differentiation and the lack of intergradation,
all three taxa are now treated as full species (Busack &
Ernst, 1980; Fritz & Wischuf, 1997; Barth et al., 2004;
Mantziou et al., 2004; Spinks et al., 2004).
Genetic evidence suggests M. leprosa as basal lineage,
representing the sister taxon of a clade comprising all
other species; M. caspica and M. rivulata are sister species
and phylogenetically embedded within their East and
South-east Asian congeners (Barth et al., 2004; Spinks
et al., 2004). Mauremys caspica and M. rivulata occupy
parapatric ranges with a long contact zone of �1000 km
in Asia Minor (Fritz & Wischuf, 1997). Comparing more
than 800 specimens morphologically, Fritz & Wischuf
(1997) found hybrids of M. caspica and M. rivulata at only
two sites along the contact zone. This distributional
situation implies that these two species diverged in
allopatry and are still outcompeting one another by
using the same ecological niche, not yet allowing a
sympatric occurrence (‘semispecies’ of Mayr, 1963).
While M. rivulata is monotypic, three subspecies are
recognized within M. caspica, suggesting that M. caspica
and M. rivulata are ideally suited models for investigating
different stages of speciation of freshwater terrapins. In
view of the growing number of reports of hybrids even
between distantly related chelonian species (see reviews
in Schilde et al., 2004 and Buskirk et al., 2005; see also
Bowen & Karl, 2007 and Stuart & Parham, 2007) and
introgressed mtDNA in several species (Guicking et al.,
2002; Lara-Ruiz et al., 2006; Farias et al., 2007; Fong
et al., 2007; Praschag et al., 2007; Spinks & Shaffer,
2007), we hope to gain novel insights into speciation of
chelonians using this model.
The present study is based on a range-wide sampling
of M. caspica and M. rivulata. We use sequence variation of a
mitochondrial and a nuclear genomic marker gene as well
as nuclear genomic fingerprinting [Inter-Simple-Sequen-
ce-Repeat (ISSR) PCR] to address the following questions:
(i) do morphological, mtDNA and nuclear genomic
differentiation follow the same pattern, (ii) does
interspecific hybridization represent an exceptional and
localized phenomenon or does gene flow still take place on
a larger scale and (iii) do the subspecies within M. caspica
correspond to evolutionarily significant genetic lineages?
Within this frame, we present genetic data from a newly
discovered putative hybrid population comprising
terrapins morphologically intermediate between M. caspica
and M. rivulata. The other two hybrid populations in
south-eastern Turkey and Syria are now extinct (Fritz &
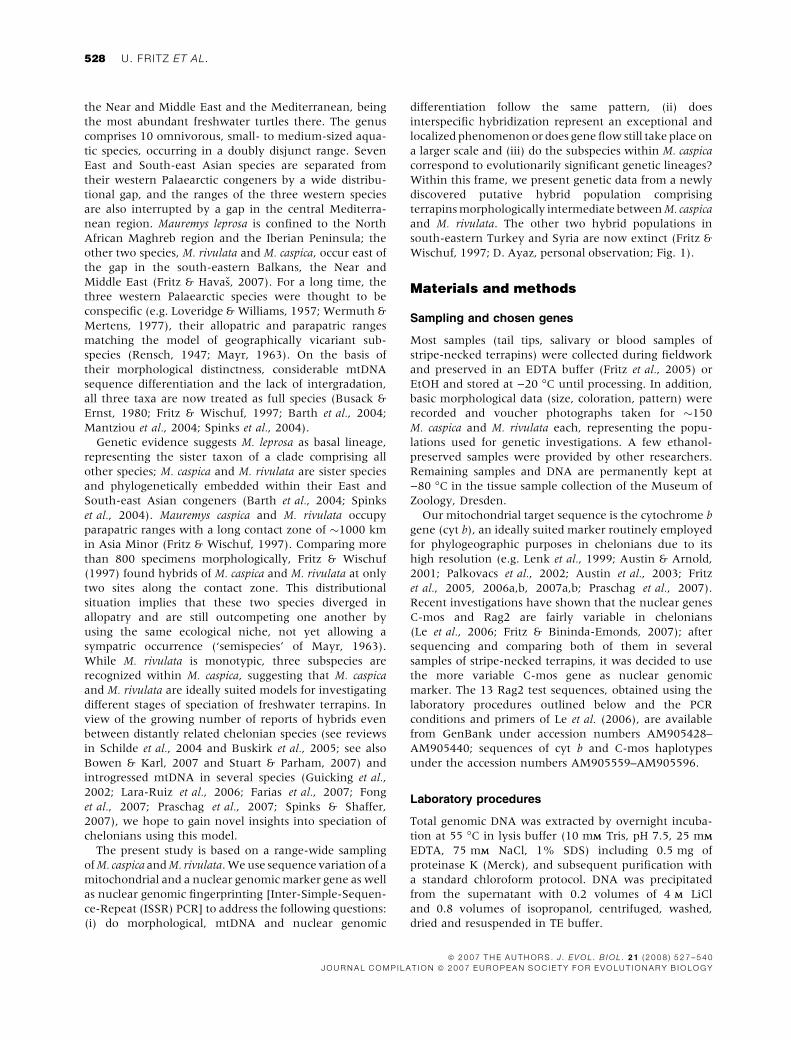
Wischuf, 1997; D. Ayaz, personal observation; Fig. 1).
Materials and methods
Sampling and chosen genes
Most samples (tail tips, salivary or blood samples of
stripe-necked terrapins) were collected during fieldwork
and preserved in an EDTA buffer (Fritz et al., 2005) or
EtOH and stored at )20 �C until processing. In addition,
basic morphological data (size, coloration, pattern) were
recorded and voucher photographs taken for �150
M. caspica and M. rivulata each, representing the popu-
lations used for genetic investigations. A few ethanol-
preserved samples were provided by other researchers.
Remaining samples and DNA are permanently kept at
)80 �C in the tissue sample collection of the Museum of
Zoology, Dresden.
Our mitochondrial target sequence is the cytochrome b
gene (cyt b), an ideally suited marker routinely employed
for phylogeographic purposes in chelonians due to its
high resolution (e.g. Lenk et al., 1999; Austin & Arnold,
2001; Palkovacs et al., 2002; Austin et al., 2003; Fritz
et al., 2005, 2006a,b, 2007a,b; Praschag et al., 2007).
Recent investigations have shown that the nuclear genes
C-mos and Rag2 are fairly variable in chelonians
(Le et al., 2006; Fritz & Bininda-Emonds, 2007); after
sequencing and comparing both of them in several
samples of stripe-necked terrapins, it was decided to use
the more variable C-mos gene as nuclear genomic
marker. The 13 Rag2 test sequences, obtained using the
laboratory procedures outlined below and the PCR
conditions and primers of Le et al. (2006), are available
from GenBank under accession numbers AM905428–
AM905440; sequences of cyt b and C-mos haplotypes
under the accession numbers AM905559–AM905596.
Laboratory procedures
Total genomic DNA was extracted by overnight incuba-
tion at 55 �C in lysis buffer (10 mMM Tris, pH 7.5, 25 mMM
EDTA, 75 mMM NaCl, 1% SDS) including 0.5 mg of
proteinase K (Merck), and subsequent purification with
a standard chloroform protocol. DNA was precipitated
from the supernatant with 0.2 volumes of 4 MM LiCl
and 0.8 volumes of isopropanol, centrifuged, washed,
dried and resuspended in TE buffer.
528 U. FRITZ ET AL.
ª 2 0 0 7 T H E A U T H O R S . J . E V O L . B I O L . 2 1 ( 2 0 0 8 ) 5 2 7 – 5 4 0
J O U R N A L C O M P I L A T I O N ª 2 0 0 7 E U R O P E A N S O C I E T Y F O R E V O L U T I O N A R Y B I O L O G Y
Two fragments (overlapping by �300 bp), together
comprising almost the complete cyt b gene and the
adjacent portion of the tRNA-Thr gene, were amplified
for 86 samples (Appendix S1) using the primers CytbG
(Spinks et al., 2004), mt-E-Rev2, mt-c-For2 and mt-f-na
(Fritz et al., 2006b). PCR was performed in a 50 lL
volume (50 mMM KCl, 1.5 mMM MgCl2, and 10 mMM Tris–
HCl, 0.5% Triton X-100, pH 8.5) containing 1 unit of Taq
DNA polymerase (Bioron), 10 pmol dNTPs (Eppendorf or
Fermentas) and 10 pmol of each primer. After initial
denaturing for 5 min at 95 �C, 35–40 cycles were
performed with denaturing 1 min at 95 �C, annealing
1 min at 55–58 �C and primer extension for 2 min at
72 �C, followed by a final elongation of 10 min at 72 �C.
PCR products were purified by precipitation under the
following conditions: 1 volume PCR product (30 lL), 1
volume 4 MM NH4Ac (30 lL) and 12 volumes EtOH
(100%; 360 lL). DNA was pelleted by centrifugation
and the pellet washed with 70% ethanol. The pellet was
dissolved in 20 lL H2O. PCR products were sequenced
with the primers mt-c-For2 and mt-E-Rev2 (Fritz et al.,
2006b) on an ABI 3130 sequencer (Applied Biosystems).
Because no internal stop codons were found and nucle-
otide frequencies corresponded to those known for
coding mtDNA, we conclude that we amplified and
sequenced mtDNA and not nuclear copies of mitochon-
drial genes.
An �600 bp long fragment of the C-mos gene of 72
stripe-necked terrapins (Appendix S1) was amplified and
sequenced in the same procedure, but using the primers
Cmos1 and Cmos3 (Le et al., 2006) and the following
PCR programme: initial denaturing at 95 �C for 5 min
and 40 cycles of denaturing 30 s at 95 �C, annealing 45 s
at 58 �C and primer extension for 1 min at 72 �C,
followed by a final elongation for 10 min at 72 �C.
Estimation of gametic phase of C-mos
Twenty-two of the studied 72 diploid individuals were
found to be heterozygous at one to four sites in the
577 bp long alignment. For individuals with more than
one heterozygous position gametic phase cannot be
identified from the sequences directly; gametic haplo-
types (alleles) have to be determined either through
cloning of the alleles from PCR products or through
statistical inference maximizing the likelihood of geno-
type frequencies. Identification of sequences employing a
cloning approach is not only time-consuming and
expensive, but also has been shown to be unreliable
due to frequent recombination events during the cloning
procedure (Yu et al., 2006). Thus, we reconstructed
gametic haplotypes and individual genotypes using the
expectation-maximization (EM) algorithm as imple-
mented in ARLEQUINARLEQUIN 3.1 (Excoffier et al., 2005). The
EM algorithm has been shown to perform well under a
wide range of population and dataset scenarios (Fallin &
Schork, 2000; Tishkoff et al., 2000; Zhang et al., 2001)
and is robust to violations of the underlying assumptions
of Hardy–Weinberg equilibrium (Niu et al., 2002; Xu
et al., 2002). The zipper version of the EM algorithm was
started at 50 random starting points with a maximum of
5000 iterations, an epsilon value of 1e)7 and 50 random
loci (polymorphic positions) orders. Of the 12 individuals
with more than one heterozygous position, three
Fig. 1 Distribution of Mauremys caspica
subspecies and M. rivulata according to Fritz
& Wischuf (1997). Sampling sites indicated
(M. caspica, black circles; M. rivulata, red
squares; extinct hybrid populations, white
stars; newly discovered putative hybrid pop-
ulation, black star); adjacent sites combined.
For exact localities, see Appendix S1. Cross-
hatching, intergradation zone of M. caspica
caspica and M. c. siebenrocki.
Mauremys phylogeography 529
ª 2 0 0 7 T H E A U T H O R S . J . E V O L . B I O L . 2 1 ( 2 0 0 8 ) 5 2 7 – 5 4 0
J O U R N A L C O M P I L A T I O N ª 2 0 0 7 E U R O P E A N S O C I E T Y F O R E V O L U T I O N A R Y B I O L O G Y
belonged to M. caspica, eight to M. rivulata and one was
morphologically identified as hybrid between both taxa.
No differences were found between reconstructions of
haplotypes based on the total dataset including all 72
individuals and independent estimates within the two
taxa. Since Hardy–Weinberg gene frequencies might
be different between the two Mauremys taxa included in
the study, gametic haplotypes were first inferred within
the two taxa independently. A comparison to a
reconstruction including all 72 individuals, however,
produced the same haplo- and genotypes.
Phylogenetic and population genealogy analyses
Cyt b sequences of the two subspecies of the third
western Palaearctic Mauremys species, M. leprosa, were
downloaded from GenBank and included as outgroups
to the alignment (M. l. leprosa: AJ877039; M. l. saharica:
AJ877035) and five previously published cyt b sequences
of M. caspica (AJ564453–AJ564454, AM110186) and
M. rivulata (AJ564455, AM110185; Barth et al., 2004;
Fritz et al., 2006a) were added. The resulting 91
sequences (M. caspica, 49; M. rivulata, 37; putative
caspica · rivulata hybrids, 5) were collapsed into haplo-
types and identical sequences removed in phylogenetic
analyses. Of 1040 aligned sites, 924 were constant, 13
variable characters were parsimony-uninformative and
103 variable characters were parsimony-informative. For
the ingroup taxa, 969 sites were constant, nine were
variable but parsimony-uninformative and 62
parsimony-informative. Likewise, the 144 inferred
C-mos alleles (M. caspica, 66; M. rivulata, 68; putative
caspica · rivulata hybrids, 10) were collapsed into an
alignment of unique haplotypes (577 bp) that included
20 variable positions, of which 11 were parsimony-
informative (Appendix S1; see also ‘Results’).
Cyt b data were analysed using the neighbour-joining
(NJ) cluster algorithm and with the optimality criteria
maximum parsimony (MP; equal weighting) and maxi-
mum likelihood (ML) as implemented in PAUPPAUP* 4.0b10
(Swofford, 2002; setting swap = TBR) as well as Bayesian
inference of phylogeny as implemented in MRRBAYESAYES 3.1
(Ronquist & Huelsenbeck, 2003). Bayesian analysis (BA)
was performed using two simultaneous runs of four
chains of 10 000 000 generations sampling every 500
generations. The trees of the first generations were
discarded as burn-in so that only the plateau of the most
likely trees was used. The best evolutionary model for the
data (ML calculation and ML distances) was selected by
the Akaike information criterion using MODELTESTMODELTEST 3.06
(best-fit model: K81uf+I; Posada & Crandall, 1998).
Under ML, the starting tree was obtained by stepwise
addition. Bootstrap support was calculated with PAUPPAUP*
4.0b10 for MP (settings def hs add = cl and
nreps = 10 000) and ML (nreps = 100).
Within the same species, sequence data cannot neces-
sarily be represented by dichotomous trees because
ancestral haplotypes may persist along with their
descendents, and tokogenetic reticulate relationships
are likely. Moreover, in organisms with sexual repro-
duction recombination is expected to produce reticula-
tions in reconstructions of evolutionary relationships
based on autosomal nuclear gene fragments at the
population level. Thus reconstruction methods that
enforce tree-like relationships might not adequately
represent all the (conflicting) information on relation-
ships present in the alignment. Therefore, we applied
the median-joining (MJ) network reconstruction algo-
rithm as implemented in NETWORKNETWORK 4.2.0.1 (Bandelt
et al., 1999; http://www.fluxus-engineering.com) to our
cyt b and C-mos data. This algorithm results in networks
representing all equally parsimonious solutions if a
sufficiently weighted genetic distance measure (epsilon)
is applied. A sparse MJ network was also constructed
using equal weights of characters and mutation types,
as well as an epsilon value of zero. In addition, we used
the Statistical Parsimony algorithm as implemented in
TCSTCS 1.21 (Clement et al., 2000). This software is based
on statistical parsimony for constructing a haplotype
network in that the required number of mutational steps
leading from one haplotype to another is minimized.
TCSTCS calculates the outgroup weight for each haplotype
and determines the ancestral haplotype according to
coalescent theory.
Nuclear fingerprinting and analysis
To obtain a measure for possible gene flow between
M. caspica and M. rivulata, we conducted nuclear genomic
fingerprinting using ISSR PCR. This technique employs a
single PCR primer that binds to di- or trinucleotide repeat
motifs (microsatellites), which are abundant in eukaryo-
tic genomes (Tautz & Renz, 1984; Condit & Hubbell,
1991). Since sequences of microsatellites are conserved
over a wide range of organisms, universal primers can be
used. Amplified regions correspond to the sequence
between two simple sequence repeat (SSR) priming sites
orientated on opposite DNA strands (Wolfe et al., 1998).
SSR regions appear to be scattered evenly throughout the
genome (Tautz & Renz, 1984; Condit & Hubbell, 1991),
resulting in a large number of polymorphic bands. The
markers are inherited in a dominant or codominant
Mendelian fashion but are scored as diallelic-dominant
markers for data analysis (Wolfe et al., 1998). The
absence of a band is interpreted as primer divergence or
loss of a locus through the deletion of the SSR site or
chromosomal rearrangement (Wolfe & Liston, 1998).
ISSR is a powerful tool for identifying hybridization and
gene flow, indicated by shared parental bands (e.g. Wolfe
et al., 1998; Wink et al., 2001; Nagy et al., 2003; Schilde
et al., 2004; Fritz et al., 2005).
We used the nonanchored primer (GACA)4 that
yielded species-diagnostic banding patterns for other
chelonian species in previous studies (e.g. Schilde et al.,
530 U. FRITZ ET AL.
ª 2 0 0 7 T H E A U T H O R S . J . E V O L . B I O L . 2 1 ( 2 0 0 8 ) 5 2 7 – 5 4 0
J O U R N A L C O M P I L A T I O N ª 2 0 0 7 E U R O P E A N S O C I E T Y F O R E V O L U T I O N A R Y B I O L O G Y
2004). PCR was performed with �60 ng template DNA in
a 30 lL volume [same PCR buffer as described above,
10 pmol primer, 10 pmol dNTPs (Fermentas) and 1 unit
Taq polymerase (Bioron)]. Following the initial 5 min
denaturing at 94 �C, the PCR program consisted of 35
cycles of 60 s at 94 �C, 120 s at the annealing temper-
ature of 55 �C, 120 s at 72 �C and a final elongation step
of 5 min at 72 �C. DNA fragments were separated by
PAGE in a vertical apparatus (38 · 30 cm, Sequigene,
Bio-Rad) for 1.5 h at 65 W. The denaturing gel [7 MM
urea, 6% acrylamide (Rotiphorese 40, 29 : 1, Roth) in 1·TBE buffer (10·: 1 MM Tris, 0.83 MM boric acid, 10 mMM
EDTA, pH 8.6)] had a thickness of 0.4 mm. After drying,
the gel was scanned. Seventeen unambiguously scorable
bands of 41 samples were transformed into a pres-
ence ⁄ absence matrix and analysed using the cluster
algorithm NJ in PAUPPAUP* 4.0b10. Given that M. caspica and
M. rivulata have diagnostic banding patterns, their ISSR
profiles should be revealed as distinct clusters. Hybrids
should share alleles of both species.
Results
Morphology
All stripe-necked terrapins studied during fieldwork,
except the five putative hybrids from north-western
Turkey (Gaziler village, Osmaneli district, Bilecik prov-
ince), perfectly agreed with the species-diagnostic color-
ation and pattern characters outlined by Fritz & Wischuf
(1997) and could be unambiguously assigned either to
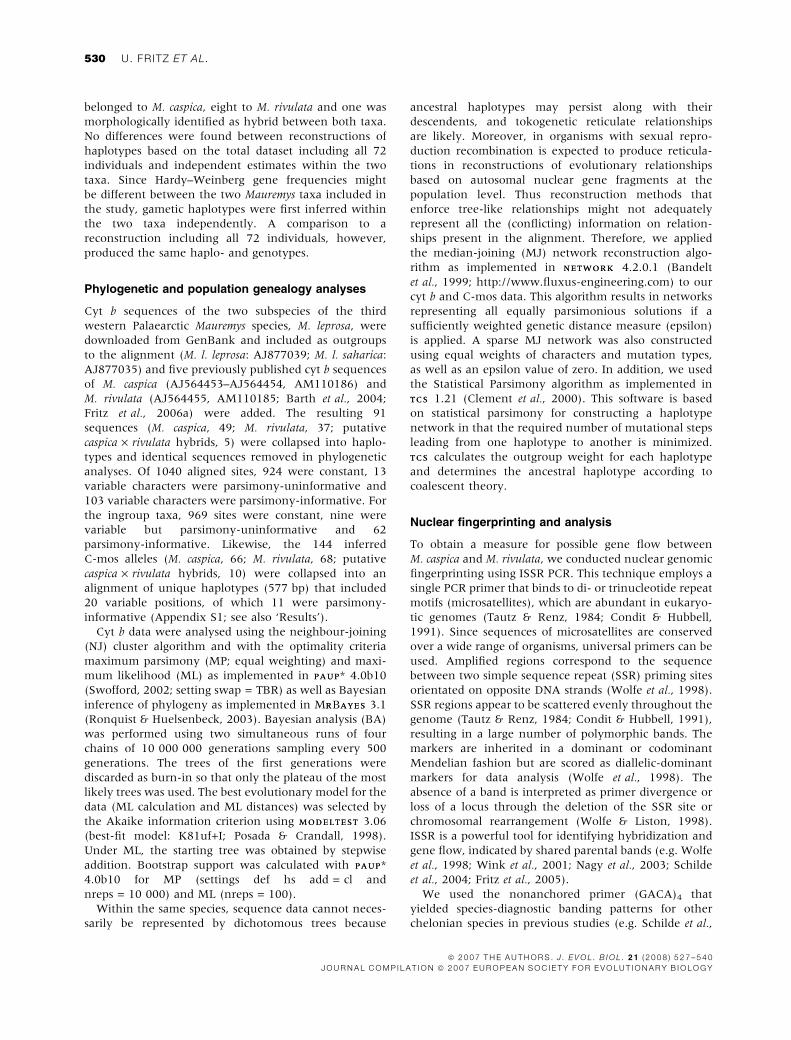
M. caspica or to M. rivulata, without any character overlap.
Individuals of the three morphologically distinctive
subspecies of M. caspica agreed with the descriptions of
Fritz & Wischuf (1997). The putative caspica · rivulata
hybrids resembled the eight hybrids described in Fritz &
Wischuf (1997) in that species-diagnostic coloration and
pattern characters of M. caspica and M. rivulata (see Fritz &
Wischuf, 1997) occurred in combination in the same
terrapin or characters were intermediate (Fig. 2).
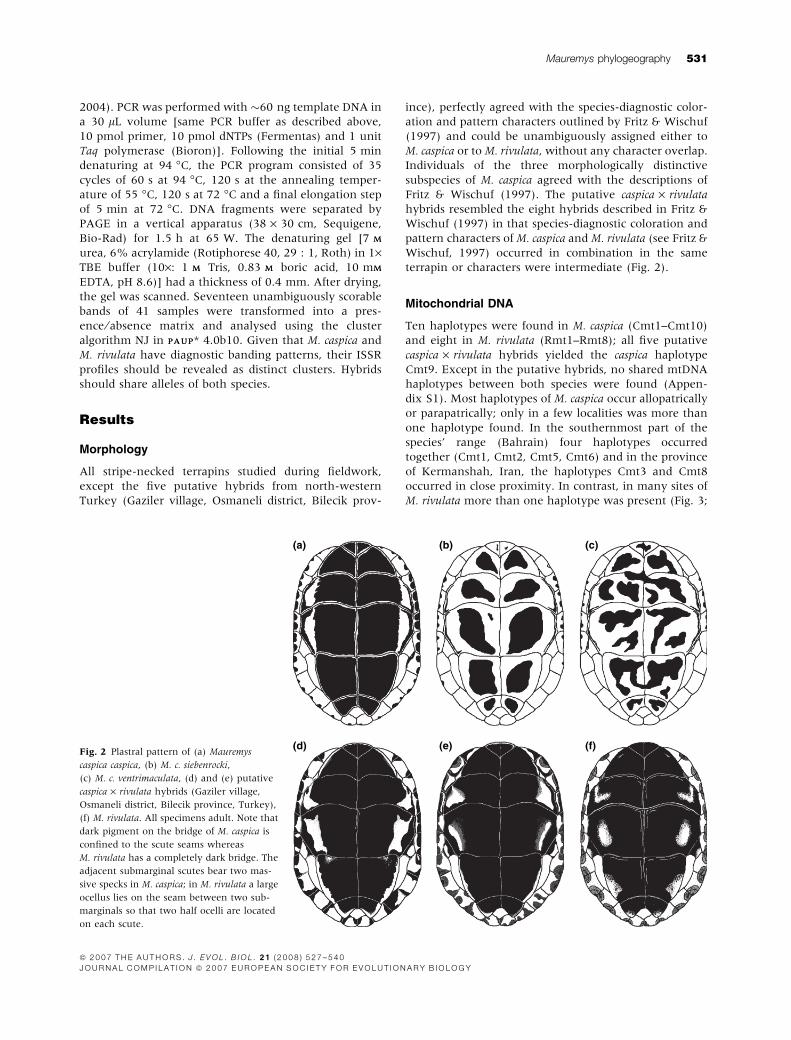
Mitochondrial DNA
Ten haplotypes were found in M. caspica (Cmt1–Cmt10)
and eight in M. rivulata (Rmt1–Rmt8); all five putative
caspica · rivulata hybrids yielded the caspica haplotype
Cmt9. Except in the putative hybrids, no shared mtDNA
haplotypes between both species were found (Appen-
dix S1). Most haplotypes of M. caspica occur allopatrically
or parapatrically; only in a few localities was more than
one haplotype found. In the southernmost part of the
species’ range (Bahrain) four haplotypes occurred
together (Cmt1, Cmt2, Cmt5, Cmt6) and in the province
of Kermanshah, Iran, the haplotypes Cmt3 and Cmt8
occurred in close proximity. In contrast, in many sites of
M. rivulata more than one haplotype was present (Fig. 3;
(a) (b) (c)
(d) (e) (f)Fig. 2 Plastral pattern of (a) Mauremys
caspica caspica, (b) M. c. siebenrocki,
(c) M. c. ventrimaculata, (d) and (e) putative
caspica · rivulata hybrids (Gaziler village,
Osmaneli district, Bilecik province, Turkey),
(f) M. rivulata. All specimens adult. Note that
dark pigment on the bridge of M. caspica is
confined to the scute seams whereas
M. rivulata has a completely dark bridge. The
adjacent submarginal scutes bear two mas-
sive specks in M. caspica; in M. rivulata a large
ocellus lies on the seam between two sub-
marginals so that two half ocelli are located
on each scute.
Mauremys phylogeography 531
ª 2 0 0 7 T H E A U T H O R S . J . E V O L . B I O L . 2 1 ( 2 0 0 8 ) 5 2 7 – 5 4 0
J O U R N A L C O M P I L A T I O N ª 2 0 0 7 E U R O P E A N S O C I E T Y F O R E V O L U T I O N A R Y B I O L O G Y
Appendix S1). Uncorrected p distances and ML distances
of haplotypes are summarized in Table 1.
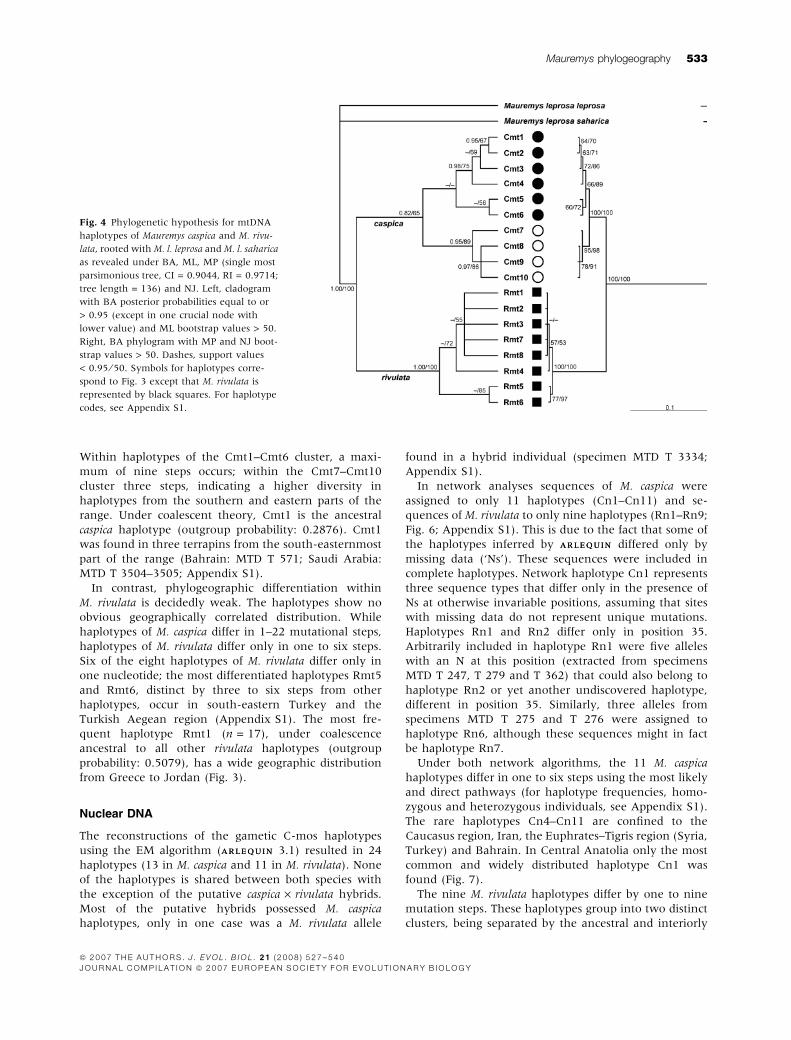
All tree-building methods revealed an identical
branching pattern; haplotypes of each species correspond
to a distinct clade (Fig. 4). However, under BA and ML
the monophyly of M. caspica haplotypes is unexpectedly
weakly supported (posterior probability of 0.82, bootstrap
support of 65%), whereas under parsimony and NJ high
bootstrap support of 100% occurs. Monophyly of
M. rivulata haplotypes is well-supported under all meth-
ods. Within M. caspica, two clades occur. One weakly
supported clade (Cmt1–Cmt6) contains haplotypes from
the eastern and southern parts of the range; the other
clade (Cmt7–Cmt10), moderately to well-supported,
comprises sequences of terrapins from Anatolia and
adjacent westernmost Iran; both clades occur in the
province of Kermanshah, western Iran (Cmt3 and Cmt8).
Structure within the M. rivulata clade is weak; Rmt5 and
Rmt6 are suggested with weak support as sister to the
other haplotypes.
Networks of the two species are highly distinct. Using
TCSTCS, their parsimony networks are not connected if 90–
95% thresholds are applied (Fig. 5). If a connection is
enforced, haplotypes of the two species are separated by a
minimum of 50 mutational steps (52 in the MJ network
created by NETWORKNETWORK 4.2.0.1). In M. caspica two distinct
clusters occur, corresponding to the two clades in
phylogenetic analyses. In parsimony (Fig. 5) and MJ
network analyses (not shown), haplotypes of the two
clusters are separated by at least 10 mutational steps.
Fig. 3 Distribution of mtDNA haplotypes of
Mauremys caspica (western clade, open circles;
eastern clade, solid black circles) and M.
rivulata (solid red squares). Numbers indicate
individual haplotypes; numbers separated by
slashes, syntopic occurrence of respective
haplotypes. Note high diversity around the
Persian Gulf.
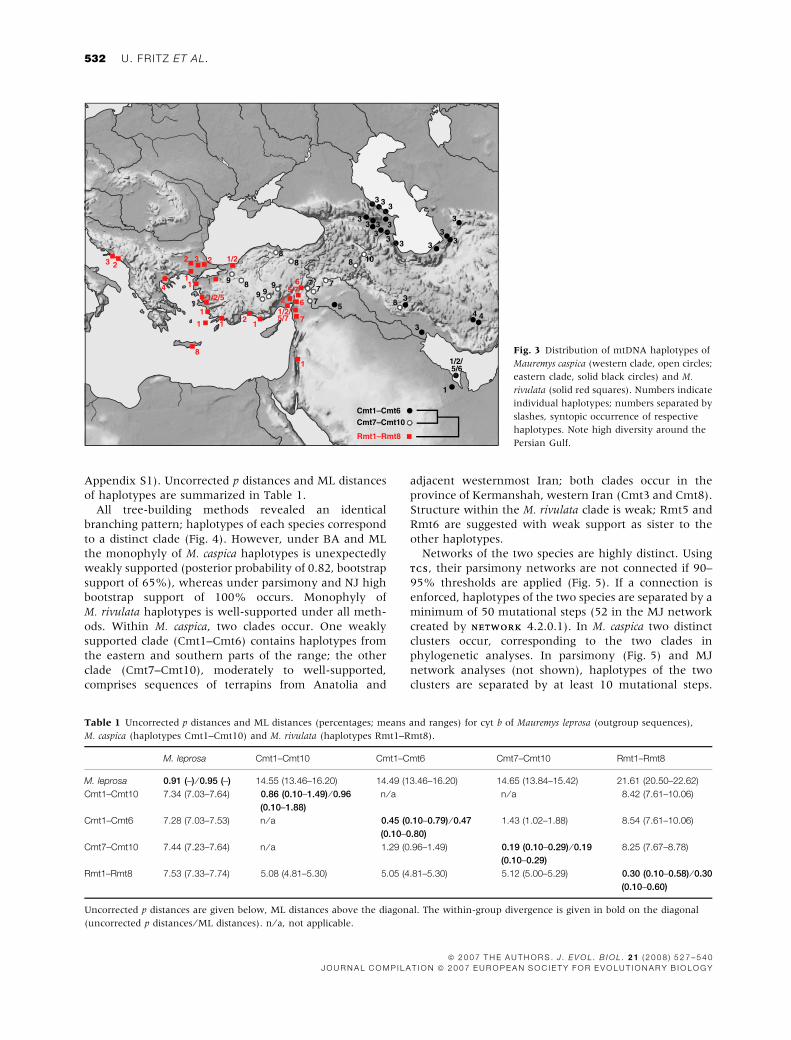
Table 1 Uncorrected p distances and ML distances (percentages; means and ranges) for cyt b of Mauremys leprosa (outgroup sequences),
M. caspica (haplotypes Cmt1–Cmt10) and M. rivulata (haplotypes Rmt1–Rmt8).
M. leprosa Cmt1–Cmt10 Cmt1–Cmt6 Cmt7–Cmt10 Rmt1–Rmt8
M. leprosa 0.91 (–) ⁄ 0.95 (–) 14.55 (13.46–16.20) 14.49 (13.46–16.20) 14.65 (13.84–15.42) 21.61 (20.50–22.62)
Cmt1–Cmt10 7.34 (7.03–7.64) 0.86 (0.10–1.49) ⁄ 0.96
(0.10–1.88)
n ⁄ a n ⁄ a 8.42 (7.61–10.06)
Cmt1–Cmt6 7.28 (7.03–7.53) n ⁄ a 0.45 (0.10–0.79) ⁄ 0.47
(0.10–0.80)
1.43 (1.02–1.88) 8.54 (7.61–10.06)
Cmt7–Cmt10 7.44 (7.23–7.64) n ⁄ a 1.29 (0.96–1.49) 0.19 (0.10–0.29) ⁄ 0.19
(0.10–0.29)
8.25 (7.67–8.78)
Rmt1–Rmt8 7.53 (7.33–7.74) 5.08 (4.81–5.30) 5.05 (4.81–5.30) 5.12 (5.00–5.29) 0.30 (0.10–0.58) ⁄ 0.30
(0.10–0.60)
Uncorrected p distances are given below, ML distances above the diagonal. The within-group divergence is given in bold on the diagonal
(uncorrected p distances ⁄ ML distances). n ⁄ a, not applicable.
532 U. FRITZ ET AL.
ª 2 0 0 7 T H E A U T H O R S . J . E V O L . B I O L . 2 1 ( 2 0 0 8 ) 5 2 7 – 5 4 0
J O U R N A L C O M P I L A T I O N ª 2 0 0 7 E U R O P E A N S O C I E T Y F O R E V O L U T I O N A R Y B I O L O G Y
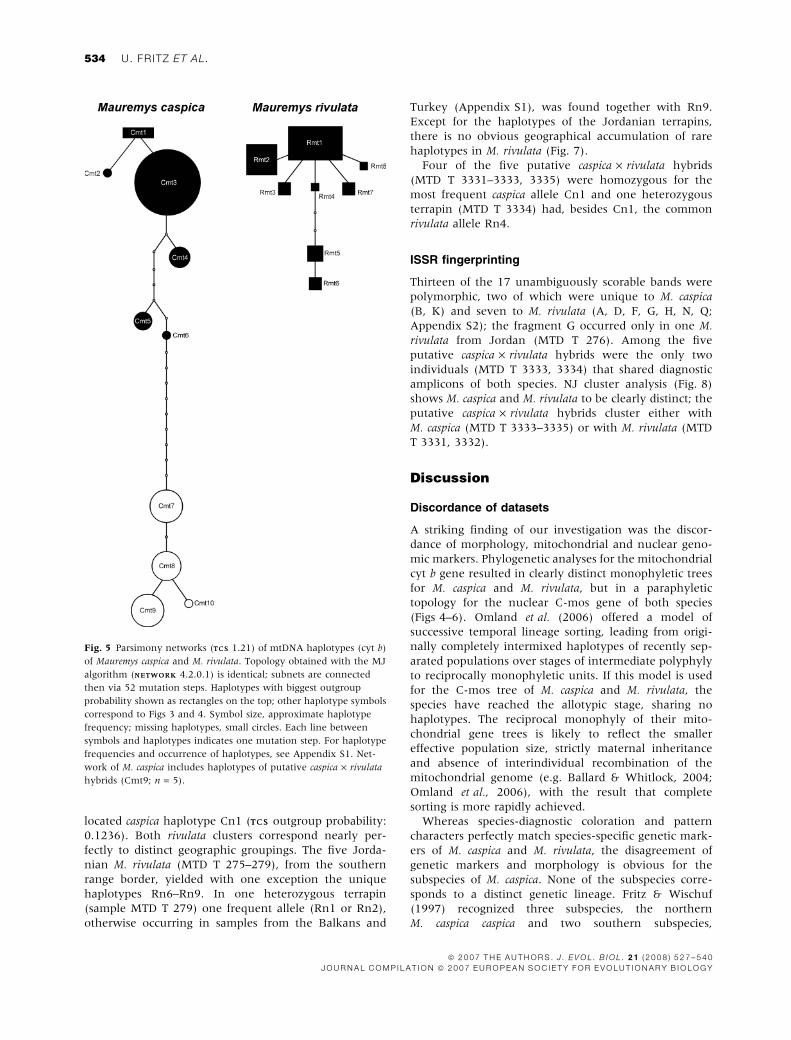
Within haplotypes of the Cmt1–Cmt6 cluster, a maxi-
mum of nine steps occurs; within the Cmt7–Cmt10
cluster three steps, indicating a higher diversity in
haplotypes from the southern and eastern parts of the
range. Under coalescent theory, Cmt1 is the ancestral
caspica haplotype (outgroup probability: 0.2876). Cmt1
was found in three terrapins from the south-easternmost
part of the range (Bahrain: MTD T 571; Saudi Arabia:
MTD T 3504–3505; Appendix S1).
In contrast, phylogeographic differentiation within
M. rivulata is decidedly weak. The haplotypes show no
obvious geographically correlated distribution. While
haplotypes of M. caspica differ in 1–22 mutational steps,
haplotypes of M. rivulata differ only in one to six steps.
Six of the eight haplotypes of M. rivulata differ only in
one nucleotide; the most differentiated haplotypes Rmt5
and Rmt6, distinct by three to six steps from other
haplotypes, occur in south-eastern Turkey and the
Turkish Aegean region (Appendix S1). The most fre-
quent haplotype Rmt1 (n = 17), under coalescence
ancestral to all other rivulata haplotypes (outgroup
probability: 0.5079), has a wide geographic distribution
from Greece to Jordan (Fig. 3).
Nuclear DNA
The reconstructions of the gametic C-mos haplotypes
using the EM algorithm (ARLEQUINARLEQUIN 3.1) resulted in 24
haplotypes (13 in M. caspica and 11 in M. rivulata). None
of the haplotypes is shared between both species with
the exception of the putative caspica · rivulata hybrids.
Most of the putative hybrids possessed M. caspica
haplotypes, only in one case was a M. rivulata allele
found in a hybrid individual (specimen MTD T 3334;
Appendix S1).
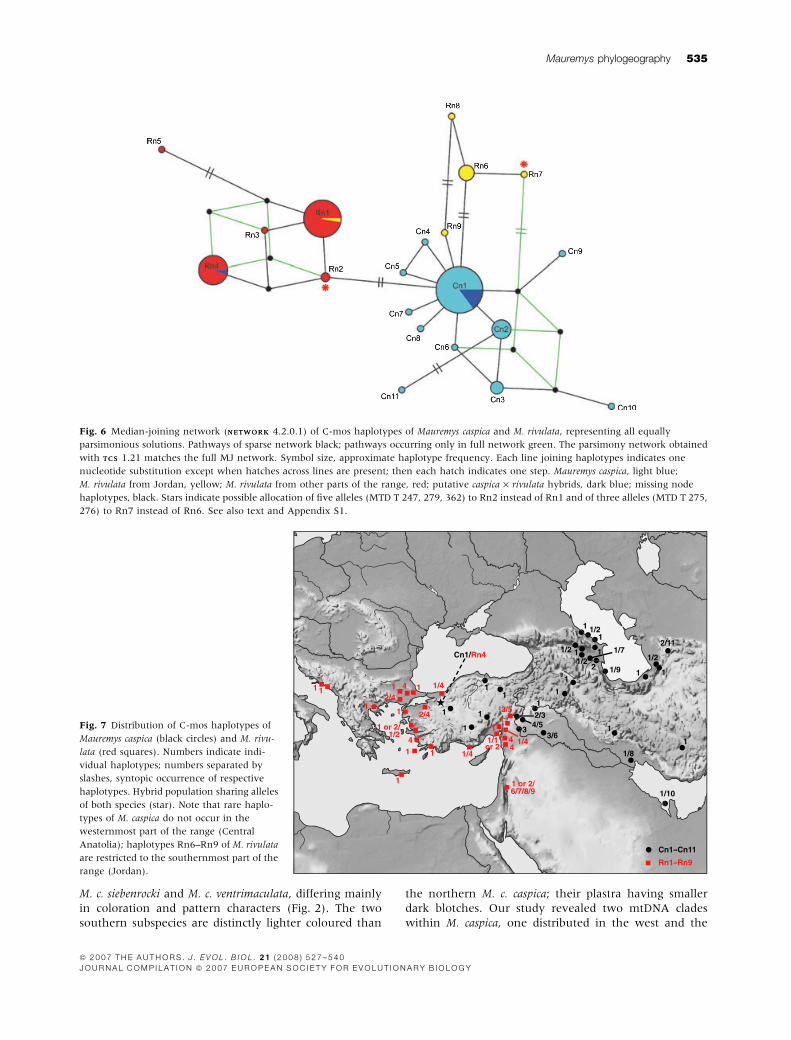
In network analyses sequences of M. caspica were
assigned to only 11 haplotypes (Cn1–Cn11) and se-
quences of M. rivulata to only nine haplotypes (Rn1–Rn9;
Fig. 6; Appendix S1). This is due to the fact that some of
the haplotypes inferred by ARLEQUINARLEQUIN differed only by
missing data (‘Ns’). These sequences were included in
complete haplotypes. Network haplotype Cn1 represents
three sequence types that differ only in the presence of
Ns at otherwise invariable positions, assuming that sites
with missing data do not represent unique mutations.
Haplotypes Rn1 and Rn2 differ only in position 35.
Arbitrarily included in haplotype Rn1 were five alleles
with an N at this position (extracted from specimens
MTD T 247, T 279 and T 362) that could also belong to
haplotype Rn2 or yet another undiscovered haplotype,
different in position 35. Similarly, three alleles from
specimens MTD T 275 and T 276 were assigned to
haplotype Rn6, although these sequences might in fact
be haplotype Rn7.
Under both network algorithms, the 11 M. caspica
haplotypes differ in one to six steps using the most likely
and direct pathways (for haplotype frequencies, homo-
zygous and heterozygous individuals, see Appendix S1).
The rare haplotypes Cn4–Cn11 are confined to the
Caucasus region, Iran, the Euphrates–Tigris region (Syria,
Turkey) and Bahrain. In Central Anatolia only the most
common and widely distributed haplotype Cn1 was
found (Fig. 7).
The nine M. rivulata haplotypes differ by one to nine
mutation steps. These haplotypes group into two distinct
clusters, being separated by the ancestral and interiorly
Fig. 4 Phylogenetic hypothesis for mtDNA
haplotypes of Mauremys caspica and M. rivu-
lata, rooted with M. l. leprosa and M. l. saharica
as revealed under BA, ML, MP (single most
parsimonious tree, CI = 0.9044, RI = 0.9714;
tree length = 136) and NJ. Left, cladogram
with BA posterior probabilities equal to or
> 0.95 (except in one crucial node with
lower value) and ML bootstrap values > 50.
Right, BA phylogram with MP and NJ boot-
strap values > 50. Dashes, support values
< 0.95 ⁄ 50. Symbols for haplotypes corre-
spond to Fig. 3 except that M. rivulata is
represented by black squares. For haplotype
codes, see Appendix S1.
Mauremys phylogeography 533
ª 2 0 0 7 T H E A U T H O R S . J . E V O L . B I O L . 2 1 ( 2 0 0 8 ) 5 2 7 – 5 4 0
J O U R N A L C O M P I L A T I O N ª 2 0 0 7 E U R O P E A N S O C I E T Y F O R E V O L U T I O N A R Y B I O L O G Y
located caspica haplotype Cn1 (TCSTCS outgroup probability:
0.1236). Both rivulata clusters correspond nearly per-
fectly to distinct geographic groupings. The five Jorda-
nian M. rivulata (MTD T 275–279), from the southern
range border, yielded with one exception the unique
haplotypes Rn6–Rn9. In one heterozygous terrapin
(sample MTD T 279) one frequent allele (Rn1 or Rn2),
otherwise occurring in samples from the Balkans and
Turkey (Appendix S1), was found together with Rn9.
Except for the haplotypes of the Jordanian terrapins,
there is no obvious geographical accumulation of rare
haplotypes in M. rivulata (Fig. 7).
Four of the five putative caspica · rivulata hybrids
(MTD T 3331–3333, 3335) were homozygous for the
most frequent caspica allele Cn1 and one heterozygous
terrapin (MTD T 3334) had, besides Cn1, the common
rivulata allele Rn4.
ISSR fingerprinting
Thirteen of the 17 unambiguously scorable bands were
polymorphic, two of which were unique to M. caspica
(B, K) and seven to M. rivulata (A, D, F, G, H, N, Q;
Appendix S2); the fragment G occurred only in one M.
rivulata from Jordan (MTD T 276). Among the five
putative caspica · rivulata hybrids were the only two
individuals (MTD T 3333, 3334) that shared diagnostic
amplicons of both species. NJ cluster analysis (Fig. 8)
shows M. caspica and M. rivulata to be clearly distinct; the
putative caspica · rivulata hybrids cluster either with
M. caspica (MTD T 3333–3335) or with M. rivulata (MTD
T 3331, 3332).
Discussion
Discordance of datasets
A striking finding of our investigation was the discor-
dance of morphology, mitochondrial and nuclear geno-
mic markers. Phylogenetic analyses for the mitochondrial
cyt b gene resulted in clearly distinct monophyletic trees
for M. caspica and M. rivulata, but in a paraphyletic
topology for the nuclear C-mos gene of both species
(Figs 4–6). Omland et al. (2006) offered a model of
successive temporal lineage sorting, leading from origi-
nally completely intermixed haplotypes of recently sep-
arated populations over stages of intermediate polyphyly
to reciprocally monophyletic units. If this model is used
for the C-mos tree of M. caspica and M. rivulata, the
species have reached the allotypic stage, sharing no
haplotypes. The reciprocal monophyly of their mito-
chondrial gene trees is likely to reflect the smaller
effective population size, strictly maternal inheritance
and absence of interindividual recombination of the
mitochondrial genome (e.g. Ballard & Whitlock, 2004;
Omland et al., 2006), with the result that complete
sorting is more rapidly achieved.
Whereas species-diagnostic coloration and pattern
characters perfectly match species-specific genetic mark-
ers of M. caspica and M. rivulata, the disagreement of
genetic markers and morphology is obvious for the
subspecies of M. caspica. None of the subspecies corre-
sponds to a distinct genetic lineage. Fritz & Wischuf
(1997) recognized three subspecies, the northern
M. caspica caspica and two southern subspecies,
Fig. 5 Parsimony networks (TCSTCS 1.21) of mtDNA haplotypes (cyt b)
of Mauremys caspica and M. rivulata. Topology obtained with the MJ
algorithm (NETWORKNETWORK 4.2.0.1) is identical; subnets are connected
then via 52 mutation steps. Haplotypes with biggest outgroup
probability shown as rectangles on the top; other haplotype symbols
correspond to Figs 3 and 4. Symbol size, approximate haplotype
frequency; missing haplotypes, small circles. Each line between
symbols and haplotypes indicates one mutation step. For haplotype
frequencies and occurrence of haplotypes, see Appendix S1. Net-
work of M. caspica includes haplotypes of putative caspica · rivulata
hybrids (Cmt9; n = 5).
534 U. FRITZ ET AL.
ª 2 0 0 7 T H E A U T H O R S . J . E V O L . B I O L . 2 1 ( 2 0 0 8 ) 5 2 7 – 5 4 0
J O U R N A L C O M P I L A T I O N ª 2 0 0 7 E U R O P E A N S O C I E T Y F O R E V O L U T I O N A R Y B I O L O G Y
M. c. siebenrocki and M. c. ventrimaculata, differing mainly
in coloration and pattern characters (Fig. 2). The two
southern subspecies are distinctly lighter coloured than
the northern M. c. caspica; their plastra having smaller
dark blotches. Our study revealed two mtDNA clades
within M. caspica, one distributed in the west and the
Fig. 6 Median-joining network (NETWORKNETWORK 4.2.0.1) of C-mos haplotypes of Mauremys caspica and M. rivulata, representing all equally
parsimonious solutions. Pathways of sparse network black; pathways occurring only in full network green. The parsimony network obtained
with TCSTCS 1.21 matches the full MJ network. Symbol size, approximate haplotype frequency. Each line joining haplotypes indicates one
nucleotide substitution except when hatches across lines are present; then each hatch indicates one step. Mauremys caspica, light blue;
M. rivulata from Jordan, yellow; M. rivulata from other parts of the range, red; putative caspica · rivulata hybrids, dark blue; missing node
haplotypes, black. Stars indicate possible allocation of five alleles (MTD T 247, 279, 362) to Rn2 instead of Rn1 and of three alleles (MTD T 275,
276) to Rn7 instead of Rn6. See also text and Appendix S1.
Fig. 7 Distribution of C-mos haplotypes of
Mauremys caspica (black circles) and M. rivu-
lata (red squares). Numbers indicate indi-
vidual haplotypes; numbers separated by
slashes, syntopic occurrence of respective
haplotypes. Hybrid population sharing alleles
of both species (star). Note that rare haplo-
types of M. caspica do not occur in the
westernmost part of the range (Central
Anatolia); haplotypes Rn6–Rn9 of M. rivulata
are restricted to the southernmost part of the
range (Jordan).
Mauremys phylogeography 535
ª 2 0 0 7 T H E A U T H O R S . J . E V O L . B I O L . 2 1 ( 2 0 0 8 ) 5 2 7 – 5 4 0
J O U R N A L C O M P I L A T I O N ª 2 0 0 7 E U R O P E A N S O C I E T Y F O R E V O L U T I O N A R Y B I O L O G Y
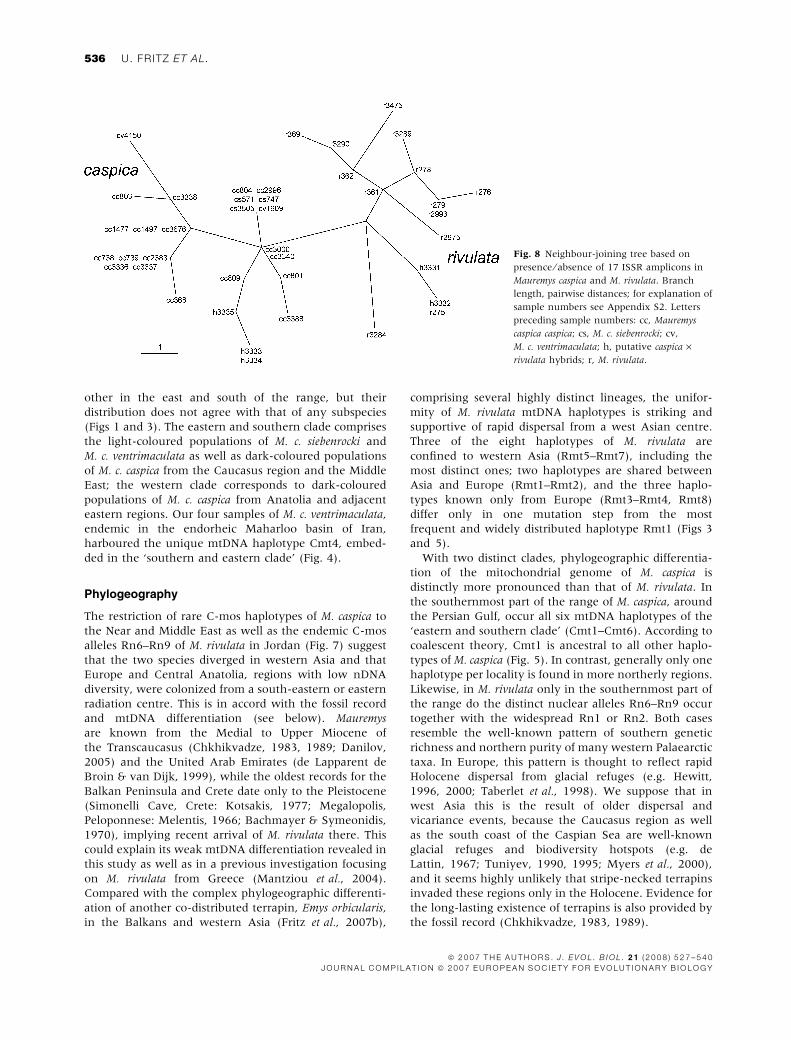
other in the east and south of the range, but their
distribution does not agree with that of any subspecies
(Figs 1 and 3). The eastern and southern clade comprises
the light-coloured populations of M. c. siebenrocki and
M. c. ventrimaculata as well as dark-coloured populations
of M. c. caspica from the Caucasus region and the Middle
East; the western clade corresponds to dark-coloured
populations of M. c. caspica from Anatolia and adjacent
eastern regions. Our four samples of M. c. ventrimaculata,
endemic in the endorheic Maharloo basin of Iran,
harboured the unique mtDNA haplotype Cmt4, embed-
ded in the ‘southern and eastern clade’ (Fig. 4).
Phylogeography
The restriction of rare C-mos haplotypes of M. caspica to
the Near and Middle East as well as the endemic C-mos
alleles Rn6–Rn9 of M. rivulata in Jordan (Fig. 7) suggest
that the two species diverged in western Asia and that
Europe and Central Anatolia, regions with low nDNA
diversity, were colonized from a south-eastern or eastern
radiation centre. This is in accord with the fossil record
and mtDNA differentiation (see below). Mauremys
are known from the Medial to Upper Miocene of
the Transcaucasus (Chkhikvadze, 1983, 1989; Danilov,
2005) and the United Arab Emirates (de Lapparent de
Broin & van Dijk, 1999), while the oldest records for the
Balkan Peninsula and Crete date only to the Pleistocene
(Simonelli Cave, Crete: Kotsakis, 1977; Megalopolis,
Peloponnese: Melentis, 1966; Bachmayer & Symeonidis,
1970), implying recent arrival of M. rivulata there. This
could explain its weak mtDNA differentiation revealed in
this study as well as in a previous investigation focusing
on M. rivulata from Greece (Mantziou et al., 2004).
Compared with the complex phylogeographic differenti-
ation of another co-distributed terrapin, Emys orbicularis,
in the Balkans and western Asia (Fritz et al., 2007b),
comprising several highly distinct lineages, the unifor-
mity of M. rivulata mtDNA haplotypes is striking and
supportive of rapid dispersal from a west Asian centre.
Three of the eight haplotypes of M. rivulata are
confined to western Asia (Rmt5–Rmt7), including the
most distinct ones; two haplotypes are shared between
Asia and Europe (Rmt1–Rmt2), and the three haplo-
types known only from Europe (Rmt3–Rmt4, Rmt8)
differ only in one mutation step from the most
frequent and widely distributed haplotype Rmt1 (Figs 3
and 5).
With two distinct clades, phylogeographic differentia-
tion of the mitochondrial genome of M. caspica is
distinctly more pronounced than that of M. rivulata. In
the southernmost part of the range of M. caspica, around
the Persian Gulf, occur all six mtDNA haplotypes of the
‘eastern and southern clade’ (Cmt1–Cmt6). According to
coalescent theory, Cmt1 is ancestral to all other haplo-
types of M. caspica (Fig. 5). In contrast, generally only one
haplotype per locality is found in more northerly regions.
Likewise, in M. rivulata only in the southernmost part of
the range do the distinct nuclear alleles Rn6–Rn9 occur
together with the widespread Rn1 or Rn2. Both cases
resemble the well-known pattern of southern genetic
richness and northern purity of many western Palaearctic
taxa. In Europe, this pattern is thought to reflect rapid
Holocene dispersal from glacial refuges (e.g. Hewitt,
1996, 2000; Taberlet et al., 1998). We suppose that in
west Asia this is the result of older dispersal and
vicariance events, because the Caucasus region as well
as the south coast of the Caspian Sea are well-known
glacial refuges and biodiversity hotspots (e.g. de
Lattin, 1967; Tuniyev, 1990, 1995; Myers et al., 2000),
and it seems highly unlikely that stripe-necked terrapins
invaded these regions only in the Holocene. Evidence for
the long-lasting existence of terrapins is also provided by
the fossil record (Chkhikvadze, 1983, 1989).
Fig. 8 Neighbour-joining tree based on
presence ⁄ absence of 17 ISSR amplicons in
Mauremys caspica and M. rivulata. Branch
length, pairwise distances; for explanation of
sample numbers see Appendix S2. Letters
preceding sample numbers: cc, Mauremys
caspica caspica; cs, M. c. siebenrocki; cv,
M. c. ventrimaculata; h, putative caspica ·rivulata hybrids; r, M. rivulata.
536 U. FRITZ ET AL.
ª 2 0 0 7 T H E A U T H O R S . J . E V O L . B I O L . 2 1 ( 2 0 0 8 ) 5 2 7 – 5 4 0
J O U R N A L C O M P I L A T I O N ª 2 0 0 7 E U R O P E A N S O C I E T Y F O R E V O L U T I O N A R Y B I O L O G Y
The phylogenetically differentiated clade of haplotypes
Cmt7–Cmt10, nearly entirely confined to Anatolia, sug-
gests that a distinct refuge existed there. This is unex-
pected considering the high altitude of this region
(�1000 m above the sea level in the Anatolian Plateau),
surely with severe climatic conditions during Pleistocene
glacials. The uniformity of nDNA alleles in Central
Anatolia (Fig. 7) could reflect that these populations
underwent a glacial bottleneck.
The co-occurrence of both mtDNA clades of M. caspica in
the upper and lower Euphrates and Tigris catchment
basins (Fig. 3) calls for further research. This pattern could
be the result of distinct Holocene range expansions,
downstream from the western refuge in Anatolia and
upstream from the south-eastern refuge around the
Persian Gulf, leading to admixture of both dispersal waves
along the courses of the Euphrates and Tigris rivers.
Hybridization
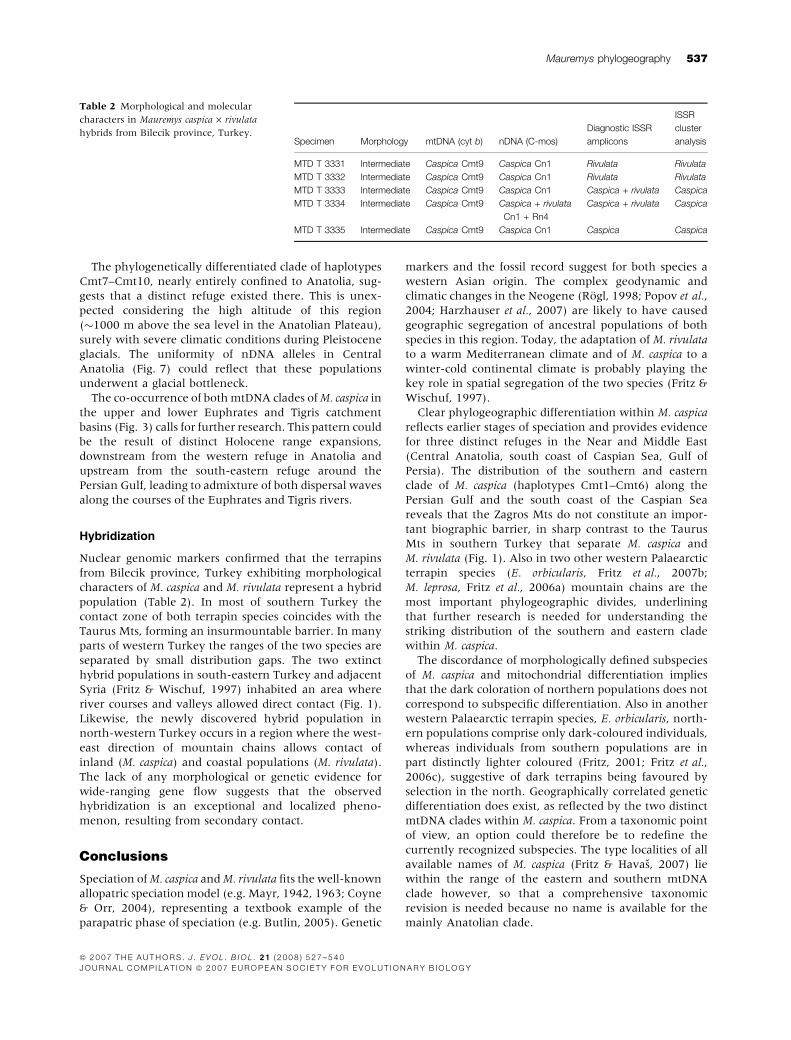
Nuclear genomic markers confirmed that the terrapins
from Bilecik province, Turkey exhibiting morphological
characters of M. caspica and M. rivulata represent a hybrid
population (Table 2). In most of southern Turkey the
contact zone of both terrapin species coincides with the
Taurus Mts, forming an insurmountable barrier. In many
parts of western Turkey the ranges of the two species are
separated by small distribution gaps. The two extinct
hybrid populations in south-eastern Turkey and adjacent
Syria (Fritz & Wischuf, 1997) inhabited an area where
river courses and valleys allowed direct contact (Fig. 1).
Likewise, the newly discovered hybrid population in
north-western Turkey occurs in a region where the west-
east direction of mountain chains allows contact of
inland (M. caspica) and coastal populations (M. rivulata).
The lack of any morphological or genetic evidence for
wide-ranging gene flow suggests that the observed
hybridization is an exceptional and localized pheno-
menon, resulting from secondary contact.
Conclusions
Speciation of M. caspica and M. rivulata fits the well-known
allopatric speciation model (e.g. Mayr, 1942, 1963; Coyne
& Orr, 2004), representing a textbook example of the
parapatric phase of speciation (e.g. Butlin, 2005). Genetic
markers and the fossil record suggest for both species a
western Asian origin. The complex geodynamic and
climatic changes in the Neogene (Rogl, 1998; Popov et al.,
2004; Harzhauser et al., 2007) are likely to have caused
geographic segregation of ancestral populations of both
species in this region. Today, the adaptation of M. rivulata
to a warm Mediterranean climate and of M. caspica to a
winter-cold continental climate is probably playing the
key role in spatial segregation of the two species (Fritz &
Wischuf, 1997).
Clear phylogeographic differentiation within M. caspica
reflects earlier stages of speciation and provides evidence
for three distinct refuges in the Near and Middle East
(Central Anatolia, south coast of Caspian Sea, Gulf of
Persia). The distribution of the southern and eastern
clade of M. caspica (haplotypes Cmt1–Cmt6) along the
Persian Gulf and the south coast of the Caspian Sea
reveals that the Zagros Mts do not constitute an impor-
tant biographic barrier, in sharp contrast to the Taurus
Mts in southern Turkey that separate M. caspica and
M. rivulata (Fig. 1). Also in two other western Palaearctic
terrapin species (E. orbicularis, Fritz et al., 2007b;
M. leprosa, Fritz et al., 2006a) mountain chains are the
most important phylogeographic divides, underlining
that further research is needed for understanding the
striking distribution of the southern and eastern clade
within M. caspica.
The discordance of morphologically defined subspecies
of M. caspica and mitochondrial differentiation implies
that the dark coloration of northern populations does not
correspond to subspecific differentiation. Also in another
western Palaearctic terrapin species, E. orbicularis, north-
ern populations comprise only dark-coloured individuals,
whereas individuals from southern populations are in
part distinctly lighter coloured (Fritz, 2001; Fritz et al.,
2006c), suggestive of dark terrapins being favoured by
selection in the north. Geographically correlated genetic
differentiation does exist, as reflected by the two distinct
mtDNA clades within M. caspica. From a taxonomic point
of view, an option could therefore be to redefine the
currently recognized subspecies. The type localities of all
available names of M. caspica (Fritz & Havas, 2007) lie
within the range of the eastern and southern mtDNA
clade however, so that a comprehensive taxonomic
revision is needed because no name is available for the
mainly Anatolian clade.
Table 2 Morphological and molecular
characters in Mauremys caspica · rivulata
hybrids from Bilecik province, Turkey.Specimen Morphology mtDNA (cyt b) nDNA (C-mos)
Diagnostic ISSR
amplicons
ISSR
cluster
analysis
MTD T 3331 Intermediate Caspica Cmt9 Caspica Cn1 Rivulata Rivulata
MTD T 3332 Intermediate Caspica Cmt9 Caspica Cn1 Rivulata Rivulata
MTD T 3333 Intermediate Caspica Cmt9 Caspica Cn1 Caspica + rivulata Caspica
MTD T 3334 Intermediate Caspica Cmt9 Caspica + rivulata
Cn1 + Rn4
Caspica + rivulata Caspica
MTD T 3335 Intermediate Caspica Cmt9 Caspica Cn1 Caspica Caspica
Mauremys phylogeography 537
ª 2 0 0 7 T H E A U T H O R S . J . E V O L . B I O L . 2 1 ( 2 0 0 8 ) 5 2 7 – 5 4 0
J O U R N A L C O M P I L A T I O N ª 2 0 0 7 E U R O P E A N S O C I E T Y F O R E V O L U T I O N A R Y B I O L O G Y
Hybridization between M. caspica and M. rivulata is
extremely rare. Apart from three hybrid populations
(Fritz & Wischuf, 1997; this study), there is no evidence
for gene flow. This was unexpected considering the
frequent cases of hybridization and introgression of
mitochondrial genomes in other, in part even distantly
related, chelonian species (Guicking et al., 2002; Lara-
Ruiz et al., 2006; Farias et al., 2007; Fong et al., 2007;
Praschag et al., 2007; Spinks & Shaffer, 2007; see also
reviews in Schilde et al., 2004; Buskirk et al., 2005 and
Bowen & Karl, 2007; Stuart & Parham, 2007) and
suggests that in chelonians effective intrinsic isolation
mechanisms exist, developed during speciation. The
increasing frequency of hybridization in other, mainly
tropical chelonians in recent years could therefore reflect
the breakdown of ecological isolation due to large-scale
human disturbance.
Acknowledgments
Daniel Frynta, Mario Herz, Pavel Siroky and Paul
Vercammen provided samples or assisted during collec-
tion of samples. Thanks go to Massimo Delfino for his
help with the fossil record of Mauremys and to Anke
Muller for laboratory work. Dincer Ayaz’s work was
supported by the TUBITAK grant TBAG-2402 (103T189).
References
Austin, J.J. & Arnold, N.E. 2001. Ancient mitochondrial DNA
and morphology elucidate an extinct island radiation of Indian
Ocean giant tortoises (Cylindraspis). Proc. R. Soc. Lond. B 268:
2515–2523.
Austin, J.J., Arnold, N.E. & Bour, R. 2003. Was there a second
adaptive radiation of giant tortoises in the Indian Ocean?
Using mitochondrial DNA to investigate speciation and
biogeography of Aldabrachelys. Mol. Ecol. 12: 1415–1424.
Bachmayer, F. & Symeonidis, N. 1970. Die fossilen Schild-
krotenreste des geologisch-palaontologischen Institutes der
Universitat von Athen. Ann. Geol. Pays Hellen. 22: 227–246.
Ballard, J.W.O. & Whitlock, M.C. 2004. The incomplete natural
history of mitochondria. Mol. Ecol. 13: 729–744.
Bandelt, H.-J., Forster, P. & Rohl, A. 1999. Median-joining
networks for inferring intraspecific phylogenies. Mol. Biol. Evol.
16: 37–48.
Barth, D., Bernhard, D., Fritzsch, G. & Fritz, U. 2004. The
freshwater turtle genus Mauremys (Testudines, Geoemydidae)
– a textbook example of an east–west disjunction or a
taxonomic misconcept? Zool. Scripta 33: 213–221.
Bowen, B.W. & Karl, S.A. 2007. Population genetics and
phylogeography of sea turtles. Mol. Ecol. 16: 4886–4907.
Busack, S.D. & Ernst, C.H. 1980. Variation in Mediterranean
populations of Mauremys Gray 1869. Ann. Carnegie Mus. Nat.
Hist. 49: 251–264.
Buskirk, J.R., Parham, J.F. & Feldman, C.R. 2005. On the
hybridisation between two distantly related Asian turtles
(Testudines: Sacalia · Mauremys). Salamandra 41: 21–26.
Butlin, R.K. 2005. Recombination and speciation. Mol. Ecol. 14:
2621–2635.
Chkhikvadze, V.M. 1983. Iskopaemye cherepakhi Kavkaza i Sever-
nogo Prichernomorya. Metsniereba, Tbilisi.
Chkhikvadze, V.M. 1989. Neogenovye cherepakhi SSSR. Mets-
niereba, Tbilisi.
Clement, M., Posada, D. & Crandall, K.A. 2000. TCSTCS: a computer
program to estimate gene genealogies. Mol. Ecol. 9: 1657–1660.
Condit, R. & Hubbell, S.P. 1991. Abundance and DNA sequence
of two-base repeat regions in tropical tree genomes. Genome
34: 66–71.
Coyne, J.A. & Orr, H.A. 2004. Speciation. Sinauer Associates,
Sunderland, MA.
Danilov, I.G. 2005. Die fossilen Schildkroten Europas. In:
Handbuch der Reptilien und Amphibien Europas. Band 3 ⁄ IIIB:
Schildkroten (Testudines) II (U. Fritz, ed.), pp. 329–441. Aula-
Verlag, Wiebelsheim.
Excoffier, L., Laval, G. & Schneider, S. 2005. ARLEQUINARLEQUIN ver. 3.0:
an integrated software package for population genetics data
analysis. Evol. Bioinform. Online 1: 47–50.
Fallin, D. & Schork, N.J. 2000. Accuracy of haplotype frequency
estimation for biallelic loci, via the expectation-maximization
algorithm for unphased diploid genotype data. Am. J. Hum.
Genet. 67: 947–959.
Farias, I.P., Jerozolimski, A., Melo, A., das Neves Viana, M.,
Martins, M. & dos Santos Monjelo, L.A. 2007. Population
genetics of the Amazonian tortoises, Chelonoidis denticulata and
C. carbonaria (Cryptodira: Testudinidae) in an area of symp-
atry. Amphibia-Reptilia 28: 357–365.
Fong, J.J., Parham, J.F., Shi, H., Stuart, B.L. & Carter, R.L. 2007.
A genetic survey of heavily exploited, endangered turtles:
caveats on the conservation value of trade animals. Anim.
Conserv. 10: 452–460.
Fritz, U. 2001. Emys orbicularis (Linnaeus, 1758) – Europaische
Sumpfschildkrote. In: Handbuch der Reptilien und Amphibien
Europas. Band 3 ⁄ IIIA: Schildkroten (Testudines) I (U. Fritz, ed.),
pp. 343–515. Aula-Verlag, Wiebelsheim.
Fritz, U. & Bininda-Emonds, O.R.P. 2007. When genes meet
nomenclature: tortoise phylogeny and the shifting generic
concepts of Testudo and Geochelone. Zoology 110: 298–307.
Fritz, U. & Havas, P. 2007. Checklist of chelonians of the world.
Vert. Zool. 57: 149–368.
Fritz, U. & Wischuf, T. 1997. Zur Systematik westasiatisch-
sudosteuropaischer Bachschildkroten (Gattung Mauremys).
Zool. Abh. 49: 223–260.
Fritz, U., Fattizzo, T., Guicking, D., Tripepi, S., Pennisi, M.G.,
Lenk, P., Joger, U. & Wink, M. 2005. A new cryptic species of
pond turtle from southern Italy, the hottest spot in the range
of the genus Emys. Zool. Scripta 34: 351–371.
Fritz, U., Barata, M., Busack, S.D., Fritzsch, G. & Castilho, R.
2006a. Impact of mountain chains, sea straits and peripheral
populations on genetic and taxonomic structure of a fresh-
water turtle, Mauremys leprosa. Zool. Scripta 35: 97–108.
Fritz, U., Auer, M., Bertolero, A., Cheylan, M., Fattizzo, T.,
Hundsdorfer, A.K., Martın Sampayo, M., Pretus, J.L., Siroky,
P. & Wink, M. 2006b. A rangewide phylogeography of
Hermann’s tortoise, Testudo hermanni (Reptilia: Testudines:
Testudinidae): implications for taxonomy. Zool. Scripta 35:
531–543.
Fritz, U., d’Angelo, S., Pennisi, M.G. & Lo Valvo, M. 2006c.
Variation of Sicilian pond turtles, Emys trinacris – what makes a
species cryptic? Amphibia-Reptilia 27: 513–529.
Fritz, U., Hundsdorfer, A.K., Siroky, P., Auer, M., Kami, H.,
Lehmann, J., Mazanaeva, L.F., Turkozan, O. & Wink, M.
538 U. FRITZ ET AL.
ª 2 0 0 7 T H E A U T H O R S . J . E V O L . B I O L . 2 1 ( 2 0 0 8 ) 5 2 7 – 5 4 0
J O U R N A L C O M P I L A T I O N ª 2 0 0 7 E U R O P E A N S O C I E T Y F O R E V O L U T I O N A R Y B I O L O G Y
2007a. Phenotypic plasticity leads to incongruence between
morphology-based taxonomy and genetic differentiation in
western Palaearctic tortoises (Testudo graeca complex; Testu-
dines, Testudinidae). Amphibia-Reptilia 28: 97–121.
Fritz, U., Guicking, D., Kami, H., Arakelyan, M., Auer, M., Ayaz,
D., Ayres Fernandez, D., Bakiev, A.G., Celani, A., Dzukic, G.,
Fahd, S., Havas, P., Joger, U., Khabibullin, V.F., Mazanaeva,
L.F., Siroky, P., Tripepi, S., Valdeon Velez, A., Velo Anton, G.
& Wink, M. 2007b. Mitochondrial phylogeography of Euro-
pean pond turtles (Emys orbicularis, Emys trinacris) – an update.
Amphibia-Reptilia 28: 418–426.
Guicking, D., Fritz, U., Wink, M. & Lehr, E. 2002. New data on
the diversity of the Southeast Asian leaf turtle genus Cyclemys
Bell, 1834. Molecular results. Faunist. Abh. 23: 75–86.
Guo, X. & Wang, Y. 2007. Partitioned Bayesian analyses,
dispersal-vicariance analysis, and the biogeography of Chinese
toad-headed lizards (Agamidae: Phrynocephalus): a re-evalua-
tion. Mol. Phylogenet. Evol. 45: 643–662.
Harzhauser, M., Kroh, A., Mandic, O., Piller, W.E., Gohlich, U.,
Reuter, M. & Berning, B. 2007. Biogeographic responses to
geodynamics: a key study all around the Oligo-Miocene
Tethyan seaway. Zool. Anz. 246: 241–256.
Hewitt, G.M. 1996. Some genetic consequences of ice ages, and
their role in divergence and speciation. Biol. J. Linn. Soc. 58:
247–276.
Hewitt, G.M. 2000. The genetic legacy of the Quaternary ice
ages. Nature 405: 907–913.
Kalyabina, S.A., Milto, K.D., Ananjeva, N.B., Legal, L., Joger, U.
& Wink, M. 2001. Phylogeography and systematics of Lacerta
agilis based on mitochondrial cytochrome b gene sequences:
first results. Russ. J. Herpetol. 8: 149–158.
Kalyabina-Hauf, S.A. & Ananjeva, N.B. 2004. Phylogeography and
Intraspecies Structure of the Widely Distributed Sand Lizard, Lacerta
agilis L., 1758 (Lacertidae, Sauria, Reptilia). Pensoft, Sofia [in
Russian, with English summary].
Kotsakis, T. 1977. I resti di Anfibi e Rettili pleistocenici della
grotta ‘Bate’ (Rethymnon, Creta). Rend. Linc., Sci. Fis. Nat., 8
ser. 63: 571–582, 1 plate.
de Lapparent de Broin, F. & van Dijk, P.P. 1999. Chelonia from
the Late Miocene Baynunah Formation, Emirate of Abu
Dhabi, United Arab Emirates: palaeogeographic implications.
In: Fossil Vertebrates of Arabia (P.J. Whybrow & A. Hill, eds), pp.
136–162. Yale University Press, New Haven, CT.
Lara-Ruiz, P., Lopez, G.G., Santos, F.R. & Soares, L.S. 2006.
Extensive hybridization in hawksbill turtles (Eretmochelys
imbricata) nesting in Brazil revealed by mtDNA analyses.
Conserv. Genet. 7: 773–781.
de Lattin, G. 1967. Grundriß der Zoogeographie. Gustav Fischer
Verlag, Stuttgart.
Le, M., Raxworthy, C.J., McCord, W.P. & Mertz, L. 2006. A
molecular phylogeny of tortoises (Testudines: Testudinidae)
based on mitochondrial and nuclear genes. Mol. Phylogenet.
Evol. 40: 517–531.
Lenk, P., Fritz, U., Joger, U. & Wink, M. 1999. Mitochondrial
phylogeography of the European pond turtle, Emys orbicularis
(Linnaeus 1758). Mol. Ecol. 8: 1911–1922.
Loveridge, A. & Williams, E.E. 1957. Revision of the African
tortoises and turtles of the suborder Cryptodira. Bull. Mus.
Comp. Zool. 115: 163–557.
Macey, J.R., Schulte, J.A., Ananjeva, N.B., Larson, A., Rastegar-
Pouyani, N., Shammakov, S.M. & Papenfuss, T.J. 1998.
Phylogenetic relationships among agamid lizards of the Lau-
dakia caucasia species group: testing hypotheses of biogeo-
graphic fragmentation and an area cladogram for the Iranian
Plateau. Mol. Phylogenet. Evol. 10: 118–131.
Macey, J.R., Wang, Y., Ananjeva, N.B., Larson, A. & Papenfuss,
T.J. 1999. Vicariant patterns of fragmentation among
gekkonid lizards of the genus Teratoscincus produced by the
Indian collision: a molecular phylogenetic perspective and an
area cladogram for Central Asia. Mol. Phylogenet. Evol. 12:
320–332.
Mantziou, G., Poulakakis, N., Lymberakis, P., Valakos, E. &
Mylonas, M. 2004. The inter- and intraspecific status
of Aegean Mauremys rivulata (Chelonia, Bataguridae) as
inferred by mitochondrial DNA sequences. Herpetol. J. 14:
34–45.
Mayr, E. 1942. Systematics and the Origin of Species from the
Viewpoint of a Zoologist. Columbia University Press, New York.
Mayr, E. 1963. Animal Species and Evolution. Belknap Press of
Harvard University Press, Cambridge, MA.
Melentis, J.K. 1966. Clemmys caspica aus dem Pleistozan des
Beckens von Megalopolis im Peloponnes (Griechenland). Ann.
Geol. Pays Hellen. 17: 169–181.
Myers, N., Mittermeier, R.A., Mittermeier, C.G., da Fonseca,
G.A.B. & Kent, J. 2000. Biodiversity hotspots for conservation
priorities. Nature 403: 853–858.
Nagy, Z.T., Joger, U., Guicking, D. & Wink, M. 2003. Phylo-
geography of the European whip snake Coluber (Hierophis)
viridiflavus as inferred from nucleotide sequences of the
mitochondrial cytochrome b gene and ISSR genomic finger-
printing. Biota 3: 109–118.
Niu, T., Qin, Z.S., Xu, X. & Liu, J.S. 2002. Bayesian haplotype
inference for multiple linked single-nucleotide polymor-
phisms. Am. J. Hum. Genet. 70: 157–169.
Omland, K.E., Baker, J.M. & Peters, J.L. 2006. Genetic signa-
tures of intermediate divergence: population history of Old
and New World Holarctic ravens (Corvus corax). Mol. Ecol. 15:
795–808.
Palkovacs, E.P., Gerlach, J. & Caccone, A. 2002. The evolution-
ary origin of Indian Ocean tortoises (Dipsochelys). Mol. Phylo-
genet. Evol. 24: 216–227.
Popov, S.V., Rogl, F., Rozanov, A.Y., Steininger, F.F., Shcherba,
I.G. & Kovac, M. 2004. Lithological-paleogeographic maps of
Paratethys. 10. Maps Late Eocene to Pliocene. Cour. Forschungs-
inst. Senckenberg 250: 1–46.
Posada, D. & Crandall, K.A. 1998. MODELTESTMODELTEST: testing the model
of DNA substitution. Bioinformatics 14: 817–818.
Praschag, P., Hundsdorfer, A.K. & Fritz, U. 2007. Phylogeny and
taxonomy of endangered South and South-east Asian fresh-
water turtles elucidated by mtDNA sequence variation (Testu-
dines: Geoemydidae: Batagur, Callagur, Hardella, Kachuga,
Pangshura). Zool. Scripta 36: 429–442.
Rensch, B. 1947. Neuere Probleme der Abstammungslehre. Enke,
Stuttgart.
Rogl, F. 1998. Palaeogeographic considerations for Mediterra-
nean and Paratethys seaways (Oligocene to Miocene). Ann.
Naturhist. Mus. Wien 99: 279–310.
Ronquist, F. & Huelsenbeck, J.P. 2003. MRRBAYESAYES 3: Bayesian
phylogenetic inference under mixed models. Bioinformatics 19:
1572–1574.
Schilde, M., Barth, D. & Fritz, U. 2004. An Ocadia sinensis ·Cyclemys shanensis hybrid. Asiatic Herpetol. Res. 10: 120–125.
Schmitt, T. 2007. Molecular biogeography of Europe: Pleistocene
cycles and postglacial trends. Frontiers Zool. 4: 1–12.
Mauremys phylogeography 539
ª 2 0 0 7 T H E A U T H O R S . J . E V O L . B I O L . 2 1 ( 2 0 0 8 ) 5 2 7 – 5 4 0
J O U R N A L C O M P I L A T I O N ª 2 0 0 7 E U R O P E A N S O C I E T Y F O R E V O L U T I O N A R Y B I O L O G Y
Spinks, P.Q. & Shaffer, H.B. 2007. Conservation phylogenetics of
the Asian box turtles (Geoemydidae, Cuora): mitochondrial
introgression, numts, and inferences from multiple nuclear
loci. Conserv. Genet. 8: 641–657.
Spinks, P.Q., Shaffer, H.B., Iverson, J.B. & McCord, W.P. 2004.
Phylogenetic hypotheses for the turtle family Geoemydidae.
Mol. Phylogenet. Evol. 32: 164–182.
Stuart, B.L. & Parham, J.F. 2007. Recent hybrid origin of three
rare Chinese turtles. Conserv. Genet. 8: 169–175.
Swofford, D.L. 2002. PAUPPAUP*. Phylogenetic Analysis Using Parsimony
(*and Other Methods), Version 4.0b10. Sinauer Associates, Sun-
derland, MA.
Taberlet, P., Fumagalli, L., Wust-Saucy, A.-G. & Cosson, J.F.
1998. Comparative phylogeography and postglacial coloniza-
tion routes in Europe. Mol. Ecol. 7: 453–464.
Tautz, D. & Renz, M. 1984. Simple sequences are ubiquitous
repetitive components of eukaryontic genomes. Nucleic Acids
Res. 12: 4127–4138.
Tishkoff, S.A., Pakstis, A.J., Ruano, G. & Kidd, K.K. 2000. The
accuracy of statistical methods for estimation of haplotype
frequencies: an example from the CD4 locus. Am. J. Hum.
Genet. 67: 518–522.
Tuniyev, B.S. 1990. On the independence of the Colchis center
of amphibian and reptile speciation. Asiatic Herpetol. Res. 3:
67–84.
Tuniyev, B.S. 1995. On the Mediterranean influence on the
formation of herpetofauna of the Caucasian isthmus and its
main xerophylous refugia. Russ. J. Herpetol. 2: 95–119.
Ursenbacher, S., Carlsson, M., Helfer, V., Tegelstrom, H. &
Fumagalli, L. 2006. Phylogeography and Pleistocene refugia of
the adder (Vipera berus) as inferred from mitochondrial DNA
sequence data. Mol. Ecol. 15: 3425–3437.
Weiss, N. & Ferrand, N. 2007. Phylogeography of Southern
European Refugia. Springer, Berlin, Heidelberg, New York.
Wermuth, H. & Mertens, R. 1977. Testudines, Crocodylia,
Rhynchocephalia. Tierreich 100: i–xxvii, 1–174.
Wink, M., Guicking, D. & Fritz, U. 2001. Molecular evidence for
hybrid origin of Mauremys iversoni Pritchard et McCord, 1991,
and Mauremys pritchardi McCord, 1997. Zool. Abh. 51: 41–49.
Wolfe, A.D. & Liston, A. 1998. Contributions of PCR-based
methods to plant systematics and evolutionary biology. In:
Molecular Systematics of Plants II. DNA Sequencing (D.E. Soltis,
P.S. Soltis & J.J. Doyle, eds), pp. 43–86. Kluwer Academic
Publishers, Boston, MA.
Wolfe, A.D., Xiang, Q.-Y. & Kephart, S.R. 1998. Assessing
hybridization in natural populations of Penstemon (Scrophu-
lariaceae) using hypervariable intersimple sequence repeat
(ISSR) bands. Mol. Ecol. 7: 1107–1125.
Xu, C.-F., Lewis, K., Cantone, K.L., Khan, P., Donnelly, C.,
White, N., Crocker, N., Boyd, P.R., Zaykin, D.V. & Purvis, I.J.
2002. Effectiveness of computational methods in haplotype
prediction. Hum. Genet. 110: 148–156.
Yu, W., Rusterholtz, K.J., Krummel, A.T. & Lehman, N. 2006.
Detection of high levels of recombination generated during
PCR amplification of RNA templates. BioTechniques 40:
499–507.
Zhang, S., Pakstis, A., Kidd, K.K. & Zhao, H. 2001. Comparisons
of two methods for haplotype reconstruction and haplotype
frequency estimation from population data. Am. J. Hum. Genet.
69: 906–912.
Supplementary Material
The following supplementary material is available for this
article:
Appendix S1 Mauremys samples and their mitochondrial
and nuclear genomic haplotypes.
Appendix S2 ISSR marker bands of Mauremys caspica
and M. rivulata using the primer (GACA)4.
This material is available as part of the online
article from: http://www.blackwell-synergy.com/doi/abs/
10.1111/j.1420-9101.2007.01485.x
Please note: Blackwell Publishing are not responsible
for the content or functionality of any supplementary
materials supplied by the authors. Any queries (other
than missing material) should be directed to the corre-
sponding author for the article.
Received 7 September 2007; revised 15 November 2007; accepted 26
November 2007
540 U. FRITZ ET AL.
ª 2 0 0 7 T H E A U T H O R S . J . E V O L . B I O L . 2 1 ( 2 0 0 8 ) 5 2 7 – 5 4 0
J O U R N A L C O M P I L A T I O N ª 2 0 0 7 E U R O P E A N S O C I E T Y F O R E V O L U T I O N A R Y B I O L O G Y
Copyright © 2022 FDOKUMEN