Globalization, Democracy, and Social Spending in Latin America, 1980-1997
40
Globalization, Democracy, and Social Spending in Latin America, 1980-1997 George Avelino Fundação Getulio Vargas Av 9 de Julho2029 01313-902 São Paulo, SP, Brazil [email protected] David S. Brown Department of Political Science – MS24 Rice University P.O. Box 1892 Houston, TX 77005-1892 [email protected] Wendy Hunter Department of Government Burdine Hall 536 Austin, Texas 78712-1087 Phone: (512) 471-5121 Fax: (512) 471-1061
-
Upload
independent -
Category
Documents
-
view
4 -
download
0
Transcript of Globalization, Democracy, and Social Spending in Latin America, 1980-1997
Globalization, Democracy, and Social Spending in Latin America, 1980-1997
George AvelinoFundação Getulio Vargas
Av 9 de Julho202901313-902 São Paulo, SP, Brazil
David S. BrownDepartment of Political Science – MS24
Rice UniversityP.O. Box 1892
Houston, TX [email protected]
Wendy HunterDepartment of Government
Burdine Hall 536Austin, Texas 78712-1087
Phone: (512) 471-5121Fax: (512) 471-1061
2
INTRODUCTION
The globalization of markets for capital, goods, services, and information that has taken
place in the past fifteen or so years is without historical parallel. Against a wider context
of international integration, Latin America has experienced the most dramatic change in
its economic policy orientation since World War II. Latin American governments have
instituted a broad array of reforms aimed at integrating their economies into global
markets. While many other regions have made changes in a similar direction, few have
undergone as rapid and thorough a transformation as Latin America.
While globalization has provided some groups in society with new opportunities
for social mobility, it has created new sources of inequality and insecurity for others.
Most would agree that economic openness puts employers under greater pressure to
reduce labor costs, and that individuals who possess the skills, knowledge, and resources
associated with internationally competitive sectors benefit more from the new market-
oriented system than those who do not.
In this light, questions about how states provide for the welfare of citizens in the
contemporary international economic system gain new relevance. How has the
international integration of markets for goods, services, and capital affected the social
policy decisions of Latin American governments? More specifically, have governments
become less generous toward citizens in response to the pressures generated by greater
economic openness? Or, have they created stronger safety nets and new forms of social
assistance in order to meet the new social challenges of globalization?
3
This paper examines the impact globalization and democracy have on social
spending in Latin America. We use time-series cross-sectional (TSCS) analysis to test
whether the empirical patterns observed in the OECD nations are observed in a
developing region that has undergone dramatic economic and political change over the
last two decades. We build on previous work in several ways. First, we use data on
social spending that maximizes cross-country comparability. Second, we test whether
our results are sensitive to different measures of globalization and democracy. Third,
since different social programs reach different constituencies, we disaggregate social
spending to determine whether the effects of globalization and democracy vary by
program. Finally, we provide the first compositional analysis of social spending using a
comprehensive framework developed by Gary King and Jonathan Katz (1999). By
examining the distribution of resources to health, education, and social security, we gain
a more refined understanding of the interaction between globalization, democracy, and
social spending.
Several empirical patterns emerge from our analysis. First, confirming previous
results from Kaufman and Segura (forthcoming), we find trade openness has a strong
negative impact on the amount of resources devoted to social spending. Second, we find
democracy has a strong positive correlation with social spending both as a percentage of
GDP and in per capita terms. To understand the causal links that connect globalization,
democracy, and social spending, we break social spending down into several categories.
We find that democracy’s biggest impact on social spending is through education while
trade openness has its largest impact on health spending. We also find that increased
trade openness influences the distribution of resources to social security, education,
4
health, and a residual category of programs that includes housing, sanitation, and other
poverty alleviation programs. Countries that trade a relatively high percentage of their
GDP protect education and health while allocating greater resources to the residual
category. The increasingly large allocation of resources to the residual category,
however, comes at the direct cost of social security. Finally, we find that democracies
allocate relatively more resources to health, education, and the residual category at the
direct cost of social security.
The paper proceeds as follows. Section one introduces the theory and previous
empirical work that relates globalization to government spending. Section two describes
our data and the model we use to test the hypotheses derived from the previous section.
Section three presents the results. Section four extends the analysis by conducting a
compositional analysis of the social welfare budget. Section five concludes the paper by
discussing the implications of our findings as well as identifying some questions that
remain unanswered.
THEORY
A growing literature addresses the interaction between globalization, domestic politics,
and government spending (Cameron 1978; Katzenstein 1985; Hicks and Swank 1992;
Pierson 1996; Powers and Kostadinova n.d.; Rodrik 1998, 1999, 2001; Garrett 1998 and
2001; Garrett and Mitchell 1999; Huber 1999; Hurrell and Woods 1999; Garrett and
Nickerson 2001; Adsera and Boix forthcoming;, Kaufman and Segura forthcoming;
Huber and Stephens forthcoming). The question at the core of this literature involves
whether governments respond to the challenges of globalization with social policy
5
choices that are oriented more toward cutting costs ("efficiency") or protecting people's
welfare ("compensation").
The central notion of the efficiency approach is that governments will reduce
taxes and social welfare expenditures that diminish profits, discourage investment, and
therefore threaten economic growth and international competitiveness. Social services
burden business through the distortion of labor markets and higher taxes. If governments
borrow to pay for these services, the higher real interest rates that result further depress
investment. In short, the efficiency approach posits economic openness places important
constraints on welfare spending, leaving governments little choice but to restrict their
social outlays.
The compensation perspective recognizes the constraints imposed by economic
integration on the social policy options of governments, yet accords greater weight to the
countervailing demands imposed by citizens seeking protection from the state. It stresses
the perception among top elected officials and bureaucrats that the social instability and
political discontent engendered by internationalization could ultimately endanger the
model of economic openness as well as their careers. The core contention of the
compensation thesis is that government officials use the latitude they have to strengthen
social insurance mechanisms and cushion citizens from the vagaries of the international
economy.
Social expenditures are a clear general measure of the extent to which
governments contract or expand their commitments to citizens.1 Fluctuations in
1While summary figures do not address the distributional impact of social spending, there is some evidencethat they exert a positive impact on the poorer sectors of the population in Latin America (Petrei 1996;Mostajo 2000).
6
spending can provide clues about the constraints facing public officials, their latitude for
responding to those constraints, and the relative weight they place on competing
priorities. The quantitative dimension inherent in studies of expenditures is conducive to
clarity and comparability across countries. Yet because welfare states may change in
kind as well as in quantity (similar amounts of money may fund very different types of
programs and constituencies), case studies and intra-regional comparisons that examine
the transformation of social programs in detail are hence necessary complements to cross-
regional analysis.
Latin America constitutes an interesting and relatively understudied region for
the analytical questions at hand. The majority of studies aimed at understanding
globalization's effects on social protection focus on OECD countries (e.g. Cameron 1989,
Garrett 1998; Garrett and Mitchell 1999; Katzenstein 1985; Pierson 1996; Rodrik 1998;
Hicks and Swank 1992). This literature grew in part out of a concern that social welfare
states in industrialized democracies would undergo severe erosion as increased trade with
low wage economies placed downward pressure on wages and benefits. At the same
time, capital liberalization allowed investors to look abroad for higher returns on their
investments, causing some concerns over capital flight. Some authors pay special
attention to the developing world (e.g. Garrett and Nickerson 2001; Rodrik 1999), but
only one major quantitative study (Kaufman and Segura forthcoming) focuses
specifically on Latin America.
A number of factors that set Latin America apart from other regions—especially
Western Europe—impinge upon the ability and/or inclination of Latin American
governments to respond to globalization with robust welfare programs. On the one hand,

7
some of these factors encourage actions in accordance with the efficiency thesis. Others
make Latin America more likely to adopt compensatory schemes.
The relative weakness of unions and paucity of Social Democratic parties, a
historical support base for universal social protection policies in Western Europe,
deprives Latin American citizens of two key organizational means to defend social
services against budgetary cuts. Thus, while Cameron (1978) finds that trade openness in
Western Europe resulted in the provision of greater public resources for social protection,
such an outcome may not hold in Latin America.
The rapid and dramatic process of stabilization and structural adjustment in the
wake of the Latin American debt crisis—and the active accompanying role played by the
International Monetary Fund—is without parallel in the developed world. IMF
prescriptions for attaining fiscal solvency depend on reducing government expenditure on
social programs by introducing user fees in health and education, and by affecting a more
efficient distribution of goods and services to the poor.2 Governments reluctant to
initiate such actions still acknowledge the importance of expressing to the IMF their
intent to adopt these economic reforms.
Finally, the comparative weakness of Latin American states exposes welfare
programs to the risk of retrenchment. The state in most Latin American countries, while
never as strong as in most Western European countries, was weakened further by the
economic crisis of the 1980s and 1990s. Governments in the region are notorious for
their inability to carry out some of the most essential tasks—tax collection—necessary to
maintain generous welfare support (Huber 1999).
8
Other factors relevant to Latin America provide some reason to expect
globalization might promote compensation. Greater trade volatility heightens the
insecurity of citizens unless governments take active measures to provide for social
protection. Most Latin American countries tend to have relatively specialized patterns of
trade compared to their counterparts in the developed world. With higher levels of
volatility, the effects of trade exposure may be more severe, inducing a higher level of
government spending in relation to total trade. This hypothesized relationship leads us to
examine the role played by new democratic regimes.
Noted earlier, most of the previous empirical work focuses on the OECD nations
for which comparable and extensive data are available. Understandably, these studies
take stable democratic institutions as given. In these models, democracy has only an
indirect effect: it works as a channel through which the effects of other relevant variables
(such as political parties and union strength) can be analyzed. Although it is important to
consider political factors other than regime type, issues relating to regime type and
regime transition still deserve attention. At least two reasons justify this claim.
First, we need to know more about the conditions that make democracies work:
the conditions that enable them to achieve economic growth, material security, freedom
of arbitrary violence, and other widely desirable objectives (Przeworski et all, 1995).
Due to the endemic political instability that has characterized developing countries, much
of the comparative work on democratization assumes these new regimes were inherently
fragile. These works were mostly concerned in constructing etiologies of regime types or
2See Deacon (1999: 222) for a list of the IMF's prescriptions vis-`a-vis the social policies of borrowingmember countries. See also Grosh (1996) for the theory behind targeting and its practice.
9
of the democratization process itself. Virtually ignored in this literature is the impact of
democracy over public policies.3
The recent political and economic transformations experienced by many
developing countries offer a unique opportunity to explore questions about how different
political regimes react to external economic shocks (Rodrik, 1999). According to Adserá
and Boix (forthcoming), the interaction between democracy and globalization has a
strong positive effect on government expenditures. As Latin American countries
comprise a significant part of the recent wave of democratization, they provide a great
opportunity to analyze the effects of different political regimes over these policy options.
Second, despite the euphoria sparked by the widespread democratization among
developing countries, current attitudes toward new democracies are mixed. Although they
represent an important change in comparison to previous authoritarian institutions, Latin
American democracies have been criticized for not having fulfilled many of the
expectations they generated. This growing disenchantment with democracy is particularly
acute in the provision of public services, an area in which democratization was expected
to have a tangible impact on the plight of the poor.4
As the empirical literature makes clear, democracies alone are unlikely to reverse
deeply entrenched patterns of poverty and social inequality. Nevertheless, the prevalence
3 For a survey of different “types of democracy”, mostly based on institutional characteristics, see Collierand Levistky (1997). As the ability of the poor to make effective demands depends on the institutionaldesign of democratic regimes, a natural extension of the work done here is to test the impact of differenttypes of democracy over public policies.
4 A recent poll by “Latinobarometro”, published in “The Economist” (2001), attested the decline of thedemocracy support in Latin America. This disenchantment, however, does not imply in disregarding thatchanges in democracies are usually moderate and incremental as claimed by many authors (Huntington,1989; Schmitter and Karl, 1991). In most cases, the disenchantment stems from the perception that newdemocracies have not represented a shift in government priorities, even an incremental one, toward theinterests of the poor.
10
of new democracies headed by governments with a presumed interest in maintaining
social stability and winning re-election would seem to auger well for social welfare
programs. The social dislocations produced by restructuring an economy toward
competition in the international marketplace affect middle class as well as poorer
segments of the population. Rebellion among indigenous peasant producers in southern
Mexico, food riots in Argentina, and strikes by public sector workers in a number of
countries are among the expressions of protest that have emerged in the last decade. The
widespread institution of social emergency programs, such as PRONASOL in Mexico
and FONCODES in Peru, suggests that governments in the region are not unaware of the
need to secure support for themselves and for their economic reforms.
MODEL SPECIFICATION
To test hypotheses on the influence of globalization and democracy on social spending,
we examined annual data for 19 Latin American countries between 1980 and 1997.5 The
data was compiled by a team of researchers assembled by the United Nations
Commission for the Latin American and the Caribbean (ECLAC/CEPAL).6 This data set
provides a unique opportunity to study the relationship between democratization and
social spending for two reasons. First, with the exception of Cuba and Haiti, the set
includes all Latin American countries. Second, the persistent problem of data
5 The countries are Argentina, Bolivia, Brazil, Chile, Colombia, Costa Rica, Dominican Republic,Ecuador, El Salvador, Guatemala, Honduras, Jamaica, Mexico, Nicaragua, Panama, Paraguay, Peru,Uruguay, and Venezuela. The full data matrix, therefore, comprises a maximum of 342 observations (19countries x 18 years). Missing data, however, implied that we analyzed smaller data sets, depending on thecountry and year coverage of variables.
11
comparability is minimized by the ECLAC, which conducted studies of each country for
the expressed purpose of producing comparable data on social spending.7
The data form a Times-Series Cross-Sectional (TSCS) data set in which each
country-year represents a single observation. Although pooling the data has the obvious
benefit of increasing the number of observations, it can violate at least two of the basic
assumptions that underlie Ordinary Least Squares (OLS) estimation. First the temporal
structure of the data increases the chance of autocorrelation, violating the OLS
assumption that the errors are independent of each other. Second, the cross-sectional
structure of the data increases the chance that the variance in the error terms may differ
across countries and that there will be spatial processes that affect different panels
simultaneously (i.e., a currency crisis in Argentina effects Brazil). The consequence of
these violations is that OLS coefficient estimates are still unbiased but inefficient.
In order to deal with these problems we followed Beck and Katz (1995, 1996) and
used panel corrected standard errors. To deal with the problem of auto-correlation we
included a lagged dependent variable and a set of “n” country and “t” year dummies. The
inclusion of a lagged dependent variable is based on two assumptions. First the
autocorrelation problem is limited to the first-order correlation, a plausible assumption
given the short period covered by the data. Second the autocorrelation is not unit specific;
rather, it is assumed to be common across all pooled units.8 Finally, but no less
6 ECLAC/CEPAL "Base de Datos de Gasto Social - División de Desarrollo Social de la Cepal, actualizadahasta fines de 1998."
7 This project has yielded two publications: Cominetti and Di Gropello (1994) and Cominetti and Ruiz(1997).
8 As argued by Beck and Katz, (1995: 638), “The assumption of unit-specific serial correlations also seemsodd at a theoretical level. Time-series cross-section analysis assume that the ‘interesting’ parameters of themodel, β, do not vary across units; this assumption of pooling is at the heart of TSCS analysis. Why not
12
important, including a lagged dependent variable allows one to address autocorrelation
without transforming the data, which complicates the interpretation of regression
coefficients.
The inclusion of a set of “n” country dummies addresses the heteroscedasticity
problem by controlling for country-specific effects. It assumes that these effects are fixed
over time, allowing a different intercept for each country. This statistical technique has
two other consequences that are worth mentioning.
First, the combination of these dummy variables may be highly correlated with
other independent variables, producing multicollinearity problems within the model and
reducing the efficiency of the estimates. Multicollinearity will be particularly acute in
relation to variables that are relatively invariant, or fixed, within each country along the
18-year period. This prevents the inclusion of some variables traditionally used in cross-
sectional models that explain welfare spending variation in OECD countries: the
institutional characteristics of social programs.
Second, the exclusion of relevant variables from the model specification should
lead to bias in estimates of the coefficients. From this perspective, the set of dummies
summarizes the differences between countries caused by relevant variables that can be
considered as fixed over time. The country dummies can also account for the differences
caused by unmeasured relevant variables, a very common situation among developing
countries for which it is hard to find complete and comparable data. In sum, while the
should we expect the ‘nuisance’ ρ to not show similar pooling? ρ can be interpreted as how long it takes forprior shocks to be removed from the system. Why should this ‘memory’ be the only model parameter thatvaries from unit to unit?” See also, Beck and Katz (1996).
13
inclusion of country dummies has some disadvantages, it insures that no relevant, and
relatively stable, cross-sectional variable is excluded from the model.9
Finally, the inclusion of year dummies takes into account time specific effects.
For instance, if all countries are subject to a common external shock, the effects of this
shock over our dependent variables need to be controlled. This problem is particular
important because of the debt crisis endured by Latin American countries during the end
of the last century. Therefore, we will employ the following baseline equation:
Social Spendingi,t = α i + δt + b1 Social Spendingi,t-1 + b2 Pop65 i,t
+ b3 Unemployment i,t + b4 Level of Development i,t + b5 Growth i,t
+ b6 Democracy i,t + b7 Financial Liberalization i,t + b8 Trade Openness i,t
+ ε i,t.
In this equation, the terms α and δ represent country and year dummies, the b’s are the
parameter estimates and ε represents the error term. Finally, the subscripts i and t
represent the country and year of observations respectively.
Social Spending is the dependent variable, measured in two ways: as a
percentage of GDP and in 1990 per capita dollars. At first, it will be measured as a
percentage of GDP and in 1990’s per capita dollars. Results for more disaggregated
levels of social spending and for changes in the composition of the social welfare budget
will be shown later.
The measure for democracy conceives democratization as a distinct process and
measures its effects by using a dummy variable for the political regime, coding one for
9 As stressed by Stimson (1985), the estimated dummy coefficients are not explanation, but rathersummary measures of our ignorance about the causes of between-units differences. Following Przeworskiand Teune (1970), one would say that the dummies represent our inability to “substitute the name ofvariables for the names of social systems.” (p.8)
14
democracies and zero for the residual category of authoritarian regimes. The measure is
drawn from Alvarez et all (1996). Based on Dahl’s (1971) minimalist definition of a
democratic regime, the authors focus on contestation as the essential institutional feature
of democracies.10 We followed Alvarez et. al in their classification. To check the
stability of our results with respect to the measure of democracy, we ran every regression
using a continuous variable derived from Gurr’s POLITY IV data. We subtracted Gurr’s
AUTOC score from his DEMOC score, producing a more continuous measure that
ranges from –10 (most authoritarian) to 10 (the most democratic).
Gobalization is measured by two indicators. The first is trade openness: the sum
of imports and exports as a percentage of the GDP. It is important to note that the
inclusion of country dummies in all equations takes into account countries’ fixed
characteristics (such as the size of the population and the distance from major trade
partners) that may influence their exposure to international trade.11 Therefore, we are
confident that the coefficient on the trade openness term represents government policy
choices.
The second indicator is the degree of international financial liberalization,
drawn from Morley, Machado, and Pettinato (1999), and defined as “the average of four
components which reflects the sectoral control of foreign investment, limits on profit and
interest repatriation, controls on external credits by national borrowers and capital
outflows.” The index is based on information from IMF’s Annual Report on Exchange
10 “Our purpose is to distinguish regimes that allow some, even if limited, regularized competition amongconflicting visions and interests from those in which some values or interests enjoy a monopoly buttressedby a threat or the actual use of force.” (Alvarez et all, 1996: 4). See Huntington (1991: 266-67) for asimilar theoretical point.
15
Arrangements and Exchange Restriction, and is normalized between zero and one, with
one being the country observation with the smallest legal restrictions on capital flows.12
We also include four control variables traditionally used in the social spending
empirical literature. The first is demographic: pop65 which is defined as the percentage
of the population that is 65 years or older. Due to the impact of demographic
characteristics over health care and social security, we expect a higher percentage of
elderly people in the population to be positively related to social spending. The data for
this variable came from the WDI 2000.
The second traditional control variable is the unemployment rate. Despite the
existence of few public unemployment programs in Latin America, we expect this
coefficient to be positive: high unemployment rates should be correlated with increased
social spending. The data was drawn from various issues of ECLAC’s yearly report on
the Economic Survey of Latin America.
We also include the level of economic development, defined as the log of Gross
Domestic Product per capita and measured in PPP dollars. Including income in the
equation takes into account Wagner’s Law which states the level of public spending is
positively correlated with levels of economic development. Finally, the annual growth
rate of GDP per capita is included to control for the effects of economic volatility on
government spending. Data for both variables were drawn from the WDI 2000.
11 See Rodrik (1998: 1026), who calls this exogenous component of trade shares as the “natural opennessfor each country.”
16
RESULTS
Aggregate Measures
Table 1 presents the results at the aggregate level. Several patterns can be observed from
the estimates. First, the lagged dependent variable in every regression is significant
which comes as no surprise. Although there is a strong correlation between the
dependent variable and its lag, the coefficient on the lagged dependent term is not close
to one, ranging from .72 to .76. Consequently, the unit root problem is not a concern.
Second, none of the economic controls are correlated with social spending. Given the use
of country dummy variables in each regression, there is little cross-sectional variance left
for the control variables to explain. Third, the coefficient on the democratic dummy
variable is statistically significant and positive in every regression. To test the stability of
the result with respect to the operationalization of democracy, we substituted in Gurr’s
POLITY IV measure of democracy. In every regression the Gurr measure score
confirmed the results we obtained with Przeworski et. al’s dichotomous
operationalization. Finally, the coefficient for the trade openness variable is significant
and negative: as trade openness increases, the resources governments devote to social
programs decrease.
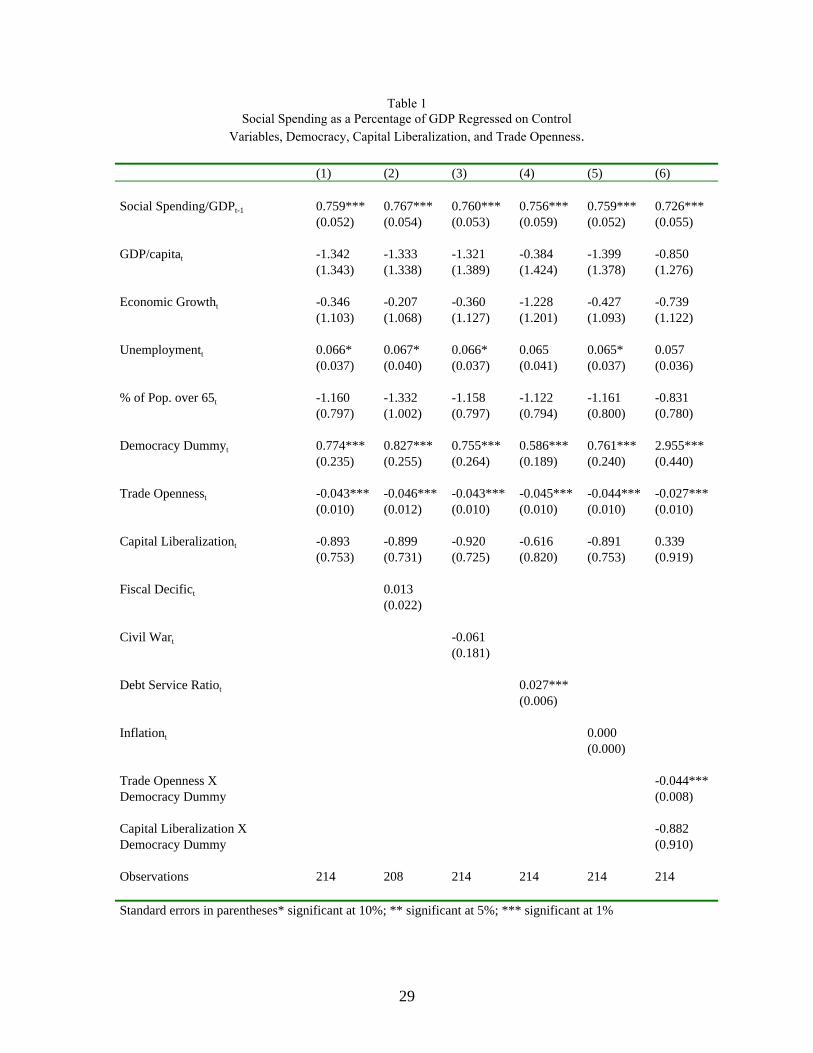
<Table 1>
The substantive impact of increased trade and democratization is significant. The
democracy dummy variable is relatively easy to interpret. The coefficient on the
democratic dummy variable indicates that the difference between democratic and
authoritarian regimes is roughly .8 percentage points of GDP. Of course, for the larger
12 The difference between each country absolute index and the least liberalized country year observation is
17
economies (Brazil, Mexico, and Argentina), a .8 percentage point difference is
substantial. In Brazil’s 1 trillion dollar economy, for example, .8 percentage points is
equivalent to 800 million dollars. The same pattern is observed when we use social
spending in dollars per capita as the dependent variable. The coefficient on the
democratic dummy term ranges from $35 dollars per capita to $45 dollars per capita
among the same six regressions. Given that total social spending in some countries is
less than $45 dollars per capita (Paraguay, Bolivia, Peru), the difference between
democratic and authoritarian regimes is substantial. Even among the bigger spenders
(Chile, Costa Rica, Brazil spend between $400-$500 per capita), the $35 to $45
difference amounts to roughly 10 percent of all social spending. Regressions for the per
capita spending figures can be found in Appendix 1.
The impact trade openness has on social spending is substantial as well. To
illustrate the constraints trade openness places on social spending among the Latin
American countries, we plotted the predicted values and 95% confidence intervals for
social spending as trade openness ranges from 0 to 120. Bear in mind that the inter-
quartile range of the data runs from 30% to 60%. In other words, 50% of the cases have
economies in which trade represents 30-60% of GDP. Holding all other variables
constant at their means, varying trade openness from 30% to 60% results in a -1.73
percentage point change (95% confidence interval from -2.6 to -.88). In per capita terms,
governments in more open economies (at the 75% percentile) will spend approximately
$71 less than their more closed counterparts (95% confidence interval is -115.03 to -
25.50). Although the differences at first seem substantial, it is important to note that the
expressed as a percentage of the difference between the maximum and minimum absolute indexes for allcountries over the entire period.
18
ability for countries to increase trade openness is somewhat circumscribed. For example,
the difference between Brazil’s highest and lowest trade openness figure is roughly 8
percentage points. Argentina, another fairly large economy, is also somewhat limited (11
percentage points).
<Figure 1>
The estimates we report withstood a number of tests for stability. First, we tested
the stability of the results with respect to our measure of globalization. For instance,
Rodrik (1998) argues the most important issue is the “exposure to external risk” brought
about by economic internationalization rather than trade shares alone. However, the
inclusion of variables that measure “terms of trade risk” or “export concentration” did not
cause any noticeable change in our results.13 We also substituted our variable for capital
liberalization with another variable that measurers the net inflows of Foreign Direct
Investment as a percentage of the GDP. Using the alternative measure based on Foreign
Direct Investment had no effect on our estimates.
Second, we subjected our models to bootstrapping: we took each country out, one
a time, to see if its absence affected the estimates. This is particularly important given
the TSCS nature of the data since influential points are probably clumped together and
will not, by themselves, appear to have an effect on the results. We found that the
coefficients for the democracy dummy and trade openness variables remained significant
throughout the procedure.
13 The first variable is the standard deviation of the first logarithm differences of the terms of trade foreach country. Data on terms of trade were drawn from ESDB/IADB, available at the IADB Internet site(www.iadb.org). Export concentration is measured as the summation of the percentage share of the tenmost important export products on the total exports for each country. Data from this last variable wascollected from ECLAC/CEPAL, Statistical Yearbook of Latin America, various issues.

19
Also presented in the regression tables is a model that includes an interactive term
for democracy and trade openness along with an interactive term for democracy and
capital liberalization. The estimates indicate a strong interactive relationship exists
between democracy and trade openness. However, in direct contrast to findings by others
(Garrett and Nicerson 2001; Adserá and Boix, forthcoming), we find that the interaction
between democracy and trade openness has a strong negative impact on social spending.
Rather than dampening the negative correlation between social spending and trade
openness, democracy seems to amplify its negative impact. This finding comes with two
caveats. First, democracies continue to outspend their authoritarian counterparts until
trade represents roughly 57% of their GDP. Roughly 60% of all cases lie below that
figure: in 60% of the cases, the predicted value for democratic regimes is higher. Second,
when examining spending as a percentage of GDP, the interactive term loses its
magnitude and significance when Paraguay is removed from the sample. It is also
important to point out that the negative coefficient may be driven by the significant
advantage democracies hold over authoritarian regimes when trade comprises a smaller
percentage of GDP. Because of the linearity imposed by our model, the large advantage
at low levels of trade openness translates into an authoritarian advantage at the highest
levels (see Figure 2)..
<Figure 2>
Previous empirical work seeks to establish whether governments respond to
globalization by either becoming more efficient (spending less) or by compensating the
losers (spending more). However, as Kaufman and Segura note, the number of
constituencies that benefit from social spending varies dramatically. Consequently, we
20
might expect that if democratic institutions provide some form of compensation, they
would allocate resources to those sectors most affected by increasing competition in the
market. Examining whether trade openness and democracy affect all components of
social spending equally will help us determine whether changes in spending can be
attributed to the compensation or efficiency hypotheses.
Health, Education, and Social Security
Health, education, and social security are the main components of social spending yet
serve very diverse segments of the population. As Kaufman and Segura note, social
security outlays may be most susceptible to globalization since they comprise an
important part of the wage bill (Kaufman and Segura, forthcoming). Health and
education, however, are not as directly tied to the costs born by employers. There may be
important differences between health and education as well. Although there are certainly
important societal effects of an increasing supply of educational opportunity, the direct
beneficiaries of increasing access to education are the young students themselves along
with their parents. Those benefiting from health expenditures represent a wider segment
of the population. Since the groups that benefit directly from spending on health,
education, and social security vary, we estimated the previous models for each category
of spending separately.
Table 2 reports the results for three components of social spending for both the
standard model and a model with interactions. A clear pattern emerges from the
estimates reported in Table 2. Democracy’s positive impact on social spending is

21
channeled through education. The democratic dummy variable has a positive and
statistically significant coefficient in both equations for education.
<Table 2>
Although the democracy variable maintains its positive coefficient, in the health equation
it cannot be distinguished from zero at any acceptable level of confidence. The
consistent pattern in the health regressions is the strong and negative association between
the trade openness variable and spending. With respect to social security, we find that
only the interactive term between democracy and trade openness exhibits a strong
negative correlation with spending.
Along with our findings in the aggregate analysis, the following pattern begins to
emerge. Although trade openness is negatively correlated with aggregate social
spending, its main effects are found in health spending and education spending.
Democracy’s positive association with social spending is manifested in higher rates of
spending on education. The interaction between democracy and trade openness is always
negative and significant. Democracies, it seems, are much quicker to cut social spending
as larger segments of the economy are exposed to trade. But, as we saw in Figure 2, a
large number of democracies (democracies with relatively low levels of trade to GDP)
actually spend more than authoritarian regimes (roughly 60 percent of our cases). The
picture, consequently, is somewhat murky. In terms of the compensation versus
efficiency hypotheses, the dummy variable term for democracy indicates democratic
regimes compensate exposure to trade by increasing social spending. Trade openness,
however, forces governments to cut back on spending particularly in health and
education. In countries with relatively small trade sectors (i.e. Brazil, Argentina, Mexico,
22
Colombia, Peru, Venezuela), democratic regimes spend more than authoritarian regimes.
In countries with relatively high levels of trade (i.e. Costa Rica, Panama, Jamaica,
Nicaragua, Paraguay), democratic regimes spend less than their authoritarian
counterparts. However, as noted earlier, there are reasons to suspect that the strong
negative coefficient is being driven by the substantial advantage democratic regimes hold
at low levels of trade openness. In fact, when we eliminate the largest economies (those
with trade representing 30 percent or less of GDP), the interactive term between
democracy and trade openness becomes insignificant while the democracy dummy
variable still maintains its strong positive coefficient.
Although disaggregating social spending into health, education, and social
security reveals some interesting patterns, several important questions remain
unanswered. We don’t know, for example, whether democracies spend more on
education by taking from health or social security. We know that trade openness does not
seem to affect the overall size of social security, but what we don’t know is whether
maintaining social security comes at the cost of health and education. According to the
estimates from the regressions reported in Table 2, the answer would be yes. However,
the regression analysis used heretofore cannot answer these questions.
COMPOSITIONAL ANALYSIS
Compositional analysis allows us to examine the effect globalization and democracy have
on a number of budget categories simultaneously. Although the literature focuses on
education, health, and social security, an average of 10 percent of all social spending in
Latin America went to other programs: housing, sanitation, and other poverty alleviation
23
programs. Politically important programs such as PRONASOL in Mexico and
FONCODES in Peru do not show up in budgetary outlays destined for education, health,
or social security. Given the size of these programs, it is important to employ an analysis
that can estimate the impact of globalization and domestic political institutions on social
spending programs simultaneously.
Previous work that tests the compensation or efficiency hypotheses focuses
exclusively on the size of overall government spending. Given the wide array of groups
that benefit from different social programs, the distribution of resources within social
spending can illuminate how domestic political institutions and economic phenomena
affect the allocation of resources among different political constituencies. Previous work
relies on artificially dichotomizing the social welfare budget: separate regressions are run
for each component or all remaining programs are lumped into a residual category.
Rather than dichotomizing or simplifying the budget to accord with readily available
methodologies, we can use an approach developed by King and Katz that provides a
systematic framework to examine the distribution of shares among more than one
category (King and Katz 1999). More importantly, their approach allows us to account
for parts of the welfare budget that have been ignored. Only through compositional
analysis can we obtain the entire picture in order to understand the allocative strategies
politicians use in response to changing global circumstances.
Rather than provide an accounting of the methodological issues relevant to
compositional analysis, we refer the reader to King and Katz (1999) as well as to
Aitchison (1986). To perform the compositional analysis, we began with the social
spending data on health, education, social security, and a residual category “other” which
24
is comprised of housing, sanitation, and other welfare programs. Housing, sanitation, and
other programs not budgeted through health, education, or social security represent 10
percent of social spending in Latin America. To estimate the correlation between
globalization, democracy, and the distribution of government resources on different
social programs, we ran a series of regressions in which each component is divided by a
standard category (we chose social security). Once expressed as a ratio, the term is
logged. Predicted values are generated by the n-1 regressions (n being the number of
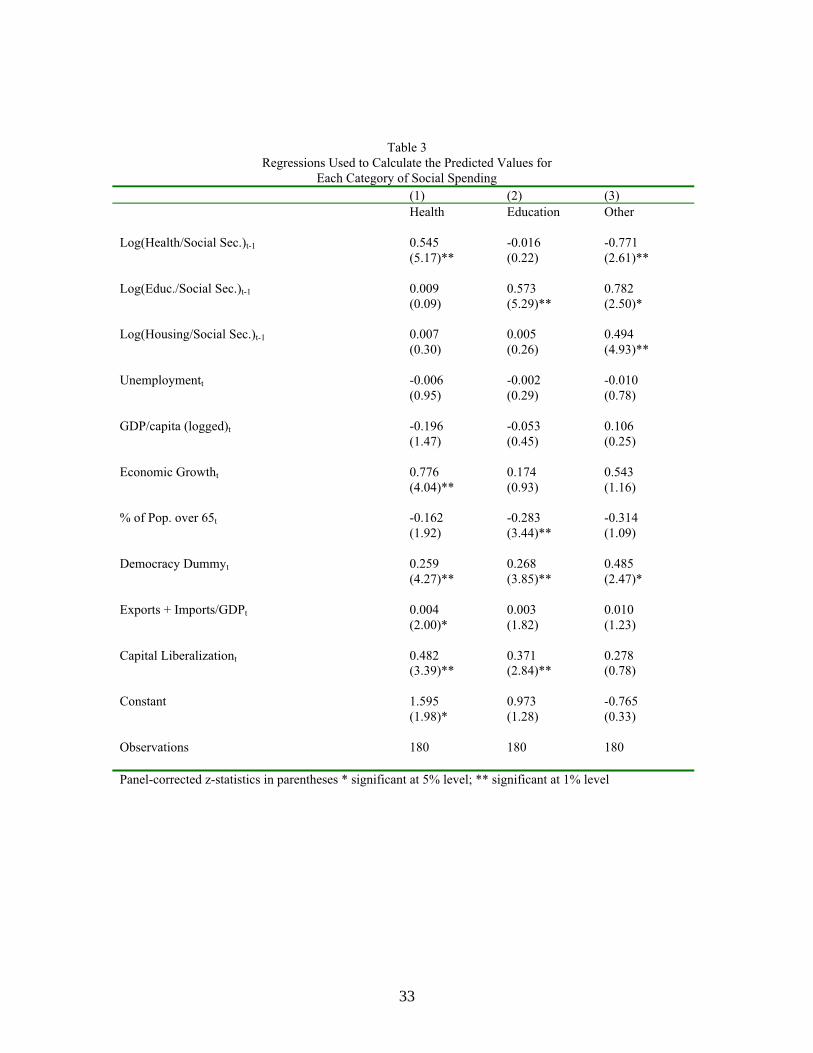
categories). We present the resulting regressions in Table 3. Predicted values are
generated for the three categories which can then be subtracted from one, producing the
predicted percentage of the fourth category (in our case social security).
<Table 3>
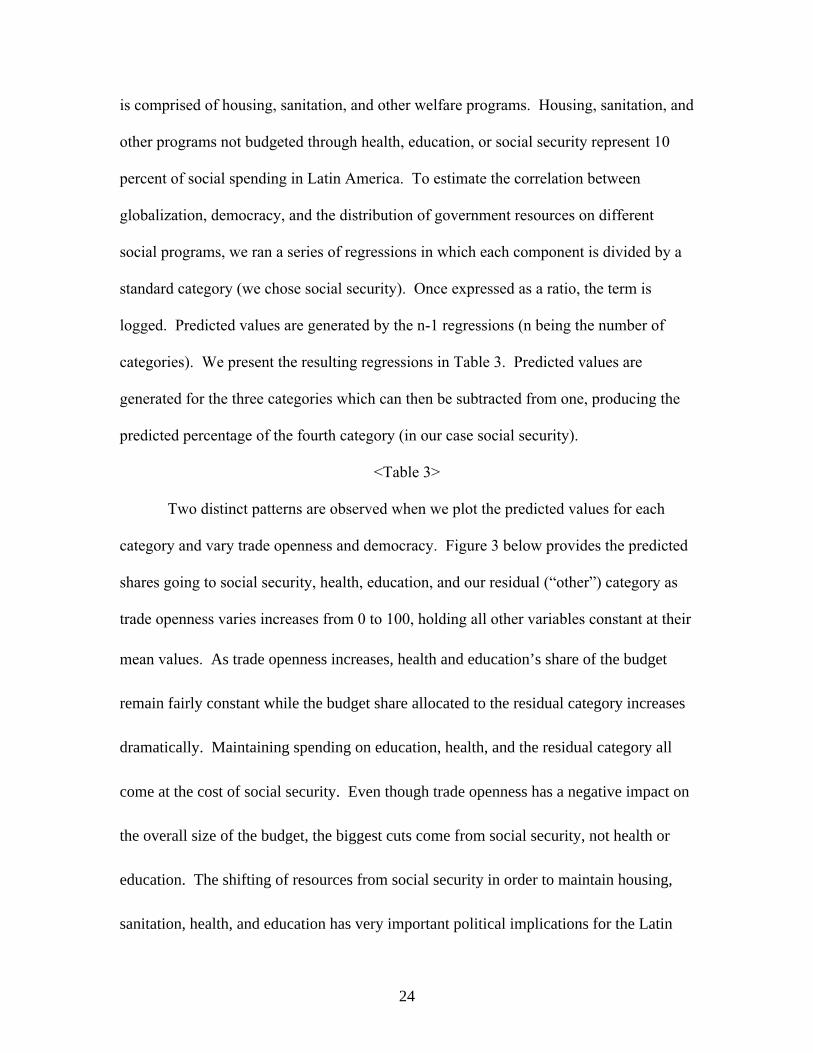
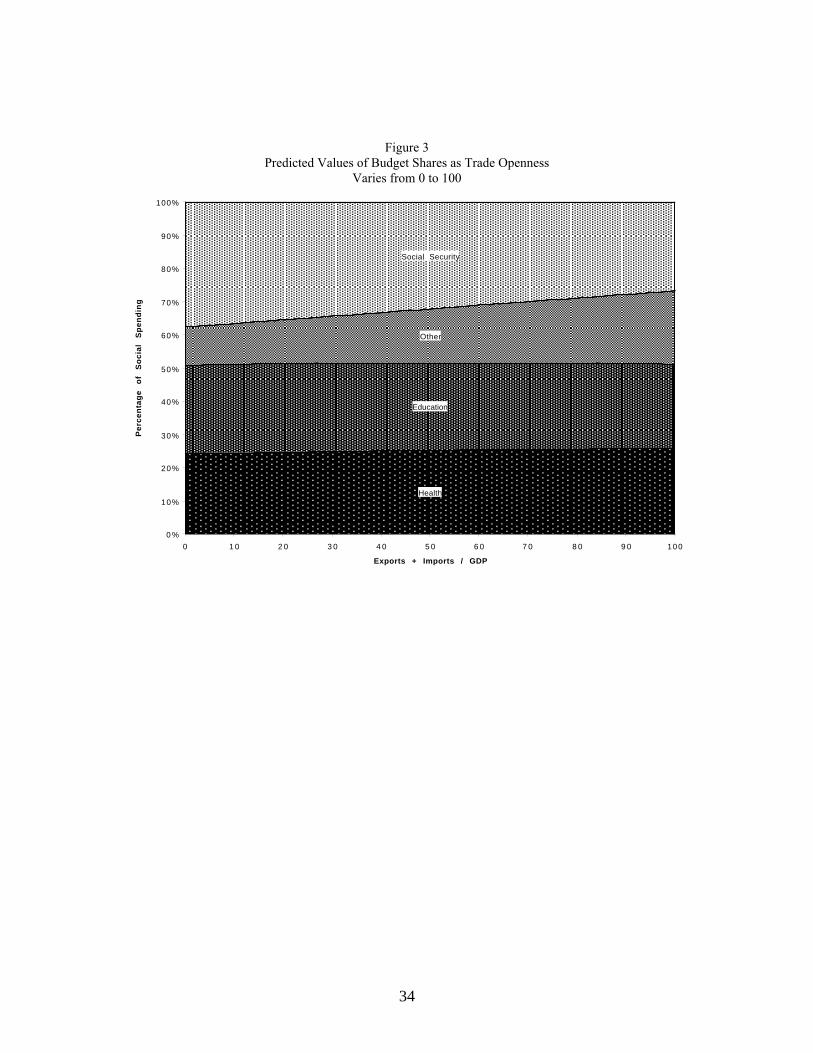
Two distinct patterns are observed when we plot the predicted values for each
category and vary trade openness and democracy. Figure 3 below provides the predicted
shares going to social security, health, education, and our residual (“other”) category as
trade openness varies increases from 0 to 100, holding all other variables constant at their
mean values. As trade openness increases, health and education’s share of the budget
remain fairly constant while the budget share allocated to the residual category increases
dramatically. Maintaining spending on education, health, and the residual category all
come at the cost of social security. Even though trade openness has a negative impact on
the overall size of the budget, the biggest cuts come from social security, not health or
education. The shifting of resources from social security in order to maintain housing,
sanitation, health, and education has very important political implications for the Latin
25
American cases. Given the relatively narrow segment of the population that benefits
from social security spending, redistributing resources to housing, sanitation, and other
welfare programs while maintaining health and education suggests that some form of
compensation is occurring.
Though somewhat limited, available evidence suggests that social security
transfers are regressive compared to either education or health (Petrei, 1996). In addition,
many Latin American governments have created new types of social programs (our
residual category) with the declared objective to circumvent old and vitiated distributive
schemes in order to target the poor more efficiently (Graham 1994). Therefore,
redistributing funds from social security to health, education, and other welfare programs
suggests that even though trade openness has a negative impact on the overall size of
social spending, it compels governments to shift resources among programs to
compensate those most adversely affected. Finally, since education and health are
generally regarded as representing more productive forms of social investment, we can
say trade openness compels Latin American governments to invest more efficiently.
<Figure 3>
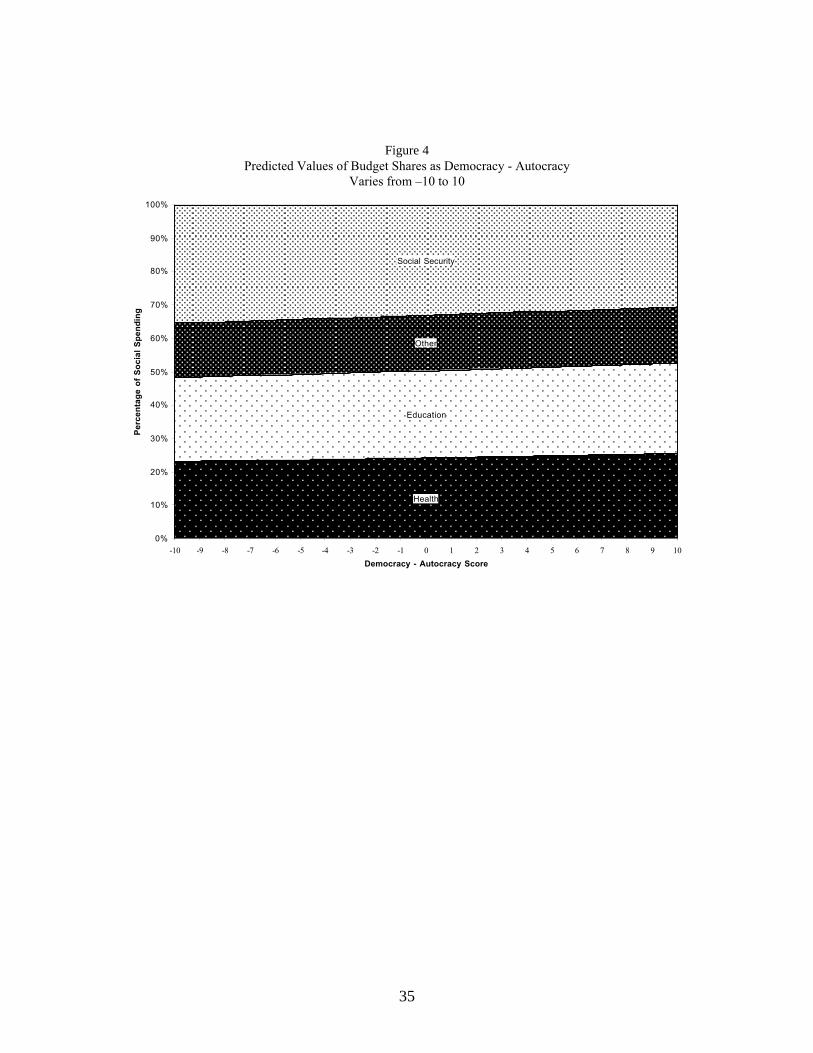
The estimates also suggests that resources are allocated to programs that reach a
larger segment of the population (health and education) as well as to the poor (narrowly
focused welfare programs). Not only is the pattern above more efficient in terms of
investing in the economy, there is a political logic lurking underneath. Democracy’s
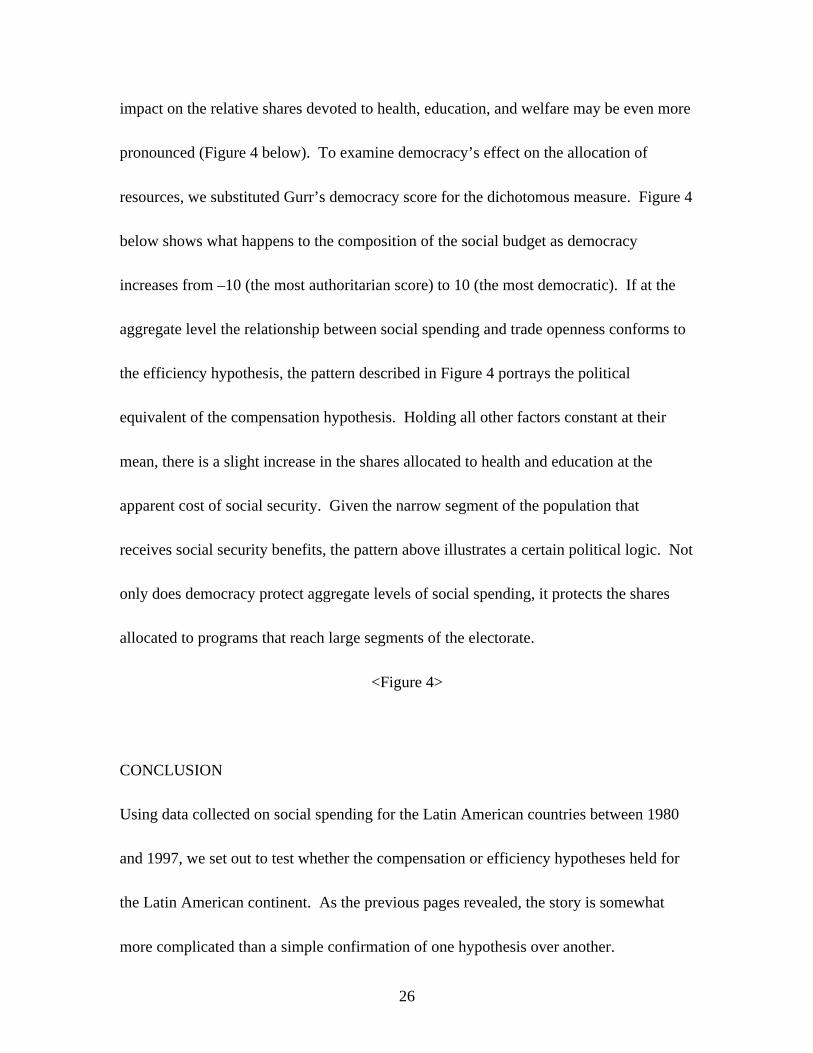
26
impact on the relative shares devoted to health, education, and welfare may be even more
pronounced (Figure 4 below). To examine democracy’s effect on the allocation of
resources, we substituted Gurr’s democracy score for the dichotomous measure. Figure 4
below shows what happens to the composition of the social budget as democracy
increases from –10 (the most authoritarian score) to 10 (the most democratic). If at the
aggregate level the relationship between social spending and trade openness conforms to
the efficiency hypothesis, the pattern described in Figure 4 portrays the political
equivalent of the compensation hypothesis. Holding all other factors constant at their
mean, there is a slight increase in the shares allocated to health and education at the
apparent cost of social security. Given the narrow segment of the population that
receives social security benefits, the pattern above illustrates a certain political logic. Not
only does democracy protect aggregate levels of social spending, it protects the shares
allocated to programs that reach large segments of the electorate.
<Figure 4>
CONCLUSION
Using data collected on social spending for the Latin American countries between 1980
and 1997, we set out to test whether the compensation or efficiency hypotheses held for
the Latin American continent. As the previous pages revealed, the story is somewhat
more complicated than a simple confirmation of one hypothesis over another.

27
Specifically, and in direct contrast to previous work by on the OECD countries, we find
that trade openness has a negative impact on the allocation of resources to social
programs. The strong, negative correlation between trade openness and social spending
confirms recent work by Kaufman and Segura (forthcoming). We find, however, in
contrast to Kaufman and Segura, that democracy has a consistent positive influence on
social spending.
Interacting democracy and trade openness produced a very contradictory result,
implying that democracies do not compensate the losers as trade openness increases.
Instead, at first glance, it appears democracies accelerate the efficient allocation of
resources away from social spending as trade openness increases. Further investigation,
however, showed that the negative coefficient on the interactive term was generated by
the large democratic economies that outspent their authoritarian counterparts. Finally, we
analyzed the allocation of resources between social spending programs to better
understand whether globalization and democracy perform compensating or efficiency
functions both in terms of economic investment and politics. Democracies protect
spending on programs that reach large segments of the population while globalization
leads to a more efficient allocation of resources among individual programs.
All we have done here is to establish some interesting empirical patterns, more
theoretical and empirical work is needed to actually explain this complex set of
phenomena. At the very least, we have established there are some heretofore unobserved
28
patterns that deserve further scrutiny. Left unanswered, for example, is why trade
openness has a consistently negative correlation with social spending in Latin America
when similar models for the OECD nations produce contradictory results. More work is
also needed to explain why our estimates of democracy’s impact on social spending
differ from those produced by Kaufman and Segura. Finally, more work is needed on
correctly specifying a model that interacts globalization with domestic political
institutions. By pursuing these questions in greater depth we can better understand the
constraints and opportunities that globalization and democratization afford.
29
Table 1Social Spending as a Percentage of GDP Regressed on Control
Variables, Democracy, Capital Liberalization, and Trade Openness.
(1) (2) (3) (4) (5) (6)
Social Spending/GDPt-1 0.759*** 0.767*** 0.760*** 0.756*** 0.759*** 0.726***(0.052) (0.054) (0.053) (0.059) (0.052) (0.055)
GDP/capitat -1.342 -1.333 -1.321 -0.384 -1.399 -0.850(1.343) (1.338) (1.389) (1.424) (1.378) (1.276)
Economic Growtht -0.346 -0.207 -0.360 -1.228 -0.427 -0.739(1.103) (1.068) (1.127) (1.201) (1.093) (1.122)
Unemploymentt 0.066* 0.067* 0.066* 0.065 0.065* 0.057(0.037) (0.040) (0.037) (0.041) (0.037) (0.036)
% of Pop. over 65t -1.160 -1.332 -1.158 -1.122 -1.161 -0.831(0.797) (1.002) (0.797) (0.794) (0.800) (0.780)
Democracy Dummyt 0.774*** 0.827*** 0.755*** 0.586*** 0.761*** 2.955***(0.235) (0.255) (0.264) (0.189) (0.240) (0.440)
Trade Opennesst -0.043*** -0.046*** -0.043*** -0.045*** -0.044*** -0.027***(0.010) (0.012) (0.010) (0.010) (0.010) (0.010)
Capital Liberalizationt -0.893 -0.899 -0.920 -0.616 -0.891 0.339(0.753) (0.731) (0.725) (0.820) (0.753) (0.919)
Fiscal Decifict 0.013(0.022)
Civil Wart -0.061(0.181)
Debt Service Ratiot 0.027***(0.006)
Inflationt 0.000(0.000)
Trade Openness X -0.044***Democracy Dummy (0.008)
Capital Liberalization X -0.882Democracy Dummy (0.910)
Observations 214 208 214 214 214 214
Standard errors in parentheses* significant at 10%; ** significant at 5%; *** significant at 1%
30
Figure 1Predicted Values and 95% Confidence Intervals For Social Spending
As a Percentage of GDP at Various Levels of Trade Openness
0 50 100 150
5
10
15
Exports + Imports / GDP
Soc
ial S
pend
ing
(% o
f GD
P)
31
Figure 2Interaction Between Democracy and Trade Openness When Holding
All Variables at the Means and Varying Trade Openness
250
252
254
20 40 60 80
250
252
254
20 40 60 80
Exports + Imports / GDP
Soc
ial S
pend
ing
per
Cap
ita
Democracies
Dictatorships

32
Table 2Regression for Education, Health, and Social Security
Panel-corrected z-statistics in parentheses: * significant at 5% level; ** significant at 1% level
(1) (2) (3) (4) (5) (6)Education Education Health Health Social
SecuritySocialSecurity
Lagged Dependent 0.751 0.695 0.549 0.563 0.826 0.812Variable (29.40)** (16.98)** (16.37)** (17.00)** (8.52)** (8.93)**
Unemployment 0.461 0.330 0.803 0.657 1.205 0.611(2.21)* (1.66) (4.86)** (3.53)** (1.20) (0.66)
GDP/capita (log) 18.118 33.638 39.705 45.237 11.533 17.655(1.50) (2.89)** (4.04)** (4.26)** (0.72) (1.05)
Economic Growth -1.111 -15.287 1.404 -3.056 -17.260 -37.484(0.10) (1.35) (0.09) (0.19) (0.72) (1.52)
Population 65 and -11.316 -6.979 0.051 0.245 25.743 22.550Above (1.29) (0.79) (0.02) (0.07) (2.28)* (1.88)
Democracy Dummy 11.730 58.212 0.805 10.250 14.632 23.9871=Democracy (5.45)** (5.25)** (0.39) (1.23) (1.72) (0.78)
Trade Openness -0.300 -0.028 -0.257 -0.166 -0.011 0.260(2.51)* (0.27) (3.80)** (2.43)* (0.06) (1.22)
Capital -1.788 26.317 16.748 16.746 -5.986 -34.987Liberalization (0.32) (1.77) (3.04)** (1.48) (0.22) (0.82)
Democracy X -21.766 3.777 48.739Capital Lib. (0.91) (0.32) (0.91)
Democracy X -0.853 -0.311 -1.022Trade Openness (7.30)** (3.98)** (2.76)**
Constant -60.109 -212.090 -269.675 -315.371 -201.810 -203.189(0.70) (2.93)** (3.55)** (3.92)** (2.06)* (1.93)
Observations 200 200 183 183 177 177
33
Table 3Regressions Used to Calculate the Predicted Values for
Each Category of Social Spending(1) (2) (3)Health Education Other
Log(Health/Social Sec.)t-1 0.545 -0.016 -0.771(5.17)** (0.22) (2.61)**
Log(Educ./Social Sec.)t-1 0.009 0.573 0.782(0.09) (5.29)** (2.50)*
Log(Housing/Social Sec.)t-1 0.007 0.005 0.494(0.30) (0.26) (4.93)**
Unemploymentt -0.006 -0.002 -0.010(0.95) (0.29) (0.78)
GDP/capita (logged)t -0.196 -0.053 0.106(1.47) (0.45) (0.25)
Economic Growtht 0.776 0.174 0.543(4.04)** (0.93) (1.16)
% of Pop. over 65t -0.162 -0.283 -0.314(1.92) (3.44)** (1.09)
Democracy Dummyt 0.259 0.268 0.485(4.27)** (3.85)** (2.47)*
Exports + Imports/GDPt 0.004 0.003 0.010(2.00)* (1.82) (1.23)
Capital Liberalizationt 0.482 0.371 0.278(3.39)** (2.84)** (0.78)
Constant 1.595 0.973 -0.765(1.98)* (1.28) (0.33)
Observations 180 180 180
Panel-corrected z-statistics in parentheses * significant at 5% level; ** significant at 1% level
34
Figure 3Predicted Values of Budget Shares as Trade Openness
Varies from 0 to 100
Health
Education
Social Security
Other
0 %
10%
20%
30%
40%
50%
60%
70%
80%
90%
100%
0 1 0 2 0 3 0 4 0 5 0 6 0 7 0 8 0 9 0 100
Exports + Imports / GDP
Pe
rce
nta
ge
o
f S
oci
al
Sp
en
din
g
35
Figure 4Predicted Values of Budget Shares as Democracy - Autocracy
Varies from –10 to 10
Health
Education
Social Security
Other
0%
10%
20%
30%
40%
50%
60%
70%
80%
90%
100%
-10 -9 -8 -7 -6 -5 -4 -3 -2 -1 0 1 2 3 4 5 6 7 8 9 10
Democracy - Autocracy Score
Pe
rce
nta
ge
of
So
cia
l S
pe
nd
ing
36
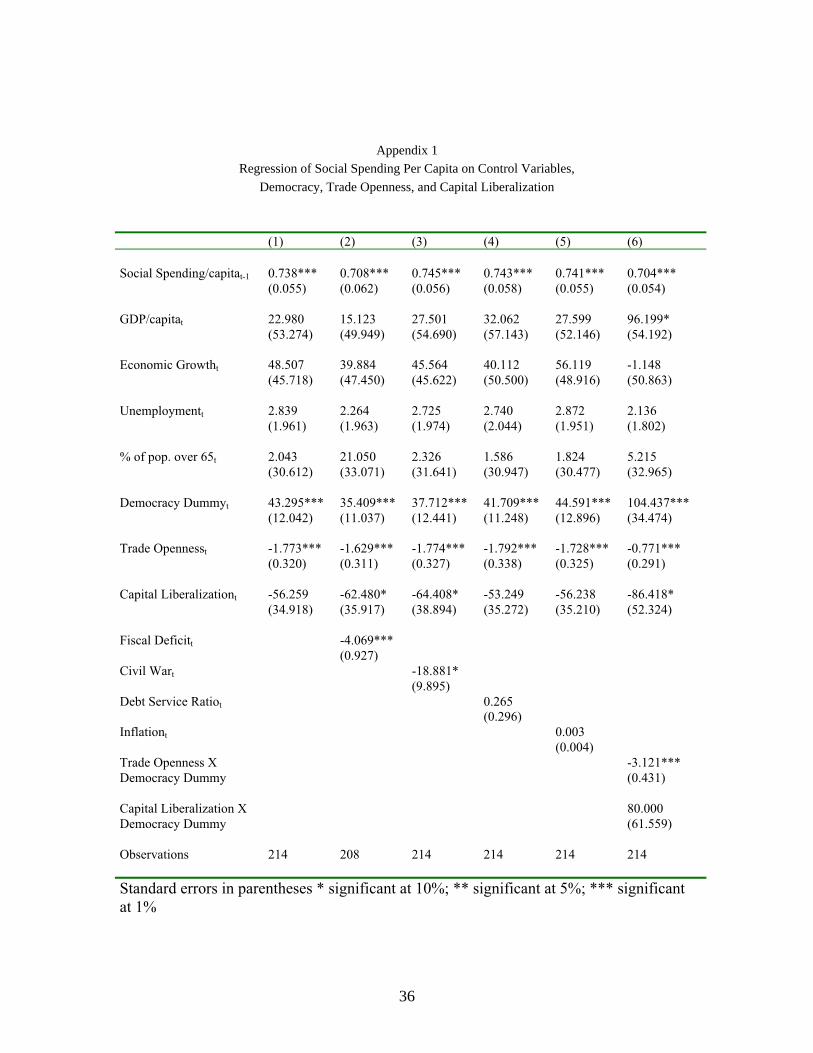
Appendix 1Regression of Social Spending Per Capita on Control Variables,
Democracy, Trade Openness, and Capital Liberalization
(1) (2) (3) (4) (5) (6)
Social Spending/capitat-1 0.738*** 0.708*** 0.745*** 0.743*** 0.741*** 0.704***(0.055) (0.062) (0.056) (0.058) (0.055) (0.054)
GDP/capitat 22.980 15.123 27.501 32.062 27.599 96.199*(53.274) (49.949) (54.690) (57.143) (52.146) (54.192)
Economic Growtht 48.507 39.884 45.564 40.112 56.119 -1.148(45.718) (47.450) (45.622) (50.500) (48.916) (50.863)
Unemploymentt 2.839 2.264 2.725 2.740 2.872 2.136(1.961) (1.963) (1.974) (2.044) (1.951) (1.802)
% of pop. over 65t 2.043 21.050 2.326 1.586 1.824 5.215(30.612) (33.071) (31.641) (30.947) (30.477) (32.965)
Democracy Dummyt 43.295*** 35.409*** 37.712*** 41.709*** 44.591*** 104.437***(12.042) (11.037) (12.441) (11.248) (12.896) (34.474)
Trade Opennesst -1.773*** -1.629*** -1.774*** -1.792*** -1.728*** -0.771***(0.320) (0.311) (0.327) (0.338) (0.325) (0.291)
Capital Liberalizationt -56.259 -62.480* -64.408* -53.249 -56.238 -86.418*(34.918) (35.917) (38.894) (35.272) (35.210) (52.324)
Fiscal Deficitt -4.069***(0.927)
Civil Wart -18.881*(9.895)
Debt Service Ratiot 0.265(0.296)
Inflationt 0.003(0.004)
Trade Openness X -3.121***Democracy Dummy (0.431)
Capital Liberalization X 80.000Democracy Dummy (61.559)
Observations 214 208 214 214 214 214
Standard errors in parentheses * significant at 10%; ** significant at 5%; *** significantat 1%
37
Bibliographic Sources
Adsera, Alicia and Carles Boix, no date, "The Political Economy of, Trade and EconomicIntegration: A Review Essay " Unpublished, paper.
________________, forthcoming, "Trade, Democracy and the Size, of the Public Sector”International Organization.
Aitchison, J. 1986. The Statistical Analysis of Compositional Data. London; Chapmanand Hall.
Beck, Nathaniel and Jonathan N. Katz, 1995, “What to Do (and Not to Do) With Time-Series Cross-Section Data”. American Political Science Review, 89(3): 634-47.
Beck, Nathaniel and Jonathan N. Katz, 1996, “Nuisance vs. Substance: Specifying andEstimating Times-Series-Cross-Sectional Models”. Political Analysis, 6: 1-36.
Birdsall, Nancy, and Augusto de la Torre, 2001, Washington, Contentious: EconomicPolicies for Social Equity in Latin, America, Washington, D.C.: Carnegie Endowmentfor, International Peace and Inter-American Dialogue.
Birdsall, Nancy and Carol Graham, eds, 2000, New Markets, New, Opportunities?:Economic and Social Mobility in a Changing, World, Washington, D C: The BrookingsInstitution Press.
Bulmer–Thomas, Victor, 1996, The New Economic Model in Latin, America and itsImpact on Income Distribution and Poverty, London: MacMillan Press, Ltd.
Cameron, David, 1978: "The Expansion of the Public Economy: A Comparative Analysis" American Political Science Review 72: 1243–1261.
Collier, David; and Steve Levitsky, 1997, “Democracy with Adjectives; ConceptualInnovation in Comparative Research”. World Politics, 49: 430-51
Cominetti, Rosella; and Emanuela Di Gropello, 1994, “El Gasto Social en AméricaLatina: Un Examen Cuantitativo and Cualitativo”, Santiago de Chile, ComisiónEconómica para America Latina y el Caribe (CEPAL), Cuadernos de la Cepal # 71
Cominetti, Rosella and Gonzalo Ruiz,1998, “Evolución del Gasto Público Social enAmerica Latina: 1980-1995”, Santiago de Chile, Comisión Económica para AméricaLatina y el Caribe (CEPAL), Cuadernos de la Cepal # 80
Deacon, Bob, 1999, "Social Policy in a Global Context " In Inequality Globalization, andWorld Politics, edited by Andrew Hurrell and Ngaire Woods, Oxford and New York:Oxford University Press.
38
Edwards, Sebastian and Nora Lustig, eds, 1997, Labor Markets in, Latin America:Combining Social Protection with Market, Flexibility, Washington, D C, The BrookingsInstitution Press.
Garrett, Geoffrey, 1998, Partisan Politics in the Global Economy, Cambridge and NewYork: Cambridge University Press.
Garrett, Geoffrey, 2001, "Globalization and Government Spending, Around the World”Studies in Comparative International Development 35(4): 3-29.
Garrett, Geoffrey and Mitchell, Deborah, 1999, "Globalization and, the Welfare State"unpublished manuscript.
Garrett, Geoffrey and David Nickerson, 2001, "Globalization, Democratization andGovernment Spending in Middle Income Countries" unpublished manuscript.
Graham, Carol, 1994, Safety Nets, Politics, and the Poor: Transitions to MarketEconomies, Washington, D.C.: Brookings Institution.
Grosh, Margaret E, 1996, Administering Targeted Social Programs in Latin America:From Platitudes to Practice, Aldershot: Avebury.
Hicks, Alexander and Dwane Swank, 1992, "Politics, Institutions, and Welfare Spendingin Industrialized Democracies ", American Political Science Review, 86: 658–74.
Huber, Evelyne, 1996, "Options for Social Policy in Latin America: Neoliberal versusSocial Democratic Models " In Gosta Esping–Andersen (ed.) Welfare States inTransition: National Adaptations in Global Economies, London: Sage Publications.
Huber, Evelyne, 1999, "Globalization and Social Policy, Developments in LatinAmerica” Paper prepared for the conference Globalization and the Future of WelfareStates: Interregional Comparisons, Brown University, October 22–23.
Huber, Evelyne and John D, Stephens, Forthcoming, Political Choice, in GlobalMarkets: Development and Crisis of Advanced Welfare States.
Huntington, Samuel P., 1989, “The Modest Meaning of Democracy.” In: Pastor, RobertA., ed., Democracy in the Americas: Stopping the Pendulum. New York, Holmes andMeyer Publishers.
Huntington, Samuel P., 1991, The Third Wave; democratization in the late twentiethcentury. Norman, University of Oklahoma Press.
Hurrell, Andrew and Ngaire Woods, 1999, Inequality, Globalization, and World Politics,Oxford and New York: Oxford University Press
39
Katzenstein, Peter J, 1985, Small States in World Markets, Ithaca, New York, CornellUniversity Press.
Kaufman, Robert and Alex Segura, Forthcoming, "Globalization, Domestic Politics andSocial Spending in Latin America: A, Time-Series Cross-Section Analysis, 1973-1997World, Politics
Keohane, Robert and Helen Milner, eds., 1996, Internationalization, and DomesticPolitics, Cambridge: Cambridge University, Press.
King, G. and J. Katz. 1999. “A Statistical Model for Multiparty Electoral Data.”American Political Science Review. Vol. 93 (March).
Lustig, Nora ed., 2001, Shielding the Poor: Social Protection in the, Developing World,Washington, D.C.: The Brookings Institution, and the Inter-American DevelopmentBank.
Morley, Samuel; Roberto Machado; and Stefano Pettinato, 1999, Indexes of StructuralReforms in Latin America. Santiago de Chile: ECLAC (Economic Development Division,LC/L 1166).
Petrei, Humberto, 1996, Distribuición del Ingresso: El papel del Gasto Público Social.Santiago de Chile: ECLAC/CEPAL (Série Política Fiscal # 81 – LC/L.953).
Prezeworski, Adam and Henry Teune, 1970, The Logic of Comparative Social Inquiry.New York, John Wiley and Sons.
Przeworski, Adam et al.,1995, Sustainable Democracy. Cambridge, CambridgeUniversity Press.
Pierson, Paul, 1996, "The New Politics of the Welfare State” World, Politics 48 (2):143–179.
Powers, Nancy R, and Petya Kostadinova (no date). "Trading Social, Citizenship? AStudy of Globalization's Effects in Latin, America ", unpublished manuscript.
Rodrik, Dani, 1998, "Why Do More Open Economies Have Bigger, Governments?" TheJournal of Political Economy 106:5, (October): 997–1032.
________, 1999, The New Global Economy and Developing, Countries: MakingOpenness Work, Washington, D.C.: Overseas Development Council
________, 2001, ¿Por qué hay tanta inseguridad económica en América Latina? Revistade la CEPAL 73 (Abril): 7–31.
Schmitter, Philippe C. and Terry L. Karl, 1991, “What democracy is… and what is not”.Journal of Democracy, 2(1): 75-88.
40
Stallings, Barbara and Wilson Peres, 2000, Growth, Employment, and, Equity, TheImpact of the Economic Reforms in Latin America, and the Caribbean, Washington, D C: Brookings Institution, Press.
Stimson, James M., 1985, “Regression in Space and Time: A Statistical Essay”.American Journal of Political Science, 29: 914-47.
The Economist, (2001), The Latinobarometro Poll; An Alarm Call for Latin AmericanDemocracies, July 28th – August 3rd