Globalisation and Employment in Bangladesh and Kenya ...
32
0 Globalisation and Employment in Bangladesh and Kenya DISCUSSION PAPER 7 By Kunal Sen School of Development Studies and Overseas Development Group, University of East Anglia, Norwich NR4 7TJ, United Kingdom email: [email protected] I would like to thank the Centre for Policy Dialogue (CPD), Dhaka, Bangladesh and the Kenya Institute for Public Policy Research and Analysis (KIPPRA), Nairobi, Kenya, for providing excellent research facilities and logistic support during my visits to Bangladesh and Kenya. In particular, I would like to thank Prof. Mwangi Kimenyi, Executive Director, KIPPRA, and Prof. Mustafizur Rahman, Research Director, CPD, for their support and advice. This paper has benefited considerably from discussions with Md. Akhtaruzzaman, Debapriya Bhattacharya, Enamul Haque, Kapil Kapoor, Rafiqul Islam Molla, Narhari Rao, Zaidi Sattar, Binayak Sen and Rehman Sobhan in the case of Bangladesh, and Graham Glenday , Bernard Kagira, Peter Kimuyu, Kulundu Manda, Eng. Masila , Catherine Masinde, Hezron Nyangitu and Terry Ryan in the case of Kenya. The usual disclaimer applies. This paper has been prepared as part of the DFID-funded project Globalisation, Production and Poverty.
-
Upload
khangminh22 -
Category
Documents
-
view
4 -
download
0
Transcript of Globalisation and Employment in Bangladesh and Kenya ...
0
Globalisation and Employment
in Bangladesh and Kenya
DISCUSSION PAPER 7
By
Kunal Sen
School of Development Studies and Overseas Development Group,University of East Anglia, Norwich NR4 7TJ, United Kingdom
email: [email protected]
I would like to thank the Centre for Policy Dialogue (CPD), Dhaka, Bangladesh and the Kenya Institutefor Public Policy Research and Analysis (KIPPRA), Nairobi, Kenya, for providing excellent researchfacilities and logistic support during my visits to Bangladesh and Kenya. In particular, I would like tothank Prof. Mwangi Kimenyi, Executive Director, KIPPRA, and Prof. Mustafizur Rahman, ResearchDirector, CPD, for their support and advice. This paper has benefited considerably from discussionswith Md. Akhtaruzzaman, Debapriya Bhattacharya, Enamul Haque, Kapil Kapoor, Rafiqul IslamMolla, Narhari Rao, Zaidi Sattar, Binayak Sen and Rehman Sobhan in the case of Bangladesh, andGraham Glenday , Bernard Kagira, Peter Kimuyu, Kulundu Manda, Eng. Masila , Catherine Masinde,Hezron Nyangitu and Terry Ryan in the case of Kenya. The usual disclaimer applies.
This paper has been prepared as part of the DFID-funded project Globalisation, Production andPoverty.
1
Globalisation and Employment in Bangladesh and Kenya
By
Kunal Sen
School of Development Studiesand Overseas Development Group,
University of East Anglia,Norwich NR4 7TJ,United Kingdom
email: [email protected]
I would like to thank the Centre for Policy Dialogue (CPD), Dhaka, Bangladesh andthe Kenya Institute for Public Policy Research and Analysis (KIPPRA), Nairobi,Kenya, for providing excellent research facilities and logistic support during my visitsto Bangladesh and Kenya. In particular, I would like to thank Prof. Mwangi Kimenyi,Executive Director, KIPPRA, and Prof. Mustafizur Rahman, Research Director, CPD,for their support and advice. This paper has benefited considerably from discussionswith Md. Akhtaruzzaman, Debapriya Bhattacharya, Enamul Haque , Kapil Kapoor,Rafiqul Islam Molla, Narhari Rao, Zaidi Sattar, Binayak Sen and Rehman Sobhan inthe case of Bangladesh, and Graham Glenday , Bernard Kagira, Peter Kimuyu,Kulundu Manda, Eng. Masila , Catherine Masinde, Hezron Nyangitu and Terry Ryanin the case of Kenya. The usual disclaimer applies.
This paper has been prepared as part of the DFID-funded project, ‘Globalisation,Production and Poverty’.
2
EXECUTIVE SUMMARY
In contrast to the growing empirical literature that examines the labour market effects
of globalisation in middle income developing countries, there are few studies that do
so for the low income countries of South Asia and Sub-Saharran Africa. In this paper,
we study the effects of globalisation on manufacturing employment in Bangladesh
and Kenya, two countries that have witnessed rapid integration of their economies
with the rest of the world in the past two decades. To assess the impact of increased
open-ness on employment, we use the factor content, the growth accounting and
regression-based approaches.
The analysis of the factor-intensity of exports and imports for Bangladesh
suggest a significant increase in labour-intensive manufacturing exports in the 1990s,
along with a corresponding increase in labour-intensive imports. For Kenya, on the
other hand, there is little change in the volume of exports and imports, or in their
factor-content. Employment coefficients for exports and imports suggest that the
structure of exports is marginally more labour-intensive than imports in both
Bangladesh and Kenya. The growth accounting results indicate that in the case
of Bangladesh, the contribution of international trade to total employment growth has
been positive, though less significant both in absolute and relative terms in the 1990s
than in the1980s. For Kenya, the effect of international trade on employment has been
unambiguously negative in the 1990s.
The regression results indicate that in the case of Bangladesh, increased open-
ness led to the adoption of more labour-intensive techniques within the same industry
while in the case of Kenya, there is no evidence that increased open-ness led to any
appreciable changes in the efficiency of labour or shifts in industry-specific
capital/labour ratios. Thus, the paper finds that globalisation has led to a differential
impact on manufacturing employment in the two countries of our study. In the case of
Bangladesh, increased integration with the world economy has led to an increase
(albeit small) in manufacturing employment while in the case of Kenya, the net effect
of globalisation on employment could be considered negative.
1
Introduction
The 1980s and 1990s have witnessed a rapid integration of the global economy,
reflected in reduced trade barriers, increased trade, highly mobile capital and labour
and the rapid transmission of technology across national lines. There is a vast
empirical literature that examines the labour market effects of such a process of
globalisation for developed countries. In contrast, for developing countries, the
limited set of studies that is available is mainly focused on middle income economies
mostly concentrated in Latin America, with few studies on the low- income countries
of South Asia and Sub-Saharran Africa (see Sen 2001 for a critical review of these
studies). This paper attempts to examine the effects of globalisation on manufacturing
employment in two low-income countries, one in South Asia and the other in Africa.
The countries that we study are Bangladesh and Kenya. Both these countries are
appropriate case studies of the subject at hand, having undergone substantial
economic reforms in the past two decades that has led to the rapid integration of these
two economies with the world economy.
In analyzing the relationship between globalisation and manufacturing
employment, the paper employs three approaches. These are the factor content
approach; the growth accounting approach; and a regression-based approach. Factor
content studies have been widely used both in order to test theories of international
trade and to estimate the employment effects of trade, particularly between developed
and developing countries and provide a useful way of analysing the overall effects of
trade changes on the utilisation of labour. The growth accounting approach
decomposes changes in employment into that part which is accounted for by changes
in domestic demand, changes in exports, changes in imports and productivity growth
(Moreira and Najberg 2000). The third approach that has been used in studies of the
impact of trade on employment is to regress employment at the industry level on a
number of explanatory variables, derived from an econometric model. This approach
has been used by Hine and Wright (1998) to analyse the impact of trade on
employment in UK manufacturing and in a developing country context by Milner and
Wright (1998) for Mauritius. Explanatory variables used by Hine and Wright include
output, export penetration, import penetration and the relative cost of labour
(wage/cost of capital ratio). This approach can take account of the indirect impact of
trade on employment via endogenous changes in technology linked to international
2
trade and/or changes in the efficiency of labour use. Further details of these
approaches are provided in Jenkins and Sen (2002).
The remainder of the paper is divided into six sections. Firstly, in Section II,
we provide a brief overview of policies with respect to international trade and foreign
direct investment (FDI) in Bangladesh and Kenya in the past two decades. We follow
this in Section III with an examination of the changing structure of production and
employment in the manufacturing sectors of these two countries in the recent past.
Sections IV, V and VI use the factor content, growth accounting and econometric
approaches respectively to assess the impact of international trade on manufacturing
employment. Section VII concludes.
II. An Overview of Trade and Foreign Direct Investment Policies
This section provides a brief overview of trade reform and foreign investment policies
in each country and the major trends in trade openness and FDI indicators in these two
countries.
Bangladesh: Beginning in the early 1980s, there was slow progress towards a more
liberal economic policy regime in Bangladesh, with the adoption of the New
Industrial Policy in 1982 and the Revised Industrial Policy in 1986. During this
period, the extensive quantitative restrictions on imports and strict exchange control
measures that had existed in the economy of Bangladesh since independence in 1971
were gradually relaxed (Paratian and Torres 2001). The government introduced
measures to promote exports by introducing export subsidies and import duty
reductions on imported inputs used by exporters, and the first export processing zone
(EPZ) was set up in Chittagong in 1983. There was also emphasis on reducing the
level and dispersion of tariffs, simplifying and rationalising the tariff structure, and a
shift from quotas to tariffs. Furthermore, during this period, a positive list of items
that could be imported was replaced with a negative list of items that could not be
imported without a licence, with the negative list being progressively reduced over
time.
The period from 1991 onwards was marked by the acceleration of trade
reforms with peak tariff rates being drastically reduced and the almost complete
3
abolition of quotas.1 The average Effective Rate of Protection (ERP) fell from 75.7
per cent in 1992/93 to 24.5 per cent in 1999/00, with a similar fall in its standard
deviation from 84.4 in 1992/93 to 20.0 in 1999/00. The most dramatic reductions in
ERPs were observed in ready-market garments from 237.2 per cent in 1992/93 to 58.9
per cent in 1999/00, handloom cloth from 157.7 per cent in 1992/93 to 64.6 per cent
in 1999/00, and mill cloth from 189.7 per cent in 1992/93 to 72.7 per cent in 1999/00
(World Bank 1999). The policy measures were also partially successful in reducing
the anti-export bias of the trade regime, with the ratio of the effective exchange rate
for imports to that of exports decreasing from 1.657 in 1991/92 to 1.263 in 1997/98
(op cit.). In addition, the government introduced a unified exchange rate system by
eliminating the ‘Secondary Exchange Market System’ and adopting a moderately
flexible exchange rate policy. By 1994, Bangladesh had accepted the IMF’s Article 8
obligations, thus committing itself to current account convertibility.
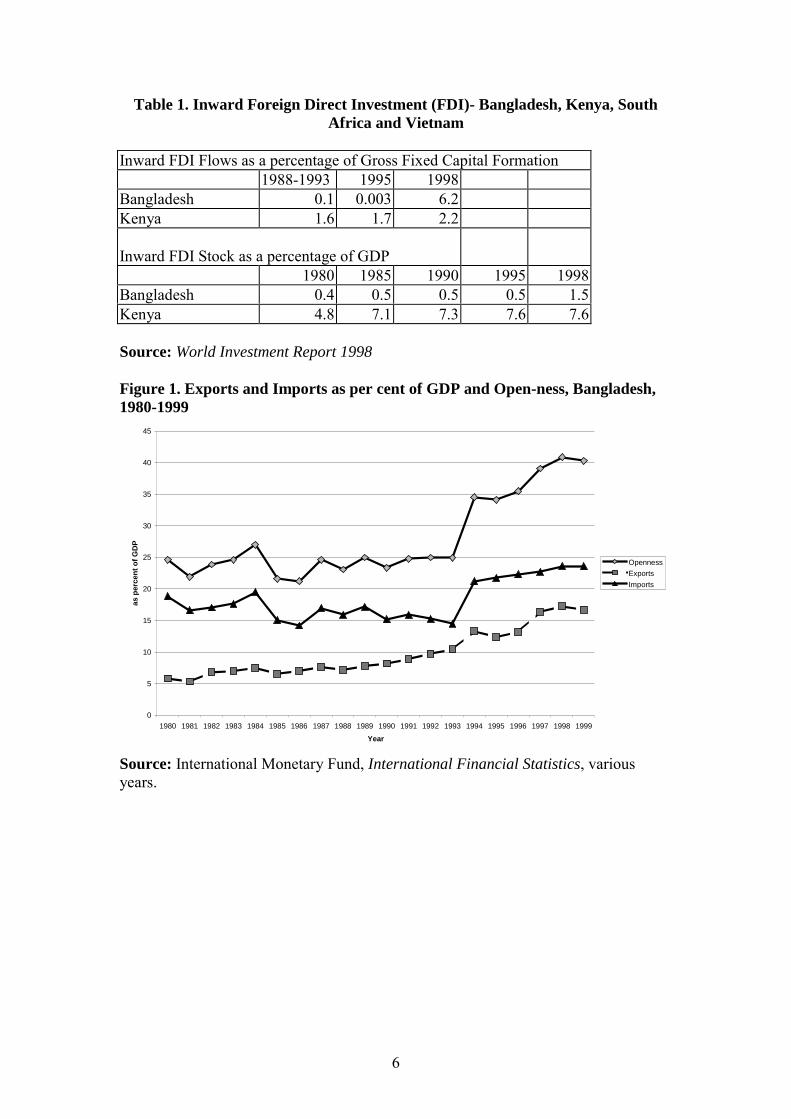
The trade liberalisation of the early 1990s seem to have led to a dramatic
increase in the openness of the Bangladesh economy since 1994, with the ratio of
exports plus imports as a ratio of GDP increasing from an average of 24 per cent in
1980-1993 to over 37 per cent in 1994-1998 (Figure 1).
Since 1991, the Bangladesh government has enacted a set of measures to
provide additional incentives to firms to invest in EPZs. A second EPZ was set up in
Savar near Dhaka in 1993 and in October 1996, the government enacted a law
allowing the establishment of EPZs by the private sector. The government also offers
liberal incentives to firms to set up operations in the EPZs – in particular, a ten year
tax holiday, zero duties on the imports of capital and intermediate goods, and the full
repatriation by foreign firms of the principal and profits generated in the EPZs. These
incentives have attracted some foreign investment in the late 1990s, with South Korea
being the largest investor. As a consequence, inward FDI flows as a percentage of
total investment has increased from 0.1 in 1988-1993 to 6.2 in 1998 (Table 1). Much
of this inward foreign investment goes to the EPZs, with the share of EPZs in total
foreign direct investment being 68.1 per cent in 1995/1996 (Paratian and Torres op
cit.). These export processing zones have been critical in the export success of
Bangladesh in recent years, with the bulk of the exports in EPZs originating in the
1 In 1995/97, 115 items were in the negative list, out of which 92 were there for non-trade reasons. Thiscompared to 478 items in 1985/86. With respect to tariffs, the unweighted average tariff rate fell fromover 57 per cent in 1991/92 to 20.7 per cent in 1997/98.

4
ready-made garments sector. A distinctive feature of employment in the EPZs is that a
majority of the workers in the EPZ units are women (approximately 70 per cent
according to Paratian and Torres, op cit.).
Kenya: Since gaining independence from Great Britain in 1963, Kenya followed an
import-substituting industrialisation strategy for the next two decades. The Kenyan
economy performed well in the period 1964-1980 with the GDP growth rate
averaging around 5.5 per cent per annum during this period. The manufacturing sector
grew at a rapid pace, at 10 per cent per annum, fuelled by growth in domestic rural
incomes and the expansion of exports to Tanzanian and Uganda under the common
market created by the East African Community (EAC).
In the late 1970s, the Kenyan economy was hit by several shocks one after
another. First, there was the boom and bust cycle in coffee and tea prices in 1976-
1979. Second, the EAC broke up in 1977, denying Kenyan exporters preferential
access to Ugandan and Tanzanian markets. Third was the oil price shock of 1979.
These shocks contributed to a widening of the current account deficit from 3 per cent
of GDP in 1975-77 to 10-11 per cent in 1978-82.
A structural adjustment programme was introduced in 1979 that, among other
measures, called for eliminating barriers to foreign trade and foreign investment.
Furthermore, steps would be taken to promote export-led growth instead of import
substitution by reducing protection and controls on access to foreign exchange,
adopting a flexible exchange rate policy and providing additional incentives to
exporters. In June 1982, one fifth of restricted items were freed from import licensing
(World Bank 1987). Subsequently, there was limited progress with respect to the
liberalisation of the trade regime with many of the strict controls on the importation of
goods remaining in place. On the exchange rate front, there was a series of
devaluations in 1982, with the exchange rate at the end of 1982 being 14.06 Ksh to 1
US dollar, as compared to 9.66 Ksh to 1 US dollar in 1981.2 Trade reforms started
picking up pace in the late 1980s with the conversion of quantitative restrictions to
tariff equivalents, starting in 1987. In 1990, the government embarked on a phased
tariff reduction (particularly in the high-rate bands) and a rationalisation of tariff
bands (Glenday and Ryan 2000). Perhaps the most significant policy change in the
5
1990s was the revocation of import licensing schedules (other than for health, safety
and security reasons) in May 1993. However, the trade liberalization process was
interrupted by an economic crisis in 1997, following the collapse of an IMF program,
election spending-related budgetary crisis and exchange rate instability (Glenday and
Ndii 1999).
The possible beneficial effects that trade reforms might have had on economic
performance in Kenya has been considerably lessened by major slippages in
macroeconomic policy in the early 1980s and then again in the early 1990s, leading to
high inflation and an appreciation of the real exchange rate during these two periods.
At the same time, the trade reforms have proceeded at an uneven pace, with periods of
rapid opening up followed by periods of stagnancy or reversal in trade liberalisation.3
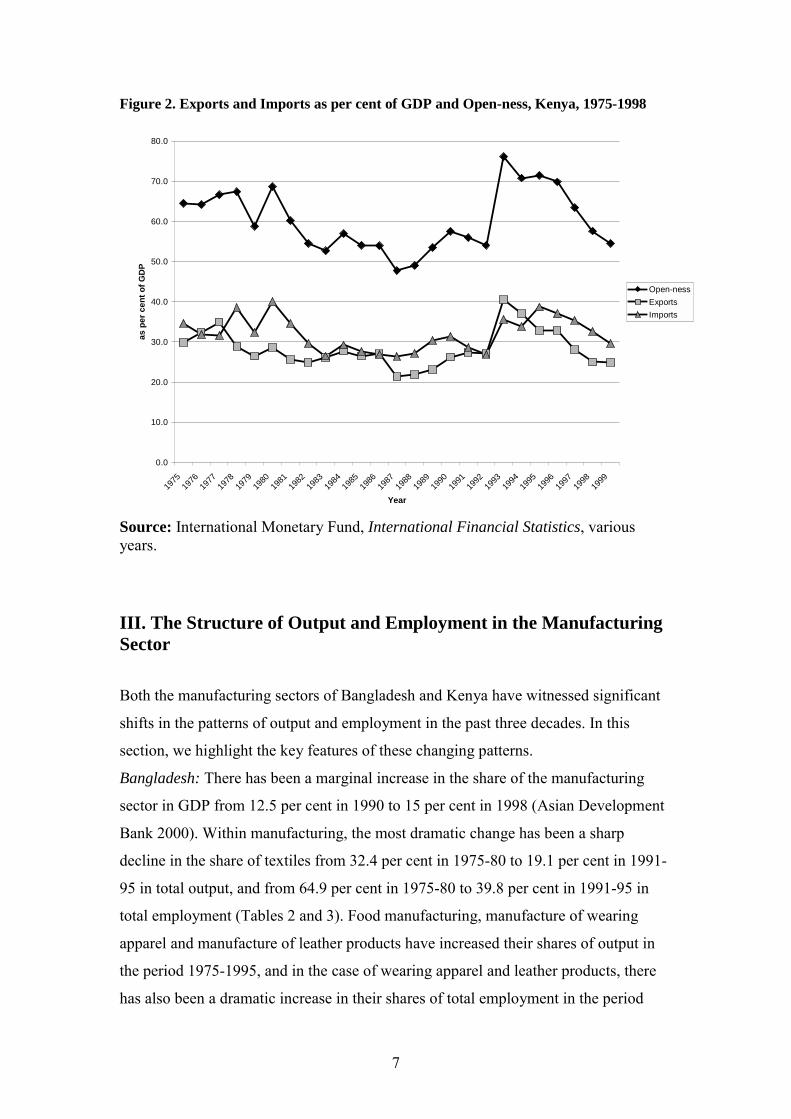
The openness measure (exports + imports as a per cent of GDP) for Kenya also shows
no clear trend, with an increase in the late 1980s followed by a sharp decline since
1993 (Figure 2). The decline in the open-ness measure in the late 1990s seems to be
driven both by a fall in exports and imports as percentages of GDP.
There has been a negligible flow of FDI into Kenya in the 1980s and 1990s, in
spite of a consistently liberal environment towards FDI by the Kenyan government for
much of the post-independence period. Inward FDI as a ratio of total investment
averaged 1-2 per cent in the period 1988-1998 (Table 1). Since 1988, the Kenyan
government has implemented a series of measures to attract foreign investors into
Kenya, particularly with respect to export platforms such as Manufacturing Under
Bond (MUB) and Export Processing Zones (EPZs). In 1997, 12 out of the 22 firms
operating in Kenya were fully foreign owned and another two had a nominal one per
cent domestic shareholding. However, the performance of these export platforms have
been disappointing with exports from EPZs accounting for 3.5 per cent of total
manufacturing exports and employment in these firms accounting for barely one per
cent of total manufacturing employment in 1997 (Glenday and Ndii op cit.).
2 The sequence of devaluations were in response to a possibility of capital flight following the coupattempt in August 1982.3 As O'Brien and Ryan note, 'Kenya can be made to fit the mould of a reluctant reformer whose overallrecord has been no better than the (Sub-Saharran African) average' (p. 494, 2000).
6
Table 1. Inward Foreign Direct Investment (FDI)- Bangladesh, Kenya, SouthAfrica and Vietnam
Inward FDI Flows as a percentage of Gross Fixed Capital Formation1988-1993 1995 1998
Bangladesh 0.1 0.003 6.2Kenya 1.6 1.7 2.2
Inward FDI Stock as a percentage of GDP1980 1985 1990 1995 1998
Bangladesh 0.4 0.5 0.5 0.5 1.5Kenya 4.8 7.1 7.3 7.6 7.6
Source: World Investment Report 1998
Figure 1. Exports and Imports as per cent of GDP and Open-ness, Bangladesh,1980-1999
Source: International Monetary Fund, International Financial Statistics, variousyears.
0
5
10
15
20
25
30
35
40
45
1980 1981 1982 1983 1984 1985 1986 1987 1988 1989 1990 1991 1992 1993 1994 1995 1996 1997 1998 1999Year
as p
erce
nt o
f GD
P
OpennessExportsImports
7
Figure 2. Exports and Imports as per cent of GDP and Open-ness, Kenya, 1975-1998
Source: International Monetary Fund, International Financial Statistics, variousyears.
III. The Structure of Output and Employment in the ManufacturingSector
Both the manufacturing sectors of Bangladesh and Kenya have witnessed significant
shifts in the patterns of output and employment in the past three decades. In this
section, we highlight the key features of these changing patterns.
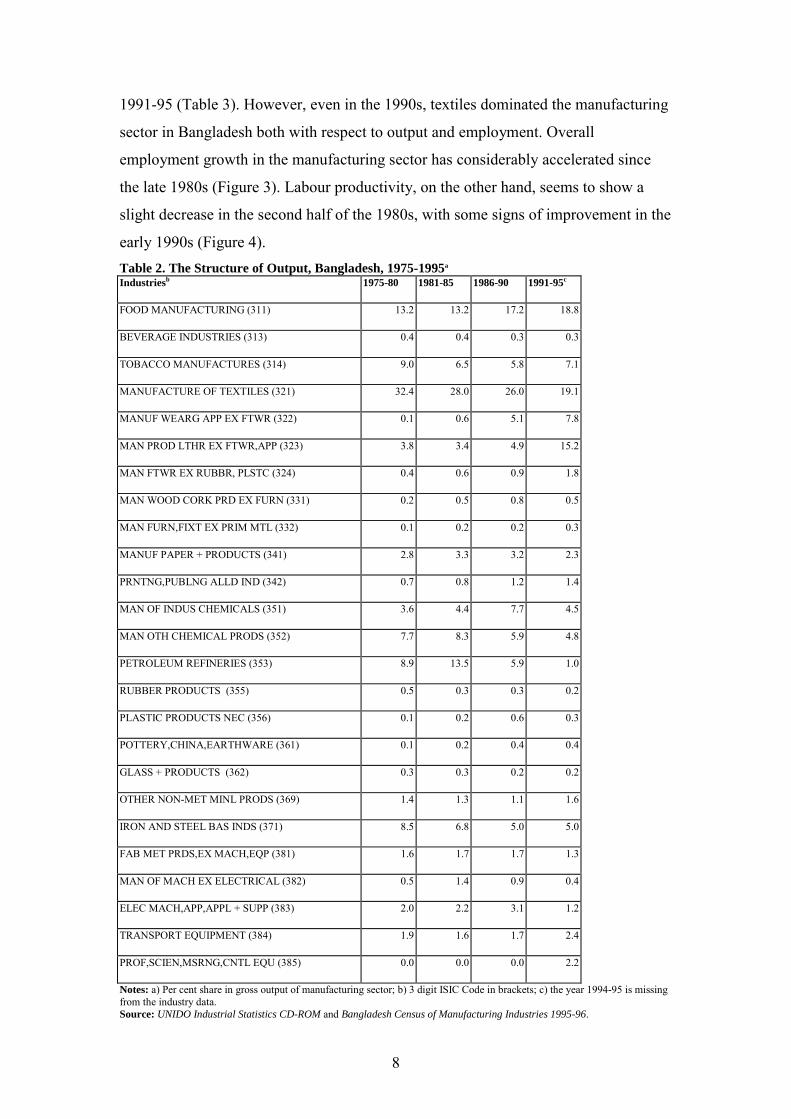
Bangladesh: There has been a marginal increase in the share of the manufacturing
sector in GDP from 12.5 per cent in 1990 to 15 per cent in 1998 (Asian Development
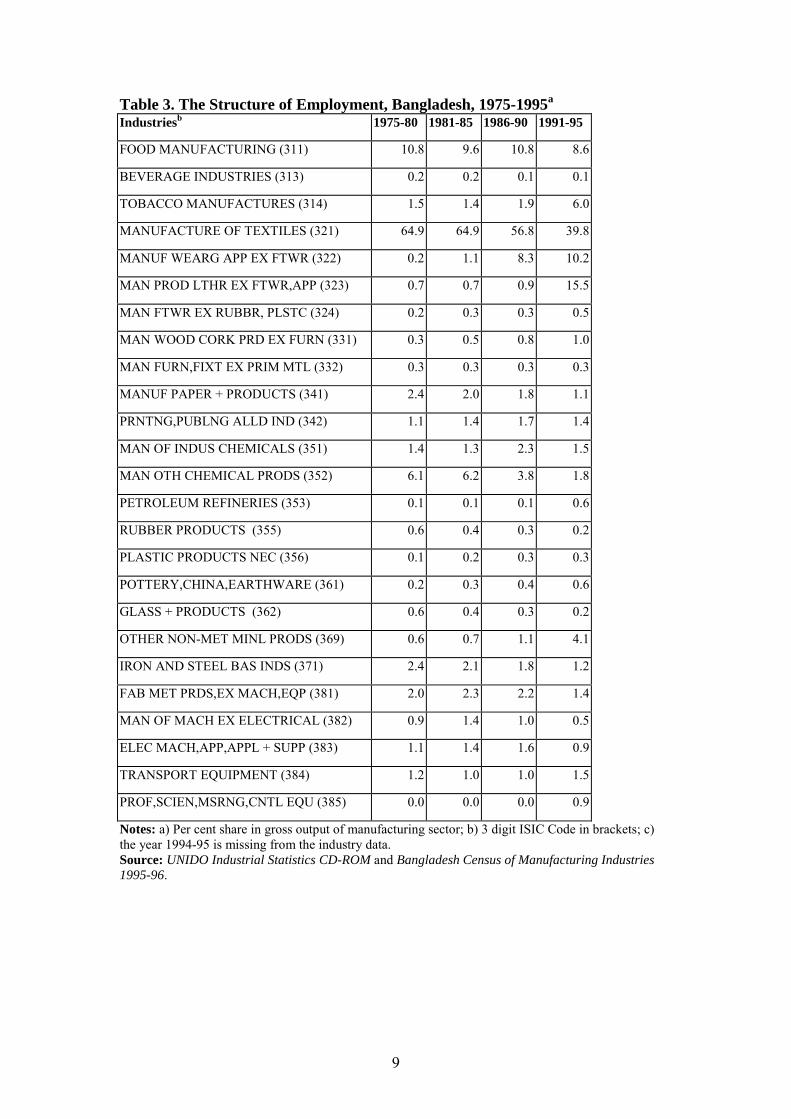
Bank 2000). Within manufacturing, the most dramatic change has been a sharp
decline in the share of textiles from 32.4 per cent in 1975-80 to 19.1 per cent in 1991-
95 in total output, and from 64.9 per cent in 1975-80 to 39.8 per cent in 1991-95 in
total employment (Tables 2 and 3). Food manufacturing, manufacture of wearing
apparel and manufacture of leather products have increased their shares of output in
the period 1975-1995, and in the case of wearing apparel and leather products, there
has also been a dramatic increase in their shares of total employment in the period
0.0
10.0
20.0
30.0
40.0
50.0
60.0
70.0
80.0
1975
1976
1977
1978
1979
1980
1981
1982
1983
1984
1985
1986
1987
1988
1989
1990
1991
1992
1993
1994
1995
1996
1997
1998
1999
Year
as p
er c
ent o
f GD
P
Open-nessExports Imports
8
1991-95 (Table 3). However, even in the 1990s, textiles dominated the manufacturing
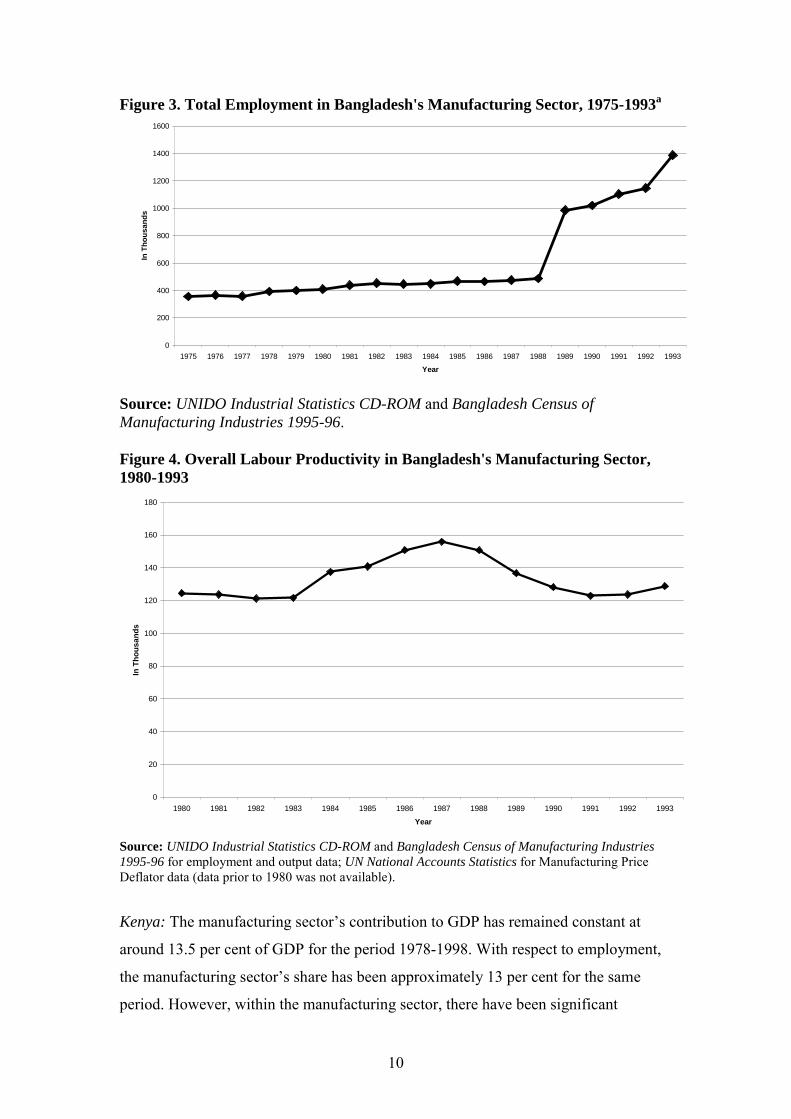
sector in Bangladesh both with respect to output and employment. Overall
employment growth in the manufacturing sector has considerably accelerated since
the late 1980s (Figure 3). Labour productivity, on the other hand, seems to show a
slight decrease in the second half of the 1980s, with some signs of improvement in the
early 1990s (Figure 4).Table 2. The Structure of Output, Bangladesh, 1975-1995a
Industriesb 1975-80 1981-85 1986-90 1991-95c
FOOD MANUFACTURING (311) 13.2 13.2 17.2 18.8
BEVERAGE INDUSTRIES (313) 0.4 0.4 0.3 0.3
TOBACCO MANUFACTURES (314) 9.0 6.5 5.8 7.1
MANUFACTURE OF TEXTILES (321) 32.4 28.0 26.0 19.1
MANUF WEARG APP EX FTWR (322) 0.1 0.6 5.1 7.8
MAN PROD LTHR EX FTWR,APP (323) 3.8 3.4 4.9 15.2
MAN FTWR EX RUBBR, PLSTC (324) 0.4 0.6 0.9 1.8
MAN WOOD CORK PRD EX FURN (331) 0.2 0.5 0.8 0.5
MAN FURN,FIXT EX PRIM MTL (332) 0.1 0.2 0.2 0.3
MANUF PAPER + PRODUCTS (341) 2.8 3.3 3.2 2.3
PRNTNG,PUBLNG ALLD IND (342) 0.7 0.8 1.2 1.4
MAN OF INDUS CHEMICALS (351) 3.6 4.4 7.7 4.5
MAN OTH CHEMICAL PRODS (352) 7.7 8.3 5.9 4.8
PETROLEUM REFINERIES (353) 8.9 13.5 5.9 1.0
RUBBER PRODUCTS (355) 0.5 0.3 0.3 0.2
PLASTIC PRODUCTS NEC (356) 0.1 0.2 0.6 0.3
POTTERY,CHINA,EARTHWARE (361) 0.1 0.2 0.4 0.4
GLASS + PRODUCTS (362) 0.3 0.3 0.2 0.2
OTHER NON-MET MINL PRODS (369) 1.4 1.3 1.1 1.6
IRON AND STEEL BAS INDS (371) 8.5 6.8 5.0 5.0
FAB MET PRDS,EX MACH,EQP (381) 1.6 1.7 1.7 1.3
MAN OF MACH EX ELECTRICAL (382) 0.5 1.4 0.9 0.4
ELEC MACH,APP,APPL + SUPP (383) 2.0 2.2 3.1 1.2
TRANSPORT EQUIPMENT (384) 1.9 1.6 1.7 2.4
PROF,SCIEN,MSRNG,CNTL EQU (385) 0.0 0.0 0.0 2.2
Notes: a) Per cent share in gross output of manufacturing sector; b) 3 digit ISIC Code in brackets; c) the year 1994-95 is missingfrom the industry data.Source: UNIDO Industrial Statistics CD-ROM and Bangladesh Census of Manufacturing Industries 1995-96.
9
Table 3. The Structure of Employment, Bangladesh, 1975-1995a
Industriesb 1975-80 1981-85 1986-90 1991-95
FOOD MANUFACTURING (311) 10.8 9.6 10.8 8.6
BEVERAGE INDUSTRIES (313) 0.2 0.2 0.1 0.1
TOBACCO MANUFACTURES (314) 1.5 1.4 1.9 6.0
MANUFACTURE OF TEXTILES (321) 64.9 64.9 56.8 39.8
MANUF WEARG APP EX FTWR (322) 0.2 1.1 8.3 10.2
MAN PROD LTHR EX FTWR,APP (323) 0.7 0.7 0.9 15.5
MAN FTWR EX RUBBR, PLSTC (324) 0.2 0.3 0.3 0.5
MAN WOOD CORK PRD EX FURN (331) 0.3 0.5 0.8 1.0
MAN FURN,FIXT EX PRIM MTL (332) 0.3 0.3 0.3 0.3
MANUF PAPER + PRODUCTS (341) 2.4 2.0 1.8 1.1
PRNTNG,PUBLNG ALLD IND (342) 1.1 1.4 1.7 1.4
MAN OF INDUS CHEMICALS (351) 1.4 1.3 2.3 1.5
MAN OTH CHEMICAL PRODS (352) 6.1 6.2 3.8 1.8
PETROLEUM REFINERIES (353) 0.1 0.1 0.1 0.6
RUBBER PRODUCTS (355) 0.6 0.4 0.3 0.2
PLASTIC PRODUCTS NEC (356) 0.1 0.2 0.3 0.3
POTTERY,CHINA,EARTHWARE (361) 0.2 0.3 0.4 0.6
GLASS + PRODUCTS (362) 0.6 0.4 0.3 0.2
OTHER NON-MET MINL PRODS (369) 0.6 0.7 1.1 4.1
IRON AND STEEL BAS INDS (371) 2.4 2.1 1.8 1.2
FAB MET PRDS,EX MACH,EQP (381) 2.0 2.3 2.2 1.4
MAN OF MACH EX ELECTRICAL (382) 0.9 1.4 1.0 0.5
ELEC MACH,APP,APPL + SUPP (383) 1.1 1.4 1.6 0.9
TRANSPORT EQUIPMENT (384) 1.2 1.0 1.0 1.5
PROF,SCIEN,MSRNG,CNTL EQU (385) 0.0 0.0 0.0 0.9
Notes: a) Per cent share in gross output of manufacturing sector; b) 3 digit ISIC Code in brackets; c)the year 1994-95 is missing from the industry data.Source: UNIDO Industrial Statistics CD-ROM and Bangladesh Census of Manufacturing Industries1995-96.
10
Figure 3. Total Employment in Bangladesh's Manufacturing Sector, 1975-1993a
Source: UNIDO Industrial Statistics CD-ROM and Bangladesh Census ofManufacturing Industries 1995-96.
Figure 4. Overall Labour Productivity in Bangladesh's Manufacturing Sector,1980-1993
Source: UNIDO Industrial Statistics CD-ROM and Bangladesh Census of Manufacturing Industries1995-96 for employment and output data; UN National Accounts Statistics for Manufacturing PriceDeflator data (data prior to 1980 was not available).
Kenya: The manufacturing sector’s contribution to GDP has remained constant at
around 13.5 per cent of GDP for the period 1978-1998. With respect to employment,
the manufacturing sector’s share has been approximately 13 per cent for the same
period. However, within the manufacturing sector, there have been significant
0
200
400
600
800
1000
1200
1400
1600
1975 1976 1977 1978 1979 1980 1981 1982 1983 1984 1985 1986 1987 1988 1989 1990 1991 1992 1993
Year
In T
hous
ands
0
20
40
60
80
100
120
140
160
180
1980 1981 1982 1983 1984 1985 1986 1987 1988 1989 1990 1991 1992 1993Year
In T
hous
ands
11
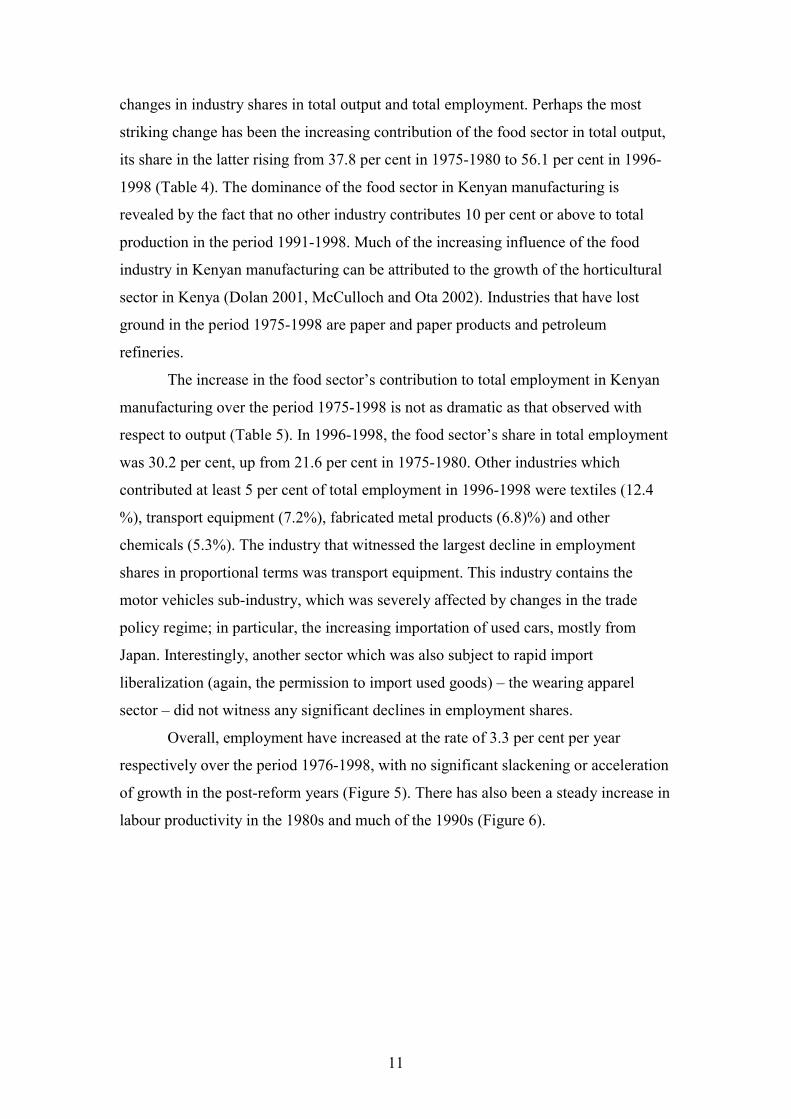
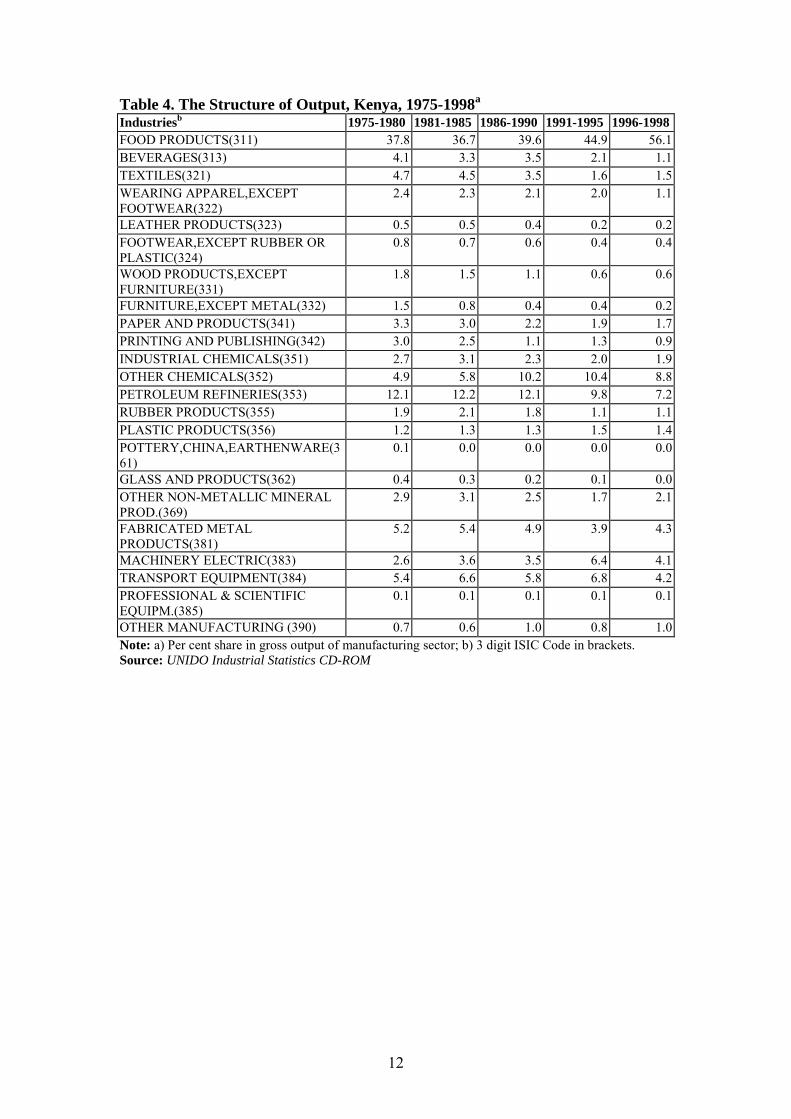
changes in industry shares in total output and total employment. Perhaps the most
striking change has been the increasing contribution of the food sector in total output,
its share in the latter rising from 37.8 per cent in 1975-1980 to 56.1 per cent in 1996-
1998 (Table 4). The dominance of the food sector in Kenyan manufacturing is
revealed by the fact that no other industry contributes 10 per cent or above to total
production in the period 1991-1998. Much of the increasing influence of the food
industry in Kenyan manufacturing can be attributed to the growth of the horticultural
sector in Kenya (Dolan 2001, McCulloch and Ota 2002). Industries that have lost
ground in the period 1975-1998 are paper and paper products and petroleum
refineries.
The increase in the food sector’s contribution to total employment in Kenyan
manufacturing over the period 1975-1998 is not as dramatic as that observed with
respect to output (Table 5). In 1996-1998, the food sector’s share in total employment
was 30.2 per cent, up from 21.6 per cent in 1975-1980. Other industries which
contributed at least 5 per cent of total employment in 1996-1998 were textiles (12.4
%), transport equipment (7.2%), fabricated metal products (6.8)%) and other
chemicals (5.3%). The industry that witnessed the largest decline in employment
shares in proportional terms was transport equipment. This industry contains the
motor vehicles sub-industry, which was severely affected by changes in the trade
policy regime; in particular, the increasing importation of used cars, mostly from
Japan. Interestingly, another sector which was also subject to rapid import
liberalization (again, the permission to import used goods) – the wearing apparel
sector – did not witness any significant declines in employment shares.
Overall, employment have increased at the rate of 3.3 per cent per year
respectively over the period 1976-1998, with no significant slackening or acceleration
of growth in the post-reform years (Figure 5). There has also been a steady increase in
labour productivity in the 1980s and much of the 1990s (Figure 6).
12
Table 4. The Structure of Output, Kenya, 1975-1998a
Industriesb 1975-1980 1981-1985 1986-1990 1991-1995 1996-1998FOOD PRODUCTS(311) 37.8 36.7 39.6 44.9 56.1BEVERAGES(313) 4.1 3.3 3.5 2.1 1.1TEXTILES(321) 4.7 4.5 3.5 1.6 1.5WEARING APPAREL,EXCEPTFOOTWEAR(322)
2.4 2.3 2.1 2.0 1.1
LEATHER PRODUCTS(323) 0.5 0.5 0.4 0.2 0.2FOOTWEAR,EXCEPT RUBBER ORPLASTIC(324)
0.8 0.7 0.6 0.4 0.4
WOOD PRODUCTS,EXCEPTFURNITURE(331)
1.8 1.5 1.1 0.6 0.6
FURNITURE,EXCEPT METAL(332) 1.5 0.8 0.4 0.4 0.2PAPER AND PRODUCTS(341) 3.3 3.0 2.2 1.9 1.7PRINTING AND PUBLISHING(342) 3.0 2.5 1.1 1.3 0.9INDUSTRIAL CHEMICALS(351) 2.7 3.1 2.3 2.0 1.9OTHER CHEMICALS(352) 4.9 5.8 10.2 10.4 8.8PETROLEUM REFINERIES(353) 12.1 12.2 12.1 9.8 7.2RUBBER PRODUCTS(355) 1.9 2.1 1.8 1.1 1.1PLASTIC PRODUCTS(356) 1.2 1.3 1.3 1.5 1.4POTTERY,CHINA,EARTHENWARE(361)
0.1 0.0 0.0 0.0 0.0
GLASS AND PRODUCTS(362) 0.4 0.3 0.2 0.1 0.0OTHER NON-METALLIC MINERALPROD.(369)
2.9 3.1 2.5 1.7 2.1
FABRICATED METALPRODUCTS(381)
5.2 5.4 4.9 3.9 4.3
MACHINERY ELECTRIC(383) 2.6 3.6 3.5 6.4 4.1TRANSPORT EQUIPMENT(384) 5.4 6.6 5.8 6.8 4.2PROFESSIONAL & SCIENTIFICEQUIPM.(385)
0.1 0.1 0.1 0.1 0.1
OTHER MANUFACTURING (390) 0.7 0.6 1.0 0.8 1.0Note: a) Per cent share in gross output of manufacturing sector; b) 3 digit ISIC Code in brackets.Source: UNIDO Industrial Statistics CD-ROM

13
Table 5. The Structure of Employment, Kenya, 1975-1998a
Industriesb1975-1980 1981-1985 1986-1990 1991-1995 1996-1998
FOOD PRODUCTS(311) 21.6 23.9 27.2 28.8 30.2BEVERAGES(313) 3.8 3.7 3.7 4.3 3.6TEXTILES(321) 13.4 14.6 14.3 9.7 12.4WEARING APPAREL,EXCEPTFOOTWEAR(322)
4.0 4.6 4.3 2.6 3.6
LEATHER PRODUCTS(323) 1.2 0.8 0.8 1.0 0.9FOOTWEAR,EXCEPT RUBBER ORPLASTIC(324)
1.6 1.4 1.3 2.8 1.2
WOOD PRODUCTS,EXCEPTFURNITURE(331)
6.8 5.9 5.0 3.7 4.7
FURNITURE,EXCEPT METAL(332) 2.3 2.1 2.2 3.0 2.1PAPER AND PRODUCTS(341) 2.9 2.8 3.8 3.9 4.0PRINTING AND PUBLISHING(342) 3.4 3.3 3.5 2.8 3.4INDUSTRIAL CHEMICALS(351) 1.8 2.1 2.0 3.4 2.0OTHER CHEMICALS(352) 3.7 4.2 4.5 3.0 5.3PETROLEUM REFINERIES(353) 0.3 0.2 0.2 0.1 0.1RUBBER PRODUCTS(355) 1.3 1.2 1.2 1.8 1.3PLASTIC PRODUCTS(356) 1.4 1.3 1.5 1.3 2.4POTTERY,CHINA,EARTHENWARE(361)
0.1 0.1 0.1 0.4 0.1
GLASS AND PRODUCTS(362) 0.7 0.8 0.8 1.8 0.8OTHER NON-METALLIC MINERALPROD.(369)
3.2 2.8 3.0 3.1 3.1
FABRICATED METALPRODUCTS(381)
6.7 6.6 6.3 6.9 6.8
MACHINERY ELECTRIC(383) 4.1 4.3 1.7 1.6 1.6TRANSPORT EQUIPMENT(384) 14.3 11.4 9.8 8.7 7.2PROFESSIONAL & SCIENTIFICEQUIPM.(385)
0.1 0.1 0.1 0.1 0.2
OTHER MANUFACTURING (390) 1.0 1.1 1.6 1.9 1.8Notes: a) Per cent share in gross output of manufacturing sector; b) 3 digit ISIC Code in brackets.Source: UNIDO Industrial Statistics CD-ROM

14
Figure 5. Total Employment in Kenya’s Manufacturing Sector, 1975-1998a
Source: UNIDO Industrial Statistics CD-ROM
Figure 6. Overall Labour Productivity in Kenya's Manufacturing Sector, 1975-1998
Source: UNIDO Industrial Statistics CD-ROM for employment and output data andStatistical Abstract, Government of Kenya, various issues, for Manufacturing PriceDeflator data.
0
5
10
15
20
25
30
35
40
45
1975 1976 1977 1978 1979 1980 1981 1982 1983 1984 1985 1986 1987 1988 1989 1990 1991 1992 1993 1994 1995 1996 1997 1998Year
In T
hous
ands
0
50
100
150
200
250
1975 1976 1977 1978 1979 1980 1981 1982 1983 1984 1985 1986 1987 1988 1989 1990 1991 1992 1993 1994 1995 1996 1997 1998Year
In T
hous
ands
15
IV. The Factor-Content of Exports and Imports
This section examines the changing factor content of exports and imports in
Bangladesh and Kenya, with a view to identifying the significance of labour-intensive
exports, as opposed to other types of manufactured exports and the way in which this
has changed over time. In order to do so, we have applied Krause’s (1988)
classification of ISIC manufacturing industries according to their dominant factor
input.4 This distinguishes between natural resource intensive, labour intensive,
technology intensive and human capital intensive industries. The natural resource
intensive industries are further sub-divided into agricultural and mineral-based
industries.
Bangladesh: There has been a significant shift into unskilled labour-intensive exports
from agricultural resource intensive exports over the period 1976-1998 (Table 6). The
change in the structure of exports occurred mostly in the 1990s, when total
manufacturing exports increase four fold from $981 million in 1976-80 to $4008
million in 1996-98. By the latter period, unskilled labour intensive exports comprised
around 90 per cent of total manufacturing exports. Much of the exports in this
category was wearing apparel (ISIC 322), which formed 72 per cent of total
manufacturing exports in 1996-98, as compared to 0.08 per cent in 1976-80. This
expansion in ready-made garments was made possible to a great extent by preferential
treatment accorded to Bangladesh’s exports by the European Union under the GSP
scheme, and the substantial quotas made available in the US market, coupled with the
imposition of quota restrictions by the MFA on Bangladesh’s main competitors,
mainly China and India (Spinanger and Wogart 2000).
It is interesting to note, though, that there has also been an increase in the
unskilled labour component of manufacturing imports over the same period (Table 7).
In fact, unskilled labour intensive imports had the largest share in total imports (35.6
per cent) in 1996-98, as compared to the next highest – technology-intensive imports
(24.6 per cent). The increase in unskilled labour intensive imports was due in great
part to the sharp increase in the importation of textiles required for the garments
4 The trade data comes from the International Economic Database of the Australian National Universityand has been reclassified from COMTRADE data according to the International Standard IndustrialClassification (ISIC Rev. 2). Because the trade data is only available at the four digit level and in asmall number of cases, Krause uses a five digit classification, we have had to slightly modify hisgroupings.
16
industry, and as we have seen in Section 3, textiles have been the dominant sector in
employment in Bangladesh over the past two decades. This implies that in spite of
Bangladesh’s impressive performance in ready-made garments, it is not obvious that
net employment effects of Bangladesh’s increasing integration with the world
economy have been positive.
To examine the impact of exports and imports on employment, we derive
employment coefficients at the industry level which is then weighted by the share of
each industry in exports and imports. Since the major export industry, the ready-made
garments sector, is female labour intensive, the employment coefficients are
calculated separately for female and male labour (we use 4 digit industry data from
1992, the most recent year for which such data was available). The employment
coefficients are presented in Table 8.5 We find that exports are significantly female
labour intensive than imports; however, the employment coefficient for male labour is
greater for imports than for exports. In the aggregate, the employment coefficient for
exports is marginally higher at 254 versus 226 for imports. This confirms our earlier
finding that the structure of exports in Bangladesh has not been necessarily more
labour-intensive than the structure of its imports, at least till the early 1990s.
Kenya: As noted earlier, Kenya has been a reluctant liberaliser, with slow and uneven
progress in trade reforms. This is also evident in the structure of exports, which does
not display great change over 1976-1998 (Table 6). Agricultural resource intensive
exports remain the most important category of exports, with a share of 64.7 per cent in
total manufacturing exports in 1996-1998. There has been a slight increase in
unskilled labour intensive exports from 4.8 per cent in 1976-80 to 15.8 per cent in
1996-1998. Total manufacturing exports also do not show signs of growth – the
growth rate was 1.9 per cent per annum in 1991-1998 as compared to 7.6 per cent per
annum in 1976-1990.
The structure of imports also does not show significant change in the period under
consideration, with technology and human capital intensive imports remaining the
dominant two components of total manufacturing imports (Table 7). As in the case of
Bangladesh, exports are more female labour intensive than imports, while for male
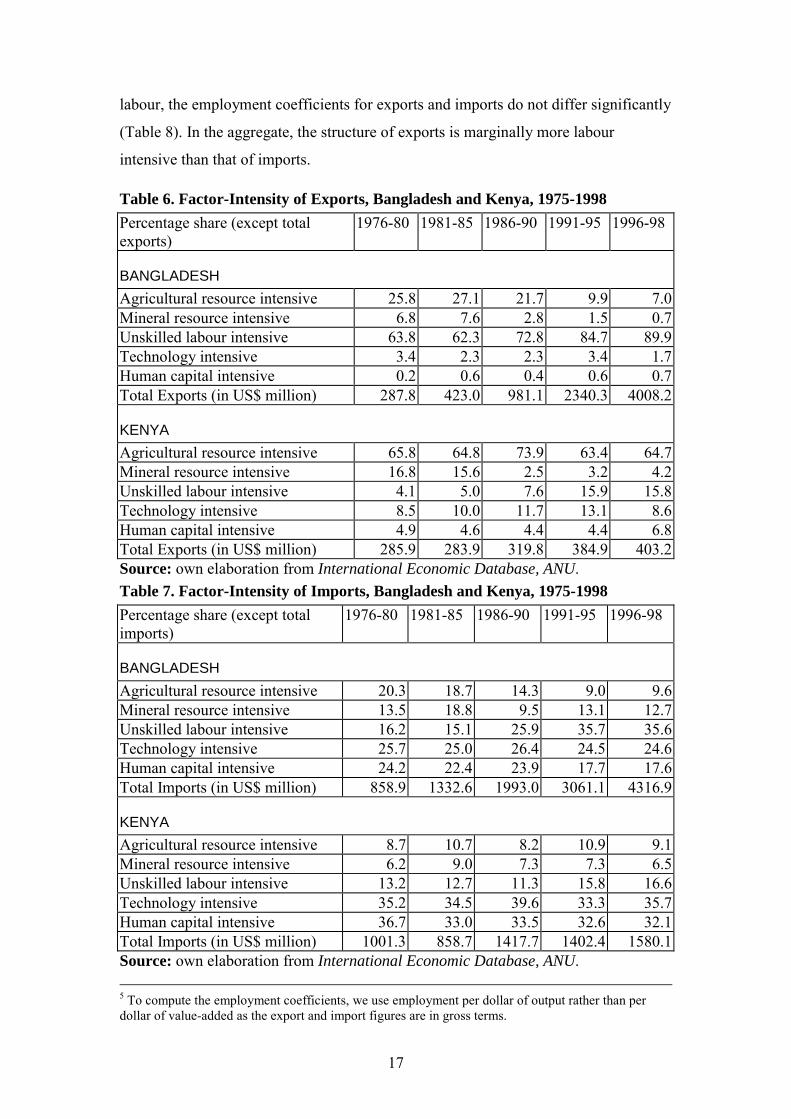
17
labour, the employment coefficients for exports and imports do not differ significantly
(Table 8). In the aggregate, the structure of exports is marginally more labour
intensive than that of imports.
Table 6. Factor-Intensity of Exports, Bangladesh and Kenya, 1975-1998Percentage share (except totalexports)
1976-80 1981-85 1986-90 1991-95 1996-98
BANGLADESHAgricultural resource intensive 25.8 27.1 21.7 9.9 7.0Mineral resource intensive 6.8 7.6 2.8 1.5 0.7Unskilled labour intensive 63.8 62.3 72.8 84.7 89.9Technology intensive 3.4 2.3 2.3 3.4 1.7Human capital intensive 0.2 0.6 0.4 0.6 0.7Total Exports (in US$ million) 287.8 423.0 981.1 2340.3 4008.2
KENYAAgricultural resource intensive 65.8 64.8 73.9 63.4 64.7Mineral resource intensive 16.8 15.6 2.5 3.2 4.2Unskilled labour intensive 4.1 5.0 7.6 15.9 15.8Technology intensive 8.5 10.0 11.7 13.1 8.6Human capital intensive 4.9 4.6 4.4 4.4 6.8Total Exports (in US$ million) 285.9 283.9 319.8 384.9 403.2Source: own elaboration from International Economic Database, ANU.Table 7. Factor-Intensity of Imports, Bangladesh and Kenya, 1975-1998Percentage share (except totalimports)
1976-80 1981-85 1986-90 1991-95 1996-98
BANGLADESHAgricultural resource intensive 20.3 18.7 14.3 9.0 9.6Mineral resource intensive 13.5 18.8 9.5 13.1 12.7Unskilled labour intensive 16.2 15.1 25.9 35.7 35.6Technology intensive 25.7 25.0 26.4 24.5 24.6Human capital intensive 24.2 22.4 23.9 17.7 17.6Total Imports (in US$ million) 858.9 1332.6 1993.0 3061.1 4316.9
KENYAAgricultural resource intensive 8.7 10.7 8.2 10.9 9.1Mineral resource intensive 6.2 9.0 7.3 7.3 6.5Unskilled labour intensive 13.2 12.7 11.3 15.8 16.6Technology intensive 35.2 34.5 39.6 33.3 35.7Human capital intensive 36.7 33.0 33.5 32.6 32.1Total Imports (in US$ million) 1001.3 858.7 1417.7 1402.4 1580.1Source: own elaboration from International Economic Database, ANU. 5 To compute the employment coefficients, we use employment per dollar of output rather than perdollar of value-added as the export and import figures are in gross terms.

18
Table 8. Employment Coefficients of Imports and Exports, Bangladesh andKenyaBANGLADESHEmployment Coefficient of Imports and Exports, 1992
Exports ImportsEmployment Coefficient per mn. $ of output
Female 139 6Male 114 221Total 254 226
KENYAEmployment Coefficient of Imports and Exports, 1996
Exports ImportsEmployment Coefficient per mn. $ of output
Female 143 89Male 589 597Total 732 686
Source: own elaboration from International Economic Databank (IEDB), ANU andUNIDO data
V. Growth Accounting
As was seen in Section II, there have been substantial changes in both countries in
terms of openness in recent years. A first stab at estimating the effects of increased
openness on employment can be made using a growth accounting methodology which
divides employment changes over a period of time into that attributable to changes in
domestic demand, exports, import penetration and productivity.
Starting from the basic accounting identity that
Qit = Dit + Xit – Mit
where
Dit is domestic absorption of industry i at time t
Qit is domestic production of industry i at time t
Xit is exports of industry i at time t
Mit is imports of industry i at time t
Employment can be calculated as
Lit = lit(Dit + Xit – Mit)
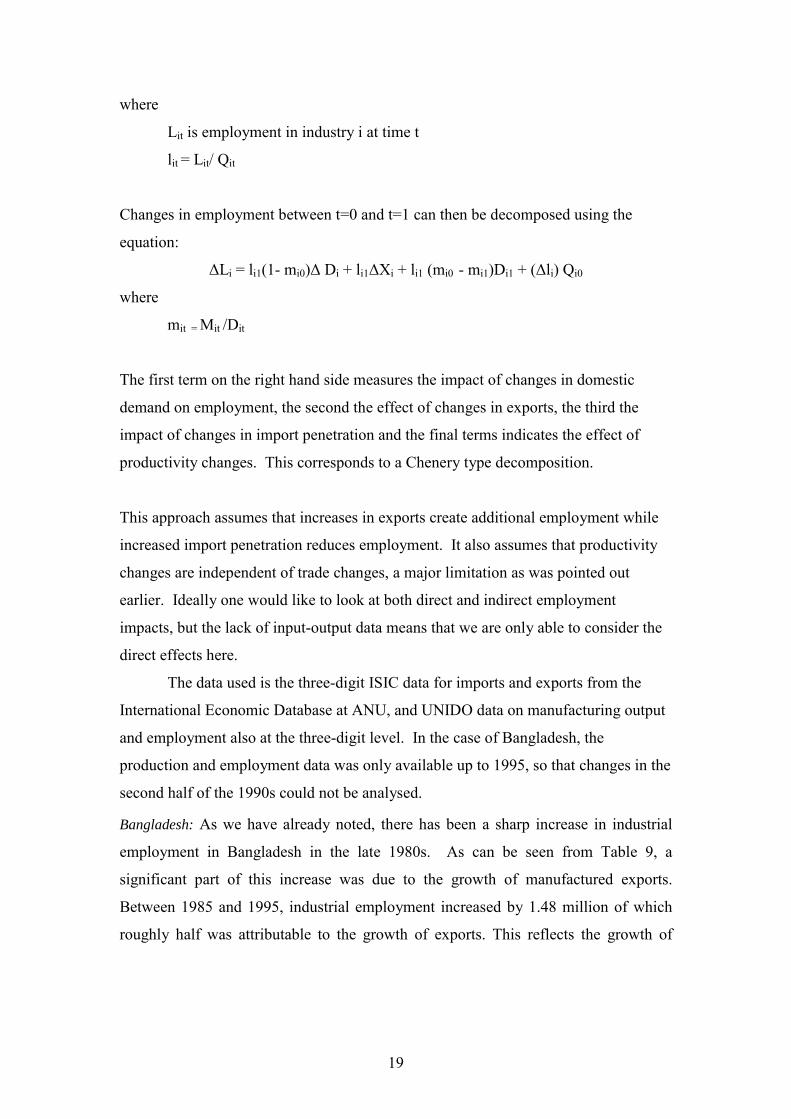
19
where
Lit is employment in industry i at time t
lit = Lit/ Qit
Changes in employment between t=0 and t=1 can then be decomposed using the
equation:
∆Li = li1(1- mi0)∆ Di + li1∆Xi + li1 (mi0 - mi1)Di1 + (∆li) Qi0
where
mit = Mit /Dit
The first term on the right hand side measures the impact of changes in domestic
demand on employment, the second the effect of changes in exports, the third the
impact of changes in import penetration and the final terms indicates the effect of
productivity changes. This corresponds to a Chenery type decomposition.
This approach assumes that increases in exports create additional employment while
increased import penetration reduces employment. It also assumes that productivity
changes are independent of trade changes, a major limitation as was pointed out
earlier. Ideally one would like to look at both direct and indirect employment
impacts, but the lack of input-output data means that we are only able to consider the
direct effects here.
The data used is the three-digit ISIC data for imports and exports from the
International Economic Database at ANU, and UNIDO data on manufacturing output
and employment also at the three-digit level. In the case of Bangladesh, the
production and employment data was only available up to 1995, so that changes in the
second half of the 1990s could not be analysed.
Bangladesh: As we have already noted, there has been a sharp increase in industrial
employment in Bangladesh in the late 1980s. As can be seen from Table 9, a
significant part of this increase was due to the growth of manufactured exports.
Between 1985 and 1995, industrial employment increased by 1.48 million of which
roughly half was attributable to the growth of exports. This reflects the growth of
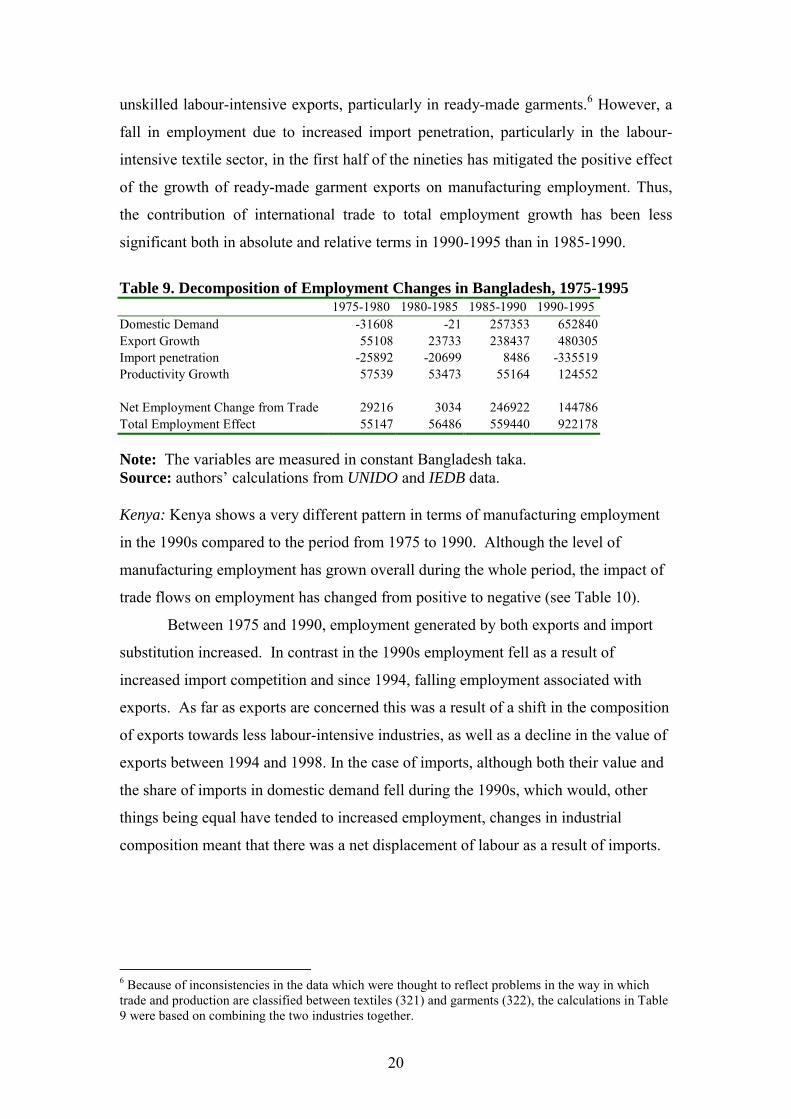
20
unskilled labour-intensive exports, particularly in ready-made garments.6 However, a
fall in employment due to increased import penetration, particularly in the labour-
intensive textile sector, in the first half of the nineties has mitigated the positive effect
of the growth of ready-made garment exports on manufacturing employment. Thus,
the contribution of international trade to total employment growth has been less
significant both in absolute and relative terms in 1990-1995 than in 1985-1990.
Table 9. Decomposition of Employment Changes in Bangladesh, 1975-19951975-1980 1980-1985 1985-1990 1990-1995
Domestic Demand -31608 -21 257353 652840Export Growth 55108 23733 238437 480305Import penetration -25892 -20699 8486 -335519Productivity Growth 57539 53473 55164 124552
Net Employment Change from Trade 29216 3034 246922 144786Total Employment Effect 55147 56486 559440 922178
Note: The variables are measured in constant Bangladesh taka.Source: authors’ calculations from UNIDO and IEDB data.
Kenya: Kenya shows a very different pattern in terms of manufacturing employment
in the 1990s compared to the period from 1975 to 1990. Although the level of
manufacturing employment has grown overall during the whole period, the impact of
trade flows on employment has changed from positive to negative (see Table 10).
Between 1975 and 1990, employment generated by both exports and import
substitution increased. In contrast in the 1990s employment fell as a result of
increased import competition and since 1994, falling employment associated with
exports. As far as exports are concerned this was a result of a shift in the composition
of exports towards less labour-intensive industries, as well as a decline in the value of
exports between 1994 and 1998. In the case of imports, although both their value and
the share of imports in domestic demand fell during the 1990s, which would, other
things being equal have tended to increased employment, changes in industrial
composition meant that there was a net displacement of labour as a result of imports.
6 Because of inconsistencies in the data which were thought to reflect problems in the way in whichtrade and production are classified between textiles (321) and garments (322), the calculations in Table9 were based on combining the two industries together.
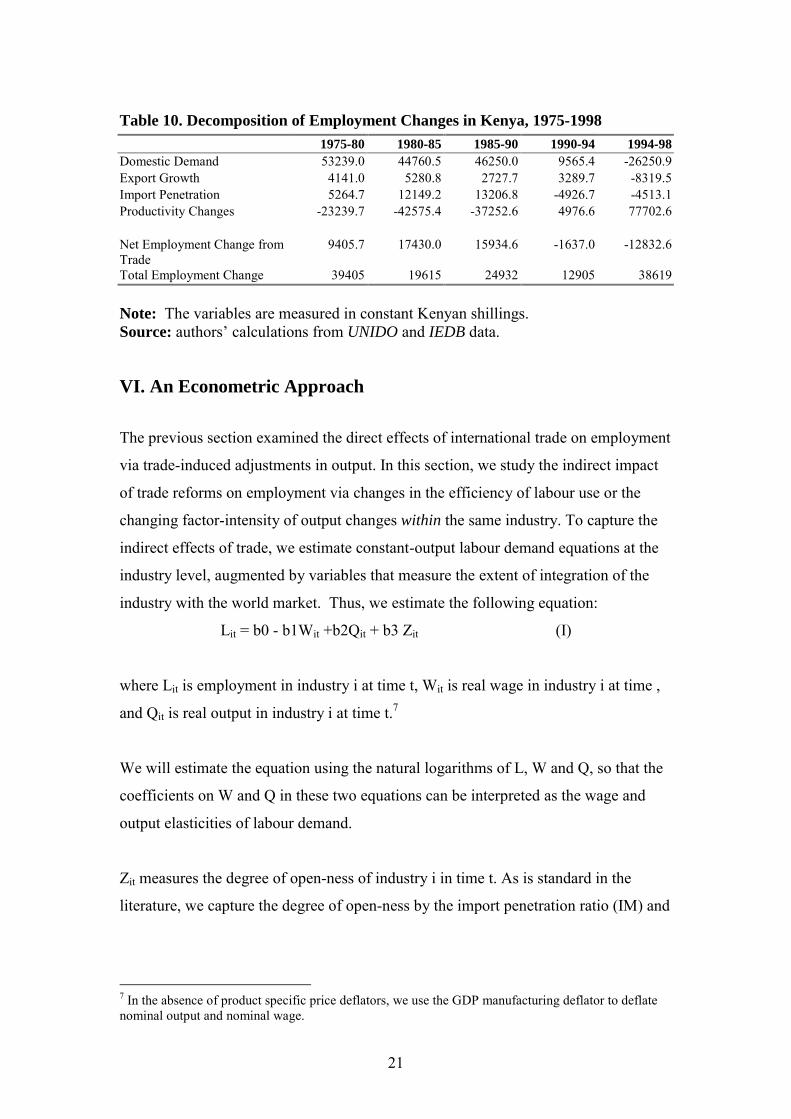
21
Table 10. Decomposition of Employment Changes in Kenya, 1975-19981975-80 1980-85 1985-90 1990-94 1994-98
Domestic Demand 53239.0 44760.5 46250.0 9565.4 -26250.9Export Growth 4141.0 5280.8 2727.7 3289.7 -8319.5Import Penetration 5264.7 12149.2 13206.8 -4926.7 -4513.1Productivity Changes -23239.7 -42575.4 -37252.6 4976.6 77702.6
Net Employment Change fromTrade
9405.7 17430.0 15934.6 -1637.0 -12832.6
Total Employment Change 39405 19615 24932 12905 38619
Note: The variables are measured in constant Kenyan shillings.Source: authors’ calculations from UNIDO and IEDB data.
VI. An Econometric Approach
The previous section examined the direct effects of international trade on employment
via trade-induced adjustments in output. In this section, we study the indirect impact
of trade reforms on employment via changes in the efficiency of labour use or the
changing factor-intensity of output changes within the same industry. To capture the
indirect effects of trade, we estimate constant-output labour demand equations at the
industry level, augmented by variables that measure the extent of integration of the
industry with the world market. Thus, we estimate the following equation:
Lit = b0 - b1Wit +b2Qit + b3 Zit (I)
where Lit is employment in industry i at time t, Wit is real wage in industry i at time ,
and Qit is real output in industry i at time t.7
We will estimate the equation using the natural logarithms of L, W and Q, so that the
coefficients on W and Q in these two equations can be interpreted as the wage and
output elasticities of labour demand.
Zit measures the degree of open-ness of industry i in time t. As is standard in the
literature, we capture the degree of open-ness by the import penetration ratio (IM) and
7 In the absence of product specific price deflators, we use the GDP manufacturing deflator to deflatenominal output and nominal wage.
22
the export-output ratio (EO) defined at the industry level (Hine and Wright 1998).8
The use of these two variables also allows us to separate the effects of import
competition from export orientation on the efficiency of labour use. The exports and
imports data is obtained from the International Economic Databank at the Australian
National University.
The equations are estimated using a pooled dataset drawn from the UNIDO’s
industrial statistics that provides data on output, employment and wages both at the
ISIC three digit and four digit levels from the 1970s. The industry data for Bangladesh
is available at the ISIC 4 digit level for 1982-1992 and allows us to construct a panel
of 660 observations, the panel comprising 60 industries over 11 years. In case of
Kenya, data at the ISIC 4 digit level is not available, but the ISIC 3 digit data is
available for the 1980s and much of the 1990s – the number of industries included in
the panel is 21, and the period of analysis is 1982-1998 (the number of observations is
374).
One econometric problem we face in estimating equation (I) is the possibility
of a high degree of measurement error in the import penetration and export orientation
variables. This is because the output data used in the denominator comes from the
Industrial Census while the trade data used in the numerator (and in the case of IM,
also in the denominator) comes from the Customs or the Directorate of Trade.
Usually, the coverage of the latter is more comprehensive than the coverage of the
former, as the Industrial Census often omits small scale enterprises operating in the
‘informal sector’ (the jua kali sector in Kenya) who may be engaged in international
trade. Thus, inconsistencies in the coverage of the manufacturing sector in the
production and trade data would lead to measurement errors in IM and EO. One way
of addressing this problem is to take first differences of all variables, both dependent
and independent, in equation (I). Under the assumption that the coverage of the
manufacturing sector in the Industrial Census would not change appreciably over
time, first-differencing would give more precise estimates of IM and EO as compared
to using the levels of the latter two variables in the regressions..9
8 We define the import penetration ratio for a particular industry as its imports as a ratio of domesticdemand (i.e, imports+output-exports); while the export-orientation ratio is exports as a ratio of output.9 To see this, suppose the coverage of imports and exports is comprehensive while that for output is not(a defensible assumption, as we have noted earlier). Let q1 be that part of output that is not captured inthe Industrial Census. Let q2 be the output that is reported in the Industrial Census. Then, EO=X/Q,where X is exports and Q is output, and Q=q1+q2. Taking log first differences, we get:
23
In our estimation procedure, we also introduce industry-specific dummies to
control for unobservable time-invariant differences in across industries (such as in the
rate of technological progress). We experiment with both current and one year lagged
values of W, IM and EO, given the short run rigidities in adjusting employment in a
given year. The regression results for Bangladesh are presented in Table 11 and those
for Kenya in Table 12. In Column 1, we present estimates of the standard labour
demand equation without incorporating the open-ness variables. Column 2 reports the
augmented labour demand equation with the import penetration and export orientation
variables included together. In Columns 3 and 4, we augment the labour demand
equation by including the import penetration and export orientation ratios separately
to incorporate concerns regarding the possible multicollinearity of the two open-ness
variables. In Column 5, we present the augmented labour demand equation, with time
dummies included to control for economy-wide shocks to labour demand (structural
adjustment programmes would fall into this category).
We first discuss the results for Bangladesh (Table 11). From Col. 1, it is clear
that the coefficients on real output and real wage have the expected signs and are
statistically significant. A one per cent increase in output leads to a 0.87 per cent
increase in employment, and an one per cent increase in the real wage rate leads to a
fall in employment by 0.04 per cent. Introducing import penetration and export
orientation, we find that both import penetration and export orientation seem to have a
positive effect on employment, with the coefficient on IM statistically significant at
the 5 per cent level and that for EO significant at the 1 per cent level (Col. 2).10 The
results do not change when we introduce IM and EO separately in the regression
(Cols. 3 and 4). Finally, adding time dummies leads to little change in the coefficients
for IM and EO (Col. 5). Thus, there is clear evidence that increased international trade
(whether due to an increase in imports or in exports relative to output) has led to an
increase in employment (for the same level of output) in Bangladesh’s manufacturing
sector. This could possibly be linked to a shift to labour-intensive techniques in a
given industry following higher degrees of import penetration and/or export-
orientation in that industry, rather than falling labour productivity per se.
21 ˆˆˆˆ qqXOE −−= . Then, as long as 1q̂ is significantly less than 2q̂ (that is, q1 is relatively stableover time), the log first difference of EO will be less subject to measurement error compared to thelevel of EO. A similar argument holds for IM.10 The Durbin-Watson (DW) statistics also suggest a lack of serial correlation in the residuals.
24
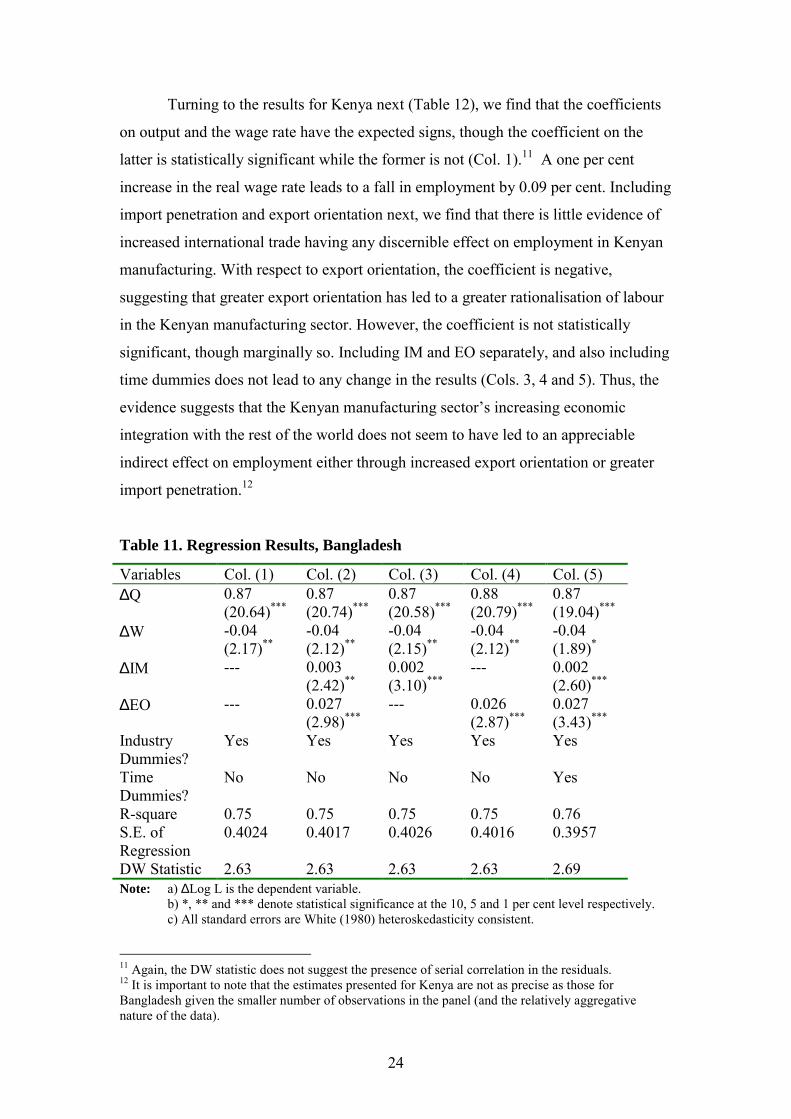
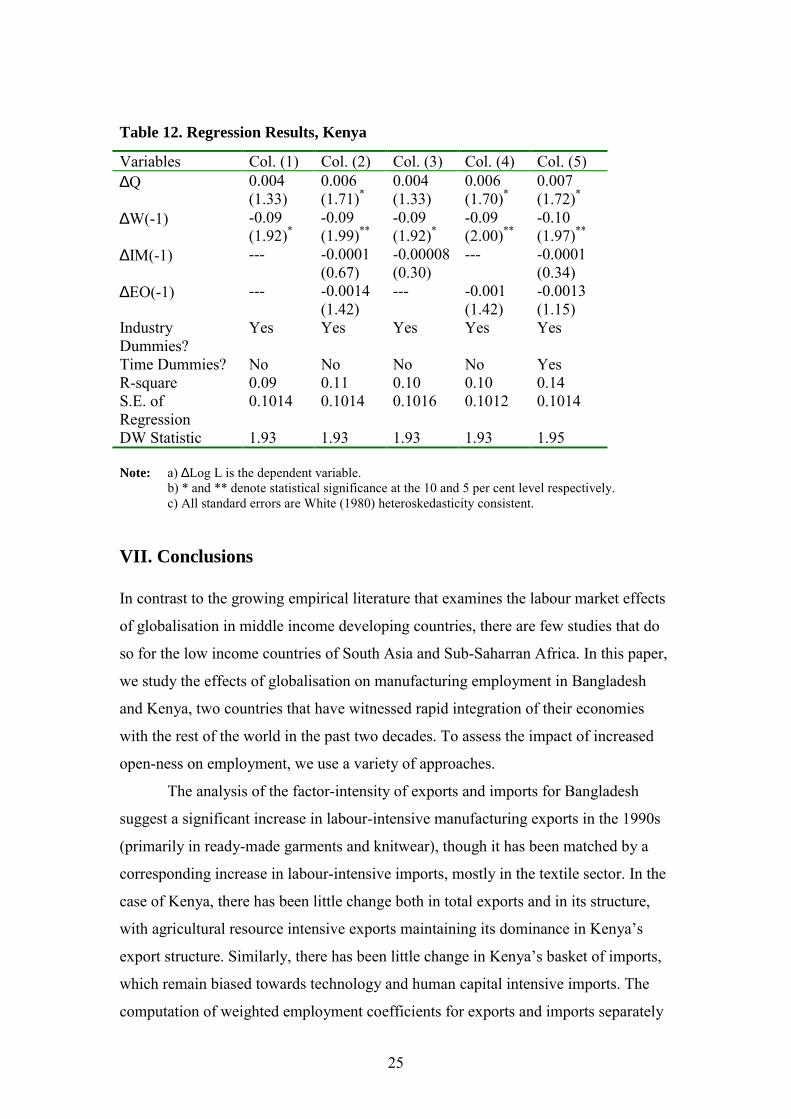
Turning to the results for Kenya next (Table 12), we find that the coefficients
on output and the wage rate have the expected signs, though the coefficient on the
latter is statistically significant while the former is not (Col. 1).11 A one per cent
increase in the real wage rate leads to a fall in employment by 0.09 per cent. Including
import penetration and export orientation next, we find that there is little evidence of
increased international trade having any discernible effect on employment in Kenyan
manufacturing. With respect to export orientation, the coefficient is negative,
suggesting that greater export orientation has led to a greater rationalisation of labour
in the Kenyan manufacturing sector. However, the coefficient is not statistically
significant, though marginally so. Including IM and EO separately, and also including
time dummies does not lead to any change in the results (Cols. 3, 4 and 5). Thus, the
evidence suggests that the Kenyan manufacturing sector’s increasing economic
integration with the rest of the world does not seem to have led to an appreciable
indirect effect on employment either through increased export orientation or greater
import penetration.12
Table 11. Regression Results, Bangladesh
Variables Col. (1) Col. (2) Col. (3) Col. (4) Col. (5)∆Q 0.87
(20.64)***0.87(20.74)***
0.87(20.58)***
0.88(20.79)***
0.87(19.04)***
∆W -0.04(2.17)**
-0.04(2.12)**
-0.04(2.15)**
-0.04(2.12)**
-0.04(1.89)*
∆IM --- 0.003(2.42)**
0.002(3.10)***
--- 0.002(2.60)***
∆EO --- 0.027(2.98)***
--- 0.026(2.87)***
0.027(3.43)***
IndustryDummies?
Yes Yes Yes Yes Yes
TimeDummies?
No No No No Yes
R-square 0.75 0.75 0.75 0.75 0.76S.E. ofRegression
0.4024 0.4017 0.4026 0.4016 0.3957
DW Statistic 2.63 2.63 2.63 2.63 2.69Note: a) ∆Log L is the dependent variable.
b) *, ** and *** denote statistical significance at the 10, 5 and 1 per cent level respectively.c) All standard errors are White (1980) heteroskedasticity consistent.
11 Again, the DW statistic does not suggest the presence of serial correlation in the residuals.12 It is important to note that the estimates presented for Kenya are not as precise as those forBangladesh given the smaller number of observations in the panel (and the relatively aggregativenature of the data).
25
Table 12. Regression Results, Kenya
Variables Col. (1) Col. (2) Col. (3) Col. (4) Col. (5)∆Q 0.004
(1.33)0.006(1.71)*
0.004(1.33)
0.006(1.70)*
0.007(1.72)*
∆W(-1) -0.09(1.92)*
-0.09(1.99)**
-0.09(1.92)*
-0.09(2.00)**
-0.10(1.97)**
∆IM(-1) --- -0.0001(0.67)
-0.00008(0.30)
--- -0.0001(0.34)
∆EO(-1) --- -0.0014(1.42)
--- -0.001(1.42)
-0.0013(1.15)
IndustryDummies?
Yes Yes Yes Yes Yes
Time Dummies? No No No No YesR-square 0.09 0.11 0.10 0.10 0.14S.E. ofRegression
0.1014 0.1014 0.1016 0.1012 0.1014
DW Statistic 1.93 1.93 1.93 1.93 1.95
Note: a) ∆Log L is the dependent variable.b) * and ** denote statistical significance at the 10 and 5 per cent level respectively.c) All standard errors are White (1980) heteroskedasticity consistent.
VII. Conclusions
In contrast to the growing empirical literature that examines the labour market effects
of globalisation in middle income developing countries, there are few studies that do
so for the low income countries of South Asia and Sub-Saharran Africa. In this paper,
we study the effects of globalisation on manufacturing employment in Bangladesh
and Kenya, two countries that have witnessed rapid integration of their economies
with the rest of the world in the past two decades. To assess the impact of increased
open-ness on employment, we use a variety of approaches.
The analysis of the factor-intensity of exports and imports for Bangladesh
suggest a significant increase in labour-intensive manufacturing exports in the 1990s
(primarily in ready-made garments and knitwear), though it has been matched by a
corresponding increase in labour-intensive imports, mostly in the textile sector. In the
case of Kenya, there has been little change both in total exports and in its structure,
with agricultural resource intensive exports maintaining its dominance in Kenya’s
export structure. Similarly, there has been little change in Kenya’s basket of imports,
which remain biased towards technology and human capital intensive imports. The
computation of weighted employment coefficients for exports and imports separately
26
for female and male labour for these two countries suggest that exports are more
female labour intensive than imports in both these countries. However, at the
aggregate, the structure of exports is marginally more labour-intensive than imports
for Bangladesh and Kenya.
The decomposition of employment changes to the different components of
output growth and in productivity indicate that in the case of Bangladesh, the
contribution of international trade to total employment growth has been positive,
though less significant both in absolute and relative terms in the first half of the 1990s
(a period which witnessed rapid trade reforms in Bangladesh) than in the second half
of the 1980s. In the case of Kenya, employment fell in the 1990s as a result of import
competition and since 1994, due also to falling exports. Thus, the effect of
international trade on employment has been unambiguously negative in the 1990s in
Kenya.
The estimation of labour demand equations augmented by variables measuring
open-ness allow us to assess the indirect impact of international trade on employment
via changes in technology or the efficiency of labour use. The results indicate that in
the case of Bangladesh, both greater import penetration and export orientation led to
an increase in employment for the same level of output, suggesting the adoption of
more labour-intensive techniques within the same industry in faced of increased open-
ness. However, for Kenya, there is no evidence that increased open-ness led to any
appreciable changes in the efficiency of labour or shifts in industry-specific capital-
labour ratios.
Thus, the paper finds globalisation has led to a differential impact on
manufacturing employment in the two countries of our study. In the case of
Bangladesh, increased integration with the world economy has led to an increase in
manufacturing employment, both directly via a net expansion in the labour-intensive
industries, and indirectly via changes in industry-specific capital-labour ratios. Even
here, we find that there have also been significant job losses in the labour-intensive
textile sector in Bangladesh due to import competition. In the case of Kenya, labour-
intensive manufacturing exports have not shown signs of significant growth, while
there is evidence of a negative direct impact of import competition on manufacturing
employment. There has also been little indirect impact of international trade on
manufacturing employment. Thus, the net effect of globalisation on employment
could be considered negative, at least in the 1990s.
27
What explains the differences in labour market outcomes following opening
up in these two countries? Two possible reasons may be offered in an answer to this
question. Firstly, there are clear differences in factor endowments between these two
countries, with the labour-land ratio more favourable to the growth of unskilled
labour-intensive manufacturing exports such as garments and knitwear in the case of
Bangladesh as compared to Kenya (Collier and Gunning 1999). Secondly, the reforms
with respect to international trade and foreign investment in the case of Kenya were
implemented in the presence of significant macroeconomic uncertainty and in a
political environment where the relationship between the government and major
bilateral and multilateral donors has not been the most conducive (O’Brien and Ryan
2000). Along with the stop-go nature of the reforms, particularly with respect to
international trade, these factors may have led to a lack of credibility of the reforms
themselves (Reinnika 1996). This may explain why with very similar policies with
respect to the wooing of foreign investment in EPZs, the inflow of FDI in EPZs in
Kenya has been miniscule compared to that in Bangladesh, and may account for the
very different roles that the EPZs have played in their respective countries’ export
drive.
28
References
Asian Development Bank (2000), Country Economic Review, Manila.
Collier, P. and J.W. Gunning (1999), “Why has Africa Grown Slowly?” Journal ofEconomic Perspectives, Vol. 13, No. 2, pp. 3-22.
Dolan, C. (2001), “The ‘Good Wife’: Struggles over resources in the Kenyan
horticultural sector”, Journal of Development Studies, Vol. 37(2), pp. 147-176.
Glenday, G. and D. Ndii (1999), “Export Platforms in Kenya”, mimeo.
Glenday, G. and T.C.I. Ryan (2000), “Trade Liberalization and Growth in Kenya”,
mimeo.
Hine, R. and P. Wright (1998), ‘Trade with Low Wage Economies, Employment and
Productivity in UK Manufacturing’, Economic Journal.
Jenkins, R.O. and K. Sen (2002), “Globalization and Labour Markets in the South”,
paper presented in ESRC Conference on Globalisation and (In)equality,
University of Warwick, April 2002.
Krause, L.B. (1988), U.S Economic Policy Towards the Association of southeast
Asian nations: meeting the Japanese Challenge, Washington D.C., The
Brookings Institution.
McCulloch, N. and M. Ota (2002), “Export Horticulture and Poverty in Kenya”,
mimeo.
Milner, C. and P. Wright (1998), "Modelling Labour Market Adjustment to Trade
Liberalisation in an Industrialising Economy", The Economic Journal, Vol.
108, pp. 509-528.
Moreira, M.M. and S. Najberg (2000), “Trade Liberalisation in Brazil: Creating or
Exporting Jobs?" Journal of Development Studies, Vol. 36, No. 3, pp. 78-99.
O’Brien, F.S. and T.C.I. Ryan (2000), “Kenya” in Devarajan, S. et al. (eds.), Aid and
Reform in Africa, The World Bank, Washington D.C.
Paratian, R. and R. Torres (2001), Bangladesh: Studies on the Social Dimensions of
Globalization, International Labour Office, Geneva.
Reinnika, R. (1996), “The credibility program in trade liberalization: empirical
evidence from Kenya”, Journal of African Economies, Vol. 5(3), ppp. 444-
468.
29
Sen, K. (2001), Globalisation and Labour Market Outcomes in the South: A Critical
Survey, Discussion Paper 1, Project on Golbalisation, Production and Poverty,
Overseas Development Group, Norwich.
Spinanger, D. and J.P. Wogart (2000), “Will the Emperor wear clothes from
Bangladesh in 2005?”, mimeo.
World Bank (1987), Kenya: Industrial Sector Policies for Investment and Export
Growth, Washington D.C.
World Bank (1999), Bangladesh: Trade Liberalization, its Pace and Impacts,
Washington D.C.
White, H. (1980), “A Heteroskedasticity-Consistent Covariance Matrix Estimator and
a Direct Test for Heteroskedasticity”, Econometrica, Vol. 66, pp. 817-838.