Global Perspectives on Trade and Sustainability
66
Global Perspectives on Trade and Sustainability Capacity-Building Programme on Trade and Sustainability under the ITEC Programme of the Ministry of External Affairs, Government of India (9-20 July 2018)
-
Upload
khangminh22 -
Category
Documents
-
view
1 -
download
0
Transcript of Global Perspectives on Trade and Sustainability
Research and Information System for Developing Countries (RIS) is a New Delhi-based
autonomous policy research institute that specialises in issues related to international
economic development, trade, investment and technology. RIS is envisioned as a forum
for fostering effective policy dialogue and capacity-building among developing countries
on global and regional economic issues.
The focus of the work programme of RIS is to promote South-South Cooperation and
collaborate with developing countries in multilateral negotiations in various forums. RIS
is engaged across inter-governmental processes of several regional economic cooperation
initiatives. Through its intensive network of think tanks, RIS seeks to strengthen policy
coherence on international economic issues and the development partnership canvas.
For more information about RIS and its work programme, please visit its website:
www.ris.org.in
RIS A Think-Tankof Developing Countries
Core IV-B, Fourth Floor, India Habitat CentreLodhi Road, New Delhi-110 003 India., Ph. 91-11-24682177-80Fax: 91-11-24682173-74, Email: [email protected]: http://www.ris.org.in
www.facebook.com/risindia @RIS_NewDelhi www.youtube.com/RISNewDelhi
Follow us on:
Global Perspectives onTrade and Sustainability
Capacity-Building Programme on Trade and Sustainability under the ITEC Programme of the Ministry of External Affairs, Government of India
(9-20 July 2018)

Global Perspectives onTrade and Sustainability

Core IV–B, Fourth Floor, India Habitat CentreLodhi Road, New Delhi–110 003, India Ph.: +91–11–24682177–80, Fax: +91–11–24682173–74E–mail: [email protected]: www.ris.org.in
This report is compilation of articles submitted by the participants of ITEC-Trade and Sustaibility. Usual disclaimers apply.

Contents
Preface by Prof. Sachin Chaturvedi, Director General, RIS ............................................................ ....iii
I. Governance and Implementation Issues: Clean Energy Generation to Reduce Green Gas Emissions (GGH) ....................................................................................... 1
II. Pollution Haven Hypothesis and the Environmental Impacts tF Foreign Direct Investment: The Case Of Tanzania, Kenya, Malawi, Tunisia, Russia And Vietnam ................................................................................................... 13
III. Wetland Degradation and Sustainabile Biodiverty: Case Studies of Sri Lanka, South Africa, Nigeria And Vietnam ..................................................................... 23
IV. Dynamics of Trade Policies in Developing Countries Case studies of Sri-Lanka, Uruguay and Zambia ............................................................................................. 33
V. SDGs: Can it Spur Economic Growth in Developing Countries? ....................................... 47


PrefaCe
Capacity-building among developing countries on global and regional economic issues is a major part of the work programme of RIS. The first edition of the ITEC capacity building programme on “Trade and Sustainability” was held from 9 July to 20 July 2018 at RIS. The programmes aims to inculcate in the participants enhanced understanding of challenges and opportunities associated with the process of international trade. It is also designed to expose the participants to the growing complexities of international trade and negotiations and build their analytical skills to deal with them. Twentysix participants from 18 countries took part in it. The programme broadly took up the following themes: production and trade, regulatory framework, biodiversity, etc.
As part of the agenda of the programme, participants enthusiastically engaged in technical sessions and group discussions. They identified relevant areas to deliberate upon and eventually came up with status papers highlighting their various dimensions, regional and global contexts and country experiences. Based on individual areas of expertise and inclination they prepared brief papers. We are pleased to publish them in the present report.
We are sure that the publication would be found interesting and useful reference by scholars, policy makers, and practitioners from developing countries.
Sachin Chaturvedi
Director General, rIs
Prof. Sachin Chaturvedi


1
Governance and Implementation Issues: Clean Energy Generation to
Reduce Green Gas Emissions (GGH)
I
Andrea Maria Direnna Menoni(Uruguay)
Ciro Marques Russo(Brazil)
Devika Edirisooriya Arachchi Patabendige(Sri Lanka)
Emmanuel Espinoza(Mexico)


3
Introduction Climate change is one of the most pressing challenges of the present times. Most current concentration of greenhouse gases in the atmosphere is the result of the emissions since the industrial revolution, primarily by the developed countries. Nonetheless, developing countries are deeply engaged the fight against the climate change and have put forward emission reduction pledges that were the part of the 2015 Paris Agreement, despite their limited historical contribution to global warming as compared to developed countries’ industrial activities during the last two centuries.
According to the fifth assessment report of the Intergovernmental Panel on Climate Change (IPCC), global scenario for keeping temperature change below 2°C is characterized, inter alia, with the sustainable use of resources and tripling to nearly quadrupling share of zero- and low-carbon based energy supply globally by the year 2050. The importance of clean energy is also highlighted in Sustainable Development Goal 7 (“Affordable and Clean Energy”), which aims to ensure universal access to affordable, reliable, and modern energy services by 2030.
Developing countries are striving for a transition towards energy systems based on the renewable sources. According to the principle of Common But Differentiated Responsibilities (CBDR) embedded in the United Nations Climate Change Convention (UNFCCC), developed countries have
undertaken commitments to provide financial support and facilitate access and transfer of technologies to developing countries. The level of financing available under the Green Climate Fund, however, is insufficient (~USD 8 billions).
In this document, cases of Brazil, Mexico, Uruguay and Sri Lanka have been reviewed, to analyze best practices implemented and the challenges that the developing countries face in the implementation of clean technologies for generation of energy. Mexico and Brazil share similar characteristics as far as population, GDP, GDP per capita and large territories are concerned. And Uruguay and Sri Lanka are the countries with a small territory, but different economic conditions, especially the GDP per capita (Table 1).
Case StudiesMéxicoCountry status
Mexico is vulnerable to climate change. According to studies this can negatively affect 15% of its territory, 68% of its population and 71% of its economy.1 With a population of 124 million, 1,149.92 billion dollars of GDP and 8,902.8 dollars GPD per capita, Mexico is a country with high complexity2.
In Mexico “67.3% of the total GHG emissions causing climate change in 2010”3 came from the energy sector. In the Paris agreement, Mexico has committed to reduce by 2030 black carbon emissions by 51%, emissions of greenhouse
Table 1. Profile of Countries
Brazil México Uruguay Sri LankaGDP (billion USD) 1,796 1,150 52,42 87, 2Population (millions) 207,7 124 3.4 21,2 Territory (km2) 8,514,215 1,964,375 176,220 65, 610GDP per Capita (USD) 8.649,95 8.201,31 15.220,57 4,065

4
gases by 22%; boosting generation of clean energy at 37.7% by 2030. In terms of energy efficiency, a goal has been set to reduce energy intensity by 1.9% from 2016 to 2030; and 3.7% from 2031 to 20504.
Mexico has an installed capacity of 73MW5, mainly based on oil and gas source (Fig. 1). Since 2006, Mexico has promoted an ambitious strategy for generation of clean energy. In
2013, through an energy reform, the country transformed its energy market, establishing public policies to develop clean energy (Fig. 2). The Renewable Energy Attractiveness Index place Mexico as the 12th country in attracting investment in renewable energy. Mexico is the only Latin American country with the greatest potential for solar energy generation, being the fourth with highest potential worldwide.
Governance strategies
Regulation: Mexico has built a strong regulatory framework. In 2009, it approved the Law on the Use of Renewable Energy and Financing of the Energy Transition; the Law for the Sustainable Use of Energy; Fund for the Energy Transition and the Sustainable Use of Energy. In 2014, government established a National Agency for Industrial Safety and Environmental Protection; and approved the General Law on Climate Change, the National Climate Change Strategy and Special Climate Change Program.
Auctions: Since 2015, Mexico organizes reverse auctions to contract long-term energy capacity to supply national market. The unique feature of the initiative is that only the clean sources are allowed to participate in the bid. Clean energy under Mexico’s regulation
Fig. 1 Mexico’s Electricity Mix
Source: Blomberg New Energy Finance
Fig. 2 Investment in Mexico’s Electricity Sector
Source: Blomberg New Energy Finance

5
includes wind, solar, geothermal, biomass, hydro, nuclear and efficient cogeneration. three auctions had taken place with a resulting inflow of 8,600 million dollars of estimated investment; 45 new photovoltaic as well as 20 wind power plants are under construction.
Biomass: Mexico has set an example of producing energy from residues of some industries including tequila, sugar factories and livestock or poultry companies to cover their energy needs. Some municipalities in Aguascalientes and Nuevo León produce energy from their urban or industrial waste.
Challenges According to the data from the International Energy Agency, energy efficiency has the potential to reduce emissions up to 40% by the year 2050. México is creating incentives to promote the rational use of energy by people.
Furthermore, there is a need for significant amount of resources to implement the strategy; however, funding is a challenge for governments due to several factors. In addition, the need of back-up energy has begun to promote investment on marine and hydro energy generation. The government has tried to reduce legal, political and financial barriers to fund research and innovation projects in these areas.
UruguayCountry status
Uruguay has a strong energy matrix (Fig. 3) based on the renewable energy (95%), which has the added benefit of making the country less vulnerable to fluctuations of global energy prices (oil, gas, coal, uranium). As an instrument of state policy, the country has strengthened institutional role of the National Energy Directorate and the Public Electricity Companies, and it has promoted an efficient and rational energy use 6.
Fig. 3 Uruguay’s Electricity Mix
Surce: Blomberg New Energy Finance
Fig. 4 Investment in Uruguay’s Electricity Sector
Source: Blomberg New Energy Finance

6
The greenhouse gas emissions in Uruguay´s energy sector is one of the lowest in the world. In the context of the 2015 Paris Agreement, Uruguay has pledged to reduce CH4 emissions intensity by 33% from its 1990 values by 2030, by means of domestic resources and a potential total reduction of 46%, if adequate additional means of implementation are made available.
Governance strategies In the “Analysis of the preparation and implementation of the Energy Policy Uruguay 2030” 7 by the National Energy Directorate of Uruguay, it has been observed that since 2008, the government has invested more than 7,000 million dollars in its energy sector. Investment profile in the energy sector is diverse (Fig 4.) As a result, Uruguay “reached the global top in the incorporation of renewable sources thus witnessing a structural transformation of the electricity sector. Further, such a transformation has positive externality in the form of generation of thousands of jobs, new capacities as well as original knowledge, in addition to contributing to the social integration of the country”. One of the goals in the energy policy is the universalization of access to electricity.
Regulation: In 2008, Uruguay established a long-term energy policy for 2030, which incorporates not only economic and technological elements, but also environmental, cultural, ethical and social aspects. In the context of this policy, the universal and safe access to energy has been considered a human right for all social sectors of the country.
Fig. 5 Brazil’s Electricity Mix
Source: Blomberg New Energy Finance
Fig. 6 Investment in Brazil’s Electricity Sector
Source: Blomberg New Energy Finance
7
From the point of view of demand, the National Energy Efficiency Plan 2015-2030 has established the lines of action necessary to promote energy efficiency at the national level to achieve an energy goal of 1,690 kiloteps (thousands of equivalent tons of oil).8
The government also gives tax incentives for renewable energy equipment manufacturing; for instance, tax benefits are given for national manufacturing of solar equipment and investments in solar equipments.9
ChallengesSince the country has abundant renewable energy sources, which allows it to generate energy at market costs, the government is striving to reduce energy subsidies without compromising its energy security. Uruguay needs to attract more investments to continue exploration of its maritime platform in search of oil and gas. To do so, the country is seeking joint-ventures with oil companies and public-private partnerships.
In this context, it is necessary to consider the need to meet energy demands of all segments of Uruguay´s society (including the poor and most vulnerable) in a way that allows access to energy at affordable costs and under safe
conditions (e.g., avoiding precarious accidents). Universal access to energy can be achieved through a combination of diverse types of energy and technologies, with solutions adapted to the needs and territorial context of each household.
BrazilCountry status
Brazil’s current energy mix consists of 40% of renewables (75% of the renewables in its electricity supply), which already makes the country a low carbon economy.10 Despite its limited responsibility for climate change, Brazil has put forward more ambitious emissions reduction goal than most developed countries’ targets: a 37 per cent cut in greenhouse gases emissions from 2005 levels by 2025.
Brazil’s energy matrix reflects country’s reliance on hydropower for producing electricity, on ethanol for transportation and sugarcane bagasse and charcoal for industry. As a result, CO2 emissions from fossil fuels have been relatively small. However, the main challenge for the country is to reduce continuously emissions from deforestation. Brazil intends to achieve 45% of renewables
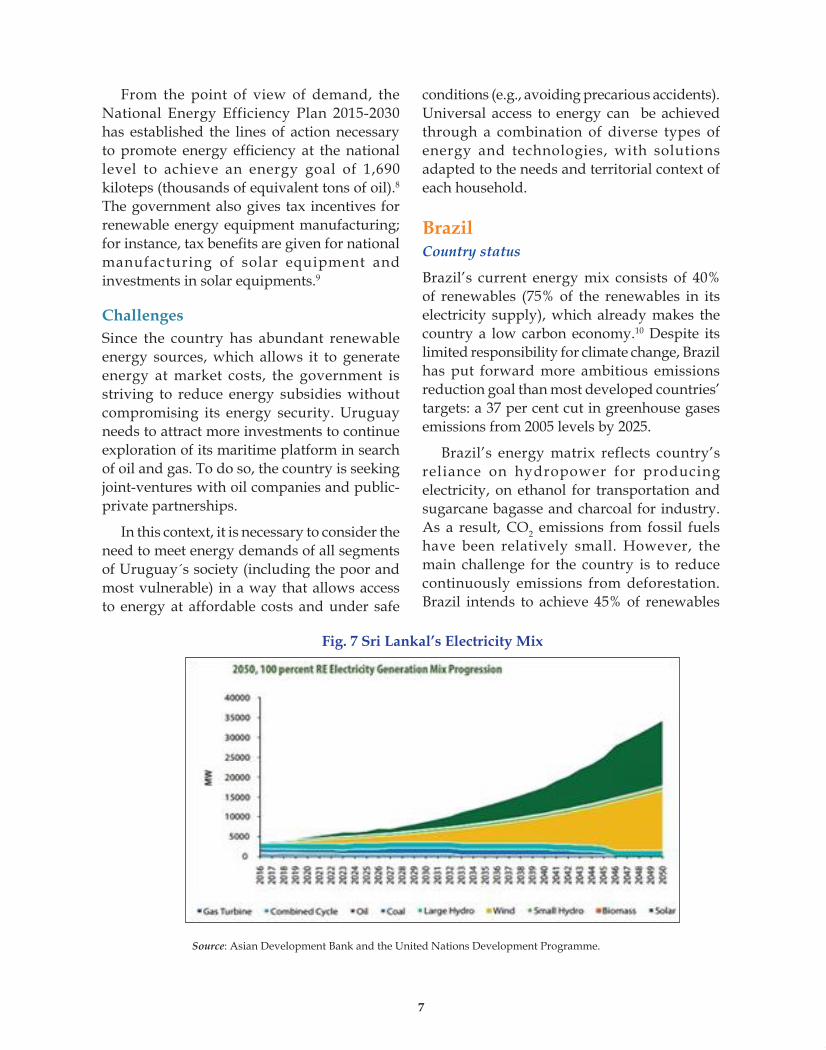
Fig. 7 Sri Lankal’s Electricity Mix
Source: Asian Development Bank and the United Nations Development Programme.

in the energy mix by 2030, though, inter alia, increasing the use of other renewable energy sources (in addition to hydropower) in the total energy mix between 28% and 33% by 2030; raising the share of wind, biomass and solar; and achieving 10% efficiency gains in the electricity sector by 2030. The current trends in energy mix and type of finance is given in Fig 6. The country already has a successful biofuel program and plans to increase the share of sustainable biofuels in its energy mix to 18% by 2030.
Governance strategies
In 2016, Brazil reached a total installed capacity of 149GW (Fig 5).11 the regulated market (ACR) is supplied with renewable energy and new generation capacity contracted by the government through reverse auctions. Since 2010, as the result of their maturity (wholesale price parity with conventional sources), all renewable technologies can compete with conventional fuels in regular tenders (in addition to technology-specific auctions).
Brazilian Development Bank (BNDES) has played a major role in the development of the renewable energy market in the country. Between 2006 and 2016, BNDES disbursed around $29 billion for renewable energy projects12. BNDES applies local content requirements in wind and solar project loans, which contribute to equipment manufacturers’ decision to set factories in the Brazilian territory.
With regard to energy efficiency, the government requires that all electricity distribution companies allocate 0.5% of their net operating revenue towards end-use energy efficiency investments. To provide additional incentives for energy savings, since January 2018, households can opt for a dynamic tariff scheme, whereby the price of electricity varies along the day, reaching high price during peak hours.
Implementation challengesOne of the main challenges the government
faces is that how it should meet the growing energy needs of the Brazilian society, while maintaining clean profile of the national energy matrix.
Repeated droughts during 2011-2015 strained hydropower production in Brazil, highlighting the importance of diversifying sources of renewable energy. The use of wind and solar energy has been increasing consistently in the country over the last 5 years. In 2016, total installed wind capacity in the country reached 10GW. In the same year, however, for the first time since 2009, wind projects did not secure any long-term contracts through federal auctions.
To further develop Brazil’s power sector, regular auctions and the continued flow of investments would be crucial. Transnational corporations have fared well in the last auctions, as they are able to take advantage of their global value chains to negotiate lower prices for the required equipment, as well as with better terms of access to foreign loans.
The high costs of new technologies and issues relating to financing access could potentially represent barriers for small scale renewable systems. In the case of photo-voltaic systems, for example, currency exchange rates can have an important impact on the final price to local consumers (currently at the level of more than US$ 5.000,00 for a medium-sized household), as it affects the costs of equipment for small -scale generation, most of which are still imported. The Brazilian government is striving to provide further incentives through BNDES, which offers loans under favorable conditions to individual citizens interested in employing solar panels.
Sri LankaCountry statusSri Lanka, as an island nation, is particularly vulnerable to rising sea levels, caused by climate change. Their economy has grown

9
with GDP per capita rising from US$ 3,094 in 2011 to US$ 3,956 in 2017. Also, the population increased from 14.75 million in 1980 to 21.4 million in 2017. Energy demand in 2005 was 337.40MW and increased up to 416.58MW in 2015.13 Sri Lanka’s energy demand is supplied by several energy sources consisting of both indigenous non-fossil fuels and imported fossil fuels. Sri Lanka power generation is mainly based on three primary resources—biomass, petroleum and hydroelectricity.14
Primary Energy mix in 2015 was Petroleum 39%, Biomass 39%, Coal 10%, Hydro 9% and New Renewal Energy only 3%. It is committed to reach 100% renewable energy generation as quickly as possible, and by 2050 at the latest (fig 7). As the country continues for transition to a zero-carbon society, the share of renewable technologies is expected to increase dramatically and electricity supply would be dominated by state orientation institute. 15
Governance strategiesAn energy policy consistent with the social and economic development goals is required owing to the significant impacts of the energy sector on social and economic activities of the country. Primary objective of the energy policy is to ensure that it is available through economically viable supplies that are clean, secure, sustainable, and reliable, to provide convenient, affordable energy services to support socially equitable development of Sri Lanka.16
The Government has been taking many steps to implement Rules and Regulations, policies and strategies to develop and manage the energy sector. Some of the strategies implemented are: providing basic energy needs, ensuring energy security, promoting energy efficiency and conservation, promoting indigenous resources, adopting an appropriate pricing policy, enhancing energy sector management capacity, consumer protection and ensuring a level playing field, enhancing the quality of energy services, protection from
Adverse Environmental Impacts of Energy Facilities.17 In addition, according to the budget proposal 2018, Sri Lanka government has introduced emission standards for Euro IV or equivalent standards.
Implementation challengesThe major challenges facing Sri Lanka’s Power sector are as follows.
• Heavily depends on the imported fossil fuels prices of which cannot be controlled;
• Inadequate t ransmiss ion capaci ty particularly for renewable integration, issues in upgrading the existing transmission and continuous rehabilitation of transmission grid
• Investment is required for infrastructure development in the power sector such as generation, transmission and distribution,
• Technical barriers for integration of renewable energy to its maximum level; and the lack of inadequate technical support.
• Some of social groups are trying to drive the policies towards their personal milestones. Non-availability of proper incentives to develop renewable energy based capacity;
• upgrading power sector institutions capacity to meet emerging power sector needs,
• Development of Human Resource capacity for emerging needs and introducing cast reflective tariff.
Conclusion and RecommendationsAll four countries that are part of this study are fully engaged in the transition towards energy systems based on the renewable sources. Energy efficiency and the generation of energy from clean sources are the central pillars of sustainable energy transition. In addition to its importance for climate change mitigation, energy transition can create new economic and employment opportunities, enhance food and energy security, improve air quality, promote best practices of water management,

10
and therefore, contribute to sustainable development in general, as well as fulfillment of sustainable development goal #7.
The transition to renewable energy technologies represents an opportunity to attract and scale up investments that can provide direct and indirect benefits to states and societies, by reducing dependence on imported fossil fuels; improving local air quality and public health. All countries would benefit from additional technological and financial support from abroad. The levels of financing from developed countries have, however, been insufficient. In this context, developing countries need to increase research and development for innovation in renewable energy technologies as a way of reducing their costs for the end consumers. Another alternative is to further promote South-South Cooperation (e.g., in the production and commercialization of wind turbines and photo-voltaic panels).
Due to the rapid reduction of costs, in particular, of solar and wind energy, renewable technologies have become the technology of choice in a growing number of markets. In the case of the four countries analyzed, most equipment related to the new renewable technologies are being imported. To build a fair and equitable response to the challenges of energy transition and climate change, it is crucial that all countries cooperate to promote a supportive and open international economic system that would lead to sustainable economic growth and development in all Parties, particularly developing country Parties, thus enabling them better to address the problems of climate change. As is reflected in article 3.5. of the UNFCCC, measures taken to combat climate change, including unilateral ones, should not constitute a mean of arbitrary or unjustifiable discrimination or a disguised restriction on international trade.
It is important to take into account the immense challenge of ensuring energy access to the estimated global population of more than 8
billion people in 2030. In addition, according to REN21 Conference, “1.2 billion people do not have access to electricity, and 2.7 billion people lack access to clean forms of cooking energy”18. Rural and urban demands, as well as domestic, social and industrial demands could be best met with a diverse mix of technologies, which maximize the potential of renewable energy.
I n d e v e l o p i n g c o u n t r i e s , i n c o m e generation may be insufficient to support energy infrastructure projects, inter-regional transmission and renewable energy projects. The consolidation of innovative financial mechanisms, including loan guarantees, is a priority to mitigate these problems. The integration of renewable energies into national and regional strategies for economic and social development, the development of national climate policy, agriculture, industrial development, education, health and family well-being will provide more opportunities for the expansion of renewable energy.
Endnotes1. Alanis G. (2012). México Rumbo a la Sustentabilidad:
40 Propuestas para la Administración Federal 2012-2018. Available on: https://www.greenpeace.org/mexico/Global/mexico/report/2012/3/MexicohacialaSustentabilidad.pdf
2. World Bank (2018). GDP per capita (current US$). Available on: https://data.worldbank.org/indicator/NY.GDP.PCAP.CD?year_high_desc=true
3. Centro Mexicano de Derecho Ambiental (2012) Inventario Nacional de Emisiones de Gases de Efecto Invernadero. Pp. 198. SEPRIM: Ciudad de México.
4. https://unfccc.int/files/meetings/paris_nov_2015/application/pdf/paris_agreement_spanish_.pdf, UNFCCC
5. Luiza Demoro (2017), Country Profile. Available on https://www.bnef.com/core/country-profiles/mex
6. Sustainable Energy for all Rapid Assessment Gap Analysis Uruguay
7. Analysis of the preparation and implementation of the Energy Policy Uruguay 2030 Rossanna González
8. National Energy Directorate, Ministry of Industry, Energy and Mining, Uruguay -Ramón Méndez Faculty of Engineering, University of the Republic, Uruguay
9. http://www.miem.gub.uy/

11
10. http://unasep.mef.gub.uy/10485/8/areas/promocion-de-inversiones-en-energias-renovables.html
11. http://www4.unfccc.int/submissions/INDC/Published%20Documents/Brazil/1/BRAZIL%20iNDC%20english%20FINAL.pdf
12. Luiza Demoro (2016), Country Profile. Available on https://www.bnef.com/core/country-profiles/bra
13. https://www.bndes.gov.br/wps/portal/site/home/transparencia/estatisticas-desempenho/desembolsos/desembolsos-nos-anos-anteriores/
14. Sri Lanka Central Bank , Annual Report 201715. 100% Electricity Generation Through Renewable
Energy by 2050- Assessment of Sri Lanka’s Power Sector, Co-publication of the Asian Development Bank and the United Nations Development Programme.
16. ibid17. National Energy Policy and Strategies of Sri Lanka-
Version 6.3 (Public Comments) 2017Feb23.18. The Gazette of the Democratic Socialist Republic of Sri
Lanka. MINISTRY OF POWER & ENERGY, National Energy Policy & Strategies of Sri Lanka. No. 1553/10 – TUESDAY, JUNE 10, 2008
19. h t t p : / / w w w . r e n 2 1 . n e t / w p - c o n t e n t /uploads/2017/12/Conference-Report_double-page_ES.pdf
ReferenceAlanis G. (2012). México Rumbo a la Sustentabilidad: 40
Propuestas para la Administración Federal 2012-2018. Available on: https://www.greenpeace.org/mexico/Global/mexico/report/2012/3/MexicohacialaSustentabilidad.pdf
World Bank (2018). GDP per capita (current US$). Available on: https://data.worldbank.org/indicator/NY.GDP.PCAP.CD?year_high_desc=true
Centro Mexicano de Derecho Ambiental (2012) Inventario Nacional de Emisiones de Gases de Efecto Invernadero. Pp. 198. SEPRIM: Ciudad de México.
https://unfccc.int/files/meetings/paris_nov_2015/application/pdf/paris_agreement_spanish_.pdf, UNFCCC
Luiza Demoro (2017), Country Profile. Available on https://www.bnef.com/core/country-profiles/mex
Luiza Demoro (2016), Country Profile. Available on: https://www.bnef.com/core/country-profiles/bra
Kallakuri C. et al (2016). The 2016 International Energy Efficiency Scorecard. Available on https://aceee.org/portal/national-policy/international-scorecard,
Rossanna González (2010). Analysis of the preparation and implementation of the Energy Policy Uruguay 2030, National Energy Directorate, Ministry of Industry, Energy and Mining, Uruguay -Ramón Méndez Faculty of Engineering, University of the Republic, Uruguay http://www.miem.gub.uy/
Sri Lanka Central Bank , Annual Report 2017100% Electricity Generation Through Renewable Energy
by 2050- Assessment of Sri Lanka’s Power Sector, Co-publication of the Asian Development Bank and the United Nations Development Programme.
http://unasep.mef.gub.uy/10485/8/areas/promocion-de-inversiones-en-energias-renovables.html
http://www4.unfccc.int/submissions/INDC/Published%20Documents/Brazil/1/BRAZIL%20iNDC%20english%20FINAL.pdf
https://www.bndes.gov.br/wps/portal/site/home/transparencia/estatisticas-desempenho/desembolsos/desembolsos-nos-anos-anteriores/
https://www.seforall.org/sites/default/files/Uruguay_RAGA_EN_Released.pdf


13
Pollution Haven Hypothesis and the Environmental Impacts tf
Foreign Direct Investment: The Case Of Tanzania, Kenya, Malawi,
Tunisia, Russia And Vietnam
II
Karugaba Rugaimukamu(Tanzania)
Emmanuel Nabuora Nakitare(Kenya)
Chisomo Mandala(Malawi)
Fatern Barouni(Tunisia)
Irina Omilaeva(Russia)
Canh Mai Thi(Vietnam)


15
1. Introduction1.1. BackgroundMost countries began opening the doors for foreign direct investment (FDI) inflows from the early 1980s which not only significantly boosted their economic growth but also increased their energy consumption and CO2 emissions (Shahbaz et al, 2015). FDI targets all —the low-income countries, middle-level countries and high-income countries. According to UNCTAD (2018), FDI outflows were directed more towards low and middle-income countries. World Bank (2018) investment report has highlighted the following economic sectors which attract more FDI in developing countries— mining and quarrying, manufacturing, accommodation, financial and insurance, information and communication, electricity and gas, wholesale and retail trade, agriculture, construction, real estate activities, professional activities, other service activities, education, public administration and defence, and transportation and storage. Doytch and Uctum (2016) argued that FDI flows affected the environment differently depending on the type of economic sector. FDI flows into manufacturing increased pollution (negative halo effect), while those into services supported the halo effect hypothesis (ibid).
FDI flows fluctuated in the last decade and witnessed significant drop of 23% globally in 2017 (UNCTAD, 2018). However, developing countries are devising incentives and also easing environmental regulations; a phenomenon commonly described as ‘race to the bottom’.
There are some significant benefits, which are attributed to FDI. For instance, FDI provides direct capital financing, generates positive externalities, and consequently, would stimulate economic growth through technology transfer, spillover effects, productivity gains, and would introduce new processes and managerial skills. Further, GDP of countries has accelerated and decelerated in tandem with the FDI inflows (UNCTAD, 2018).
However, researches have shown that despite these benefits, economic growth and energy consumption results in increased carbon footprint and CO2 emissions and FDI and CO2 emissions are interrelated (Shahbaz et al., 2015, Dietzenbacher & Mukhopadhyay,2006). Thus , there is a need to have analysis of this issue in a greater detail.
1.2. Objective Several studies have ascertained the relationship between FDI and harmful environmental effects on host countries using cross country and time series data. However, evidences on the relationship of the same among the low, middle, and high-income countries are contentious and inconsistent. Among other things, the attractive FDI sectoral distribution, FDI technology invested, type of goods manufactured, export size and GDP trends in these countries have been dissimilar and varying (UNCTAD,2018). Thus, the objective of the study is to establish relationship between pollution havens and their consequent environmental impacts. Specifically, the aim is to:
Examine the relationship between FDI inflows and the environmental impact among low income, lower middle income and upper middle-income countries.
Determine relationship between exports and environmental impact among low income, lower middle income and upper middle-income countries.
Ascertain the relationship between GDP and the environmental impact among low income, lower middle income and upper middle-income countries.
1.3. Significance of the studyThe contributions of this study are threefold— theoretical, empirical and from the policy perspective. Theoretically, it can add to a body of existing knowledge, and empirically, it can help to understand the FDI and environmental dimensions impacts. Further, in terms of

policy implications, the study offers an effective foundation to low and middle-income countries’ policy-makers as far as FDI and environmental sustainability is concerned.
2. Literature Review2.1. Theoretical ReviewAccording to Kearsley and Riddel (2009), Pollution Haven Hypothesis (PHH) posits that emission reductions observed in developed nations are partly the result of shifting “dirty” production to developing nations with lax environmental standards. The pollution haven hypothesis maintains that the industries that are highly pollution intensive, i.e. dirty industries, have been migrated from developed economies to the developing world. It is argued that the environmental concerns of the developed economies caused them to enact strict environmental regulations, which increased the cost of production of the dirty industries at home. Consequently, developing countries and some developed as well provide pollution havens for dirty industries. In this study, the pollution haven argument for six countries for the period of 2008- 2017 has been examined.
Similarly, Environmental Kuznets Curve (EKC) theory states that rising national output leads to increase in pollution emissions until an economy reaches a certain size, and decreases thereafter. This paper uses this theory as it focuses on the role of the FDI plays in shaping the environment.
2.2. Empirical ReviewMost of the research work in Tanzania was done focusing on the mining and quarrying sector, which has a significant contribution in the Tanzanian GDP. Among these studies, work by Mwakaje (2013) assessed the contribution of Environmental Impact Assessment (EIA) in forming the policy and decision-making process with regard to the boom in FDI in the country. The main focus of the study was to investigate the quality of the EIA undertaken
and the extent to which it would influence decision making with regard to the investments in Tanzania. This was done by reviewing EIA reports and with consultations with developers and regulatory authorities. The main findings were that, despite the existence of EIA for almost all development projects in the country, only a few of the mitigation measures proposed in the EIA reports were implemented by the developers. The study also revealed that a number of EIA reports were significantly weak in terms of indicating decisions and ensuring that FDI would result in a win-win outcome. In addition, the enforcement and monitoring of environmental management plans by the authorities responsible were weak, partly owing to inadequate resources. However, unlike the present study, this study dealt with only one country.
Several studies have been done within the topic of FDI and Environment in Kenya. Al-Mulal et al (2016) investigated the environmental Kuznets curve (EKC) hypothesis in Kenya using the time period of 1980–2012. The ARDL approach was utilized to prevent any estimation errors and unreliability in the model, the Narayan and Narayan (Energy Policy 38:661–666, 2010) approach was used to control multicollinearity problems in the regression. The outcome of this research revealed that fossil fuel energy consumption, GDP, urbanization, and trade openness together increased air pollution in the long run and short run. And renewable energy consumption mitigates air pollution both in the long and short run. Moreover, financial development was also found to reduce air pollution, but only in the long run. Based on the results, the EKC hypothesis was found not suitable for Kenya. From the findings of their research, a few policy recommendations were provided to help Kenya for reducing its air pollution levels. Unlike this research, our research used the data from 2008 to 2017to close the gap of any new challenges and opportunities that might have occurred.
Although FDI flows in Malawi were not been high (UNCTAD,2018) like other developing

17
countries, still Malawi has played a great role in attracting FDI, and as a result, they have not been spared from environmental challenges thereof. Kazembe and Namizinga (2007) assessed some of the factors that deter investors from investing in Malawi and investigated the reasons why FDI in Malawi didn’t increase over years, and also evaluated why Malawians are reluctant to invest in their own country. The study identified key deterrents to investment in Malawi as high interest rates, lack of proper legal frameworks, macro-economic instability, poor infrastructure, corruption, lack of natural resources, high production costs, market size and political instability. Despite the case that some of these challenges are shared by most of the developing countries, the study did not dwell much on to highlight repercussions of FDI vis-à-vis environmental sustainability.
Hakimi and Hamdi (2016) investigated the possible economic impacts of the trade liberalization on the environmental quality in Tunisia and Morocco. Specifically, it inspected whether or not liberalization of the trade sector harmed the quality of the environment in both countries. They conducted various econometric models—a VECM and cointegration techniques for single country case study and a Panel VECM and Panel cointegration when using data of both countries as a group. The study found bidirectional causality between FDI and CO2. This implies that the nature of FDI inflows to Morocco and Tunisia are not clean FDI. The results showed that the trade liberalization impacted negatively on the environment. The paper concluded that although trade liberalization boosted the economy of both the countries by creating new employment opportunities, liberalization has harmed the environment. Unlike this study, the present study dealt with six countries and used simple secondary interpretation.
Yi Feng et al (2009) examined history, trends, geographical and sectoral preferences, and policy issues of foreign direct investment (FDI) in Russia. Most of the obstacles to FDI in Russia identified were institutional such as: government
restrictions, trade-related investment measures (TRIMs), customs, bureaucracy, legal FDI framework, labor issues, taxation, partnerships with firms, corruption, and crime. It has been observed that Russian(an upper middle-income country) challenges are not different from a low-income country such as Malawi, as mentioned above. However, again the study did not touch upon the harmful environmental effect as a result of PHH.
Linh and Lin (2014) examined the dynamic relationships between CO2 emissions, energy consumption, FDI and economic growth for Vietnam from 1980 to 2010 based on the EKC approach, co-integration, and Granger causality tests. The empirical results found that EKC theory is not applicable to Vietnam. However, the study results indicated a dynamic relationship among CO2 emissions, energy consumption, FDI and economic growth. Despite the study similar to ours , in context it researched on country and thus the findings can hardly be generalized.
3. Methodology
Country Classifications
According to World Bank (2018), low-income economies are defined as those with a GNI per capita, calculated using the World Bank Atlas method of USD 995 or less in 2017; lower middle-income economies are those with a GNI per capita between USD 996 and USD 3,895; upper middle-income economies are those with a GNI per capita between USD 3,896 and USD 12,055; high-income economies are those with a GNI per capita of USD12,056 or more.
Carbon Emission
Emissions of CO2 come from burning oil, coal and gas for energy use. Carbon dioxide also enters the atmosphere from burning wood and waste materials and from some industrial processes such as cement production (UNCTAD, 2018).

18
Figure 1.1: Foreign Direct Investment, Net Inflows (BOP, US$) 2008-2017
Source: Authors’ computation from World Bank, 2018
Figure 1.2: Exports of Goods and Services (BOP, Current USD) 2008-2017
Source: Authors’ computation from World Bank, 2018

19
Figure 1.3: GDP (BOP, Current US$) 2008-2017
Source: Authors’ computation from World Bank, 2018
Figure 1.4: CO2 Emissions (KT) 2008-2014
Source: Authors’ computation from World Bank, 2018

20
In this study, we examine cross-country data of 6 countries with the aim to study the interrelationship between trade, FDI and environmental degradation. The study was done within the scope of upper middle income (Russia), lower middle income (Vietnam, Tunisia and Kenya), and low-income countries (Tanzania, and Malawi) to observe the real scenario across all economic categories. In this paper, one environmental indicator was chosen for analysis that was CO2 emission. In the current study, PHH FDI inflow was operationalized and measured by looking at three indicators — FDI inflows, GDP pattern, and exports size from the FDI host countries.
4. Country Cases and DiscussionBelow is the longitudinal data in graph format representing FDI inflows, exports of goods and services, GDP and CO2 emissions for ten years from 2008 to 2017. the data have been retrieved from the World Development Indicators (2018). However, data for CO2 emission data from 2015 to 2017 were not available.
The graph on Foreign Direct Investment, Net Inflows (BOP, US$) 2008-2017 showedthat Russia (upper middle-income country) has attracted more revenue, followed by Vietnam (lower middle-income country), Tunisia (lower middle-income country), Tanzania (low income country), Kenya (lower middle-income country), and Malawi (low income country).
The graph above on Exports of Goods and Services (BOP, Current USD) 2008-2017 indicates that Russia (upper middle-income country) exported the most - in an invented U-shaped pattern, followed by Vietnam (lower middle-income country), Tunisia (lower middle-income country), Tanzania (low income country), Kenya (lower middle-income country), and Malawi (low income country) lagged behind. Countries with higher FDI inflows also have greater exports. Thus, higher exports seem to be correlated with the size of FDI inflows to the respective countries.
The graph above on GDP (BOP, Current US$) 2008-2017 shows that Russia (upper middle-income country) has a higher GDP compared to other countries in the study; in an invented U-shaped pattern, followed by Vietnam (lower middle-income country), Tunisia (lower middle-income country), Tanzania (low income country), Kenya (lower middle-income country), and Malawi (low income country), lagged behind. As in the case of exports, the GDP of countries also shows a positive relation with the size of FDI inflows to the respective countries.
The graph above on CO2 Emissions (KT) 2008-2014 shows that Russia (upper middle-income country) has a higher CO2 emission rate compared to other countries; followed by Vietnam (lower middle-income country), Tunisia (lower middle-income country), Tanzania (low income country), Kenya (lower middle-income country), and Malawi (low income country) had lower CO2 emissions. The CO2 emissions are highest for countries with the highest FDI inflows.
5. Conclusion and RecommendationsThis study indicates that FDI increases environmental degradation by increasing CO2 emissions, thus confirming to the PHH theory. Further, the empirical data showed that as GDP raised, CO2 emission increased, thus conforming the EKC theory. Notwithstanding, with exception which is in the second phase of the EKC, other countries under the study are still in their first phase of the EKC. Thus, one of the policy recommendations for the low income, lower middle income and upper middle-income countries is to continue devising strategies to attract FDI, but in a sustainable manner by formulating stringent environmental measures and avoiding the “race to the bottom” phenomenon. Furthermore, policy focus should be to give more attention to negative consequences of PHH on the welfare of their citizens and to promote green economy.

21
6. Limitation and Area for Further StudiesThis study investigated only six countries from the low, lower middle and upper middle-income countries and used secondary data with a simple interpretation. Futurer studies shall include more countries and high-income countries and econometric empirical data analysis.
ReferencesAl-Mulali, U., Solarin, S. A., & Ozturk, I. (2015).
Investigating the presence of the environmental Kuznets curve (EKC) hypothesis in Kenya: an autoregressive distributed lag (ARDL) approach. Natural Hazards, 80(3), 1729–1747. doi:10.1007/s11069-015-2050-x
Dietzenbacher, E., & Mukhopadhyay, K. (2006). An Empirical Examination of the Pollution Haven Hypothesis for India: Towards a Green Leontief Paradox? Environmental and Resource Economics, 36(4), 427–449. doi:10.1007/s10640-006-9036-9
Dinh Hong Linh and Shih-Mo Lin, (2014), CO2 Emissions, Energy Consumption, Economic Growth and FDI in Vietnam, Managing Global Transitions, 12, (3 (Fall)), 219-232
Doytch, N., & Uctum, M. (2016). Globalization and the environmental impact of sectoral FDI. Economic Systems, 40(4), 582–594. doi:10.1016/j.ecosys.2016.02.005
Hakimi, A., & Hamdi, H. (2016). Trade liberalization, FDI inflows, environmental quality and economic growth: A comparative analysis between Tunisia and Morocco. Renewable and Sustainable Energy Reviews, 58, 1445–1456. doi:10.1016/j.rser.2015.12.280
Kazembe, P & Namizinga, N. (2007). The impact of foreign direct investment on development: Policy challenges for Malawi. The government of Malawi, ministry of industry, trade and private sector development. Integrated framework policy analysis working paper series No.6.
Kearsley, A., & Riddel, M. (2010). A further inquiry into the Pollution Haven Hypothesis and the environmental Kuznets Curve. Ecological Economics, 69(4), 905–919. doi:10.1016/j.ecolecon.2009.11.014
Mwakaje, A. G. (2013). Assessing the Contribution of Environmental Impact Assessments in Informing Decision Makers Concerning the Booming of FDI in Tanzania. Environment and Natural Resources Research, 3(4). doi:10.5539/enrr.v3n4p118
Shahbaz, M., Nasreen, S., Abbas, F., & Anis, O. (2015). Does foreign direct investment impede environmental quality in high-, middle-, and low-income countries? Energy Economics, 51, 275–287. doi:10.1016/j.eneco.2015.06.014
UNCTAD (2018). http://worldinvestmentreport.unctad.org/world-investment-report-2018/
World Bank (2018). https://www.worldbank.org/.../2018 Yi Feng, Yi Sun and Joshua C. Walton (2009) Foreign Direct
Investment in Russia and Lessons for China, The Chinese Economy, 42:3, 78-93, DOI: 10.2753/CES1097-1475420305


Wetland Degradation and Sustainabile Biodiverty: Case Studies
of Sri Lanka, South Africa, Nigeria And Vietnam
III
Queeneth O. Ekeocha (Nigeria)
Rudzani Khameli(South Africa)
Peshala Pussella(Sri Lanka)
Quyet Nguyen (Vietnam)


25
BackgroundBiodiversity is the extent of nature’s varieties or variations within the natural system; both in the number and the frequency. Wetlands are extremely essential for the conservation of biodiversity. the Ramsar Convention of 1971 defined “wetlands as areas of marsh, fen, peatland or water, whether natural or artificial, permanent or temporary, with water that is static or flowing, fresh, brackish or salt, including areas of marine water, the depth of which at low tide does not exceed six metres” (Ramsar Handbook, 2010). They are important because they protect and improve water quality, provide fish and wildlife habitats, store floodwaters and maintain surface water flow during dry periods.
Wetlands can provide economic benefits like improved water quality, flood control, wildlife and fisheries habitat, and recreational opportunities. Isolated wetlands can often serve as crucial habitats for small populations of rare birds, insects, and amphibians. Wetland ecosystems provide feeding, nursery and breeding areas for commercially important crustaceans, molluscs, and other aquatic wildlife (Bamidele, 2010). Most of the rural communities in the developing countries depend on agriculture for their livelihood. So, maintaining trade-off between agriculture and biodiversity is extremely important. In many countries, wetlands are among the overlooked natural resources, yet, they are very important and critical for maintaining clean water, giving support to wildlife and fish populations.
Globally and across various countries, wetland degradation is one of the concerns and challenges for conserving biodiversity (Copeland, 2013; Davinson, 2014). Degradation is caused by human activities and through natural phenomena. For instance, industrial pollution, harmful agricultural practices, commercial exploitation (dams and hotels construction, etc), improper waste management, pollution and climate change have caused wetland degradation or depletion. Wetland
degradation is further aggravated by increased temperature, rise in sea level, drought, oil spillage, pollution, reclamation, population surge, etc leading to total or partial loss of shallow wetlands. The implication is that wetlands have lost their abilities to recharge groundwater, collect sediment, trap pollutants and sustain livelihood.
Harmful activities on wetlands hinder the optimum utilization and conservation of biodiversity. Global wetlands are lost by more than 50%. It is reported that wetland loss has been 3.7% faster during the 20th and early 21st century and it was about 64–71% since 1900 AD (Davinson, 2014). The rate of wetland loss in Europe and North America has remained low since 1980s, but it has been high in Asia and Africa where large-scale and rapid conversion of coastal and inland natural wetlands is continuing.
The Case Study of Sri LankaSri Lanka owns rich biodiversity zones and is recognized as one of the biological hotspot of the world. The country boasts of seven UNESCO World Heritage sites, 13 National Parks, a biodiversity park and 93 other protected natural areas, and includes 24 protected areas bordering coastal zone (Coastal Zone Management Plan, 2003) associated with coastal habitats such as lagoons/estuaries, mangroves, salt marshes, etc. In addition, its hard coral reefs are rich in biodiversity; nearly 1,000 species of fish and many other invertebrate species. Oceanic waters around Sri Lanka support populations of whales and dolphins, migrant birds and marine turtles.
Muthurajawela Marsh and lagoon wetland with an area extent of 3,068 hectares is located between 10 and 30 km north of Colombo, in Gampaha District together with Negombo Lagoon (3,164 hectares), which is the largest saline coastal peat bog. Muthurajawela forms an integrated coastal wetland system of high biodiversity and ecological significance. The ecosystem is listed as one of 12 priority

26
wetlands in Sri Lanka, and in 1996 an area of some 1,777 hectares in the northern section of Muthurajawela was declared as a wetland sanctuary by the government of Sri Lanka under the Flora and Fauna Act in recognition of its vast biodiversity. According to the statistics, the marsh consists of 192 distinct spaces of flora, 209 distinct spaces of fauna and 102 species of birds; some of them are indigenous to the marsh (Emerton and Kekulandala 2003). Large portion of coastal wetlands in the coastal belt of Sri Lanka have been degraded mainly due to the establishment of eco-tourism projects as well as due to landfill for housing, commercial and industrial development, prawn farming and aquaculture activities.
As the result of biodiversity destruction in the coastal belt, water birds’ population has reduced, and over 50% of remaining species are under the threat of extinction (IUCN, 2009). The International Water Management Institute (IWMI) has identified and estimated the quantity of sedimentation within the entire area by using satellite data and GIS techniques in 2007. Multi- spectral land satellite imageries were used to spatially capture changes in and around the wetland area. These indicated that between 1992 and 2002, wetland were subjected to change with the loss of clean water area 30%, mangrove 49% and marshes 40% ;caused by sedimentation, infilling, clearing of vegetation and expansion of human settlements (Rebilo et al., 2007).
The Case Study of South AfricaAccording to the National Biodiversity Assessment for South Africa, carried out in 2011, wetlands occupy only 2.4% of the country’s total area; and of it around 48% is critically endangered, 12% is endangered, 5% is vulnerable and 35% is least threatened (Macfarlane et al., 2014). The South African wetlands are therefore the most highly threatened ecosystems of all in the country (Driver et al., 2012). The launching of the Working for Wetlands Programme in June 2000 enhanced awareness on the value of wetlands,
and along with it came many environmental education campaigns focusing on wetlands (Sieben, 2011). Restoration activities include building of gabion structures to minimise erosion, construction of structures that divert the flow of water or raise the water -table, as well as plugging of artificial drainage channels, and removal of invasive plants (South African Department of Environmental Affairs, 2014). Since its establishment, the Programme has spent approximately 530 million Rands in wetland rehabilitation, and has been involved in over 900 wetlands, thereby upgrading or reinstating ecological integrity of over 70,000 hectares of wetland environment (South African National Biodiversity Institute, 2014). South Africa has lost, and continues to lose wetlands as the result of human activities such as dam construction, veld fires, overgrazing, pollution, crop production, urbanisation and poor management of land resources (King et al., 2005). Wetland ecosystems facing the greatest threat in South Africa are floodplains since they are localised in lands most suitable for agricultural production (South African National Biodiversity Institute, 2013). The threats are realised in both urban and rural areas—for urban areas its urban expansion, while in rural areas agricultural activities are the main drivers of change (Davidson, 2014).
The Mamalana wetland is near Bushbuckridge in Mpumalanga; an area inhabited by a highly impoverished and marginalised population of 500,000 people. About 70% of the local people use the wetland in some way for their livelihoods, and 25% depend entirely on it as their only source of food and income (South African National Biodiversity Institute, 2013). Erosion and degradation of the wetland resulted in the loss of tonnes of soil, and subsequent loss of 863 farming plots for 215 local farmers and 2,155 people lost a significant part of their food security.
The Case Study of NigeriaThe Nigerian wetlands comprise freshwater wetlands and coastal saline wetlands. The

27
freshwater wetlands comprise the Imo River, Lake Chad, Ogun-Osun River, Niger delta, Cross River, Niger River and the Benue River, while the coastal saline wetlands consists of the Cross River estuary, Imo River, Qua Iboec River estuary and the Niger River. A stretched expanse of about 2,988,000 hectares of the terrestrial lands in Nigeria is categorized as wetlands, while the freshwater swamp and mangrove region are about 2,130,000 hectares and 858,000 hectares, respectively (Olalekan, Abimbola, Saheed and Damilola, 2014). The value and resources of the Nigeria freshwater wetlands could produce about 510,000 tonnes of fish, vertebrates’ worth over 14 reptile species, 7 mammal species, 5 amphibians, about 72 birds’ species and over 200 species of fish (Olalekan, Abimbola, Saheed and Damilola, 2014). The economic importance of wetlands in Nigeria includes food (fish, crab, snail, periwinkles, etc) freshwater for agriculture, timber product (chewing sticks, transmission poles, genetic materials (medicinal species), erosion regulating, sites for festivals, etc.
The Niger Delta wetland is the largest in Africa and is the third largest mangrove forest in the world, and has been declared a key zone for conservation of the western coast of Africa (Okonkwo, Taylor and Kumar, 2015). Another prominent wetland in Nigeria is the Hadejia-Nguru wetland, which is the first Ramsar site in Nigeria , located in the northeast Nigeria, and is known for recharge and replenishment of underground water in the Komadugu-Yobe Basin.
Majority of the threats to Nigerian wetlands include oil spillage, industrial waste pollution, population pressure, rapid urbanization, mining, dam construction and transportation routes among others. Dredging leads to total eradication of seabeds, seagrasses and marine animals like turtles and physico-chemical changes in water. As mentioned above, wetland reclamation in Lagos was reduced from 708.96 hectares (52.68) in 1965 to 7.10
hectares (0.53%) in 2005 (Olusola, Muyideen and Abel, 2016). Oil spillage/disaster in places like Ogoni land, Okrika, destroyed wetlands in the area. According to Albert, Amaratunga, and Haigh (2018), there were 9,434 oil spillages in the Niger Delta between 2006 and 2015 with the oil emptied into estuaries, inland and coastal waters, land and swamps of Nigeria. Water pollution, urban sewage as in the case of Oguta Lake also degraded wetlands in Nigeria (Aigbedion et al., 2007). Other wetland issues include forest clearing for agriculture, urbanization, construction activities like sand- filling, etc. In addition, lack of monitoring mechanisms from government and lack of awareness by the inhabitants led to further loss of wetlands.
The Case Study of VietnamOver last fifteen years, the government of Vietnam has paid great attention to the formulation and completion of a legislation system ,which would set a legal foundation for national governance, and would create favourable conditions for international integration. A number of these regulations are related to wetland management. Legislation on environmental protection and nature conservation has contributed significantly to wetland protection. Vietnam has passed more than 500 regulations on environmental protection and nature conservation since 1976 (Vietnam Environmental Protection Agency, 2005). However, of these, only ten refer directly to wetlands, while the rest are indirectly related to the protection of various components of wetlands such as water resources and wildlife protection. The Land Law does not define wetlands as a separate land type. Instead, wetlands can be understood as “land for wet rice cultivation”, “land for salt production”, “land for aqua-cultural farming”, “special use forest land as national parks and nature reserves” and “rivers, streams, creeks, springs, and special use water surfaces (Vietnam Environmental Protection Agency, 2005).

28
Significant wetland issues in Vietnam include industrial wastes from vessels, production and processing plants. Industrial and processing parks of the southern focal economic development zone disposed of more than 137,000 m3 of waste per day (of which is 90 tonnes were solid wastes) into DongNai, ThiVai and SaiGon rivers (National Environment Agency, 2010). In 2005, toxic algae occurred again in Binh Thuan, causing negative effects to the environment and to tourism activities. The Sai Gon River has become heavily polluted with organic matters, exceeding national environmental standards by more than a factor of seven.
The use of explosive compounds and use of cyanide in fishing have caused pollution in the benthic environment, and has destroyed the structure of coral reefs in Co To, Bach Long Vi and Con Dao Islands. This kind of practice has destroyed biotic communities and has left long-term negative impacts on the environment.
Review of Wetland Conventions, Policies and RegulationsThe Ramsar Convention is the intergovernmental treaty that provides the framework for the conservation and wise use of wetlands and their resources. It was adopted in Iranian city of Ramsar in 1975. Some countries had some forms of wetland policies even before the Ramsar. For instance, wetland regulation dated back from the pre-colonial period in Bayelsa state, where the Oporoma traditional institution regulated the sacred conservation, management and control of area (Adekola and Whanda, Ogwu, 2012). Others include the Convention on International Trade in Endangered Species of Wild Fauna and Flora (CITES), Convention on Biodiversity in1994, the Cartagena Protocol on Bio-safety 2004, the Aichi convention in 2002, etc. All the countries analyzed in this study have policies covering wetland preservations. But, available literature shows that even though these countries have the legal frameworks for wetlands, economic activities by individual and
government still defy the law. In Vietnam, the land law does not define wetlands as separate land type. Instead, wetlands can be understood as “land for wet rice cultivation”, “land for salt production”, etc. This defiles the purpose of wetland conservation and sustainability of biodiversity. Meanwhile, the Biodiversity Action Plan for aquaculture development in 2030 is being drafted in Vietnam.
Wetland Programmes in Sri Lanka, South Africa, Nigeria and VietnamThere are some wetland programmes for sustainable biodiversity existing in the countries under study. In Sri Lanka, private sector also participates in conservation of wetlands. A project has been carried out by United Dendro Energy (Pvt) Ltd as a part of Wetland Day celebrations, to remove exotic shrub Prosopis juliflora and exotic cactus Opuntia dillenii which invaded significant parts of the Ramsar site. Apart from that, Dilmah Conservation is involved with mapping important Kayankerni reef as a marine sanctuary (Wetland Conservation in Sri Lanka; Ramsar. Org).
Manalana wetland rehabilitation was prioritized by the government and a cost-benefit analysis undertaken after rehabilitation showed that the economic value of livelihood benefits increased by 294% from the degraded state. The wetland contributes in providing services (e.g. grazing, crops, crafting materials), estimated at 3,466 Rand per household per year to nearly 70% of local households (News24 Archives, 2018). Other restoration activities in South Africa include building of gabion structures, construction of structures that divert the flow of water or raise the water -table, as well as plugging of artificial drainage channels, and removal of invasive plants (South African Department of Environmental Affairs, 2014). Wetlands day is also facilitated in South Africa to promote wetland sustainability.
In Nigeria, there is community partnership with Shell company (in Niger Delta region) to restore wetlands. The Abobiri, Obia-

29
Countries Policies/Laws/Conventions Concerning WetlandsSri Lanka • The Sri Lanka Department of Wildlife Conservation (DWC) which is
the Ramsar Administrative Authority in the country and the other agency, is the Central Environmental Authority (CEA) who chairs the National Wetland Steering Committee and who was responsible for drafting the National Wetland Policy and Strategy in 2006.
South Africa • The National Environmental Management Act (NEMA) 1998 which provides principles to promote environmental management and decision-making (Government Gazette, 2014);
• The Environmental Conservation Act 1989 prohibits any form of harm to the environment (Government Gazette, 2014);
• The National Water Act 1998 promotes protection, conservation, good use and management of water bodies (Government Gazette, 2014); and
• The National Biodiversity Act 2004 which provides the framework for the protection of species and ecosystems that warrant national protection. (Government Gazette, 2004).
Nigeria • Wetland policies at federal, state and local levels and dated back to the pre-colonial period;
• Forestry Ordinance of 1916 where forest reserves were established by the central government and subsequently handed over to local authorities for management;
• Northern Nigeria Wild Animals Law of 1963, the Eastern Nigerian Wild Animals Law of 1965, and the Western State Forestry (amendment) Edict of 1969 (focusing on forestry and wildlife conservation);
• The Petroleum Act of 1969 prescribed rules for safe drilling, storage and handling of mineral oils by holders of land leases or licenses;
• Signing of Ramsar Convention in 2000;• National Oil Spill Detection and Response, 2006, etc.
Vietnam • Strategy on planning, rational utilization and protection of water resources in Vietnam;
• Management strategy to the year 2020 of the protected area system in Vietnam;
• Government Decree and Circular on the conservation and sustainable development of wetlands;
• Decision issued by the Minister of MONRE on the approval of the Action Plan on Conservation and Sustainable Development of Wetlands for the 2014-2020 periods;
• The Vietnam Biodiversity Action Plan to the year 2025 and vision to the year 2030 (currently being drafted).

30
yagha and Opume communities switched to wetland-friendly livelihood practices such as fish, periwinkle, plantation and poultry farming (Okonkwo, Kumar and Taylor, 2015). Regulatory agencies such as Nigerian Federal Environmental Protection Agency (FEPA), Nigerian National Environmental Standards and Regulations Enforcement Agency (NESREA) and Nigerian National Oil Spill Detection and Response Agency (NOSDRA) have often been stringent and forceful in their regulation of human activities and enforcement of environmental laws in wetland areas. These organizations collect fines from oil companies (especially) for failing to remediate oil impacts in the Niger Delta wetlands.
Vietnam has undertaken a number of communication, education and awareness-raising activities related to wetlands, including the use of mass media to publicise wetlands, their functions and values, management issues, and policy and institutional arrangements at the central and local levels on conservation and sustainable development of wetlands. Agricultural, forestry and fisheries extension activities have also been undertaken through the production of technical manuals relating to wetland utilisation. Wetland day is also celebrated in the country to mark the essence of wetland conservation. Some universities, such as the Vietnam National University in Hanoi and Can Tho University, have courses related to wetlands.
Conclusion and RecommendationsThe study focused on the conservation of biodiversity with particular emphasis on the economic importance of wetlands. Extant literature shows that unsustainable agricultural and industrial practices are the common cause of wetland degradation. Wetland degradation has increased in the past few decades globally, and particularly in the case of the countries undertaken for this study. In the countries
covered and even globally, there is an evidence of wetland degradation which negatively affect rural communities’ livelihood.
The study has found that wetlands have economic opportunities (energy generation, tourism, food security, biodiversity preservation, etc); and biodiversity resilience mechanisms (carbon sequestration, climate regulation, nutrient cycling, oxygen production and soil formation) in all the countries. Thus, countries can benefit from wetland conservation. There exist a number of programmes focussing on conserving wetlands in these areas. However, the government and other relevant stakeholders do not invest sufficiently in awareness, protection, rehabilitation, waste management, eco-friendly agricultural programmes, etc which can enhance wetland conservation. Even though legal frameworks exist globally and nationally to support wetland rehabilitation, there are implementation gaps, mostly in the developing countries.
The following recommendations have been made that can be adopted for wetland conservation.
• There should be environmental friendly programmes for the relevant stakeholders on sustainable agricultural and industrial practices— like training, impact assessment programmes, etc;
• There should be effective implementation, monitoring and regulating of wetland policies in the study area by imposing stricter options like fines, taxes, etc;
• The relevant s takeholders should sufficiently invest in wetland conservation programmes by allocating resources for maintenance and management of wetlands;
• There should be increased awareness on the sustainable use and economic importance of wetlands; and
• Effort to promote and enhance international cooperation on conservation and sustainable development of wetlands as contained in the SDG goal number 17, should also be made.

31
ReferencesAdekola, O.; Whanda, S. & Ogwu, F. (2012). “Assessment
of policies and legislation that affect management of wetlands in Nigeria”. Society of Wetlands (2012) 32:665–677 doi 10.1007/s13157-012-0299-3.
Aigbedion, I. Iyayi, S. E. Agbeboh, G. U. (2007). Prospect “Assessment and risk analysis: example from Niger Delta, Nigeria basin”. World Applied Science Journal, 2(6):569-574.
Bamidele, J. F. (2010). “Threats to sustainable utilization of coastal wetlands in Nigeria”. Journal of Nigerian Environmental Society (JNES) 5(3) 217-225.
Copeland, C. (2013). “Wetlands: An overview of issues”. Congressional Research Service, December 5.
Davinson, N. C. (2014). How much wetland has the world lost? Long-term and recent trends in global wetland area. Marine and Freshwater Research January, doi: 10.1071/MF14173
Department of Environmental Affairs (DEA) (2014). State of the wetlands in South Africa: State of the environment. Department of Environmental Affairs, South Africa.
Driver A., Sink, K. J., Nel, J. N., Holness, S., Van Niekerk, L., Daniels, F., Jonas, Z., Majiedt, P.A., Harris, L. & Maze, K. (2012). National biodiversity assessment 2011: An assessment of South Africa’s biodiversity and ecosystems. Synthesis Report. South African National Biodiversity Institute and Department of Environmental Affairs, Pretoria.
Emerton, L. and Kekulandala, D. C. B. (2003). Assessment of the economic value of Muthurajawela wetland.
Government Gazette (2014). “Environmental impact assessment regulations”. Department of Environmental Affairs, Vol. 594, No. 38282, Pretoria.
IUCN (2009) Forestry and protected areas. King, N., Rosmarin, T. & Friedman, Y. (2005). Biodiversity
and ecosystem health, South Africa Environment Outlook, Department of Environmental Affairs and Tourism, South Africa.
Lucy Emerton, L. D. C. B. Kekulandala (2003). “Assessment of the economic value of Muthurajawela wetland”. Occasional paper of IUCN, Sri Lanka.
Macfarlane, D., Holness, S. D., von Hase, A., Brownlie, S. & Dini, J. (2014). Wetland offsets: A best-practice guideline for South Africa. South African National Biodiversity Institute and the Department of Water Affairs. Pretoria.
National Environment Agency, 2001-2010. National Environment Protection Strategy.
News24 Archives. 60% of SA wetlands destroyed. Available from https://www.news24.com/Africa/
News/60-of-SA-wetlands-destroyed-20060717. [accessed Jul 12 2018].
Okonkwo, C. N. P., Kumar, L. and Taylor, S. (2015). The Niger Delta wetland ecosystem: What threatens it and why should we protect it? African Journal of Environmental Science and Technology, Vol. 9(5), pp. 451- 463, May. doi: 10.5897/AJEST2014.1841.
Olusola, A. M.; Muyideen, A. A. ; Abel, O. O. (2016). An Assessment of Wetland Loss in Lagos Metropolis, Nigeria. Country Studies, 6(7).
Albert, O. N., Amaratunga, D.; Haigh, R. P. (2018). Evaluation of the impacts of oil spill disaster on communities and its influence on restiveness in Niger Delta, Nigeria. Procedia Engineering 212, 1054-1061. https://doi.org/10.1016/j.proeng.2018.01.136
Ramsar Handbook (2010). National Wetland Policies. Ramsar Convention Secretariat
Rebilo LMFCM, Nagabhatla N (2007) Remote Sensing and GIS for wetland inventory: Mapping and change analysis. Journal of Environmental Management 90, 2144-2153.
Resources of Nigeria: Case Study of the Hadejia-Nguru Wetlands. Poult Fish Wildl Sci 2: 123.
Sevvandi Jayakody PHD ,Manjula Amararathne MSc, Gayashan M. Arachchige BSc, Achini Wathsala Fernando MPhil; Mainstreaming (2018): Wetlands into national planning Sri Lanaka.PDF
Sieben, E.J.J. (2011). Compiling vegetation data on wetlands in KwaZulu-Natal, Free State and Mpumalanga Providing Minimum Data Requirements and a Sampling Protocol. Water Research Commission. WRC Report No. KV.258/10.
South African National Biodiversity Institute (2013). Life: the state of South Africa’s biodiversity 2012. South African National Biodiversity Institute, Pretoria.
South African National Biodiversity Institute, South Africa. 2014. Rehabilitation Plan for the Hogsback Wetland Project, Eastern Cape: Planning Year 2014. Prepared by Jenny Youthed, Aurecon South Africa (Pty) Ltd as part of the planning phase for the Working for Wetlands Rehabilitation Programme. SANBI Report No. 109664/8800
Vietnam Environment Protection Agency (2005), Overview of wetlands status in Vietnam following 15 years of ramsar convention implementation, 2005.
Wet land conservation in Sri Lanka. from https://www.ramsar.org/news/wetland-conservation-in-sri-lanka.cited 13/7/2018
Wet land conservation in Sri Lanka. from https://www.ramsar.org/news/wetland-conservation-in-sri-lanka.cited 13/7/2018)


33
Dynamics of Trade Policies in Developing Countries Case studies of Sri-Lanka, Uruguay and Zambia
IV
Chandima Lakmali Withanage (Sri Lanka)
E.A. Anuradha Edirisinghe(Sri Lanka)
Jerad Wasantha Kannangara(Sri Lanka)
María Eugenia Pereira(Uruguay)
Reuben K. Walobele(Zambia)


35
IntroductionThe developing countries are facing challenges emerging from international trade. To adapt to these challenges, each country must design trade policy which is best suited to its economy, is comparatively advantageous , and has level of development. This paper seeks to explore the trade policy challenges of three developing countries, located in three different continents, namely, Sri Lanka, Zambia and Uruguay. They share the fact that they are developing countries, relatively small vis-a-vis others in their region, and they must look for the best strategy for sailing through testing times in the history of globalization.
The paper attempts to explain different instruments that each country must establish in its trade policy: tariff, non-tariff barriers, the signing of trade agreements and the role of the World Trade Organization in this regard. Subsequently, the reality of each country has been analyzed according to the latest trade policy review carried out by WTO.
Trade Policy and WTOT r a d e P o l i c y c o v e r s g o v e r n m e n t macroeconomic policy interventions to alter the volume, direction and composition of imports and exports. Each form of intervention in the tradable sector has distinct income and price effect that tend to alter resource allocation in production and consumption, thus affecting balance of payments, growth and income distribution. While tariff barriers have been losing importance in international trade, Non-tariff barriers have become more prominent in the current era. Each country defines its trade policy and proposes practices with the fundamental objective of influencing, in some way, the orientation, structure and volume of its foreign trade. The various instruments of trade policy include tariffs, import quotas voluntary export restraints and voluntary import expansions, national regulatory laws,
anti - dumping duties, subsidies among others.
To avoid that these barriers do not become distortive measures in the international trade, they have become a subject of negotiation in the multilateral arena (WTO), as well as in the bilateral treaties. To achieve the objective of free and fair trade and to maintain a transparent system ,WTO conducts Trade Policy Reviews of each of the member- country.
Trade Policy Of UruguayInternational trade plays an important role in this country’s gross domestic product (Fig 1.). According to the Trade Policy Review conducted by WTO (2018), trade accounted for 30% of the country’s GDP in 2017. Agriculture exports constituted the major chunk of total exports. Uruguay is major producer of products such as meat, soybean, cereals and dairy products among others. Currently, the country produces food for 30 million people per year, but this number can increase to 50 million people (Uruguay XXI, 2017). In this sense, Uruguay is a country that can play an important role in ensuring Food Security for those countries that face difficulties in achieving it.
Exports are composed mainly of agro-industrial products (Fig 2.). Almost 50% of exports are concentrated in 3 chapters of the Harmonized System—02 Meat (22%), 12 Soya (16%), 44 Wood and wood products (12%). As agriculture plays an important role in overall export profile of the country, it is really committed to agriculture negotiations under the WTO, an example of this is its active participation in groups, such as G20 and Cairns Group.
Uruguay has a negative balance of trade, with imports exceeding exports. However, this trade deficit has been shrinking over recent years. China is the main trading partner of Uruguay, being the main destination of exports and imports in 2017 (Fig 3.). China constituted 22% of exports in the last year, thus surpassing the traditional trading partners of

36
Figure. 1: Exports and Imports of Uruguay
Figure 2 : List of products exported by Uruguay in 2017
Source: TradeMap.org.
Source: TradeMap.org.

37
Uruguay i.e. Brazil (16 %) and Argentina (5%). However, Uruguay does not have any Free Trade Agreement (FTA) with China.
The main import product in 2017 was mineral oils (50%), followed by Vehicles, electrical machinery, plastics, chemicals, fertilizers (Fig. 4). As can be easily seen, unlike export goods that are mainly composed of agricultural products and those with low industrial processes, imports are mainly of NAMA goods.
Uruguay is a country committed to multilateral and regional negotiations. It is an original member of the WTO, ratifying its main agreements. Recently, in 2014, Uruguay signed the Protocol Amending the Agreement on Trade-Related Aspects of Intellectual Property Rights (TRIPS), while in 2016, it notified the ratification of the agreement on Trade Facilitation.
To understand the Trade policy of Uruguay, it must be understood that this country belongs to the Common Market of the South (MERCOSUR). The Mercosur emerged in
1991 and aims to become a common market. However, this integration process has not managed to achieve its original objectives since it has not managed to perfect its requirements of Customs Union, and there are currently a significant number of exceptions to integretion process, such us non-tariff barriers in the intra-zone trade. These measures have been especially strengthened during the first decade of this centurydue to the economic crisis and changes in governments (which led to more protectionist policies by the States). On the other hand, it should be mentioned that the Common Customs Code and the Customs Income Distribution System have not yet entered into force (Bartesaghi, 2015).
Tariff Barriers in UruguayUruguay has a common trade policy with its MERCOSUR partners, the main instrument being Common External Tariff (CET). The average tariff rate is 9.4% with a minimum of 0% and a maximum of 30%. It is important to highlight that all tariffs applied by Uruguay are Ad Valorem. Among the exceptions that exist, a special regime can be found for capital
Figure 3: Uruguay Exports by destination
Source: TradeMap.org.

38
Figure 4: List of products imported by Uruguay in 2017
Figure 5: Supplying markets for a product imported by Uruguay
Source: TradeMap.org.
Source: TradeMap.org.

39
goods and for information and technology products, where it can apply a tariff above the common one.
According to data obtained in the Trade Policy Review of the WTO (2018), there are no large differences in the average tariffs applied to agricultural products and NAMA products. The averages of the agriculture products are 9.6% and the NAMA are 9.4%. The WTO emphasizes that the average tariff is relatively low in comparison with other countries. the products with the highest tariff protection (35%) correspond to textile products. The tariff rate is high due to the quality of the workforce it employs (mainly women and with low level of formal education).
Non Tariff Barriers In UruguayIn the latest review of Uruguay’s trade policy (2018) it has been highlighted that the country levy low number of non-tariff barriers. The work done in implementing measures related Trade Facilitation Agreement was also highlighted including implementation of the Single Window system, use of digital customs clearance forms and an electronic payment system and the implementation of a certification
system for Authorized Economic Operators (AEO). However, Uruguay has increased the consular rate from 2% to 3% for MERCOSUR member- countries, and from 3% to 5% for the rest of the countries. The increase in the consular rate is having a negative impact.
Uruguay does not have quantitative restrictions on trade such as quotas. But, Uruguay imposes import restrictions and prohibitions to protect national security, public health, plant and animal health, and the environment. The number of products subject to prohibition decreased during the review period from 652 in 2012 to 323 in 2017. Regarding automatic import licenses, the majority of these are concentrated in vehicles and automóviles sector. The average number of days to get the license varies between 1 and 10 days. Regarding non-automatic licenses, there are 7 such licenses which are applicable to sugar sector, organic chemicals, and nuclear reactors. These licenses may take 15 days for approval. It is important to remember that in Uruguay the licenses are applied by decree of the government, and can be eliminated without the need for the participation of the legislative body.
Figure 6: Exports and Imports of Sri Lanka
Source: TradeMap.org.
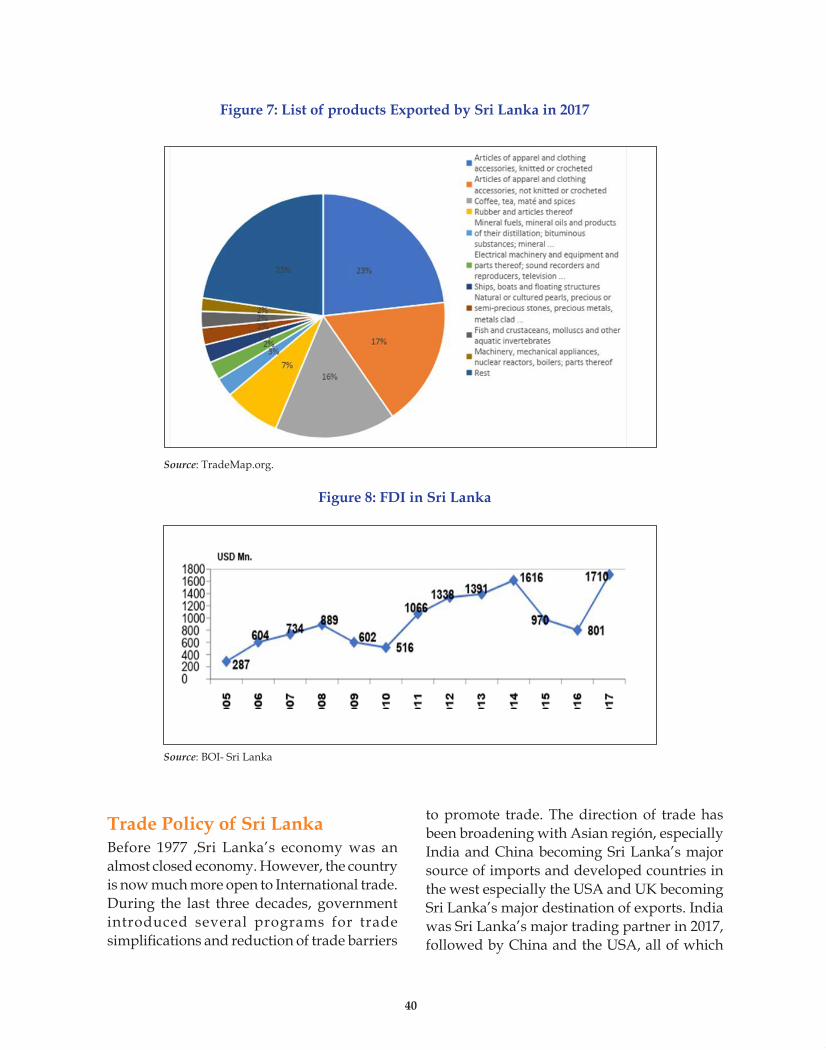
40
Trade Policy of Sri LankaBefore 1977 ,Sri Lanka’s economy was an almost closed economy. However, the country is now much more open to International trade. During the last three decades, government introduced several programs for trade simplifications and reduction of trade barriers
Figure 7: List of products Exported by Sri Lanka in 2017
Figure 8: FDI in Sri Lanka
Source: TradeMap.org.
Source: BOI- Sri Lanka
to promote trade. The direction of trade has been broadening with Asian región, especially India and China becoming Sri Lanka’s major source of imports and developed countries in the west especially the USA and UK becoming Sri Lanka’s major destination of exports. India was Sri Lanka’s major trading partner in 2017, followed by China and the USA, all of which

41
together contributed to around 40 per cent of the total trade with Sri Lanka.
Imports are in excess of export earnings (Fig. 6); balance of trade has been in deficit since 1977 in Sri Lanka. The trade deficit widened to US dollars 9.6 billion in 2017 from US dollars 8.8 billion in 2016, due to increased expenditure on imports as the effects of adverse weather conditions and climb up of international commodity prices. The trade deficit expanded to US$ 8,873 Mn recorded in 2016. As percentage GDP, the trade deficit was recorded at 11% in 2017 compared to 10.9% in 2016. However, export grew significantly in 2017 to US$ 11.360 Bn because of continued inflows by way of tourism earnings and worker’s remittances;both cushioned substantially the trade deficit.
The share of exports was dominated by primary commodities including Tea, Rubber, Coconut, Spices, Fish (24.4% in year 2017); textiles and garments, which provided the largest contribution to industrial exports (44.3% in year 2017) (Fig. 7). Imports of Sri Lanka gradually shifted from consumer goods to (21.5% in year 2017) intermediate goods to (54.5% in year 2017) and to nvestment goods (23.3 % in year 2017).
Sri Lanka is an attractive FDI destination due to the many incentives in place for investment. According to Board of Investment data, FDI inflows grew steadily and reached US$1.6 billion in 2014 and FDI inflows increased to US$1.7 billion in 2017. The telecommunications sector was the largest recipient of foreign investment, followed by manufacturing, infrastructure projects and services. China, Malaysia, Hong Kong, India and UK were the top five source counties of FDI (Fig. 8).
Tariff Barriers The applied MFN tariff in Sri Lanka consists of ad-valorem rates, specific rates, and alternate rates. The tariff lines varied between 0% and 30%, and most of the tariff was applied on an
ad-valorem basis (WTO (2016). Sri Lanka Trade Policy Review). The 2017 tariff, which was based on the HS 2017 nomenclature, comprised 7,438 lines at the eight-digit level (Table 1).
Table 1: Tariff Structure as at 31.12.2017
tariff RateNo of Tariff Lines
(2017 Version : 8 digits )
Percentage
Free 4064 54.645% 2 0.0310% 9 0.1215% 1534 20.6225% 25 0.3430% 1454 19.5575% 3 0.0485% 1 0.01125% 5 0.07Specific 72 0.96Specific & Advelorum
269 3.62
total 7438 100
Source: Annual Report, Department of Trade and Investment Policy (2017)
Tariff PreferencesSri Lanka is a pioneer member of the General Agreements on Trade and Tariff. (GATT) Further Sri Lanka holds the membership of the World Trade Organization (WTO). Sri Lanka has a bilateral trade agreements with India, Pakistan and Singapore, and plans are underway for negotiation of bilateral agreements with several others countries including China, Thailand and Bangladesh. In addition, regional integration is expected to strengthen further through trade and partnership agreement with India, which is currently under negotiation. Furthermore Sri Lanka is a party of several regional trade agreements such as the Bangkok agreement (APTA), South Asian Preferential Trade Agreement (SAFTA) and Bay of Bengal Initiative for Multi-Sector Technical & Economic Co-operation(BIMST-EC) has proposed regional frame work agreement. Sri Lanka benefitted from the GSP facility from 2017, offered by several developed countries, including the EU, USA, Australia, Canada, Japan, Russian Federation and Turkey.

42
Figu
re 9
: Zam
bia’
s M
FN a
nd P
refe
rent
ial T
arif
fs
Sour
ce: U
NC
TAD
, 201
6:26
.

43
Non-Tariff Barriers According to the trade policy review of Sri Lanka in 2016, non-tariff barriers as other charges affecting imports, including the number of para tariffs Export Development Board Levy (Cess), Ports and Airport Development Levy and Excise Duty, Value Added Tax (VAT), Nation Building Tax, and the Special Commodity Levy. However measures were taken to phase out para tariff in 2017.
Sri Lanka has introduced a single window system in January 2016. And the country has started implementing the WTO Customs Valuation Agreement from7 January 2003. Further, Sri Lanka also applies preferential rules of origin under bilateral and regional trade agreements.
Zambia and Free TradeBefore Independence, the country was engaged as the result of the British whose policies were liberal. A few years after independence, Zambia nationalized all enterprises and followed a protectionist policy close to three decades. It should be pointed from the outset that Zambia was one of the most industrialized newly independent states with twice gross national product of South Korea with one of the highest per capita income in newly independent African countries (Rakner, Lise, 2003:44).
In the mid 1990s, the country embarked on the path of liberalization of the country’s economy by opening its economy to competition through signing various Free Trade Agreements (FTAs). Currently, the country is a member of a couple of regional trade bodies namely Southern Africa Development Community (SADC), which allow the zero rating of good and services within the member- states. Zambia is also a member of the Common Market for Eastern and Southern Africa and allows for the preferential tariff duties for member- states. Currently Zambia is involved in the rigorous negotiations of coming up with one Tripartite Free Trade Area that consists of the SADC, COMESA and the EAC, East Africa Economic Community.
Further, the country benefits from and entitled to benefits under the Africa Growth Opportunity Act (AGOA). Under this arrangement is duty- free and quota -free access to the US market for good ranging from textile and apparel.
Tariff BarriersZambia maintains a tariff regime on its imported goods, which are low and moderate. They are in four bands namely 0, 5, 15 and 25 for raw materials, capital gods, intermediate goods and finished goods (Fig. 9). Further, Zambia has bound tariffs at the WTO at a simple average of 106.5. (UNCTAD 2016:29)
Non Tariff Barriers Both imported and exported products face several export and import restrictions at the Zambian border. These stem from the need to protect local industry, self sufficiency, sanitary and phytosanitary measures, different interpretation of SADC and COMESA rules of origin, lack of implementation of the SADC and COMESA preferential trading rules and policy inconsistence (UNCTAD 2016:29).
Goods such as cement, sugar and wheat attract restrictions as a justification of protection of local industry. Further, there are bans on export of corn and certain species of timber (Mukula) among others for food security and preventing environmental degradation and extinction, respectively.
UNCTAD in its Trade Policy Review for Zambia, points out that the country’s trade policy framework must identify and tackle the problems and constraints faced by exporters at every stage forthe process of production of goods and services for exports (UNCTAD, 2016:26).
Secondly, the policies emphasise that country has not made use of the comparative advantage to maximize the benefits out of the FTAs, Common Market and the Tripartite arrangement.

44
Figure 10: Exports of Zambia in 2017
Figure 11: Zambia’s Imports in 2017
Source: TradeMap.org.
Source: TradeMap.org.

45
Towards Improved Export Of High Value Manufactured Goods
Since early 70s, when the country saw the danger of depending on copper as the major product, the policy makers started thinking of economic diversification. This was however, very difficult in the era of socialism and the absence of Foreign Direct Investment (FDI). As such the policy remained on paper until recently when successful governments have committed to the establishment of Multi-Facility Economic Zones (MFEZs). Currently, Zambia has successfully managed to put up three MFEZs—one on the copperbelt (Chambishi Multi-Facility Economic Zone) and two in the capital Lusaka namely Lusaka East and Lusaka South Economic Zones.
Currently the country export copper and a few agricultural products whilst imports include mainly machinery, automobiles, petroleum products among other (Fig. 10 and Fig. 11).
Conclusion and Recommendations As a Member of MERCOSUR, trade policy of Uruguay is tied to other members of this process. In the last six months MERCOSUR started negotiations with Canada, Korea and will launch the negotiations with Singapore. As most of the exports of Uruguay are agriculture based products, the trade barriers in the developed countries are high; and this issue needs to be resolved at the regional and multilateral levels. Opportunities should be explored to enter into FTA with China.
In the case of Sri Lanka, the Government has identified the need to reform its trade policies and practices in order to support a more business-friendly environment, promote private sector for growth and use the strategic position of the country to improve its competitiveness in the global market and to attract FDI.
In case of Zambia the empirical evidence shows that the trade volumes have increased since signing of SADC-FTA. Currently, Zambia
and other members of the SADC, COMESA and the East Africa Community (EAC) are in the negotiation stage of signing a Tripartite agreement between the three regional blocks to enhance trade in these regions. Further, Zambia has no defined bilateral framework for trade with her biggest export destination i.e. Switzerland ; opportunities should be explored to sign FTA with it.
ReferencesBartesaghi, I. (2015). Algunas reflexiones sobre el
Mercosur: propuestas para una necesaria reforma. In Análisis & Perspectivas, Nro. 3. Available on: https://ucu.edu.uy/sites/default/files/pdf/2015/Algunas_reflexiones_sobre_el_Mercosur_Informe_Bartesaghi.pdf
· Central Bank of Sri Lanka (2017). Annual Report. Available on: https://www.cbsl.gov.lk/en/publications/economic-and-financial-reports/annual-reports/annual-report-2017
· Cuthbertson, Sandy (2003),Tariff and Trade Policy Framework for Sri Lanka in 2003. Tariff Advisory Council, Sri Lanka.
· UNCTAD (2016). Zambia: Harnessing the Potential for Trade and Sustainable Grow in Zambia. UNCTAD: Geneva.
· Uruguay XXI (2017). Presentation of Uruguay. Available on: https://www.uruguayxxi.gub.uy/uploads/informacion/846413dd351c2212c70dc488ecb96b22c0aa5dc0.pdf
· WTO (2014). Technical Barriers to Trade. The WTO Agreements series. Available on: https://www.wto.org/english/res_e/publications_e/tbttotrade_e.pdf
· WTO (2016). Sri Lanka Trade Policy Review.Available on: https://www.wto.org/english/tratop_e/tpr_e/tp447_e.htm
· WTO (2016). Zambia Trade Policy Review. Available on: https://www.wto.org/english/tratop_e/tpr_e/tp440_e.htm
· WTO (2018). Uruguay Trade Policy Review. Available on: https://www.wto.org/english/tratop_e/tpr_e/tp474_e.htm


47
SDGs: Can it Spur Economic Growth in Developing Countries?
V
Tajaddin Bayramov(Azerbaijan)
John Stephen Mukwaya(Uganda)
Jaya Bissessur(Mauritius)
Hikmatullo Khojaev(Tajikistan)


49
IntroductionThe Sustainable Development Goals (SDGs) were born at the United Nations Conference on Sustainable Development in Rio de Janeiro in 2012. The objective was to produce a set of universal goals that meet the urgent environmental, political and economic challenges facing the world. Building on the principle of “leaving no one behind”, the new Agenda emphasizes a holistic approach to achieving sustainable development for all. The SDGs consist of 17 goals and 169 targets. The 17 SDGs include: No Poverty, Zero Hunger, Good Health and Wellbeing, Quality Education, Gender Equality, Clean Water and Sanitation, Affordable and Clean Energy, Decent Work and Economic Growth, Industry, Innovation and Infrastructure, Reduced Inequality, Sustainable Cities and Communities, Responsible Consumption and Production, Climate Action, Life Below Water, Life on Land, Peace and Justice Strong Institutions, Partnerships to achieve the Goal. The SDGs work in the spirit of partnership and pragmatism to make the right choices for improving quality of life in a sustainable way. They provide clear guidelines and targets for all countries to adopt in accordance with their own priorities and the environmental challenges of the world at large. The SDGs are an inclusive agenda. They tackle the root causes of poverty and unite all together to make a positive change for both people and planet.
The SDGs replaced the Millennium Development Goals (MDGs), which started a global effort in 2000 to tackle the indignity of poverty. In response to the accusation that the MDGs were too narrow in focus, the SDGs, over and above the Millennium Development Goals, also include new areas such as climate change, economic inequality, innovation, sustainable consumption, peace and justice, among other priorities. Along with being more all-encompassing, the consultation process was also much more inclusive – Ban Ki-moon called it the “most transparent and inclusive
process in UN history”. The goals are also interconnected in nature – often the key to success on one that will involve tackling issues more commonly associated with another.
Though all goals are unique and require attention of all the countries, this paper will prioritize Sustainable Development Goal 8, which is, ‘Decent Work and Economic Growth’. As roughly half of the world’s population still lives on the equivalent of about US$2 a day and in too many places, having a job doesn’t guarantee the ability to escape from poverty. A continued lack of decent work opportunities lead to an erosion of the basic social contract underlying democratic societies: that all must share in progress. According to ILO, employment growth since 2008 has averaged only 0.1% annually, compared with 0.9% between 2000 and 2007. By 2019, more than 212 million people will be out of work, up from the current 201 million; 600 million new jobs need to be created by 2030, just to keep pace with the growth of the working age population.
Thus, the central question addressed in this paper is how is economic growth, as a part of SDGs, is contributing to decent jobs and living in developing countries? To answer this question, we will analyze information for four developing countries, namely: Mauritius, Uganda, Azerbaijan, and Tajikistan.
Case Study for MauritiusOverview of the EconomySince independence in 1968, Mauritius has undergone a remarkable transformation from a low income, agricultural based economy, to a diversified upper middle income economy with a growing industrial, financial and tourist sectors. Mauritius has successfully transitioned from an agricultural to a manufacturing and tourism- basedeconomy.
The presence of strong institutions in a politically stable and successful business environment combined with effective use of

50
trade preferences (particularly with Europe and India) have been influential in accelerating growth and facilitating economic diversification.
Mauritius has a liberal economic and trade policy and is a member of WTO, as well as many other regional economic groups. Moreover, the country has been successful in the process of trade liberalization in the context of COMESA FTA and SADC FTA, respectively, and is also involved in the negotiations of COMESA – EAC- SADC Tripartite with the main objective of enlarging the Free Trade area which would encompass the three economic regional communities.
Unemployment is nevertheless a current challenge for the government of Mauritius, especially among less skilled women and youth. From Table 1, it can be noted that since the financial crisis in 2008, unmployment has remained stagnant at around 8 per cent over the last five years. It is observed that unemployment level is significantly higher among women (11 per cent) and youth (26.3 per cent). Further, female labour force participation is discouraged, among other things, by a wage gap of 50 per cent vis-à-vis men even after controlling for education, age and other variables.
The overall economic outlook in Mauritius is favourable although it is prone to a number of downside risks. One reason could be the continued low growth experienced by Europe which has adversely affected tourism, trade and the foreign Direct Investment. On the domestic
side, the risks emanating from the public debt should be managed since the external debt registered is relatively low with long maturities and favorable terms. On the other hand, if the public debt is not reduced from its relatively high level, vulnerabilities could arise. Income and corporate tax are low and are set at just 15 % and thus represent an aspect that could be considered for reform.
A new development agenda : “ Transforming Our world : The 2030 Agenda for sustainable development ” has been adopted by the United Nations with a view to achieve a better future for all citizens and it will lay out the foundations for the next 15 years to reduce extreme poverty, fight inequality and injustice, and protect our planet. In this respect, Mauritius, together with 193-Member States, adopted the Agenda which clearly describes the world we want. In addition, it serves as the structure for all necessary efforts across sectors of the economy and all levels as well as for SDG integration in the national priorities and plans. Mauritius has explored the institutional coordination mechanisms and arrangements that would be vital in ensuring consistency and making progress on SDG goals and targets.
Economic ChallengesMauritius is seeking a second economic miracle as economic growth has been decelerating. Furthermore, growth has not fully resulted into poverty reduction, job- creation and improved quality of jobs. It is worth noting that achieving
Table 1: Mauritius: Key Selected Economic Indicators
2012 2013 2014 2015 2016Output (real GDP %) 3.2 3.2 3.6 3.4 3.8Unemployment ( %) 8.0 8.0 7.8 8.0 7.7Budgetary revenue incl grants (%) 21.4 21.4 20.6 20.6 21.9Budgetary expenditure (%) 23.6 24.6 24.8 23.9 25.3Public Debt ( domestic and external) 51.5 53.9 56.1 58.0 63.7Current Account -7.3 -6.3 -5.6 -5.1 -4.5
Source : IMF 2016

51
comprehensive and sustainable economic growth will require necessary measures and investments in key sectors. At the same time, it was felt that the traditional sectors such as sugarcane, tourism and manufacturing be revamped and diversified using the Small Medium Enterprises (SMEs), which could be given the opportunity to boost and flourish. They could also be regarded as the new backbone of innovative development together with other strategic areas like technology and innovation, ocean economy, trade in gold and precious stones. Moreover, it was felt that progress across the different sectors would benefit the poorest and most vulnerable persons who are still not actively participating in the economy.
In addition, the global financial and economic crisis have had a significant impact on Small Island Developing States (SIDS) and they have experienced limited access to affordable credit. Moreover, the existing frameworks for evaluating loan eligibility and assessing interest rates for lending are based on GDP and do not consider the vulnerabilities of SIDS. As a result, Mauritius currently faces many challenges that hinder its economic growth.
Case Study for TajikistanTajikistan is a mountainous, landlocked country in Central Asia with an estimated population of 9 million people as of 2018, and an area of 143,100 km2 (55,300 sq mi). It is bordered by Afghanistan to the south, Uzbekistan to the west, Kyrgyzstan to the north, and China to the east.
Tajikistan’s economy depends on agriculture, which employs two-fifths of the labour force. In the agriculture sector, land tenure for individual and family farms has increased. More than 122,000 individual and family farms have received land rights certificates, benefiting more than 350,000 shareholders, of whom 43% were women. Tajikistan’s light industry is also based on its agricultural production and
includes cotton-cleaning mills and silk factories; the Dushanbe textile complex is the country’s largest.
Tajikistan possesses rich mineral deposits. Energy resources include sizable coal deposits and smaller reserves of natural gas and pe-troleum. Some of the fast-flowing mountain streams have been exploited as hydroelectric power sources. Most of the electric power gen-erated in Tajikistan is hydroelectric. The Central Asia-South Asia power project, commonly known by the acronym CASA-1000, is a $1.16 billion project; currently under construction that will allow for the export of surplus hy-droelectricity from Tajikistan and Kyrgyz-stan to Pakistan and Afghanistan.
Economic growth and ChallengesTajikistan’s real GDP growth accelerated to 7.1% in 2017 from 6.9% a year ago. The economy was largely fueled by private consumption, supported by remittances and net exports and boosted by metallic minerals. On the supply side, growth was supported by both the tradable and non-tradable sectors, with the highest contribution from industry followed by agriculture and services.
Tajikistan has achieved rapid poverty reduction over the past two decades, mainly due to a favorable external environment. Poverty fell from over 83% to about 47% between 2000 and early 2009, and from 37% to 31% between 2012 and 2016.
Unemployment level in Tajikistan has considerably lowered in last three years. In January 2018, it was recorded as 2.1%, which was the lowest statistics since the last 10 years. Landlocked country’s main employment has been dominated by agricultural sector. On the other side, the government softens financial policy to attract foreign investment to the country. The difficult environment for doing business in Tajikistan, as well as obstacles to foreign direct investment (FDI), have

52
discouraged private investment and limited overall investment. Greater private investment and new business development are crucial prerequisites to increase job- creation.
SDGs in Tajikistan
The National Development Strategy 2016–30 envisions improving the living standards of the population in four main areas: (i) achieving energy security; (ii) improving transport and communication connectivity; (iii) improving food security and the population’s access to good quality nutrition; and (iv) expanding productive employment.
The recently adopted National Development S trategy (NDS) -2030 and Mid- term Development Program of the Republic of Tajikistan for 2016-2020 (MTDP 2020) are two key tools for nationalization of the SDGs, and their further integration into the national development policy.
Thus, NDS-2030 will be considered as a main strategy around which stakeholders will be implementing the SDGs,and will become the main enabler for achieving national development goals.
Eventually, to achieve higher growth, Tajikistan needs to implement a deeper structural reform agenda designed to: (a) reduce the role of the state and enlarge that of the private sector in the economy through a more favorable business climate, thus increasing private investment and generating more productive jobs; (b) modernize and improve the efficiency and social inclusiveness of basic public services; and (c) enhance the country’s connectivity to regional and global markets and knowledge.
Case study for UgandaThe Republic of Uganda is a landlocked country in East Africa with the current population of 44,297,336 equivalent to 0.58% of the total world population with National GDP of 2,552.79 USD. Uganda’s Vision 2040
provides development paths and strategies to operationalize Uganda’s Vision statement which is “A Transformed Ugandan Society from a Peasant to a Modern and Prosperous Country within”. Although abundant in natural resources, Uganda is one of the poorest countries in the world. In recent years, with help of foreign assistance, the government stabilized the economy and increased investments on education and infrastructure. The Vision 2040 is conceptualized around strengthening the fundamentals of the economy to harness the abundant opportunities around the country. The identified opportunities include: oil and gas, tourism, minerals, ICT business, abundant labour force, geographical location and trade, water resources, industrialization, and agriculture among others that are to date considerably under-exploited.
At the same time, Uganda has introduced ambitious public sector reforms in the past two decades. This has resulted in the creation of a robust formal governance system and has helped improve public sector management and institutional quality. Voice and accountability, which improved between 2003 and 2008, have declined sincethen , however. Uganda’s economy is projected to grow by 5.0% to 5.50%,
Growth projections have indicated that Uganda would graduate into a lower middle income country by 2017, progressing to an upper middle income category by 2032 and attaining its target of USD9500 in 2040. Projections further indicate that Uganda will be a first world country in the next fifty years. To achieve this transformation the average real GDP growth rate will have to grow consistently at about 8.2 per cent per annum, translating into total GDP of about USD 580.5bn with a projected population of 61.3 million in 2040.
Key strategies for sustained economic growth are as follows.
• The government reviewed service delivery system to be acting as a unit, harness ing synergies and delivering public services efficiently and effectively.

53
• Pursue urbanization policy that has brought about better urban systems that enhance productivity, livability and sustainability while releasing land for commercializing agriculture.
• The Government has strengthened the three arms of government and has ensured checks and balances and taking decisions that have national interest first
• The Government has developed and nurtured a national value system to change citizens’ mind sets, promote patriotism, enhance national identity and nurture a conducive ideological orientation
Objectives• I n c r e a s e s u s t a i n a b l e p r o d u c t i o n ,
productivity and value addition in key growth opportunities.
• Increase the stock and quality of strategic infrastructure to accelerate the country’s competitiveness.
• Enhance human capital development; and• Strengthen mechanisms for quality, effective
and efficient service delivery
• Priority Areas and Strategic InterventionsSocio-Economic Challenges faced by Uganda
include Influx of refugees in the country, high levels of corruption, political disruptions, poor health condition, and climatic changes.
To propel the country to middle income status in the next five years would be through prioritizing investment in five key growth drivers with the greatest multiplier effect as identified in the Uganda Vision 2040. The plan has prioritized five key growth drivers namely—Agriculture, Tourism, Minerals, Oil and Gas, Infrastructure, and Human Capital Development.
Case Study for AzerbaijanAzerbaijan, is a republic in southeastern Europe and Western Asia, in the South Caucasus region. It is borders Armenia, Georgia, Iran, Russia, and Turkey.
At the beginning of the 20 th century, Azerbaijan was the world’s leading petroleum producer, and it was also the birthplace of the oil-refining industry. In 1901, for example,
Figure: Unemployment Rate, Tajikistan, 2008-2018
Source: National Bank of Tajikistan (2018)
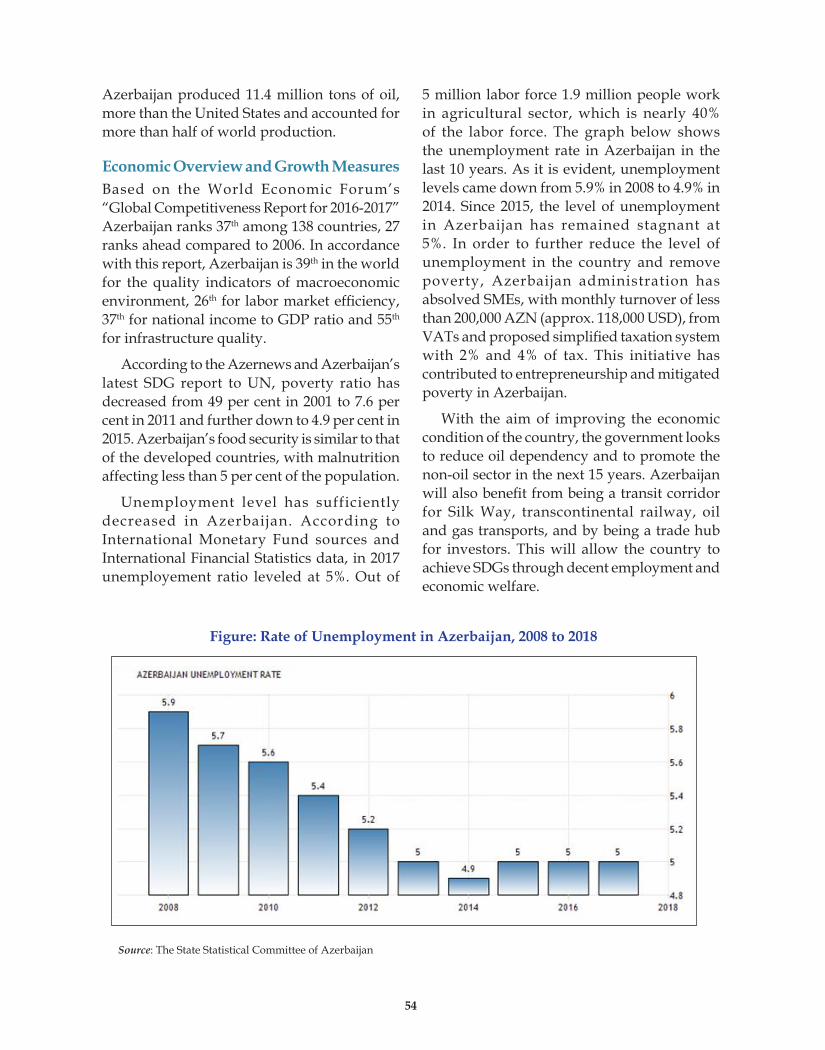
54
Azerbaijan produced 11.4 million tons of oil, more than the United States and accounted for more than half of world production.
Economic Overview and Growth MeasuresBased on the World Economic Forum’s “Global Competitiveness Report for 2016-2017” Azerbaijan ranks 37th among 138 countries, 27 ranks ahead compared to 2006. In accordance with this report, Azerbaijan is 39th in the world for the quality indicators of macroeconomic environment, 26th for labor market efficiency, 37th for national income to GDP ratio and 55th for infrastructure quality.
According to the Azernews and Azerbaijan’s latest SDG report to UN, poverty ratio has decreased from 49 per cent in 2001 to 7.6 per cent in 2011 and further down to 4.9 per cent in 2015. Azerbaijan’s food security is similar to that of the developed countries, with malnutrition affecting less than 5 per cent of the population.
Unemployment level has sufficiently decreased in Azerbaijan. According to International Monetary Fund sources and International Financial Statistics data, in 2017 unemployement ratio leveled at 5%. Out of
5 million labor force 1.9 million people work in agricultural sector, which is nearly 40% of the labor force. The graph below shows the unemployment rate in Azerbaijan in the last 10 years. As it is evident, unemployment levels came down from 5.9% in 2008 to 4.9% in 2014. Since 2015, the level of unemployment in Azerbaijan has remained stagnant at 5%. In order to further reduce the level of unemployment in the country and remove poverty, Azerbaijan administration has absolved SMEs, with monthly turnover of less than 200,000 AZN (approx. 118,000 USD), from VATs and proposed simplified taxation system with 2% and 4% of tax. This initiative has contributed to entrepreneurship and mitigated poverty in Azerbaijan.
With the aim of improving the economic condition of the country, the government looks to reduce oil dependency and to promote the non-oil sector in the next 15 years. Azerbaijan will also benefit from being a transit corridor for Silk Way, transcontinental railway, oil and gas transports, and by being a trade hub for investors. This will allow the country to achieve SDGs through decent employment and economic welfare.
Figure: Rate of Unemployment in Azerbaijan, 2008 to 2018
Source: The State Statistical Committee of Azerbaijan

55
Conclusion and RecommendationsDeveloping countries face certain political, economic, and environmental impediments and risks in achieving these goals. The key challenges are environmental and geographical inappropriateness, financial hardship, and availability of resources. In general, developing countries show an inclination towards adopting SDGs, specifically the ones prioritizing poverty reduction, economic growth and decent work.
However, the governments of the developing countries consistently need to take initiatives to implement the SDGs. In case of Small Island Developing States (SIDS), given their vulnerability and their disadvantage with regard to traditional markets, trade policy is helpful in strengthening their resilience. It is therefore, suggested that they establish a proper mechanism to promote intra-SIDS movement of goods, capital and professional services with flexible rules of origin. On the other hand, non-
Tariff Measures (NTMs) present a challenge for small economies in their efforts to compete in foreign markets. It is also recommended that the impact of Non-Tariff Measures on Small economies should be effectively addressed.
ReferencesThomson, S. (2015). What are the Sustainable Development
Goals? World Economic Forum. https://www.weforum.org/agenda/2015/09/what-are-
the-sustainable-development-goals/The World Bank in Tajikistan, World Bank Review http://
www.worldbank.org/en/country/tajikistan/overview
Uganda Economic Outlook 2017, PricewaterhouseCoopers Limited
https://www.pwc.com/ug/en/assets/pdf/economic-outlook-second-edition.pdf
WEF (2018). The Global Financial and Monetary System in 2030, World Economic Forum Report
https://www.weforum.org/reports/the-global-financial-and-monetary-system-in-2030


Research and Information System for Developing Countries (RIS) is a New Delhi-based
autonomous policy research institute that specialises in issues related to international
economic development, trade, investment and technology. RIS is envisioned as a forum
for fostering effective policy dialogue and capacity-building among developing countries
on global and regional economic issues.
The focus of the work programme of RIS is to promote South-South Cooperation and
collaborate with developing countries in multilateral negotiations in various forums. RIS
is engaged across inter-governmental processes of several regional economic cooperation
initiatives. Through its intensive network of think tanks, RIS seeks to strengthen policy
coherence on international economic issues and the development partnership canvas.
For more information about RIS and its work programme, please visit its website:
www.ris.org.in
RIS A Think-Tankof Developing Countries
Core IV-B, Fourth Floor, India Habitat CentreLodhi Road, New Delhi-110 003 India., Ph. 91-11-24682177-80Fax: 91-11-24682173-74, Email: [email protected]: http://www.ris.org.in
www.facebook.com/risindia @RIS_NewDelhi www.youtube.com/RISNewDelhi
Follow us on:
Global Perspectives onTrade and Sustainability
Capacity-Building Programme on Trade and Sustainability under the ITEC Programme of the Ministry of External Affairs, Government of India
(9-20 July 2018)