
Global Journal of Management and Business Research
84
FatTailsValueatRisk RiskandPalladiumReturns ContrabandonGovt.Revenue ImpactofDeficitFinancing VOLUME18ISSUE3VERSION1.0 OnlineISSN:2249-4588 PrintISSN:0975-5853 DOI:10.17406/GJMBR
-
Upload
khangminh22 -
Category
Documents
-
view
2 -
download
0
Transcript of Global Journal of Management and Business Research
Fat�Tails�Value�at�Risk Risk�and�Palladium�Returns
Contraband�on�Govt.�RevenueImpact�of�Deficit�Financing
VOLUME�18����������ISSUE�3����������VERSION�1.0
Online�ISSN�:�2249-4588Print�ISSN�:��0975-5853DOI�:�10.17406/GJMBR

Global Journal of Management and Business Research: B Economics and Commerce

Global Journal of Management and Business Research: B
Economics and Commerce
Open Association of Research Society
Volume 18 Issue 3 (Ver. 1.0)
All rights reserved.
This is a special issue published in version 1.0 of “Global Journal of Science Frontier
Research.” By Global Journals Inc.
All articles are open access articles distributedunder “Global Journal of Science Frontier
Research”
Reading License, which permits restricted use. Entire contents are copyright by of “Global
Journal of Science Frontier Research” unless otherwise noted on specific articles.
No part of this publication may be reproduced or transmitted in any form or by any means,
electronic or mechanical, including photocopy, recording, or any information
storage and retrieval system, without written permission.
The opinions and statements made in this book are those of the authors concerned. Ultraculture has not verified and neither
confirms nor denies any of the foregoing andno warranty or fitness is implied.
Engage with the contents herein at your own risk.
The use of this journal, and the terms and conditions for our providing information, is
governed by our Disclaimer, Terms and Conditions and Privacy Policy given on our
By referring / using / reading / any type of association / referencing this journal, this
signifies and you acknowledge that you have read them and that you accept and will be
bound by the terms thereof.
All information, journals, this journal, activities undertaken, materials, services and our website, terms and conditions, privacy policy, and this journal is subject to change
anytime without any prior notice.
Incorporation No.: 0423089License No.: 42125/022010/1186
Registration No.: 430374Import-Export Code: 1109007027
Employer Identification Number (EIN): USA Tax ID: 98-0673427
website http://globaljournals.us/terms-and-condition/menu-id-1463/
© Global Journal of Management and Business
Research. 2018.
Global Journals Inc. (A Delaware USA Incorporation with “Good Standing”; Reg. Number: 0423089)Sponsors: Open Scientific Standards
Publisher’s Headquarters office
Offset Typesetting
Packaging & Continental Dispatching
Find a correspondence nodal officer near you
To find nodal officer of your country, pleaseemail us at [email protected]
eContacts
Press Inquiries: [email protected] Inquiries: [email protected] Support: [email protected] & Releases: [email protected]
Pricing (E xcluding Air Parcel Charges):
Open Association of Research Society
Global Journals Incorporated2nd, Lansdowne, Lansdowne Rd., Croydon-Surrey, Pin: CR9 2ER, United Kingdom
Global Journals Pvt LtdE-3130 Sudama Nagar, Near Gopur Square, Indore, M.P., Pin:452009, India
USA Toll Free: +001-888-839-7392 USA Toll Free Fax: +001-888-839-7392
945th Concord Streets,
United States of AmericaFramingham Massachusetts Pin: 01701,
Global Journals Headquarters®
Yearly Subscription (Personal & Institutional) 250 USD (B/W) & 350 USD (Color)

Editorial Board Global Journal of Management and Business Research
Dr. John D. Theodore Prof. Moji Moatamedi
American Military University
JDT Management Consultants, President.
D.B.A., Business Economy
University of South Africa
Ph.D. Aristotelian University
Business Administration
Ph.D. Administration, University of Kansas
USA
Honorary Vice Chair
Ph.D., at The University of Sheffield,
MBA, Manchester Business School
University of Manchester
UK
Dr. R. Allen Shoaf Professor Maura Sheehan
B.A., M.A., Ph.D. Cornell University
Cornell University, Teaching Assistant in the English
Department,
University of Florida, US
Professor, International Management
Director, International Centre
for Management & Governance Research (ICMGR)
Ph.D. in Economics
UK
Dr. Mehdi Taghian Dr. Carl Freedman
Senior Lecturer
Faculty of Business and Law
BL Deakin Business School
Melbourne Burwood Campus
Australia
B.A., M.A., Ph.D. in English, Yale University
Professor of English, Louisiana State University, US
Dr. Agni Aliu Dr. Tsutomu Harada
Ph.D. in Public Administration,
South East European University, Tetovo, RM
Asociater profesor South East European University,
Tetovo, Macedonia
Professor of Industrial Economics
Ph.D., Stanford University, Doctor of Business
Administration, Kobe University
Dr. Wing-Keung Won Dr. Xiaohong He
Ph.D., University of Wisconsin-Madison,
Department of Finance and
Big Data Research Center
Asia University,
Taiwan
Professor of International Business
University of Quinnipiac
BS, Jilin Institute of Technology; MA, MS, Ph.D.,.
(University of Texas-Dallas)

Dr. Carlos García Pont Dr. Söhnke M. Bartram
Associate Professor of Marketing
IESE Business School, University of Navarra
Doctor of Philosophy (Management),
Massachussetts Institute of Technology (MIT)
Master in Business Administration, IESE, University of
Navarra
Degree in Industrial Engineering,
Universitat Politècnica de Catalunya
Web: iese.edu/aplicaciones/faculty/facultyDetail.asp
Department of Accounting and Finance
Lancaster University Management School
Ph.D. (WHU Koblenz)
MBA/BBA (University of Saarbrücken)
Web: lancs.ac.uk/staff/bartras1/
Dr. Bassey Benjamin Esu Dr. Dodi Irawanto
B.Sc. Marketing; MBA Marketing; Ph.D Marketing
Lecturer, Department of Marketing, University of Calabar
Tourism Consultant, Cross River State Tourism
Development Department
Co-ordinator, Sustainable Tourism Initiative, Calabar,
Nigeria
Ph.D., M.Com, B.Econ Hons.
Department of Management
Faculty of Economics and Business
Brawijaya University
Malang, Indonesia
Dr. Ivona Vrdoljak Raguz Dr. Yongbing Jiao
University of Dubrovnik,
Head, Department of Economics and Business
Economics,
Croatia
Ph.D. of Marketing
School of Economics & Management
Ningbo University of Technology
Zhejiang Province, P. R. China
Dr. Charles A. Rarick Yue-Jun Zhang
Ph.D.
Professor of International Business
College of Business
Purdue University Northwest
Hammond, Indiana US
Business School,
Center for Resource and
Environmental Management
Hunan University, China
Dr. Albrecht Classen Dr. Brandon S. Shaw
M.A. (Staatsexamen), Ph.D. University of Virginia,
German
Director, Summer Abroad Program, Medieval Europe
Travel Course
B.A., M.S., Ph.D., Biokinetics, University of Johannesburg,
South Africa
Professor Department of Sport and Movement Studies
University of Johannesburg, South Africa
Contents of the Issue
i. Copyright Notice ii. Editorial Board Members iii. Chief Author and Dean iv. Contents of the Issue
1. Viabilidad del Modelo de Gestión de la Innovación para Microempresas
Familiares del Sector Alimenticio. 1-10 2. Fat Tails, Value at Risk, and the Palladium Returns. 11-16 3.
4. Impact of Deficit Financing on Economic Growth in Nigeria. 29-36 5. The Effect of Contraband on Government Revenue: Case of Segen Area
People’s Zone. 37-50 v. Fellows vi. Auxiliary Memberships vii. Preferred Author Guidelines viii. Index
La RSE Dans Les PME Camerounaises: Etude Exploratoire Partir Des Schèmes Cognitifs Des Propriétaires-Dirigeants. 17-28
À
© 2018. Diana Katiuska Peña Ponce, Jenny Parrales Reyes, Veronica Ponce Alvarez, Monica Quiñonez Cercado, Jorge Calderon Garcia & Ana Maribel Ponce Castro. This is a research/review paper, distributed under the terms of the Creative Commons Attribution-Noncommercial 3.0 Unported License http://creativecommons.org/licenses/by-nc/3.0/), permitting all non-commercial use, distribution, and reproduction in any medium, provided the original work is properly cited.
Global Journal of Management and Business Research: B Economics and Commerce Volume 18 Issue 3 Version 1.0 Year 2018 Type: Double Blind Peer Reviewed International Research Journal Publisher: Global Journals
Online ISSN: 2249-4588 & Print ISSN: 0975-5853
Viabilidad del Modelo de Gestión de la Innovación para Microempresas Familiares del Sector Alimenticio
By Diana Katiuska Peña Ponce, Jenny Parrales Reyes, Veronica Ponce Alvarez, Monica Quiñonez Cercado, Jorge Calderon Garcia & Ana Maribel Ponce Castro
Universidad Estatal del Sur de Manabí
Abstract- Purpose: Las microempresas juegan un rol preponderante en la economía del Ecuador dado queestas constituyen actualmente la base del sistema económico de libre mercado, son la fuente generadora de la mayor parte de empleoy representan un elemento de cohesión social en un entorno globalizado. En este sentido, el propósito del presente trabajo de investigación es demostrar la viabilidad desde el punto de vista teórico de un modelo teórico para la gestión de la innovación en microempresas familiares del sector alimenticio de Jipijapa. Para la validación del mismo se emplearon métodos y técnicas que demostraron la viabilidad del mismo.
Methodology/Approach: Los métodos empleados en la investigación fueron el método de criterio de expertos a través del método de la preferencia y el criterio de usuarios mediante la técnica Iadov. El primero permitió demostrar la factibilidad desde el punto de vista teórico del modelo, y con el segundo se analizó la factibilidad de la metodología de implementación a partir del criterio de los potenciales usuarios.
Findings: Los principales hallazgos de la investigación radican en la aplicabilidad del modelo de gestión de la innovación para microempresas familiares dada la flexibilidad del mismo.
Keywords: modelo; gestión de la innovación; microempresa familiar; criterio de expertos; criterio de usuarios.
GJMBR-B Classification: JEL Code: A19
ViabilidaddelModelodeGestiondelaInnovacionparaMicroempresasFamiliaresdelSectorAlimenticio Strictly as per the compliance and regulations of:
Viabilidad del Modelo de Gestión de la Innovación para Microempresas Familiares del
Sector Alimenticio
1
Globa
l Jo
urna
l of M
anag
emen
t an
d Bu
siness Resea
rch
Volum
e XVIII
Issue
III
Ver
sion
IYe
ar
20
18
© 2018 Global Journals
()
B
Abstract- Purpose: Las microempresas juegan un rol preponderante en la economía del Ecuador dado queestas constituyen actualmente la base del sistema económico de libre mercado, son la fuente generadora de la mayor parte de empleoy representan un elemento de cohesión social en un entorno globalizado. En este sentido, el propósito del presente trabajo de investigación es demostrar la viabilidad desde el punto de vista teórico de un modelo teórico para la gestión de la innovación en microempresas familiares del sector alimenticio de Jipijapa. Para la validación del mismo se emplearon métodos y técnicas que demostraron la viabilidad del mismo.
Methodology/Approach: Los métodos empleados en la investigación fueron el método de criterio de expertos a través del método de la preferencia y el criterio de usuarios mediante la técnica Iadov. El primero permitió demostrar la factibilidad desde el punto de vista teórico del modelo, y con el segundo se analizó la factibilidad de la metodología de implementación a partir del criterio de los potenciales usuarios.
Findings: Los principales hallazgos de la investigación radican en la aplicabilidad del modelo de gestión de la innovación para microempresas familiares dada la flexibilidad del mismo.
Research Limitation/Implication: Se destaca como limitante de este trabajo la búsqueda de los expertos que avalaran la viabilidad del modelo analizado.
Originality/Value of Paper: La originalidad del trabajo está dado en el uso de técnicas que aportan criterios importantes en la aplicabilidad del modelo.
Category: Research PaperKeywords: modelo; gestión de la innovación; microempresa familiar; criterio de expertos; criterio de usuarios.
I. Introduction
n la actualidad, hay tres formas básicas para impulsar el crecimiento económico: el crecimiento de la población, la adopción de las industrias de
mayor productividad, o el inicio de mejoras de
Author α: Economist, Universidad Estatal del Sur de Manabi.e-mail: [email protected] σ ρ: Ingeniera, Universidad Estatal del Sur de Manabi. e-mails: [email protected],[email protected], [email protected] Ѡ: Ingeniera en Contabilidad y Auditoría, Universidad Estatal del Sur de Manabí.Author ¥: Ingeniero, en Administración de Empresas Agropecuarias, Universidad Laica Eloy Alfaro de Manabi.Author §: Ingeniera Comercial, Universidad Estatal del Sur de Manabí.
productividad más amplias. Debido a que la innovaciónpuede aumentar la cantidad de producción por unidadde trabajo, ésta puede jugar un papel crucial en la productividad y en un mayor crecimiento económico.
En este orden de ideas, datos del Departamento de trabajo de Estados Unidos estimó que la innovación ha producido alrededor de la mitad de todo el crecimiento económico del país en los últimos 50 años, (U.S. Department of Labour, 2007). La Organización para la Cooperación y Desarrollo Económico, también ha declarado que el 50 por ciento del PIB de las principales economías de dicha organización está basado en el conocimiento, (OCDE, 2005).
Así la acción coordinada del trabajo de los sistemas de innovación, es la que permite mejorar la productividad, competitividad y, de forma más amplia, el desarrollo de los territorios, (Vásquez-Barquero, 2009;Pellegrino y Savona, 2013). Esto, debido a que las empresas transforman el ahorro en inversión, y el estímulo a redes y agrupaciones entre entidades, propicia la aparición de economías de escala, de proximidad y reduce los costos de transacción.
La importancia del rol de las micro, pequeñas y medianas empresas en esta fase de transformación económica se constituye en un elemento preponderante dado el aporte que éstas tienen en la economía, sin dejar de reconocer la necesidad de optimizar los métodos de gestión que se han utilizado, para lo cual se deben basar en una correcta fundamentación teórica y metodológica que avale la correspondencia con los actuales retos en materia de innovación, tecnología y conocimiento a nivel internacional.
Sin embargo, los actuales modelos para gestionar la innovación están diseñados para grandes empresas resultando ineficientes para las de menor dimensión y por ende resulta complicada la convergencia de las microempresas con las empresas de mayor tamaño, estableciendo grandes diferencias, sobre todo en áreas económicas, productivas
y sociales.Arribándose a la idea de que se deben
aprovechar las ventajas que ofrece la innovación, basado en enfoques que estén acordes al tamaño,
E
Diana Katiuska Peña Ponce α, Jenny Parrales Reyes σ, Veronica Ponce Alvarez ρ, Monica Quiñonez Cercado Ѡ, Jorge Calderon Garcia ¥ & Ana Maribel Ponce Castro §
2
Globa
l Jo
urna
l of M
anag
emen
t an
d Bu
siness Resea
rch
Volum
e XVIII
Issue
III
Ver
sion
IYe
ar
20
18
© 2018 Global Journals1
Viabilidad del Modelo de Gestión de la Innovación para Microempresas Familiares del Sector Alimenticio(
)B
flexibilidad, proximidad al mercado y predisposición al cambio y de esta forma explotar las ventajas resultantes de las economías de escala disponiendo de estructuras de gestión que sean adaptables, incluyendo actividades de capacitación y acceso a la información, cultura de cambio y adaptación a los avances tecnológicos que les permita a las microempresas gestionar de forma adecuada la innovación.
En Ecuador, se conoce que cerca del 90 % de las empresas pertenecen a grupos familiares, en especial a micro, pequeñas y medianas empresas, siendo una forma de organización empresarial que en momentos de crisis han ayudado a reconstruir el país. Sin embargo, la regularidad es que las micro, pequeñas y medianas empresas a diferencia de las empresas de mayor dimensión poseen mayores dificultades en los procesos de gestión resaltando las insuficiencias en la gestión de la innovación, desarrollo tecnológico, capacitación, problemas de liquidez, costos de operación, falta de competitividad y calidad, lo cual tiene su fundamento en la baja productividad y la incapacidad de buscar nuevas oportunidades de negocios o mejoras sistemáticas en su estructura productiva.
La alternativa de realizar un modelo para gestionar la innovación en microempresas familiares surge con la relación de que un modelo es un medio complementario para estudiar diferentes fenómenos y objetos. Los modelos son el punto de partida, un medio para analizar y sintetizar situaciones complejas, (Haddad y Andrade, 1989; Frechtling, 1996; Caiero, 2001; Mankiw, 2001; Vogt, 2002; Martín, 2006; Ferriol, 2011; Almuiñas y Galarza, 2011; Vargas, 2013).
A partir de este precepto, se concibe al modelo para la gestión de la innovación en microempresas familiares del sector alimenticio como un conjunto de relaciones que permitirán de forma simple y comprensible ofrecer una alternativa de solución ala problemática actual.
El objetivo del presente estudio es demostrar la viabilidad desde el punto de vista teórico del modelo de gestión de la innovación diseñado para las microempresas familiares del sector alimenticio en Jipijapa, Ecuador.
II. Methodology
La validación de los modelos es pertinente para sobre la base de ello garantizar su confiabilidad, aplicabilidad y viabilidad, (Chávez, et al., 2015; Espín, 2017). Para demostrar la viabilidad del modelo de gestión de la innovación para microempresas familiares del sector alimenticio en Jipijapa se emplea el método de expertos y la técnica VA Iadov.
Para realizar la evaluación de expertos a los resultados de la investigación se empleó el Método de la Preferencia, por su exactitud, objetividad y rapidez.
Este permite superar las limitaciones, relacionadas con la complejidad de su aplicación y del procesamiento de los datos y alcanzar una imagen integral y más amplia de la posible evolución del resultado científico sometido a valoración.
Para la determinación de los expertos se debe tener en cuenta el concepto siguiente: “Se entiende por experto, tanto a un individuo, como a un grupo de personas u organizaciones capaces de ofrecer valoraciones conclusivas de un problema y hacer recomendaciones respecto a sus momentos fundamentales con un máximo de competencia”, (Lissabet, 1998).
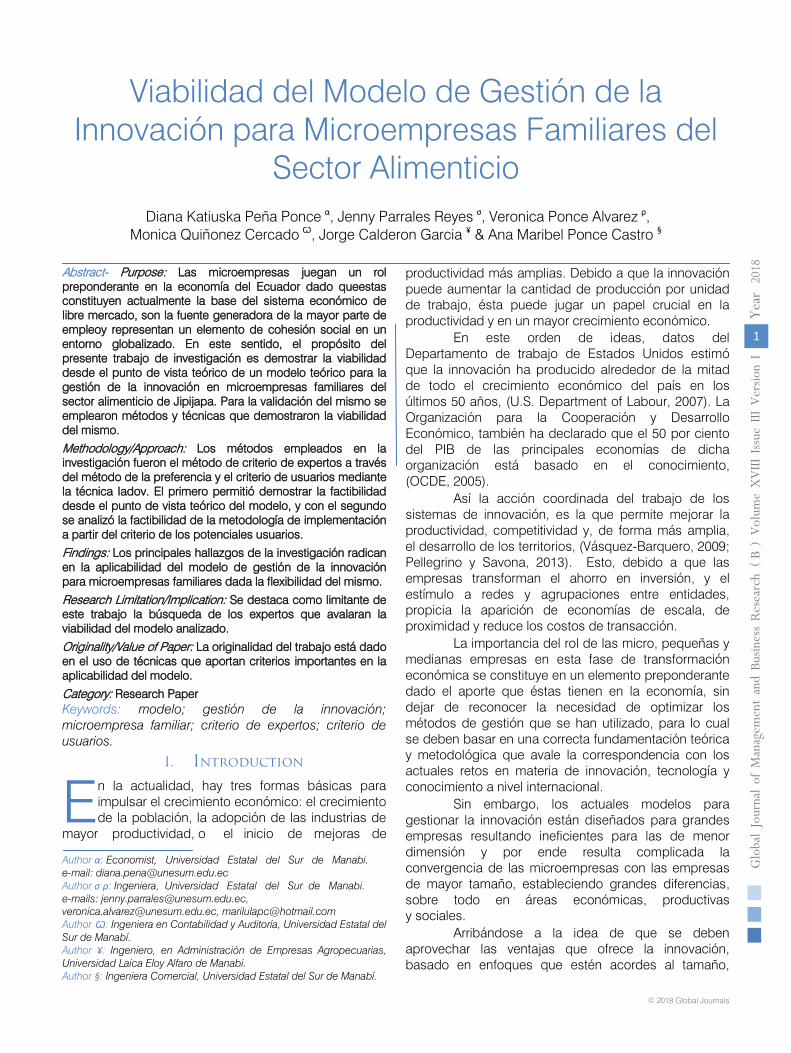
El modelo y metodología a evaluar se presentan a continuación:
Figura 1: Modelo de gestión de la innovación para microempresas familiares
Fuente: Elaboración propia
POLÍTICAS PÚBLICAS NACIONALES
INFORMACIÓN DEL MERCADO
Vigilancia (Ferias emprendimiento,
Internet, análisis clientes y proveedores)
Transferencia de tecnología
Generación de soluciones Protección
Mejora de procesos y productos
ENTORNO SOCIO ECONÓMICO
SATISFACCIÓN DEL MERCADO
PRODUCTIVIDAD Y PERMANENCIA EN EL MERCADO
Estrategia Tecnológica
Dirección participativa
Firmeza del liderazgo
Motivación
Funcionamiento organizativo
ENTORNO
AMB I ENTAL
ENTORNO
POL Í T I CO
Visión y pensamiento estratégico
3
Globa
l Jo
urna
l of M
anag
emen
t an
d Bu
siness Resea
rch
Volum
e XVIII
Issue
III
Ver
sion
IYe
ar
20
18
© 2018 Global Journals
Viabilidad del Modelo de Gestión de la Innovación para Microempresas Familiares del Sector Alimenticio
()
B
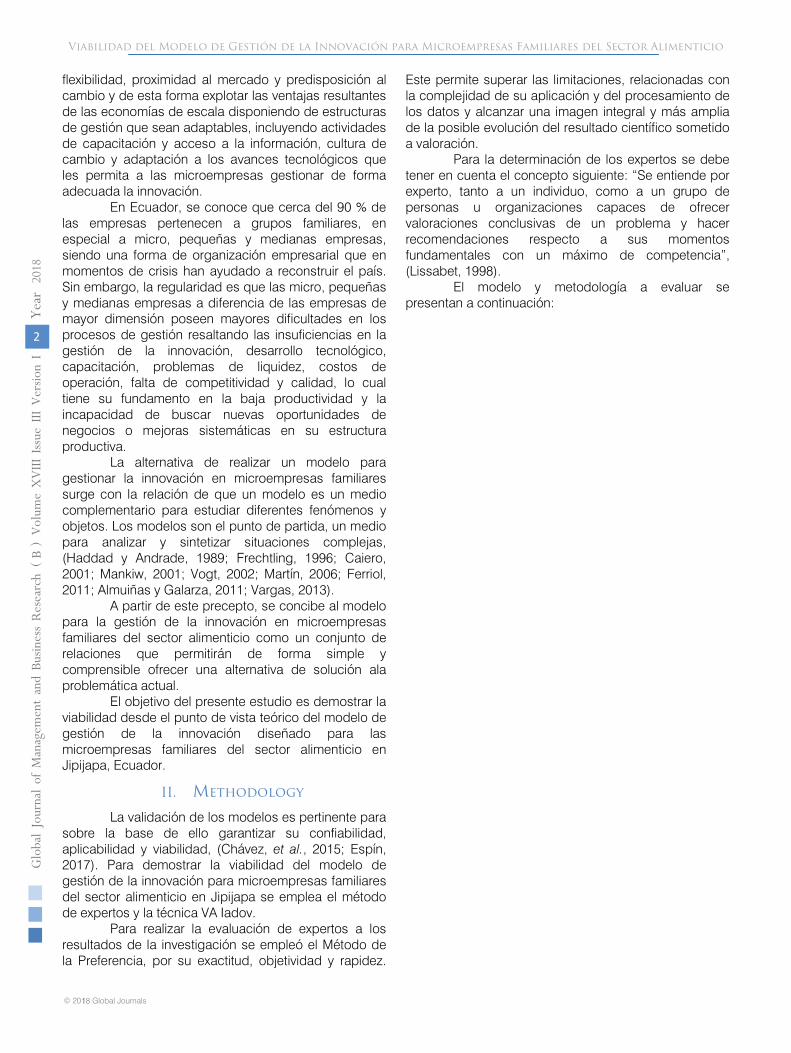
Fuente: Elaboración propia
Figura 2: Metodología para la operacionalización del modelo propuesto
a) Ejecución del Método de criterio de expertos (Método de la preferencia)
Primera etapa, consiste en la formulación del objetivo de la evaluación por los expertos.
“Demostrar la viabilidad del modelo de gestión de la innovación para microempresas familiares del sector alimenticio en Jipijapa, Ecuador”.
Segunda etapa, selección de los expertos Se preseleccionó un grupo de expertos,
compuesto por profesionales de nacionalidad ecuatoriana, tomando como criterio de selección la efectividad de la actividad profesional que desempeñan.
Para valorar el nivel de experticia de los especialistas, se empleó el coeficiente de competencia, (Souto, 2015). Los resultados obtenidos se observan en el Tabla 1, a partir del análisis realizado se
seleccionaron 15 expertos. Según plantea Lissabet, (1998), el numero óptimo de expertos a seleccionar debe estar entre 15 y 30.
PREP
ARA C
IÓN
PRE
VIA
• Etapa 1. Sensibilización de trabajadores
• Etapa 2. Establecimiento de condiciones adecuadas de trabajo
• Etapa 3. Establecimiento de mecanismos de motivación, incentivos, valores
PRO
CESO
DE
APRE
NDI
ZAJE
• Etapa 4. Determinación de las necesidades de aprendizaje y ejecución del proceso de capacitación
• Etapa 5. Prueba de aptitudes
• Etapa 6. Diseño de estrategia (planificación y organización)
GES
TIÓ
N D
E LA
INN
OVA
CIÓ
N
• Etapa 7. Análisis de clientes, competencia y proveedores
• Etapa 8. Diseño de estrategia de publicidad
• Etapa 9. Análisis de necesidades de tecnología y participación en redes
• Etapa 10. Administración participativa (creatividad, generación de ideas [selección, viabilidad])
• Etapa 11 Implementación (idea) del proceso de innovación (simplificado) para la mejora de procesos y productos. Documentación de la experiencia
FASE 1
FASE 2
FASE 3
4
Globa
l Jo
urna
l of M
anag
emen
t an
d Bu
siness Resea
rch
Volum
e XVIII
Issue
III
Ver
sion
IYe
ar
20
18
© 2018 Global Journals1
Viabilidad del Modelo de Gestión de la Innovación para Microempresas Familiares del Sector Alimenticio(
)B
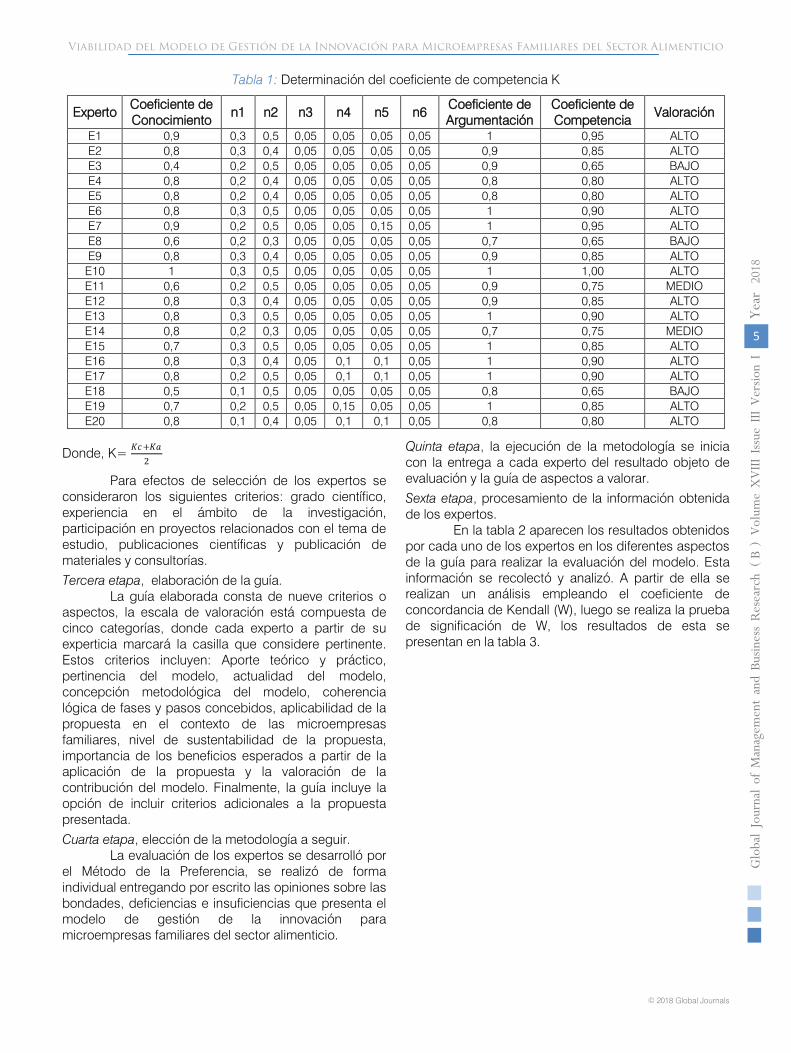
Tabla 1: Determinación del coeficiente de competencia K
Experto Coeficiente de Conocimiento
n1 n2 n3 n4 n5 n6 Coeficiente de Argumentación
Coeficiente de Competencia
Valoración
E1 0,9 0,3 0,5 0,05 0,05 0,05 0,05 1 0,95 ALTO E2 0,8 0,3 0,4 0,05 0,05 0,05 0,05 0,9 0,85 ALTO E3 0,4 0,2 0,5 0,05 0,05 0,05 0,05 0,9 0,65 BAJO E4 0,8 0,2 0,4 0,05 0,05 0,05 0,05 0,8 0,80 ALTO E5 0,8 0,2 0,4 0,05 0,05 0,05 0,05 0,8 0,80 ALTO E6 0,8 0,3 0,5 0,05 0,05 0,05 0,05 1 0,90 ALTO E7 0,9 0,2 0,5 0,05 0,05 0,15 0,05 1 0,95 ALTO E8 0,6 0,2 0,3 0,05 0,05 0,05 0,05 0,7 0,65 BAJO E9 0,8 0,3 0,4 0,05 0,05 0,05 0,05 0,9 0,85 ALTO
E10 1 0,3 0,5 0,05 0,05 0,05 0,05 1 1,00 ALTO E11 0,6 0,2 0,5 0,05 0,05 0,05 0,05 0,9 0,75 MEDIO E12 0,8 0,3 0,4 0,05 0,05 0,05 0,05 0,9 0,85 ALTO E13 0,8 0,3 0,5 0,05 0,05 0,05 0,05 1 0,90 ALTO E14 0,8 0,2 0,3 0,05 0,05 0,05 0,05 0,7 0,75 MEDIO E15 0,7 0,3 0,5 0,05 0,05 0,05 0,05 1 0,85 ALTO E16 0,8 0,3 0,4 0,05 0,1 0,1 0,05 1 0,90 ALTO E17 0,8 0,2 0,5 0,05 0,1 0,1 0,05 1 0,90 ALTO E18 0,5 0,1 0,5 0,05 0,05 0,05 0,05 0,8 0,65 BAJO E19 0,7 0,2 0,5 0,05 0,15 0,05 0,05 1 0,85 ALTO E20 0,8 0,1 0,4 0,05 0,1 0,1 0,05 0,8 0,80 ALTO
Donde, K= 𝐾𝐾𝐾𝐾+𝐾𝐾𝐾𝐾2
Para efectos de selección de los expertos se consideraron los siguientes criterios: grado científico, experiencia en el ámbito de la investigación, participación en proyectos relacionados con el tema de estudio, publicaciones científicas y publicación de
materiales y consultorías.
Tercera etapa, elaboración de la guía.
La guía elaborada consta de nueve criterios o aspectos, la escala de valoración está compuesta de cinco categorías, donde cada experto a partir de su experticia marcará la casilla que considere pertinente. Estos criterios incluyen: Aporte teórico y práctico, pertinencia del modelo, actualidad del modelo, concepción metodológica del modelo, coherencia lógica de fases y pasos concebidos, aplicabilidad de la propuesta en el contexto de las microempresas familiares, nivel de sustentabilidad de la propuesta, importancia de los beneficios esperados a partir de la aplicación de la propuesta y la valoración de la contribución del modelo. Finalmente, la guía incluye la opción de incluir criterios adicionales a la propuesta presentada.
Cuarta etapa, elección de la metodología a seguir.
La evaluación de los expertos se desarrolló por el Método de la Preferencia, se realizó de forma individual entregando por escrito las opiniones sobre las bondades, deficiencias e insuficiencias que presenta el modelo de gestión de la innovación para microempresas familiares del sector alimenticio.
Quinta etapa, la ejecución de la metodología se inicia con la entrega a cada experto del resultado objeto de evaluación y la guía de aspectos a valorar.
Sexta etapa, procesamiento de la información obtenida de los expertos.
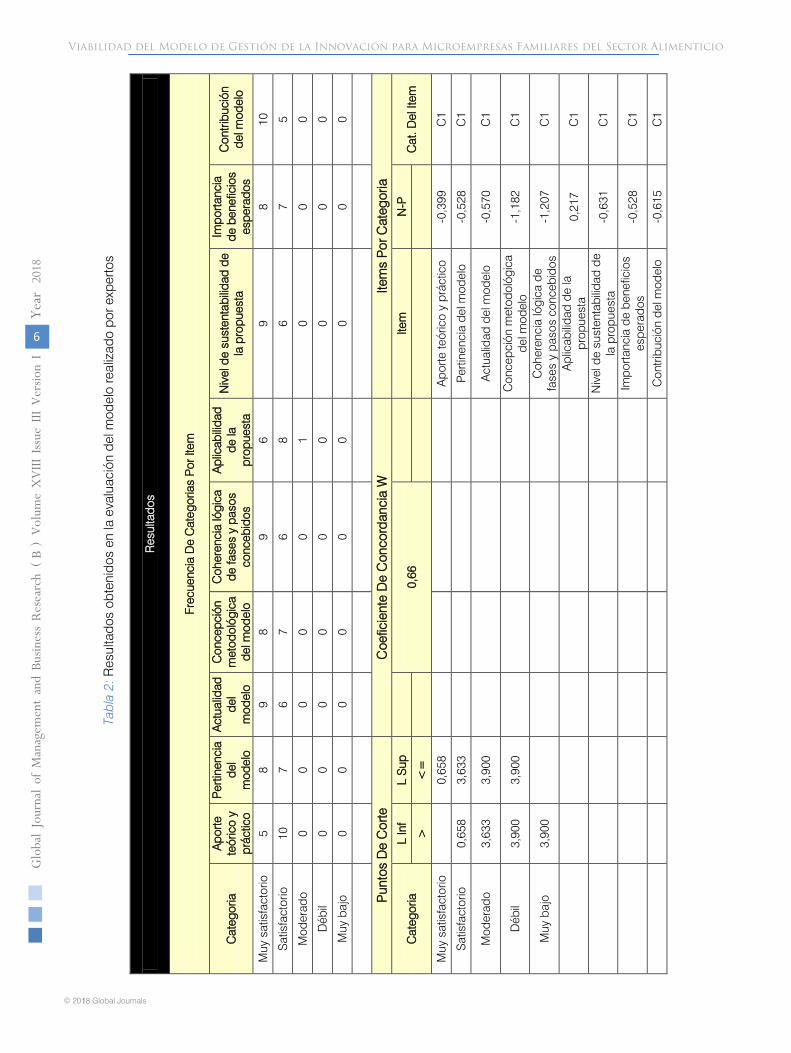
En la tabla 2 aparecen los resultados obtenidos por cada uno de los expertos en los diferentes aspectos de la guía para realizar la evaluación del modelo. Esta información se recolectó y analizó. A partir de ella se realizan un análisis empleando el coeficiente de concordancia de Kendall (W), luego se realiza la prueba de significación de W, los resultados de esta se presentan en la tabla 3.
5
Globa
l Jo
urna
l of M
anag
emen
t an
d Bu
siness Resea
rch
Volum
e XVIII
Issue
III
Ver
sion
IYe
ar
20
18
© 2018 Global Journals
Viabilidad del Modelo de Gestión de la Innovación para Microempresas Familiares del Sector Alimenticio
()
B
6
Globa
l Jo
urna
l of M
anag
emen
t an
d Bu
siness Resea
rch
Volum
e XVIII
Issue
III
Ver
sion
IYe
ar
20
18
© 2018 Global Journals1
Tabl
a 2:
Res
ulta
dos
obte
nido
s en
la e
valu
ació
n de
l mod
elo
real
izad
o po
r exp
erto
s
Res
ulta
dos
Frec
uenc
ia D
e C
ateg
oria
s P
or It
em
Cat
ego r
iaA
porte
te
óric
o y
prác
ti co
Per
ti nen
cia
del
mod
elo
Act
ual id
ad
del
mod
elo
Con
cep c
ión
met
odol
ógic
a de
l mod
elo
Coh
eren
cia
lógi
ca
de fa
ses
y pa
sos
conc
ebi d
os
Apl
ica b
ilida
d de
la
prop
uest
a
Niv
el d
e su
sten
tabi
lidad
de
la p
rop u
esta
Impo
r tanc
ia
de b
enef
icio
s es
pera
dos
Con
trib u
ción
de
l mod
elo
Muy
sat
isfa
ctor
io5
89
89
69
810
Sat
isfa
ctor
io10
76
76
86
75
Mod
era d
o0
00
00
10
00
Déb
il0
00
00
00
00
Muy
baj
o0
00
00
00
00
Pun
tos
De
Cor
teC
oefi c
ient
e D
e C
onco
rdan
cia
WIte
ms
Por
Cat
egor
ia
Cat
egor
iaL
Inf
L S
up0,
66Ite
mN
-PC
at. D
el It
em>
<=
Muy
sat
isfa
ctor
io0,
658
Apo
rte te
óric
o y
prác
tico
-0,3
99C
1
Sat
isfa
ctor
io0,
658
3,63
3P
ertin
enci
a de
l mod
elo
-0,5
28C
1
Mod
erad
o3,
633
3,90
0A
ctua
lidad
del
mod
elo
-0,5
70C
1
Déb
il3,
900
3,90
0C
once
pció
n m
etod
ológ
ica
del m
odel
o-1
,182
C1
Muy
baj
o3,
900
Coh
eren
cia
lógi
ca d
e fa
ses
y pa
sos
conc
ebid
os-1
,207
C1
Apl
icab
ilida
d de
la
prop
uest
a0,
217
C1
Niv
el d
e su
sten
tabi
lidad
de
la p
ropu
esta
-0,6
31C
1
Impo
r tanc
ia d
e be
nefic
ios
espe
rado
s-0
,528
C1
Con
tribu
ción
del
mod
elo
-0,6
15C
1
Viabilidad del Modelo de Gestión de la Innovación para Microempresas Familiares del Sector Alimenticio(
)B
7
Globa
l Jo
urna
l of M
anag
emen
t an
d Bu
siness Resea
rch
Volum
e XVIII
Issue
III
Ver
sion
IYe
ar
20
18
© 2018 Global Journals
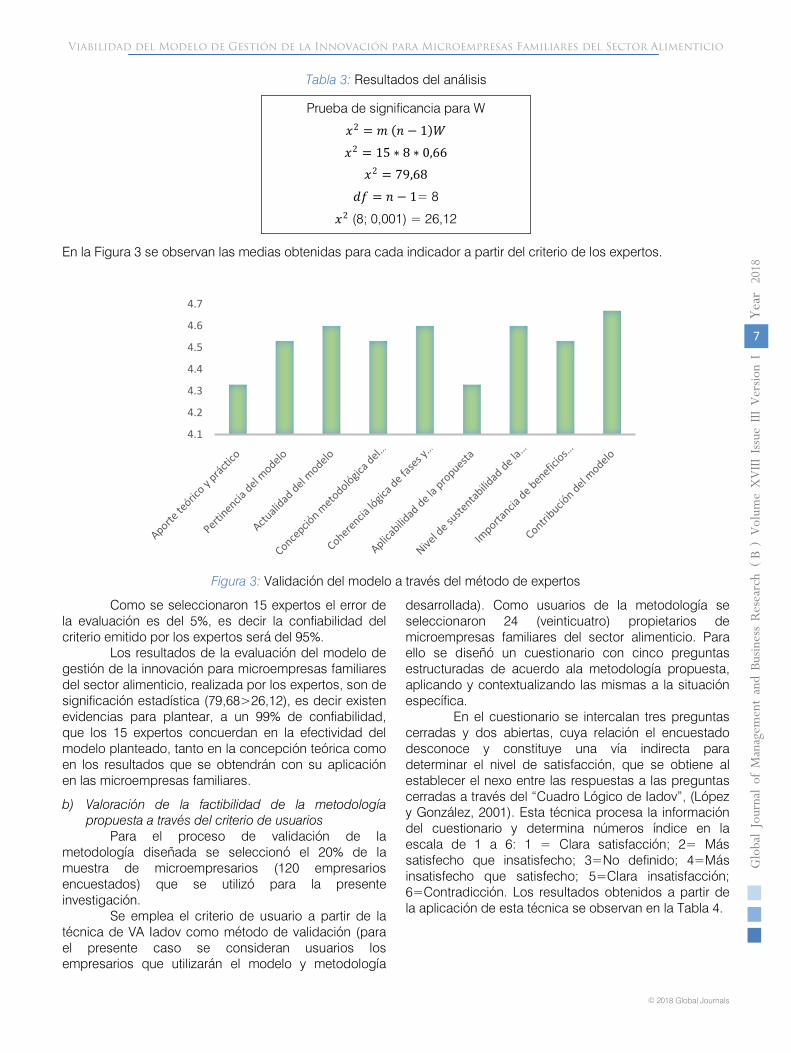
Figura 3: Validación del modelo a través del método de expertos
Como se seleccionaron 15 expertos el error de la evaluación es del 5%, es decir la confiabilidad del criterio emitido por los expertos será del 95%.
Los resultados de la evaluación del modelo de gestión de la innovación para microempresas familiares del sector alimenticio, realizada por los expertos, son de significación estadística (79,68>26,12), es decir existen evidencias para plantear, a un 99% de confiabilidad, que los 15 expertos concuerdan en la efectividad del modelo planteado, tanto en la concepción teórica como en los resultados que se obtendrán con su aplicación en las microempresas familiares.
b) Valoración de la factibilidad de la metodología propuesta a través del criterio de usuarios
Para el proceso de validación de la metodología diseñada se seleccionó el 20% de la muestra de microempresarios (120 empresarios encuestados) que se utilizó para la presente investigación.
Se emplea el criterio de usuario a partir de la técnica de VA Iadov como método de validación (para el presente caso se consideran usuarios los empresarios que utilizarán el modelo y metodología
desarrollada). Como usuarios de la metodología se seleccionaron 24 (veinticuatro) propietarios de microempresas familiares del sector alimenticio. Para ello se diseñó un cuestionario con cinco preguntas estructuradas de acuerdo ala metodología propuesta, aplicando y contextualizando las mismas a la situación específica.
En el cuestionario se intercalan tres preguntas cerradas y dos abiertas, cuya relación el encuestado desconoce y constituye una vía indirecta para determinar el nivel de satisfacción, que se obtiene al establecer el nexo entre las respuestas a las preguntas cerradas a través del “Cuadro Lógico de Iadov”, (López y González, 2001). Esta técnica procesa la información del cuestionario y determina números índice en la escala de 1 a 6: 1 = Clara satisfacción; 2= Más satisfecho que insatisfecho; 3=No definido; 4=Más insatisfecho que satisfecho; 5=Clara insatisfacción; 6=Contradicción. Los resultados obtenidos a partir de la aplicación de esta técnica se observan en la Tabla 4.
4.1
4.2
4.3
4.4
4.5
4.6
4.7
Viabilidad del Modelo de Gestión de la Innovación para Microempresas Familiares del Sector Alimenticio
()
B
Tabla 3: Resultados del análisis
Prueba de significancia para W
𝑥𝑥2 = 𝑚𝑚 (𝑛𝑛 − 1)𝑊𝑊𝑥𝑥2 = 15 ∗ 8 ∗ 0,66
𝑥𝑥2 = 79,68
𝑑𝑑𝑑𝑑 = 𝑛𝑛 − 1= 8
𝑥𝑥2 (8; 0,001) = 26,12
En la Figura 3 se observan las medias obtenidas para cada indicador a partir del criterio de los expertos.
8
Globa
l Jo
urna
l of M
anag
emen
t an
d Bu
siness Resea
rch
Volum
e XVIII
Issue
III
Ver
sion
IYe
ar20
18
© 2018 Global Journals1
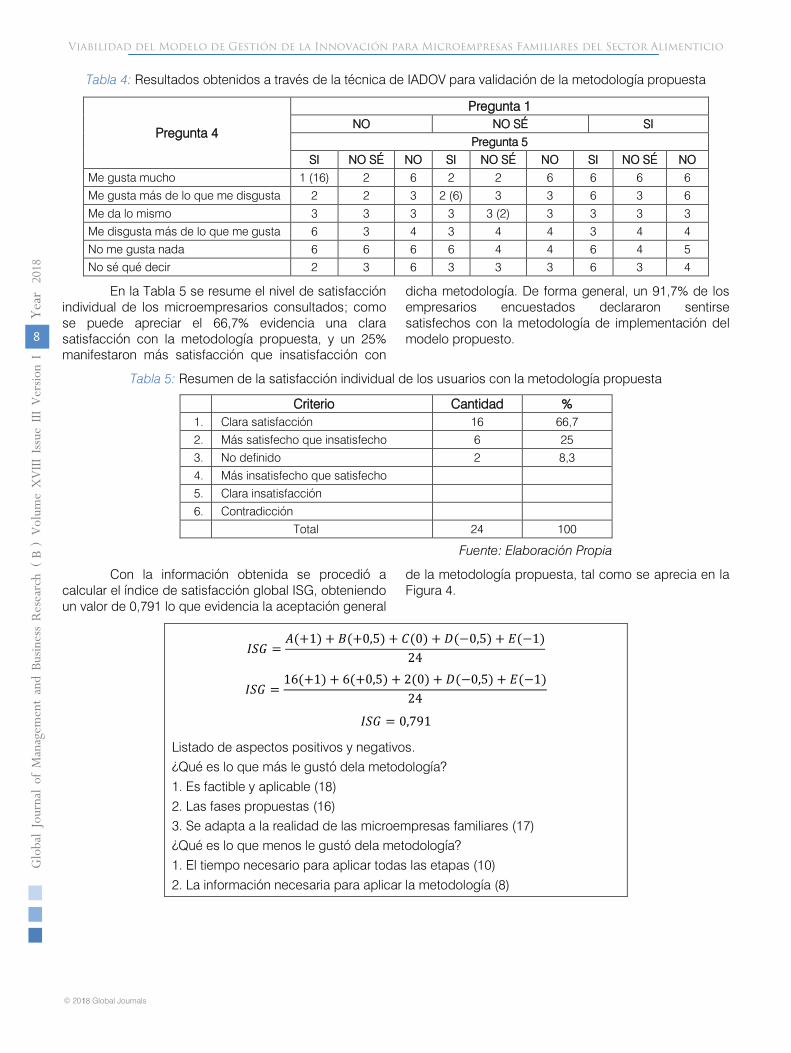
Tabla 4: Resultados obtenidos a través de la técnica de IADOV para validación de la metodología propuesta
Pregunta 4
Pregunta 1 NO NO SÉ SI
Pregunta 5 SI NO SÉ NO SI NO SÉ NO SI NO SÉ NO
Me gusta mucho 1 (16) 2 6 2 2 6 6 6 6 Me gusta más de lo que me disgusta 2 2 3 2 (6) 3 3 6 3 6 Me da lo mismo 3 3 3 3 3 (2) 3 3 3 3 Me disgusta más de lo que me gusta 6 3 4 3 4 4 3 4 4 No me gusta nada 6 6 6 6 4 4 6 4 5 No sé qué decir 2 3 6 3 3 3 6 3 4
En la Tabla 5 se resume el nivel de satisfacción individual de los microempresarios consultados; como se puede apreciar el 66,7% evidencia una clara satisfacción con la metodología propuesta, y un 25% manifestaron más satisfacción que insatisfacción con
dicha metodología. De forma general, un 91,7% de los empresarios encuestados declararon sentirse satisfechos con la metodología de implementación del modelo propuesto.
Tabla 5: Resumen de la satisfacción individual de los usuarios con la metodología propuesta
Criterio Cantidad % 1. Clara satisfacción 16 66,7 2. Más satisfecho que insatisfecho 6 25 3. No definido 2 8,3 4. Más insatisfecho que satisfecho
5. Clara insatisfacción
6. Contradicción
Total 24 100
Fuente: Elaboración Propia
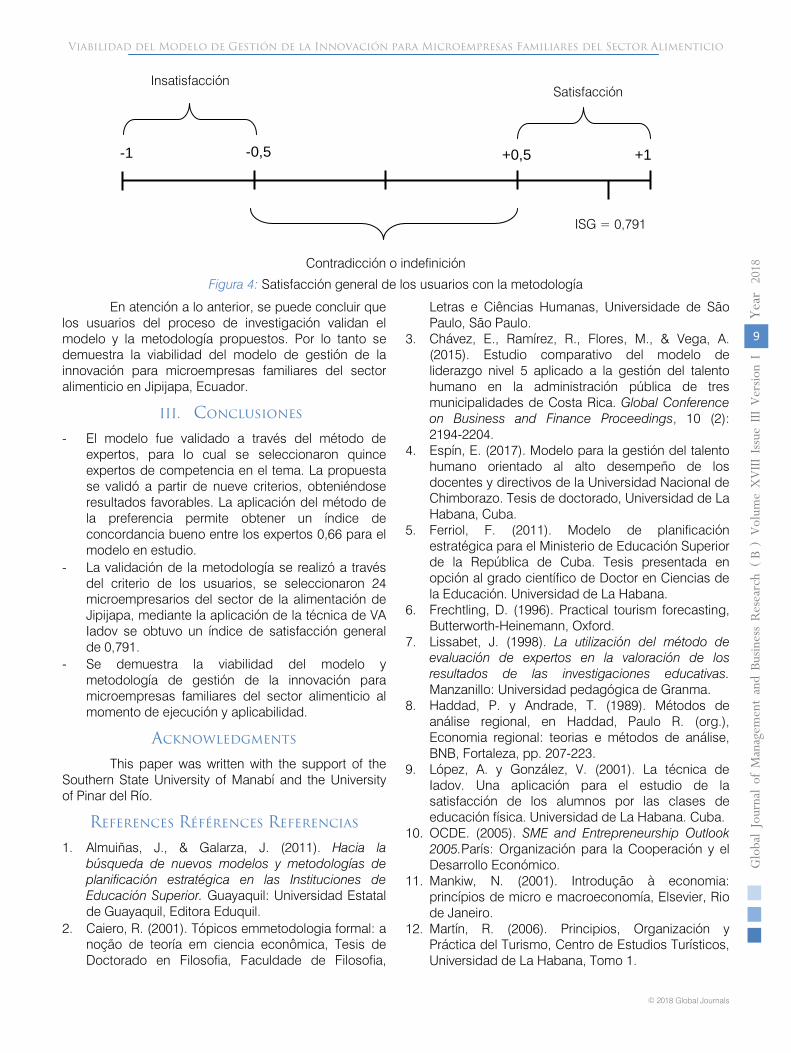
Con la información obtenida se procedió a calcular el índice de satisfacción global ISG, obteniendo un valor de 0,791 lo que evidencia la aceptación general
de la metodología propuesta, tal como se aprecia en la Figura 4.
𝐼𝐼𝐼𝐼𝐼𝐼 =𝐴𝐴(+1) + 𝐵𝐵(+0,5) + 𝐶𝐶(0) + 𝐷𝐷(−0,5) + 𝐸𝐸(−1)
24
𝐼𝐼𝐼𝐼𝐼𝐼 =16(+1) + 6(+0,5) + 2(0) + 𝐷𝐷(−0,5) + 𝐸𝐸(−1)
24
𝐼𝐼𝐼𝐼𝐼𝐼 = 0,791
Listado de aspectos positivos y negativos.
¿Qué es lo que más le gustó dela metodología?
1. Es factible y aplicable (18)
2. Las fases propuestas (16)
3. Se adapta a la realidad de las microempresas familiares (17)
¿Qué es lo que menos le gustó dela metodología?
1. El tiempo necesario para aplicar todas las etapas (10)
2. La información necesaria para aplicar la metodología (8)
Viabilidad del Modelo de Gestión de la Innovación para Microempresas Familiares del Sector Alimenticio(
)B
9
Globa
l Jo
urna
l of M
anag
emen
t an
d Bu
siness Resea
rch
Volum
e XVIII
Issue
III
Ver
sion
IYe
ar
20
18
© 2018 Global Journals
Figura 4: Satisfacción general de los usuarios con la metodología
En atención a lo anterior, se puede concluir que los usuarios del proceso de investigación validan el modelo y la metodología propuestos. Por lo tanto se demuestra la viabilidad del modelo de gestión de la innovación para microempresas familiares del sector alimenticio en Jipijapa, Ecuador.
III. Conclusiones
- El modelo fue validado a través del método de expertos, para lo cual se seleccionaron quince expertos de competencia en el tema. La propuesta se validó a partir de nueve criterios, obteniéndose resultados favorables. La aplicación del método de la preferencia permite obtener un índice de concordancia bueno entre los expertos 0,66 para el modelo en estudio.
- La validación de la metodología se realizó a través del criterio de los usuarios, se seleccionaron 24 microempresarios del sector de la alimentación de Jipijapa, mediante la aplicación de la técnica de VA Iadov se obtuvo un índice de satisfacción general de 0,791.
- Se demuestra la viabilidad del modelo y metodología de gestión de la innovación para microempresas familiares del sector alimenticio al momento de ejecución y aplicabilidad.
Acknowledgments
This paper was written with the support of the Southern State University of Manabí and the University of Pinar del Río.
References Références Referencias
1. Almuiñas, J., & Galarza, J. (2011). Hacia la búsqueda de nuevos modelos y metodologías de planificación estratégica en las Instituciones de Educación Superior. Guayaquil: Universidad Estatal de Guayaquil, Editora Eduquil.
2. Caiero, R. (2001). Tópicos emmetodologia formal: a noção de teoría em ciencia econômica, Tesis de Doctorado en Filosofia, Faculdade de Filosofia,
Letras e Ciências Humanas, Universidade de São Paulo, São Paulo.
3. Chávez, E., Ramírez, R., Flores, M., & Vega, A. (2015). Estudio comparativo del modelo de liderazgo nivel 5 aplicado a la gestión del talento humano en la administración pública de tres municipalidades de Costa Rica. Global Conference on Business and Finance Proceedings, 10 (2): 2194-2204.
4. Espín, E. (2017). Modelo para la gestión del talento humano orientado al alto desempeño de los docentes y directivos de la Universidad Nacional de Chimborazo. Tesis de doctorado, Universidad de La Habana, Cuba.
5. Ferriol, F. (2011). Modelo de planificación estratégica para el Ministerio de Educación Superior de la República de Cuba. Tesis presentada en opción al grado científico de Doctor en Ciencias de la Educación. Universidad de La Habana.
6. Frechtling, D. (1996). Practical tourism forecasting, Butterworth-Heinemann, Oxford.
7. Lissabet, J. (1998). La utilización del método de evaluación de expertos en la valoración de los resultados de las investigaciones educativas. Manzanillo: Universidad pedagógica de Granma.
8. Haddad, P. y Andrade, T. (1989). Métodos de análise regional, en Haddad, Paulo R. (org.), Economia regional: teorias e métodos de análise, BNB, Fortaleza, pp. 207-223.
9. López, A. y González, V. (2001). La técnica de Iadov. Una aplicación para el estudio de la satisfacción de los alumnos por las clases de educación física. Universidad de La Habana. Cuba.
10. OCDE. (2005). SME and Entrepreneurship Outlook 2005.París: Organización para la Cooperación y el Desarrollo Económico.
11. Mankiw, N. (2001). Introdução à economia: princípios de micro e macroeconomía, Elsevier, Rio de Janeiro.
12. Martín, R. (2006). Principios, Organización y Práctica del Turismo, Centro de Estudios Turísticos, Universidad de La Habana, Tomo 1.
Insatisfacción Satisfacción
-1 -0,5 +1 +0,5
Contradicción o indefinición
ISG = 0,791
Viabilidad del Modelo de Gestión de la Innovación para Microempresas Familiares del Sector Alimenticio
()
B
10
Globa
l Jo
urna
l of M
anag
emen
t an
d Bu
siness Resea
rch
Volum
e XVIII
Issue
III
Ver
sion
IYe
ar20
18
© 2018 Global Journals1
13. Pellegrino, G., & Savona, M. (2013). Is Money All? Financing versus Knowledge and Demand Constraints to innovation. UNU-MERIT.
14. Souto, L. (2015). Modelo de gestión de recursos humanos para la organización superior de dirección empresarial del Ministerio de Comercio Exterior de Cuba. Cuba: Tesis de Doctorado en Ciencias Económicas, Universidad de La Habana.
15. U.S. Department of Labour. (2007). “The STEM Workforce Challenge: the Role of the Public Workforce System in a National Solution for a Competitive Science, Technology, Engineering, and Mathematics (STEM) Workforce”.USA. http://www. doleta.gov/youth_services/pdf/STEM_Report_4%2007.pdf.
16. Vargas, T. (2013). Modelo de gestión de la capacitación para el turismo sostenible basado en enfoques de organización que aprende. Validación en Viñales. Pinar del Río: Universidad de Pinar del Río Hnos. Saiz Montes de Ocas.
17. Vásquez-Barquero, A. (2009). Desarrollo local, una estrategia para tiempos de crisis. Universitas Forum, Vol.1. N° 2. 1-10.
18. Vogt, C. (2002). Modelos e modelagens, Comciência: revista eletrônica de jornalismo, fev. http://www.comciencia.brreportagens/framereport. htm.
Viabilidad del Modelo de Gestión de la Innovación para Microempresas Familiares del Sector Alimenticio(
)B
© 2018. Turen Guo, Jianhua Ding & Bin Guo. This is a research/review paper, distributed under the terms of the Creative Commons Attribution-Noncommercial 3.0 Unported License http://creativecommons.org/licenses/by-nc/3.0/), permitting all non-commercial use, distribution, and reproduction in any medium, provided the original work is properly cited.
Global Journal of Management and Business Research: B Economics and Commerce Volume 18 Issue 3 Version 1.0 Year 2018 Type: Double Blind Peer Reviewed International Research Journal Publisher: Global Journals
Online ISSN: 2249-4588 & Print ISSN: 0975-5853
Fat Tails, Value at Risk, and the Palladium Returns By Turen Guo, Jianhua Ding & Bin Guo
Jianghan University
Strictly as per the compliance and regulations of:
Abstract- The past decade has witnessed the rapid growing of the world palladium market. Thus, it is even more important to develop effective quantitative tools for risk management of palladium assets at this moment. In this paper, we investigate five different types of widely-used statistical distributions and employ the industry standard risk measurement, Value at Risk, for risk management of daily palladium spot returns. We first apply four different criteria to compare the goodness of fit of the five distributions, and then calculate the VaRs based on the parameters estimated from the first step. Our results indicate the Skewed t distribution has the best in-sample fitting and generate VaR values closest to the nonparametric historical VaR values.
Keywords: skewed t distribution; goodness of fit; risk management.
GJMBR-B Classification: JEL Code: C46; C58; G10
FatTailsValueatRiskandthePalladiumReturns
Fat Tails, Value at Risk, and the Palladium Returns
Turen Guo α, Jianhua Ding σ & Bin Guo ρ
Abstract- The past decade has witnessed the rapid growing of the world palladium market. Thus, it is even more important to develop effective quantitative tools for risk management of palladium assets at this moment. In this paper, we investigate five different types of widely-used statistical distributions and employ the industry standard risk measurement, Value at Risk, for risk management of daily palladium spot returns. We first apply four different criteria to compare the goodness of fit of the five distributions, and then calculate the VaRs based on the parameters estimated from the first step. Our results indicate the Skewed t distribution has the best in-sample fitting and generate VaR values closest to the nonparametric historical VaR values. Keywords: skewed t distribution; goodness of fit; risk management.
I. Introduction
uring the recent decades, many researchers and practitioners have been drawn by various kinds of alternative investments to diversify their
portfolios. Market participants are extremely excited about the potential investment vehicles which could serve as safe hedging for conventional asset classes, such as stocks, foreign exchanges and fixed income bonds. The precious metal of palladium, which has been widely used in automotive, chemical, electrical, jewellery and dental industries, naturally serves as a popular candidate. Similar as any other products, the price of palladium are determined by the supply and demand. Currently, the two largest producers are Russia and South Africa, which consist of more than 75% of annual world mine supplies. On the demand side, the rising giant, China, accounts for more than 70% of annual global demand increases of palladium. Moreover, the increasing demand in China is mainly responsible for the price increase since the year of 2004. According to the United States Geological Survey, the global mine production of palladium was slightly more than 250 tons in 2010, and the world demand of palladium was nearly 350 tons in 2010.
Since so many investors have been drawing to the global palladium market and the market capitalization has increased so dramatically during the last decade, it becomes a more urgent task for market
Author α: School of Economics and Management, Xiangnan College, Chenzhou, Hunan, China. e-mail: [email protected] Author α: School of Business, Jianghan University, Wuhan, Hubei, China. Author ρ: Cologne Graduate School in Management, Economics and Social Sciences, University of Cologne, Germany.
practitioners and academia to develop effective risk management tools. In this paper, we focus on the development of quantitative risk management tools. We take advantage of the widely-used concept, Value at Risk (VaR), and investigate empirical performance of a variety of heavy-tailed distributions in risk measures calculations. Our statistical distributions cover: the normal, the Student’s t, the Skewed t, the normal inverse Gaussian (NIG), and the generalized hyperbolic (GH) distributions. Our results indicate the Skewed t distribution could generate most suitable VaR values and outperform other types of popular statistical distributions.
a) Literature Review Since these five different statistical distributions
were introduced into the literature, there have been extensive studies on their performance in fitting asset returns. Both the normal and the Student’s t distributions have been in the literature for more than a hundred years (see Helmert, 1876). Hansen (1994) introduces the Skewed t distribution and discussed its performance in fitting the US stock returns. There are many other types of asymmetric t distribution, and we chose the one in Hansen (1994) for its simplicity. Also, Barndorff-Nielsen (1977) developed the GH distribution for the US stock returns. As surveyed by see Figueroa-Lopez, et al. (2011) that the NIG distribution is one of the most popular subclasses of the GH distribution in financial modeling, and thus we are also interested in it in this paper. We have also investigated some other subclasses of the GH distribution, such as the normal reciprocal inverse Gaussian (NRIG), and the results are similar and available upon request. Our work is closely related to the work in Guo (2017a). Guo compared these five widely-used statistical distributions in fitting the SP 500 index returns and showed the Skewed t distribution has the best in-sample fitting and predicts the most accurate risk measure values. One could also see other similar studies in Bueno, Fortes and Vlachoski (2017) and Kayaba, Hirano, Baba, Matsui and Ueda (2017).
In this paper, we reconsider these five types of statistical distributions but focus on the precious metal market. Our special interests are on palladium, one of the rare metals which have gained increasing attentions in the financial market and academia. There are quite a few studies on palladium asset returns. Adrangi and
D
11
Globa
l Jo
urna
l of M
anag
emen
t an
d Bu
siness Resea
rch
Volum
e XVIII
Issue
III
Ver
sion
IYe
ar
20
18
© 2018 Global Journals
()
B
Chatrath (2002) focused on ARCH-type models and provided evidence of nonlinear dependencies in palladium and platinum futures markets with controls for seasonality and contract-maturity effects generally explaining the nonlinearities in the data. Diaz (2015) investigated the spots prices of the two scarce precious metals, platinum and palladium. Diaz found intermediate memory in the return structures of both precious metals, which implies the instability of platinum and palladium returns’ persistency in the long run. Auer (2015) also used GARCH models to investigate the impact of the specific calendar day on the conditional means of palladium returns, and showed that during the period from July 1996 to August 2013 there is no significant impact of the specific calendar day observed. Some researchers also investigated the hedging effect of the palladium. For instance, Pierdzioch, Risse and Rohloff (2016) used Bayesian additive regression trees to reexamine whether investments in precious metals are a hedge against exchange-rate movements and showed that investments in gold and silver are strong hedges against depreciations of major exchange rates but the hedging properties of palladium and platinum are mainly confined to the Australian dollar and Canadian dollar. Similar studies could also be found in Hammoudeh, Malik and Mc Aleer (2011). Finally, Caporale, Spagnolo and Spagnolo (2017) adopted a vector autoregressive model to investigate the relationship between macro news and commodity returns and indirectly showed the
palladium could serve as a safe asset to the stock market in US.
In this paper, our main interests are developing an effective quantitative risk management tool based on the concept of VaR. The paper is structured as follows. In Section 2, we introduce the heavy-tailed distributions. Section 3 summarizes the data. The estimation results are in Section 4. Finally, we conclude in Section 5.
II. Heavy-Tailed Distributions
In this section, we introduce four types of widely-used heavy-tailed distribution in addition to the normal distribution: (i) The Student’s t distribution; (ii) The Skewed t distribution; (iii) The normal inverse Gaussian distribution (NIG); and (iv) The generalized hyperbolic distribution (GH). All the distributions have been standardized to ensure mean and standard deviation equal to zero and one respectively. Their probability density functions are given as follows.
(i) Student’s t Distribution
12 2
1/2
1( )2( | ) 1
( 2)( )[( 2) ]2
tt
ef e
νν
ν ν νν π
+−
+Γ
= + − Γ −
, (1)
Whereν indicates degrees of freedom and 𝑒𝑒𝑡𝑡 is daily equity market index return.
(ii) Skewed t Distribution
( 1)/22
( 1)/22
11 /2 1
( | , )11 /
2 1
tt
t
tt
be abc e a b
f ebe abc e a b
ν
ν
ν βν β
ν β
− +
− +
+ + < − − − = + + ≥ − − +
Where 𝑒𝑒𝑡𝑡 is the standardized log return, and the constants a , b and c are given by 241
a c νβν− = −
,
2 2 21 3b aβ= + − , and c = 1( )2
( 2) ( )2
ν
νπ ν
+Γ
− Γ
. The density function has a mode of /a b− , a mean of zero, and a unit
variance. The density function is skewed to the right when β>0, and vice-versa when β>0. The Skewed t distribution specializes to the standard Student’s t distribution by setting the parameter β>0.
(iii) Normal Inverse Gaussian Distribution (NIG)
2 21 2 2
2 2
( ( ) )( | , , , ) exp( ( ))
( )t
t t
t
K ef e e
e
αδ α δ µµ α β δ δ α β β µ
π δ µ
+ −= − + −
+ −
Where 𝐾𝐾λ (.) is the modified Bessel function of the third kind and index λ=0 and α>0. The NIG distribution is
specified as in Prause (1997). The NIG distribution is normalized by setting μ =−𝛿𝛿𝛿𝛿/�𝛼𝛼2 − 𝛿𝛿2
and ( )32 2
2
α βδ
α
−= ,
which implies E(et)=0 and Var (et)=1.
12
Globa
l Jo
urna
l of M
anag
emen
t an
d Bu
siness Resea
rch
Volum
e XVIII
Issue
III
Ver
sion
IYe
ar
20
18
© 2018 Global Journals1
Fat Tails, Value at Risk, and the Palladium Returns
, (2)
, (3)
()
B
(iv) Generalized Hyperbolic Distribution
( )( ) ( ) ( )
( )( )1 1
2 2 2 2
, ,| , , ; , ,
, ,2 , ,
pt
tp
p
e m p b ggf e p b g q p b gd p b g
b g d p b g K g −
−=
+π
Where ( )( )
n pn n
p
K gR
g K g+ , ( ) { }
12 2 2
1 2 1, , 0d p b g R b R R−
+ − ≥ , and ( ) ( ) 1, , , ,m p b g b d p b g R− .
, and p b g are parameters. The generalized hyperbolic distribution is a standardized version of Prause (1997).
III. Data
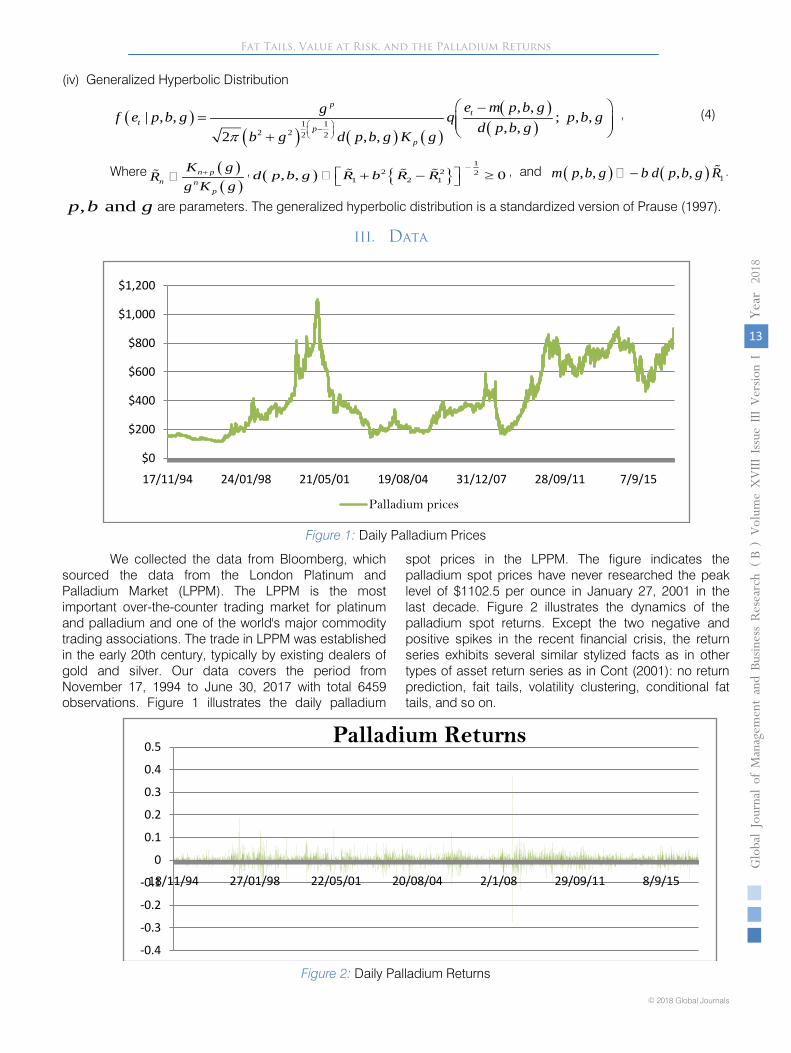
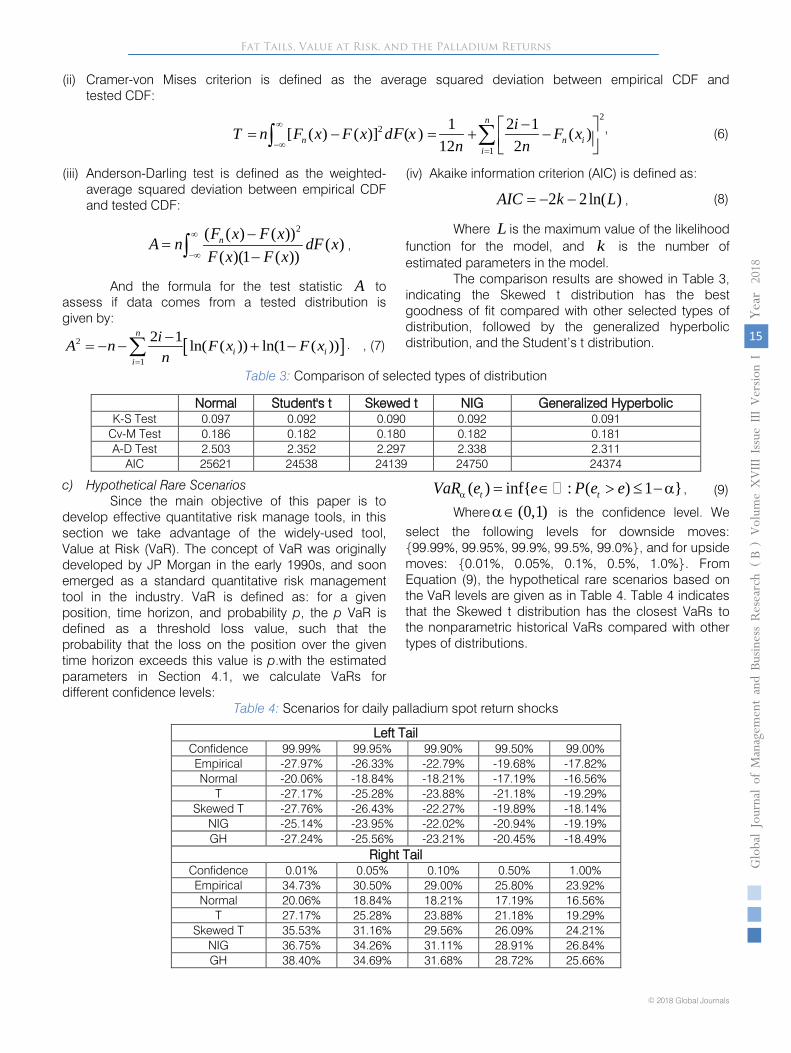
Figure 1: Daily Palladium Prices
We collected the data from Bloomberg, which sourced the data from the London Platinum and Palladium Market (LPPM). The LPPM is the most important over-the-counter trading market for platinum and palladium and one of the world's major commodity trading associations. The trade in LPPM was established in the early 20th century, typically by existing dealers of gold and silver. Our data covers the period from November 17, 1994 to June 30, 2017 with total 6459 observations. Figure 1 illustrates the daily palladium
spot prices in the LPPM. The figure indicates the palladium spot prices have never researched the peak level of $1102.5 per ounce in January 27, 2001 in the last decade. Figure 2 illustrates the dynamics of the palladium spot returns. Except the two negative and positive spikes in the recent financial crisis, the return series exhibits several similar stylized facts as in other types of asset return series as in Cont (2001): no return prediction, fait tails, volatility clustering, conditional fat tails, and so on.
Figure 2: Daily Palladium Returns
$0
$200
$400
$600
$800
$1,000
$1,200
17/11/94 24/01/98 21/05/01 19/08/04 31/12/07 28/09/11 7/9/15
Palladium prices
-0.4
-0.3
-0.2
-0.1
0
0.1
0.2
0.3
0.4
0.5
18/11/94 27/01/98 22/05/01 20/08/04 2/1/08 29/09/11 8/9/15
Palladium Returns
, (4)
13
Globa
l Jo
urna
l of M
anag
emen
t an
d Bu
siness Resea
rch
Volum
e XVIII
Issue
III
Ver
sion
IYe
ar
20
18
© 2018 Global Journals
Fat Tails, Value at Risk, and the Palladium Returns
()
B
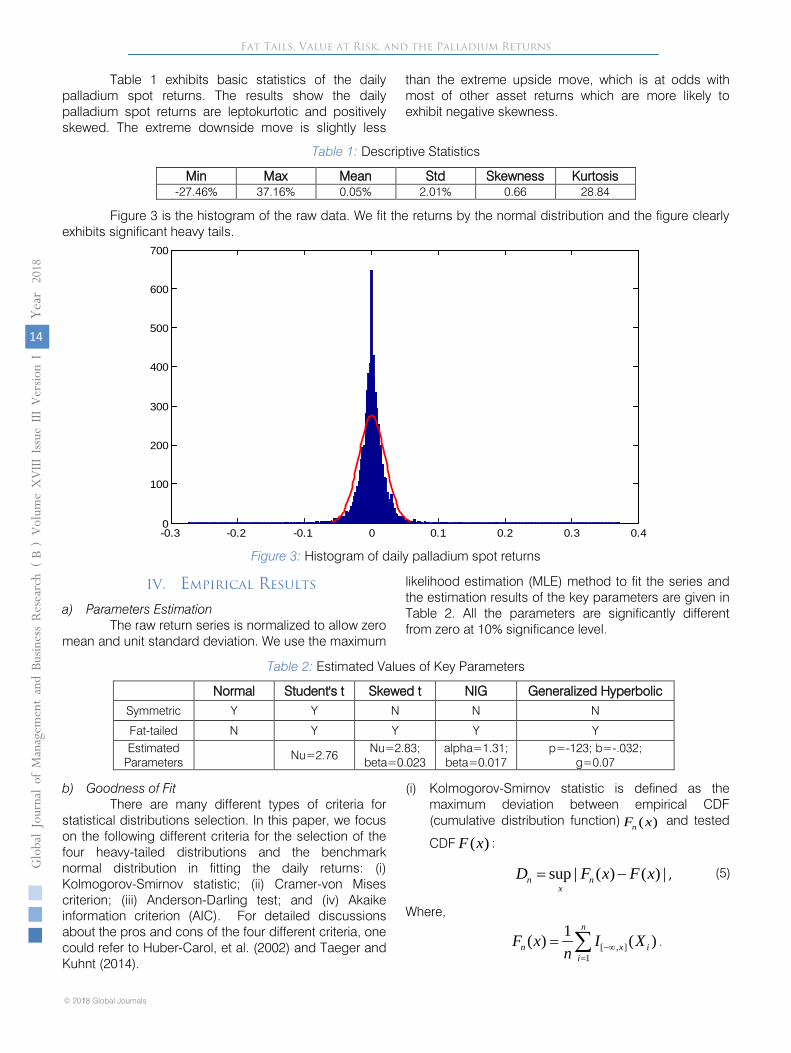
Table 1 exhibits basic statistics of the daily palladium spot returns. The results show the daily palladium spot returns are leptokurtotic and positively skewed. The extreme downside move is slightly less
than the extreme upside move, which is at odds with most of other asset returns which are more likely to exhibit negative skewness.
Table 1: Descriptive Statistics
Min Max Mean Std Skewness Kurtosis -27.46% 37.16% 0.05% 2.01% 0.66 28.84
Figure 3:
Histogram of daily palladium spot returns
IV.
Empirical Results
a)
Parameters Estimation The raw return series is normalized to allow zero
mean and unit standard deviation. We use the maximum
likelihood estimation (MLE) method to fit the series and the estimation results of the key parameters are given in Table 2.
All the parameters are significantly different from zero at 10% significance level.
Table 2:
Estimated Values of Key Parameters
b) Goodness of Fit
There are many different types of criteria for statistical distributions selection. In this paper, we focus on the following different criteria for the selection of the four heavy-tailed distributions and the benchmark normal distribution in fitting the
daily returns: (i)
Kolmogorov-Smirnov statistic; (ii) Cramer-von Mises criterion; (iii) Anderson-Darling test; and (iv) Akaike information criterion (AIC). For detailed discussions about the pros and cons of the four different criteria, one could refer to
Huber-Carol, et al. (2002) and
Taeger and
Kuhnt (2014).
(i) Kolmogorov-Smirnov statistic
is defined as the
maximum deviation between empirical CDF (cumulative distribution function) ( )nF x
and tested
CDF ( )F x :
,
Where,
[ , ]1
1( ) ( )n
n x ii
F x I Xn −∞
=
= ∑ .
-0.3 -0.2 -0.1 0 0.1 0.2 0.3 0.40
100
200
300
400
500
600
700
(5)
14
Globa
l Jo
urna
l of M
anag
emen
t an
d Bu
siness Resea
rch
Volum
e XVIII
Issue
III
Ver
sion
IYe
ar
20
18
© 2018 Global Journals1
Fat Tails, Value at Risk, and the Palladium Returns(
)B
sup | ( ) ( ) |n nx
D F x F x ,
Figure 3 is the histogram of the raw data. We fit the returns by the normal distribution and the figure clearly exhibits significant heavy tails.
Normal Student's t Skewed t NIG Generalized HyperbolicSymmetric Y Y N N N
Fat-tailed N Y Y Y YEstimated
ParametersNu=2.76
Nu=2.83; beta=0.023
alpha=1.31; beta=0.017
p=-123; b=-.032;g=0.07
(ii) Cramer-von Mises criterion is defined as the average squared deviation between empirical CDF and tested CDF:
22
1
1 2 1[ ( ) ( )] ( ) ( )12 2
n
n n ii
iT n F x F x d x F xn n
∞
−∞=
− = − = + − ∑∫
(iii) Anderson-Darling test is defined as the weighted-average squared deviation between empirical CDF and tested CDF:
2( ( ) ( )) ( )( )(1 ( ))nF x F xA n dF x
F x F x∞
−∞
−=
−∫ ,
And the formula for the test statistic A to assess if data comes from a tested distribution is given by:
[ ]2
1
2 1 ln( ( )) ln(1 ( ))n
i ii
iA n F x F xn=
−= − − + −∑ .
(iv) Akaike information criterion (AIC) is defined as:
2 2ln( )AIC k L= − − ,
Where L is the maximum value of the likelihood function for the model, and k is the number of estimated parameters in the model.
The comparison results are showed in Table 3, indicating the Skewed t distribution has the best goodness of fit compared with other selected types of distribution, followed by the generalized hyperbolic distribution, and the Student’s t distribution.
Table 3: Comparison of selected types of distribution
Normal Student's t Skewed t NIG Generalized Hyperbolic
K-S Test 0.097 0.092 0.090 0.092 0.091 Cv-M Test 0.186 0.182 0.180 0.182 0.181 A-D Test 2.503 2.352 2.297 2.338 2.311
AIC 25621 24538 24139 24750 24374 c) Hypothetical Rare Scenarios
Since the main objective of this paper is to develop effective quantitative risk manage tools, in this section we take advantage of the widely-used tool, Value at Risk (VaR). The concept of VaR was originally developed by JP Morgan in the early 1990s, and soon emerged as a standard quantitative risk management tool in the industry. VaR is defined as: for a given position, time horizon, and probability p, the p VaR is defined as a threshold loss value, such that the probability that the loss on the position over the given time horizon exceeds this value is p.with the estimated parameters in Section 4.1, we calculate VaRs for different confidence levels:
( ) inf{ : ( ) 1 }t tVaR e e P e eα = ∈ > ≤ −α ,
Where (0,1)α∈ is the confidence level. We select the following levels for downside moves: {99.99%, 99.95%, 99.9%, 99.5%, 99.0%}, and for upside moves: {0.01%, 0.05%, 0.1%, 0.5%, 1.0%}. From Equation (9), the hypothetical rare scenarios based on the VaR levels are given as in Table 4. Table 4 indicates that the Skewed t distribution has the closest VaRs to the nonparametric historical VaRs compared with other types of distributions.
Table 4: Scenarios for daily palladium spot return shocks
Left Tail Confidence 99.99% 99.95% 99.90% 99.50% 99.00% Empirical -27.97% -26.33% -22.79% -19.68% -17.82% Normal -20.06% -18.84% -18.21% -17.19% -16.56%
T -27.17% -25.28% -23.88% -21.18% -19.29% Skewed T -27.76% -26.43% -22.27% -19.89% -18.14%
NIG -25.14% -23.95% -22.02% -20.94% -19.19% GH -27.24% -25.56% -23.21% -20.45% -18.49%
Right Tail Confidence 0.01% 0.05% 0.10% 0.50% 1.00% Empirical 34.73% 30.50% 29.00% 25.80% 23.92% Normal 20.06% 18.84% 18.21% 17.19% 16.56%
T 27.17% 25.28% 23.88% 21.18% 19.29% Skewed T 35.53% 31.16% 29.56% 26.09% 24.21%
NIG 36.75% 34.26% 31.11% 28.91% 26.84% GH 38.40% 34.69% 31.68% 28.72% 25.66%
,
, (7)
(9)
15
Globa
l Jo
urna
l of M
anag
emen
t an
d Bu
siness Resea
rch
Volum
e XVIII
Issue
III
Ver
sion
IYe
ar
20
18
© 2018 Global Journals
Fat Tails, Value at Risk, and the Palladium Returns
F
()
B
(6)
(8)
V. Conclusions
The past decade has witnessed the rapid increase of the world palladium market. Thus, it is even more important to develop effective quantitative risk management tools at this moment. In this paper, we investigate five different types of widely-used statistical distributions and employ the industry standard risk measurement, Value at Risk, for risk management of daily palladium spot returns. We first apply four different criteria to compare the goodness of fit of the five distributions, and then calculate the VaRs based on the parameters estimated from the first step. Our results indicate the Skewed t distribution has the best in-sample fitting and generate VaR values closest to the nonparametric historical VaR values. There is one potential direction for further research. In Figure 2, we observed the volatility clustering phenomenon, which is usually captured by the generalized autoregressive conditional heteroskedasticity (GARCH) process in financial econometric modeling as in Guo (2017b). It would be interesting to incorporate the GARCH model into our current setting to discuss the relevant results.
References Références Referencias
1. Adrangi, B. and A. Chatrath (2002), “The dynamics of palladium and platinum prices.” Computational Economics, Vol. 19, no. 2, pp. 179-195.
2. Akaike, H. (1973). “Information theory and an extension of the maximum likelihood principle.” in Petrov, B.N.; Csáki, F., 2nd International Symposium on Information Theory, Tsahkadsor, Armenia, USSR, pp. 267–281.
3. Auer, B. (2015), “Superstitious seasonality in precious metals markets? Evidence from GARCH models with time-varying skewness and kurtosis.” Applied Economics, Vol. 47, pp. 2844-2859.
4. Barndorff - Nielsen, O. (1977). “Exponentially decreasing distributions for the logarithm of particle size.” Proceedings of the Royal Society, Vol. 353, pp. 401-419.
5. Bueno, P., E. Fortes and K. Vlachoski (2017). “Speculative investment, heavy-tailed distribution and risk management of Bitcoin exchange rate returns,” Journal of Progressive Research in Social Sciences, Vol. 5, pp. 347-355;
6. Caproale, G., F. Spagnolo and N. Spagnolo (2017), “Macro news and commodity returns.” International Journal of Finance and Economics, Vol. 22, pp. 68-80.
7. Cont, R. (2001), “Empirical properties of asset returns: stylized facts and statistical issues.” Quantitative Finance, Vol. 1, pp. 223-236.
8. Diaz, J. (2016), “Do scarce precious metals equate to safe harbor investments? The case of platinum and palladium.” Economic Research International, Vol. 2016, pp. 1-7.
9. Figueroa-Lopez, J., S. Lancette, K. Lee and Y. Mi (2011). “Estimation of NIG and VG models for high frequency financial data.” in Handbook of Modeling High-Frequency Data in Finance, edited by F. Viens, M.C. Mariani and I. Florescu, John Wiley & Sons, Inc., USA.
10. Guo, Z. (2017a). “Heavy-tailed distribution and risk management of equity market tail events.” Journal of Risk & Control, Vol. 4, pp. 31-41.
11. Guo, Z. (2017b). “GARCH models with fat-tailed distributions and the Hong Kong stock market returns.” International Journal of Business and Management, Vol. 12, pp. 28-37.
12. Hansen, B. (1994). “Autoregressive conditional density estimation.” International Economic Review, Vol. 35, pp. 705-730.
13. Hammoudeh, S., F. Malik and M. Mc Aleer (2011). “Risk management of precious metals.” Quarterly Review of Economics and Finance, Vol. 51, pp. 435-441.
14. Helmert, F. (1876). “Über die Wahrscheinlichkeit der Potenzsummen der Beobachtungs fehler und uber einige damit in Zusammenhang stehende Fragen,” Zurich Math Physics, Vol. 21, pp. 192-218.
15. Huber-Carol, C., N. Balakrishnan, M. Nikulin and M. Mesbah (2002). Goodness-of-Fit Tests and Model Validity, Springer.
16. Kayaba, K., Y. Hirano, M. Baba, N. Matsui and N. Ueda (2017). “Normal reciprocal inverse Gaussian distribution and the stock market returns in Japan.” Working paper.
17. Pierdzioch, C., M. Risse and S. Rohloff (2016), “Are precious metals a hedge against exchange-rate movements? An empirical exploration using Bayesian additive regression trees.” The North American Journal of Economics and Finance, Vol. 38, pp. 27-38.
18. Prause, K. (1999). “The generalized hyperbolic model: estimation, financial derivatives, and risk measures.” Ph.D. Dissertation.
19. Taeger, D. and S. Kuhnt (2014). “Goodness-of-fit tests.” Statistical Hypothesis Testing with SAS and R, Wiley Online Library.
16
Globa
l Jo
urna
l of M
anag
emen
t an
d Bu
siness Resea
rch
Volum
e XVIII
Issue
III
Ver
sion
IYe
ar
20
18
© 2018 Global Journals1
Fat Tails, Value at Risk, and the Palladium Returns(
)B
© 2018. Tchatchoua Thierry, Math Mazra & Et Djebba Vagai. This is a research/review paper, distributed under the terms of the Creative Commons Attribution-Noncommercial 3.0 Unported License http://creativecommons.org/licenses/by-nc/3.0/), permitting all non-commercial use, distribution, and reproduction in any medium, provided the original work is properly cited.
Global Journal of Management and Business Research: B Economics and Commerce Volume 18 Issue 3 Version 1.0 Year 2018 Type: Double Blind Peer Reviewed International Research Journal Publisher: Global Journals
Online ISSN: 2249-4588 & Print ISSN: 0975-5853
La RSE Dans Les PME Camerounaises: Etude Exploratoire À Partir Des Schèmes Cognitifs Des Propriétaires-Dirigeants
By Tchatchoua Thierry, Math Mazra & Et Djebba Vagai Université de Maroua
Abstract- This study is interested in the owner-manager of the SME and particularly in the analysis of his cognitive schemes concerning CSR. Using cognitive mapping as a technique for representing and analysing cognitive patterns, the results of this study reveal that human resources, consumers and to a lesser extent the community are the stakeholders whose well-being is of concern to SME’s owners manager. However, their motivations for implementing CSR are not the same. For some, CSR is a lever for achieving strategic objectives, while for others it is an objective in itself, and not a means for achieving other ends.
Keywords: SMEs, CSR, owner-managers, cognitive schemes.
GJMBR-B Classification: JEL Code: A10
LaRSEDansLesPMECamerounaisesEtudeExploratoireaPartirDesSchemesCognitifsDesProprietairesDirigeants
Strictly as per the compliance and regulations of:
17
Globa
l Jo
urna
l of M
anag
emen
t an
d Bu
siness Resea
rch
Volum
e XVIII
Issue
III
Ver
sion
IYe
ar
20
18
© 2018 Global Journals
()
B
Tchatchoua Thierry α, Math Mazra σ & Et Djebba Vagai ρ
Résumé- Cette étude s’intéresse au propriétaire-dirigeant de la PME et particulièrement à l’analyse de ses schèmes cognitifs concernant la RSE. Utilisant la technique de la cartographie cognitive comme technique de représentation et d’analyse des schèmes cognitifs, les résultats de cette étude révèlent que les ressources humaines, les consommateurs et dans une moindre mesure la communauté sont les parties prenantes dont le bien-être préoccupent les propriétaires-dirigeants de PME. Cependant leurs motivations à l’implémentation de de la RSE ne sont pas les mêmes. Pour certains la RSE constitue un levier pour l’atteinte des objectifs stratégiques tandis que pour d’autres il s’agit en soi d’un objectif, et non d’un moyen pour l’atteinte d’autres fins. Motsclés : PME, RSE, propriétaire-dirigeant, schèmes cognitifs. Abstract- This study is interested in the owner-manager of the SME and particularly in the analysis of his cognitive schemes concerning CSR. Using cognitive mapping as a technique for representing and analysing cognitive patterns, the results of this study reveal that human resources, consumers and to a lesser extent the community are the stakeholders whose well-being is of concern to SME’s owners manager. However, their motivations for implementing CSR are not the same. For some, CSR is a lever for achieving strategic objectives, while for others it is an objective in itself, and not a means for achieving other ends. Keywords: SMEs, CSR, owner-managers, cognitive schemes.
I. Introduction
a RSE est devenue une des expressions les plus en vogue du monde des affaires. Presque toutes les grandes entreprises ou multinationales s’y
mettent et publient régulièrement des rapports de RSE ou présentent des campagnes soulignant leurs activités de RSE. Elle constitue également un objet de recherche privilégié en sciences de gestion dans la mesure où ce champ de réflexion est de plus en plus répandu, dans le monde scientifique.
Le concept de RSE n’est pourtant pas un concept récent. Développée dans les années 1950 par des auteurs anglo-saxons, et notamment par Bowen en
Author α ρ:
Assistant, Département de Management Stratégie et
Prospective, Faculté des Sciences Economiques et de Gestion, Université de Maroua-Cameroun. e-mail: [email protected]
Author σ: Chargé de Cours, Département de Management Stratégie et
Prospective, Faculté des Sciences Economiques et de Gestion, Université de Maroua-Cameroun.
1953, la RSE revêt actuellement des enjeux différents, tant dans les grandes que les petites et moyennes entreprises.
Toutefois, le mouvement de recherche sur la RSE a été essentiellement orienté vers les très grandes entreprises; compte tenu du fait qu’elles ont une contribution significative au niveau de la production et des échanges économiques, donc génèrent également des externalités conséquentes en matière environnementale et sociale, cela conduit les organismes internationaux à demander à ces grandes entreprises d’intégrer la prise en compte de ses effets dans le management de leurs entreprises. En effet, l’idée qui prévalait était que ce concept concernait surtout les grandes entreprises; Si on a pu s’interroger pendant quelque temps sur la pertinence de la promotion de la RSE dans les PME, cette question apparaît aujourd’hui dépassée, le problème étant plutôt de savoir quelles sont les pratiques de RSE dans les PME.
Les raisons qui amènent à considérer que les PME sont autant concernées que les grandes entreprises par la RSE peuvent être nombreuses. Si on estime généralement que les grandes entreprises sont essentiellement motivées par le risque de réputation, on pourrait penser que les PME, dont la visibilité est moins grande et le degré d’exposition médiatique plus faible, peuvent se dispenser de mettre en œuvre des démarches de RSE. En fait, il n’en est rien, car leur proximité avec l’environnement, leur familiarité avec les acteurs locaux et leur implication dans le maillage territorial leur confère au contraire une responsabilité particulière.
En outre compte tenu de leur importance et leur prépondérance dans le tissu économique, les PME sont aujourd’hui sollicitées pour adopter un comportement responsable (Munteanu, 2014). En effet, même si l'impact individuel d’une PME peut paraitre relativement limité, les conséquences cumulées de ces entreprises tant au plan économique, social ou environnemental sont substantielles (Ammenberg et Hjelm, 2003).
Diverses études ont mis en évidence la particularité des partiques de RSE des PME par rapport à celle des grandes structures (Courrent et Spence, 2014; Spence et al., 2007; Spence et al., 2011). Toutefois, Les travaux portant sur l’implication des PME
L
La RSE Dans Les PME Camerounaises: Etude Exploratoire À Partir Des Schèmes Cognitifs Des
Propriétaires-Dirigeants
18
Globa
l Jo
urna
l of M
anag
emen
t an
d Bu
siness Resea
rch
Volum
e XVIII
Issue
III
Ver
sion
IYe
ar
20
18
© 2018 Global Journals1
La Rse Dans Les Pme Camerounaises: Etude Exploratoire a Partir Des Schemes Cognitifs Des Proprietaires-Dirigeants
()
B
dans la RSE sont à ce jour encore limitées par rapport à ceux portant sur la RSE dans les grandes entreprises (Munteanu, 2014). Ce constat est aujourd’hui établi en dépit des conclusions de quelques études (Ciliberti et al., 2008).
En outre, la majorité des études consacrés au sujet se regroupent principalement dans les pays développés (Ortiz-Avram et Kühne, 2008; Russo et Perrini, 2010). Les conclusions de telles études étant difficilement transposables aux pays en développement en général et africains en particulier, il nous est paru intéressant d’explorer ce sujet dans le contexte camerounais, compte tenu du fait que la RSE est un concept très peu connu et partagé dans les milieux des entreprises d’origine africaine (Atidegla ,2005). En effet, au Cameroun les pratiques de RSE sont davantage le fait des filiales des multinationales qui a travers leurs fondations caritives (fondation Orange, fondation MTN,) œuvrent à l’implémentation de la RSE à côté du développement de leurs activités principales.
Peu de recherches aussi bien dans les pays développés qu’en développement se sont intéressées à ce que pensent les propriétaires-dirigeants de PME de la RSE. Ceci constitue une remise en cause profonde de leurs spécificités (Torrès, 1997), dont l’une des principales réside dans la place centrale des propriétaires-dirigeants dans la gestion de l’entreprise (Ben hassine et Ghozzi-Nekhili, 2013).
Partant de ce constat, le but de cet article est de contribuer à la recherche sur la RSE en contexte PME en mettant l’accent sur l’acteur central qu’est le propriétaire - dirigeant et particulièrement sur ses schèmes cognitifs.
II. Revue de la Littérature
a) La RSE: un Concept, Plusieurs Définitions La RSE est conçue comme une "soft law", c'est-
à-dire que les règles de droit qui en résultent sont non obligatoires. Elle demeure à ce jour une obligation morale pour les organisations, en ce sens que son non-respect n’entraîne pas de sanctions. L’article pionnier dans le champ de la responsabilité sociale, intitulé The Changing Basis of Economic Responsibility, date de 1916. Écrit par l’économiste américain, Clark (1916), l’auteur, pourtant défenseur de la théorie économique, propose un contrôle social des affaires, c'est-à-dire un élargissement des responsabilités de l’entreprise dans le volet social. Mais c’est grâce à Bowen (1953) avec son ouvrage Social Responsibilities of the Businessman, que la RSE connut un écho mondial.
Cependant, même après plusieurs décennies, durant lesquelles de nombreux chercheurs se sont penchés sur la question, aucun réel consensus ne semble s’être établi afin de délimiter de manière définitive la notion de RSE. Les recherches de Dahlsrud (2008) ont montré qu’entre 1980 et 2003, 37 définitions de la RSE avaient été proposées tant par les théoriciens
que par les institutions. Bien que cette floraison de définitions ou d’acceptions du terme traduise l’intérêt sans cesse croissant que suscite ce concept, il faut reconnaitre qu’elle traduit également la difficulté de délimiter le champ de la RSE.
Pour Bowen (1953), la RSE représente l’obligation pour les dirigeants de poursuivre les politiques et de prendre les décisions qui sont en cohérence avec les valeurs de la société. Plusieurs auteurs vont abonder dans ce sens. Pour Davis (1960), la RSE concerne les actions et les décisions que prennent les hommes d’affaires pour des raisons qui vont, en partie, au-delà des intérêts purement techniques et économiques de l’entreprise. Cet auteur admet que la responsabilité d’un homme d’affaires et de son entreprise dépasse la simple recherche des performances économiques. Frederick (1960), quant à lui, considère que, la RSE suppose une attitude civique à l’égard des ressources économiques et humaines, et une volonté d’utiliser ces ressources pour satisfaire des but sociaux élevés et pas simplement l’intérêt étroitement circonscrit d’une groupe de personnes fussent-ils actionnaires.
Pour Mc Guire (1963) la responsabilité sociale suppose que l’entreprise n’a pas seulement des obligations légales ou économiques, mais qu’elle a aussi des responsabilités envers la société qui vont au-delà de ces obligations.
Carroll (1979), considère quant-à lui que la Responsabilité Sociale doit être abordée selon trois approches que sont la réactivité organisationnelle, les différentes catégories de la RSE et les préoccupations sociales de l’organisation. Selon cet auteur, la RSE est l’ensemble des obligations que l’entreprise a vis-à-vis de la société (en englobant) les catégories économiques, légales, éthiques et discrétionnaires. Cet auteur détermine quatre catégories de responsabilité: celle discrétionnaire, celle éthique, celle légale et celle économique. Selon ce modèle, les grandes préoccupations de l’entreprise se divisent en six catégories: les consommateurs, les discriminations, l’environnement, la sécurité des produits, la sécurité au travail et les actionnaires.
En 2001, la Commission des Communautés européennes définit le concept de RSE dans son Livre Vert: « Le concept de responsabilité sociale des entreprises signifie essentiellement que celles-ci décident de leur propre initiative de contribuer à améliorer la société et rendre plus propre l’environnement. (…). Cette responsabilité s’exprime vis-à-vis des salariés et, plus généralement, de toutes les parties prenantes qui sont concernées par l’entreprise mais qui peuvent, à leur tour, influer sur sa réussite (…). Bien que leur responsabilité première soit de générer des profits, les entreprises peuvent en même temps contribuer à des objectifs sociaux et à la protection de l’environnement, en intégrant la responsabilité sociale
19
Globa
l Jo
urna
l of M
anag
emen
t an
d Bu
siness Resea
rch
Volum
e XVIII
Issue
III
Ver
sion
IYe
ar
20
18
© 2018 Global Journals
La Rse Dans Les Pme Camerounaises: Etude Exploratoire a Partir Des Schemes Cognitifs Des Proprietaires-Dirigeants
()
B
comme investissement stratégique au cœur de leur stratégie commerciale, de leurs instruments de gestion et de leurs activités » (CE, 2001: 5). Cette définition montre alors que la RSE n'est pas une alternative aux activités centrales de l'entreprise, elle s’applique à la gestion même de toute entreprise.
Pour la Commission interdépartementale du développement durable, la RSE est« un processus permanent d’amélioration dans le cadre duquel les entreprises intègrent de manière volontaire, systématique et cohérente des considérations d’ordre social, environnemental et économique dans la gestion globale de l’entreprise ; à cet égard, la concertation avec les parties prenantes de l’entreprise fait partie intégrante du processus » (CIDD, 2005, p.6).
Toutes ces définitions, bienque différentes les unes des autres, font ressortir deux dimensions fondamentales de la RSE. D'une part, elles font valoir que la responsabilité sociale réside dans le fait d'aller au-delà de la loi et de la réglementation. Le deuxième élément important que font ressortir les définitions réside dans l'idée corollaire que l'entreprise n'est pas seulement redevable envers ses actionnaires, mais qu'elle doit également tenir compte de l'ensemble des intervenants avec qui elle a des liens ou sur lesquels elle a un impact.
Partant de ce constat, la définition que nous retenons dans le cadre de cette étude est celle de la commission européenne (2001, p.6) qui définit la RSE comme: « un concept par lequel les entreprises intègrent les préoccupations sociales et environnementales dans leurs opérations d’affaires et dans leurs interactions avec leurs parties prenantes sur une base volontaire ».
L’ambiguïté de la définition de la RSE se répercute évidemment dans ses pratiques, notamment dans les PME.
b) Spécificités de la RSE dans les PME Dès 1991, Keneret Smith (1991) soulignent le
fait que peu de recherches sont menées sur la RSE en contexte PME. Les institutions européennes l’admettent également ; « on sait peu de choses des attitudes et des activités des PME en ce qui concerne leur implication en RSE » (Commission Européenne, 2002, p. 7). Or la RSE n’est pas, loin s’en faut, ignorée des PME.
Depuis quelques années, des initiatives se sont multipliées sur le sujet et un mouvement de recherche prenant en considération les PME s’est mis en route (Quairel-Lanoizelée et Auberger., 2005, Moore et Spence, 2006 ; Morsing et Perrini, 2009 ; Perrini, 2006 ; Perrini et al., 2007 ; Russo et Tencati, 2008). Plusieurs recherches montrent que les PME s’engagent dans la RSE mais différemment que ne le font les grandes entreprises (Moore et Spence, 2006; Perrini et al., 2007). La RSE en PME n’est pas standardisée à travers des procédures précises comme on peut le voir dans le cas des grandes entreprises qui font souvent référence aux mêmes outils. Car, très souvent les PME font de la RSE de façon purement informelle (Commission Européenne, 2007).
Cependant, les études laissent entrevoir des résultats très hétérogènes quant à la réalité des pratiques responsables dans les PME (Observatoire des PME européennes, 2002; Auberger et Quairel, 2005 ; Berger-Douce, 2006, 2008).
En effet, Il est difficile pour les PME de s’engager sur tous les aspects compris dans la notion de RSE.L’étude de Wilson (1980) révèle que les préoccupations en matière de RSE dans les PME sont diversement perçues. De cette étude, il ressort que la responsabilité envers le consommateur à travers sa satisfaction liée à la qualité du produit, du service, et des besoins est davantage prise en compte dans les PME; suivent, la responsabilité envers les employés a travers les salaires , les conditions de travail, le partage des bénéfices et la responsabilité envers la communauté à travers les donations, respect de l’environnement, des lois et règlements enfin la recherche du profit.
Wilson (1980) divise les dirigeants de PME en deux catégories: les dirigeants de type P orientés profit et les dirigeants de type V considérant d’autres valeurs en dehors de la profitabilité. Pour les dirigeants de type V, le « bien de la société » est aussi important que la profitabilité.
Les travaux de Cabagnols et Le bas (2006) montrent également que les PME s’engagent moins intensément dans des actions environnementales, que les grandes.
Le tableau ci-dessous énumère les pratiques de RSE généralement recensées dans les PME.
Tableau 1: Actions RSE dans les PME (Jenkins, 2006)
Environnement
Employés
Société / Communauté
Utilisation d’énergies renouvelables
Evènements sociaux pour les collaborateurs
Dons à des associations Réductions des produits dangereux
pour l’environnement
Formations et programmes de développement
Engagement dans lavie locale de la société
Afin de prendre en compte la diversité des
pratiques de RSE des propriétaires-dirigeants de PME au regard de leur engagement sociétal et/ou environnemental, Berger-Douce (2007) distingue quatre
types d’engagement dans la RSE: engagement rituel, engagement réactif, l’engagement proactif et l’engagement mobilisateur.
20
Globa
l Jo
urna
l of M
anag
emen
t an
d Bu
siness Resea
rch
Volum
e XVIII
Issue
III
Ver
sion
IYe
ar
20
18
© 2018 Global Journals1
La Rse Dans Les Pme Camerounaises: Etude Exploratoire a Partir Des Schemes Cognitifs Des Proprietaires-Dirigeants
()
B
L’engagement rituel traduit un engagement dans les pratiques RSE résultant des pressions externes ou des opportunités comme la recherche d’un avantage concurrentiel ou l’amélioration de l’image sans que le dirigeant ne soit obligatoirement convaincu du bien-fondé de sa démarche.
L’engagement mobilisateur est de nature stratégique. L’engagement du propriétaire-dirigeant de la PME dans ce cas est une réponse aussi bien aux contraintes environnementales qu’aux besoin de gestion interne. Il s’agit d’un engagement dans les pratiques RSE du dirigeant dans la perspective que cet engagement produise des effets induits contribuant à l’atteinte des objectifs stratégiques de l’entreprise. Il peut s’agir d’un moyen d’amélioration des conditions de travail (Masurel, 2007) ainsi que de gagner la loyauté, la confiance, et la motivation de son personnel (Berger-Douce; 2008).
L’engagement proactif renvoi à une volonté forte du dirigeant d’implémenter des actions en faveur de la RSE en l’absence de contraintes externes. L’engagement de type réactif traduit un engagement contraint du dirigeant a la RSE du fait de la règlementation.
Allant dans le même sens Saulquin et Schier (2007) ont défini une typologie des perceptions des dirigeants de PME vis-à-vis de la RSE en quatre catégories: contrainte, levier d’ouverture, levier de dynamique interne, et levier stratégique. Ainsi selon ces auteurs le dirigeant de la PME peut adopter soit une posture mécaniste lorsqu’il perçoit la RSE comme une contrainte, soit une posture opportuniste et cosmétique lorsqu’il perçoit la RSE comme un levier d’ouverture, soit une posture processuelle quand il la perçoit comme un levier de dynamique interne et enfin une posture engagée lorsqu’il la perçoit comme un levier stratégie.
Un pas de plus vers une conception de la RSE comme construction cognitive est franchi avec Ben Boubaker-Gherib et al. (2009) qui conçoivent un modèle conceptuel basé sur les perceptions des dirigeants. Leur modèle est basé sur une typologie de perceptions
qui oscillent entre : le « devoir faire » et le « vouloir faire ». Suivant cette approche, l’engagement des PME dans la RSE est déterminé par ses valeurs personnelles du dirigeant ou mieux encore par ses schèmes cognitifs.
La plupart des auteurs qui étudient les PME constate l’impossibilité d’évoquer la gestion de celles-ci en éludant la question du poids des propriétaires-dirigeants (Bayad et Nebenhaus, 1998). Les décisions stratégiques et organisationnelles courantes sont considérées comme corrélées au schème cognitif du propriétaire-dirigeant (Julien, 1993, Marchesnay, 1991).
Le schème cognitif est l’unité à ce jour la plus réduite pour l’étude de l’individu en tant qu’acteur
pensant. L’importance des schèmes cognitifs dans l’étude des individus est révélée à la suite des travaux de Dearborn et Simon (1958).
Les schèmes cognitifs ou mentaux représentent la façon qu’a un individu d’appréhender la réalité présente, passée et future (Cossette, 2004). Il s’agit d’une sorte de grilles de lecture de la réalité qui permettent le déchiffrage d’une situation, grâce à la perception d’un ensemble de liens de cause à effet, et d’agir en conséquence (Wirtz, 2002). Ils permettent à l’individu de donner sens à tout ce qui l’entoure. Cependant, les schèmes ne doivent pas être confondus avec la réalité, puisqu’ils n’en sont qu’une représentation assez subjective, un schéma simplifié et distordu de la situation objective (March et Simon, 1958).
Ce processus de création de sens s'apparente à une heuristique individuelle qui permet en quelque sorte de simplifier la réalité en traduisant ce qui se passe dans et autour de l'organisation, en lui conférant des significations et en faisant des liens avec la réalité organisationnelle. Ces significations résultent de processus subjectifs et interprétatifs qui sont ancrés dans des contextes organisationnels et sociétaux spécifiques. Les schèmes cognitifs sont le produit de processus culturels et institutionnels (pays, région, famille, religion, écoles, expérience professionnelle etc.) qui prennent place à différents niveaux dans la vie d’un individu. Les connaitre et les prendre en considération dans l’étude des organisations est déterminant, car l’une des clefs du de la gestion des organisations réside dans la pensée des dirigeants, dans ses contenus et dans ses mécanismes (Laroche et Nioche, 1994).
En effet, l’approche cognitive des organisations considère que la pensée du dirigeant de l’entreprise est l’élément clé pour comprendre et expliquer ses décisions managériales (Gendre-Aegerter, 2008). L’organisation, comme produit et comme processus, est profondément humaine et la compréhension qu’on peut en développer ne peut être, au mieux que très superficielle si elle ne tient pas compte des individus concernés, particulièrement de leurs schèmes. Les travaux de March et Simon (1958) sur la théorie de la rationalité limitée ont depuis longtemps montré que les décisions managériales reflétaient dans une large mesure les idiosyncrasies du dirigeant. C’est ce qui fait dire à Laroche et Nioche (1994, p. 46) que:« les organisations ne peuvent être comprises sans faire référence aux structures cognitives de leurs acteurs et tout particulièrement de celles des dirigeants ».
Selon cette approche, l’organisation est perçue comme en partie ou en totalité créée par les individus qui agissent sur elle et non comme un organisme obéissant à une série de lois scientifiques (Cossette, 2003). Elle remet en cause le modèle solidement installé celui de l’organisation « boite noire » (Lauriol, 1996). Elle remet également en cause la conception néo-classique de la rationalité des individus pour s’appuyer sur la
c) Les Schèmes Cognitifs Du Propriétaire-Dirigeant: De Quoi s’agit-il ?
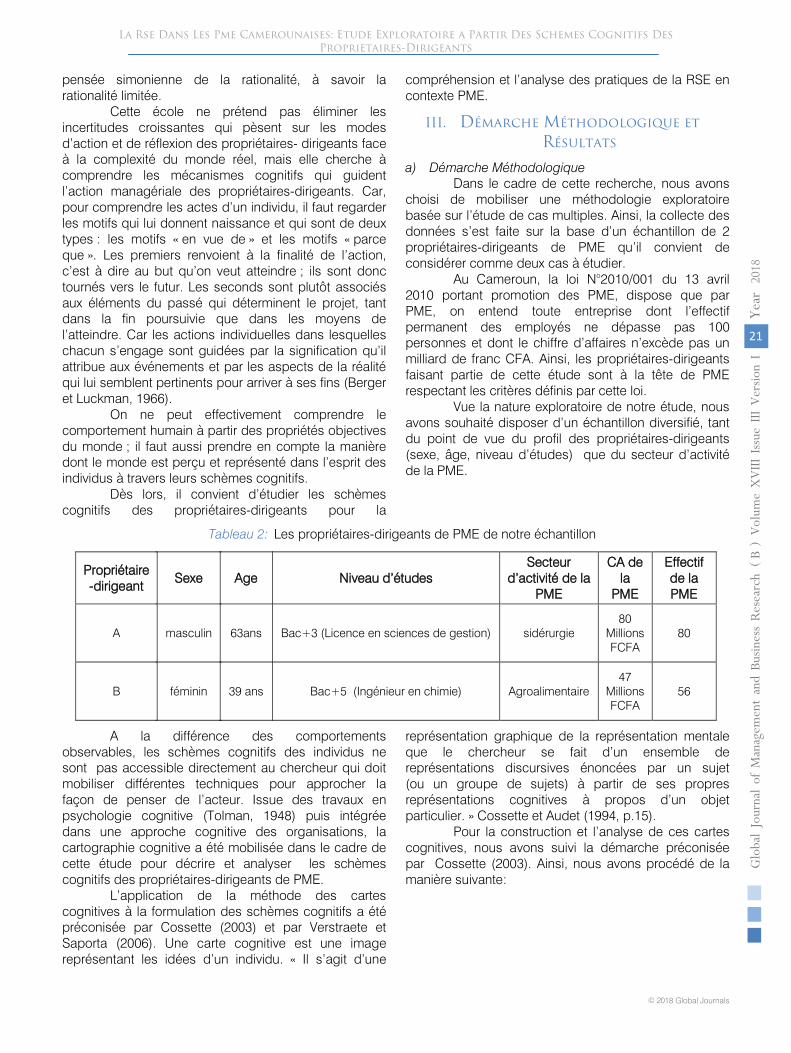
21
Globa
l Jo
urna
l of M
anag
emen
t an
d Bu
siness Resea
rch
Volum
e XVIII
Issue
III
Ver
sion
IYe
ar20
18
© 2018 Global Journals
La Rse Dans Les Pme Camerounaises: Etude Exploratoire a Partir Des Schemes Cognitifs Des Proprietaires-Dirigeants
()
B
pensée simonienne de la rationalité, à savoir la rationalité limitée.
Cette école ne prétend pas éliminer les incertitudes croissantes qui pèsent sur les modes d’action et de réflexion des propriétaires- dirigeants face à la complexité du monde réel, mais elle cherche à comprendre les mécanismes cognitifs qui guident l’action managériale des propriétaires-dirigeants. Car, pour comprendre les actes d’un individu, il faut regarder les motifs qui lui donnent naissance et qui sont de deux types : les motifs « en vue de » et les motifs « parce que ». Les premiers renvoient à la finalité de l’action, c’est à dire au but qu’on veut atteindre ; ils sont donc tournés vers le futur. Les seconds sont plutôt associés aux éléments du passé qui déterminent le projet, tant dans la fin poursuivie que dans les moyens de l’atteindre. Car les actions individuelles dans lesquelles chacun s’engage sont guidées par la signification qu’il attribue aux événements et par les aspects de la réalité qui lui semblent pertinents pour arriver à ses fins (Berger et Luckman, 1966).
On ne peut effectivement comprendre le comportement humain à partir des propriétés objectives du monde ; il faut aussi prendre en compte la manière dont le monde est perçu et représenté dans l’esprit des individus à travers leurs schèmes cognitifs.
Dès lors, il convient d’étudier les schèmes cognitifs des propriétaires-dirigeants pour la
compréhension et l’analyse des pratiques de la RSE en contexte PME.
III. Démarche Méthodologique et Résultats
a) Démarche Méthodologique Dans le cadre de cette recherche, nous avons
choisi de mobiliser une méthodologie exploratoire basée sur l’étude de cas multiples. Ainsi, la collecte des données s’est faite sur la base d’un échantillon de 2 propriétaires-dirigeants de PME qu’il convient de considérer comme deux cas à étudier.
Au Cameroun, la loi N°2010/001 du 13 avril 2010 portant promotion des PME, dispose que par PME, on entend toute entreprise dont l’effectif permanent des employés ne dépasse pas 100 personnes et dont le chiffre d’affaires n’excède pas un milliard de franc CFA. Ainsi, les propriétaires-dirigeants faisant partie de cette étude sont à la tête de PME respectant les critères définis par cette loi.
Vue la nature exploratoire de notre étude, nous avons souhaité disposer d’un échantillon diversifié, tant du point de vue du profil des propriétaires-dirigeants (sexe, âge, niveau d’études) que du secteur d’activité de la PME.
Tableau 2: Les propriétaires-dirigeants de PME de notre échantillon
Propriétaire-dirigeant
Sexe Age Niveau d’études
Secteur d’activité de la
PME
CA de la
PME
Effectif de la PME
A masculin 63ans Bac+3 (Licence en sciences de gestion) sidérurgie
80 Millions FCFA
80
B féminin 39 ans Bac+5 (Ingénieur en chimie) Agroalimentaire
47 Millions FCFA
56
A la différence des comportements observables, les schèmes cognitifs des individus ne sont pas accessible directement au chercheur qui doit mobiliser différentes techniques pour approcher la façon de penser de l’acteur. Issue des travaux en psychologie cognitive (Tolman, 1948) puis intégrée dans une approche cognitive des organisations, la cartographie cognitive a été mobilisée dans le cadre de cette étude pour décrire et analyser les schèmes cognitifs des propriétaires-dirigeants de PME.
L’application de la méthode des cartes cognitives à la formulation des schèmes cognitifs a été préconisée par Cossette (2003) et par Verstraete et Saporta (2006). Une carte cognitive est une image représentant les idées d’un individu. « Il s’agit d’une
représentation graphique de la représentation mentale que le chercheur se fait d’un ensemble de représentations discursives énoncées par un sujet (ou un groupe de sujets) à partir de ses propres représentations cognitives à propos d’un objet particulier. » Cossette et Audet (1994, p.15).
Pour la construction et l’analyse de ces cartes cognitives, nous avons suivi la démarche préconisée par Cossette (2003). Ainsi, nous avons procédé de la manière suivante:
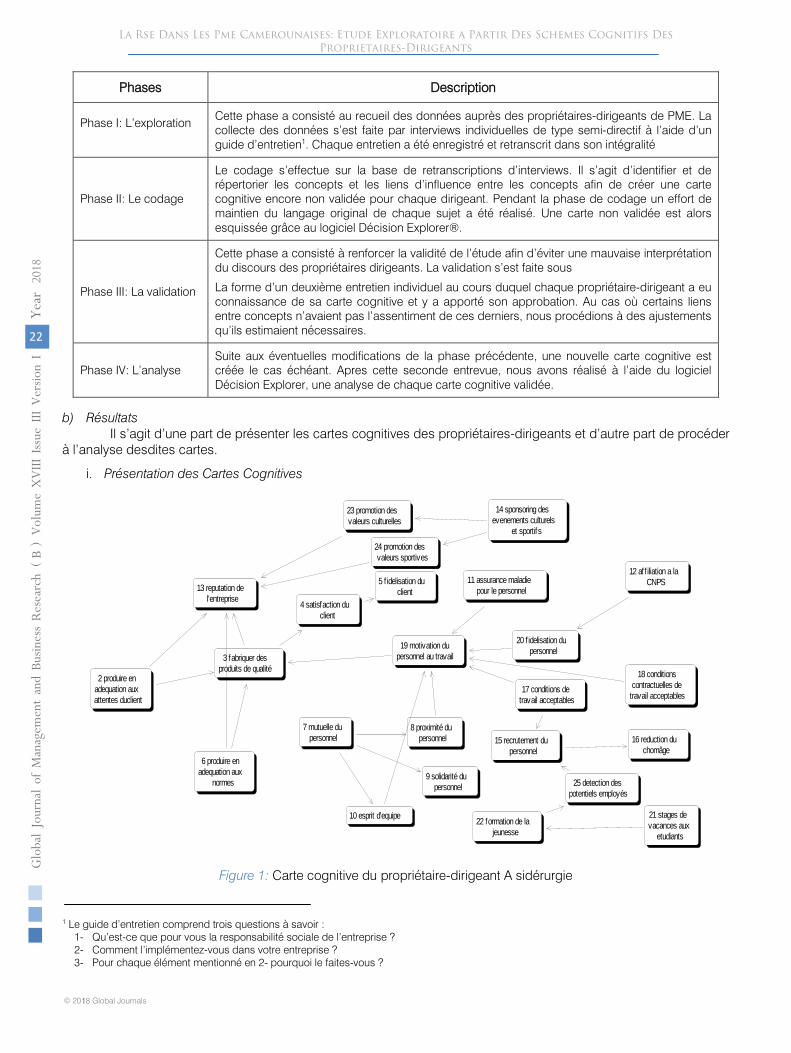
22
Globa
l Jo
urna
l of M
anag
emen
t an
d Bu
siness Resea
rch
Volum
e XVIII
Issue
III
Ver
sion
IYe
ar
20
18
© 2018 Global Journals1
La Rse Dans Les Pme Camerounaises: Etude Exploratoire a Partir Des Schemes Cognitifs Des Proprietaires-Dirigeants
()
B
Phases Description
Phase I: L’exploration
Cette phase a consisté au recueil des données auprès des propriétaires-dirigeants de PME. La collecte des données s’est faite par interviews individuelles de type semi-directif à l’aide d’un guide d’entretien1. Chaque entretien a été enregistré et retranscrit dans son intégralité
Phase II: Le codage
Le codage s’effectue sur la base de retranscriptions d’interviews. Il s’agit d’identifier et de répertorier les concepts et les liens d’influence entre les concepts afin de créer une carte cognitive encore non validée pour chaque dirigeant. Pendant la phase de codage un effort de maintien du langage original de chaque sujet a été réalisé. Une carte non validée est alors esquissée grâce au logiciel Décision Explorer®.
Phase III: La validation
Cette phase a consisté à renforcer la validité de l’étude afin d’éviter une mauvaise interprétation du discours des propriétaires dirigeants. La validation s’est faite sous
La forme d’un deuxième entretien individuel au cours duquel chaque propriétaire-dirigeant a eu connaissance de sa carte cognitive et y a apporté son approbation. Au cas où certains liens entre concepts n’avaient pas l’assentiment de ces derniers, nous procédions à des ajustements qu’ils estimaient nécessaires.
Phase IV: L’analyse Suite aux éventuelles modifications de la phase précédente, une nouvelle carte cognitive est créée le cas échéant. Apres cette seconde entrevue, nous avons réalisé à l’aide du logiciel Décision Explorer, une analyse de chaque carte cognitive validée.
b) Résultats Il s’agit d’une part de présenter les cartes cognitives des propriétaires-dirigeants et d’autre part de procéder
à l’analyse desdites cartes.
i. Présentation des Cartes Cognitives
Figure 1: Carte cognitive du propriétaire-dirigeant A sidérurgie
1 Le guide d’entretien comprend trois questions à savoir :
1- Qu’est-ce que pour vous la responsabilité sociale de l’entreprise ? 2- Comment l’implémentez-vous dans votre entreprise ? 3- Pour chaque élément mentionné en 2- pourquoi le faites-vous ?
2 produire en
adequation aux
attentes duclient
3 fabriquer des
produits de qualité
4 satisfaction du
client
5 f idelisation du
client
6 produire en
adequation aux
normes
7 mutuelle du
personnel8 proximité du
personnel
9 solidarité du
personnel
10 esprit d'equipe
11 assurance maladie
pour le personnel
12 aff iliation a la
CNPS13 reputation de
l'entreprise
14 sponsoring des
evenements culturels
et sportifs
15 recrutement du
personnel
16 reduction du
chomâge
17 conditions de
travail acceptables
18 conditions
contractuelles de
travail acceptables
19 motivation du
personnel au travail
20 fidelisation du
personnel
21 stages de
vacances aux
etudiants
22 formation de la
jeunesse
23 promotion des
valeurs culturelles
24 promotion des
valeurs sportives
25 detection des
potentiels employés
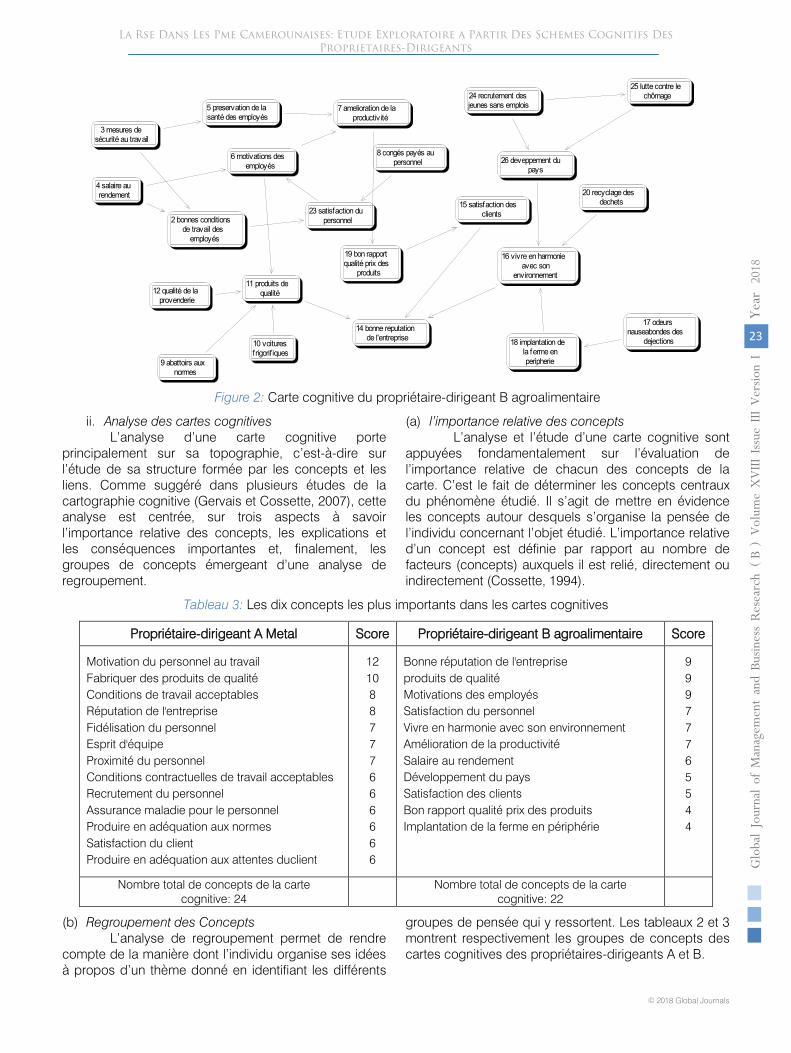
23
Globa
l Jo
urna
l of M
anag
emen
t an
d Bu
siness Resea
rch
Volum
e XVIII
Issue
III
Ver
sion
IYe
ar
20
18
© 2018 Global Journals
La Rse Dans Les Pme Camerounaises: Etude Exploratoire a Partir Des Schemes Cognitifs Des Proprietaires-Dirigeants
()
B
Figure 2: Carte cognitive du propriétaire-dirigeant B agroalimentaire
ii. Analyse des cartes cognitives L’analyse d’une carte cognitive porte
principalement sur sa topographie, c’est-à-dire sur l’étude de sa structure formée par les concepts et les liens. Comme suggéré dans plusieurs études de la cartographie cognitive (Gervais et Cossette, 2007), cette analyse est centrée, sur trois aspects à savoir l’importance relative des concepts, les explications et les conséquences importantes et, finalement, les groupes de concepts émergeant d’une analyse de regroupement.
(a) l’importance relative des concepts L’analyse et l’étude d’une carte cognitive sont
appuyées fondamentalement sur l’évaluation de l’importance relative de chacun des concepts de la carte. C’est le fait de déterminer les concepts centraux du phénomène étudié. Il s’agit de mettre en évidence les concepts autour desquels s’organise la pensée de l’individu concernant l’objet étudié. L’importance relative d’un concept est définie par rapport au nombre de facteurs (concepts) auxquels il est relié, directement ou indirectement (Cossette, 1994).
Tableau 3: Les dix concepts les plus importants dans les cartes cognitives
Propriétaire-dirigeant A Metal Score Propriétaire-dirigeant B agroalimentaire Score
Motivation du personnel au travail Fabriquer des produits de qualité Conditions de travail acceptables Réputation de l'entreprise Fidélisation du personnel Esprit d'équipe Proximité du personnel Conditions contractuelles de travail acceptables Recrutement du personnel Assurance maladie pour le personnel Produire en adéquation aux normes Satisfaction du client Produire en adéquation aux attentes duclient
12 10 8 8 7 7 7 6 6 6 6 6 6
Bonne réputation de l'entreprise produits de qualité Motivations des employés Satisfaction du personnel Vivre en harmonie avec son environnement Amélioration de la productivité Salaire au rendement Développement du pays Satisfaction des clients Bon rapport qualité prix des produits Implantation de la ferme en périphérie
9 9 9 7 7 7 6 5 5 4 4
Nombre total de concepts de la carte cognitive: 24
Nombre total de concepts de la carte
cognitive: 22
(b) Regroupement des Concepts L’analyse de regroupement permet de rendre
compte de la manière dont l’individu organise ses idées à propos d’un thème donné en identifiant les différents
groupes de pensée qui y ressortent. Les tableaux 2 et 3 montrent respectivement les groupes de concepts des cartes cognitives des propriétaires-dirigeants A et B.
2 bonnes conditionsde travail des
employés
3 mesures desécurité au travail
4 salaire aurendement
5 preservation de lasanté des employés
6 motivations desemployés
7 amelioration de laproductivité
8 congés payés aupersonnel
9 abattoirs auxnormes
10 voituresfrigorifiques
11 produits dequalité12 qualité de la
provenderie
14 bonne reputationde l'entreprise
15 satisfaction desclients
16 vivre en harmonieavec son
environnement
17 odeursnauseabondes des
dejections18 implantation dela ferme enperipherie
19 bon rapportqualité prix des
produits
20 recyclage desdechets
23 satisfaction dupersonnel
24 recrutement desjeunes sans emplois
25 lutte contre lechômage
26 deveppement dupays
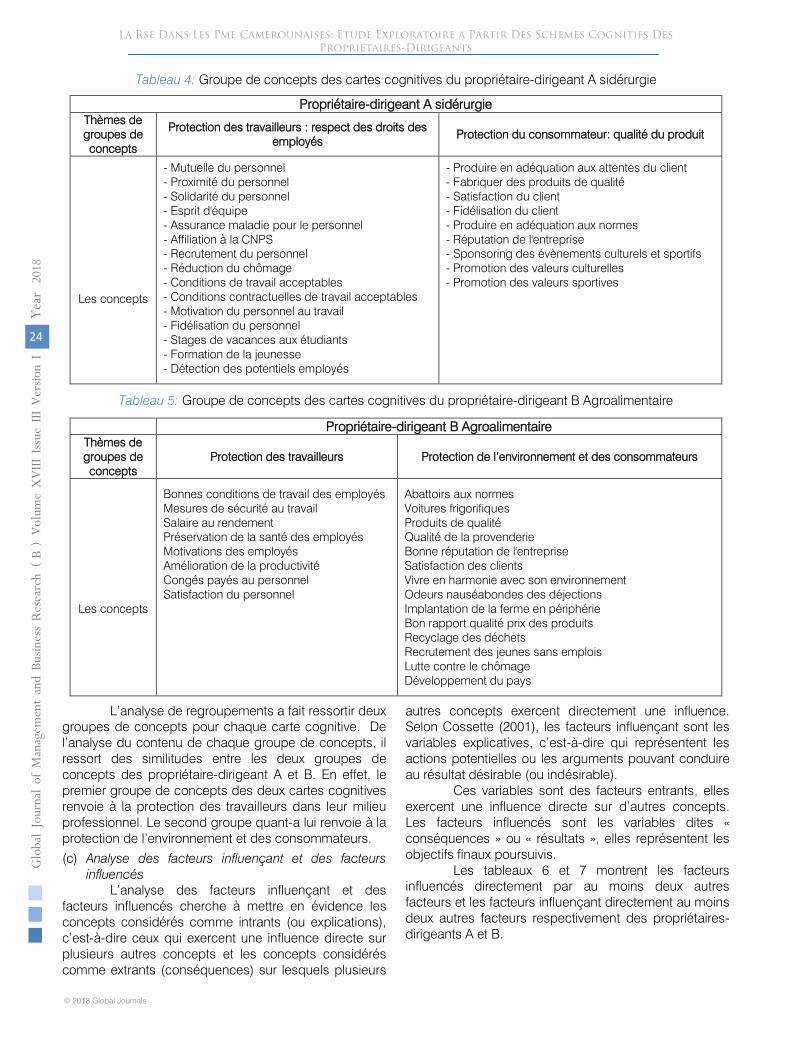
24
Globa
l Jo
urna
l of M
anag
emen
t an
d Bu
siness Resea
rch
Volum
e XVIII
Issue
III
Ver
sion
IYe
ar
20
18
© 2018 Global Journals1
La Rse Dans Les Pme Camerounaises: Etude Exploratoire a Partir Des Schemes Cognitifs Des Proprietaires-Dirigeants
()
B
Tableau 4: Groupe de concepts des cartes cognitives du propriétaire-dirigeant A sidérurgie
Propriétaire-dirigeant A sidérurgie Thèmes de groupes de concepts
Protection des travailleurs : respect des droits des employés
Protection du consommateur: qualité du produit
Les concepts
- Mutuelle du personnel - Proximité du personnel - Solidarité du personnel - Esprit d'équipe - Assurance maladie pour le personnel - Affiliation à la CNPS - Recrutement du personnel - Réduction du chômage - Conditions de travail acceptables - Conditions contractuelles de travail acceptables - Motivation du personnel au travail - Fidélisation du personnel - Stages de vacances aux étudiants - Formation de la jeunesse - Détection des potentiels employés
- Produire en adéquation aux attentes du client - Fabriquer des produits de qualité - Satisfaction du client - Fidélisation du client - Produire en adéquation aux normes - Réputation de l'entreprise - Sponsoring des évènements culturels et sportifs - Promotion des valeurs culturelles - Promotion des valeurs sportives
Tableau 5: Groupe de concepts des cartes cognitives du propriétaire-dirigeant B Agroalimentaire
Propriétaire-dirigeant B Agroalimentaire Thèmes de groupes de concepts
Protection des travailleurs Protection de l’environnement et des consommateurs
Les concepts
Bonnes conditions de travail des employés Mesures de sécurité au travail Salaire au rendement Préservation de la santé des employés Motivations des employés Amélioration de la productivité Congés payés au personnel Satisfaction du personnel
Abattoirs aux normes Voitures frigorifiques Produits de qualité Qualité de la provenderie Bonne réputation de l'entreprise Satisfaction des clients Vivre en harmonie avec son environnement Odeurs nauséabondes des déjections Implantation de la ferme en périphérie Bon rapport qualité prix des produits Recyclage des déchets Recrutement des jeunes sans emplois Lutte contre le chômage Développement du pays
L’analyse de regroupements a fait ressortir deux groupes de concepts pour chaque carte cognitive. De l’analyse du contenu de chaque groupe de concepts, il ressort des similitudes entre les deux groupes de concepts des propriétaire-dirigeant A et B. En effet, le premier groupe de concepts des deux cartes cognitives renvoie à la protection des travailleurs dans leur milieu professionnel. Le second groupe quant-a lui renvoie à la protection de l’environnement et des consommateurs.
(c) Analyse des facteurs influençant et des facteurs influencés
L’analyse des facteurs influençant et des facteurs influencés cherche à mettre en évidence les concepts considérés comme intrants (ou explications), c’est-à-dire ceux qui exercent une influence directe sur plusieurs autres concepts et les concepts considérés comme extrants (conséquences) sur lesquels plusieurs
autres concepts exercent directement une influence. Selon Cossette (2001), les facteurs influençant sont les variables explicatives, c’est-à-dire qui représentent les actions potentielles ou les arguments pouvant conduire au résultat désirable (ou indésirable).
Ces variables sont des facteurs entrants, elles exercent une influence directe sur d’autres concepts. Les facteurs influencés sont les variables dites « conséquences » ou « résultats », elles représentent les objectifs finaux poursuivis.
Les tableaux 6 et 7 montrent les facteurs influencés directement par au moins deux autres facteurs et les facteurs influençant directement au moins deux autres facteurs respectivement des propriétaires-dirigeants A et B.
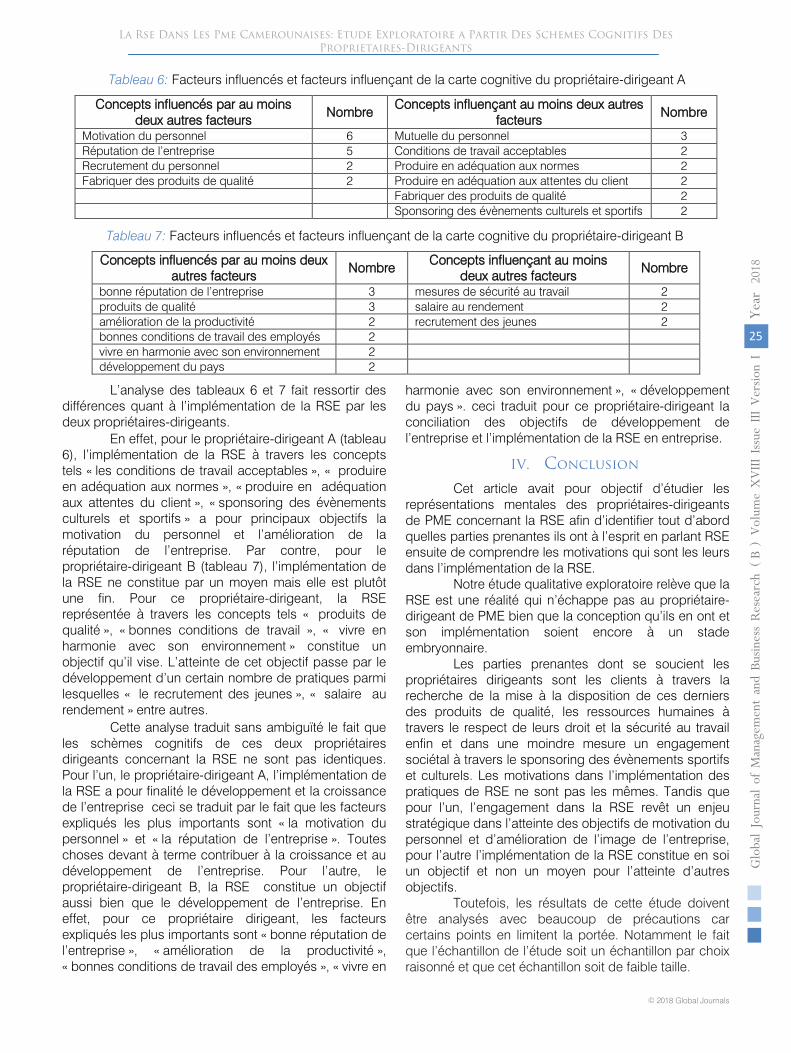
25
Globa
l Jo
urna
l of M
anag
emen
t an
d Bu
siness Resea
rch
Volum
e XVIII
Issue
III
Ver
sion
IYe
ar
20
18
© 2018 Global Journals
La Rse Dans Les Pme Camerounaises: Etude Exploratoire a Partir Des Schemes Cognitifs Des Proprietaires-Dirigeants
()
B
Tableau 6: Facteurs influencés et facteurs influençant de la carte cognitive du propriétaire-dirigeant A
Concepts influencés par au moins deux autres facteurs
Nombre Concepts influençant au moins deux autres
facteurs Nombre
Motivation du personnel 6 Mutuelle du personnel 3 Réputation de l’entreprise 5 Conditions de travail acceptables 2 Recrutement du personnel 2 Produire en adéquation aux normes 2 Fabriquer des produits de qualité 2 Produire en adéquation aux attentes du client 2
Fabriquer des produits de qualité 2 Sponsoring des évènements culturels et sportifs 2
Tableau 7: Facteurs influencés et facteurs influençant de la carte cognitive du propriétaire-dirigeant B
Concepts influencés par au moins deux autres facteurs
Nombre Concepts influençant au moins
deux autres facteurs Nombre
bonne réputation de l’entreprise
3
mesures de sécurité au travail
2
produits de qualité
3
salaire au rendement
2
amélioration de la productivité
2
recrutement des jeunes
2
bonnes conditions de travail des employés
2
vivre en harmonie avec son environnement
2
développement du pays
2
Cette analyse traduit sans ambiguïté le fait que les schèmes cognitifs de ces deux propriétaires dirigeants concernant la RSE ne sont pas identiques. Pour l’un, le propriétaire-dirigeant A, l’implémentation de la RSE a pour finalité le développement et la croissance de l’entreprise ceci se traduit par le fait que les facteurs expliqués les plus importants sont « la motivation du personnel » et « la réputation de l’entreprise ». Toutes choses devant à terme contribuer à la croissance et au développement de l’entreprise. Pour l’autre, le propriétaire-dirigeant B, la RSE constitue un objectif aussi bien que le développement de l’entreprise. En effet, pour ce propriétaire dirigeant, les facteurs expliqués les plus importants sont « bonne réputation de l’entreprise », « amélioration de la productivité », « bonnes conditions de travail des employés », « vivre en
harmonie avec son environnement », « développement du pays ». ceci traduit pour ce propriétaire-dirigeant la conciliation des objectifs de développement de l’entreprise et l’implémentation de la RSE en entreprise.
IV. Conclusion
Cet article avait pour objectif d’étudier les représentations mentales des propriétaires-dirigeants de PME concernant la RSE afin d’identifier tout d’abord quelles parties prenantes ils ont à l’esprit en parlant RSE ensuite de comprendre les motivations qui sont les leurs dans l’implémentation de la RSE.
Notre étude qualitative exploratoire relève que la RSE est une réalité qui n’échappe pas au propriétaire-dirigeant de PME bien que la conception qu’ils en ont et son implémentation soient encore à un stade embryonnaire.
Les parties prenantes dont se soucient les propriétaires dirigeants sont les clients à travers la recherche de la mise à la disposition de ces derniers des produits de qualité, les ressources humaines à travers le respect de leurs droit et la sécurité au travail enfin et dans une moindre mesure un engagement sociétal à travers le sponsoring des évènements sportifs et culturels. Les motivations dans l’implémentation des pratiques de RSE ne sont pas les mêmes. Tandis que pour l’un, l’engagement dans la RSE revêt un enjeu stratégique dans l’atteinte des objectifs de motivation du personnel et d’amélioration de l’image de l’entreprise, pour l’autre l’implémentation de la RSE constitue en soi un objectif et non un moyen pour l’atteinte d’autres objectifs.
Toutefois, les résultats de cette étude doivent être analysés avec beaucoup de précautions car certains points en limitent la portée. Notamment le fait que l’échantillon de l’étude soit un échantillon par choix raisonné et que cet échantillon soit de faible taille.
L’analyse des tableaux 6 et 7 fait ressortir des différences quant à l’implémentation de la RSE par les deux propriétaires-dirigeants.
En effet, pour le propriétaire-dirigeant A (tableau 6), l’implémentation de la RSE à travers les concepts tels « les conditions de travail acceptables », « produire en adéquation aux normes », « produire en adéquation aux attentes du client », « sponsoring des évènements culturels et sportifs » a pour principaux objectifs la motivation du personnel et l’amélioration de la réputation de l’entreprise. Par contre, pour le propriétaire-dirigeant B (tableau 7), l’implémentation de la RSE ne constitue par un moyen mais elle est plutôt une fin. Pour ce propriétaire-dirigeant, la RSE représentée à travers les concepts tels « produits de qualité », « bonnes conditions de travail », « vivre en harmonie avec son environnement » constitue un objectif qu’il vise. L’atteinte de cet objectif passe par le développement d’un certain nombre de pratiques parmi lesquelles « le recrutement des jeunes », « salaire au rendement » entre autres.
Bibliographie
1. Ammenberg, J. et O. Hjelm (2003), Tracing business and environmental effects of environmental management system - a study of networking small and medium-sized enterprises using a joint environmental management system, Business Strategy and the Environment, 12: 3, 163-174.
2. Atidegla, A. (2005). « Etude sur la responsabilité sociétale des acteurs économiques. » In: Commenne, V. (coord.) Responsabilité sociale et environnementale: l’engagement des acteurs économiques. Paris: Editions Charles Léopold Mayer.
3. Auberger M. N. et Quairel F. (2005), « Management responsable et PME: une relecture du concept de responsabilité sociétale de l’entreprise », Revue des Sciences de Gestion: Direction et Gestion, n° 211-212, pp. 111- 126.
4. BAYAD M. et NEBENHAUS D. (1998), Contribution à un modèle pyramidal de la gestion des ressources humaines en PME, Revue Internationale PME, 11, 162-178.
5. Ben Hasine L. et Ghozzi-Nekhili C. (2013), Perception de la responsabilité sociale des entreprises par leurs dirigeants : une comparaison entre PME tunisiennes certifiées et non certifiées, Revue Internationale PME, Vol. 26-numéro 2, pp. 59-80.
6. Ben Boubaker-Gherib J., Spence M. et Ondoua Biwolé V. (2009), Développement durable et PME dans les pays émergents: entre proactivité, opportunisme et compromis, Journal of Small Business and Entrepreneurship, 22, 3, 275-295.
7. Berger-Douce S. (2006), « La démarche collective, un outil d‟ appropriation du management environnemental par les PME ? », Revue Sciences de Gestion, n° 54, pp. 19-36.
8. Berger-Douce, S. (2006). « Les enjeux stratégiques de l’engagement environnemental des petites entreprises ». Gestion 2000, n°1, jan-fév, 171-188.
9. Berger-Douce S. (2008), « Rentabilité et pratiques de RSE en milieu de PME: Premiers résultats d’une étude française », Revue Management et Avenir, n° 15, pp. 9-29.
10. Berger - Douce S. (2007), Les stratégies d’engagement sociétal des entrepreneurs, Revue de l’Entrepreneuriat, 6, 1, 53-71.
11. Berger P. L. et Luckmann T. (1966), The Social Construction of Reality, Ed. Doubleday, New York, 240 p.
12. Bowen H. R. (1953), Social Responsibilities of the Businessman, Ed. Harper and Brothers, New York, 150 p.
13. Cabagnols A. et Le Bas C. (2006), « Les déterminants du comportement de responsabilité
sociale de l'entreprise. Une analyse économétrique à partir de nouvelles données d'enquête », Premier Congrès du RIODD, Créteil, France, 7-8 décembre.
14. Carroll A. B. (1979), “A Three-Dimensional Conceptual Model of Corporate Social Performance”, Academy of Management Review, vol. 4, n° 4, pp. 497-505.
15. Clark J. M., (1916), The Changing Basis of Economic Responsibility, Journal of Political Economy, vol. 24, n° 3, p. 209-229.
16. Courrent J.-M. et Spence M. (2014), Chapitre 5 « Orientation entrepreneuriale et engagement des PME dans des logiques de développement durable » p. 113 in « Entrepreneuriat, développement durable et territoire. Approches contextualisées », Sous la direction de Guillouzo R., Edition Hachette Supérieur.
17. COURRENT J. M., (2004), « Ethique et petite entreprise », Revue Française de Gestion, vol. 29, n° 144, p. 139-152.
18. Ciliberti, F., Pontrandolfo, P., et Scozzi, B. (2008). Investigating corporate social responsibility in supply chains: a SME perspective.Journal of Cleaner Production, 16 (15), 1579–1588.
19. Commission Européenne (2001), Le livre vert pour promouvoir un cadre européen de la responsabilité sociale des entreprises.
20. Commission Européenne. (2002). Observatoire des PME européennes – Les PME européennes etles responsabilités sociale et environnementale. Commission Office for Official Publication of the European Communities, Volume 4/2002, Luxembourg.
21. Commission des Communautés Européennes (2006), Communication de la Commission au Conseil, au Parlement Européen, au Comité Economique et Social Européen et au Comité des Régions – Miseenoeuvre du programme communautaire de Lisbonne pour la croissance et l’emploi – « Latransmission d’entreprise: la continuité grâce à un nouveau départ »
22. CCE (Commission des communautés européennes), (2001), Livre vert: Promouvoir un cadreeuropéen pour la responsabilité sociale des entreprises, Bruxelles.
23. Commission des Communautés Européennes. (2001). Livre Vert: Promouvoir un cadre européen pour la responsabilité sociale des entreprises. Bruxelles: Commission des Communautés
24. Commission interdépartementale du Développement durable (2005), Rapport annuel.
25. COSSETTE P., 2004, L’organisation, une perspective cognitiviste, Éditions les Presses de l’Université Laval, Collection Sciences de l'Administration, Québec.
26. COSSETTE P., 1994, La carte idiosyncrasique, étude exploratoire des schèmes personnels de
26
Globa
l Jo
urna
l of M
anag
emen
t an
d Bu
siness Resea
rch
Volum
e XVIII
Issue
III
Ver
sion
IYe
ar
20
18
© 2018 Global Journals1
La Rse Dans Les Pme Camerounaises: Etude Exploratoire a Partir Des Schemes Cognitifs Des Proprietaires-Dirigeants
()
B
propriétaires-dirigeants de PME, dans COSSETTE P. (dir.), Cartes cognitives et organisations, Éditions les Presses de l'Université Laval, Collection Sciences de l'Administration, Sainte-Foy, Québec, pp. 113-154.
27. COSSETTE P., 2001, A systematic Method to articulate Strategic Vision: an Illustration with a Small Business Owner-Manager, Journal of Enterprising Culture, vol. 9, no 2, juin, pp. 173-199. Paru en français en 2003 dans Revue de l’Entrepreneuriat, vol 2, no 1, sous le titre : Méthode systématique d'aide à la formulation de la visionstratégique: illustration auprès d'un propriétaire dirigeant, pp. 1-17.
29. COSSETTE P., 2000, La cognition comme objet
d’étude dans la littérature scientifique sur la PME et l’entrepreneuriat, Revue Internationale PME, vol. 13, no 1, pp. 11-37.
30. Cossette P. (2003), Méthode systématique d’aide à la formulation de la vision stratégique: illustrationauprès d’un propriétaire-dirigeant, Revue de l’Entrepreneuriat, 2, 1, 1-18.
32. Dahlsrud, A. (2008). How corporate social
responsibility is defined: an analysis of 37 definitions. Corporate social responsibility and environmental management, 15(1), 1-13.
33. Davis (1960), can business afford to ignore social responsibilityies? California management review, 2? 70-76.
34. Dearborn, D. C., et Simon, H. A. (1958). Selective perception: A note on the departmental identifications of executives. Sociometry, 21, 140–144.
35. European Commission (2007), Opportunity and responsibility. How to help more small businesses to integrate social and environmental issues into what they do.
37. Gervais, J., et Cossette, P. (2007). Knowledge
management and cognitive maps: A study about interorganizational collaboration. Annales Des Telecommunications Annals of Telecommunications, 62(7-8), 786-807.
38. Grayson, D 2004, 'How CSR contributes to the competitiveness of Europe in a more sustainable world', The World Bank Institute and the CSR Resource Centre, Netherlands, pp. 1-5.
39. Jenkins, H. 2006. Small business champions for Corporate Social Responsibility. Journal of Business Ethics, 67(3): 241–256.
40. Julien P.-A. (1994), Les PME : bilan et perspectives, Ed Economica, Paris, 437 p.
41. Kenner Thompson, J. et H.L. Smith (1991), Social Responsibility and small business : suggestions for research, Journal of Small Business Management, janvier, vol. 29, n° 1, p. 30- 44.
42. LAROCHE H. et NIOCHE J.P., 1994, L’approche cognitive de la stratégie d’entreprise, Revue Française de Gestion, vol. 97, juin-juillet-août,
pp. 67-78.
43. LAURIOL J., 1996, Une approche socio-cognitive de la décision stratégique, le cas B.S.C, Conférence Internationale de Management Stratégique (AIMS), Lille.
44. March J. et H.-A. Simon (1958), Organizations, Wiley, New York.
46. MASUREL, E. (2007), “Why SMEs invest in environmental measures: sustainability evidence from small and medium-sized printing firms”, Business Strategy and the Environment, 16, 3,
pp. 190-201.
47. McGuire J. W. (1963),
Business and Society, Mac
Graw-Hill, New-York.
48. Moore, G. et
Spence, L.J. (2006). Responsibility and
small business, Journal of Business Ethics,67(3), 219–226.
49. Morsing, M. et
Perrini, F. (guest eds.) (2009). CSR in
SMEs: Do SMEs matter for the CSR agenda?
Business Ethics: A European Review, 18(1): 1–6.
50. Munteanu, A. R. (2014), The Place of Social Responsibility in the Business Model of A SME, International Journal of Economic Practices and Theories, 4:
5.
51. Observatoire des PME européennes (2002), Les PME européennes et les responsabilités sociale et environnementale, Rapport n°4, 71 p.
52. Ortiz, D., Kühne, S. (2008). Implementing responsible business behavior from a strategic management
perspective: Developing a framework
for Austrian SMEs. Journal of Business Ethics, 82,
463–475.
27
Globa
l Jo
urna
l of M
anag
emen
t an
d Bu
siness Resea
rch
Volum
e XVIII
Issue
III
Ver
sion
IYe
ar
20
18
© 2018 Global Journals
La Rse Dans Les Pme Camerounaises: Etude Exploratoire a Partir Des Schemes Cognitifs Des Proprietaires-Dirigeants
()
B
28. COSSETTE P., 1997, Les travaux publiés dans la Revue internationale PME depuis sa fondation: caractéristiques et tendances, Revue Internationale PME, vol. 10, no 2, pp. 109-128.
31. COSSETTE, P., AUDET, M., "Qu'est-ce qu'une carte cognitive?", dans P. Cossette (dir.), Cartes cognitives et organisations, Collection "Sciences de l'administration", Québec/Paris: Les Presses de l’Université Laval/Éditions ESKA, 1994, p. 13-33.
36. Gendre-Aegerter D. (2008), La perception du dirigeant de PME de sa responsabilité sociale: une approchepar la cartographie cognitive, Thèse de doctorat en sciences économiques et sociales, Universitéde Fribourg (Suisse), 584 p.
45. Marchesnay, M. (1991), La PME: une gestion spécifique. In: Économie rurale. N°206.Nouvelles approches en gestion de l'entreprise agricole. Session des 29 et 30 Novembre 1990 organisée par Jean-Marie Attonaty (INRA-ESR), Jacques Clément (DGER) et Louis-Georges Soler (INRA-SAD) pp. 11-17.
53. Perrini, F. (2006). SMEs and CSR theory: Evidence and implications from an Italian perspective. Journal of Business Ethics, 67(3): 305–316.
54. Perrini, F., Russo, A. et Tencati, A. (2007). CSR strategies of SMEs and large firms: Evidence from Italy. Journal of Business Ethics, 74(3): 285–300.
55. Quairel, F., et Auberger, M. N., (2005). Management responsable et PME : Une relecture duconcept de « responsabilité sociétale de l’entreprise. La Revue des Sciences de Gestion, Direction et Gestion, n° 211-212 – RSE.
56. Quairel-Lanoizelée, F. et Auberger, M. N. (2005). Les PME sont-elles socialement responsables? La Revue des Sciences de gestion, 211-212, 111-126.
57. Russo A. et Perrini F. (2010), “Investigating Stakeholder Theory and Social Capital: CSR in Large Firms and SMEs”, Journal of Business Ethics, Vol. 91 n° 2, pp. 207-221.
58. Russo, A. et Tencati, A. (2008). Formal vs. informal CSR strategies: Evidence from Italian micro, small, medium-sized, and large firms. Journal of Business Ethics 85(2): 339–353.
59. Saulquin J. Y. et Schier G. (2007). Des perceptions managériales aux pratiques RSE: une étude exploratoire. Gestion 2000, 24(6): 181-195.
60. Saulquin J.-Y. et Schier G. (2005), « Typologie des pratiques de RSE », Colloque GREFIGE-CEREMO, Agadir, avril.
61. Spence L. J. (2007), « CSR and small business in a European policy context: the five C’s of CSR and small business research, agenda 2007 », Business and society review, n°112, pp 533-552.
62. Spence M., Gherib B. B. J. et Biwolé V. O. (2007), « Développement durable et PME», Revue Internationale P.M.E.: Économie et Gestion de La Petite et Moyenne Entreprise, Vol. 20, n° 3-4, p. 17-42.
63. Spence M., Gherib B. B. J. et Biwolé V. O. (2011), « Is Entrepreneurial will Enough? A North–South Comparison », Journal of Business Ethics, Vol. 99, n° 3, p. 335-367.
64. Tolman E. C. (1948). Cognitive maps in rats and men. The Psychological Review, 55(4): 189–208, 1948.
65. Torrès O. (1997), Pour une approche contingente de la spécificité de la PME, Revue Internationale PME, 10, 2, 9-43.
66. Verstraete T. et Saporta B. (2006), Création d’Entreprise et Entrepreneuriat, Les éditions del’ ADREG, Janvier.
67. Wilson, E. (1980). Social responsibility of business: What are the small business perspectives? Journal of Small Business Management, 18(3): 17–24.
68. WIRTZ P., (2002), Le dirigeant : intendant fidèle ou agent opportuniste?, XIIème Conférence Internationale de Management Stratégique (AIMS), 5-7 juin, Paris.
28
Globa
l Jo
urna
l of M
anag
emen
t an
d Bu
siness Resea
rch
Volum
e XVIII
Issue
III
Ver
sion
IYe
ar20
18
© 2018 Global Journals1
La Rse Dans Les Pme Camerounaises: Etude Exploratoire a Partir Des Schemes Cognitifs Des Proprietaires-Dirigeants
()
B
© 2018. Ali Manir Bazza, Mandara Binta & Ibrahim Muhammad Alhaji. This is a research/review paper, distributed under the terms of the Creative Commons Attribution-Noncommercial 3.0 Unported License http://creativecommons.org/licenses/by-nc/3.0/), permitting all non-commercial use, distribution, and reproduction in any medium, provided the original work is properly cited.
Global Journal of Management and Business Research: B Economics and Commerce Volume 18 Issue 3 Version 1.0 Year 2018 Type: Double Blind Peer Reviewed International Research Journal Publisher: Global Journals
Online ISSN: 2249-4588 & Print ISSN: 0975-5853
Impact of Deficit Financing on Economic Growth in Nigeria By Ali Manir Bazza, Mandara Binta & Ibrahim Muhammad Alhaji
Federal College of Education
Abstract- This study examined the impact of deficit financing on economic growth in Nigeria for the period spanning from 1981 to 2016. Secondary data was used and sourced from the Central Bank of Nigeria’s statistical bulletin and was analyzed through the application of Augmented Dickey Fuller to ascertain the stationarity properties of the time series variables and ARDL Technique was employed for the regression analysis. The results from the unit root test revealed mixed degree of integration of the variables i.e. I (0) and (1) and the result from the ARDL regression estimate showed that government deficit finance over the years had significantly impacted on the output growth of Nigeria. The variables used in the study were jointly found significant in affecting the output growth of the economy as revealed by the F-statistics of the model 56.27987 (0.000000). The study therefore recommends that deficit financing should be increased effectively, and that government should ensure an efficient public expenditure process and fiscal discipline as well as maintenance of macroeconomic stability so that Nigerian economy can develop.
Keywords: deficit finance, domestic private investment and output growth.
GJMBR-B Classification: JEL Code: A19
ImpactofDeficitFinancingonEconomicGrowthinNigeria
Strictly as per the compliance and regulations of:
Impact of Deficit Financing on Economic Growth in Nigeria
Ali Manir Bazza α, Mandara Binta σ & Ibrahim Muhammad Alhaji ρ
Abstract- This study examined the impact of deficit financing on economic growth in Nigeria for the period spanning from 1981 to 2016. Secondary data was used and sourced from the Central Bank of Nigeria’s statistical bulletin and was analyzed through the application of Augmented Dickey Fuller to ascertain the stationarity properties of the time series variables and ARDL Technique was employed for the regression analysis. The results from the unit root test revealed mixed degree of integration of the variables i.e. I (0) and (1) and the result from the ARDL regression estimate showed that government deficit finance over the years had significantly impacted on the output growth of Nigeria. The variables used in the study were jointly found significant in affecting the output growth of the economy as revealed by the F-statistics of the model 56.27987 (0.000000). The study therefore recommends that deficit financing should be increased effectively, and that government should ensure an efficient public expenditure process and fiscal discipline as well as maintenance of macroeconomic stability so that Nigerian economy can develop. Keywords: deficit finance, domestic private investment and output growth.
I. Introduction
eficit Financing is an important method of promoting economic growth and development. In the Keynesian analysis, it has been advocated
that deficit financing could be adopted in order to tackle the problem of inflationary-unemployment in the advanced nations when there is recession or depression. In the post Keynesian analysis, it has also been advocated that deficit financing could be applied to the some of the problems of developing nations, especially the problem of unemployment. The Keynesian school of thought advocates the expansion in government expenditures even above current income, particularly during depressions. According to them, the main cause of depression is lack of spending by the public sector when the economy suffers from lack of aggregate demand such as the great depression of 1929 to 1932 and most recently, the 2008 Global Financial and Economic crisis. This will increase the demand for productive output and to reduce the level of
Author α: Bureau of Public Procurement, Three Arms Zone Abuja Nigeria. e-mail: [email protected]
Author σ: Department of Business Education, Federal College of Education Yola Nigeria. e-mail: [email protected]
Author ρ: Department of Accounting, School of Management Science, Nuhu Bamalli Polytechnic Zaria, Kaduna Nigeria. e-mail: [email protected]
unemployment (Anyanwu and Oaikhenan, 1995, Ogboru, 2006, Iya, 2014). A lot of economic problems are caused by deficits when it is in persistence specifically, deficit financing adversely impacts interest rate, investment and economic growth Money creation via deficit financing results in an increase in the stock of money and this is inflationary. Excessive monetary expansions produce an expansion of imports and a contraction of exports so that the external reserve tends to contract.
In Nigeria, considerable attention has been focused on the consequences of deficit financing because of the belief that the presence of these consequences in the Nigeria economy might have informed the current thinking that the government through its deficit financing has contributed greatly to the country's current economic problem. Among the problems confronting the Nigerian economy are; pressure on balance of payment, declining growth and heavy debt burden in which we (Nigeria) had $18billion about 60 percent of the $30billion owed the Paris Club written off (Debt Management Office, 2006). The concern is not deficit perse, this is because fiscal deficit is not a crime but when it exceeds the international bench mark of 3 percent of GDP is worrisome, especially when it cannot be said to promote economic activities (Anyanwu, 1997).
All government programmes must be financed, whether in form of expenditure on goods and services or on the assets acquisition or through lending to the private sector. The other part of the expenditure which has not been financed through income tax, individual’s savings or domestic borrowing must be through fiscal deficit.
The persistent recurrence of deficit financing via the creation of high powered money may not guarantee the achievement of macroeconomic objectives, which may in turn affect the level of desired investment in an economy and thereby narrowing growth. Major determinant that is mostly affected directly by macro- economic policy is investment, (Word Bank 1993) such macroeconomic policies involved the deliberate control of policy instruments, such as monetary and fiscal policies on grounds of achieving macroeconomic objectives. Investors expectation, decision and confidence on whether to invest or not are based on macroeconomic indices. It is regarded that Macro economic variables are basic fundamentals or
D
29
Globa
l Jo
urna
l of M
anag
emen
t an
d Bu
siness Resea
rch
Volum
e XVIII
Issue
III
Ver
sion
IYe
ar
20
18
© 2018 Global Journals
()
B
preconditions which must be achieved for investment to take place and it is against this macroeconomic background that this research work is undertaken to determine to assess the performance of deficit financing on private investment.
a) Objectives of the Study
i. Examine the impact of Deficit financing on Economic Performance of Nigeria.
ii. Examine the impact of Gross net Capital Formation (Domestic Private Investment) on Nigerian economy.
II. Theoretical Framework
a) Deficit Financing and Economic Growth Theory The Keynesian economists are of the opinion
that increase in government spending leads to an increase in domestic output and sees the possibilities of government spending crowding out private (investment) spending through interest cost credit (interest rate). They also believed that fiscal deficit could have a negative impact on external sector, reflected through trade deficit, but only if the domestic economy is unable to absorb the additional liquidity through an expansion in output. The theory holds that government borrowing only in cyclical downturn when there is a rise in a private sector savings and period of unemployment.
In a cyclical upturn, there shall be the reverse of borrowing. However, the financing of any level of fiscal deficits whether through taxation or borrowing fiscal policy involves the absorption of real resources by the public sector that otherwise would be available to the private sector, the absorption of domestic resources will be delay if foreign borrowing or unemployed resource are available. This absorption would improve overall efficiency (output growth) if the social return (benefit) from public expenditure exceeds its private opportunity cost. While public expenditure may displace private sector output (the crowding out effect), it may also improve private sector productivity (the positive externality or public good effect). Development models of public expenditure which primarily is the work of Rustow (1971) anchors on the fact the countries of the world must pass through different stages before they could develop, and that these different stages requires varied proportion of Government spending to total investment in the economy will be large since most of her activities centre on capital formation bordering on roads, housing telephone, education, health care, among others in preparation for takeoff into the middle stage.
b) Empirical Literature Several attempts had been made to examine
the effect of deficit financing on economic growth of a country. Cooray, (2009), Abdullahi, (2000), Gregornu et al (2007), and Erkin, (1998) in their works the impact of government expenditure on growth discovered that countries with large government expenditure tend to
experience higher growth. Deficit spending by the government stimulates the economy in the short run by making households feel wealthier, thus, raising total private and public consumption expenditure. Through the resulting increase in the aggregate demand, budget deficit has a positive effect on macro-economic activities, thereby stimulating savings and capital formation Seater in (Okpanchi and Abimiku, (2007), Chakraborty and Chakraborty, (2006)Liu, et al (2008) examined the casual relationship between GDP and public expenditure for US data during the period 1947-2002. The causality results revealed that the total government expenditure causes growth of GDP. They concluded that judging from the causality test Keynesian hypothesis exerts more influence than the Wagner’s law.
Owole et al (2007) investigated the relationship between government expenditure and economic growth for a group of 30 OECD countries during the period 1970-2005.Theregression results showed the existence of a long-run relationship between government expenditure and economic growth. Also, they observed a unidirectional causality from government expenditure to growth for 16out of the countries, thus supporting the Keynesian hypothesis. However, causality runs from economic growth to government expenditure in 10 out of the countries, confirming the Wagner’s law. Finally, he found that the existence of feedback relationship between government expenditure and economic growth of four countries. Goher et al (2011) verified the impact of government fiscal deficit on investment and economic growth using time series of thirty years stretching between 1980 and 2009. They believed that fiscal profligacy has seriously undermined the growth objectives thereby adversely impacting physical and social infrastructure in the country. Huynh (2007) conducted his study while collecting data from the developing Asian countries from the period of 1990 to 2006. He concluded that there is negative impact of budget deficit on the GDP growth of the country while analyzing the trends in Vietnam.
Vamvoukas (2000) explored with the help of Keynesian preposition and Richardian Equivalence, the effect of budget deficit on interest rate and inflation rate, while using data of Greek economy from 1948-2001 by applying co-integration analysis, granger causality and impulse function. Shojai (1999) concluded that deficit spending, financed by the central bank, can also lead to inefficiencies in financial markets and cause high inflation in developing countries. At the same time, it also distorts real exchange rates, which in turn undermines the international competiveness of the economy. Akpokodje (1988) also observed that Government’s monetary policy which insured credit to the private sector has a strong positive and significant impact on private investment. He found out that, in the long run, sectoral allocation of funds to the private
30
Globa
l Jo
urna
l of M
anag
emen
t an
d Bu
siness Resea
rch
Volum
e XVIII
Issue
III
Ver
sion
IYe
ar20
18
© 2018 Global Journals1
Impact of Deficit Financing on Economic Growth in Nigeria(
)B
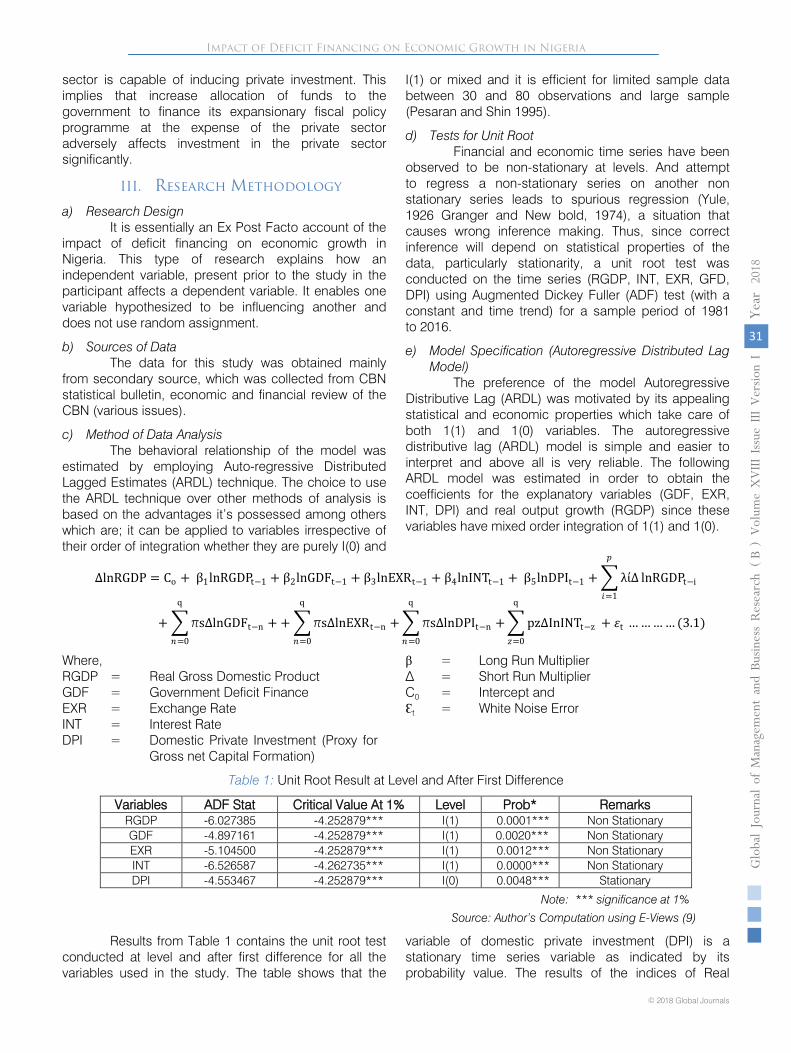
sector is capable of inducing private investment. This implies that increase allocation of funds to the government to finance its expansionary fiscal policy programme at the expense of the private sector adversely affects investment in the private sector significantly.
III. Research Methodology
a) Research Design It is essentially an Ex Post Facto account of the
impact of deficit financing on economic growth in Nigeria. This type of research explains how an independent variable, present prior to the study in the participant affects a dependent variable. It enables one variable hypothesized to be influencing another and does not use random assignment.
b) Sources of Data The data for this study was obtained mainly
from secondary source, which was collected from CBN statistical bulletin, economic and financial review of the CBN (various issues).
c) Method of Data Analysis The behavioral relationship of the model was
estimated by employing Auto-regressive Distributed Lagged Estimates (ARDL) technique. The choice to use the ARDL technique over other methods of analysis is based on the advantages it’s possessed among others which are; it can be applied to variables irrespective of their order of integration whether they are purely I(0) and
I(1) or mixed and it is efficient for limited sample data between 30 and 80 observations and large sample (Pesaran and Shin 1995).
d) Tests for Unit Root Financial and economic time series have been
observed to be non-stationary at levels. And attempt to regress a non-stationary series on another non stationary series leads to spurious regression (Yule, 1926 Granger and New bold, 1974), a situation that causes wrong inference making. Thus, since correct inference will depend on statistical properties of the data, particularly stationarity, a unit root test was conducted on the time series (RGDP, INT, EXR, GFD, DPI) using Augmented Dickey Fuller (ADF) test (with a constant and time trend) for a sample period of 1981 to 2016.
e) Model Specification (Autoregressive Distributed Lag Model)
The preference of the model Autoregressive Distributive Lag (ARDL) was motivated by its appealing statistical and economic properties which take care of both 1(1) and 1(0) variables. The autoregressive distributive lag (ARDL) model is simple and easier to interpret and above all is very reliable. The following ARDL model was estimated in order to obtain the coefficients for the explanatory variables (GDF, EXR, INT, DPI) and real output growth (RGDP) since these variables have mixed order integration of 1(1) and 1(0).
∆lnRGDP = Co + β1lnRGDPt−1 + β2lnGDFt−1 + β3lnEXRt−1 + β4lnINTt−1 + β5lnDPIt−1 + �λί∆𝑝𝑝
𝑖𝑖=1
lnRGDPt−i
+ � πs∆lnGDFt−n +q
𝑛𝑛=0
+ � πs∆lnEXRt−n +q
𝑛𝑛=0
� πs∆lnDPIt−n +q
𝑛𝑛=0
� pz∆InINTt−z + 𝜀𝜀t … … … … (3.1)q
𝑧𝑧=0
Where, RGDP = Real Gross Domestic Product GDF = Government Deficit Finance EXR = Exchange Rate INT = Interest Rate DPI = Domestic Private Investment (Proxy for
Gross net Capital Formation)
β = Long Run Multiplier ∆ = Short Run Multiplier C0 = Intercept and Ԑt = White Noise Error
Table 1: Unit Root Result at Level and After First Difference
Variables ADF Stat Critical Value At 1% Level Prob* Remarks RGDP -6.027385 -4.252879*** I(1) 0.0001*** Non Stationary GDF -4.897161 -4.252879*** I(1) 0.0020*** Non Stationary EXR -5.104500 -4.252879*** I(1) 0.0012*** Non Stationary INT -6.526587 -4.262735*** I(1) 0.0000*** Non Stationary DPI -4.553467 -4.252879*** I(0) 0.0048*** Stationary
Note: *** significance at 1%
Source: Author’s Computation using E-Views (9)
Results from Table 1 contains the unit root test conducted at level and after first difference for all the variables used in the study. The table shows that the
variable of domestic private investment (DPI) is a stationary time series variable as indicated by its probability value. The results of the indices of Real
31
Globa
l Jo
urna
l of M
anag
emen
t an
d Bu
siness Resea
rch
Volum
e XVIII
Issue
III
Ver
sion
IYe
ar20
18
© 2018 Global Journals
Impact of Deficit Financing on Economic Growth in Nigeria
()
B
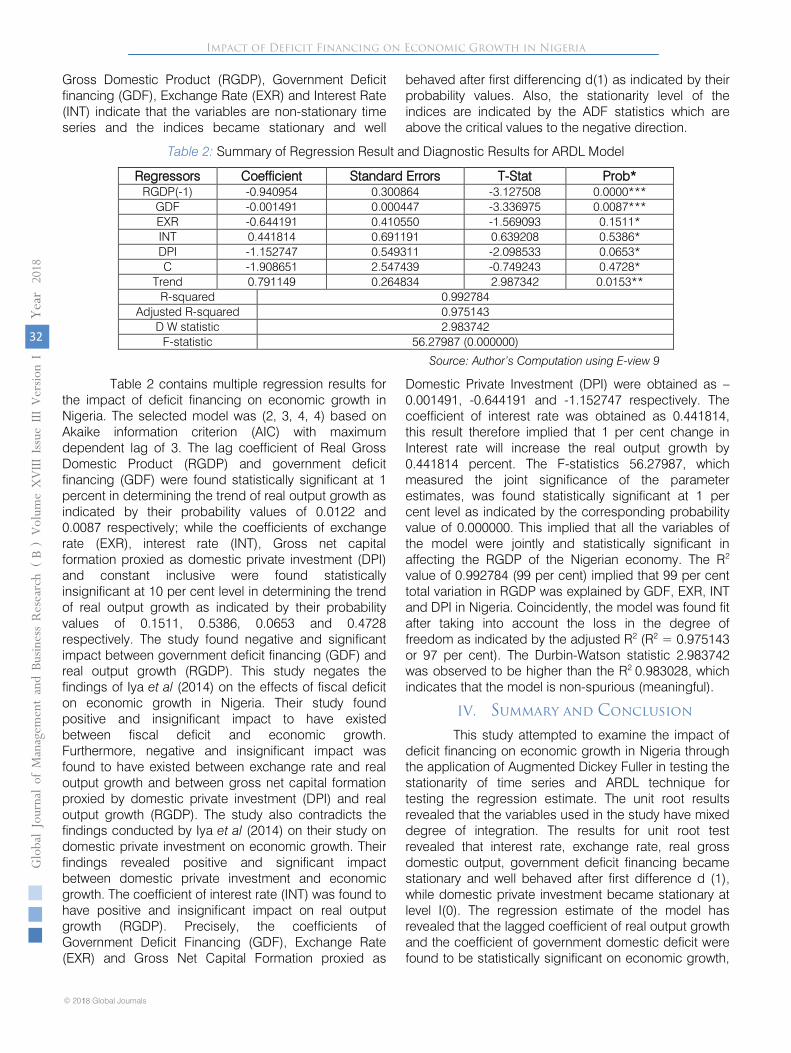
Gross Domestic Product (RGDP), Government Deficit financing (GDF), Exchange Rate (EXR) and Interest Rate (INT) indicate that the variables are non-stationary time series and the indices became stationary and well
behaved after first differencing d(1) as indicated by their probability values. Also, the stationarity level of the indices are indicated by the ADF statistics which are above the critical values to the negative direction.
Table 2: Summary of Regression Result and Diagnostic Results for ARDL Model
Regressors Coefficient Standard Errors T-Stat Prob* RGDP(-1) -0.940954 0.300864 -3.127508 0.0000***
GDF -0.001491 0.000447 -3.336975 0.0087*** EXR -0.644191 0.410550 -1.569093 0.1511* INT 0.441814 0.691191 0.639208 0.5386* DPI -1.152747 0.549311 -2.098533 0.0653* C -1.908651 2.547439 -0.749243 0.4728*
Trend 0.791149 0.264834 2.987342 0.0153** R-squared 0.992784
Adjusted R-squared 0.975143 D W statistic 2.983742
F-statistic 56.27987 (0.000000)
Source: Author’s Computation using E-view 9
Table 2 contains multiple regression results for the impact of deficit financing on economic growth in Nigeria. The selected model was (2, 3, 4, 4) based on Akaike information criterion (AIC) with maximum dependent lag of 3. The lag coefficient of Real Gross Domestic Product (RGDP) and government deficit financing (GDF) were found statistically significant at 1 percent in determining the trend of real output growth as indicated by their probability values of 0.0122 and 0.0087 respectively; while the coefficients of exchange rate (EXR), interest rate (INT), Gross net capital formation proxied as domestic private investment (DPI) and constant inclusive were found statistically insignificant at 10 per cent level in determining the trend of real output growth as indicated by their probability values of 0.1511, 0.5386, 0.0653 and 0.4728 respectively. The study found negative and significant impact between government deficit financing (GDF) and real output growth (RGDP). This study negates the findings of Iya et al (2014) on the effects of fiscal deficit on economic growth in Nigeria. Their study found positive and insignificant impact to have existed between fiscal deficit and economic growth. Furthermore, negative and insignificant impact was found to have existed between exchange rate and real output growth and between gross net capital formation proxied by domestic private investment (DPI) and real output growth (RGDP). The study also contradicts the findings conducted by Iya et al (2014) on their study on domestic private investment on economic growth. Their findings revealed positive and significant impact between domestic private investment and economic growth. The coefficient of interest rate (INT) was found to have positive and insignificant impact on real output growth (RGDP). Precisely, the coefficients of Government Deficit Financing (GDF), Exchange Rate (EXR) and Gross Net Capital Formation proxied as
Domestic Private Investment (DPI) were obtained as –0.001491, -0.644191 and -1.152747 respectively. The coefficient of interest rate was obtained as 0.441814, this result therefore implied that 1 per cent change in Interest rate will increase the real output growth by 0.441814 percent. The F-statistics 56.27987, which measured the joint significance of the parameter estimates, was found statistically significant at 1 per cent level as indicated by the corresponding probability value of 0.000000. This implied that all the variables of the model were jointly and statistically significant in affecting the RGDP of the Nigerian economy. The R2 value of 0.992784 (99 per cent) implied that 99 per cent total variation in RGDP was explained by GDF, EXR, INT and DPI in Nigeria. Coincidently, the model was found fit after taking into account the loss in the degree of freedom as indicated by the adjusted R2 (R2 = 0.975143 or 97 per cent). The Durbin-Watson statistic 2.983742 was observed to be higher than the R2 0.983028, which indicates that the model is non-spurious (meaningful).
IV. Summary and Conclusion
This study attempted to examine the impact of deficit financing on economic growth in Nigeria through the application of Augmented Dickey Fuller in testing the stationarity of time series and ARDL technique for testing the regression estimate. The unit root results revealed that the variables used in the study have mixed degree of integration. The results for unit root test revealed that interest rate, exchange rate, real gross domestic output, government deficit financing became stationary and well behaved after first difference d (1), while domestic private investment became stationary at level I(0). The regression estimate of the model has revealed that the lagged coefficient of real output growth and the coefficient of government domestic deficit were found to be statistically significant on economic growth,
32
Globa
l Jo
urna
l of M
anag
emen
t an
d Bu
siness Resea
rch
Volum
e XVIII
Issue
III
Ver
sion
IYe
ar
20
18
© 2018 Global Journals1
Impact of Deficit Financing on Economic Growth in Nigeria(
)B
while the coefficients of exchange rate, interest rate and domestic private investment were found to be statistically insignificant. The model result indicates that government domestic deficit, exchange rate and domestic private investment had negative association with economic growth, while interest rate had a positive association with economic growth. The model was found to be fit as evidenced by its R-squared (0.975143), and the variables in the estimated model were found to be simultaneously statistically significant as shown by the high value of F-statistic (56.27987). In conclusion, it could be said that management of deficit financing has been effective. Some of the major features identified to include public investment involving domestic deficit financing have been self-liquidating, good inter-agency coordination, good record keeping, good quality human resources, financing of long term projects with long term loans, short term project with short term loans. Thus, the federal government became a revenue follower to the extent that its expenditure pattern had little relationship with movement in receipt.
a) Policy Recommendation
1. The study found that deficit financing has negative significant impact on economic growth in Nigeria. It is therefore recommended that deficit financing should be increased effectively, and that government should ensure an efficient public expenditure process and fiscal discipline as well as maintenance of macroeconomic stability so that Nigerian economy can develop.
2. The study found a negative significant association between domestic private investment and economic growth. It is therefore recommended that government should provide enabling environment for the domestic investors and be given loans in order to boost their business to promote economic growth.
References Références Referencias
1. Abdullahi, H. A. (2000). The Relationship between Government Expenditure and Economic Growth in Saudi Arabia” Journal of Administrative Science 12(2): 173-19.
2. Akpokodje, A. (1988). Macroeconomic Environment Investment Stimulation and Economic Growth and Development. The Nigerian Experience Selected Paper for 1998 Annual Conference Nigerian Economic Society.
3. Anyanwu, J. C. (1997). Nigerian Public Finance: Onitsha Joanne Educational Publishers Ltd.
4. Anyanwu, J. C., & Oaikhenan, H. E (1995) Modern Macroeconomics Theory and Application in Nigeria: Journal Educational Publisher Onitsha.
5. Chakra Borty, P., & Chakra Borty, L. S. (2006). Is Fiscal Policy Contra Cyclical in India?
6. Cooray, A. (2009). Government Expenditure, Governance and Economic Growth Comparative Economic studies, 51(3): 401418 [http://www. ingentaconnect.com/content/pal/ces;jsessionid=q1g8lgkzfvms.alice].
7. Domestic Debt Management Office (2006). Fiscal Adjustment in Nigeria: The Problem of Fiscal Dominance in Nigeria, CBN Bullion, 27 (2), April-june, 2003.
8. Erkin, B. (1998). Government Expenditure and Economic Growth Reflections on Ram’s Approach, A New Framework and Some Evidence from Newzealand Time series data: keio economic Studies, 25(1): 59-66. Expenditure and economic growth in Nigeria and Asian Economic and Financial Review 1 (3): 104-113.
Granger, C. W. J & Newbold, P. (1974). Spurious Regression in Econometrics: Journal of Econometrics 2 (1), 111-120.
10. Gregoriou, A., Ghosh, S. (2007). The Impact of Government Expenditure on Growth: Empirical Evidence from Heterogeneous Panel. [http://www. brunel.ac.uk/9379/efwps/0701.pdf].
11. Huynh, N.D. (2007). Budget Deficit and Economic growth in Developing Countries: The case of Vietnam Hansai Institute for Social and Economic Research (KISER).
12. Iya, I.B., Aminu, U., & Gabdo, A.Y. (2014). Empirical Analysis of the Effects of Fiscal Deficits on Economic Growth in Nigeria. International Journal of Emerging Technology and Advanced Engineering. Website: www.ijetae.com. ISSN 2250-2459, ISO 9001: 2008. 4(8), August 2014.
13. Keynes, J.M. (1936). The General Theory of Employment, Interest and Money, London: Mac Millan and Company Ltd.
14. Liu Chih-HL (2008). The Association between Government Expenditure and Economic Growth: The Granger Causality Test of the US Data, 1974-2002. Journal of Public Budgeting, Accounting and Financial Management, 20(4): 439-52.
15. Ogboru, I. (2006). Macroeconomics. Kaduna Liberty Publications limited.
16. Okpanachi, U. M., & Abimiku, C. A. (2007). Fiscal Deficit and Macroeconomic Performance: A Survey of Theory and Empirical Evidence in the Nigerian economy: Challenges and Directions for Growth in the 25 years 3, 3-34. Makurdi Aboki Publishers.
17. Owole, O. & Olubenga A.O (2007). Public Expenditure and Economic Growth: New Evidence from OECD Countries. [http://iaes.confex.com/iaes/ Rome_67/techprogram/S1888. HTM].
18. Rostow, W. (1971). The United State in The World Arena: An Essay in the Recent History (America Project series, 568 page).
19. Shojai, S. (1999). Budget Deficit and Debt. Global Perspective, Praeger Publisher USA.
33
Globa
l Jo
urna
l of M
anag
emen
t an
d Bu
siness Resea
rch
Volum
e XVIII
Issue
III
Ver
sion
IYe
ar
20
18
© 2018 Global Journals
Impact of Deficit Financing on Economic Growth in Nigeria
()
B
9.
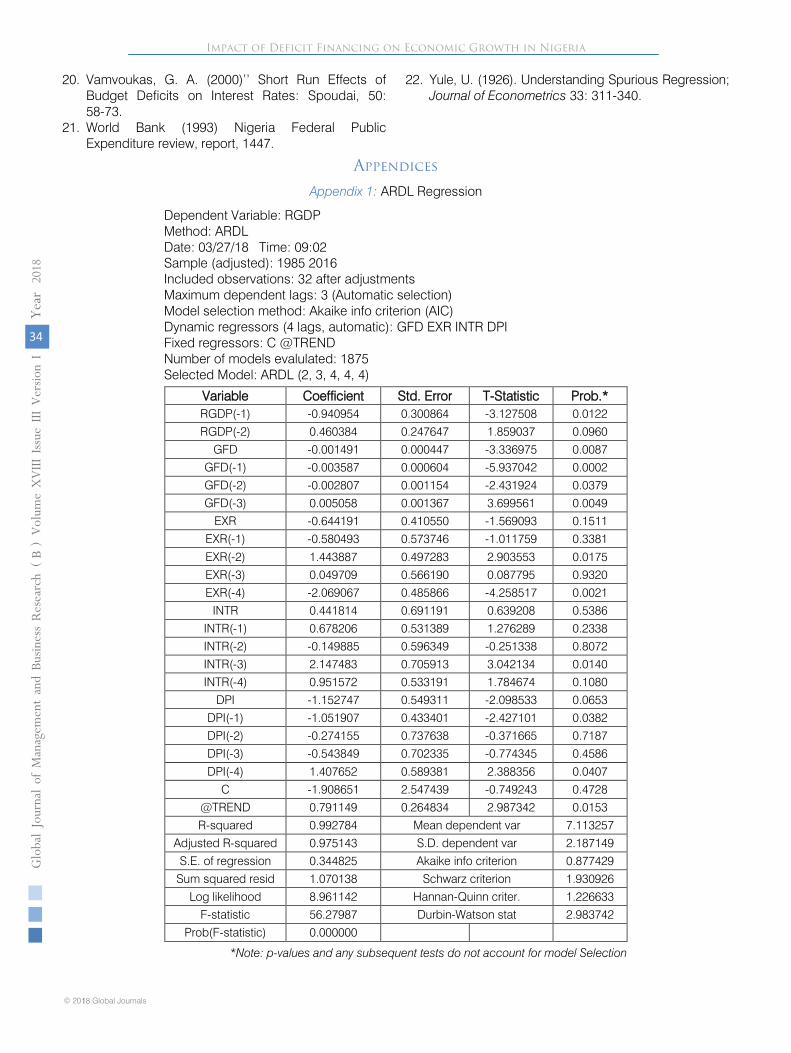
20. Vamvoukas, G. A. (2000)’’ Short Run Effects of Budget Deficits on Interest Rates: Spoudai, 50: 58-73.
21. World Bank (1993) Nigeria Federal Public Expenditure review, report, 1447.
22. Yule, U. (1926). Understanding Spurious Regression; Journal of Econometrics 33: 311-340.
Appendices
Appendix 1: ARDL Regression
Dependent Variable: RGDP Method: ARDL Date: 03/27/18 Time: 09:02 Sample (adjusted): 1985 2016 Included observations: 32 after adjustments Maximum dependent lags: 3 (Automatic selection) Model selection method: Akaike info criterion (AIC) Dynamic regressors (4 lags, automatic): GFD EXR INTR DPI Fixed regressors: C @TREND Number of models evalulated: 1875 Selected Model: ARDL (2, 3, 4, 4, 4)
Variable Coefficient Std. Error T-Statistic Prob.* RGDP(-1) -0.940954 0.300864 -3.127508 0.0122 RGDP(-2) 0.460384 0.247647 1.859037 0.0960
GFD -0.001491 0.000447 -3.336975 0.0087 GFD(-1) -0.003587 0.000604 -5.937042 0.0002 GFD(-2) -0.002807 0.001154 -2.431924 0.0379 GFD(-3) 0.005058 0.001367 3.699561 0.0049
EXR -0.644191 0.410550 -1.569093 0.1511 EXR(-1) -0.580493 0.573746 -1.011759 0.3381
EXR(-2) 1.443887 0.497283 2.903553 0.0175 EXR(-3) 0.049709 0.566190 0.087795 0.9320 EXR(-4) -2.069067 0.485866 -4.258517 0.0021
INTR 0.441814 0.691191 0.639208 0.5386 INTR(-1) 0.678206 0.531389 1.276289 0.2338 INTR(-2) -0.149885 0.596349 -0.251338 0.8072 INTR(-3) 2.147483 0.705913 3.042134 0.0140 INTR(-4) 0.951572 0.533191 1.784674 0.1080
DPI -1.152747 0.549311 -2.098533 0.0653 DPI(-1) -1.051907 0.433401 -2.427101 0.0382 DPI(-2) -0.274155 0.737638 -0.371665 0.7187 DPI(-3) -0.543849 0.702335 -0.774345 0.4586
DPI(-4) 1.407652 0.589381 2.388356 0.0407 C -1.908651 2.547439 -0.749243 0.4728
@TREND 0.791149 0.264834 2.987342 0.0153 R-squared 0.992784 Mean dependent var 7.113257
Adjusted R-squared 0.975143 S.D. dependent var 2.187149 S.E. of regression 0.344825 Akaike info criterion 0.877429
Sum squared resid 1.070138 Schwarz criterion 1.930926 Log likelihood 8.961142 Hannan-Quinn criter. 1.226633
F-statistic 56.27987 Durbin-Watson stat 2.983742 Prob(F-statistic) 0.000000
*Note: p-values and any subsequent tests do not account for model Selection
34
Globa
l Jo
urna
l of M
anag
emen
t an
d Bu
siness Resea
rch
Volum
e XVIII
Issue
III
Ver
sion
IYe
ar
20
18
© 2018 Global Journals1
Impact of Deficit Financing on Economic Growth in Nigeria(
)B
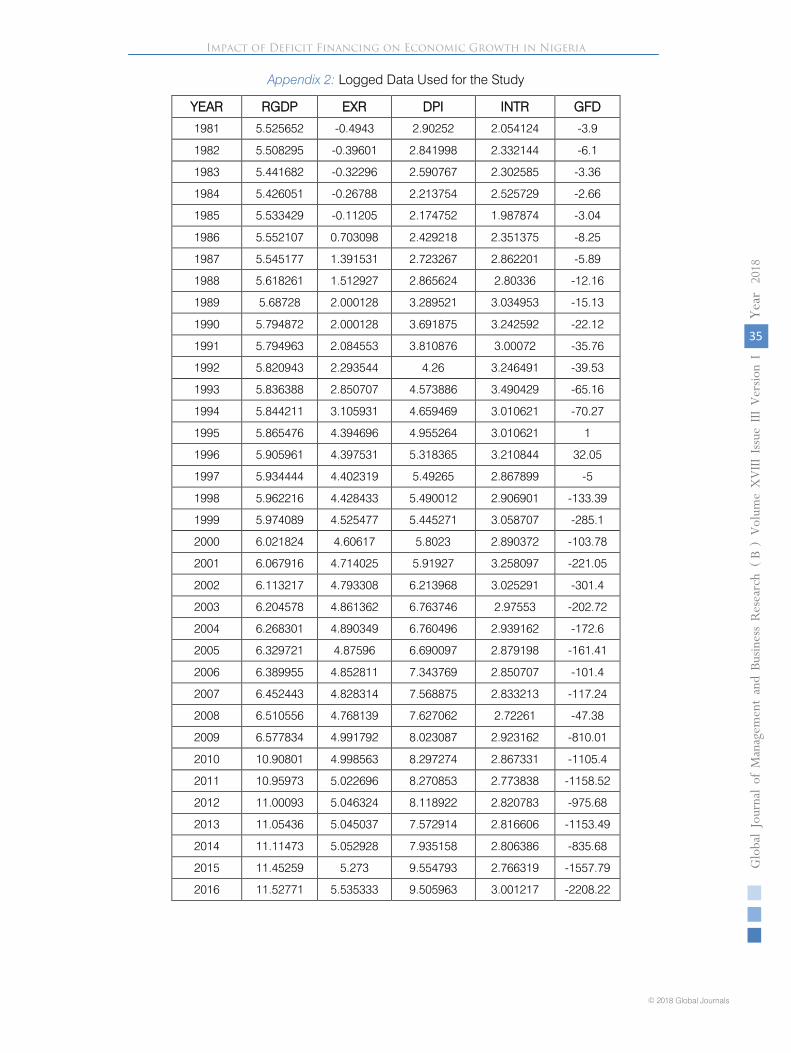
Appendix 2: Logged Data Used for the Study
YEAR RGDP EXR DPI INTR GFD
1981 5.525652 -0.4943 2.90252 2.054124 -3.9
1982 5.508295 -0.39601 2.841998 2.332144 -6.1
1983 5.441682 -0.32296 2.590767 2.302585 -3.36
1984 5.426051 -0.26788 2.213754 2.525729 -2.66
1985 5.533429 -0.11205 2.174752 1.987874 -3.04
1986 5.552107 0.703098 2.429218 2.351375 -8.25
1987 5.545177 1.391531 2.723267 2.862201 -5.89
1988 5.618261 1.512927 2.865624 2.80336 -12.16
1989 5.68728 2.000128 3.289521 3.034953 -15.13
1990 5.794872 2.000128 3.691875 3.242592 -22.12
1991 5.794963 2.084553 3.810876 3.00072 -35.76
1992 5.820943 2.293544 4.26 3.246491 -39.53
1993 5.836388 2.850707 4.573886 3.490429 -65.16
1994 5.844211 3.105931 4.659469 3.010621 -70.27
1995 5.865476 4.394696 4.955264 3.010621 1
1996 5.905961 4.397531 5.318365 3.210844 32.05
1997 5.934444 4.402319 5.49265 2.867899 -5
1998 5.962216 4.428433 5.490012 2.906901 -133.39
1999 5.974089 4.525477 5.445271 3.058707 -285.1
2000 6.021824 4.60617 5.8023 2.890372 -103.78
2001 6.067916 4.714025 5.91927 3.258097 -221.05
2002 6.113217 4.793308 6.213968 3.025291 -301.4
2003 6.204578 4.861362 6.763746 2.97553 -202.72
2004 6.268301 4.890349 6.760496 2.939162 -172.6
2005 6.329721 4.87596 6.690097 2.879198 -161.41
2006 6.389955 4.852811 7.343769 2.850707 -101.4
2007 6.452443 4.828314 7.568875 2.833213 -117.24
2008 6.510556 4.768139 7.627062 2.72261 -47.38
2009 6.577834 4.991792 8.023087 2.923162 -810.01
2010 10.90801 4.998563 8.297274 2.867331 -1105.4
2011 10.95973 5.022696 8.270853 2.773838 -1158.52
2012 11.00093 5.046324 8.118922 2.820783 -975.68
2013 11.05436 5.045037 7.572914 2.816606 -1153.49
2014 11.11473 5.052928 7.935158 2.806386 -835.68
2015 11.45259 5.273 9.554793 2.766319 -1557.79
2016 11.52771 5.535333 9.505963 3.001217 -2208.22
35
Globa
l Jo
urna
l of M
anag
emen
t an
d Bu
siness Resea
rch
Volum
e XVIII
Issue
III
Ver
sion
IYe
ar
20
18
© 2018 Global Journals
Impact of Deficit Financing on Economic Growth in Nigeria
()
B
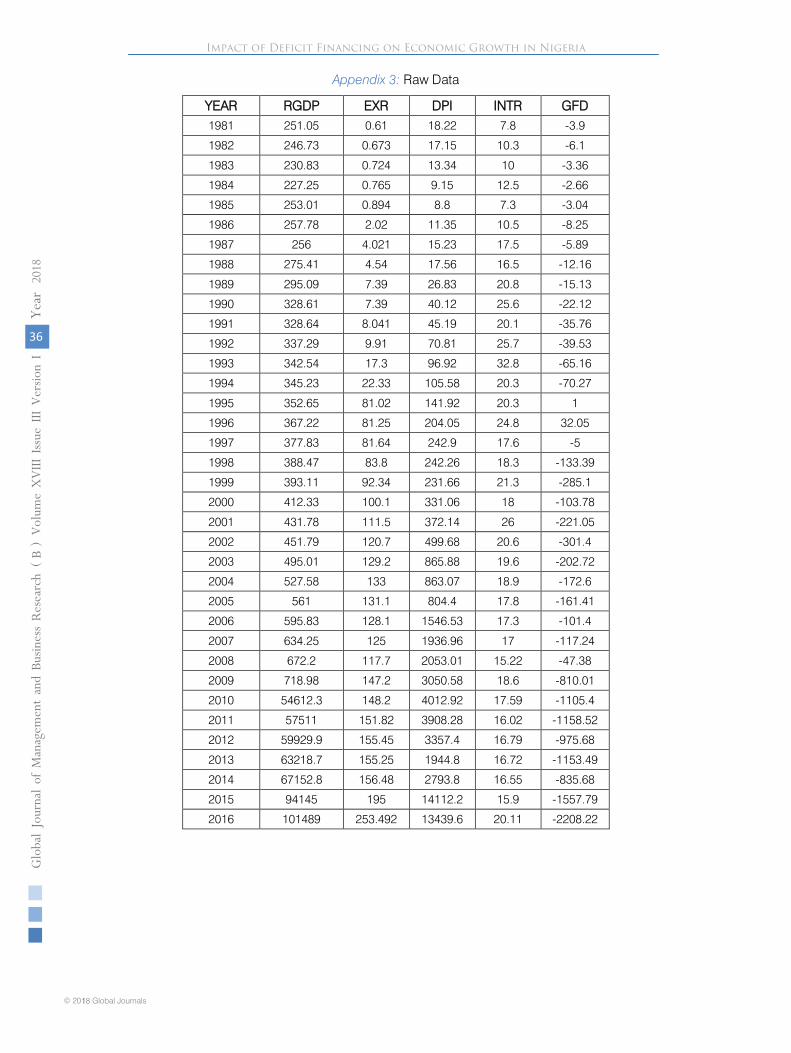
Appendix 3: Raw Data
YEAR RGDP EXR DPI INTR GFD 1981 251.05 0.61 18.22 7.8 -3.9
1982 246.73 0.673 17.15 10.3 -6.1
1983 230.83 0.724 13.34 10 -3.36
1984 227.25 0.765 9.15 12.5 -2.66
1985 253.01 0.894 8.8 7.3 -3.04
1986 257.78 2.02 11.35 10.5 -8.25
1987 256 4.021 15.23 17.5 -5.89
1988 275.41 4.54 17.56 16.5 -12.16
1989 295.09 7.39 26.83 20.8 -15.13
1990 328.61 7.39 40.12 25.6 -22.12
1991 328.64 8.041 45.19 20.1 -35.76
1992 337.29 9.91 70.81 25.7 -39.53
1993 342.54 17.3 96.92 32.8 -65.16
1994 345.23 22.33 105.58 20.3 -70.27
1995 352.65 81.02 141.92 20.3 1
1996 367.22 81.25 204.05 24.8 32.05
1997 377.83 81.64 242.9 17.6 -5
1998 388.47 83.8 242.26 18.3 -133.39
1999 393.11 92.34 231.66 21.3 -285.1
2000 412.33 100.1 331.06 18 -103.78
2001 431.78 111.5 372.14 26 -221.05
2002 451.79 120.7 499.68 20.6 -301.4
2003 495.01 129.2 865.88 19.6 -202.72
2004 527.58 133 863.07 18.9 -172.6
2005 561 131.1 804.4 17.8 -161.41
2006 595.83 128.1 1546.53 17.3 -101.4
2007 634.25 125 1936.96 17 -117.24
2008 672.2 117.7 2053.01 15.22 -47.38
2009 718.98 147.2 3050.58 18.6 -810.01
2010 54612.3 148.2 4012.92 17.59 -1105.4
2011 57511 151.82 3908.28 16.02 -1158.52
2012 59929.9 155.45 3357.4 16.79 -975.68
2013 63218.7 155.25 1944.8 16.72 -1153.49
2014 67152.8 156.48 2793.8 16.55 -835.68
2015 94145 195 14112.2 15.9 -1557.79
2016 101489 253.492 13439.6 20.11 -2208.22
36
Globa
l Jo
urna
l of M
anag
emen
t an
d Bu
siness Resea
rch
Volum
e XVIII
Issue
III
Ver
sion
IYe
ar20
18
© 2018 Global Journals1
Impact of Deficit Financing on Economic Growth in Nigeria(
)B
© 2018. Addisu Karafo. This is a research/review paper, distributed under the terms of the Creative Commons Attribution-Noncommercial 3.0 Unported License http://creativecommons.org/licenses/by-nc/3.0/), permitting all non-commercial use, distribution, and reproduction in any medium, provided the original work is properly cited.
Global Journal of Management and Business Research: B Economics and Commerce Volume 18 Issue 3 Version 1.0 Year 2018 Type: Double Blind Peer Reviewed International Research Journal Publisher: Global Journals
Online ISSN: 2249-4588 & Print ISSN: 0975-5853
The Effect of Contraband on Government Revenue: Case of Segen Area People’s Zone
By Addisu Karafo Jinka University
Abstract- The main objective of this study was to assess the effect of contraband on government revenue of Segen Area People Zone. The study was descriptive used only primary data from revenue authority employees and contraband business operators through structured questionnaires. The targeted respondents were selected using simple random sampling and judgmental sampling technique. The collected data were analyzed statistically with statistical software. The result of the study shows that the motivating factors were lack of formal income, lack of job and the demand and supply gap in formal operation. The finding also reveals that contraband undermines the government revenue, increases the tax burden on formal business operators and may remove them from official system in to informal nontax paying system. Moreover; it kills the need of the investments and innovations in the country, wipes out foreign currency that a country may earn from legal import export and creates unfair competition in the market. The process of controlling contraband faces a great challenge like a bribe, insufficient skilled and competent manpower, lack of ongoing training, low salary of the workers, corruption, inadequate enforcement and penalties and ineffective respond to tax evasion in the area. Accordingly; to mitigate contraband, the government should raise domestic innovations, manufacturing and human resource capacity development, strengthen strong enforcement of the rules and punishments, and even create a conducive environment for effective coordination and communication among controlling unit and the general public.
Strictly as per the compliance and regulations of:
Keywords: contraband, government revenue, illicit business, smuggling.
GJMBR-B Classification: JEL Code: H27
TheEffectofContrabandonGovernmentRevenueCaseofSegenAreaPeoplesZone
The Effect of Contraband on Government Revenue: Case of Segen Area People’s Zone
Addisu Karafo
37
Globa
l Jo
urna
l of M
anag
emen
t an
d Bu
siness Resea
rch
Volum
e XVIII
Issue
III
Ver
sion
IYe
ar
20
18
© 2018 Global Journals
()
B
Abstract- The main objective of this study was to assess the effect of contraband on government revenue of Segen Area People Zone. The study was descriptive used only primary data from revenue authority employees and contraband business operators through structured questionnaires. The targeted respondents were selected using simple random sampling and judgmental sampling technique. The collected data were analyzed statistically with statistical software. The result of the study shows that the motivating factors were lack of formal income, lack of job and the demand and supply gap in formal operation. The finding also reveals that contraband undermines the government revenue, increases the tax burden on formal business operators and may remove them from official system in to informal nontax paying system. Moreover;it kills the need of the investments and innovations in the country, wipes out foreign currency that a country may earn from legal import export and creates unfair competition in the market. The process of controlling contraband faces a great challenge like a bribe, insufficient skilled and competent manpower, lack of ongoing training, low salary of the workers, corruption, inadequate enforcement and penalties and ineffective respond to tax evasion in the area. Accordingly; to mitigate contraband, the government should raise domestic innovations, manufacturing and human resource capacity development, strengthen strong enforcement of the rules and punishments, and even create a conducive environment for effective coordination and communication among controlling unit and the general public. Keywords: contraband, government revenue, illicit business, smuggling.
1. Introduction
1.1 Background of the Studylobalization is an engine for economic growth and significantly enhances trading activities. It also boosts opportunities for informal business
operators in informal economies creating a multi-dimensional challenge for the administration. Informal economy comprises those economic activities that circumvent costs and excluded from the benefits and rights incorporated in administrative rules and regulations. It is part of an economy that is not taxed, monitored by any form of government or included in any gross national product (GNP).
Illicit trading activities across a border such as contraband are invasive socio-economic perils deep-rooted in the global trading system. Their syndicates are drawn by huge profits while benefiting from weak legislation. Enforcement agencies face the formidable
Author: Lecturer, Jinka University, College of Business and Economics. e-mail: [email protected]
task of facilitating the flow of legal trade whiledismantling organizations involved in smuggling operations. Smugglings dampen the economy in multidimensional ways. It destabilizes the legal industry, restrains innovation and investments, reduces government revenues, fuels transnational organized crime and hampers the health and safety of consumers (FICCI, 2016).
Ethiopia is a landlocked country and experienced strong, broad-based growth averaging 10.5% a year from 2005/06 to 2015/16, compared to a regional average of 5.4% (World Bank, 2017). This growth brought with it positive trends in poverty reduction in both urban and rural areas. Despite this marvelous change; the tax revenue collectionperformance of the country is lowest compared to an average tax collection performance of sub-Saharan African countries, (Alemayehu, 2015) and even below its neighboring countries (Tilahun, 2014 cited in Workineh, 2016). This low performance is an indication of illicit trade activities outside the formal business activities whoevade and avoid tax revenue from government. The products on such illicit trading activities are smuggled goods which have no official entry point in the country, do not have customs document or prior approval to enter into or depart from the country. The agentsinvolved in these activities violate the law that govern the import and export procedure and thus avoid the payment of all applicable taxes for the importation or exportation of goods.
1.2 Statement of the ProblemProducts crossing a border in to or out of the
country illegally are informal transactions. They remain a great challenge for countries in generating tax revenue for long periods of time. They expand the evader’s potential of evading tax revenue from government treasury and disappoint those who operate in legal economy forcing them to shift their activities to illegal markets. Moreover; they kill micro small and medium business enterprises growth shutting their market by providing forbidden and quality products produced with advanced technologies at a low price. By removing revenue from government and demolishing the growth of micro small and medium enterprises, the contrabandist puts the economy of the country at risk.
These contraband activity most of the time typifies developing and underdeveloped nations which are characterized by high manpower, lower per capital
G
38
Globa
l Jo
urna
l of M
anag
emen
t an
d Bu
siness Resea
rch
Volum
e XVIII
Issue
III
Ver
sion
IYe
ar
20
18
© 2018 Global Journals1
The Effect of Contraband on Government Revenue: Case of Segen Area People’s Zone(
)B
income and the biggest portion of the economy leading the life by cultivation. These nations have no well-established infrastructures; agriculture covering the largest percentage of GDP and industries that produce products with poor qualities. They are also subject to foreign cultures invasion and dominance of the youngest people losing their identity. Consequently; the individuals in these countries are forced to participate in illegal activities as an agent or direct for themselves.
In Ethiopia, contraband is not a recent phenomenon but existed long periods ago. Since then smugglers did not hesitate to smuggle goods into and out of Ethiopia, and they are still doing it in spite of all laws and regulations1
Why do individuals involve themselves in contraband activities?
. They smuggled products like electronics and electrical goods, garments of various kinds, perfumes, cosmetics, habit-forming drugs, armaments, and others. The products are smuggled from countries like Sudan, Eritrea, Kenya, and Djibouti (Zemzem and Teklu, 2017). These neighboring countries knowingly allow their border for such products to cross Ethiopia to raise illegal activities in the country that will jeopardize the economy of the country at any time.
Thus, it is against the problems stated above that this study tries to investigate the effect that products crossing the border and entering the country unlawfully through Moyale have on the revenue of the Segen area peoples zone tax authority.
In line with the above-stated research problem, the study will answer the following research questions:
What are the effects of these activities on government revenue?
What are the measures taken or planned to be taken against activities?
1.3 Objectives of the Study
1.3.1 General Objective The general objective of this study is to
investigate the effect of contraband on government tax revenue of Segen Area Peoples’ Zone.
1.3.2 Specific Objectives
• To assess the reasons why individuals engage themselves in contraband activities.
• To assess the effect of this activity on government revenue of the area and
• To examine the measures taken and planned to be taken against the activity.
1.4 Scope and Limitation Segen area people zone consists of five
Woredas namely Konso, Dirashe, Burjy, Amaharo and Ali. These Woredas are near one another and located in southern region of the country bordering the region with Oromia region. However, the contraband or smuggled
1 www.erca.gov.et/index.php/customs/org
products largely enter the area from Oromia region Moyal to Konso and then distributed to the rest of Zone Woredas and other parts of the region and country at large. Thus this study concentrates on Segen Area People’s Zone because of the time and cost that it takes to cover the entire country. The targeted business operators also exist outside the formal system, so the owners may refuse to participate and fill the questionnaires appropriately.
1.5 The Significance of the Study This study focuses on the effect of contraband
which is an illegal activity undertaken against government revenue and the economy at large. So this will have the following benefits:
• It can help tax authority to establish ways that will help them to eradicate if possible or reduce contraband and enhance its tax revenue potential.
• It can also help the government to establish a policy that will reduce the level of informal economy in the country.
• It can also act as a stepping stone for other research on the same area.
1.6 Organization of the Paper This study is concerned with contraband in
Segen Area Peoples’ Zone and will have five parts. The first part is about the introduction and incorporates background, statement of the problem, objectives, scope and limitation, significance and organization of the paper. The second section was about the literature review related to the study followed by methods used to collect data, select sample and analysis of the collected data. The fourth section presents data analysis and discussion and the fifth section of the study then concludes the study.
2. Review of Literature
2.1 Contraband and its Meaning Products produced in or outside a country
cross a border to abroad or into the country from outside in two ways. In the first case legally by those who have legal license to do it and pays tax for the government on the income generated from such transactions. They deal with products that are allowed to be imported or exported by rules and regulation of the country and support the economy of that country. On the other hand, there are people who engage themselves in activities that contradict the legal system of the country. They had no state-issued permits, license or registration and did not pay tax on the products. Moreover; the products being imported or exported may be forbidden legally because of the effect that they may have on the socioeconomic and political system of the country. In general word, the products entering or leaving the country in such a way are named as contrabands.
39
Globa
l Jo
urna
l of M
anag
emen
t an
d Bu
siness Resea
rch
Volum
e XVIII
Issue
III
Ver
sion
IYe
ar
20
18
© 2018 Global Journals
The Effect of Contraband on Government Revenue: Case of Segen Area People’s Zone
()
B
The word contraband refers to property that is illegal to possess or transport and may be goods that are illegal to import or export and are attempted to be smuggled into a country. Contraband goods are usually subject to seizure by government officials (https:// definitions.uslegal.com/c/contraband). The products have no official entry point, do not have customs document or prior approval to enter into or depart from a country so, they violate the law that governs the import /export procedure and thus avoid the payment of all applicable taxes for the importation or exportation of goods (www.erca.gov.et/index.php/customs/org) and has harmful effect on the socioeconomic development of a country.
In Ethiopia, this contraband enters the country in different directions from neighboring countries namely Kenya, Sudan, Eritrea, Djibouti, and Somalia. The operator brings the products on foot, pack animals, Motor Vehicle and Cars that gives transport service to the public. Moreover, the public office cars that are provided by the government to officials for office purposes like ambulances and those cars that carry oils and gas from the center to different areas of the country also participate in supporting in such evil activities. Some are trafficked hidden within areas such as automobile tires, doors, fenders, bumpers, fuel tanks, and in other secret compartments of trucks, and trains.
Even more; some contraband goods are occasionally smuggled into and out of the country stuck in containers with other legal shipments allowed to be imported or exported after fulfilling customs formality. Drivers of trucks which transport legal shipments stop their vehicle en route and load illegal goods in to the container of legal products. Smugglers are also assisted by some dishonest customs officers at check points and local security forces. Smugglers bribe them and enter or take their goods into or out of the country illegally.
To convey their goods, smugglers cross the land borders of the country and use routes that are not under the control of the federal police. The large part of the Ethiopian border encompasses extensive lowland areas2
2
which are difficult to fully control by the federal police. As a result, smugglers can easily cross the border with their substantial smuggled goods. The smugglers, experienced in running contraband goods and adept at traversing the country's border, are canny in looking for other devious routes when their way was blocked by federal policemen. They are also violent enough to intimidate or kill anyone standing in their way. As a result, many elements of the Ethiopian law enforcement community have lost their priceless lives in the fight against smugglers. Using the above mentioned devious devices/methods, smugglers deliver contraband goods to their secret stores and make them available for selling and distribution.
www.erca.gov.et/index.php/customs/o
2.2 Determinants of Contraband Some of illicit transactions may be carried out
across a border between countries by illegal traders or by licensed business owners whose aim was to escape government tax. This was the problem for all countries across a globe for an extensive period of times and still exists regardless of the measures developed and taken by governments. However; what remained an answered by academicians, government and even international organizations was, why do people engage themselves in such illegal activities given its existence outside government control?
People participate in contraband activities directly by themselves or assign agents that will act on behalf of them for commission base. They are motivated by various factors may be to avoid taxes and to secure illegal competitive advantage, to avoid customs checkpoints where goods and their documents are examined, to make a living and to escape from the unemployment prevailed in the country (www.erca.gov. et/index.php/customs/org). Others involved in the contraband trade as acts of political defiance. Irresponsible and anti-peace elements may smuggle guns and hand grenades into the country to commit a crime, to damage public infrastructure and to create political instability in the country or to cause an atmosphere of social unrest. Moreover; consumer's willingness to buy goods on the black market is the other factor that drives smugglers (www.erca.gov.et/ index.php/customs/org). Smuggled goods are sold at a low price and this has made thousands of poor people prefer to buy smuggled products than legally imported goods. External factors like political instability, social unrest and economic crisis in the neighboring countries may also contribute to the expansion of contraband trade in a given country.
In many parts of the world, the import and export policies usually consider the effect that the products may have on the economy of the country. Accordingly, there are products which are allowed by the import/export policy of the country and also prohibited even if the demand for the products exists in that country taking in to account their effects. In such cases, prohibitions effectively prevent trading in forbidden products on the legal market, but these products continue to be desired, wanted and insisted by consumers. So the absence of legal supply leaves plenty of opportunities for contraband supply to substitute for it. Lack of legal supply to meet this demand for prohibited products (demand gap) may force individuals to engage themselves in illicit activities.
The level of tax burden also plays great role in the economy in expanding the market of contrabandists. Business peoples may join refusing the level tax they are being charged by the government. A well-established tax system considers the ability to pay for the people and also have a pivotal role in inspiring micro small and
40
Globa
l Jo
urna
l of M
anag
emen
t an
d Bu
siness Resea
rch
Volum
e XVIII
Issue
III
Ver
sion
IYe
ar
20
18
© 2018 Global Journals1
The Effect of Contraband on Government Revenue: Case of Segen Area People’s Zone(
)B
medium business enterprises in the economy. However; many countries mainly developing countries charges their peoples without ability consideration to meet the level of tax they have aimed to collect in that fiscal year. They may do this by increasing tax rate or forcefully incorporate the business into tax net. Thus, this moves the business peoples to smuggling creating higher tax evasion in that country. Several studies by Bhagwati, (1964); Fisman and Wei, (2004); Mishra, (2008) and Buehn and Farzanegan (2011), pointed out that tax rate is vital to push factors for smuggling.
Moreover; effective law enforcement in the nation is a fundamental element in keeping the people in that tax system and reduce illegal acts. A country that has fine law enforcement experiences less illicit activities. A significant measure for lack of a successful enforcement mechanism is the number of policemen per a population and level of investment in technology and training that support surveillance, which enables proactive and effective enforcement actions possible. The costs of smuggling depend on the probability of being caught and punished by the authorities, so intensifying enforcement increases the costs of smuggling in the form of punishment, confiscation, and detection (Martin and Panagariya, 1984). The study shows a significant negative correlation between effective enforcement and smuggling (Buehn and Farzanegan, 2011). Low risk of the law enforcement with profitability from tax evasion from smuggling enhances the motivation for the illegal act of smuggling.
Countries with low innovations and lower level of technology of the domestic industries to produce new products that contend smuggled products in quality and price may experience a higher number of peoples involved in contraband activities. The imported products illegally satisfy the needs of the consumers with emerging technologies, new products with better quality and performance (Bakhtiyari & Salarzaei, 2016). Smuggling of imported goods expands due to enhanced public demand. Ambition value of imported goods with the perceived better quality compared to domestic commodities, coupled with enhances purchasing power tends to provide impetus to smuggling. Findings of the subsequent section on the extent of smuggling show that weakness of domestic industry in producing quality machinery and electronic goods could be one of the causes for smuggling of imported goods.
2.3 Effect of Contraband
Regardless of different approaches to definitions of contraband, its effects are numerous and economically significant. It is a serious problem and its impact is far-reaching, affecting various stakeholders including Government, domestic industries and citizens of the country. Most customs, border and law enforcement officials, policymakers, and academicians agree that illegal trans-border trading results in major
financial and social costs to economy, and society (FICCI, 2016).
2.3.1 A Loss of Government Revenues The smuggling of goods or products can be
considered as one of the tax violations that attack a country’s tax system. It dampens legal imports and drastically decreases the volume of revenues collected from various duties and levies by state agencies. Customs duty forms a significant part of the Central Government revenues, which shows a decreasing trend over the past few years (FICCI, 2016).
Illegal trade in contraband products deprives government tax revenue because the product crosses the border illegally without payment of tax. When goods are conveyed secretly or illicitly into or out of the country without the payment of customs duty and taxes, the government loses much revenue (www.erca.gov.et/ index.php/customs/org). The eventual outcome of the revenue lost is that it hampers development programs. Therefore to make the development programs feasible and to finance them, the government may be forced to increase taxes or adjust other sources of income. The burden of covering these shortages falls on honest taxpayers who in turn lead to higher prices of commodities which in turn can contribute for the growth of black-markets or as the tax increase drive up the price of domestically produced and imported goods, many consumers seek lower-priced products through a variety of alternative venues and channels, many of which are illegal. (www.erca.gov.et/index.php/customs/ org).
The main objective of taxation is to reduce the income inequality among the people usually using progressive tax system. Through this tax system, high-income earners pay accordingly and the poor as well. However, contraband business violates this and amplifies income disparity or the earnings gap between the rich and poor. They are the main parts of the group who are recognized legally in evading government revenue. The products entering or parting the country by these illicit traders are hidden from the view of government and are sold surreptitiously. They use the poor on a little compensation to carry the smuggled products on foot or other means from the border to their store. They accumulate the wealth while the living standards for many stagnate because they are not paying as formal business peoples.
2.3.2 Impact on Domestic Industries and Innovations
The flow of contraband products into a country weakens local industries by distorting the prices of the products. These illegal, illicit traders well know by the act of providing the products at chipper prices which will disappoint and may also remove local producers from the market. Their intension was evading and avoiding tax and regulation, so their chip price may result in the breakdown of domestic industries or force domestic producers into bankruptcies.
41
Globa
l Jo
urna
l of M
anag
emen
t an
d Bu
siness Resea
rch
Volum
e XVIII
Issue
III
Ver
sion
IYe
ar20
18
© 2018 Global Journals
The Effect of Contraband on Government Revenue: Case of Segen Area People’s Zone
()
B
Micro Small and Medium enterprises are the principal employment generators and exert a strong influence on the economies of all countries. They are the fertile sectors regarding of innovations and quick remedy for unemployment and also increases tax revenue for the government. Moreover; they are the backbone of every economy in raising the economy through the enhancement of import and export of the country. However; contraband operators remained the main hindrance for these entrepreneurs by providing quality products produced by advanced technologies at lower prices. By doing this, they downsize domestic entrepreneurs development and expansions.
Innovation in the form of the conception of new ideas for the development of new products or processes and experimentation3
2.3.3 Threat to Society
has been recognized widely as an imperative driver of economic growth. Innovators protect their thoughts through patents, copyrights, design rights and trademarks. Without adequate protection of these intellectual property rights, the incentive to develop new ideas and goods is reduced, thereby weakening the innovation process. In industries where product development requires significant investment and innovation, smuggling of counterfeit product impairs investments and innovation by undermining the efforts of innovators and discouraging them from further research and development, which ultimately hampers overall growth of the economy.
Smugglers involved in clandestine activities also pose a serious threat to society. It affects the internal structure of a society by creating powerful illegal institutions (Dominguez, 1975). It expands the black market and increases convergence between organized crime, terrorist groups and other threat networks available at (http://www.state.gov/documents/ organization/250513.pdf). Smugglers and their system outwit the national borders imposing security threat and earnings from this illegal activity may be used finance insecurity that increases the policing costs (Burke, 2013).
Antisocial behavior is conduct that disrupts society or displays disdain or hostility to it. For instance, committing a crime is antisocial manners. Such kind of behavior can be intensified in society by the body of persons who used smuggled in weapons for violence activities calculated to cause death, robbery, burglary, rape and other crimes. Therefore smuggling armaments into the country weakens the struggle to maintain peace and order in the society available at (www.erca.gov.et/ indexphp/ customs/ others/101contraband).
2.3.4 A Negative Effect on the Economy Monetary costs arise from smuggling due to
evasion of taxes and tariffs. Smugglers are extra burden
3 www.ficci.in/spdocument/20807/final.
for government budget by evading legal duties and taxes/tariffs. A developing country relies more on indirect taxes as compared to direct taxes and low indirect tax collections may have harmful consequences for the government’s ability to provide public goods. The provision of public goods increases the productivity of economy (Loayza, 1996), and thus not creating such public products has a harmful effect on productivity, development, and economic growth (Norton, 1988).
Smuggling may have a negative effect on official indicators such as growth and income distribution. It involves bribery and other forms of corruption and tends to promote criminal behavior in the economy (www.ficci.in/spdocument/20807/final). Smuggling may result in mass fall-down in domestic companies who are unable to counter cheap imports, leading to surging in unemployment in the country.
2.3.5 Health and Safety Risks A contraband operator also carries products
that are risky for society. They deal with prohibited goods like narcotics and illicit tobacco which are the serious threat to the life of many citizens of the country (WEF, 2012). And pornography materials which display genitals and show sex acts in an offensive way, thereby eroding the moral values of the society. Even although the legal system of the countries prohibit the importation such products, they are entering the border increasingly with the increasing number of users.
Habit–forming dangerous drugs debase/ demoralize the moral senses of the youth and others who take illegal drugs for pleasure or because of addiction and it also cause them a wave of sickness when they are unable to continue captivating it. The poor quality smuggled goods can produce health problem in the society. In their attempt to control drug trafficking, federal policemen catch people and travelers who bring illegal drugs into the country (www.erca.gov. et/index.php/ customs/org).
2.4 Measures Against Contraband Cross-border trade below the radar of
government oversight is both a boon, and a curse for many African economies (www.ictsd.org/bridges-news/ bridges). However; in many countries particularly Africa the cost of contraband or informal cross-border trade outweighs the benefit because of this governments are standing against this activities. They frame some of measures that they think will reduce or eradicate contraband and other illegal cross border trades and in turn enhance domestic production.
Informal cross-border trade touches everybody in the community. So the prevention of contraband needs a wide range of actors including government, both regional and local administrators, and the society at large. The government by itself cannot stop informal trades, so should work together with the community where the contrabandist were located and conceal their
42
Globa
l Jo
urna
l of M
anag
emen
t an
d Bu
siness Resea
rch
Volum
e XVIII
Issue
III
Ver
sion
IYe
ar
20
18
© 2018 Global Journals1
The Effect of Contraband on Government Revenue: Case of Segen Area People’s Zone(
)B
products after crossing the border. The Ethiopian government has established a new strategy against contraband and based on this strategy the government has disbanded customs police, the former agent responsible to prevent contraband, and replaced it by the federal police as of July 2008. In addition to this, the government has amended customs and tax laws. This amendment has helped to streamline taxation procedure and to empower the federal police for prevent contraband (www.erca.gov.et/index.php/customs/o). However; federal police only can't carry the burden of averting contraband alone, so they need to work with regional and local administrators, and the community. As a result of the active participation of them in fighting against contraband, the volume of smuggled goods that enter for example into Diredawa via Shinile Zone has decreased (Paper on strategy to prevent contraband, 2009).
Information and knowledge gap usually are bases of failing for many individuals, entrepreneurs, and companies. Having awareness and information about the advantage and disadvantages of something gives a clue to accept or reject it. Enlightening the general public and creating awareness about the effects of contraband on the economy of a given country plays a vast role in challenging the increasing informal cross-border trade activities. Contrabandists usually use the harsh economic and financial condition of the public and use them to carry illegal products from the border through challenging ways using motorbikes, animals and human back particularly females or hide the contraband from government officials. They are doing this because of poor understanding about contraband and abet for contrabandists even and abuse the government officials assuming that officials are blocking the business of the people. Therefore, providing education is necessary to infuse into the hearts and minds of citizens the necessity for proper respect traditional law and to let them stand against contraband. Educating the society about the proclamations, regulations, directives and operational systems of customs using various media and customs website awakens the people to stand up for their country.
Also; to reduce the size of smuggling in the country it is necessary to strengthen the deterrence mechanism for committing the crime. In Ethiopia, sub article 1 of article 92 stipulated in proclamation no.622/ 2009 any person who, in contravention of this proclamation or the other laws enforced by ERCA, including regulations and directives issued there under, imports or exports prohibited or restricted goods or without customs clearance or illegally imports dully exported goods, without prejudice to the forfeiture of the goods and equipments used in the commission of the offence and the proceeds thereof, be punishable with fine equivalent to the amount of the customs duties and taxes payable on the goods and with rigorous
imprisonment from 7 to 15 years (Customs Proclamations No.622/2009)4
The World Bank findings show that political support for customs reforms is essential, together with
. According to sub article 2 of the same article, any person who transports, stores, offers for sale or buys goods referred to in sub article 1 of this article while being or ought to have been aware of the illegality of their acquisition shall without prejudice to the forfeiture of the goods and equipments used in the commission of the offence and the proceeds thereof without affecting the right of third parties who transacted in good faith, be punishable with a fine equivalent to the amount of the customs duties and taxes payable on the goods and with rigorous imprisonment from 7 to 15 years. According to sub-article 3 of article 92 stipulated in proclamation 622/2009, where the offense is committed by the use of force or by an organized group with the offender of the punishment shall be, without prejudice to the forfeiture of the goods seized and fine from 15 to 20 years, rigorous imprisonment.
The other approach connected with the strategy to prevent contraband is allowing border trade. By making border trade with the neighboring countries: Somalia, Sudan, Kenya and Djibouti, the government has tried to collect taxes. The border trade has been carried out by the directives issued in 2000 and 2001 by the Ministry of Trade and Industries. The objectives of the border trade are to let the residents in the border area fulfill their demand for consumption goods, to let them use border trade as a means of securing the necessities of life, to decrease the activities of contraband and to promote legal trade. By opening the door to border trade, the government anticipates some smugglers will abandon their vicious practice and turn into productive citizens of the country. Export items for border trade are typically consisted of a pulse, livestock such as goats, sheep, camel, and others. Import items are mainly food items, clothing that are usually dressed by the residents of the border area.
Moreover; the simplification of the procedures and creation of a system which allows fewer contacts between the staff and the traders was implemented by some countries, while others upgraded information technology system and even introduced custom software to improve service delivery, increase transparency and shorten customs clearance time. In their reforms, Countries like Uganda and Peru on the other hand employed measures such as cooperation with other authorities, private entities and police, expanded audits and preventative inspections to increase enforcement. Though these efforts may have reduced the clearance time, increased seizures (especially in Mozambique) and a decline in smuggling, corruption is still high (especially in developing countries), which compromises these efforts.
4 Proclamations No.622/2009, Customs Proclamation.
43
Globa
l Jo
urna
l of M
anag
emen
t an
d Bu
siness Resea
rch
Volum
e XVIII
Issue
III
Ver
sion
IYe
ar
20
18
© 2018 Global Journals
The Effect of Contraband on Government Revenue: Case of Segen Area People’s Zone
()
B
stable leadership. Financial support is also a very important ingredient in ensuring successful restructuring. Also, the cooperation of customs staff, taxpayers, and coordination with other tax agencies is critical for effective customs reform (World Bank, 2005).
The literature furthermore points several initiatives that may help to combat illicit trade, including:
Exchange and joint analysis of statistics of general trends of the risks and seizure of illegal and undeclared goods.
Enhance cooperation between Customs and different players in the economy, including other law enforcement agencies, to help to better infiltrate and identify production and distribution networks for illegal and illicit trade.
Exchange of knowledge and experience by customs officials regionally and internationally.
Establish and designate as appropriate national coordination agencies or bodies and institutional infrastructure responsible for policy guidance, research and monitoring of efforts to prevent, combat and eradicate illicit trade.
Introduce modernized systems, improved risk management practices, and implement audits of the custodians of regulatory controls.
One measure has been the establishment of simplified trade regimes, which simplify the rules and procedures for small traders and provide tax incentives for trading within the formal sector. Some countries cater expressly for the needs of small-scale traders at their borders, by providing information officers to assist with the correct procedures. Equally, these economic communities promote engagement with informal cross-
border trade representatives, to ensure their needs are considered when policies and legislation are
developed5
3. Research Methodology
.
3.1 Research Design The study was descriptive, describing the effect
of contraband on government revenue of Segen Area People’s Zone. This is because it depicts the participants in accurately and allows insight into life experiences due to its unique approach.
3.2 Data Source and Collection Methods
The core objective of this study was to investigate the effect of contraband on government revenue of Segen Area people’s zone. Contraband is informal business operating outside the formal rule and regulation and has no legal records, so it is difficult to measure the amount of revenue loosed by the government through contraband. An estimate made by
different experts is used to know the extent of the contraband effect.
This study used only primary data obtained from revenue authority employees and contraband business operators. The study used only primary data because of the illegal nature of the area of investigation, lack of formal records about the revenues of the operators and actual revenue loss of government because of this informal business (contraband).
Primary data were collected through structured questionnaires that contain both open and closed- ended questions distributed to the employees and business operators. Also; Lickert scale was used to generate the perception of various study respondents on the magnitude of contraband. Secondary data were collected through reviewing written documents, articles and journals.
3.3 Sampling Design The target population of this study was tax
authority employees and formal business operators as well as those illicit traders. Segen Area Peoples Zone was composed of five Woredas (Konso, Dirashe, Amharo, Burji, and Ali). Accordingly, the study utilized all data obtained from the employees of the revenue authority and contraband business operators. The tax authority offices were located in Zone city and Zone center in addition to five Woredas.
Collecting enough data from the targeted population is essential for the realization of the research objectives and to arrive at the needed conclusion. The area of investigation lacks formal records about revenue and expense, operates outside the official system of operation and mysterious in number to select the representative sample for the study. Also; they may perceive divulging them for the government for punishment at the time the researcher met them and might refuse to give the data hence their business was informal by nature. Therefore; the researcher picked 50 contraband business operators using judgmental sampling technique considering the ability to fill the questionnaire properly, uniformity of their business and their objectives of preferring illegal business than formal business.
The total numbers of employees in revenue authority are known so; the researcher used simple random sampling. Currently, there are about 178 numbers of employees in the zone tax authority (35 in Konso, 31 in Amharo, 25 in Gidole, 15 in Ali, 22 in Burji, 16 in Segen city and 34 in Zone center). Using simple random sampling technique, the researcher took 75 numbers of employees (15 from Konso, Amharo and Zone city, 10 from Burji and Gidole. The remaining ten were from Ali and Segen city).
3.4 Data Analysis After collecting all necessary data from
respondents; they were examined for detection of 5 https://www.trademarkea.com/news/east-africa-has-a-lesson-for-sadc-in-formalising-cross-border-trade/
44
Globa
l Jo
urna
l of M
anag
emen
t an
d Bu
siness Resea
rch
Volum
e XVIII
Issue
III
Ver
sion
IYe
ar
20
18
© 2018 Global Journals1
The Effect of Contraband on Government Revenue: Case of Segen Area People’s Zone(
)B
errors and omissions through careful scrutiny of the completed questionnaires and put into a limited number of categories. The data collected through
questionnaire were quantifiable, so were organized systematically and analyzed statistically with statistical software (SPSS 20.0).
4. Data Analysis and Presentation
4.1 Demographic characteristics of the respondents
Table 1: Demographic Characteristics of Employees
Frequency Percent Valid Percent Cumulative Percent
Gender Male 48 64 64 64 Female 27 36 36 100 Total 75 100 100
Educational Level
Certificate 13 17.3 17.3 17.3 Diploma 29 38.7 38.7 56 BA 30 40 40 96 Masters 3 4 4 100 Total 75 100 100
Field of Study
Accounting 31 41.3 41.3 41.3 Management 27 36 36 77.3 Economics 14 18.7 18.7 96 Other 3 4 4 100 Total 75 100 100
Work Experience
less than 2 years 10 13.3 13.3 13.3 2-5 years 34 45.3 45.3 58.7 5-10 years 24 32 32 90.7 Above 10 years 7 9.3 9.3 100 Total 75 100 100
Source: Survey (2018)
Table 1 above presents the demographic characteristics of the revenue authority employees used to collect data for the study. As was seen from the table, the majority of the participants were male and also diploma and first-degree holders. This has its own effect on contraband controlling process. Holding the high number of employees that have a lower educational level or completed their education through distance process will affect the revenue of the zone negatively. Not only can this but from the table one can also conclude that the majority of the selected employees were accountant and management field of study. More over; the table reveals that the selected employees have a work experience of between two to ten years.
4.2 Factors Motivating Peoples to Engage in Contraband Contraband activities are illegal business
activities violating the law of the country or performed
against the rules and regulations that govern the export and import activities of the countries. Different methods are being designed to cut this illegal business, but instead of dimensioning it is raising and even attracting many young generations including those which are in formal business sectors. Individuals may be involved for the suck of their benefit or serve other on commission bases. The motivating factors are various among the participants like personal financial problems, increasing family responsibility or even lack of a formal job as a source of income and other. The following table presents the factors that motivate peoples to engage themselves in illegal business activities. Moreover; other joins it as a response to overly cumbersome, rigid, time-consuming and inefficient bureaucratic export/import procedures and regulations.
Table 2: Why are you Engaged in Contraband
Frequency Percent Valid Percent
Cumulative Percent
Valid
Lack of job 16 32.0 32.0 32.0 Lack of capital to start up my own business 3 6.0 6.0 38.0 Lack of formal source of income to meet my family responsibilities 21 42.0 42.0 80.0 Demand-supply gap in formal system 10 20.0 20.0 100.0
Total 50 100.0 100.0 Source: Survey (2018)
As shown in Table 2 above, people are being forced by lack of formal income to meet their family
responsibilities (42%). Rise in family number and expenses for consumption from time to time with
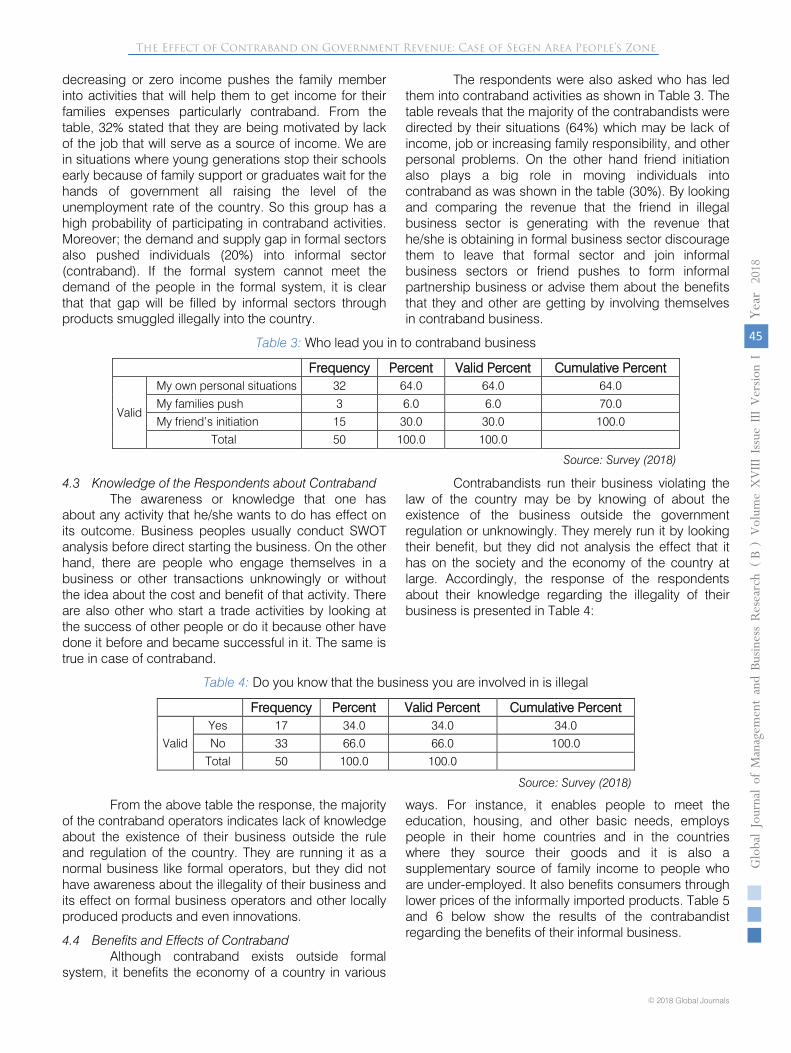
45
Globa
l Jo
urna
l of M
anag
emen
t an
d Bu
siness Resea
rch
Volum
e XVIII
Issue
III
Ver
sion
IYe
ar
20
18
© 2018 Global Journals
The Effect of Contraband on Government Revenue: Case of Segen Area People’s Zone
()
B
decreasing or zero income pushes the family member into activities that will help them to get income for their families expenses particularly contraband. From the table, 32% stated that they are being motivated by lack of the job that will serve as a source of income. We are in situations where young generations stop their schools early because of family support or graduates wait for the hands of government all raising the level of the unemployment rate of the country. So this group has a high probability of participating in contraband activities. Moreover; the demand and supply gap in formal sectors also pushed individuals (20%) into informal sector (contraband). If the formal system cannot meet the demand of the people in the formal system, it is clear that that gap will be filled by informal sectors through products smuggled illegally into the country.
The respondents were also asked who has led them into contraband activities as shown in Table 3. The table reveals that the majority of the contrabandists were directed by their situations (64%) which may be lack of income, job or increasing family responsibility, and other personal problems. On the other hand friend initiation also plays a big role in moving individuals into contraband as was shown in the table (30%). By looking and comparing the revenue that the friend in illegal business sector is generating with the revenue that he/she is obtaining in formal business sector discourage them to leave that formal sector and join informal business sectors or friend pushes to form informal partnership business or advise them about the benefits that they and other are getting by involving themselves in contraband business.
Table 3: Who lead you in to contraband business
Frequency Percent Valid Percent Cumulative Percent
Valid
My own personal situations 32 64.0 64.0 64.0
My families push 3 6.0 6.0 70.0 My friend’s initiation 15 30.0 30.0 100.0
Total 50 100.0 100.0
Source: Survey (2018)
4.3 Knowledge of the Respondents about Contraband The awareness or knowledge that one has
about any activity that he/she wants to do has effect on its outcome. Business peoples usually conduct SWOT analysis before direct starting the business. On the other hand, there are people who engage themselves in a business or other transactions unknowingly or without the idea about the cost and benefit of that activity. There are also other who start a trade activities by looking at the success of other people or do it because other have done it before and became successful in it. The same is true in case of contraband.
Contrabandists run their business violating the law of the country may be by knowing of about the existence of the business outside the government regulation or unknowingly. They merely run it by looking their benefit, but they did not analysis the effect that it has on the society and the economy of the country at large. Accordingly, the response of the respondents about their knowledge regarding the illegality of their business is presented in Table 4:
Table 4: Do you know that the business you are involved in is illegal
Frequency Percent Valid Percent Cumulative Percent
Valid Yes 17 34.0 34.0 34.0 No 33 66.0 66.0 100.0
Total 50 100.0 100.0
Source: Survey (2018)
From the above table the response, the majority of the contraband operators indicates lack of knowledge about the existence of their business outside the rule and regulation of the country. They are running it as a normal business like formal operators, but they did not have awareness about the illegality of their business and its effect on formal business operators and other locally produced products and even innovations.
4.4 Benefits and Effects of Contraband Although contraband exists outside formal
system, it benefits the economy of a country in various
ways. For instance, it enables people to meet the education, housing, and other basic needs, employs people in their home countries and in the countries where they source their goods and it is also a supplementary source of family income to people who are under-employed. It also benefits consumers through lower prices of the informally imported products. Table 5 and 6 below show the results of the contrabandist regarding the benefits of their informal business.
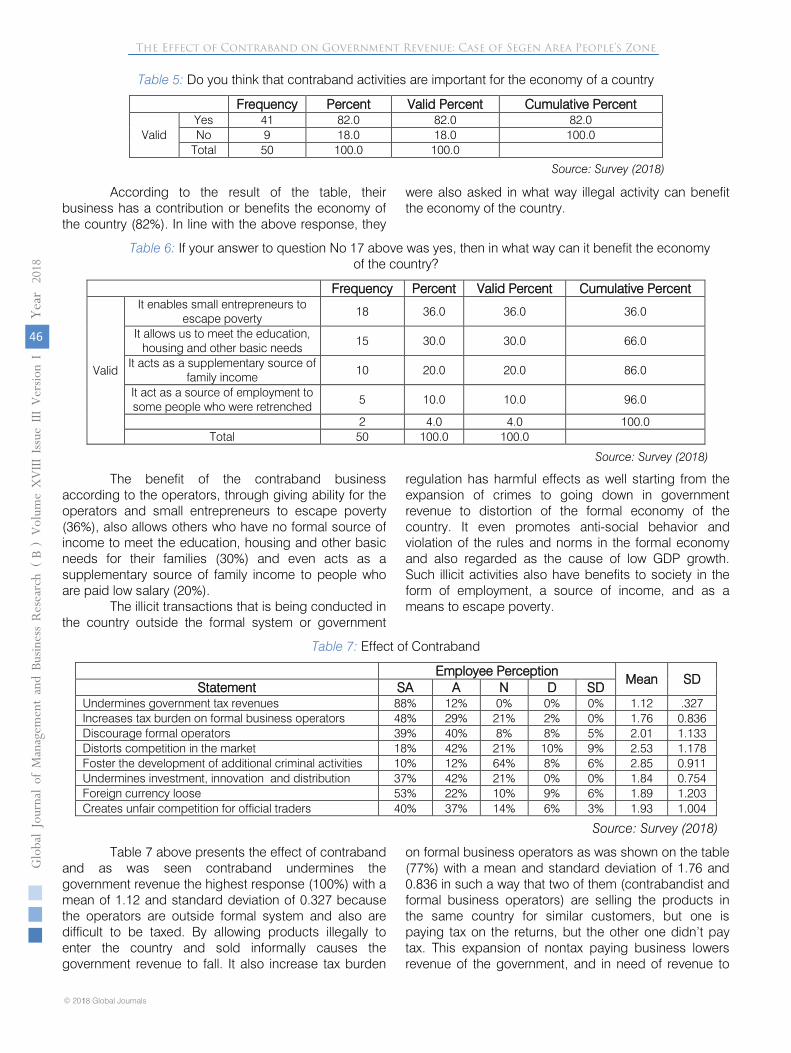
46
Globa
l Jo
urna
l of M
anag
emen
t an
d Bu
siness Resea
rch
Volum
e XVIII
Issue
III
Ver
sion
IYe
ar
20
18
© 2018 Global Journals1
The Effect of Contraband on Government Revenue: Case of Segen Area People’s Zone(
)B
Table 5: Do you think that contraband activities are important for the economy of a country
Frequency Percent Valid Percent Cumulative Percent
Valid Yes 41 82.0 82.0 82.0 No 9 18.0 18.0 100.0
Total 50 100.0 100.0
Source: Survey (2018)
According to the result of the table, their business has a contribution or benefits the economy of the country (82%). In line with the above response, they
were also asked in what way illegal activity can benefit the economy of the country.
Table 6: If your answer to question No 17 above was yes, then in what way can it benefit the economy of the country?
Frequency Percent Valid Percent Cumulative Percent
Valid
It enables small entrepreneurs to escape poverty
18 36.0 36.0 36.0
It allows us to meet the education, housing and other basic needs
15 30.0 30.0 66.0
It acts as a supplementary source of family income
10 20.0 20.0 86.0
It act as a source of employment to some people who were retrenched
5 10.0 10.0 96.0
2 4.0 4.0 100.0 Total 50 100.0 100.0
Source: Survey (2018)
The benefit of the contraband business according to the operators, through giving ability for the operators and small entrepreneurs to escape poverty (36%), also allows others who have no formal source of income to meet the education, housing and other basic needs for their families (30%) and even acts as a supplementary source of family income to people who are paid low salary (20%).
The illicit transactions that is being conducted in the country outside the formal system or government
regulation has harmful effects as well starting from the expansion of crimes to going down in government revenue to distortion of the formal economy of the country. It even promotes anti-social behavior and violation of the rules and norms in the formal economy and also regarded as the cause of low GDP growth. Such illicit activities also have benefits to society in the form of employment, a source of income, and as a means to escape poverty.
Table 7: Effect of Contraband
Employee Perception Mean SD
Statement SA A N D SD Undermines government tax revenues 88% 12% 0% 0% 0% 1.12 .327 Increases tax burden on formal business operators 48% 29% 21% 2% 0% 1.76 0.836 Discourage formal operators 39% 40% 8% 8% 5% 2.01 1.133 Distorts competition in the market 18% 42% 21% 10% 9% 2.53 1.178 Foster the development of additional criminal activities 10% 12% 64% 8% 6% 2.85 0.911 Undermines investment, innovation and distribution 37% 42% 21% 0% 0% 1.84 0.754 Foreign currency loose 53% 22% 10% 9% 6% 1.89 1.203 Creates unfair competition for official traders 40% 37% 14% 6% 3% 1.93 1.004
Source: Survey (2018)
Table 7 above presents the effect of contraband and as was seen contraband undermines the government revenue the highest response (100%) with a mean of 1.12 and standard deviation of 0.327 because the operators are outside formal system and also are difficult to be taxed. By allowing products illegally to enter the country and sold informally causes the government revenue to fall. It also increase tax burden
on formal business operators as was shown on the table (77%) with a mean and standard deviation of 1.76 and 0.836 in such a way that two of them (contrabandist and formal business operators) are selling the products in the same country for similar customers, but one is paying tax on the returns, but the other one didn’t pay tax. This expansion of nontax paying business lowers revenue of the government, and in need of revenue to
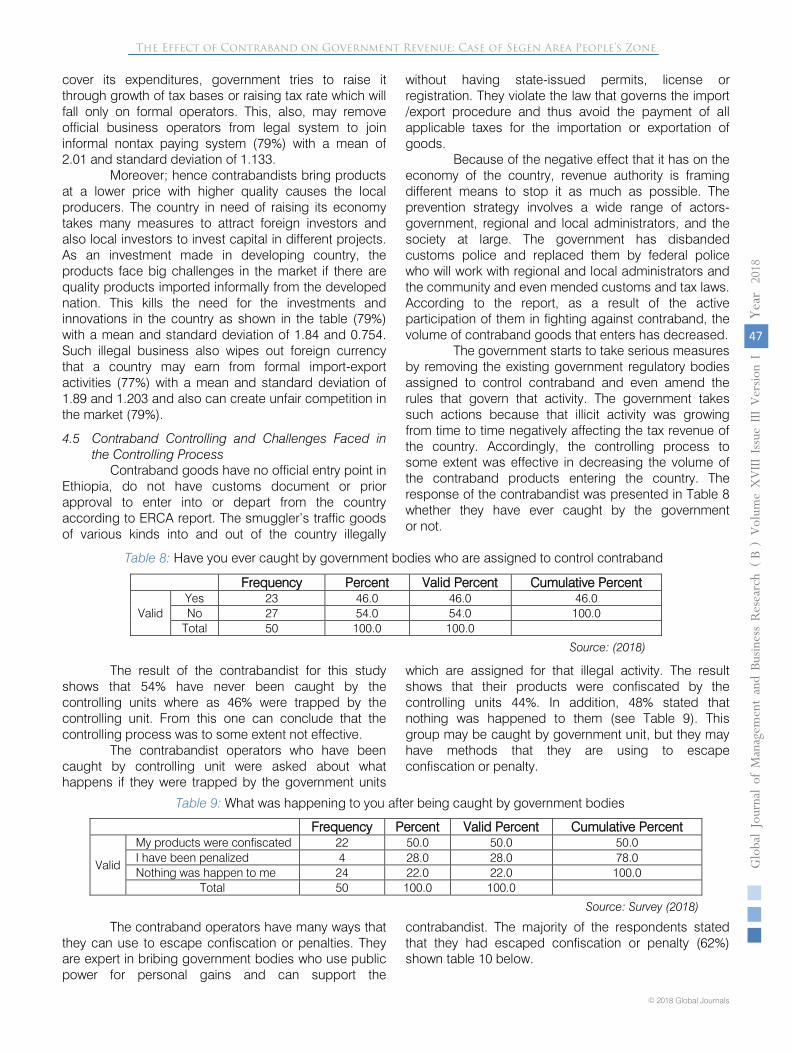
47
Globa
l Jo
urna
l of M
anag
emen
t an
d Bu
siness Resea
rch
Volum
e XVIII
Issue
III
Ver
sion
IYe
ar
20
18
© 2018 Global Journals
The Effect of Contraband on Government Revenue: Case of Segen Area People’s Zone
()
B
cover its expenditures, government tries to raise it through growth of tax bases or raising tax rate which will fall only on formal operators. This, also, may remove official business operators from legal system to join informal nontax paying system (79%) with a mean of 2.01 and standard deviation of 1.133.
Moreover; hence contrabandists bring products at a lower price with higher quality causes the local producers. The country in need of raising its economy takes many measures to attract foreign investors and also local investors to invest capital in different projects. As an investment made in developing country, the products face big challenges in the market if there are quality products imported informally from the developed nation. This kills the need for the investments and innovations in the country as shown in the table (79%) with a mean and standard deviation of 1.84 and 0.754. Such illegal business also wipes out foreign currency that a country may earn from formal import-export activities (77%) with a mean and standard deviation of 1.89 and 1.203 and also can create unfair competition in the market (79%).
4.5 Contraband Controlling and Challenges Faced in the Controlling Process
Contraband goods have no official entry point in Ethiopia, do not have customs document or prior approval to enter into or depart from the country according to ERCA report. The smuggler’s traffic goods of various kinds into and out of the country illegally
without having state-issued permits, license or registration. They violate the law that governs the import /export procedure and thus avoid the payment of all applicable taxes for the importation or exportation of goods.
Because of the negative effect that it has on the economy of the country, revenue authority is framing different means to stop it as much as possible. The prevention strategy involves a wide range of actors- government, regional and local administrators, and the society at large. The government has disbanded customs police and replaced them by federal police who will work with regional and local administrators and the community and even mended customs and tax laws. According to the report, as a result of the active participation of them in fighting against contraband, the volume of contraband goods that enters has decreased.
The government starts to take serious measures by removing the existing government regulatory bodies assigned to control contraband and even amend the rules that govern that activity. The government takes such actions because that illicit activity was growing from time to time negatively affecting the tax revenue of the country. Accordingly, the controlling process to some extent was effective in decreasing the volume of the contraband products entering the country. The response of the contrabandist was presented in Table 8 whether they have ever caught by the government or not.
Table 8: Have you ever caught by government bodies who are assigned to control contraband
Frequency Percent Valid Percent Cumulative Percent
Valid Yes 23 46.0 46.0 46.0 No 27 54.0 54.0 100.0
Total 50 100.0 100.0
Source: (2018)
The result of the contrabandist for this study shows that 54% have never been caught by the controlling units where as 46% were trapped by the controlling unit. From this one can conclude that the controlling process was to some extent not effective.
The contrabandist operators who have been caught by controlling unit were asked about what happens if they were trapped by the government units
which are assigned for that illegal activity. The result shows that their products were confiscated by the controlling units 44%. In addition, 48% stated that nothing was happened to them (see Table 9). This group may be caught by government unit, but they may have methods that they are using to escape confiscation or penalty.
Table 9: What was happening to you after being caught by government bodies
Frequency Percent Valid Percent Cumulative Percent
Valid
My products were confiscated 22 50.0 50.0 50.0
I have been penalized 4 28.0 28.0 78.0
Nothing was happen to me 24 22.0 22.0 100.0
Total 50 100.0 100.0
Source: Survey (2018)
The contraband operators have many ways that they can use to escape confiscation or penalties. They are expert in bribing government bodies who use public power for personal gains and can support the
contrabandist. The majority of the respondents stated that they had escaped confiscation or penalty (62%) shown table 10 below.
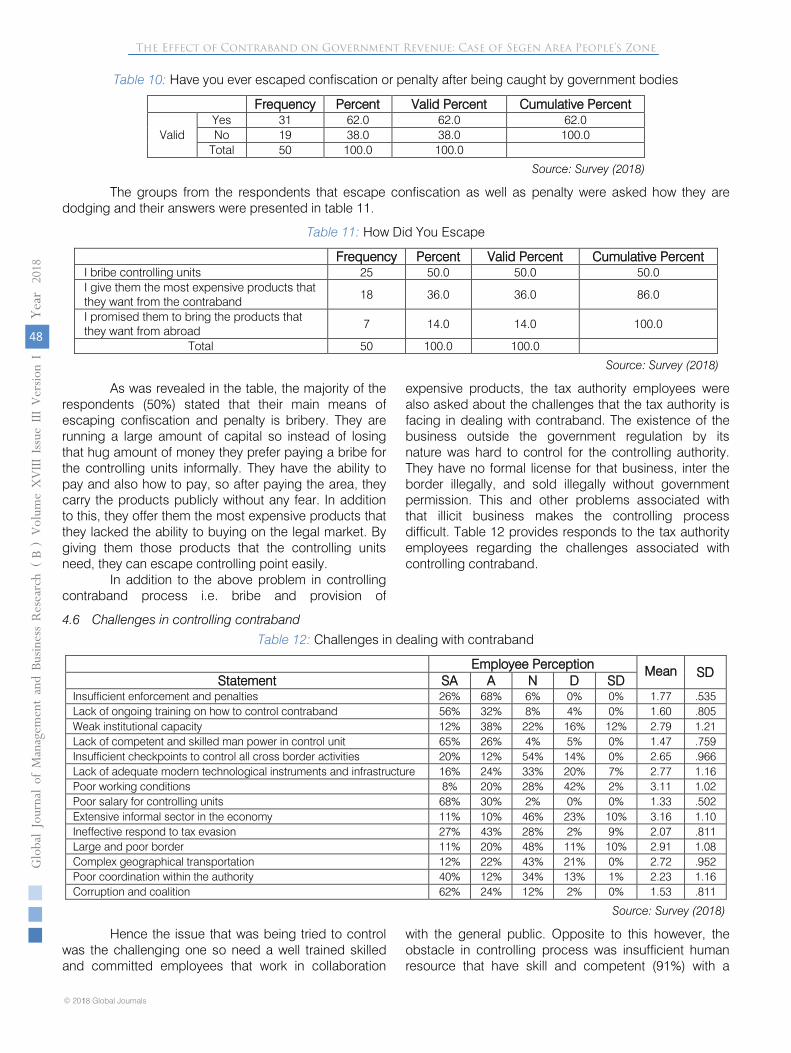
48
Globa
l Jo
urna
l of M
anag
emen
t an
d Bu
siness Resea
rch
Volum
e XVIII
Issue
III
Ver
sion
IYe
ar
20
18
© 2018 Global Journals1
The Effect of Contraband on Government Revenue: Case of Segen Area People’s Zone(
)B
Table 10: Have you ever escaped confiscation or penalty after being caught by government bodies
Frequency Percent Valid Percent Cumulative Percent
Valid Yes 31 62.0 62.0 62.0 No 19 38.0 38.0 100.0
Total 50 100.0 100.0
Source: Survey (2018)
The groups from the respondents that escape confiscation as well as penalty were asked how they are dodging and their answers were presented in table 11.
Table 11: How Did You Escape
Frequency Percent Valid Percent Cumulative Percent I bribe controlling units 25 50.0 50.0 50.0 I give them the most expensive products that they want from the contraband
18 36.0 36.0 86.0
I promised them to bring the products that they want from abroad
7 14.0 14.0 100.0
Total 50 100.0 100.0
Source: Survey (2018)
As was revealed in the table, the majority of the respondents (50%) stated that their main means of escaping confiscation and penalty is bribery. They are running a large amount of capital so instead of losing that hug amount of money they prefer paying a bribe for the controlling units informally. They have the ability to pay and also how to pay, so after paying the area, they carry the products publicly without any fear. In addition to this, they offer them the most expensive products that they lacked the ability to buying on the legal market. By giving them those products that the controlling units need, they can escape controlling point easily.
In addition to the above problem in controlling contraband process i.e. bribe and provision of
expensive products, the tax authority employees were also asked about the challenges that the tax authority is facing in dealing with contraband. The existence of the business outside the government regulation by its nature was hard to control for the controlling authority. They have no formal license for that business, inter the border illegally, and sold illegally without government permission. This and other problems associated with that illicit business makes the controlling process difficult. Table 12 provides responds to the tax authority employees regarding the challenges associated with controlling contraband.
4.6 Challenges in controlling contraband
Table 12: Challenges in dealing with contraband
Employee Perception Mean SD Statement SA A N D SD
Insufficient enforcement and penalties 26% 68% 6% 0% 0% 1.77 .535 Lack of ongoing training on how to control contraband 56% 32% 8% 4% 0% 1.60 .805 Weak institutional capacity 12% 38% 22% 16% 12% 2.79 1.21 Lack of competent and skilled man power in control unit 65% 26% 4% 5% 0% 1.47 .759 Insufficient checkpoints to control all cross border activities 20% 12% 54% 14% 0% 2.65 .966 Lack of adequate modern technological instruments and infrastructure 16% 24% 33% 20% 7% 2.77 1.16 Poor working conditions 8% 20% 28% 42% 2% 3.11 1.02 Poor salary for controlling units 68% 30% 2% 0% 0% 1.33 .502 Extensive informal sector in the economy 11% 10% 46% 23% 10% 3.16 1.10 Ineffective respond to tax evasion 27% 43% 28% 2% 9% 2.07 .811 Large and poor border 11% 20% 48% 11% 10% 2.91 1.08 Complex geographical transportation 12% 22% 43% 21% 0% 2.72 .952 Poor coordination within the authority 40% 12% 34% 13% 1% 2.23 1.16 Corruption and coalition 62% 24% 12% 2% 0% 1.53 .811
Source: Survey (2018)
Hence the issue that was being tried to control was the challenging one so need a well trained skilled and committed employees that work in collaboration
with the general public. Opposite to this however, the obstacle in controlling process was insufficient human resource that have skill and competent (91%) with a
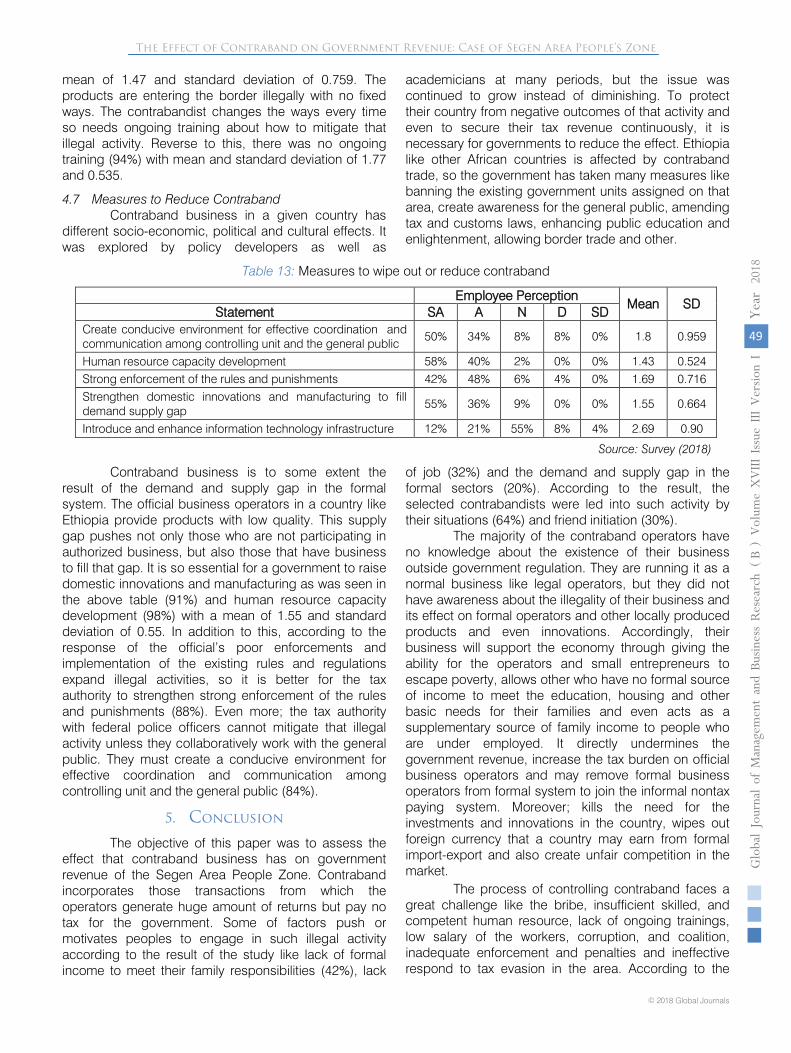
49
Globa
l Jo
urna
l of M
anag
emen
t an
d Bu
siness Resea
rch
Volum
e XVIII
Issue
III
Ver
sion
IYe
ar20
18
© 2018 Global Journals
The Effect of Contraband on Government Revenue: Case of Segen Area People’s Zone
()
B
mean of 1.47 and standard deviation of 0.759. The products are entering the border illegally with no fixed ways. The contrabandist changes the ways every time so needs ongoing training about how to mitigate that illegal activity. Reverse to this, there was no ongoing training (94%) with mean and standard deviation of 1.77 and 0.535.
4.7 Measures to Reduce Contraband Contraband business in a given country has
different socio-economic, political and cultural effects. It was explored by policy developers as well as
academicians at many periods, but the issue was continued to grow instead of diminishing. To protect their country from negative outcomes of that activity and even to secure their tax revenue continuously, it is necessary for governments to reduce the effect. Ethiopia like other African countries is affected by contraband trade, so the government has taken many measures like banning the existing government units assigned on that area, create awareness for the general public, amending tax and customs laws, enhancing public education and enlightenment, allowing border trade and other.
Table 13: Measures to wipe out or reduce contraband
Employee Perception Mean SD
Statement SA A N D SD Create conducive environment for effective coordination and communication among controlling unit and the general public
50% 34% 8% 8% 0% 1.8 0.959
Human resource capacity development 58% 40% 2% 0% 0% 1.43 0.524 Strong enforcement of the rules and punishments 42% 48% 6% 4% 0% 1.69 0.716 Strengthen domestic innovations and manufacturing to fill demand supply gap
55% 36% 9% 0% 0% 1.55 0.664
Introduce and enhance information technology infrastructure 12% 21% 55% 8% 4% 2.69 0.90
Source: Survey (2018)
Contraband business is to some extent the result of the demand and supply gap in the formal system. The official business operators in a country like Ethiopia provide products with low quality. This supply gap pushes not only those who are not participating in authorized business, but also those that have business to fill that gap. It is so essential for a government to raise domestic innovations and manufacturing as was seen in the above table (91%) and human resource capacity development (98%) with a mean of 1.55 and standard deviation of 0.55. In addition to this, according to the response of the official’s poor enforcements and implementation of the existing rules and regulations expand illegal activities, so it is better for the tax authority to strengthen strong enforcement of the rules and punishments (88%). Even more; the tax authority with federal police officers cannot mitigate that illegal activity unless they collaboratively work with the general public. They must create a conducive environment for effective coordination and communication among controlling unit and the general public (84%).
5. Conclusion
The objective of this paper was to assess the effect that contraband business has on government revenue of the Segen Area People Zone. Contraband incorporates those transactions from which the operators generate huge amount of returns but pay no tax for the government. Some of factors push or motivates peoples to engage in such illegal activity according to the result of the study like lack of formal income to meet their family responsibilities (42%), lack
of job (32%) and the demand and supply gap in the formal sectors (20%). According to the result, the selected contrabandists were led into such activity by their situations (64%) and friend initiation (30%).
The majority of the contraband operators have no knowledge about the existence of their business outside government regulation. They are running it as a normal business like legal operators, but they did not have awareness about the illegality of their business and its effect on formal operators and other locally produced products and even innovations. Accordingly, their business will support the economy through giving the ability for the operators and small entrepreneurs to escape poverty, allows other who have no formal source of income to meet the education, housing and other basic needs for their families and even acts as a supplementary source of family income to people who are under employed. It directly undermines the government revenue, increase the tax burden on official business operators and may remove formal business operators from formal system to join the informal nontax paying system. Moreover; kills the need for the investments and innovations in the country, wipes out foreign currency that a country may earn from formal import-export and also create unfair competition in the market.
The process of controlling contraband faces a great challenge like the bribe, insufficient skilled, and competent human resource, lack of ongoing trainings, low salary of the workers, corruption, and coalition, inadequate enforcement and penalties and ineffective respond to tax evasion in the area. According to the
50
Globa
l Jo
urna
l of M
anag
emen
t an
d Bu
siness Resea
rch
Volum
e XVIII
Issue
III
Ver
sion
IYe
ar
20
18
© 2018 Global Journals1
The Effect of Contraband on Government Revenue: Case of Segen Area People’s Zone(
)B
result of the study, it is so better for a government to raise domestic innovations and manufacturing and human resource capacity development. In addition to this, it should also strengthen strong enforcement of the rules and punishments and even create the conducive environment for effective coordination and communication among controlling unit and the general public.
References Références Referencias
1. Bakhtiyari, M., & Salarzaei, A. H. (2016): Causes and Factors Affecting the Crime of Tobacco and Goods Smuggling in Iran. International Journal of Law 2(2), 52–57.
2. Bhagwati, J. (1964): On the under invoicing of imports. Bulletin of the Oxford University Institute of Statistics, 26, 389-397.
3. Buehn, A. and M. R. Farzanegan. (2011) Smuggling around the World: Evidence from a Structural Equation Model. Applied Economics, 44(23), 3047-3064.
4. Burke, T. (2013): The Effect of Excise Taxes on Cigarette Smuggling: An Instrumental Variable Approach (CMC Senior Theses). Retrieved from http://scholarship.claremont. edu/cmc_theses/764 www.erca.gov.et/indexphp/customs/others/101 contraband.
5. Deardorff, A. and Stolper, W. (1990): Effects of smuggling under African conditions: a factual, institutional and analytic discussion, Weltwirtschaftliches Archiv, 126(1), 116-41.
6. Dominguez, J. (1975): Smuggling, Foreign Policy, No. 20, pp. 87-96+161-164.
7. Fisman, R., & Shang-Jin Wei (2004): Tax Rates and Tax Evasion: Evidence from “Missing Imports” in China. Journal of Political Economy, 112(2), 471–496.
8. Global Agenda Council on Illicit Trade, Davos Annual Meeting, January 2012: World Economic Forum (WEF).
9. Johnson, S., Kaufmann, D. and Shleifer, A. (1997): The unofficial economy in transition, Brookings Papers on Economic Activity, 2, 159-221
10. Loayza, N.V. (1996) The economics of the informal sector: A simple model and some empirical evidence from Latin America, Carnegie-Rochester Conference Series on Public Policy, 45, 129-162.
11. Mishra, P., Subramanian, A., & Topalova, P. (2008): Policies, Enforcement, and Customs Evasion: Evidence from India. Journal of Public Economics, 92(10–11), 1907–1925.
12. Norton, D. (1988): On the economic theory of smuggling, Economica, 55(217), 107-118.
13. The Global Illicit Trade in Tobacco: A Threat to National Security, available at: http://www.state.gov/ documents/organization/250513.pdf
14. Eukeria Mashiri and Favourate Y Sebele-Mpofu, Illicit trade, economic growth and the role of Customs: a literature review, International Network of Customs Universities, Volume 9, Number 2.
Global Journals
Guidelines Handbook
2018
www.GlobalJournals.org
Fellows
Global Journals Incorporate (USA) is accredited by Open Association of Research Society (OARS), U.S.A and in turn, awards “FARSBA” title to individuals. The 'FARSBA' title is accorded to a selected professional after the approval of the Editor-in-
Chief/Editorial Board Members/Dean.
FARSBA accrediting is an honor. It authenticates your research activities. After recognition as FARSBA, you can add 'FARSBA' title with your name as you use this recognition as additional suffix to your status.
This will definitely enhance and add more value and repute to your name. You may use it on your professional Counseling Materials such as CV, Resume, and Visiting Card etc.
The following benefits can be availed by you only for next three years from the date of certification:
FARSBA designated members are entitled to avail a 40% discount while publishing their research papers (of a single author) with Global Journals Incorporation (USA), if the same is accepted by Editorial Board/Peer Reviewers. If you are a main author or co-author in case of multiple authors, you will be entitled to avail discount of 10%.
Once FARSBA title is accorded, the Fellow is authorized to organize a
symposium/seminar/conference on behalf of Global Journal Incorporation (USA).The Fellow can also participate in conference/seminar/symposium organized by another institution as representative of Global Journal. In both the cases, it is mandatory for him to discuss with us and obtain our consent.
You may join as member of the Editorial Board of Global Journals Incorporation (USA) after successful completion of three years as Fellow and as Peer Reviewer. In addition, it is also desirable that you should organize seminar/symposium/conference at least once.
We shall provide you intimation regarding launching of e-version of journal of your stream time to time.This may be utilized in your library for the enrichment of knowledge of your students as well as it can also be helpful for the concerned faculty members.
FELLOW OF ASSOCIATION OF RESEARCH SOCIETY IN BUSINESS (FARSB)
The “FARSB” is a dignified title which is accorded to a person’s name viz. Dr. John E. Hall, Ph.D., FARSBA or William Walldroff, M.S., FARSBA.
© Copyright by Global Journals | Guidelines Handbook
I

As FARSBA, you will be given a renowned, secure and free professional email address with 100 GB of space e.g. [email protected]. This will include Webmail, Spam Assassin, Email Forwarders,Auto-Responders, Email Delivery Route tracing, etc.
The FARSBA will be eligible for a free application of standardization of their researches. Standardization of research will be subject to acceptability within stipulated norms as the next step after publishing in a journal. We shall depute a team of specialized research professionals who will render their services for elevating your researches to next higher level, which is worldwide open standardization.
The FARSBA member can apply for grading and certification of standards of their educational and Institutional Degrees to Open Association of Research, Society U.S.A.Once you are designated as FARSBA, you may send us a scanned copy of all of your credentials. OARS will verify, grade and certify them. This will be based on your academic records, quality of research papers published by you, and some more criteria. After certification of all your credentials by OARS, they will be published on your Fellow Profile link on website https://associationofresearch.org which will be helpful to upgrade the dignity.
The FARSBA members can avail the benefits of free research podcasting in Global Research Radio with their research documents. After publishing the work, (including published elsewhere worldwide with proper authorization) you can upload your research paper with your recorded voice or you can utilize chargeable services of our professional RJs to record your paper in their voice on request.
The FARSBA member also entitled to get the benefits of free research podcasting of
their research documents through video clips. We can also streamline your conference videos and display your slides/ online slides and online research video clips at reasonable charges, on request.
The FARSBA can go through standards of OARS. You can also play vital role if you have
any suggestions so that proper amendment can take place to improve the same for the benefit of entire research community.
IIII
© Copyright by Global Journals | Guidelines Handbook
The ' MARSBA ' title is accorded to a selected professional after the approval of the
Editor-in-Chief / Editorial Board Members/Dean.
The “MARSBA” is a dignified ornament which is accorded to a person’s name viz. Dr.
John E. Hall, Ph.D., MARSBA or William Walldroff, M.S., MARSBA.
MARSB accrediting is an honor. It authenticates your research activities. After becoming MARSBA, you
can add 'MARSBA' title with your name as you use this recognition as additional suffix to your status.
This will definitely enhance and add more value and repute to your name. You may use it on your
professional Counseling Materials such as CV, Resume, Visiting Card and Name Plate etc.
The following benefitscan be availed by you only for next three years from the date of certification.
MARSBA designated members are entitled to avail a 25% discount while publishing
their research papers (of a single author) in Global Journals Inc., if the same is
accepted by our Editorial Board and Peer Reviewers. If you are a main author or co-
author of a group of authors, you will get discount of 10%.
As MARSBA, you will be given a renowned, secure and free professional email address
with 30 GB of space e.g. [email protected]. This will include Webmail, Spam
Assassin, Email Forwarders,Auto-Responders, Email Delivery Route tracing, etc.
MEMBER OF ASSOCIATION OF RESEARCH SOCIETY IN BUSINESS (MARSBA)
The FARSBA is eligible to earn from sales proceeds of his/her researches/reference/review Books or literature, while publishing with Global Journals. The FARSBA can decide whether he/she would like to publish his/her research in a closed manner. In this case, whenever readers purchase that individual research paper for reading, maximum 60% of its profit earned as royalty by Global Journals, will be credited to his/her bank account. The entire entitled amount will be credited to
his/her bank account exceeding limit of minimum fixed balance. There is no minimum time limit for collection. The FARSC member can decide its price and we can help in making the right decision.
The FARSBA member is eligible to join as a paid peer reviewer at Global Journals Incorporation (USA) and can get remuneration of 15% of author fees, taken from the author of a respective paper. After reviewing 5 or more papers you can request to transfer the amount to your bank account.
III
© Copyright by Global Journals | Guidelines Handbook

We shall provide you intimation regarding launching of e-version of journal of your
stream time to time.This may be utilized in your library for the enrichment of
knowledge of your students as well as it can also be helpful for the concerned faculty
members.
Once you are designated as MARSBA, you may send us a scanned copy of all of your
credentials. OARS will verify, grade and certify them. This will be based on your
academic records, quality of research papers published by you, and some more
criteria.
It is mandatory to read all terms and conditions carefully.
The MARSBA member can apply for approval, grading and certification of standards of
their educational and Institutional Degrees to Open Association of Research, Society
U.S.A.
© Copyright by Global Journals
IV
| Guidelines Handbook
Auxiliary Memberships
Institutional Fellow of Open Association of Research Society (USA)-OARS (USA)Global Journals Incorporation (USA) is accredited by Open Association of Research Society, U.S.A (OARS) and in turn, affiliates research institutions as “Institutional Fellow of Open Association of Research Society” (IFOARS).The “FARSC” is a dignified title which is accorded to a person’s name viz. Dr. John E. Hall, Ph.D., FARSC or William Walldroff, M.S., FARSC.The IFOARS institution is entitled to form a Board comprised of one Chairperson and three to five board members preferably from different streams. The Board will be recognized as “Institutional Board of Open Association of Research Society”-(IBOARS).
The Institute will be entitled to following benefits:
The IBOARS can initially review research papers of their institute and recommend them to publish with respective journal of Global Journals. It can also review the papers of other institutions after obtaining our consent. The second review will be done by peer reviewer of Global Journals Incorporation (USA) The Board is at liberty to appoint a peer reviewer with the approval of chairperson after consulting us. The author fees of such paper may be waived off up to 40%.
The Global Journals Incorporation (USA) at its discretion can also refer double blind peer reviewed paper at their end to the board for the verification and to get recommendation for final stage of acceptance of publication.
The IBOARS can organize symposium/seminar/conference in their country on behalf of Global Journals Incorporation (USA)-OARS (USA). The terms and conditions can be discussed separately.
The Board can also play vital role by exploring and giving valuable suggestions regarding the Standards of “Open Association of Research Society, U.S.A (OARS)” so that proper amendment can take place for the benefit of entire research community. We shall provide details of particular standard only on receipt of request from the Board.
The board members can also join us as Individual Fellow with 40% discount on total fees applicable to Individual Fellow. They will be entitled to avail all the benefits as declared. Please visit Individual Fellow-sub menu of GlobalJournals.org to have more relevant details.
V
© Copyright by Global Journals | Guidelines Handbook

We shall provide you intimation regarding launching of e-version of journal of your stream time to time. This may be utilized in your library for the enrichment of knowledge of your students as well as it can also be helpful for the concerned faculty members.
After nomination of your institution as “Institutional Fellow” and constantly functioning successfully for one year, we can consider giving recognition to your institute to function as Regional/Zonal office on our behalf.The board can also take up the additional allied activities for betterment after our consultation.
The following entitlements are applicable to individual Fellows:
Open Association of Research Society, U.S.A (OARS) By-laws states that an individual Fellow may use the designations as applicable, or the corresponding initials. The Credentials of individual Fellow and Associate designations signify that the individual has gained knowledge of the fundamental concepts. One is magnanimous and proficient in an expertise course covering the professional code of conduct, and follows recognized standards of practice.
Open Association of Research Society (US)/ Global Journals Incorporation (USA), as described in Corporate Statements, are educational, research publishing and professional membership organizations. Achieving our individual Fellow or Associate status is based mainly on meeting stated educational research requirements.
Disbursement of 40% Royalty earned through Global Journals : Researcher = 50%, Peer Reviewer = 37.50%, Institution = 12.50% E.g. Out of 40%, the 20% benefit should be passed on to researcher, 15 % benefit towards remuneration should be given to a reviewer and remaining 5% is to be retained by the institution.
We shall provide print version of 12 issues of any three journals [as per your requirement] out of our 38 journals worth $ 2376 USD.
© Copyright by Global Journals
Other:
The individual Fellow and Associate designations accredited by Open Association of Research Society (US) credentials signify guarantees following achievements:
The professional accredited with Fellow honor, is entitled to various benefits viz. name, fame, honor, regular flow of income, secured bright future, social status etc.
VI
| Guidelines Handbook
Note :
″
″
In addition to above, if one is single author, then entitled to 40% discount on publishing research paper and can get 10%discount if one is co-author or main author among group of authors.
The Fellow can organize symposium/seminar/conference on behalf of Global Journals Incorporation (USA) and he/she can also attend the same organized by other institutes on behalf of Global Journals.
The Fellow can become member of Editorial Board Member after completing 3yrs. The Fellow can earn 60% of sales proceeds from the sale of reference/review
books/literature/publishing of research paper. Fellow can also join as paid peer reviewer and earn 15% remuneration of author charges and
can also get an opportunity to join as member of the Editorial Board of Global Journals Incorporation (USA)
• This individual has learned the basic methods of applying those concepts and techniques to common challenging situations. This individual has further demonstrated an in–depth understanding of the application of suitable techniques to a particular area of research practice.
In future, if the board feels the necessity to change any board member, the same can be done with the consent of the chairperson along with anyone board member without our approval.
In case, the chairperson needs to be replaced then consent of 2/3rd board members are required and they are also required to jointly pass the resolution copy of which should be sent to us. In such case, it will be compulsory to obtain our approval before replacement.
In case of “Difference of Opinion [if any]” among the Board members, our decision will be final and binding to everyone.
VII
© Copyright by Global Journals | Guidelines Handbook
We accept the manuscript submissions in any standard (generic) format.
We typeset manuscripts using advanced typesetting tools like Adobe In Design, CorelDraw, TeXnicCenter, and TeXStudio. We usually recommend authors submit their research using any standard format they are comfortable with, and let Global Journals do the rest.
Authors should submit their complete paper/article, including text illustrations, graphics, conclusions, artwork, and tables. Authors who are not able to submit manuscript using the form above can email the manuscript department at [email protected] or get in touch with [email protected] if they wish to send the abstract before submission.
Before and during Submission
Authors must ensure the information provided during the submission of a paper is authentic. Please go through the following checklist before submitting:
1. Authors must go through the complete author guideline and understand and agree to Global Journals' ethics and code of conduct, along with author responsibilities.
2. Authors must accept the privacy policy, terms, and conditions of Global Journals. 3. Ensure corresponding author’s email address and postal address are accurate and reachable. 4. Manuscript to be submitted must include keywords, an abstract, a paper title, co-author(s') names and details (email
address, name, phone number, and institution), figures and illustrations in vector format including appropriate captions, tables, including titles and footnotes, a conclusion, results, acknowledgments and references.
5. Authors should submit paper in a ZIP archive if any supplementary files are required along with the paper. 6. Proper permissions must be acquired for the use of any copyrighted material. 7. Manuscript submitted must not have been submitted or published elsewhere and all authors must be aware of the
submission.
Declaration of Conflicts of Interest
It is required for authors to declare all financial, institutional, and personal relationships with other individuals and organizations that could influence (bias) their research.
Policy on Plagiarism
Plagiarism is not acceptable in Global Journals submissions at all.
Plagiarized content will not be considered for publication. We reserve the right to inform authors’ institutions about plagiarism detected either before or after publication. If plagiarism is identified, we will follow COPE guidelines:
Authors are solely responsible for all the plagiarism that is found. The author must not fabricate, falsify or plagiarize existing research data. The following, if copied, will be considered plagiarism:
• Words (language) • Ideas • Findings • Writings • Diagrams • Graphs • Illustrations • Lectures
© Copyright by Global Journals
Preferred Author Guidelines
VIII
| Guidelines Handbook
Alternatively, you can download our basic template from https://globaljournals.org/Template.zip
• Printed material • Graphic representations • Computer programs • Electronic material • Any other original work
Authorship Policies
Global Journals follows the definition of authorship set up by the Open Association of Research Society, USA. According to its guidelines, authorship criteria must be based on:
1. Substantial contributions to the conception and acquisition of data, analysis, and interpretation of findings. 2. Drafting the paper and revising it critically regarding important academic content. 3. Final approval of the version of the paper to be published.
Changes in Authorship
The corresponding author should mention the name and complete details of all co-authors during submission and in manuscript. We support addition, rearrangement, manipulation, and deletions in authors list till the early view publication of the journal. We expect that corresponding author will notify all co-authors of submission. We follow COPE guidelines for changes in authorship.
Copyright
During submission of the manuscript, the author is confirming an exclusive license agreement with Global Journals which gives Global Journals the authority to reproduce, reuse, and republish authors' research. We also believe in flexible copyright terms where copyright may remain with authors/employers/institutions as well. Contact your editor after acceptance to choose your copyright policy. You may follow this form for copyright transfers.
Appealing Decisions
Unless specified in the notification, the Editorial Board’s decision on publication of the paper is final and cannot be appealed before making the major change in the manuscript.
Acknowledgments
Contributors to the research other than authors credited should be mentioned in Acknowledgments. The source of funding for the research can be included. Suppliers of resources may be mentioned along with their addresses.
Declaration of funding sources
Global Journals is in partnership with various universities, laboratories, and other institutions worldwide in the research domain. Authors are requested to disclose their source of funding during every stage of their research, such as making analysis, performing laboratory operations, computing data, and using institutional resources, from writing an article to its submission. This will also help authors to get reimbursements by requesting an open access publication letter from Global Journals and submitting to the respective funding source.
Preparing your Manuscript
Authors can submit papers and articles in an acceptable file format: MS Word (doc, docx), LaTeX (.tex, .zip or .rar including all of your files), Adobe PDF (.pdf), rich text format (.rtf), simple text document (.txt), Open Document Text (.odt), and Apple Pages (.pages). Our professional layout editors will format the entire paper according to our official guidelines. This is one of the highlights of publishing with Global Journals—authors should not be concerned about the formatting of their paper. Global Journals accepts articles and manuscripts in every major language, be it Spanish, Chinese, Japanese, Portuguese, Russian, French, German, Dutch, Italian, Greek, or any other national language, but the title, subtitle, and abstract should be in English. This will facilitate indexing and the pre-peer review process.
The following is the official style and template developed for publication of a research paper. Authors are not required to follow this style during the submission of the paper. It is just for reference purposes.
© Copyright by Global Journals | Guidelines Handbook
IX
Manuscript Style Instruction (Optional)
• Microsoft Word Document Setting Instructions. • Font type of all text should be Swis721 Lt BT. • Page size: 8.27" x 11'”, left margin: 0.65, right margin: 0.65, bottom margin: 0.75. • Paper title should be in one column of font size 24. • Author name in font size of 11 in one column. • Abstract: font size 9 with the word “Abstract” in bold italics. • Main text: font size 10 with two justified columns. • Two columns with equal column width of 3.38 and spacing of 0.2. • First character must be three lines drop-capped. • The paragraph before spacing of 1 pt and after of 0 pt. • Line spacing of 1 pt. • Large images must be in one column. • The names of first main headings (Heading 1) must be in Roman font, capital letters, and font size of 10. • The names of second main headings (Heading 2) must not include numbers and must be in italics with a font size of 10.
Structure and Format of Manuscript
The recommended size of an original research paper is under 15,000 words and review papers under 7,000 words. Research articles should be less than 10,000 words. Research papers are usually longer than review papers. Review papers are reports of significant research (typically less than 7,000 words, including tables, figures, and references)
A research paper must include:
a) A title which should be relevant to the theme of the paper. b) A summary, known as an abstract (less than 150 words), containing the major results and conclusions. c) Up to 10 keywords that precisely identify the paper’s subject, purpose, and focus. d) An introduction, giving fundamental background objectives. e) Resources and techniques with sufficient complete experimental details (wherever possible by reference) to permit
repetition, sources of information must be given, and numerical methods must be specified by reference. f) Results which should be presented concisely by well-designed tables and figures. g) Suitable statistical data should also be given. h) All data must have been gathered with attention to numerical detail in the planning stage.
Design has been recognized to be essential to experiments for a considerable time, and the editor has decided that any paper that appears not to have adequate numerical treatments of the data will be returned unrefereed.
i) Discussion should cover implications and consequences and not just recapitulate the results; conclusions should also be summarized.
j) There should be brief acknowledgments. k) There ought to be references in the conventional format. Global Journals recommends APA format.
Authors should carefully consider the preparation of papers to ensure that they communicate effectively. Papers are much more likely to be accepted if they are carefully designed and laid out, contain few or no errors, are summarizing, and follow instructions. They will also be published with much fewer delays than those that require much technical and editorial correction.
The Editorial Board reserves the right to make literary corrections and suggestions to improve brevity.
© Copyright by Global Journals
X
| Guidelines Handbook

Format Structure
It is necessary that authors take care in submitting a manuscript that is written in simple language and adheres to published guidelines.
All manuscripts submitted to Global Journals should include:
Title
The title page must carry an informative title that reflects the content, a running title (less than 45 characters together with spaces), names of the authors and co-authors, and the place(s) where the work was carried out.
Author details
The full postal address of any related author(s) must be specified.
Abstract
The abstract is the foundation of the research paper. It should be clear and concise and must contain the objective of the paper and inferences drawn. It is advised to not include big mathematical equations or complicated jargon.
Many researchers searching for information online will use search engines such as Google, Yahoo or others. By optimizing your paper for search engines, you will amplify the chance of someone finding it. In turn, this will make it more likely to be viewed and cited in further works. Global Journals has compiled these guidelines to facilitate you to maximize the web-friendliness of the most public part of your paper.
Keywords
A major lynchpin of research work for the writing of research papers is the keyword search, which one will employ to find both library and internet resources. Up to eleven keywords or very brief phrases have to be given to help data retrieval, mining, and indexing.
One must be persistent and creative in using keywords. An effective keyword search requires a strategy: planning of a list of possible keywords and phrases to try.
Choice of the main keywords is the first tool of writing a research paper. Research paper writing is an art. Keyword search should be as strategic as possible.
One should start brainstorming lists of potential keywords before even beginning searching. Think about the most important concepts related to research work. Ask, “What words would a source have to include to be truly valuable in a research paper?” Then consider synonyms for the important words.
It may take the discovery of only one important paper to steer in the right keyword direction because, in most databases, the keywords under which a research paper is abstracted are listed with the paper.
Numerical Methods
Numerical methods used should be transparent and, where appropriate, supported by references.
Abbreviations
Authors must list all the abbreviations used in the paper at the end of the paper or in a separate table before using them.
Formulas and equations
Authors are advised to submit any mathematical equation using either MathJax, KaTeX, or LaTeX, or in a very high-quality image. Tables, Figures, and Figure Legends
Tables: Tables should be cautiously designed, uncrowned, and include only essential data. Each must have an Arabic number, e.g., Table 4, a self-explanatory caption, and be on a separate sheet. Authors must submit tables in an editable format and not as images. References to these tables (if any) must be mentioned accurately.
© Copyright by Global Journals | Guidelines Handbook
XI
Figures
Figures are supposed to be submitted as separate files. Always include a citation in the text for each figure using Arabic numbers, e.g., Fig. 4. Artwork must be submitted online in vector electronic form or by emailing it.
Preparation of Eletronic Figures for Publication
Although low-quality images are sufficient for review purposes, print publication requires high-quality images to prevent the final product being blurred or fuzzy. Submit (possibly by e-mail) EPS (line art) or TIFF (halftone/ photographs) files only. MS PowerPoint and Word Graphics are unsuitable for printed pictures. Avoid using pixel-oriented software. Scans (TIFF only) should have a resolution of at least 350 dpi (halftone) or 700 to 1100 dpi (line drawings). Please give the data for figures in black and white or submit a Color Work Agreement form. EPS files must be saved with fonts embedded (and with a TIFF preview, if possible).
For scanned images, the scanning resolution at final image size ought to be as follows to ensure good reproduction: line art: >650 dpi; halftones (including gel photographs): >350 dpi; figures containing both halftone and line images: >650 dpi.
Color charges: Authors are advised to pay the full cost for the reproduction of their color artwork. Hence, please note that if there is color artwork in your manuscript when it is accepted for publication, we would require you to complete and return a Color Work Agreement form before your paper can be published. Also, you can email your editor to remove the color fee after acceptance of the paper.
Tips for writing a good quality Management Research Paper
Techniques for writing a good quality management and business research paper:
1. Choosing the topic: In most cases, the topic is selected by the interests of the author, but it can also be suggested by the guides. You can have several topics, and then judge which you are most comfortable with. This may be done by asking several questions of yourself, like "Will I be able to carry out a search in this area? Will I find all necessary resources to accomplish the search? Will I be able to find all information in this field area?" If the answer to this type of question is "yes," then you ought to choose that topic. In most cases, you may have to conduct surveys and visit several places. Also, you might have to do a lot of work to find all the rises and falls of the various data on that subject. Sometimes, detailed information plays a vital role, instead of short information. Evaluators are human: The first thing to remember is that evaluators are also human beings. They are not only meant for rejecting a paper. They are here to evaluate your paper. So present your best aspect.
2. Think like evaluators: If you are in confusion or getting demotivated because your paper may not be accepted by the evaluators, then think, and try to evaluate your paper like an evaluator. Try to understand what an evaluator wants in your research paper, and you will automatically have your answer. Make blueprints of paper: The outline is the plan or framework that will help you to arrange your thoughts. It will make your paper logical. But remember that all points of your outline must be related to the topic you have chosen.
3. Ask your guides: If you are having any difficulty with your research, then do not hesitate to share your difficulty with your guide (if you have one). They will surely help you out and resolve your doubts. If you can't clarify what exactly you require for your work, then ask your supervisor to help you with an alternative. He or she might also provide you with a list of essential readings.
4. Use of computer is recommended: As you are doing research in the field of management and business then this point is quite obvious. Use right software: Always use good quality software packages. If you are not capable of judging good software, then you can lose the quality of your paper unknowingly. There are various programs available to help you which you can get through the internet.
5. Use the internet for help: An excellent start for your paper is using Google. It is a wondrous search engine, where you can have your doubts resolved. You may also read some answers for the frequent question of how to write your research paper or find a model research paper. You can download books from the internet. If you have all the required books, place importance on reading, selecting, and analyzing the specified information. Then sketch out your research paper. Use big pictures: You may use encyclopedias like Wikipedia to get pictures with the best resolution. At Global Journals, you should strictly follow here.
© Copyright by Global Journals
XII
| Guidelines Handbook

6. Bookmarks are useful: When you read any book or magazine, you generally use bookmarks, right? It is a good habit which helps to not lose your continuity. You should always use bookmarks while searching on the internet also, which will make your search easier.
7. Revise what you wrote: When you write anything, always read it, summarize it, and then finalize it.
8. Make every effort: Make every effort to mention what you are going to write in your paper. That means always have a good start. Try to mention everything in the introduction—what is the need for a particular research paper. Polish your work with good writing skills and always give an evaluator what he wants. Make backups: When you are going to do any important thing like making a research paper, you should always have backup copies of it either on your computer or on paper. This protects you from losing any portion of your important data.
9. Produce good diagrams of your own: Always try to include good charts or diagrams in your paper to improve quality. Using several unnecessary diagrams will degrade the quality of your paper by creating a hodgepodge. So always try to include diagrams which were made by you to improve the readability of your paper. Use of direct quotes: When you do research relevant to literature, history, or current affairs, then use of quotes becomes essential, but if the study is relevant to science, use of quotes is not preferable.
10. Use proper verb tense: Use proper verb tenses in your paper. Use past tense to present those events that have happened. Use present tense to indicate events that are going on. Use future tense to indicate events that will happen in the future. Use of wrong tenses will confuse the evaluator. Avoid sentences that are incomplete.
11. Pick a good study spot: Always try to pick a spot for your research which is quiet. Not every spot is good for studying.
12. Know what you know: Always try to know what you know by making objectives, otherwise you will be confused and unable to achieve your target.
13. Use good grammar: Always use good grammar and words that will have a positive impact on the evaluator; use of good vocabulary does not mean using tough words which the evaluator has to find in a dictionary. Do not fragment sentences. Eliminate one-word sentences. Do not ever use a big word when a smaller one would suffice. Verbs have to be in agreement with their subjects. In a research paper, do not start sentences with conjunctions or finish them with prepositions. When writing formally, it is advisable to never split an infinitive because someone will (wrongly) complain. Avoid clichés like a disease. Always shun irritating alliteration. Use language which is simple and straightforward. Put together a neat summary.
14. Arrangement of information: Each section of the main body should start with an opening sentence, and there should be a changeover at the end of the section. Give only valid and powerful arguments for your topic. You may also maintain your arguments with records.
15. Never start at the last minute: Always allow enough time for research work. Leaving everything to the last minute will degrade your paper and spoil your work.
16. Multitasking in research is not good: Doing several things at the same time is a bad habit in the case of research activity. Research is an area where everything has a particular time slot. Divide your research work into parts, and do a particular part in a particular time slot.
17. Never copy others' work: Never copy others' work and give it your name because if the evaluator has seen it anywhere, you will be in trouble. Take proper rest and food: No matter how many hours you spend on your research activity, if you are not taking care of your health, then all your efforts will have been in vain. For quality research, take proper rest and food.
18. Go to seminars: Attend seminars if the topic is relevant to your research area. Utilize all your resources.
19. Refresh your mind after intervals: Try to give your mind a rest by listening to soft music or sleeping in intervals. This will also improve your memory. Acquire colleagues: Always try to acquire colleagues. No matter how sharp you are, if you acquire colleagues, they can give you ideas which will be helpful to your research.
20. Think technically: Always think technically. If anything happens, search for its reasons, benefits, and demerits. Think and then print: When you go to print your paper, check that tables are not split, headings are not detached from their descriptions, and page sequence is maintained.
© Copyright by Global Journals | Guidelines Handbook
XIII
Irrelevant and inappropriate material is superfluous. Foreign terminology and phrases are not apropos. One should never take a broad view. Analogy is like feathers on a snake. Use words properly, regardless of how others use them. Remove quotations. Puns are for kids, not grunt readers. Never oversimplify: When adding material to your research paper, never go for oversimplification; this will definitely irritate the evaluator. Be specific. Never use rhythmic redundancies. Contractions shouldn't be used in a research paper. Comparisons are as terrible as clichés. Give up ampersands, abbreviations, and so on. Remove commas that are not necessary. Parenthetical words should be between brackets or commas. Understatement is always the best way to put forward earth-shaking thoughts. Give a detailed literary review.
22. Report concluded results: Use concluded results. From raw data, filter the results, and then conclude your studies based on measurements and observations taken. An appropriate number of decimal places should be used. Parenthetical remarks are prohibited here. Proofread carefully at the final stage. At the end, give an outline to your arguments. Spot perspectives of further study of the subject. Justify your conclusion at the bottom sufficiently, which will probably include examples.
23. Upon conclusion: Once you have concluded your research, the next most important step is to present your findings. Presentation is extremely important as it is the definite medium though which your research is going to be in print for the rest of the crowd. Care should be taken to categorize your thoughts well and present them in a logical and neat manner. A good quality research paper format is essential because it serves to highlight your research paper and bring to light all necessary aspects of your research.
Informal Guidelines of Research Paper Writing
Key points to remember:
• Submit all work in its final form. • Write your paper in the form which is presented in the guidelines using the template. • Please note the criteria peer reviewers will use for grading the final paper.
Final points:
One purpose of organizing a research paper is to let people interpret your efforts selectively. The journal requires the following sections, submitted in the order listed, with each section starting on a new page:
The introduction: This will be compiled from reference matter and reflect the design processes or outline of basis that directed you to make a study. As you carry out the process of study, the method and process section will be constructed like that. The results segment will show related statistics in nearly sequential order and direct reviewers to similar intellectual paths throughout the data that you gathered to carry out your study.
The discussion section:
This will provide understanding of the data and projections as to the implications of the results. The use of good quality references throughout the paper will give the effort trustworthiness by representing an alertness to prior workings.
Writing a research paper is not an easy job, no matter how trouble-free the actual research or concept. Practice, excellent preparation, and controlled record-keeping are the only means to make straightforward progression.
General style:
Specific editorial column necessities for compliance of a manuscript will always take over from directions in these general guidelines.
To make a paper clear: Adhere to recommended page limits. Mistakes to avoid: •
Insertion of a title at the foot of a page with subsequent text on the next page. •
Separating a table, chart, or figure—confine each to a single page.
•
Submitting a manuscript with pages out of sequence. •
In every section of your document, use standard writing style, including articles ("a" and "the").
•
Keep paying attention to the topic of the paper.
© Copyright by Global Journals
XIV
| Guidelines Handbook
21. Adding unnecessary information: Do not add unnecessary information like "I have used MS Excel to draw graphs."
• Use paragraphs to split each significant point (excluding the abstract). • Align the primary line of each section. • Present your points in sound order. • Use present tense to report well-accepted matters. • Use past tense to describe specific results. • Do not use familiar wording; don't address the reviewer directly. Don't use slang or superlatives. • Avoid use of extra pictures—include only those figures essential to presenting results.
Title page:
Choose a revealing title. It should be short and include the name(s) and address(es) of all authors. It should not have acronyms or abbreviations or exceed two printed lines.
Abstract: This summary should be two hundred words or less. It should clearly and briefly explain the key findings reported in the manuscript and must have precise statistics. It should not have acronyms or abbreviations. It should be logical in itself. Do not cite references at this point.
An abstract is a brief, distinct paragraph summary of finished work or work in development. In a minute or less, a reviewer can be taught the foundation behind the study, common approaches to the problem, relevant results, and significant conclusions or new questions.
Write your summary when your paper is completed because how can you write the summary of anything which is not yet written? Wealth of terminology is very essential in abstract. Use comprehensive sentences, and do not sacrifice readability for brevity; you can maintain it succinctly by phrasing sentences so that they provide more than a lone rationale. The author can at this moment go straight to shortening the outcome. Sum up the study with the subsequent elements in any summary. Try to limit the initial two items to no more than one line each.
Reason for writing the article—theory, overall issue, purpose.
• Fundamental goal. • To-the-point depiction of the research. • Consequences, including definite statistics—if the consequences are quantitative in nature, account for this; results of
any numerical analysis should be reported. Significant conclusions or questions that emerge from the research.
Approach:
o Single section and succinct. o An outline of the job done is always written in past tense. o Concentrate on shortening results—limit background information to a verdict or two. o Exact spelling, clarity of sentences and phrases, and appropriate reporting of quantities (proper units, important
statistics) are just as significant in an abstract as they are anywhere else.
Introduction:
The introduction should "introduce" the manuscript. The reviewer should be presented with sufficient background information to be capable of comprehending and calculating the purpose of your study without having to refer to other works. The basis for the study should be offered. Give the most important references, but avoid making a comprehensive appraisal of the topic. Describe the problem visibly. If the problem is not acknowledged in a logical, reasonable way, the reviewer will give no attention to your results. Speak in common terms about techniques used to explain the problem, if needed, but do not present any particulars about the protocols here.
The following approach can create a valuable beginning:
o Explain the value (significance) of the study. o Defend the model—why did you employ this particular system or method? What is its compensation? Remark upon
its appropriateness from an abstract point of view as well as pointing out sensible reasons for using it. o Present a justification. State your particular theory(-ies) or aim(s), and describe the logic that led you to choose
them. o Briefly explain the study's tentative purpose and how it meets the declared objectives.
© Copyright by Global Journals | Guidelines Handbook
XV

Approach:
Use past tense except for when referring to recognized facts. After all, the manuscript will be submitted after the entire job is done. Sort out your thoughts; manufacture one key point for every section. If you make the four points listed above, you will need at least four paragraphs. Present surrounding information only when it is necessary to support a situation. The reviewer does not desire to read everything you know about a topic. Shape the theory specifically—do not take a broad view.
As always, give awareness to spelling, simplicity, and correctness of sentences and phrases.
Procedures (methods and materials):
This part is supposed to be the easiest to carve if you have good skills. A soundly written procedures segment allows a capable scientist to replicate your results. Present precise information about your supplies. The suppliers and clarity of reagents can be helpful bits of information. Present methods in sequential order, but linked methodologies can be grouped as a segment. Be concise when relating the protocols. Attempt to give the least amount of information that would permit another capable scientist to replicate your outcome, but be cautious that vital information is integrated. The use of subheadings is suggested and ought to be synchronized with the results section.
When a technique is used that has been well-described in another section, mention the specific item describing the way, but draw the basic principle while stating the situation. The purpose is to show all particular resources and broad procedures so that another person may use some or all of the methods in one more study or referee the scientific value of your work. It is not to be a step-by-step report of the whole thing you did, nor is a methods section a
set of orders.
Materials:
Materials may be reported in part of a section or else they may be recognized along with your measures.
Methods:
o
Report the method and not the particulars of each process that engaged the same methodology.
o
Describe the method entirely. o
To be succinct, present methods under headings dedicated to specific dealings or groups of measures.
o
Simplify—detail how procedures were completed, not how they were performed on a particular day. o
If well-known procedures were used, account for the procedure by name, possibly with a reference, and that's all.
Approach:
It is embarrassing to use vigorous voice when documenting methods without using first person, which would focus the reviewer's interest on the researcher rather than the job. As a result, when writing up the methods, most authors use third person passive voice.
Use standard style in this and every other part of the paper—avoid familiar lists, and use full sentences.
What to keep away from:
o
Resources and methods are not a set of information.
o
Skip all descriptive information and surroundings—save it for the argument. o
Leave out information that is immaterial to a third party.
Results:
The principle of a results segment is to present and demonstrate your conclusion. Create this part as entirely objective details of the outcome, and save all understanding for the discussion.
The page length of this segment is set by the sum and types of data to be reported. Use statistics and tables, if suitable, to present consequences most efficiently.
You must clearly differentiate material which would usually be incorporated in a study editorial from any unprocessed data or additional appendix matter that would not be available. In fact, such matters should not be submitted at all except if requested by the instructor.
© Copyright by Global Journals
XVI
| Guidelines Handbook
Content:
o Sum up your conclusions in text and demonstrate them, if suitable, with figures and tables. o In the manuscript, explain each of your consequences, and point the reader to remarks that are most appropriate. o Present a background, such as by describing the question that was addressed by creation of an exacting study. o Explain results of control experiments and give remarks that are not accessible in a prescribed figure or table, if
appropriate. o Examine your data, then prepare the analyzed (transformed) data in the form of a figure (graph), table, or
manuscript.
What to stay away from:
o Do not discuss or infer your outcome, report surrounding information, or try to explain anything. o Do not include raw data or intermediate calculations in a research manuscript. o Do not present similar data more than once. o A manuscript should complement any figures or tables, not duplicate information. o Never confuse figures with tables—there is a difference.
Approach:
As always, use past tense when you submit your results, and put the whole thing in a reasonable order.
Put figures and tables, appropriately numbered, in order at the end of the report.
If you desire, you may place your figures and tables properly within the text of your results section.
Figures and tables:
If you put figures and tables at the end of some details, make certain that they are visibly distinguished from any attached appendix materials, such as raw facts. Whatever the position, each table must be titled, numbered one after the other, and include a heading. All figures and tables must be divided from the text.
Discussion:
The discussion is expected to be the trickiest segment to write. A lot of papers submitted to the journal are discarded based on problems with the discussion. There is no rule for how long an argument should be.
Position your understanding of the outcome visibly to lead the reviewer through your conclusions, and then finish the paper with a summing up of the implications of the study. The purpose here is to offer an understanding of your results and support all of your conclusions, using facts from your research and generally accepted information, if suitable. The implication of results should be fully described.
Infer your data in the conversation in suitable depth. This means that when you clarify an observable fact, you must explain mechanisms that may account for the observation. If your results vary from your prospect, make clear why that may have happened. If your results agree, then explain the theory that the proof supported. It is never suitable to just state that the data approved the prospect, and let it drop at that. Make a decision as to whether each premise is supported or discarded or if you cannot make a conclusion with assurance. Do not just dismiss a study or part of a study as "uncertain."
Research papers are not acknowledged if the work is imperfect. Draw what conclusions you can based upon the results that you have, and take care of the study as a finished work.
o You may propose future guidelines, such as how an experiment might be personalized to accomplish a new idea. o Give details of all of your remarks as much as possible, focusing on mechanisms. o Make a decision as to whether the tentative design sufficiently addressed the theory and whether or not it was
correctly restricted. Try to present substitute explanations if they are sensible alternatives. o One piece of research will not counter an overall question, so maintain the large picture in mind. Where do you go
next? The best studies unlock new avenues of study. What questions remain? o Recommendations for detailed papers will offer supplementary suggestions.
© Copyright by Global Journals | Guidelines Handbook
XVII

Approach:
When you refer to information, differentiate data generated by your own studies from other available information. Present work done by specific persons (including you) in past tense.
Describe generally acknowledged facts and main beliefs in present tense.
The Administration Rules
Administration Rules to Be Strictly Followed before Submitting Your Research Paper to Global Journals Inc.
Please read the following rules and regulations carefully before submitting your research paper to Global Journals Inc. to avoid rejection.
Segment draft and final research paper: You have to strictly follow the template of a research paper, failing which your
paper may get rejected. You are expected to write each part of the paper wholly on your own. The peer reviewers need to identify your own perspective of the concepts in your own terms. Please do not extract straight from any other source, and do not rephrase someone else's analysis. Do not allow anyone else to proofread your manuscript.
Written material: You may discuss this with your guides and key sources. Do not copy anyone
else's paper, even if this is
only imitation, otherwise it will be rejected on the grounds of plagiarism, which is illegal. Various methods to avoid plagiarism are strictly applied by us to every paper, and, if found guilty, you may be blacklisted, which could affect your career adversely. To guard yourself and others from possible illegal use, please do not permit anyone to use or even read your paper and file.
© Copyright by Global Journals
XVIII
| Guidelines Handbook
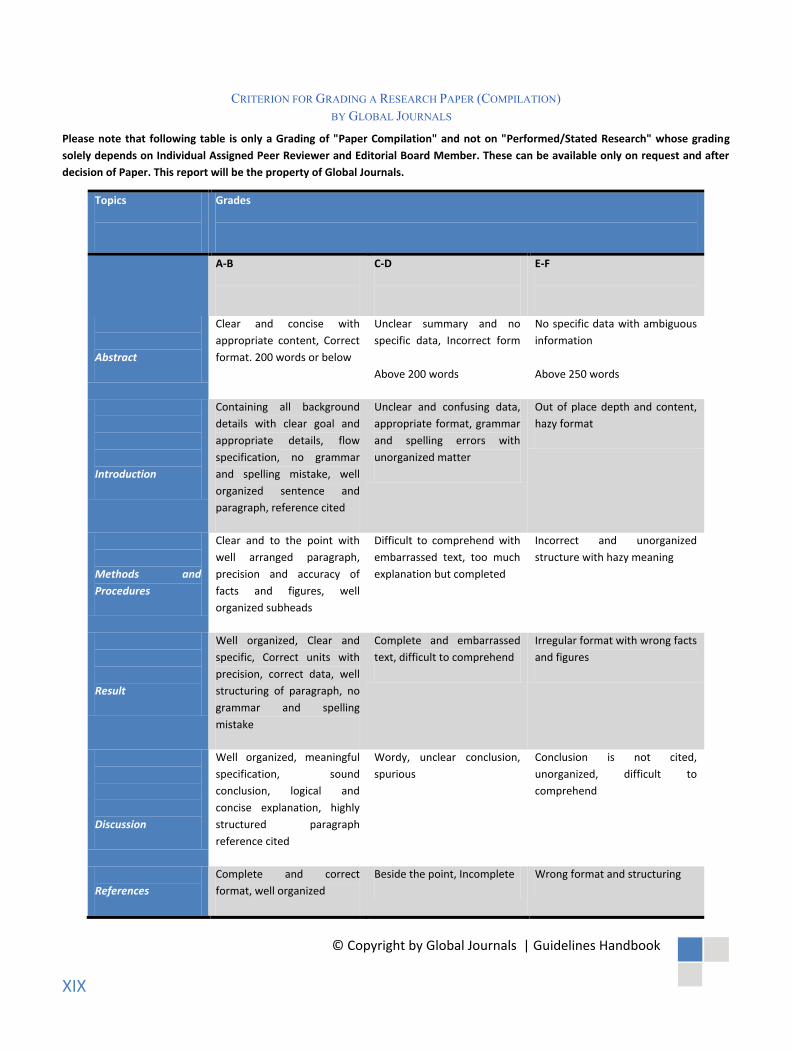
CRITERION FOR GRADING A RESEARCH PAPER (COMPILATION)BY GLOBAL JOURNALS
Please note that following table is only a Grading of "Paper Compilation" and not on "Performed/Stated Research" whose grading
solely depends on Individual Assigned Peer Reviewer and Editorial Board Member. These can be available only on request and after
decision of Paper. This report will be the property of Global Journals.
Topics Grades
A-B C-D E-F
Abstract
Clear and concise with
appropriate content, Correct
format. 200 words or below
Unclear summary and no
specific data, Incorrect form
Above 200 words
No specific data with ambiguous
information
Above 250 words
Introduction
Containing all background
details with clear goal and
appropriate details, flow
specification, no grammar
and spelling mistake, well
organized sentence and
paragraph, reference cited
Unclear and confusing data,
appropriate format, grammar
and spelling errors with
unorganized matter
Out of place depth and content,
hazy format
Methods and
Procedures
Clear and to the point with
well arranged paragraph,
precision and accuracy of
facts and figures, well
organized subheads
Difficult to comprehend with
embarrassed text, too much
explanation but completed
Incorrect and unorganized
structure with hazy meaning
Result
Well organized, Clear and
specific, Correct units with
precision, correct data, well
structuring of paragraph, no
grammar and spelling
mistake
Complete and embarrassed
text, difficult to comprehend
Irregular format with wrong facts
and figures
Discussion
Well organized, meaningful
specification, sound
conclusion, logical and
concise explanation, highly
structured paragraph
reference cited
Wordy, unclear conclusion,
spurious
Conclusion is not cited,
unorganized, difficult to
comprehend
References
Complete and correct
format, well organized
Beside the point, Incomplete Wrong format and structuring
XIX
© Copyright by Global Journals | Guidelines Handbook
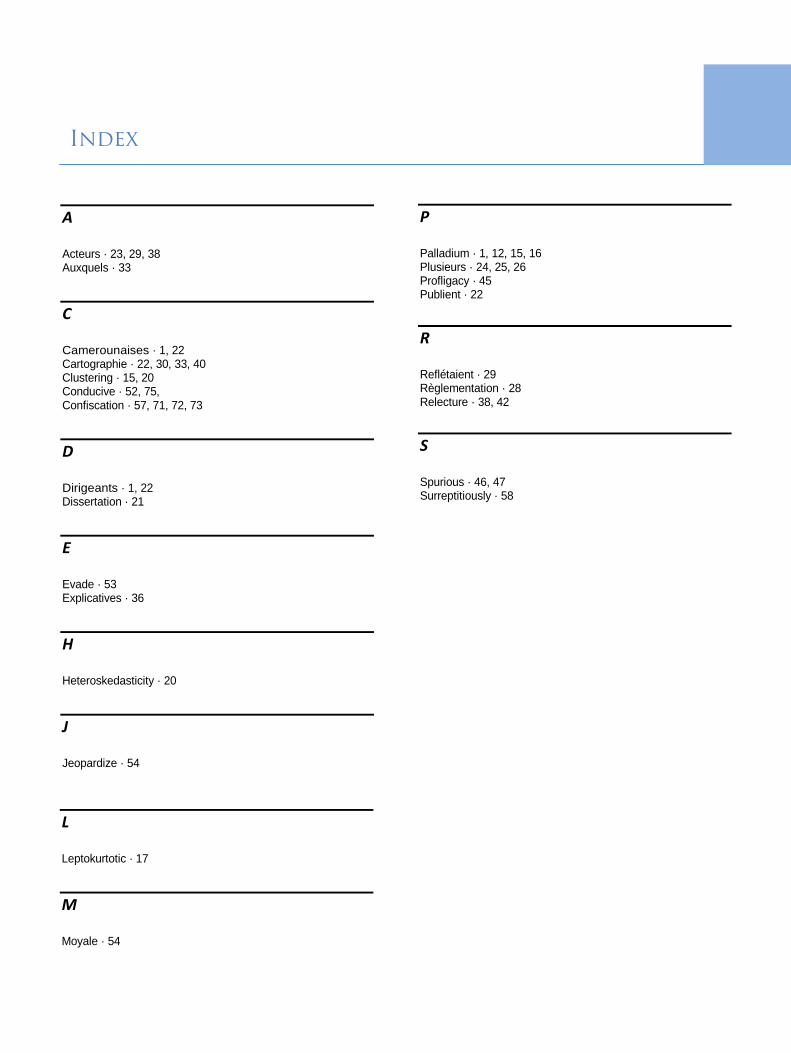
Index
A
Acteurs · 23, 29, 38Auxquels · 33
C
Camerounaises · 1, 22Cartographie · 22, 30, 33, 40Clustering · 15, 20Conducive · 52, 75, Confiscation · 57, 71, 72, 73
D
Dirigeants · 1, 22Dissertation · 21
E
Evade · 53Explicatives · 36
H
Heteroskedasticity · 20
J
Jeopardize · 54
L
Leptokurtotic · 17
M
Moyale · 54
P
Palladium · 1, 12, 15, 16Plusieurs · 24, 25, 26Profligacy · 45Publient · 22
R
Reflétaient · 29Règlementation · 28Relecture · 38, 42
S
Spurious · 46, 47Surreptitiously · 58

© Global Journals