
global - integration - World Bank Open Knowledge Repository
370
Editors Bernard Hoekman • Beata Smarzynska Javorcik Global i ntegration & T echnology T ransfer 36126 Public Disclosure Authorized Public Disclosure Authorized Public Disclosure Authorized ublic Disclosure Authorized
-
Upload
khangminh22 -
Category
Documents
-
view
5 -
download
0
Transcript of global - integration - World Bank Open Knowledge Repository

EditorsBernard Hoekman • Beata Smarzynska Javorcik
Globalintegration & Technology
Transfer
36126
Pub
lic D
iscl
osur
e A
utho
rized
Pub
lic D
iscl
osur
e A
utho
rized
Pub
lic D
iscl
osur
e A
utho
rized
Pub
lic D
iscl
osur
e A
utho
rized


Global Integrationand Technology
Transfer


Global Integrationand Technology
Transfer
Edited by Bernard Hoekman and Beata Smarzynska Javorcik
A copublication of Palgrave Macmillanand the World Bank

©2006 The International Bank for Reconstruction and Development / The World Bank1818 H Street NWWashington, DC 20433Telephone: 202-473-1000Internet: www.worldbank.orgE-mail: [email protected]
All rights reserved.
1 2 3 4 09 08 07 06
A copublication of The World Bank and Palgrave Macmillan.
Palgrave MacmillanHoundmills, Basingstoke, Hampshire RG21 6XS and175 Fifth Avenue, New York, NY 10010Companies and representatives throughout the world
Palgrave Macmillan is the global academic imprint of the Palgrave Macmillan division of St. Martin’sPress, LLC and of Palgrave Macmillan Ltd.
Macmillan® is a registered trademark in the United States, United Kingdom and other countries. Palgrave®is a registered trademark in the European Union and other countries.
This volume is a product of the staff of the International Bank for Reconstruction and Development/The WorldBank. The findings, interpretations, and conclusions expressed in this volume do not necessarily reflect the viewsof the Executive Directors of The World Bank or the governments they represent.
The World Bank does not guarantee the accuracy of the data included in this work. The boundaries, colors,denominations, and other information shown on any map in this work do not imply any judgement on the part ofThe World Bank concerning the legal status of any territory or the endorsement or acceptance of such boundaries.
Rights and Permissions
The material in this publication is copyrighted. Copying and/or transmitting portions or all of this work with-out permission may be a violation of applicable law. The International Bank for Reconstruction and Develop-ment/The World Bank encourages dissemination of its work and will normally grant permission to reproduceportions of the work promptly.
For permission to photocopy or reprint any part of this work, please send a request with complete infor-mation to the Copyright Clearance Center Inc., 222 Rosewood Drive, Danvers, MA 01923, USA; telephone:978-750-8400; fax: 978-750-4470; Internet: www.copyright.com.
All other queries on rights and licenses, including subsidiary rights, should be addressed to the Officeof the Publisher, The World Bank, 1818 H Street NW, Washington, DC 20433, USA; fax: 202-522-2422;e-mail: [email protected].
ISBN-10: 0-8213-6125-2 (softcover)ISBN-10: 0-8213-6371-9 (hardcover)ISBN-13: 978-0-8213-6125-2 (softcover)ISBN-13: 978-0-8213-6371-3 (hardcover)eISBN-10: 0-8213-6126-0 eISBN-13: 978-0-8213-6126-9DOI: 10.1596/978-0-8213-6125-2
Library of Congress Cataloging-in-Publication Data
Global integration and technology transfer/edited by Bernard Hoekman, Beata Smarzynska Javorcik.p. cm. – (Trade and development series)
Includes bibliographical references and index.ISBN-13: 978-0-8213-6125-2ISBN-10: 0-8213-6125-2
1. International economic integration. 2. International trade. 3. Investments, Foreign—Developing countries. 4. Technology transfer—Economic aspects—Developing countries. 5. Indus-trial productivity—Effect of technological innovations on—Developing countries. I. Hoekman,Bernard M., 1959- II. Javorcik, Beata K. Smarzynska. III. Series.
HF1418.5.G5715 2005337.1—dc22
2005043451Cover photos: Royalty Free/Fotosearch; Royalty Free/Getty.Cover designer: Tomoko Hirata.

Foreword xi
Acknowledgments xv
Contributors xvii
Abbreviations and Acronyms xix
1 Lessons from Empirical Research on International Technology Diffusion through Trade and Foreign Direct Investment 1Bernard Hoekman and Beata Smarzynska Javorcik
Part I LITERATURE SURVEYS
2 Econometric versus Case Study Approaches to Technology Transfer 29Howard Pack
3 Foreign Direct Investment, Linkages, and Technology Spillovers 51Kamal Saggi
4 Plant- and Firm-Level Evidence on “New” Trade Theories 67James R. Tybout
Part II FOREIGN TRADE AND PRODUCTIVITY
5 On the Quantity and Quality of Knowledge:The Impact of Openness and Foreign R&Don North-North and North-South TechnologySpillovers 99Maurice Schiff and Yanling Wang
Contents
v

vi Contents
6 The Knowledge Content of Machines: North-South Trade and Technology Diffusion 113Giorgio Barba Navaretti, Maurice Schiff,and Isidro Soloaga
7 Exports and Economic Performance: Evidence from a Panel of Chinese Enterprises 139Aart Kraay
Part III FOREIGN DIRECT INVESTMENT, TECHNOLOGY TRANSFER, AND PRODUCTIVITY
8 Foreign Investment and Productivity Growth in Czech Enterprises 161Simeon Djankov and Bernard Hoekman
9 Technological Leadership and the Choice of Entry Mode by Foreign Investors 179Beata Smarzynska Javorcik
10 Does Foreign Direct Investment Increase the Productivity of Domestic Firms? In Search of Spillovers through Backward Linkages 207Beata Smarzynska Javorcik
11 Product Quality, Productive Efficiency, and International Technology Diffusion: Evidence from Plant-Level Panel Data 241Aart Kraay, Isidro Soloaga, and James R. Tybout
12 Market Discipline and Corporate Efficiency: Evidence from Bulgaria 281Simeon Djankov and Bernard Hoekman
13 Innovation in Mexico: NAFTA Is Not Enough 305Daniel Lederman and William F. Maloney
Index 339
Figures1.1 Perceived Effects of FDI in the Czech Republic and Latvia 116.1 Average Unit Values in Select Countries, 1989–97 1216D.1 Persistency of the Technology Gap with One-Year Lag 1336D.2 Persistency of the Technology Gap with Two-Year Lag 1346D.3 Persistency of the Technology Gap with Seven-Year Lag 1348.1 Labor Productivity of Czech Firms with and without
Foreign Partners, 1991 167

8.2 Total Factor Productivity Growth in Czech Firms with and without Foreign Partners, 1992–96 168
8.3 Training and New Technology in Czech Firmswith and without Foreign Partners 168
9.1 R&D Intensity and Probability of a Joint Venture: Case 1 1849.2 R&D Intensity and Probability of a Joint Venture: Case 2 1849.3 R&D Intensity and Probability of a Joint Venture: Case 3 18510.1 Net FDI Inflows to Lithuania, 1993–2000 21310.2 Change in Horizontal Measure, 1996–2000 22010.3 Change in Backward Measure, 1996–2000 22010.4 Change in Forward Variable, 1996–2000 22113.1 Growth Rates of Total Factor Productivity
in Selected Countries and Regions, 1960–99 30713.2 Patents per Million Workers in Selected
Regions, 1960–2000 30813.3 Number of Scientific Publications and Patents in Mexico
Relative to Comparative Countries, 1960–2000 31013.4 Ratio of R&D to GDP in Selected Countries 31513.5 Innovation Inputs in Mexico 31613.6 Efficiency of Research and Development
in Selected Countries, 1985–2000 32213.7 IRCA Index in Selected Industries
and Countries, 1980–2000 32313.8 Private Sector Perceptions of Quality of Scientific
Institutions and University–Private Sector Collaboration, Selected Countries, 1994–2001 328
Tables2.1 Technological Capabilities in Manufacturing Industry 365.1 Determinants of Total Factor Productivity
in OECD Countries 1045.2 Determinants of Total Factory Productivity
in Developing Countries 1086.1 Determinants of Total Factor Productivity 1256.2 Choice of Technology 1266A.1 Matching between Machines and Products 1286C.1 Description and Source of Data for Variables 1316C.2 Descriptive Statistics 1327.1 Summary Statistics for Enterprise Sample 1417.2 Distribution of Sample by Ownership and Sector, 1990 1427.3 Summary Statistics on Exporters, 1988–92 1437.4 Summary Statistics on Exporters by Ownership
and Sector, 1990 144
Contents vii

7.5 Size of Exporters and Nonexporters, 1988–92 1457.6 Persistence and Volatility of Export Status 1457.7 Performance of Exporters and Nonexporters 1477.8 Basic Model Results 1507.9 Export Histories 1527.10 Basic Model Controlling for Export Histories 1538.1 Descriptive Statistics of the Sample 1668.2 Revenue Shares of Inputs, Mark-Up, and Scale
Estimates by Sector 1718.3 Panel Regression Estimates 1728.4 Spillover Effects on Firms without Foreign Linkages 1738.5 Spillover Effects on Firms without FDI 1749.1 Entry Modes Chosen by Investors in the Sample, by Country 1889.2 Entry Modes Chosen by Investors in the Sample, by Industry 1899.3 Probit Model with Firm- and Industry-Level
R&D and Advertising Intensities 1929.4 Classification of Industries by Technology Level 1939.5 R&D Intensity of FDI Projects in Three-Digit SIC Industries 1949.6 Probit Model with Relative R&D and Advertising Intensities 1979.7 Bivariate Probit with Sample Selection 1999.8 Marginal Effects of Bivariate Probit with Sample
Selection: Entry Mode Equation 20010.1 FDI Inflows to Central and Eastern European
Countries, 1993–2000 21410.2 Distribution of Firms with Foreign Capital,
by Industry, 2000 21510.3 Summary Statistics 21910.4 Additional Summary Statistics for Spillover Variables 21910.5 OLS with Lagged and Contemporaneous
Spillover Variables 22210.6 Comparison of Coefficients from OLS
and Olley-Pakes Regressions 22610.7 Results of OLS and Olley-Pakes Regressions in First,
Second, and Fourth Differences 22810.8 Share of Foreign Ownership and Productivity Spillovers 23110.9 Concentration of Downstream Sectors
and Productivity Spillovers 23311A.1 Colombian Chemical Industries: Dynamic Model 26011A.2 Moroccan Chemical Industries: Dynamic Model 26211A.3 Mexican Chemical Industries: Dynamic Model 26411A.4 Colombian Chemical Industries: Static Model 26611A.5 Moroccan Chemical Industries: Static Model 26811A.6 Mexican Chemical Industries: Static Model 270
viii Contents

11B.1 Activity Dynamics in the Colombian ChemicalsIndustry: Descriptive Evidence 272
11B.2 Activity Dynamics in the Moroccan Chemicals Industry: Descriptive Evidence 273
11B.3 Activity Dynamics in the Colombian Chemicals Industry: Econometric Results 274
11B.4 Activity Dynamics in the Moroccan Chemicals Industry: Econometric Results 276
12.1 Performance Statistics, 1991–96 28612.2 Descriptive Statistics 28812.3 Pearson Correlation Table 29612.4 Estimation Results 29712.5 Estimation Results: Random-Effects Model 30013.1 Determinants of Patent Counts 32013.2 Structure of R&D Effort in Selected
Countries, 1995–2000 327
Contents ix


xi
Development experience over the past 50 years suggests that trade liberalizationand increased international integration are critical elements of a successful strategyto promote economic growth. The World Bank has been an advocate and sup-porter of a trade agenda that enables developing countries to gain as much accessto foreign markets as possible, but it has also stressed the importance of developingcountries opening their own markets to international trade and investment.
This volume presents a rich set of analyses exploring how trade and foreigndirect investment (FDI) can help increase economic growth by allowing firms totap into and benefit from the global pool of knowledge. The chapters demonstratethat both obtaining access to foreign markets and opening their own economies totrade and FDI are crucial to promoting economic growth in developing countries,because they stimulate international technology diffusion. The volume also identi-fies government policies that can facilitate technology transfer and its absorptionin the developing world.
Among the conclusions emerging from the research contained in this volume, anumber stand out. First, the evidence suggests that an open trade regime facilitatesthe diffusion of knowledge. Undistorted access to capital equipment and importedinputs that embody foreign knowledge allow firms to acquire know-how; thegreater competition from imports lowers the mark-ups over costs that firms chargecustomers. At the same time, given that technology markets are associated withincreasing returns, imperfect competition, and externalities, the argument againsttrade protection is not unconditional. The conclusions hinge on the scope ofknowledge spillovers. International spillovers, for which there is considerable evi-dence, strongly tilt the balance in favor of free trade. If national spillovers are alsoimportant, there may be a potential role for intervention. Trade policy, however, is
Foreword

not the instrument of choice in this situation, as it does little to encourage localresearch and development and necessarily leads to other distortions.
Second, FDI policies in most developing countries have become more liberal inrecent years. But government policies often distinguish between types of FDI, pro-viding greater incentives to joint ventures with national firms than to fully ownedsubsidiaries of multinational enterprises. Such a policy stance often reflects a desire tomaximize technology transfer to local firms and agents. The evidence suggests, how-ever, that policies that discriminate between types of FDI are unlikely to promotetechnology transfer. By attempting to force multinational enterprises to license theirtechnologies or engage in joint ventures, host countries may lower the quality of tech-nologies they receive and reduce incentives for foreign firms to invest at all.
While the magnitude of international technology diffusion undertaken bymultinational enterprises need not be socially optimal, evidence presented in thisvolume reveals that such firms are keen to transfer technology to their local suppli-ers. Policies that increase incentives to source locally, as opposed to regulation orlegislation requiring that multinational enterprises engage in international tech-nology diffusion to local competitors, have a greater likelihood of being successful.Examples of such a policy are supplier development programs that aim to preparelocal companies to understand and meet the needs of multinational enterprises.The services provided under such programs can be effective in assisting firms, pro-vided they are well designed, mobilize the right type of skills, and ensure that theirtarget audience is aware of the services on offer.
Many countries actively seek to attract foreign investors through up-front subsi-dies, tax holidays, and other grants. A rationale for such investment incentives maybe based on positive externalities generated by inflows of FDI. Local suppliers maybenefit not just through expanded sales but through access to technologies pro-vided by the investors. Such positive externalities may be enhanced by the preva-lence of “follow the leader” behavior among multinational enterprises. Given theoligopolistic nature of markets within which FDI occurs, a new entrant may resultin additional investments by both competitors and upstream suppliers of inputs,components, and services. An implication is that a host country may be able tounleash a sequence of investments by successfully inducing FDI from one or twomajor firms.
If the local economy lacks a well-developed network of potential suppliers,multinational enterprises may be hesitant to invest, and local suppliers may notdevelop because of lack of demand. In the presence of such interdependence,growth may be constrained by a coordination problem that can partially beresolved by initiating investments from key firms. Such coordination problemscannot be tackled solely through investment incentives. Policy efforts need to focusprimarily on improving the investment climate and reducing the costs of absorbing
xii Foreword

technology, a complex task that involves building human capital and expandingnational innovation systems. Thus while there may be a case for investment incen-tives, it is a conditional one. To be effective, the investment climate and absorptivecapacity must meet certain conditions. Moreover, given competition among coun-tries in attracting FDI through incentive packages, policymakers must carefullyexamine the magnitude of potential costs and benefits associated with such policies.
François BourguignonChief Economist and Senior Vice-PresidentThe World Bank
Foreword xiii


xv
ACKNOWLEDGMENTS
The chapters in this volume are the product of a research project undertaken bythe World Bank Research Department. The research was partially supported bygrant PO62764 from the Bank’s research support budget. The financial supportprovided by the U.K. Department for International Development is also gratefullyacknowledged. Some of the chapters have been published in professional journals,others are published here for the first time.
The project owes much to the substantial inputs of Professor Jim Tybout(Pennsylvania State University) in the early phases. Aart Kraay helped manage theproject research, working with Professor Tybout and Bernard Hoekman. Theeditors are grateful to both of them, as well as to Isidro Soloaga for his tirelesseffort to put together the data sets used in the chapters. The editors thank StephenMcGroarty, Santiago Pombo, Janice Tuten, and Nora Leah Ridolfi for their assis-tance in getting the manuscript through the production process in a timely manner.Thanks are also due to Barbara Karni for excellent copyediting and to MaribelFlewitt and Rebecca Martin for administrative assistance.
All views expressed in this volume are those of the contributors. They do notnecessarily represent the views of the World Bank, its executive directors, or thecountries they represent.


Simeon Djankov, World Bank, Washington, DC, and Centre for Economic PolicyResearch, London
Bernard Hoekman, World Bank, Washington, DC, and Centre for Economic Pol-icy Research, London
Beata Smarzynska Javorcik, World Bank, Washington, DC, and Centre for Eco-nomic Policy Research, London
Aart Kraay, World Bank, Washington, DC
Daniel Lederman, World Bank, Washington, DC
William F. Maloney, World Bank, Washington, DC
Giorgio Barba Navaretti, Università degli Studi di Milano and Centro Studi Lucad’Agliano, Milan
Howard Pack, Wharton School, University of Pennsylvania, Philadelphia
Kamal Saggi, Southern Methodist University, Dallas, Texas
Maurice Schiff, World Bank, Washington, DC, and Institute for the Study ofLabor (IZA), Bonn
Isidro Soloaga, Universidad de las Américas, Puebla, Mexico
James R. Tybout, Pennsylvania State University, University Park, Pennsylvaniaand National Bureau of Economic Research, Cambridge, Massachusetts
Yanling Wang, Norman Paterson School of International Affairs, Carleton Uni-versity, Ottawa, Ontario
Contributors
xvii


xix
CGE computable general equilibriumCMEA Council of Mutual Economic Assistance EBRD European Bank for Reconstruction and DevelopmentEU European UnionFDI foreign direct investmentGNP gross national productIRCA innovative revealed comparative advantage ISIC International Standard Industrial ClassificationJV joint ventureNACE Nomenclature générale des activités économiques dans les Com-
munautés européennes NAFTA North American Free Trade AgreementNSO National Statistical Office (of Bulgaria)OECD Organisation for Economic Co-operation and DevelopmentOEM original equipment manufacturer OLS ordinary least squares OPT outward processing tradePCM price-cost margin R&D research and developmentTFP total factor productivityTRIMs Trade Related Investment Measures UNIDO United Nations Industrial Development OrganizationUSPTO United States Patent and Trademark Office UVI unit values index
AbbreviationsAND ACRONYMS


Lessons from EmpiricalResearch on International
Technology Diffusionthrough Trade and
Foreign Direct Investment
Bernard Hoekman and Beata Smarzynska Javorcik
1
1
This volume examines international technology diffusion. Its chapters explore thechannels through which existing knowledge is transferred across countries, themagnitude of such transfers, and their impact.
The acquisition and diffusion of knowledge or technology are of great impor-tance for economic development, as the adoption of new techniques, machines,and production processes is a key determinant of productivity growth. Given thatmost research and development (R&D) and innovation is undertaken in high-income countries, most developing economies must rely largely on importedtechnologies as sources of new productive knowledge. This is not to say that no R&Dis undertaken in developing countries; a considerable amount of follow-on innova-tion and adaptation does occur there, contributing to the global stock of knowledge.
The determinants of the supply of new knowledge—innovation and invention—have been the subject of a great deal of research. The chapters in this volume arenot concerned with the generation of new knowledge. The focus is on the diffusionof knowledge through trade and direct foreign investment.
Improving our understanding of how technology diffuses across borders isimportant in order to identify what governments can do through policies to stim-ulate international technology diffusion and its absorption in their economies.Numerous policies are motivated to a greater or lesser extent by the objective ofacquiring and augmenting or adapting knowledge that will enhance productivity

and economic growth. Such policies range from the general to the specific. Examplesinclude the provision of public goods such as education and infrastructure, the estab-lishment of specific funds for the creation of technology, the granting of subsidies forcapital investment, action to protect intellectual property rights, design of the struc-ture of import protection to favor the import of equipment and machinery, thegranting of tax incentives for foreign investors, export promotion schemes, the estab-lishment of free trade or special economic zones, and specialized training programs.
The “correct” policy intervention, if any, depends critically on the channelsthrough which technology diffuses internationally and the quantitative effects ofthe various diffusion processes on allocative efficiency and productivity growth.Neither is well understood. Most of the empirical evidence is based on aggregatedata or cross-sectional surveys and is subject to multiple interpretations. Casestudies, while informative about the case at hand, are difficult to generalize. Hencepolicymakers have often acted on the basis of theory, anecdotes, or instincts.
International technology diffusion can occur through numerous channels.Trade in goods and services is one. All trade bears some potential for transmittingtechnological information. Imported capital goods and technological inputs candirectly improve productivity by being used in production processes. Alternatively,firms may learn about technologies by exporting to knowledgeable buyers, whoshare product designs and production techniques with them.
A second channel is foreign direct investment (FDI) or the pursuit of project-specific joint ventures. Multinational enterprises generally transfer technologicalinformation to their subsidiaries, directly affecting the productivity of theseplants. In addition, some of the associated knowledge may “leak” into the hosteconomy. In both cases—trade and FDI—technology may diffuse from firms thathave acquired it internationally to other firms in the same industry or region throughdemonstration effects, labor turnover, mutual input suppliers, or reverse engineering.
A third channel of international technology diffusion is direct trade in knowledgethrough technology purchases or licensing. This may occur within firms, amongjoint ventures, or between unrelated firms. Licensing and FDI are often substitutes,but they may also be complements. Much of the recorded international paymentsand receipts for intellectual property (royalties) occur within firms, as flowsbetween parent firms and affiliates. Which form is preferable to technology ownersdepends on many factors, including the strength of intellectual property rights.
In sum, new technologies can be transmitted internationally through a varietyof activities. They may be embodied in goods and transferred through imports ofnew varieties of differentiated products or capital goods and equipment, they maybe obtained through exposure to foreign buyers or foreign investors, or they maybe acquired through direct trade in “disembodied knowledge”—through contractssupported by policies that protect intellectual property.
2 Global Integration and Technology Transfer

The chapters in this volume focus on the first two channels, trade and FDI.1
They use cross-country and firm-level data sets to investigate the extent towhich trade and FDI serve as channels of technology transfer. The chapters rely-ing on cross-country data explore the importance of trade openness, absorptiveand innovative capacity, and the identity of trading partners as determinants ofinternational technology diffusion measured by total factor productivity (TFP)performance. The focus is on spillovers through trade, building on and extendingthe original insight of Coe and Helpman (1995). In the case of analyses based onfirm-level data, the information available allows individual manufacturers to befollowed over time in terms of their productivity and the types of activities theyare engaged in (exporting, importing, joint ventures, and so on). Data on allpotential channels of diffusion are generally not available for any of the countriesstudied, but together the data sets cover many of the activities of interest fromthe perspective of international technology diffusion.
The firm-level analyses span several Central and Eastern European transitioneconomies, China, two Latin American countries (Colombia and Mexico), and oneNorth African country (Morocco). They are all quite different in terms of initial con-ditions and endowments. The Central and Eastern European countries are relativelywell endowed with human capital (skilled labor) and physical infrastructure. Theyalso provide an unprecedented natural experiment of sudden exposure to interna-tional trade, investment, and technology. In addition, they are of interest in terms ofthe use that was made of regional integration agreements, with the prospect of acces-sion to the European Union a major focal point for reform. In East Asia, China hasoften been cited as a country rapidly absorbing new technologies and moving up thetechnology ladder. China’s adoption of the “open door policy” in 1979 marked thebeginning of a concerted program to acquire foreign technology in order to raisegrowth rates and living standards. Over the course of the next 25 years, China’sspectacular growth was accompanied by its emergence as the largest developingcountry recipient of FDI, one of the world’s largest trading nations, and a majorimporter of capital goods. The semi-industrial countries of Latin America, whereopening to trade is relatively recent and factor endowments are quite different (naturalresource abundance), offer an alternative opportunity for analyzing technologydiffusion patterns given the availability of high-quality firm-level data. Morocco issimilar to Latin America in terms of relatively high endowments of naturalresources, but it differs in terms of endowments of unskilled labor and the use ofa free trade agreement with the European Union to improve export market access.
This introductory chapter sets the stage for the individual analyses. It reviewsthe major findings of the chapters in the volume as well as related research—withan emphasis on that undertaken by the World Bank—that focuses on contributingto the understanding of international technology diffusion. Much of the chapter
Lessons from Empirical Research on International Technology Diffusion 3

focuses on the policy implications emerging from the volume’s findings as well asthe literature in this area more generally. The chapter ends with a brief summaryof the main messages emerging from this research and suggestions for furtherwork to address open questions. Because the first three chapters of the volumeprovide surveys of the literature and evidence of different dimensions of interna-tional technology diffusion—case studies and cross-country experience (chapter 2),the role of FDI (chapter 3) and the role of trade (chapter 4)—we do not review theliterature in these areas in any depth here.
Technology Diffusion through Trade
Trade can contribute to international technology diffusion by providing localfirms access to new technologies embodied in imported machinery and equipmentand by creating opportunities for reverse engineering of products developedabroad. It can also create incentives to adopt and improve technologies throughexporting opportunities.
Access to Technologies through Imports
Coe and Helpman (1995) and Coe, Helpman, and Hoffmaister (1997) find thatforeign knowledge (R&D) embodied in traded goods has a statistically significantpositive impact on aggregate TFP of importing countries.2 Subsequent researchfinds that this impact is greater the more open a country is, the more skilled is itslabor force, and, in the case of developing countries, the more trade takes placewith industrial economies (Schiff and Wang forthcoming).
Knowledge accumulation means new knowledge (an increase in its quality),greater access to existing knowledge (an increase in its quantity), or both. Chapter 5,by Maurice Schiff and Yanling Wang, examines the relative contribution of thesetwo components of knowledge to total TFP for North-North and North-Southtrade-related knowledge diffusion. They proxy quantity by openness (as measuredby the trade to GDP ratio) and quality by the R&D content of trade (the type ofproducts traded). The literature assumes equal contributions to TFP of opennessand the R&D content of trade. Schiff and Wang show that this assumption does notcorrespond to reality. They find that R&D has a greater impact on TFP than opennessfor North-North trade and that openness has a greater impact on TFP than R&Dfor North-South trade. These results imply that the impact of openness on TFP indeveloping (developed) countries is larger (smaller) than previously obtained inthis literature and that developing countries may obtain larger productivity gainsfrom trade liberalization than previously thought.
As variations in capital goods trade can better explain cross-country differencesin productivity than can overall trade (see, for example, Eaton and Kortum 1999),
4 Global Integration and Technology Transfer

the distinction between quantity and quality is further examined in the context ofimported capital goods by Barba Navaretti, Schiff, and Soloaga (chapter 6). Theirchapter focuses on the impact of imported technologies on the productivity ofcountries in Central and Eastern Europe and the Southern Mediterranean.Comparing the unit values of machinery imported by each country with the unitvalues of machinery imported by the United States, the authors calculate the gapbetween the technology purchased and the technological frontier (defined by theUnited States). They find that the gap is persistent and in some cases even increasing.They conclude that the productivity growth in manufacturing depends on thetypes of machines imported (quality) and not on the share of imported equipmentin total investment (quantity).
These results suggest that open trade policies are critical for developing countriesin attracting technology. Openness alone, however, is not sufficient—bothabsorptive capacity and the ability to adapt foreign technology need to be inplace, both of which are related to human capital endowments and investment inR&D-intensive industries. In developing countries, technology acquisition oftenamounts to adapting existing methods to local circumstances (Evenson andWestphal 1995). This process takes time. Gradual adoption of new techniques ornew inputs is optimal for risk-averse producers in the face of costly adoption anduncertain returns. Producers need to learn how to apply the new technology;they often begin by applying it to a small part of their output and, if profitable,gradually increasing its application over time (Tybout 2000).
The farther the “technological distance” of a country from the global frontier(best practice), the more difficult it is to absorb information effectively into pro-duction systems (Keller 2002). As Keller (1996) argues, access to foreign technologiesalone does not increase growth rates of developing countries. Countries tend toacquire international technology more readily if domestic firms have local R&Dprograms, there are domestic private and public research laboratories and universities,and there exists a sound basis of technical skills and human capital. In chapter 2 of thisvolume, Howard Pack surveys and synthesizes much of the relevant literature onthis issue, concluding that the existence of such “complementary inputs” reducesthe costs of imitation, adaptation, and follow-on innovation.
Access to Technologies through Exports
While it is quite plausible that repeated contacts with knowledgeable foreign buyersprovide greater awareness of and access to foreign technologies, the literature surveyby James Tybout (chapter 4) concludes that the jury is still out on whether firmslearn from exporting. This is an important policy as well as analytical question, asmany governments have export promotion programs that are at least in part
Lessons from Empirical Research on International Technology Diffusion 5

premised on the existence of such learning, as well as on the presumption thatsuch new knowledge will spill over to other firms in the local economy.
Two studies—Clerides, Lach, and Tybout (1998), using plant-level data fromColumbia, Mexico, and Morocco, and Bernard and Jensen (1999), based on U.S.data—analyze the causal links between exporting and productivity. They observethat firms that are relatively efficient become exporters, while plants that ceaseexporting experience increasingly high costs. They find no evidence of learningfrom exporting and conclude that the well-documented positive associationbetween exporting and greater efficiency is explained by the self-selection of moreefficient firms into export markets.
These results contrast with the conclusions of Aart Kraay (chapter 7). Using dataon 2,105 Chinese enterprises during the period 1988–92 and controlling for pastperformance and unobserved firm characteristics, Kraay finds that past exports leadto significant improvements in enterprise performance. Interestingly, these learningeffects are most pronounced among established exporters. For new entrants toexport markets, learning effects appear to be insignificant or even negative.
The reality may be more nuanced than a simple distinction between self-selectioninto and learning from exporting. In another World Bank study, Hallward-Driermayer,Iarossi, and Sokoloff (2002), using firm-level information from a sample of EastAsian countries, conclude that firms make deliberate decisions to raise productivityin order to serve export markets. It is not simply that more productive firms self-select into exporting but that firms that explicitly target export markets consistentlymake different decisions regarding investment, training, technology, and the selectionof inputs, thereby raising their productivity. Thus the “exporter selection” process isnot necessarily driven by exogenous shocks, such as trade reforms, but reflects invest-ments made by firms in anticipation of accessing foreign markets.
Foreign Direct Investment as a Conduitof Knowledge
Investments by multinational enterprises may provide developing country affiliatesand partners with access to more efficient foreign technologies, as Kamal Sagginotes (chapter 3). Insofar as this knowledge does not remain restricted to partnerfirms or plants, FDI can result in technological spillovers, operating throughdemonstration effects (imitation) and labor turnover. Such benefits from FDI, ifthey arise, will be offset by more vigorous competition for local firms in the sameindustry, forcing down average price-cost margins.
Several chapters in Roberts and Tybout (1996) examine the potential impactsof FDI. Subsequent research, including several chapters in this volume, has continuedto investigate the sign and magnitude of the effects of FDI. However, the major
6 Global Integration and Technology Transfer

contribution of the more recent literature is to distinguish between horizontalspillover effects within an industry and vertical spillovers generated by linkagesin the production or value chain. Research has focused on the incentives formultinational enterprises to deliberately transfer technology to upstream localfirms that are (potential) suppliers of intermediates that the multinationalenterprise uses in production.
Implicit to the analysis of knowledge spillovers from FDI is the assumptionthat foreign ownership per se conveys some intangible advantage and that prox-imity to foreign firms or plants can be beneficial to domestic firms. Until recently,there was relatively little robust empirical confirmation that the first part of thisassumption holds, particularly in the context of developing countries. In chapter 8Simeon Djankov and Bernard Hoekman use firm-level panel data from the CzechRepublic to show that during 1992–96, FDI had a positive impact on the TFPgrowth of recipient firms, correcting for the fact that foreign companies may (anddid) invest in firms with above-average initial productivity. More recent evidenceis provided by another output of the World Bank research program in this area.Arnold and Javorcik (2005) use the Indonesian Census of Manufacturing todemonstrate that foreign acquisitions increased the productivity of the acquiredIndonesian plants. To control for the possibility that foreign investors may selectplants that are more productive to begin with, the study employs a matching tech-nique and the difference in differences approach. The analysis indicates that benefitsof foreign ownership are realized very quickly and that acquired plants experiencelarge increases in productivity, investment outlays, employment, and output. For-eign ownership is also found to lead to greater integration of plants into the globaleconomy through exports and imports.
In studying FDI spillovers, it is important to distinguish between horizontal(intraindustry) and vertical (interindustry) spillovers. In principle, vertical spilloversare more likely to occur, insofar as multinational enterprises can be expected to takeactions to prevent knowledge from leaking to their competitors in the same industry.They can do so by paying efficiency wages, enforcing intellectual property rights, andimposing noncompete clauses on key staff.Vertical spillovers are more likely to occur,because foreign affiliates have an incentive to reduce sourcing costs by encouragingproductivity improvements in (potential) local suppliers of inputs and services.However, the local upstream industries concerned may not always benefit, as foreignentry in a downstream sector may also give rise to greater imports of intermediates orresult in entry of foreign input suppliers. Such “follow the client” FDI is quitecommon in sectors such as automobiles. More generally, it can be expected to beprevalent for services suppliers, for whom trade is often not technically possible.
Case studies suggest that substantial technology diffusion occurs due to FDI(Blomström and Kokko 1998). Econometric studies are more diverse. Some find
Lessons from Empirical Research on International Technology Diffusion 7

that firms in sectors with a relatively high multinational enterprise presence tendto be more productive (Kokko, Tansini, and Zejan 1997), while others concludethat domestically held firms may actually do worse as the foreign presence in theirindustry increases (for example, Aitken and Harrison 1999). Negative spillovereffects may occur in the short run if multinational enterprises siphon off domesticdemand or bid away high-quality labor. As Görg and Strobl (2001) point out in arecent meta-analysis of the literature on intraindustry spillovers, studies employingpanel (rather than cross-sectional) data, which can and thus do control for unob-served firm characteristics (or unobserved industry characteristics in the case of esti-mations at the sectoral level), are less likely to find a positive effect.
Chapter 8 falls into this category. It finds that FDI has a positive impact on TFPgrowth of recipient firms, controlling for selection bias, but it also concludes thatjoint ventures and foreign affiliates have a negative spillover effect on purely domes-tic firms in the same industry. Interestingly, foreign affiliates alone do not have a sig-nificant effect on the performance of domestic firms and joint ventures taken together,which the authors attribute to the better absorptive capacity of joint ventures.
The results of chapter 9, by Beata Javorcik, suggest that the findings of Djankovand Hoekman in chapter 8 could also be due to differences in technological contentand thus in the spillover potential of joint ventures and foreign subsidiaries.Javorcik’s analysis is based on data from 22 transition economies for the early1990s. She shows that foreign investors with the most sophisticated technologies(relative to the industry mean) are more likely to engage in wholly owned projectsthan in joint ventures. These effects are present in high- and medium-technologysectors but not in low-R&D industries.
In contrast to the mixed results on intraindustry (horizontal) spilloversfrom FDI, the evidence on interindustry (vertical) technology transfer frommultinational enterprises has been consistently positive. The literature hasdocumented such transfers taking place through firms from industrial coun-tries buying the output of Asian firms to sell under their own brand names.Mexico’s maquiladora sector is an example of vertical international technologydiffusion. Most maquiladoras began as subsidiaries of U.S. firms that shiftedlabor-intensive assembly operations to Mexico (Tan and Batra 1995). However,over time the maquiladoras adopted more sophisticated production tech-niques, many of which were imported from the United States (Saggi 2002). Inchapter 10 Javorcik analyzes firm-level panel data from Lithuania. She pro-duces evidence that is consistent with the hypothesis that positive productivityspillovers from FDI occur through contacts between foreign affiliates and localsuppliers in upstream sectors. Her results suggest that a one standard deviationincrease in FDI in the sourcing (buying) sector is associated with a 15 percent
8 Global Integration and Technology Transfer

rise in output of each domestic firm in the supplying industry. Vertical spilloversare associated with projects with shared domestic and foreign ownership but notwith fully owned foreign investments.
Openness to Trade and FDI: Interactionsand Procompetitive Effects
The studies described looked at each channel of technology transfer in isolation. Amore systematic approach requires the simultaneous consideration of the effectsof various international transactions on firm productivity. This is the focus of theresearch undertaken by Aart Kraay, Isidro Soloaga, and James Tybout in chapter 11,which uses plant-level panel data from Colombia, Mexico, and Morocco. Theirfindings suggest that international activities (such as exporting, importing, andFDI) do not help much in predicting current firm performance, once past realiza-tions on quality and marginal costs are controlled for. In the minority of cases,where significant associations emerge, international activities appear to movecosts and product quality in the same direction.
The survey by Pack (chapter 2) points out that both theoretical studies andempirical evidence indicate that host-country absorptive capacity is crucial forobtaining significant benefits from FDI. This suggests that liberalization of tradeand FDI policies should be complemented with appropriate measures withrespect to education, R&D, and human capital accumulation. Similarly, empiricalevidence supports the argument that intellectual property rights are trade relatedand that asymmetric intellectual property rights protection across countries dis-torts the pattern of world trade and alters the composition of FDI inflows (Finkand Maskus 2005; Javorcik 2004).
Lowering barriers to imports and FDI increases competition, as foreign goodsand foreign producers enter the domestic market. The magnitude of the effectmay be larger in developing countries, which (in part due to previous protectionfrom international competition) lag behind industrial nations in terms of techno-logical sophistication, quality and variety of products, and productivity. While inthe short run the loss of market share to foreign goods or firms may push localfirms up their average cost curve and thus lower their productivity, in the mediumrun weaker firms will be forced to exit and survivors will lower their cost base,upgrade their production, or both. The result is that the average productivity ofindigenous firms will increase. This view is reflected in Tybout’s survey (chapter 4),which concludes that mark-ups generally fall with import competition, import-competing firms cut back their production levels when foreign competitionintensifies (at least in the short run), increased trade rationalizes production in
Lessons from Empirical Research on International Technology Diffusion 9

the sense that markets for the most efficient plants are expanded but large import-competing firms tend to simultaneously contract, and exposure to foreign compe-tition often improves intraplant efficiency.
Policies to liberalize trade and FDI are, of course, not the only policy instru-ments for increasing competition. Complementary policies are important as well,including in particular hard budget constraints to ensure that financial resourcesare allocated to activities with the highest expected return and that firms failing toperform are forced to exit. Djankov and Hoekman explore the importance of suchcomplementary sources of market discipline on TFP in chapter 12. They investi-gate the effects of demonopolization and restructuring of conglomerates, theimposition of harder budget constraints, and trade liberalization on the perform-ance of Bulgarian firms between 1991 and 1995. They find a positive relationshipbetween the increased market discipline associated with these reforms and subse-quent productivity growth, a result that is consistent with the general finding in theliterature. But they also conclude that different types of market discipline have dif-ferent impacts on exporting and nonexporting (import-competing) enterprises.Trade policy reform has less of an impact on the exporters in the sample—indeed,trade reforms are found to have a significant effect only once firms that exportmost of their output are removed from the sample. Moreover, access to subsidies(soft budget constraints, as measured by the magnitude of arrears) and more con-centrated markets reduce the impact of trade liberalization. Not considering suchfactors can lead to either over- or underestimation of the effects of trade reformson TFP.
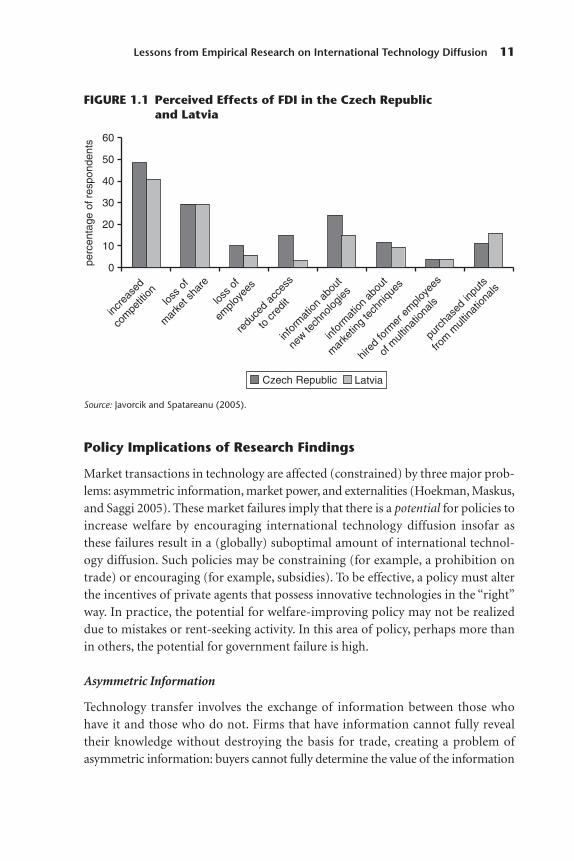
The impact of increased competition as a result of FDI inflows is documentedin several chapters in this volume, as well as in many of the investment climate–related surveys undertaken in developing countries and transition economiessince the late 1990s. In a 2003 survey of 391 domestic enterprises in the CzechRepublic, almost half of respondents reported that foreign entry had increased thelevel of competition in their sector. Twenty-nine percent of respondents claimedto have lost market share as a result of foreign entry. Similar responses wereobtained from a survey of 396 enterprises in Latvia (Javorcik and Spatareanu2005). Many studies’ finding of a negative correlation between the presence of for-eign firms and the productivity of domestic enterprises in the same sector may beattributed to the fact that the increased competition resulting from foreign entryoutweighs the effect of knowledge transfer (Aitken and Harrison 1999). The per-centage of Czech firms reporting multinationals siphoning off the demand fortheir products exceeded the share of Czech firms reporting learning from foreignfirms through the demonstration effect (figure 1.1). These findings help explainthe negative spillovers obtained by Djankov and Hoekman in chapter 8.
10 Global Integration and Technology Transfer
Policy Implications of Research Findings
Market transactions in technology are affected (constrained) by three major prob-lems: asymmetric information, market power, and externalities (Hoekman, Maskus,and Saggi 2005). These market failures imply that there is a potential for policies toincrease welfare by encouraging international technology diffusion insofar asthese failures result in a (globally) suboptimal amount of international technol-ogy diffusion. Such policies may be constraining (for example, a prohibition ontrade) or encouraging (for example, subsidies). To be effective, a policy must alterthe incentives of private agents that possess innovative technologies in the “right”way. In practice, the potential for welfare-improving policy may not be realizeddue to mistakes or rent-seeking activity. In this area of policy, perhaps more thanin others, the potential for government failure is high.
Asymmetric Information
Technology transfer involves the exchange of information between those whohave it and those who do not. Firms that have information cannot fully revealtheir knowledge without destroying the basis for trade, creating a problem ofasymmetric information: buyers cannot fully determine the value of the information
Lessons from Empirical Research on International Technology Diffusion 11
Source: Javorcik and Spatareanu (2005).
FIGURE 1.1 Perceived Effects of FDI in the Czech Republicand Latvia
0
10
20
30
40
50
60
incre
ased
com
petiti
onlos
s of
mar
ket s
hare
loss
of
emplo
yees
redu
ced
acce
ss
to cr
edit
infor
mat
ion a
bout
new te
chno
logies
infor
mat
ion a
bout
mar
ketin
g te
chniq
ues
hired
form
er e
mplo
yees
of m
ultina
tiona
ls
purc
hase
d inp
uts
from
mult
inatio
nals
perc
enta
ge o
f res
pond
ents
Czech Republic Latvia

before buying it. This can lead to large transactions costs, which stifle market-basedtechnology transfer. In the international context, information problems are moresevere, are and the enforcement of contracts more difficult to achieve. The theoryof the multinational firm posits that one motivation for such firms to establishforeign subsidiaries is the desire to overcome the difficulty of using markets toprofit from their proprietary technologies.
Market Power
Owners of (new) technologies typically have substantial market power, result-ing from lead time, fixed (sunk) costs, and learning by doing or from the grant-ing of intellectual property rights. This necessarily implies that the price oftechnology will exceed the socially optimal level (that is, the marginal cost).While this divergence between price and cost allows innovators to profit fromtheir innovation, it also implies a reduction in the (static) national welfare ofthose importing technologies.
Externalities
Externalities may arise if the costs and benefits of technology exchange are notfully internalized by those involved. A major share of benefits to recipient coun-tries of international technology diffusion is likely to arise from uncompensatedspillovers. Positive spillovers exist whenever technological information is diffusedinto the wider economy and the technology provider cannot extract the economicvalue of that diffusion. Spillovers can arise from imitation, trade, licensing, FDI,and the movement of people.
Import-competing industries register productivity gains following trade andFDI reforms (with much of the gains due primarily to factor use reallocationeffects), and price-cost margins fall as a result of greater competition. But thepolicy implications of these phenomena are not straightforward, as Erdem andTybout (2004) note, because it is not clear what drives improved performance.Is it due to better management incentives? To greater returns to innovation? Toincentives to shed redundant labor as a result of greater competitive pressures?Understanding the drivers is important from a policy perspective, as policiesneed to target the specific incentives that matter. There is significant uncertaintyhere. One conclusion that seems robust is that domestic distortions (marketfailures) and general economywide policies motivated by public good rationales(education, infrastructure) may be more important than trade and investmentpolicies in determining long-run outcomes. However, trade and investmentpolicies are a key determinant of international technology diffusion. The analysesin this volume of the effects of trade and FDI suggest that the impacts of trade
12 Global Integration and Technology Transfer

and investment policies differ depending on circumstances in the importing orhost country, such as the ability to supply intermediate inputs, the country’sabsorptive capacity, and the extent of any bias toward or against types ofimports and types of FDI.
Technology-Related Trade Policies and InternationalTechnology Diffusion
Many countries have historically engaged in infant industry protection, but theevidence suggests that diffusion of knowledge is facilitated by an open traderegime (Hoekman, Maskus, and Saggi 2005). Undistorted access to capital equip-ment and imported inputs that embody foreign knowledge allows firms to acquireknow-how. The case for open markets extends to other products as well, as greatercompetition will reduce price-cost markups. At the same time, given that technol-ogy markets are associated with increasing returns, imperfect competition, andexternalities, the argument against trade protection is not unconditional. Theconclusions hinge on the scope of knowledge spillovers. International spillovers,for which there is considerable evidence (see chapter 5 and the references citedthere), strongly tilt the balance in favor of free trade. If national spillovers are alsoimportant, however, there may be a potential role for intervention. For example, ifproductivity improvements depend only on a country’s own R&D, a case can bemade for policies that ensure that industries in which such improvements occur ata rapid rate are not all located elsewhere. The relative magnitudes of internationalas opposed to national spillovers are not known, and much will depend on thespecific circumstances of countries. What matters is that research indicates thereis a geographic component to knowledge flows, suggesting that agglomeration-type effects can be important (Jafee, Trajtenberg, and Henderson 1993; Sjoholm1996; Audretsch and Feldman 1996). From a policy perspective, restricting trade isneither efficient nor effective. Instead, general policies are needed to increase theincentives of agents to undertake activities that generate social benefits that exceedprivate returns, without simultaneously creating additional distortions. Such poli-cies include measures to improve the investment climate and reduce the “costs ofdoing business,” as well as investments in education. Trade policy does little toencourage local R&D and necessarily leads to other distortions.3
One set of trade policies that is often motivated on the basis of internationaltechnology diffusion objectives is trade related investment measures (TRIMs).Examples are local content and technology transfer requirements for foreigninvestors. TRIMs discriminate against imports by creating incentives (other thanimport tariffs) to source inputs from domestic producers. In the internationaltechnology diffusion context, a motivation for TRIMs is often that foreign firms
Lessons from Empirical Research on International Technology Diffusion 13

might be expected to transfer knowledge to ensure that local inputs satisfy theirspecifications. TRIMs act as an implicit tariff on intermediate goods imports,because manufacturers are forced to use higher-cost local inputs. They are inferiorto tariffs in welfare terms, as no tariff revenue is generated. More important fromthe perspective of international technology diffusion is the fact that TRIMs pro-vide little or no incentive for the protected producers of intermediate goods toacquire more knowledge.
FDI-Related Policies
Historically, restrictive trade policies were often complemented by restrictions onFDI, in part to prevent the use of investment as a way of getting around trade pro-tection (so-called tariff-jumping investment). Japan, the Republic of Korea, andTaiwan (China) have all imposed restrictions on FDI. Policies were often morewelcoming toward other modes of international technology diffusion, includingliberal trade policies affecting imports of machinery and equipment (throughzero duty ratings or drawback mechanisms) and the licensing of foreign technol-ogy. In recent years national FDI policies have generally become more liberal indeveloping countries, but governments often differentiate between joint venturesand fully owned subsidiaries of multinational enterprises. China, among others,has been more encouraging of joint ventures than inward FDI, although it hasbecome the leading destination for FDI. Such a policy stance may reflect a desireto maximize technology transfer to local agents.
The literature suggests that such discriminatory policies are unlikely to achieve thedesired effects with respect to technology transfer. Survey evidence indicates that tech-nologies transferred to wholly owned subsidiaries are of a newer vintage than licensedtechnologies or those transferred to joint ventures (Mansfield and Romeo 1980). For-eign investors also tend to devote more resources to technology transfer to their whollyowned subsidiaries than to partially owned affiliates (Ramachandaram 1993). More-over, the econometric analysis conducted by Javorcik (chapter 10) shows that multina-tional enterprises with advanced technologies tend to enter a host country throughwholly owned subsidiaries rather than joint ventures. By forcing multinationalenterprises to license their technologies or engage in joint ventures, host countriesmay be lowering the quality of technologies they receive as well as reducing the incen-tives to invest in the country at all.
While the magnitude of international technology diffusion undertaken bymultinational enterprises need not be socially optimal, considerable evidence sug-gests that such firms are keen to transfer technology to their local suppliers.4 Poli-cies that facilitate this process, as opposed to regulation or legislation requiringthat multinational enterprises engage in international technology diffusion to
14 Global Integration and Technology Transfer

local competitors, have a greater likelihood of being successful. A concrete exampleof such a policy would be a supplier development program that aims to preparelocal companies to understand and meet the needs of multinational enterprises.Such programs have been successfully implemented in Ireland and more recentlythe Czech Republic. Participation is offered to promising small- and medium-sizeenterprises that undergo an evaluation process followed by intense work with out-side consultants to make improvement to areas in which they are lacking. Partici-pants are given opportunities to start new business relationships by meeting withmultinationals looking for local suppliers.
If they are well designed, the services provided in this way can be effective inassisting firms, especially smaller enterprises, mobilize the right type of skills(consultants) and ensure that their target audience is aware of the services onoffer. In practice these conditions are frequently not met. As a result, such pro-grams often have limited impact at best, because the services provided do notgenerate much value-added or because the “wrong” firms—those with limitedpotential for improvement or those that had access to market-based consultingservices (in the process creating a potential negative spillover on the privateconsulting industry)—get help.5
Many countries actively seek to attract foreign investors through up-front sub-sidies, tax holidays, and other grants. For there to be a rationale for such invest-ment incentives, host countries must enjoy positive externalities from inward FDI.The prevalence of “follow the leader” behavior among multinational enterprisesprovides another potential case for FDI incentives. Given the oligopolistic natureof markets within which FDI occurs, a new entrant may attract investments byboth competitors and upstream suppliers. If it does, competition at multiplestages of production may increase, raising efficiency, overall output, and employ-ment. An implication is that a host country may be able to unleash a sequence ofinvestments by successfully inducing FDI from one or two major firms.
If the local economy lacks a well-developed network of potential suppliers,multinational enterprises may be hesitant to invest, and local suppliers may notdevelop because of lack of demand. In the presence of such interdependence,growth may be constrained by a coordination problem that can be partiallyresolved by initiating investments from key firms. Of course, such coordinationproblems cannot be tackled solely through investment incentives. Policy effortsneed to focus primarily on improving the investment climate and reducing thecosts of absorbing technology, a complex task that involves building human capitaland expanding national innovation systems.
Thus while there may be a case for incentives, it is a conditional one. To beeffective, the investment climate and absorptive capacity must meet certainconditions.6 Moreover, given competition among countries in providing FDI
Lessons from Empirical Research on International Technology Diffusion 15

incentive packages, one must carefully examine the magnitude of potential costsand benefits associated with such policies. Before considering FDI incentives, itprobably makes sense to invest in marketing a country as a profitable location forinvestment and ensuring that potential investors can easily access all relevantinformation (Rodriguez-Clare 2004).
General versus Specific Domestic Technology-RelatedSubsidy Policies
A substantial share of R&D benefits may be local in nature, leading to a concentra-tion of innovative activity, often around academic research centers (Audretsch andFeldman 1996). Such agglomeration externalities may provide a case for specificR&D–related subsidies as well as support of basic research and training to expandabsorptive capacity in a country, which many studies indicate is crucial for obtainingsignificant spillover benefits from trade or FDI.7 Without adequate human capital orinvestments in R&D, spillovers may simply be infeasible. The implication is thatliberalization of trade and open FDI policies need to be complemented by policieswith respect to education, R&D, and human capital accumulation if countries areto take full advantage of international technology diffusion.
Daniel Lederman and William Maloney (chapter 13) examine the evolution ofMexican technological progress in the past few decades, devoting special attentionto the role of trade, FDI, and the national innovation system. Their main messageis that trade liberalization (North American Free Trade Agreement) was helpfulbut insufficient to help Mexico catch up to the levels of innovation and the pace oftechnological progress in its North American partners. The evidence suggests that,given its level of development, Mexico suffers from low levels of R&D expenditureand low levels of patenting activity. It severely underperforms when comparedwith successful developing economies, such as the Republic of Korea. The authorsargue that Mexico’s national innovation system—how the private sector, universi-ties, and public policies interact to produce economically meaningful innova-tion—is inefficient. Without addressing this weakness, Mexico is unlikely to beable to converge on the pace of innovation in North America. Improving the qual-ity of research institutions; providing incentives for researchers to get involvedwith the productive sector, in particular incentives for appropriating innovationsemanating from technical research; negotiating the cofinancing of researchexchange programs with NAFTA partners; and developing domestic credit mar-kets are among the policy responses suggested.
Of great relevance to international technology diffusion is the role that subsidiescan play to facilitate learning, technology acquisition, and dynamic comparative
16 Global Integration and Technology Transfer

advantage where returns to such activities cannot be appropriated by privateagents and hence will not be undertaken by any individual firm. Amsden (1989)and others argue that policy interventions, including implicit or explicit subsidies,lay behind the economic “miracles” in the Republic of Korea and Taiwan (China).They claim that carefully targeted subsidies allowed these governments to stimu-late key sectors that became efficient in their own right and provided positivespillovers for the economy as a whole.
In considering this infant industry argument for government support, it isimportant to differentiate between sector-specific subsidies and general policiesfacilitating learning and the development of private enterprise. In a recent com-prehensive retrospective on the East Asian development experience, Noland andPack (2003) argue that sector-specific policies did not result in high rates of TFPgrowth for manufacturing. In the Republic of Korea and Taiwan (China), TFPgrowth was not much higher than in the Organisation for Economic Co-operationand Development (OECD). In India selective interventionist policies were associatedwith declining TFP growth rates, while the opening of the economy led to an increasein TFP growth rates (Krishna and Mitra 1998). Specific interventions will often getit wrong, in part as a result of rent-seeking, and in part as a result of general equi-librium effects (a subsidy for one activity usually implies a tax on all others).
The case for general policy support for certain types of activity, including inno-vation, education, transport infrastructure, and similar public goods, is uncontro-versial. The same is true for policies aimed to promote socially beneficial activities.Markets do fail, and there may be good rationales for governments to provideincentives for firms and agents to undertake activities that would otherwise beundersupplied. An important example that has a direct bearing on the subject athand is the learning externality analyzed by Hausmann and Rodrik (2003). Themarket undersupplies investment by firms in new (nontraditional) activitiesbecause of appropriability problems: as soon as an entrepreneur is successful inidentifying a profitable new production opportunity, entry by imitators preventshim or her from recouping costs. In this case, a subsidy or similar incentive canhelp expand innovation and risk taking.8 As Rodriguez-Clare (2004) notes, thisargument provides a rationale for supporting innovating projects leading to newknowledge about the country’s comparative advantage, but it is not a justificationfor a general policy of supporting small and medium-size enterprises. Nor is it acase for trade policy, which is too blunt an instrument (Baldwin 1969). Any supportprogram should be aimed at young firms, as firms that have remained small formany years most likely exhibit low productivity and are therefore not promisingtargets for intervention (see, for example, Srinivasan 2004).
The efficient use of support policies requires that governments be effective atidentifying cases that justify intervention, designing effective instruments, and
Lessons from Empirical Research on International Technology Diffusion 17

implementing these instruments appropriately. In practice, governments may failin doing all three; the policy problem is to assess the relative sizes of governmentfailure and the failures of the market for knowledge. Potential problems includethe fact that subsidies can serve to support inefficiency; firms may behave strategically(by underinvesting, for example) in order to win subsidies; and subsidies canresult in corruption, bad corporate governance, and rent-seeking behavior. Thegreatest challenge of implementing subsidies is that they are difficult to control.Government needs to establish an effective and credible exit strategy that weedsout unsuccessful efforts from successful ones. The capabilities and autonomy ofthe state play a fundamental role in implementing subsidy policies effectively(Rodrik 1993), suggesting that this is a policy path that countries with weak gov-ernance and institutions pursue at their peril. Greater policy consistency andcredibility may be obtained through international cooperation (for example,trade agreements), which can help government be more credible in ensuring thata policy to assist a particular activity is temporary (Hoekman 2005).
Intellectual Property Rights and Technology Transfer
Intellectual property rights can support markets in technology, including interna-tional technology diffusion, and they are likely to interact with both trade and FDIflows (Arora, Fosfuri, and Gambardella 2001; Javorcik 2004; Maskus 2000).Although the chapters in this volume do not address intellectual property rightsissues, we discuss briefly some of the stylized facts and findings from the literaturefrom the perspective of international technology diffusion.9
Absent intellectual property rights, firms would be less willing to engage intechnology transactions. Patents and trade secrets provide a legal basis for revealingthe proprietary characteristics of technologies to subsidiaries and licensees,supporting the formation of licensing contracts.10 Patent protection bothincreases flows of international technology diffusion to countries with techno-logical capacity and shifts incentives for investors between FDI and licensing.
The empirical literature yields several results. First, patent applications fromforeign nations are strongly associated with productivity growth in recipientcountries (Eaton and Kortum 1996). Except in the United States, more than halfof productivity growth in OECD countries comes from importing technologies(patents). This proportion is higher for small economies. Thus trade in ideas is amajor factor in world economic growth.
Second, patent citations reflect knowledge flows across borders. While there isa limited amount of diffusion overall (because of distance, borders, and differencesacross regions in technological specialization [Peri 2003]), the most significantpatents and knowledge in highly technological sectors are widely diffused. Thereis a strongly positive impact of knowledge flows on international innovation.
18 Global Integration and Technology Transfer

Third, international trade flows, especially in patent-sensitive industries,respond positively to increases in patent rights among middle-income and largedeveloping countries. An important reason is that these countries represent acompetitive imitation threat with weak intellectual property rights, and strongerpatents expand the market for foreign exporters (Smith 2001). However, tradeflows to poor countries are not responsive to patent rights.
Fourth, the evidence on patent protection and inward FDI is mixed, but recentstudies uniformly find positive impacts among middle-income and large developingcountries (Fink 2005). However, in poor countries, patents do not expand FDI(Smith 2001; Blyde and Acea 2002). Stronger patent protection also shifts the focusof FDI from distribution of imported products to local production (Javorcik 2004).
Fifth, strengthening intellectual property rights shifts international technologydiffusion from exports and FDI toward licensing and positively affects knowledgeinflows, measured as R&D expenditures undertaken on behalf of affiliates. Thesefindings apply only to recipient countries with strong imitative abilities; the impactis zero in other countries (Smith 2001).
Sixth, a common finding of the literature is that the poorest countries areunlikely to benefit from strong intellectual property rights (McCalman 2001).Stronger patent rights may be expected to raise considerably the rents earned byinternational firms as intellectual property rights become more valuable, obligingdeveloping countries to pay more for the average inward flow of protected technology.In some countries international technology diffusion-related spillovers are likely tobe small at best, given limited absorptive capacity. The implications are that in poorcountries, policy should aim to lower the costs of imports of intellectual propertyrights–intensive goods and technology and raise the capacity to absorb and adapttechnologies through programs aimed at bolstering human capital.
Conclusion: Main Messages and OutstandingResearch Questions
The relationship between trade and investment policies and international knowledgeflows associated with trade in goods and FDI is complex. What are the mainmessages that emerge from the research summarized above and the chapters inthis volume? Without implying any rank ordering in terms of importance, wewould stress the following:
• Trade and FDI are major indirect channels for diffusing technology. Followingincreases in competition due to liberalization of trade and FDI, price-costmark-ups and the output of import-competing firms fall. In the medium term,more efficient plants expand, while others contract or exit. These procompetitive
Lessons from Empirical Research on International Technology Diffusion 19
effects generate the incentives to invest in new equipment and apply new methodsof production, to innovate, to improve quality and differentiate products, and soforth. A liberal policy stance toward such flows is, therefore, an importantinstrument with which to encourage international technology diffusion. Thisconclusion is bolstered by the finding that restrictive policies will not generateincentives for greater investments in the acquisition and absorption of knowledge.
• The procompetitive effects of trade and FDI may be attenuated or not realized inthe absence of complementary policies that ensure that domestic firms confronthard budget constraints and markets are contestable. If domestic banks areencouraged by the government (whether explicitly or implicitly) to build upnonperforming assets and finance inefficient loss-making firms, greater compe-tition from imports may not induce firms to apply new techniques and improveproductivity. It is also important that pro-FDI policies be accompanied by opentrade policies, in order to confront foreign investors with competition. Thenegative association between concentration and TFP performance in Bulgariafound by Djankov and Hoekman in chapter 12 is indicative in this regard.
• Trade is also an important direct conduit for technology diffusion, in that muchknowledge and R&D is embodied in goods that are imported, especially capitalgoods and machinery. From the perspective of international technology diffusion,this helps explain the structure of protection often observed in developingcountries, where the effective rate of protection on investment or intermediategoods is much lower than on consumer or final goods. Such a structure of pro-tection may encourage international technology diffusion, but it is unlikelyto be optimal, because it may distort both production and consumptiondecisions—leading, for example, to the use of excessively capital-intensive tech-niques and creating incentives for domestic investment in the more protectedindustries. The finding that vertical spillovers are more likely (and larger) ifthere is a local supplying industry points in the same direction: a policy thatexplicitly favors imports of inputs over other imports may act as a disincentivefor the development of such activities, reducing the benefits of FDI.
• The positive effect of trade on developing countries depends not just on tradepolicies (openness) but also on the prevailing conditions in an economy. As sev-eral chapters emphasize, the impact of openness on productivity growth is afunction of absorptive capacity, broadly defined. The absorptive capacity com-bined with the structure of trade policy has implications for the composition oftrade taking place and its effects. The findings suggest that a neutral trade policyis called for in order not to distort the investment choices of domestic firms andthat complementary policies enhancing technological capacity are important.
• Exporters tend to be more efficient than nonexporters, suggesting that theyhave acquired and apply better technologies, both hard and soft. However, the
20 Global Integration and Technology Transfer

lack of strong evidence of learning by exporting in the literature, in conjunctionwith the robust finding that imports are an important source of knowledgeand market discipline again suggests that governments should pursue a neutraltrade policy. The finding that firms that target export markets are (or become)more productive because they take explicit actions regarding investment, train-ing, technology, and so forth in anticipation of accessing foreign markets sug-gests a likely additional payoff in terms of international technology diffusionfrom engaging in market access negotiations with trade partners.
• FDI is an important direct source of technology and knowledge. Almost allstudies show that firms with foreign capital perform better than indigenousfirms, even after controlling for the fact that foreign investors generally selectplants that are more productive in the first place. This suggests that FDI resultsin a more effective use of resources in host countries.
• The evidence on externalities associated with FDI is less clear cut. Intraindustryspillovers are less likely to take place than vertical spillovers. Vertical spilloversare a function of the capacity of the domestic industry to satisfy the demands ofmultinational enterprises at lower cost than imports, which in turn will dependin part on the nationality of investors and the location of host countries relativeto the home countries of the multinational enterprises concerned.
• While open trade and investment policies help developing countries in attractingand accessing technology, openness alone is not sufficient. Absorptive capacitymatters, as does the initial level of technological capacity of domestic firms. Thisfinding points to the importance of education, infrastructure, access to financefor small firms and start-ups, and low regulatory costs of entry (World Bank2004). To a large extent, the policy agenda here overlaps that of improving theinvestment climate in general and reducing the costs of doing business. However,there may also be a need for specific supply-related policies, that is, horizontalmeasures to encourage investment in innovative new activities, such as supplyingworld markets and local multinational enterprises, and activities oriented towardfinal demand. Determining what types of complementary policies are needed toenhance technological capabilities requires country-specific analysis (Sutton2002). Effective monitoring and evaluation of programs that aim to improve thesupply of knowledge is critical to ensure that they are beneficial.
This summary of the main messages emerging from the research has already indi-cated that several areas remain in which the state of knowledge cannot providereliable policy guidelines, either because a particular question has not beenaddressed or because the analyses suffer from shortcomings. We conclude withfour areas in which more policy-relevant research is needed on the trade- andinvestment-related dimensions of international technology diffusion.11
Lessons from Empirical Research on International Technology Diffusion 21

First, more research is needed on the question of selection versus learning inthe context of domestic firms that are successful in exporting. The jury is still outon whether exporters learn from selling abroad. Whether or not they do is importantfor policy, as it will determine whether there is a case for subsidizing such activi-ties. A related policy-relevant question concerns the role of the prospect of exportmarket access on investments by local firms and, in particular, what it implies forthe design and content of trade agreements, increasingly used as the instrumentthrough which to obtain and lock in access to export markets.
Second, not enough is known about the mechanism behind vertical spilloversfrom FDI. While anecdotal evidence suggests that such spillovers may be due todeliberate knowledge transfer from multinational enterprises, it is plausible that theprospect of receiving a lucrative deal from a foreign company creates a powerfulincentive for domestic firms to restructure and increase their efficiency. If local sup-pliers do learn from interactions with foreign affiliates, using policy instruments toattract FDI or establishing supplier development programs may be justified. If, how-ever, what matters is the prospect of obtaining more profitable contracts than thoseavailable from local firms and customers, then a similar outcome could be achievedby, for instance, facilitating access to foreign markets through multilateral or prefer-ential trade agreements or facilitating the flow of information about foreign marketsand business opportunities available there. Many governments use both types ofpolicy instruments; a better understanding of the mechanisms that drive verticalspillovers could help identify whether some of these programs are redundant.
Third, the literature has largely ignored the impact of what is increasingly animportant input category when estimating firm productivity: services. These rangefrom management consulting to finance, design, marketing, and transportation.Assessing the importance of services-related policies on firm performance, theimpact of access to domestic versus foreign services providers, and the effect ofinternational integration on the number of service varieties available in the marketare examples of important questions in their own right that also have strong policyimplications for international technology diffusion. There is likely to be a closeconnection between the functioning of services industries and the realization ofthe agglomeration externalities that have been stressed in the recent literature onindustrial development as a precondition for sustained growth of specific sectorsor activities (Burgess and Venables 2004).
Fourth, as trade and investment policies and the transfer of technology are onthe agenda of trade negotiations at both the regional and multilateral level,enhancing the understanding of the impacts of policy reform suggestions made insuch negotiations is another subject for further research. The chapters in this volumeindicate that the origin of investment and trade may matter in terms of the likelymagnitude of international technology diffusion.
22 Global Integration and Technology Transfer

Notes
1. The role of intellectual property rights is discussed in another volume in this series (Fink andMaskus 2005). We summarize some of the major findings of the empirical literature on the linksbetween intellectual property rights and trade/FDI later in this chapter.
2. See Keller (1996) for a criticism of earlier work by Coe and Helpman (1995). The fact that tradeembodies technical information is evident in numerous studies, including Eaton and Kortum (1996)and Keller (2002).
3. Deardorff and Stern (1987) note that the use of trade policy in such situations is analogous todoing acupuncture with a fork—one prong may “hit the spot,” but the others can only do harm.
4. Moran (1998) discusses several case studies that document this process.5. See, for example, ADE, IBM, and EPU-NTUA (2003) for an evaluation of EU assistance
programs to Mediterranean countries in this area, as well as Batra and Mahmood (2003). Hoekmanand Javorcik (2004) discuss some of the literature in this area.
6. Care must also be taken in terms of the sectoral allocation of incentives. In particular, the casefor seeking to attract “high-tech” investments is weak. Investment in simple activities (such astransportation and other fundamental services) may yield larger returns, even if it does not result inlarge technology spillovers. Industrialization can be subject to large coordination failures, whichinvestment in local infrastructure can help resolve, improving the investment climate in the process.
7. The first avenue raises concerns regarding the ability of government to identify the right activitiesand prevent capture of policies.
8. In many cases, intellectual property rights will be ineffective, as the technologies that will beused are likely to be known in the rest of the world.
9. What follows draws on Hoekman, Maskus, and Saggi (2005). For a more detailed discussion ofthese issues, see Fink and Maskus (2005).
10. See Correa (2005) for the counterargument that strong intellectual property rights may stifleinternational technology diffusion as firms exploit market power.
11. Research is also needed on other dimensions of international technology diffusion, especiallythe supply side. This includes innovation policies and systems, including the impact of protection ofintellectual property rights and the preconditions for benefiting from strengthening them (see Finkand Maskus 2005).
References
ADE (Aide à la Decision Économique), IBM Business Consulting Services, and EPU-National TechnicalUniversity of Athens. 2003. “Evaluation of Economic Cooperation between the EuropeanCommission and the Mediterranean Countries.” Final Report, Vol. 1 (November). Belgium.
Aitken, Brian J., and Ann E. Harrison. 1999. “Do Domestic Firms Benefit from Direct Foreign Invest-ment? Evidence from Venezuela.” American Economic Review 89 (3): 605–18.
Amsden, A. 1989. Asia’s Next Giant: South Korea and Late Industrialization. New York: OxfordUniversity Press.
Arnold, Jens Matthias, and Beata Smarzynska Javorcik. 2005. “Gifted Kids or Pushy Parents? ForeignAcquisitions and Plant Productivity in Indonesia.” Policy Research Working Paper 3597, WorldBank, Washington, DC.
Arora, Ashish, Andrea Fosfuri, and Alfonso Gambardella. 2001. Markets for Technology: The Economicsof Innovation and Corporate Strategy. Cambridge, MA: MIT Press.
Audretsch, David, and Maryann Feldman. 1996. “R&D Spillovers and the Geography of Innovationand Production.” American Economic Review 86 (3): 630–40.
Baldwin, Robert. 1969. “The Case against Infant Industry Protection.” Journal of Political Economy 77(3): 295–305.
Lessons from Empirical Research on International Technology Diffusion 23

Batra, Geeta, and Syed Mahmood. 2003. “Direct Support to Private Firms: Evidence on Effectiveness.”Policy Research Working Paper 3170, World Bank, Washington, DC.
Bernard, Andrew B., and J. Bradford Jensen. 1999. “Exceptional Exporter Performance: Cause, Effect,or Both?” Journal of International Economics 47 (1): 1–25.
Blomström, Magnus, and Ari Kokko. 1998. “Multinational Corporations and Spillovers.” Journal ofEconomic Surveys 12 (2): 247–78.
Blyde, J.S., and C. Acea. 2002. The Effects of Intellectual Property Rights on Trade and FDI in LatinAmerica.” Inter-American Development Bank, Washington, DC.
Burgess, Robin, and Anthony Venables. 2004. “Toward a Microeconomics of Growth.” In AcceleratingDevelopment: Annual World Bank Conference on Development Economics, ed. François Bourguignonand Boris Pleskovic, 105–39. Washington, DC: World Bank.
Clerides, Sofronis K., Saul Lach, and James R. Tybout. 1998. “Is Learning by Exporting Important?Micro-Dynamic Evidence from Colombia, Mexico, and Morocco.” Quarterly Journal of Economics113 (3): 903–47.
Coe, David T., and Elhanan Helpman. 1995. “International R&D Spillovers.” European EconomicReview 39 (5): 859–87.
Coe, David T., Elhanan Helpman, and Alexander W. Hoffmaister. 1997. “North-South R&DSpillovers.” Economic Journal 107 (440): 134–149.
Correa, Carlos M. 2005. “Can the TRIPS Agreement Foster Technology Transfer to DevelopingCountries?” In International Public Goods and Transfer of Technology under a Globalized IntellectualProperty Regime, ed. Keith E. Maskus and J.H. Reichman, 227–56. Cambridge: Cambridge Univer-sity Press.
Deardorff, Alan, and Robert Stern. 1987. “Current Issues in Trade Policy: An Overview.” In U.S. TradePolices in a Changing World Economy, ed. Robert Stern, 15–77. Cambridge, MA: MIT Press.
Eaton, Jonathan, and Samuel Kortum. 1996.“Trade in Ideas: Patenting and Productivity in the OECD.”Journal of International Economics 40 (3–4): 251–78.
———. 1999. “International Technology Diffusion: Theory and Measurement.” InternationalEconomic Review 40 (3): 537–70.
Erdem, Erkan, and James Tybout. 2004. “Trade Policy and Industrial Sector Responses in the Develop-ing World: Interpreting the Evidence.” In Brookings Trade Forum 2003, ed. Susan Collins and DaniRodrik, 1–43. Washington, DC: Brookings Institution Press.
Evenson, Robert, and Larry Westphal. 1995. “Technological Change and Technology Strategy.” InHandbook of Development Economics, Vol. 3, ed. T.N. Srinivasan and Jere Behrman, 2209–99.Amsterdam: North-Holland.
Fink, Carsten. 2005. “Intellectual Property Rights and U.S. and German International Transactions inManufacturing Industries.” In Intellectual Property and Development: Lessons from Recent EconomicResearch, ed. Carsten Fink and Keith Maskus, 75–110. Washington, DC: World Bank.
Fink, Carsten, and Keith Maskus, eds. 2005. Intellectual Property and Development: Lessons from RecentEconomic Research. Washington, DC: World Bank.
Görg, Holger, and Eric Strobl. 2001. “Multinational Companies and Productivity Spillovers: A Meta-Analysis.” Economic Journal 111 (475): 723–39.
Hallward-Driermayer, M., G. Iarossi, and K. Sokoloff. 2002. “Exports and Manufacturing Productivityin East Asia: A Comparative Analysis with Firm-Level Data.” NBER Working Paper 8894, NationalBureau of Economic Research, Cambridge, MA.
Hausmann, Ricardo, and Dani Rodrik. 2003. “Economic Development as Self-Discovery.” Journal ofDevelopment Economics 72 (2): 603–33.
Hoekman, Bernard. 2005. “Operationalizing the Concept of Policy Space in the WTO: Beyond Specialand Differential Treatment.” Journal of International Economic Law 8 (2): 405–24.
Hoekman, Bernard, and Beata Smarzynska Javorcik. 2004. “Policies to Encourage Firm Adjustment toGlobalization.” Oxford Review of Economic Policy 20 (3): 457–73.
Hoekman, Bernard, Keith Maskus, and Kamal Saggi. 2005. “Transfer of Technology to DevelopingCountries: Unilateral and Multilateral Policy Options.” World Development, 33(10): 1587–1602.
24 Global Integration and Technology Transfer
Jaffe, Adam, Manuel Trajtenberg, and Rebecca Henderson. 1993. “Geographic Localization of Knowl-edge Spillovers as Evidenced by Patent Citations.” Quarterly Journal of Economics 108 (3):577–98.
Javorcik, Beata Smarzynska. 2004.“The Composition of Foreign Direct Investment and Protection of Intel-lectual Property Rights: Evidence from Transition Economies.” European Economic Review 48 (1):39–62.
Javorcik, Beata Smarzynska, and Mariana Spatareanu. 2005. “Disentangling FDI Spillover Effects:What Do Firm Perceptions Tell Us?” In Does Foreign Direct Investment Promote Development? ed.Theodore Moran, Edward Graham, and Magnus Blomström, 45–71. Washington, DC: Institute forInternational Economics.
Keller, Wolfgang.1996. “Are International R&D Spillovers Trade-Related? Analyzing Spillovers amongRandomly Matched Trade Partners.” European Economic Review 42 (8): 1469–81.
———. 2002. “Geographic Localization of International Technology Diffusion.” American EconomicReview 92 (1): 120–42.
Kokko, Ari, Ruben Tansini, and Mario Zejan. 1997. “Trade Regimes and Spillover Effects of FDI:Evidence from Uruguay.” Stockholm School of Economics.
Krishna, Pravin, and Devashish Mitra. 1998. “Trade Liberalization, Market Discipline, and Productiv-ity Growth: India.” Journal of Development Economics 56 (2): 447–62.
Mansfield, Edwin, and Anthony Romeo. 1980. “Technology Transfer to Overseas Subsidiaries byU.S.-Based Firms.” Quarterly Journal of Economics 95: 737–49.
Maskus, Keith E. 2000. Intellectual Property Rights in the Global Economy. Washington, DC: Institutefor International Economics.
McCalman, Phillip. 2001. “Reaping What You Sow: An Empirical Analysis of International PatentHarmonization.” Journal of International Economics 55 (1): 161–86.
Moran, Theodore. 1998. Foreign Direct Investment and Development. Washington, DC: Institute forInternational Economics.
Noland, Marcus, and Howard Pack. 2003. Industrial Policy in an Era of Globalization: Lessons from Asia.Washington, DC: Institute of International Economics.
Peri, G. 2003.“Knowledge Flows, R&D Spillovers, and Innovation. Department of Economics, Universityof California, Davis.
Ramachandaram, Vijaya. 1993. “Technology Transfer, Firm Ownership, and Investment in HumanCapital.” Review of Economics and Statistics 75 (4): 664–70.
Rhee, Yung Whee. 1990.“The Catalyst Model of Development: Lessons from Bangladesh’s Success withGarment Exports.” World Development 18 (2): 333–46.
Roberts, Mark, and James Tybout, eds. 1996. Industrial Evolution in Developing Countries. New York:Oxford University Press for the World Bank.
Rodriguez-Clare, Andres. 1996. “Multinationals, Linkages, and Economic Development.” AmericanEconomic Review 86 (4): 852–73.
———. 2004. “Microeconomic Interventions after the Washington Consensus.” Inter-AmericanDevelopment Bank, Research Department, Washington, DC.
Rodrik, Dani. 1993. “Taking Trade Policy Seriously: Export Subsidization as a Case Study in PolicyEffectiveness.” NBER Working Paper 4567, National Bureau of Economic Research, Cambridge, MA.
Saggi, Kamal. 1996. “Entry into a Foreign Market: Foreign Direct Investment versus Licensing.” Reviewof International Economics 4 (1): 99–104.
———. 2002. “Trade, Foreign Direct Investment, and International Technology Transfer: A Survey.”World Bank Research Observer 17 (2): 191–235.
Schiff, Maurice, and Yangling Wang. Forthcoming. “North-South and South-South Trade-RelatedTechnology Diffusion.” Journal of Development Studies.
Sjoholm, Fredrik 1996. “International Transfer of Knowledge: The Role of International Tradeand Geographic Proximity.” Weltwirtschaftliches Archiv 132 (1): 97–115.
Smith, P. J. 2001. “How Do Foreign Patent Rights Affect U.S. Exports, Affiliate Sales, and Licenses?”Journal of International Economics 55 (2): 411–40.
Lessons from Empirical Research on International Technology Diffusion 25

Srinivasan, T.N. 2004. “Entrepreneurship, Innovation, and Growth.” In Accelerating Development:Annual World Bank Conference on Development Economics, ed. F. Bourguignon and B. Pleskovic,73–104. Washington, DC: World Bank.
Sutton, John. 2002.“Rich Trades, Scarce Capabilities: Industrial Development Revisited.” Economic andSocial Review 33 (1): 1–22.
Tan, Hong, and Geeta Batra. 1995. “Technology Spillovers from FDI: Evidence from Mexico.” WorkingPaper, Private Sector Development Department, World Bank, Washington, DC.
Tybout, James. 2000. “Manufacturing Firms in Developing Countries: How Well Do They Do andWhy?” Journal of Economic Literature 38 (1): 11–44.
World Bank. 2004. Doing Business. Washington, DC: World Bank.
26 Global Integration and Technology Transfer

Part I
Literaturesurveys


Econometric versusCase Study Approaches
to Technology Transfer
Howard Pack
29
2
There has been increasing interest in recent years in econometric estimates of theproductivity performance of firms in developing countries (Aw, Chen, and Roberts2001; Pack and Paxson 2001; Tybout 2000; Kraay [chapter 7 of this volume]; andKraay, Soloaga, and Tybout [chapter 11 of this volume]). There is also a large andrich case study literature, insights from which could help frame relevant questionsand point out the limitations of econometric studies as a result of the absence ofinformation in censuses of manufacturing that has been shown to be relevant inextensive case study interviews.
The major determinant of productivity is the effort of firms to absorb technol-ogy. The core of the industrial development process consists of obtaining and assim-ilating new technology. New technologies consist of hardware—machinery andnew buildings—and the knowledge or software with which to run a plant. Firmscan obtain new technology by purchasing new or used equipment (foreign ordomestic), by engaging in technology licensing agreements, and by hiring consult-ants. Firms improve purchased technology and occasionally develop their ownthrough formal and informal research and development (R&D) programs. Theymay learn about the software component from newly hired workers with experienceat other firms or recent university studies, from informal interaction with moreadvanced firms (domestic and foreign), and from purchasers of their output or pur-veyors of their inputs.
Most econometric studies that attempt to study these processes rely onobservations obtained from periodic manufacturing censuses, 5 or 10 years apart,or from annual industrial surveys that collect measures of output (gross receipts,

30 Global Integration and Technology Transfer
value-added) and inputs (number of workers, capital value at historic acquisitioncosts, current price intermediates) but do not permit fine-grained analysis of thedeterminants of a firm’s evolution. Analyses in which researchers collect the datathemselves have generated richer data, which allow the exploration of more complexissues (Bigsten and others 2002).
In contrast, case studies provide a rich source of evidence on the details of thetransfer and absorption process and offer important clues to the type of microeco-nomic detail that would contribute to deeper understanding of the process. Econo-metric and case studies are complementary. It is impossible for econometric studiesto include many of the subtle insights that have been obtained from exhaustive casestudies of firms. But case studies are often concerned largely with the process oftechnology acquisition and neglect to measure the ultimate productivity effect onthe firms studied or the impact on other firms and sectors, phenomena that arebetter addressed by analyzing large industrial surveys and censuses of manufactur-ing. Moreover, given the substantial time spent in each plant, it is difficult to gener-ate a sample that is sufficiently large that the results can be viewed as robust.
Modes of Technology Transfer forIndividual Firms
Importation of New Equipment or Purchaseof Locally Produced Equipment
The purchase of equipment is a potent potential source of new technology if thenew vintage is more productive than that currently employed by the firm. Gains canbe obtained from both new and used equipment, but I concentrate on new equip-ment purchases. The gain in efficiency embodied in equipment is reflected indesigns that (potentially) allow greater output per machine hour, reduced labor andmaterial inputs per unit of output, or both. Such physical productivity improve-ments are realized in the country of origin by plants that purchase the machine andby firms in other countries with similar per capita income. Whether these potentialgains lead to actual reductions in unit cost depends on the price of the equipmentand the ability of firms to realize the gains in efficiency embodied in the design ofthe equipment, referred to as technology assimilation or absorption.
Given the very limited capacity of domestic machinery producers, in all but ahandful of developing countries, firms in the modern manufacturing sector buymost of their equipment abroad. Any equipment (including secondhand equipment)that reduces unit costs should be viewed as providing a productive infusion oftechnology. Despite the potential improvement in efficiency bestowed by newmachinery, as measured by the reduction in unit labor inputs, there is abundant
30

Econometric versus Case Study Approaches 31
evidence in many developing countries that the productivity improvements offeredby superior equipment are frequently not realized in local factories.1 In many cases,local firms lack the technological knowledge or do not face competitive pressure toachieve the technical efficiency that characterizes firms in industrial countries thathave adopted identical machinery. Knowledge and incentives are important.
Knowledge Obtained in Market Transactions
A considerable literature documents the efforts of firms to increase productivitywith a given complement of plant and equipment (Dahlman and Westphal 1981;Hobday 1995; Katz 1987; Kim 1997; Lall 1987; Matthews and Cho 2000; Pack1987). They hire consultants, engage in technology licensing agreements, andundertake R&D in order to realize the potential of new equipment.
Firms in most successful newly industrialized countries have undertaken oneor more but not necessarily all of these actions. A voluminous case study literaturedescribes such efforts, but many studies provide no numerical evidence of theireffectiveness in raising productivity or reducing costs. The emphasis in manystudies is on the process of knowledge acquisition rather than its results.The evidence shows that firms in the Republic of Korea and Taiwan (China) performmuch better than firms in Argentina, India, Kenya, and the Philippines, where thepolicy environment often discouraged productive technology transfer, sinceacceptable levels of profits were obtainable in the narrow, protected domesticmarket.2 In contrast, in countries in which large export growth has been realized,the cost of innovative efforts to assimilate technology could be allocated over thevery large quantities sold in the world market.
Foreign direct investment may be another source of new knowledge for themanufacturing sector. Foreign firms that establish new production are typicallycloser than local firms to world best practice. They may improve the performanceof the sector in which they operate or in vertically related sectors. Improvementmay occur voluntarily, if they allow other firms to observe their operations, orinvoluntarily, as firms respond to increased competition. If managers and workersleave for locally owned firms or provide knowledge in informal settings, the diffusionof knowledge will affect productivity of firms in the same and related industries.3
Joint ventures, though somewhat different in ownership structure from FDI, mayyield similar benefits.
Knowledge Obtained as a Byproduct of Market Transactions
Firms may obtain technology at low or zero cost from transactions in both theiroutput and input markets. A considerable case study literature (Hobday 1995,Kim 1997) documents that knowledge has been acquired by firms that engage in
31

32 Global Integration and Technology Transfer
exporting. The knowledge obtained consists of process improvements, qualitycontrol, and information about markets that allows firms to achieve a more prof-itable product mix.4 Foreign firms may provide this proprietary knowledge in antic-ipation of its beneficial effects on their own profits (Pack and Saggi 2000).
It is also possible that firms obtain knowledge from newly hired workers as aresult of their experience with previous employers (Marshall 1890; David andRosenbloom 1990; Henderson 1999; Quigley 1998). These are pecuniary externaleconomies to the firm and the industry.5 Resurrecting Marshallian economies,some studies argue that firms obtain knowledge from other firms in the same andrelated industries in an informal manner, through social interaction and directobservation of other plants, a process that is much more difficult to document.The most convincing case studies are based on interviews in Taiwan (China)(Saxenian and Hsu 2001) and in Silicon Valley in the United States (Saxenian 1994).
Determinants of the Demand for and Productivityof Technology Transfers
Despite the potential for firms in all countries to participate in the internationaland intranational transfer of technology, such transfer has occurred mainly incountries that have enjoyed sustained growth in per capita income and attemptedto penetrate international markets. This impression may or may not reflect thereality of transfer. The Republic of Korea and Taiwan (China) have been subjectedto much more intensive analysis than Colombia, Nepal, or Tanzania, but one sus-pects that casual empiricism is correct. Economies that have had rapid growth arelikely to have experienced greater technology inflows. Sustained growth has usuallybeen characterized by limited fluctuations in GDP and by low inflation. The pro-ductivity benefits from the search for and adoption of new technology are morelikely to translate into improved profitability with such stability than in an envi-ronment characterized by sustained decline, as in Tanzania or by substantial cyclesand inflation, as in many Latin American economies.6 In a country such asArgentina, with persistent high inflation and unpredictable changes in relativeprices of purchased inputs and output, increases in productivity may be offset byunanticipated changes in relative prices. The rewards to astute financial transac-tions and negotiated lower input prices are likely to far outweigh the reductions incost obtainable from improved total factor productivity (TFP) in the plant. In peri-ods of significant downturns in GNP, a not infrequent occurrence, the existence ofextensive excess capacity also militates against the systematic search for new tech-nology. This implies that even if some of a firm’s efforts to acquire and utilizetechnology cannot be precisely measured, inclusion of the rate of growth andthe standard deviation of output of the sector to which it belongs may providesome indication of unmeasurable technology transfers, with larger transfersoccurring in less volatile environments.

Econometric versus Case Study Approaches 33
The international trade regime has several effects on incentives to obtain newtechnology. High rates of effective protection, especially if they are viewed as likelyto continue, may reduce incentives to reduce cost. Although in principle, cost-reducing technology transfer will always improve profits, firms may be satisfiedwith existing rates of return and not undertake the required effort.7 Conversely, ineconomies in which exporting offers profitability similar to sales in domestic mar-kets, firms may attempt to acquire new technology that allows them to produce atlower cost, higher quality for the international market, or both. Thus differencesin the trade regime may account for some of the observed variation in technologytransfer levels across less developing countries. In addition, firms in countries thathave more favorable incentives for exporting may more easily obtain the foreignexchange necessary to import equipment and pay for knowledge, in the form oftechnology licenses, consultants’ fees, or other expenses.
A third set of policy variables that may affect the ability of firms to acquiretechnology is the intellectual property rights regime of the country. Difficulty inenforcing contracts dealing with technology licenses or the ability to obtain legalredress if the local partner in a joint venture illegally transfers proprietary knowledgeto other firms may limit the supply of technology (or raise its price), even in thepresence of good macroeconomic and trade policies.
The Case Study Literature
In discussing the case studies, I consider their treatment of three different aspectsof the development of technological abilities. The first is technology transfer perse (T), including the source of equipment, the hiring of consultants, the signing oftechnology licensing agreements. The second is efforts to absorb the technologytransferred (A). Typically, this measure is descriptive, recording the number ofpersonnel engaged in the transfer effort, the resources expended, and the involve-ment, if any, of the foreign suppliers. The third measure, R, is the result of T andA. It captures increases in TFP or declines in production cost.
Few of the case studies document T in great detail, most describe A extensively, andfew attempt to assess R. The descriptive studies that omit R are nevertheless useful forthe insight they provide, though their ultimate impact cannot be reliably assessed byobjective measures but must rely on the reader’s evaluation of the evidence.
Case Studies of Technology Transfer in Countrieswith Trade Restrictions
Most of the early case studies were conducted in India and Latin America. Thisreflects the fact that these studies were initiated in the 1970s, when the greatestconcentration of industrial skills in the developing world existed in these regions,following two decades or more of import-substituting industrialization. As

34 Global Integration and Technology Transfer
production abilities were accumulated in the fast-growing Asian countries, a newround of research in the 1990s focused on them.
The most extensive set of case studies in Latin America is that published in avolume edited by Katz (1987). The studies in his volume fit mainly in the A cate-gory. The major question they address is how plants were able to improve the pro-ductivity of equipment already in place. There is very little detailed discussion ofthe nature of the technology transfer process, such as the source of equipment orwhether suppliers provided technical help, the emphasis being on the adaptiveefforts of local firms. Except in one case, there is no measure of the impact of theseefforts. Neither the magnitude of TFP growth nor unit cost reduction is calculated.
The firms studied in Katz’s volume did not use the foreign equipment purchasedaccording to the guidelines equipment manufacturers provided. Local engineersaltered the production process to increase the output obtained from a given com-plement of machines by adjusting the production process to allow the use of localraw materials, given their lower cost or the difficulty of obtaining foreign exchange topay for imported inputs. A few new products were developed. As in Organisation forEconomic Co-operation and Development (OECD) countries in their early stage ofindustrialization, most of the technological breakthroughs were “minor” ratherthan major (Rosenberg 1976), involving small changes in machine settings, theaddition of devices that improved performance, and the use of equipment at speedsthat differed from manufacturers’ recommendations. Such innovations had beenobserved earlier in the Republic of Korea and Taiwan (China) in response to a lowuser cost of capital, which provided an inducement to search for capital-savinginnovations (Ranis 1973).8
Cumulatively, the impact of these technical changes altered the importedprocesses significantly (in an engineering sense) and occasionally yielded new prod-ucts. The case studies in Katz’s volume provide detailed histories about the processof assimilation in two or three firms, but they do not provide systematic insightsinto either the initial process of technical acquisition or the economic impact ofthe efforts they describe. There is no attempt to determine the impact of theseadaptations on other firms in the same local industry or the effect on downstreampurchasers when the products are intermediates. Where the output is consumergoods or final investment goods, no welfare assessment is made of the impact ofprice changes or the greater or more appropriate variety of goods. Nor is there evi-dence on the interactions of the firms with upstream suppliers. The detaileddescriptions of the process of technical adaptation are thus bereft of a systematicanalysis of the economic impact of the process. One is informed of the process ofhow firms move along or shift to another isoquant, but there is no confrontationof such moves with an isocost curve that would indicate whether allocative effi-ciency or TFP improved.

Econometric versus Case Study Approaches 35
An analysis of the petrochemical industry by Cortes and Bocock (1986) con-centrates on the process of transfer, T, but does not consider A or R. Cortes andBocock are concerned mainly with the terms of transfer, reflecting a large litera-ture that argues that the charges to less developing countries for technologylicensing agreements were excessive. The agreements analyzed were executed inthe 1960s and 1970s. The final contracts ranged from simple licensing (with aninitial lump-sum payment plus a royalty equal to a percentage of annual revenue)to majority ownership by the local firm in a joint venture. In some agreements,the foreign firm provided all of the equipment and software; in others local com-panies assembled many of the elements from different suppliers. The evidence onthe quality of technology transferred and its price was too ambiguous to permitany clear-cut conclusions. There is no evaluation of the effectiveness of the trans-fer as opposed to the details of the negotiations and price. The productivity of theinitial transfer is not investigated.
Lall (1987) conducted a comprehensive set of studies in India. The emphasis ison A, rather than on the technology transferred to India or further diffusionwithin India. There is little evaluation of the impact on costs or productivity,though there is a discussion of exports as a potential indicator of the ability tolearn sufficiently to compete on world markets.9 The study’s exhaustive taxonomyis helpful in underlining the difficulties that may occur in econometric estimatesof the impact of technology diffusion. Table 2.1, taken from Lall, provides adescription of the technological activities of a firm, divided into six categories:project preparation, project execution, process engineering, product engineering,industrial engineering, and technology transfer. Any of the activities listed in thetable can reduce costs or increase productivity.
These are much finer categories than can be investigated in a large-scale surveyinvolving many firms. Case studies have been based on spending days or weeks atindividual firms to obtain this type of qualitative information. Few of these activi-ties will be recorded in the questionnaires typically employed in industrial surveysand censuses. Thus it is unlikely that any census or survey in less developing coun-tries captures the details of production developments that constitute the basis oftechnology transfers.
Does the absence of such elements present special difficulties for econometricstudies based on broader categories of technology transfer? For example,improved knowledge of quality control by a U.S. firm may be part of the knowl-edge package transferred in a licensing agreement, or it may be embodied in newequipment. The results of successful efforts are packaged in the technology,embodied or disembodied, and the price will reflect the productivity of thecomponents, assuming a relatively competitive market for knowledge. Significantpositive coefficients on a variable such as payments for technology cannot distinguish

36 Global Integration and Technology Transfer
among the sources of the productivity boost that could affect any of the activities,but such detailed knowledge may not be relevant for many issues, such as whethergovernments should loosen their restrictions on technology licensing payments.
Lall’s studies and those contained in Katz’s volume show that in some, but notall, categories of technology development, there has been progress that shouldhave led to TFP growth for firms. However, growth accounting research at theindustry level in India and several Latin America countries suggests that TFPgrowth in individual industrial sectors between 1960 and 1985, when the casestudies were conducted, was either very low or negative (Ahluwalia 1985; Bonelli1992). Thus even if there were cost-reducing innovations in individual firms,something never explicitly investigated, their significance was not a generalphenomenon leading to industrywide TFP growth.10 This may partly have
Project Project Process Product Industrial Technologypreparation execution engineering engineering engineering transfer
Identification Basic Debugging Assimilation Improved Developmentof suitable process of new of product workflow and of localproject design plant design scheduling suppliers and
subcontractors
Feasibility Basic and Initial Initial Better Transfer ofstudies detailed adaptation adaptation working know-how
engineering to local raw of product practices, to buyersmaterials, to local time and working market needs motionconditions, studieslayout
Specification Equipment Balancing of Improvement Monitoring of Setting up ofof product search, facilities to in product capacity turnkeyrange, input procure- remove design utilization, projects fortesting ment, bottlenecks, coordination customersrequirements testing reach full of different (capital
capacity stages goods firms)
Specification Civil Achievement Adaptation Evaluation of Setting upof scale of construction of adequate to export in-house and of projectsproduction quality market bought-out for similar
control needs components plants
Identification Ancillary Equipment New product Taking outof technology services maintenance introduction of patents;
and repair; by licensing developmentsome in-house of blueprintsspares andmanufacture
TABLE 2.1 Technological Capabilities in Manufacturing Industry
Source: Lall (1987).

reflected the limited demand for technological knowledge by most firms in the1960s and 1970s in the highly protected domestic environment of countriesengaged in import substituting industrialization.
A few case studies have been conducted in Sub-Saharan Africa. Pack (1987)analyzes the determinants of TFP in manufacturing firms in Kenya. In four multi-national textile plants, equipment of various vintages was transferred to local sub-sidiaries. All of the plants employed a large contingent of managers from thehome firm. The plants achieved surprisingly high levels of TFP relative to Britishtextile mills using identical equipment. The precise level of TFP relative to Britishplants depends on the assumed elasticity of substitution, s. With an assumedvalue of 0.5, the Kenyan firms achieve relative TFP of roughly 70 percent, most ofthe shortfall being due to the protectionist policy regime, which encouraged shortproduction runs. This implies that the combined transfer of hardware and knowl-edge was quite successful in the case of fully owned subsidiaries. TFP in multina-tional firms was almost certainly greater than it would have been in locally ownedcompanies. A comparison with local firms producing similar products but relyingon technology licensing would provide an important contrast, as it might beargued that more knowledge is transferred where the potential for unauthorizedknowledge seepage is lower (see chapter 3 by Saggi for analysis and references).
The most complete study examines a sample of firms in Ghana’s manufacturingsector (Lall and others 1994). It measures “technological competence,” proxied bythe number of educated owners and employees, but it does not discuss the sourcesof hardware, and software, or the productivity with which they are deployed.
Case Studies in Export-Oriented Countries
Case studies in protectionist countries explore mainly heavy industries characterizedby relatively large-scale, capital-intensive production. The firms were oftenenclaves in which forward and backward linkages to the rest of the industrial sectorwere limited. Very often there were only a few firms in the sector, and many of theskills generated in production had limited uses in other industrial branches.
In contrast, the literature on the export economies emphasizes technologytransfer in newer sectors, such as electronics (Bloom 1991; Hobday 1995; Kim1997; Matthews and Cho 2000). There was also extensive study in the 1970s andearly 1980s of sectors, such as clothing and footwear, in which low-wage countriesdeveloped their early industrial skills based on an initial comparative advantage.In these studies, considerable attention is given to the source of equipment, thehiring of consultants, the signing of technology licensing agreements, and thetransfer to the firms of knowledge from foreign purchasers. Much of this researchalso considers the success of absorption of technology by individual firms.
Econometric versus Case Study Approaches 37

Relatively few studies evaluate either TFP growth or cost reduction. Given thatmuch of the output of the firms was directed to export markets, there is a pre-sumption that the T and A activities were economically efficient, although problemsof intrafirm cross-subsidization leave this an open question.
In almost all of the Asian countries analyzed, the development trajectory ofindustry was rapid. Equipment (often secondhand) was imported in the earlyyears, relevant knowledge was obtained, and both were improved upon by firms(Enos and Park 1988). In the period of labor-intensive development, the 1960sand early 1970s, most of the machinery was readily available on the world market,and the knowledge necessary to produce textiles, clothing, wigs, and simple sport-ing equipment was easily obtained from freely available industry knowledge, con-sultants, and trade publications. Rhee, Ross-Larson, and Pursell (1984) documentthese modes of technology transfer to the Republic of Korea. Their study was thefirst to suggest another mode of transfer, as exporters obtained information,design, and production engineering free of charge. Hou and Gee (1993) obtainedsimilar results in Taiwan (China).
The authors did not examine whether free transfers of knowledge from OECDimporters to Asian exporters improved TFP. Moreover, there was no systematicinvestigation of whether these knowledge transfers were diffused to other firms(nonexporters) through worker mobility, communication among owners, orother modes.11 Whatever its quantitative importance, knowledge transfer occurredover a relatively short period, roughly the decade after the (then) small firms hadbegun operations. The firms were largely in labor-intensive sectors in which the“software” of production had a relatively simple mechanical or chemical engineer-ing base. There was little in the way of complicated science that needed to betransferred. Much of the relevant knowledge was tacit but widely diffused withinOECD countries. As the sectoral structure changed in the 1970s to more capital-and technology-intensive branches, much of the critical knowledge had a morecomplex scientific base, was more codified, and was subject to stricter proprietaryrules. Informal transfer of such knowledge in transactions between buyers and sell-ers became less likely, as they were replaced by more formal licensing agreements.The free knowledge obtained from exporting was thus largely limited to a shortperiod for new firms in labor-intensive sectors.
In econometric analyses attempting to establish a link between exports andproductivity growth, the relatively short period during which learning is sup-ported by OECD importers implies that the dates of the census or survey data arecritical. It would be surprising if Korean or Taiwanese exporters from, say, 1985onward acquired quantitatively significant free knowledge from their purchasers.But economies currently at lower stages of industrialization might still derive suchbenefits. The feedback from exporting to productivity growth needs to be investigated
38 Global Integration and Technology Transfer

with suitably chosen dates, but this is usually impossible given the necessarily arbi-trary dates of officially collected data. Moreover, unless such knowledge transfersare augmented by internal efforts at absorbing these transfers, their impact will below. Interaction effects are important, but the variables available in manufacturingcensuses usually cannot capture these complex interactions.
Descriptions of Asian technology acquisition in the succeeding period innewer, more technology-intensive sectors demonstrate that international transfershave been supplemented by intensive internal absorption efforts (Enos and Park1988; Hobday 1995; Kim 1997). Complex equipment and seemingly completetechnology license agreements rarely produce a fully saleable end product or pro-ductivity improvement unless resources are devoted to mastering the importedtechnology. Such efforts may take several years, even for well-specified productswith a codified knowledge base.A major lesson to be drawn for econometric studies isthe need for precise measures of absorptive effort and the difficulty of specifyingthe correct lag structure. The promised productivity improvement (or product)may come to fruition several years after the technology transfer, the timing being afunction of the absorptive effort after the transfer.
A more detailed summary of some of the case studies underlines a number ofthe implications for econometric estimates of the case studies.
Case Studies in Export-Oriented Economies Kim’s 1997 study of the Republic ofKorea is the most detailed analysis of the transfer and absorption of technology inAsia. The categories he uses in describing the transfer process are similar to thosein table 2.1. For individual firms in automobiles, microwave ovens, and semicon-ductor production, he identifies the foreign firms that supplied the equipmentand discusses many aspects of the transfer process, including the product blue-prints acquired, the technical manuals providing instructions about operatingindividual machines, the expenses incurred to train local engineers abroad, andthe extensive visits by foreign engineers to Korean firms.
How will such activities enter a standard econometric analysis? If firm accountsare precise, many of the payments for productivity-enhancing transfers will bereported. If each of these activities is priced at its marginal productivity for thefirm, total expenses incurred will be an economically meaningful measure. Twocaveats apply. First, some expenditures, such as the living expenses of Korean autoengineers sent abroad for training, are unlikely to be fully or correctly recorded. Inmany instances, firms will not have recorded actual expenditures but simplyacknowledge that workers were sent abroad; the variable used will have to bedummies indicating whether such activities occurred, regardless of the timeperiod and presumably the total learning that occurred. In a similar vein, severalof the firms report that they employed engineers who flew to Seoul from Japan on
Econometric versus Case Study Approaches 39

weekends. It is not clear that such outlays were correctly recorded, yet they areviewed as having had high productivity. If all firms in a large sample had similaromissions, there would not be a problem. However, a reasonable conjecture is thatfirms differ in the accuracy of their accounting.
Second, insofar as the price of technology licenses is the outcome of a bilateralbargaining process in an imperfect market, as suggested by the empirical work ofCortes and Bocock (1986), recorded expenditures across firms may have a tenuousrelation to the productivity of the technology transferred. Prices may not reflectmarginal productivity. While it is impossible to retrospectively deal with suchomissions, interpretation of the econometric results must necessarily take theseinto account. In either case it is possible that precise estimates of the impact oftechnology transfer may not be obtainable given measurement errors and criticalinteractions among the relevant variables.
The preceding paragraph assumes that accounting standards in the Asiancountries are high. However, as the Asian financial crisis unfolded, it became clearthat accurate measures of such standard ratios as the rate of return on equity cap-ital were grossly deficient even in the largest firms with listed equity shares. Withlax general accounting standards, it requires a leap of faith to assume thatreported technology transfer costs and internal R&D measures are accurate, yetthese measures are often used in econometric studies. Moreover, many Asiancountries are characterized by a conglomerate corporate structure in which theallocation of expenses and income among their component firms is arbitrary.Some have centralized research and may charge only part of the expenses for tech-nology acquisition to component firms.12 Relatively arbitrary transfer pricingamong the affiliates may diminish the accuracy of value-added measures in anygiven product line or plant. If the dependent variable in production function esti-mation is value-added by product line or plant, problems arise, as the absolutemeasure is not accurate and changes in transfer pricing among related firms maylead to changes in value-added that are unrelated to any changes in productivity.
Even if expenditures are recorded correctly, the measured impact of technologyexpenditures may be misleading. One or two foreign managers may make non-marginal contributions. One of the Korean auto companies reports that an indis-pensable manager was hired from British Leyland. Without this individual, theentire production process might not have been established; the production functionwould not have existed without him. In contrast, estimates of the impact oftechnology transfers assume the existence of a production function to which agiven technology purchase makes a contribution at the margin. This suggests thatthe impact of some transfers will be underestimated.
All of these are standard problems encountered in attempting to obtain general-izable econometric results. If the estimates contradict those of intensive case studies,
40 Global Integration and Technology Transfer

Econometric versus Case Study Approaches 41
it is necessary to consider whether problems of measurement and specificationhave led to misleading results. Consider, for example, the problem of determiningwhich technology variables are the sources of productivity growth. Say that firmsthat purchase equipment from abroad also send workers for training to the plant ofthe equipment manufacturers but that this training, which is the key to increasedproductivity, is not recorded. Growth in firm productivity may then be mistakenlyattributed to the imported machinery rather than the additional training of theworkers. The entire process should be thought of in Bayesian terms, in which thecase studies provide priors while the sample information leads to revisions thatform the base for the posterior estimates. While this cannot be implemented formally,viewing the case studies and econometric evidence in such a framework is likely tolead to more nuanced insights than sole reliance on either. In the instance justcited, evidence from case studies would suggest that any econometric findings thatmost of the growth of productivity was attributable to new equipment should leadto a re-examination of the survey results to determine whether the recordedresponses on training or expenditures on consultants are consistent (and believable)across firms. The purchase of large amounts of new equipment, for example, willusually be accompanied by significant training. If the data do not indicate suchtraining, caution in interpreting the results is warranted.
Occasionally, case studies are too concerned with establishing their own views;the hypotheses they suggest must be carefully evaluated to ensure that the insightderived from them has validity given the information they report. For example,Kim (1997) contrasts the experience of Hyundai, which utilized many sources ofexternal technology in establishing auto production, with Daewoo, which reliedentirely on General Motors. His plausible view is that Hyundai was forced to learnto integrate different types of knowledge and became more self-reliant, a processthat showed up in higher labor productivity. My own calculation with the data hepresents leads to the conclusion that the two firms had almost identical TFP. Thuseven if one could obtain measures on whether the technology was packaged, as inthe case of Daewoo, or unpackaged (from many sources), as in the case of Hyundai,it may well be the case that the interpretation of the author is open to question.Estimates from a large number of firms are likely to reduce such problems.
Many of the case studies suggest plausible views that an early weaning fromreliance on technology suppliers is superior to minor adaptation of packaged tech-nology and will lead to improved productivity in the long run. Lall (1987) makes thisargument, and it is a recurrent theme in the studies in Katz (1987). But there is noquantitative confirmation of this view in any of the studies, and attempting to testsuch hypotheses would require a degree of detail that is unlikely to be present in offi-cially collected information. If any measures were available, even a measure as simpleas the number of foreign technology suppliers, they would be worth including.

42 Global Integration and Technology Transfer
Kim (1997) describes other aspects of the process by which technology transfertranslates into increased TFP. First, there are long lags between transfer and successfulproduction. Second, even having obtained a seemingly foolproof combination ofhardware and software from foreign suppliers, productive use of these requiresintensive internal efforts by the firm. The interaction of transfer and internal effort isthus a very important component of the payoff from technology transfer, yet there isno obvious way of modeling this, since a multiplicative variable constructed frommultiplying contemporaneous measures of technology transfer and absorptiveeffort may not be adequate. Equipment or software obtained in one year maybecome productive only after application of internal absorption efforts in succeedingyears, with highly variable lag structures. Interviews in case studies can focus onsuch interactions; the data in censuses and surveys are less likely to be amenable tosuch fine-grained testing. All the researcher can do is be aware of the issues raisedby the case studies and interpret the quantitative findings judiciously. Kimdescribes the problems:
Despite the training and consulting services of Ricardo [a foreign consultant] and the
three experts, Hyundai engineers repeated trials and errors for fourteen months before
creating the first prototype. But the engine block broke into pieces at its first test. New
prototype engines appeared almost every week, only to break in testing. No one on the
team could figure out why the prototypes kept breaking down, casting serious doubts,
even among Hyundai management, on its capability to develop a competitive engine.
The team had to scrap eleven more broken prototypes before one survived the test.
There were 288 engine design changes, 156 in 1986 alone. Ninety-seven test engines
were made before Hyundai refined its natural aspiration and turbo-charger engines; 53
more engines were produced for durability improvement, 88 more for developing a car,
26 more for developing its transmission, and 6 more for other tests, totaling 324 test
engines. In addition more than 200 transmissions and 150 test vehicles were created
before Hyundai perfected them in 1992. (1997, p. 122)
These efforts, over a long period of time, partly reflect Hyundai’s inability toobtain all of the relevant knowledge from its Japanese licensor. The time lags andthe interaction between imported knowledge and internal effort that are recordedin such a case study are difficult to replicate in econometric ones, even those basedon careful survey instruments.
Exports and Productivity Even with all of the information obtained from a licen-sor and equipment obtained from firms in industrial nations, Samsung, anothermajor Korean firm, had considerable difficulty producing the central mechanismof a microwave oven.
It took the team a year of eighty-hour weeks to complete the first prototype (in 1976)
but the plastic in the cavity melted in a test. . . . Finally in June 1978, after two years, the

Econometric versus Case Study Approaches 43
team developed a model that survived the test; but it was too crude to compete in the
world market. Samsung incrementally improved the product and developed a
makeshift production line, producing one over a day, then two, which it placed in local
bakeries for feedback from users. (Kim 1997, p. 137)
Samsung’s effort in microwaves was in response to a large order from J.C. Penney.In this case, the export order catalyzed the increase in productivity, with the growthin TFP (or product quality) preceding the actual export but with the causalitygoing from an export order to productivity. The order provided the inducementmechanism that stimulated the internal effort just described that was complemen-tary to imported technology. In principle, a domestic order of comparable sizecould have warranted the investment in product development. However, the sizeof the initial foreign order and its prospective magnitude if there was an initialsuccess, dwarfed any forecast of domestic sales, as Korean per capita income wasthen still far from levels at which microwaves were purchased. Although a produc-tion subsidy could have been offered by the government and achieved a similarresult, officials would have had to be implausibly well informed to have chosenboth the right product and the appropriate firm. This anecdote suggests thatcausality may be very difficult to identify in standard econometric models. Nodata will be available on the date of orders, productivity-augmenting efforts tomake the sales profitable, and the eventual producer surplus generated by the sales.
Kim reports another phenomenon that suggests that externalities from exportsmanifest themselves in ways that standard production function estimates do notcapture. The success of Samsung in producing microwaves and its ability to fulfillexport orders benefited another Korean firm, Lucky Goldstar. Lucky Goldstar hadattempted to reach a technology licensing agreement with Hitachi, a Japanesefirm, but Hitachi had declined to provide knowledge to a potential competitor.After Samsung’s demonstrated success at technological development and exporting,Hitachi agreed to a licensing agreement with Lucky Goldstar, concluding that itmight as well obtain some royalties rather than watch as Lucky Goldstar dupli-cated Samsung’s success or hire workers from Samsung (Kim 1997). While it isdifficult to classify this externality, it is clear from this and other case studies thatpotential technology licensors are more willing to enter agreements once localtechnical ability has been demonstrated, particularly if it meets the market test ofsales in export markets. Lucky Goldstar decreased its costs, and presumablyincreased its profits, as a result of Samsung’s innovation cum exporting. In thiscase, technology development by firm x confers an external economy on y as itobtains a license, probably at a lower cost.13 Such interactions among a smallnumber of key firms cannot be investigated in large samples of firms, yet they mayplay a role. Econometric estimates can thus be fruitfully supplemented by thefindings, judiciously interpreted, of case studies.

44 Global Integration and Technology Transfer
Examining the development of the electronics industry in several newly indus-trial countries in Asia, Hobday (1995) also underlines the importance of the con-tracts local firms obtained as original equipment manufacturers to companiessuch as Radio Shack. The firms not only received technical aid from their cus-tomers but, given the large size of the orders, were more willing to undertake theirown R&D. Thus the original finding of Rhee, Ross-Larson, and Pursell (1984)about “externalities” from exporting is supplemented in newer industries by therole that large foreign sales play in encouraging R&D. Such effects are likely to bedifficult to sort out in large multiproduct firms, but nevertheless the case studiesare quite uniform in suggesting this link between exports and productivity growth,mediated by R&D.
With perfect data sets, exports would be divided into those occurring underoriginal equipment manufacturer (OEM) agreements and those on the spotmarket, with OEM agreements more likely to generate technology transfers thanthe latter; absent such information, any results on exporting have to be carefullyinterpreted. But it is clear from these examples that testing the relation betweenproductivity and exports can be difficult. Studies such as Clerides, Lach, andTybout (1998), while suggestive of the directions of causation between produc-tivity and exports, have to be viewed as tentative in light of case studies that delin-eate a very complex relationship between export orders and efforts to enhanceproductivity. The inability to differentiate among such micro phenomena mayaccount for the widely disparate results found on the productivity-export link.
More generally, differences across countries in management’s ability to perceiveand exploit opportunities underscores the need for extremely careful formulationof hypotheses. Lucky Goldstar management noted and acted on the potential to goback to Hitachi. Many of these managers had experience in high-technology firmsin the United States and were immersed in an entrepreneurial culture. In manycountries, such opportunities will not be seized, and researchers could mistakenlyconclude there were no externalities. Differences in the entrepreneurial abilities offirms may lead to very different outcomes given the same options.14
Tests of such phenomena can be suggested, for example, making the timeprofile of licensing in firm A in industry i a function of the exports of firm B inindustry i. But given the multiple determinants of licensing decisions, this islikely to be too simple. Such case studies highlight the need for caution inreaching conclusions about the presence or absence of benefits from exportingin addition to the standard gains in national income.
Foreign Direct Investment Consider the impact of FDI on firm productivity inthe recipient country. Some authors (Rodríguez-Clare 1996; Rivera-Batiz andRivera-Batiz 1990) suggest that many of the (pecuniary) externalities will manifest

Econometric versus Case Study Approaches 45
themselves in upstream and downstream firms rather than in firms in the sameindustry. FDI can lead to an increase in productivity in the host economy throughdiffusion to firms in the same sector as well as backward and forward linkages.The starting point in understanding the role of linkages is the market imperfec-tion that exists in the production of new goods or the use of new technologies inan economy. Given that some of the benefits of FDI will be captured by con-sumers as consumer surplus (or by downstream producers as producer surplus),there is a positive externality that generally leads to insufficient innovation orentry. Goods with positive net social surplus will not be introduced if the profitsfrom doing so do not compensate for the costs of introducing the good (Romer1994). The local market may be too small to establish a profitable firm.
If these inputs are nontradable, domestic firms will not have access to them,making them less productive. All firms would be better off if these inputs wereproduced locally, but given the market imperfection noted above, this does nothappen. When inputs are tradable, local firms often contend that imported inputsraise their costs, because of transportation costs, the higher costs of altering thedesign of the input if the supplier is far away, the need to maintain higher inven-tories because of the fixed costs of transportation, uncertainty about timely deliv-ery, excess costs imposed by the absence of local agents able to set up machinery oradvise firms on the most suitable intermediates, and so forth.15 Say that a multi-national corporation establishes production. Under these conditions, it generatesa positive externality enjoyed by the local firms that now have access to this input(see Rodríguez-Clare 1996).16 This holds for both backward and forward linkages.That is, both users other than the foreign firm and supplying firms now haveaccess to the locally supplied input, increasing their producer surplus. Firms couldnot charge for all of these impacts, and the impact of the technology transfer willbe underestimated using econometric evidence alone.
A number of case studies consider one or more of these issues. Ranis and Schive(1985) document the impact in Taiwan (China) of the establishment of a branch ofthe Singer Sewing Machine Company. With Singer’s help, new firms were estab-lished and existing ones improved. While the qualitative evidence indicates thatthere were benefits from Singer’s entry, no estimate of their size is provided.17
Meyanathan (1994) provides interesting anecdotal evidence, including a briefdiscussion of the impact of Intel’s plant in Singapore. Lim and Fong (1991) cite alarge number of instances of foreign firms having beneficial effects in Malaysia,Singapore, Taiwan (China), and Thailand. None of these studies considers the fullset of benefits just noted, however, or estimates the magnitude of the benefits.While the qualitative properties have the right signs, they provide no guidelines topolicymakers about the magnitude of benefits and thus offer little guidance aboutthe desirable size of appropriate subsidies.

46 Global Integration and Technology Transfer
Labor Mobility Saxenian (1994) and others have documented that firms acquireconsiderable amounts of knowledge from the workers they hire. Such processesare indeed one of the central tenets of discussions of agglomeration economies(David and Rosenbloom 1990; Quigley 1998; Henderson 1999). Quigley (1998)and Henderson (1999) rely on a variety of indirect productivity tests and do nottry to sort out the various sources of agglomeration economies. Some of thecase studies, particularly Kim (1997) and Hobday (1995) identify and describethe role of key personnel, largely nationals educated and employed abroad, whohave returned and provided critical knowledge. Kim reports that a U.S.–educatedKorean who had achieved a high managerial position at Motorola played a criticalrole in the development of Samsung’s semiconductor operations. He alsodescribes the impact of four Korean graduates of major U.S. universities with con-siderable work experience who were recruited to return to the Republic of Korea.Such critical personnel are difficult to model within a statistical study, as theirnumbers and total salaries will be tiny within large firms, but their impact may bedisproportionately large.18 Further complicating the picture is the possibilitythat a key role of FDI stems from the movement of foreign workers to locallyowned firms. Schive (1990) provides evidence of the considerable movement ofengineers and scientists from foreign-owned firms in Taiwan (China) to locallyowned firms.
Summary and Conclusions
Given the many questions that cannot be answered by case studies, more system-atic evidence is needed to confirm or disprove some of the conjectures based onthem. But caution is needed in drawing strong inferences from econometric stud-ies about the impact of technology diffusion on productivity.
The case studies raise several modeling issues:
1. It would be useful to estimate the rate of growth and fluctuations in output forthe sector to which individual firms belong, as they provide an importantconditioning variable through their effect on the decisions of firms on theprobable benefit of productivity improvements relative to financial assetmanagement.
2. Knowledge provided by OECD importers is likely to be a function of whetherthe product is old (and proprietary knowledge less important) or new (andmost of the relevant knowledge is proprietary). Some indication of each firm’sproduct mix is important.
3. Measures of internal absorption efforts are critical, as the payoff to technologytransfers is contingent on them.

Econometric versus Case Study Approaches 47
4. Given the likelihood of a variable lag structure between efforts to improve pro-ductivity and their realization, measures of absorptive effort need to be cumu-lative rather than for a “typical” year.
5. The numbers of foreign technology suppliers, if available, would be useful totest views that technological independence yields greater TFP growth thantechnological dependence.
6. The feedback from exporting to productivity growth needs to be investigatedwith suitably chosen dates rather than simply abiding by the necessarily arbi-trary dates of officially collected data. It may be more important early in theindustrialization process and for a relatively short period of time.
7. Where possible, it would be helpful to divide exports into those occurringunder OEM agreements and those on the spot market; absent such informa-tion, any conclusions on the relation between exporting and productivity haveto be carefully hedged. The timing of export orders and increased R&D in theproduct area is also important to consider, though the collection of suitabledata is clearly a major problem. It is necessary to have precise measures ofabsorptive effort and to specify a plausible lag structure, as the promised pro-ductivity improvement (or product) may come to fruition several years afterthe technology transfer, the timing being a function of the absorptive effortafter the transfer.
8. The benefits of FDI in sector j may appear in firms in all sectors that purchasethe same inputs from sector k, established as a result of new demand by the for-eign firm. Establishing a causal link would require information not only oninput-output relations but also on whether firms in sectors a … j, l – z werebegun as an indirect consequence of FDI in j.
9. If TFP growth is partly due to technology licensing agreements, measured byroyalty payments, the availability of licenses may itself be endogenous, aresponse to the perception of the growing technological ability of developingcountries. An examination of the time profile of licensing in firms in industry ias a function of the exports of other firms in the same industry would be ofinterest in testing the possibility that greater competence of local firms inducesforeign firms to be more forthcoming in their licensing behavior.
Notes
1. See Pack (1987) for examples from Kenya, the Philippines, and Tanzania.2. Protection raises the profitability of domestic sales, generating an income effect that may discour-
age cost-reducing efforts. However, the greater opportunity cost of not engaging in such effort may spurinnovation, a substitution effect. Arguments that import-substituting industrialization discourages thesearch for productivity growth assume that the income effect outweighs the substitution effect.
3. Saggi (chapter 3 in this volume) contains an excellent review of the extensive literature.

48 Global Integration and Technology Transfer
4. Westphal (2002) contains a very thorough review of the issues and evidence.5. If workers pay for these gains by accepting reduced wages, there is no welfare gain. Workers are
more likely to have paid for such acquisition of knowledge if it consists of general rather than firm-specificknowledge.
6. One of the explanations for the convergence between per capita income in the United Statesand the other OECD countries toward U.S. per capita income in the years 1950–75 is the better man-agement of domestic demand and the greater willingness of firms to invest in equipment and software,often acquired from the United States.
7. As noted earlier, there are income and substitution effects that work in opposite directions.8. In principle, an increase in the user cost of capital should lead to a search for any cost-saving
innovation, but it often seems to lead to a focus on using equipment more intensively (employing secondor third shifts, for example).
9. Exports do not prove definitive evidence of such ability, as they may be cross-subsidized byprofits in the domestic market earned by other products within a multiproduct firm or encouraged bygovernment subsidies.
10. The failure of industrywide estimates of TFP growth to confirm individual firm studies proba-bly reflects a selection bias. The choice of firms in individual studies may reflect the authors’ prior per-ceptions that these firms were engaged in intensive technological effort—it would not be very interestingto spend six months in a firm that undertook no such activities.
11. Pack and Saggi (2000) analyze the determinants of such diffusion.12. See the excellent discussion of some of the accounting practices among the Korean chaebol in
Chang (2003).13. Such instances of changed willingness of foreign technology suppliers to offer local firms pro-
prietary technologies are not found in case studies in India or Latin America, presumably reflecting theinability of local firms there to offer a credible threat to international licensors. Most of the innovationefforts were directed to redressing various handicaps imposed by the import-substituting industrial-ization regime itself.
14. Nelson and Pack (1999) emphasize the role of entrepreneurship as part of the explanation ofthe rapid productivity growth in some Asian countries.
15. For estimates of the costs of some of these, see Pack (1987).16. Following the lead of Scitovsky and Chenery, Pack and Westphal (1986) argue that such a
situation may justify investment coordination.17. Permission for multinational corporations to operate within the local economy may be condi-
tioned on their achieving a given share of local value-added, motivating foreign firms to build up localsuppliers. Such a condition runs the danger of encouraging inefficient local suppliers and ensuringdemand by multinational corporations for protection in the domestic market or for export subsidiesto offset the excess cost of domestic sourcing of inputs. Multinational corporations may voluntarilyattempt to promote local suppliers in order to reduce their own costs.
18. See the Wall Street Journal (1990) for one description of the role of returning Taiwanese nationals.
References
Ahluwalia, Isher Judge. 1985. Industrial Growth in India. Delhi: Oxford University.Aw, Bee Yan, Hiaomin Chen, and Mark J. Roberts. 2001. “Firm-Level Evidence on Productivity Differ-
entials and Turnover in Taiwanese Manufacturing.” Journal of Development Economics 66 (1): 51–86.Bigsten, A., P. Collier, S. Dercon, M. Fafchamps, B. Gauthier, J.W. Gunning, A. Isaksson, A. Oduro, R.
Oostendorp, C. Pattillo, M. Soderbom, F. Teal, and A. Zeufack. 2002. “Do African ManufacturingFirms Learn from Exporting?” Centre for the Study of African Economies Working Paper Series2002–09 (September): 1–33. Oxford University, Oxford.
Bloom, Martin. 1991. Technological Change in the Korean Electronics Industry. Paris: Organisation forEconomic Co-operation and Development.

Econometric versus Case Study Approaches 49
Bonelli, R. 1992. “Growth and Productivity in Brazilian Industries: Impacts of Trade Orientation.”Journal of Development Economics 39 (1): 85–111.
Chang, Sea-Jin. 2003. Financial Crisis and Transformation of Korean Business Groups: The Rise and Fallof Chaebols. Cambridge: Cambridge University Press.
Clerides, Sofronis, Saul Lach, and James R. Tybout. 1998. “Is Learning by Exporting Important? Micro-Dynamic Evidence from Columbia, Mexico, and Morocco.” Quarterly Journal of Economics 113 (3):903–47.
Cortes, Mariluz, and Peter Bocock. 1986. Transfer of Petrochemical Technology to Latin American. Balti-more: Johns Hopkins University Press.
Dahlman, Carl J., and Larry F.Westphal. 1981.“Technological Effort in Industrial Development: An Interpre-tative Survey of Recent Research.” World Bank, Washington, DC.
David, Paul, and Joshua L. Rosenbloom. 1990. “Marshallian Factor Market Externalities and theDynamics of Industrial Location.” Journal of Urban Economics 28: 349–70.
Enos, John, and W.H. Park. 1988. The Adoption and Diffusion of Imported Technology: The Case ofKorea. London: Croom Helm.
Henderson, Vernon. 1999.“Urbanization in Developing Countries.” Department of Economics, BrownUniversity, Providence, RI.
Hobday, Mike. 1995. Innovation in East Asia: The Challenge to Japan. London: Edward Elgar.Hou, Chi-Ming, and San Gee. 1993. “National Systems Supporting Technical Advance in Industry: The
Case of Taiwan.” In National Innovation Systems: A Comparative Analysis, ed. Richard R. Nelson.New York: Oxford University Press.
Katz, Jorge, ed. 1987. Technology Generation in Latin American Manufacturing Industries. London: Macmillan.Kim, Linsu. 1997. From Imitation to Innovation: Dynamics of Korea’s Technological Learning. Boston:
Harvard Business School Press.Lall, Sanjaya. 1987. Learning to Industrialize. London: Macmillan.Lall, Sanjaya, Giorgio Naveretti, Simon Teitel, and Wignaraja Ganeshan. 1994. Technology and Enterprise
Development: Ghana under Structural Adjustment. New York: St. Martin’s Press.Lim, Linda Y.C., and Pang Eng Fong. 1991. Foreign Direct Investment and Industrialization in Malaysia,
Singapore, Taiwan, and Thailand. Paris: Organisation for Economic Co-operation and Development.Marshall, Alfred. 1890. Principles of Economics. London: MacMillan.Matthews, John A., and Dong-Sung Cho. 2000. Tiger Technology. Cambridge: Cambridge University
Press.Meyanathan, Saha Dhevan. 1994. Industrial Structures and the Development of Small and Medium
Enterprise Linkages. Washington, DC: World Bank.Nelson, Richard R., and Howard Pack. 1999. “The Asian Growth Miracle and Modern Growth Theory.”
Economic Journal 109 (457): 416–36.Pack, Howard. 1987. Productivity, Technology, and Industrial Development. New York: Oxford
University Press.Pack, Howard, and Christina Paxson. 2001. “Is African Manufacturing Skill Constrained?” In The
Industrial Experience of Africa, ed. A. Szirmai. London: Macmillan.Pack, Howard, and Kamal Saggi. 2000. “Vertical Technology Transfer via International Outsourcing.”
Journal of Development Economics 65 (2): 389–415.Pack, Howard, and Larry E. Westphal. 1986. “Industrial Strategy and Technological Change: Theory vs.
Reality.” Journal of Development Economics 22 (1): 87–128.Quigley, John M. 1998. “Urban Diversity and Economic Growth.” Journal of Economic Perspectives 12
(2): 127–38.Ranis, Gustav. 1973.“Industrial Sector Labor Absorption.” Economic Development and Cultural Change
21 (3): 387–408.Ranis, Gustav, and Chi Schive. 1985. “Direct Foreign Investment in Taiwan’s Development.” In Foreign
Trade and Investment: Economic Development in the Newly Industrializing Asian Countries, ed. WalterGalenson. Madison: University of Wisconsin Press.

50 Global Integration and Technology Transfer
Rhee, Yung W., B. Ross-Larson, and Garry Pursell. 1984. Korea’s Competitive Edge: Managing Entry intoWorld Markets. Baltimore: Johns Hopkins University Press.
Rivera-Batiz, F., and L. Rivera-Batiz. 1990. “The Effects of Direct Foreign Investment in the Presence ofIncreasing Returns Due to Specialization.” Journal of Development Economics 34 (1–2): 287–307.
Rodríguez-Clare, Andrés. 1996. “Multinationals, Linkages, and Economic Development.” AmericanEconomic Review 86 (4): 852–73.
Romer, Paul. 1994. “New Goods, Old Theory, and the Welfare Costs of Trade Restrictions.” Journal ofDevelopment Economics 43 (1): 5–38.
Rosenberg, Nathan. 1976. Perspectives on Technology. Cambridge: Cambridge University Press.Saxenian, A. 1994. Regional Advantage: Culture and Competition in Silicon Valley and Route 128.
Cambridge, MA: Harvard University Press.Saxenian, A., and Jinh-Yuh Hsu. 2001.“The Silicon Valley–Hsinchu Connection: Technical Communities
and Industrial Upgrading.” Industrial and Corporate Change 10 (4): 893–920.Schive, Chi. 1990. The Foreign Factor: The Multinational Corporations’ Contribution to the Economic
Modernization of the Republic of China. Stanford, CA: Hoover Institution Press.Tybout, James R. 2000. “Manufacturing Firms in Developing Countries: How Well Do They Do, and
Why?” Journal of Economic Literature 38 (1): 11–44.(March)Wall Street Journal. 1990. “Taiwan, Long Noted for Cheap Imitations, Becomes an Innovator.” June 1.Westphal, Larry E. 2002.“Technology Strategies for Economic Development in a Fast Changing Global
Economy.” Economics of Innovation and New Technology 11 (4–5): 275–320.

Foreign Direct Investment,Linkages, and Technology
Spillovers
Kamal Saggi
51
3
Intrafirm trade (trade between subsidiaries and headquarters of multinationalfirms) may account for one-third of total world trade today; sales of subsidiariesof multinational firms now exceed worldwide exports of goods and services(UNCTAD 2003). Thus foreign direct investment (FDI) is the dominant channelthrough which firms serve customers in foreign markets. While much FDI occursbetween industrial countries, developing countries are becoming increasinglyimportant host countries for FDI. In fact, about 33 percent of the global stock ofFDI today is in developing countries (UNCTAD 2003).
The effects of FDI on technology transfer, backward and forward linkages, localemployment, and overall industrial development of host countries have alwaysbeen an important policy concern in developing countries. Many Asian and LatinAmerican countries whose model for economic development was based on a strat-egy of import substitution actively intervened with respect to international tradeand FDI.
This chapter evaluates the analytical arguments and related empirical evidenceregarding the effects of FDI on local industrial development (particularly withrespect to linkages and technology transfer) in order to derive implications forpolicy. It argues that while substantial evidence supports the view that multina-tionals facilitate international technology transfer, evidence regarding the diffu-sion of technologies introduced by them to local firms is more mixed. The mostrecent empirical studies of FDI have shown convincingly that suppliers and buy-ers that interact with multinationals experience substantial improvements intechnology and productivity. These studies have established a strong connection

between technology transfer and linkage effects of multinational firms, an insightthat has begun to gain currency only in recent years.
Effects of FDI on Linkages and Technology Transfer
A basic tenet of the theory of the multinational firm is that such firms rely heavilyon intangible assets, such as superior technology and well-established brandnames, to successfully compete with local firms that are better acquainted with thehost country environment. Arnold and Javorcik (2005) provide direct evidence ofthe impact of FDI. Using data from Indonesia’s manufacturing sector for1983–96, they find that foreign ownership leads to significant improvements inacquired plants: after three years total factor productivity (TFP) in the acquiredplants outperformed TFP in the control plants by 34 percent. Arnold and Javorcikcontrol for the self-selection problem: while it is true that multinationals typicallyacquire firms that are relatively more productive, they contribute to the futureproductivity of acquired firms. Thus multinational firms surely transfer technol-ogy to their subsidiary and can therefore potentially play a crucial role in theinternational diffusion of technology to other firms. The question is, do they?
Casual evidence supports the view that multinationals are intimately involvedin international technology transfer. In 1995 more than 80 percent of global roy-alty payments for international transfers of technology were made from sub-sidiaries to their parent firms (UNCTAD 1997). And the intrafirm share of tech-nology flows has increased over time. Of course, royalty payments record only theexplicit sale of technology and do not capture the full magnitude of technologytransfer through FDI caused by technology transfer through imitation, trade ingoods, and other channels.
By encouraging inward FDI, developing countries hope not only to importmore efficient foreign technologies but also to improve the productivity of localfirms through technological spillovers to them. Not surprisingly, a large literaturetries to determine whether host countries enjoy spillovers (that is, positive exter-nalities) from FDI.
Before turning to this evidence, it is useful to be clear about the potential chan-nels through which such spillovers may arise. Any discussion of spillovers fromFDI needs to tackle the difficult question of whether it is reasonable to expect suchspillovers to occur: multinationals have much to gain from preventing the diffu-sion of their technologies to local firms, and one would expect them to takeactions that help preserve their technological superiority. Of course, this argumentdoes not apply when their technologies diffuse vertically to potential suppliers ofinputs or buyers of goods and services sold by multinationals (as discussed later).
52 Global Integration and Technology Transfer

In general, however, a skeptical a priori position on spillovers from multinationalsto their local competitors seems appropriate.
At the micro level, the literature suggests three potential channels of spillovers:demonstration effects, labor turnover, and vertical linkages.
Demonstration Effects
The demonstration effect argument states that exposure to the superior technologyof multinational firms may lead local firms to update their own production meth-ods. The implicit assumption behind this argument is that it may be too costly forlocal firms to acquire the information required to adopt a new technology if it isnot first introduced in the local economy by a multinational (and hence demon-strated to succeed in the local environment). As the payoff from the adoption of aforeign technology can be highly uncertain, the successful application of such atechnology in the local environment by a multinational can help reduce uncer-tainty, thereby generating informational spillovers for local firms. Hausmann andRodrik (2003) argue that such externalities are pervasive in the process of eco-nomic development and can provide a rationale for an activist industrial policy.
Suppose FDI does lower the cost of technology adoption and leads to fasteradoption of new technologies by local firms. Does that imply that, relative to trade(that is, a scenario in which foreign firms export to the domestic or world market),inward FDI necessarily improves productivity in the local economy? Technologydiffusion may strengthen the competitors of foreign firms. Foreseeing the conse-quences of such diffusion, foreign firms may alter the terms of their original tech-nology transfer. For example, a foreign firm may choose to transfer technologiesof lower quality when there is a risk of leakage to local firms. Thus while demon-stration effects may exist in principle, strategies undertaken by multinationalfirms may limit their effect.
Labor Turnover
Researchers have extensively studied direct imitation and reverse engineering aschannels of interfirm technology diffusion but neglected the role of labor turnover.Labor turnover differs from the other channels, because knowledge embodied inthe labor force moves across firms only through the physical movement of workers.The relative importance of labor turnover is difficult to establish, because it wouldrequire tracking individuals who once worked for multinationals and then deter-mining the impact of their job choices on the productivity of new employers. Fewempirical studies attempt to measure the magnitude of labor turnover from multi-nationals to local firms.
Foreign Direct Investment, Linkages, and Technology Spillovers 53
The evidence on labor turnover is mixed. Gershenberg’s (1987) study ofKenyan industries finds limited evidence of labor turnover from multinationals tolocal Kenyan firms, but several other studies document substantial labor turnoverfrom multinationals to local firms. Consider the case of the garment industry inBangladesh (see Rhee 1990 for details). Korea’s Daewoo supplied Desh (the firstBangladeshi firm to manufacture and export garments) with technology andcredit. Thus Desh was not a multinational firm in the strict sense but a domesticfirm that benefited substantially from its connection with Daewoo. Eventually,115 of the 130 initial workers left Desh to set up their own firms or to join othernewly established garment companies. The remarkable speed with which the for-mer Desh workers transmitted their know-how to other factories clearly demon-strates the role labor turnover can play in technology diffusion. Rodrik (2004)argues that imitative entry through labor turnover drove industry growth notonly in the case of garments in Bangladesh but also in information technology inIndia and salmon farming in Chile (where the first successful investment wasactually made by the government).
Pack (1997) discusses evidence documenting the role of labor turnover in dis-seminating the technologies of multinationals to local firms. In the mid-1980s,almost 50 percent of all engineers and about 63 percent of all skilled workers wholeft multinationals in Taiwan (China) joined local Taiwanese firms. Gershenberg’s(1987) study of Kenyan industry reports smaller figures: of the 91 job shifts stud-ied, only 16 percent involved turnover from multinationals to local firms.
In order to synthesize these empirical findings, the cross-country variation inlabor turnover rates itself requires explanation. One possible generalization is thatin economies such as the Republic of Korea and Taiwan (China), local competi-tors are less disadvantaged relative to their counterparts in many African coun-tries, thereby making labor turnover possible. Thus the ability of local firms toabsorb technologies introduced by multinationals may be a key determinant ofwhether labor turnover occurs as a means of technology diffusion in equilibrium(see Glass and Saggi 2002 for a formal model). Furthermore, the local investmentclimate may be such that workers looking to leave multinationals in search of newopportunities (or other local entrepreneurs) find it unprofitable to start their owncompanies, implying that the only alternative opportunity is to join existing localfirms. The presence of weak local competitors probably goes hand in hand withthe lack of entrepreneurial efforts, because both may result from the underlyingstructure of the economic environment.
Labor turnover rates may vary at the industry level as well. Casual observationsuggests that industries with a fast pace of technological change (such as the com-puter industry in Silicon Valley) are characterized by very high turnover rates rel-ative to more mature industries. Therefore, cross-country variation in labor
54 Global Integration and Technology Transfer

turnover from multinationals could stem simply from the global composition ofFDI: developing countries are unlikely to host FDI in sectors subject to rapid tech-nological change.
Using firm-level data from the manufacturing sector in Ghana, Görg and Strobl(2002) provide recent evidence on labor turnover and its effect on the productivityof local firms. They show that firms run by owners who worked for multinationalsin the same industry before establishing their own firms have higher productivitygrowth than other domestic firms. This finding implies that entrepreneurs bringwith them some of the knowledge accumulated in the multinational. Görg andStrobl do not find any positive effects on firm-level productivity if the owner hadexperience in multinationals in other industries or received training by multina-tionals, suggesting that the knowledge imparted to workers may sometimes be of avery specific type, with limited applicability to other industries.
Linkages and Vertical Technology Transfer
A voluminous informal and empirical literature exists on backward linkages. The2001 World Investment Report was devoted entirely to the effects of FDI on back-ward linkages in host countries. Analytical models exploring the relationshipbetween multinationals and backward linkages in the host country are hard to comeby, however. Two prominent examples of such models are Markusen and Venables(1999) and Rodriguez-Clare (1996). Both provide important insights regarding thetwo-way relationship between multinationals and linkages. The intermediate goodssector is modeled as monopolistically competitive, so that the effects of foreigninvestment occur by altering the incentives for entry into such markets.
Barrios, Görg, and Strobl (2004) construct a model in which the competitioneffect generated by a multinational is eventually dominated by the positive exter-nalities it generates. Using plant-level panel data from the manufacturing sector inIreland (a country whose economic development has been greatly influenced bymultinational firms), they show that such a model indeed describes the Irish expe-rience with FDI.
Alfaro and Rodriguez-Clare (2004) use plant-level data from several LatinAmerican countries to evaluate the linkage effects of multinationals. Their work,motivated by a modified version of the model presented in Rodriguez-Clare(1996), makes the important point that many empirical studies lack a tight link toexisting theoretical models and often use inappropriate measures to evaluate thelinkage effects of multinationals. More specifically, empirical studies often use theshare of inputs purchased locally by a multinational to measure the impact onlinkages. Alfaro and Rodriguez-Clare argue that the proper measure (as implied bytheory) is the ratio of the value of inputs bought domestically to the total number
Foreign Direct Investment, Linkages, and Technology Spillovers 55

of workers hired by a multinational. The distinction between the two types ofmeasures is important, because multinationals typically source a smaller percent-age of their inputs locally than their local competitors. This does not imply thattheir linkage effects are necessarily negative, since their production techniques mayrequire more inputs in relation to the workers they hire. Alfaro and Rodriguez-Clare find that the linkage coefficient of multinationals is actually higher than thatof local firms in Brazil, Chile, and República Bolivariana de Venezuela, where it isno different (statistically) than in Mexico.
Lin and Saggi (2005a, 2005b) consider how the entry of multinationals mightaffect the supply side of the intermediate good sector. They raise the followingquestions: What is the relationship between vertical technology transfer from amultinational to its local suppliers and the equilibrium degree of backward link-ages? How does the nature of contractual relationships between multinationalsand their local suppliers affect the degree of backward linkages in the local indus-try? To address these questions, they develop a two-tier model in which the pro-duction of a final good requires an intermediate good, and the market structure atboth stages of production is oligopolistic. Upon entry the multinational sourcesthe intermediate good locally and engages in vertical technology transfer to itssuppliers, guided by a contractual agreement. Two types of contractual relation-ships are considered, one in which its suppliers must abide by an exclusivity con-dition that precludes them from serving its local rivals and another in which theyface no such restriction. The major point of their paper is that the linkage effectsthat result from the multinational’s entry depend crucially on the nature of thecontractual agreement that emerges in equilibrium: under exclusivity, the multi-national’s entry can even lower linkages (and welfare) relative to autarky.
As Rodriguez-Clare (1996) notes, multinationals improve welfare only if theygenerate linkages over and beyond those generated by the local firms they dis-place. The question of relevance here is whether the generation of linkages isexpected to result in productivity improvements, technology diffusion, or both.Vertical technology transfer has been documented to occur when firms fromindustrial countries buy the output of firms in Asian economies in order to sell itunder their own name (Hobday 1995). Companies such as Radio Shack and TexasInstruments have commissioned firms in developing countries to produce com-ponents or entire products, which are then sold under the retailer’s name. Packand Saggi (2001) summarize evidence that shows that in the late 1970s manyKorean firms directly benefited from the technical information foreign buyersprovided. The knowledge transfers involved were multifaceted and included notonly manufacturing knowledge but also information on sizes, colors, labels, pack-ing materials, and instructions to users. Over the same period, many importingfirms from industrial countries maintained very large staffs in the Republic of
56 Global Integration and Technology Transfer

Korea and Taiwan (China), who spent considerable time helping their local man-ufacturers meet required quality specifications.
Based on this evidence, Pack and Saggi (2001) develop a model that exploresthe interdependence between production of manufactures in developing coun-tries and their marketing into industrial country markets. In their model, a buyerfrom an industrial country can transfer technology to producers in a developingcountry in order to outsource production. Since firms in developing countriesoften lack the ability to successfully market their products internationally, tech-nology leakage in the developing country market actually benefits the industrialcountry firm, since it increases competition among the developing country sup-pliers. An interesting implication of their analysis is that fully integrated multina-tional firms may be more averse to technology diffusion than firms involved ininternational arm’s length arrangements.
More recent evidence regarding vertical technology transfer is provided byMexico’s experience with the maquiladora sector and its automobile industry. Mexicostarted the maquiladora sector as part of its Border Industrialization Programme,designed to attract foreign manufacturing facilities along the U.S.–Mexico border.Most maquiladoras began as subsidiaries of U.S. firms that shifted labor-intensiveassembly operations to Mexico because of its low wages relative to the United States.The industry evolved over time, and the maquiladoras now employ sophisticatedproduction techniques, many of which have been imported from the United States.
The development of the automobile industry in Mexico provides an excellentexample of the pitfalls and benefits of policies that seek to maximize local benefitsfrom FDI. Historically, Mexico’s motivations for intervening in the automobileindustry were similar to those of a host of other developing countries thatintended to use trade policy to encourage industrial development. During the1960s and 1970s, Mexico required multinationals in the automobile industry tohave a domestic content of 60 percent. Mexico did not allow foreign firms to ver-tically integrate with their local suppliers. The goal of this nationalistic stance mayhave been to ensure that domestic firms captured the benefits generated by thebackward linkages of FDI.
An interesting aspect of Mexico’s export performance requirement in the auto-mobile industry (as noted by Moran 1998) was that, unlike countries such asMalaysia, Mexico did not require that foreign firms export a particular product(such as a finished car) but only that the value of exports bear some relation to thevalue of imports. Clearly, such a policy let the car companies decide what toexport, leaving them free to make their own calculations based on comparativeadvantage considerations.
The export performance of the industry has improved so much that Mexicohas become the world’s largest developing country exporter in the automobile
Foreign Direct Investment, Linkages, and Technology Spillovers 57

sector (Moran 1998). Mexico’s experience in the automobile industry is also illus-trative of how FDI can contribute to industrial development in the host country.Initial investments by U.S. car manufacturers in Mexico were followed by invest-ments by Japanese and European car manufacturers and by firms that made auto-mobile parts and components. As a result, competition in the automobile industryincreased at multiple stages of production, thereby improving efficiency. This pat-tern of FDI behavior, in which investment by one firm is followed by investment byothers, probably reflects strategic considerations. Most multinational firms competein highly concentrated markets and are highly responsive to one another’s decisions.An important implication of this interdependence of competing multinationals isthat a host country may be able to unleash a sequence of investments by successfullyinducing FDI from one or two major firms.
Extensive backward linkages resulted from FDI in the Mexican automobileindustry: within five years of investments by major auto manufacturers, therewere 300 domestic producers of parts and accessories, 110 of which had annualsales of more than $1 million. Multinationals in the Mexican automotive sectorconducted production audits, held weekly coordination meetings, and providedtechnical training to their suppliers (Perez-Nunez 1990). Foreign producers alsotransferred technology to these domestic suppliers: industry best practices, zero-defect procedures, production audits, and others practices were introduced todomestic suppliers, improving their productivity and the quality of their prod-ucts. As a result of increased competition and efficiency, Mexican exports in theautomobile industry boomed.
A comprehensive case study of the effects of Intel’s investment in Costa Rica(Larrain, Lopez-Calva, and Rodriguez-Clare 2000) finds evidence that local sup-pliers benefited substantially from Intel’s investment. Similar evidence exists forother sectors and countries, as discussed in detail in Moran (1998, 2001). In theelectronics sector, Moran (2001) notes that foreign investors in Malaysia helpedtheir local subcontractors keep pace with modern technologies by assigning tech-nicians to the suppliers’ plants to help set up and supervise large-volume auto-mated production and testing procedures. In chapter 10 in this volume Javorcikexamines backward linkages and technology spillovers using data from Lithuanianmanufacturing sector during the period 1996–2000. She finds that firm productivityis positively affected by a sector’s intensity of contacts with multinational customersbut not by the presence of multinationals in the same industry. Thus her resultssupport vertical spillovers from FDI but not horizontal ones. Blalock (2001) usesa panel data set from Indonesian manufacturing establishments to check for thesame effects. He finds strong evidence of a positive impact of FDI on the produc-tivity growth of local suppliers, indicating that technology transfer from multina-tionals indeed takes place. He plausibly suggests that since multinationals tend to
58 Global Integration and Technology Transfer

source inputs that require relatively simple technologies relative to the final prod-ucts they produce, local firms that produce such intermediates may be in a betterposition to learn from multinationals than those that compete with them.
The evidence on vertical technology transfer from multinationals to their sup-pliers is positive and robust (as long as local policies do not restrict multinationalsfrom taking advantage of comparative advantage considerations in making theirsourcing decisions). What do we know about the effects of multinationals on theirlocal competitors? One should not expect the picture to be too rosy from the per-spective of host countries. A challenge facing the positive view regarding technol-ogy spillovers from FDI is to explain how such spillovers can ever be in the interestof multinational firms. Clearly, under most circumstances multinationals wouldrather limit diffusion in the local economy. In fact, the heart of the theory thatseeks to explain the emergence of multinationals is that such firms can successfullycompete with local firms precisely because they possess superior technologies,management, and marketing. Why, then, would multinationals not take actions toensure that such advantages do not diffuse to local competitors? With that in mind,let us now turn to the empirical evidence.
Do Horizontal Spillovers from FDI Exist?
Early efforts in search of horizontal spillovers from FDI proceeded by relating theinterindustry variation in productivity to the extent of FDI (Caves 1974; Globerman1979; Blomström and Persson 1983; Blomström 1986). By and large, these studiesfind that sectors with a higher level of foreign involvement (as measured by theshare of the labor force in the industry employed by foreign firms or the extent offoreign ownership) tend to have higher productivity, higher productivity growth, orboth. The fact that these studies involve data from different countries (Australia forthe Caves study, Canada for Globerman, Mexico for Blomström) lends a strongdegree of robustness to this positive correlation between the level of foreign involve-ment and local productivity at the sector level.
Of course, correlation is not causation and, as Aitken and Harrison (1999)note, this literature may overstate the positive impact of FDI on local productivity.Investment may have been attracted to the more productive sectors of the econ-omy instead of being the cause of the high productivity in such sectors. In otherwords, the studies ignore an important self-selection problem. Both trade and FDIhelp ensure an efficient allocation of global resources by encouraging investmentin those sectors in which an economy enjoys comparative advantage. In this sense,Aitken and Harrison’s point is almost necessarily implied by traditional trade the-ory. However, if trade protection encourages investment in sectors in which a hosteconomy does not enjoy comparative advantage, trade protection may be welfare
Foreign Direct Investment, Linkages, and Technology Spillovers 59

reducing. This possibility was relevant for countries that sought to industrialize byfollowing a strategy of import substitution.
Only plant-level studies can control for the self-selection problem that mayplague industry-level studies. Taking the argument a step further, the self-selectionproblem may also arise in plant-level studies: more productive plants may be theones that attract foreign investment (as Arnold and Javorcik 2005 find).
What do plant-level studies find with respect to spillovers from FDI? Haddadand Harrison’s (1993) study is the first to employ a comprehensive data set at thelevel of the individual firm over several years. The data come from an annual sur-vey of all manufacturing firms in Morocco. An important result of the study isthat foreign firms exhibit higher levels of TFP but their rate of TFP growth islower than that of domestic firms. As Haddad and Harrison note, at first glancesuch a finding suggests that perhaps there is some sort of convergence betweendomestic and foreign firms. In fact, this is not the case. Although there is a leveleffect of foreign investment on the TFP of domestic firms, such an effect is miss-ing for the growth rate of the TFP of domestic firms. In addition, when sectors aredivided into high and low tech, the effect of FDI at the sector level is more positivein low-tech sectors. The authors interpret this result as indicative of the lack ofabsorptive capacity on the part of local firms in the high-tech sector, where theymay lag behind multinationals and be unable to absorb foreign technology.
Aitken, Harrison, and Lipsey (1996) undertake a somewhat different approachto measuring spillovers from FDI. The idea behind their study is that technologyspillovers should increase the marginal product of labor, which should show up ashigher wages. The study employs data from manufacturing firms in Mexico, theUnited States, and República Bolivariana de Venezuela. For both Mexico andRepública Bolivariana de Venezuela, a higher share of foreign employment is asso-ciated with higher overall wages for both skilled and unskilled workers, and roy-alty payments to foreign firms from local firms are highly correlated with wages.The study finds no positive impact of FDI on the wages of workers employed bydomestic firms. In fact, the authors report a small negative effect for domesticfirms, whereas the overall effect for the entire industry is positive. These findingsdiffer from those for the United States, where a larger share of foreign firms inemployment is associated with both a higher average wage as well as higher wagesin domestic establishments. Putting Aitken, Harrison, and Lipsey’s (1996) findingsinto the context of previous work, it is clear that wage spillovers (from foreign todomestic firms) are associated with higher productivity in domestic plants. Con-versely, the absence of wage spillovers appears to accompany the existence of pro-ductivity differentials between domestic and foreign firms.
Using annual census data on more than 4,000 Venezuelan firms, Aitken andHarrison (1999) provide another test of the spillover hypothesis. Since each plant
60 Global Integration and Technology Transfer

was observed over a period of time, their study avoids the self-selection problemof earlier sector-level studies. The authors find a positive relationship betweenforeign equity participation and plant performance, implying that foreign partic-ipation does indeed benefit domestic plants. However, this own-plant effect isrobust only for plants that employ fewer than 50 employees. For larger plants, for-eign participation results in no significant improvement in productivity relative todomestic plants. More interestingly, Aitken and Harrison find that productivity indomestic plants declines with an increase in foreign investment, that is, they findevidence of negative spillovers from FDI, which they suggest could result from amarket stealing effect. That is, foreign competition may have forced domesticfirms to lower output, thereby forgoing economies of scale. Nevertheless, on bal-ance Aitken and Harrison find that the effect of FDI on the productivity of theentire industry is weakly positive. They also note that similar results are obtainedfor Indonesia, except that the positive effect on own plants is stronger and the neg-ative effect on domestic plants weaker, suggesting a stronger overall positive effect.
Haskel, Pereira, and Slaughter (2002) use plant-level panel data for all U.K.manufacturing from 1973 through 1992 to re-examine the issue of spillovers fromFDI. As they note, there can be little doubt that local firms in the United Kingdompossess sufficient absorptive capacity to benefit from the introduction of newertechnologies by multinationals, so if spillovers do not materialize, they cannot beattributed to the limitations of domestic firms. Across a wide range of specifications,the authors find that a 10 percent increase in foreign presence in a U.K. industryraises the TFP of that industry’s domestic plants by about 0.5 percent. However, theynote that the large tax breaks and incentive packages given to multinationals seemout of proportion relative to the magnitude of spillovers they generate.
To recapitulate, while some studies cast doubt on the view that FDI generates pos-itive spillovers for local firms, others reach more positive conclusions. Regardless ofone’s view regarding these findings, domestic firms should be expected to suffer fromthe increase in competition that often results from FDI; part of the benefit of inwardFDI is that it can help weed out relatively inefficient domestic firms. Resourcesreleased in this process will be put to better use by foreign firms with superior tech-nologies, efficient new entrants (both domestic and foreign), or some other sectors ofthe economy. However, such reallocation of resources cannot take place instanta-neously. Studies of spillovers may not cover a long enough period to be able to accu-rately determine how FDI affects entry and exit. Furthermore, their design limitssuch horizontal studies, because they cannot clarify linkages and spillovers that mayresult from FDI in industries other than the one in which FDI occurs.
Moran (2005) argues that there is a substantial difference between the operatingcharacteristics of subsidiaries that are integrated into the international sourcingnetworks of the parent multinationals and subsidiaries that serve protected domestic
Foreign Direct Investment, Linkages, and Technology Spillovers 61

markets and are prevented by policy barriers (such as mandatory joint venture anddomestic content requirements) from being so integrated. These different character-istics include plant size, the proximity of technology and quality control proceduresto industry best practices, the speed with which production processes are brought tothe frontier, the efficiency of operations, and the cost of output. Subsidiaries that arewell integrated into the global network of their parent firms have a greater positiveimpact on the host country, often accompanied by vertical backward linkages andexternalities. Subsidiaries that cater primarily to protected local markets have a muchless positive—and sometimes demonstrably negative—impact on the local economy.
Drawing on a wealth of case studies and econometric evidence, Moran arguesthat this contrast in performance holds across different industries, countries, andtime periods. He notes that the inability of earlier studies to isolate the influencesof FDI on host country welfare stems from their failure to differentiate betweenexport-oriented FDI and import-substitution FDI, between foreign investors freeto source from wherever they wish and foreign investors operating with domesticcontent requirements, or between foreign investors obliged to operate as minorityshareholders and those with whole or majority ownership accounts.
The entry of multinationals may benefit host countries even if it fails to resultin spillovers for local firms, for several reasons. First, spillovers to local firms thatdirectly compete with the multinationals would be the most elusive of benefitsthat host countries may expect to enjoy from FDI. Second, local agents other thandomestic competitors of multinationals (for example, local workers and local sup-pliers) may enjoy positive externalities from FDI. If they do, the total effect of FDIon local welfare may be positive despite the lack of technology spillovers. Third,spillovers may be of an entirely different nature: local firms may enjoy positiveexternalities from foreign firms that make it easier for them to export. Such exter-nalities may come about because better infrastructure (transportation, storage facil-ities, and ports) emerges in regions with a high concentration of foreign exporters.
Aitken, Hanson, and Harrison (1997) provide direct evidence on this issue. Intheir detailed study of 2,104 manufacturing plants in Mexico, 28 percent of firmshad foreign ownership and 46 percent of foreign plants exported. They find thatthe probability of a Mexican-owned plant exporting is positively correlated withits proximity to foreign-owned exporting plants. Such spillovers may result frominformational externalities and may lower the fixed costs of accessing foreignmarkets rather than the marginal costs of exporting.
Concluding Remarks
There is no simple way of describing the policy environment that multinationalsface in developing countries. A roughly accurate statement is that while FDI in
62 Global Integration and Technology Transfer

services markets faces a multitude of restrictions, FDI into the manufacturing sec-tor is confronted with both restrictions and incentives, often in the same country.In regions that historically emphasized import-substituting industrialization—most of Africa, Latin America, and Southeast Asia—countries either prohibitedFDI or forced multinational firms to operate under severe restrictions. Even ineconomies in which technology acquisition was a major policy objective, multina-tionals were rarely permitted to operate fully owned subsidiaries; Japan, theRepublic of Korea, and Taiwan (China) all imposed restrictions on FDI at variouspoints in time. In other words, “outward-oriented” economies were not particu-larly keen on allowing multinational firms into their markets.
Despite the prevalence of various types of restrictions on FDI, multinationalsdo not necessarily face an entirely hostile environment in developing countries. Infact, many countries try to lure large multinational firms with investment incen-tives. Interestingly, it is not unusual for investment incentives to be offered in con-junction with performance requirements and other restrictions on FDI, perhapsto partially offset the negative impact of the restrictions on the likelihood ofinvestment by multinationals. Is there a case for the use of such incentives? Inprinciple, a case for the use of tax incentives for FDI could be made on the basis ofpositive spillovers of FDI to local firms, but the argument is difficult to make,because the evidence is not sufficiently conclusive. The complicated restrictionsand requirements often imposed by developing countries on multinational firmsalso seem counterproductive. While multinationals can possess significant marketpower, restrictive trade polices are likely to increase, not reduce, such marketpower (once they are in the local market). A relatively open policy regime towardtrade and FDI, with adequate safety nets for those likely to be hurt by foreigncompetition, seems the most reasonable way forward. A restrictive trade regimecoupled with an open FDI regime creates incentives for tariff-jumping FDI, thewelfare effects of which are far from obvious.
References
Aitken, Brian, and Ann E. Harrison. 1999. “Do Domestic Firms Benefit from Direct Foreign Invest-ment?” American Economic Review 89 (3): 605–8.
Aitken, Brian, Gordon H. Hanson, and Ann E. Harrison. 1997. “Spillovers, Foreign Investment, andExport Behavior.” Journal of International Economics 43 (1–2): 103–32.
Aitken, Brian, Ann E. Harrison, and Robert E. Lipsey. 1996. “Wages and Foreign Ownership: A Com-parative Study of Mexico, Venezuela, and the United States.” Journal of International Economics 40(3–4): 345–71.
Alfaro, Laura, and Andrés Rodriguez-Clare. 2004. “Multinationals, Linkages, and Economic Develop-ment.” Economica: 113–69.
Arnold, Jens M., and Beata S. Javorcik. 2005. “Foreign Acquisitions and Plant Performance in Indonesia.”Policy Research Working Paper 3597, World Bank, Washington, DC.
Foreign Direct Investment, Linkages, and Technology Spillovers 63

Barrios, Salvador, Holger Görg, and Eric Strobl. 2004. “FDI, Competition, and Industrial Developmentin the Host Country.” CORE Discussion Paper 2004/11, Louvain-la-Neuve, Belgium.
Blalock, Garrick. 2001. “Technology from Foreign Direct Investment: Strategic Transfer through Sup-ply Chains.” Department of Applied Economics and Management, Cornell University, Ithaca, NY.
Blomström, Magnus. 1986. “Foreign Investment and Productive Efficiency: The Case of Mexico.” Jour-nal of Industrial Economics 35 (1): 97–110.
Blomström, Magnus, and Hakan Persson. 1983. “Foreign Investment and Spillover Efficiency in anUnderdeveloped Economy: Evidence from the Mexican Manufacturing Industry.” World Develop-ment 11 (6): 493–501.
Caves, Richard E. 1974. “Multinational Firms, Competition, and Productivity in Host-Country Indus-tries.” Economica 41: 176–93.
Gershenberg, Irving. 1987. “The Training and Spread of Managerial Know-How: A ComparativeAnalysis of Multinational and Other Firms in Kenya.” World Development 15 (7): 931–39.
Glass, Amy J., and Kamal Saggi. 2002. “Multinational Firms and Technology Transfer.” ScandinavianJournal of Economics 104 (4): 495–513.
Globerman, Steve. 1979. “Foreign Direct Investment and ‘Spillover’ Efficiency Benefits in CanadianManufacturing Industries.” Canadian Journal of Economics 12 (1): 42–56.
Görg, Holger, and Eric Strobl. 2002. “Spillovers from Foreign Firms through Worker Mobility: AnEmpirical Investigation.” IZA Discussion Paper 591, Institute for the Study of Labor, Bonn.
Haddad, Mona, and Ann Harrison. 1993. “Are There Positive Spillovers from Direct Foreign Invest-ment? Evidence from Panel Data for Morocco.” Journal of Development Economics 42 (1): 51–74.
Haskel, Jonathan E., Sonia Pereira, and Matthew J. Slaughter. 2002. “Does Inward Foreign DirectInvestment Boost the Productivity of Domestic Firms?” Working Paper 8724, National Bureau ofEconomic Research, Cambridge, MA.
Hausmann, Ricardo, and Dani Rodrik. 2003. “Economic Development as Self-Discovery.” Journal ofDevelopment Economics 72 (2): 603–33.
Hobday, Michael. 1995. Innovation in East Asia: The Challenge to Japan. Cheltenham: Edward Elgar.Larrain, B., Felipe, Luis F. Lopez-Calva, and Andrés Rodriguez-Clare. 2000. “Intel: A Case Study of FDI
in Central America.” Working Paper 58, Center for International Development, Harvard Univer-sity, Cambridge, MA.
Lin, Ping, and Kamal Saggi. 2005a. “Multinational Firms and Backward Linkages: A Critical Surveyand a Simple Model.” In Does Foreign Direct Investment Promote Development? ed. TheodoreMoran, Edward Graham, and Magnus Blomström. 159–74. Washington, DC: Institute for Interna-tional Economics.
———. 2005b. “Multinational Firms, Exclusivity, and the Degree of Backward Linkages.” Departmentof Economics, Southern Methodist University, Dallas, TX.
Markusen, James R., and Anthony Venables. 1999. “Foreign Direct Investment as a Catalyst for Indus-trial Development.” European Economic Review 43 (2): 335–56.
Moran, Theodore. 1998. Foreign Direct Investment and Development. Washington, DC: Institute forInternational Economics.
———. 2001. Parental Supervision: The New Paradigm for Foreign Direct Investment and Development.Washington, DC: Institute for International Economics.
———. 2005. “How Does Foreign Direct Investment Affect Host-Country Development: Do WeAlready Know the Answer? Using Industry Case Studies to Make Reliable Generalizations.” In DoesForeign Direct Investment Promote Development? ed. Theodore Moran, Edward Graham, and MagnusBlomström. 281–314. Washington, DC: Institute for International Economics.
Pack, Howard. 1997. “The Role of Exports in Asian Development.” In Pathways to Growth: ComparingEast Asia and Latin America, ed. Nancy Birdsall and Frederick Jaspersen. Washington, DC: Inter-American Development Bank.
Pack, Howard, and Kamal Saggi. 2001. “Vertical Technology Transfer via International Outsourcing.”Journal of Development Economics 65 (2): 389–415.
64 Global Integration and Technology Transfer

Perez-Nunez, Wilson. 1990. Foreign Direct Investment and Industrial Development in Mexico. Paris:OECD.
Rhee, Yung Whee. 1990.“The Catalyst Model of Development: Lessons from Bangladesh’s Success withGarment Exports.” World Development 18 (2): 333–46.
Rodriguez-Clare, Andrés. 1996. “Multinationals, Linkages, and Economic Development.” AmericanEconomic Review 86 (4): 852–74.
Rodrik, Dani. 2004.“Industrial Policy for the Twenty-First Century.” Department of Economics, HarvardUniversity, Cambridge, MA.
UNCTAD (United Nations Commission on Trade and Development) 1997. World Investment Report:Transnational Corporations, Market Structure, and Competition Policy. New York: United Nations.
—— 2001. World Investment Report. Promoting Linkages. NewYork United Nations.—— 2003. World Investment Report: FDI Policies for Development: National and International Perspec-
tives. New York: United Nations.
Foreign Direct Investment, Linkages, and Technology Spillovers 65


67
4Chapter 4Plant- and Firm-Level
Evidence on “New” Trade Theories
James R. Tybout
Two decades ago, in an effort to become more relevant, trade economists begandeveloping models with imperfectly competitive product markets. The result wasa richer body of theory that describes how commercial policy might affect price-cost mark-ups, firm size, productivity, exports, and profitability of domesticproducers. The literature also yielded formal representations of the channelsthrough which commercial policy might influence growth. This chapter selectivelysurveys and interprets the firm- and plant-level evidence that has emerged on thebasis of these theories.
The first section focuses on three static predictions of the “new” trade theorythat have attracted attention from empiricists. First, protection can change firms’pricing behavior, thereby affecting the allocative efficiency of the economy andthe distribution of real income. Second, when trade policies affect prices, theygenerally also change the set of active producers, their output levels, or both.These adjustments induce productivity changes through scale effects and marketshare reallocations. Third, changes in the intensity of foreign competition, infirms’ opportunities to export, or both can affect their technical efficiency.1
The second section continues to discuss firm-level responses to policy reforms interms of pricing decisions, output levels, exports, and productivity. However, rather
This chapter previously appeared in the 2003 Handbook of International Economics, edited by James
Harrigan and E. Kwan Choi. The author is grateful to James Harrigan and to participants in workshops
at the National Bureau of Economic Research, the University of Toronto, and the University of Texas-
Austin for many useful comments.

than focus on comparative statics, the models and evidence in this section areexplicitly dynamic. They allow for sunk entry costs, firm heterogeneity, anduncertainty. They thus highlight the relation between responses, expectations, andinitial conditions.
The last section of the chapter briefly recaps what is known and what we wouldlike to know. It also indicates some directions for future research.
Static Results: Mark-Ups, Scale,and Productivity
Pricing
Theory Except when collusive equilibria are considered, trade models with imper-fect competition treat firms’ pricing decisions as determined by static profit max-imization. Accordingly, the ratio of output prices (p) to marginal costs (c) is typicallya decreasing function of the elasticity of demand (h) that firms face:
(4.1)
It follows that when trade liberalization increases h, mark-ups should fall.This kind of elasticity effect has been generated by a variety of modeling
devices. For example, under the “Armington assumption” that foreign and domes-tic goods are imperfect substitutes, the demand elasticity for domestic goods risesas the relative price of foreign goods falls (see, for example, Devarajan and Rodrik1991). When protection takes the form of nontariff barriers, the removal of a quotacan create heightened competitive pressures (Bhagwati 1978). When liberalizationmakes more product varieties available (Krugman 1979), reduces the market shareof domestic firms (Helpman and Krugman 1985), or both, producers may perceivetheir demand elasticities to rise.
When collusive equilibria are modeled, trade liberalization can change the pay-off to defecting, change firms’ ability to punish defectors, or make it more difficultto detect them (Prusa 1992; Staiger and Wolak 1989).2 It is possible that coopera-tive behavior will become unsustainable and mark-ups will fall. Some have arguedthat collusive firms are likely to use the (exogenous) tariff-distorted price of importsas a reference price.3 By construction, models that begin from this pricing rule pre-dict that trade liberalization will depress the price of import-competing goods.
Evidence Several simple methodologies have been used to link mark-ups to importcompetition. Prices and marginal costs are rarely observable, so each techniqueinfers mark-ups indirectly. The most common approach is to use the price-cost
p
c=
−
ηη 1
.
68 Global Integration and Technology Transfer

margin—sales net of expenditures on labor and materials over sales. If one assumesthat unit labor and material costs are flat with respect to output, and we interpretc as short-run marginal costs, this statistic is a monotonic transformation of themark-up in equation (4.1):
where qit is the physical output of the ith firm in period t. The PCM is also currenteconomic profits (pit) over sales plus the competitive return on capital over revenues:
where kit is the capital stock, r is the market return on capital, and d is the depreci-ation rate.4 By this logic, after controlling for the ratio of capital stocks to sales,variables that measure the intensity of foreign competition should contributenothing to the explanation of price-cost margins in industries in which free entrydrives profits to zero. If, however, economic profits are present (pit > 0), these vari-ables should correlate negatively with PCM whenever trade liberalization increasesdemand elasticities or destroys collusive equilibria.
Most analyses of mark-ups based on the PCM begin from a simple regression,such as
(4.2)
where i may index either firms or industries, and Iit is a proxy for the intensity ofimport competition (the import penetration rate, the effective protection rate, ora license coverage ratio). (Import competition can be observed only at the industrylevel, so when firm-level data are used, Iit takes the same value for all firms withineach industry.) When industry-level cross-sectional data are used, the typical find-ing is that “the ratio of imports to domestic consumption tends to be negativelycorrelated with the profitability of domestic sellers, especially when domestic con-centration is high” (Schmalensee 1989, p. 976).5
A handful of studies has implemented equation (4.2) with plant-level paneldata, controlling for permanent cross-industry differences in technology withindustry dummies and controlling for efficiency-related variation in mark-ups byincluding plant-level market shares.6 Results for Chile (1979–86), Colombia(1977–85), Mexico (1985–90), and Morocco (1984–89) all reveal the same basicpattern: “In every country studied, relatively high industrywide exposure to foreigncompetition is associated with lower [price-cost] margins, and the effect is concen-trated in larger plants” (Roberts and Tybout 1996, p. 196, their italics). This pattern
PCM k p q Iit it it it it it= + + + +β β β ε0 1 2( )/ L
PCMp q
r k
p qitit
it it
t it
it it
= + +π δ( ),
PCMp q c q
p q
p c
pitit it it tt
it it
it it
it
= − = −,
Plant- and Firm-Level Evidence on “New” Trade Theories 69
seems robust with respect to measures of import competition. In the case of Mexico,where it was possible to explore alternative measures of protection, the patternappears whether one uses import penetration rates, effective protection rates, orlicense coverage ratios (Grether 1996).
The standard interpretation for these price-cost margin findings is that largefirms or concentrated industries enjoy the most market power, hence their pricesare the most responsive to heightened foreign competition. But other explanationsare also plausible. For example, it may be that “relatively efficient industries aremore profitable, and thus better able to compete against potential imports (lowimport penetration)” (Roberts and Tybout 1996, p. 195). Or concentration mayreflect large sunk entry costs instead of market power (see, for example, Hopenhayn1992). In this case, rather than squeezing monopoly profits, unanticipated foreigncompetition cuts into the revenues that firms had expected would cover their entrycosts, making them sorry, ex post, that they entered (see, for example, Albuquerqueand Rebelo 2000). If this interpretation is correct, one should observe output con-tractions in industries with high sunk costs and exit in the others when trade is lib-eralized. There is some evidence that this happens, as I show below.
An alternative methodology for linking foreign competition and pricing beginsfrom the standard Tornqvist growth decomposition. Suppose the ith firm producesoutput according to where is the vector of J factorinputs it uses and Ait measures its productivity level at time t. Then, suppressingtime subscripts, output growth can be decomposed into a weighted-average ofgrowth rates in the factor inputs and a residual productivity growth term:
(4.3)
Hall (1988) notes that when product markets are imperfect, this expression can becombined with equation (4.1) and the cost-minimization conditions
to link output growth, input growth, productivity growth, and mark-ups:
(4.4)
He argues that a regression of output growth on the share-weighted rate of inputgrowth, treating d ln(Ai) as the mean productivity growth rate plus noise, shouldreveal the price-cost mark-up as the slope coefficient.
By allowing h to vary through time with trade reforms, one can test whetherimport competition affects mark-ups. Similarly, one can look for trade-related shiftsin the mean rate of productivity growth. Several analysts have performed theseexercises by fitting generalized versions of equation (4.4) to plant-level panel data.7
d qv w
p qd vi
ij
j
i iijln( ) ln( )=
−
1jj
J
id A=
∑ +1
ln( ).
∀j,
c w q vi j i ij= ∂ ∂/ /( ),
d qh
vd v d Ai
ij i
ji
j
J
ln( )ln( )
ln( )ln( ) ln( )= ∂
∂+
=∑
1
..
v v v vit it it itJ= ( , )1 2 Kq A h vit it it= ( ),
70 Global Integration and Technology Transfer

Studying Turkey and Côte d’Ivoire, respectively, Levinsohn (1993) and Harrison(1994) conclude that certain protected sectors had significant mark-ups duringthe sample period and that these mark-ups fell with trade liberalization orexchange rate appreciation. Repeating the exercise using a panel of Indian firms,Krishna and Mitra (1998) report “strong evidence of an increase in competition(as reflected in price-marginal cost mark-ups)” after the 1991 trade liberalization(p. 447). Thus studies based on Hall’s approach are consistent with studies basedon the price-cost margin. Both methodologies suggest that heightened foreigncompetition forces down mark-ups by domestic firms.
Hall’s approach is subject to several criticisms. First, profit-maximizing firmsshould adjust their factor demands in response to productivity shocks. Hence con-sistent estimators of the slope coefficient in equation (4.4) require instrumentsthat are correlated with factor stock growth but not with transitory productivitygrowth. It is difficult to argue that any available instruments satisfy this criterion,so mark-up estimates are probably biased upward and may exhibit spurious cor-relation with the trade regime (Abbott, Griliches, and Hausman 1989).
Second, the framework presumes that firms face no adjustment costs. If someor all of the factors are subject to such costs, they will be paid less than their mar-ginal revenue product during upswings (when factor inputs are growing rapidly)and more during downswings (when factor inputs are growing slowly or shrink-ing). Since measurement error is countercyclical and productivity growth tends tobe procyclical, the estimated mark-up may be understated. Furthermore, if importcompetition depresses demand for domestic goods, it may appear to eliminatemonopoly power when it merely creates underutilization of capacity.
Third, inputs and outputs are typically poorly measured, and year-to-year fluc-tuations in these variables are particularly noisy. For example, due to gestationlags and changes in capacity utilization, growth in capital stocks is quite differentfrom growth in capital services.8 Perhaps more important, growth rates in physi-cal output are not really observed; what we observe is growth in nominal revenuedeflated by a broad price index. If firms that expand rapidly also tend to drivetheir output prices down relatively rapidly, as one would expect in a differentiatedproduct market, then true output growth is understated when input growth israpid, and the mark-up estimate should be biased downward.9 I discuss thesemeasurement problems below.
Firm Size Distribution and Its Effects on Productivity
Theory The output changes that accompany price adjustments depend on whethermarkets are segmented and whether entry or exit barriers inhibit adjustments inthe number of producers. Head and Ries (1999) provide a useful synopsis of some
Plant- and Firm-Level Evidence on “New” Trade Theories 71

alternative theories. In the absence of collusive behavior, unilateral trade liberal-ization either reduces firm size (when there are entry or exit barriers or marketsare segmented) or leaves it unchanged (when entry and exit are free).10 Alternatively,when firms collude to slightly undercut the tariff-inclusive price of imports, tradeliberalization cum free entry and scale economies force import-competing firmsthat remain in the market to operate on a larger scale.
As Head and Ries (1999) acknowledge, the invariance of firm size under freeentry and no collusion is an artifact of the Dixit-Stiglitz demand system used inthe models they consider. More generally, free entry is consistent with firm-sizeadjustments whenever trade liberalization induces changes in the demand elastic-ities (h) that domestic firms perceive. In particular, when demand elasticities risewith liberalization, price-cost mark-ups are squeezed according to equation (4.1),which should induce exit until the remaining firms can make up on volume whatthey lost on margin.
Business and labor groups care about policy-induced output adjustments,because they are generally accompanied by job creation or destruction and bycapital gains or losses. But trade economists have focused mainly on the ways thechanges in the size distribution affect productivity. To summarize these effects,I adopt Tybout and Westbrook’s (1995) decomposition of industrywide productiv-ity growth. As before, let output at the ith firm in year t be given by butnow write where is a constant-returns homothetic func-tion of the input vector, vit, and g (.) captures any scale economies. Let
be this firm’s market share in terms of its input use, and letbe its productivity level. Then the rate of growth in industrywide
average productivity, can be decomposed as
(4.5)
where measures returns to scale at the ith plant in year t. Thefirst right-hand-side term quantifies efficiency gains due to scale economies at themargin, the second term quantifies gains due to market share reallocations towardrelatively efficient producers, and the last term picks up residual intrafirm averageefficiency changes that are unrelated to internal scale economies. I hereafter refer tothese three quantities as scale effects, market share effects, and technical efficiency effects.
In most trade models, all firms within an industry are characterized by a commontechnology and face identical demand conditions, so they expand or contracttogether in response to liberalization. Productivity gains or losses, when they arepresent, thus come exclusively from scale effects.11
µit it itd q d g= ln( ) ln( )/
dB
B
dg
g
q
qt
t
it
itit
it
ti
nt
=
−
=∑ ( )µ 1
1
++
+
=∑dS
B
B
dA
A
q
qitit
ti
ntit
it
it
t1
=∑i
nt
1
,
B B St int
it it= =Σ 1 ,B q g vit it it= / ( )S g v g vit it i
ntit= ∑ =( ) ( )/ 1
g vit( )h v g vit it( ) ( ( )),= γq A h vit it it= ( ),
72 Global Integration and Technology Transfer

Plant- and Firm-Level Evidence on “New” Trade Theories 73
Several models deal explicitly with intraindustry heterogeneity and show howsize adjustments (including entry or exit) might affect productivity through themarket share effects. For example, Bond (1986) shows how heterogeneous work-ers might endogenously allocate themselves between entrepreneurial positionsand salaried employment. In his “normal” case, protection of the industrial sectorincreases firm heterogeneity and lowers average productivity by drawing low-quality entrepreneurs into managerial roles.
Melitz (2003) obtains a related set of results in a forward-looking model ofsteady state trade with firm heterogeneity and imperfect competition. Movementtoward freer trade increases a country’s imports and erodes each domestic firm’sdomestic sales and profits.12 Firms at the lowest end of the productivity distribu-tion contract or exit, while firms at the high end of the productivity distributionexpand their exports more than they contract their domestic sales. Accordingly,aggregate productivity improves.
Still another version of the same basic idea can be found in Bernard and others(2000), who use a static model to study the effects of liberalization on the size andproductivity mix of producers. They show that when firms use Bertrand pricingrules to compete, trade liberalization expands the market shares of the most effi-cient firms by providing them with larger export markets, and it forces firms atthe low end of the productive efficiency spectrum to shut down as they face com-petition from abroad.
The Evidence, Part 1: Size Distributions and Trade What do we know empiri-cally about size distributions and trade? Many analysts have fit cross-sectionalregressions that relate firm-size measures to the intensity of import competition,controlling for a few other factors, such as domestic market size.13 Whether thecompetition proxy is the import penetration rate or a measure of the industry-wide rate of protection, this literature finds that import competition reduces theaverage plant size, if it has an effect at all. Studies that include export shares in theexplanatory variable set find that average plant sizes are relatively large in theexport-oriented industries.
One limitation of this literature is that domestic output appears in the denom-inator of import penetration rates, so there may be a spurious negative correlationbetween output per firm and this foreign competition proxy. A second problem isthat causality may run from size to protection. Concentrated industries that aredominated by a few large producers may have an easier time coordinating lobby-ing efforts, because they face less of a free-rider problem. A third problem is thatmost of these studies presume that firms in all industries will adjust to foreigncompetition in the same way. This runs contrary to theory, which tells us that
74 Global Integration and Technology Transfer
industries with low entry barriers, such as apparel, are likely to show relatively lesssize adjustment and more adjustment in the number of active firms.
Several studies handle the first two criticisms by measuring exposure to foreigncompetition with policy variables such as tariff rates and license coverage ratiosand by focusing on intraindustry changes in average firm size rather than cross-industry differences. Comparing industrial census data before and after Chile’strade liberalization, Tybout, de Melo, and Corbo (1991) find that plants in “sectorswith relatively large declines in protection have shown a greater tendency towardemployment reductions” (p. 236).14 Tybout and Westbrook (1995) find that duringMexico’s unilateral trade liberalization of 1984–89, firms in the sectors that under-went relatively large reductions in license coverage ratios tended to grow relativelyslowly, while firms grew quickly in sectors with rapid export growth.15
A subset of studies that deals with the first two criticisms also deals with thethird by allowing intraindustry changes in firm size to vary with entry costs (prox-ied by industry-specific plant turnover rates). Perhaps the best is Head andRies’s (1999), which uses the Canada–U.S. Free Trade Agreement as a naturalexperiment. Their regressions suggest that “Canadian tariff reductions loweredscale [in Canada], while U.S. tariff reductions increased scale” (p. 309). Theyconfirm that entry barriers affect the way firms respond: industries with highturnover (low entry costs) show relative mild reductions in scale in the face ofheightened import competition. Roberts and Tybout (1991) obtain similar find-ings by contrasting industry-specific size distributions in Chile and Colombiaand relating them to cross-country, industry-specific differences in effectiveprotection.
The Evidence, Part 2: Trade-Induced Size Adjustments and Scale EfficiencyThe finding that foreign competition is associated with smaller firms in import-competing industries seems robust. There is also some evidence that foreignliberalization increases the size of exporting firms. How dramatically have thesetrade-induced adjustments affected scale efficiency?
Most of the studies that address this question are based on computable generalequilibrium (CGE) models. They suggest that the scale-based efficiency gains whentrade is liberalized range from 1 to 5 percent of GDP.16 These findings are suspect,for two reasons. First, while CGE models often predict firm-size expansion in alltraded goods industries, the econometric evidence clearly suggests that firms inimport-competing sectors contract when import competition intensifies, at least inthe short run. Second, even if exporter expansion were the dominant effect of lib-eralization, it is unlikely that the gains in scale efficiency would amount to much.Although CGE studies often presume returns to scale of 1.10–1.25 at the margin,this is probably a gross overstatement of the extent of unexploited scale economies.
Exporting plants tend to already be the largest in their industry (Bernard andJensen 1995, 1997; Bernard and Wagner 1997; Aw, Chen, and Roberts 1997; Das,Roberts, and Tybout 2001). They are thus not likely to exhibit much poten-tial to further exploit scale economies. Similarly, since most of the produc-tion in any industry comes from large plants, scale efficiency losses due tocontraction in import-competing sectors are also typically minor (Tybout andWestbrook 1996).
As an alternative to CGE analysis, Tybout and Westbrook (1995) used paneldata on Mexican firms to estimate returns to scale as a function of size. Theythen combine these estimates with the firm-specific growth rates observed duringMexico’s unilateral trade liberalization of 1984–89 to implement equation (4.5).Although the cumulative weighted-average growth rate in output is 53 percent forthe manufacturing sector, they find that the associated productivity growth ratedue to scale efficiency effects is only 0.5 percentage points. This reflects the factthat large plants were operating in the flat portions of their average cost scheduleand these plants accounted for the bulk of the output adjustments.
The Evidence, Part 3: Market Shares and Productivity Effects Of course, scaleeffects are not necessary to link size adjustments and productivity growth. Trade-induced market share reallocations can affect industrywide performance as longas firms are heterogeneous in terms of Ait. What do we know empirically aboutthese effects?
A simple way to address this question is to view firms’ sizes as reflecting theirproductivity.17 If liberalization causes large firms to expand while small firms con-tract or exit, the associated market share reallocations should improve efficiency.From this perspective, the very robust finding that larger firms are more likely toexport suggests that access to foreign markets allows the most efficient firms tobecome larger, thus pulling up industrywide productivity levels.
Studies that associate changes in trade protection with changes in the intrain-dustry size distribution deliver mixed evidence. Head and Ries (1999) find thatlarge Canadian firms grew the most dramatically with U.S. tariff reductions andshrank the most dramatically in response to Canadian tariff reductions. Robertsand Tybout (1991) find that shrinkage in response to import competition—proxiedby import penetration rates or effective protection rates—was relatively dramaticamong large firms in Chile (1979–85) and Colombia (1977–87). But Dutz (1996)finds that as Morocco dismantled nontariff barriers during the 1980s, small plantsshrank more than larger plants and their exit probabilities increased relative toothers’. Tybout, de Melo, and Corbo (1991) find that in Chile, reductions in effec-tive protection between 1967 and 1979 were associated with balanced percentagereductions in employment across the entire size distribution.
( )µit
Plant- and Firm-Level Evidence on “New” Trade Theories 75

These mixed findings could mean that the selection effects emphasized byMelitz (2003) are not robust, that size is a poor proxy for productivity, or both. Todetermine whether size is a poor proxy for productivity, several studies measureshare effects directly by constructing firm- or plant-specific Bit trajectories. Tybout(1991) uses revenue per worker as his productivity measure and measures share-based gains for Chile (1979–85), Colombia (1977–1987) and Morocco (1984–87).18
He finds that market share reallocations contribute to productivity growth amongtradable goods, but his data span periods of major macro shocks rather thanmajor trade liberalization episodes, so it is difficult to argue that the gains aretrade induced. Using the same Chilean data set, Pavcnik (2002) measures TFPmuch more carefully. She finds that the shifting of market shares toward moreefficient plants was an important source of efficiency gain during the sampleperiod. However, she does not investigate the link between market share realloca-tions and foreign competition. Tybout (1991), Liu (1993), Liu and Tybout (1996),and Pavcnik (2002) all find that exiting plants were substantially less productivethan surviving plants in Chile (and elsewhere), but none of these studies links thisgap to import competition or exporting opportunities.
Tybout and Westbrook (1995) have a better basis for inference in the unilateralMexican liberalization of 1984–89. Using equation (4.5), as well as a similardecomposition based on cost functions, they find that this liberalization was asso-ciated with efficiency gains and that some of these gains were due to market sharereallocations. However, they do not find strong evidence that rationalizationeffects were concentrated in the tradable goods industries. Trefler (2001), studyingthe Free Trade Agreement between Canada and the United States, finds little evi-dence that turnover-based productivity gains were concentrated in the industriessubjected to the largest tariff reductions.19
In sum, market share reallocations (including entry and exit) do matter, but itis difficult to find empirical studies that convincingly link these processes to thetrade regime.20 This is not surprising, given that the effects of import competitionon industrial evolution are inherently dynamic and poorly captured by contem-poraneous, reduced-form correlations. I return briefly to this issue when I discusstransition dynamics in the last section.
Other Intrafirm Productivity Gains
Leaving aside productivity effects due to adjustments in the firm size distribution,there are many other linkages between commercial policy and efficiency gains.These are bundled together in the third right-hand-side (technical efficiency)term in equation (4.5). Some have to do with changes in the incentives to innovateor eliminate waste. For example, foreign competition or access to foreign markets
76 Global Integration and Technology Transfer

Plant- and Firm-Level Evidence on “New” Trade Theories 77
may change the effort that a firm’s managers put forth or the rate at which theyimprove their products and processes. However, a diverse body of theory suggeststhat the direction of change in efficiency hinges critically upon model specifics(Corden 1974; Goh 2000; Hart 1983; Miyagawa and Ohno 1995; Rodrik 1992;Scharfstein 1988; Voustden and Campbell 1994).
Other effects on intrafirm productivity are more robust. As Ethier (1982) notes,intrafirm productivity gains may accompany trade liberalization if it expands themenu of intermediate inputs available to domestic firms. This allows each producerto match its input mix more precisely to the desired technology or product char-acteristics. Similar comments apply concerning access to capital goods, as de Longand Summers (1991) stress.
Trade may also act as a conduit for disembodied technology diffusion if firmslearn about products by observing imported varieties or exporting to knowledge-able buyers who provide them with blueprints and give them technical assistance(see, for example, Grossman and Helpman 1991). Similar knowledge transfers mayoccur when domestic firms enter into joint ventures or sell equity to foreign multi-nationals, although these activities are less directly related to commercial policy.
Domestic knowledge spillovers further confound the picture. If learning exter-nalities are generated by experience producing a good, then changes in a country’sproduct mix induced by commercial policy can change the rate at which domesticefficiency grows (see, for example, Krugman 1987; Young 1991). Whether tradeliberalization helps or hurts in this respect depends on which productiveprocesses generate the most positive externalities and whether they expand orcontract as protection is dismantled.
The Evidence, Part 1: Product Variety and Productivity Very little firm-levelempirical work has been done on the popular notion that increases in the menuof available inputs improve productivity. This lack of micro evidence reflects thepractical difficulties in identifying a firm’s desired input mix, observing theactual input mix, and relating discrepancies between the two to measures offirm performance. It may also reflect a presumption that diversification of inputbundles makes input use more heterogeneous at the industry level but not at thefirm level.
Feenstra, Markusen, and Zeile (1992) provide the only exception I am awareof.21 They argue that because Korean conglomerates (chaebols) are vertically inte-grated, when new intermediate producers join a conglomerate they effectivelydiversify the input menu for its final goods producers. Regressions confirm that,over a four-year period, TFP growth among final goods producers in 45 chaebolswas positively correlated with the fraction of input expenditure going to new intra-chaebol intermediate goods suppliers.
78 Global Integration and Technology Transfer
This innovative study provides tantalizing evidence that input diversificationcontributes to productivity gains. However, data limitations prevent the authorsfrom observing the connection between input variety and productivity as directlyas one would like. Simultaneity bias is also an issue, since chaebols with high pro-ductivity growth are probably inclined to expand and incorporate new firmsregardless of whether input diversification occurs.
The Evidence, Part 2: Import Discipline Effects It is much more common to relatefirm-level productivity measures to proxies for the vigor of import competition.Most micro empirical studies that do so are based on first- or second-orderapproximations to the production function and express the log ofproductivity, ln(Ait), as a function of import competition proxies, Iit, and noise. Inthe first-order (Cobb-Douglas) case, this amounts to estimating:
(4.6)
Alternatively, the log of productivity can be thought of as a draw from a one-sidedproductivity distribution (for example, ) plus an orthogonal transitoryshock beyond the control of managers: :22
(4.7)
Treating the distribution of as dependent upon import competition, one caninvestigate whether mean productivity levels or productivity dispersion respondto trade liberalization.
Regardless of whether one uses equation (4.6) or (4.7), one cannot measureimport competition at the firm level. Thus its effect is identified by cross-industryor temporal variation in Iit. The former type of identification is problematic,because cross-industry regressions describe long-run equilibria, and all indus-try characteristics—including import penetration rates, protection rates, andconcentration—are endogenous in the long run (Schmalensee 1989). Nonetheless,Caves and Barton (1990) use equation (4.7) to characterize the distributionfor each U.S. manufacturing industry and cross-industry variation in Iit to inferthat “import competition (measured by imports’ share of total supply) increasesefficiency in industries whose domestic producers are concentrated” (p. 111).
Other studies use temporal variation in Iit to link import competition andproductivity via equation (4.6) or (4.7). As I note in Tybout (2000), these studies(Harrison 1996; Nishimizu and Page 1982; Pavcnik 2002; Trefler 2001; Tybout,de Melo, and Corbo 1991; Tybout and Westbrook 1995) “tend to find that trade
αit
αit
ln( ) ln( )q vi i ij it it
j
J
= + +=
∑β α ε1
ln( )Ait it it= +α εαit < 0
ln( ) ln( )q v Ii i ij it it
j
J
= + +=
∑β γ ε1
q A h vit it it= ( )

Plant- and Firm-Level Evidence on “New” Trade Theories 79
liberalization is associated with rising average efficiency levels” (p. 34). Similarly,liberalization drives down measured productivity dispersion relatively more inimport-competing industries (Haddad and Harrison 1993; Pavcnik 2002; Tybout,de Melo, and Corbo 1991).23 Both sets of findings are consistent with the importdiscipline hypothesis, but they also could reflect the kind of selection effectsdescribed by Bond (1986), Melitz (2003), and Bernard and others (2000).
The implications of these studies are further clouded by methodological prob-lems. With the exception of Pavcnik (2002), they do not deal with the simultaneitybias that results from the dependence of factor inputs on productivity levels.Moreover, all of the studies use industrywide price deflators to convert plant-specificrevenues to plant-specific measures of physical output. But since products withineach industry are heterogeneous, this procedure attributes relative price fluctua-tion to physical output fluctuation, and it thus confounds efficiency with monopolypower. Trade-induced reductions in measured “productivity” dispersion may beno more than the reductions in mark-ups among firms with market power that Idiscussed before.
A general problem with this literature is that it tends to equate measured efficiencygains with welfare improvements. Thus when these gains are associated with tradeliberalization, they are touted as a beneficial effect of foreign competition. But thecosts of productivity gains are often embodied in overhead, license fees, training,and other items that do not get measured in the input vector. Furthermore, thebenefits these expenditures generate are not fully reaped in the same periods inwhich they are incurred. I know of no study that attempts to measure the presentvalue of firms’ productivity-enhancing expenditures and compare them with thepresent value of the resulting productivity gains.
The Evidence, Part 3: Trade and Technology Diffusion Does trade serve as aconduit for technology diffusion? Many studies have established that exporterstend to be larger, more skill-intensive, and more productive than their domesticallyoriented counterparts (Aw and Hwang 1995; Aw, Chen, and Roberts 1997; Bernardand Jensen 1995, 1997; Bernard and Wagner 1997; Handoussa, Nishimizu, andPage 1986; Chen and Tang 1987). Furthermore, the case study literature on exportersdocuments instances in which technologically sophisticated buyers transmit blue-prints and proprietary knowledge to the exporting firms.24 However, there is somedoubt as to whether the cross-sectional correlation between performance andexporting mainly reflects causality from performance to exporting. Firms mayself-select into export markets, be sought out by foreign buyers, or both becausethey are high quality.
Several authors have attempted to resolve this issue by studying temporalchanges in firms’ performance and their relation to export market participation.

80 Global Integration and Technology Transfer
These studies amount to Granger causality tests based on variants of the autore-gressive specification:
(4.8)
where yit is a dummy variable that indicates whether the ith firm exports in period t.Causality tests in this context establish whether exporting experience in the pasthelps explain productivity in the present, once other determinants of currentproductivity (including previous productivity) are controlled for. Given that yit
responds to productivity shocks, the distributed lag will be orthogonalto only when is serially uncorrelated, so it is key to use a generous lag length(J) for the term .
Fitting a version of equation (4.8) to plant-level panel data from Colombia,Mexico, and Morocco, Clerides, Lach, and Tybout (1998) find very little evidencethat past exporting experience improves performance. Bernard and Jensen (1999)obtain similar results using U.S. data, finding that “exporting does not Granger-cause productivity but does Granger-cause employment, shipments and wages”(p. 14). In contrast, Kraay (chapter 7 in this volume) finds that lagged yit valueshelp explain current productivity among Chinese firms; Bigsten and others(1999) find evidence that exporting Granger-causes productivity among Africanfirms. Aw, Chen, and Roberts (1997) obtain similar findings using census datafrom Taiwan (China) and the Republic of Korea.25
There are at least four problems with this literature. First, the contact betweenan exporting firm and its foreign client may occur well before export flows areactually observed in the data.26 Second, as with the import discipline literature,there is a strong tendency to interpret productivity gains as good but no effort toquantify the costs of these gains. Third, the measures of performance are quitecrude, as discussed in connection with the import discipline literature. Fourth,almost all of these studies focus on single conduits for technology transfer. Butinternational activities such as exporting, importing intermediates, importingcapital goods, and selling equity abroad are often complementary, so firms pursuethem in bundles (Kraay, Soloaga, and Tybout in chapter 11 in this volume). Stud-ies that focus on one activity at a time may generate misleading conclusionsregarding channels of international technology diffusion.
Kraay, Soloaga, and Tybout (chapter 11 in this volume) tackle the third andfourth methodological problems using the same data sets that Clerides, Lach, andTybout (1998) used to study learning by exporting. First, they document thatinternational activities indeed come in bundles: exporting, importing intermediategoods, importing capital goods, and sales of equity to multinationals are clearly notindependent activities.27 Next, by using a nested logit representation of demand
Σ jJ
j it jA= −1β ln( )
εitεit
Σ jJ
j it jy= −1γ
ln( ) ln( )A A yit j it j j
j
J
j
J
it j= + + + +−
==−∑∑β β γ0
11
εεit ,. . . s s

Plant- and Firm-Level Evidence on “New” Trade Theories 81
for the differentiated products and exploiting information on the market share ofeach product, they are able to separately measure product and process innovationsat each firm.28 Finally, they relate quality trajectories and average cost trajectories tofirms’ international activities, using generalized versions of equation (4.8). Theyfind that activity histories do not usually help predict future product quality orreduce average production costs, once the histories of these performance variablesare controlled for. Nonetheless, Colombian firms that engage in at least someinternational activities—especially those that import their intermediate goods—(tend to have higher product quality.29 This finding suggests the kind of static effi-ciency effect that Ethier (1982) envisioned.
Summary
Measurement and methodological problems plague the literature I have reviewedhere, but some findings seem robust. First, the evidence suggests that mark-upsfall with import competition. The most likely interpretation is that foreign com-petition increases the elasticity of demand that domestic firms face. It is not clearwhether these trade-induced reductions in mark-ups reflect the elimination ofmarket power or the creation of negative economic profits.
Second, contrary to the predictions of many simulation models, import-competingfirms cut back their production levels when foreign competition intensifies. This isnot consistent with the Helpman and Krugman (1985) monopolistic competitionmodel, under which some domestic plants exit and the remaining plants eitherremain the same size (if their demand elasticities do not change) or expand (if theirdemand elasticities rise). Instead, it suggests that sunk entry or exit costs are important inmost sectors.
Third, trade does seem to rationalize production in the sense that markets for themost efficient plants are expanded. Furthermore, if the methodological problemswith measuring productivity are discounted, most studies suggest that exposure toforeign competition improves intraplant efficiency (an unknown cost).
Fourth, firms that engage in international activities do tend to be larger andmore productive. But it is not obvious that the activities caused these characteris-tics and not vice versa.
Transition Dynamics
The theories I have mentioned describe static or steady-state equilibria; the regressionsthat give them empirical content deal mostly with patterns of contemporaneous corre-lation. But some important issues are inherently dynamic. For example, when a devel-oping country dismantles its trade barriers and devalues its currency, as the WorldBank often recommends, the effect of the new regime on the central bank’s foreign

82 Global Integration and Technology Transfer
currency reserves depends on the resulting changes in the export trajectory. Politicalsupport for a given reform package depends on the associated changes in firms’ marketvalues and employment trajectories that business representatives and workers antici-pate. All of the literature I have reviewed thus far is silent on these high-profile issues.
The dynamic effects of policy reforms are difficult to characterize, because theyreflect complex decisions on the part of firms. Faced with an uncertain future,some managers find themselves weighing the earnings effects of shutting downplants, firing workers, or both against the associated severance costs and the optionvalue of retaining plants or workers for possibly better days. Others weigh thesunk costs of breaking into foreign markets, building new plants, or hiring workersagainst the net revenue streams these activities may generate. Their decisions arefurther complicated by the need to anticipate decisions by managers producingcompeting products. Below I discuss a nascent literature that tackles the relationbetween commercial policy reforms and industrial responses in settings withthese features.
Export Dynamics
Theory In the past 15 years, several theoretical contributions to the trade literaturehave incorporated sunk costs and uncertainty in dynamic models. Among the firstresearchers to do so were Dixit (1989), Baldwin (1988), and Baldwin and Krugman(1989), who investigated the role of sunk costs and expectations in drivingexporters’ behavior. Generalizing their specification in anticipation of the discus-sion to follow, I specify an export profit function for the ith firm that dependson the exchange rate ( ), marginal production costs ( ), a foreign demand shifter( ), and serially uncorrelated noise ( ): 30 I assume that firmswithout prior exporting experience must establish distribution channels, repackagetheir products, and learn bureaucratic procedures and call the sum of these entrycosts for new exporters . Then, defining the indicator variable to take avalue of 1 in periods when the ith firm exports and 0 otherwise, the pay-off frombeing an exporter in year t may be written as:
Presuming that the vector follows a first-order Markov process, risk-neutral managers do best to choose a sequence of decision rules,
that maximizes their expected profit stream from export marketx yit it it, , ),ε −1
y g e cit t t it= ( , ,( , , )e c xt it t
u e c x y y
e c x
t it it it it it
ft it it
( , , , , , )
( , , )
επ
− =
+
1
εεπ ε
it it it
ft it it S it
if y y
e c x if y
= =
− +−1 11;
( , , ) Γ iit it
it it
y
if y y
= == =
−
−
1 0
0 0 01
1
;
;
yitΓS
π εft it t ite c x( , , ) .+εitxit
citet

Plant- and Firm-Level Evidence on “New” Trade Theories 83
participation: Equivalently, their patterns of export market participation shouldsatisfy the following Bellman equation:
(4.9)
Expectations are taken conditioned on and the Markov process that governthis vector’s evolution.
This framework implies that seemingly identical policies and macro conditionscan lead to different levels of exports, depending on how many firms have a historyof export market participation, for several reasons. First, when firms have no export-ing experience, they weigh the sunk costs of entry against the expected profitstream. But when most firms are already exporters, the aggregate response toexport incentives reflects volume adjustments and has little to do with entry costs.Second, firms that begin exporting in response to a shock—say, a large devaluation—
may not cease exporting when that shock is reversed. Third, expectations aboutfuture exchange rate trajectories and commercial policies may play a critical rolein determining whether firms invest in becoming exporters today. Fourth, exportresponsiveness to any shock or regime switch depends critically on the amount ofcross-firm heterogeneity in marginal costs and foreign demand, . Many firms orjust a scattered few may be on the verge of exporting.
Evidence Several studies have explored the empirical relevance of the sunk-costexport model sketched above. Roberts and Tybout (1997) begin from the implica-tion of equation (4.9) that firms will find it optimal to export whenever
The second bracketed term describes the option value of being an exporter inperiod t, that is, the expected current value of being able to export in period t+1without having to pay sunk entry costs. Accordingly, its magnitude depends onexpectations about the future operating profits one might generate by exporting.Combining terms that depend on current values of the state variables, the ith firmwill do best to export whenever
where
− =+ + + +E V e c x yt t it it it it( , , , )].|1 1 1 1 0ε
f e c x e c x E V e ct it itf
t it it t t it( , , ) ( , , ) [ ( ,= + +π δ 1 ++ + + =1 1 1 1, , | )x yit it itε
f e c x yt it it it S it( , , ) ,+ + >−1 0Γ ε
π ε
δ
ft it it it S it
t t
e c x y
E V e c
( , , ) ( )
[ ( ,
− − +
+
−
+
1 1
1
Γ
iit it it it t t it itx y E V e c x, , ) ( , , ,|+ + + += −1 1 1 11ε εiit ity+ = >1 0 0| )]
xit
( , , )e c xt it t
V e x c y e c xt it it it ityit
ft it i( , , , , ) max ( , ,ε π− =1 tt it Sy) ( )− − −1 1 Γ
( , , ,+ + + + +ε δ εit t t it itE V e c x1 1 1 iit ity+1, )

84 Global Integration and Technology Transfer
Using a reduced form approximation to f(q) and assuming a particular distri-bution for the error term, , this equation implies a dynamic discrete choicemodel of export market participation. Roberts and Tybout (1997), Bernard andJensen (1999), Campas (1999), and Sullivan (1997) fit this model as a dynamicprobit or logit and test whether sunk entry costs affect export market participation.This amounts to testing whether lagged exporting status affects current status,once the other sources of persistence in behavior have been con-trolled for. If their sources of persistence are not completely controlled for, thisapproach to inference misattributes serial correlation in exporting status to sunkcosts. It is therefore important to treat as a serially correlated disturbance whenestimating the equation.
The universal finding of these studies is that sunk costs are important. Evenafter serial correlation in is treated, the probability that a firm will export, given
can be up to 0.70 higher if it exported the previous period. Fromthis, researchers have typically concluded that export aggregates are subject toimportant hysteresis effects and that sunk costs matter.
Das, Roberts, and Tybout (2001) revisit the question of how sunk costs shapeexport responsiveness among Colombian chemical producers. Instead of using areduced-form version of the decision rule, they fit a structural model that explic-itly describes the profit function and the autoregressive processes that govern thevector Using their estimates, they then examine the option valueof export market participation for each firm:
. This expression measures the importance of expecta-tions about the future in shaping exporting decisions. They find that it is quanti-tatively important for small-scale exporters, whose foreign demand is relativelylimited. However, the firms that supply the bulk of total exports earn operatingprofits that far exceed the option value term. Hence hysteresis effects are onlyimportant to fringe players in the export markets; aggregate exports are relativelyinsensitive to history or expectations. Put differently, if one is interested only inthe aggregates, sunk entry costs and the subtleties they introduce can be ignoredfor many industries.31
One robust finding concerning exporters is that they tend to sell very smallfractions of their output abroad (Aw, Chen, and Roberts 1997; Roberts, Sullivan,and Tybout 1995; Campas 1999). In principle, this could mean that foreigndemand for each firm’s product is very limited and inelastic, but this is not theway most people view foreign markets. A second explanation is that firms exportjust enough to exploit duty drawback schemes and purchase the imported inter-mediates or capital goods at duty-free prices. To my knowledge, this hypothesishas not been pursued, although it would be easy to do so. A third hypothesis isthat firms export partly to diversify their earnings stream, exploiting the imperfect
( ,E V e xt t it+ +1 11 1 0, | )]εit ity+ =δ ε[ ( , , | )E V e x yt t it it it+ + + = −1 1 1 1
( , , , ).x c eit it t itε
( , , , ),x c eit it t itεεit
εit
( , , , )x c eit it t itε
εit

correlation between foreign and domestic shocks. Small stable shares in foreignmarkets may be rational under these assumptions.
Maloney and Azevado (1995) develop a simple model of this diversificationmotive for exports and fit it to firm-level panel data from Mexico. They find,among other things, that exchange rate volatility and the covariance betweendomestic and international demand shocks are significant determinants of exportvolumes. Hence, for example, when an overvalued exchange rate is allowed tofloat, the export response may be counterintuitive.
In sum, the initiation of exports appears to invoke some sunk start-up costs.These costs matter a good deal for marginal exporters but are unimportant relativeto the operating profits that large exporters earn. Thus their effect on aggregateexport responses to regime shifts or exchange rate shocks may not be large. Otherdeterminants of export responsiveness that may be relevant include risk diversifi-cation considerations and domestic market demand shocks (when marginal costsare not flat). There is some evidence that risk diversification matters; domesticmarket demand shocks remain largely unexplored.
Industrial Evolution
Theory Theoretical models of industrial evolution demonstrate how the combi-nation of sunk entry costs with imperfect foresight and cross-firm heterogeneitycan lead to continual flux in the population of active firms (Jovanovic 1982;Hopenhayn 1992; Ericson and Pakes 1995). They also describe the implications ofthis flux in terms of job turnover patterns and productivity growth. Very little the-oretical work has been done on the effects of commercial policy in an economywith these features.
Two exceptions merit note. The first is Melitz (2003), who focuses on the rela-tion between openness and the steady state distribution of firm types. The other isAlbuquerque and Rebelo (2000), who abstract from intraindustry heterogeneity toderive some analytical results about dynamic responses to trade liberalization. OnlyAlbuquerque and Rebelo (2000) deals with transition issues, so I focus on it here.
Albuquerque and Rebelo consider an open economy with homogeneous firmsin each of two sectors. New firms must pay a sunk fee to initiate production, soincumbents may earn positive profits in the steady state without inducing entry,and multiple equilibria are possible. Responses to policy shocks depend on thepre-reform equilibrium. When profits net of entry costs are zero in the exportablegoods sector and profits before entry costs are zero in the import-competing sector,small reductions in the rate of protection should generate entry in the exportablegoods sector and exit in the import-competing sector. Unanticipated reforms alsoinduce intersectoral reallocations of variable factors in the period before entry and
Plant- and Firm-Level Evidence on “New” Trade Theories 85

exit occur. Pre-announcing eliminates this short-run adjustment period. If, how-ever, the economy begins from an interior steady state and reforms are too mild totrigger entry or exit, the effects of policy reforms are limited to variable factormovements and capital gains or losses for the owners of incumbent firms.
The dichotomy between responses beginning from zero-profit versus interiorprofits is an artifact of the assumption that firms within each sector are homoge-neous. Intraindustry heterogeneity will generally mean that operating profits areclose to zero for the marginal incumbent and profits net of entry costs will beclose to zero for the marginal entrant. Nonetheless, the results mentioned abovesuggest how responses to reforms should depend on the density of incumbentsand potential entrants near the zero-profit margin.
The Evidence, Part 1: Descriptive Studies It is well established that, even withinnarrowly defined industries, plants are heterogeneous in terms of their size andmeasured productivity (see the references cited in the first section of this chapter).Simultaneous plant entry and exit are the norm, as are market share reallocationsand job creation and destruction among incumbent firms (see, for example, Dunne,Roberts, and Samuelson 1989; Davis, Haltiwanger, and Schuh 1996; Baldwin,Dunne, and Haltiwanger 1998; Roberts and Tybout 1996). These stylized factsinspired the modern theory of industrial evolution and are commonly cited as evi-dence of its relevance.
Much less is known about the effects of commercial policy shocks on industrialevolution patterns or how these effects depend on the initial population of firms.A number of studies document patterns of contemporaneous correlation betweenopenness, firm size distributions, and entry/exit or market share–based efficiencygains (see the first section of this chapter). There is also a small amount of evi-dence on openness to patterns of job turnover (Levinsohn 1999).32 However, thesestudies tell us little about the dynamic responses to reforms when threshold costsand uncertainty make firms’ adjustments forward looking, gradual, or dependenton initial conditions.
The Evidence, Part 2: A Structural Model Lu and Tybout (2000) attempt togo beyond patterns of contemporaneous correlation and quantify these dynamicrelationships. Drawing heavily on Ericson and Pakes (1995) and Pakes andMcGuire (1994), they develop an empirical model with sunk costs, heterogeneity,and uncertainty. Their model portrays an import-competing industry populatedby a finite number of potential entrepreneur/owners, including those already in theindustry (incumbents) and those contemplating entry (potential entrants). Eachincumbent is characterized by a unique product and a time-varying productivityindex that summarizes both the product’s appeal and the unit production costs.
86 Global Integration and Technology Transfer

Imports are represented by a single foreign variety whose price responds to exchangerate shocks and commercial policy reforms but not to domestic producers’ behavior.
Entrepreneurs in this industry play a Markov-perfect dynamic game againstone another. Each period, each entrepreneur attempts to maximize his or her dis-counted net profit stream, given the available information set. Potential entrantschoose whether to enter the market, given their privately observed entry costs.Incumbents decide whether to remain in the market or exit, given the privatelyobserved scrap value of their firms. The incumbents who remain active engage inBertrand-Nash product market competition with one another, given the currentprice of the import-competing good and a simple logit demand system.
At the beginning of each period, all entrepreneurs learn the productivity levelof each incumbent firm (industry structure), as well as the current realizations onthe number of consumers and the real effective exchange rate (market conditions).If an incumbent firm remains in the industry, its productivity evolves from periodto period according to a common knowledge exogenous Markov process, as dothe exchange rate and the number of consumers. Firms solve for their optimalstrategies and make their exit or entry decisions simultaneously. From period toperiod, the industry structure evolves with entry, exit, and random shocks to eachfirm’s productivity.
Using Colombian panel data on the pulp and paper industry, Lu and Tybout(2000) estimate the demand parameters of their model. Combined with observedmarket shares these allow them to impute product quality trajectories for eachproducer and to estimate the associated Markov processes. Given these primitives,they calibrate the entry and exit cost distributions, so that simulated plantturnover rates approximate the industry’s actual figures.
Lu and Tybout’s main computational experiment is to simulate responses to achange in the exchange rate process that gradually intensifies import competition.The impact effect of this regime switch is to squeeze price-cost mark-ups, just asthe econometric evidence suggests. However, the new exchange rate regime alsodiscourages entry (but not exit), so over time the number of domestic producersgradually shrinks. With the menu of varieties falling, elasticities of demand foreach variety fall, allowing the remaining incumbents to restore their mark-upsand cover their operating costs. This transition path suggests that the robust mar-gin squeeze effects and output contraction effects identified by contemporaneouscorrelation patterns may not be permanent.
Although consumers initially benefit from cheaper imported goods and cheaperdomestic goods, they are ultimately left with fewer domestic varieties at prices close topre-appreciation levels. Hence in the scenario that Lu and Tybout analyze, the presentvalue of consumer welfare actually falls with heightened import competition.33
Producers suffer capital losses, of course, so they are worse off, too.
Plant- and Firm-Level Evidence on “New” Trade Theories 87

Extra costs are also imposed on workers, who endure higher job destructionrates during the transition period. Indeed, the job turnover effects predicted bythis model are implausibly high, suggesting that it should be generalized toincluding severance and screening costs, as in Hopenhayn and Rogerson’s (1993)simulations. By the same token, the apparent importance of hiring and firing costsmeans that firms’ expectations are critical and suggests that static calculations ofthe employment effects of trade policies can be very inaccurate.
This framework provides a conceptually rigorous way to address the question ofhow changes in the intensity of import competition affect the market share–basedefficiency changes described by the second term in equation (4.5). Lu and Tybout(2000) find that this type of efficiency gain is small, for two reasons. First, most ofthe adjustment in varieties comes from less entry rather than more exit. Incumbentfirms that are relatively inefficient do not increase the rate at which they jump outof the market, because their entry costs are already sunk, their scrap values aresmall, and they perceive a possibility that conditions will improve in the future.Second, the firms that do enter or exit account for a relatively small fraction of totalproduction. This is consistent with what is observed in the data.
These simulations are subject to several criticisms. Most fundamentally, they arepartial equilibrium and thus do not document the capital gains and growing num-ber of product varieties in sectors that benefit from exchange rate appreciation.Second, they do not permit the number of imported varieties to adjust. If foreignfirms face sunk entry costs when breaking into the domestic market, some newfirms will probably be induced to enter by the change in the exchange rate regime.Third, the model is highly stylized in many respects, including the demand system,the productivity growth process (which is presumed exogenous), and the distri-butions for entry costs and scrap values. Nonetheless, at a minimum the modeldemonstrates that conclusions based on contemporaneous patterns of correlationcan be very misleading, and it brings together in a unified framework the phenom-ena that firms, workers, and consumers care about.
An Agenda for Future Research
I close with a few observations on directions for future trade research using firm-or plant-level data. First, as the previous section suggests, I am enthusiastic aboutthe new insights that may be gained from dynamic structural models that linktrade regimes and industrial evolution. These models suffer from some seriouslimitations, but they integrate many pieces of the response story that were hereto-fore treated in disjoint literatures. They also provide a basis for counterfactualsimulations in the presence of threshold costs, uncertainty, and heterogeneousfirms. As computers become more powerful and solution algorithms improve,
88 Global Integration and Technology Transfer

Plant- and Firm-Level Evidence on “New” Trade Theories 89
I am hopeful that econometrically estimated industrial evolution models can bemade more realistic and used for applied policy work.
Second, despite the large volume of research on the link between trade and pro-ductivity, there are several ways in which this literature might be improved. Onewould be to stop pretending that firms in manufacturing industries produce homo-geneous products and instead deal with pricing, output, and productivity measure-ment in unified frameworks (see, for example, Melitz 2000). Another would be totighten the link between theory and tests. Theory has emphasized the effects ofenhanced input variety (including both capital and intermediate goods) and, morerecently, efficiency gains due to geographic agglomeration. But there is very littledirect micro evidence on the importance of either. These are difficult topics totackle, but creative empiricists should be able to make progress on both fronts.
Third, although the relationship between trade and wages has attracted consid-erable attention, there is only limited evidence on the micro details of worker dis-placement, job search processes, and reemployment patterns triggered by changes inthe trade regime. The census bureaus of several countries (including the UnitedStates) have recently devoted some resources to matching household survey datawith establishment survey data, so the characteristics of plants and workers cannow be analyzed together and workers can be tracked as they change jobs. Thesematched data sets should provide a much better basis for inference on the employ-ment effects of commercial policy reforms or changes in the exchange rate regime.
Notes
1. I ignore the empirical literature on multinationals and foreign direct investment, which istreated in chapter 3.
2. In these models protection takes the form of institutional arrangements for antidumping measures.3. See Head and Ries (1999) for discussion and references.4. This measure presumes that intermediate input and labor use are proportional to output and
that the proportions are fixed across plants. See Schmalensee (1989) for further discussion of the lim-itations of price-cost margin as a performance measure.
5. See also Lee (1991) and Roberts and Tybout (1996,) for surveys of the literature on developingcountries.
6. As Roberts and Tybout (1996, p. 196) note, “Efficient plants should be larger and have higherprofits, so a positive correlation is generally expected between market shares and price-cost margins,regardless of whether firms have market power . . . .”
7. Generalizations have included allowing for nonconstant returns to scale and letting h and themean productivity growth rate vary across firms. See, for example, Harrison (1994).
8. Pakes and Griliches (1984) estimate that it may take several years for newly installed capital toreach full productivity.
9. Klette and Griliches (1996) and Melitz (2003) discuss the consequences of this measurementproblem for estimates of production function parameters.
10. The most common form of entry and exit barrier is sunk start-up costs. Firms continue to oper-ate as long as their expected earnings stream covers their expected future expenditures, even if ex postthey discover they cannot also recoup the sunk costs they paid to enter (see, for example, Albuquerque

90 Global Integration and Technology Transfer
and Rebelo 2000). Uncertainty about future market conditions is likely to increase the option value ofremaining in operation, effectively compounding persistence in status. Firms that enjoyed excess profitsbefore import competition intensified will also fail to exit.
11. I do not treat external returns to scale, because these are nearly impossible to measure.12. The cases he analyzes are autarky versus free trade, more versus fewer countries in a customs
union, and high versus low nontariff barriers (at home and abroad).13. These studies span a wide range of countries. See Scherer and others (1975), Muller and Owen
(1985), Baldwin and Gorecki (1986), Caves (1984), and Schwalbach (1988). Tybout (1993) providesfurther details on these studies.
14. This pattern is less apparent when size is measured with output or value-added, suggesting thatefficiency gains occurred in the import-competing industries.
15. They find no significant cross-industry correlations between firm size and effective protectionrates or import penetration rates, however.
16. See, for example, Harris (1984), Smith and Venables (1988), Norman (1990), and Brown,Deardorff, and Stern (1991). Tybout and Westbrook (1996) provide a more detailed discussion.
17. The size-productivity linkage is common in models with heterogeneous firms. See, for exam-ple, Hopenhayn (1992), Melitz (2000), and Bernard and others (2000).
18. His decomposition does not distinguish intraplant productivity gains due to scale efficiencyfrom other sources of intraplant gains. Bernard and others (2000) show that revenue per unit output isa monotonic function of true total factor productivity if firms compete.
19. Trefler’s (2001) intraindustry data are grouped by plant size, so he cannot rule out the possibilitythat the Free Trade Agreement generated productivity gains through reallocations within size classes orthrough entry and exit.
20. Bernard and Jensen (2000) link entry and exit patterns to trade indirectly by arguing that, withoutput prices pinned down by international arbitrage, Rybczynski effects should induce net entry inthe sectors that intensively use the factors that are growing relatively rapidly. They confirm this conjectureusing data from the United States, first with cross-industry regressions at the national level, then withsimilar regressions at the regional level. They find that where human capital and physical capital havegrown relative to unskilled labor, exit rates have been low among skill-intensive goods and high amonglow-skill goods.
21. Feenstra and others (1999) use detailed data on trade flows, albeit not at the firm level, to linksectoral productivity to the diversity of final good and upstream exports.
22. Detailed discussions of this approach to productivity analysis may be found in the stochasticfrontier literature (see, for example, Greene 1993).
23. There is also evidence that innovative activities are stimulated by import competition (seeBlundell, Griffith, and van Reenen 1999).
24. Much of this literature focuses on East Asia. Pack (chapter 2 in this volume) and Westphal(2001) provide recent surveys.
25. Both Kraay (chapter 7 in this volume) and Bigsten and others (1999) are based on annual datawith short lag lengths, J, and do not provide tests for serial correlation. Hence they may be picking upa spurious correlation. Aw, Chen, and Roberts (1997) compare censuses at five-year intervals, so theirstudy is also likely to suffer from this problem.
26. For interesting discussions of the case study literature on pre-exporting contacts with buyers,see Pack (chapter 2 in this volume) and Westphal (2001).
27. Using multinomial probit models, Aw, Roberts, and Winston (2001) document similar dynamiccomplementarities among worker training, R&D, and exporting.
28. One unappealing feature of their approach is that it assumes that the ratio of physical output tointermediate input use is constant across all producers in a given four-digit industry and geographicregion.
29. Given the way Kraay, Soloaga, and Tybout impute quality, this is almost a corollary to the find-ing that firms engaging in international activities have large domestic market shares.

30. Domestic product market conditions are kept out of the analysis by assuming flat marginal costschedules with respect to output.
31. Using a reduced-form econometric model and descriptive statistics, Campas (1999) draws similarconclusions from Spanish data.
32. Levinsohn (1999) finds that job turnover patterns in Chile during the 1980s were not closely linkedto commercial policy or exchange rate shocks. He argues that turnover rates were higher among tradablegoods than among nontradables. Thus liberalization in economies like Chile’s should reduce job securityand may meet resistance, for the political economy reasons detailed by Fernandez and Rodrik (1991).
33. This result is partly an artifact of the demand system they use, which probably overstates thevalue consumers place on goods with small market shares.
References
Abbott, Thomas, Zvi Griliches, and Jerry Hausman. 1989. “Short-Run Movements in Productivity:Market Power versus Capacity Utilization.” Department of Economics, Harvard University,Cambridge, MA.
Albuquerque, Rui, and Sergio Rebelo. 2000.“On the Dynamics of Trade Reform.” Journal of InternationalEconomics 51: 21–48.
Aw, Bee-Yan, and Amy Hwang. 1995. “Productivity and the Export Market: A Firm-Level Analysis.”Journal of Development Economics 47: 313–32.
Aw, Bee-Yan, Xiaomin Chen, and Mark Roberts. 1997. “Firm-Level Evidence on Productivity Differen-tials and Turnover in Taiwanese Manufacturing.” Working Paper 6235, National Bureau of Eco-nomic Research, Cambridge, MA.
Aw, Bee-Yan, Mark Roberts, and Tor Winston. 2001. “Investment in Knowledge and the Evolution ofFirm Productivity in the Taiwanese Electronics Industry.” Department of Economics, PennsylvaniaState University, University Park, PA.
Baldwin, John, and Paul Gorecki. 1986. The Role of Scale in Canada–U.S. Productivity Differences in theManufacturing Sector: 1970–79. Toronto: University of Toronto Press.
Baldwin, John, Timothy Dunne, and John Haltiwanger. 1998. “A Comparison of Job Creation and JobDestruction in Canada and the United States.” Review of Economics and Statistics 80: 347–56.
Baldwin, Richard. 1988. “Hysteresis and the Beachhead Effect.” American Economic Review 78: 773–85.Baldwin, Richard, and Paul Krugman. 1989. “Persistent Trade Effects of Large Exchange Rate Shocks.”
Quarterly Journal of Economics 104: 635–54.Bernard, Andrew, and J. Bradford Jensen. 1995. “Exporters, Jobs, and Wages in U.S. Manufacturing
1976–87.” Brookings Papers on Economic Activity: Microeconomics, Washington, DC.———. 1997. “Why Some Firms Export: Experience, Entry Costs, Spillovers, and Subsidies.” School of
Management, Yale University, New Haven, CT.———. 1999. “Exceptional Exporter Performance: Cause, Effect, or Both?” Journal of International
Economics 47: 1–26.———. 2000. “Who Dies? International Trade, Market Structure and Plant Closures.” Tuck School of
Business, Dartmouth College, Hanover, NH.Bernard, Andrew, and Joachim Wagner. 1997. “Exports and Success in German Manufacturing.”
Weltwirtschaftliches Archiv 133: 134–57.Bernard, Andrew, Jonathan Eaton, J. Bradford Jensen, and Samuel Kortum. 2000. “Plants and Produc-
tivity in International Trade.” Working Paper 7688, National Bureau of Economic Research, Cam-bridge, MA.
Bhagwati, Jagdish. 1978. Foreign Trade Regimes and Economic Development: Anatomy and Consequences ofExchange Control Regimes. Lexington, MA: Ballinger for the National Bureau of Economic Research.
Bigsten, Arne, Paul Collier, Stefan Dercon, Bernard Gauthier, Jan Gunning, Anders Isaksson, AbenaOduro, Remco Ooostendorp, Cathy Patillo, Mans Soderbom, Michel Sylvain, Francis Teal, and
Plant- and Firm-Level Evidence on “New” Trade Theories 91

92 Global Integration and Technology Transfer
Albert Zeufack. 1999. “Exports and Firm-Level Efficiency in the African Manufacturing Sector.”School of Business, University of Montreal.
Blundell, Richard, Rachel Griffith, and John van Reenen. 1999. “Market Share, Market Value andInnovation in a Panel of British Manufacturing Firms.” Review of Economic Studies 66: 529–54.
Bond, Eric. 1986. “Entrepreneurial Ability, Income Distribution, and International Trade.” Journal ofInternational Economics 20: 343–56.
Brown, Drucilla, Alan Deardorff, and Robert Stern. 1991. “A North American Free Trade Agreement:Analytical Issues and a Computational Assessment.” Department of Economics, University ofMichigan, Ann Arbor, MI.
Campas, Jose. 1999. “Exchange Rates and Trade: How Important Is Hysteresis in Trade?” Stern Schoolof Business, New York University, New York.
Caves, Richard. 1984.“Scale, Openness and Productivity in Manufacturing.” In The Australian Economy:A View from the North, ed. Richard Caves and Lawrence Krause.Washington, DC: Brookings Institution.
Caves, Richard, and David Barton. 1990. Efficiency in U.S. Manufacturing Industries. Cambridge, MA:MIT Press.
Chen, Tain-Jy, and De-Piao Tang. 1987. “Comparing Technical Efficiency between Import-Substitutingand Export-Oriented Foreign Firms in a Developing Country.” Journal of Development Economics36: 277–89.
Clerides, Sofronis, Saul Lach, and James Tybout. 1998. “Is Learning by Exporting Important? Micro-Dynamic Evidence from Colombia, Mexico and Morocco.” Quarterly Journal of Economics 113:903–47.
Corden, W. Max. 1974. Trade Policy and Economic Welfare. Oxford: Clarendon Press.Das, Sanghamitra, Mark Roberts, and James Tybout. 2001. “Market Entry Costs, Producer Hetero-
geneity, and Export Dynamics.” Working Paper 8629, National Bureau of Economic Research,Cambridge, MA.
Davis, Steven, John Haltiwanger, and Scott Schuh. 1996. Job Creation and Destruction. Cambridge, MA:MIT Press.
de Long, J. Bradford, and Lawrence Summers. 1991. “Equipment Investment and Economic Growth.”Quarterly Journal of Economics 56: 445–502.
Devarajan, Shanta, and Dani Rodrik. 1991. “Pro-Competitive Effects of Trade Reforms: Results from aCGE Model of Cameroon.” European Economic Review 35: 1157–84.
Dixit, Avinash. 1989. “Entry and Exit Decisions under Uncertainty.” Journal of Political Economy 97:620–38.
Dunne, Timothy, Mark Roberts, and Larry Samuelson. 1989. “Plant Turnover and Gross EmploymentFlows in the U.S. Manufacturing Sector.” Journal of Labor Economics 7: 48–71.
Dutz, Mark. 1996. “‘Oligopolistic Firms’ Adjustment to Quota Liberalization: Theory and Evidence.”In Industrial Evolution in Developing Countries, ed. Mark Roberts and James Tybout. New York:Oxford University Press.
Ericson, Richard, and Ariel Pakes. 1995. “Markov-Perfect Industry Dynamics: A Framework forEmpirical Work.” Review of Economic Studies 62: 53–82.
Ethier, Wilfred. 1982. “National and International Returns to Scale in the Modern Theory of Interna-tional Trade.” American Economic Review 72: 950–59.
Feenstra, Robert, James Markusen, and William Zeile. 1992. “Accounting for Growth with New Inputs:Theory and Evidence.” American Economic Review: Papers and Proceedings 82: 415–21.
Feenstra, Robert, Dorsati Madani, Tzu-Han Yang, and Chi-Yuan Liang. 1999. “Testing EndogenousGrowth in South Korea and Taiwan.” Journal of Development Economics 60: 317–41.
Fernandez, Raquel, and Dani Rodrik. 1991. “Resistance to Reform: Status Quo Bias in the Presence ofIndividual Specific Uncertainty.” American Economic Review 81: 1146–55.
Goh, Ai-Ting. 2000. “Opportunity Cost, Trade Policies and the Efficiency of Firms.” Journal of Devel-opment Economics 62: 363–83.
Greene, William. 1993. “Frontier Production Functions.” Working Paper EC-93-20, Stern School ofBusiness, New York University, New York.

Grether, Jean-Marie. 1996.“Mexico 1985–90: Trade Liberalization, Market Structure, and Manufactur-ing Performance.” In Industrial Evolution in Developing Countries, ed. Mark Roberts and JamesTybout. New York: Oxford University Press.
Grossman, Gene, and Elhanan Helpman. 1991. Innovation and Growth in the Global Economy. Cambridge,MA: MIT Press.
Haddad, Mona, and Ann Harrison. 1993. “Are There Positive Spillovers from Direct Foreign Investment?Evidence from Panel Data for Morocco.” Journal of Development Economics 42: 51–74.
Hall, Robert. 1988. “The Relation between Price and Marginal Cost in U.S. Industry.” Journal of PoliticalEconomy 96: 921–47.
Handoussa, Heba, Mieko Nishimizu, and John Page. 1986. “Productivity Change in Egyptian PublicSector Industries after the ‘Opening,’ 1973–1979.” Journal of Development Economics 20: 53–73.
Harris, Richard. 1984. “Applied General Equilibrium Analysis of Small Open Economies with ScaleEconomies and Imperfect Competition.” American Economic Review 74: 1016–32.
Harrison, Ann. 1994. “Productivity, Imperfect Competition, and Trade Reform: Theory and Evidence.”Journal of International Economics 36: 53–73.
———. 1996. “Determinants and Effects of Foreign Direct Investment in Côte d’Ivoire, Morocco, andVenezuela.” In Industrial Evolution in Developing Countries, ed. Mark Roberts and James Tybout.New York: Oxford University Press.
Hart, Oliver. 1983. “The Market Mechanism as an Incentive Structure.” Bell Journal of Economics 14:366–82.
Head, Keith, and John Ries. 1999. “Rationalization Effects of Tariff Reductions.” Journal of Interna-tional Economics 47: 295–320.
Helpman, Elhanan, and Paul Krugman. 1985. Market Structure and Foreign Trade: Increasing Returns,Imperfect Competition, and the International Economy. Cambridge, MA: MIT Press.
Hopenhayn, Hugo. 1992. “Entry, Exit, and Firm Dynamics in Long-Run Equilibrium.” Econometrica60: 1127–50.
Hopenhayn, Hugo, and Richard Rogerson. 1993. “Job Turnover and Policy Evolution: A General Equi-librium Analysis.” Journal of Political Economy 101: 915–38.
Jovanovic, Boyan. 1982. “Selection and the Evolution of Industry.” Econometrica 50: 649–70.Klette, Tor J., and Zvi Griliches. 1996. “The Inconsistency of Common Scale Estimators When Output
Prices Are Unobserved and Endogenous.” Journal of Applied Econometrics 11: 343–61.Krishna, Pravin, and Devashish Mitra. 1998. “Trade Liberalization, Market Discipline, and Productivity
Growth: New Evidence from India.” Journal of Development Economics 46: 447–52.Krugman, Paul. 1979. “Increasing Returns, Monopolistic Competition, and International Trade.” Jour-
nal of International Economics 9: 469–79.———. 1987.“The Narrow Moving Band, the Dutch Disease, and the Consequences of Mrs. Thatcher:
Notes on Trade in the Presence of Scale Economies.” Journal of Development Economics 27: 41–55.Lee, Norman. 1991. “Market Structure and Trade in the Developing Countries.” In Trade Policy, Indus-
trialization and Development: New Perspectives, ed. Gerald K. Helleiner. Oxford: Clarendon Press.Levinsohn, James. 1993. “Testing the Imports-as-Market-Discipline Hypothesis.” Journal of Interna-
tional Economics 35: 1–12.———. 1999. “Employment Responses to International Liberalization in Chile.” Journal of Interna-
tional Economics 47: 321–44.Liu, Lili. 1993. “Entry-Exit, Learning and Productivity Change: Evidence from Chile.” Journal of Devel-
opment Economics 42: 217–42.Liu, Lili, and James Tybout. 1996. “Productivity Growth in Colombia and Chile: Panel-Based Evidence
on the Role of Entry, Exit and Learning.” In Industrial Evolution in Developing Countries, ed. MarkRoberts and James Tybout. New York: Oxford University Press.
Lu, Shihua, and James Tybout. 2000. “Import Competition and Industrial Evolution: A ComputationalExperiment.” Department of Economics, Pennsylvania State University, University Park, PA.
Maloney, William, and Rodrigo Azevado. 1995. “Trade Reform, Uncertainty and Export Promotion:Mexico 1982–88.” Journal of Development Economics 48: 67–89.
Plant- and Firm-Level Evidence on “New” Trade Theories 93

94 Global Integration and Technology Transfer
Melitz, Marc. 2000. “Estimating Productivity in Differentiated Product Industries.” Department ofEconomics, Harvard University, Cambridge, MA.
———. 2003. “The Impact of Trade on Intra-industry Reallocations and Aggregate Productivity.”Econometrica 71: 1695–1725.
Miyagawa, Kaz, and Yuko Ohno. 1995. “Closing the Technology Gap under Protection.” AmericanEconomic Review 85: 755–70.
Muller, Jurgen, and Nicholas Owen. 1985. “The Effects of Trade on Plant Size.” In Industry, Structure,and Performance, ed. Joachim Schwalbach. Berlin: Edition Sigma.
Nishimizu, Mieko, and John Page. 1982. “Total Factor Productivity Growth, Technological Progress,and Technical Efficiency Change: Dimensions of Productivity Change in Yugoslavia.” EconomicJournal 92: 920–36.
Norman, Victor. 1990. “Assessing Trade and Welfare Effects of Trade Liberalization.” EuropeanEconomic Review 34: 725–51.
Pakes, Ariel, and Zvi Griliches. 1984. “Estimated Distributed Lags in Short Panels with an Applicationto the Specification of Depreciation Patterns and Capital Stock Constructs.” Review of EconomicStudies 51: 243–62.
Pakes, Ariel, and Paul McGuire. 1994. “Computing Markov-Perfect Nash Equilibria: NumericalImplications of a Dynamic Differentiated Product Model.” RAND Journal of Economics 25: 555–89.
Pavcnik, Nina. 2002. “Trade Liberalization, Exit, and Productivity Improvements: Evidence fromChilean Plants.” Review of Economic Studies 69: 245–76.
Prusa, Thomas J. 1992. “Why Are So Many Antidumping Petitions Withdrawn?” Journal of Interna-tional Economics 33: 1–20.
Roberts, Mark, and James Tybout. 1991. “Size Rationalization and Trade Exposure in DevelopingCountries.” In Empirical Studies of Commercial Policy, ed. Robert Baldwin. Chicago: University ofChicago Press for the National Bureau of Economic Research.
———, eds. 1996. Industrial Evolution in Developing Countries. New York: Oxford University Press.——— 1997. “The Decision to Export in Colombia.” American Economic Review 87: 545–65.Roberts, Mark, Theresa Sullivan, and James Tybout. 1995. “Micro-Foundations of Export Booms.”
World Bank, Washington, DC.Rodrik, Dani. 1992. “Closing the Technology Gap: Does Trade Liberalization Really Help?” In Trade
Policy, Industrialization and Development: New Perspectives, ed. Gerald Helleiner. Oxford:Clarendon Press.
Scharfstein, David. 1988. “Product Market Competition and Managerial Slack.” Rand Journal 19:47–55.
Scherer, Frederic M., Alan Beckenstein, Erich Kaufer, Dennis R. Murphy, and Francine Bougeon-Massen.1975. The Economics of Multi-Plant Operation: An International Comparison Study. Cambridge,MA: Harvard University Press.
Schmalensee, Richard. 1989. “Inter-Industry Studies of Structure and Performance.” In Handbook ofIndustrial Organization, ed. Richard Schmalensee and Robert Willig. Amsterdam: North-Holland.
Schwalbach, Joachim. 1988. “Economies of Scale and Intra-Community Trade.” In Research on the‘Cost’ of Non-Europe: Basic Findings, Vol. 2. Brussels: Commission of the European Communities.
Smith, Alistair, and Anthony Venables. 1988. “Completing the Internal Market in the EuropeanCommunity.” European Economic Review 32: 1501–25.
Staiger, Robert W., and Frank A. Wolak. 1989. “Strategic Use of Antidumping Law to Enforce TacitInternational Collusion.” Working Paper 3016, National Bureau of Economic Research, Cam-bridge, MA.
Sullivan, Theresa. 1997. Estimating the Manufactured Export Supply Function for Morocco. Ph.D. disser-tation, Department of Economics, Georgetown University, Washington, DC.
Trefler, Daniel. 2001. “The Long and Short of the Canada-U.S. Free Trade Agreement.” Working Paper8293, National Bureau of Economic Research, Cambridge, MA.

Tybout, James. 1991.“Linking Trade and Productivity: New Research Directions.” World Bank EconomicReview 6: 189–212.
———. 1993. “Internal Returns to Scale as a Source of Comparative Advantage.” Georgetown UniversityWorking Paper 93-01, Washington, DC.
———. 2000. “Manufacturing Firms in Developing Countries: How Well Do They Do, and Why?”Journal of Economic Literature 38: 11–44.
Tybout, James, and M. Daniel Westbrook. 1995. “Trade Liberalization and Dimensions of EfficiencyChange in Mexican Manufacturing Industries.” Journal of International Economics 39: 53–78.
———. 1996. “Scale Economics as a Source of Efficiency Gains.” In Industrial Evolution in DevelopingCountries, ed. Mark Roberts and James Tybout. New York: Oxford University Press.
Tybout, James, Jaime de Melo, and Vittorio Corbo. 1991. “The Effects of Trade Reforms on Scale andTechnical Efficiency: New Evidence from Chile.” Journal of International Economics 31: 231–59.
Voustden, Neil, and Neil Campbell. 1994. “The Organizational Cost of Protection.” Journal of Interna-tional Economics 37: 219–38.
Westphal, Larry. 2001. “Technology Strategies for Economic Development in a Fast-Changing GlobalEconomy.” Department of Economics, Swarthmore College, Swarthmore, PA.
Young, Alwyn. 1991. “Learning by Doing and the Dynamic Effects of International Trade.” QuarterlyJournal of Economics 106: 369–405.
Plant- and Firm-Level Evidence on “New” Trade Theories 95


Part II
FOREIGN TRADE AND PRODUCTIVITY


On the Quantity andQuality of Knowledge:
The Impact of Opennessand Foreign R&Don North-North
and North-SouthTechnology Spillovers
Maurice Schiff and Yanling Wang
99
5
The theory of endogenous growth based on increasing returns to knowledgeaccumulation originated with Romer (1986, 1990). One of the implications ofthis theory is that policies affecting knowledge accumulation can have a permanenteffect on the rate of economic growth.
Knowledge is assumed to differ from traditional inputs in two ways. First, it haspublic good characteristics.Second,new knowledge complements existing knowledge,so that the marginal product of additional units of knowledge increases.A widely avail-able new idea raises productivity and increases market size, raising the return to addi-tional ideas. A high-knowledge economy is likely to be able to make productive use ofan advanced piece of knowledge, while a knowledge-scarce economy may not.
The assumption that knowledge is a public good means that, once generated, itdiffuses at no cost and is available to the entire economy. Though knowledge clearlypossesses public goods characteristics, most knowledge is privately produced and israrely a pure public good, diffusion of which is instantaneous or free. Much new
The authors would like to thank Aaditya Mattoo, Marcelo Olarreaga, and participants at a World Bank
International Trade Seminar for their useful comments.

knowledge is embedded in new products or in improved qualities of existing prod-ucts and does not diffuse either freely or instantaneously. This is especially true inthe face of additional barriers, including tariffs and quantitative restrictions onimports, different standards and regulations, and higher communication costs(including those related to language differences).
In the case of domestic knowledge diffusion, Griliches (1957) shows that theadoption of hybrid corn in the United States was gradual and that the cumulativeadoption process followed a logistic or S-function. His work spawned a number ofstudies that found S-shaped patterns in other technology diffusion processes,implying that it may take a long time before most firms adopt a new technology.Greenwood (1997) finds that it took 54 years for the rate of adoption of steam loco-motives to rise from 10 percent to 90 percent of existing firms in the United States.In the case of diesels, the corresponding figure was five years. Manuelli and Seshadri(2003) find that the process took 35 years for tractors.1
This chapter examines the process of international rather than intranationaltechnology diffusion. Keller (2002a) shows that the effect of research and develop-ment (R&D) performed in the G-5 countries on productivity in smaller Organisa-tion for Economic Co-operation and Development (OECD) countries declineswith distance—that is, international technology diffusion is costly, and its cost riseswith distance. The studies cited above imply that access to knowledge is not instan-taneous. Rather, its rate of adoption is subject to the usual cost-benefit considera-tions and typically leads to gradual adoption. Consequently, knowledgeaccumulation occurs through an increase in quantity (increased diffusion of exist-ing knowledge), an increase in quality (new knowledge), or both.
In an international context, trade-related knowledge diffusion can occurthrough an increase in a country’s level of exposure to that knowledge throughtrade (quantity), an increase in the knowledge-content of that trade (quality), orboth. This chapter investigates how these two components of knowledge diffusionaffect productivity. Given the higher cost of international relative to domesticknowledge diffusion, examining the differential impact of the quantity and qualityof knowledge diffusion in an international context seems particularly promising.
A recent literature has examined the impact of trade on knowledge diffusion byconstructing measures of access to foreign knowledge and estimating its effect onproductivity.2 The seminal paper is Coe and Helpman (1995). It estimates theimpact on total factor productivity (TFP) of foreign R&D, defined as the sum oftrading partners’ R&D stocks (that is, a measure of knowledge quality), weightedby the bilateral trade shares (a measure of knowledge quantity). Using aggregatedata, Lumenga-Neso, Olarreaga, and Schiff (forthcoming) find that foreign R&Dhas a significantly positive impact on TFP in developed countries; Coe, Helpman,and Hoffmaister (1997) find similar results for developing countries. TFP rises with
100 Global Integration and Technology Transfer

the degree of a country’s openness and the trading partners’ R&D stocks. Similarfindings are obtained at the industry level by Keller (2002b) for developed countriesand by Schiff, Wang, and Olarreaga (2002) for developing countries.
These studies treat the two components of trade-related knowledge diffusion—openness and trading partners’ R&D stocks—symmetrically in their empiricalanalysis. This chapter subjects the symmetry assumption to rigorous testingand concludes that the impact of the two components is asymmetric. It finds thatopenness plays a more (less) important role than trading partners’ R&D stocks inNorth-South (North-North) knowledge diffusion and has a greater (smaller)impact on productivity in the South (North) than found in the existing literature.
Analytical Framework
This chapter investigates the relative contributions to TFP in a developed or a devel-oping country of R&D performed in OECD countries (quality of knowledge) andthe degree of access to this knowledge through trade (quantity of knowledge). TFPis assumed to be given by
(5.1)
where T denotes technological knowledge and Z is a vector of other factorsaffecting TFP, including, for instance, education. T in a given country is assumedto be given by
(5.2)
where DRD is the stock of R&D produced in that country, NRD is access to thetrading partners’ R&D stocks, and T1 and T2 are the first-order derivatives withrespect to DRD and NRD (what is referred to in the literature as foreign R&D),respectively. Access to the foreign stock of R&D, NRD, is assumed to be given by
(5.3)
NRD is thus a function of OPEN, the degree of a country’s openness, and RDC,a measure of trading partners’ R&D stocks (that is, the R&D content of the country’strade). The second derivative, NRD11, is assumed to be negative to reflect the factthat the additional knowledge a country obtains from the imports of a givenmachine is likely to diminish with the number of units of that machine it imports.
Past studies that have examined trade-related technology diffusion haveassumed that openness and trading partners’ R&D stocks enter symmetrically inNRD, that is, that equation (5.3) takes the form
(5.4)NRD NRD OPEN RDC= ∗( )
NRD NRD OPEN RDC NRD NRD NRD= > <( , ); , , .1 2 110 0
T T DRD NRD T T= >( , ); , ,1 2 0
TFP TFP T Z= ( , ),
On the Quantity and Quality of Knowledge 101

and that equation (5.1) takes the form
(5.5)
This chapter investigates whether the variables OPEN and RDC actually entersymmetrically into the TFP equation. The hypothesis is tested for both North-Northtrade (trade among OECD countries) and North-South trade (trade betweenOECD and developing countries).
North-North Trade
Empirical Implementation
For North-North trade, we use the same aggregate data used by Coe and Helpman(1995) and Keller (1998). The data set consists of 22 developed countries (21 OECDcountries and Israel) and 20 years (1971–90). Using aggregate data allows a moreprecise comparison of our results with those of Coe and Helpman (1995) and Keller(1998). It is also useful because a third of the sample of OECD countries does notreport R&D data at the industry level.3
Coe and Helpman (1995) define NRD as the sum over all trading partners of theirR&D stocks multiplied by the trade shares. They define trade shares as the importsfrom trading partners divided by the sum of these imports. The fact that the tradeshares add up to 1 implies that the level of total imports does not affect NRD (as longas the shares are unchanged).4 Here trade shares are defined relative to GDP, and thelevel of imports does affect NRD. Thus NRD for country c is given by
(5.6)
where M is imports, RD is the stock of R&D, and k stands for the trading partnercountries.
We define two transformations of NRD, one that measures openness and onethat measures the R&D content of imports. Openness is defined as
(5.7)
which is obtained by setting in equation (5.6). The R&D content oftrade, RDC, is defined as
(5.8)
which is obtained by setting in equation (5.6).M GDP c kck c/ = ∀1, , ,
RDC RDc k
k c
≡≠
∑ ,
RD kk = ∀1, ,
OPENM
GDPcck
ck c
≡≠
∑ ,
NRDM
GDPRDc
ck
ck
k c
≡
≠∑ ,
TFP TFP T DRD OPEN RDC Z= ∗( ( , ), ).
102 Global Integration and Technology Transfer

Two alternative equations are estimated:
(5.9)
and
(5.10)
where NRD, OPEN, and RDC are defined in equations (5.6), (5.7), and (5.8); DRDc isthe home country’s stock of R&D; and Dt (Dc) are time (country) dummies. Equation(5.10) is estimated as a check on robustness of the estimation results of equation (5.9).
Assume that when imports or the R&D content of imports change, the propor-tional change is the same across all trading partners. Then in equation (5.9) theelasticity of TFP with respect to openness is and the elasticity with respectto the R&D content of trade is In equation (5.10) the elasticity of TFP is with respect to openness and with respect to the R&D content of trade. Ifopenness and the R&D content of trade enter symmetrically in TFP (as they do inNRD in equation [5.6]), the following results should hold: in equation (5.9),
in equation (5.10), and . If, however, the impact of openness on TFPis larger (smaller) than the impact of the R&D content, the following results shouldhold: > (<) 0 and < (>) 0.
Note that the value of these coefficients is likely to depend on the level of devel-opment of the importing country. In OECD countries in which communicationand information systems are more highly developed, new knowledge is likely tospread more rapidly, and the marginal impact of additional imports is likely to besmaller. In contrast, knowledge is likely to spread less rapidly in developing coun-tries, where communication and information systems are less developed, and themarginal impact of additional imports is likely to be larger.
Empirical Results
Before turning to the econometric analysis, we need to consider the fact that twoor more variables may be trended and contain unit roots, making the regressionresults spurious (unless the variables are co-integrated). As noted earlier, we use thesame data used by Coe and Helpman (1995). They found that their variables exhib-ited a clear trend but were co-integrated, justifying the estimation of a relationshipin the levels of the variables without having to adjust them.
′βRT
β βN N= ′′ =βR 0βT = 0
′ + ′β βN R
′βNβN .β βN T+
log log log logTFP DRD NRDct ct N ct R= ′ + ′ + ′ + ′β β β β0 1 RRDC
D D
ct
t t c c
ct
ct ,+ ′ + ′ + ′∑∑β β ε
log log log logTFP DRD NRD OPENct ct N ct T= + + +β β β β0 1 cct
t t c c
ct
ctD D ,+ + +∑∑β β e
On the Quantity and Quality of Knowledge 103

The empirical results are presented in table 5.1. Regression (1) indicates that theelasticities of both DRD (own R&D stock) and NRD are positive and significant atthe 1 percent level, with the elasticity of DRD (0.112) more than twice as large asthat of NRD (0.045). Regression (2) adds the variable OPEN. The elasticities withrespect to DRD (0.119) and NRD (0.055) are similar to those in regression (1), andthe elasticity with respect to OPEN is −0.071 (all significant at the 1 percent level).This implies that the elasticity is bN = 0.055 with respect to the R&D content oftrade, and bN + bT = −0.016 with respect to openness and is not significantly dif-ferent from zero. These results imply that symmetry is rejected and that the R&Dcontent of trade (the quality of trade) has a greater impact on TFP than the degreeof openness (the quantity of trade).
In regression (3), (is not significant) and (is significant atthe 1 percent level). Thus the elasticity of TFP with respect to openness is
(not significant), and the elasticity with respect to the R&D content oftrade is Although the elasticities in regression (3) differ from thosein regression (2), the qualitative result is the same: symmetry is rejected, and the R&Dcontent of trade has a greater impact on TFP than the degree of openness.5
′ + ′ =β βN R 0 204. .′ = −N 0 004.
′ =βR 0 208.′ = −N 0 004.
104 Global Integration and Technology Transfer
TABLE 5.1 Determinants of Total Factor Productivityin OECD Countries
Model
Variable (1) (2) (3)
logDRD 0.112* 0.119* 0.045*(14.1) (14.77) (4.25)
logNRD 0.045* 0.055* −0.004(4.9) (5.82) (−0.43)
logOPEN −0.071*(23.67)
logRDC 0.208*(8.63)
Adjusted R2 0.60 0.61 0.66
Source: Authors.
Note: N = 440. Figures in parenthesis are t-statistics. Results on time and country dummies are notreported. DRD is the domestic R&D stock; NRD is the trade-related foreign R&D stock, as defined inequation (5.6); OPEN is the ratio of a country’s total imports over its GDP; and RDC is the sum of theR&D stock for the rest of the sample.
*Significant at the 1 percent level.

Why does the R&D content of trade have a greater impact on TFP than thedegree of openness? First, most OECD countries have low trade barriers, and opennessis typically high. Consequently, the marginal impact of trade is likely to be small(NRD11 < 0 in equation [5.3]). Second, alternative means of diffusing knowledgeare available, including FDI, licensing, the Internet and other telecommunicationstechnology, scientific journals, and international meetings, all of which reduce theimportance of trade as a means of knowledge diffusion.
Note that conditions with respect to openness and other channels of tech-nology diffusion differ greatly in the South. Over the estimation period 1976–98,tariffs averaged 6.3 percent for 15 OECD countries in the sample and 20.5 per-cent (more than three times more) in 24 developing countries in the sample. Asfor alternative channels of technology diffusion, over the period 1990–98, theaverage number of Internet users was 52.8 per 1,000 people in the 15 OECDcountries and 6.8 (about one-eighth as many) in the 24 developing countries.FDI averaged $95.6 billion in the 15 OECD countries and $33.8 billion (about athird as much) from the 15 OECD countries to all developing countries. Unsur-prisingly, as shown below, the empirical results for North-South and North-North trade differ.
Comparison with the Literature
In their seminal paper, Coe and Helpman (1995) estimate regression (1) andobtain an elasticity of TFP with respect to NRD of 0.092 and of 0.060 when theyadd a dummy variable to capture the additional effect of domestic R&D in theG-7 countries.6 In a much cited paper, Keller (1998) uses the same data and esti-mates alternative versions of TFP equations. In one specification, he regressesTFP on DRD and RDC, with results that are as good as or better than those ofCoe and Helpman. He obtains an elasticity of TFP with respect to RDC of 0.161and of 0.129 when the dummy variable is added to capture the additional effectof domestic R&D in the G-7 countries. He concludes that a country’s trading part-ners’ R&D does not necessarily diffuse through trade and that nontrade chan-nels should be investigated as well.
Keller’s point seems well taken. His results are close to those in regression (3),though our interpretation differs somewhat from his. By incorporating both NRDand RDC (in addition to DRD) in regression (3), we allow the data to determinewhich of the two effects—openness or trading partners’ R&D stocks—dominates.Our interpretation is that the effect of trading partners’ R&D stocks on TFP is dom-inant in North-North trade but that this reflects both the influence of nontradechannels and the fact that OECD economies are typically very open, so that themarginal effect of openness is small.
On the Quantity and Quality of Knowledge 105

This result does not generalize to North-South trade, because of the differentconditions in the South described above. As is shown below, opposite findings areobtained for North-South trade, with openness having a significant impact on TFP.
North-South Trade
Empirical Implementation
For North-South trade, we make use of a data set of industry-level, trade-relatedtechnology diffusion used in Schiff, Wang, and Olarreaga (2002). The data set con-sists of 16 manufacturing industries, 24 developing economies, 15 OECD tradingpartners, and 22 years (1977–98).7 The 16 industries are divided into high and lowR&D-intensity groups, with R&D intensity defined as the ratio of expenditures onR&D to value-added. The average R&D intensity is 1.3 percent for the “low” groupand 11 percent for the “high” group.8 As in Coe, Helpman, and Hoffmaister (1997),domestic R&D was not included because of the lack of data.
Schiff,Wang, and Olarreaga (2002) define North-foreign R&D (that is, knowledgeobtained through trade) in industry i of developing country c, NRDci, as
(5.11)
where c (k) indexes developing (OECD) countries, j indexes industries, M denotesimports, VA denotes value-added, and RD denotes R&D. acij is the import input-output coefficient, which measures for country c the share of imports of industry jsold to industry i.
The first part of equation (5.11) says that in developing country c, North-foreignR&D in industry i, NRDci, is the sum, over all industries j, of RDcj, the industry-jforeign R&D obtained through imports, multiplied by acij, the share of imports ofindustry j that is sold to industry i. The second part of equation (5.11) says thatRDcj is the sum, over OECD countries k, of Mcjk/VAcj, the imports of industry-jproducts from OECD country k per unit of industry-j value-added (that is, thebilateral openness share), multiplied by RDjk, the stock of industry-j R&D inOECD country k.
We define an openness variable as
(5.12)
which is derived from equation (5.11) by setting RD j kjk = ∀1, , .
OPEN aM
VAci cij
j
cjk
cjk
=
∑ ∑ ,
NRD a RD aM
VARDci cij cj
j
cij
j
cjk
cjk
jk≡ =
∑ ∑ ∑
,
106 Global Integration and Technology Transfer

We define an R&D variable as
(5.13)
which is derived from equation (5.11) by setting Mcjk/VAcj = 1,Education is included in the regression as a control variable, as it is in Coe,
Helpman, and Hoffmaister (1997); Schiff, Wang, and Olarreaga (2002); and others.Two alternative equations are estimated:
(5.14)
and
(5.15)
where E denotes education, and Dt, (Dc), and (Di) represent time, country, andindustry dummies. The effects for high and low R&D-intensity industries are esti-mated by introducing a dummy variable, DR, with DR = 1 for high R&D-intensityindustries and DR = 0 otherwise.
Empirical Results
As with the analysis of North-North trade, we need to consider the possibility thattwo or more variables might be trended and contain unit roots, making the regres-sion results spurious (unless the variables are co-integrated). The unit roothypothesis was rejected at the 1 percent significance level for log TFP, log NRD,log OPEN, and log RDC. The education variable E is significant at the 1 percentlevel in all six regressions, with a 1 percentage point increase in education raisingTFP by 6.8–7.5 percent (table 5.2).
Regressions (1) and (2) are reproduced from Schiff, Wang, and Olarreaga(2002). They impose symmetric effects of openness and R&D on TFP. Regression(1) shows a positive impact of NRD on TFP (significant at the 1 percent level),with an elasticity of about 0.19. Regression (2) shows an elasticity of about 0.14for low R&D-intensity industries and 0.28 for high R&D-intensity industries, bothsignificant at the 1 percent level. As might be expected, foreign R&D has a greaterimpact on the productivity of R&D-intensive industries.
+ ′ + + ′ + ′∑∑∑β β β εt t c c t i
ict
citD D D ,
log log logTFP NRD RDCcit N cit L cit E= ′ + ′ + ′ + ′β β β β0 EEct
+ + + +∑∑∑β β β εt t c c i i
ict
citD D D ,
log log logTFP NRD OPEN Ecit N cit T cit E ct= + + +β β β β0
∀c j k, , .
RDC a RDci cij
j
jk
k
=
∑ ∑ ,
On the Quantity and Quality of Knowledge 107

Columns (3) and (4) regress TFP on NRD and OPEN (see equation [5.14]).Regression (3) shows that the elasticity of TFP with respect to R&D is –0.012 (notsignificantly different from zero), and the elasticity with respect to openness is about0.24 (0.251−0.012), significant at the 1 percent level. Regression (4) shows that forlow R&D-intensity industries, the elasticity of TFP with respect to R&D is −0.065(not significantly different from zero), and the elasticity with respect to opennessis 0.23 (0.295−0.065), significant at the 1 percent level. For high R&D-intensityindustries, the elasticity of TFP with respect to R&D is 0.22 (0.285−0.065), significant
108 Global Integration and Technology Transfer
TABLE 5.2 Determinants of Total Factory Productivityin Developing Countries
Model
Variable (1) (2) (3) (4) (5) (6)
log NRD 0.188** 0.138** −0.012 −0.065 0.369** 0.294**(6.11) (4.03) (−0.19) (−0.99) (8.82) (6.31)
log NRD*DR 0.141** 0.285** 0.156**(3.52) (4.02) (3.5)
log OPEN 0.251** 0.295**(3.89) (4.23)
log OPEN*DR −0.244**(−3.13)
log RDC −0.408** −0.248**(−6.38) (−3.89)
log RDC*DR −0.189*(−2.15)
E 6.831** 6.823** 6.9** 6.866** 7.462** 7.411**(4.34) (4.34) (4.37) (4.37) (4.74) (4.72)
Adjusted R2 0.23 0.23 0.23 0.24 0.24 0.24
Source: Authors.
Note: N = 5,721. Figures in parentheses are t-statistics. The constant and regression results on country,year, and industry dummies are not reported. NRD is the trade-related North-foreign R&D defined inequation (5.11), OPEN is defined in equation (5.12), and RDC is defined in equation (5.13). E is thesecondary school completion ratio for the population 25 and above. DR = 1 for R&D-intensive industriesand 0 for low R&D-intensity industries.
*Significant at the 5 percent level.**Significant at the 1 percent level.

at the 1 percent level, and the elasticity with respect to openness is about 0.27(0.22+ 0.295 − 0.244), significant at the 1 percent level. The results from regression (4)imply that R&D has no impact on the TFP of low R&D-intensity industries and asignificant impact on the TFP of high R&D-intensity industries. Openness hasa significant impact on the TFP of both low and high R&D-intensity industries.The impact of openness is larger than that of R&D,significantly so for low R&D-intensityindustries (where only openness matters), somewhat less so for high R&D-intensityindustries. The results on the importance of R&D are quite plausible: one wouldexpect the embodied technology or R&D content of imports to matter more inindustries in which technology plays a more important role (that is, in R&D-intensive industries).9
Columns (5) and (6) correspond to equation (5.15). Regression (5) shows anelasticity of TFP of about 0.37 with respect to openness (significantly differentfrom zero at the 1 percent level) and of about (−0.039) with respect to R&D (notsignificantly different from zero). These results confirm those of regression (3).
Regression (6) shows an elasticity of TFP with respect to openness equal toabout 0.29 for low R&D-intensity industries and 0.45 for high R&D-intensityindustries, both significant at the 1 percent level. The elasticity of TFP withrespect to R&D is not significantly different from zero for low R&D-intensityindustries (0.046 = 0.294 − 0.248) or high R&D-intensity industries (0.013 = 0.046+ 0.156 − 0.189). These results confirm those of regression (4), though the elas-ticities with respect to openness in both industry groups are larger in this case andthe elasticity with respect to R&D in high R&D-intensity industries is smaller.
Comparison with the Literature
The results obtained here imply that the impact of openness on TFP in develop-ing countries is greater than that obtained in Schiff, Wang, and Olarreaga (2002),where the effects of openness and R&D were constrained to be symmetric. For allindustries taken together, the elasticity of TFP with respect to openness is 0.19 inthe presence of symmetry and 0.24–0.37 in its absence. When industries are splitbetween high and low R&D-intensity industries, the elasticity of TFP with respectto openness is 0.14 for low R&D-intensity industries given symmetry and0.23–0.29 in the unconstrained case. For high R&D-intensity industries, the elas-ticity is 0.28 given symmetry and 0.27–0.45 in the unconstrained case. Thus theopenness elasticity for the low R&D-intensity industries is 60–100 percent largerthan when symmetry between the R&D and openness effects is imposed and 0–60percent larger for the high R&D-intensity industries.
Coe, Helpman, and Hoffmaister (1997) estimated the impact of North-SouthR&D spillovers at the aggregate level. They tried a variety of specifications, including
On the Quantity and Quality of Knowledge 109

some with an openness variable. In their preferred specification, they obtain anelasticity of TFP with respect to NRD of 0.058 and an elasticity of TFP with respectto the share of imports to GDP (openness) of 0.0279, both significant at the 1 percentlevel.10 The sum of weights for NRD in Coe, Helpman, and Hoffmaister (1997) is1, so the elasticity of TFP is 0.058 with respect to R&D and 0.279 with respect toopenness. Coe, Helpman, and Hoffmaister (1997) estimate 10 different specifications.The average value of the elasticity of TFP is negative with respect to NRD and 0.304with respect to openness. These results support our findings that the elasticity of TFPwith respect to openness is larger than that with respect to R&D and that the val-ues obtained fall within the range of our estimates.
The conclusions of both Falvey, Foster, and Greenaway (2002) and Keller(2000) lend support to our results. Falvey, Foster, and Greenaway (2002) estimateNorth-South R&D spillovers at the aggregate level and use various definitionsof NRD, including that of Coe and Helpman (1995) and Lichtenberg and vanPottelsberghe de la Potterie (1998). They conclude that only the specifications thatinclude the level of imports result in positive coefficients for the effect of knowl-edge spillovers. Keller (2000) concludes that openness should play a greater rolefor technology diffusion and productivity growth in developing countries than indeveloped ones.
Conclusion
A recent literature has examined the impact of trade-related technology diffu-sion on TFP. That literature imposed symmetry between the impact of open-ness and that of the R&D content of trade. This chapter shows that theassumption of symmetry is not warranted in the case of either North-North orNorth-South technology diffusion.
For North-North trade, the R&D content of trade has a greater impact on TFPthan openness. Unlike studies imposing symmetry between the TFP effects of theR&D content of trade and openness, which find a positive impact of openness, ouranalysis indicates that the effect of openness on TFP is not significantly differentfrom zero. For North-South trade, openness has a greater impact on TFP than theR&D content of trade. The impact of openness on TFP is greater than that obtainedwhen symmetry is imposed. The impact of the R&D content of trade on TFP is notsignificantly different from zero in low R&D-intensity industries and seemspositive in R&D-intensive industries. These results imply that the gains from tradeliberalization in developing countries are larger than earlier literature suggested andthat the liberalization of trade in those industries is likely to have a greater impacton growth than previously thought.
110 Global Integration and Technology Transfer

Notes
1. Gradual adoption is typically attributed to some market imperfection, including lobbying (Parenteand Prescott 1994), imperfect information (Jovanovic and MacDonald 1994), and learning by doing(Jovanovic and Lach 1989; Jovanovic and Nyarko 1996). Manuelli and Seshadri (2003) obtain the samediffusion pattern for tractors in a frictionless model, with gradual adoption due to the change in exogenousvariables including labor costs, over time.
2. Recent interest in the relationship between trade and growth and in international technologyspillovers is based on the development of endogenous growth theories (Romer 1986, 1990) and theirapplication to the open economy case (Grossman and Helpman 1991).
3. Aggregate data are also used because of the difficulty of producing reasonable empirical resultsat the industry level for G7 countries plus Sweden. These countries were selected to compare the resultswith those of Keller (2002b), who examines the impact of domestic R&D and trading partners’ R&D(that is, RDC) but not of openness. Keller (2002b) covers the years 1970–91. The sample here wasrestricted because industry-level trade data are available only from 1976. The results are not reported,because the domestic R&D variable was never significant in the restricted sample, even though NRDwas positive and significant.
4. Coe and Helpman (1995) do add the share of imports in GDP in their third TFP regression,though in a different way from trade shares and R&D stocks (see Lumenga-Neso, Olarreaga, and Schiff[forthcoming] for more details).
5. We estimated TFP as a function of NRD, OPEN, and RDC but did not obtain satisfactory resultsbecause of multicollinearity problems between these variables.
6. The trade shares used in the definition of NRD in the first two equations estimated by Coe andHelpman differ from ours. In Coe and Helpman these shares add up to 1, and the effect of an overallincrease in openness cannot be simulated. For given shares, the elasticity of TFP with respect to NRDreflects the impact of an equiproportionate increase in trading partners’ R&D stocks. Thus their resultsare not so far from those obtained here. Coe and Helpman do include a measure of openness in a thirdregression by multiplying it by log NRD. However, they model a log-log relationship with respect toNRD but a semi-log relationship with respect to openness.
7. The 24 developing economies are Bangladesh, Bolivia, Chile, Cameroon, Colombia, Cyprus,Ecuador, Egypt Arab Republic, Guatemala, Hong Kong (China), Indonesia, India, the Islamic Republicof Iran, Jordan, the Republic of Korea, Kuwait, Mexico, Malawi, Malaysia, Pakistan, the Philippines,Poland, Trinidad and Tobago, and República Bolivariana de Venezuela. The 15 OECD countries areAustralia, Canada, Denmark, Finland, France, Germany, Ireland, Italy, Japan, the Netherlands, Norway,Spain, Sweden, the United Kingdom, and the United States.
8. The 16 manufacturing industries are food, beverages, and tobacco (code 31 in the InternationalStandard Industrial Classification); textiles, apparel, and leather (32); wood products and furniture (33);paper, paper products, and printing (34); chemicals, drugs, and medicines (351/2); petroleum refineries andproducts (353/4); rubber and plastic products (355/6); nonmetallic mineral products (36); iron and steel(371); nonferrous metals (372); metal products (381); nonelectrical machinery, office and computingmachinery (382); electrical machinery and communication equipment (383); transportation equipment(384); professional goods (385); and other manufacturing (39). (High R&D-intensity industries are shownin italics.) For the “high” group, the average R&D intensity minus two standard deviations is 3.8 percent,which is larger than the average plus two standard deviations of the “low” group (3.1 percent). Assuminga normal distribution, the hypothesis that any of the industries in the “high” R&D intensity clusterbelongs to the “low” cluster is rejected at the 1 percent significance level.
9. This result may also partly reflect the fact that greater openness has a disciplining effect by increas-ing the level of contestability and competitiveness of the domestic industry.
10. Coe, Helpman, and Hoffmaister (1997) use imports of machinery and equipment rather thantotal imports.
On the Quantity and Quality of Knowledge 111

References
Atkeson, Andrew, and Patrick Kehoe. 2001. “The Transition to a New Economy after the SecondIndustrial Revolution.” NBER Working Paper No. W8676, National Bureau of Economic Research,Cambridge, MA.
Coe, David T., and Elhanan Helpman. 1995.“International R&D Spillovers.” European Economic Review39 (5): 859–87.
Coe, David T., Elhanan Helpman, and Alexander W. Hoffmaister. 1997.“North-South R&D Spillovers.”Economic Journal 107 (440): 134–49.
Falvey, R., N. Foster, and D. Greenaway. 2002.“North-South Trade, Knowledge Spillovers and Growth.”Research Paper 2002/23, Leverhulme Centre for Research on Globalisation and Economic Pol-icy, University of Nottingham, United Kingdom.
Greenwood, Jeremy. 1997. “The Third Industrial Revolution: Technology, Productivity and IncomeInequality.” American Enterprise Institute Studies on Understanding Economic Inequality.Washington, DC: AEI Press.
Griliches, Zvi. 1957. “Hybrid Corn: An Exploration in the Economics of Technological Change.”Econometrica 25 (4): 501–22.
Grossman, M. Gene, and Elhanan Helpman. 1991. Innovation and Growth in the Global Economy.Cambridge, MA: MIT Press.
Jovanovic, Boyan, and Saul Lach. 1989. “Entry, Exit, and Diffusion with Learning by Doing.” AmericanEconomic Review 79 (4): 690–99.
Jovanovic, Boyan, and Glenn M. MacDonald. 1994. “Competitive Diffusion.” Journal of PoliticalEconomy 102 (1): 24–52.
Jovanovic, Boyan, and Yaw Nyarko. 1996.“Learning by Doing and the Choice of Technology.”Econometrica64 (6): 1299–310.
Keller, Wolfgang. 1998. “Are International R&D Spillovers Trade-Related? Analyzing Spillovers amongRandomly Matched Trade Partners.” European Economic Review 42 (8): 1469–81.
———.2000.“Do Trade Patterns and Technology Flows Affect Productivity Growth?”World Bank EconomicReview 14 (1): 17–47.
———. 2002a. “Geographic Localization of International Technology Diffusion.” American EconomicReview 92 (1): 120–42.
———. 2002b. “Trade and the Transmission of Technology.” Journal of Economic Growth 7 (1): 5–24.Lichtenberg, Frank R., and Bruno van Pottelsberghe de la Potterie. 1998.“International R&D Spillovers:
Comment.” European Economic Review 42 (8): 1483–91.Lumenga-Neso, Marcelo Olarreaga, and Maurice Schiff. Forthcoming. “On ‘Indirect’ Trade-Related
R&D Spillovers.” European Economic Review. (Earlier version published as World Bank PolicyResearch Working Paper 2580 (April 2001), Washington, DC.)
Manuelli,Rodolfo E., and Ananth Seshadri.2003.“Frictionless Technology Diffusion: The Case of Tractors.”Working Paper 9604, National Bureau of Economic Research, Cambridge, MA.
Parente, Stephen L., and Edward C. Prescott. 2004. “Unified Theory of the Evolution of InternationalIncome Levels.” Research Department Staff Report 333, Federal Reserve Bank of Minneapolis, Min-neapolis, MN.
Romer, Paul M. 1986. “Increasing Returns and Long-Run Growth.” Journal of Political Economy 94 (5):1002–37.
———. 1990. “Endogenous Technical Change.” Journal of Political Economy 98 (5): S71–S102.Schiff, Maurice, Yanling Wang, and Marcelo Olarreaga. 2002.“Trade-Related Technology Diffusion and
the Dynamics of North-South and South-South Integration.” Policy Research Working Paper 2861,World Bank, Washington, DC.
112 Global Integration and Technology Transfer

The Knowledge Content of Machines:
North-South Trade andTechnology Diffusion
Giorgio Barba Navaretti, Maurice Schiff, and Isidro Soloaga
113
6
This chapter examines the impact of imported technologies on productivitygrowth in developing countries. Many studies analyze trade-related channels fortransferring technologies and knowledge and their effects on productivity.1 In con-trast to this earlier literature, we focus on the technological content of importedfactors of production rather than on imports per se. We also explicitly model thechoice of technology and therefore deal with the endogenous nature of the rela-tionship between imported technologies and productivity growth.
We study the effects of knowledge, the “weightless” good (Quah 1999), when itis embodied in machines, the most physical of all factors of production. We use anindirect measure to capture the amount of knowledge contained in machines: theaverage unit value per ton of machine imported.2 Does this measure, relating thevalue of a weightless good to the weight of its container, make sense? FederalReserve Chairman Alan Greenspan once noted that through the second half of the
Earlier drafts of this chapter were circulated with the title “Weightless Machines and Costless Knowl-
edge: An Empirical Analysis of Trade and Technology Diffusion.” The authors wish to thank Francis Ng
and Alessandro Nicita for invaluable help in constructing the database; Gani Aldashev, Alessandra Tucci,
and Paolo Zagaglia for their research assistance; and Bernard Hoekman, Aart Kraay, Riccardo Luc-
chetti, James Tybout, Jonathan Eaton, and the anonymous referees of the Journal of International Eco-
nomics for providing useful suggestions. Giorgio Barba Navaretti is also grateful to David Tarr and Tony
Venables for arranging and supporting his stay at the World Bank while working on earlier drafts of this
chapter.

twentieth century, the United States tripled the real value of its output with noincrease in the weight of the material produced (Washington Post 2000). Indeed, atany point in time, the price of machines reflects their relative productivity. Theprice of computers grows with their megahertz or other embodied features.
Over time, however, the relative price of equipment falls, and the increasingproductivity of increasingly weightless (knowledge-intensive) machines is notmirrored in their prices (Gordon 1990; Eaton and Kortum 2001). The cost ofcomputers has been declining for years, although their capacity to process infor-mation has skyrocketed. Thus the evolution of unit values of machines over timefails to capture their technological content. To overcome this problem, we normal-ize the unit values of the machines imported by our sample countries by the unitvalue of the same machines imported at the same point in time by the United States,which is assumed to be the technological frontier. In this way, we derive an index,measuring the distance of imported machines from their technological frontier atany point in time, that can be used for comparisons across countries, industries,and time.
We analyze the machines exported by the European Union to a sample of neigh-boring developing countries and transition economies in Central and EasternEurope and the Southern Mediterranean. We find that although developingeconomies buy increasingly productive machines over time, the technologyembodied in these machines persistently lags behind those purchased by the UnitedStates.
What drives these choices, and how do they affect productivity and growth? Wedevelop a theoretical model that analyses the choice of technology and relates itto the expected productivity outcomes. The model is then tested, using industry-specific data for our sample countries. We find that the choice of lower technolo-gies is optimal for developing countries, given local skills and factor prices.However, an increase in the level of complexity of the machines imported has a pos-itive impact on total factor productivity (TFP) growth, which turns out to be largerthan an increase in the share of imported machines in total investments.
This chapter contributes in several ways to the literature on trade-related tech-nology spillovers, including Coe and Helpman (1995) and other papers building ontheir framework, such as Coe, Helpman, and Hoffmaister (1997); Keller (2000); andSchiff, Wang, and Olarreaga (2002). First, it clearly distinguishes between the quan-tity and quality of imports by measuring the knowledge content of importedmachines. The impact of the technological content of imported machines has rarelybeen examined in this literature.3 Imagine a country, A, that imports the same totalvalue of goods (or capital goods) from two countries, B and C, that have the sameR&D stock. The impact of imports from both countries on domestic productivity isthe same in the Coe and Helpman framework. However, the composition of goods
114 Global Integration and Technology Transfer

imported from B and C may be different. For instance, imports from B may consistof fewer but more knowledge-intensive (more productive) machines than thosefrom C. Whether imports from B or C have a greater impact on A’s productivity willdepend on the elasticity of TFP with respect to the knowledge-intensity of machinesand the quantity of machines. This is one of the issues examined in this chapter.
Second, studies based on the Coe-Helpman framework treat the choice of tech-nology as exogenous. This chapter explicitly models the choice of technology—theknowledge-intensity of machines—by relating it to its potential effect on produc-tivity growth.4
Third, this chapter extends earlier works analyzing the choice of the vintage ofimported machinery (Barba Navaretti, Soloaga, and Takacs 2000) and the impactof imported machines on export performance (Barba Navaretti, Galeotti, andMattozzi 2000).
A Model of Knowledge Production and Choice of Machines
This section develops a simple model of supply of knowledge-embedded machinesby developed countries and (import) demand by developing countries.Among otherthings, the model tries to explain two empirical observations. The first is the fact thateven though machines with greater knowledge content are more expensive at a givenmoment in time, they are cheaper over time. The second is the fact that countries withhigher levels of human capital import more knowledge-intensive machines.
Supply
Assume a developed country industry in which each firm’s cost of producing addi-tional knowledge at time t, (its expenditure on R&D), is ct. Knowledge is trans-mitted by embedding it in a machine (for example, manufacturing equipment or aCD-ROM). The cost of a knowledge-free machine is .
The production of knowledge and machines takes place in a competitive setting.Each firm produces only one machine. In other words, there are no contempora-neous economies of scale in knowledge production at the firm level.5 The cost of aknowledge-embedded machine is
(6.1)
Machines can absorb only a fixed amount of additional knowledge (for example, fixed space in a CD-ROM), and they depreciate after one period,while knowledge does not. Knowledge at time t is thus
(6.2)S S S t St
t t
= = = ∗∑ ∑∆ ∆ ∆τ1 1
.
∆ ∆S S tt = ∀,
C m c m ct t t t= + = + .
m m tt = ∀,
∆St
The Knowledge Content of Machines 115

All firms know St−1 at the start of period t. In other words, private knowledge inperiod t − 1 becomes public knowledge at time t (possibly due to reverse engineering).St is not known publicly at time t. Any firm that wants to obtain and sell St at timet has to produce .
Additional knowledge, , increases with ct, the expenditure on R&D, and with St−1,the stock of publicly available knowledge at the start of period t. The assumption isthat privately produced additional knowledge is complementary to the existing stockof publicly available knowledge. For instance, a high-knowledge economy is likely tomore easily produce an advanced piece of knowledge than a knowledge-scarce econ-omy.Thus knowledge production benefits from increasing returns at the industry level:
(6.3)
For simplicity, assume
(6.4)
From equations (6.2) and (6.4):
(6.5)
Thus the cost of producing additional knowledge, ct , falls over time, and so doesthe cost of machines, Ct (equation 6.1), despite the fact that their knowledge contentincreases. The reason is that the cost of machines is related to the cost of producingadditional knowledge, not to the stock of knowledge, because the stock of knowledgein the previous period is publicly available at zero cost and the increasing stock ofpublicly available knowledge reduces the cost of developing additional knowledge.
From equations (6.1) and (6.5):
(6.6)
At time t, firms can build “new” machines embedded with the latest knowledge,St , at cost Ct , or they can build “old” machines with publicly available knowledge, St−1,at cost .6 Thus in equilibrium, (at most) two types of machines will be built.
Note that the difference in the cost of the two types of machines is
(6.7)
The cost difference declines over time. Consequently (as shown formally below),the proportion of new machines used increases over time.
Demand
Downstream firms in developing countries need to buy a machine in every periodin order to be able to produce. They demand either an old or a new machine. Adownstream firm’s choice of type of machine depends on its knowledge-absorptioncapacity, and on country-specific human capital,H.The higher a firm’s the moreφ,φ,
C C tt t− = −∗ 1 1/( ).
C mt∗ =
C m tt = + −1 1/( ).
c S S t tt t= = − >−∆ / /1 1 1 1( ), .
∆S c St t t= ∗ −1.
∆S f c S f f ft t t= >−( , ), , , .1 1 2 12 0
∆St
∆St
116 Global Integration and Technology Transfer

effectively it can make use of the latest knowledge in its production process and thegreater the likelihood that it will buy the latest (new) machines. Similarly, the higherthe level of country-specific human capital, H, the easier it is for a firm to produc-tively absorb new knowledge.
Even though St−1 is public knowledge for all firms in the knowledge-producingindustry of the developed country, it is not public knowledge for the downstreamfirms in developing countries that produce other goods and services.Their knowledge-absorption capacity at time t is assumed to depend on a firm-specific exogenouscomponent, e, and on whether they are using old or new machines at t − 1. If firmsuse the latest machines at t − 1, they acquire a greater capacity to adopt new knowl-edge and be more effective in using the latest machines at time t. Thus
(6.8)
where denotes the effect of a machine of type i (i = OLD, NEW) at t − 1 on afirm’s knowledge-absorption capacity at time t, and > . For simplicity, let
(6.9)
Assume that at time t, the productivity gain downstream firms obtain fromadditional knowledge, , is . Normalizing firm output and sales price tounity, the added profits from are (approximately) , given by
(6.10)
where the subscript i of refers to the type of machine used by the firm at t − 1.Downstream firms choose a new (old) machine at time t as long as the produc-
tivity gain is larger (smaller) than the additional cost, that is, as long as
The critical value the exogenous component of a firm’s knowledge-absorptioncapacity, where the firm is indifferent between the two types of machines at time t,is given by the condition or
(6.11)
The higher a country’s level of human capital, the lower the critical firm-specificvalue of at which firms switch from old to new machines, that is, the lower theshare of old machines and the lower the average age of machines. If a downstreamfirm’s , then and it buys an old machine at time t. A firm usingan old machine at t − 1 has a higher value of (equation 6.11) and is thus morelikely to continue using an old machine at time t. Given that the cost of additionalknowledge falls over time (equation 6.5), falls over time (equation 6.11). When
has fallen to the point at which the inequality is reversed ( ), the firmε ε> ctεct
εct
εct
∆R tt < −1/( 1)ε ε< ct
εct
εct ti
tt M H= − ∗ ∗ −1 1 1( ) .
∆Rti =1/(t 1)–
εct ,
( ) ( ).< − = −∗C C tt t 1 1/∆Rt
i >
∆Rti
∆R g H M H M Hti
t t t ti
t ti
t= = ( )∗ = ∗ ∗− −( , ) , ,φ φ ε ε1 1
RtSt
RtSt
φ εt tiM= ∗ −1.
MtOLD−1Mt
NEW−1
Mti−1
φ φ ε φ φt t tiM= ( ) >−, , , ,1 1 2 0
The Knowledge Content of Machines 117

switches to new machines forever (assuming no sudden fall in Ht). If at first the firm buys new machines from the start.
Thus the productivity of firms with low values of e is hurt both because of thelow value of e and because firms with low values of e tend to buy old machines. Sim-ilarly, a low level of human capital hurts a firm’s productivity both because of thelower level of human capital itself and because it raises the value of and increasesthe likelihood that the firm will buy old machines.
With this setting and the distribution of firm-specific knowledge-absorptioncapacity e, we can determine the share of a given type of machine (old or new)imported by any country. Let the distribution of e be uniform, with . Thena given country’s share of old machines is
(6.12)
Given that the age of new machines is zero and that of old machines is one, theaverage age of the stock of machines is also ect. Thus the critical value ect is equal tothe share of old machines and to the average age of machines. It is inversely pro-portional to a country’s level of human capital.7
The average cost of machines is given by
(6.13)
A country with a very high level of human capital (a country at the frontier)would have a very low critical value of ect . From equation (6.12), as .Thus in an economy at the frontier, all firms use new machines, and the average costof machines relative to the average cost at the frontier, RACt , is
(6.14)
RACt , which reflects the average quality of machines in a given country relative tothat at the technological frontier, is used in the empirical analysis. It falls with —and thus rises with the level of human capital (equation 6.12)—and it falls with
, the cost of producing additional knowledge. Given that ct falls overtime, RACt increases and so does the share of new machines.
In the empirical analysis that follows, we estimate a combination of equation(6.10), which relates productivity gains to the choice of machines, and equation(6.12), which shows the (average) choice of machines made by a given country.
Data and Sample Countries
The study focuses on the imports of machines from the European Union by threecountries in Central and Eastern Europe (Bulgaria, Hungary, and Poland) andthree in the Southern Mediterranean (Egypt, Israel, and Turkey) between 1989
c tt = −1 1/( )
εct
RACm c
m ctt ct
t
= + −+( )
.1 ε
H → ∞εc → 0
AC C C m m c mt t ct t ct c t ct= ∗ + ∗ − = ∗ + + − =∗ ε ε ε ε( ) ( )( )1 1 ++ −ct ct( ).1 ε
εct t tOLDt H M= − ∗ ∗ −1 1 1( ) .
ε ∈[ , ]0 1
εct
ε ε> ct,
118 Global Integration and Technology Transfer
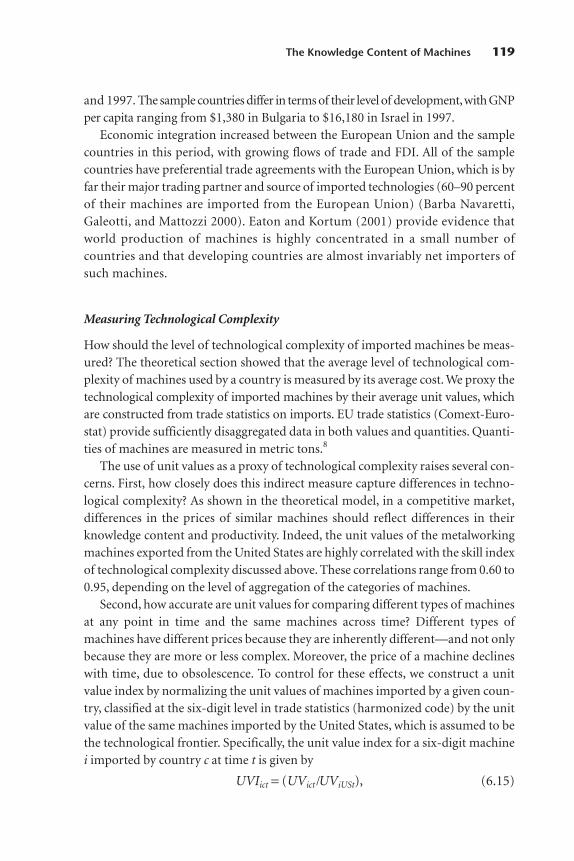
and 1997. The sample countries differ in terms of their level of development,with GNPper capita ranging from $1,380 in Bulgaria to $16,180 in Israel in 1997.
Economic integration increased between the European Union and the samplecountries in this period, with growing flows of trade and FDI. All of the samplecountries have preferential trade agreements with the European Union, which is byfar their major trading partner and source of imported technologies (60–90 percentof their machines are imported from the European Union) (Barba Navaretti,Galeotti, and Mattozzi 2000). Eaton and Kortum (2001) provide evidence thatworld production of machines is highly concentrated in a small number ofcountries and that developing countries are almost invariably net importers ofsuch machines.
Measuring Technological Complexity
How should the level of technological complexity of imported machines be meas-ured? The theoretical section showed that the average level of technological com-plexity of machines used by a country is measured by its average cost. We proxy thetechnological complexity of imported machines by their average unit values, whichare constructed from trade statistics on imports. EU trade statistics (Comext-Euro-stat) provide sufficiently disaggregated data in both values and quantities. Quanti-ties of machines are measured in metric tons.8
The use of unit values as a proxy of technological complexity raises several con-cerns. First, how closely does this indirect measure capture differences in techno-logical complexity? As shown in the theoretical model, in a competitive market,differences in the prices of similar machines should reflect differences in theirknowledge content and productivity. Indeed, the unit values of the metalworkingmachines exported from the United States are highly correlated with the skill indexof technological complexity discussed above. These correlations range from 0.60 to0.95, depending on the level of aggregation of the categories of machines.
Second, how accurate are unit values for comparing different types of machinesat any point in time and the same machines across time? Different types ofmachines have different prices because they are inherently different—and not onlybecause they are more or less complex. Moreover, the price of a machine declineswith time, due to obsolescence. To control for these effects, we construct a unitvalue index by normalizing the unit values of machines imported by a given coun-try, classified at the six-digit level in trade statistics (harmonized code) by the unitvalue of the same machines imported by the United States, which is assumed to bethe technological frontier. Specifically, the unit value index for a six-digit machinei imported by country c at time t is given by
UVIict = (UVict /UViUSt), (6.15)
The Knowledge Content of Machines 119

where the denominator is the unit value of the same machine i imported by theUnited States at time t. This is essentially the relative average cost of machines asdefined in equation (6.14).
Third, unit values may capture market imperfections, such as market poweror trade barriers, which also affect prices. However, the countries in the sampleare small, and we can reasonably assume that the price of machines is given forthem. Moreover, we use freight on board prices in current ECU at the EU border.These prices should not be distorted by trade or other policies in the importingcountry.
Once unit values indexes (UVIs) are computed, it is necessary to derive corre-spondences at the industry level between categories of machines imported and theindustries using them in production. If, for example, we are interested in com-puting the UVI for the textile industry, we must aggregate it over all textilemachines. We are able to do so at the three-digit ISIC industry level by matchingdata on productivity derived from industrial statistics (UNIDO) and data onimports of technology derived from trade statistics (Comext-Eurostat).9 Theindustry matching, reported in annex A, is available for 13 sectors. Thus the aver-age UVI of the machines used in the three-digit ISIC industry j in country c at timet is given by
(6.16)
where n is the number of six-digit categories i corresponding to the ISIC three-digit category j,Vict is the value of machines i imported by country c at time t, andVjct is the total value of machines used in sector j imported by country c at time t.10
Trends of Unit Value Indexes
It is useful to observe how the UVI6 behave across countries and over time. Figure 6.1reports the trends of the average of UVIs for the sample importing countries andsome other Southern Mediterranean countries. The U.S. index is set at 100. Formost years and countries, the index is lower than 100 and declining. These trendssupport the theoretical prediction that on average developing countries import lesstechnology-intensive machines than does the United States. The country with thesmallest gap is Israel, the country with the highest per capita income in the sample.The technology gap widens for all countries in the sample, quite dramatically so forHungary and Poland, although their trend is affected by the dramatic turnaroundof their economies after 1989.11
UVI UVIV
Vjct ictict
jcti
n6
1
=
=∑ ,
120 Global Integration and Technology Transfer

Annex D examines the persistence in the technology gap of imported machinesin a different way. It compares UVIs with their values lagged one, two, and sevenyears and shows a striking persistence in the technology gap.
Do Embodied Imported Technologies BoostProductivity? Econometric Analysis
We have shown some descriptive evidence that relative to the United States, devel-oping countries import machines embodying simpler technologies. The theoreti-cal model shows that technology imports and productivity are two endogenouschoices to be analyzed jointly. The use of more advanced technologies is expectedto increase productivity, but firms will buy them only if the increase in productiv-ity is worth the cost.
We examine the impact of machine imports on TFP in those industries (j) usingthem as factors of production. We work with a panel comprising 13 industries,6 countries, and 8 years (1989–96). Annex B describes how we computed TFP;annex C reports the data sources and the basic descriptive statistics of the variablesused in the estimations.
The Knowledge Content of Machines 121
Source: Authors.
Note: Figures show three-year moving averages.
FIGURE 6.1 Average Unit Values in Select Countries, 1989–97
0
20
40
60
80
100
120
140
1989
–91
1990
–92
1991
–93
1992
–94
1993
–95
1994
–96
1995
–97
aver
age
unit
valu
e in
dex
(US
=10
0)
Egypt Hungary Israel Jordan
Morocco Poland Tunisia Turkey

TFP at time t is assumed to depend on lagged productivity (which proxies theexogenous component of the knowledge absorption capacity), on productivity atthe frontier, on the types of machines used in production at t and earlier, and onthe overall level of development of the importing country. It can be empiricallyimplemented as follows:
(6.17)
where TFPcjt is TFP for industry j in the importing country c at time t; TFPUSjt
measures TFP for industry j in the United States, the technological leader, whichcaptures the effects of technological progress at the frontier on TFP in c;12 IMP isthe share of imported machines in total investments in industry j, which controlsfor the relative importance of imported machines; UVI is the unit value index asdefined in equation (6.15), which proxies the complexity of the machinesimported and used in sector j in the importing country c at time t; and DOMINVis a variable controlling for the technological content of domestic investments. AsDOMINV is not observable, we use domestic consumption of electricity as aproxy. GDP is per capita GDP, and measures aggregate demand and the overalllevel of development of country c at time t; it proxies human capital, as well asinfrastructure and institutional development. Dj, Dc, and Dt are industry, country,and time dummies.
We also need to analyze the choice of embodied technology, as a function,among other things, of expected productivity, given that the two are jointly deter-mined. Equation (6.14) in the model shows that the proximity to the technolog-ical frontier of the machines imported each year by country c—and consequentlytheir relative average cost—is affected by the ability of importers to use high-techtechnologies efficiently. This term is made up of firm-specific components (thatis, the firm’s absorption capacity) and of country-specific components. A firm’sabsorption capacity, and thus the gains in productivity achievable through thenew technologies, depends on its past productivity (TFPt−1); on the technologiesused in the past (UVIt−1); and on other factors, such as its relationship to foreignfirms (OPTt−1). As we do not have consistent sector-specific data on FDI, wemeasure it indirectly by looking at the share of exports of sector j from countryc classified as outward processing trade (OPT). OPT captures flows of temporarytrade between subcontractors and between parent companies and subsidiaries.13
The country-specific components include the overall level of development, asproxied by GDP per capita (GDPt−1). We also include relative factor prices (w/r)
ln( ) ln lTFP TFPcjt cjt
n
= +
+−=
∑α α αττ
1 2 3
1
nn lnTFP IMPUSjt cjt− −+1 4 1α
ln ln ln+ + +− − −α α α5 1 6 1 7UVI DOMINV GDPcjt ct ct 11
8 9 10+ + + +α α α εDj Dc Dt cjjt ,
122 Global Integration and Technology Transfer

to control for the relative labor intensity of different types of technologies.14 Wethus have
(6.18)
As for productivity, all technological choices are observed at the sector level.Equations (6.17) and (6.18) define a system that jointly determines the choice ofimported technologies and productivity.
We face several econometric problems. First, our results may be driven by spu-rious correlation, in that unobserved time-invariant factors may affect both pro-ductivity and the choice of technology. Such factors could be the share of foreigninvestors in the industry or the degree of export orientation. Although we cancontrol for some of these variables, others may remain unobservable. Second, asdiscussed in the theory, there is persistence over time in both productivity andthe choice of technology, not necessarily related to the learning process associ-ated with high-tech machines. Third, an endogeneity problem arises from thesimultaneity among productivity, the choice of technology, and potentially mostof the explanatory variables.
To eliminate the effect of time-invariant unobservable factors, we carry outthe estimations in first differences. To isolate the impact of technological choiceson productivity from trend effects, we estimate both productivity and the choiceof technology on their lagged values. As for the endogeneity problem, we runtwo independent regressions in which all explanatory variables can be instru-mented using the appropriate lagged variables, using the GMM-InstrumentalVariable method (GMM-IV) developed by Arellano and Bond (1991) for dynamicpanels.15
The two first-difference equations to be estimated are obtained by transformingequations (6.17) and (6.18) as follows:
(6.19)
(6.20)
ln ln lnUVI b UVI bw
rcjt cjtcjt
ct
= +
+−1 1 2 bb TFP
b
cjt3 1
4
ln
l
−
+ nn ln .OPT b GDP b Dtcjt ct cjt− −+ + +1 5 1 6
∆ ∆ ∆ln( ) ln( ) lnTFP a TFP a TFPcjt cjt USjt= + +− −1 1 2 1 aa UVI
a
cjt3 1
4
∆
∆
ln −
+ lln lnIMP a DOMINVcjt ct− −+1 5 1∆
ln .+ + +−a GDP a Dtct cjt6 1 7∆ ∆ε
ln (ln ) lnUVI UVIw
rcjt cjtcjt
ct
= + +
−β β β0 1 1 2 +
+ + +
−
− −
β
β β β
3 1
4 1 5 1
ln
ln
TFP
GDP OPT
cjt
ct cjt 66 7 8Dj Dc Dt cj+ + +β β ν .
The Knowledge Content of Machines 123

The results of our estimations are reported in table 6.1 for productivity(equation 6.19) and table 6.2 for the choice of technology (equation 6.20). Bothregressions perform well.The nonsignificant Sargan tests indicate that the instrumentsare appropriate. The estimations also successfully take care of the serial autocorre-lation of disturbances, given that there is no second-order autocorrelation.
We first focus on the determinants of TFP in table 6.1. Regressions (1) and (2)include the import share.As this variable has many missing observations (see annex C),to test the robustness of our results we also report regression (3), which does notinclude the import share and has many more observations, a number similar tothose used in estimating the choice of technology. We find that embodied tech-nologies, as measured by the UVI of the machines imported, have a positive effecton TFP. The coefficient is significant and robust in the three regressions (and inalternative specifications not reported). Import shares have a positive but not sig-nificant coefficient (and are not robust to changes in this specification), thus con-firming our presumption that what matters for productivity and growth is thequality of the machines imported and that once we control for quality, quantitiesare not important. TFP in the United States also has a positive effect on TFP in theimporting country, indicating that technical progress in the leader generatesspillovers onto the laggard, independently of the two countries’ trade relations.GDP has a positive effect in regression (1), confirming the prediction that country-specific factors related to the level of development enhance the efficient use ofadvanced technologies. However, this variable is sector invariant and almost timeinvariant and thus not very robust in our estimations. It is no longer significant in(2), where we include electricity consumption per capita, a proxy of the quality ofdomestic investments. Electricity consumption per capita is not significant inregression (2), probably because it is highly correlated to GDP per capita. GDP percapita is also not significant in regression (3).
We now move on to the analysis of the choice technology. Results are reportedin table 6.2. Lagged TFP has a positive and significant effect on UVI, which proxiesfor the choice of technology. Firms buy high-tech machines if they have enoughskills to use them in a sufficiently productive way. Factor prices have no effects.Alternatively, we use the ratio of real wages on real interest and the wage rental ratio,as described in footnote 14. The wage rental ratio is the best measure of relative fac-tor costs, but it includes the price of U.S. machines, which is also in the denomina-tor of the dependent variable, thereby causing spurious correlation. Results,though, are unaffected by the use of these alternative measures.
OPT, which captures the involvement of foreign firms, is also nonsignificant,even when we check for nonlinearity by introducing OPT squared. As expected,GDP has a positive impact on the choice of technology, confirming that frontiertechnology is purchased only when the overall level of development, and implicitly
124 Global Integration and Technology Transfer

The Knowledge Content of Machines 125
Dependent variable: diff ln total factor productivity
Regression
Variable (1) (2) (3)
Lag diff ln total factor productivity −0.008 0.076 0.277∗∗∗
(0.075) (0.588) (3.34)
Lag diff ln unit value index 0.228∗∗∗ 0.166∗∗ 0.169∗∗
(2.59) (2.14) (2.06)
Lag diff ln import shares 0.024 0.018(1.20) (0.999)
Lag diff ln gross domestic product per capita 1.021∗∗ 0.503 0.181(2.00) (1.04) (0.538)
Lag diff ln total factor productivity US 0.556∗∗ 0.516∗∗∗ 0.339∗
(2.47) (2.53) (1.85)
Lag diff ln electricity consumption per capita 0.471(1.07)
Number of observations 153 153 345
Wald (joint)1 23.99 57.91 26.81(0.000) (0.000) (0.000)
Sargan test2 37.36 36.36 53.59(1.000) (1.000) (0.708)
AR (1) test −2.078 −2.220 −2.560(0.038) (0.026) (0.010)
AR (2) test 1.638 1.836 1.741(0.101) (0.066) (0.082)
TABLE 6.1 Determinants of Total Factor Productivity
Note: Table includes results from the first step of two-stage GMM-Instrumental Variables estimates plus theSargan test derived from the second step. “Diff” indicates first-order differencing. Time dummies areincluded in all equations. The absolute values of t-statistics are given in parentheses. All explanatory variablesexcept TFP US are treated as endogenous. GMM–type level instruments are their second or earlier lags. TheGMM estimations were performed using the program DPD for OX (Doornik, Arellano, and Bond 2002).
1. Wald statistics are a test of the joint significance of the independent variable asymptoticallydistributed as c2 with k degrees of freedom (k is the number of coefficients estimated excluding timedummies), under the null hypothesis of no relationship.2. The Sargan test of overidentifying restrictions is distributed as a c2 with as many degrees of freedom asthe number of overidentifying restrictions, under the null hypothesis of the validity of the instruments.The test based on the two-step GMM estimator is heteroskedasticity-consistent.∗Significant at the 10 percent level. ∗∗Significant at the 5 percent level. ∗∗∗Significant at the 1 percent level.

human capital, is high. However, as in the estimation of the determinants of TFP,this result is not robust to changes in the specifications of the model: the coefficientof GDP is not significant when we measure relative factor costs as real wages overreal interest rates.
126 Global Integration and Technology Transfer
Regression
Dependent variable: Diff ln UVI6 (1) (2)
Lag diff ln unit value index −0.081 0.041(0.60) (0.662)
Lag diff ln total factor productivity 0.259∗ 0.256∗∗
(1.93) (2.10)
Lag diff ln wage rental 0.048(0.84)
Lag diff ln real wage over real interest rate −0.091(1.12)
Lag diff ln outward processing trade 0.925 −0.877(0.47) (1.11)
Lag diff ln outward processing trade squared −2.553(0.853)
Lag diff ln gross domestic product per capita 0.744∗∗ 0.035(1.97) (0.09)
Number of observations 379 379
Wald (joint) 17.80 11.16(0.007) (0.048)
Sargan test 55.71 62.21(1.000) (1.000)
AR (1) test −4.571 −4.312(0.000) (0.000)
AR (2) test −0.465 1.203(0.642) (0.229)
TABLE 6.2 Choice of Technology
Source: Authors.
Note: See note to table 6.1.∗Significant at the 10 percent level. ∗∗Significant at the 5 percent level.

Conclusion
This chapter explores the impact of imported technologies on productivity in man-ufacturing sectors for a sample of developing countries and transition economies inCentral and Eastern Europe and the Southern Mediterranean. These countries haverecently integrated their economies with the European Union.
The analysis, which is based on a theoretical model of the choice of technology,departs from earlier studies of international technology diffusion by focusing on thetechnology embodied in imported machines. The technological level of the importedmachines is proxied by an index relating the unit value of the machines imported bya given country to the unit value of the same machines imported by the United States.We find very strong regularities in the pattern of imported machines. Unit values aregenerally stable across time, except for countries facing dramatic shocks in the periodobserved. There is a constant and even increasing gap between the unit value of themachines imported by the United States and the machines imported by our sampleof developing countries. The increasing gap may be due partly to the fact that pro-ductivity grew unusually rapidly in the United States in the 1990s.
The technology gap reflects two inherent characteristics of technological progressin the past decade. On the one hand, the price of machines has been stable over time,despite the rise in their technological content. On the other hand, at any point intime, the prices of machines increases with the machines’ technological content.Therefore, as the price of technology has fallen over time, developing countries haveimported increasingly more advanced machines, while the gap with respect to tech-nological leaders has remained roughly constant. We show that this gap is persistentand that it is higher the lower the level of development of the importing country.
We also show that productivity in manufacturing depends on the type ofmachines imported in a given industry. Thus the cheaper and less sophisticatedmachines that developing countries import result in a lower TFP than frontier tech-nologies, even though the choice may well be optimal given their relative factorprices and their reduced ability to use frontier technologies.
In contrast with earlier studies we find that importing machines per se does notenhance importers’ productivity. Once we control for the quality of imports,quantity does not seem to matter.
The Knowledge Content of Machines 127

128 Global Integration and Technology Transfer
Chapter 6 Annex A: Matching between Machines and Products
TABLE 6A.1 Matching between Machines and Products
Machines
Harmonized SITC code Description
8437/38 (excluding 727 Food machinery, nondomestic84384/79)
84384, 842121, 727 Food machinery, nondomestic842122, 8435
847810, 84790 72843 Tobacco working machines
8444–8451 7244, 7245, Textile machinery7246, 7247
8452 7243 Sewing machines
8453 7248 Skin, leather working machines
84793,8465, 8466 72812, 72819, Machine tools for working woods72844 and wood treating machines
8439–8441 725 Paper mill machinery
8440–8442 726 Printing and binding machinery
8456–8463, 8466 731, 733, 735 Machine tools for metal
8454, 8455, 737 Metalworking machinery8468, 8515
8475, 8464, 2019 72841 Glass working machinery
8477 72842 Rubber and plastic workingmachines

The Knowledge Content of Machines 129
Source: Authors.
Products
NACE ISIC rev. 2 Description
411–423 311 Food
424–428 313 Beverages
429 314 Tobacco
431–439 321 Textiles
453–456 322 Clothing
441, 442, 451, 452 323, 324 Shoes and leather
461–467 331, 332 Wood and wood furniture
471, 472 341 Paper and paper products
473 342 Printing
312–319, 321–328, 381, 382, 384 Metal products and351–353, 361–365 machines (including
transport but excluding electrical machines)
221–233, 371 Iron and steel311
247 362 Glass
481–483 355,356 Rubber and plastic
TABLE 6A.1 (Continued )

130 Global Integration and Technology Transfer
Chapter 6 Annex B: Empirical Derivation of Total Factor Productivity
Measuring Changes in Total Factor Productivity
The estimation procedures used are very straightforward. We assume that sectoralGDP (Yj) is produced using two factors, physical capital (K) and labor (L), using aCobb-Douglas production function:
(6B.1)
where j indicates sector, Aj(0) represents initial conditions, lj is the rate of techno-logical progress in sector j, aj measures the importance of physical capital in out-put, and 1- aj measures the importance of labor. Taking logs and differentiatingwith respect to time yields
(6B.2)
We estimated equation (6.2) by sector j and time t. We pooled data for all c countriesin our sample, added a time trend dummy (Dt) and a country dummy (Dc), and, bycountry, added a dummy for periods of recession in economic activity (DRcjt) thattakes the value 1 whenever Ycjt < Ycjt - 1. The final equation estimated is
(6B.3)
To gain in efficiency, we take into account the simultaneous correlation betweenthe disturbances in different sectors (due to, for instance, common shocks) by esti-mating all the sectors as a system, by SUR.
Changes in TFP by country and by sector were calculated as
(6B.4)
Values estimated for a (the contribution of capital) varied from 0.25 for the foodsector to 0.75 for the machinery sector.
The Data
TFP was estimated for 13 sectors, disaggregated on the basis of the three-digit ISICrev. 2 code (see annex C), for 1980–96. Because of lack of data availability, TFP atthe sector level could be computed only for Bulgaria, Egypt, Hungary, Israel,Poland, Turkey, and the United States. Capital stocks were calculated accordingto the perpetual inventory method. The data came from the UNIDO IndustrialStatistics database.
∆TFP d Y d K d Lcjt cjt j cjt j= − − −∧ ∧ln( ) ln( ) ( ) ln(α α1 ccjt cjtDc Dt DR) .− − −
∧ ∧ ∧
d Y d K d Lcjt cjt j cjt j cjtln( ) ln( ) ( ) ln( )= + + − +λ α α1 DDc Dt DRcjt cjt+ + + ε .
d Y d K d Ljt j j jt j jtln( ) ln( ) ( ) ln( ).= + + −λ α α1
Y A e K Ljt jtjt
jtjt
jtjt= ( )−
( ) ,01λ α α

The Knowledge Content of Machines 131
Chapter 6 Annex C: Description of Variables, Sources
of Variables, and Descriptive Statistics
TABLE 6C.1 Description and Source of Data for Variables
Source: Authors.
Note: All variables except GDP are measured for sector j in country c at time t.
Variable
Total factor pro-ductivity (TFP)
Total factor productivity US
Unit value index(UVI)
Wage rental rate
Real wage
Import share (IMP)
Outward-processing trade(OPT)
GDP per capita
Description
Total factor productivity (see annex B)
Total factor productivity in the UnitedStates (see annex B)
Ratio between the unit value ofmachines imported by a country fromthe European Union and the unit valueof machines imported by the UnitedStates
where Pus is the unit
values of machines imported by theUnited States, rct is the real interest rate, and is a fixed 10 percent depreciation rate
Interest rate-deflated wages
Average share of imported machines intotal investments
Shares of outward-processed exports intotal exports of the sample country
Real gross domestic product of the importing country
w
P rcjt
USjt ct( ),
1+ +
Data source
Unido IndustrialStatistics
Unido IndustrialStatistics
Comext-Eurostat
Unido IndustrialStatistics andComext-Eurostat
Unido IndustrialStatistics andComext-Eurostat
Comext-Eurostatand UnidoIndustrial Statistics
Comext-Eurostat
World DevelopmentIndicators (WorldBank)

132 Global Integration and Technology Transfer
Number of Standard Variable observations Mean deviation
TFP 489 91.22 16.96
TFP US 504 107.39 13.33
Unit value index (UVI) 648 96.54 40.15
Wage rental rate 540 215.32 222.56
Real wage 573 249.47 382.54
Import share (IMP) 340 0.38 0.24
Outward-processingtrade (OPT) 648 0.06 0.14
GDP per capita 648 6,609.63 4,326.49
TABLE 6C.2 Descriptive Statistics
Source: Authors.

The Knowledge Content of Machines 133
Chapter 6 Annex D:
An alternative way to assess the persistency in the technology gap in machinesimported is to compare sector- and country-specific unit value indexes with theirlags.We plot the unit value indexes of machines imported at time t with the unit valueindexes of the same machines imported one year earlier (figure 6D.1), two years ear-lier (figure 6D.2), and seven years earlier (figure 6D.3). The figures show a strikingpersistence in the gap, with the indexes positively correlated with their lagged valueseven with a seven-year lag. Moreover, a large share of the observations lie above thediagonal and this share increases the longer the lag, implying that for many sectorsand countries the gap is increasing.
FIGURE 6D.1 Persistency of the Technology Gap with One-Year Lag
ln UVIit
ln U
VI it
−1
3.41283 6.04197
3.41283
6.04197
Source: Authors.
Note: ∆ denotes ln UVIit−1 = ln UVIit.

134 Global Integration and Technology Transfer
FIGURE 6D.3 Persistency of the Technology Gap with Seven-Year Lag
ln UVIit
3.41283 6.04197
3.41283
6.04197
In U
VI it
−7
FIGURE 6D.2 Persistency of the Technology Gap with Two-Year Lag
ln UVIit
ln U
VI it
−2
3.41283 6.04197
3.41283
6.04197
Source: Authors.
Note: ∆ denotes ln UVIit−2 = ln UVIit.
Source: Authors.
Note: ° denotes ln UVIit−7 = ln UVIit.
The Knowledge Content of Machines 135
Notes
1. These channels are imports (Coe and Helpman 1995; Coe Helpman, and Hoffmaister 1997;Keller 2000; Djankov and Hoekman 1996, Mody and Yilmaz 2002; Schiff, Wang, and Olarreaga 2002);foreign direct investments (Blomström and Kokko 1998); and exports (Clerides, Lach, and Tybout 1998;Bernard and Jensen 1999; Aw, Chung, and Roberts 2000; Kraay [chapter 7 of this volume]). See also BarbaNavaretti and Tarr (2000) for a review.
2. Unit values per ton of machine are very highly correlated to unit values per number of machines,but unit values per number of machines are available only for a limited number of machines and coun-tries.
3. Eaton and Kortum (2001) deal with the choice of capital equipment and its impact on produc-tivity. Caselli and Wilson (2003) classify imports of capital equipment according to the R&D intensityof the capital equipment–producing industry. However, in their framework all capital equipmentimported of a given type is technology invariant, whereas our framework specifically takes into accountdifferences in technological content within specific categories of machines.
4. Eaton and Kortum (2001) analyze both the choice of imported capital equipment and its impacton productivity. Caselli and Wilson (2003) analyze the choice of technology and its link to per capitaincome. Studies looking at the link between productivity and exports explicitly recognize that the choiceof exporting is endogenous with the respect to the effects of productivity on exporting (Clerides, Lach,and Tybout 1998; Bernard and Jensen 1999;Aw,Chung,and Roberts 2000; Kraay (chapter 7 of this volume).
5. However, as shown below, the model incorporates increasing returns at the industry level over time.6. The “old” machines are not old, but the knowledge embedded in them is. Firms can also build
machines with older knowledge at cost m, but doing so is never optimal.7. In reality, the negative link between human capital and the age of machines may be even
stronger, because countries with lower levels of income and human capital will tend to have morelow-productivity firms.
8. For some countries, the quantity of machines is also measured in terms of the number ofmachines, but these data are not as widely available as metric ton data. Unit values computed using thetwo quantity units are very highly correlated.
9. General machines, such as computers, which are used by all industries and cannot therefore beattributed to any, are omitted from the index.
10. This index is subject to a composition effect. The index can increase with time, either becausecountries buy the same bundle of machines and the value of each or some of them increases or becausebundles change toward machines with a higher average unit value. To avoid this problem, it is possible toconstruct Tornqvist price indexes in which weights are fixed over time, normally the period averageweights (Aw and Roberts 1986). However, our unit values are already normalized across machines. Thusan increase in the index due to a composition effect captures the process of technological upgrading thatwe want to observe.
11. A possible explanation for the abrupt decline of the index in Hungary and Poland that is con-sistent with earlier findings based on the skill index (Barba Navaretti, Galeotti, and Mattozzi 2000) is asfollows. Eastern European countries used to buy most of their machines within the Soviet Bloc; theyimported only very sophisticated machines from Western Europe. The first years observed in our datamay capture this earlier distortion. Once trade was liberalized with the European Union, a geographicalreorientation of imports took place and most machines were later imported from Europe. Consequently,the average quality of the machines imported from the European Union fell.
12. Given how UVI is constructed, if both machines imported by the United States and c improve atthe same pace with time, UVIc remains constant even if c imports increasingly productive machines. Topartially control for this effect, we include industry-specific TFP in the United States.
13. It is likely that local subcontractors or local subsidiaries of Western companies use moreadvanced machines, for a variety of reasons, including the standards imposed on them by their foreignpartners or parents.

136 Global Integration and Technology Transfer
14. In some specification of our empirical estimations, we use the wage rental ratio. This measure allows us to control for the effects of d, a fixed yearly depreciation
rate of 10 percent, and PUSjt, the price of the machines imported by the United States in sector j at time t(a proxy of the price of the highest technology machines). Unfortunately, this variable is also in thedenominator of UVI and is thus a source of spurious correlation. We also used an alternative measureof labor cost, controlling for the skill composition of the labor force using the ILO’s Labour StatisticsDatabase. Unfortunately, these data are sector invariant and are of little value in cleaning sector-specificlabor cost data. Using these alternative measures of labor costs did not change the results.
15. We also estimated a system of simultaneous equations in which productivity and technology arejointly determined. These estimations give similar results as the GMM-IV ones, but the endogeneity ofother variables except for TFP and UVI cannot be controlled for, a major shortcoming.
References
Arellano, Manuel, and Stephen Bond. 1991.“Some Tests of Specification for Panel Data: Monte Carlo Evi-dence and an Application to Employment Equations.” Review of Economics Studies 58 (194): 277–97.
Aw, Bee Yan, and Mark J. Roberts. 1986. “Measuring Quality Change in Quota-Constrained ImportMarkets: The Case of U.S. Footwear.” Journal of International Economics 21 (1/2): 45–60.
Aw, B. Y., S. Chung, and M.J. Roberts. 2000. “Productivity and Turnover in the Export Market: Micro-Level Evidence from Taiwan (China) and the Republic of Korea.”World Bank Economic Review 14 (1):65–90.
Barba Navaretti, Giorgio, and David G. Tarr. 2000. “International Knowledge Flows and EconomicPerformance: An Introductory Survey.” World Bank Economic Review 14 (1): 1–16.
Barba Navaretti, Giorgio, Marzio Galeotti, and Andrea Mattozzi. 2000. “Moving Skills from Hands toHeads.” Working Paper 2525, Centre for Economic Policy Research, London.
Barba Navaretti, Giorgio, Isidro Soloaga, and Wendy Takacs. 2000. “Vintage Technology and SkillConstraints: Evidence from U.S. Exports of Used and New Machines.” World Bank Economic Review14 (1): 91–109.
Bernard, Andrew B., and J.B. Jensen. 1999. “Exceptional Exporter Performance: Cause, Effect or Both?”Journal of International Economics 47 (1): 1–25.
Blomström, M., and A. Kokko. 1998. “Foreign Investment as a Vehicle for International TechnologyTransfer.” In Creation and Transfer of Knowledge: Institutions and Incentives, ed. G. Barba Navaretti,P. Dasgupta, K.G. Maler, and D. Siniscalco, 279–311. Heidelberg and Berlin: Springer Verlag.
Caselli, Francesco, and Daniel Wilson. 2003. “Importing Technology.” Department of Economics,Harvard University, Cambridge, MA.
Clerides, S., S. Lach, and J. Tybout. 1998. “Is Learning by Exporting Important? Micro-DynamicEvidence from Colombia, Mexico and Morocco.” Quarterly Journal of Economics 113 (3): 903–47.
Coe, D., and E. Helpman. 1995.“International R&D Spillovers.”European Economic Review 39 (5): 859–87.Coe, D., E. Helpman, and W. Hoffmaister. 1997. “North-South R&D Spillovers.” Economic Journal 107
(440): 134–49.Dijankov, S., and B. Hoekman. 1996. “Intra-Industry Trade, Foreign Direct Investments and the
Reorientation of East European Exports.” Discussion Paper 1377, Centre for Economic PolicyResearch, London.
Doornik, Jurgen A., Manuel Arellano, and Stephen Bond. 2002. “Panel Data Estimation Using DPD forOx.” Nuffield College, Oxford.
Eaton, J., and S. Kortum. 2001. “Trade in Capital Goods.” European Economic Review 45 (7):1195–1235.
Gordon, R.J. 1990. The Measurement of Durable Goods Prices. Chicago: University of Chicago Press.Keller, W. 2000. “Do Trade Patterns, Technology Flows Affect Productivity Growth?” World Bank
Economic Review 14 (1): 17–48.
w P rcjt USjt ct/[ ( )]1+ +δ

The Knowledge Content of Machines 137
Mody, A., and K.Yilmaz. 2002.“Imported Machines for Export Competitiveness.” World Bank EconomicReview 16 (3): 23–48.
Quah, Danny. 1999.“The Weightless Economy in Economic Development.” Discussion Paper 417, Cen-tre for Economic Policy Research, London.
Schiff, M., Y. Wang, and M. Olarreaga. 2002.“Trade-Related Technology Diffusion and the Dynamics ofNorth-South and South-South Integration.” Policy Research Working Paper 2861, World Bank,Washington, DC.

Exports and EconomicPerformance: Evidence
from a Panel of ChineseEnterprises
Aart Kraay
139
7
This chapter investigates whether firms learn from exporting. Using a panel dataset of 2,105 Chinese industrial enterprises between 1988 and 1992, it finds that,controlling for past firm performance and unobserved firm characteristics, pastexports are a significant predictor of current enterprise performance. These learn-ing effects can be quite large: the estimated coefficients indicate that a 10 percentagepoint increase in a firm’s export to output ratio in a given year leads to a 13 percentincrease in labor productivity, a 2 percent increase in total factor productivity(TFP), and a 6 percent decrease in unit costs the following year. Interestingly, theselearning effects are most pronounced among established exporters. For new entrantsto export markets, learning effects are insignificant and occasionally negative.
Although the superior economic performance of exporting firms relative tononexporters has been extensively documented in a number of developed anddeveloping countries,1 the question of causality between exports and firm per-formance has only recently begun to receive attention. After all, the better average
The author would like to thank David Dollar, William Easterly, Mary Hallward-Driemeier, Pascal
Mazodier, Barry Naughton, Jakob Svensson, James Tybout, Colin Xu, and seminar participants
at the World Bank and the Université d’Auvergne for helpful comments and Jean Imbs for dili-
gent research assistance. This chapter appeared in French as “Exportations et performances
économiques: étude d’un panel d’entreprises chinoises,” Revue d’économie du développement 1–2/
1999, 183–207.

140 Global Integration and Technology Transfer
performance of exporters may simply be due to exporters self-selecting intoexport markets precisely because they are more efficient. It is also possible thatfirms learn from exporting through a variety of channels. Somewhat informally, itis often argued that exposure to global markets elicits greater entrepreneurialeffort on the part of managers, forcing them to become more “competitive.” Moreconcretely, there is evidence that developing country exporters benefit from arange of trade-related linkages with their developed country customers, such asproduction or managerial advice embedded in supplier specifications.2
Work by Bernard and Jensen (1995, 1999a, 1999b) and Clerides, Lach, andTybout (1998) attempts to disentangle the direction of causation between exportsand firm performance, using panel data on samples of U.S. firms and Colombian,Moroccan, and Mexican firms, respectively. In contrast with this chapter, both ofthese studies find little evidence that past exports are associated with improvementsin future firm performance, casting doubt on the existence of learning effects.
This chapter extends the work of these authors in two directions. First, I con-sider a different panel data set of 2,105 large and medium-size Chinese industrialenterprises between 1988 and 1992. The experience of these firms is of consider-able independent interest, given China’s swift growth and the rapid expansion ofits trade from a very low base during the 1980s. Although China’s opening toworld markets is often cited as one of the key factors responsible for China’sgrowth, there is little evidence on the effects of trade on economic performance atthe firm level.3
Second, I employ a somewhat different empirical methodology than these ear-lier studies. For a partial correlation between past exports and current perform-ance to constitute evidence of learning from exporting, it is necessary to employ amethodology that rules out two alternative sources of this correlation: unob-served firm-specific factors that are correlated with both exports and firm per-formance and the confluence of persistence in firm performance and self-selectionof better firms into export markets. Accordingly, I employ a dynamic panel speci-fication in which firm performance depends on lagged performance and laggedexports. I address the difficulty of unobserved firm-specific effects by workingwith a first-differences specifications; the presence of lagged performance and anappropriate choice of instruments rule out the second explanation.4 Finally,unlike these earlier studies, I allow the coefficient on lagged exports to varywith the export history of the firm; I thus allow learning effects to depend onhow long firms have been in export markets. I find that there are large differencesin learning effects between recent entrants and established exporters. This raisesthe possibility that the failure of earlier studies to find learning effects maysimply be because these studies pool information across firms with differentexport histories.

Are Exporters and Nonexporters Different?
In this section, I briefly discuss the data set and document the characteristics ofthe sample of firms. I then summarize some of the features of the exporting firmsin the sample and confirm that in China, as in other countries, exporters tend tobe larger and more efficient than nonexporters. The question of causationbetween exports and firm performance is taken up in the following section.
Data and Sample Characteristics
This study exploits data from a rich panel data set of more than 7,000 large andmedium-size Chinese industrial enterprises between 1988 and 1992 compiled byChina’s State Statistical Bureau. The data set is a subsample of the annual Chineseindustrial survey on which published aggregate industrial statistics are based; itcontains consistent time series for a large number of physical and financial indica-tors of enterprises, including exports. Unfortunately, many values are missing inthe data, especially for the exports variable. This forces consideration of a muchsmaller subsample of 2,105 enterprises for which it is possible to construct a bal-anced panel of observations on all relevant variables. (Details of how the variableswere constructed from the underlying data are given in the annex.)
Tables 7.1 and 7.2 present an overview of key variables for the sample of 2,105firms. Although the sample represents only a tiny fraction of the hundreds of
Exports and Economic Performance 141
Statistic 1988 1989 1990 1991 1992
Gross output valueSample (billions of yuan) 185.1 220.4 232.9 263.5 320.3Population1 (billions of yuan) 1,822.4 2,201.7 2,392.4 2,824.8 3,706.6Sample/population (percent) 10.2 10.0 9.7 9.3 8.6EmploymentSample (thousands) 6,502.6 6,684.8 6,724.1 6,827.2 6,978.3Population1 (thousands) 61,580.0 62,280.0 63,780.0 65,510.0 66,210.0Sample/population (percent) 10.6 10.7 10.5 10.4 10.5ExportsSample (billions of yuan) 19.7 24.3 27.9 31.9 31.8Population2 (billions of yuan) 176.7 195.6 298.6 382.7 467.6Sample/population (percent) 11.2 12.4 9.3 8.3 6.8
TABLE 7.1 Summary Statistics for Enterprise Sample
Source: Author.
1. Industry only.
2. Economywide exports.

thousands of Chinese industrial enterprises, the large firms in the sample accountedfor about 10 percent of industrial gross output value and employment and 11 percentof exports in 1988. Although the share of the sample in total employment isroughly constant over the sample period, the share of the sample in gross outputfalls to 8.6 percent in 1992 and the share in exports falls precipitously to 6.8 percent.This is due primarily to biases in the composition of the sample of firms relative tothe population of Chinese industrial enterprises, as documented in the first panelof table 7.2. The sample of firms is heavily skewed toward state-owned enterprises,which have experienced slower output and export growth on average than the restof the economy (World Bank 1996, 1997). The sample is also somewhat skewed inits sectoral composition, with sectors such as textiles and ferrous metals overrepre-sented and many sectors entirely unrepresented. These compositional biases, as
142 Global Integration and Technology Transfer
TABLE 7.2 Distribution of Sample by Ownership and Sector,1990 (percent)
Source: Author.
Note: — = not applicable. Sectoral distribution for population is approximate, due to imperfectconcordance between documentation of the data set and published national tools.
1. All industry, including mining and utilities.
2. Manufacturing only.
3. Sectors not represented in sample.
Gross output value Employment
Item Sample Population Sample Population
Ownership1
State-owned units 95.92 54.60 96.07 68.42Collectively owned units 2.49 35.62 2.63 29.41Others 1.59 9.77 1.30 2.16Sector2
Textiles 25.69 14.55 29.29 14.05Garments 1.20 2.63 0.92 3.11Basic chemicals 5.59 9.47 4.11 7.20Pharmaceuticals 5.14 2.26 3.56 1.53Chemical fibers 3.77 1.73 2.08 0.64Construction materials 1.36 n.a. 1.51 n.a.Ferrous metals 32.11 8.25 27.15 5.66Machinery 13.67 10.63 21.30 18.65Automobiles 6.94 4.53 6.25 3.79Electronics 4.52 3.71 3.84 2.96Other3 — 42.24 — 42.42
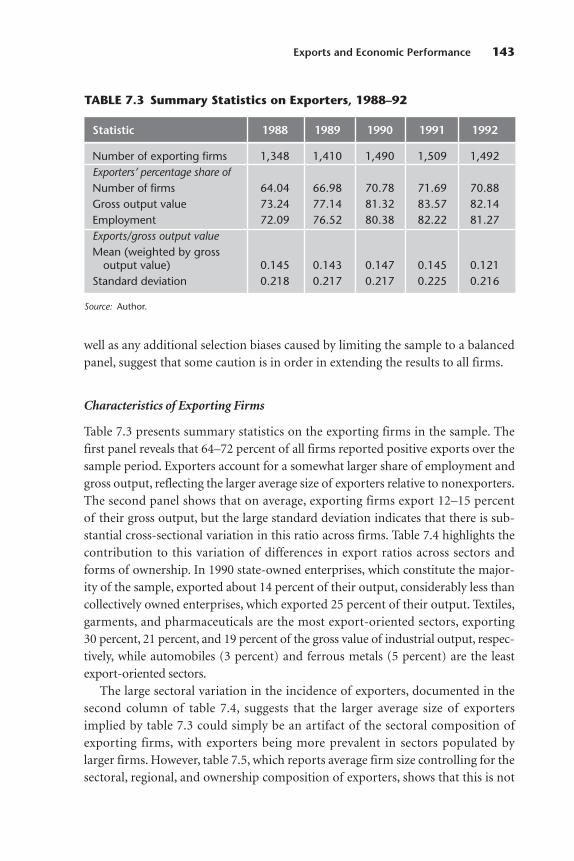
well as any additional selection biases caused by limiting the sample to a balancedpanel, suggest that some caution is in order in extending the results to all firms.
Characteristics of Exporting Firms
Table 7.3 presents summary statistics on the exporting firms in the sample. Thefirst panel reveals that 64–72 percent of all firms reported positive exports over thesample period. Exporters account for a somewhat larger share of employment andgross output, reflecting the larger average size of exporters relative to nonexporters.The second panel shows that on average, exporting firms export 12–15 percentof their gross output, but the large standard deviation indicates that there is sub-stantial cross-sectional variation in this ratio across firms. Table 7.4 highlights thecontribution to this variation of differences in export ratios across sectors andforms of ownership. In 1990 state-owned enterprises, which constitute the major-ity of the sample, exported about 14 percent of their output, considerably less thancollectively owned enterprises, which exported 25 percent of their output. Textiles,garments, and pharmaceuticals are the most export-oriented sectors, exporting30 percent, 21 percent, and 19 percent of the gross value of industrial output, respec-tively, while automobiles (3 percent) and ferrous metals (5 percent) are the leastexport-oriented sectors.
The large sectoral variation in the incidence of exporters, documented in thesecond column of table 7.4, suggests that the larger average size of exportersimplied by table 7.3 could simply be an artifact of the sectoral composition ofexporting firms, with exporters being more prevalent in sectors populated bylarger firms. However, table 7.5, which reports average firm size controlling for thesectoral, regional, and ownership composition of exporters, shows that this is not
Exports and Economic Performance 143
Statistic 1988 1989 1990 1991 1992
Number of exporting firms 1,348 1,410 1,490 1,509 1,492Exporters’ percentage share ofNumber of firms 64.04 66.98 70.78 71.69 70.88Gross output value 73.24 77.14 81.32 83.57 82.14Employment 72.09 76.52 80.38 82.22 81.27Exports/gross output valueMean (weighted by gross
output value) 0.145 0.143 0.147 0.145 0.121Standard deviation 0.218 0.217 0.217 0.225 0.216
TABLE 7.3 Summary Statistics on Exporters, 1988–92
Source: Author.

the case.5 Even within these groups, exporters tend to be nearly twice as large asnonexporters, in terms of both gross output value and employment, and this dif-ference is highly significant.
Table 7.6 presents some indicators of within-firm variation in exports between1988 and 1992. The upper panel documents the fact that a firm’s status as anexporter or nonexporter is highly persistent over time by reporting the probabil-ity that an exporting (nonexporting) firm continues to export (not export) fromone year to the next, averaging over all firms in all periods. Given that a firmexported in a particular year, the probability that it continues to export the fol-lowing year is 0.905. Similarly, the probability that a firm does not export in agiven year, conditional on not having exported the previous year, is 0.836, and theprobability that a nonexporter breaks into export markets is only 0.164. This is notto say, however, that there is little time-series variation in the export ratio itself.
144 Global Integration and Technology Transfer
TABLE 7.4 Summary Statistics on Exporters by Ownershipand Sector, 1990
Source: Author.
Exporter percentage share of Exports/gross output
Number Number Grossof of output Employ- Standard
Statistic exporters firms value ment Mean deviation
OwnershipState-owned
units 1,353 70.36 81.45 80.49 0.14 0.21Collectively
owned units 99 74.44 80.16 77.65 0.25 0.26Others 38 77.55 75.10 77.86 0.16 0.19SectorTextiles 540 87.95 93.47 92.31 0.30 0.24Garments 19 63.33 62.79 60.13 0.21 0.35Basic chemicals 86 68.80 79.81 77.42 0.11 0.13Pharmaceuticals 139 81.29 90.27 86.71 0.19 0.18Chemical fibers 24 40.00 58.71 62.31 0.08 0.13Construction 22 46.81 53.34 49.12 0.08 0.05materialsFerrous metals 65 60.19 77.95 76.64 0.05 0.12Machinery 414 62.73 76.27 75.41 0.11 0.17Automobiles 58 45.67 78.01 72.51 0.03 0.08Electronics 123 75.46 80.47 80.33 0.11 0.19

The lower panel of table 7.6 presents the mean and standard deviation of year-over-year changes in the export to gross output value ratio. The large standarddeviations indicate that there is considerable variation around the average changein exports. For example, between 1990 and 1991, these figures indicate that fullyhalf of the firms in the sample experienced a change in their export ratio of morethan 7 percent in absolute value, and one-quarter experienced changes of morethan 12 percent in absolute value.
Exports and Economic Performance 145
TABLE 7.5 Size of Exporters and Nonexporters, 1988–92(unweighted averages of selected variables)
Source: Author.
Note: Unweighted averages, controlling for ownership, sector, and province effects.
1. p-value is for test of the null hypothesis that the means for exporters and nonexporters are equal.
Item 1988 1989 1990 1991 1992
Gross output valueExporters
(thousands of yuan) 100,545 120,553 127,133 145,916 176,370Nonexporters
(thousands of yuan) 65,421 72,497 70,747 72,643 93,309p-value1 0.00 0.00 0.00 0.00 0.00EmploymentExporters 3,478 3,628 3,627 3,720 3,801Nonexporters 2,397 2,259 2,145 2,036 2,133p-value1 0.00 0.00 0.00 0.00 0.00
TABLE 7.6 Persistence and Volatility of Export Status
Source: Author.
1. Refers to firms with positive exports in both years over which change is calculated.
Exports at Does not exportItem time t + 1 at time t + 1
Exports at time t 0.905 0.095Does not export at time t 0.164 0.836
1988–89 1989–90 1990–91 1990–92
Change in exports/gross output value1
Mean 0.010 0.017 0.007 −0.020Standard deviation 0.093 0.106 0.122 0.121

Do Exporters Perform BetterThan Nonexporters?
In order to investigate differences in enterprise performance between exportersand nonexporters, I require indicators of economic performance over time for allfirms. I consider three measures: labor productivity, TFP, and unit costs. I measurelabor productivity as gross output per worker in constant 1990 prices, I measureunit costs as the current price ratio of cost of goods sold to sales revenue. TFP isconstructed as the residual from a three-factor constant returns Cobb-Douglasgross output production function using capital, labor, and materials as inputs.Capital is measured as the net value of fixed assets, labor input is measured as theannual average number of workers, and materials are measured in constant 1990prices. The output elasticities are measured as the current-price shares of factorpayments in gross output and are allowed to vary across sectors and over time. Inparticular, the output elasticity of labor in each sector and year is estimated as thesectoral average of wage payments (including bonuses) to gross output, while theoutput elasticity of materials is measured as materials consumption divided bygross output. Given the assumption of constant returns to scale, the capital outputelasticity is one minus the other two elasticities.6
It is worth noting in passing that considerable controversy surrounds variousmeasures of enterprise productivity in China.7 Much of this controversy results fromefforts to reconcile the anomalous behavior of various published price indices foroutput and material inputs and the consequences of different reconciliations for therelative productivity performance of state and nonstate industry. Since I am notinterested in comparisons between state- and nonstate industry but rather betweenexporters and nonexporters in a sample consisting primarily of state-owned enter-prises, I am able to sidestep much of the controversy surrounding the choice ofappropriate deflators. Moreover, in the empirical work in the following sections, Ienter the firm performance variables in logarithms and include ownership dummiesinteracted with period dummies, which has the effect of sweeping out any variationin deflators across ownership forms.
Table 7.7 summarizes the differences in firm performance between exportingand nonexporting firms. The first panel reports the simple averages of labor pro-ductivity, TFP, and unit costs in exporting and nonexporting firms, pooling the datafor all firms and years. Both measures of productivity are significantly higher inexporting firms, with exporters enjoying a productivity advantage of 2–9 percentover nonexporters. In terms of unit costs, exporters appear to have slightly worseperformance than nonexporters, but this is an artifact of the sectoral composition ofexporters. The lower panel presents the same averages as the upper panel, controllingfor the sectoral, regional, and ownership distribution of exporters. The productivity
146 Global Integration and Technology Transfer

Exports and Economic Performance 147
Item Exporters Nonexporters p-value1
UnconditionalLabor productivity 36.652 33.694 0.00Total factor productivity 2.014 1.965 0.00Unit costs 0.922 0.912 0.001Conditional2
Labor productivity 45.819 42.844 0.00Total factor productivity 2.105 2.057 0.00Unit costs 0.949 0.961 0.00
TABLE 7.7 Performance of Exporters and Nonexporters
Source: Author.
1. p-value is for test of the null hypothesis that the means for exporters and nonexporters are equal.
2. Controlling for sector, ownership, and regional effects.
advantage of exporters persists, and exporters now also enjoy slightly lower unitcosts than nonexporters.
In summary, the empirical regularities observed in this sample of predominantlystate-owned Chinese industrial enterprises are consistent with those documented inseveral other countries. Exporting firms tend to be larger than nonexporting firmsand to enjoy higher productivity and lower unit costs. Although a firm’s status as anexporter is very persistent over time, there is substantial time-series variation in theexport to gross output ratio of exporting firms. This last feature of the data isimportant, because in the next section I use the within-firm time-series variation inexports and performance measures to identify learning effects.
Do Exporters Learn from Exporting?
In this section I formally test whether the better average performance of exportingfirms documented in the previous section can be attributed to exporters learningfrom exporting. In contrast to other work, I find a statistically and economicallysignificant effect of lagged exports on current firm performance, suggesting thepresence of learning from exporting.
Specification and Identification
The empirical strategy in this section is to test whether a firm’s performance, asmeasured by labor productivity, TFP, and unit costs, depends on its past export

experience. For such a test to constitute evidence in favor of learning by exporting,it is necessary to rule out two alternative explanations for any observed correlationbetween past exports and current enterprise performance.
First, current enterprise performance may depend on past export experience,due to unobserved enterprise characteristics that affect both performance andexports. For example, certain firms may have more energetic managers who runefficient operations with lower unit costs than their competitors and also aggres-sively seek out foreign markets, while other firms may be run by more conserva-tive managers who are unwilling to implement efficiency-enhancing reforms andprefer to rely on traditional domestic markets. Such unobservable firm character-istics may give rise to spurious correlations between lagged exports and currententerprise performance.
Second, firm performance is itself likely to be persistent over time, and it isjointly determined with a firm’s export performance. For example, if productionis characterized by scale economies, an expansion of plant size today may result inlower unit costs for many periods in the future. If firms with better performanceself-select into export markets and firm performance is correlated over time, thencurrent performance will be correlated with past export behavior even in theabsence of learning effects.
To distinguish the learning hypothesis from these two alternative explanations,I estimate a series of regressions of firm performance on lagged exports andlagged firm performance. The estimation technique is selected so as to yield con-sistent estimates of the coefficient on lagged firm performance and lagged exportseven in the presence of unobserved firm-specific, time-invariant effects that arecorrelated with the explanatory variables.8 To the extent that unobserved firmcharacteristics, such as managerial ability, do not vary over time, the first explana-tion for the correlation between lagged exports and current firm performance isruled out. The inclusion of lagged firm performance in the regression controls forserial dependence in this variable, and the appropriate choice of lagged variablesas instruments addresses the problem that exports and firm performance arejointly determined. Hence I can also distinguish the learning hypothesis from thesecond explanation mentioned above.
Specifically, I estimate variants on the following equation:
, (7.1)
where yijt and xijt denote the logarithm of firm performance and the export to grossoutput value ratio of firm i of ownership form j at time t,hi is an unobserved firm-specific effect, and ljt is an unobserved period-specific effect that may also varyacross ownership forms. Finally, eijt is a well-behaved zero-mean disturbance term.
y y xijt ij t ij t i jt ijt= ⋅ + ⋅ + + +− − , ,1 1γ εh l
148 Global Integration and Technology Transfer

To eliminate the individual- and period-specific effects from equation (7.1), Itake deviations of all variables from period- and ownership-specific means andthen difference these deviations to obtain:
(7.2)
where ∆ is the first difference operator and and denote deviations fromperiod- and ownership-specific averages.9
Two assumptions on the structure of the disturbances are required to identifythe parameters of the model. First, I assume that there is no serial dependence ineijt, that is, E[eijt ⋅ eijs] = 0 for all s ≠ t. Second, I assume that, although firm per-formance and exports are jointly determined, exports are predetermined withrespect to eijt, that is, E[xijt ⋅ eijs] = 0 for all s > t. Although the first-differencingintroduces a correlation between the transformed residual and the first difference oflagged firm performance, the assumption of no serial dependence in the untrans-formed residual ensures that second and higher lags of firm performance are availableas instruments for . The assumptions of no serial correlation and predetermi-nacy of exports imply that second and higher lags of exports are valid instrumentsfor .
How valid are these identifying assumptions? If firm performance exhibitshigher than first-order serial dependence, the residual term in equation (7.1) willalso be serially correlated, invalidating the first identifying assumption. Since theshort available time span of the data set makes it difficult to include several lags ofthe dependent variable, the only alternative is to test whether the estimated differ-enced residuals in equation (7.2) exhibit second-order serial dependence. It turnsout that they do not, providing some comfort for the first identifying assumption.The assumption that exports are predetermined with respect to eijt would arisenaturally in any model in which both exports and firm performance depend ontheir own and the other’s lagged values (as well as other exogenous variables).10
Basic Results
The results of this basic specification are presented in table 7.8. The model is esti-mated using one lag of firm performance and one lag of exports over the periodfrom 1990 to 1992, since the differencing and choice of twice-lagged variables asinstruments eliminates the first two years from the estimation period. As instru-ments, I use only the second lags of firm performance and exports. Results usingthe full set of all available second and higher lags as instruments are quite similarand are not reported for brevity.11
The highly significant and positive coefficients on lagged firm performance inthe first row of the table confirm that firm performance is persistent over time.
∆ xij t, −1
∆yij t, −1
εijty xijt ij t, , −1
∆ ∆ ∆ ∆y y xijt ij t ij t ijt= ⋅ + ⋅ +− −β γ ε, , ,1 1
Exports and Economic Performance 149

150 Global Integration and Technology Transfer
Labor Total factor Item productivity productivity Unit costs
Lagged performance 1.037∗∗ (0.087) 0.541∗∗ (0.032) 0.221∗∗ (0.031)Lagged exports 1.321∗∗(0.252) 0.233∗∗ (0.079) −0.647∗(0.108)p-value for no serial
correlation test 0.003∗∗ 0.947 0.264
TABLE 7.8 Basic Model Results
Source: Author.
Note: Model estimated for 1990–92, using second lags of firm performance and exports as instruments.Standard errors are in parentheses. ∗Significant at the 5 percent level.∗∗Significant at the 1 percent level.
More interestingly, there is statistically significant evidence of learning fromexporting. Past exports are positively associated with current labor productivityand TFP and negatively associated with unit costs. The magnitude of these effectsis also economically significant. Recalling that the performance measure isexpressed in logarithms, the magnitudes of the coefficients on lagged exportsimply that an increase of 0.1 in a firm’s export ratio (roughly one sample standarddeviation) causes a 13 percent increase in labor productivity, a 2 percent increasein TFP, and a 6 percent reduction in unit costs the following year.
The last row of table 7.8 reports the p-value associated with a test of the nullhypothesis that there is no second-order serial correlation in the differenced resid-uals in equation (7.2). In the case of unit costs and TFP, this null hypothesis is notrejected at the 5 percent level, suggesting that the identifying assumptions areindeed valid. In the case of labor productivity, the null hypothesis is rejected at the5 percent level. However, if I augment this specification with an additional lag oflabor productivity, the null is no longer rejected, and the coefficient on laggedexports actually becomes much larger.
The rather large estimates of learning using these measures should be inter-preted with some caution. Both exports and some measures of firm performanceare quite persistent over time. As a result, lagged levels of these variables will notbe very highly correlated with contemporaneous changes in these variables. Thissuggests that lagged levels may be weak instruments for the right-hand-side vari-ables in equation (7.2). In the case of weak instruments, it is well known that infinite samples the instrumental variables estimates are biased toward the probabilitylimits of the ordinary least squares estimates of equation (7.2). Therefore, theinstrumental variables procedure I employ may only imperfectly address the endo-geneity problems that motivate its use, and hence the learning effects may be some-what overstated.12

Controlling for Export Histories
One shortcoming of the above regressions is that they do not control for theexport history of a firm. The relationship between lagged exports and currentfirm performance may depend on the export history of a firm, for a number ofreasons. Suppose, for example, that learning from exporting is a one-shot affair, inthe sense that breaking into export markets is associated with a one-time improve-ment in firm performance. In this case, lagged exports should be positively corre-lated with firm performance only in the first few years after a firm enters the exportmarket, not if a firm has been exporting for many years.
If, however, learning is an ongoing process, then lagged exports will be posi-tively associated with current performance even in firms that have been exportingfor many years. Moreover, if there are high entry costs that must be incurredbefore a firm can begin to export, then measured firm performance may initiallydeteriorate as the firm breaks into export markets. Only as the firm recoups thesestart-up costs will exports eventually be associated with better firm performance.Finally, it is even possible that firms choose to exit from export markets becausethey have exhausted all the learning benefits from exporting.
This raises the possibility that the basic regressions of the previous subsectionare misspecified, since they impose the same coefficient on lagged exports for allfirms, regardless of their export history. I address this concern by re-estimatingequation (7.1), allowing the coefficient on lagged exports to vary with the exporthistory of the firm. Specifically, the export history of a firm may be thought of asa sequence of indicator variables for each firm in each year that take on the value1 if a firm exports in that year and 0 if it does not. Even with only five years ofdata, a very large number of distinct export histories is represented in the sampleof firms, which would result in a very large number of different coefficients onlagged exports to be estimated. In order to conserve on degrees of freedom andimpose some structure on the problem, I consider five types of export histories:firms that export over the entire sample period (established exporters), firms thatinitially do not export but at some point during the sample begin exporting andcontinue to export through the end of the sample period (entrants), firms thatinitially export but leave the export market for the duration of the sample period(exiters), firms that switch between exporting and not exporting more than onceover the sample (switchers), and firms that never export (nonexporters).13 Asshown in table 7.9, slightly more than half of the firms in the sample fall in thefirst category. Relatively few firms are classified as either entrants or exiters (252and 113, respectively, representing 12 and 5 percent of the total sample). Theremainder are switchers (279) or firms that never export (343).
Next I specify a more general form of equation (7.1), in which the coefficients onlagged exports are allowed to vary with the export history of the firm. In particular,
Exports and Economic Performance 151

for t = 1991 and t = 1992, the following pair of equations relates performance tolagged performance and lagged exports:
(7.3)
where g j, j = ENT, EXT, ALW, SWI is the coefficient on lagged exports for entrants,exiters, established exporters, and switchers, respectively; ( ) is a dummyvariable that takes on the value 1 if an entrant (exiter) firm i enters (exits) the exportmarket in year t; and Di
ALW and DiSWI are dummy variables that take on the value 1 if
the firm always exports or is a switcher. Firms that do not export are excluded.Although equation (7.3) differs slightly from equation (7.2) in the sense that
there are different right-hand-side variables in the two time periods, it can be esti-mated in the same manner as before. That is, I first take deviations of all variablesfrom period- and ownership-specific means to eliminate period effects and thentake first differences to eliminate firm-specific effects. Then the assumptions thatexports are predetermined and that there is no serial correlation in the residual
DitEXTDit
ENT
y y D D Di iENT
iENT
iENT EXT
i92 91 89 90 9= ⋅ + ⋅ +( ) + ⋅β γ γ 11EXT ALW
iALW
SWIiSWI
i
D
D x
+ ⋅
+ ⋅ ⋅
γ
γ 991 92 92+ + +η λ εi i ,
y y D D Di iENT
iENT EXT
iEXT
iE
91 90 89 89 90= ⋅ + ⋅ + ⋅ +β γ γ XXT
ALWiALW SWI
iSWI
iD D x
( )
+ ⋅ + ⋅ ⋅γ γ 990 91 91+ + +η λ εi i
152 Global Integration and Technology Transfer
History Number of firms Share of total
Always exported 1,118 53.1Entrants 252 12.0Entered in 1989 79 3.8Entered in 1990 67 3.2Entered in 1991 63 3.0Entered in 1992 43 2.0
Exiters 113 5.4Exited in 1989 26 1.2Exited in 1990 15 0.7Exited in 1991 36 1.7Exited in 1992 36 1.7
Switchers 279 13.3Never exported 343 16.3
TABLE 7.9 Export Histories
Source: Author.

again imply that second and higher lags of firm performance and exports interactedwith the various indicator variables are available as instruments in each period. Notethat there is no variation in twice-lagged exports of entrants for t = 1990 (sinceexports in 1988 are by definition zero for this group of firms). For this reason, I canestimate this specification only for t = 1991 and t = 1992.
The results of this more general specification are presented in table 7.10 for thethree measures of firm performance. For comparison purposes, the first panelpresents the results of re-estimating the restricted model in equation (7.1) over theperiod 1991–92. These results are quite similar to those obtained for the fullperiod. The lower panel allows the coefficient on lagged exports to vary with theexport history of the firm. The most striking result that emerges is that learningeffects are consistently positive and significant only for established exporters.Among entrants, there is weakly significant evidence that lagged exports are asso-ciated with lower current productivity, consistent with the view that entry intoexport markets is initially costly.
It is somewhat puzzling that learning effects seem to be most pronouncedamong established exporters—firms that report positive exports in all five years of
Exports and Economic Performance 153
Labor Total factor Variable productivity productivity Unit costs
Restricted modelLagged performance 0.811∗∗∗ (0.134) 0.474∗∗∗ (0.046) 0.195∗∗∗ (0.039)Lagged exports 1.188∗∗∗ (0.254) 0.227∗∗ (0.101) −0.687∗∗∗ (0.150)Unrestricted modelLagged performance 0.778∗∗∗ (0.145) 0.469∗∗∗ (0.046) 0.196∗∗∗ (0.039)Lagged exports
in entrants −5.428∗ (3.153) −1.082 (0.667) −0.275 (0.579)Lagged exports
in exiters 0.982 (2.974) 0.236 (1.353) 0.094 (1.758)Lagged exports in
established exporters 1.477∗∗∗ (0.295) 0.293∗∗∗ (0.110) −0.688∗∗∗ (0.164)Lagged exports
in switchers 0.735 (0.743) 0.151(0.309) −.801∗ (0.414)
TABLE 7.10 Basic Model Controlling for Export Histories
Source: Author.
Note: Model estimated for 1991–92, using second lags of firm performance and exports as instruments.∗Significant at the 10 percent level.∗∗Significant at the 5 percent level.∗∗∗Significant at the 1 percent level.
the sample. This runs counter to the common intuition that new entrants toexport markets should benefit most from exposure to the competitive pressures ofglobal markets. One possible explanation for this relies on the structure of China’strade and foreign exchange institutions, which may have given the exporting firmsin the sample preferential access to foreign exchange.14 If this foreign exchangewas used to purchase better quality imported capital goods and other inputs, itmay account for the association between exports and enterprise performancedocumented above. However, this explanation is not entirely convincing duringthe sample period of the late 1980s and early 1990s, at which time a foreignexchange swap market was relatively well established.
Another explanation may simply be that the classification of “establishedexporters” is misleading. If many of these firms began exporting shortly before thebeginning of the sample period in 1988 and if learning from exporting occurs forseveral years after breaking in to export markets, then the learning effects observedin the sample may be representative of those experienced by new entrants intoexport markets.
Conclusions
This chapter examines whether firms learn from exporting, in the sense that pastexports lead to improvements in current firm performance. In contrast to thefindings of other authors for different countries, I find that in this sample of Chineseindustrial enterprises, past exports are significantly associated with higher laborproductivity, higher TFP, and lower unit costs, suggesting that firms do reap effi-ciency benefits from exporting. It is particularly interesting to note that these size-able learning effects are present in a sample consisting primarily of state-ownedenterprises, which have been widely viewed as being slow to respond to and bene-fit from China’s move to a more market-oriented economy.
These results raise a number of questions for future research. Although thecorrelation between past exports and current firm performance provides interest-ing and suggestive evidence of learning from exporting, it is less clear what exactlyfirms are learning, from whom, and how. Do firms become better at producingtheir outputs (perhaps thanks to supplier specifications provided by their clients),or do firms simply learn to be better exporters (as they develop familiarity withexport markets and distribution channels)? Do the benefits of learning accruesolely to the exporting firm, or are there external effects from one firm’s exports toanother’s performance? How long does it take for the benefits of exporting toappear? Answers to these questions will require more detailed investigation andbetter data with longer time-series coverage on the precise nature of exportingfirms’ relationships with their clients and with one another.
154 Global Integration and Technology Transfer

Exports and Economic Performance 155
Chapter 7 Annex A:Data Construction
The variables used in the chapter were constructed as follows. Gross output valueand materials consumption in current prices are taken directly from the originaldata set, and their constant 1990 values are obtained using the gross output andmaterials deflators for state industry reported in table 3 of Jefferson, Rawski, andZheng (1996). Employment is defined as the period-average workforce, and noattempt is made to adjust for nonproduction workers. Capital input is measuredas the net value of fixed assets, as reported in the data set. This constitutes a veryrough measure of capital, particularly because it is likely that firms simply cumu-late undeflated annual investments to arrive at this stock.
Total factor productivity is constructed as
(7A.1)
where tfpijt, qijt, kijt, nijt, and mijt represent TFP, gross output, capital input, laborinput, and materials input of firm i in sector j, respectively. The output elasticitiesfor labor and materials in sector j at time t,anjt , and amjt , are measured as the cur-rent price ratios of wages (including bonuses) and materials to gross output inthat sector and year. The capital output elasticity is measured as one minus theother two elasticities. Unit costs are constructed as sales revenues divided by costof goods sold, in current prices.
Constructing export to gross output ratios is complicated by the fact that thedata report exports in current prices for certain years and in constant prices forother years. For 1988–90 I take the ratio of exports to gross output at 1980 prices,while for 1991–92 I use the current price ratio. While this splicing of two differentmeasures is undesirable, it may not be too serious. For 1990 it is possible to con-struct both the current and constant 1980 price ratios, and the correlation acrossfirms in this ratio is very high (0.97).
The original data set consists of 7,252 firms. Restricting the sample to thosefirms with a complete time series on all variables of interest reduces the sample byabout two-thirds. The sample of remaining firms was reduced to the final sampleof 2,105 firms by eliminating firms with obvious coding errors or other extremeoutliers in the variables of interest.
tfp q k n mijt ijt ijtkjt
ijtnjt
ijtmjt= ⋅ ⋅ ⋅( )−α α α 1
,

Notes
1. See, among others, Chen and Tang (1987) (Taiwan [China]); Haddad (1993) (Morocco); Aw andHwang (1995) (Taiwan [China]); Bernard and Jensen (1995) (United States); and Djankov and Hoekman(1997) (Bulgaria).
2. See Clerides, Lach, and Tybout (1998) for examples and a theoretical model.3. There is a vast literature on estimating the productivity performance of Chinese enterprises
(see Jefferson, Rawski, and Zheng 1992 for an overview). This literature is concerned primarily withthe effects of China’s incremental reforms on the productivity performance of state- and nonstate-owned enterprises. The papers by Perkins (1996, 1997) are among the few studies in this literature thatexplicitly consider the role of exports at the firm level. He concludes that exporting firms enjoy higherproductivity. Using city-level data, Wei (1993) finds that exports are associated with higher growth.
4. The model estimated by Clerides, Lach, and Tybout (1998) allows for individual effects butrequires them to be independent of explanatory variables, such as lagged exports. They address theproblem of persistence and self-selection by jointly estimating a system that regresses firm perform-ance on lagged performance and a sequence of lagged dummy variables indicating export market par-ticipation and using a probit equation to describe the decision to participate in export markets.Although the joint estimation of the performance and participation equations will yield more efficientestimates than the single-equation instrumental variables estimator employed here, it requires morerestrictive distributional assumptions on the disturbances and individual effects. The evidence on cau-sation from exports to firm performance in Bernard and Jensen (1995) consists of regressions ofemployment growth and wage growth on initial export status, controlling for observable firm charac-teristics. Initial export status is a poor predictor of wage growth, but it has some explanatory power foremployment growth. This specification is subject to both of the concerns mentioned above.
5. Specifically, I report the coefficients on dummy variables for exporters and nonexporters in across-sectional regression of firm size on these variables and a set of industry, provincial, and owner-ship dummies for each year in the sample.
6. It is well known that measures of TFP constructed in this simple manner will overstate pro-ductivity if there are increasing returns or firms have market power. Since I will be identifying learningeffects from the within-firm variation in firm performance, these concerns are relevant only if thereare changes in the extent of increasing returns or firms’ market power varies over time and these meas-ures are correlated with export activity in the right way. It seems reasonable to think of the extent ofincreasing returns as a fairly stable feature of technology that is unlikely to vary much over time. It is,however, possible that firms’ market power declines as firms break into export markets, as they are lessable to charge mark-ups over unit costs. As a result, export market participation may be associatedwith declines in measured TFP. This will have the effect of obscuring, rather than exaggerating, anylearning effects on this measure of firm performance.
7. See Jefferson, Rawski, and Zheng (1992, 1996) and Woo and others (1993, 1994) for a review ofthese issues. In this chapter I use deflators for output and materials advocated by Jefferson, Rawski andZheng (1992, 1996). These deflators are based on indexes of factory-gate prices of industrial productsand material inputs rather than the implicit gross output deflator.
8. I use a dynamic panel instrumental variables estimator proposed by Arellano and Bond (1991).For applications of this technique to cross-country growth regressions, see, for example, Caselli,Esquivel and Lefort (1996) and Easterly, Loayza, and Montiel (1996).
9. That is, I regress each variable on a set of time dummies interacted with a set of ownershipdummies and retrieve the residuals from this regression as deviations from period- and ownership-specific means.
10. Only if exports depend on future performance will this identifying assumption be invalid. Inthis case, only sufficiently lagged exports will be valid instruments.
11. To allow for the possibility that exports depend on one-period ahead productivity, I also esti-mated the specification using thrice-lagged variables as instruments. This yielded similar results, witheven larger and more significant learning effects.
156 Global Integration and Technology Transfer

12. See Blundell and Bond (1998) for a discussion of these issues and possible remedies.13. Clearly, since I do not have a full export history for every firm but only five years of data, this
categorization may misclassify some firms. For example, some firms that are identified as always hav-ing exported may have entered export markets in 1987 and hence should be classified as entrants.
14. During the 1980s, trade and foreign exchange continued to be subject to considerable regula-tion. Firms were subject to foreign exchange surrender requirements and had to rely on planned allo-cations of foreign exchange to finance imports. However, beginning in the early 1980s, firms wereallowed to retain limited amounts of above-quota foreign exchange for their own use. See World Bank(1994) for details.
References
Arellano, M., and S. Bond. 1991. “Some Tests of Specification for Panel Data: Monte Carlo Evidenceand Application to Employment Equations.” Review of Economic Studies 58 (1): 277–97.
Aw, B.Y., and Hwang, A.R. 1995. “Productivity and the Export Market: A Firm-Level Analysis.” Journalof Development Economics 47 (2): 313–32.
Bernard, A., and J.B. Jensen. 1995. “Exporters, Jobs, and Wages in U.S. Manufacturing: 1976–87.”Brookings Papers on Economic Activity Microeconomics 67–119, Washington, DC.
———. 1999a. “Exceptional Exporter Performance: Cause, Effect or Both?” Journal of InternationalEconomics 47 (1): 1–25.
———.1999b.“Exporting and Productivity.” School of Management, Yale University, New Haven, CT.Blundell, Richard, and Stephen Bond. 1998. “Initial Conditions and Moment Restrictions in Dynamic
Panel Data Models.” Journal of Econometrics 87 (1): 115–43.Caselli, F., G. Esquivel, and F. Lefort. 1996. “Reopening the Convergence Debate: A New Look at Cross-
Country Growth Empirics.” Journal of Economic Growth 1 (3): 363–89.Chen, T., and D. Tang. 1987. “Comparing Technical Efficiency between Import-Substitution-Oriented
and Export-Oriented Foreign Firms in a Developing Economy.” Journal of Development Economics26 (2): 277–89.
Clerides, S., S. Lach, and J. Tybout. 1998. “Is Learning by Exporting Important? Micro-DynamicEvidence from Colombia, Mexico and Morocco.” Quarterly Journal of Economics 103 (3):903–48.
Djankov, Simeon, and Bernard Hoekman. 1997. “Trade Reorientation and ProductivityGrowth in Bulgarian Enterprises.” Policy Research Working Paper 1708, World Bank, Wash-ington, DC.
Easterly, W., N. Loayza, and P. Montiel. 1996. “Has Latin America’s Post-Reform Growth Been Disap-pointing?” Research Department, World Bank, Washington, DC.
Haddad, M. 1993. “How Trade Liberalization Affected Productivity in Morocco.” Policy ResearchWorking Paper 1096, World Bank, Washington, DC.
Jefferson, G., T. Rawski, and Y. Zheng. 1992. “Growth, Efficiency, and Convergence in China’s State andCollective Industry.” Economic Development and Cultural Change 40 (2): 239–66.
———. 1996. “Chinese Industrial Productivity: Trends, Measurement Issues and Recent Develop-ments.” Journal of Comparative Economics 23 (1): 146–80.
Perkins, F.C. 1996. “Productivity Performance and Priorities of the Reform of China’s State-OwnedEnterprises.” Journal of Development Studies 32 (3): 414–44.
———. 1997. “Export Performance and Enterprise Reform in China’s Coastal Provinces.” EconomicDevelopment and Cultural Change 45 (3): 501–39.
Wei, S.J. 1993. “Open Door Policy and China’s Rapid Growth: Evidence from City-Level Data.” Work-ing Paper 4602, National Bureau of Economic Research, Cambridge, MA.
Woo, W.T, W. Hai, Y. Jin, and G. Fan. 1993.“The Efficiency and Macroeconomic Consequences of ChineseEnterprise Reform.” China Economic Review 4 (2): 153–68.
Exports and Economic Performance 157

158 Global Integration and Technology Transfer
———. 1994. “How Successful Has Chinese Enterprises Reform Been? Pitfalls in Opposite Biases andFocus.” Journal of Comparative Economics 18 (3): 410–37.
World Bank. 1994. “China: Foreign Trade Reform.” Washington, DC.———.1996. “China: Fighting Inflation, Deepening Reforms.” Washington, DC.———.1997. “China: Development Challenges in the New Century.” Washington, DC.

Part III
Foreign directinvestment,
technologytransfer, andproductivity


Foreign Investmentand Productivity Growth
in Czech Enterprises
Simeon Djankov and Bernard Hoekman
161
8
A rich case study literature documents how firms and industries adopt new tech-nologies and know-how. It points to the vital role of imports and openness to trade,both for learning through re-engineering and direct inputs into production andthrough communications with and information from foreign partners (suppliers andbuyers). Using aggregate data, a number of studies have concluded that trading withcountries that are relatively R&D intensive leads to higher productivity growth ofdomestic industry (Coe and Helpman 1995; Coe, Helpman, and Hoffmaister 1997).While these findings are not inconsistent with the endogenous growth literature, theydo not reveal much about how technology transfer occurs.
The microeconomic literature has emphasized three channels for the internationaltransmission of technology: imports of new capital and differentiated intermediategoods (Feenstra, Markusen, and Zeile 1992; Grossman and Helpman 1995); learningby exporting (Clerides, Lach, and Tybout 1998); and foreign investment (Blomströmand Kokko 1997).Attention has centered on the role of foreign investment as a chan-nel of knowledge transfer and on the spillovers of know-how to other firms in theeconomy. Foreign investment should be associated with the transfer of knowledge,since by definition it is driven by the existence of intangible assets owned by the parentfirm (Markusen 1995). The conventional wisdom is that foreign investment is a majorchannel of technology transfer to developing countries. Pack and Saggi (1997) note
This chapter originally appeared in the World Bank Economic Review 2000, 14 (1): 49–64. The authors
are grateful to Magnus Blomström, Caroline Freund, Ann Harrison, Roberto Rocha, Jim Tybout, and
three anonymous referees for helpful comments and suggestions.

that intrafirm transactions in royalties and license fees between parent firms and sub-sidiaries account for more than 80 percent of total global flows.
What matters for economic growth are the spillovers to firms within and acrossindustries, evidence on which is much less robust. The case study literature hasargued that positive spillovers are significant. It has also documented the impor-tance of the availability of local skills and in-house technological capacity in adapt-ing and using techniques developed elsewhere (Lall 1992; Evenson and Westphal1995). Microeconometric studies using panel data sets of enterprises have come tomore ambiguous conclusions. Some analysts have found a statistically significantnegative relationship between the size of foreign investment in an industry or econ-omy and the productivity performance of domestic firms (see, for example, Harrison1996; Haddad and Harrison 1993).
This chapter investigates the impact of foreign investment on productivity per-formance of firms in the Czech Republic during the initial postreform period(1992–96).1 It distinguishes between firms that established partnerships with foreignfirms—through either a joint venture or the direct sale of a majority equity stake—and those that did not and asks whether total factor productivity (TFP) growth ratesof these groups of firms differ. TFP is used as an indirect measure of technology trans-fer. Data constraints prohibit using more direct measures, such as R&D effort or theturnover of managers and highly skilled labor. Our results suggest that TFP growth ishigher in firms with foreign partnerships and that there is a clear hierarchy: firms thathave been acquired by foreign owners have the highest TFP growth, followed by firmsinvolved in joint ventures. Firms without foreign partnerships have the lowest TFPgrowth as a group. This result continues to obtain if an adjustment is made for thehigher initial level of productivity observed in firms that attract foreign participation.
We find a statistically significant negative spillover effect of foreign participationin an industry (through joint ventures and foreign direct investment [FDI]) on firmswithout such links. This finding is consistent with the results of Aitken and Harrison(1999) for Colombia and Haddad and Harrison (1993) for Morocco. It suggests thatalthough foreign ownership or collaboration had a beneficial impact on the per-formance of the domestic partners, this benefit did not spill over to the rest of theindustry in the time period studied. In part, this result may simply reflect the factthat in a transition economy like the Czech Republic, the amount of time required toindependently adapt and learn to apply more efficient techniques is longer than thefour years for which we have data. The result should also be interpreted in light of thefact that on average firms with foreign partnerships account for almost 50 percentof total assets and more than 40 percent of total employment in our sample. If theanalysis of spillovers is restricted to the impact of FDI (foreign majority ownership)on the rest of the industry, the spillover effect remains negative, but it becomes muchsmaller and is no longer significant. This is likely to reflect not only the fact that joint
162 Global Integration and Technology Transfer

venture firms have higher TFP growth than firms without any foreign partnershipsbut also the fact that know-how spillovers from FDI require a minimum level of tech-nological capacity and effort to be absorbed. Survey data on training and investmentin technologies suggests that many domestic firms may have relatively weak capacitiesin this regard compared with firms with joint ventures. This illustrates the importanceof taking into account differences in the characteristics of firms in each industry, inparticular their endowment of technological abilities and investments in upgradingthat ability (as proxied, for example, by the level of R&D spending).
Channels of Technology Transfer
While there is little doubt that technologies make their way across internationalboundaries, the mechanisms through which this occurs are not well understood.Withthe exception of case studies,most of the empirical evidence is based on aggregate dataor cross-sectional surveys and is subject to multiple interpretations. Various trans-mission channels may play a role in the technology transfer process. New technologiesmay be embodied in goods and transferred through imports of new varieties of dif-ferentiated products or capital goods and equipment or through arm’s length trade inintellectual property (for example, licensing contracts). Firms may learn about tech-nologies by exporting to knowledgeable buyers who share product designs and pro-duction techniques with them. Technology transfer will also occur in the context offormal cooperative arrangements between foreign and local firms, through, for exam-ple, FDI (acquisition) or project-specific joint ventures.2 In all these cases, technologyacquisition will require the availability of workers with appropriate training andexpertise to allow technology absorption and adaptation. The absence of such acapacity is often held to explain why TFP is frequently lower in developing countriesfirms than in industrial nations even if identical equipment is utilized (Pack 1987).
It is helpful to differentiate between technology transfers that are realized in the con-text of formal cooperative arrangements between a foreign and a domestic firm andthose that occur at arms length.Arm’s length transactions, which include arm’s lengthtrade in machinery and components and direct purchases of knowledge (payment forpatents, blueprints, and so forth), can be a major avenue of technology transfer.However, not all technologies are available at arms length. Many may be obtainableonly through formal cooperation—either majority ownership (acquisition) or project-specific joint ventures.3 In theory, firms will be adverse to unbundling and sellingknow-how or products if there are important internalization incentives. In this case,FDI may be the preferred route to exploit knowledge advantages (Markusen 1995).
Foreign investment is likely to be associated with transfer of both hard tech-nologies (machinery, blueprints) and soft ones (management, information). It willhave two dimensions: “generic” know-how, such as management skills and quality
Foreign Investment and Productivity Growth in Czech Enterprises 163

systems, and specific know-how, such as enforcement of intellectual property rights,that cannot be obtained at arms length because of weaknesses in the existing policyenvironment or internalization incentives.4 Regarding weaknesses in the policy envi-ronment, foreign partners may reduce the cost of upgrading and learning by helpingidentify and implement systems that ensure that production meets technical spec-ifications, is delivered on time, and meets other customer needs. Interviews by theauthors with managers of enterprises with foreign partnerships suggest that all ofthese dimensions are prevalent in the Czech Republic. But more important is pre-sumably the access to unique parent firm–specific information, as well as productionand distribution networks.
A question is whether and to what extent the knowledge “transferred” by multi-nationals to affiliates diffuses to other firms in the industry.5 Theoretical models offoreign investment suggest there should be a positive relationship between FDI anddiffusion. Know-how will diffuse from firm to firm through demonstration effects,labor turnover, or reverse engineering.
Das (1987) models a foreign subsidiary as a price leader and domestic firms as acompetitive fringe. If learning by domestic firms is proportional to the output of themultinational firm—that is, the larger the multinational is relative to the domesticindustry, the easier the learning—this creates incentives for a firm to transfer tech-nology to its subsidiary, as profits are higher if more advanced technology is used.The greater output of the subsidiary then induces domestic firms to learn andadopt the foreign technology at a higher rate.
Wang and Blomström (1992) use a similar set-up, but they endogenize both thelevel of technology transfer from the parent company to the subsidiary and theinvestment in learning activities by the domestic firm. Foreign firms transfer tech-nology at a higher rate if domestic firms invest more in the learning activities.Blomström, Kokko, and Zejan (1994) find some empirical support for this prediction.
The empirical evidence on spillovers from foreign-owned affiliates to indigenousfirms is mixed (Blomström and Kokko 1997).An extensive case study literature seeksto determine whether spillovers from R&D exist and how large they are. Much of thisliterature focuses on industrial countries.6 The literature on developing countries hasdocumented that the magnitude of potential knowledge spillovers depends on theexistence of technological capabilities allowing the assimilation of know-how byindigenous firms (Pack and Westphal 1986). A unique feature of many transitioneconomies is that technological ability is substantially greater than in most developingcountries. In principle, this should facilitate adoption of new technologies and allowrapid convergence toward best practice.
Much of the econometric literature has focused on productivity measures as aproxy measure of technology diffusion. Early studies, such as Blomström and Persson(1983), using industry-level data, found that domestic labor productivity is positively
164 Global Integration and Technology Transfer

influenced by foreign presence in an industry, measured by the foreign share ofindustry employment. More recent studies using firm-level data are less supportiveof the existence of spillovers. Aitken and Harrison (1999) and Haddad and Harrison(1993) find that foreign investment has a negative effect on the performance ofdomestically owned firms. Harrison (1996) suggests that in imperfectly competitivemarkets, entry by foreign investors implies that domestic incumbents lose marketshare, which impedes their ability to attain scale economies. The negative spilloverresults contrast with the findings of the case study–based literature and may to someextent reflect the omission of important variables, such as the level of R&D spending,expenditures on training, and the magnitude of employment of personnel withtechnical degrees (engineers, scientists).7
The analysis in this chapter relies on the estimation of production functions andthe use of TFP as a proxy measure for technology transfer. Our reliance on TFP asthe dependent variable assumes that the adoption of new technologies will, withsome lag, lead to an improvement in productivity. A serious problem with thisassumption is that the case study literature has documented that such productivityimprovements depend on the technological abilities of domestic firms. Nelson andPack (1998) have demonstrated that the production function methodology canunderestimate or ignore the role of technological effort at the level of the firm andthus affect TFP growth estimates. Differences in technological capacity across firmsin an industry may be an important determinant of TFP performance, but there is noinformation on this at the level of the firm, as firm-level data on technology-relevantvariables such as R&D expenditure or the composition of the workforce are notavailable. However, the Czech Republic is not a developing country—it has a long-standing industrial base and is well-endowed with engineering and scientifichuman capital. For the economy as whole, therefore, the capacity to rapidly upgradeproductive efficiency through the adoption of best-practice techniques (both hardand soft) should be considerable. This makes the Czech case less relevant as a com-parator for developing countries that do not have equivalent endowments.
Profile of Czech Firms
Information on Czech enterprises was compiled for the 1992–97 period from surveys,using a questionnaire prepared by the authors and a database containing financialand ownership information. Financial variables were defined using internationalaccounting standards from the onset of the survey in 1992. The database includes513 firms that are quoted on the Prague Stock Exchange, whose shares traded at leastfour times in a given year, and that report the financial information required. Of thesample firms, 340 did not establish joint ventures or attract FDI, 91 concluded jointventures with foreign companies,and 82 attracted majority foreign equity investment.
Foreign Investment and Productivity Growth in Czech Enterprises 165

Thus 34 percent of the sample (173 firms) had a foreign link(either a joint ventureor FDI, with relatively uniform distribution across sectors (table 8.1).
The criterion used in the sample to determine the existence of a foreign partner-ship or ownership relationship was that at least 20 percent of the equity was ownedby a single foreign entity or that the firm had established one or more joint ventureswith a foreign partner. Because minority shareholders have little protection underCzech law, equity investors have an incentive to take a majority stake. Most firms withforeign equity ownership in the sample are majority foreign owned. While the shareof firms with foreign linkages appears high, it is representative of Czech industry.Aggregate statistics using a 5 percent or more foreign equity ownership share as acriterion reveal that during the 1994–97 period, 42 percent of all manufacturing
166 Global Integration and Technology Transfer
TABLE 8.1 Descriptive Statistics of the Sample
Number Type of foreignSample of foreign partner (FDI or
Sector size partners joint venture)
Mining 11 8 3Construction 82 55 27Food and beverages 54 36 18Textiles and apparel 39 28 11Furniture and other
wood products 11 5 6Pulp and paper 14 10 4Printing and publishing 13 6 7Chemicals 30 18 12Shoes and leather
products 6 5 1Nonmetallic mineral
products 21 16 5Basic metals 13 9 4Fabricated metal
products 24 12 12Electric and electronics 82 54 28Transport equipment 12 5 7Other manufacturing 10 6 4Retail services 15 11 4Financial services 76 56 20
Number of observations 513 340 173Share of total (percent) 100.0 66.3 33.7
Source: Authors.

Foreign Investment and Productivity Growth in Czech Enterprises 167
FIGURE 8.1 Labor Productivity of Czech Firms with and withoutForeign Partners, 1991
firms with more than 10 employees were involved in some kind of foreign partner-ship (Czech Statistical Office 1997).
Firms with foreign partnerships tend to be significantly larger than firms thatremain independent: the median level of total employment is 689 in firms withFDI, 578 in firms with joint ventures, and 352 in firms without foreign links. Foreignaffiliates or joint ventures also have higher levels of initial labor productivity,measuredas sales per worker in 1991 (figure 8.1). This suggests that foreign investors areattracted to firms with above-average performance and size.
Average TFP growth performance is also highest in firms with FDI, followed byfirms with joint ventures and domestic enterprises (figure 8.2). This may reflect thebetter than average initial level of productivity, suggesting that foreign investorschoose the “best” firms as partners. In the statistical analysis, we therefore correctfor the possibility of selection bias. The magnitude of TFP growth rates is highestin the earlier years and tapers off toward the end of the sample period. This reflectsa marked deterioration in macroeconomic conditions in 1996, a common effect forall firms. TFP growth rates initially diverge substantially, with firms with foreigninvestment increasing growth while other firms experience a reduction in TFPgrowth rates. Thereafter some convergence occurs, suggesting that spillover effectsmay be occurring toward the end of the period.
Questionnaires administered in early 1997 suggest that both joint ventures and FDIare associated with technology transfers (figure 8.3). Two questions concerned training
100
150
200
250
initial productivity (sales per worker)
koru
ny, t
hous
ands
no foreign partner joint ventures FDI

and acquisition of new technologies.Managerial responses clearly reveal what appearsto be a significant difference between firms with and without foreign partnerships.Thefirst question was,“Have your workers undergone any training in the last two years?”Managers were given discrete choices of yes or no. In firms without foreign partners,only 18 percent replied in the affirmative, while 47 percent of joint ventures and60 percent of firms with FDI indicated that their workers answered positively.
168 Global Integration and Technology Transfer
FIGURE 8.2 Total Factor Productivity Growth in Czech Firmswith and without Foreign Partners, 1992–96
2
4
6
8
10
1992–93
med
ias
TF
P g
row
th, p
erce
nt
1993–94 1994–95 1995–96
joint venturesno foreign partner FDI
FIGURE 8.3 Training and New Technology in Czech Firmswith and without Foreign Partners
10
20
30
40
50
60
70
80
perc
ent o
f firm
s
training technology
no foreign partner joint ventures FDI

The second question was whether new technology (machinery, equipment) orrelated know-how had been obtained in the previous two years.Foreign investment wasagain associated with substantially greater positive responses—in more than 70 percentof the firms with FDI and 50 percent of the joint ventures, the partner had acquiredsome kind of new technology; for firms with no foreign linkages, the figure was just35 percent. The difference between the two sets of firms is greater on the training vari-able (“software”) than on the technology (“hardware”) variable.These figures illustratethat although firm-level data on technological effort are not available, foreign part-nerships are associated with greater investments in training and knowledge acquisition.
Estimation Procedure
We estimate production functions for the firms included in the sample. Each firmi has a production function for gross output:
Yi = Fi(Li, Mi, Ki, Ti), (8.1)
where Y is gross output; K, L, and M are inputs of capital, labor, and materials; andT indexes technology. The firm’s production function, F, is homogeneous of degreeg (g ≠ 1) in K, L, and M. Firms are assumed to be price takers on factor markets butmay have market power in output markets. The price taker assumption is reasonable,since wages were largely set centrally during the sample period and most materialswere bought abroad at world prices.
The production function in equation (8.1) implies the following relation betweenmarginal physical products and outputs:8
(8.2)
where is the marginal product of input J. The optimal choice of inputs by a firmwith some monopoly power implies
(8.3)
where PJi is the price of factor J, Pi is the price of the firm’s output, and is the mark-up of price over marginal cost: where MCi is marginal cost. Combiningequations (8.2) and (8.3) yields
(8.4)
where sJi = Pji Ji /PiYi are the expenditures on each factor Ji relative to total enterpriserevenues. Since firms do not necessarily produce under constant returns to scale,the sum of these shares is not always unity. Using equation 8.4, the revenue shareof capital can be defined as
(8.5)s s s s gKi Li Mi Ki i i= − − = + −1 1( )./µ
s s s gLi Mi Ki i i+ + = /µ ,
µi i iP MC= / ,
µi
P F Pi Ji
i Ji= µ ,
FJi
F L F M F K g YLi
i Mi
i Ki
i i i+ + = ,
Foreign Investment and Productivity Growth in Czech Enterprises 169

The productivity equation can then be derived from equation (8.1) as
(8.6)
where dyi is output growth and measures the technology change or TFPgrowth. The second term on the right-hand side can be simplified to (gi – )dki usingequation (8.5). Equation (8.6) is estimated in log-differences, using actual enterprise-level data to construct the first right-hand-side term. There are two terms to estimatefor each industry (gi and the scale and mark-up parameters), as well as the TFPparameter for each enterprise.We use the reported book value of fixed assets to con-struct the capital revenue share.
To take into account the likelihood that foreign investment choices are not ran-domly distributed—the descriptive statistics reported in table 8.1 suggest that firmsattracting FDI and joint ventures have above-average initial performance—we correctfor the possible endogeneity of foreign investment choices by using the generalizedHeckman two-step procedure for correcting sample selection bias, as developed byAmemiya (1984).The procedure involves separately estimating the foreign investmentdecision and the subsequent firm productivity growth performance. The first stepuses a probit model to determine the probability of foreign investment based oninitial efficiency (proxied by the share of variable costs in total revenues), firm size,and type of industry. The second step involves an estimation using only observationson firms with foreign linkages. This results in an omitted variable sample selectionbias. The Amemiya procedure provides for a specification of the omitted variable thatcan be used in the full sample to alleviate sample selection.An additional variable esti-mated in the first step is included in the second-step regression.
Since the primary focus here is to test the association between productivity growthand foreign investment, we augment equation (8.6) by including a dummy for firmswith foreign partners as an additional “factor of production.”The dummy (FOREIGN)is 1 if a firm had either FDI or a joint venture in the preceding year and 0 if otherwise.This approach is similar to the empirical design used in Harrison (1994). In addition,the effects of other changes in the economic environment have to be controlled for.Wedo not have good proxies for these changes, nor can we account individually for eachof them. Instead, we include annual dummies in the estimating equation that pick upthe net effects of changes in the economic environment at the aggregate level.
We are also interested in investigating whether there have been any spillovereffects from foreign investment on other firms that operate in the same sectors butdo not have foreign partners. To analyze this, we run equation (8.6) on local firmsonly and include as an additional independent variable (SPILLOVER), the share ofassets of firms with FDI or joint ventures in total assets of all firms in each sector.If foreign participation has beneficial spillover effects on other firms, we wouldexpect the coefficient to be positive.
µi ,
µi
( )F T F dtTi i
i/
dy s dl s dk s dm s si i Li i Ki i Mi i i Ki Ki= + + + −µ µ[ ] [ ]) )
dkF T
Fdti
Ti
ii i+ ,
170 Global Integration and Technology Transfer

Because of the probable correlation between productivity effects and the inde-pendent variables, ordinary least squares (OLS) may give biased and inconsistentestimates. This simultaneity problem is endemic to the empirical literature on pro-ductivity measurement. We address the issue by using F-tests to reveal whether OLSis appropriate and relying on the Hausman specification test to choose betweenrandom or fixed effects frameworks in cases where OLS should not be used. Thesetests suggest that a random effects model is most appropriate.9 Coefficient estimatesfor the major coefficients or variables of interest as well as information on the share ofassets of firms with either joint ventures of FDI in total assets (48 percent) and theshare of firms with majority foreign ownership (19 percent) are reported in table 8.2.
Foreign Investment and Productivity Growth in Czech Enterprises 171
TABLE 8.2 Revenue Shares of Inputs, Mark-Up, and ScaleEstimates by Sector
Share of Shareforeign of FDI
Sector Sm Sl Sk mi gi assets assets
Mining 0.538 0.215 0.246 1.246 1.200 0.398 0.124Construction 0.720 0.169 0.111 1.137 1.088 0.432 0.325Food and beverage 0.629 0.206 0.165 1.388 1.264 0.635 0.311Textiles and apparel 0.677 0.180 0.142 1.284 1.132 0.294 0.182Furniture and other
wood products 0.743 0.145 0.110 1.152 1.001 0.542 0.261Pulp and paper 0.791 0.129 0.079 1.211 1.113 0.715 0.521Printing and
publishing 0.730 0.136 0.133 0.889 0.992 0.885 0.605Chemicals 0.757 0.151 0.091 1.201 1.163 0.547 0.281Shoes and leather
products 0.612 0.224 0.162 1.182 1.119 0.128 0.000Nonmetallic mineral
products 0.615 0.191 0.193 0.958 0.996 0.408 0.241Basic metals 0.702 0.155 0.142 1.211 0.880 0.367 0.134Fabricated metal
products 0.733 0.121 0.145 1.192 1.100 0.785 0.191Electric and electronics 0.657 0.191 0.151 1.201 1.039 0.356 0.110Transport equipment 0.687 0.117 0.195 1.272 1.070 0.428 0.127Other manufacturing 0.594 0.171 0.233 — — 0.524 0.229Retail services 0.257 0.453 0.289 1.352 1.198 0.402 0.221Financial services 0.190 0.609 0.200 1.079 1.324 0.368 0.141
Average 0.625 0.209 0.164 1.184 1.104 0.483 0.191
Source: Authors.
Note: — = not available.

Results
The results of estimating equation (8.6) are reported in table 8.3, using both OLSand a random effects specification. The estimated coefficient on the dummy forFDI is positive and statistically significant for both specifications. This suggests that,as predicted, foreign investment involves an additional “transfer of technology.”Thedummy for joint ventures also has a positive sign, but it is slightly smaller in mag-nitude and is not statistically significant.
The possibility of a positive spillover impact of foreign investment is consideredby including the share in total assets of firms with foreign partners (lagged one year)as a separate regressor (table 8.4). This is a continuous, not a categorical, variable. Asnoted previously, this approach assumes that spillovers are sector specific and there-fore ignores possible interindustry spillovers. Contrary to what is predicted, spilloversare negative: greater foreign participation in an industry has a statistically significantnegative effect on the performance of other firms. Each 10 percent increase in the for-eign asset share is associated with a 1.7 percent fall in sales growth of domestic firms.
172 Global Integration and Technology Transfer
Dependent variable: Growth in sales OLS Random effects
Amemiya selection bias correction variable Yes YesSector-specific returns to scale and mark-ups Yes YesFDI dummy 0.015∗∗ 0.015∗
(2.011) (1.937)JV dummy 0.011 0.010
(1.372) (1.286)Dummy for 1994 −0.012∗ −0.011
(−1.873) (−1.672)Dummy for 1995 −0.052∗∗ −0.052∗∗
(−7.034) (−6.942)Dummy for 1996 −0.054∗∗ −0.053∗∗
(−7.062) (−7.534)
F-test (A, B = Ai, B) 0.89Hausman test (random versus fixed effects) 25.66 (30.19)Adjusted R2 0.894 0.861
TABLE 8.3 Panel Regression Estimates (full sample)
Source: Authors.
Note: N = 513. Heteroskedasticity consistent (White correction); t-statistics are in parentheses, except forthe Hausman test, for which the parenthetical figure indicates the cut-off point. A constant term is includedin both regressions.∗Significant at the 10 percent level.∗∗Significant at the 5 percent level.

Foreign Investment and Productivity Growth in Czech Enterprises 173
It has been argued that spillovers from joint ventures should be higher than thosefrom FDI (establishment of majority-owned affiliates), as the foreign partner hasless ability to control the behavior of the domestic partner and the domestic part-ner has a greater incentive to pursue R&D itself (see, for example, Pack and Saggi1997). Internalization through FDI, in contrast, should offer greater opportunitiesto limit “technology leakage.” If this is indeed the case, it implies that excludingjoint ventures from the SPILLOVER measure of foreign “ownership” share and re-estimating the equation should increase the magnitude of the negative spillovers.
The evidence does not support this argument (table 8.5). The magnitude of thespillover effect becomes smaller and statistically insignificant, although it remainsnegative. Thus excluding joint ventures has an offsetting effect. In part, this reflectsthe fact that joint venture firms have higher TFP growth than firms without anyforeign partnerships, which raises the average of the non–FDI group. This resultillustrates that the initial negative spillover result may not be robust and that testsfor spillovers with the methodology used here (and in the literature more generally)require some assurance that in distinguishing between two subsets of firms in anindustry on the basis of whether or not there is majority foreign ownership (or,more generally, foreign linkages of some kind) one is not ignoring other importantdeterminants of the performance of firms.
Dependent variable: Growth in sales OLS Random effects
Amemiya selection bias correction variable Yes YesSector-specific returns to scale and mark-ups Yes YesSpillovers (share of assets of firms with joint −0.178∗ −0.172∗
ventures and FDI) (3.125) (2.054)Dummy for 1994 0.002 0.002
(0.215) (0.178)Dummy for 1995 −0.038∗ −0.037∗
(−4.201) (−3.934)Dummy for 1996 −0.036∗ −0.035∗
(−3.534) (−3.642)F-test 0.92
Hausman test (random versus fixed effects) 4.57 (14.45)Adjusted R2 0.887 0.843
TABLE 8.4 Spillover Effects on Firms without Foreign Linkages
Source: Authors.
Note: N = 340. Heteroskedasticity consistent (White correction); t-statistics are in parentheses, except forthe Hausman test, for which the parenthetical figure indicates the cut-off point. A constant term is includedin both regressions.∗Significant at the 5 percent level.

174 Global Integration and Technology Transfer
Dependent variable: Growth in Sales OLS Random effects
Amemiya selection bias correction variable Yes YesSector-specific returns to scale and mark-ups Yes YesSpillovers (share of assets of foreign affiliates −0.077 −0.074
in total assets of the sector) (1.425) (1.218)Dummy for 1994 0.003 0.002
(0.897) (0.178)Dummy for 1995 −0.032∗∗ −0.031∗∗
(−2.985) (−2.257)Dummy for 1996 −0.027∗ −0.025
(−1.847) (−1.514)F-test 0.91
Hausman test (random versus fixed effects) 4.13 (14.45)Adjusted R2 0.894 0.857
TABLE 8.5 Spillover Effects on Firms without FDI
Source: Authors.
Note: N = 431. Heteroskedasticity is consistent (White correction); t-statistics are in parentheses, except forthe Hausman test, for which the parenthetical figure indicates the cut-off point. A constant term is includedin both regressions.∗Significant at the 10 percent level.∗∗Significant at the 5 percent level.
One such determinant likely to be important is the technological effort offirms. The survey questionnaire revealed that joint venture firms invested signifi-cantly more in training and new technologies than pure “domestic” firms. It maybe that the technological ability and effort expended by many of the firms with-out foreign partners is too low to be able to absorb spillovers when they occur orthat the firms with foreign linkages have absorbed a significant share of the avail-able stock of labor with requisite skills. Given that FDI and joint ventures togetheraccount for significant shares of total assets, sales, and employment in the CzechRepublic, the potential for positive spillovers among firms with foreign partner-ships may be significant. It is suggestive that if “domestic” firms are excluded fromthe sample, FDI has a positive effect on firms with joint ventures, although thisis not statistically significant (the t-statistic is 1.42, possibly reflecting the smallsample size).
Account should also be taken of the short time frame on which the studyfocuses. Spillovers may require more time before they show up in TFP growth rates.And the absorption of new techniques requires significant in-house technologicaleffort, which may not be captured adequately by the production function method-ology used. Clearly, further research is required.

Concluding Remarks
Firm-level data for the Czech Republic during the 1992–96 period suggest that for-eign investment has the predicted positive impact on the TFP growth of recipientfirms. This result is robust to corrections for the sample selection bias that prevailsbecause foreign investment tends to go to firms with above-average initial produc-tivity performance. This result is not surprising, given that there is a presumptionthat foreign investors should be transferring new technologies and knowledge topartner firms. With some lag, this is likely to be reflected in greater TFP growth. FDIappears to have a greater impact on TFP growth than joint ventures, suggesting thatparent firms transfer more know-how (soft or hard) to affiliates than joint venturefirms obtain from their partners.
Taken together, joint ventures and FDI appear to have a negative spillovereffect on firms in each industry that do not have foreign partnerships. This effectis relatively large and statistically significant. However, if the focus of attention isrestricted to the impact of foreign-owned affiliates (firms with FDI) on all otherfirms in an industry, the magnitude of the negative effect becomes much smallerand loses statistical significance. In conjunction with the fact that, taken together,joint ventures and FDI account for significant shares of total output in many indus-tries, this result suggests that further research is required to determine the extent towhich knowledge diffuses from firms having strong linkages to foreign firms to thosethat do not have such relationships. Of particular importance in this connection isexploring the extent of spillovers among joint venture firms and between foreignaffiliates and firms with joint ventures. Insofar as joint venture firms invest morein technology capacity (as suggested by their training efforts), one expects thesefirms to be better able to absorb and benefit from know-how diffusion. The absenceof such capacity may be a factor underlying the observed negative spillover effect.Longer times series and collection of data on variables that measure in-house tech-nological effort by firms would help identify the magnitude and determinants oftechnological spillovers.
Notes
1. A separate but related literature on technology diffusion focuses largely on analysis of the deter-minants of the number of firms or the proportion of industry output produced by a new technology(aggregate diffusion) and on analysis of the determinants of the time at which a firm adopts a new tech-nology relative to other firms (so-called duration models) (see, for example, Ray [1964] and Karshenasand Stoneman [1994]). Data constraints prohibit analysis of the types of questions asked in the diffusionliterature, as it is not possible to identify specific technologies in our data set.
2. See, for example, Helleiner (1973) and Keesing and Lall (1992) on subcontracting; Feenstra,Markusen, and Zeile (1992) on imports of inputs; Blomström and Kokko (1997) for a recent survey ofthe literature on FDI; and Pack and Saggi (1997) for a general survey of the literature on technologytransfer.
Foreign Investment and Productivity Growth in Czech Enterprises 175

3. Notions of arm’s length exchange used in the literature vary. For example, Pack and Saggi (1997)distinguish between intrafirm exchange (FDI) and contractual exchanges (licensing, joint ventures, turnkeyprojects, and so forth). They call contractual exchanges arm’s length arrangements.
4. See Javorcik (2004) for a recent analysis of the relationship between intellectual property protec-tion and FDI in transition economies.
5. Equally important may be spillovers across industries. This issue is not explored in this chapter,although it may be important in the transition context.
6. See Nelson and Wolff (1997).7. The literature on technology acquisition and adoption in developing countries is substantial. See,
for example, Evenson and Westphal (1995); Lall (1987, 1992); and Pack and Westphal (1986). Westphal,Rhee, and Pursell (1981) discuss the case of the Republic of Korea in some depth.
8. The authors are grateful to a referee for suggesting the formulation used below.9. A fixed-effects estimation assumes firm productivity growth to be constant over time. This
assumption is objectionable, since changes in productivity due to increased competition is the phe-nomenon we seek to explore. The random effects model avoids the imposition of constant productiv-ity growth over time, but it has the drawback that productivity shocks at the firm level are assumed tobe uncorrelated over time. This may not be a reasonable restriction if there is convergence or divergencein corporate performance.
References
Aitken, Brian J., and Ann E. Harrison. 1999. “Do Domestic Firms Benefit from Direct Foreign Invest-ment? Evidence from Venezuela.” American Economic Review 89 (3): 605–18.
Amemiya, T. 1984. “Tobit Models: A Survey.” Journal of Econometrics 24: 3–61.Blomström, Magnus, and Ari Kokko. 1997. “How Foreign Investment Affects Host Countries.” Policy
Research Working Paper 1745, World Bank, Washington, DC.Blomström, Magnus, and Hakan Persson. 1983. “Foreign Investment and Spillover Efficiency in an
Underdeveloped Economy: Evidence from the Mexican Manufacturing Industry.”World Development11: 493–501.
Blomström, Magnus, Ari Kokko, and M. Zejan. 1994. “Host Country Competition and TechnologyTransfer by Multinationals.” Weltwirtschaftliches Archiv 130: 521–33.
Burnside, Craig, Michael Eichenbaum, and Sergio Rebelo. 1996. “Sector Solow Residuals.” EuropeanEconomic Review 40 (3–5): 861–69.
Clerides, Sofronis, Saul Lach, and James Tybout. 1998. “Is Learning by Exporting Important? Micro-Dynamic Evidence from Colombia, Mexico and Morocco.” Quarterly Journal of Economics 113 (3):903–47.
Coe, David, and Elhanan Helpman. 1995. “International R&D Spillovers.” European Economic Review39: 214–42.
Coe,David,Elhanan Helpman,and Alexander Hoffmaister.1997.“North-South R&D Spillovers.”EconomicJournal 107: 134–49.
Czech Statistical Office. 1997. Statistical Yearbook 1996. Prague: Czech Statistical Office.Das, S. 1987.“Externalities, and Technology Transfer through Multinational Corporations: A Theoretical
Analysis.” Journal of International Economics 22: 171–82.Evenson, R.E., and L. Westphal. 1995.“Technological Change and Technology Strategy.” In Handbook of
Development Economics, vol. III, ed. J. Behrman and T.N. Srinivasan. Amsterdam: North Holland.Feenstra, Robert, James Markusen, and William Zeile. 1992. “Accounting for Growth with New Inputs:
Theory and Evidence.” American Economic Review 82: 415–21.Grossman, Gene, and Elhanan Helpman. 1995. “Technology and Trade.” In Handbook of International
Economics, vol. III, ed. G. Grossman and K. Rogoff. Amsterdam: North Holland.Haddad, M., and A. Harrison. 1993. “Are There Positive Spillovers from Direct Foreign Investment?
Evidence from Panel Data for Morocco.” Journal of Development Economics 42: 51–74.
176 Global Integration and Technology Transfer

Harrison, Ann. 1994.“Productivity, Imperfect Competition and Trade Reform.” Journal of InternationalEconomics 36: 53–73.
———. 1996.“Determinants and Consequences of Foreign Investment in Three Developing Countries.”In Industrial Evolution in Developing Countries: Micro Patterns of Turnover, Productivity and MarketStructure, ed. Mark Roberts and James Tybout. Oxford: Oxford University Press.
Helleiner, G. 1973. “Manufactured Exports from Less Developed Countries and Multinational Firms.”Economic Journal 83: 21–47.
Javorcik, Beata S. 2004.“The Composition of FDI and Protection of Intellectual Property Rights in Tran-sition Economies.” European Economic Review 48: 39–62.
Karshenas, M., and P. Stoneman. 1994.“Technological Diffusion.” In Handbook of Economics of Innova-tion and Technological Change, ed. P. Stoneman. Oxford: Blackwell.
Keesing, Don, and S. Lall. 1992.“Marketing Manufactured Exports from Developing Countries: LearningSequences and Public Support.” In Trade Policy, Industrialization and Development: New Perspectives,ed. G. Helleiner. Oxford: Clarendon Press.
Lall, Sanjaya. 1987. Learning to Industrialize: The Acquisition of Technological Capabilities in India. London:MacMillan.
———. 1992. “Technological Capabilities and Industrialization.” World Development 20: 165–86.Markusen, James. 1995.“The Boundaries of the Multinational Enterprise and the Theory of International
Trade.” Journal of Economic Perspectives 9: 169–89.Nelson, Richard, and Howard Pack. 1998. “The Asian Miracle and Modern Growth Theory.” Policy
Research Working Paper 1881, World Bank, Washington, DC.Nelson, Richard, and Edward Wolff. 1997. “Factors behind Cross-Industry Differences in Technical
Progress.” Structural Change and Economic Dynamics 8: 205–20.Pack, Howard. 1987. Productivity Technology and Industrial Development. New York: Oxford University
Press.Pack, Howard, and Kamal Saggi. 1997. “Inflows of Foreign Technology and Indigenous Technological
Development.” Review of Development Economics 1: 81–98.Pack, Howard, and Larry Westphal. 1986. “Industrial Strategy and Technological Change.” Journal of
Development Economics 22: 87–128.Ray, G.F. 1964. The Diffusion of Mature Technologies. Cambridge: Cambridge University Press.Wang, Jian-Ye, and Magnus Blomström. 1992.“Foreign Investment and Technology Transfer: A Simple
Model.” European Economic Review 36: 137–55.Westphal, Larry, Yung Rhee, and Garry Pursell. 1981. “Korean Industrial Competence: Where It Came
from.” Staff Working Paper 469, World Bank, Washington, DC.
Foreign Investment and Productivity Growth in Czech Enterprises 177


179
9
Technological Leadershipand the Choice of Entry
Mode by Foreign Investors
Beata Smarzynska Javorcik
During the past several decades, there has been a significant change in the attitudesof governments, especially those in developing countries, toward foreign directinvestment (FDI). Rather than viewed as evil exploiters, foreign investors are nowwelcomed as a source of new technologies, better management and marketing tech-niques, and skilled jobs. Not all types of foreign investment, however, are perceivedas equally beneficial to host countries. Governments tend to favor joint ventures overother forms of FDI, since they believe that active participation of local firms facili-tates the absorption of new technologies and marketing skills.1 This chapter leavesaside the issue of whether this perception is true and instead attempts to compare thepotential of joint ventures and wholly owned foreign subsidiaries for such transfers.
In contrast to the existing literature, which demonstrates that differences in R&Dand advertising intensities between industries influence a foreign investor’s choice ofentry mode, this chapter focuses on patterns present within industries. It providesempirical evidence indicating that industry structure affects the choice of entry modeand that treating industries as homogenous, as done in earlier studies, is thus notappropriate. It finds that joint ventures in manufacturing sectors tend to be under-taken by foreign investors possessing fewer intangible assets than their counterpartsinvolved in wholly owned projects. These effects are present in high-technology but
The author wishes to thank Andy Bernard, Bruce Blonigen, Philip Levy, Robert Lipsey, T.N. Srinivasan,
and Louis Wells for their helpful suggestions and Hans Peter Lankes for making the results of a foreign
invesment survey by the European Bank for Reconstruction and Development available to her. The author
benefited from comments received at seminars at Yale University, the World Bank, and the U.S. Inter-
national Trade Commission.

not in low-technology sectors. The findings therefore suggest that joint ventures inmore R&D-intensive sectors may present less potential for transfers of technologyand marketing skills than wholly owned foreign subsidiaries.
The theoretical literature suggests that costs involved in drafting and enforcingcontracts guiding the transfers of proprietary know-how to joint ventures as wellas the threat of knowledge dissipation may make shared ownership less attractiveand encourage the establishment of wholly owned subsidiaries. Firms differentiat-ing their products through advertising may also seek full ownership to ensure thequality of their products and prevent debasing of their trademarks. Empirical studiesconfirm these predictions by finding a negative relationship between industry- orfirm-level R&D and advertising intensities and the probability of shared ownership(Stopford and Wells 1972; Gatignon and Anderson 1988; Gomes-Casseres 1989;Asiedu and Esfahani 2001).2
In contrast to existing research, this chapter proposes that the choice of entrymode depends not only on the R&D or advertising intensity of a sector but also onan investor’s endowment of intangible assets relative to the industry average (here-after referred to as relative R&D and advertising intensity). Relative endowment ofintangible assets may affect a firm’s choice of entry mode in two opposing ways.
On the one hand, technological and marketing leaders in an industry may havegreater bargaining power in negotiations with local firms and authorities andmay be able to secure more favorable terms under joint venture agreements. Thusthey are likely to gain more from such arrangements than industry laggards.3 InR&D-intensive sectors, foreign technological leaders may also be so advanced com-pared with domestic firms that technology leakage may not pose a severe threat,since local firms may be unable to use independently the knowledge acquiredthrough a joint venture. Thus one should expect to observe that industry leadersare more likely to share ownership than industry laggards.
On the other hand, if the gap between foreign and domestic firms does not guar-antee protection against dissipation of intangible assets, industry leaders may bemore averse to shared ownership than industry laggards. Moreover, they may usetheir bargaining power to negotiate sole ownership in countries in which foreignownership is restricted by the government. In that case, the relative endowment ofintangible assets would be positively correlated with the probability of full owner-ship. Thus the theoretical predictions are ambiguous, and an empirical investigationis necessary to shed light on this issue.
This chapter tests whether intraindustry differences in intangible assets affect aforeign investor’s choice of entry mode. It also examines whether these effects arethe same in industries with different levels of R&D spending. The analysis focuses onmanufacturing industries and uses a unique data set on foreign investment projects
180 Global Integration and Technology Transfer
in Eastern Europe and the former Soviet Union in the early 1990s. The data set isbased on a worldwide survey of companies conducted by the European Bank forReconstruction and Development (EBRD) that contains information on foreigninvestments in 22 transition economies.
The analysis begins by estimating a model similar to those found in earlier studies.As expected, firm- or industry-level R&D spending and firm advertising expenditureare negatively related to the probability of a joint venture and positively correlated withthe likelihood of a wholly owned project. Factors governing the choice of entry modein transition economies are thus similar to those present in other regions.
To test the first hypothesis, I include in the model industry-level R&D intensityas well as the ratio of a firm’s R&D spending to the industry mean, which serves asa proxy for a firm’s technological sophistication. R&D intensity is not a perfectmeasure of a firm’s intangible assets; firms may have other intangible assets they areconcerned about dissipating, such as distribution and marketing techniques. Totake this into account, I add an analogous variable capturing sophistication of mar-keting techniques. I also control for other firm-specific characteristics and progressof reform in a host country. I improve over the existing studies by taking intoaccount possible sample selection bias arising from the fact that the same firm char-acteristics affect both a firm’s decision to invest and choice of entry mode.
The empirical analysis supports the hypothesis that an investor’s endowment ofintangible assets relative to other firms in the industry influences its choice of entrymode. The relationship between investors’ technological and marketing sophisti-cation and the probability of shared ownership is negative. Thus the results indi-cate that industry structure affects investors’ behavior and industrial sectors shouldnot be treated as homogenous in an examination of entry mode.
Next I test whether these effects vary across industries by allowing for differentcoefficients in high-/medium- and low-technology sectors. I show that the impact oftechnological and marketing sophistication on the choice of entry mode is statisticallysignificant in the high- and medium-technology sectors but not in low-technologyindustries. This finding is robust to different classifications of sectors.
Related Literature
Theory Theory suggests that in order to compete successfully in a foreign market,a firm must possess so-called ownership advantages, which can take the form ofsuperior technology, proprietary knowledge, managerial and marketing skills, andso on. A firm can earn rents on these assets through arm’s length transactions (forexample, licensing, franchising, turnkey contracts) or by creating a subsidiary orforming a joint venture in a foreign country. Assessing the value of intangible assets
Technological Leadership and the Choice of Entry Mode 181

is a difficult task and is associated with information asymmetry. The seller maynot receive adequate payment, since he may not be able to disclose the full poten-tial of future profits generated by a given technology to a prospective buyer with-out giving away private information on the technology itself (Dunning 1988).Thus firms possessing more sophisticated technologies may face more uncertaintyin pricing and may prefer wholly owned projects to joint ventures or arm’s lengthtransactions.
A wholly owned venture might also be preferred to shared ownership in orderto guard against leakage of sensitive information. For example, a foreign investormay be concerned that in the case of the dissolution of a joint venture, the localpartner will remain in possession of the technology acquired from the multina-tional and will become a competitor in third markets. The joint venture agreementmay not offer full protection against this possibility, since it may be difficult to specifyall contingencies in the contract.4 Additionally, the local partner may use proprietaryinformation obtained from the multinational in its own wholly owned operations,thus hurting the joint venture and the foreign partner (Gomes-Casseres 1989).5 Themultinational may also fear that if the local partner controls the employment policy,it may not put enough effort into keeping key employees, who may leave and revealtheir knowledge of the production process to the competition.6
Firms investing heavily in advertising also have reasons to seek full ownership. Ajoint venture partner may have a strong incentive to free ride on the reputation of aforeign partner by debasing the quality of the product carrying the foreign trade-mark. In such a case, the local partner appropriates the full benefits of debasementwhile bearing only a small fraction of the costs (Caves 1982; Horstmann and Markusen1987). Full ownership also allows foreign investors to retain control over the market-ing strategy and eliminates the need to persuade the local partner about the optimallevel and mix of marketing expenditure. In summary, theory predicts that firms withgreater intangible assets should prefer full ownership to joint ventures.
The preferences of a host country government regarding the extent of foreignownership may differ from those of a multinational corporation. Therefore, theentry mode used may be a result of a bargaining process between the two parties(Gomes-Casseres 1990). Studies of the bargaining approach predict that multina-tional corporations in R&D-intensive industries enjoy greater bargaining power innegotiations with local authorities (Gomes-Casseres 1990; see also UNCTAD 1992).
Empirical Evidence Earlier empirical research on the relationship between intan-gible assets and the choice of entry mode found a negative correlation between firmor industry R&D intensity and the probability of shared ownership (Stopford andWells 1972; Gatignon and Anderson 1988; Asiedu and Esfahani 2001). Some studies,
182 Global Integration and Technology Transfer

however, did not produce statistically significant results (Gomes-Casseres 1989;Blomström and Zejan 1991). Advertising intensity was shown to be negativelyrelated to the probability of a joint venture (Gomes-Casseres 1989, 1990), but insome studies this relationship was not statistically significant (Hennart 1991).
The only examination of entry modes used by foreign firms investing in EasternEurope was undertaken by Meyer (1998). He analyzed characteristics of British andGerman companies engaged in minority and majority joint ventures and whollyowned projects in the region. For each of these categories, he estimated a logit modelwith the dependent variable equal to one if the particular entry mode was chosenand zero otherwise. He found a significant positive correlation between a firm’sR&D intensity and the probability of a wholly owned subsidiary and a negativerelationship between a firm’s R&D intensity and the likelihood of a joint venture.The negative relationship was present in the case of minority, majority, and all typesof joint ventures combined.
Gomes-Casseres (1990) analyzed the choice between full and shared ownershipin the context of bargaining theory. Among other variables, his model includedindustry-level R&D spending as well as its interaction with a dummy variable forcountries restricting the extent of foreign ownership. A positive correlation betweenthe interaction term and the probability of a wholly owned subsidiary would indicatethat investors in more R&D-intensive sectors can more easily negotiate full ownership.Neither of the two variables, however, turned out to be statistically significant.7
Hypotheses
In contrast to the earlier literature, I postulate that the choice of entry mode is influ-enced not only by the R&D intensity of a given industry but also by the R&D spend-ing of a foreign investor relative to other firms within the sector. Thus there existboth interindustry and intraindustry effects. However, the sign of the intraindustryeffect is unclear.8
On the one hand, investors enjoying a technological lead in their sectors areperceived as more attractive joint venture partners by local firms and govern-ments. Thus they are able to negotiate more favorable terms in a joint ventureagreement. Additionally, industry leaders may be able to form joint ventures withmore successful local companies than foreign technological laggards.9 Moreover,the technology gap between foreign leaders and domestic producers may be solarge that even in the presence of knowledge transfer to a joint venture, the threatof losing intangible assets may be minimal. Thus industry leaders may be morewilling to form joint ventures than industry laggards.
On the other hand, the technology gap may not be enough to prevent knowl-edge dissipation. Investors possessing a technological advantage over other firms in
Technological Leadership and the Choice of Entry Mode 183

their sectors may potentially incur greater losses from knowledge dissipation thaninvestors with less sophisticated technologies. It may also be more difficult to pricecutting-edge technologies than mature ones. Thus shared ownership may be lessappealing to industry leaders, who may use their bargaining power to negotiatewith the host country government an exemption from the restrictions on the extentof foreign ownership, should such restrictions be present.10 In summary, the theo-retical predictions about the relationship between relative R&D intensity and thelikelihood of a joint venture are ambiguous. Figures 9.1 and 9.2 illustrate the twopossibilities described above.
184 Global Integration and Technology Transfer
prob
abili
ty o
f a jo
int v
entu
re
R&D intensity
Figure 9.1 R&D Intensity and Probability of a Joint Venture: Case 1
Figure 9.2 R&D Intensity and Probability of a Joint Venture: Case 2
Source: Author.
Note: Each segment represents an industry.
Source: Author.
Note: Each segment represents an industry.
prob
abili
ty o
f a jo
int v
entu
re
R&D intensity

An alternative assumption, often employed in the literature (see, for example,Ethier and Markusen 1996), is that knowledge dissipation takes place regardlessof the form a multinational corporation uses to service a local market. Whetherthe multinational enters through a wholly owned subsidiary or a joint venturewith a local partner, it will lose its intangible assets after a certain time because ofemployee turnover. This loss is, however, likely to be more costly to a firm withmore sophisticated technologies. Under this assumption, the question is whetherit is cheaper for the multinational to buy loyalty from employees of its whollyowned subsidiary or from a local partner. Ethier and Markusen (1996) show thatthis depends on the parameters of the model.11 Thus theory again providesambiguous predictions.
The second hypothesis is that the impact of relative R&D intensity may not be thesame in all industries. It is plausible that relative R&D intensity plays an importantrole in high- and medium- but not in low-technology sectors. In low R&D sectors,technological sophistication may be less important to potential local partners. At thesame time, foreign investors may be less concerned about losing their technologicalsuperiority. Thus there may exist no correlation between relative R&D intensity andthe choice of entry mode in these industries. If this is the case, one would observe therelationship portrayed in figure 9.3.
Figures 9.1–9.3 suggest that studies treating industries as homogenous, and thusignoring the impact of relative R&D intensity, would produce a negative relation-ship between industry R&D efforts and the likelihood of a joint venture. A negativecorrelation would also be found if only a firm’s R&D expenditure were included inthe model. Hence while the results of the earlier studies are consistent with the pro-posed framework, they capture only part of the true relationship. If the data do not
Technological Leadership and the Choice of Entry Mode 185
prob
abili
ty o
f a jo
int v
entu
re
R&D intensity
Figure 9.3 R&D Intensity and Probability of a Joint Venture: Case 3
Source: Author.Note: Each segment represents an industry.

support the hypothesis, one should observe a negative correlation between theprobability of a joint venture and firm- or industry-level R&D spending. However,the effect of relative R&D intensity should be insignificant.
One caveat of using relative R&D expenditure as a proxy for technological lead-ership is that R&D intensity is not a perfect measure of a firm’s success in innovativeactivities. Furthermore, in low-technology sectors, differences in R&D activities,which are generally modest, may not have strong effects. Finally, technology is notthe only intangible asset firms may be concerned about losing. Leadership in termsof managerial techniques, marketing strategies, and distribution skills may be farmore important in some industries. To capture this effect, I control for the advertis-ing intensity of an industry and the relative advertising intensity of a firm.
I assume that all foreign investors have the option of engaging in a joint venturewith a local partner, should they want to do so. Thus the supply of local joint venturepartners is not constrained, and the observed entry patterns are determined entirelyby foreign investors’ demand. Considering that the aggregate FDI inflows into tran-sition economies were quite small during the period covered by the sample, thisassumption is quite realistic.Additionally, since most firms in the sample are relativelylarge, they most likely enjoyed an advantage in their search for local partners.12
I also assume that the available local partners fulfill some minimum standards setby foreign investors. Note that a difference in technological sophistication betweenforeign and local firms may be not be a serious obstacle to a successful joint ventureagreement, since, as surveys indicate, local partners are expected to contribute theirknowledge of market conditions, distribution networks, and ability to deal withgovernment officials rather than provide technological expertise (OECD 1994).
In addition to proxies for intangible assets, the estimated model includes othervariables. Blomström and Zejan (1991) mention that larger firms are more will-ing to take higher risks and are therefore more likely than smaller companies toengage in wholly owned projects. Thus I control for a firm’s size and expect to findthat it is negatively correlated with the probability of a joint venture. Note, however,that empirical investigations have often produced the opposite result (Blomströmand Zejan 1991; Meyer 1998).13 Stopford and Wells (1972) point out that morediversified firms tend to be more tolerant of minority ownership and are morelikely to engage in joint ventures. This finding has been confirmed by Meyer (1998).Therefore, I also control for production diversification and anticipate a positivesign on its coefficient.
Usually, a major contribution of a local partner to a joint venture is the knowl-edge of the business environment in a host country. As foreign investors learnmore about local conditions, their need for a local partner declines (Kogut andSingh 1988). Thus I control for investors’ regional experience and expect to obtaina negative sign.14 Similarly, I take into account firms’ international experience. As
186 Global Integration and Technology Transfer

Blomström and Zejan (1991) show, firms with greater experience in foreign oper-ations are less likely to share ownership.
The choice between full and shared ownership is also likely to be influenced bythe investment climate in a host country. On the one hand, having a local partner thatis well connected with local authorities may be more useful in countries with lessfriendly an attitude toward FDI. On the other hand, in economies with a moredeveloped legal system and better corporate governance, foreign investors may beconfident that potential disputes with local partners can be resolved fairly throughthe court system. They may thus be less averse to shared ownership. In summary, therelationship between business environment in a host country and the form ofinvestment is ambiguous.
Data and Statistical Models
The data set used in this study is based on the EBRD survey of foreign investors,supplemented with the information obtained from the Worldscope database.15 InJanuary 1995 a brief questionnaire was sent to all companies (about 9,500) listedin Worldscope. Responses were obtained from 1,405 firms, which answered ques-tions regarding their investments in Eastern European transition economies andthe former Soviet republics, a total of 22 countries. The data set contains informa-tion on both investors and noninvestors.
In the case of investors, the type of entry mode for existing and planned projects inthe region is known. Survey respondents were asked to classify each of their projectsas a joint venture, acquisition, or greenfield project. For the purpose of this study, Iconsider all greenfield and acquisition projects not associated with joint ventures to bewholly owned. Unfortunately, no information is available on the size of investments.
The data set does not include any information on the timing of each investment.Since the magnitude of FDI inflows was marginal before 1989, the information col-lected pertains mostly to the period 1989–94.16 Joint ventures outnumber whollyowned projects in all but one host country in the data set and constitute 62 percentof all projects (table 9.1).
During the past decade, transition economies undertook dramatic liberalizationof their FDI regimes. In the Soviet Union a presidential decree issued in October1990 allowed foreign wholly owned companies to be established in the form ofbranches or subsidiaries. The decree also created the legal basis for foreign investorsto buy existing Soviet enterprises as they were privatized (McMillan 1996).Act XXIVof 1988 on the Investment of Foreigners in Hungary allowed non-Hungariancompanies to own equity up to 100 percent (WTO 1998). In Poland the 1988 Lawon Economic Activity with the Participation of Foreign Parties permitted 100 percentforeign equity participation (GATT 1992).
Technological Leadership and the Choice of Entry Mode 187

To the best of my knowledge, in none of the countries in the sample does legisla-tion specifically forbid full ownership by foreign investors. It is possible, however, thatin practice permissions for fully owned projects are denied in some economies.To takethis possibility into account, I include host country dummies in the model and showthat this change does not strongly affect the results. In many transition economies,however, FDI in sectors such as production of military equipment and extraction ofnatural resources is subject to restrictions on the extent of foreign ownership.17 I there-fore exclude firms in the coal, gas, and oil industries from the sample.
188 Global Integration and Technology Transfer
Number Numberof joint of wholly Totalventure owned number of Average ofprojects projects projects Population transitionin the in the in the (millions) indicators
Country sample sample sample 1993 1994
Albania 3 1 4 3.2 2.50Azerbaijan 1 1 2 7.4 1.33Belarus 5 3 8 10.4 1.67Bulgaria 16 13 29 8.5 2.50Croatia 7 4 11 4.8 3.17Czech Republic 55 53 108 10.3 3.50Estonia 16 8 24 1.5 3.33FYR Macedonia 2 1 3 2.2 2.83Georgia 4 2 6 5.4 1.33Hungary 50 48 98 10.3 3.33Kazakhstan 10 6 16 16.9 1.67Latvia 13 6 19 2.6 2.83Lithuania 8 5 13 3.7 3.00Moldova 2 0 2 4.3 2.17Poland 84 51 135 38.5 3.33Romania 21 12 33 22.7 2.67Russian Fed. 83 31 114 148.3 2.67Slovak Republic 26 19 45 5.3 3.33Slovenia 13 5 18 2.0 3.17Turkmenistan 1 0 1 4.1 1.17Ukraine 20 5 25 52.1 1.33Uzbekistan 5 1 6 22.0 2.00
Mean or total 445 275 720 16.0 2.45
TABLE 9.1 Entry Modes Chosen by Investors in the Sample,by Country
Source: Author.
Note: Sample includes manufacturing sectors only.

The sample includes only manufacturing sectors, since in many service industries(such as banking, insurance, and telecommunications), restrictions on the extent offoreign ownership exist. In other sectors, such as accounting and public relations serv-ices, it may be extremely difficult to measure the endowment of intangible assets. Jointventure is the dominant form of investment in the majority of industries in the sam-ple (table 9.2).However, in the drugs, cosmetics, and health care products sectors,only12 percent of all projects are joint ventures, while wholly owned subsidiaries accountfor 88 percent of investments.18 Wholly owned projects constitute 80 percent of allinvestments in the beverage sector. The drugs, cosmetics, and health care productssector is the most R&D-intensive industry, and in the beverage sector marketingactivities play a very important role. Fear of losing intangible assets is thus a likelyexplanation of the underrepresentation of joint ventures in these industries.
Following earlier studies, I begin the analysis by estimating a probit model withthe dependent variable taking on the value of one if investor i has engaged in a joint
Technological Leadership and the Choice of Entry Mode 189
Joint ventures Wholly owned as percentage projects as percentage of all projects of all projects
Industry in the industry in the industry
Drugs, cosmetics,and health care products 12.1 87.9
Electronics 67.0 33.0Aerospace 80.0 20.0Chemicals 78.0 22.0Machinery and equipment 68.8 31.3Electrical equipment 32.3 67.7Automotive 60.0 40.0Diversified manufacturing 88.5 11.5Metal 72.2 27.8Metal products 65.4 34.6Paper 67.6 32.4Beverages 20.0 80.0Food 61.7 38.3Apparel 50.0 50.0Textiles 55.6 44.4Tobacco 100.0 0.0Printing and publishing 60.0 40.0
TABLE 9.2 Entry Modes Chosen by Investors in the Sample,by Industry
Source: Author.

venture with a local partner in country c and zero if the project was wholly owned.Thus the number of observations will be equal to the number of projects under-taken in the region by all firms in the sample.19
I improve over the existing literature by controlling for possible sample selec-tion bias. It is likely that the coefficient estimates from a model describing thechoice between full and shared ownership are inconsistent because the model doesnot take into account which firms undertake FDI in the first place. To address thisissue, I estimate a bivariate probit model accounting for sample selection. The firstequation in the model describes firm i’s decision to undertake FDI in country c; thesecond models the choice between full and shared ownership.20
With the exception of regional experience, which comes from the survey, allexplanatory variables employed in the estimation are taken from a commercial data-base,Worldscope, and refer to 1993 or the closest year for which information is avail-able. Industry R&D intensity is measured by R&D expenditure as a percentage of netsales. To find the industry averages, I use figures for all firms listed in Worldscope ina given industry. The industry averages were calculated at the three-digit SIC indus-try classification.21 To proxy for investor’s technological sophistication, I use relativeR&D intensity, defined as the ratio of a firm’s R&D intensity to the industry aver-age.22 Industry advertising intensity is measured by sales, general expenditure, andadministrative expenditure divided by net sales. This variable is a standard proxy foradvertising intensity used in the literature. The industry average is calculated at thethree-digit level. I define the relative advertising intensity as the ratio of a firm’sadvertising intensity to the industry average.
I use firm sales in millions of U.S. dollars as a measure of firm size. Diversifica-tion is proxied by the number of four-digit SIC codes describing a firm’s activities.To control for regional experience, I include a dummy variable taking on the valueof one if a firm had a trading relationship with the region before transition and zerootherwise. International experience is measured by the share of foreign sales ina firm’s total sales. Ideally, I would like to have used the share of foreign assets in afirm’s total assets. This would, however, have severely reduced the size of the sample.Since the share of foreign sales is highly correlated with the share of foreign assets(0.82), I believe that it can serve as a proxy for international experience. To capturethe investment conditions in a host country, I use an index of transition progress,defined as the average of EBRD transition indicators. Transition indicators rate theprogress of a country’s reforms in price liberalization and competition, trade andexchange system, large-scale privatization, small-scale privatization,enterprise restruc-turing, and banking reform.23 (The values for 1994 for all host countries in the sampleare presented in table 9.1.) In the selection equation of bivariate probit, I also controlfor the size of the local market as captured by the host’s GDP, measured in millionsof U.S. dollars; the figures come from EBRD (1994).
190 Global Integration and Technology Transfer

To test whether the same effects are present in high- and low-technology sectors,I allow for different coefficients in the two groups of industries. The classificationof industries is based on the average R&D intensity of each three-digit SIC sector,with two different cut-off values. I also employ the classification suggested byBlomström, Lipsey, and Ohlsson (1991).
Empirical Findings
Comparison with Earlier Studies
I begin the investigation by estimating a model comparable to those found in theearlier literature. This exercise allows me to establish whether the same factors affectforeign investors’ choice of entry mode in transition economies as in other parts ofthe world. I employ a probit model in which the dependent variable takes on thevalue of one if the project takes the form of a joint venture with a local partner andzero if it is wholly owned. Explanatory variables include investor size, R&D inten-sity, advertising intensity, a measure of production diversification, and proxies forinternational and regional experience. The results are presented in terms of mar-ginal effects evaluated at the sample mean.
The estimates shown in the first column of table 9.3 are consistent with thoseobtained in earlier studies. They indicate that smaller firms and firms with higherR&D and advertising intensities are more likely to engage in wholly owned projectsthan in joint ventures. Regional experience, international experience, and productiondiversification, however, do not appear to be statistically significant. Next I add thetransition index to the model and observe that everything else equal, investors aremore likely to engage in joint ventures in countries that are less advanced in termsof reform. Thus I find support for the hypothesis that local partners are more usefulin countries with a less friendly investment climate. Including the transition index haslittle effect on the other variables in the regression.
Since many of the earlier studies used industry- rather than firm-level proxiesfor intangible assets, I also estimate a model that includes average R&D and adver-tising intensity for three-digit SIC industries. The results, presented in the third andfourth columns of table 9.3, indicate that firms in sectors characterized by highR&D spending are less likely to share ownership. Advertising intensity, however,does not appear to have a significant effect on the form of investment. I also findthat investors with less international experience and those entering host countriesthat are less advanced in terms of reform are more likely to form joint ventures.None of the other variables is statistically significant.
In summary, the results are broadly consistent with the findings of the earlier lit-erature. They suggest that forces determining the entry mode of foreign investors intransition economies are similar to those operating in other parts of the world.
Technological Leadership and the Choice of Entry Mode 191

192 Global Integration and Technology Transfer
Source: Author.
Note: Standard errors, pertaining to coefficients underlying the marginal effects, are reported inparentheses. <0.0001 denotes coefficients with an absolute value below 0.0001. The dependentvariable is equal to one in the case of a joint venture and to zero in the case of a wholly ownedsubsidiary.∗The coefficient underlying the marginal effect is significant at the 10 percent level.
∗∗The coefficient underlying the marginal effect is significant at the 5 percent level.
∗∗∗The coefficient underlying the marginal effect is significant at the 1 percent level.
Variable Marginal effects
Firm R&D −0.0233∗∗∗ −0.0257∗∗∗
(0.0067) (0.0068)
Industry R&D −0.0370∗∗∗ −0.0381∗∗∗
(0.0074) (0.0075)
Firm ADV −0.0181∗∗∗ −0.0185∗∗∗
(0.0035) (0.0035)
Industry ADV 0.0017 0.0010(0.0014) (0.0015)
Diversification 0.0106 0.0116 0.0132 0.0136(0.0151) (0.0153) (0.0100) (0.0101)
Regional experience 0.0507 0.0314 0.0382 0.0201(0.0681) (0.0685) (0.0427) (0.0431)
International −0.0007 −0.0003 −0.0020∗∗∗ −0.0018∗∗
experience (0.0012) (0.0012) (0.0007) (0.0007)
Firm size <.0001∗∗ <.0001∗ <.0001 <.0001(0.0000) (0.0000) (0.0000) (0.0000)
Transition index −0.1318∗∗ −0.1478∗∗∗
(0.0516) (0.0387)
Number ofobservations 346 346 603 603
Chi2 84.01 90.74 49.84 64.99Degrees of freedom 6 7 6 7Prob > chi2 0.00 0.00 0.00 0.00Log L −194.76 −191.39 −378.26 −370.68
TABLE 9.3 Probit Model with Firm- and Industry-Level R&D and Advertising Intensities

Summary Statistics
The next step is to compare the average R&D intensity of investors engaged inwholly owned projects with that of investors sharing ownership in each three-digitSIC sector. I group sectors into high, medium, and low technology, following theclassification used by Blomström, Lipsey, and Ohlsson (1991) (table 9.4).
In all but one high-technology industry, investors engaged in wholly owned proj-ects are on average more R&D intensive than those sharing ownership (table 9.5).Thisgroup consists of industries such as drugs, medical instruments and equipment, andcommunications equipment. In medium-technology industries,which include indus-trial chemicals, motor vehicles, and household appliances, in half of the sectors inwhich both modes are present, investors engaged in wholly owned projects are char-acterized by higher-level R&D efforts. In low-technology sectors, this is true in 10 of16 cases. In each of the three groupings, the average R&D intensity of firms with whollyowned projects is higher than that of firms engaged in joint ventures.
Technological Leadership and the Choice of Entry Mode 193
Source: Blomström, Lipsey, and Ohlsson (1991).
Low technology Medium technology High technology
TABLE 9.4 Classification of Industries by Technology Level
Grain mill, bakery products
Other food products
Beverages
Primary ferrous metals
Primary nonferrous metals
Fabricated metal products
Lumber, wood, furniture
Paper and pulp
Printing and publishing
Textiles and apparel
Glass products
Stone and clay products
Tobacco
Soap and other cleansers
Industrial chemicals
Agricultural chemicals
Farm and gardenmachinery
Construction machinery
Other nonelectricalmachinery, exceptoffice and computingmachinery
Household appliances
Radio, TV equipment
Motor vehiclesand equipment
Transportationequipment other thanaircraft and motorvehicles and equipment
Rubber productsMiscellaneous plasticproducts
Other manufactures
Drugs
Office and computingmachinery
Electronic components
Communicationequipment, exceptradio and TVequipment
Other electricalmachinery
Aircraft
Instruments

194 Global Integration and Technology Transfer
WhollyJoint owned
Sector SIC code ventures projects All
High-technologyDrugs 283 10.62 15.71 15.23Measuring and controlling devices 382 9.94 9.08 9.61Aircraft and parts 372 7.48 9.44 8.08Communications equipment 366 5.60 13.31 7.06Medical instruments and supplies 384 4.58 5.07 4.99Electronic components
and accessories 367 3.39 5.63 4.14Computer and office equipment 357 4.09 4.09Search and navigation equipment 381 3.20 3.20
Average 6.36 12.67 9.54
Medium-technology Refrigeration and service machinery 358 7.26 7.26Electric distribution equipment 361 7.26 7.26Hose, belting, gaskets, and packing 305 6.00 6.00 6.00Plastics materials and synthetics 282 4.65 4.86 4.71Special industry machinery 355 4.22 5.68 4.70Industrial inorganic chemicals 281 4.09 6.23 4.46Motor vehicles and equipment 371 3.91 4.49 4.17Railroad equipment 374 1.49 4.60 3.05Household audio and video
equipment 365 5.79 1.03 2.93Metalworking machinery 354 2.68 2.56 2.66Soap, cleaners, and toilet goods 284 2.60 2.60General industrial machinery 356 2.30 2.30Ship and boat building and repair 373 2.14 2.14Engines and turbines 351 2.11 2.11 2.11Construction and related machinery 353 1.83 2.49 2.03Industrial machinery not elsewhere
classified 359 1.75 1.75Miscellaneous manufactures 399 1.59 1.59 1.59Miscellaneous chemical products 289 1.31 1.31Miscellaneous plastic products
not elsewhere classified 308 1.22 0.11 1.11Farm and garden machinery 352 0.00 3.68 0.74Electric lightning, wiring equipment 364 0.67 0.67Rubber and plastics footwear 302 0.00 0.00 0.00
Average 3.21 3.76 3.35
TABLE 9.5 R&D Intensity of FDI Projects in Three-DigitSIC Industries

Technological Leadership and the Choice of Entry Mode 195
WhollyJoint owned
Sector SIC code ventures projects All
Low-technologyPrinting trade services 279 5.25 5.25Preserved fruits and vegetables 203 4.24 4.24Broadwoven fabric mills, wool 223 4.00 4.00Nonferrous rolling and drawing 335 1.54 5.11 3.16Heavy construction, excluding
highways 162 2.70 2.70Electrical work 173 2.67 2.67Copper ores 102 1.75 2.84 2.29Cutlery, handtools, and hardware 342 2.22 2.28 2.27Nonresident building construction 154 1.25 2.94 1.93Miscellaneous food and kindred
products 209 1.86 1.86Sugar and confectionery products 206 1.83 1.83Miscellaneous metal ores 109 1.73 1.73Manifold business forms 276 1.43 1.43Miscellaneous textile goods 229 1.40 1.40Clay, ceramic, and refractory
minerals 145 1.35 1.35Secondary nonferrous metals 334 1.34 1.34Primary nonferrous metals 333 1.23 1.23 1.23Iron ores 101 1.21 1.21Miscellaneous converted paper
products 267 0.21 1.34 1.15Miscellaneous nonmetallic
mineral products 329 0.76 2.43 1.13Metal cans and shipping containers 341 1.20 0.79 0.99Blast furnace and basic steel
products 331 0.93 0.93Meat products 201 0.79 0.91 0.85Grain mill products 204 0.68 1.10 0.72Glass and glassware pressed
or blown 322 0.65 0.65Miscellaneous wood products 249 0.63 0.63 0.63Paper mills 262 0.60 0.67 0.61Dairy products 202 0.57 0.57Highway and street construction 161 0.55 0.55Fabricated structural metal products 344 0.00 0.82 0.55
TABLE 9.5 (Continued)
(continued)

Testing the Hypotheses
To test whether intraindustry differences in intangible assets affect the choice ofentry mode, I include in the model the average R&D intensity of each industry aswell as the ratio of a firm’s R&D spending to the industry mean. I also add the cor-responding variables for advertising intensity. The results of the probit model lendsupport to the hypothesis (table 9.6). Firms with large R&D and advertising effortsrelative to the industry average are more likely to undertake wholly owned projectsthan to engage in joint ventures. This finding holds when transition progress, hostcountry dummies, and dummies for European and U.S. firms are included.
As before, joint ventures tend to be undertaken by firms in less R&D-intensiveindustries, by smaller and more diversified firms, and by investors with less interna-tional experience. As before, transition progress has a negative marginal effect on theprobability of a joint venture relative to a wholly owned subsidiary. Industry adver-tising intensity, regional experience, and dummies for European and U.S. investorsdo not appear to be statistically significant. With the exception of international expe-rience, which ceases to be significant at the conventional levels, the inclusion of hostcountry dummies does not strongly affect the results.
A major drawback of employing the probit specification is that it takes intoaccount firms that invested in the region but not those that decided against FDI. Thismay be a source of sample selection bias and may lead to inconsistent estimates. Tothe best of my knowledge, none of the previous studies addressed this issue. I correctfor the sample selection bias by estimating a bivariate probit model in which the first
196 Global Integration and Technology Transfer
WhollyJoint owned
Sector SIC code ventures projects All
Paperboard containers and boxes 265 0.44 0.33 0.40Carpets and rugs 227 0.36 0.36Cement, hydraulic 324 0.28 0.28Fats and oils 207 0.15 0.15 0.15Beverages 208 0.35 0.13 0.15Gold and silver ores 104 0.00 0.00Commercial printing 275 0.00 0.00
Average 0.87 1.76 1.2
TABLE 9.5 R&D Intensity of FDI Projects in Three-DigitSIC Industries (Continued)
Source: Author.
Note: Figures in bold denote cases in which R&D intensity of wholly owned projects is greater than R&D intensity of joint ventures.

Source: Author.
Note: Standard errors, pertaining to coefficients underlying marginal effects, are reported in parentheses.Marginal effects whose absolute value is less than 0.0001 are indicated by < .0001. The dependent variableis equal to one in the case of a joint venture and to zero in the case of a wholly owned subsidiary.∗The coefficient underlying the marginal effect is significant at the 10 percent level.
∗∗The coefficient underlying the marginal effect is significant at the 5 percent level.
∗∗∗The coefficient underlying the marginal effect is significant at the 1 percent level.
Variable Marginal effects
Relative R&D −0.0611∗∗ −0.0638∗∗ −0.0672∗∗ −0.0738∗∗∗
(0.0262) (0.0263) (0.0272) (0.0279)
Industry R&D −0.0462∗∗∗ −0.0472∗∗∗ −0.0542∗∗∗ −0.0550∗∗∗
(0.0106) (0.0106) (0.0112) (0.0113)
Relative ADV −0.1782∗∗ −0.1934∗∗∗ −0.2191∗∗∗ −0.1800∗∗
(0.0718) (0.0724) (0.0755) (0.0770)
Industry ADV <0.0001 −0.0008 <0.0001 −0.0003(0.0023) (0.0024) (0.0025) (0.0025)
Diversification 0.0293∗ 0.0314∗∗ 0.0311∗ 0.0218(0.0152) (0.0153) (0.0161) (0.0166)
Regional experience 0.1011 0.0824 0.0709 0.0866(0.0669) (0.0673) (0.0696) (0.0714)
International −0.0025∗∗ −0.0022∗ −0.0018 −0.0033∗∗
experience (0.0012) (0.0012) (0.0012) (0.0013)
Firm size <.0001∗ <.0001∗ <.0001∗ <.0001(0.0000) (0.0000) (0.0000) (0.0000)
Transition index −0.1217∗∗
(0.0508)
U.S. parent −0.1146(0.1917)
European parent 0.1641(0.1861)
Host dummies No No Yes YesNumber of
observations 346 346 345 345Chi2 66.31 72.18 86.51 97.34Degrees of freedom 8 9 27 29Prob > chi2 0.00 0.00 0.00 0.00Log L −203.61 −200.67 −192.94 −187.52
TABLE 9.6 Probit Model with Relative R&D and AdvertisingIntensities
197

equation describes a firm’s decision to invest in a host country and the second focuseson the choice between full and shared ownership. The selection equation includes allvariables used in the second stage as well as the market size of the host country, prox-ied by the GDP. Market size is an important factor in the decision to undertake FDI,but it is unlikely to affect the choice of entry mode.
The estimation results lead to conclusions similar to those suggested by the pro-bit model (table 9.7). Firms that are leaders in terms of technology or marketingskills are more likely to undertake wholly owned projects than to share ownership.Thus the data support the hypothesis that intraindustry differences in intangibleassets are important and that treating industries as homogenous is not appropriate.The signs and significance levels of the other coefficients are very similar to thosefound in the probit model. The only exception is production diversification, whichceases to be statistically significant. In summary, taking sample selection into accountdoes not have a large impact on the estimation results.
The results from the selection equation indicate that FDI is more likely to takeplace in countries with larger market size and more advanced reforms. More diver-sified and larger firms as well as those with greater regional and international expe-rience are more likely to invest in the region. This is also true of firms in moreadvertising-intensive industries. Relative endowments of intangible assets andindustry-level R&D spending do not have a statistically significant effect on theprobability of investing. With the exception of industry R&D intensity, all theseresults are consistent with the stylized facts.24
Relative endowments of intangible assets affect an investor’s choice of entrymode when all manufacturing sectors are taken into account. It is likely, however,that these effects differ across industries. Technological leadership may play animportant role in high-technology industries but may be of little significance in lowR&D sectors. To test this hypothesis, I reestimate the model allowing for differentcoefficients for high-/medium- and low-technology sectors. I group sectors into thetwo categories based on the classification proposed by Blomström, Lipsey, andOhlsson (1991). I also use an alternative grouping method based on the averageR&D intensity of the sector, with R&D spending of 1 and 2 percent of net salesserving as the cut-off values.25
The results indicate that relative R&D intensity and industry R&D spendingaffect the choice of entry mode in high- and medium-technology sectors but not inlow-technology industries (table 9.8). The difference between the coefficients under-lying the marginal effects of relative R&D spending in the two groups of industriesis significant at the 5 percent level. Relative advertising expenditure influences theentry mode in both types of industries, though in the case of low-technology sectorsit is significant in only one regression. Firm size is negatively related to the probability
198 Global Integration and Technology Transfer

Technological Leadership and the Choice of Entry Mode 199
Marginal effects
Variable Entry mode equation Investment equation
Relative R&D −0.0698∗∗ 0.0003
(0.0742) (0.0330)
Industry R&D −0.0496∗∗∗ −0.0002
(0.0298) (0.0114)
Relative ADV −0.2297∗∗∗ 0.0098
(0.1899) (0.0788)
Industry ADV −0.0022 0.0011∗∗∗
(0.0072) (0.0025)
Diversification 0.0247 0.0025∗
(0.0442) (0.0169)
Regional experience 0.0457 0.0433∗∗∗
(0.2049) (0.0702)
International −0.0026∗ 0.0007∗∗∗
experience (0.0038) (0.0013)
Firm size <.0001∗∗ <.0001∗∗∗
(0.0000) (0.0000)
Transition index −0.1766∗∗∗ 0.0491∗∗∗
(0.1585) (0.0443)
Market size <0.0001∗∗∗
(0.0000)
Number of observations 7,152
Log L −1225.16
TABLE 9.7 Bivariate Probit with Sample Selection
Source: Author.
Note: Standard errors, pertaining to coefficients underlying the marginal effects, are reported inparentheses. Marginal effects whose absolute value is less than 0.0001 are indicated by <.0001. In theinvestment equation, the dependent variable is equal to one if FDI takes place and to zero otherwise. Inthe entry mode equation, the dependent variable is equal to one in the case of a joint venture and tozero in the case of a wholly owned subsidiary.∗The coefficient underlying the marginal effect is significant at the 10 percent level.
∗∗The coefficient underlying the marginal effect is significant at the 5 percent level.
∗∗∗The coefficient underlying the marginal effect is significant at the 1 percent level.

200 Global Integration and Technology Transfer
Blomstrom R&D = 1 R&D = 2 and others’ percent percent
Variable classification cut-off cut-off
High∗ relative R&D −0.2275∗∗∗ −0.1271∗∗∗ −0.2828∗∗∗
(0.1601) (0.1162) (0.1898)
Low∗ relative R&D −0.0305 0.0390 −0.0597(0.1621) (0.2423) (0.1290)
High∗ Industry R&D −0.1049∗∗∗ −0.0535∗∗∗ −0.1140∗∗∗
(0.0400) (0.0318) (0.0484)
Low∗ industry R&D −0.0997 1.1569 −0.0997(0.3960) (3.0105) (0.3792)
High∗ relative ADV −0.4345∗∗∗ −0.2837∗∗∗ −0.5281∗∗∗
(0.3127) (0.2321) (0.3674)
Low∗ relative ADV −0.2873 −0.8189∗ −0.0984(0.4282) (1.1316) (0.3005)
High∗ industry ADV −0.0014 −0.0028 −0.0026(0.0089) (0.0077) (0.0096)
Low∗ industry ADV −0.0122 −0.0071 −0.0091(0.0203) (0.0664) (0.0182)
High∗ diversification −0.0163 0.0028 −0.0241(0.0567) (0.0519) (0.0638)
Low∗ diversification 0.0794∗ 0.1870∗∗ 0.0552∗
(0.1013) (0.2066) (0.0800)
High∗ regional experience 0.1760 0.1104 0.1382(0.3044) (0.2391) (0.3627)
Low∗ regional experience −0.3374∗ −0.9271 −0.1039(0.4880) (1.4678) (0.3454)
High∗ international experience −0.0007 −0.0022 0.0002(0.0049) (0.0046) (0.0059)
Low∗ international experience −0.0040 −0.0034 −0.0025(0.0076) (0.0130) (0.0070)
High∗ firm size <.0001 <.0001∗ <.0001(0.0000) (0.0000) (0.0000)
TABLE 9.8 Marginal Effects of Bivariate Probit with SampleSelection: Entry Mode Equation

Source: Author.
Note: Standard errors, pertaining to coefficients underlying marginal effects, are reported inparentheses. Marginal effects whose absolute value is less than 0.0001 are indicated by < .0001. In theinvestment equation (not reported in the table), the dependent variable is equal to one if FDI takesplace and to zero otherwise. In the entry mode equation, the dependent variable is equal to one in thecase of a joint venture and to zero in the case of a wholly owned subsidiary.∗The coefficient underlying the marginal effect is significant at the 10 percent level.
∗∗The coefficient underlying the marginal effect is significant at the 5 percent level.
∗∗∗The coefficient underlying the marginal effect is significant at the 1 percent level.
Blomstrom R&D = 1 R&D = 2 and others’ percent percent
Variable classification cut-off cut-off
Low∗ firm size −0.0001∗∗ −0.0001∗ −0.0001∗∗
(0.0001) (0.0001) (0.0001)
High∗ transition −0.2308∗∗∗ −0.1896∗∗∗ −0.2163∗∗
(0.2102) (0.1736) (0.2150)
Low∗ transition −0.1705 −0.0973 −0.1305(0.3524) (0.9443) (0.3305)
Number of observations 7,152 7,152 7,152
LogL −1159.79 −1188.00 −1156.67
TABLE 9.8 (Continued)
of shared ownership in all industries. Transition progress is significant at the con-ventional levels only in high– and medium–R&D sectors, though the underlyingcoefficients for the two groups of industries are not significantly different from eachother. In low-technology sectors, more diversified firms and investors withoutregional experience are more tolerant toward shared ownership.26
The empirical evidence presented in this chapter indicates that differences in rel-ative endowments of intangible assets across firms within an industry influencechoice of entry mode. Technological and marketing leaders tend to avoid joint ven-tures and prefer to engage in wholly owned projects. The effect is present mainly inhigh- and medium-technology sectors.
Concluding Remarks
The choice of entry mode by foreign investors has been of interest to both policy-makers and researchers in the field of international business. Changing attitudestoward FDI, greater openness to foreign investment, and the loosening of restric-tions on foreign ownership have increased the need to understand the impact of for-eign investors on host economies. Developing country governments are especially
Technological Leadership and the Choice of Entry Mode 201

interested in the question of technology and know-how transfer resulting fromFDI. To be able to assess the potential magnitude of such benefits, it is importantto understand the preferences of different types of investors with respect to theentry mode. This study sheds some light on this issue by analyzing entry modeschosen by foreign firms entering transition economies in Eastern Europe and theformer Soviet Union in the early 1990s.
This chapter contributes to the literature by formulating and providing empir-ical support for new hypotheses relating the intraindustry differences in R&D andmarketing efforts to the choice of entry mode. It improves on other studies by takinginto account the potential sample selection bias. The results indicate that industrystructure has a significant impact on foreign investment decisions. Treating indus-tries as homogenous in investigations of forces governing FDI flows may thereforebe inappropriate.
The findings show that foreign investors that are technological and marketingleaders in their sectors are less likely to form joint ventures than firms laggingbehind. This effect is most prominent in high- and medium-technology industries.Thus while it is widely believed that joint ventures with local firms are more con-ducive to transferring knowledge and know-how than wholly owned FDI projects,the potential magnitude of transfers from joint ventures in high R&D sectors maybe smaller than that from fully owned subsidiaries.
Notes
1. See Beamish (1988), Blomström and Zejan (1991), and Blomström and Sjöholm (1999). Suchviews have led some host countries to restrict the extent of foreign ownership or to offer special incen-tives to foreign investors undertaking joint ventures with local partners. For instance, in the 1980s China,India, Indonesia, the Republic of Korea, Malaysia, Mexico, Nigeria, Pakistan, and Sri Lanka placedrestrictions on foreign ownership (UNCTC 1987).
2. R&D intensity is defined as expenditure on R&D expressed as a percentage of net sales. In thetext the terms R&D expenditure, R&D spending, and R&D efforts refer to R&D intensity. Sectors with ahigh average R&D intensity are described as high-technology or R&D-intensive sectors.
3. Some evidence indicates that firms with higher R&D spending enjoy greater bargaining powerin negotiations with host country governments (Stopford and Wells 1972; UNCTAD 1992).
4. A significant number of joint ventures terminate during the first few years of their existence. Forinstance, 35 of 92 joint ventures examined by Kogut (1989) failed within seven years. Twenty-seven percentof joint ventures surveyed by Miller and others (1996) were not expected to survive by their partners.Killing (1982) reported that 36 percent of partners rated the performance of their joint ventures asunsatisfactory.
5. Unilever’s joint venture in Shanghai may serve as an example. The Chinese partner began tomanufacture a washing detergent that had a similar formula and was packaged in a strikingly similarbox as the Omo brand produced by the joint venture (The Economist 1997).
6. In Bulgaria the Commission for the Protection of Competition has investigated cases of violationof business secrets by former employees. Some of these cases have been brought by foreign companiesoperating in the country (Hoekman and Djankov 1997).
7. See Gomes-Casseres (1990) for a brief review of the earlier tests of bargaining theory and adescription of their limitations.
202 Global Integration and Technology Transfer

8. Cohen and Klepper (1992) show that the distributions of R&D intensity within different indus-tries “display a strikingly regular pattern” (p. 773).
9. In general, foreign investors tend to choose more successful local companies for acquisitions orjoint venture arrangements. Analysis of firm-level data shows that foreign investment flows to local firmsof above-average size, initial profitability, and initial labor productivity (for evidence from the CzechRepublic, see chapter 8 of this volume; for evidence from Indonesia, see Arnold and Javorcik 2005).
10. Foreign investors often take precautions against losses of their proprietary knowledge. Warhurst(1991) provides some examples of such efforts on the part of multinational corporations engaged injoint ventures in China. For instance, foreign experts training employees of the Chinese partner werereported to withhold certain technical knowledge, including blueprints. In one case the Chinese com-pany was not allowed to have access to the “‘know-why’ which would enable it to absorb fully and alterthe technology for future needs” (p. 1063). In another case the training of a Chinese team in theinvestor’s home country took place in a rented section of a university rather than at the companyresearch center, possibly out of concern about protecting proprietary technology.
11. Ethier and Markusen (1996) focus on the choice of exporting, licensing, and acquiring asubsidiary.
12. Brouthers and Bamossy (1997) report that some state-owned enterprises in the region had onlylimited knowledge of Western firms, which led them to restrict their search for foreign joint venturepartners to major, well-known Western multinationals.
13. I also experimented with including firm size relative to the industry average, but this variable did notappear to be statistically significant and adding it to the regressions had little impact on other coefficients.
14. However, a study by Meyer (1998) produced a positive coefficient.15. Worldscope is a commercial database that provides detailed financial statements, business
descriptions, and historical pricing information on thousands of public companies located in more than50 countries.
16. Eastern European countries and the Soviet Union were virtually closed to foreign investmentbefore 1989 (see Dunning and Rojec 1993; Meyer 1995; Hunya 1997).
17. See Dunning and Rojec (1993) for a description of these restrictions.18. In the drugs sector (SIC code 283), 10 percent of projects are joint ventures and 90 percent are
wholly owned subsidiaries.19. The number of observations is smaller than the number of projects in table 9.1 because of miss-
ing firm-specific information.20. This model was first proposed by Wynand and van Praag (1981). See Greene (1993) for a brief
description of the model.21. In calculating industry averages, I removed two outliers from the drug sector and one from the
communications equipment industry. These firms reported R&D intensities equal to 16,598, 1,815, and2,560, respectively. All three firms reported annual sales of less than $500,000. They are thus likely to bestart-up companies. The conclusions of this chapter remain unchanged even if this correction is notperformed.
22. If firm- and industry-level figures were both equal to zero, relative R&D intensity took on thevalue of one.
23. See EBRD (1994) for a detailed description.24. The evidence in Javorcik (2004) suggests that low R&D intensity of foreign investors in transi-
tion economies may be linked to weak protection of intellectual property rights.25. The average R&D intensity of all three-digit SIC sectors is 1.29 percent of sales.26. The equation I estimated includes the following R&D terms:
Y
Y
icfirm
indind
ic
∗ = + + +…
=
β β β0 1 2
1
R&D
R&DR&D
if
otherwise.
Y
Yic
ic
∗ >=
0
0
Technological Leadership and the Choice of Entry Mode 203

It is possible that b1 is a function of R&D intensity of an industry. For instance, it is conceivable that
Estimation of the above equation, however, produced insignificant coefficients a0 and a1.
References
Arnold, Jens Matthias, and Beata Smarzynska Javorcik. 2005. “Gifted Kids or Pushy Parents? ForeignAcquisitions and Plant Performance in Indonesia.”Policy Research Working Paper 3597,World Bank,Washington, DC.
Asiedu, Elizabeth, and Hadi Salehi Esfahani. 2001. “Ownership Structure in Foreign Direct InvestmentProjects.” Review of Economics and Statistics 83 (4): 647–62.
Beamish, Paul W. 1988. Multinational Joint Ventures in Developing Countries. Routledge: London andNew York.
Blomström, Magnus, and Fredrik Sjöholm. 1999.“Technology Transfer and Spillovers: Does Local Par-ticipation with Multinationals Matter?” European Economic Review 43 (4–6): 915–23.
Blomström, Magnus, and Mario Zejan. 1991. “Why Do Multinational Firms Seek Out Joint Ventures?”Journal of International Development 3 (1): 53–63.
Blomström, Magnus, Robert E. Lipsey, and Lennart Ohlsson. 1991.“What Do Rich Countries Trade withEach Other? R&D and the Composition of U.S. and Swedish Trade.” NBER Reprint No. 1551 (fromBanca Nazionale del Lavoro Quarterly Review 173 [June 1990] 215–35), National Bureau of Eco-nomic Research, Cambridge, MA.
Brouthers, Keith D., and Gary J. Bamossy. 1997. “The Role of Key Stakeholders in International JointVenture Negotiations: Case Studies from Eastern Europe.” Journal of International Business Studies28 (2): 285–308.
Caves, R. 1982. Multinational Enterprise and Economic Analysis. New York: Cambridge University Press.Cohen, Wesley M., and Steven Klepper. 1992.“The Anatomy of Industry R&D Intensity Distributions.”
American Economic Review 82 (4): 773–99.Dunning, John H. 1988. Explaining International Production. London: Unwin Hyman.Dunning, John H., and Matija Rojec. 1993. Foreign Privatization in Central and Eastern Europe. Central
and Eastern European Privatization Network, Ljubljana, Slovenia.EBRD (European Bank for Reconstruction and Development). 1994. Transition Report. London.The Economist. 1997. “Multinationals in China: Going It Alone.” April 19.Ethier, Wilfred, and James Markusen. 1996. “Multinational Firms, Technological Diffusion and Trade.”
Journal of International Economics 41 (1–2): 1–28.Gatignon, Hubert, and Erin Anderson. 1988.“The Multinational Corporation’s Degree of Control over
Foreign Subsidiaries: An Empirical Test of a Transaction Cost Explanation.” Journal of Law, Eco-nomics, and Organization 4 (2): 305–36.
GATT (General Agreement on Trade and Tariffs). 1992. Trade Policy Review: Poland. Vol. 1. Geneva.Gomes-Casseres, Benjamin. 1989. “Ownership Structures of Foreign Subsidiaries: Theory and Evi-
dence.” Journal of Economic Behavior and Organization 11 (1): 1–25.———. 1990.“Firm Ownership Preferences and Host Government Restrictions: An Integrated Approach.”
Journal of International Business Studies 21 (1): 1–22.Greene, William H. 1993. Econometric Analysis, 2nd. ed. New York: Macmillan Publishing Company.
1 0 1
0 0
= +
= + +∗
R&D
ThenR&D
R&D
ind
icfirm
ind
Y
.
1 2
1 0
0
R D
Y Y
Y
firm ind
ic ic
ic
& + +…
= >=
∗
R&D
if
otherwise.
204 Global Integration and Technology Transfer
Hennart, Jean–François. 1991. “The Transaction Cost Theory of Joint Ventures: An Empirical Study ofJapanese Subsidiaries in the United States.” Management Science 37 (4): 483–97.
Hoekman, Bernard, and Simeon Djankov. 1997.“Competition Law in Post-Central Planning Bulgaria.”Discussion Paper 1723, Centre for Economic Policy Research, London.
Horstmann, Ignatius, and James R. Markusen. 1987. “Licensing versus Direct Investment: A Model ofInternalization by the Multinational Enterprise.” Canadian Journal of Economics 20 (3): 464–81.
Hunya, Gabor. 1997.“Large Privatisation, Restructuring and Foreign Direct Investment.” In Lessons fromthe Economic Transition: Central and Eastern Europe in the 1990s, ed. Salvatore Zecchini, 275–300.Dordrecht: Kluwer Academic Publishers.
Javorcik, Beata Smarzynska. 2004. “The Composition of Foreign Direct Investment and Protection ofIntellectual Property Rights: Evidence from Transition Economies.” European Economic Review 48(1): 39–62.
Killing, J.P. 1982. “How to Make a Global Joint Venture Work.” Harvard Business Review 60 (May):120–27.
Kogut, Bruce. 1989. “The Stability of Joint Ventures: Reciprocity and Competitive Rivalry.” Journal ofIndustrial Economics 37: 183–98.
Kogut, Bruce, and Harbir Singh. 1988. “The Effect of National Culture on the Choice of Entry Mode.”Journal of International Business Studies 19 (3): 411–32.
McMillan, Carl H. 1996. “Foreign Investment in Russia: Soviet Legacies and Post-Soviet Prospects.” InForeign Investment in Russia and Other Soviet Successor States, ed. Patrick Artisien-Maksimenko andYuri Adjubei, 41–72. New York: St. Martin’s Press.
Meyer, Klaus. 1995. “Direct Foreign Investment in Eastern Europe. The Role of Labor Costs.” Compar-ative Economic Studies 37 (1): 69–88.
———. 1998. Direct Investment in Economies in Transition. Cheltenham, UK, and Northampton, MA:Edward Elgar.
Miller, Robert, Jack Glen, Frederick Jaspersen, and Yannis Karmokolies. 1996.“International Joint Venturesin Developing Countries: Happy Marriages?”Discussion Paper 29, International Finance Corporation,Washington, DC.
OECD (Organisation for Economic Co-operation and Development). 1994. Assessing Investment Oppor-tunities in Economies in Transition. Paris.
Stopford, John M., and Louis T. Wells, Jr. 1972. Managing the Multinational Enterprise. New York: BasicBooks.
UNCTAD (United Nations Conference on Trade and Development). 1992. World Investment Report1992: Transnational Corporations as Engines of Growth. New York: United Nations.
UNCTC (United Nations Centre on Transnational Corporations). 1987. Arrangements between JointVenture Partners in Developing Countries. Advisory Study No. 2. New York.
Warhurst, Alyson. 1991. “Technology Transfer and the Development of China’s Offshore Oil Industry.”World Development 19 (8): 1055–73.
WTO (World Trade Organization). 1998. Trade Policy Review: Hungary. Geneva.Wynand, P., and B. van Praag. 1981.“The Demand for Deductibles in Private Health Insurance: A Probit
Model with Sample Selection.” Journal of Econometrics 17 (2): 229–52.
Technological Leadership and the Choice of Entry Mode 205


Does Foreign DirectInvestment Increase the
Productivity of DomesticFirms? In Search of
Spillovers throughBackward Linkages
Beata Smarzynska Javorcik
207
10
Policymakers in many developing countries and transition economies place attract-ing foreign direct investment (FDI) high on their agenda, expecting FDI inflows tobring much-needed capital, new technologies, marketing techniques, and manage-ment skills. While all of these potential benefits of FDI are viewed as important,emphasis is placed on the contribution of FDI to increasing the productivity andcompetitiveness of the domestic industry. It is often hoped that technology transferresulting from FDI will go beyond actual projects undertaken by foreign investorsand, through knowledge spillovers, will benefit domestic firms.
Yet there is no evidence that positive externalities generated by foreign presenceactually exist. As Rodrik (1999) notes, “Today’s policy literature is filled with
This chapter originally appeared in the American Economic Review 94 (3): 605–27. The author wishes
to thank Mary Amiti, Enrique Aldaz-Carroll, Andrew Bernard, Simon Evenett, Ana Fernandes, Michael
Ferrantino, Caroline Freund, Holger Görg, Mary Hallward-Driemeier, Wolfgang Keller, Pravin Krishna,
Hiau Looi Kee, Maryla Maliszewska, Jacques Morisset, Marcelo Olarreaga, Nina Pavcnik, Maurice Schiff,
Matt Slaughter, Mariana Spatareanu, Jim Tybout, two anonymous referees, and the participants of the
Tuck International Trade Conference for valuable comments and suggestions. Financial support from the
Foreign Investment Advisory Service (FIAS), a joint facility of the International Finance Corporation and
the World Bank, is gratefully acknowledged. This chapter is part of a larger FIAS effort to improve the
understanding of spillovers from multinational corporations to local firms.

extravagant claims about positive spillovers from FDI, but the evidence is sober-ing.” Indeed, data limitations and the difficulties associated with disentangling dif-ferent effects at play have prevented researchers from providing conclusive evidenceof positive externalities resulting from FDI. While recent firm-level studies haveovercome many of the difficulties faced by earlier literature, the emerging messageis not very positive.
The literature on this subject is of three kinds. First, there are case studies, whichare often very informative and include a wealth of valuable information (see, forinstance, Moran 2001). Because they pertain to particular FDI projects or specificcountries, however, these studies cannot easily be generalized.
Second, there is a plethora of industry-level studies, most of which show a pos-itive correlation between foreign presence and the average value-added per workerin the sector. Because most of these studies rely on cross-sectional data, it is diffi-cult to establish the direction of causality. It is possible that the positive associationis caused by the fact that multinationals tend to locate in high-productivity indus-tries rather than by genuine productivity spillovers. The positive correlation mayalso be a result of FDI inflows forcing less productive domestic firms to exit or ofmultinationals increasing their share of the host country market, both of whichwould raise the average productivity in the industry.1
Third, there is research based on firm-level panel data, which examines whetherthe productivity of domestic firms is correlated with the extent of foreign presence intheir sector. Most of these studies—such as the careful analyses done by Haddad andHarrison (1993) on Morocco,Aitken and Harrison (1999) on República Bolivariana deVenezuela, Djankov and Hoekman (2000) on the Czech Republic, and Konings(2001) on Bulgaria, Romania, and Poland—cast doubt on the existence of spilloversfrom FDI in developing countries. The researchers either fail to find a significanteffect or produce evidence of negative horizontal spillovers (the effect of the presenceof multinational corporations on domestic firms in the same sector). The picture ismore positive in the case of industrial countries: recent work by Haskel, Pereira, andSlaughter (2002) and Keller and Yeaple (2003) provides convincing evidence of pos-itive FDI spillovers in the United Kingdom and the United States, respectively.2
It is possible, though, that researchers have been looking for FDI spillovers in thewrong place.Since multinationals have an incentive to prevent information leakage thatwould enhance the performance of their local competitors but at the same time maybenefit from transferring knowledge to their local suppliers, spillovers from FDI aremore likely to be vertical than horizontal in nature. In other words, spillovers are mostlikely to take place through backward linkages (contacts between domestic suppliers ofintermediate inputs and their multinational clients) and thus would not have beencaptured by earlier studies.3 It is also plausible that spillovers from multinationalpresence in upstream sectors exist thanks to the provision of inputs that either were
208 Global Integration and Technology Transfer

previously unavailable in the country or are technologically more advanced, lessexpensive, or accompanied by provision of complementary services.As Blomström,Kokko, and Zejan (2000) point out, very few empirical studies analyze verticalspillovers. The notable exceptions are Blalock (2001), who uses firm-level panel datafrom Indonesia, and Schoors and van der Tol (2001), who rely on cross-sectionalenterprise-level data from Hungary. Both provide evidence of positive FDI spilloversthrough backward linkages.4
The purpose of this chapter is twofold. First, it examines whether the productiv-ity of domestic firms is correlated with the presence of multinationals in down-stream sectors (potential customers) or upstream industries (potential suppliers ofintermediate inputs). Detecting such effects would be consistent with the existenceof vertical spillovers. The analysis improves over the recent literature by taking intoaccount econometric problems that may have biased the results of earlier work. Thesemiparametric estimation method suggested by Olley and Pakes (1996) is employedto account for endogeneity of input demand. Moreover, standard errors are correctedto take into account the fact that the measures of potential spillovers are industry spe-cific while the observations in the data set are at the firm level. As Moulton (1990)notes, failing to make such a correction will lead to a serious downward bias in theestimated errors, resulting in a spurious finding of statistical significance for theaggregate variable of interest.
Second, this study goes beyond the existing literature by shedding light on deter-minants of vertical spillovers. It examines whether benefits stemming from verti-cal linkages are related to the extent of foreign ownership in affiliates. Based on casestudies and investor surveys, these factors have been conjectured to influence thereliance on local sourcing on the part of multinationals and thus the potential ben-efits of backward linkages, but their impact does not appear to have been system-atically examined.5
The analysis is based on data from the annual enterprise survey conducted bythe Lithuanian Statistical Office. The survey coverage is extensive, as firms account-ing for about 85 percent of output in each sector are included. The data constitutean unbalanced panel covering the 1996–2000 period. Focusing on a transitioneconomy such as Lithuania is very suitable for this project, as the endowment ofskilled labor enjoyed by transition economies makes them a particularly likely placefor productivity spillovers to manifest themselves.6
The findings can be summarized as follows. The empirical results are consistentwith the existence of positive spillovers from FDI taking place through backwardlinkages, but there is no robust evidence of spillovers occurring through either thehorizontal or the forward linkage channel. In other words, the productivity ofLithuanian firms is positively correlated with the extent of potential contacts withmultinational customers but not with the presence of multinationals in the same
Does Foreign Direct Investment Increase the Productivity of Domestic Firms? 209

industry or the existence of multinational suppliers of intermediate inputs. The mag-nitude of the effect is economically meaningful. A one standard deviation increase inthe foreign presence in the sourcing sectors is associated with a 15 percent rise in out-put of each domestic firm in the supplying industry. The productivity effect is foundto originate from investments with joint foreign and domestic ownership but not fromfully owned foreign affiliates, which is consistent with the evidence of a larger amountof local sourcing undertaken by jointly owned projects.
Overview of Spillover Channels
Spillovers from FDI take place when the entry or presence of multinational corpo-rations increases the productivity of domestic firms in a host country and themultinationals do not fully internalize the value of these benefits. Spillovers maytake place when local firms improve their efficiency by copying technologies of for-eign affiliates operating in the local market either through observation or by hiringworkers trained by the affiliates. Another kind of spillover occurs if multinationalentry leads to more severe competition in the host country market and forces localfirms to use their existing resources more efficiently or to search for new technolo-gies (Blomström and Kokko 1998).
To the extent that domestic firms and multinationals operating in the same sec-tor compete with one another, multinationals have an incentive to prevent tech-nology leakage and spillovers from taking place. This can be achieved by formallyprotecting their intellectual property, engaging in trade secrecy, paying higherwages to prevent labor turnover, or locating in countries or industries in whichdomestic firms have limited imitative capacities to begin with.7 This observation isconsistent with the results of recent studies that failed to produce evidence of pos-itive horizontal spillovers from FDI.
Multinationals have no incentive to prevent technology diffusion to upstreamsectors, as they may benefit from improved performance of intermediate input sup-pliers. Thus backward linkages—contacts between multinational firms and theirlocal suppliers—should be the most likely channel through which spillovers man-ifest themselves. These spillovers may take place through direct knowledge transferfrom foreign customers to local suppliers;8 higher requirements for product qual-ity and on-time delivery introduced by multinationals, which provide incentives todomestic suppliers to upgrade their production management or technology;9 andmultinational entry increasing demand for intermediate products, which allowslocal suppliers to reap the benefits of scale economies.
Similarly, domestic firms may become more productive as a result of gainingaccess to new, improved, or less costly intermediate inputs produced by multina-tionals in upstream sectors (forward linkage channel). Sales of these inputs by
210 Global Integration and Technology Transfer

multinationals may be accompanied by provision of complementary services thatmay not be available in connection with imports.
Anecdotal evidence confirms that spillovers take place through backward link-ages in transition economies. For instance, after a Czech producer of aluminumalloy castings for the automotive industry signed its first contract with a multina-tional customer, the staff from the multinational would visit the Czech firm’s prem-ises two days each month over an extended period to work on improving the qualitycontrol system. Subsequently, the Czech firm applied these improvements to itsother production lines (not serving this particular customer) and reduced thenumber of defective items produced (interview with company management in theCzech Republic, May 2003).
The results of a recent enterprise survey conducted in Latvia by the World Bank(2003a) are consistent with the expectation that positive spillovers take placethrough backward linkages but are ambiguous with respect to the intraindustryeffect. The evidence from Latvia is particularly relevant as, in addition to beingneighboring countries, Lithuania and Latvia share many similarities in terms oftheir history and economic conditions. The survey demonstrates that a majorityof multinationals are engaged in local sourcing: 82 percent of those interviewedhad at least one Latvian supplier of intermediate inputs, and on average 47 percent ofintermediate inputs purchased by foreign firms came from Latvian producers.Thirty-six percent of Latvian firms supplying multinationals reported receivingassistance from their customers. As far as horizontal spillovers are concerned, one-third of Latvian firms stated that they had benefited from the presence of foreignfirms in their sector (15 percent through sourcing inputs from multinationals, 14percent by learning about new technologies, and 9 percent by learning about newmarketing strategies). At the same time, 45 percent of survey respondents reportedthat foreign entry increased competition in their industry, with 6.5 percent of firmsadmitting to having lost market share to foreign firms. As Aitken and Harrison(1999) point out, knowledge spillovers within an industry may be counterbalancedby the competition effect; that is, as domestic firms lose market share to foreignentrants, their productivity falls, since their fixed costs are spread over a smallermarket. Thus the reported increase in competition levels due to foreign entry isconsistent with the lack of intraindustry spillovers found in the current analysis.
Different types of FDI projects may have different implications for verticalspillovers. For instance, it has been argued that affiliates established through merg-ers and acquisitions or joint ventures are likely to source more locally than thosetaking the form of greenfield projects (UNCTC 2001). While greenfield projectshave to put time and effort into developing local linkages, affiliates establishedthrough mergers and acquisitions can take advantage of the supplier relationshipsof the acquired firm or its local partners. Empirical evidence to support this view
Does Foreign Direct Investment Increase the Productivity of Domestic Firms? 211

has been found for Japanese investors (Belderbos, Capannelli, and Fukao 2001) andfor Swedish affiliates in Eastern Europe (UNCTC 2000). Unfortunately, in the dataset used here, it is impossible to distinguish among the three types of foreign invest-ment. However, to the extent that full foreign ownership is a proxy for greenfieldprojects, it is expected that fully owned foreign affiliates will tend to rely more onimported inputs, while investment projects with shared domestic and foreign own-ership will tend to source more locally.10 This hypothesis is supported by the WorldBank (2003a) survey, which shows that while more than half of partially owned for-eign affiliates operating in Latvia purchased their intermediate inputs locally, only9 percent of fully owned foreign subsidiaries did so. Similarly, the results of a study ofthe largest exporters in Hungary (Toth and Semjen 1999) indicate that foreign affiliateswith larger shares of foreign equity tend to purchase fewer inputs from Hungarian com-panies. In sum, it is expected that larger spillovers are associated with partially ratherthan fully owned foreign projects.
Data and Estimation Strategy
This section reviews recent developments in FDI inflows to Lithuania and describesthe data and the estimation strategy.
Foreign Direct Investment in Lithuania
Like other former Soviet republics, Lithuania had been virtually closed to foreigninvestment until 1990, when it regained its independence and began the process oftransition to a market economy. The first stage of the privatization process, whichbegan in 1991, offered limited opportunities for foreign investors. It was not until1997 that FDI inflows into Lithuania increased significantly, as a result of the secondstage of the privatization program. FDI inflows peaked in 1998, when 60 percent ofthe shares of Lietuvas Telekomas (Lithuanian Telecom), the fixed-line monopolyoperator, were sold to Amber Teleholdings, a consortium of Swedish Telia and FinishSonera (EBRD 2001) (figure 10.1).11
Due to its late start, Lithuania has attracted less FDI than other Central and EasternEurope countries. Cumulative FDI inflows between 1993 and 2000 reached $694 percapita,placing Lithuania seventh among Central and Eastern European countries,aboveSlovenia, Bulgaria, and Romania. In terms of the value of cumulative FDI inflows,Lithuania ranks eighth, above Estonia and Slovenia (table 10.1).
In terms of sectoral distribution, 44 percent of the FDI stock in 1996 was in man-ufacturing. Following large inflows into the telecommunications and financial sec-tors, this figure decreased to 32 percent in 2000. Within manufacturing, foodproducts, beverages, and tobacco attracted the largest share of investment (12 percentof the total FDI stock), followed by textiles and leather products (4 percent) and
212 Global Integration and Technology Transfer

refined petroleum and chemicals (4 percent). Electrical machinery, optical instru-ments, and wood products also received significant foreign investments (OECD 2000)(table 10.2).
Lithuania’s population, GDP, and FDI inflows are concentrated in three cities:Vilnius, Kaunas, and Klaipeda. At the beginning of 2000, Vilnius accounted for60.5 percent of Lithuania’s FDI, Klaipeda accounted for 11.6 percent, and Kaunaaccounted for 10.5 percent. Direct investment in manufacturing sectors is concen-trated around Klaipeda, while the bulk of FDI inflows into wholesale and retailtrading are found in Vilnius (OECD 2000, 2001).
Data Description
The data used in this study come from the annual enterprise survey conducted bythe Lithuanian Statistical Office. The survey coverage is extensive, as firms account-ing for about 85 percent of output in each sector are included in the sample.
The Lithuanian enterprise data have been praised for their high quality and reli-ability.12 The data constitute an unbalanced panel covering the 1996–2000 period.The number of firms per year varies from a low of 12,000 in 1996 to a high of 21,000in 1999. Due to financial constraints in some years, the Statistical Office wasforced to reduce the scope of the exercise. In each year, however, the same samplingtechnique was used.
Does Foreign Direct Investment Increase the Productivity of Domestic Firms? 213
0
100
200
300
400
500
600
700
800
900
1,000
1993 1994 1995 1996 1997 1998 1999 2000
US
$ m
illio
ns
total total excluding 1998 sale of Lithuanian Telecom
FIGURE 10.1 Net FDI Inflows to Lithuania, 1993–2000
Source: IMF (2003).

214
Glo
bal In
tegratio
n an
d Tech
no
log
y Transfer
FDI inflow (millions of dollars) FDI inflows, 2000 FDI inflows, 1993–2000
As percent Per Value PerCountry 1993 1994 1995 1996 1997 1998 1999 2000 of GDP capita ($) (millions of $) capita ($)
Bulgaria 40 105 90 109 505 537 806 1,002 7.9 123 3,194 393Czech Republic 654 878 2,568 1,435 1,286 3,700 806 1,002 7.9 123 3,194 393Estonia 162 214 201 150 266 581 305 387 7.5 283 2,268 1,656Hungary 2,350 1,144 4,519 2,274 2,167 2,037 1,977 1,646 3.5 163 18,113 1,790Latvia 45 214 180 382 521 357 348 410 5.7 173 2,456 1,036Lithuania 30 31 73 152 355 926 486 379 3.4 108 2,432 694Poland 1,715 1,875 3,659 4,498 4,908 6,365 7,270 9,341 5.9 242 39,631 1,025Romania 94 341 419 263 1,215 2,031 1,041 1,037 2.7 46 6,441 287Slovak Republic 199 270 236 351 174 562 354 2,052 10.4 380 4,198 777Slovenia 113 117 150 173 334 216 107 136 0.7 68 1,345 676
TABLE 10.1 FDI Inflows to Central and Eastern European Countries, 1993–2000
Source: IMF (2003) and World Bank (2003b).

Do
es Foreig
n D
irect Investm
ent In
crease the Pro
ductivity o
f Do
mestic Firm
s?215
Distribution Firmsof FDI withacross foreign
NACE sectors Domestic capital2 All (2)/(3)code Sector (percent)1 firms (1) (2) firms (3) ∗ 100 Horizontal Backward Forward
15 Food products and beverages 19.6 396 50 446 11.2 26.6 1.5 4.817 Textiles 12.5 74 30 104 28.8 39.7 13.7 1.718 Wearing apparel 1.9 172 43 215 20.0 33.5 2.7 25.619 Leather and leather products 0.1 19 3 22 13.6 6.6 6.8 15.320 Wood and wood products, except furniture 4.2 382 43 425 10.1 34.3 12.5 8.421 Pulp, paper, and paper products 2.3 17 6 23 26.1 39.4 17.2 10.922 Publishing, printing, and recorded media 0.2 204 12 216 5.6 7.0 3.5 18.324 Chemicals and chemical products 10.7 44 17 61 27.9 20.9 7.4 3.725 Rubber and plastic products 3.8 111 25 136 18.4 31.4 11.0 10.926 Other nonmetallic mineral products 7.4 141 17 158 10.8 35.3 3.1 6.827 Basic metals 0.6 6 3 9 33.3 50.3 16.7 4.328 Fabricated metal products 0.7 156 24 180 13.3 10.7 8.4 22.329 Machinery and equipment 1.1 94 12 106 11.3 23.2 6.9 15.330 Office machinery and computers 0.0 8 2 10 20.0 8.0 6.3 22.531 Electrical equipment and apparatus 1.2 37 4 41 9.8 65.3 7.1 15.032 Radio, television, and communication equip. 4.3 24 5 29 17.2 32.2 14.4 17.033 Medical, precision, and optical instruments 0.8 42 7 49 14.3 23.8 11.9 18.734 Motor vehicles 0.8 9 1 10 10.0 59.8 4.4 12.635 Other transport equipment 7.6 39 8 47 17.0 71.5 0.2 13.136 Furniture 0.6 154 20 174 11.5 9.7 6.9 14.5
Total 80.4 2,129 332 2,461 13.5 31.5 8.1 13.1
TABLE 10.2 Distribution of Firms with Foreign Capital, by Industry, 2000
Source: Author.1. Shares do not add up to 100 percent because the table excludes tobacco (NACE 16), which accounts for 0.9 percent of the FDI stock, and manufacturing of refinedpetroleum products (NACE 23), which account for 18.7 percent.2. Foreign share of at least 10 percent of total capital.

216 Global Integration and Technology Transfer
This chapter focuses on manufacturing firms (sectors 15–36 in Nomenclaturegénérale des activités économiques dans les Communautés européennes [NACE]), whichlowers the sample size to 2,500–4,000 firms a year. The number of observations is fur-ther reduced by deleting those with missing values, no sales, and no employment, aswell as observations failing to satisfy other basic error checks. Two sectors—tobacco(NACE 16) and manufacturing of refined petroleum products (NACE 23)—areexcluded, because the small number of firms makes it impossible to apply the Olley-Pakes technique (discussed below) to these industries. Thus the final sample sizevaries between 1,918 and 2,711 firms.
The data set contains information on foreign ownership, sales, inventories, employ-ment, fixed assets, input costs, investment, location, and share of exports in total sales.Firms with foreign capital participation are defined as firms in which the share of sub-scribed capital (equity) owned by foreign investors is equal to at least 10 percent. Morethan 12 percent (1,414 of the 11,630 observations) meet this definition.
Lithuania and other transition economies in Central and Eastern Europe aresuitable objects for an analysis of FDI spillovers because of their high endowmentof skilled labor, which makes them particularly likely locations for productivityspillovers. On the downside, the brief duration of the panel makes it more difficultto detect the presence of spillovers. Extending the panel to earlier years would notmitigate this problem, because FDI during the early 1990s was limited. Further-more, a high level of aggregation in the industry classification (NACE two-digit)and the fact that the data set pertains to firms rather than plants also works againstfinding a significant spillover effect.
Estimation Strategy
To examine the correlation between firm productivity and FDI in the same indus-try or other sectors, an approach similar to that taken by earlier literature is fol-lowed and several variations of the following equation are estimated:
lnYijrt = a + b1 ln Kijrt + b2 ln Lijrt + b3 ln Mijrt + b4 Foreign Shareijrt
+ b5 Horizontaljt + b6 Backwardjt + b7 Forwardjt
+at +ar +aj + eijrt. (10.1)
Yijrt stands for the real output of firm i operating in sector j and region r at time t,which is calculated by adjusting the reported sales for changes in inventories of fin-ished goods and deflating the resulting value by the producer price index for theappropriate two-digit NACE sector. Kijrt, capital, is defined as the value of fixed assetsat the beginning of the year, deflated by the simple average of the deflators for five

NACE sectors: machinery and equipment; office,accounting,and computing machin-ery; electrical machinery and apparatus; motor vehicles, trailers, and semi-trailers;and other transport equipment. Since in the data set it is impossible to distinguishbetween skilled and unskilled workers, labor is expressed in terms of efficiency units,which are computed by dividing the wage bill by the minimum wage (Lijrt).13 Mijrt,materials, is equal to the value of material inputs adjusted for changes in materialinventories, deflated by an intermediate inputs deflator calculated for each sectorbased on the input-output matrix and deflators for the relevant industries. ForeignShareijrt measures the share of firm’s total equity owned by foreign investors.
Turning to proxies for spillovers, Horizontaljt captures the extent of foreign pres-ence in sector j at time t and is defined as foreign equity participation averaged over allfirms in the sector, weighted by each firm’s share in sectoral output.14 In other words,
Horizontaljt = (Σi for all i ∈ j Foreign Shareit ∗ Yit)/Σi for all i ∈ jYi. (10.2)
Thus the value of the variable increases with the output of foreign investmententerprises and the share of foreign equity in these firms.
Backwardjt is a proxy for the foreign presence in the industries supplied by sec-tor j. It is intended to capture the extent of potential contacts between domesticsuppliers and multinational customers. It is defined following Blalock (2001), andSchoors and van der Tol (2001) as
Backwardjt = Σk if k ≠ j ajk Horizontalkt (10.3)
where ajk is the proportion of sector j’s output supplied to sector k taken from the 1996input-output matrix at the two-digit NACE level.15 The proportion is calculated exclud-ing products supplied for final consumption but including imports of intermediateproducts.16 As the formula indicates, inputs supplied within the sector are not included,since this effect is already captured by the Horizontal variable.17 The greater the foreignpresence in sectors supplied by industry j and the larger the share of intermediates sup-plied to industries with a multinational presence, the higher the value of the variable.
The Forward variable is defined as the weighted share of output in upstream (orsupplying) sectors produced by firms with foreign capital participation.As only inter-mediate goods sold in the domestic market are relevant to this study, goods producedby foreign affiliates for exports (Xit) are excluded. The following formula is used:
Forwardjt = Σm if m ≠ j sjm (Σi for all i∈m Foreign Shareit
∗ (Yit − Xit))/(Σi for all i∈m (Yit − Xit)), (10.4)
where sjm is the share of inputs purchased by industry j from industry m in totalinputs sourced by sector j. For the same reason as before, inputs purchased withinthe sector are excluded. The value of the variable increases with the share of foreignaffiliates in the (domestically sold) output of upstream sectors.
Does Foreign Direct Investment Increase the Productivity of Domestic Firms? 217

The proxies for horizontal and vertical linkages are time-varying sector-specificvariables. While the coefficients taken from the input-output table remain fixed,changes in the level of foreign investment and firm output are observed during theperiod in question.
There is significant variation across sectors and time in all variables (tables 10.2,10.3,and 10.4). For instance, the value of Horizontal ranges from 6.6 percent in leatherand leather products to 65.3 percent in electrical equipment and apparatus and 71.5percent in other transport equipment.The average value increases from almost 12 per-cent in 1996 to more than 31 percent in 2000. Similarly, the value of the Backward vari-able rises from 3.6 percent in 1996 to 6.0 percent in 1998 and 8.1 percent in 2000. Thehighest values are registered in pulp, paper, and paper products (17.2 percent); basicmetals (16.7 percent); and radio, television, and communications equipment (14.4percent). The lowest value (0.2 percent) is in manufacturing other transport equip-ment. The Forward proxy ranges from 1.7 percent in manufacturing textiles to 25.6percent in manufacturing wearing apparel. The Forward variable increases overtime, from 3.3 percent in the first year to 13.1 percent in the last year.
Changes between 1996 and 2000 in the value of all spillover variables are calcu-lated for each sector (figures 10.2–10.4). Seven industries registered a rise in theBackward measure of more than 5 percentage points, and 10 other sectors experi-enced increases of more than 2 percentage points. The largest changes wereobserved in textiles, pulp and paper, wood, rubber, and plastics. Changes in theHorizontal variable were even more pronounced: 13 industries experienced anincrease of more than 10 percentage points, with motor vehicles leading the rank-ing. In contrast, apparel, metal products, and office machinery saw the greatestchanges in the Forward measure.
In an exploratory regression, the model described above is estimated usingordinary least squares (OLS) with White’s correction for heteroskedasticity.A firm’s output is the dependent variable; explanatory variables include capital,labor, materials, foreign equity share, and proxies for FDI spillovers operatingthrough horizontal, backward, and forward channels. Since knowledge externali-ties from the foreign presence may take time to manifest themselves, two specifi-cations are employed, one with contemporaneous and one with lagged spillovervariables. The estimation is performed on the full sample and on the sample ofdomestic firms only.18 The model includes fixed effects for years (4), industries(19), and regions (9). The results indicate that firms with foreign capital tend tobe more productive than purely Lithuanian firms (table 10.5). And, more impor-tant for the purpose of this study, there is a significant and positive coefficient onboth the Backward and Horizontal variables in all four specifications. The coeffi-cients on lagged values appear larger and (in the case of Backward) of higher sta-tistical significance. The third spillover variable, Forward, does not appear to be
218 Global Integration and Technology Transfer

Does Foreign Direct Investment Increase the Productivity of Domestic Firms? 219
Summary statistics for Summary statistics for levels first differences
Number of Standard Number of StandardVariable observations Mean deviation observations Mean deviation
ln Y 11,630 13.5 2.0 6,853 0.01 0.6ln L 11,630 6.1 1.8 6,853 −0.06 0.6ln K 11,630 12.0 2.4 6,853 0.26 0.7ln materials 11,630 12.3 2.5 6,853 −0.02 1.1ln gross
investment 8,262 10.6 2.4 3,765 −0.04 1.8Foreign share 11,630 7.8 23.0 6,853 0.42 9.1Exports share 9,762 21.1 34.0 5,757 −1.20 22.6Horizontal 11,630 19.7 12.3 6,853 3.99 4.7Backward 11,630 4.9 3.9 6,853 1.05 1.1Backward (fully
foreign owned) 11,630 1.9 2.0 6,853 0.41 0.6Backward
(partially foreign owned) 11,630 3.0 2.5 6,853 0.64 1.1
Backward (concentrated) 11,630 1.9 2.1 6,853 0.37 0.8
Backward (competitive) 11,630 2.9 3.0 6,853 0.68 1.1
Forward 11,630 6.9 5.5 6,853 2.38 2.6ln demand 11,630 18.9 1.4 6,853 0.06 0.1H4 11,630 576.9 844.4 6,853 −8.03 209.3
TABLE 10.3 Summary Statistics
Source: Author.
Horizontal spillovers Backward spillovers Forward spillovers
Number Number NumberStandard of Standard of Standard of
Year Mean deviation industries Mean deviation industries Mean deviation industries
1996 11.85 12.92 20 3.62 3.05 20 3.29 2.42 20
1997 17.32 15.70 20 5.17 4.03 20 4.27 2.83 20
1998 21.95 15.58 20 6.02 4.59 20 6.16 3.14 20
1999 28.93 19.93 20 7.72 4.93 20 8.81 4.27 20
2000 31.46 19.20 20 8.13 5.00 20 13.08 6.70 20
TABLE 10.4 Additional Summary Statistics for Spillover Variables
Source: Author.

220 Global Integration and Technology Transfer
0
1
2
3
4
5
6
7
8
9
10
texti
les
pulp,
pap
er
wood
rubb
er, p
lastic
s
basic
met
als
instru
men
ts
met
al pr
od.
furn
iture
chem
icals
electr
ical e
quip.
offic
e m
achin
ery
mac
hiner
y
leath
er
mot
or ve
hicles
ing
mine
ral p
rod.
appa
rel
food
radio
, tele
vision
equ
ip.
FIGURE 10.3 Change in Backward Measure, 1996–2000
Source: Author.
−10
0
10
20
30
40
50
60
mot
or ve
hicles
basic
met
als
othe
r tra
nspo
rt
texti
les
mine
ral p
rod.
pulp,
pap
er
appa
rel
wood
mac
hiner
y
chem
icals
instru
men
tsfo
od
electr
ical e
quip.
leath
er
furn
iture
ing
offic
e m
achin
ery
rubb
er, p
lastic
s
radio
, tele
vision
equ
ip.
met
al pr
od.
FIGURE 10.2 Change in Horizontal Measure, 1996–2000
Source: Author.

statistically significant. In sum, the results are consistent with productivityspillovers from FDI taking place within industries and flowing from multinationalcustomers to their domestic suppliers.
To be more confident about isolating the effects of productivity spillovers, onemust control for other factors that may influence firm productivity. If multinationalentry decreases industry concentration, leading to more competition and forcingdomestic firms to improve their efficiency, this situation may be regarded as abroadly defined spillover effect. Since, however, our interest is primarily knowledgetransfer, it would be useful to separate the two phenomena. Thus the Herfindahlindex (H4) is included as a proxy for the level of industry concentration.19 Foreignentry into downstream sectors may increase demand for intermediate products,which in turn will allow local suppliers to reap the benefits of scale economies. Toseparate this effect, the regression includes the demand for intermediate goods, cal-culated based on information on sourcing patterns from the input-output matrixand the value of production in using sectors.20 A positive correlation betweendemand for intermediates (Demand) and firm productivity is anticipated.
Several econometric concerns need to be addressed in the analysis. The first is theomission of unobserved variables. Firm-, time-, and region-specific factors that areunknown to the econometrician but known to the firm may affect the correlationbetween firm productivity and foreign presence. Examples of these variables include
Does Foreign Direct Investment Increase the Productivity of Domestic Firms? 221
0
5
10
15
20
25
appa
rel
met
al pr
od.
offic
e m
achin
ery
instru
men
ts
mac
hiner
y
electr
ical e
quip.
ing
othe
r tra
nspo
rt
furn
iture
rubb
er, p
lastic
s
pulp,
pap
er
wood
leath
er
mot
or ve
hicles
mine
ral p
rod.
food
basic
met
als
chem
icals
texti
les
radio
, tele
vision
equ
ip.
FIGURE 10.4 Change in Forward Variable, 1996–2000
Source: Author.

222 Global Integration and Technology Transfer
Variable All firms Domestic All firms Domestic
Foreign share 0.0025∗∗∗ 0.0025∗∗∗
(0.0002) (0.0003)
Backward 0.0105∗∗ 0.0086∗
(0.0048) (0.0051)
Backward lagged 0.0173∗∗∗ 0.0177∗∗∗
(0.0060) (0.0066)
Forward −0.0030 0.0001(0.0024) (0.0027)
Forward lagged −0.0029 −0.0007(0.0040) (0.0044)
Horizontal 0.0029∗∗ 0.0040∗∗∗
(0.0013) (0.0014)
Horizontal lagged 0.0038∗ 0.0046∗∗
(0.0021) (0.0023)
Intercept 5.2323∗∗∗ 5.2082∗∗∗ 5.1599∗∗∗ 5.1582∗∗∗
(0.0805) (0.0876) (0.1007) (0.1108)
Number ofobservations 11.630 10.216 8.214 7.118
R2 0.93 0.92 0.93 0.92
TABLE 10.5 OLS with Lagged and Contemporaneous Spillover Variables
Source: Author.
Note: Robust standard errors are presented in parentheses. The dependent variable is ln firm output.Each regression includes ln capital stock, ln effective employment, and ln materials, as well as industry,region, and year fixed effects. ∗Significant at the 10 percent level.∗∗Significant at the 5 percent level.∗∗∗Significant at the 1 percent level.
high-quality management in a particular firm or better infrastructure in a givenregion. This problem is addressed by following Haskel, Pereira, and Slaughter (2002)and using time differencing as well as a full set of fixed effects for year, industry, andregion. In addition to removing any fixed firm-specific unobservable variation, dif-ferencing will remove fixed regional and industrial effects, such as infrastructure andtechnological opportunity. Time, industry, and regional dummy variables will control

for unobservables that may be driving changes in, for instance, the attractiveness ofa particular region or industry.21 Thus the specification becomes
∆lnYijrt = d1∆lnKijrt + d2∆lnLijrt + d3∆lnMijrt + d4∆Foreign Shareijrt
+ d5∆Horizontaljt + d6∆Backwardjt + d7∆Forwardjt
+ d8∆H4jt + d9∆lnDemandjt + at + ar + aj + eijrt (10.5)
This model is estimated in first, second, and fourth differences. The examina-tion of longer differences gives relatively more weight to more persistent changesin the variables of interest and hence reduces the influence of noise. Its disadvan-tage is that longer time differences reduce the size of the sample. As a compromise,the specifications in differences are employed, but only the relationship betweencontemporaneous changes in FDI and firm-level total factor productivity is con-sidered, because adding lags would seriously strain the time span of the data set.
Second, Moulton (1990) shows that in the case of regressions performed onmicro units but including aggregated market (or in this case, industry) variables,the standard errors from OLS will be underestimated. As he demonstrates, fail-ing to take this into account leads to a serious downward bias in the estimatederrors, resulting in spurious findings of statistical significance for the aggregatevariable of interest. To address this issue, the standard errors are corrected for acorrelation between observations belonging to the same industry in a given year(in other words, standard errors are clustered for all observations in the sameindustry and year).
It has been argued that the use of OLS is inappropriate when estimating productiv-ity, because this method treats labor and other inputs as exogenous variables. Grilichesand Mairesse (1995) made the case that inputs should be considered endogenous,because they are chosen by the firm based on its productivity, which is observed bythe producer but not by the econometrician. Not taking into account the endogene-ity of input choices may bias the estimated coefficients. Since the focus of this chap-ter is on firm productivity, the consistency of the estimates is crucial for the analysis.
For this reason, the semiparametric estimation procedure suggested by Olleyand Pakes (1996), which allows for firm-specific productivity differences exhibitingidiosyncratic changes over time, is used. Following Olley and Pakes, it is assumedthat at the beginning of every period a firm chooses variable factors and a level ofinvestment that, together with the current capital value, determine the capital stockat the beginning of the next period. The capital accumulation equation is given by
kit+1 = (1 − d)kit + iit, (10.6)
where k stands for capital, i for investment, and d for the rate of depreciation.Consider the following Cobb-Douglas production function model:
yit = a + bl ∗ lit + bk ∗ kit + bm ∗mit + ωit + hit, (10.7)
Does Foreign Direct Investment Increase the Productivity of Domestic Firms? 223

where yit, lit, and mit denote the logarithm of output, labor, and material inputs,respectively, and subscripts i and t stand for firm and time. ωit denotes productiv-ity, and hit stands for either measurement error or a shock to productivity that isnot forecastable during the period in which labor can be adjusted. Both ωit and hit
are unobserved. The difference is that ωit is a state variable in the firm’s decisionproblem and thus affects the input demand, whilehit does not. Labor and materi-als are assumed to be freely variable inputs. Capital is a fixed factor and is affectedonly by the distribution of ω conditional on information at time t - 1 and past val-ues of ω. The fact that input choices are determined in part by the firm’s beliefsabout ωit gives rise to simultaneity bias. The positive correlation between ωit andinputs used in period t will cause an OLS estimation that does not take into accountunobserved productivity differences to provide upwardly biased estimates of thecoefficients on variable inputs.
The insight of the Olley-Pakes method is that the observable characteristics of thefirm can be modeled as a monotonic function of the productivity of the firm. Sincethe investment decision depends on the capital stock and on firm productivity,
iit = iit (ωit, kit). (10.8)
By inverting equation 10.8, one can express unobserved productivity ωit as a func-tion of observable investment and capital and thus control for ωit in estimation:
ωit = hit (iit, kit). (10.9)
By substituting equation (10.9) into equation (10.7), the equation to be estimatedin the first stage of the procedure is obtained:
yit = a + bl ∗ lit + bk ∗ kit + bm ∗ mit + h(iit,kit) + hit. (10.10)
The functional form of h(⋅) is not known. Therefore, the bk coefficient cannot beestimated at this stage. A partially linear model, including a third-order polynomialexpansion in capital and investment to approximate the form of the h(⋅), is esti-mated. From this stage, the consistent estimates of the coefficients on labor andmaterial inputs as well as the estimate of the third-order polynomial in iit and kit
(referred to as yit) are obtained:
yit = a + bk ∗ kit + h(iit,kit) (10.11)
h(iit,kit) = yit − bk ∗kit. (10.12)
The second step of the estimation procedure considers the expectation of yit+1 − bm ∗mit+1 − bl ∗ lit+1:
E(yit+1 − bm ∗mit+1 − bl ∗ lit+1 | kit+1)
= a + bk ∗kit+1 + E(wit+1 | wit)
= bk ∗kit +1 + g(wit). (10.13)
224 Global Integration and Technology Transfer

Assuming that ωit follows a first-order Markov process, one can rewrite ωit+1 as afunction of ωit, letting xit+1 be the innovation in ωit+1. Using equations (10.9) and(10.12), equation (10.13) becomes a function of iit and kit:
yit+1 − bm ∗mit+1 − bl ∗ lit+1 = bk ∗kit+1 + g(yit – bk ∗kit) + xit+1 +hit+1, (10.14)
where g is a third-order polynomial ofyit − bk ∗kit. This is the equation to be estimatedin the second stage of the procedure. Only in this stage is it possible to obtain consis-tent estimates of bk. Since the capital in use in a given period is assumed to beknown at the beginning of the period and xit+1 is mean independent of all variablesknown at the beginning of the period, xit+1 is mean independent of kit +1. A nonlinearleast squares method is used to estimate equation (10.14).
A production function with the Olley-Pakes correction is estimated for eachindustry separately. From the estimation, the measure of total factor productivity(the difference between the actual and predicted output) is recovered and used inthe estimation of the basic model:22
tfpit = yit - bl ∗ lit - bk ∗kit - bm ∗ mit. (10.15)
The Olley-Pakes correction appears to work quite well. If the procedure suc-cessfully corrects for biases, one would expect to find a decrease in coefficients onlabor and material inputs and an increase in the capital coefficient relative to theOLS results. The material and labor coefficients move in the predicted direction in17 cases each, while the magnitude of the capital coefficient increases in 16 of 20cases (table 10.6).
Estimation Results from a Model in Differences
This section describes the results from a baseline specification, compares spilloversassociated with fully and partially owned foreign affiliates, and discusses robust-ness checks.
Baseline Specification
A model estimated in first differences produces findings that are consistent with thehypothesis that domestic firms benefit from the foreign presence in sectors they sup-ply. The first two columns of table 10.7 contain the results for the full sample andthe subsample of domestic firms. (Because of lack of space, the coefficients on inputsare not reported.) In both regressions a positive and significant coefficient on theproxy for spillovers through backward linkages can be found. The third and fourthcolumns present the results from the regressions with the Olley-Pakes correction.23
The estimations produce a positive and significant coefficient on the Backward variable
Does Foreign Direct Investment Increase the Productivity of Domestic Firms? 225

226 Global Integration and Technology Transfer
TABLE 10.6 Comparison of Coefficients from OLS and Olley-Pakes Regressions
Sector code 15 17 18 19
Coefficients from Olley-Pakes regressionsNumber of observationsin Stage I 1150 271 498 68ln (labor) 0.3395∗∗∗ 0.3823∗∗∗ 0.6211∗∗∗ 0.3201∗∗∗
ln (materials) 0.5036∗∗∗ 0.4356∗∗∗ 0.2312∗∗∗ 0.5256∗∗∗
ln (capital) 0.1002∗∗∗ 0.0176 0.0221 0.0547∗
Sum of coefficients 0.94 0.84 0.87 0.90
Coefficients from OLS regressionsln (labor) 0.4114∗∗∗ 0.4500∗∗∗ 0.7357∗∗∗ 0.3318∗∗∗
ln (materials) 0.5180∗∗∗ 0.4816∗∗∗ 0.2483∗∗∗ 0.5490∗∗∗
ln (capital) 0.0396∗∗∗ 0.0028 −0.0003 0.0038Sum of coefficients 0.97 0.93 0.98 0.88Change in l coefficient − − − −Change in m coefficient − − − −Change in k coefficient + + + +
Sector code 27 28 29 30
Coefficients fromOlley-Pakes regressionsNumber of observationsin Stage I 22 465 256 23ln (labor) 0.6059∗∗ 0.3917∗∗∗ 0.4885∗∗∗ 0.7412∗∗∗
ln (materials) 0.5703∗∗ 0.4475∗∗∗ 0.3851∗∗∗ 0.3394∗∗∗
ln (capital) −0.0922∗∗∗ 0.0528∗∗∗ 0.0455∗∗ −0.1521∗∗∗
Sum of coefficients 1.08 0.89 0.92 0.93
Coefficients from OLS regressionsln (labor) 0.7614∗∗∗ 0.3970∗∗∗ 0.5261∗∗∗ 0.6215∗∗∗
ln (materials) 0.2807∗∗∗ 0.4910∗∗∗ 0.4364∗∗∗ 0.2122ln (capital) −0.0606 0.0258∗∗ −0.0617∗∗∗ −0.1084Sum of coefficients 0.98 0.91 0.90 0.73Change in l coefficient − − − +Change in m coefficient + − − +Change in k coefficient − + + −

Does Foreign Direct Investment Increase the Productivity of Domestic Firms? 227
TABLE 10.6 (Continued )
Source: Authors∗Significant at the 10 percent level.∗∗Significant at the 5 percent level.∗∗∗Significant at the 1 percent level.
20 21 22 24 25 26
828 66 610 174 311 3640.3658∗∗∗ 0.1420∗ 0.4380∗∗∗ 0.2633∗∗∗ 0.3843∗∗∗ 0.4478∗∗∗
0.4797∗∗∗ 0.5272∗∗∗ 0.3391∗∗∗ 0.4601∗∗∗ 0.4748∗∗∗ 0.4804∗∗∗
0.0679∗∗∗ 0.1427∗∗∗ 0.0862∗∗∗ 0.1625∗∗∗ 0.0444∗∗∗ 0.0307∗∗∗
0.91 0.81 0.86 0.89 0.90 0.96
0.4558∗∗∗ 0.2655∗∗∗ 0.5048∗∗∗ 0.3072∗∗∗ 0.4360∗∗∗ 0.5134∗∗∗
0.4862∗∗∗ 0.6103∗∗∗ 0.3864∗∗∗ 0.5277∗∗∗ 0.5118∗∗∗ 0.4804∗∗∗
0.0214∗∗∗ 0.0420 0.0512∗∗∗ 0.0730∗∗∗ 0.0357∗∗ −0.0375∗∗∗
0.96 0.92 0.94 0.91 0.98 0.96− − − − − −− − − − − 0+ + + + + +
31 32 33 34 35 36
84 68 117 23 100 4000.4651∗∗∗ 0.2845∗∗∗ 0.3791∗∗∗ 0.2739∗ 0.5015∗∗∗ 0.4003∗∗∗
0.4374∗∗∗ 0.3833∗∗∗ 0.5275∗∗∗ 0.3497∗∗∗ 0.2769∗∗∗ 0.4460∗∗∗
−0.0167 0.0132 0.0510 0.0850 0.0945∗∗∗ 0.0737∗∗∗
0.89 0.68 0.96 0.71 0.78 0.92
0.4296∗∗∗ 0.3429∗∗∗ 0.4704∗∗∗ 0.2542∗∗ 0.5233∗∗∗ 0.4567∗∗∗
0.5189∗∗∗ 0.4611∗∗∗ 0.5311∗∗∗ 0.3531∗∗∗ 0.3158∗∗∗ 0.5030∗∗∗
−0.0527 0.0862 −0.0339 0.1322∗∗ 0.0326 −0.01230.90 0.89 0.97 0.74 0.87 0.95
+ − − + − −− − − − − −+ − + − + +

228
Glo
bal In
tegratio
n an
d Tech
no
log
y Transfer
First differences Second differences Fourth differences
OLS Olley-Pakes method OLS Olley-Pakes method OLS Olley-Pakes method
Variable All Domestic All Domestic All Domestic All Domestic All Domestic All Domestic
Foreign share 0.0006 0.0009 0.0008 0.0003 0.0015 0.0006
(0.0007) (0.0007) (0.0007) (0.0006) (0.0010) (0.0008)
Backward 0.0382∗∗∗ 0.0360∗∗∗ 0.0407∗∗ 0.0347∗ 0.0321∗∗∗ 0.0301∗∗ 0.0539∗∗∗ 0.0523∗∗∗ 0.0232∗∗ 0.0256∗∗ 0.0590∗∗∗ 0.0706∗∗∗
(0.0101) (0.0103) (0.0163) (0.0193) (0.0120) (0.0125) (0.0101) (0.0113) (0.0105) (0.0111) (0.0080) (0.0087)
Forward −0.0050 −0.0073∗∗ −0.0060 −0.0118∗ −0.0079∗ −0.0088 −0.0061 −0.0039 −0.0027 0.0026 0.0004 0.0192∗∗∗
(0.0033) (0.0034) (0.0055) (0.0063) (0.0047) (0.0055) (0.0060) (0.0073) (0.0067) (0.0040) (0.0067) (0.0041)
Horizontal −0.0003 −0.0006 −0.0019 −0.0022 0.0015 0.0013 0.0024 0.0012 0.0103∗∗∗ 0.0114∗∗∗ 0.0108∗∗∗ 0.0078∗∗∗
(0.0013) (0.0013) (0.0025) (0.0024) (0.0021) (0.0022) (0.0026) (0.0027) (0.0013) (0.0015) (0.0011) (0.0012)
H4 0.0000 0.0000 0.0001∗∗∗ 0.0001∗∗∗ 0.0000 0.0000 0.0000 0.0001 0.0002∗∗ 0.0003∗∗∗ 0.0000 0.0003∗∗∗
(0.0000) (0.0000) (0.0000) (0.0000) (0.0000) (0.0000) (0.0000) (0.0000) (0.0001) (0.0000) (0.0001) (0.0000
Demand 0.6103∗∗∗ 0.6752∗∗∗ 0.3699 0.5341∗ 0.3527∗ 0.3911∗∗ 0.2464 0.4137 −0.2196∗ −0.2344∗ −0.3966∗∗∗ −0.3806∗∗∗
(0.1945) (0.1929) (0.2934) (0.2806) (0.1869) (0.1872) (0.2970) (0.3003) (0.1133) (0.1305) (0.1007) (0.1132)
Number ofobservations 6,853 5,916 3,765 3,084 4,551 3,923 2,379 1,920 1,135 964 833 681
R2 0.49 0.49 0.08 0.08 0.62 0.61 0.09 0.09 0.70 0.69 0.06 0.06
TABLE 10.7 Results of OLS and Olley-Pakes Regressions in First, Second, and Fourth Differences
Source: Author.
Note: Standard errors in parentheses have been corrected for clustering for each industry in each year. In the regressions without the Olley-Pakes correction, thedependent variable is ∆ln firm output and the right-hand side includes ∆ln capital stock, ∆ln labor, and ∆ln materials. In models employing the Olley-Pakes procedure,the dependent variable is ∆ln total factor productivity. All regressions include industry, region, and year fixed effects. ∗Significant at the 10 percent level.∗∗Significant at the 5 percent level.∗∗∗Significant at the 1 percent level.
Does Foreign Direct Investment Increase the Productivity of Domestic Firms? 229
in both the full sample and the subsample of domestic firms. The size of the coef-ficients is similar across columns and slightly larger in the case of the full sample.The magnitude of the effect is economically meaningful. A one standard deviationincrease in the foreign presence in the sourcing sectors (that is, an increase of4 percentage points in the backward variable) is associated with a 15 percent risein output of each domestic firm in the supplying industry.24
There is little evidence that spillovers take place through the other channels. Thecoefficient on the Horizontal variable does not appear to be statistically significant,which is consistent with the literature that fails to find a positive intraindustry effectin developing countries (for example, Aitken and Harrison 1999; Djankov andHoekman 2000; Konings 2001). The Forward variable, in contrast, bears a negativesign but appears to be statistically significant in only two regressions.
As for the other control variables, there is no indication of a positive associationbetween changes in foreign equity share and productivity growth. As in Aitken andHarrison (1999), the Foreign Share is positively correlated with productivity levels (recallthe results from table 10.5) but not with growth rates, suggesting that foreign firms maybe investing in the most productive domestic enterprises.25 A positive coefficient is foundon demand in downstream sectors, indicating the existence of procyclical productivityeffects. The data suggest a positive correlation between industry concentration and pro-ductivity growth, but the results are statistically significant in only two cases.26
To check the robustness of the results, a model in second and fourth differencesis estimated. Since the sample covers only five years of data, the specification infourth differences is the longest difference that can be employed. A positive and sig-nificant coefficient on the Backward variable is found in all specifications, evidencethat is consistent with the hypothesis that productivity spillovers are taking placethrough contacts between domestic firms and their foreign customers in down-stream sectors. There is no indication of the other type of vertical spillovers, as theForward variable appears to be insignificant in the majority of cases. As for intra-sectoral spillovers, only the results on the long differences suggest their existence.These results should be treated with caution, however, as they are based on a smallnumber of observations. The reduction in the sample size may also be responsible forthe change in the sign of demand from downstream sectors, which, in the fourth dif-ference specification, appears to be negatively correlated with firm productivity.27
Full versus Partial Foreign Ownership
Next consider the hypothesis that backward linkages associated with partiallyowned foreign projects lead to greater spillovers than linkages associated withwholly owned foreign affiliates because of different propensities to engage in localsourcing. To examine this question, two measures of backward linkages are calculated

for the two types of foreign investments. The proxy for fully owned foreign proj-ects is defined as
Backward (Full Ownership)jt = Σk if k ≠ j ajk ∗ (Σi for all i ∈k WOSit
∗ Foreign Shareit ∗ Yit)/Σi for all i ∈ k Yit, (10.16)
where WOS is a dummy for wholly owned subsidiaries. WOS is equal to 1 for firmswhose share of foreign capital is at least 99 percent.28 The measure for partiallyowned investments (those with foreign capital participation greater than 10 percentbut less than 99 percent) is defined in an analogous manner.
The results support the hypothesis (table 10.8). A significant and positive corre-lation is found between changes in output of domestic firms and backward linkagesassociated with partially foreign owned projects but not wholly foreign owned affil-iates. The difference between the magnitudes of the two coefficients is statistically sig-nificant in three out of four cases (in the case of the full sample, at the 1 percent level).These findings are consistent with the observation that projects owned jointly bydomestic and foreign entities are more likely to source locally, thus creating greaterscope for spillovers to firms operating in upstream sectors.
The other variables exhibit patterns similar to those observed in table 10.7. Theonly exception is the Forward measure, which appears to be negative and statisticallysignificant in three out of four cases, suggesting that foreign presence in upstreamsectors has a negative impact on the performance of local firms in using industries.This finding is similar to that obtained by Schoors and van der Tol (2001). A possi-ble explanation is that after buying out domestic firms in supplying sectors, foreignowners upgrade production facilities and manufacture more sophisticated products,which are then sold at a higher price. Local firms in using sectors that purchase theseinputs may have limited ability to benefit from their higher technological contentbut are forced to bear the higher cost.
Another reason why the extent of foreign ownership may matter for spillovers isthe control over company operations. Foreign owners may be more inclined toimport intermediate inputs (for example, due to their familiarity with foreign sup-pliers) and may be in better position to do so in enterprises in which they havemajority ownership. Thus as a robustness check, a model comparing the effect ofminority- versus majority-owned foreign investments on spillovers through back-ward linkages was estimated. Since no significant difference between verticalspillovers from the two types of projects was found, the results are not reported here.These findings are consistent with the observation that domestic capital participa-tion in FDI projects lowers foreign investors’ costs of using local suppliers and thusresults in more local sourcing and greater productivity spillovers to domestic pro-ducers of intermediate inputs.
230 Global Integration and Technology Transfer

Robustness Checks
This section describes three additional extensions and robustness checks. First, it isconceivable, though not very likely, that the results on the effect of backward link-ages are driven by the level of concentration in purchasing industries (which may
Does Foreign Direct Investment Increase the Productivity of Domestic Firms? 231
OLS Olley-Pakes method
Variable All Domestic All Domestic
Foreign share 0.0006 0.0010
(0.0007) (0.0007)
Backward (partial ownership) 0.0444∗∗∗ 0.0394∗∗∗ 0.0499∗∗∗ 0.0401∗∗
(0.0085) (0.0096) (0.0146) (0.0190)
Backward (full ownership) 0.0040 0.0154 0.0020 0.0090(0.0110) (0.0133) (0.0171) (0.0223)
Forward −0.0053∗ −0.0074∗∗ −0.0066 −0.0121∗
(0.0030) (0.0032) (0.0053) (0.0062)
Horizontal −0.0009 −0.0009 −0.0025 −0.0026(0.0012) (0.0012) (0.0024) (0.0023)
H4 0.0000 0.0000 0.0001∗∗∗ 0.0001∗∗∗
(0.0000) (0.0000) (0.0000) (0.0000)
Demand 0.6181∗∗∗ 0.6817∗∗∗ 0.3794 0.5427∗∗
(0.1778) (0.1825) (0.2810) (0.2698)
R2 0.49 0.49 0.08 0.08F-stat (BKFO = BKPO) 12.01 2.91 6.41 1.68
Prob F > 0 0.00 0.09 0.01 0.20
TABLE 10.8 Share of Foreign Ownership and ProductivitySpillovers
Source: Author.
Note: Specification in first differences. Standard errors in parentheses have been corrected for clusteringfor each industry in each year. In the regressions without the Olley-Pakes correction, the dependentvariable is ∆ln firm output and the right-hand side includes ∆ln capital stock, ∆ln labor, and ∆lnmaterials. In models employing the Olley-Pakes procedure, the dependent variable is ∆ln total factorproductivity. All regressions include industry, region, and year fixed effects. BKFO = Backward (fullownership); BKPO = Backward (partial ownership). ∗Significant at the 10 percent level.∗∗Significant at the 5 percent level.∗∗∗Significant at the 1 percent level.

232 Global Integration and Technology Transfer
be correlated with foreign presence) rather than genuine knowledge spillovers fromFDI. For instance, both domestic and foreign enterprises operating in concentratedsectors may have more resources to provide assistance to their suppliers, althoughat the same time they may be less inclined to do so. In contrast, firms in competitiveindustries may have fewer resources to support their suppliers but a greater incen-tive to transfer knowledge to downstream sectors in order to obtain higher-qualityor less expensive inputs. Thus ex ante the effect of concentration is ambiguous.
To eliminate the alternative explanation driven by the above arguments, amodel is estimated to test whether a differential effect of foreign presence in thetwo types of downstream industries exists. The U.S. Department of Justice defini-tion of concentrated sectors (those with a Herfindahl index for the four largestfirms exceeding 1,800) is employed to calculate separate measures of Backward forconcentrated and competitive industries.29 The results indicate that foreign pres-ence in both types of upstream industries leads to positive spillovers to supplyingsectors (table 10.9). The Backward variable is statistically significant seven out ofeight times—the only exception being the case of spillovers from concentrated indus-tries in the regression with the Olley-Pakes correction estimated on the subsample ofdomestic firms. In all four models, there is no statistically significant differencebetween the magnitude of the backward linkage effect for the two types of sectors,suggesting that the level of concentration in upstream sectors is not a concern inthe model.
Second, the motivation for undertaking FDI is likely to affect the extent of localsourcing by foreign subsidiaries. It has been suggested that domestic market-orientedforeign affiliates tend to purchase more inputs locally than their export-orientedcounterparts (Altenburg 2000; UNCTC 2000). Exporting affiliates that are part ofinternational production networks are more likely to be dependent on the globalsourcing policies of their parent company and thus may have less freedom to choosetheir suppliers. Moreover, quality and technical requirements associated with goodstargeted for the domestic market may be lower, so local suppliers may find it easierto serve multinationals focused on the domestic market. In contrast, if multina-tionals serving global markets impose more stringent cost and quality requirementsand thus necessitate greater adjustments and larger productivity improvements onthe part of local suppliers, one may expect more spillovers to be associated withexporting multinationals. This effect would be reinforced by the fact that multina-tionals serving global markets may possess superior technologies, creating greateropportunities for learning by local suppliers. In summary, the theoretical predic-tions regarding the relationship between export orientation of multinationals andspillovers are ambiguous.
To examine whether the export orientation of foreign affiliates matters forspillovers, two separate measures of backward linkages are calculated: one for affiliates

Does Foreign Direct Investment Increase the Productivity of Domestic Firms? 233
OLS Olley-Pakes method
Variable All Domestic All Domestic
Foreign share 0.0006 0.0009(0.0007) (0.0007)
Backward (concentrated) 0.0394∗∗∗ 0.0360∗∗∗ 0.0401∗∗ 0.0258(0.0131) (0.0126) (0.0187) (0.0193)
Backward (competitive) 0.0379∗∗∗ 0.0360∗∗∗ 0.0409∗∗ 0.0383∗
(0.0107) (0.0108) (0.0187) (0.0214)
Forward −0.0050 −0.0073∗∗ −0.0059 −0.0115∗
(0.0033) (0.0033) (0.0054) (0.0061)
Horizontal −0.0003 −0.0006 −0.0019 −0.0020(0.0013) (0.0013) (0.0025) (0.0024)
H4 0.0000 0.0000 0.0001∗∗∗ 0.0001∗∗∗
(0.0000) (0.0000) (0.0000) (0.0000)
Demand 0.6158∗∗∗ 0.6754∗∗∗ 0.3684 0.5099*(0.2210) (0.2203) (0.3107) (0.3032)
Number of observations 6,853 5,916 3,765 3,084R2 0.49 0.49 0.08 0.08
F-stat (BK concentrated =BK competitive) 0.02 0.00 0.00 0.33
Prob F > 0 0.90 1.00 0.97 0.57
TABLE 10.9 Concentration of Downstream Sectors and Productivity Spillovers
Source: Author.
Note: Specification in first differences. Standard errors in parentheses have been corrected for clusteringfor each industry in each year. In the regressions without the Olley-Pakes correction, the dependentvariable is ∆ln firm output and the right-hand side includes ∆ln capital stock, ∆ln labor, and ∆lnmaterials. In models employing the Olley-Pakes procedure, the dependent variable is ∆ln total factorproductivity. All regressions include industry, region, and year fixed effects. BK = Backward.∗Significant at the 10 percent level.∗∗Significant at the 5 percent level.∗∗∗Significant at the 1 percent level.
focused mostly on exporting and one for foreign firms targeting the domestic mar-ket. The measure for affiliates is defined as
Backward (Export-Oriented)jt = Σk if k ≠ j ajk ∗ (Σi for all i ∈k Export-Orientedit
∗ Foreign Shareit ∗ Yit)/Σi for all i ∈ k Yit, (10.17)

234 Global Integration and Technology Transfer
where Export-Orientedit is equal to 1 if the share of output exported by firm i is above50 percent and 0 otherwise. The measure for domestic market-oriented foreign affil-iates is defined analogously. The results (not reported here) suggest that both typesof foreign affiliates are associated with spillovers to upstream sectors. While the mag-nitude of the coefficient on domestic market-oriented affiliates is larger in three outof four cases, the difference between the two coefficients is not statistically significant.
The same exercise was performed for two additional cut-off points, 66 and 90percent of output exported, but only in regressions estimated with the Olley-Pakescorrection on the subsample of domestic firms was the coefficient on Backward(Domestic market-oriented) significantly larger than the coefficient on the measureof spillovers associated with exporting affiliates. Thus there is some indication thatdomestic market-oriented FDI projects are correlated with greater productivityspillovers to their local suppliers, although the evidence is not very robust.
To correct for potential biases in coefficients on variable factor inputs, the shareof foreign capital as well as other sectoral variables (Horizontal, Backward, Forward,H4, and Demand) was included in the first stage of the Olley-Pakes procedure. Foreach of the exercises presented in tables 10.7–10.9, a separate Olley-Pakes proce-dure with the relevant spillover measures added to the first stage was estimated. Theresults from this estimation led to exactly the same conclusions as those presentedhere (and are therefore not shown). A likely reason why this modification did notproduce significant changes in the results is that investment, which enters the firststage of the Olley-Pakes procedure in the polynomial form, picks up most of theeffect that foreign entry and presence have on firm behavior.
Conclusions
In contrast to earlier literature, which focused on intraindustry spillovers from FDI,this chapter tests for productivity spillovers taking place through backward linkages(contacts between foreign affiliates and their domestic suppliers) and forward link-ages (interactions between foreign suppliers of intermediate inputs and their domes-tic customers). The analysis, based on a firm-level panel data set from Lithuania,addresses econometric issues that may have biased the findings of earlier research,such as endogeneity of input demand and correction of standard errors to accountfor the fact that, while observations pertain to firms, the variables of interest are at theindustry level.
The results are consistent with the presence of productivity spillovers taking placethrough backward linkages. They suggest that a one standard deviation increasein the foreign presence in downstream sectors is associated with a 15 percent rise inoutput of each domestic firm in supplying industries. Productivity benefits arefound to be associated with partially but not fully owned foreign projects, a result
that is in line with the evidence that suggests that partially owned foreign projectsengage in more local sourcing than fully owned foreign projects.As was the case withthe earlier firm-level studies of developing countries, no evidence of intrasectoralspillovers is found. Nor is there any indication of spillovers stemming from a multi-national presence in sectors supplying intermediate inputs.
More research is needed to fully understand the effect of FDI on host countries.In particular, it would be useful to confirm the findings of this chapter using datathat allow individual firms to be identified as suppliers to multinationals ratherthan relying on input-output matrices to measure interactions between sectors. Itwould also be interesting to learn more about host country and investor character-istics that determine the extent of spillovers operating through different channels.It is to be hoped that improved data availability will allow researchers to examinethese questions in the future.
Notes
1. The pioneering work on this issue done by Caves (1974) focused on Australia. It was followed bystudies looking at Mexico, where, due to the large technological gap between foreign and domestic firms,the scope for spillovers may have been higher (see Blomström and Persson 1983; Blomström and Wolff1994; Blomström 1989). The criticism regarding reverse causality does not apply to all industry-levelresearch, as some studies look at changes taking place between two points in time (Blomström 1986 onMexico) or rely on panel data (Liu, Wang, and Wei 2000 on the United Kingdom) and still conclude thatpositive spillovers from FDI exist.
2. For surveys of the literature on spillovers from FDI, see Görg and Strobl (2001) and Lipsey (2002).3. For a theoretical justification of spillovers through backward linkages, see Rodríguez-Clare (1996),
Markusen and Venables (1999), and Lin and Saggi (2004). For case studies, see Moran (2001).4. Kugler (2000) finds intersectoral technology spillovers from FDI in Colombia. However, he does
not distinguish between the channels through which such spillovers may be occurring (backward ver-sus forward linkages).
5. See UNCTC (2001, chapter 4) for a comprehensive review of this topic.6. For instance, during the 1990–2000 period the number of scientists and engineers in research and
development activities per 1 million people was 2,031 in Lithuania, 2,139 in the Republic of Korea, 711in Argentina, 168 in Brazil, and 154 in Malaysia (World Bank 2003b).
7. Several studies (Aitken, Harrison, and Lipsey 1996; Girma, Greenaway, and Wakelin 2001) haveshown that foreign firms pay higher wages than domestic firms. Multinationals have also been found tobe sensitive to the strength of intellectual property rights protection in host countries (see Javorcik 2004).
8. As numerous case studies indicate, multinationals often provide technical assistance to their sup-pliers in order to raise the quality of their products or facilitate innovation (see Moran 2001). They helpsuppliers with management training and organization of the production process, quality control, pur-chase of raw materials, and even finding additional customers. The existence of linkages does not nec-essarily guarantee that spillovers take place, nor does the fact that multinationals may charge for servicesprovided preclude the presence of spillovers. Spillovers take place when foreign affiliates are unable toextract the full value of the resulting productivity increase through direct payment or the lower pricesthey pay for intermediates sourced from the local firm.
9. For instance, many multinationals require their suppliers to obtain International StandardsOrganization (ISO) quality certifications.
10. Greenfield projects may be undertaken jointly by foreign and local entities, but in this case theyshould be lumped together with joint ventures, as the participation of a local company brings access to
Does Foreign Direct Investment Increase the Productivity of Domestic Firms? 235

domestic suppliers. This classification will, however, be problematic in the case of full acquisitionsundertaken by foreigners.
11. The large jump in FDI inflows due to this transaction does not affect the results of this chapter,as only manufacturing sectors are included in the econometric analysis.
12. A recent study examining the quality of data collected by statistical offices ranked Lithuania sec-ond among 20 transition economies (see Belkindas, Dinc, and Ivanova 1999).
13. This approach was pioneered by Griliches and Ringstad (1971) and used by Tybout, de Melo,and Corbo (1991). Defining employment as the number of workers yields similar results.
14. This definition is analogous to that in Aitken and Harrison (1999), who use employment asweights. Schoors and van der Tol (2001) as well as Blalock (2001) employ output weights but do not takeinto account the share of foreign equity, treating as foreign total output of firms with at least 10 or20 percent foreign equity, respectively.
15. To illustrate the meaning of the variable, suppose that the sugar industry sells half of its outputto jam producers and half to chocolate producers. If no multinationals are producing jam but half of allchocolate production comes from foreign affiliates, the Backward variable will be calculated as follows:(0.5 ∗ 0) + (0.5 ∗ 0.5) = 0.25.
16. Since relationships between sectors may change over time (although a radical change is unlikely),using multiple input-output matrices would be ideal. Unfortunately, input-output matrices for lateryears are unavailable. Similarly, employing a matrix excluding imports would be preferable, but such amatrix does not exist. The results should be interpreted with these two caveats in mind.
17. Including the share of intermediates supplied within the sector in the Backward measure doesnot change the conclusions with respect to the correlation between firm productivity and foreign pres-ence in the sourcing sectors.
18. Domestic firms are defined as those with less than 10 percent foreign equity.19. The index is defined as the sum of the squared market shares of the four largest producers in
a given sector. Its value may range from 0 to 10,000. As Nickell (1996) notes, predictions of the theo-retical literature on the impact of competition on productivity are ambiguous. In his empirical analy-sis, however, Nickell finds evidence of a positive correlation between competition and productivitygrowth.
20. More precisely, Demandjt = Σk ajk ∗ Ykt, where ajk is the input-output matrix coefficient indicatingthat in order to produce one unit of good k, ajk units of good j are needed. Ykt stands for industry k out-put deflated by an industry-specific deflator.
21. In this case, the fixed effect for region r captures not just the fact that region r is an attractivebusiness location but also that its attractiveness is changing over time.
22. While the Olley-Pakes method also allows for taking into account firm exit, it is not done here,because the data do not allow one to distinguish between firm exit from the sample due to liquidationand firm exit due to not being included in the group of enterprises surveyed in a given year.
23. The number of observations is smaller in these regressions, as the Olley-Pakes procedure can beapplied only to firms reporting positive gross investment in a given year.
24. The calculation is based on the coefficient from the regression with the Olley-Pakes correctionestimated on the subsample of domestic firms (table 10.7, column 4).
25.This conclusion is supported by the findings obtained by Djankov and Hoekman (2000).Aitken andHarrison (1999) report a similar pattern of results in their analysis of Indonesian data. As an additionalcheck, an indicator variable for the cases in which the foreign share increases from less than 50 percentto more than 50 percent (thus giving the foreign investor majority ownership) was experimented with,but it did not appear to be statistically significant.
26. This finding would be consistent with a Schumpeterian-style argument that more monopolisticfirms can more readily fund research and development expenditure because they face less market uncer-tainty and have a larger and more stable cash flow (see Levin, Cohen, and Mowery 1985).
27. This change is not due to multicolinearity with the Backward variable, as the correlation betweenthe two is 0.3.
236 Global Integration and Technology Transfer

28. There are 342 observations pertaining to fully owned foreign affiliates and another 35 observa-tions for firms whose foreign capital share is 99–100 percent. Together they constitute 27 percent of allobservations of firms with foreign capital participation.
29. The following seven sectors fall into the concentrated category: chemicals and chemical prod-ucts (NACE 24); basic metals (NACE 27); office machinery and computers (NACE 30); electrical equip-ment and apparatus (NACE 31); radio, TV, and communications equipment (NACE 32); motor vehicles(NACE 34); and other transport equipment (NACE 35).
References
Aitken, Brian J., and Ann E. Harrison. 1999. “Do Domestic Firms Benefit from Direct Foreign Invest-ment? Evidence from Venezuela.” American Economic Review 89 (3): 605–18.
Aitken, Brian, Ann E. Harrison, and Robert E. Lipsey. 1996.“Wages and Foreign Ownership: A ComparativeStudy of Mexico,Venezuela and the United States.” Journal of International Economics 40 (3–4): 345–71.
Altenburg, Tilman. 2000. “Linkages and Spillovers between Transnational Corporations and Small andMedium-Sized Enterprises in Developing Countries: Opportunities and Best Policies.” In TNC-SMELinkages for Development: Issues-Experiences-Best Practices, ed. United Nations Conference on Tradeand Development, 3–61. New York and Geneva: United Nations.
Belderbos, Rene, Giovanni Capannelli, and Kyoji Fukao. 2001. “Backward Vertical Linkages of ForeignManufacturing Affiliates: Evidence from Japanese Multinationals.”World Development 29 (1): 189–208.
Belkindas, Misha, Mustafa Dinc, and Olga Ivanova. 1999.“Statistical Systems Need Overhaul in Transi-tion Economies.” Transition 10 (4): 22–24.
Blalock, Garrick. 2001. “Technology from Foreign Direct Investment: Strategic Transfer through Sup-ply Chains.” Paper presented at the “Empirical Investigations in International Trade” conference,Purdue University, West Lafayette, IN, November 9–11.
Blomström, Magnus. 1986. “Foreign Investment and Productive Efficiency: The Case of Mexico.” Jour-nal of Industrial Economics 35 (1): 97–110.
———. 1989. Foreign Investment and Spillovers. London: Routledge.Blomström, Magnus, and Ari Kokko. 1998.“Multinational Corporations and Spillovers.” Journal of Eco-
nomic Surveys 12 (2): 1–31.Blomström, Magnus, and Hakan Persson. 1983. “Foreign Investment and Spillover Efficiency in an
Underdeveloped Economy: Evidence from the Mexican Manufacturing Industry.” World Develop-ment 11 (6): 493–501.
Blomström, Magnus, and Edward N. Wolff. 1994.“Multinational Corporations and Productivity Conver-gence in Mexico.” In Convergence of Productivity: Cross-National Studies and Historical Evidence, ed.William J. Baumol, Richard R. Nelson, and Edward N.Wolff, 263–84. Oxford: Oxford University Press.
Blomström, Magnus, Ari Kokko, and Mario Zejan. 2000. Foreign Direct Investment: Firm and Host Coun-try Strategies. London: Macmillan Press.
Caves, Richard E. 1974.“Multinational Firms, Competition and Productivity in Host-Country Markets.”Economica 41 (162): 176–93.
Djankov, Simeon, and Bernard Hoekman. 2000.“Foreign Investment and Productivity Growth in CzechEnterprises.” World Bank Economic Review 14 (1): 49–64.
EBRD (European Bank for Reconstruction and Development). 2001. Lithuania Investment Profile 2001.London: EBRD.
Girma, Sourafel, David Greenaway, and Katharine Wakelin. 2001. “Who Benefits from Foreign DirectInvestment in the UK?” Scottish Journal of Political Economy 48 (2): 119–33.
Görg, Holger, and Eric Strobl. 2001. “Multinational Companies and Productivity Spillovers: A Meta-Analysis.” Economic Journal 111 (475): 723–39.
Griliches, Zvi, and Jacques Mairesse. 1995.“Production Functions: The Search for Identification.”WorkingPaper 5067, National Bureau of Economic Research, Cambridge, MA.
Does Foreign Direct Investment Increase the Productivity of Domestic Firms? 237

Griliches, Zvi, and Vidar Ringstad. 1971. Economies of Scale and the Form of the Production Function.Amsterdam: North-Holland.
Haddad, Mona, and Ann E. Harrison. 1993. “Are There Positive Spillovers from Direct Foreign Invest-ment? Evidence from Panel Data for Morocco.” Journal of Development Economics 42 (1): 51–74.
Haskel, Jonathan E., Sonia C. Pereira, and Matthew J. Slaughter. 2002. “Does Inward Foreign DirectInvestment Boost the Productivity of Domestic Firms?” Working Paper 8724, National Bureau ofEconomic Research, Cambridge, MA.
IMF (International Monetary Fund).2003. International Financial Statistics Database.Washington,DC: IMF.Javorcik, Beata Smarzynska. 2004.“The Composition of Foreign Direct Investment and Protection of Intel-
lectual Property Rights: Evidence from Transition Economies.”European Economic Review 48 (1): 39–62.Keller, Wolfgang, and Stephen R. Yeaple. 2003.“Multinational Enterprises, International Trade and Pro-
ductivity Growth: Firm Level Evidence from the United States.” NBER Working Paper No. 9504,National Bureau of Economic Research, Cambridge, MA.
Konings, Jozef. 2001.“The Effects of Foreign Direct Investment on Domestic Firms.” Economics of Tran-sition 9 (3): 619–33.
Kugler, Maurice. 2000. “The Diffusion of Externalities from Foreign Direct Investment: Theory Aheadof Measurement.” Discussion Papers in Economics and Econometrics, University of Southampton,United Kingdom.
Levin, Richard C., Wesley M. Cohen, and David C. Mowery. 1985.“R&D Appropriability, Opportunity,and Market Structure: New Evidence on Some Schumpeterian Hypotheses.” American EconomicReview 75 (2): 20–24.
Lin, Ping, and Kamal Saggi. 2004.“Multinational Firms and Backward Linkages: A Survey and a SimpleModel.” Department of Economics, Southern Methodist University, Dallas, TX.
Lipsey, Robert E. 2002.“Home and Host Country Effects of FDI.”Working Paper 9293, National Bureauof Economic Research, Cambridge, MA.
Liu, Xiaming, Pamela Siler, Chengqi Wang, and Yingqi Wei. 2000.“Productivity Spillovers from ForeignDirect Investment: Evidence from UK Industry Level Panel Data.” Journal of International BusinessStudies 31 (3): 407–25.
Markusen, James R., and Anthony J. Venables. 1999.“Foreign Direct Investment as a Catalyst for Indus-trial Development.” European Economic Review 43 (2): 335–56.
Moran, Theodore H. 2001. Parental Supervision: The New Paradigm for Foreign Direct Investment andDevelopment. Washington, DC: Institute for International Economics.
Moulton, Brent R. 1990. “An Illustration of a Pitfall in Estimating the Effects of Aggregate Variables onMicro Units.” Review of Economics and Statistics 72 (2): 334–38.
Nickell, Stephen. 1996.“Competition and Corporate Performance.” Journal of Political Economy 104 (4):724–46.
Olley, Steven G., and Ariel Pakes. 1996. “The Dynamics of Productivity in the TelecommunicationsEquipment Industry.” Econometrica 64 (6): 1263–97.
OECD (Organisation for Economic Co-operation and Development). 2000. Lithuania: Foreign DirectInvestment Impact and Policy Analysis. Paris.
———. 2001. Reviews of Foreign Direct Investment: Lithuania. Paris.Rodríguez-Clare, Andrés. 1996.“Multinationals, Linkages, and Economic Development.”American Eco-
nomic Review 86 (4): 852–73.Rodrik, Dani. 1999. “The New Global Economy and Developing Countries: Making Openness Work.”
Overseas Development Council Policy Essay No. 24, Baltimore, MD.Schoors, Koen, and Bartoldus van der Tol. 2001. “The Productivity Effect of Foreign Ownership on
Domestic Firms in Hungary.” Paper presented at the International Atlantic Economic Conference,Philadelphia, PA, October 11–14.
Toth, Istvan Janos, and Andras Semjen. 1999. “Market Links and Growth Capacity of Enterprises in aTransforming Economy: The Case of Hungary.” In Market Links, Tax Environment and FinancialDiscipline of Hungarian Enterprises, ed. Istvan Janos Toth and Andras Semjen, 1–37. Budapest: Insti-tute of Economics, Hungarian Academy of Sciences.
238 Global Integration and Technology Transfer

Tybout, James, Jaime de Melo, and Vittorio Corbo. 1991. “The Effects of Trade Reforms on Scale andTechnical Efficiency.” Journal of International Economics 31 (3–4): 231–50.
UNCTC (United Nations Centre on Transnational Corporations). 2000. The Competitiveness Challenge:Transnational Corporations and Industrial Restructuring in Developing Countries. New York andGeneva: United Nations.
———. 2001. World Investment Report: Promoting Linkages. New York and Geneva: United Nations.World Bank. 2003a. “Developing Knowledge-Intensive Sectors, Technology Transfers, and the Role of
FDI.” Foreign Investment Advisory Service, Washington, DC.———. 2003b. World Development Indicators Database. Washington, DC: World Bank.
Does Foreign Direct Investment Increase the Productivity of Domestic Firms? 239


Product Quality,Productive Efficiency,
and InternationalTechnology Diffusion:
Evidence from Plant-LevelPanel Data
Aart Kraay, Isidro Soloaga, and James R. Tybout
241
11
A casual tourist can confirm that technologies often make their way from the devel-oped world to less developed countries. However, despite the critical importance oftechnology diffusion for economic development, the evidence on many aspects of thisprocess remains sketchy. What mechanisms most frequently transmit foreign tech-nologies to firms in less developed countries? Do these foreign technologies affectboth productive efficiency and product quality in the recipient firms? Under whatcircumstances do firms pursue activities that give them access to foreign knowledge?This chapter develops a new methodology for addressing these issues and appliesthe framework to plant-level panel data from Colombia, Mexico, and Morocco.
The Literature
The limited understanding of international knowledge diffusion does not derivefrom neglect of the topic. In the empirical literature alone, at least three differentmethodological approaches have been deployed. At the very micro level, analystshave used case studies and qualitative surveys to generate descriptions of learning
The authors would like to thank Wolfgang Keller, Jim Levinsohn, Marc Melitz, and Mark Roberts for use-
ful discussions and absolve them of blame for any methodological flaws that remain.

processes at individual firms (see, for example, Hobday 1995; Lall 1987; Katz 1987;Pack 1987; Rhee, Ross-Larson, and Pursell 1984). This literature provides invalu-able details concerning firms’ efforts to absorb technology, as Pack (chapter 2 of thisvolume) observes, but it has to little to say quantitatively about the results of theseefforts in terms of productive efficiency or product quality. There are some excep-tions (for example, Pack 1987), but they are too few and based on such small sam-ples that they provide little basis for generalization.
At the other extreme, studies based on aggregated data have correlated cross-country patterns of productivity growth or productivity levels with various prox-ies for countries’ exposure to foreign knowledge and their ability to absorb it. Theseproxies include capital goods imports (de Long and Summers 1991; Keller 2000);trade with countries possessing large R&D stocks (Coe and Helpman 1995; Keller1998, 2000); foreign direct investment (FDI) inflows (Blomström, Lipsey, andZejan 1994); and domestic patent stocks (Eaton and Kortum 1996).1 Unlike casestudies and descriptive surveys, cross-country regressions document broad pat-terns of association, providing a basis for generalization. However, most are sub-ject to a variety of econometric criticisms, including aggregation bias, omittedvariable bias, measurement error bias, and simultaneity bias.
Plant- or firm-level econometric studies correlate proxies for firms’ exposure toforeign knowledge with their productivity levels or growth rates. To cite a fewexamples, Aitken and Harrison (1999), Haddad and Harrison (1993), and Djankovand Hoekman (chapter 8 of this volume) study FDI; Chen and Tang (1987); Aw andHwang (1995); Clerides, Lach, and Tybout (1998); Kraay (chapter 7 of this vol-ume); and Bigsten and others (1999) study exports.2 By sacrificing the nuance anddetail provided by case studies, these micro econometric studies gain the ability totreat large numbers of producers and make statistical inferences. They do betterthan the macro studies in terms of identifying specific correlates of productivityand avoiding aggregation bias.
Plant-level econometric studies have significant shortcomings, however. Onecommon problem is failure to disentangle causality. For example, contemporane-ous correlation between exports and efficiency tells us nothing about what causedwhat. Even studies that use lagged exports to predict current efficiency may missthe knowledge transmission mechanism, as Westphal (2001) emphasizes.
A second problem is that productivity is almost always poorly measured.3 Man-ufactured products are quite heterogeneous, even within narrowly defined indus-tries, so there is no single measure of output that can be compared across firms.Real revenue is typically used as a stand-in for physical product, but this variableresponds to product-specific price adjustments as well as fluctuations in physicalvolume. Productivity measures consequently confound productive efficiency andmarket power. Furthermore, when technology diffusion leads to product innovation
242 Global Integration and Technology Transfer

rather than process innovation, these productivity measures may miss the effectentirely. Finally, like cross-country regressions, studies in this literature usuallyfocus on a single conduit for international technology diffusion and ignore the oth-ers, opening the door to omitted variable bias.
The Contribution of This Chapter
As an econometric study based on plant-level data, this chapter falls squarely in thethird category mentioned before. It attempts to improve on existing methodologiesin two respects. First, we abandon the standard approach to measuring productiv-ity in favor of an alternative approach that treats the observed plant-level data onrevenues, costs, and market shares as reflecting equilibrium in a differentiatedproduct market. By using a new normalization and imposing sufficient demand-side structure, we avoid the problem of distinguishing real revenue from physicalproduct. We are also able to separately measure process innovations, which aremanifest in marginal cost reductions, and product innovations, which are manifestin heightened demand for a product at a given vector of goods prices. Accordingly,we can study the joint evolution of these processes and investigate whether improve-ments in one dimension are complemented or offset by changes in the other.
Second, we treat multiple channels for international technology diffusion in asingle integrated framework. This would not be important if the various activitiesthat transmit technology were unrelated to one another. But because of comple-mentarities and indivisibilities, they tend to come in bundles, predictable sequences,or both.4 Hence econometric models that treat any one of them as the unique sourceof foreign technology run a considerable risk of misattribution.
The main knowledge-transmitting activities identified by the case study literatureinclude FDI in domestic enterprises, joint ventures, outsourcing, licensing arrange-ments, importation of intermediate and capital goods, learning from exporting toknowledgeable buyers, and learning from the importation of final goods and fromreactions to changes in domestic market structures as these goods enter the country.It is not hard to identify reasons why firms’ decisions regarding these activities will berelated to one another. Exporters are more likely to use imported capital and inter-mediate goods, because they are granted preferential access to foreign exchange orbecause the product characteristics needed for exporting are best manufactured withthese goods. Similar input and capital good requirements may accompany licensingagreements. Firms with FDI are more likely to use imported intermediates, becausethe parent company can internalize some costs by doing so. Multinationals some-times locate plants abroad to exploit low wages while protecting their intangibleassets, such as proprietary knowledge and product reputation, so FDI and exportingcan also be complementary activities.
Product Quality, Productive Efficiency, and International Technology Diffusion 243

Methodology
To motivate our empirical model, we begin by sketching a dynamic model of indus-trial evolution in which firms make optimal decisions about their activity bundles.In turn, these bundles influence their future performance. Although the model isnot very formal, the discussion allows us to be explicit about the causal relation-ships we assume generated the data.
Determinants of Performance
From the perspective of managers, the activities described above generate revenuesby improving a firm’s unit production costs (cjt) or the appeal of its product (ajt),which we combine to form the performance vector ωjt = for the jth firm inperiod t. Then, presuming that the elements of ωjt evolve according to autoregres-sive processes, conditioned on exogenous firm characteristics (hereafter xjt) and thefirm’s history of activity bundles (hereafter Bjt−1), we write
(11.1)
where Ωjt = (ωjt, ωjt−1, ωjt−2,…), Bjt = (bjt, bjt−1, bjt−2,…), ejt is a serially uncorrelatedvector of unobserved innovations in the ωjt process, and the column vector of dum-mies bjt indicates which activity bundle the jth firm is pursuing at time t, if any.5
Determinants of Activity
Of course, the activities themselves are endogenous. We envision that firms weighfour kinds of effects on their profit streams when choosing which combination topursue. First, as described by equation (11.1), activities influence future realizationson the performance trajectories, ωjt. Second, in so doing they may also affect thefuture activity choices and performance of competing firms. Third, given the real-ization of ωjt, activity bundles can affect net operating profits by changing demandconditions—by, for example, providing access to foreign markets—or by affectingthe share of operating profits retained by the firm’s majority owners. Finally, the ini-tiation of activities generally involves start-up or adjustment costs.
The specifics of these effects on profits depend on the activity in question. Forexample, joint ventures, subcontracting, and FDI may transmit knowledge, improvea firm’s access to inputs, or both, thereby affecting the evolution of its performancevector, ωjt. These activities may also affect the firm’s operating profits by creating newmarkets for its products, branding its products, creating profit-sharing obligations,or diluting corporate control. Finally, joint ventures, subcontracting, and FDI involveup-front research costs and legal fees.
Similar observations apply to the other activities cited above. Firms that importintermediate or capital goods improve their performance trajectories by using
ω jt jt jt jt jtg B= − −ω( , , , ),x 1 1Ω e
( , )a cjt jt
244 Global Integration and Technology Transfer
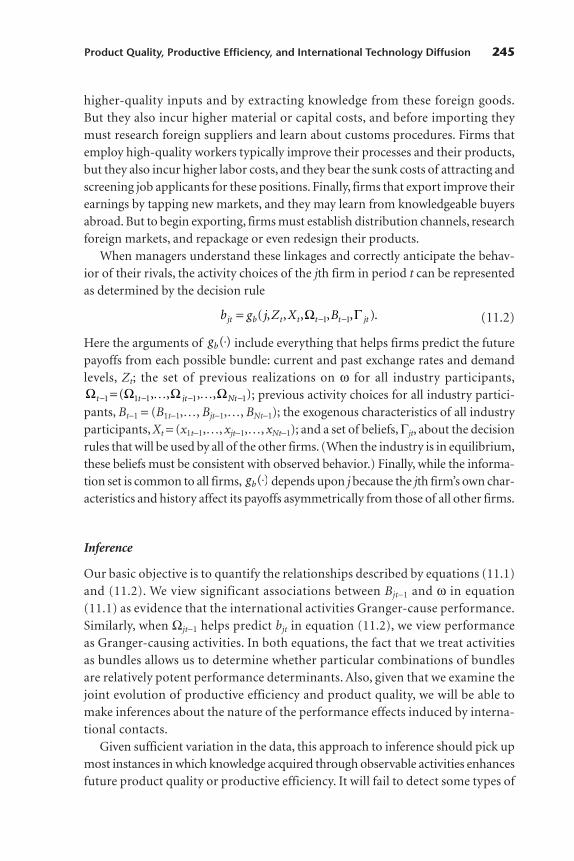
higher-quality inputs and by extracting knowledge from these foreign goods.But they also incur higher material or capital costs, and before importing theymust research foreign suppliers and learn about customs procedures. Firms thatemploy high-quality workers typically improve their processes and their products,but they also incur higher labor costs, and they bear the sunk costs of attracting andscreening job applicants for these positions. Finally, firms that export improve theirearnings by tapping new markets, and they may learn from knowledgeable buyersabroad. But to begin exporting, firms must establish distribution channels, researchforeign markets, and repackage or even redesign their products.
When managers understand these linkages and correctly anticipate the behav-ior of their rivals, the activity choices of the jth firm in period t can be representedas determined by the decision rule
(11.2)
Here the arguments of include everything that helps firms predict the futurepayoffs from each possible bundle: current and past exchange rates and demandlevels, Zt; the set of previous realizations on ω for all industry participants,
; previous activity choices for all industry partici-pants, Bt−1 = (B1t−1,…, Bjt−1,…, BNt−1); the exogenous characteristics of all industryparticipants, Xt = (x1t−1,…, xjt−1,…, xNt−1); and a set of beliefs, Γjt, about the decisionrules that will be used by all of the other firms. (When the industry is in equilibrium,these beliefs must be consistent with observed behavior.) Finally, while the informa-tion set is common to all firms, depends upon j because the jth firm’s own char-acteristics and history affect its payoffs asymmetrically from those of all other firms.
Inference
Our basic objective is to quantify the relationships described by equations (11.1)and (11.2). We view significant associations between Bjt−1 and ω in equation(11.1) as evidence that the international activities Granger-cause performance.Similarly, when Ωjt−1 helps predict bjt in equation (11.2), we view performanceas Granger-causing activities. In both equations, the fact that we treat activitiesas bundles allows us to determine whether particular combinations of bundlesare relatively potent performance determinants. Also, given that we examine thejoint evolution of productive efficiency and product quality, we will be able tomake inferences about the nature of the performance effects induced by interna-tional contacts.
Given sufficient variation in the data, this approach to inference should pick upmost instances in which knowledge acquired through observable activities enhancesfuture product quality or productive efficiency. It will fail to detect some types of
gb( )⋅
Ω Ω Ω Ωt t jt Nt− − − −=1 1 1 1 1( , , , , )… …
gb( )⋅
b g j Z X Bjt b t t t t jt= ( , , , , , ).Ω Γ− −1 1
Product Quality, Productive Efficiency, and International Technology Diffusion 245

linkages between activities and performance, however. For example, suppose a for-eign corporation subcontracts with a plant to become a supplier of one of its prod-ucts and it transmits the necessarily technical information to that plant. It may beyears before the plant begins to export the product to the buyer (see Kim 1997), sowhen the associated exports show up in the data, the plant’s performance trajec-tory will already have responded to the new knowledge and no association will bedetected. This scenario would generate the misleading impression that the out-sourcing activity responded to a productivity shock rather than vice versa.
Equation (11.1) will also miss technology diffusion that does not occur at thefirm level. For example, if firms acquire imported intermediate or capital inputsthrough an intermediary rather than by purchasing directly from foreign suppli-ers, the associated improvement in performance will not be attributed to foreignsources. Similarly, if firms that learn by engaging in international business serve asvaluable examples for others, the knowledge spillovers they generate will not beattributed to foreign sources. For all of these reasons, the results of the exercise thatfollows should be viewed as suggestive rather than definitive.
An Empirical Model
To render equations (11.1) and (11.2) empirically useful, we must surmount sev-eral obstacles. The first problem is measuring the performance vector, ω. Somehowwe must measure unit production costs (cjt) and product attractiveness (cjt) con-cepts using plant-level data on revenues, intermediate input costs, market shares,labor costs, and crude capital stock proxies.
To render unit production costs observable, we use a novel normalization.Specifically, we define one unit of the jth plant’s product to be whatever that plantcan produce with a dollar’s worth of intermediate inputs. Since products are dif-ferentiated, this does not imply that a plant using a relatively large amount of inter-mediate inputs is producing a relatively valuable output. However, if firms were todiffer in the efficiency with which they convert intermediate goods into final out-put, this assumption would have the undesirable implication that efficiency gainsreduce output when the physical volume of final production does not change.6
Thus our normalization is accompanied by two strong assumptions: firms exhibitconstant-returns homothetic technologies, and these technologies differ acrossproducers only because of differences in primary factor efficiency.7 That is, the onlyreason why marginal cost schedules differ across firms is that some firms use laborand capital more effectively than others.
With these assumptions we can calculate unit (variable) production costs andoutput prices at the jth plant in year t as and where Cjt istotal variable costs (labor, intermediates, and energy); Ijt is intermediate input costs;
p R Ijt jt jt= ( ),/c C Ijt jt jt= ( )/
246 Global Integration and Technology Transfer
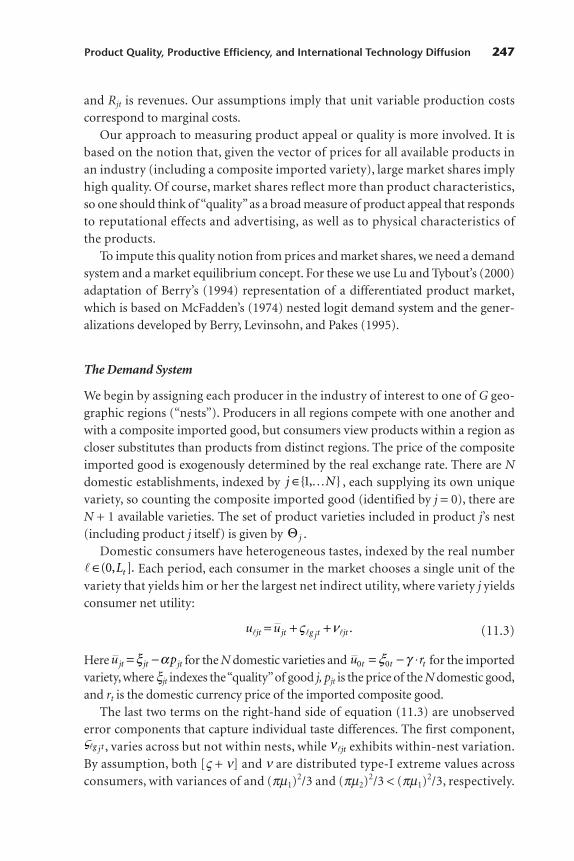
and Rjt is revenues. Our assumptions imply that unit variable production costscorrespond to marginal costs.
Our approach to measuring product appeal or quality is more involved. It isbased on the notion that, given the vector of prices for all available products inan industry (including a composite imported variety), large market shares implyhigh quality. Of course, market shares reflect more than product characteristics,so one should think of “quality”as a broad measure of product appeal that respondsto reputational effects and advertising, as well as to physical characteristics ofthe products.
To impute this quality notion from prices and market shares, we need a demandsystem and a market equilibrium concept. For these we use Lu and Tybout’s (2000)adaptation of Berry’s (1994) representation of a differentiated product market,which is based on McFadden’s (1974) nested logit demand system and the gener-alizations developed by Berry, Levinsohn, and Pakes (1995).
The Demand System
We begin by assigning each producer in the industry of interest to one of G geo-graphic regions (“nests”). Producers in all regions compete with one another andwith a composite imported good, but consumers view products within a region ascloser substitutes than products from distinct regions. The price of the compositeimported good is exogenously determined by the real exchange rate. There are Ndomestic establishments, indexed by , each supplying its own uniquevariety, so counting the composite imported good (identified by j = 0), there areN + 1 available varieties. The set of product varieties included in product j’s nest(including product j itself) is given by .
Domestic consumers have heterogeneous tastes, indexed by the real numberEach period, each consumer in the market chooses a single unit of the
variety that yields him or her the largest net indirect utility, where variety j yieldsconsumer net utility:
(11.3)
Here for the N domestic varieties and for the importedvariety, where xjt indexes the “quality”of good j, pjt is the price of the N domestic good,and rt is the domestic currency price of the imported composite good.
The last two terms on the right-hand side of equation (11.3) are unobservederror components that capture individual taste differences. The first component,
, varies across but not within nests, while exhibits within-nest variation.By assumption, both [V + n] and n are distributed type-I extreme values acrossconsumers, with variances of and (pm1)2/3 and (pm2)2/3 < (pm1)2/3, respectively.
nljtVlg jt
u rt t t0 0= − ⋅x γu pjt jt jt= −x α
u ujt jt g jt jtl l l= + +ς n .
l ∈( , ].0 Lt
Θ j
j N∈ … , 1
Product Quality, Productive Efficiency, and International Technology Diffusion 247

The indirect utility function parameters are identified only up to a scalar multiple,so we impose m1 = 1.8 We define s = 1 − m2/m1(0 < s < 1) to index the degree of sub-stitutability among, versus within, nests.9
Integrating over domestic consumers yields the standard nested logit expressionfor the demand for the jth domestic variety as a fraction of total domestic demandfor varieties in the jth product’s nest:
(11.4)
Similarly, total demand for group g varieties as a share of total domestic consump-tion is
(11.5a)
and the demand for the imported variety as a share of total domestic consumption—that is, the import penetration rate—is
(11.5b)
Hence demand for the jth variety as a fraction of total units sold is sjt = sj|g,t◊ sg,t.Given our normalization rule, we can measure the market shares that appear in
equations (11.4), (11.5a), and (11.5b) as
and
where Mt is the dollar value of imports converted to pesos at the same realexchange rate for all years.10 Using these equations and the definition of , it isthen possible to solve for the quality of domestic good j by using the expressionfor mean utility:
ξ α σjt jt j g tjt
t
p ss
sj= − +
=ln ln| ,
,
( )0
1,, , , , .K KN t T=1
ujt
s so t g t
g
G
, , ,= −=
∑11
sI
Is
I
j g tjt
i jit
g t
i git
i
N| , ,,=∑
=∑
∑∈
∈
=Θ
Θ
1
tt
it tI M+
s s
Dt g t
g
G
k
G
kt
0
11
1
11
1, , .= − =
∑ +==
−∑
s
sD
D
Dg tgt
k
G
kt
gt, , ex=∑ +
=−
=
−
1
1
1 1
σ
σwhere pp
( )
( ), , , ,
u ug Gkt t
k g
−−
= …
∈
0
11
σΘ
∑∑
su u
u uj g tjt t
k jkt
| ,
exp[( ) ( )]
exp[(=
− −∑ −∈
0
0
1/ σ
Θtt
tj N) ( )]
, , , , ./ 1
1 2−
= …σ
248 Global Integration and Technology Transfer

Finally, we obtain our quality/appeal measure, ait , by expressing xjt relative to thequality of imports. Specifically, without loss of generality we set the mean utilityfrom imports to zero ( ) and measure the quality of domestic good j relativeto the quality of imports as
(11.6)
Note that expression (11.6) does not explain how ajt is determined; rather it pro-vides a way to solve for an unobserved matrix in terms of observed matrices andparameters that can be estimated.
Estimation
Expression (11.6) cannot be used to impute quality unless a, g, and s are known.We identify these parameters by substituting the right-hand side of expression(11.6) into a linearized version of equation (11.1) wherever ajt appears:
(11.1a)
(11.1b)
We then estimate these equations jointly with the equilibrium price relationship thatobtains when firms Bertrand-Nash compete in the product market (Berry 1994):11
(11.7)
That is, we estimate the demand parameters at the same time that we estimate theparameters describing the effects of international activities on each dimension ofperformance (lb and fb).
It remains to discuss the properties of the error terms in the system (11.1a), (11.1b),and (11.7). First, if reflects measurement error in costs or intermediate inputs, itwill be correlated with the right-hand side variables in equation (11.7). Unlike Berry(1994), we assume this problem away by positing that the noise in equation (11.7)comes exclusively from measurement error in revenues (and thus in prices).12
Second, if the disturbance terms and are serially correlated, they will not beorthogonal to lagged endogenous variables and spurious correla-tion patterns may result. There are two standard ways to deal with this problem. Oneis to choose a sufficiently long lag length (Q), so that all persistence in the endogenous
( , , ),b a cjt jt q jt q− − −1
ε jtcε jt
a
εitP
ln ln( )
( ), ,| , |
( )/
p cs sj t j t
j g t j
= + −− ⋅ − − ⋅
1
1 1
s ασ σ gg t g t
jtP
s, ,
.⋅
+ ε
j N t T= … = + …1 1, , , , , .Q
c a c ajt q j t q
q
Q
q j t q
q Q
Qx
jt= + + +−=
−= +
∑ ∑0
1 1
2
f f f, , x ++ +−f ebjt jt
cb 1 ,
a a a cjt q j t q
q
Q
q jt q
q Q
Qx
jt= + + +−=
−= +
∑ ∑0
1 1
2
+ l l l, x ll ebjt jt
ab − +1 ,
a p r ss
sjt jt t jt t j g tjt
t
≡ − = − − +
x x g s00
a ln( ) ln,,
|
= =, , , , .j N t T1 1K K
u t0 0=
Product Quality, Productive Efficiency, and International Technology Diffusion 249

variables is absorbed by the explanatory variables, leaving and serially uncor-related. This solution is simple and appealing, but in short panels like ours it meanssacrificing most of the time series information in the data. Since time series variationis key for Granger causality tests, we choose the other standard approach. That is, weassume that the error terms are characterized by a standard error component speci-fication and correct for the associated initial conditions problem.
Specifically, we write the disturbances as andwhere, , , ,
and and .We thenuse Wooldridge’s (2000) conditional likelihood function to deal with the initialconditions problem. That is, we write the joint density for T realizations on the vec-tor ωjt and the unobserved effects, , conditioned on ωj1 and xj, as
We then express mj as a linear projection on wj1 and the temporal mean of xj, plus aresidual plant effect
(11.8)
We substitute this expression for mj into the density function above, conditioned onωj1 and xj , and integrate out the unobserved plant effects, . Since byconstruction is orthogonal to ωj1, this approach eliminates the initial conditionsproblem, and the compound disturbance vector, , has standard errorcomponents properties.13 We use a full information maximum likelihood estima-tor for the system (11.1a), (11.1b), (11.6), (11.7), and (11.8), presuming that all dis-turbances are normally distributed.
Determinants of Activity
Our last methodological task is to develop a version of equation (11.2) that can beestimated. Structural estimation of the deep parameters is out of the question,given the complexity of the optimization problem and the number of parametersinvolved. Instead, we assume that the probability of choosing the kth activity bun-dle can be written as a reduced-form linear expression in the observable argumentsof . Also we drop all lags of more than one year and summarize the perform-ance of competing firms with a cross-firm average of ω, excluding the jth firm,hereafter :14
(11.2′)b bjkt k ji t k jt k tj
jktb= ′ + ′ + ′ +− − −
−δ α η ε, 1 1 1ω ω ,k K=1 2
ω− j
gb( )⋅
( , )υ υ µjta
jtc
j+ ∗µ j
∗µ µ µj j
ajc∗ ∗ ∗= ( , )
µ ρ ρ ρ µj j j jx= + + + ∗0 1 1 2ω .
f x b
f x
j jT j j j j
jT jT j
( , , , , , )
( , ,
ω ω ω
ω ω ω2 1
1 1
…
= −
µ |
| jjt j jT jT jT j jt jTb f x b, , ) ( , , , ,µ µ− − − −⋅1 1 2 1 2ω ω ω| jj
j j j j j j j jf x b g x
)
( , , , ) ( , ).
L
ω ω ω2 1 1 1 1| |µ µ
µ µ µj ja
jc= ( , )
∀ =k a c,cov( , ) cov( , )µ µ µ µja
mc
jk
mk j m= = ∀ ≠0cov( , )µ µ σµj
ajc
ac=cov( , ) ,,υ υ συjt
ajtc
ac=∀ ≠s 0cov( , )υ υjtk
jt sk
− = 0var( ) , var( ), ,υ σ µ συ µjtk
k jk
k= =2 2
ε µ υjtc
jc
jtc= + ,ε µ υjt
aja
jta= +
ε jtcε jt
a
250 Global Integration and Technology Transfer

(Unlike in equation 11.2, firms’ choices of activity bundles are not deterministichere, because we do not have access to the entire information on which they basetheir decision.)
As with equations (1a) and (1b), we adopt an error components specificationfor the disturbances, and we address the associated initial conditionsproblem using Wooldridge’s (2000) technique. That is, we express each element ofthe vector as a linear function of the vector of initial states, plus noise.
In principle, there are some efficiency gains to be reaped by estimating the sys-tem of equations (11.2′) jointly with those in the system (11.1a), (11.1b), and(11.7). However, as long as the residual plant effects in equation (11.2′) are not cor-related with m∗ in equations (11.1a) and (11.1b), this is not necessary for consis-tency. We therefore opt to keep the model manageable and estimate the activitydeterminant equations separately.
Empirical Results
To implement our estimator, we use annual industrial survey data from three semi-industrial countries: Colombia, Mexico, and Morocco (see Roberts and Tybout1997, for detailed descriptions of the data.) Ideally, we would like to study all of theactivities described earlier, but each data set provides information on only a subset.The Colombian data reveal whether firms are importing intermediate goods andexporting; the Moroccan data identify exporters and firms with foreign owners(FDI); and the Mexican data identify exporters, importers of intermediate goods,and importers of capital goods. Thus although no single country spans the entire setof activities, across the three of them we observe a fairly large collection of conduitsfor international technology transfer.
We focus our empirical analysis on manufactured chemicals, for several reasons.First, treating all of the establishments in our data sets would be an overwhelmingtask. Second, among the sectors with sufficient observations to support inference,the chemical industries are most prone to engage in international activities. Third,these industries rely relatively heavily on scientists, technicians, and engineers, sowhen technology diffusion takes place, we are likely to find it at these firms. Fourth,in most chemical industries, imported final goods are sufficiently important to playthe role of an outside good in our demand system. Finally, the chemical industriesare well represented in all three countries. Cross-country comparisons thus allowus to examine whether particular types of production are prone to particular pat-terns of technology absorption.
We limit our analysis to plants that were present during all years of the analysis.(For Colombia, the sample period is 1981–91, for Mexico it is 1986–90, and forMorocco it is 1986–93.) Exclusion of entering and exiting plants obviously opens
bj0,µ jb
ε µjtb
jb
jb= +u ,
Product Quality, Productive Efficiency, and International Technology Diffusion 251

the door to selection bias in our findings, but it greatly simplifies the econometricmodeling. We believe this is a price worth paying, because the omitted firms sup-ply a very small fraction of the market. Furthermore, we are less concerned withprecise parameter estimation than with determining whether significant patternsof association are present. It is highly unlikely that they would be manifest onlyamong the new and dying plants that we leave out of our panels.
Determinants of Performance
Estimates of the demand system are reported in annex 1. The results for eachfour-digit chemical industry in Colombia, Morocco, and Mexico are presented intables 11A.1–3. (Industries with fewer than 10 plants continually present are nottreated.) To conserve space, we do not report parameters of the covariance matricesfor the compound disturbances, but we do report the coefficients from equation(11.8), which relates the unobserved plant effects, ma and mb, to initial realizations ofthe performance variables, a1 and c1.
Under each industry heading, the left-hand column reports parameter estimatesand the right-hand column reports the associated standard errors. Wald-statisticsfor the null hypotheses that product quality is unrelated to international activitiesand that marginal costs are unrelated to international activities are reported nearthe bottom of each table. All coefficient estimates that are at least twice their stan-dard error are reported in bold, as are c2 statistics with p-values less than 0.05. Thedegrees of freedom for the Wald-statistics depend on the number of activity bun-dles considered, which varies across countries and industries. (The latter occurswithin a country because some industries do not exhibit all possible activities.)Parameters, standard errors, and test statistics that describe the relationshipbetween activities and performance are reported in shaded panels.
Demand Parameters Parameter estimates for the demand system appear in thetop panel of each table. As hoped,a, the parameter that measures the sensitivity ofindirect utility to price, is always quite significant and positive. This gives us someconfidence that the price measure implied by our normalization rule containsinformation relevant to consumers. It is generally higher in Morocco than in theother countries, because the French accounting system there led to a unit pricemeasure that was somewhat lower than the measure we calculated for Mexico andColombia. As a result, the model assigned Morocco higher demand elasticities.
Estimates of s are also quite accurate. They imply that for most industries,the standard error of V + n is roughly twice the standard error of n alone. For agiven consumer, indirect utilities vary substantially across regions, as well asbetween foreign and domestic varieties. (It would be straightforward to use these
252 Global Integration and Technology Transfer
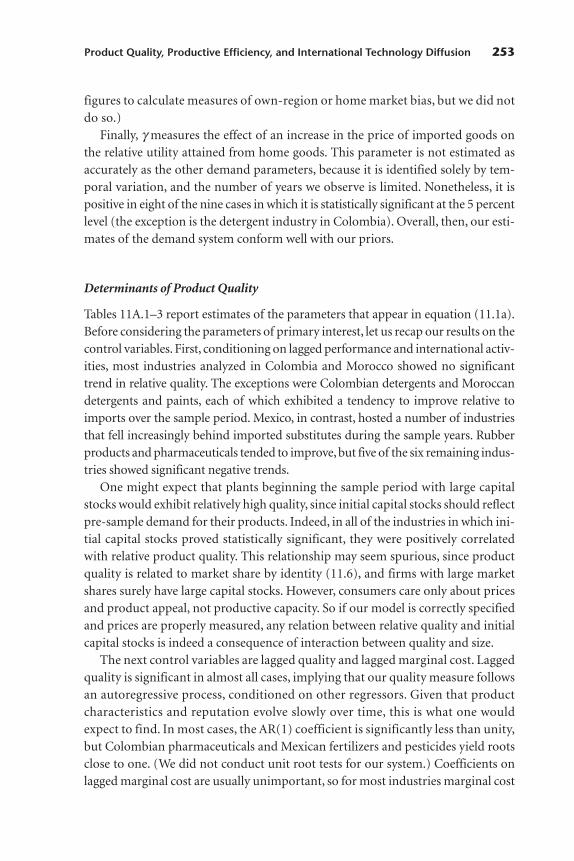
figures to calculate measures of own-region or home market bias, but we did notdo so.)
Finally, g measures the effect of an increase in the price of imported goods onthe relative utility attained from home goods. This parameter is not estimated asaccurately as the other demand parameters, because it is identified solely by tem-poral variation, and the number of years we observe is limited. Nonetheless, it ispositive in eight of the nine cases in which it is statistically significant at the 5 percentlevel (the exception is the detergent industry in Colombia). Overall, then, our esti-mates of the demand system conform well with our priors.
Determinants of Product Quality
Tables 11A.1–3 report estimates of the parameters that appear in equation (11.1a).Before considering the parameters of primary interest, let us recap our results on thecontrol variables. First, conditioning on lagged performance and international activ-ities, most industries analyzed in Colombia and Morocco showed no significanttrend in relative quality. The exceptions were Colombian detergents and Moroccandetergents and paints, each of which exhibited a tendency to improve relative toimports over the sample period. Mexico, in contrast, hosted a number of industriesthat fell increasingly behind imported substitutes during the sample years. Rubberproducts and pharmaceuticals tended to improve, but five of the six remaining indus-tries showed significant negative trends.
One might expect that plants beginning the sample period with large capitalstocks would exhibit relatively high quality, since initial capital stocks should reflectpre-sample demand for their products. Indeed, in all of the industries in which ini-tial capital stocks proved statistically significant, they were positively correlatedwith relative product quality. This relationship may seem spurious, since productquality is related to market share by identity (11.6), and firms with large marketshares surely have large capital stocks. However, consumers care only about pricesand product appeal, not productive capacity. So if our model is correctly specifiedand prices are properly measured, any relation between relative quality and initialcapital stocks is indeed a consequence of interaction between quality and size.
The next control variables are lagged quality and lagged marginal cost. Laggedquality is significant in almost all cases, implying that our quality measure followsan autoregressive process, conditioned on other regressors. Given that productcharacteristics and reputation evolve slowly over time, this is what one wouldexpect to find. In most cases, the AR(1) coefficient is significantly less than unity,but Colombian pharmaceuticals and Mexican fertilizers and pesticides yield rootsclose to one. (We did not conduct unit root tests for our system.) Coefficients onlagged marginal cost are usually unimportant, so for most industries marginal cost
Product Quality, Productive Efficiency, and International Technology Diffusion 253
shocks have little effect on the subsequent evolution of product quality. In the fourindustry/country cases in which lagged marginal cost was significant, firms adjustedto cost shocks partly by reducing the future quality of their product.
The coefficients on initial quality realizations indicate that unobserved hetero-geneity is often important and that Wooldridge’s correction matters. In contrast,the coefficients on initial marginal cost realizations are usually insignificant, so ourrepresentation of unobserved heterogeneity in equation (11.8) is probably moregeneral than it needs to be for most industries. Nonetheless, the covariance matri-ces for our compound disturbances imply that in many cases, persistent unob-served heterogeneity remains after conditioning on these variables.
Consider now the variables of primary interest—the dummies for the various activ-ity bundles.15 Wald-statistics reported at the bottom of each table test the joint nullhypothesis that the previous period’s activity bundles have nothing to do with currentquality. Tellingly, all but three of these χ2 statistics have a p-value greater than 0.05, soin 16 of the 19 country/industry cases, one cannot reject the null hypothesis that pre-vious international activities have no effect on current product quality. Experimentswith additional lags on activity bundles (not reported) left this basic message intact.
In the three instances in which activities are significantly related to quality, thedominant relationship is negative. In Moroccan plastics and Colombian fertilizersand pesticides, any combination of international activities lead to worse productquality than no international activities. In the other significant case, Moroccan paintsand varnishes, firms that exported and firms with foreign ownership performedworse than firms without international activities, but firms that had both types ofinternational relationship performed better. (In this case, none of the coefficients forthese activity bundles was individually significant, so colinearity problems prevented usfrom drawing strong conclusions.) Overall, then, our methodology yields virtually noevidence that international activities Granger-cause improvements in product qual-ity. (We return to the issue of whether we are missing significant linkages shortly.)
Determinants of Marginal Cost
The weak and occasionally negative association between product quality and inter-national activities need not imply that firms pursuing these activities are misguided.It may be that international activities mainly help reduce costs rather than improvequality. Are such linkages picked up by our model?
Parameter estimates for our marginal cost equation (11.1b) are reported byindustry and country in the lower panels of tables 11A.1–3. We begin our discus-sion of the results with the control variables. First, note that most industries showno significant trend in marginal costs once initial capital stocks, lagged costs, andactivities are controlled for. The exceptions are plastics and soaps in Mexico and
254 Global Integration and Technology Transfer

Morocco, which trend significantly upward, and fertilizers in Mexico and pharma-ceuticals in Colombia, which trend downward.
More interestingly, productive capacity (measured by initial capital stocks)seems to have little to do with our measure of marginal production costs. Exceptamong Mexican rubber producers, where marginal costs rise with capacity, andMexican pharmaceutical producers, where the opposite occurs, initial capacity isnot a significant predictor of our cost measure. This suggests that scale economiesare not dramatic and that production technologies are reasonably homothetic overthe size range we observe in our panels.
As for the role of lagged marginal costs, all of the industries show clear evidenceof serial dependence. Not surprisingly, all of the coefficients are greater than zero,and most are at least two standard deviations below unity. In half of the Mexicanindustries, lagged quality is also associated with current costs, usually positively, butno such relationship emerges in the other countries. Initial realizations on marginalcosts are significant in most sectors, implying that unobserved heterogeneity isimportant. The (unreported) variance in residual plant effects is also often signif-icant and correlated with the residual plant effect in the quality equation. However,the sign of this correlation varies from industry to industry.
Now consider the relation between international activities and marginal costs.Except in Morocco, our Wald-tests fail to reject the null hypothesis that the two areunrelated. In Morocco FDI alone is associated with significant cost reductionsamong paint and varnish producers, but exports and FDI together lead to costincreases. Interestingly, the plants that both export and have FDI are also the ones(weakly) predicted to have the highest quality product, so the combined effect ofthese activities may well be to enhance profits.16 Exporting and FDI tend to increasecosts among detergent and perfume producers, but there is no evidence of offset-ting quality gains. Among Moroccan pharmaceutical producers, exporting and FDIsignificantly reduce future costs, alone or together. They also tend to reduce qual-ity, however, so as with Moroccan paint and varnish producers, the net effect ofthese activities on profits is not immediately apparent.
Although none of the other country/industry panels shows a significant jointrelationship between international activities and future marginal costs, in someinstances particular activity bundles yield statistically significant effects. Theseoccur exclusively among bundles that involve importing intermediate inputs. InColombia fertilizer and pesticide producers reduce their future costs by importingintermediates, but they also reduce the quality of their product. In Mexico inter-mediate imports increase marginal costs, but they also increase quality among rub-ber producers. The same is true among Mexican fertilizer and pesticide producers,although the quality effect is not statistically significant. Among Mexican pharma-ceutical producers, imported intermediates—in combination with exports or imported
Product Quality, Productive Efficiency, and International Technology Diffusion 255

capital goods—reduce marginal costs and, if anything, tend to increase productquality. Only in the “other chemicals” sector do imported intermediates (in com-bination with imported capital and exports) significantly increase future costswithout also tending to improve product quality.
Overall, then, most country/industry panels show no significant associationbetween international activities and future marginal costs. However, a minority ofindustries exhibits this type of causal link. Furthermore, whether the activitiesincrease or reduce costs, there is often an offsetting change in product quality, mak-ing the net effect of the international activities on profits ambiguous.
A Robustness Check Granger causality tests may miss important linkages if thetransmission of knowledge does not coincide with the observed internationalactivity. For example, when a foreign buyer places an order with a domestic firm,it may transmit blueprints and technical assistance years before the actual exportsoccur. To check whether this problem has undermined our inferences, we aban-don our dynamic specification in favor of a model that simply tests for static cor-relation between international activities and performance. That is, we drop all ajt−q
and cjt−q variables and replace bjt−1 with bjt on the right-hand side of equations (1a)and (1b). If this model reveals no association, we have stronger evidence againstthe claim that international activities transmit knowledge. Statistical significanceneed not imply causal relationships from activities to performance, however. Itmay reflect causation from performance to activities (which we explore shortly)or transitory effects that do not involve knowledge transmission. For example,access to imported intermediates may simply enrich the menu of inputs for firmsand allow them to produce better products or reduce their costs, as Ethier (1982)suggests.
Tables 11A.4–6 report the static version of our model for each industry/countrypanel. (We still use an error component specification, but we drop Wooldridge’s cor-rection for initial conditions, because lagged performance measures no longer appearon the right-hand side.) When lagged quality is dropped and international activitiesare no longer lagged, many sectors show a significant association between productquality and international activity. Furthermore, the association is now positive inColombia for firms that import their intermediate inputs. By itself, this result has sev-eral interpretations. It may mean that importing intermediates allows a firm to learnsomething about technology and to permanently increase the quality of its product,as Grossman and Helpman (1991) suggest.17 Alternatively, it may reflect the staticbenefits from importing that Ethier (1982) notes. This interpretation strikes us asmore plausible, given that we picked up no evidence of Granger causation fromimported intermediates to subsequent gains in product quality and that importedintermediates are unlikely to be preceded by ongoing contacts with foreign suppliers.
256 Global Integration and Technology Transfer

Mexico and Morocco also exhibit more significant associations in the staticmodel. However, in contrast to Colombia, international activities still seem to hurtquality, if anything. Thus in determining the effects of international activities onperformance, country conditions may be more important than technologicalfeatures of industries that are common across borders.
Finally, in the marginal cost equation, coefficients differ from those in thedynamic model, but the evidence that international activities are associated withlower costs is, if anything, weaker. In sum, with the exception of the Colombianresults on product quality, the timing issue does not appear to be the main reasonwhy firms’ product quality and marginal costs are unrelated to their internationalactivities.
Determinants of Activity
Our last empirical exercise addresses the issues of how activities are chosen andwhether performance causes international activities. We begin with a descriptivereview of the activity patterns found in our data sets. Without controlling for any-thing, in tables 11B.1 and 11B.2 we report probabilities of different activity bundlesand transitions between bundles based on simple cell counts. Clearly, regardless ofwhich activity combinations we consider, the pursuit of one activity increases thelikelihood that others will be pursued as well. Similar statements hold for transi-tions. If one of the international activities has been initiated, the probability thatothers will follow increases. Accordingly, empirical models that focus on a singleactivity as the key to international technology diffusion probably suffer from sig-nificant omitted variable bias.
Of course, patterns of association may not reflect complementarities among theactivities. It is possible that certain firm characteristics—for example, location in aport city or ethnic ties to foreign countries—may make firms engage in multipleinternational activities, even when true complementarities are absent. To get at thispossibility and to better understand firms’ activity choices, we estimate the systemof linear probability equations (11.2′), allowing for unobserved heterogeneity andusing Wooldridge’s (2000) correction for the initial conditions problem.
Table 11B.3 presents results for Colombia. We report estimates for three of thefour possible activity bundles. (The bundle with no international activities is omit-ted. Parameter estimates for this option can be derived from the constraint that thesum of the probabilities of the different bundles must always be unity.) The firstcolumn reports results for all firms but does not include performance measures.Two points merit mention. First, activities are highly persistent, even after control-ling for unobserved heterogeneity. This suggests that the start-up costs associatedwith the initiation of new international activities are nontrivial, and thus transitory
Product Quality, Productive Efficiency, and International Technology Diffusion 257

policy or macro shocks may have lasting effects on activity patterns (Roberts andTybout 1997). Second, we continue to find that the probability that a firm becomesan exporter is higher if it was already importing intermediates the previous year,and the probability of becoming an importer is higher for exporters than for non-exporters. However, tests reported at the bottom of table 11B.3 fail to reject the nullhypotheses that these differences in conditional probabilities are zero. Thus althoughimported intermediates and exporting tend to go together, the dynamic interac-tions between them are not strong in this fuller specification.
Our second set of estimates (columns 3 and 4 in table 11B.3) adds performancemeasures to investigate whether firms with high quality, low costs, or both are morelikely to engage in activities. Since our quality variable is normalized to have thesame mean in each of the four-digit industries, we cannot simply pool all sectors.Instead, we restrict attention to pharmaceuticals, the four-digit industry with thelargest number of firms.18 Within this four-digit industry, the two patterns notedabove continue to appear. Activities are highly persistent, and the presence of oneactivity increases the probability that another will be initiated. However, thesedynamic interactions are not statistically significant.
Regarding the effects of quality and cost on the choice of activities, the signs ofthe coefficients are intuitive for the “both export and import” bundle. Firms withhigher quality and lower costs are more likely to pursue this bundle of activities.However, neither coefficient nor the coefficients for the other bundles are signifi-cant, so the case for causation from previous performance to activity choices isweak. Table 11B.4 reports analogous results for Morocco, where we observe data onexporting and foreign equity but the degree of persistence, as measured by the mag-nitude of the coefficients on own lagged activities, is generally smaller. This is espe-cially true for FDI, with past FDI activities increasing the probability of current FDIactivity by only 10 percent in the first set of regressions, and not at all in the secondset, which includes performance variables (reported only for plastics).
One puzzling exception to the pattern of insignificant effects of performance onthe choice of activities is in the equation for the choice of both activities. Other thingsequal, firms with higher quality and lower costs are less likely to choose both activi-ties. This mirrors the negative correlation between product quality and the joint pur-suit of exports and FDI found in tables 11A.2–5. Taken at face value, it suggests thatforeign investors are attracted to plants that have been performing relatively poorly.
Conclusion
This chapter has several basic messages. First, by imposing enough structure on theproduction function and the demand system, it is possible to measure product qual-ity and marginal costs at the plant level and to relate the evolution of these variables
258 Global Integration and Technology Transfer

to firms’ activity histories. Doing so, we find strong firm-level persistence in bothquality and marginal costs, as expected. However, in most of the industry/countrypanels we studied, past international activities do not help much to predict currentperformance, once past realizations on quality and marginal cost are controlled for.That is, activities do not typically Granger-cause performance. Interestingly, in theminority of cases in which significant associations emerge, international activitiesappear to move costs and product quality in the same direction. Thus the net effecton profits in these cases is not immediately apparent.
Concerning the determinants of international activities, several basic patternsemerge. Most fundamentally, activities are highly persistent, even after controllingfor unobserved heterogeneity. This suggests that firms incur sunk threshold costswhen they initiate or cease activities, so temporary policy or macro shocks mayhave long-run effects on the patterns of activities observed in a particular countryor industry.
Second, activities tend to go together. Thus studies that relate firms’ performanceto one international activity and ignore the others may generate very misleading con-clusions. The bundling of activities seems to mainly reflect unobserved plant charac-teristics,however,such as managerial philosophy,contacts,product niche,and location.Once these are controlled for, there is little evidence that engaging in one internationalactivity increases the probability that others will occur in the future.
Finally, we find weak evidence (from Colombia) that firms that are alreadystrong performers seek out foreign markets as a way to enhance their profits. Theseresults do not generalize to Morocco, where plastics firms that have been performingpoorly are more likely than other firms to become exporters and receive FDI.
Product Quality, Productive Efficiency, and International Technology Diffusion 259

260 Global Integration and Technology Transfer
Chapter 11 Annex A:Demand Parameters and Performance Equations
Basic industrial Fertilizers andchemicals pesticides Plastics
Demand parameter
a 2.151 0.1 5.363 0.403 16.16 1.367s 0.627 0.017 0.714 0.018 0.482 0.004g 0.074 0.153 1.69 0.465 6.355 3.724
Product quality equation (11.1a)
Intercept −0.449 0.191 1.978 1.282 0.128 2.617Trend −0.018 0.012 −0.046 0.033 −0.818 0.325ln (initial capital) 0.051 0.027 −0.197 0.158 0.690 0.600
X only 0.041 0.087MI only 0.112 0.071 −0.904 0.302 0.564 1.510X and MI 0.064 0.09 −0.811 0.258 1.482 1.707
a(t − 1) 0.819 0.067 0.648 0.077 0.183 0.17a(1) 0.124 0.054 0.329 0.100 0.358 0.098c(t − 1) −0.386 0.319 −0.056 0.462 −0.829 11.46c(1) 0.624 0.336 −3.481 0.873 2.071 7.392
Marginal cost equation (11.1b)
Intercept −0.031 0.032 0.175 0.040 −0.002 0.013Trend 0.001 0.002 0.001 0.003 0.000 0.002ln (initial capital) 0.003 0.005 −0.017 0.005 0.004
X only 0.001 0.015MI only 0.009 0.012 −0.069 0.031 0.011 0.011X and MI 0.004 0.016 −0.063 0.027 0.000 0.012
c(t − 1) 0.705 0.067 0.915 0.063 0.717 0.074c(1) 0.33 0.072 −0.134 0.093 0.058 0.05a(t − 1) −0.004 0.01 −0.01 0.008 0.001 0.001a(1) 0.002 0.008 0.012 0.007 −0.001 0.001
Quality effects 2.658 10.634 0.756MC effects 0.676 5.936 1.293
−ln(L) −572.82 −301.98 −72.99Number of observations 324 117 108
TABLE 11A.1 Colombian Chemical Industries: Dynamic Model

Product Quality, Productive Efficiency, and International Technology Diffusion 261
TABLE 11A.1 (Continued)
Paints and Detergents andvarnishes Pharmaceuticals perfumes
3.388 0.161 2.236 0.074 4.174 0.2190.458 0.018 0.671 0.009 0.662 0.008
−1.675 0.927 0.096 0.084 −3.133 0.348
0.538 0.619 0.135 0.154 1.665 0.659−0.05 0.057 0.001 0.012 0.189 0.0370.166 0.072 −0.012 0.02 −0.039 0.066
−0.103 0.161−0.101 0.362 −0.04 0.071 0.05 0.152−0.41 0.407 −0.04 0.103 0.096 0.214
0.378 0.05 1.016 0.038 0.356 0.0690.752 0.068 −0.019 0.040 0.694 0.093
−2.199 2.05 −1.572 0.194 0.802 0.6070.3 2.148 0.799 0.199 −2.456 0.996
0.031 0.019 0.135 0.039 −0.001 0.0420.001 0.001 −0.008 0.003 −0.005 0.003
−0.003 0.002 −0.003 0.005 0.002 0.004
−0.028 0.041−0.011 0.012 −0.009 0.018 0.007 0.0140.008 0.014 −0.026 0.025 0.015 0.020
0.788 0.066 0.526 0.057 0.632 0.0740.022 0.067 0.235 0.059 0.156 0.079
−0.002 0.002 −0.012 0.01 0.001 0.0070.002 0.002 0.011 0.011 −0.008 0.008
1.495 0.62 0.2124.323 1.306 0.612
−47.97 −1,103.15 −543.54120 639 351
Source: Authors.
Note: Boldfaced figures indicate values that are significant at the 5 percent level.

262 Global Integration and Technology Transfer
TABLE 11A.2 Moroccan Chemical Industries: Dynamic Model
Paints andvarnishes Pharmaceuticals
Demand parameter
a 21.058 2.614 11.06 0.996s 0.867 0.014 0.761 0.020g 20.700 8.110 7.844 4.069
Product quality equation (11.1a)
Intercept 4.33 4.831 −1.738 2.298Trend 0.634 0.215 −0.008 0.071ln (initial capital) 0.273 0.311 0.533 0.185
X only −1.217 1.164 −1.219 0.524FDI only −0.673 0.81 −0.809 0.463X and FDI 2.088 1.447 −0.691 0.516
a(t − 1) −0.558 0.169 0.069 0.154a(1) 1.129 0.141 0.654 0.127c(t − 1) 19.86 7.190 2.515 2.016c(1) −7.708 9.734 1.23 4.536
Marginal cost equation (11.1b)
Intercept 0.099 0.086 −0.088 0.159Trend 0.003 0.007 −0.002 0.006ln (initial capital) −0.005 0.009 0.02 0.014
X only 0.01 0.039 −0.094 0.038FDI only −0.007 0.024 −0.067 0.033X and FDI 0.117 0.044 −0.095 0.035
c(t − 1) 0.633 0.178 0.534 0.148c(1) 0.601 0.266 0.15 0.342a(t − 1) −0.009 0.006 −0.008 0.011a(1) 0.005 0.005 0.01 0.01
Quality effects 7.834 5.753MC effects 9.573 8.554
−ln(L) −111.051 −216.877Number of observations 84 76

Product Quality, Productive Efficiency, and International Technology Diffusion 263
TABLE 11A.2 (Continued )
Detergents and Chemicals notperfumes elsewhere classified Plastics
1.479 0.132 10.204 0.789 7.065 0.3930.256 0.030 0.703 0.025 0.676 0.0287.977 3.031 4.482 3.236 4.601 1.329
−0.609 0.823 1.833 1.212 0.623 0.580.275 0.056 −0.025 0.082 0.041 0.031
−0.063 0.06 0.106 0.096 −0.007 0.076
−0.409 0.334 0.334 0.992 −0.328 0.2240.098 0.308 0.357 0.477 −0.122 0.181
−0.103 0.277 1.534 0.862 −3.105 0.653
0.466 0.114 0.532 0.106 0.475 0.1030.608 0.140 0.234 0.084 0.478 0.096
−1.069 0.987 −3.202 1.909 −3.655 1.0221.768 1.061 0.741 1.848 2.341 0.981
0.032 0.073 0.036 0.055 0.095 0.0580.015 0.006 −0.002 0.005 0.007 0.002
−0.01 0.007 0.002 0.007 −0.009 0.008
0.069 0.04 −0.008 0.061 −0.015 0.0210.041 0.037 0.002 0.032 −0.023 0.0170.099 0.033 0.047 0.056 −0.013 0.057
0.672 0.118 0.314 0.140 0.208 0.0750.006 0.112 0.327 0.139 0.491 0.0940.021 0.014 0.002 0.007 −0.01 0.007
−0.023 0.017 0.001 0.006 0.015 0.008
2.115 3.354 23.8499.715 0.837 2.192
35.459 −317.777 −918.0460 186 492
Source: Authors.
Note: Boldfaced figures indicate values that are significant at the 5 percent level.

264 Global Integration and Technology Transfer
TABLE 11A.3 Mexican Chemical Industries: Dynamic Model
Basic industrial Syntheticchemicals resins Plastics
Demand parameter
a 1.368 0.110 1.828 0.166 2.283 0.101s 0.586 0.047 0.532 0.049 0.763 0.036g −0.488 1.264 1.927 0.590 1.562 1.474
Product quality equation (11.1a)
Intercept −2.752 1.861 1.730 0.437 3.450 0.737Trend −0.010 0.255 −0.356 0.095 −0.707 0.212ln (initial capital) 0.234 0.055 0.010 0.019 −0.049 0.030
X only 0.270 0.387 −0.052 0.137 0.120 0.199MI only −0.401 0.157 0.026 0.077 −0.065 0.152MK only −0.218 0.185 −0.291 0.141 0.032 0.268MI and X −0.288 0.151 0.135 0.078 −0.035 0.192MK and X −0.347 0.190 0.088 0.166 0.253 0.540MI and MK −0.221 0.238 −0.121 0.151MI, MK, and X −0.255 0.139 0.029 0.057 0.086 0.156
a(t − 1) −0.012 0.094 0.854 0.052 0.755 0.043a(1) 0.679 0.090 0.146 0.048 0.353 0.047c(t − 1) 1.304 0.784 0.475 0.374 0.014 n.a.c(1) −0.739 0.752 −0.192 0.341 −0.429 0.154
Marginal cost equation (11.1b)
Intercept −0.028 0.115 0.089 0.035 −0.105 0.038Trend −0.002 0.018 −0.027 0.014 0.045 0.010ln (initial capital) 0.002 0.012 −0.003 0.004 0.001 0.003
X only 0.024 0.035 −0.025 0.031 0.023 0.023MI only 0.002 0.027 −0.005 0.018 0.000 0.018MK only −0.020 0.023 −0.003 0.032 0.022 0.034MI and X −0.011 0.022 0.019 0.018 −0.005 0.024MK and X −0.004 0.029 −0.037 0.038 0.103 0.062MI and MK 0.063 0.040 0.000 0.018MI, MK, and X 0.019 0.023 0.017 0.013 0.029 0.018
c(t − 1) 0.975 0.071 0.838 0.085 0.755 0.043c(1) 0.091 0.062 0.184 0.078 0.173 0.039a(t − 1) −0.009 0.052 0.027 0.011 0.001 0.005a(1) 0.003 0.036 −0.026 0.010 0.001 0.005
Quality effects 11.311 8.451 2.099MC effects 8.508 5.126 6.504
−ln(L) −212.78 −431.26 −345.26Number of observations 236 156 580

Product Quality, Productive Efficiency, and International Technology Diffusion 265
TABLE 11A.3 (Continued)
Other Rubber Fertilizers and Soaps andchemicals products pesticides Pharmaceuticals perfumes
2.261 0.131 2.966 0.224 1.975 0.238 1.197 0.070 1.725 0.1210.729 0.074 0.734 0.090 0.740 0.084 0.709 0.083 0.589 0.0341.691 0.580 −0.565 0.457 3.713 0.625 −0.363 0.447 9.878 1.782
1.344 0.488 0.019 0.305 4.795 0.732 −0.860 0.562 7.670 1.141−0.322 0.103 0.170 0.082 −1.345 0.202 0.206 0.102 −0.933 0.2690.026 0.015 0.062 0.028 −0.044 0.023 0.000 0.019 −0.048 0.032
−0.133 0.236 0.101 0.381 0.191 0.2710.077 0.054 0.261 0.122 0.032 0.091 −0.060 0.118
−0.074 0.129 0.247 0.284 −0.586 0.277 −0.107 0.193 0.137 0.5170.059 0.066 0.141 0.110 0.178 0.159 0.058 0.062
0.040 0.082 −0.118 0.194 0.026 0.156 0.056 0.093 −0.038 0.159−0.135 0.086 −0.163 0.149 0.071 0.063 0.158 0.144
0.887 0.044 0.935 0.068 1.096 0.124 0.809 0.061 0.652 0.0490.092 0.043 0.050 0.072 −0.046 0.128 0.168 0.058 0.426 0.051
−0.154 0.245 −0.555 0.481 −0.070 0.632 0.041 0.146 −0.121 0.3240.317 0.222 0.542 0.483 0.617 0.378 −0.086 0.128 0.151 0.318
0.028 0.029 −0.062 0.039 0.358 0.096 0.277 0.092 −0.345 0.143−0.003 0.010 0.025 0.010 −0.069 0.027 0.007 0.020 0.125 0.049−0.003 0.003 0.018 0.005 0.006 0.004 −0.024 0.010 −0.008 0.006
−0.030 0.055 0.012 0.066 −0.027 0.1480.016 0.013 0.054 0.022 −0.092 0.049 −0.023 0.023
−0.011 0.030 0.028 0.049 −0.043 0.051 −0.035 0.106 −0.040 0.1030.028 0.015 −0.008 0.020 0.075 0.028 −0.073 0.033
−0.018 0.019 −0.006 0.035 −0.019 0.029 −0.107 0.050 −0.013 0.0320.044 0.020 −0.049 0.027 −0.054 0.034 0.000 0.029
0.693 0.057 0.610 0.103 0.589 0.097 0.606 0.081 0.695 0.0660.238 0.052 0.374 0.100 −0.074 0.068 0.096 0.071 0.249 0.0640.013 0.010 0.017 0.013 0.053 0.019 0.064 0.031 −0.016 0.008
−0.009 0.010 −0.022 0.014 −0.066 0.019 −0.055 0.030 0.020 0.009
8.379 9.503 7.029 2.367 2.09111.606 12.389 9.844 7.186 1.218
−618.66 −329.45 −149.38 −372.34 −189.00356 168 76 244 188
Source: Authors.
Note: Boldfaced figures indicate values that are significant at the 5 percent level.

266 Global Integration and Technology Transfer
TABLE 11A.4 Colombian Chemical Industries: Static Model
Basic industrial Fertilizers andchemicals pesticides Plastics
Demand parameter
a 2.151 0.100 15.969 1.760 18.317 1.777s 0.627 0.017 0.500 0.000 0.491 0.003g 0.074 0.153 2.083 26.857 3.540 5.221
Restricted product quality equation (11.1a)
Intercept −0.449 0.191 26.713 56.287 1.052 7.206Trend −0.018 0.012 −3.853 3.103 −0.723 0.475ln (initial capital) 0.051 0.027 3.154 6.285 3.062 0.476
X only 0.041 0.087MI only 0.112 0.071 −21.496 38.73 5.531 1.610X and MI 0.064 0.09 −11.446 35.52 −1.402 2.165
Restricted marginal cost equation (11.1b)
Intercept 0.819 0.067 0.433 0.106 −0.004 0.019Trend 0.124 0.054 −0.001 0.002 −0.007 0.002ln (initial capital) −0.386 0.319 −0.046 0.022 0.038 0.004
X only 0.624 0.336MI only −0.031 0.032 −0.008 0.069 0.06 0.015X and MI 0.001 0.002 0.003 0.064 0.008 0.02
Quality effects 2.658 0.405 22.322MC effects 4.338 0.112 22.562
−log (L) −458.158 613.069 22.083Number of observations 396 143 132

Product Quality, Productive Efficiency, and International Technology Diffusion 267
TABLE 11A.4 (Continued)
Paints and Detergents andvarnishes Pharmaceuticals perfumes
2.557 0.215 2.196 0.075 4.169 0.2160.294 0.020 0.700 0.009 0.664 0.008
−0.258 1.328 −0.748 0.116 −3.120 0.312
3.827 0.410 −10.451 0.789 −12.029 0.897−6.152 0.446 -0.087 0.019 0.361 0.037−0.111 0.371 1.149 0.200 0.757 0.186
−0.931 0.230−2.212 4.174 0.274 0.096 0.294 0.097−0.027 0.115 0.652 0.141 −0.001
−0.684 1.35 0.507 0.032 0.332 0.0290.325 0.575 −0.01 0.001 −0.007 0.001
−1.314 0.716 0 0.01 −0.01 0.009
−0.069 0.0450.124 0.031 0.014 0.018 −0.007 0.015
−0.003 0.001 −0.056 0.027 −0.028 0.016
0.284 50.673 5.08617.529 11.91 3.262
41.823 −837.104 −512.619132 781 429
Source: Authors.
Note: Boldfaced figures indicate values that are significant at the 5 percent level.

268 Global Integration and Technology Transfer
TABLE 11A.5 Moroccan Chemical Industries: Static Model
Paints andvarnishes Pharmaceuticals
Demand parameter
a 22.29 2.789 11.712 1.057s 0.83 0.016 0.73 0.017g 10.807 7.052 3.978 2.747
Restricted product quality equation (11.1a)
Intercept 5.817 11.856 3.84 5.261Trend 0.572 0.169 −0.076 0.065Ln (initial capital) 1.026 0.902 0.812 0.354
X only −0.347 1.491 −0.668 0.643FDI only 1.023 1.439 −0.934 0.459X and FDI 2.909 1.742 −0.156 0.494
Restricted marginal cost equation (11.1b)
Intercept 0.013 0.147 0.312 0.121Trend 0.011 0.004 −0.004 0.004Ln (initial capital) 0.009 0.018 −0.007 0.013
X only −0.025 0.042 −0.042 0.042FDI only 0.023 0.039 −0.048 0.031X and FDI 0.100 0.047 0.022 0.034
Quality effects 4.333 6.394MC effects 9.193 9.144
-ln(L) −93.598 −223.352Number of observations 112 104

Product Quality, Productive Efficiency, and International Technology Diffusion 269
Table 11A.5 (Continued )
Detergents and Chemicals notperfumes elsewhere classified Plastics
1.478 0.13 10.869 0.402 8.718 0.4410.255 0.027 0.262 0.004 0.547 0.019
−0.048 2.062 5.285 6.8 4.639 1.04
−4.077 4.199 13.286 9.291 2.286 1.9430.278 0.049 0.093 0.132 0.097 0.024
−0.31 0.356 0.491 0.178 0.67 0.14
−1.166 0.545 −0.07 1.782 −0.156 0.2440.13 0.521 0.028 1.008 −0.101 0.243
−1.095 0.559 −1.747 1.496 −1.333 0.542
0.257 0.08 0.087 0.068 0.242 0.0670.013 0.004 0.002 0.003 0.006 0.002
−0.024 0.011 0.013 0.009 −0.013 0.008
−0.012 0.056 −0.106 0.051 −0.014 0.0180.081 0.05 −0.005 0.033 0.013 0.0180.121 0.052 −0.047 0.049 0.047 0.04
8.737 1.534 6.5411.281 4.977 2.221
49.601 221.778 −1021.8180 248 656
Source: Authors.
Note: Boldfaced figures indicate values that are significant at the 5 percent level.

270 Global Integration and Technology Transfer
TABLE 11A.6 Mexican Chemical Industries: Static Model
Basic industrial Syntheticchemicals Resins Plastics
Demand parameter
a 1.475 0.1 1.987 0.229 7.707 0.824
s 0.517 0.02 0.665 0.028 0.167 0.008
g 0.142 0.113 −0.652 0.19 −1.275 0.885
Restricted product quality equation (11.1a)
Intercept −4.386 0.498 −8.92 1.304 6.68 2.656
Trend 0.106 0.034 −0.592 0.074 0.143 0.184
ln(K) 0.55 0.054 0.739 0.125 0.682 0.671
X only 0.058 0.264 −0.41 7.907
MI only 0.195 0.157 −1.995 0.903
MK only −0.366 0.148 −0.307 1.016 −3.36 1.327
MI and X −0.437 0.125 −0.519 0.978 −2.569 0.918
MK and X −0.212 0.157 −1.852 1.905
MI and MK 0.144 0.203 −0.169 0.359 −0.393 1.06
MI, MK, and X −0.256 0.132 −0.507 0.814
Restricted marginal cost equation (11.1b)
Intercept 0.274 0.04 0.356 0.027 0.167 0.022
Trend 0.029 0.004 −0.025 0.005 0.021 0.003
ln(K) −0.013 0.019 −0.02 0.009 0.005 0.008
X only −0.069 0.062 0.036 0.109
MI only −0.037 0.035 −0.003 0.026
MK only −0.051 0.033 0.307 0.088 −0.079 0.039
MI and X −0.041 0.028 0.108 0.072 0 0.026
MK and X 0.006 0.035 −0.106 0.058
MI and MK −0.036 0.045 −0.068 0.053 0.004 0.032
MI, MK, and X −0.032 0.03 0 0.023
Quality effects 24.524 0.833 15.586
MC effects 6.268 15.62 7.351
−Log(L) −308.656 154.594 18.271
Number of 295 95 195observations

Product Quality, Productive Efficiency, and International Technology Diffusion 271
TABLE 11A.6 (Continued)
Other Rubber Fertilizers and Soaps andchemicals products pesticides Pharmaceuticals perfumes
10.77 1.021 1.921 0.12 3.524 0.23 4.712 0.359 2.643 0.093
0.111 0.006 0.513 0.016 0.428 0.022 0.486 0.022 0.555 0.008
1.244 2.583 −1.254 0.236 −0.067 0.093 −1.742 0.254 −3.073 0.134
23.366 8.731 −14.229 1.115 −0.116 0.591 −2.419 1.049 −10.119 0.456
1.186 0.804 0.493 0.078 0.017 0.02 −0.156 0.057 −0.679 0.032
−0.131 . 0.965 0.162 0.698 0.051 0.752 0.134 0.444 0.060
−3.432 9.913 0.013 0.143 0.322 0.523 0.12 0.142
−2.39 4.414 0.06 0.319 0.07 0.112 −1.181 0.372 0.142 0.144
−2.477 7.056 −0.043 0.674 0.01 0.155 0.557 0.448 −0.157 0.270
−3.76 3.527 −0.29 0.131 0.259 0.373 0.09 0.202
−2.788 6.024 −0.147 0.260
−1.956 4.316 −0.14 0.398 0.236 0.134 −0.221 0.53 0.396 0.145
−4.341 3.659 0.042 0.355 0.005 0.109 0.429 0.446 0.285 0.162
0.426 0.044 0.404 0.07 0.261 0.027 0.375 0.054 0.309 0.032
0.008 0.006 0.016 0.005 0.009 0.002 −0.006 0.004 −0.006 0.003
−0.037 0.014 0.002 0.025 0.01 0.008 0 0.015 −0.017 0.010
−0.046 0.149 −0.013 0.036 0.03 0.054 0.006 0.023
−0.085 0.061 0.044 0.04 −0.061 0.023 −0.047 0.038 0.008 0.023
−0.053 0.114 0.003 0.087 −0.009 0.037 0.049 0.046 0.043 0.044
−0.067 0.047 −0.078 0.028 0.073 0.038 0.053 0.033
−0.066 0.086 −0.022 0.042
−0.011 0.066 0.018 0.051 −0.075 0.028 −0.017 0.055 0.041 0.023
−0.04 0.049 −0.023 0.046 −0.026 0.028 0.057 0.046 0.063 0.026
1.685 0.382 14.883 17.184 10.458
4.301 2.455 13.005 9.796 9.071
746.139 −93.021 −957.527 −312.373 −810.053
305 235 445 210 725
Source: Authors.
Note: Boldfaced figures indicate values that are significant at the 5 percent level.

272 Global Integration and Technology Transfer
Chapter 11 Annex B:Activity Patterns and Determinants
Year t + 1
Year t None Import Export Both Total
None 509 70 9 3 591Import 58 522 1 31 612Export 7 2 45 7 61Both 4 47 7 508 566Total 578 641 62 549 1,830
P[export] 0.343P[import] 0.644P[export|import] 0.480P[import|export] 0.903
P[export at t + k | not export at t] 0.037P[export at t + k | not export at t, not import at t] 0.020P[export at t + k | not export at t, import at t] 0.052P[Ho: export at t + 1 independent of import at t] 0.003
P[import at t + k | not import at t] 0.126P[import at t + k | not import at t, not export at t] 0.124P[import at t + k | not import at t, export at t] 0.148P[Ho: import at t + 1 independent of export at t] 0.590
TABLE 11B.1 Activity Dynamics in the Colombian ChemicalsIndustry: Descriptive Evidence
Source: Authors.
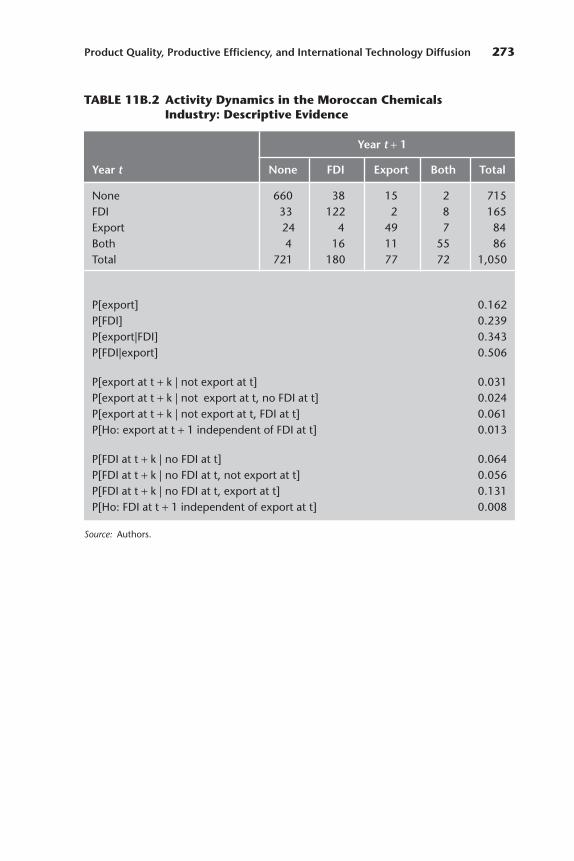
Product Quality, Productive Efficiency, and International Technology Diffusion 273
Year t + 1
Year t None FDI Export Both Total
None 660 38 15 2 715FDI 33 122 2 8 165Export 24 4 49 7 84Both 4 16 11 55 86Total 721 180 77 72 1,050
P[export] 0.162P[FDI] 0.239P[export|FDI] 0.343P[FDI|export] 0.506
P[export at t + k | not export at t] 0.031P[export at t + k | not export at t, no FDI at t] 0.024P[export at t + k | not export at t, FDI at t] 0.061P[Ho: export at t + 1 independent of FDI at t] 0.013
P[FDI at t + k | no FDI at t] 0.064P[FDI at t + k | no FDI at t, not export at t] 0.056P[FDI at t + k | no FDI at t, export at t] 0.131P[Ho: FDI at t + 1 independent of export at t] 0.008
TABLE 11B.2 Activity Dynamics in the Moroccan ChemicalsIndustry: Descriptive Evidence
Source: Authors.

274 Global Integration and Technology Transfer
All firms Pharmaceuticals only
Dependent Standard Standardvariable Regressor Coefficient error Coefficient error
Export and Lagged both 0.604 0.034 0.778 0.079import Lagged export 0.113 0.045 0.234 0.092
Lagged import 0.011 0.014 0.107 0.076Lagged neither 0.015 0.014 0.110 0.071Quality — — 0.007 0.009Marginal cost — — −0.043 0.037Initial both 0.332 1.468 0.240 0.048Initial export 0.029 0.661 0.276 0.088Initial import 0.058 1.093 0.046 0.031Average quality — — 0.002 0.009Average marginal
cost — — 0.045 0.054Export only Lagged both 0.063 0.017 0.113 0.063
Lagged export 0.507 0.027 0.466 0.070Lagged import 0.033 0.013 0.077 0.061Lagged neither 0.017 0.009 0.061 0.060Quality — — −0.006 0.005Marginal cost — — 0.002 0.021Initial both −0.048 0.018 −0.069 0.029Initial export 0.160 0.032 −0.051 0.071Initial import −0.031 0.014 −0.037 0.022Average quality — — 0.005 0.005Average marginal
cost — — −0.031 0.041Import only Lagged both −0.032 0.043 −0.115 0.104
Lagged export 0.019 0.069 −0.088 0.131Lagged import 0.546 0.028 0.574 0.104Lagged neither 0.093 0.019 0.102 0.095Quality — — 0.005 0.013Marginal cost — — 0.089 0.054Initial both 0.072 0.044 0.170 0.065Initial export 0.013 0.065 0.123 0.126Initial import 0.287 0.031 0.311 0.047Average quality — — −0.002 0.013Average marginal
cost — — −0.090 0.072
TABLE 11B.3 Activity Dynamics in the Colombian ChemicalsIndustry: Econometric Results

Product Quality, Productive Efficiency, and International Technology Diffusion 275
All firms Pharmaceuticals only
Dependent Standard Standardvariable Regressor Coefficient error Coefficient error
P[export at t + k | not export at t,import at t] − P[export at t + k |not export at t, not import at t] 0.012 0.016 0.013 0.032
P[import at t + k | not import at t,export at t] − P[import at t + k |not import at t, not export at t] 0.025 0.055 −0.065 0.092
TABLE 11B.3 Activity Dynamics in the Colombian ChemicalsIndustry: Econometric Results (Continued)
Source: Authors.
Note: — = not available.

276 Global Integration and Technology Transfer
All firms Pharmaceuticals only
Dependent Standard Standardvariable Regressors Coefficient error Coefficient error
Export Lagged both 0.427 0.039 0.594 0.077and FDI Lagged export 0.081 0.028 0.018 0.047
Lagged FDI −0.067 0.027 0.026 0.052Lagged neither −0.003 0.007 0.021 0.050Quality — — −0.010 0.005Marginal cost — — 0.081 0.041Initial both 0.442 2.030 0.000 0.000Initial export 0.007 1.815 0.002 0.018Initial FDI 0.147 1.697 0.058 0.020Average quality — — 0.012 0.006Average marginal
cost — — −0.107 0.066Export only Lagged both 0.097 0.038 0.136 0.155
Lagged export 0.404 0.038 0.579 0.100Lagged FDI 0.085 0.031 0.168 0.100Lagged neither 0.037 0.010 0.135 0.090Quality — — −0.005 0.013Marginal cost — — 0.060 0.092Initial both −0.016 0.042 0.000 0.000Initial export 0.366 0.044 0.323 0.048Initial FDI −0.064 0.030 −0.036 0.044Average quality — — 0.020 0.015Average marginal
cost — — −0.192 0.122FDI only Lagged both −0.262 0.050 −0.395 0.139
Lagged export −0.073 0.040 −0.004 0.047Lagged FDI 0.101 0.040 −0.004 0.056Lagged neither 0.010 0.010 −0.030 0.044Quality — — 0.003 0.011Marginal cost — — −0.048 0.074Initial both 0.296 0.053 0.000 0.000Initial export 0.063 0.046 −0.025 0.046Initial FDI 0.597 0.036 0.649 0.046Average quality — — −0.005 0.013Average marginal
cost — — −0.090 0.071
TABLE 11B.4 Activity Dynamics in the Moroccan ChemicalsIndustry: Econometric Results

Product Quality, Productive Efficiency, and International Technology Diffusion 277
All firms Pharmaceuticals only
Dependent Standard Standardvariable Regressors Coefficient error Coefficient error
P[export at t + k|not export att, FDI at t] − P[export at T + k |not export at t, no FDI at t] −0.016 0.036 0.037 0.050
P[FDI at t + k|no FDI at t,export at t] − P[FDI at t + k |no FDI at t, not export at t] 0.002 0.035 0.022 0.042
TABLE 11B.4 Activity Dynamics in the Moroccan ChemicalsIndustry: Econometric Results (Continued)
Source: Authors.
Note: — = not available.

278 Global Integration and Technology Transfer
Notes
1. Unlike the other authors mentioned here, Eaton and Kortum (1996) do not attempt to empiri-cally isolate a conduit for knowledge transfer.
2. Tybout (2000) provides a more extensive literature review.3. Few studies in the other literatures do better. Pack (1987) is an exception. He uses detailed infor-
mation on machines and workers at a sample of plants to calculate high-quality productivity indexes.4. Milgrom and Roberts (1990) make a similar point in their study of the adoption of new tech-
nologies and organizational strategies. They do not consider international trade in goods, ownership,or information, so their list of activities differs somewhat from those that are the focus here. Nonethe-less, their basic analytical point translates to our setting, mutatis mutandis. When nonconvexities andcomplementarities characterize the profit function, it may well be optimal to adopt bundles of newactivities at once.
5. That is, the kth element of bjt takes a value of one in period t if the firm is engaged in the kth pos-sible bundle of activities during that period and otherwise takes a value of zero. In a country in whichthere are K possible activities, bjt has 2K elements.
6. Variation in factor prices across plants will also undermine our basis for inference. We controlledfor regional variation in factor prices using regional dummies and never found significant effects.
7. It is possible to avoid this assumption, but doing so leaves the demand parameters underidenti-fied and necessitates Bayesian estimation. Katayama, Lu, and Tybout (2003) provide details.
8. Anderson, de Palma, and Thisse (1992) show that one can think of these error components asreflecting heterogeneous tastes over unobserved product characteristics. From that perspective,Ackersburg and Rysman (2001) suggest that m1 and m2 be made functions of the number of products,since the addition of more products to a market is likely to crowd product space and effectively reducethe dispersion in tastes across products. We experimented with this generalization and found no cross-nest dependence of the error component variances on the number of products available locally.
9. As s goes to zero, the within-group correlation of utilities goes to zero; as s goes to unity, within-group correlation goes to unity.
10. More precisely, we calculate Mt using a constant real exchange rate to convert real dollar importsto pesos in all years. Thus we assume that the real dollar cost of imports corresponds to the volumeof intermediate goods used to produce them. Our approach to measuring imports also implies thatforeign producers do not adjust their dollar price in response to exchange rate fluctuations—that is, weassume complete pass-through. This implication is consistent with our expressions for equilibrium mar-ket shares and prices, which are based on the premise that the price of the outside good does not respondto adjustments in the prices of the domestically produced varieties. While the empirical literature sug-gests that the dollar prices of imported goods are likely to respond some to exchange rate fluctuations,our assumption does not seem too far from reality.
11. This condition presumes that the (common knowledge) performance vector (ω1, ω2t, ωjt,… ωNt)is realized at the beginning of each period and that future states of the industry do not depend on cur-rent price and quantity choices, given Ωt−1 and Bt−1. Also, mixed strategies in the product market com-petition are disallowed. See Ericson and Pakes (1995) for a formal discussion of the relation betweenproduct market competition and industry dynamics.
12. Lu and Tybout (2000) discuss some alternative ways to allow for noise in equation (11.2′). Thesealternatives complicate the estimation procedure but can be feasibly implemented. We plan to exploretheir properties in future work.
13. Note that we assume that m∗ is independent of bj, although mmay not be.14. In principle, a multinomial probit version of the decision rule could be estimated using the simu-
lated method of moments (Geweke, Keane, and Runkle 1997). However, this approach is difficult to applyin our data sets, because we do not have any firm-specific information on variables that affect the utilityof different choices (Keane 1992). Extensive experimentation with this estimator thus proved fruitless.
15. We use the following notation: X (exporter), MI (importer of intermediate goods), MK(importer of capital goods), and FDI (firm with at least 5 percent foreign ownership).

16. It is straightforward to calculate the predicted effect of these marginal cost and quality changeson profits firm by firm, but we did not do so.
17. As Grossman and Helpman (1991, p. 166) note,“Imports may embody differentiated intermedi-ates that are not available in the local economy. The greater the quantity of such imports, the greater per-haps will be the number of insights that local researchers gain from inspecting and using these goods.”
18. Alternatively, we might have pooled all firms and added industry dummies. The problem withthis approach is that it adds a large number of additional parameters to be estimated. Since several ofthe other industries have quite small populations of firms, this rapidly exhausts degrees of freedom. Adrawback of focusing on the largest industry is that the term , summarizing competitors’ perform-ance, exhibits very little cross-firm variation. We therefore drop it from the estimation. Even for this lim-ited specification, the number of parameters to be estimated is quite large: Kx(2K − 1) elements in thevector of coefficients on lagged activities (d, 2 ∗ K ∗ (2K − 1) elements in the vector of coefficients onlagged performance,a, and the same number again for the initial conditions correction. For this reasonwe are unable to estimate the model for Mexico, where the increase from K = 2 to K = 3 activities wouldresult in 144 parameters to be estimated, with at most 580 observations in the plastics industry.
References
Ackersburg, Daniel, and Mark Rysman. 2001. “Unobserved Product Differentiation in Discrete ChoiceModels: Estimating Price Elasticities and Welfare Effects.”Department of Economics, Boston University.
Aitken, Brian, and Ann Harrison. 1999. “Do Domestic Firms Benefit from Foreign Direct Investment?Evidence from Panel Data.” American Economic Review 89 (3): 605–18.
Anderson, Simon, Andre de Palma, and Jacques-Francois Thisse. 1992. Discrete Choice Theory ofProduct Differentiation. Cambridge, MA: MIT Press.
Aw, Bee-Yan, and Amy Hwang. 1995. “Productivity and the Export Market: A Firm-Level Analysis.”Journal of Development Economics 47 (3): 313–32.
Berry, Steven. 1994. “Estimating Discrete-Choice Models of Product Differentiation.” Rand Journal 25(2): 242–62.
Berry, Steven, James Levinsohn, and Ariel Pakes. 1995. “Automobile Prices in Market Equilibrium.”Econometrica 63 (4): 841–90.
Bigsten, Arne, Paul Collier, Stefan Dercon, Bernard Gauthier, Jan Gunning, Anders Isaksson, AbenaOduro, Remco Ooostendorp, Cathy Patillo, Mans Soderbom, Michel Sylvain, Francis Teal, andAlbert Zeufack. 1999. “Exports and Firm-Level Efficiency in the African Manufacturing Sector.”School of Business, University of Montreal.
Blomström, Magnus, Robert Lipsey, and Mario Zejan. 1994.“What Explains the Growth of DevelopingCountries?” In Convergence of Productivity: Cross-National Studies and Historical Evidence, ed.William J. Baumol, Richard Nelson, and Edward Wolff, 243–59. New York: Oxford University Press.
Chen, Tain-jy, and De-piao Tang. 1987.“Comparing Technical Efficiency between Import-Substitutingand Export-Oriented Foreign Firms in a Developing Country.” Journal of Development Economics36 (3): 277–89.
Clerides, Sofronis, Saul Lach, and James Tybout. 1998. “Is Learning by Exporting Important? Micro-Dynamic Evidence from Colombia, Mexico and Morocco.” Quarterly Journal of Economics 115 (3):903–47.
Coe, David, and Elhanan Helpman. 1995. “International R&D Spillovers.” European Economic Review39 (4): 859–87.
de Long, J. Bradford, and Lawrence Summers. 1991. “Equipment Investment and Long Run Growth.”Quarterly Journal of Economics 106 (2): 445–502.
Eaton, Jonathan, and Samuel Kortum. 1996.“Trade in Ideas: Patenting and Productivity in the OECD.”Journal of International Economics 40 (2): 251–78.
Ericson, Richard, and Ariel Pakes. 1995.“Markov-Perfect Industry Dynamics: A Framework for EmpiricalWork.” Review of Economic Studies 62 (1): 53–82.
ωtj
−−
1
Product Quality, Productive Efficiency, and International Technology Diffusion 279

Ethier, Wilfred. 1982. “National and International Returns to Scale in the Modern Theory of Interna-tional Trade.” American Economic Review 72 (3): 389–405.
Geweke, John, Michael Keane, and David Runkle. 1997. “Statistical Inference in the MultinomialMulti-Period Probit Model.” Journal of Econometrics 80 (1): 125–65.
Grossman, Gene, and Elhanan Helpman. 1991. Innovation and Growth in the Global Economy.Cambridge, MA: MIT Press.
Haddad, Mona, and Ann Harrison. 1993.“Are There Positive Spillovers from Direct Foreign Investment?Evidence from Panel Data for Morocco.” Journal of Development Economics 42 (1): 51–74.
Hobday, Michael. 1995. Innovation in East Asia: The Challenge to Japan. Cheltenham, UK: Edward Elgar.Katayama, Hajime, Shihua Lu, and James Tybout. 2003. “Why Plant-Level Productivity Studies Are
Often Misleading and an Alternative Approach to Inference.”Working Paper 9617, National Bureauof Economic Research, Cambridge, MA.
Katz, Jorge. 1987. Technology Generation in Latin American Manufacturing Industries. London:MacMillan.
Keane, Michael. 1992. “A Note on Identification of the Multinomial Probit Model.” Journal of Businessand Economic Statistics 10 (2): 193–200.
Keller, Wolfgang. 1998. “Are International R&D Spillovers Trade-Related? Analyzing Spillovers amongRandomly Matched Trade Partners.” European Economic Review 42 (8): 1469–81.
———. 2000.“Do Trade Patterns and Technology Flows Affect Productivity Growth?” World Bank Eco-nomic Review 214 (1): 17–47.
Kim, L. 1977. Imitation to Innovation: The Dynamics of Korea’s Technological Learning. Boston: HarvardBusiness School Press.
Lall, Sanjaya. 1987. Learning to Industrialize. London: MacMillan.Lu, Shihua, and James Tybout. 2000. “Inferring Plant-Level Performance Measures from Revenues and
Costs.” Department of Economics, Pennsylvania State University. University Park, Pennsylvania.McFadden, Daniel. 1974. “Conditional Logit Analysis of Qualitative Choice Behavior.” In Frontiers in
Econometrics, ed. Paul Zarembka. New York: Academic Press.Milgrom, Paul, and John Roberts. 1990. “The Economics of Modern Manufacturing: Technology,
Strategy and Organization.” American Economic Review 80 (3): 511–28.Pack, Howard. 1987. Productivity, Technology and Industrial Development. New York: Oxford University
Press.Rhee, Yung Whee, Bruce Ross-Larson, and Garry Pursell. 1984. Korea’s Competitive Edge: Managing
Entry into World Markets. Baltimore: Johns Hopkins University Press.Roberts, Mark, and James Tybout. 1997. “The Decision to Export in Colombia: An Empirical Model of
Entry with Sunk Costs.” American Economic Review 87 (3): 545–64.Tybout, James. 2000. “Manufacturing Firms in Developing Countries: How Well Do They Do, and
Why?” Journal of Economic Literature 38 (1): 11–44.Tybout, James, and M. Daniel Westbrook. 1995. “Trade Liberalization and Dimensions of Efficiency
Change in Mexican Manufacturing Industries.” Journal of International Economics 39 (1):53–78.
Westphal, Larry. 2001. “Technology Strategies for Economic Development in a Fast Changing GlobalEconomy.” Economics of Innovation and New Technology 11 (4–5): 275–320.
Wooldridge, Jeffrey. 2000. “The Initial Conditions Problem in Dynamic, Nonlinear Panel Data Mod-els with Unobserved Heterogeneity.” Working Paper, Department of Economics, Michigan StateUniversity, East Lansing.
280 Global Integration and Technology Transfer

Market Discipline andCorporate Efficiency:
Evidence from Bulgaria
Simeon Djankov and Bernard Hoekman
281
12
The conventional wisdom in the international trade literature is that greater importcompetition forces domestic firms to improve their efficiency. In contrast, manyempirical studies suggest that import competition has no or only a weak effect oncorporate performance. These findings may come about because many tests of theimpact of import competition on firm performance have tended to focus on allfirms producing tradable products. No distinction is generally made betweenimport-competing firms and enterprises that export a substantial proportion oftheir output. The latter should be much less sensitive to a reduction in import bar-riers, insofar as the revealed ability to compete on export markets indicates thatthese firms should already be efficient. While imports are often a key input for suchfirms, governments in most countries have implemented schemes aimed at pro-viding exporters with inputs at world prices. A reduction in overall levels of importbarriers will therefore also imply less of a change in incentives than is the case forimport-competing firms.
While not distinguishing between exporters and nonexporters may be a factorunderlying the weak relationship that has been found between trade liberalizationand subsequent improvements in corporate performance, other factors may leadto an overstatement of the impact of trade liberalization. Frequently, governmentspursuing structural economic reforms may take actions that go beyond trade lib-eralization. Examples are tighter fiscal discipline, privatization, and the introduc-tion of antitrust regimes, all of which should result in greater market discipline
This article originally appeared in the Canadian Journal of Economics 2000, 33(1): 190–212.

282 Global Integration and Technology Transfer
for enterprises. Conversely, if a government does not pursue such complementaryactions when undertaking trade liberalization, the effects of greater competitionfrom imports may be attenuated. For example, if soft financing at the enterpriselevel is available or competition law enforcement is lax, import competition maydo little to influence firms’ performance. Indeed, a perverse relation may exist iffirms obtain increased subsidies or soft loans because import competition hascaused a decline in their productivity.
In this chapter we investigate the relationship between firm productivity andincreased competition in Bulgaria during the 1991–95 period, focusing on a num-ber of major changes in policies—in particular, opening to international trade, cor-poratization and demonopolization of state-owned industry, and changes in thehardness of budget constraints confronting firms. Enterprise-level data are used todirectly estimate changes in total factor productivity (TFP) growth, which we useas the measure of enterprise adjustment to the more competitive environment.We findthat changes in import competition, domestic market structure (industry concen-tration), and firm-specific budget constraints (as measured by changes in arrears)all have the predicted impact on corporate performance. Increased import pressureis positively associated with subsequent productivity growth of Bulgarian firms.However, this finding is robust only once the sample is split into firms that are pri-marily exporters and those that are not. What matters for the exporters is compe-tition on the global market. The results suggest that empirical work analyzing theimpact of trade liberalization should be based on firm-level data that allowexporters and nonexporters to be distinguished. The analysis also illustrates theimportance of accounting for changes in other policies that may enhance or attenuatethe effect of greater competition from imports. In our sample, increases in domesticconcentration and arrears are associated negatively with TFP growth.
The Literature on Competitionand Corporate Efficiency
There is a substantial theoretical literature that studies the relationship betweencompetition and corporate efficiency. The general hypothesis is that increased com-petition stimulates improvements in productivity. Two lines of argument have beendeveloped in support of this hypothesis. The first is derived from the literature onX-inefficiency (internal to the firm); the second centers on industry rationaliza-tion. The X-inefficiency literature assumes that managerial effort is undersuppliedin the absence of vigorous competition. In a theoretical investigation of the impli-cations of the X-inefficiency hypothesis, Horn, Lang, and Lundgren (1995) showhow greater competition may induce an expansion of output by incumbent firmsthrough improved internal technical efficiency without any reallocation ofresources across firms. Earlier studies (Holstrom 1982; Nalebuff and Stiglitz 1983)

Market Discipline and Corporate Efficiency 283
argue that incentive schemes for managers will generate better results the greater thenumber of players (firms) involved. This arises because of greater opportunities forcomparison of performance. Hart (1983) builds an explicit model to show the linkbetween increased competition and improved manager performance.
A second line of argument is that increased competition may lead to a rational-ization of oligopolistic industries as firms are forced to compete for market share(Schmidt 1994). Resource reallocation occurs across firms within and betweensectors. Although the shake-out process may result in a transitional decline inmeasured efficiency insofar as firms with increasing returns to scale lose domesticmarket share, over time this may be offset by greater output as the size of the mar-ket expands due to exit and access to export markets. Much depends on the exis-tence of scale economies and the ease of entry and exit. Since competition raises theprobability of bankruptcy and hence job losses, it also generates stronger incentivesfor workers to improve productivity and higher labor turnover across firms withinsectors (Dickens and Katz 1987).
Both strands of the theoretical literature lead to the same prediction: greatercompetition leads, with some lag, to productivity improvements in imperfectlycompetitive industries. Few empirical investigations using firm-level data haveestablished a strong link between greater competition and subsequent improvementsin corporate productivity. Most studies look only at the partial correlation of aspecific measure of increased competition; to the best of our knowledge there areno studies on developing countries or transition economies that attempt to accountfor different types of government policies that may affect competitive pressuresat a given point in time. The four policy changes that are most frequently analyzedin the literature are trade liberalization (often proxied by changes in importpenetration), hard budget disciplines, changes in market structure through entryand exit, and privatization.
Import Competition
Trade liberalization programs in developing countries in the 1980s and in transitioneconomies in the early 1990s have generated firm- or industry-level data that allowtests of the imports-as-market-discipline hypothesis. Most studies exploring theeffect of increased import competition on enterprise behavior estimate the impacton relative changes in TFP across sectors and have come to ambiguous conclusions.Harrison (1994) finds that the reduction in tariffs and the subsequent increase inimport penetration in Côte d’Ivoire following the 1982 trade liberalization had apositive, although not statistically significant, effect on TFP growth. Haddad, DeMelo, and Horton (1996) find no effect of increased import penetration on TFPgrowth in Moroccan industries following the 1986 liberalization. In contrast tothese studies, van Wijnbergen and Venables (1993) find a strong positive effect of

increased import penetration on labor productivity in a large sample of Mexicanmanufacturing firms.Several studies on transition economies also find a positive asso-ciation between import competition and changes in productivity. Earle and Estrin(2001) conclude that there is a strong positive effect of increased import competi-tion on labor productivity of Russian firms, and Falk, Raiser, and Brauer (1995)find a positive association between import penetration and industry perform-ance in a large sample of Polish firms.
A second group of studies uses the dynamics of entry and exit across sectors asa measure of the effect of imports as market discipline. Roberts (1996) finds someevidence for a positive effect of import competition on increased turnover inColombia, but only in highly concentrated industries. Using a sample of Chileanfirms, Tybout (1996) finds only a weak association between import penetration andentry-exit patterns.
A third group of studies focuses on changes in industry mark-ups (price-cost mar-gins) in countries that have undergone recent trade liberalization.A reduction in mark-ups is interpreted as a sign that increased competitive pressure has induced managersto improve efficiency. Levinsohn (1993) and Grether (1996) find some support for theimports-as-market-discipline hypothesis in studies of Turkey and Mexico, respectively.
Financial Discipline
A second strand in the empirical literature suggests that the imposition of hardbudget constraints (elimination of direct subsidies, prudent bank lending, refusal bythe government to write off bad debt) is necessary to ensure productivity growth.Prudent bank lending has been shown to lead to improved allocation of resourcesin the real sector and hence to affect economic growth positively (King and Levine1993). Without hard budget constraints, it may be rational for managers to spendmore time lobbying the government for subsidies and related types of support thanundertaking painful restructuring measures. The empirical evidence suggests that“enterprises subjected to financial discipline show more aggressive collection ofreceivables, a closer link between profitability and investment, and a reorientation ofgoals from output targets to profits” (World Bank 1996, p. 45). Soft budget con-straints are not necessarily introduced through direct government subsidies. Schaffer(1998) finds, for a large sample of Hungarian, Polish, and Russian firms, that gov-ernments use tax arrears to keep loss-making enterprises afloat.
Changes in Competition Policies and Market Structure
A third group of studies focus on competition in the domestic product market as adeterminant of corporate performance. Two studies of British manufacturing firms(Nickell,Wadhwani, and Wall 1992 and Nickell 1996) use a panel framework to show
284 Global Integration and Technology Transfer

that market concentration has an adverse effect on the level of TFP. By the nature oftheir estimation, this also implies that an increase in market concentration is followedby a fall in productivity. In the transition context, Lizal, Singer, and Svejnar (1995)find that the deconcentration of industry that followed the collapse of central planningin the Czech Republic did not result in improved labor productivity. Controlling forchanges in imports, Earle and Estrin (2001) find no effect of changes in marketconcentration on the performance of Russian firms, as measured in labor productivitygrowth, total layoffs, or the introduction of new product lines. These results aresomewhat surprising and may be due to the absence of panel data sets and the lackof attention given to controlling for the possibility that firms differ in terms of thehardness of their budget constraints.
Privatization
A great deal of attention has been given to determining the effects of privatizationof firm performance (see Shleifer and Vishny 1994 for an overview). Clearly, thismay have significant implications for managerial incentives to improve efficiency,and any empirical evaluation of trade liberalization should take into account theeffect of privatization programs if they are pursued by a government. However, inthe case of Bulgaria, privatization was not pursued with any vigor. Consequently,we make no attempt to survey the large and rapidly expanding literature.
Economic Reforms in Bulgaria
Until the late 1980s, Bulgaria was closely connected to the Soviet Union through theCouncil of Mutual Economic Assistance (CMEA) system. There was only a very smallprivate sector, unlike Poland or Hungary, where private firms were allowed to operatein agriculture and services. State enterprises, organized in large vertically integratedconglomerates, produced according to quotas set by the Central Planning Committee.Their activities were financed by the State Bank, the only financial intermediary inthe country. About one-third of industrial output was exported in 1988, of whichsome 80 percent went to CMEA markets (World Bank 1991). Similarly, Bulgariarelied to a great extent on the CMEA for its imports. Following the collapse of theCMEA in 1990, Bulgaria lost its major export markets, was forced to adjust to a muchhigher oil import bill as Soviet oil subsidies were eliminated and Iraqi supplies driedup following the Persian Gulf War, and was confronted with the repercussions of thecivil war in Yugoslavia. The latter implied not just the loss of another export marketbut also higher transport costs to Europe. The magnitude of the economic shocks inthe early 1990s therefore went beyond the demise of central planning.
As a result of these various developments, the economy went into a sharp recession.In 1991 industrial production fell by 22 percent, GDP declined by over 10 percent, and
Market Discipline and Corporate Efficiency 285

unemployment rose rapidly (table 12.1, panel A).A “big bang”stabilization and struc-tural adjustment program was implemented during the course of 1991. Under it mostsubsidies were slashed. By mid-1992 most retail prices were liberalized, leading to alarge jump in inflation, reflecting the existing monetary overhang. By 1994 outputbegan to expand again, led by strong export growth, and unemployment rates startedto decline from their peak of 17 percent in 1993. The majority of manufacturingindustries became confronted with stronger market discipline. Aggregate subsidies(budget transfers) to the industrial sector declined from 14.9 percent of GDP in1990 to 1.1 percent of GDP in 1995 (EBRD 1997). Although most remaining direct
286 Global Integration and Technology Transfer
Panel A: Macroeconomic Indicators
Indicator 1991 1992 1993 1994 1995 1996
Real economicgrowth (percent) –11.7 –5.6 –4.2 1.4 2.6 –4.2
Industrial production(percent change) –22.4 –12.2 –6.4 2.2 8.6 –7.8
Exports (percentchange fromprevious year) –5.6 11.8 23.4 37.1 29.3 15.3
Imports (percentchange fromprevious year) –18.6 53.2 8.2 9.1 18.3 8.3
CPI change (percentchange fromprevious year) 338.5 91.3 75.0 52.1 32.9 298.1
Unemployment(percent oflabor force) 11.1 16.4 17.0 13.3 10.6 11.7
Bulgarian lev/US$exchange rate 21.8 24.5 32.7 66.1 70.7 782.3
TABLE 12.1 Performance Statistics, 1991–96
Panel B: Stock of Tax Arrears (percent of GDP, end-period)
Country 1991 1992 1993 1994 1995 1996
Bulgaria 6.7 10.3 10.9 12.2 11.1 13.4Moldova — — — 9.6 8.2 10.4Poland 4.1 4.4 5.3 4.5 3.6 3.9Romania 1.8 2.3 1.5 4.2 4.6 5.1Russian Federation — — 1.7 2.5 3.5 10.0
Source: EBRD (1997).
Note: — = not available.

subsidies from the budget were concentrated in nontradable goods or services indus-tries (utilities, mining, construction), many firms continued to be financed throughsoft loans from state-owned banks and build-up of arrears (on taxes, wages, and cred-itors). Bulgaria was among the worst performing European transition economies inthis regard (table 12.1, panel B).
Competition from imports increased significantly. In 1992 imports jumped50 percent, following the abolition of trade monopolies, licensing, exchangecontrol, and quantitative restrictions. Imports continued to expand steadily after1992. A unified floating exchange rate regime and a relatively flat five-band tariffstructure were adopted, with a maximum rate of 40 percent and an average collectedrate (tariff revenues as a share of imports) of some 7 percent in 1994–95 (IMF 1997).1
Very little privatization occurred up to 1996; the manufacturing sector continuedto consist almost exclusively of state-owned enterprises: as of end-1995 only 7 percentof manufacturing output was in private hands (Bulgarian Privatization Agency 1997).However, a 1992 Law on Demonopolization led to a significant reduction in con-centration and vertical integration in many sectors, as enterprises were transformedinto joint stock companies and often broken up into constituent parts. Some newdomestic entry also occurred in manufacturing sectors—in the 1991–95 periodabout 12 percent of manufacturing (mostly food and clothing) was produced in newprivate firms (National Statistical Office of Bulgaria 1997). As a result, concentrationin most industries declined (table 12.2).
The transformation of state-owned enterprises into joint stock companies wasaccompanied by the creation of boards of directors. Membership of the boards wasdrawn from line ministries and other government bodies. Although in principle theboards could lead to a strengthening of incentives for management to improveenterprise performance, it could also make it easier to engage in profit shifting andasset stripping by weakening the oversight role of the state (Schleifer and Vishny1994). In the short run, the effect of breaking up enterprises and the resultingelimination of in-house upstream and downstream linkages could also lead to areduction in efficiency, as these are replaced with arm’s length relationships only witha lag and involve incurring a variety of transactions and search costs (Svejnar 1995).In the event, the absence of privatization in the manufacturing and banking sectorscreated an environment of lax financial discipline for many enterprises. Althoughthe government reduced explicit budgetary subsidies significantly, it often brokereddeals between banks and enterprises (both state owned) to ensure that productioncontinued even if the enterprise generated negative value-added (Claessens andPeters 1997). There was also a partial write-off of bank debts in 1993 for a numberof highly indebted enterprises (an earlier write-off in 1991 is not captured in the data).These write-offs provided a perverse signal to all firms. Matters were compoundedby a reduction in the quality of the “regulatory oversight” to which state-owned
Market Discipline and Corporate Efficiency 287
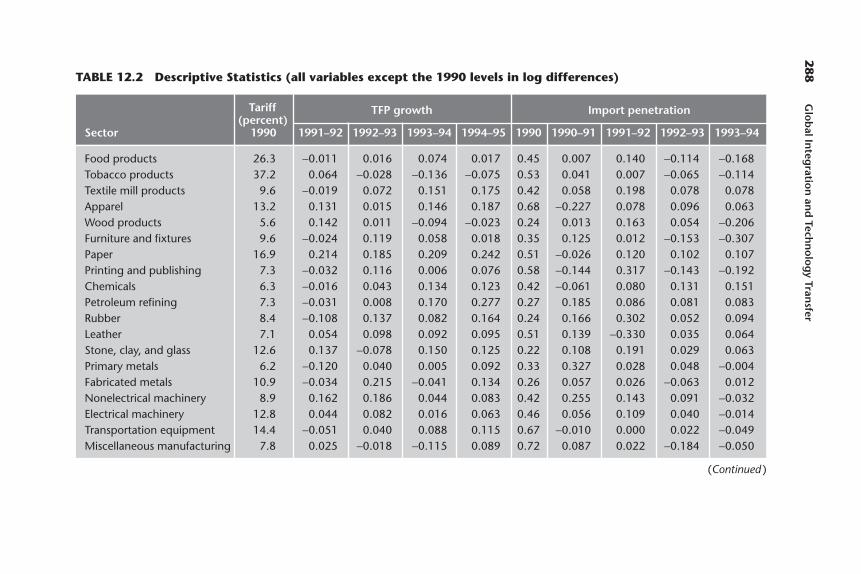
288
Glo
bal In
tegratio
n an
d Tech
no
log
y Transfer
Tariff TFP growth Import penetration(percent)
Sector 1990 1991–92 1992–93 1993–94 1994–95 1990 1990–91 1991–92 1992–93 1993–94
Food products 26.3 −0.011 0.016 0.074 0.017 0.45 0.007 0.140 −0.114 −0.168Tobacco products 37.2 0.064 −0.028 −0.136 −0.075 0.53 0.041 0.007 −0.065 −0.114Textile mill products 9.6 −0.019 0.072 0.151 0.175 0.42 0.058 0.198 0.078 0.078Apparel 13.2 0.131 0.015 0.146 0.187 0.68 −0.227 0.078 0.096 0.063Wood products 5.6 0.142 0.011 −0.094 −0.023 0.24 0.013 0.163 0.054 −0.206Furniture and fixtures 9.6 −0.024 0.119 0.058 0.018 0.35 0.125 0.012 −0.153 −0.307Paper 16.9 0.214 0.185 0.209 0.242 0.51 −0.026 0.120 0.102 0.107Printing and publishing 7.3 −0.032 0.116 0.006 0.076 0.58 −0.144 0.317 −0.143 −0.192Chemicals 6.3 −0.016 0.043 0.134 0.123 0.42 −0.061 0.080 0.131 0.151Petroleum refining 7.3 −0.031 0.008 0.170 0.277 0.27 0.185 0.086 0.081 0.083Rubber 8.4 −0.108 0.137 0.082 0.164 0.24 0.166 0.302 0.052 0.094Leather 7.1 0.054 0.098 0.092 0.095 0.51 0.139 −0.330 0.035 0.064Stone, clay, and glass 12.6 0.137 −0.078 0.150 0.125 0.22 0.108 0.191 0.029 0.063Primary metals 6.2 −0.120 0.040 0.005 0.092 0.33 0.327 0.028 0.048 −0.004Fabricated metals 10.9 −0.034 0.215 −0.041 0.134 0.26 0.057 0.026 −0.063 0.012Nonelectrical machinery 8.9 0.162 0.186 0.044 0.083 0.42 0.255 0.143 0.091 −0.032Electrical machinery 12.8 0.044 0.082 0.016 0.063 0.46 0.056 0.109 0.040 −0.014Transportation equipment 14.4 −0.051 0.040 0.088 0.115 0.67 −0.010 0.000 0.022 −0.049Miscellaneous manufacturing 7.8 0.025 −0.018 −0.115 0.089 0.72 0.087 0.022 −0.184 −0.050
TABLE 12.2 Descriptive Statistics (all variables except the 1990 levels in log differences)
(Continued )
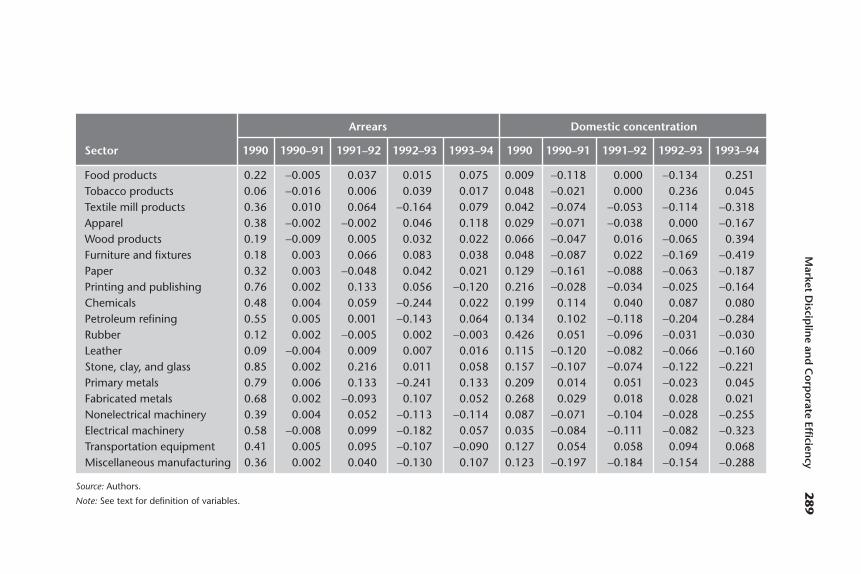
Market D
isciplin
e and
Co
rpo
rate Efficiency
289
Arrears Domestic concentration
Sector 1990 1990–91 1991–92 1992–93 1993–94 1990 1990–91 1991–92 1992–93 1993–94
Food products 0.22 −0.005 0.037 0.015 0.075 0.009 −0.118 0.000 −0.134 0.251Tobacco products 0.06 −0.016 0.006 0.039 0.017 0.048 −0.021 0.000 0.236 0.045Textile mill products 0.36 0.010 0.064 −0.164 0.079 0.042 −0.074 −0.053 −0.114 −0.318Apparel 0.38 −0.002 −0.002 0.046 0.118 0.029 −0.071 −0.038 0.000 −0.167Wood products 0.19 −0.009 0.005 0.032 0.022 0.066 −0.047 0.016 −0.065 0.394Furniture and fixtures 0.18 0.003 0.066 0.083 0.038 0.048 −0.087 0.022 −0.169 −0.419Paper 0.32 0.003 −0.048 0.042 0.021 0.129 −0.161 −0.088 −0.063 −0.187Printing and publishing 0.76 0.002 0.133 0.056 −0.120 0.216 −0.028 −0.034 −0.025 −0.164Chemicals 0.48 0.004 0.059 −0.244 0.022 0.199 0.114 0.040 0.087 0.080Petroleum refining 0.55 0.005 0.001 −0.143 0.064 0.134 0.102 −0.118 −0.204 −0.284Rubber 0.12 0.002 −0.005 0.002 −0.003 0.426 0.051 −0.096 −0.031 −0.030Leather 0.09 −0.004 0.009 0.007 0.016 0.115 −0.120 −0.082 −0.066 −0.160Stone, clay, and glass 0.85 0.002 0.216 0.011 0.058 0.157 −0.107 −0.074 −0.122 −0.221Primary metals 0.79 0.006 0.133 −0.241 0.133 0.209 0.014 0.051 −0.023 0.045Fabricated metals 0.68 0.002 −0.093 0.107 0.052 0.268 0.029 0.018 0.028 0.021Nonelectrical machinery 0.39 0.004 0.052 −0.113 −0.114 0.087 −0.071 −0.104 −0.028 −0.255Electrical machinery 0.58 −0.008 0.099 −0.182 0.057 0.035 −0.084 −0.111 −0.082 −0.323Transportation equipment 0.41 0.005 0.095 −0.107 −0.090 0.127 0.054 0.058 0.094 0.068Miscellaneous manufacturing 0.36 0.002 0.040 −0.130 0.107 0.123 −0.197 −0.184 −0.154 −0.288
Source: Authors.
Note: See text for definition of variables.

290 Global Integration and Technology Transfer
enterprises were subject, as efforts were made by “agents”(managers) and “principals”(members of the various ministries and government bodies that were chosen forthe boards of directors) to retain or obtain control over good assets.
In 1996 a crisis emerged: real GDP fell by more than 4 percent, industrial outputdropped by almost 8 percent, and inflation jumped to nearly 300 percent (table 12.1).This resulted in the fall of the Socialist government and led to subsequent attemptsto sever the link between banks and enterprises. The effects of the 1996 crisis arenot reflected in this study, as the data series ends in the fourth quarter of 1995. Onecan, however, observe a substantial build-up of arrears starting in 1992, whichundoubtedly contributed to the events in 1996.
The Empirical Framework
The literature on TFP measurement relies either on Tornquist approximations ofDivisia indexes or on production (or cost) function estimates. The latter approachis particularly useful when the underlying assumptions of the former (constantreturns to scale, perfect competition, and profit maximization) are too demanding.Since we use data for the initial postreform period in Bulgaria, there are many reasonsto suspect that Divisia indexes may be inappropriate for measuring productivitychanges. Production function estimations are therefore used instead.
Following the derivation in Basu and Fernald (2002), assume each firm i insector s has a production function for gross output:
Yi = Fi (Ki, Li, Mi, Is, Cs, Ai, Ti), (12.1)
where Y is gross output; K, L, and M are firm-specific inputs of capital, labor,and mate-rials; and T indexes technology. As the primary focus of this chapter is to test theassociation between productivity growth at the enterprise level and changes in importcompetition (Is), while controlling for changes in domestic market competition (Cs)and financial discipline (Ai), we augment the production function by including thesevariables as additional factors of production, with I and C being sector specific and Afirm specific. We assume these variables have an impact on the productivity perform-ance of firms by affecting the incentives for managers to address X-inefficiency.
The construction of each variable is described in the next section. The firm’sproduction function F is homogeneous of degree g (g ≠ 1) in K, L, M, I, C, and A.Firms are assumed to be price takers on factor markets but may have market powerin output markets. The former assumption is reasonable, since wages were setcentrally in the state sector during the sample period and most materials werebought abroad at world market prices. The value of the marginal product is thenproportional to the price of the input, PJi:
(12.2)P F Pi Ji
i Ji= µ ,

Market Discipline and Corporate Efficiency 291
where is the marginal product of input J for firm i. Firms may charge a markup mi
over marginal cost, mi = Pi/MCi, where MCi is marginal cost. Equations (12.1) and(12.2) imply that
(12.3)
where dyi is output growth, changes in inputs in the first term are weighted by revenueshares (sJi is the input j’s share in nominal gross expenditure), and equalsthe technology change or TFP growth. Equation (12.3) implies that mark-ups foreach enterprise may differ. Given the short time-series of the data available to us,we assume that mark-ups across all firms within a sector are the same. We do allowmark-ups to vary over the sample years, however, consistent with the methodologyin Levinsohn (1993) and Harrison (1994).
We rewrite equation (12.3) as:
(12.4)
where ∆yi,t = lnYi,t − lnYi,t−1 and similarly for li,t, mi,t, ki,t, is, t−1, cs, t−1, and ai,t−1 (alllower-case symbols represent logs). All βt’s are estimated over each industry(sector) s for each period, that is, a separate production function is fitted to eachsector, using data for all enterprises in the sector. The heterogeneity of enterpriseperformance is captured in a firm-specific term (ai).
Data for output, inputs, and arrears are at the level of the firm. The two sector-specific explanatory variables (import competition and concentration) are affectedby government policies and are exogenous for individual firms.2 Is depends ondemand factors and trade policies; Cs is driven by entry and exit decisions of otherfirms as well as by actions taken by the authorities to break up monopolies andcorporatize state-owned firms.3 Ai is largely a function of the willingness of creditorsto tolerate a buildup of debt, but it can be affected by the political influence of thefirm. Both the sector-specific explanatory variables and the firm-specific variable(arrears) are lagged one year to reduce possible endogeneity.
In addition,the effects of other changes in the economic environment have to be con-trolled for. We do not have good proxies for these changes, nor can we account individ-ually for each of them. Instead, we include annual dummies in the estimating equationthat pick up the net effects of changes in the economic environment at the aggregate level.
Because of the probable correlation between productivity effects and theindependent variables, ordinary least squares (OLS) may give biased and inconsistentestimates. This simultaneity problem is endemic to the empirical literature onproductivity measurement. One solution would be to use firm-specific instrumentsthat cause changes in input demands but are uncorrelated with the productivity shock.
∆ ∆ ∆ ∆ ∆y l m k Ii t i Lst i t Mst i t Kst i t, , , ,= + + + +α β β β γ 1 ss t
s t i t jC A
,
, ,
−
− −+ + +1
2 1 3 1 4γ γ γ∆ ∆ YYearj i t∑ + ε , ,
( )F T F dtTi
ii
i/
dy s dl s dk s dm di dci i Li i Ki i Mi i s s= + + + + +µ γ γ γ[ ] 1 2 3ddaF T
Fdti
Ti
ii i+ ,
FJi

As Levinsohn (1993) and Feenstra (1996) note, however, suitable instruments arenot readily available. A second approach, developed in Olley and Pakes (1996), usessemi-parametric estimation techniques to address the same issue. Their techniquerequires profit maximization and is therefore unlikely to be appropriate for Bulgariandata in the initial transition period. We address the issue by using F-tests to revealwhether OLS is appropriate and relying on the Hausman specification test tochoose between random or fixed effects frameworks in cases where OLS shouldnot be used. As discussed below, these tests suggest that a random effects modelis most appropriate.4
As mentioned previously, our premise is that import competition should pri-marily affect firms that produce for the local market. In the empirical analysis, thesample of firms therefore is split into exporters and nonexporters. The basic ideaunderlying this is simple. If a firm sells its production abroad, its productivitygrowth should not be affected by changes in domestic market concentration andimport penetration. In contrast, the association between import competition andsubsequent productivity growth should be strong for firms that sell mostly domes-tically. Thus we expect to find a positive association between increases in importcompetition and subsequent improvements in productivity (γ1 > 0). Conversely,we expect an inverse relationship between domestic concentration (defined toexclude import competition) and increases in enterprise arrears (our proxy for laxfinancial discipline) and productivity growth (γ2, γ3 < 0). We do not have theoreti-cal predictions on the signs of the estimated coefficients on the annual dummy vari-ables, as those pick up the net effect of a multitude of other policies that affect theincentives created for enterprise performance.
The Data
The data used are from the Bulgarian industry census and are reported on a quar-terly basis to the National Statistical Office (NSO). The data set covers 1,337medium-size and large manufacturing firms from the fourth quarter of 1991through the fourth quarter of 1995 and includes detailed information on firmrevenues, expenditures, profits, employment, export share in revenues, capitalstock, and inventories. All firms are identified by their name and a six-digit sectorcode, following the 1987 Bulgarian Industrial Classification. We use sector-specificprice information (as reported on a quarterly basis by the NSO) on inputs andoutput to convert the material input expenditures, sales revenues, and inventoriesof each firm into quantities. Fourth quarter 1995 relative prices are used as a baseto avoid possible distortions arising from the adjustment in relative prices thatoccurred in the sample period. We use quarterly price deflators to minimize the dis-tortionary effects of inflation on our derived measure of output. Once quarterly
292 Global Integration and Technology Transfer

values of production and costs are deflated, the four quarterly observations areadded together to construct annual measures of inputs and output. This is important,as each sector may have a different product cycle during the year.5
The firm-level data include information on the share of exports in total revenues.We define as exporters all firms that sold more than three-quarters of their pro-duction abroad during the first year of the sample 1991. (An alternative definition,whereby exporters are defined as firms that sell more than half of their productionabroad, is also used below to assess the sensitivity of results to the definition ofexporter status). We choose this definition instead of using the share of outputexported during the sample period to deal with the problem that export status in agiven year is endogenous to policy. Previous studies have shown that of the firmsthat are able to make the transition to becoming an exporter after a trade reform,many experienced an above-average contraction of their domestic market (Robertsand Tybout 1997). By defining exporters as enterprises that were exporting at thebeginning of the sample period, we remove this endogeneity problem.
In the sample period, Bulgaria did not use generally accepted accounting practices.Instead, the old Soviet-style accounting system was used. The main difference was thefocus on production rather than sales as the measure of performance, which impliedthat production for inventory (unsold production) was counted as sales. In many casesthis was a considerable portion of overall firm output, as managers stored finishedgoods to use them as a bargaining chip with suppliers or customers at a later stage.Another item added to sales revenue was the direct subsidies received from the gov-ernment. Shaffer (1998) argues that this accounting practice is defensible in the con-text of transition economies, where output prices may be held at artificially low levels.In such cases, the subsidy acts as a compensatory transfer from the budget. Since pricefixing was abolished in Bulgarian manufacturing sectors in 1991, this reasoning is notapplicable to our data. To adjust for these accounting peculiarities, firms’ revenueswere recalculated by subtracting inventory increases and subsidies from the sales.6
Another problem with the accounting data is the treatment of depreciation costs.The 1988 Law on Amortization stipulated depreciation schedules for machinery,buildings, and transport vehicles comparable to those of Western European coun-tries. In reality, a large portion of firms’ capital stock was old and should have beenfully depreciated. Managers, however, were allowed to charge any depreciation ratein such cases. Most often the practice was to charge the rate of the last year from theschedule, but this was by no means universally applied. The prospect of privatizationof some firms further obscured true depreciation costs. Managers of such enterprises,if and when they entertained the possibility of buying into the company or assistingother buyers in return for compensation or job security, had an incentive to under-report capital or to depreciate it faster, so as to influence downward the price atwhich they might subsequently be able to purchase the firm. Given that the data on
Market Discipline and Corporate Efficiency 293

capital stocks and depreciation are unlikely to provide a good measure of the flowof capital services, energy consumption is used as a proxy for capital utilization. Thiscorrection is attractive in the transition context, because it is a flow measure thatdoes not depend on accounting measures of fixed assets (Burnside, Eichenbaum,and Rebelo 1995), but it has the drawback that the substitution of additional capitalfor reduced energy consumption is obscured.
As discussed earlier, a large-scale informal economy emerged in Bulgaria duringthe sample period. One effect of the opportunities for shifting profits from publicenterprises to the private sector is that reported profits of state-owned enterprisesare likely to be biased downward (for example, because of acceptance of buildup ofarrears), while costs are likely to be biased upward (due to, for example, transferpricing). To the extent that reported costs exceed real costs, and derived profits fallshort of real profits, the estimated coefficients would be biased downward ifestimated in levels. However, since the incentive structure for managers did notchange significantly during 1991–96, except as a result of common economywidedevelopments (which are controlled for), this problem should not affect changes invariables. This is the main reason for our choice of empirical tests—all regressionsare run in (log)-differences rather than levels of both the left- and right-hand sidevariables. This should alleviate the biases in the reported data.
The measure of (the changes in) domestic market structure (CS) is derived fromregistry data on all manufacturing enterprises in Bulgaria during the 1991–95 period.These data were also obtained from the NSO and cover 13,568 entities. This is anunbalanced panel, that is, the data record entry and exit of firms and cover enterprisesboth in and outside our sample. They thus fully account for the changes in domesticmarket competition arising either from the decline in incumbent firms’ production,the entry of new firms, or the rationalization (breakup) of conglomerates.7 We usethe standard Herfindahl index (the sum of squared market shares of all firms in agiven industry) as a measure of concentration.
Arrears,Ai,our proxy for the laxness of financial discipline at the firm level,are definedas the ratio of overdue payments to total debt in a given year. This definition implicitlycorrects for firm size, as both the numerator and denominator vary with size. Data onarrears are not consistent with international accounting standards: overdue payments for30 days or more are counted as arrears. This is a relatively short period when comparedwith the practice in the United States (120 days) or the European Union (90 days). Thiscreates further problems once penalties are incurred, since they are treated as increases inthe amount of outstanding arrears.As mentioned previously,there was also a partial write-off of bank debts in 1993 (an earlier write-off in 1991 is not captured in the data).Although the write-off affected only highly indebted firms, the extent to which it sent asignal to all firms and affected subsequent debt increases is not easily measured. In sum,the arrears data may be a volatile proxy for the hardness of budget constraints across firms.
294 Global Integration and Technology Transfer

Import penetration, (Is), is used as a proxy for increased competitive pressuresfrom abroad. The Is variable is constructed using Bulgarian customs data. Thesedata have the advantage of being in a format that can be easily mapped into thetwo-digit industry codes that correspond to the enterprise data.8 While importpenetration is often used in the literature as a proxy for trade liberalization, directmeasures of changes in trade barriers are preferable. This is a tall order to fill in theBulgarian context: prior to 1990 traditional trade policies were not relevant, as alltrade was handled through state-run foreign trade organizations. Following thepolitical changes in 1990 and the abolition of central planning, direct trade becamepossible. The extent of the trade liberalization that occurred was very significant;almost analogous to a move from autarky to free trade. This implies that the standardapproach used in the literature to explore the effect of marginal changes (for example,a move from an average tariff of 40 percent to 25 percent) would not be appropriateto Bulgaria in any case. The use of import penetration implicitly accounts for theeffect of the collapse of the CMEA, the disbanding of foreign trade organizations(state trading monopolies), and so forth.
Subsequent to the opening of the economy in 1990, traditional trade policyinstruments such as the tariff became more relevant in Bulgaria, as such instrumentswere the only avenue available for firms seeking to reduce competition from imports.Although the initial trade policy environment was quite liberal—average tariffsbeing low, never having been relevant in the past—the structure of initial levels oftariffs and other charges on imports may nonetheless embody information regardingthe “sensitivity”or ability of industries to seek or obtain protection. Initial tariff levels(reported in the first column of table 12.2) are used to investigate to what extentthey are correlated with firm performance.
All variables were first constructed in levels and then converted into log-differences.The resulting variables are reported in table 12.2. Simple correlation analysis showsthat for both the full sample and for nonexporters, there is no significant collinear-ity among changes in Cs, Ai, and Is (table 12.3). There is a negative correlationbetween change in arrears and the level of the initial tariff and TFP growth and apositive correlation between Is and TFP growth.
Results
Standard test statistics suggest that either fixed or random effects approaches shouldbe used to estimate equation (12.5). An F-test indicates that ordinary least squares isinappropriate: the null hypothesis of identical firm effects is rejected: F(1336, 3950)= 0.83 with a critical value of 1.001 (table 12.4).9 We rely on the Hausman test todetermine whether a fixed or random effects specification is most appropriate. In allbut one of the regressions the Hausman test indicates that random effects should be used.
Market Discipline and Corporate Efficiency 295
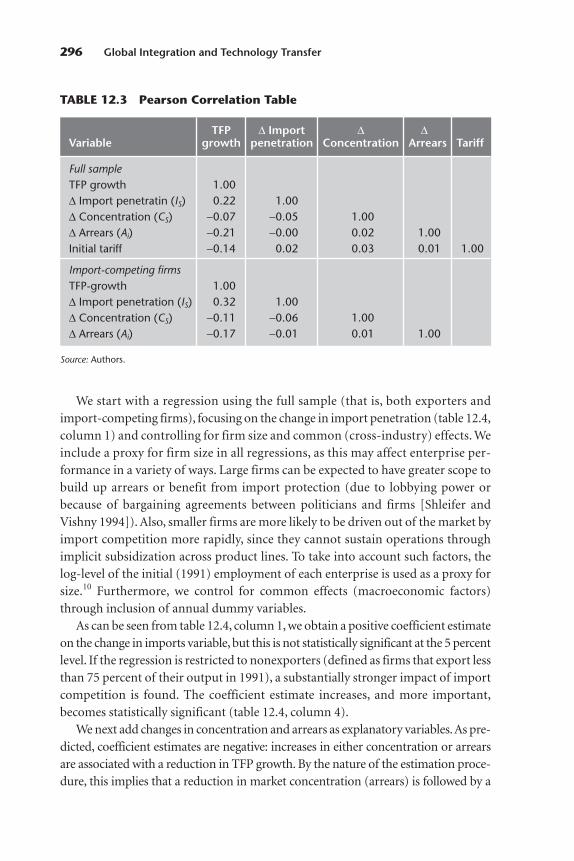
We start with a regression using the full sample (that is, both exporters andimport-competing firms), focusing on the change in import penetration (table 12.4,column 1) and controlling for firm size and common (cross-industry) effects. Weinclude a proxy for firm size in all regressions, as this may affect enterprise per-formance in a variety of ways. Large firms can be expected to have greater scope tobuild up arrears or benefit from import protection (due to lobbying power orbecause of bargaining agreements between politicians and firms [Shleifer andVishny 1994]). Also, smaller firms are more likely to be driven out of the market byimport competition more rapidly, since they cannot sustain operations throughimplicit subsidization across product lines. To take into account such factors, thelog-level of the initial (1991) employment of each enterprise is used as a proxy forsize.10 Furthermore, we control for common effects (macroeconomic factors)through inclusion of annual dummy variables.
As can be seen from table 12.4, column 1, we obtain a positive coefficient estimateon the change in imports variable, but this is not statistically significant at the 5 percentlevel. If the regression is restricted to nonexporters (defined as firms that export lessthan 75 percent of their output in 1991), a substantially stronger impact of importcompetition is found. The coefficient estimate increases, and more important,becomes statistically significant (table 12.4, column 4).
We next add changes in concentration and arrears as explanatory variables.As pre-dicted, coefficient estimates are negative: increases in either concentration or arrearsare associated with a reduction in TFP growth. By the nature of the estimation proce-dure, this implies that a reduction in market concentration (arrears) is followed by a
296 Global Integration and Technology Transfer
TFP ∆ Import ∆ ∆Variable growth penetration Concentration Arrears Tariff
Full sampleTFP growth 1.00∆ Import penetratin (IS) 0.22 1.00∆ Concentration (CS) −0.07 −0.05 1.00∆ Arrears (Ai) −0.21 −0.00 0.02 1.00Initial tariff −0.14 0.02 0.03 0.01 1.00
Import-competing firmsTFP-growth 1.00∆ Import penetration (IS) 0.32 1.00∆ Concentration (CS) −0.11 −0.06 1.00∆ Arrears (Ai) −0.17 −0.01 0.01 1.00
TABLE 12.3 Pearson Correlation Table
Source: Authors.

Market Discipline and Corporate Efficiency 297
Import-competingFull sample firms only1
I II III I II IIIIndependent Random Random Fixed Random Random Randomvariable effects effects effects effects effects effects
∆ Import penetration 0.12 0.09 0.08 0.15 0.11 0.10
(1.84) (1.63) (0.72) (2.44) (2.61) (2.10)
∆ Concentration −0.12 −0.16 −0.14 −0.18
(−2.43) (−2.51) (−3.12) (−3.22)
∆ Arrears −0.03 −0.02 −0.03 −0.03
(−2.05) (−1.91) (−2.19) (−2.07)
∆ Imports × ∆ −0.45 −0.48
concentration (−1.75) (−1.12)
Size 0.01 0.00 0.00 0.01 0.00 0.00
(1991 employment) (2.14) (1.73) (1.70) (1.79) (1.53) (1.42)
Year 1992 dummy 0.03 0.03 0.03 0.03 0.03 0.03
(2.14) (2.21) (2.16) (2.32) (2.09) (2.04)
Year 1994 dummy −0.02 −0.02 −0.03 −0.02 −0.03 −0.02
(−2.62) (−2.58) (−2.71) (−2.41) (−2.19) (−2.16)
Year 1995 dummy −0.09 −0.10 −0.12 −0.11 −0.14 −0.14
(−5.13) (−5.62) (−5.69) (−5.42) (−6.26) (−6.31)
Industry-specificfactor costs(bLs,t, bMs,t, bKs,t) Yes Yes Yes Yes Yes Yes
Sample size 5,348 5,348 5,348 4,312 4,312 4,312
Adjusted R2 0.28 0.29 0.28 0.30 0.30 0.30
F-test (A,B = Ai,B) 0.83 0.84 0.84 0.87 0.88 0.88
Hausman test 48.13 52.36 79.64 47.68 49.62 51.02(random versus fixed) effects; critical value in parentheses) (60.19) (62.54) (63.72) (60.19) (62.54) (63.72)
TABLE 12.4 Estimation Results (random effects model,except where noted)
Source: Authors.Note: t-statistics are in parentheses; estimates are heteroskedasticity consistent(using the White correction).
1. Firms that exported less than 75 percent of their production in 1991.

rise in TFP, even when one accounts for the effects on import competition and arrears(concentration). Inclusion of these two domestic competition variables reduces theeffect of imports, which become even less statistically significant. When the sample islimited to import-competing firms, import competition remains statistically signifi-cant, suggesting there are significant differences across the two types of firms.
Finally, we include imports interacted with concentration as a regressor. In gen-eral, inclusion of such interaction terms is a helpful robustness test and may also helpto remove the heteroskedasticity of the error term.11 Interacting imports and con-centration also has an economic rationale, as it allows us to account for the possibil-ity that imports may have different effects in competitive as opposed to imperfectlycompetitive market structures. In the case of Bulgaria, initial levels of concentrationwere very high and import penetration very low. Imports can be expected to expandmore rapidly in products where markets are more competitive. In industries wherethere are economies of scale and firms retain an ability to set prices (capture rents),imports may expand less rapidly. If the interaction term is included in the full sam-ple, the Hausman test indicates that random effects are inappropriate. Fixed effectswere therefore used. Inclusion of the interaction term does not affect the results:imports remain insignificant, and the coefficient estimates for concentration andarrears are not affected.12 The interaction effect is not statistically significant.
If the sample is restricted to import-competing enterprises, the inclusion of theinteraction term does not have the effect of making changes in import penetrationinsignificant. Instead, the coefficient estimate for imports remains positive andsignificant at the 95 percent level.13 These results illustrate the importance ofdistinguishing between import-competing and exporting firms. Only in the case ofnonexporters is there a robust relationship between changes in import penetrationand firm performance (as measured by the change in TFP).14 The results also illustratethe importance of including additional measures of competitive pressures thatreflect other (nontrade) policies implemented by the government. The estimatedeffect of changes in concentration and arrears on TFP performance is negative andsignificant whether exporters are included in the sample or not.
Work by Roberts and Tybout (1997); Clerides, Lach, and Tybout (1998); andTybout and Westbrook (1995) has centered on the issue of whether export activityresults in higher productivity growth. If the lagged log level of the export share in totalsales is included as a regressor, we find that being an exporter is associated with higherTFP growth. Coefficient estimates of this variable are positive and statistically sig-nificant for all three specifications, the t-statistic being consistently about 3. Unfor-tunately, the data do not allow us to undertake an analysis of the type done by Tyboutand his coauthors, which centers on testing the learning-by-exporting hypothesis.This requires information on when a firm enters a new export market, which is notavailable in our sample.
298 Global Integration and Technology Transfer

Market Discipline and Corporate Efficiency 299
In all the regressions, the year dummies become increasingly negative in magnitudeand increase in statistical significance.While this pattern in the year dummies may bedue to a variety of common macro or “environmental” factors, a likely explanation isthat it reflects the changing incentive structure confronting managers of enterprises.At the start of the period, the government was pursuing a large number of reforms,including not only price liberalization and abolition of foreign trade monopolies butalso corporatization and rationalization of state-owned firms as a precursor todivestiture (privatization). This created incentives for managers of firms to undertakereforms in the expectation that this would enhance their ability to benefit from (orsurvive) the privatization process. In the event, the government never proceededbeyond rationalization of industries; privatization never got off the ground. Consistentwith the models of Schleifer and Vishny (1994), this provided incentives for managersto divert resources and engage in asset stripping. The increasing magnitude of thecoefficient estimate over time may reflect the fact that it took time for managers tolearn how to manipulate the system in order to shift resources out of the firm,complemented by the gradual deterioration of the quality of the monitoring ofmanagement performance by the various government ministries. The contributionsin Bogetic and Hillman (1995) describe in some detail the extent to which enterprisesengaged in asset stripping and pursued “de facto”privatization of resources in Bulgaria.The end result was the financial crisis that occurred in 1996.
A weakness of the empirical approach pursued in this chapter is that the majorexplanatory variables are all endogenous. Although the preferable approach ofusing direct measures of the underlying (exogenous) policy determinants of thesechanges is impossible to employ in the Bulgarian context (and for that matter, forany transition economy that pursues a “big bang” liberalization approach), we arerelatively comfortable with the use of the concentration and arrears variables. Thechange in concentration was to a very large extent driven by the policy of corpora-tization and breaking up conglomerates created under the central planningmodel.15 The level and change in arrears is a direct measure of the ability of firmsto obtain soft financing from the banking sector. Import penetration is a directmeasure of the effect of a variety of policies to open up the economy to external trade.
Information is available on the initial trade policy stance and changes in thisstance over time.To assess the robustness of the import competition–based estimationsdiscussed above, we therefore rerun the regressions using the initial (1991) level oftariffs and surcharges. The trade policy variable is insignificant in the full sample(table 12.5). If the regression is restricted to nonexporters, the trade policy variableis negative, as predicted, but only marginally significant. In contrast to the earlierresults, concentration and arrears become statistically insignificant once we includethe interaction term between tariffs and concentration. The results suggest thatthose firms that initially had above-average rates of protection performed worse

300 Global Integration and Technology Transfer
Import-competingFull sample firms only1
Independent variable I II III I II III
1990 level of tariffs/ −0.02 −0.01 −0.01 −0.03 −0.02 −0.02surcharges (−1.63) (−1.37) (−1.03) (−2.07) (−1.76) (−1.81)
∆ Concentration −0.11 −0.10 −0.12 −0.08(−2.68) (−1.32) (−2.94) (−1.28)
∆ Arrears −0.02 −0.02 −0.02 −0.03(−1.98) (−1.62) (−2.12) (−1.57)
1990 tariff level × 0.07 0.06∆ concentration (1.21) (1.13)
Size (1991 employment) 0.01 0.00 0.00 0.01 0.00 0.00(2.04) (1.79) (1.78) (1.92) (1.81) (1.80)
Year 1992 dummy 0.03 0.03 0.03 0.03 0.03 0.03(2.29) (2.32) (2.26) (2.42) (2.18) (2.05)
Year 1994 dummy −0.02 −0.02 −0.02 −0.02 −0.02 −0.02(−2.89) (−2.76) (−2.68) (−2.72) (−2.29) (−2.50)
Year 1995 dummy −0.10 −0.11 −0.10 −0.10 −0.11 −0.10(−6.13) (−6.28) (−6.34) (−6.20) (−6.02) (−5.98)
Industry-specificfactor costs (bLs,t,bMs,t, bKs,t) Yes Yes Yes Yes Yes Yes
Sample size 5348 5348 5348 4312 4312 4312
Adjusted R2 0.26 0.27 0.27 0.31 0.31 0.32
F-test (A, B = Ai, B) 0.81 0.82 0.81 0.84 0.84 0.84Hausman test (random 50.61 57.42 47.95 58.32 55.16 59.61
versus fixed effects;critical value inparentheses) (60.19) (62.54) (63.72) (60.19) (62.54) (63.72)
TABLE 12.5 Estimation Results: Random-Effects Model
Source: Authors.
Note: t-statistics are in parentheses; estimates are heteroskedasticity consistent (using the Whitecorrection).
1. Firms that exported less than 75 percent of their production in 1991.

Market Discipline and Corporate Efficiency 301
after the opening of the economy in 1990–91. These findings are consistent withthe earlier ones using changes in import penetration as a regressor.
During 1991–95 little change occurred in the level of tariffs. Import surchargesranging from 3 to 40 percent ad valorem and averaging 15 percent were imposedin August 1994 on some final consumer goods, but these covered only 48 narrowlydefined (at the five-digit level) product lines, mainly dairy products and chocolatefoods. After 1995 significant surcharges were implemented for a wider range ofimports, in part to deal with a balance of payments crisis, but this period is out ofsample. It is therefore not very informative to use changes in tariffs or surcharges as anexplanatory variable during the 1991–95 period. Regressing TFP growth on changesin tariffs and surcharges results in insignificant coefficient estimates (not reported).
The analysis in this chapter is limited to a balanced panel of firms. In principle,this can lead to selection bias. However, in the case of Bulgaria, and transitioneconomies more generally, it is not clear in what direction the bias goes. In contrastto a market economy, where entry and exit involves the creation and destruction ofdistinct (and usually independent) entities, in the case of Bulgaria during theperiod under consideration, entry and exit of this type was quite rare. Instead, thegovernment pursued a policy of corporatization and restructuring of state-ownedenterprises that involved breaking up existing conglomerates. It is this process thatprimarily drives the changes in market structure we observe in the data. The problemis that politics plays a large role in determining whether in this process an enterprise thatis subjected to rationalization ends up with a better or worse “endowment.”We haveno information on the extent to which firms in the sample were subject to downsizing,nor do we have specific information regarding the “quality” of the assets lost orobtained in this process. What we can say with greater confidence is that there is nodifference between exporters and nonexporters in this regard. As one of our mainmotivations is to investigate the importance of making such a distinction, we wouldargue that sample selection bias is not a serious issue.16
Conclusions
Relatively few empirical studies have found robust support for the predicted pos-itive relationship between liberalization of trade and the subsequent performanceof domestic industry. In this chapter we argue that this may reflect the fact thatno distinction is made between exporters and nonexporters and that account isnot taken of the combined effect of other sources of—and changes in—marketdisciplines. In principle, one expects trade liberalization to have a greater impacton nonexporting, import-competing enterprises than on those that export a sig-nificant share of their production. One also expects a greater impact of trade lib-eralization in environments characterized by hard budget constraints, active

enforcement of competition policy, and governance structures that create incen-tives for managers to maximize operating efficiency. In the context of developingcountries in particular, governments may pursue only piecemeal reform, with theeffect of attenuating the impact of trade liberalization. Trade liberalization alonemay not have a significant effect on corporate performance in the absence ofcomplementary policy measures to promote greater competition and induce thenecessary reallocation of resources within and across firms. Alternatively, gov-ernments may implement policy actions in multiple areas that all have the effectof increasing market disciplines. Account of such changes, or the absence thereof,should be taken in empirical assessments of the effects of trade liberalization.
Using data for Bulgaria during 1991–95, we find empirical support for the premisethat changes in market discipline that emerged during the early 1990s—through tradeliberalization, demonopolization and restructuring efforts, and hard budgetconstraints are associated with subsequent productivity growth in the enterprise sector.For the full sample of firms, we find that changes in import penetration do not have astatistically significant effect on firm productivity. It is only when we distinguishbetween firms on the basis of initial export intensity status and remove those firms thatexported 75 percent or more of their output in 1991 that import competition becomesa significant explanatory variable. Arrears and concentration are not sensitive to thisdistinction. These variables are equally important for both types of firms.
Notes
1. Export taxes of 20 percent were applied on a small number of foodstuffs and materials used bythe construction industry in 1993–94. These were phased out by the end of 1995.
2. Imports, concentration, and arrears are all endogenous. Although using lagged values should helpreduce problems of contemporaneous correlation, relying on such endogenous variables as regressorsdoes not provide information on, or tests of, the true underlying determinants of changes of productivity.As discussed below, however, this is the best that can be done given data constraints.
3. See Djankov and Hoekman (2000) for an analysis of the activities of the Bulgarian antitrust office.4. This is consistent with our intuition, as fixed-effects estimation assumes firm productivity growth
to be constant over time. This assumption is objectionable, since changes in productivity due toincreased competition is the phenomenon we seek to explore. The random-effects model avoids theimposition of constant productivity growth over time, but it has the drawback that productivity shocksat the firm level are assumed to be uncorrelated over time. This may not be a reasonable restriction ifthere is convergence or divergence in corporate performance.
5. It would, of course, be preferable to use firm-specific price indices as deflators, but these were notpart of the standard questionnaire sent to firms by the NSO. The use of sectoral price deflators obscuresthe variation of firm performance within a sector. This would be a serious problem if we were studying theconvergence or divergence in productivity within sectors. It is less objectionable here, as the primary focusis on the performance of firms across sectors. The results should nonetheless be treated with caution.
6. At the suggestion of a referee, we also ran all the regressions reported below without subtractingsubsidies from enterprise revenues. The results are not sensitive to whether or not subsidies are included.This is a reflection of the limited use that was made of direct subsidies.
7. See Djankov and Hoekman (1998) for a discussion and descriptive statistics on breakups andclosure of plants.
302 Global Integration and Technology Transfer

8. Partner country export data were used to check the accuracy of these data. The two data sets werevery similar.
9. In any event, it is also problematic on a priori grounds to assume homogeneity of firm characteristics.10. We cannot use revenues (since that would create simultaneity problems in the regression) or
fixed assets (since the data, as discussed earlier, are suspect).11. As we employ the White correction in the estimation, any improvement in this regard is likely
to be marginal.12.This result may in part reflect the change from random- to fixed-effects estimation.Imports are already
insignificant in a fixed-effects-based estimation once concentration and arrears are included in the regression.13. These results are not very sensitive to the definition of what is an exporter. If we run the regres-
sions using a criterion of exporting at least 50 percent of production to define exporters, the results are verysimilar. In the case in which the sample is restricted to nonexporters, the coefficient estimate on changein import penetration (controlling for arrears, concentration, and the interaction effect) is 0.11 (t = 2.12).
14. Very similar results are found if instead of breaking the sample into two groups, the regressionis run on the full sample (including changes in import penetration, arrears, concentration, and theimports’concentration interaction term on the right-hand side) but we control for exporters byinteracting export status (using a dummy variable equal to 1 if 75 percent of output is exported during1991) with the change in imports.
15. Imports can, of course, also be expected to play a role, but this does not appear to be the case inBulgaria. The correlation between changes in concentration and changes in imports is effectively zero(see table 12.3).
16. Djankov and Hoekman (1998) analyze the extent to which the results of the panel regressionschange if the sample includes spinoffs and plant closures. If such an unbalanced panel of Bulgarian firmsis used, the magnitude of productivity improvement (as measured by a decline in price-cost margins,not TFP growth) is somewhat greater than for the balanced panel. This also suggests that possibleselection bias is not a major source for concern, insofar as the bias works against the firms in the bal-anced sample.
References
Basu, Susanto, and John Fernald. 2002. “Aggregate Productivity and the Productivity of Aggregates.”European Economic Review 46: 963–91.
Bogetic, Zelko, and Arye Hillman, eds. 1995. Financing the Government in Transition: Bulgaria. Washington,DC: World Bank.
Bulgarian Privatization Agency. 1997. Annual Report 1996. Sofia: Bulgarian Privatization Agency.Burnside, Craig, Michael Eichenbaum, and Sergio Rebelo. 1995. “Capital Utilization and Returns to
Scale.” In NBER Macroeconomics Annual, ed. Ben Bernanke and Julio Rothemberg. Cambridge, MA:National Bureau of Economic Research.
Claessens, Stijn, and R. Kyle Peters. 1997. “Enterprise Performance and Soft Budget Constraints: TheCase of Bulgaria.” Economics of Transition 5: 305–22.
Clerides, Sofronis, Saul Lach, and James Tybout. 1998. “Is Learning by Exporting Important? Micro-Dynamic Evidence from Colombia,Mexico,and Morocco.”Quarterly Journal of Economics 113: 903–47.
Dickens,William, and Lawrence Katz. 1987.“Inter-Industry Wage Differences and Industry Characteristics.”In Unemployment and the Structure of Labor Markets, ed. Kevin Lang and Jonathan Leonard. NewYork: Blackwell.
Djankov, Simeon, and Bernard Hoekman. 1998. “Trade Reorientation and Post-Reform ProductivityGrowth in Bulgarian Enterprises.” Journal of Policy Reform 2: 151–68.
———.2000.“Competition Policy in Post-Central Planning Bulgaria.”Antitrust Bulletin 65 (Spring): 227–48.Earle, John, and Saul Estrin. 2001.“Privatization and the Structure of Enterprise Ownership.” In Russia’s
Post-Communist Economy, ed. B. Granville and P. Oppenheimer. Oxford: Oxford University Press.EBRD (European Bank for Reconstruction and Development). 1997. Transition Report. London: EBRD.
Market Discipline and Corporate Efficiency 303

Falk, M., M. Raiser, and H. Brauer. 1995. “Output Decline and Recovery in Poland.” Kiel Institute forWorld Economics Working Paper 723, University of Kiel, Germany.
Feenstra, Robert. 1996.“Estimating the Effects of Trade Policy.” In Handbook of International Economics,Vol. III, ed. Gene Grossman and Ken Rogoff. Amsterdam: North Holland.
Grether, Jean-Marie. 1996. “Mexico 1985–1990: Trade Liberalization, Market Structure, and Manufactur-ing Performance.” In Industrial Evolution in Developing Countries, ed. M. Roberts and J. Tybout.Oxford: Oxford University Press.
Haddad, Mona, Jaime de Melo, and Brendan Horton. 1996.“Morocco 1984–1989: Trade Liberalization,Exports, and Industrial Performance.”In Industrial Evolution in Developing Countries, ed. M. Robertsand J. Tybout. Oxford: Oxford University Press.
Harrison, Ann. 1994.“Productivity, Imperfect Competition and Trade Reform.” Journal of InternationalEconomics 36: 53–73.
Hart, Oliver. 1983.“The Market Mechanism as an Incentive Scheme.”Bell Journal of Economics 14: 366–82.Holstrom, Bengt. 1982. “Moral Hazard in Teams.” Bell Journal of Economics 13: 324–40.Horn, Henrik, Harold Lang, and Stefan Lundgren. 1995. “Managerial Effort Incentives, X-Inefficiency
and International Trade.” European Economic Review 39: 117–38.IMF (International Monetary Fund).1997.Yearbook of Government Finance Statistics.Washington,DC: IMF.King, M., and R. Levine. 1993.“Finance and Growth: Schumpeter Might Be Right.” Quarterly Journal of
Economics 108: 717–37.Levinsohn, James. 1993.“Testing the Imports-as-Market-Discipline Hypothesis.” Journal of International
Economics 35: 1–22.Lizal, L., P. Singer, and J. Svejnar. 1995.“Manager Interests, Breakups and Performance of Enterprises in
Transition.” In The Czech Republic and Economic Transition in Eastern Europe, ed. J. Svejnar. SanDiego, London, and Toronto: Harcourt Brace, Academic Press.
National Statistical Office of Bulgaria. 1997. Statistical Yearbook. Sofia: Government Printing Office.Nalebuff, Barry, and Joseph Stiglitz. 1983. “Prizes and Incentives: Towards a General Theory of
Compensation.” Bell Journal of Economics 14: 21–43.Nickell, Stephen, Sushil Wadhwani, and Martin Wall. 1992. “Productivity Growth in UK Companies
1975–86.” European Economic Review 36: 1066–85.Nickell,Stephen.1996.“Competition and Corporate Governance.”Journal of Political Economy 104: 721–46.Olley,Stephen,and Ariel Pakes.1996.“The Dynamics of Productivity in the Telecommunications Equipment
Industry.” Econometrica 64: 1263–98.Roberts,Mark.1996.“Colombia 1977–1985: Producer Turnover,Margins,and Trade Exposure.”In Industrial
Evolution in Developing Countries, ed. M. Roberts and J. Tybout. Oxford: Oxford University Press.Roberts, Mark, and James Tybout. 1997. “An Empirical Model of Sunk Costs and the Decision to
Export.” American Economic Review 87: 545–64.Schaffer,Mark.1998.“Do Firms in Transition Economies Have Soft Budget Constraints? A Reconsideration
of Concepts and Evidence.” Journal of Comparative Economics 26: 157–79.Schmidt, Klaus. 1994.“Managerial Incentives and Product Market Competition.”Discussion Paper 430,
University of Bonn, Germany.Shleifer, Andrei, and Robert Vishny. 1994. “Politicians and Firms.” Quarterly Journal of Economics
46: 995–1025.Svejnar, Jan. 1995. “Enterprises and Workers in Transition.” American Economic Review 86: 123–27.Tybout, James. 1996.“Chile 1979–1986: Trade Liberalization and Its Aftermath.” In Industrial Evolution
in Developing Countries, ed. M. Roberts and J. Tybout. Oxford: Oxford University Press.Tybout, James, and M. Daniel Westbrook. 1995. “Trade Liberalization and Dimensions of Efficiency
Change in Mexican Manufacturing Industries.” Journal of International Economics 31: 53–78.van Wijnbergen, Sweder, and Anthony Venables. 1993. “Trade Liberalization, Productivity, and
Competition: The Mexican Experience.” Discussion Paper 345, London School of Economics.World Bank. 1991. Bulgaria: Crisis and Transition to a Market Economy. Washington, DC: World Bank.———. 1996. World Development Report 1996: From Plan to Market. Washington, DC: World Bank.
304 Global Integration and Technology Transfer
305
13Chapter 13Innovation in Mexico:
NAFTA Is Not Enough
Daniel Lederman and William F. Maloney
Although Mexicans have traditionally lamented their distance from divine protectionand proximity to the United States, dramatically increased commercial interactionswith arguably the most dynamic generator of new technologies in history couldpotentially yield the country large growth dividends through technological transfer.1
Yet the main message of this chapter is that trade liberalization and the NorthAmerican Free Trade Agreement (NAFTA) are helpful but not enough to helpMexico catch up to the level of technological progress of its North American part-ners, especially the United States. In fact, the evidence reviewed here suggests that,given its level of development, Mexico suffers from low levels of innovation effort,and it severely underperforms relative to successful economies, such as the Republicof Korea and the United States. In addition, its national innovation system (that is,how the private sector, universities, and public policies interact to produce eco-nomically meaningful innovation) is inefficient. Without addressing these defi-ciencies, it is unlikely that NAFTA alone will be sufficient for Mexico to catch upwith the pace of innovation in North America.
The literature suggests that roughly half of cross-country differences in percapita income and growth are driven by differences in total factor productivity(TFP), generally associated with technological progress (see Dollar and Wolf1997; Hall and Jones 1999). Furthermore, much of the widening gap between richand poor countries results not from differences in capital investment but fromdifferences in technological progress. This fact moves to center stage an abidingquestion in economic development: given the great potential gains to be realizedby adopting technologies from the industrial economies, why do developingcountries fail to do so? Perversely, the countries generating new technologies atthe frontier appear to have faster TFP growth in manufacturing and agriculture

than do poor countries that could, in theory, adopt existing technologies inventedin the advanced economies (Martin and Mitra 2001).
Recent work in innovation stresses that adopting existing technology has its cost.Firms and countries need to develop an absorptive or national learning capacity,which is hypothesized to be a function of spending on research and development(R&D).2 Although learning is often considered relevant only for basic science dedi-cated to expanding the knowledge frontier, Cohen and Levinthal (1989), amongothers, stress that learning (that is, knowing where the frontier is and figuring outwhat adaptations are necessary to move toward it) is the “second face” of R&D.
Pavitt (2001) argues that investment in pure research is also important fordeveloping countries. First, countries that are most familiar with the frontiers ofbasic science will best train the applied problem solvers in the private sector. Second,even basic research does not flow easily or without cost across borders, so developingcountries cannot simply rely on what is being generated in the advanced countries.Lederman and Sáenz (2003) present econometric evidence suggesting that innova-tion outcomes (patents per capita) are an important explanation of the levels ofdevelopment observed around the world.
In this chapter we review indicators of Mexico’s technological progress andinnovation efforts since the 1960s and ask what the global and Mexican experi-ences suggest about how greater openness to trade and FDI should affect specificeconomies. We argue that Mexico’s weak national learning and innovative capacityrepresents a critical missing complement to its liberalization efforts. This is aresult partly of weak efforts in education and innovation and partly in how theseefforts are coordinated, through a largely dysfunctional national innovation system.The principal conclusion is that exploiting the opportunities offered by greaterintegration with Canada and the United States requires Mexico to make substantialpolicy improvements in both the level and efficiency of innovation efforts. NAFTAis not enough.
Mexican Innovation and Technological ProgressSince the 1960s
One of the most heavily used indicators of progress in innovation is the level andgrowth rate of TFP. This is generally understood to be the part of the growth ofgross domestic product (GDP) that is not explained by the accumulation of rawlabor, physical capital, and perhaps human capital, ideally after controlling forcapacity utilization. Since the pioneering work of Solow (1956, 1957), this indica-tor has been thought to be a good proxy for technological progress.
Figure 13.1 shows average annual TFP growth rates in Mexico and selectedother countries and regions between 1960 and 1999.3 Mexico’s TFP performance
306 Global Integration and Technology Transfer

was highest in the 1960s, and, as in most of the other economies except those ofBrazil and the East Asia and Pacific region, it declined in the 1970s and declinedwith the rest of Latin America in the 1980s (largely as a result of the debt crisis).4
The slight recovery in the 1990s may have resulted from economic reforms imple-mented in the late 1980s and early 1990s in most Latin American and Caribbeancountries, although recent econometric estimates suggest that, on average, theseeffects were modest in the region.5 Figure 13.1 suggests that Chile, the most advancedreformer, performed far better than either the Latin American or the Asianregional averages for the past two decades. Given the overall similarity in policypackages, there would seem to be nothing in the economic model adopted thatintrinsically dictated lower rates of TFP growth in Mexico.
An explanation for these patterns was put forward by Acemoglu, Aghion, andZilibotti (2002), who argue that there are two stages of technology adoption. Thefirst is based on fomenting the accumulation of technology embodied in capitalformation, even if this requires some static efficiency losses through interventionistpolicies, arguably including the import-substituting industrialization adopted inLatin America. The second stage, centered on innovation, requires greater struc-tural flexibility and fewer distortions. In their view, Brazil, the Republic of Korea,Mexico, Peru, and Taiwan (China) all successfully pursued the first stage, but the
Innovation in Mexico: NAFTA Is Not Enough 307
Source: Loayza, Fajnzylber, and Calderón (2002).
FIGURE 13.1 Growth Rates of Total Factor Productivity in Selected Countries and Regions, 1960–99
−4
−3
−2
−1
0
1
2
3
4
5
Mexico Brazil Chile CostaRica
R.B.deVenezuela
UnitedStates
Canada KoreaRep. of
Norway LatinAmerica
OECD East Asia
perc
enta
ge
1960–69 1970–79 1980–89 1990–94 1995–99

Asian economies were able to make the transition to efficient innovative economieswhereas Latin America was not. The case of Chile, which liberalized about 10 yearsbefore Mexico, supports this diagnosis and offers some reason to suppose thatMexico will experience a similar rebound in TFP in the coming years, all otherthings equal. In light of the successful growth experiences of the relatively openeconomies of Finland, Ireland, Israel, and Spain over a similar period, it is difficultto argue that the extreme “closedness” of the region was necessary or desirable,especially given the difficult political economy problems of moving to a moreinnovative structure later.6
Productivity growth in Norway, another petroleum exporter, was quite strong byinternational standards throughout this period, suggesting that net exporters ofnatural resources do not necessarily have lower potential for productivity growth.On the contrary, Lederman and Maloney (2002) find that countries rich in naturalresources tend to experience faster economic growth, even after controlling for thecontributions of human and physical capital accumulation.
Another commonly used innovation proxy is the number of patents granted(figure 13.2). It is generally believed that patent statistics broadly reflect the flow
308 Global Integration and Technology Transfer
FIGURE 13.2 Patents per Million Workers in Selected Regions,1960–2000
Source: U.S. Patent Office.
0
0.5
1
1.5
2
2.5
num
ber
of p
aten
ts p
er m
illio
n w
orke
rsnu
mbe
r of
pat
ents
per
mill
ion
wor
kers
num
ber
of p
aten
ts p
er m
illio
n w
orke
rsnu
mbe
r of
pat
ents
per
mill
ion
wor
kers
3
3.5
4
1960s 1970s 1980s 1990–94 1995–20000
10
20
30
40
50
60
70
80
1960s 1970s 1980s 1990–94 1995–2000
East Asia Korea, Rep. of
0
50
100
150
200
250
300
350
400
450
1960s 1970s 1980s 1990–94 1995–2000
0
20
40
60
80
100
120
1960s 1970s 1980s 1990–94 1995–2000
Latin America and the Caribbean Mexico
United States Canada High-income countries

of innovations covering either adaptations of existing patents or brand-newinventions (Griliches 1990; Patel and Pavitt 1995). Measures of the number ofpatents granted to researchers from around the globe, however, are not withoutflaws. One important consideration is the fact that the costs of applying forpatents, the level of intellectual property protection, the pecuniary benefits frompatents, and other institutional features vary greatly across countries. Thus patentsgranted in one country are not strictly comparable to those granted by others.We use the number of patents granted to Mexican residents by the United StatesPatent and Trademark Office (USPTO) as a proxy for the flow of innovation.7 Thedata from the USPTO are attractive because of their global and long time cover-age and especially because it is commonly understood that the United States offersperhaps the most advanced levels of intellectual property protection in the world(Maskus 2000). Although the costs of the application process are likely to behigher in the United States than in most other countries, the benefits are alsolikely to be higher.
The evidence suggests that over time, Mexico’s patenting activity follows a pat-tern similar to its TFP growth rate. The number of patents granted to Mexicaninnovators peaked in the 1960s, declined continuously until the first half of the1990s, and picked up again after the implementation of NAFTA in the second halfof the 1990s. This resurgence was quite modest by historical standards, however,and was insufficient to make a significant dent in the observed gap with respect toCanada and the United States. Mexico is far behind East Asia (especially theRepublic of Korea) and lags Costa Rica and República Bolivariana de Venezuela.
This pattern remains even when differences in the level of development areaccounted for. Figure 13.3 benchmarks performance by researchers in Mexico, com-paring their performance with average performance in countries with the same levelsof GDP, the same size labor force, and the same value of merchandise exports to theUnited States since the 1960s.8 It shows how far Mexico is from the average of similareconomies (the zero line); the embedded table reports Mexico’s average absolutelevels by decades. A negative number on the vertical axis is evidence of underper-formance. Mexico’s performance in patents has fallen from more than twice theaverage in the 1960s to substantially below the average in the 1980s, just prior tothe debt crisis and the structural reforms.
Another indicator of innovation is the number of scientific publications,which can be interpreted as a measure of outcome of basic rather than appliedresearch. Mexico shows some upward progress from the 1980s, to roughly half ofits expected value.
In summary, in terms of TFP growth, patenting activity, and scientific publications,Mexico lags behind many countries at its level of development and sorely behindthe newly industrial countries of Asia that were once its comparators.
Innovation in Mexico: NAFTA Is Not Enough 309

How Trade and Foreign Direct Investment AffectInnovation and Technological Progress
What does the international evidence say about how the increased trade and FDIencouraged by NAFTA might affect growth through the transmission or genera-tion of technology? The bulk of the literature suggests modest effects, workingprimarily through physical capital accumulation.9 Using a panel of countries since1960, Loayza, Fajnzylber, and Calderón (2002) find that a 1 percent increase in theportion of the trade-to-GDP ratio that is related to trade policies leads to anincrease in the growth rate of GDP per capita of 0.025–0.010 percentage points ayear.10 Consistent with the findings of Baldwin and Seghezza (1996) and Levineand Renelt (1992), Wacziarg (2001) finds that the most statistically robust channelthrough which trade positively affects economic growth is investment, withdomestic investment growth accounting for more than 60 percent of the positiveeffect of trade on growth.11 He speculates that these results are consistent withtheories that focus on the procompetitive effects of trade, because the survival ofexisting firms and the entry of new ones after trade liberalization probably requirelarge fixed capital costs.
An emerging body of literature also finds an impact of trade and investment vari-ables on TFP growth, although the exact channel remains ambiguous. The overall
310 Global Integration and Technology Transfer
FIGURE 13.3 Number of Scientific Publications and Patents in MexicoRelative to Comparative Countries, 1960–2000
Source: Authors’ calculations.
−100
−50
0
50
100
150
200
1960 1965 1970 1975 1980 1985 1990 1995 2000
devi
atio
n fr
om e
xpec
ted
valu
e (p
erce
nt)
1990s 47 1,5571980s
decadenumber of
patents
number ofscientific
publications
39 8471970s 49 not available1960s 72 not available
number of scientific publicationsnumber of patents

impact of NAFTA on productivity in Mexico was positive: the agreement wasassociated with convergence in rates of TFP growth among the manufacturingsectors in Mexico and the United States. López-Córdova (2002) estimates that thewhole package of NAFTA–related phenomena (lower Mexican tariffs, the prefer-ential tariff margin in the United States, higher import-to-output ratio, and par-ticipation of foreign producers) increased TFP by 10 percent. Schiff and Wang’s(2002) estimate of the same package is 5.6–7.5 percent. These estimates are broadlyconsistent with estimates of a very large impact of the free trade agreement inCanada. Trefler (1998) argues that overall manufacturing TFP rose by 0.2 percent ayear (1.0 percent for the firms most affected by trade), primarily as a result ofplant turnover and rising technical efficiency within plants. Hence it is likely thatthe rates of TFP growth in Canada and Mexico would have been even lower thanthose shown in figure 13.1 if NAFTA and its predecessor, the Canada–U.S. FreeTrade Agreement, had not been implemented.
Imports of capital or intermediate goods, which are thought to embody ortransmit knowledge of new production techniques or skills, appear associatedwith a positive effect on the levels of TFP.12 Coe, Helpman, and Hoffmaister (1997)find that the overall level of imports is important for international technology diffu-sion for 77 developing countries. Looking at industry-level data from eight OECDcountries, Keller (2002) finds that roughly 50 percent of TFP growth in manufac-turing industries results from their own R&D spending, 30 percent results fromother domestic industries, and 20 percent results from R&D expenditures in for-eign industries, some of which is transmitted through trade. He speculates that theimportance of R&D expenditures in foreign industries may be much higher indeveloping countries, where local R&D effort is much lower than in high-incomecountries. For Latin America, Schiff and Wang (2004) find modestly positiveeffects of the technology embodied in intermediate inputs on TFP for certainhigh–R&D industries in Latin America.13 Looking specifically at NAFTA, Schiffand Wang (2002) find that the roughly 14–18 percent increase in total importsfrom NAFTA partners to Mexico led to an increase in TFP levels in manufacturingindustries of 5.1–7.0 percent. The 3 percent diversion of imports from other OECDcountries, whose imports have no impact on TFP, led to another 0.47 percentincrease in TFP.14
The interpretation of these results is not straightforward. Seemingly in contra-diction to the above studies, Eaton and Kortum (1996) find that bilateral importsdo not help predict bilateral patenting activity, their indicator of internationaltechnology diffusion. Based on firm-level data from Mexico, López-Córdova(2002), like Muendler (2002) for Brazil, finds a negative impact of imported inputson manufacturing TFP.15 Schiff and Wang (2002) express doubt about the mean-ing of their own estimates in the Coe-Helpman-Hoffmaister tradition. The fact
Innovation in Mexico: NAFTA Is Not Enough 311

that input trade with the United States is a good vehicle for technology transfer toMexico but that trade with other high-income OECD countries apparently has noeffect on TFP is counterintuitive. The result is strikingly consistent with Keller(2002), who finds that the impact of trade in intermediate goods decreases withgeographic distance between trade partners. In fact, employing Keller’s elasticity,the U.S. impact on Mexico should be, and is, roughly 10 times as large as that withrespect to the OECD. However, space-dependent depreciation of technologyembodied in inputs seems unlikely and, as Schiff and Wang (2002) suggest, theseresults may be picking up greater collaborative and subcontracting relationshipsacross the border rather than the effortless transfer of production knowledgeembodied in the intermediate inputs themselves. This in no way undermines thebenefits of an open trade stance with respect to the United States, but it does sug-gest that the extraordinarily large TFP-enhancing effects of trade with the UnitedStates reflect nontrade channels of influence, which may be related to personaland business interactions among businesspeople, firms, and researchers.
Firms may also learn by exporting in the sense that participation in foreignmarkets may help them identify the latest production, management, and marketingtechniques. Thus exporters in Mexico could have enhanced their learning capacityduring the post–NAFTA and trade liberalization period. Numerous cross-sectionalstudies have shown that Mexican exporters tend to be more technically efficient,presumably because of technological development related to the import oftechnologies from abroad (Alvarez and Robertson 2001; Meza González andYaguë 2002). However, using the only micro-level panel data spanning the NAFTAperiod that allow for the determination of causality—whether exports make a firmmore efficient or more efficient firms export—López-Córdova (2002) finds noimpact of exporting on TFP growth and a negative correlation with productivitylevels. A World Bank study (2000) finds that the number of years of experience inexporting does seem to be associated with rising TFP levels, although the estimatesdid not control for unobserved firm-specific characteristics and the act of beginningto export itself did not appear to stimulate productivity growth.
The absence of a positive finding is consistent with the panel regressions byClerides, Lach, and Tybout (1998) for Mexico’s early period of liberalization, as wellas for Colombia and Morocco. The researchers found little evidence in any countrythat firms’ cost structures change after breaking into the export market. They arguethat higher productivity is likely to be the result of a selection of the better firms intoexporting—that is, the Schumpeterian reallocation effect.16 These results are alsoconsistent with Kraay, Soloaga, and Tybout’s (chapter 11 of this volume) analysis offirms in the chemical industry in Mexico and Colombia. The researchers wereunable to establish Granger causality between engaging in international activities—be it imports or exports—and indicators of productivity gains.17 The disappointing
312 Global Integration and Technology Transfer
results regarding the lack of a robust positive effect of exporting on TFP growthare found elsewhere, in both emerging and advanced economies.18
There can be little doubt that FDI increases the capital stock in the host countryand contributes the technology embodied in that capital. It also may have realloca-tion effects, to the degree that it displaces inefficient firms. However, the macroeco-nomic evidence does not suggest strong causality between FDI and TFP growth,and the microeconomic evidence for technological spillovers to other firms is thinand negative.19 López-Córdova (2002) finds a negative direct effect of FDI on thesame industry’s TFP. This is consistent with numerous other panel studies ofother developing and industrial countries.20 Other literature on Mexico is sparse.Blomström and Wolff (1994) find that both the rate of local firms’ labor produc-tivity growth and their catch-up rate to the multinationals are positively related tothe industry’s degree of foreign ownership. They find that the rate of convergenceof industry labor productivity with the U.S. rate of growth is higher in industrieswith a higher share of multinationals. They point out, however, that it is difficultto distinguish a rise in within-firm productivity from increased competition thatforces out less efficient firms, raising the average rate of growth.
In summary, our reading of the international evidence is that NAFTA may havehelped spur trade, FDI, and economic growth, but the trade channel’s benefitswere driven mainly by factor accumulation effects and displacement of inefficientfirms by more efficient firms. FDI stimulated by NAFTA aided Mexico’s economicrecovery, but it did not necessarily augment the technological progress componentof TFP. The evidence for direct knowledge spillovers through these mechanismsseems generally weak.
National Learning Capacity: The Missing Complement
These findings seem somewhat counterintuitive, given how important trade and,to a lesser extent, FDI appear to have been in the “Asian miracles,” which did expe-rience rapid rates of TFP growth. The lackluster productivity growth of Mexicooffers important insights. Trefler (1999a, 1999b) argues that NAFTA was associatedwith closing the gap with the United States in some manufacturing activities but inexacerbating it in others, such as computers and industrial machinery. He arguesthat a critical explanation is low levels of Canadian R&D and deficient basic scienceand that the presumption that Mexico can rely on basic science from the UnitedStates is misguided. By the time a seminal innovation is transferred from theUnited States, its most valuable applications have already been exploited by U.S.companies. To support this point, Trefler cites evidence showing that a 5 percentincrease in R&D in the United States is associated with 6.7 percent increase in U.S.productivity but only a 2.4 percent increase in Canadian productivity.
Innovation in Mexico: NAFTA Is Not Enough 313

Both partners’ experiences suggest that, although they are helpful, trade and FDIare not enough to put Mexico on a rapid growth path; important complementaryefforts in innovation are necessary. An emerging strand of the growth literaturestresses the importance of “national learning” or “innovative” capacity to adopt newtechnologies and implicitly take advantage of the new trade opportunities for con-vergence. Acemoglu and Zilibotti (2001) argue that most technologies developed inadvanced countries are not as productive in developing countries because the hostcountries’ low human capital is not appropriate for using innovative productionprocesses. Lloyd-Ellis and Roberts (2002) argue that education and technologicalprogress are not only complements but dynamic complements, with the return toeach determined by the growth of the other. Technology transfer from the UnitedStates to Mexico, for example, will not lead to the equalization of productivity levelsbetween these countries as long as Mexico’s human capital is much lower than thatin the United States.
Howitt and Mayer-Foulkes (2002) offer a “convergence club” theory that explainswhy human capital—and innovative effort more generally—are essential forconvergence among countries. They trace three possible productivity-growth pathsfor countries exposed to identical technological progress. Countries with highhuman capital relative to the technological frontier will experience the fastest ratesof TFP growth.21 That is, the most dynamic economies will tend to be those thathave the necessary human capital and the required learning capacity for pushing thetechnological frontier forward. Countries with lower learning capacity will tend torely on the adoption of technologies previously invented in the most dynamic coun-tries (as Trefler [1999] suggests is the case in Canada), and they will appear to showslower levels of TFP growth than the leading countries. Economies that have inade-quate human capital or learning capacity to adopt technologies stagnate.22 Micro-economic evidence from Mexico suggests that firms that spend more on R&D,use highly skilled workers, and train are more likely to adopt new technologies(López-Acevedo 2002). But the question remains whether, in the aggregate, Mexicois making the necessary complementary effort in innovation that theory suggests isnecessary for it to converge with U.S. levels or whether an excessive reliance on passivetransfers through trade and FDI will leave the country stuck in a low-growth trap.
Where Does Mexico Stand in Innovation Effort?
As a way of quantifying Mexico’s innovation effort, we benchmarked two commonindicators of innovation inputs: expenditure on R&D and payments for licensing ofnew foreign technologies, both with respect to GDP and the labor force.23 Expenditureon R&D extends beyond investment in cutting-edge technologies to expenditure
314 Global Integration and Technology Transfer

on adoption and adaptation of technologies. It shows substantial variance acrosscountry growth trajectories. Not only does the share of GDP dedicated to R&D inthe average country increase with income per capita, several high-growth com-parator countries—Finland, the Republic of Korea, and Israel—had dramatictakeoffs relative to this benchmark, a path that China and India appear to beattempting to follow (figure 13.4). The average effort of five middle-income LatinAmerican countries (Argentina, Brazil, Chile, Costa Rica, and Mexico) is substan-tially below trend.
Since the late 1960s, Mexico’s R&D effort has been below the level of countriesat the same level of development. In contrast, licensing expenditures since the late1970s have met or exceeded the predicted level (figure 13.5).24 The debt crisis ofthe 1980s was associated with a rapid decline in R&D effort. It is therefore possi-ble that one of the channels through which the process of adjustment during the1980s hampered productivity growth may have been through the reduction ofR&D investments. During the NAFTA period, R&D spending rose again, althoughnot to the average. From this viewpoint Mexico needs to do more to stimulateinnovative activity and address impediments to it. This becomes even more obvi-ous when we look at high-innovation countries. Among these countries, onlyCanada experienced neither a boom nor a continuously high level of R&D effort,a result consistent with Trefler’s (1999a, 1999b) argument that Canada risks falling
Innovation in Mexico: NAFTA Is Not Enough 315
FIGURE 13.4 Ratio of R&D to GDP in Selected Countries
Source: Lederman and Maloney (2003).
0.0
0.5
1.0
1.5
2.0
2.5
3.0
3.5
4.0
4.5
5.0
4 5 6 7 8 9 10 11
R&
D/G
DP
log GDP per capita
Israel
Korea, Rep. ofPredicted
ratio
Finland
LA(5)
India
China

into a lower growth equilibrium if it does not increase its R&D effort. The cases ofFinland and the Republic of Korean are remarkable in that they went throughperiods of very rapid improvements in their relative R&D effort; by the early1980s both were well above the median.
How Much Should Mexico Spend on Innovation?
Caution is necessary in interpreting these benchmarking results and those like them,for two reasons. First, standard growth theory suggests that levels of investment—inphysical and knowledge capital—determine the steady-state level of income. Hencein some sense, the above benchmarking is simply asking what combination of var-ious kinds of investments a country used to attain its current level of income. Atthe most basic, very high use of R&D in China or India may suggest only that thesecountries are inefficiently using those factors. As Maloney and Rodriguez-Clare(2005) argue, the accumulation of knowledge capital and physical capital are closelyrelated (TFP and the capital/output ratio are highly correlated), suggesting strongcomplementarities between the two. It may make little sense for a country toembark on a research agenda without a well-developed private sector to comple-ment it. Furthermore, as Maloney (2005) points out, Latin America attained itslevels of income with low levels of R&D and education and moderate levels of
316 Global Integration and Technology Transfer
FIGURE 13.5 Innovation Inputs in Mexico
Source: Authors’ calculations.
−100
−50
0
50
100
150
200
1990 1995 2000
devi
atio
n fr
om e
xpec
ted
valu
e (p
erce
nt)
R&D/GDPlicensing/GDP

licensing relative to what was expected given the level of GDP and the size of thepopulation in these countries. In contrast, in Finland and the newly industrializedcountries of Asia, R&D, education, and licensing all exceeded expectations. Butthis does not suggest that one recipe is preferred to the other: Italy and Spain fol-lowed the Latin recipe and converged very quickly to EU levels of income. That said,their recent slowdowns suggest that while process and managerial innovation cangenerate substantial TFP gains, over the longer term a greater emphasis on R&D–type activities in the production mix is probably necessary.
Another way of posing the question is to ask whether the returns to R&Dcan justify the dramatic increases in R&D expenditures seen in Finland or theRepublic of Korea. Most estimates of the impact of R&D spending on TFP inselected U.S. firms and industries are very high, ranging from 30 to 120 percent,which, when compared with a 7 percent return on capital, implies that the UnitedStates should invest several times more in R&D than it currently does.25 Ledermanand Maloney (2003) also find estimates of social rates of return to R&D for aglobal sample, including poorer countries in this range. However, they find thatthere appears to be a U-shaped pattern relating returns to level of development, apattern in which countries such as Mexico show much lower returns than countriessuch as Finland. Why this should be the case is partly the subject of the next section.
Lederman and Maloney also find that not only do natural resource–abundanteconomies (captured by the ratio of net exports of natural resources) such as Mexicoappear to grow more rapidly than others, the interaction with R&D spending issignificantly positive.26 That is, a much higher commitment to innovation mayhave allowed Australia and Scandinavia to exploit their natural resources moreeffectively than Mexico and other Latin American economies.
Why Is Innovation Effort So Low in Mexico?
High social returns may not translate into high private returns—and hence innova-tive effort—because market imperfections tend to reduce the equilibrium marginalprivate returns to R&D.27 Knowledge is especially susceptible to market failures thatlead to an underinvestment in R&D and other innovation-related activities. Thesemarket failures take several forms.
Nonappropriability Innovators may be unable to exclude others from using theirideas. This is implicit in the finding that rates of return to R&D tend to be roughlyfour times the private rate in the studies cited above. Recognition of this failurehas led to an emphasis on public interventions necessary to ensure the sociallyoptimal level of innovation. These interventions include subsidies to R&D,
Innovation in Mexico: NAFTA Is Not Enough 317

temporary monopoly rights granted through patents, and other intellectual prop-erty regime instruments.
The same problem slows the transmission of existing ideas. A firm that incursthe costs of tapping into the global stock of knowledge will soon find its discover-ies adopted by other firms that free ride on the investment. Historically, this hasgiven rise to institutions ranging from agricultural extension services to technologyparks to institutions designed to act as “antennae” for new ideas at the sectoral andnational levels.
Lumpiness and Scale Economies That Dictate Specialization R&D and inno-vation are characterized by economies of scale and lumpiness. To be effective,resources often need to be concentrated in a manner that is beyond the capacity ofthe individual firm. Combined with the fact that even patents are not effective inresolving the nonappropriability problem in “pure science,” this provides a rationalefor institutions dedicated to R&D and innovation efforts, such as research centersand universities. Innovation and knowledge developed by these institutions tendto be nonexclusive and are made available to all interested parties.
Innovation, Diffusion, and Application That Require Collaboration amongMany Institutions and Firms Although innovation is sometimes the product of asingle firm, the more common pattern is one of joint efforts among various firms,among firms and R&D–related institutions, or among various R&D-related insti-tutions. Progress does not proceed linearly from pure science to applied tech-nologies, it moves in both directions, with feedback from frontline users oftechnology to researchers essential for refining products and productionprocesses (Nelson and Rosenberg 1993). As a result of specialization, the full supplychain of knowledge is not totally integrated, either vertically or horizontally. Tech-nological advance is not necessarily evenly diffused throughout the supply chain.Success may require cooperation among actors, cooperation that is subject to coor-dination failures and transactions costs. In many industrial countries these issueshave given rise to national institutions devoted to formenting collaboration or elim-inating impediments to technological collaboration between institutions.
The development and necessary interaction and coordination of these marketand nonmarket institutions has led to the concept of national innovation systemsand the emergence of an extensive body of relevant literature that we can only touchon here (Nelson and Rosenberg 1993; OECD 1999, 2001). It is through networksof public and private firms interacting in a concerted way to generate and adopttechnologies that nations learn. This national learning capacity is what permitsnations to adopt and innovate in their initial areas of comparative advantage andhelps create new areas (see Furman, Porter, and Stern 2002; Nelson 1993; Romer
318 Global Integration and Technology Transfer

1990; Wright 1999). National learning capacity can be seen as the factor determin-ing which convergence club countries find themselves in, according to Howitt andMeyer-Foulkes (2002). A broader concept of a national innovation system includesother supporting institutions, such as credit and labor markets and even the degreeof market friendliness of the economy (that is, whether there is an incentive todevelop an idea and how difficult it is to take an idea to market).
Mexico has numerous innovation-related public institutions, including institu-tions associated with the Ministry of Education, the National Council for Scienceand Technology (CONACYT), and the national petroleum company (PEMEX),that address particular market failures. As is generally the case, however, marketforces will not guarantee that the various components of these nonmarket institu-tions function coherently in a fashion that remedies the market failures they wereintended to address. Finland, consistently ranked among the top two most compet-itive economies in the world, is extraordinarily mindful of the need to ensure thesmooth collaboration of elements of its national innovation system—in a way thatMexico is not. The challenge for public policy is thus not only to help establishresearch and educational agencies but to see that market and extra-market incen-tives ensure that these agencies are adequately integrated with one another andwith the productive sector.
The Efficiency of Knowledge Generation
The weak functionality of the Mexican national innovation system may con-tribute to low private and social rates of return and the apparent low efficiency inthe use of innovation investment, measured in terms of how well it converts R&Dfinancing into patenting.
Table 13.1 presents econometric estimates of patenting elasticities with respectto total R&D investment.28 Also included in the regression in order to standardizeby trade and endowment patterns are the log of exports to the United States, netexports of natural resources, and the log of the pre-sample mean of patents(1963–85). Every regression includes a dummy for Latin America and a dummyfor Mexico that are interacted with the R&D terms as a measure of whether thetransformation rates are higher than the sample mean. The first three columnssuggest that there is a strong and statistically significant relationship between R&Dexpenditures and patents. However, the Latin American dummy with R&D gener-ates a strongly negative coefficient, suggesting both that the region performs sub-stantially worse than the norm in converting R&D expenditures into innovationand that Mexico performs even worse than the region as a whole. More generally,these results suggest that some of the spillovers among firms in the OECD are notoccurring in Latin America.
Innovation in Mexico: NAFTA Is Not Enough 319

320 Global Integration and Technology Transfer
Methodology: Negative binomial, presample mean estimatorPresample: 1963–84
Number of observations 512 512 512 512
Number of countries 53 53 53 53
ln(average patents 1963–84) 0.32∗ 0.40∗ 0.38∗ 0.26∗
ln(R&D expenditure) 0.78∗ 0.48∗ 0.48∗ 0.24∗
ln(Ustrade) 0.37∗ 0.35∗ 0.32∗
Nrleamer −0.03∗∗ −0.03∗ −0.07∗
ln(quality)∗ln(R&D) 0.17∗
ln(colaboration)∗ln(R&D)ln(years of education)∗ln(R&D)Tertiary enrollment∗ln(R&D)Secondary enrollment∗ln(R&D)LAC∗ln(R&D) −0.03∗ −0.04∗ −0.04∗ 0.00MEX∗ln(R&D) 0.00 −0.04∗ −0.04∗ −0.02∗
Openness∗ln(R&D) 0.02∗∗ 0.02∗∗∗
Trade residual∗ln(R&D)ICT∗ln(R&D)Time trend 0.05∗ 0.04∗ 0.03∗ 0.03∗
Pseudo R-squared 0.17 0.19 0.18 0.21Log likelihood −2,889.4 −2,828.5 −2,946.6 −2,766.2
TABLE 13.1 Determinants of Patent Counts
Figure 13.6 expands this exercise by plotting the interactive dummies for anumber of other regions and countries, leaving the OECD as reference. Finland,the Republic of Korea, and Taiwan (China), to mention a few, appear to be moreefficient than Latin America and Mexico.
The negative Latin American effect disappears altogether when the quality ofscientific and research organizations (universities and public research institutes)and the quality of collaboration between the productive sector and universities areintroduced. When tertiary enrollment rates are added, Mexico’s dummy also dis-appears. It is noteworthy that secondary enrollment and the level of developmentof information and communications technology do not explain the region’s inno-vation inefficiency, suggesting that a focus on computer and communicationsinfrastructure to the detriment of more traditional institutions of learning seemsinadvisable.29 In summary, Mexico’s inefficiency results from a combination of lowenrollment rates in universities and poor quality research and linkages betweenthe universities and the productive sector.

Structural Change in Trade but Not in Innovation
As an additional measure of how well the national innovation system is working, wecan determine how well Mexico’s innovation effort corresponds with the emergingareas of comparative advantage—that is, the extent to which the national innova-tion system is “supporting” sectors with potential dynamism. NAFTA stimulateda structural change in which Mexico became a net exporter of machinery, includ-ing telecommunications equipment, road vehicles and parts, and office and dataprocessing equipment (De Ferranti and others 2002). In addition, the incidenceof intraindustry trade rose remarkably fast after 1994. What is not clear is whetherthese are simply upscale maquiladora operations or whether they have the poten-tial to become knowledge clusters that both provide employment opportunitiesand drive future growth.
Innovation in Mexico: NAFTA Is Not Enough 321
Source: Bosch, Lederman, and Maloney (2003) and authors’ estimates.∗Significant at the 1 percent level.∗∗Significant at the 5 percent level.
512 512 328 512 328 295
53 53 52 53 52 49
0.33∗ 0.28∗ 0.37∗ 0.23∗ 0.30∗ 0.28∗
0.35∗ 0.31∗ 0.42∗ 0.15∗ 0.29∗ 0.34∗
0.30∗ 0.38∗ 0.27∗ 0.37∗ 0.22∗ 0.19∗
−0.08∗ −0.10∗ −0.07∗ −0.11∗ −0.09∗ −0.08∗
0.12∗ 0.09∗ 0.09∗
0.11∗ −0.01 0.03∗∗ 0.020.10∗ 0.08∗
0.08∗ 0.07∗ 0.07∗
0.02 −0.01 −0.01−0.01 −0.01∗ −0.02∗ 0.01 0.00 0.00−0.03∗ −0.03∗ −0.03∗ −0.02∗∗ −0.01 0.00
0.01 0.00 0.02∗ 0.00 0.02∗ 0.03∗
0.000.03∗ −0.01 −0.03∗∗ 0.00 −0.01 −0.02
0.20 0.21 0.23 0.22 0.24 0.25−2,770.7 −2,731.7 −1,722.0 −2,700.3 −1,686.5 −1,529.6
TABLE 13.1 (Continued)

The Innovative Revealed Comparative Advantage (IRCA) index reveals howpatenting in various sectors in Brazil, the Republic of Korea, Mexico, and Taiwan(China) relative to each country’s total patenting compares with the world’s shareof total patenting in that sector (figure 13.7) (Patel and Pavitt 1995). A value aboveunity suggests that a country has an IRCA in a sector. The principal sectors inwhich Mexico shows an IRCA are traditional processed foods, soaps and paints, andprimary ferrous products. It has no IRCA in computers or automobiles. In con-trast, Brazil’s aircraft index has been rising since the privatization of EMBRAER(Brazil’s small airplane and parts producer) in 1994. More dramatically, theRepublic of Korea shows a notable increase in the index for electronic equipment,a sector in which it had a clear IRCA by 2000. Taiwan (China) also experiencedsubstantial changes in its innovative structure and now has a clear IRCA in trans-portation industries (motorcycles and bicycles, miscellaneous transportationequipment) and various electronics products (radio and TV receiving equipment,household appliances).
Mexico’s inability to generate an IRCA in the areas in which it appears to beexporting heavily suggests that the national innovation system is not supportingthe productive sector. To the degree that Mexico is simply relying on temporarily
322 Global Integration and Technology Transfer
FIGURE 13.6 Efficiency of Research and Development in Selected Countries, 1985–2000
Source: Lederman and Maloney (2003).
−10
−5
0
5
10
15
20
Argen
tina
Brazil
Chile
Colom
bia
Costa
Rica
Mex
icoPer
u
Urugu
ay
Venez
uela,
R.B
. de
Taiwan
Korea
, Rep
. of
Israe
l
Finlan
d
Norway
devi
atio
n fr
om O
EC
D a
vera
ge (
perc
ent)

Inn
ovatio
n in
Mexico
: NA
FTA Is N
ot En
oug
h
323
FIGURE 13.7 IRCA Index in Selected Industries and Countries, 1980–2000
Source: Authors’ calculations.
0
1
2
3
4
5
6
7
8
9
10
1980 1985
IRCA in selected industries in MexicoIRCA in aircraft in Brazil and computing and
accounting equipment in Mexico
IRCA in selected electronics industries in theRepublic of Korea
IRCA in selected electronics and transportationindustries in Taiwan (China)
1990 1995 2000
vehiclesfood
electronicscomputingsoap
primary ferrous
IRC
A in
dex
(18-
year
mov
ing
aver
age)
0
0.2
0.4
0.6
0.8
1
1.2
1.4
1980 1985 1990 1995 2000
Brazil aircraft
Mexico officecomputing andaccountingequipment
IRC
A in
dex
in S
IC 3
72(1
8-ye
ar m
ovin
g av
erag
e)
0
1
2
3
4
5
6
7
8
1980 1985 1990 1995 2000
office computing andaccounting equipmenthousehold appliances
radio and televisionreceivingelectronic components
IRC
A in
dex
(18-
year
mov
ing
aver
age)
0
0.5
1
1.5
2
2.5
3
3.5
4
1980 1982 1984 1986 1988 1990 1992 19941996 1998 2000
office computingand accountingequipment
radio and televisionreceiving
household appliances
motorcycles andbicycles
electronic componentsmiscellaneoustransportation
IRC
A in
dex
(18-
year
mov
ing
aver
age)

low labor costs to assemble computers rather than developing depth in supportinga knowledge base, these sectors may lose steam in the near future.
The National Innovation System: A Closer Look
The previous sections suggest that both the level and the efficiency of the nationalR&D effort depend on elements of the national innovation system—the quality ofthe nonmarket-based institutions developed to resolve market failure and howwell they are linked. Mexico’s national innovation system appears to be characterizedby a lack of coordination among its components.
“Following the money” reveals that all of the government’s R&D is self-financedand less than 8 percent of the R&D performed by universities is financed by theproductive sector. In turn, neither the government nor universities contribute sig-nificant amounts to the productive sector’s efforts. The three sectors functionmore or less independently—a recipe that is unlikely to produce economicallymeaningful innovation (see Lederman, Maloney, and Servén 2005 for details).
This pattern appears in sharp contrast to some of the Scandinavian countriesand newly industrialized countries in Asia, which, while making a massive effortto create an educated scientific community, recognized the importance of a well-coordinated national innovation system to support the private sector in the contextof an export-oriented trade policy (de Ferranti and others 2003). Even a cursoryreview of Finland’s technology policy reveals a virtual obsession with coordinationamong various elements of the national innovation system (between firms andamong firms, universities, and think tanks). The emphasis is not only on having theright human capital but on ensuring that it faces the correct incentives to interact andto generate networks that serve as collectors, creators, and disseminators of knowl-edge that enhances competitiveness.
Firm–Firm Links, Public Research Centers,and State-Owned Enterprises
Firms can internalize many of the externalities of nonappropriability, lumpiness,and risk discussed above by banding together to form industry-level associationsand research centers. One of the most famous policy initiatives to promote interfirmlinkages in the United States is SEMATECH, a research consortium of semiconduc-tor manufacturers set up in 1987 by 14 U.S. semiconductor firms with the financialassistance of the U.S. government, which has been given credit for reviving theindustry in the face of Japanese competition (Irwin and Klenow 1996). In Mexicothe Unión Nacional Avícola concerns itself with raising the quality of technologicalinputs into the production process, particularly by importing foreign technologies
324 Global Integration and Technology Transfer

(Mayer 2002). In both cases, the dominant private sector presence ensures therelevance of R&D. But these efforts have developed without the involvement ofthe public sector, and they have arisen out of the firms’ own concerns about theircompetitiveness.
Theory suggests that market forces alone often do not lead to the establishmentof strong knowledge sharing and technology diffusion agreements among privatefirms, primarily because firms naturally seek to prevent potential competitorsfrom profiting from their own R&D investments and know-how. Mexico, likemany other countries, established many public research centers to fill the gap.Rosenberg (2000) argues that such institutions generally have poor track records,because government researchers have relatively little understanding of the needsof the productive sector and face few incentives to address them. This critiqueappears writ large in Mexico. Many of the 150 public research centers emerged inthe import-substituting industrialization period, largely under the logic thatfledgling industries lacked in-house capability to undertake the necessary research.Today they enjoy a disproportionate share of national research budgets. However,they are dependent on the secretariat to which they belong and frequently opposeany efforts of the secretariat to contract with firms or outside universities thatmight be more qualified to investigate a particular question.30
Furthermore, the lack of competition has had the usual depressing effects onquality and created disincentives to work with other institutions that might bepotential rivals. Proposed reform laws foresee greater autonomy for the centers,and they offer the possibility that research funds will be allocated competitivelyrather than automatically to a center of investigation. Inducing a greater degree ofcompetition for scarce research funding would move Mexico close to the fundingallocation systems of high performers like Finland, which has unified its publicresearch centers under one roof. This ensures the same marginal return to researchspending across sectors and permits greater transparency and ease of monitoring.
There are, however, several cases of generally fruitful public research center–ledtechnology transfer to the private sector, all in areas in which Mexico has an IRCA:ferrous metals and food items. In the case of the Center of Research and TechnicalAssistance (CIATEQ), based in Queretaro, however, successful experiences occurredbefore the privatization of the industries involved, suggesting the long gestationperiod needed to establish effective technology transfer relationships. The case ofthe Center for Research and Advanced Studies, in Irapuato, (CINVESTAV-Irapuato)suggests the importance of establishing international linkages and plugging thedomestic national innovation system into the global stock of knowledge. Lowlevels of human capital in the private sector—related to low tertiary and secondaryschooling, especially in rural areas—have also become obstacles to successful tech-nology transfers intermediated by government-funded research centers.
Innovation in Mexico: NAFTA Is Not Enough 325

One of the most straightforward ways of ensuring links between productiveactivities and R&D efforts is through public management of important economicsectors. This has been done in Brazil (EMBRAER before 1994), Chile (CODELCO),Costa Rica (telecommunications, utilities), Mexico (PEMEX), Taiwan (China)(telecommunications), and República Bolivariana de Venezuela (PEDEVESA).The evidence on the efficiency of total R&D expenditures in several of these coun-tries is quite strong, indicating that public management is not necessarily mis-guided, although that seems not to be the case in Mexico. Furthermore, the initiallinks of the public research centers referred to above were to public sector firms.
Universities
Universities enrich the innovation network through several channels. First, theyproduce workers with tertiary education, who are the lifeblood of the nationalinnovation system. The importance of this function cannot be overstated. Inter-views with high-tech companies in Costa Rica highlight the issue of the generationof high-quality human capital in a country as an order of magnitude more impor-tant than other factors, including R&D incentives and R&D suppliers (de Ferrantiand others 2002). Second, universities are well suited for large, long-term, basicresearch. Third, they are likely to maintain contacts with research centers in indus-trial countries and hence perform an important role as a link to worldwide scientificand technological know-how. In all cases, the degree to which they remedy theunderlying market failures depends on their links to the productive sector.
Higher education plays a dominant role in Mexican and Latin American R&D(table 13.2), which often translates into a bias toward basic as opposed to appliedresearch (Hansen and others 2002).31 This bias is not necessarily a weakness, pro-vided that the incentives academics face ensure that the work is of high quality and islinked to the productive sector. In Finland 40 percent of firms have collaborativearrangements with universities (Brunner 2001), and these interactions have beenvital to the continued dynamism of both the high-tech and more traditional forestindustries, as Blomström and Kokko (2001) have documented. Comparable figuresare not available for Mexico, but the results of the Global Competitiveness Report of theWorld Economic Forum indicate that businesses perceive university–private sectorinteractions in Mexico, as in many Latin American countries, as weak (figure 13.8).
These results are consistent with case studies by Mayer (2002) of Avimex, a vet-erinary pharmaceutical company in Mexico. He notes that although Avimexspends 10–15 percent of sales on R&D and develops world-class innovations injoint projects with U.S. research institutes, the company, like most Mexican firms,lacks research partners in Mexico. This lack has forced the firm to look for partnersin the United States.
326 Global Integration and Technology Transfer

In her study of 13 high-tech firms in Jalisco, Mexico’s Silicon Valley, whichemployed roughly 249 Mexican engineers involved in research and design, RiveraVargas (2002) finds that there was limited contact between the firms and theiracademic counterparts. In particular, no joint research projects in electronics orrelated areas were being carried out. Hanson (2004) argues that although there arecases in which multinational corporations and universities collaborate on curricu-lum development, there appear to be no systematic plans to use these relationships totransfer technology, and there appears to be little active learning. More generally, thegovernment, when encouraging manufacturing investment such as the maquilado-ras, never looked beyond job creation to active programs of technology transfer.
The isolation of the Mexican university arises from both the demand and supplysides. A number of factors—including poor design and faulty incentives—areresponsible for the dearth of effective links and collaboration between scientificinstitutions and the private sector in Latin America and the Caribbean. But thereis also a lack of incentives for universities to link with and address private sectorknowledge needs. Arguably, the region has more of a liberal arts than a technicalculture, with deep historical roots that resonate with critiques of the inadequateU.K. system a few decades ago.32 But there are also more concrete disincentives.
Innovation in Mexico: NAFTA Is Not Enough 327
Financed Performed Performedby Financed by Performed by
productive from productive by higher nonproductiveCountry sector abroad sector education public sector
Brazil 39.14 0.00 44.04 44.27 11.69Canada 44.56 12.69 57.69 28.67 13.64Chile 19.37 5.75 9.62 47.11 43.27Costa Rica — — 32.58 48.72 18.70Finland 62.72 4.12 66.95 19.12 13.93Ireland 66.46 8.79 71.58 20.46 7.96Rep. of Korea 73.02 0.08 72.53 10.42 17.05Mexico 19.06 5.22 22.66 39.82 37.52Sweden 64.37 3.47 75.73 21.57 2.70Taiwan (China) 60.03 0.10 61.00 12.20 26.80United States 62.98 0.00 73.88 14.33 11.78R. B. de
Venezuela 38.13 0.00 — — —
TABLE 13.2 Structure of R&D Effort in Selected Countries, 1995–2000(percentage of total R&D expenditures, annual averages)
Source: Authors’ calculations based on annual data collected by Lederman and Sáenz (2003).
Note: — = not available.

Because researchers cannot appropriate the benefits of innovation, they have littleincentive to undertake innovations and link with the private sector. Various indus-trial countries allow ownership rights to government-funded R&D—often on acase-by-case basis and in some countries, including Japan and the United States,explicitly in the national patent laws. In the United States the Bayh-Dole Act of1980 allows industry contractors of the government, national laboratories, andacademic institutions to automatically retain title to the inventions that come out oftheir research work, even if the work was or is funded by the government. In return,the government receives from the university or industry a royalty-free license forgovernmental purposes. There is convincing evidence that these laws have helpedspeed the rate of patenting by research conducted in U.S. public laboratories (Jaffeand Lerner 2001). The lessons learned regarding incentives for patenting byresearchers also apply to Mexican public research centers and universities.
Goldfarb, Henrekson, and Rosenberg (2001) cite differences in academicstructures and their influence on researcher involvement with the commercialization
328 Global Integration and Technology Transfer
FIGURE 13.8 Private Sector Perceptions of Quality of ScientificInstitutions and University–Private Sector Collaboration, Selected Countries, 1994–2001
Source: World Economic Forum (2002).
2.0
2.5
3.0
3.5
4.0
4.5
5.0
5.5
6.0
6.5
7.0
Argen
tina
Brazil
Chile
Colom
bia
Costa
Rica
Mex
icoChin
a
Spain
Korea
, Rep
. of
India
Irelan
d
Austra
lia
Sweden
Israe
l
Finlan
d
United
Sta
tes
Quality of scientific institutions University/private sector collaboration

of research ideas as an important reason for the much lower spillovers from acade-mia to industry in Sweden than in the United States. Competition for researchersand scientists in the United States has reinforced the need for policies that areattractive to them. Universities have established technology transfer offices, andthey have liberal policies on faculty leaves of absence and consulting privileges,which allow faculty to pursue commercial opportunities while keeping their posi-tions on the faculty intact. In contrast, Swedish universities do not gain from com-mercialization and hence resist faculty involvement with industry. For instance, itis difficult for Swedish professors to take temporary leave to organize firms, asprofessors in the United States are permitted to do.
If an innovation is to be commercialized, property rights must be allocated tothe university or the researcher. How these rights are allocated also has a signifi-cant impact. If researchers get the property rights, they are likely to remain at theuniversity; if they do not retain the rights, they are likely to move to the produc-tive sector.
At a more mundane level, Mayer (2002) argues that bureaucratic rigidities inMexico make it difficult to write contracts with universities or gain access to theirlaboratories and equipment. Mexico’s very centralized and bureaucratic approvalprocess serves as a disincentive to firms attempting to forge ties with universities.
Supporting Capital and Labor Markets and IntellectualProperty Regimes
Credit markets and labor markets are critical supporting elements of the nationalinnovation system. Here, too, Mexico may be facing important barriers to raisingthe innovation effort.
By nature, innovation has long gestation periods and high levels of risk; theabsence of long-term credit markets can inhibit long-run innovation-related risktaking. The shallowness of Mexican markets is well documented. Less is knownabout the specialized capital market institutions required across the innovationcycle, namely, precommercialization financing (seed money) and the subsequentventure capital infusion needed to bring ideas to market. In India in addition toample fiscal incentives for R&D, a development financial institution (the IndustrialCredit and Investment Corporation of India and its subsidiaries) initiated venturecapital in 1988. Subsequently, private venture capital firms emerged, albeit on asmaller scale. In Israel innovation policy is essentially credit policy (Trajtenberg2001). In Mexico there is currently no recognition of the venture capital firm as alegal entity. There are holding companies, or SIMCAS, that hold other firms’ assets,but the legal structure does not encourage the association of several entrepreneursto share risk, and the profits of the SIMCAs enjoy unfavorable fiscal treatment.
Innovation in Mexico: NAFTA Is Not Enough 329

That said, other countries in the region, such as Chile, that have established ven-ture capital–type institutions have suffered from a lack of “deal flow”—the ideasare not there, or if they are there, they are unable to escape the institution in whichthey were generated. A government program to resolve the capital problem may be“pushing on a string” if it does not also address the fundamental dysfunction of thenational innovation system.
Parente and Prescott (2000) identify the barriers to the adoption of new technolo-gies embodied in labor codes or other workplace restrictions as explanations for dif-fering levels of development. Whether their largely anecdotal evidence can establishsuch impediments as primary, it is clear that Mexico’s labor code is not friendly to theintroduction of new technologies or processes. The dynamic concerns about TFPgrowth should assume a larger profile in the national debates over labor reform(see OECD 2001).
Although the literature on intellectual property rights is somewhat ambiguous,the strengthening of intellectual property regimes seems important to the innovationeffort (see Park 2001, for example). The index of intellectual property regimes is asignificant determinant of R&D. In the Mexican case, the rise in the index canaccount for all of the rebound in R&D, and it is the only determining variableamong increased credit intermediation, lower risk, and greater ability to mobilizepublic resources that improved and thus could have been responsible for the modestrecovery in the share of R&D in Mexico’s GDP during the second half of the 1990s(see Lederman and Maloney 2003).
Conclusion
The countries to which Mexico often compares itself, particularly the newlyindustrialized countries of Asia, have followed growth strategies characterized bya very active approach to innovation policy. This has often included an activeengagement in world markets, particularly on the export side. NAFTA—andeconomic integration with Canada and the United States more generally—thereforerepresents a step in the right direction. Import competition has been associatedwith improvements in manufacturing TFP, and it may have indirectly increasedproductivity by improving the efficiency of R&D. Improvements in intellectualproperty rights and increased credit availability were probably associated with themoderate yet insufficient increase in R&D expenditures in the late 1990s. Never-theless, the main conclusion of this chapter is that NAFTA is not enough to ensuretechnological convergence in North America.
On basic indicators of investment in innovation and innovation outcomes,Mexico lags significantly behind comparator countries. The low levels of bothinnovation effort and efficiency suggest that the country needs to address issues
330 Global Integration and Technology Transfer

related to the inefficiency of its national innovation system. In particular, it needs toimprove the quality of its research institutions by changing both internal promotion/advancement criteria and incentives to interact with the private sector. In additionto regulatory changes affecting intellectual property regimes, researchers for uni-versities, and public research centers, it is likely that public subsidies will beneeded to provide additional incentives for firms to establish such links, especiallywhen there is little previous collaborative experience and thus little mutualtrust. The careful design of such mechanisms is essential; simply increasing thefinancing to existing programs and institutions should emphatically not be anoption. Reform of supporting institutions, such as credit and labor markets, shouldalso be considered. Finally, more effort needs to be dedicated to collecting statisticsand establishing methods to monitor the functioning of the national innovationsystem and the success of government interventions. It may be useful to build aninformation-based monitoring facility that would play a role similar to that ofSpain’s National Commission for the Evaluation of Research Activity (CNEAI).33
Clearly, Mexico’s location next to one of the most dynamic sources of innova-tion in the world offers opportunities for collaboration with northern universitiesand firms. Within the NAFTA context, Mexico might negotiate the co-financing ofjoint research or exchange programs. However, such efforts will lead to little ifhuman capital and institutions are not brought up to speed to enable Mexico toparticipate as a full partner in innovation.
Notes
1. Apologies to Pastor (2002), who first used the title “NAFTA Is Not Enough.” We find it especiallyappropriate to the issues of innovation discussed here.
2. At the firm level, see Cohen and Levinthal (1989); Forbes and Wield (2000); Griffith, Redding,and van Reenen (2003); and Pavitt (2001). At the national level, see Baumol, Nelson, and Wolff(1994).
3. Most of the analyses presented in this chapter are quantitative, relying on internationallycomparable indicators of various aspects of innovative activity and technological progress provided byLederman and Sáenz (2003).
4. The decline in productivity growth in the United States and other high-income countries in the1970s has been attributed to the oil shock of 1973 and its macroeconomic repercussions (Griliches1988). It is difficult to blame the decline in productivity in Mexico and other oil exporters on this factor.The East Asia and Pacific region, for example, did not experience such a slowdown, perhaps becausesome countries in the region, such as Indonesia, are oil exporters. The Republic of Korea, however, didexperience the slowdown.
5. In assessing the impact of various factors on TFP growth in the region, Loayza, Fajnzylber, andCalderón (2002) find that for all 20 Latin American countries in their sample, the impact of struc-tural reform policies was positive; for 15 countries in the sample, stabilization policies were positiveas well. They note, however, that the estimated combined contribution of the two ranged from 2.5 to3.0 percent—not insignificant but not likely to transform the region into Asian or Scandinaviangrowth miracles.
Innovation in Mexico: NAFTA Is Not Enough 331

6. Many resource-rich countries—Australia, Canada, Finland, and Sweden—also closed some-what after the Great Depression, although none did so to the degree of Latin America (Maloney 2002).
7. The USPTO demands that the invention be novel, nontrivial, and have commercial application(Jaffe and Trajtenberg 2002).
8. The patent residuals are derived from a negative binomial regression on GDP, population, andtheir squares plus a term for trade with the United States, which is known to be correlated with patentingin the United States. Median regression on the same regressors less the U.S. trade variable gives thepublications residuals. See Bosch, Lederman, and Maloney (2003) for technical details about themethodologies and data.
9. Interested readers can also consult other literature reviews on these issues, including Navarettiand Tarr (2000) and Saggi (chapter 3 of this volume).
10. The corresponding result from a 30-year cross-section of countries was below this range, fallingto 0.005 percent.
11. For a strong critique of cross-country studies that examines the link between trade andeconomic growth, see Rodriguez and Rodrik (2000).
12. For a more expansive review of the literature, see Keller (2001).13. High R&D industries are those that have relatively high shares of R&D expenditures over sales
in high-income countries.14. There was no difference between high and low R&D-intensive industries, suggesting that
industrial composition is not critical to the benefits of NAFTA.15. Muendler (2002) argues that this may be explained by the failure among manufacturers to
adjust production practices to the increased availability of imported inputs.16. They do find, however, that the presence of exporters may make it easier for nonexporters to
break into foreign markets. In Colombia nonexporters appear to experience cost reductions whenexport activity increases.
17. Intermediate inputs increased marginal costs and quality among producers of rubber, fertilizer,and pesticide. For pharmaceutical producers, imported intermediates combined with exports orimported capital goods, reduced marginal costs and tended to increase product quality. But these wereexceptions to a fairly ambiguous record.
18. The same inconclusiveness appears in the U.S. microeconomic data (Bernard and Jensen 1999). Astudy of a panel of Spanish firms concludes that there is evidence only in favor of the (Schumpeterian)firm-selection channel; the evidence on the learning-by-exporting hypothesis is very weak (Delgado,Fariñas, and Ruamo 2001). Aw, Chung, and Roberts (2000) report similar results for firms in the Republicof Korea and Taiwan (China). Kraay’s study on China (chapter 7 of this volume) is an exception.
19. For less developed countries, see, for example, Calderón, Loayza, and Servén (2002); Carkovicand Levine (2002); and Loayza, Fajnzylber, and Calderón (2002).
20. In a comprehensive review of the literature, Lipsey (2002) argues that the evidence is vast that for-eign firms tend to be at least as productive as domestic firms and hence their presence pushes up averageproductivity. However, the evidence that the presence of foreign firms has positive productivity spilloversis ambiguous. The great majority of studies that find strong effects employ cross-sectional data that can-not control for unobserved country characteristics. Studies using firm-level panels frequently findinsignificant or even negative effects (see, for example, Aitken and Harrison 1999 for República Bolivari-ana de Venezuela). Van Pottelsberghe de la Potterie and Lichtenberg (2001) find that investing in a moretechnologically advanced country and hence adding foreign production to domestic productionincreases productivity in the home country but that investing in a technologically less advanced countryhas insignificant or negative results for the host developing country. Baldwin, Braconier, and Forslid(2000) find mixed results for seven OECD countries. Using panel firm-level data from Sweden,Braconier, Ekholm, and Midelfart Knarvik (2000) discover no spillovers from incoming FDI on produc-tivity; the only variable in their sample affecting TFP is own-country R&D. Using panel data on techno-logical transfer from the United States, Xu (2000) finds a technology transfer effect by U.S. multinationalcorporations only for advanced countries, although a competition effect does appear to increase produc-tivity. Kinoshita (2000) finds little evidence of positive effects of FDI at the firm level in the Czech Republic
332 Global Integration and Technology Transfer

from 1995 to 1998. Javorcik (chapter 10 of this volume) reports no direct impact of FDI in Lithuania onfirms in the same industry, although she does find an impact on affiliated upstream suppliers.
21. For these authors, “innovative-effective” human capital is a combination of the level of educationand the effort invested by the economy to develop new technologies based on the technological frontier.
22. Similar results were previously suggested by Grossman and Helpman (1991), among others.They propose a model with multiple growth equilibria resulting from intranational R&D externalities.Maloney (2002) argues that this partly explains why Latin America nearly disappeared from someindustries it once dominated globally.
23. To derive the relationship between the rate of R&D investment and GDP, we estimated a medianregression in which the dependent variable was the log of R&D expenditures over GDP from the early1960s to 2000 and the arguments were the log of GDP per capita and the log of GDP per capita squared.
24. These are residuals from more general median regressions for both R&D and licensing, whichinclude log GDP, log GDP squared, log labor, log labor squared, and time dummies as arguments.
25. Griliches (1992) estimates social returns to R&D in the United States of 20–60 percent. Jonesand Williams (1998) confirm that rates of return in the United States are at least 30 percent and calculatethat the optimal resources that should be devoted to R&D could be four times the current level in theUnited States.
26. See also Lederman and Maloney (2002), who investigate the impact of trade structure ongrowth and find natural resources to be positively related to growth.
27. For an intuitive discussion of the determinants of the equilibrium private marginal rate ofreturn, see David, Hall, and Toole (2000). The equilibrium return is determined by the marginal costs ofand returns to R&D. Some market failures affect the costs (that is, capital markets might be incomplete),others affect the returns (that is, the nonappropriability problem).
28. These estimates were obtained using a pooled regression of 52 countries over a 15-year period(1985–2000) in a negative binomial regression application of Blundell, Griffith, and Windmeijer’s(2002) presample mean estimator, which aims to control unobserved country-specific characteristicsand the likely endogeneity of some of the explanatory variables.
29. The information and communication technology index used in this analysis is the one pro-vided by Lederman and Xu (2001). It is the result of the first principal component from factor analysisusing four indicators of information and communication technology: per capita telephone lines, cellularphones, personal computers, and Internet hosts.
30. This information comes from discussions in 2001 and 2002 with and presentations by CarlosBazdresch, Centro de Investigacion y Docencia Economicas (CIDE). Mr. Bazdresch is a former headof CONACYT.
31. The data in table 13.1 for Mexico differ from those in table 13.2 because of the different sourcesof information and different time periods. The data in table 13.2 are internationally comparable.
32. This appears to be the case throughout the region. Agapitova and Holm-Nielsen (2002) arguethat overall the university mentality in Chile is not geared toward solving problems on a business timescale. Mullin (2001) argues that overall academic interests tend to be narrow and unapplied. Observersof Costa Rica’s two-star technical school stress not so much incentives but the “foundationalimpulse”—a desire to be patterned more on the Massachusetts Institute of Technology or other technicalschools of excellence than on those with a liberal arts bias.
33. This commission has improved the quality and quantity of basic research output in Spain, evenduring a period of declining public funding of research (Jiménez-Contreras, de Moya Anegón, andLópez-Cózar 2003). The main monitoring variable used by the CNEAI is the number of publicationsbased on government- and university-funded research, which is made public once or twice a year.Given the reputational rewards sought by researchers, it is likely that the mere publication of theperformance index can improve the quality of research. This principle could be used to improve the qualityof applied research, by, for example, maintaining an accurate count of patents granted by the Canadian,Mexican, and U.S. governments to researchers residing in Mexico and financed by public funds,through public research centers or universities. Other important variables to monitor are discussed inDe Ferranti and others (2003, chapter 8).
Innovation in Mexico: NAFTA Is Not Enough 333

References
Acemoglu, Daron, and Fabrizio Zilibotti. 2001. “Productivity Differences.” Quarterly Journal of Eco-nomics 116 (2): 563–606.
Acemoglu, Daron, Philippe Aghion, and Fabrizio Zilibotti. 2002. “Distance to Frontier, Selection,and Economic Growth.” Working Paper 9066, National Bureau of Economic Research, Cam-bridge, MA.
Agapitova, Natalia, and Lauritz Holm-Nielsen. 2002. “Chile: Science, Technology, and Innovation.”LCSHD Paper Series No. 79, Latin America and the Caribbean Region, Human DevelopmentDepartment, World Bank, Washington, DC.
Aitken, Brian J., and Ann E. Harrison. 1999.“Do Domestic Firms Benefit from Direct Foreign Investment?Evidence from Venezuela.” American Economic Review 89 (3): 605–18.
Alvarez, Roberto, and Raymond Robertson. 2001. “Exposure to Foreign Markets and Firm-LevelInnovation: Evidence from Chile and Mexico.” Departments of Economics, University of Chile,Santiago, and Macalester College, St. Paul, MN.
Aw, Bee Yan, Sukkyun Chung, and Mark J. Roberts. 2000. “Productivity and Turnover in the ExportMarket: Micro-level Evidence from the Republic of Korea and Taiwan (China).” World Bank Eco-nomic Review 14 (1): 65–90.
Baldwin, Richard E., and Elena Seghezza. 1996. “Testing for Trade-Induced Investment-Led Growth.”Working Paper 5416, National Bureau of Economic Research, Cambridge, MA.
Baldwin, Richard, Henrick Braconier, and Rikard Forslid. 2000. “Multinationals, Endogenous Growthand Technological Spillovers: Theory and Evidence.” Discussion Paper 2155, Centre for Eco-nomic Policy Research, London.
Barro, Robert J. 1991. “Economic Growth in a Cross-Section of Countries.” Quarterly Journal ofEconomics 106 (2): 407–44.
Baumol, William J., Richard R. Nelson, and Edward N. Wolff, eds. 1994. The Convergence of Productivity,Its Significance and Its Varied Connotations. Oxford: Oxford University Press.
Bernard, Andrew B., and J. Bradford Jensen. 1999. “Exporting and Productivity.” Working Paper 7135,National Bureau of Economic Research, Cambridge, MA.
Blomström, Magnus, and Ari Kokko. 2001. “From Natural Resources to High-Tech Production: TheEvolution of Industrial Competitiveness in Sweden and Finland.” Stockholm School of Economics.
Blomström, Magnus, and Edward N. Wolff. 1994. “Multinational Corporations and ProductivityConvergence in Mexico.” In Convergence of Productivity: Cross-National Studies and HistoricalEvidence, ed. William J. Baumol, Richard R. Nelson, and Edward N. Wolff, 263–84. Oxford: OxfordUniversity Press.
Blundell, Richard, Rachel Griffith, and Frank Windmeijer. 2002. “Individual Effects and Dynamics inCount Data Models.” Journal of Econometrics 108 (1): 113–31.
Bosch, Mariano, Daniel Lederman, and William F. Maloney. 2003. “Patenting and Efficiency: A GlobalView.” Office of the Chief Economist for Latin America and the Caribbean Region, World Bank,Washington, DC.
Braconier, Henrik, Karolina Ekholm, and Karen Helene Midelfart Knarvik. 2000. “Does FDI Work as aChannel for R&D Spillovers? Evidence Based on Swedish Data.” Discussion Paper 2469, Centre forEconomic Policy Research, London.
Brunner, José Joaquín. 2001. “Chile: Report and Index on Technological Capacity.” School of Govern-ment, Universidad Adolfo Ibáñez, Santiago de Chile.
Calderón, César, Norman Loayza, and Luis Servén. 2002. “Greenfield FDI vs. Mergers and Acquisitions:Does the Distinction Matter?” Office of the Chief Economist for Latin America and the CaribbeanRegino, World Bank, Washington, DC.
Carkovic, Maria, and Ross Levine. 2002. “Does Foreign Direct Investment Accelerate EconomicGrowth?” Finance Department, University of Minnesota, Minneapolis, MN.
Casas, Rosalba, Rebeca de Gortari, and M. Josefa Santos. 2000. “The Building of Knowledge Spaces inMexico: A Regional Approach to Networking.” Research Policy 29 (2): 225–41.
334 Global Integration and Technology Transfer

Clerides, Sofronis K., Saul Lach, and James R. Tybout. 1998. “Is Learning by Exporting Important?Micro-Dynamic Evidence from Colombia, Mexico and Morocco.” Quarterly Journal of Economics113 (3): 903–47.
Coe, David T., Elhanan Helpman, and Alexander W. Hoffmaister. 1997. “North-South R&D Spillovers.”Economic Journal 107 (440): 134–49.
Cohen, Wesley M., and Daniel A. Levinthal. 1989. “Innovation and Learning: The Two Faces of R&D.”Economic Journal 99 (397): 569–96.
David, Paul A., Bronwyn H. Hall, and Andrew A. Toole. 2000.“Is Public R&D a Complement or Substitutefor Private R&D? A Review of the Econometric Evidence.” Research Policy 29 (4–5): 497–529.
de Ferranti, David, Daniel Lederman, William F. Maloney, and Guillermo E. Perry. 2002. “FromNatural Resources to the Knowledge Economy: Trade and Job Quality.” Latin American andCaribbean Studies Department, World Bank, Washington, DC.
de Ferranti, David, Guillermo E. Perry, Indermit Gill, J. Luis Guasch, William F. Maloney, CarolinaSanchez-Paramo, and Norbert Schady. 2003.“Closing the Gap in Education and Technology.” LatinAmerican and Caribbean Studies Department, World Bank, Washington, DC.
Delgado, Miguel, Jose Fariñas, and Sonia Ruamo. 2001. “Firm Productivity and Export Markets: ANon-Parametric Approach.” Journal of International Economics 57 (2): 397–422.
Dollar, David, and Edward N. Wolf. 1997. “Convergence of Industry Labor Productivity amongAdvanced Economies, 1963–1982.” In The Economics of Productivity, Vol. 2, ed. Edward N. Wolff,39–48. London: Elgar.
Eaton, Jonathan, and Samuel Kortum. 1996.“Trade in Ideas: Patenting and Productivity in the OECD.”Journal of International Economics 40 (3): 251–78.
Forbes, Naushad, and David Wield. 2000. “Managing R&D in Technology-Followers.” Research Policy29 (9): 1095–109.
Furman, Jeffrey L., Michael Porter, and Scott Stern. 2002. “The Determinants of National InnovativeCapacity.” Research Policy 31 (6): 899–933.
Goldfarb, Brent, Magnus Henrekson, and Nathan Rosenberg. 2001.“Demand-vs. Supply-Driven Inno-vations: U.S. and Swedish Experiences in Academic Entrepreneurship.” Working Paper in Economicsand Finance 0436, Stockholm School of Economics.
Griffith, Rachel, Stephen Redding, and John van Reenen. 2003. “R&D and Absorptive Capacity: FromTheory to Data.” Working Paper 01/03, Institute for Fiscal Studies, London.
Griliches, Zvi. 1988. “Productivity Puzzles and R&D: Another Nonexplanation.” Journal of EconomicPerspectives 2 (4): 9–21.
———. 1990. “Patent Statistics as Economic Indicators: A Survey.” Journal of Economic Literature 28(4): 1661–707.
———. 1992. “The Search for R&D Spillovers.” Scandinavian Journal of Economics 94 (S29): 29–47.———. 1994. “Productivity, R&D and the Data Constraint.” American Economic Review 84 (1):
1–23.Griliches, Zvi, and Frank Lichtenberg. 1984a. “Interindustry Technology Flows and Productivity
Growth: A Reexamination.” Review of Economics and Statistics 66 (2): 324–29.———. 1984b. “R&D and Productivity Growth at the Industry Level: Is There Still a Relationship?”
In R&D, Patents and Productivity, ed. Zvi Griliches, 465–502. Chicago: University of ChicagoPress.
Grossman, Gene M., and Elhanan Helpman.1991. Innovation and Growth in the Global Economy.Cambridge, MA: MIT Press.
Hall, Robert, and Charles I. Jones. 1999. “Why Do Some Countries Produce So Much More Output perWorker Than Others?” Quarterly Journal of Economics 114 (1): 83–116.
Hansen, Thomas Nokolaj, Natalia Agapitova, Lauritz Holm-Nielsen, and Ognjenka Goga Vukmirovic.2002. “The Evolution of Science and Technology: Latin America and the Caribbean in Compara-tive Perspective.” World Bank, Department of Human Development, Washington, DC.
Hanson, Mark. 2004. “Transnational Corporations, Knowledge Transfer, and National Development:The Case of Mexico.” Graduate School of Education, University of California, Riverside.
Innovation in Mexico: NAFTA Is Not Enough 335

Howitt, Peter, and David Mayer-Foulkes. 2002. “R&D, Implementation and Stagnation: A Schum-peterian Theory of Convergence Clubs.” Working Paper 9104, National Bureau of EconomicResearch, Cambridge, MA.
Irwin, Douglas A., and Peter J. Klenow. 1996. “High-Tech R&D Subsidies: Estimating the Effects ofSematech.” Journal of International Economics 40 (3/4): 323–44.
Jaffe, Adam B., and Josh Lerner. 2001. “Reinventing Public R&D: Patent Policy and the Commercial-ization of National Laboratory Technologies.” Rand Journal of Economics 32 (1): 167–98.
Jaffe, Adam B., and Manuel Trajtenberg. 2002. Patents, Citations and Innovations: A Window on theKnowledge Economy. Cambridge, MA: MIT Press.
Jiménez-Contreras, Evaristo, Félix de Moya Anegón, and Emilio Delgado López-Cózar. 2003. “TheEvolution of Research Activity in Spain: The Impact of the National Commission for the Evalua-tion of Research Activity (CNEAI).” Research Policy 32 (1): 123–42.
Jones, Charles I., and John C. Williams. 1998. Measuring the Social Return to R&D. Quarterly Journalof Economics 113 (4): 1119–35.
Keller, Wolfgang. 2001. “International Technology Diffusion.” Working Paper 8573, National Bureau ofEconomic Research, Cambridge, MA.
———. 2002. “Trade and the Transmission of Technology.” Working Paper 6113, National Bureau ofEconomic Research, Cambridge, MA.
Kinoshita, Yuko. 2000.“R&D and Technology Spillovers via FDI: Innovation and Absorptive Capacity.”Working Paper 349, William Davidson Institute, Ann Arbor, MI.
Lederman, Daniel, and William F. Maloney. 2003. “Trade Structure and Growth.” Office of the ChiefEconomist for Latin America and the Caribbean Region, World Bank, Washington, DC.
Lederman, Daniel, and Laura Sáenz. 2003. “Innovation around the World: A Cross-Country Data Baseof Innovation Indicators.” Office of the Chief Economist for Latin America and the CaribbeanRegion, World Bank, Washington, DC.
Lederman, Daniel, and Lixin Colin Xu. 2001. “Comparative Advantage and Trade Intensity: Are Tradi-tional Endowments Destiny?” Office of the Chief Economist for Latin America and the CaribbeanRegion, World Bank, Washington, DC.
Lederman, Daniel, William F. Maloney, and Luis Servén. 2005. Lessons from NAFTA for Latin Americaand the Caribbean. Palo Alto, CA: Stanford University Press.
———. 2003. “R&D and Development.” World Bank, Office of the Chief Economist for Latin Americaand the Caribbean Region, Washington, DC.
Levine, Ross, and David Renelt. 1992. “A Sensitivity Analysis of Cross-Country Growth Regressions.”American Economic Review 82 (4): 942–63.
Lipsey, Robert E. 2002. “Home and Host Country Effects of FDI.” Working Paper 9293, NationalBureau of Economic Research, Cambridge, MA.
Lloyd-Ellis, Huw, and Joanne Roberts. 2002. “Twin Engines of Growth: Skills and Technology as EqualPartners in Balanced Growth.” Journal of Economic Growth 7 (2): 87–115.
Loayza, Norman, Pablo Fajnzylber, and César Calderón. 2002. “Economic Growth in Latin Americaand the Caribbean: Stylized Facts, Explanations, and Forecasts.” Office of the Chief Econo-mist for Latin America and the Caribbean Region, Regional Studies Program, World Bank,Washington, DC.
López-Acevedo, Gladys. 2002. “Determinants of Technology Adoption in Mexico.” Latin American andthe Caribbean Regional Office, Poverty Reduction and Economic Management Sector Unit, WorldBank, Washington, DC.
López-Córdova, J. Ernesto. 2002. “NAFTA and Mexico’s Manufacturing Productivity: An EmpiricalInvestigation Using Micro-Level Data.” Paper presented at the meetings of the Latin American andCaribbean Economic Association, Madrid.
Maloney, William F. 2002.“Missed Opportunities: Innovation, Natural Resources, and Growth in LatinAmerica.” Economia 3 (1): 111–50.
———. 2005. “Patterns of Innovation.” Latin American and the Caribbean Regional Office, WorldBank, Washington, DC.
336 Global Integration and Technology Transfer

Maloney, William F., and Andrés Rodriguez-Clare. 2005.“Innovation Shortfalls.” Latin American and theCaribbean Regional Office, World Bank and Inter-American Development Bank, Washington, DC.
Martin, William, and Devashish Mitra. 2001. “Productivity Growth and Convergence in Agricultureand Manufacturing.” Economic Development and Cultural Change 49 (2): 403–22.
Maskus, Keith E. 2000. “Intellectual Property Rights in the Global Economy.” Institute for InternationalEconomics, Washington, DC.
Mayer, David. 2002. “Liberalization, Knowledge, and Technology: Lessons from Veterinary Pharmaceuticsand Poultry in Mexico.” Centro de Investigacion y Docencia Economicas, Mexico.
Meza González, Liliana, and Ana Belen Mora Yagüe. 2002. “Why Do Mexican Manufacturing FirmsInvest in R&D?” Department of Economics, Universidad Iberamericana, Mexico, D.F. Mexico andDepartment of Economics, Georgetown University, Washington, DC.
Muendler, Marcus. 2002. “Openness and Growth: A Study of Brazilian Manufacturers, 1986–1998.”Department of Economics, University of California, Berkeley.
Mullin, James. 2001. Science, Technology, and Innovation in Chile. International Development ResearchCentre, Ottawa.
Navaretti, Giorgio Barba, and David G. Tarr. 2000. “International Knowledge Flows and EconomicPerformance: A Review of the Evidence.” World Bank Economic Review 14 (1): 1–15.
Nelson, Richard R. 1993.“A Retrospective.” In National Innovation Systems: A Comparative Analysis, ed.Richard Nelson, 505–24. New York: Oxford University Press.
Nelson, Richard, and Nathan Rosenberg. 1993. “Technical Innovation and National Systems.” InNational Innovation Systems: A Comparative Analysis, ed. Richard Nelson, 3–22. New York: OxfordUniversity Press.
OECD (Organisation for Economic Co-operation and Development). 1999. Managing National Inno-vation Systems. Paris
———. 2001. Innovative Clusters: Drivers of National Innovation Systems. Paris.———. 2002. “And the Twain Shall Meet: The Cross-Market Effects of Product and Labour Market
Policies.” In OECD Employment Outlook 2002 (9): 257–315.Parente, Stephen L., and Edward C. Prescott. 2000. Barriers to Riches. Cambridge, MA: MIT Press.Park, Walter G. 2001. “Intellectual Property and Patent Regimes.” In Economic Freedom of the World,
2001 Annual Report, 101–20. Vancouver: Fraser Institute.Pastor, Robert A. 2002. “NAFTA Is Not Enough: Steps toward a North American Community.” In The
Future of North American Integration beyond NAFTA, ed. Peter Hakim and Robert E. Litan, 87–118.Washington, DC: Brookings Institution Press.
Patel, Pari, and Keith Pavitt. 1995. “Patterns of Technological Activity: Their Measurement and Inter-pretation.” In Handbook of the Economics of Innovation and Technological Change, ed. Paul Stoneman,14–51. Padstow, United Kingdom: T.J. Press Ltd.
Pavitt, Keith. 2001. “Public Policies to Support Basic Research: What Can the Rest of the World Learnfrom U.S. Theory and Practice? (And What They Should Not Learn).” Industrial and CorporateChange 10 (3): 761–79.
Rivera Vargas, María Isabel. 2002. Technology Transfer via University-Industry Relationship: The Case of theForeign High-Technology Electronics Industry in Mexico’s Silicon Valley. New York: Routledge-Falmer.
Rodriguez, Francisco, and Dani Rodrik. 2000.“Trade Policy and Economic Growth: A Skeptic’s Guide tothe Cross-National Evidence.” In NBER Macroeconomics Annual 2000. Cambridge, MA: MIT Press.
Romer, Paul. 1990. “Endogenous Technological Change.” Journal of Political Economy 98 (5): 71–102.Rosenberg, Nathan. 2000. “Why Do Firms Do Basic Research (with Their Own Money)?” Economics of
Science and Innovation 2: 197–206.Scherer, Fredric M. 1982. “Inter-Industry Technology Flows and Productivity Growth.” Review of Eco-
nomics and Statistics 64 (4): 627–34.Schiff, Maurice, and Yanling Wang. 2002.“Regional Integration and Technology Diffusion: The Case of
NAFTA.” Working Paper 3132, World Bank, Washington, DC.———. 2004. “Education, Governance and Trade-Related Technology Spillovers in Latin America.”
IZA Discussion Paper 1028, Institute for the Study of Labor, Bonn, Germany.
Innovation in Mexico: NAFTA Is Not Enough 337

Solow, Robert. 1956. “A Contribution to the Theory of Economic Growth. Quarterly Journal ofEconomics 70 (1): 65–94.
———. 1957. “Technical Change and the Aggregate Production Function.” Review of Economics andStatistics 39: 312–20.
Sveikauskas, Leo. 1981. “Technological Inputs and Multifactor Productivity Growth.” Review ofEconomics and Statistics 63 (2): 275–82.
Terleckyj, Nestor E. 1980. “Direct and Indirect Effects of Industrial Research and Development on theProductivity Growth of Industries.” In New Developments in Productivity Measurement and Analysis,ed. John W. Kendrick and Beatrice N. Vaccara, 359–77. Chicago: University of Chicago Press.
Trajtenberg, Manuel. 2001. “Innovation in Israel 1968–1997: A Comparative Analysis Using PatentData.” Research Policy 30 (3): 363–89.
Trefler, Daniel. 1998. “The Long and Short of the Canada-U.S. Free Trade Agreement.” CanadianInstitute for Advanced Research, University of Toronto and National Bureau of EconomicResearch, New York.
———. 1999a. “Does Canada Need a Productivity Budget?” Policy Options (July–August): 66–71.———. 1999b. “My Brains and Your Looks: Canada in an Innovative World (A Business Agenda with
Heart).” Paper presented at the Canadian Deputy Minister’s Retreat, Toronto, January 27.van Pottelsberghe de la Potterie, Bruno, and Frank Lichtenberg. 2001. “Does Foreign Direct Investment
Transfer Technology across Borders?” Review of Economics and Statistics 83 (3): 490–97.Wacziarg, Romain. 2001. “Measuring the Dynamic Gains from Trade.” World Bank Economic Review
15 (3): 393–429.World Bank. 2000. “Mexico Export Dynamics and Productivity Analysis of Mexican Manufacturing in
the 1990s.” Report 19864-ME, Private Sector Development Department, Washington, DC.World Economic Forum. 2002. “The Global Competitiveness Report 2001–2002.” Harvard University
Center for International Development. Geneva: World Economic Forum.Wright, Gavin. 1999. Can a Nation Learn? American Technology as a Network Phenomenon. NBER
Conference Report Series. Chicago: University of Chicago Press.Xu, Bin. 2000. “Multinational Enterprises, Technology Diffusion, and Host Country Productivity
Growth.” Journal of Development Economics 62 (2): 477–93.
338 Global Integration and Technology Transfer

Aabsorptive capacity
case studies and, 39implications of lags in, 60, 61knowledge content of machines and, 117R&D policies and, 16, 20, 21spillovers and, 19technology transfer and, 5, 8, 9, 15, 30,
37, 163acquisitions. See also entry mode and FDI
advantages over greenfields, 211productivity and, 7
advertising intensity related to entry mode,182–83, 191
Africa, 54Aghion, Phillipe, 307Aitken, Brian, 59, 60, 61, 62, 162, 165, 208, 211,
229, 242Asian countries, 38–41, 54. See also China
(Taiwan)automobile industry in Mexico, 57–58Aw, Bee-Yan, 242
Bbackward linkages. See also vertical
spilloverscountry example (see Lithuania)description of and relevant conditions,
210–12FDI spillovers and, 55, 58–59, 210–12focus on vertical spillovers, 56, 209–10maquiladora sector in Mexico and, 57, 58subsidy policies and, 62
Baldwin, Robert, 82, 310Bangladesh, 54Barba Navaretti, Giorgio, 113Bayh-Dole Act (1980, USA), 328Bernard, Andrew, 6, 73, 79, 80, 84, 140, 207Blomström, Magnus, 161, 164, 186, 187, 191,
193, 198, 209, 313, 326Brazil, 56, 326Bulgaria, 118, 285–301. See also competition
related to firm performance; machineryimports and TFP
Ccase studies of technology transfer
applicability of econometric analyses, 29–30,38–39
determinants of the usefulness of technologytransfers, 32–33
in export-oriented countries, 37–39in export-oriented economies, 39–42exports related to productivity, 42–44factors affecting technological ability devel-
opment, 33FDI’s impact on productivity, 44–45labor mobility, 46modeling issues, 46–47modes of technology transfer, 30–32plant-level studies in select countries (see
product quality and firm efficiency)problems attaining general econometric
analyses, 39–41TFP growth data and, 36–37, 42with trade restrictions, 33–37
339
Index

Center for Research and Advanced Studies(CINVESTAV), Mexico, 325
Center of Research and Technical Assistance(CIATEQ), Mexico, 325
Chile, 56, 326China (Taiwan)
case studies about, 45center for innovation, 326efficiency of knowledge generation, 319export study (see exports and economic
performance)IRCA index of innovation, 322, 323fratio of R&D to GDP, 315spending on innovation, 316
Clerides, Sofronis, 6, 44, 80, 242, 298, 312CNEAI (National Commission for the
Evaluation of Research Activity), 331CODELCO, Chile, 326Coe, David, 3, 4, 100, 102, 103, 105, 106, 107,
109, 110, 114, 115, 311Colombia knowledge diffusion analysis. See
product quality and firm efficiencycommercial policy. See trade policy and
technology transfercomparative advantage, 17, 37, 59, 318, 321,
322–24competition related to firm performance
domestic competition related to performance, 284–85
financial discipline and efficiency, 284hypothesis about competition and
productivity, 282–83import competition’s effect on
TFP, 283–84linkages and, 55–63mark-ups linked to import competition,
68–71privatization and economic reforms in
Bulgaria and, 285–301productivity and, 68–79, 221spillovers and, 210–11trade policy and, 9–12, 19
computable general equilibrium (CGE) modeling, 74–75
CONACYT, Mexico, 319Costa Rica, 58, 326cost functions, 76, 290Council of Mutual Economic Assistance
(CMEA), SU, 285credit and labor markets, 16, 319, 329–31Czech Republic
backward linkages evidence, 211
FDI effects on competition, 10, 11tspillovers and linkages study, 162–75
DDaewoo, 41, 54de Melo, Jaime, 74, 75, 283demonstration effects, 2, 6, 10, 53, 164developed countries
impact of openness on TFP, 4, 100–101machine imports and, 115
developing countriesbenefits from technology diffusion, 4, 5,
7, 9, 20case studies on, 30–31, 33, 35, 47channels of technology transfer in, 163,
164, 165failure to innovate, 305, 306, 311, 314FDI-related policies and, 14, 19, 21, 52, 55,
57, 208, 229knowledge diffusion analysis, 100, 105,
109–10machine impact on productivity (see
machinery imports and TFP)Djankov, Simeon, 161, 281
EEaton, Jonathan, 113, 119, 311economic growth, 162, 284, 308, 310.
See also competition related to firm performance; exports and economicperformance; imports and economic performance; productivity
economies of scale, 61, 115, 298, 318efficiency impacted by FDI. See competition
related to firm performanceEgypt, 118. See also machinery imports and TFPEMBRAER, Brazil, 322, 326employment. See also labor mobility
in Czech Republic study, 162, 165, 167, 174entry mode choice and, 182export performance and, 141–43linkages and, 51, 60productivity and, 216, 286, 292trade theories and, 73, 75, 82, 88
entry mode and FDIfactors affecting entry mode decision, 179–80intangible assets related to entry mode
choice, 182–83, 185, 196–201model assumptions and variables, 186ownership advantage theories, 181–82R&D intensity and spending related to,
183–87, 191, 192t, 198, 202
340 Index

R&D intensity by sector, 193, 194–96t,198, 202
state policies and, 187–89study methodology, 180–81, 187–91, 201–2
European Union, 3, 114, 118, 119, 294. See alsomachinery imports and TFP
exports and economic performancecharacteristics of exporting and nonexport-
ing firms, 141–45China study, 139–40, 155econometric studies about, 42–44exporters vs. nonexporters, 146–47export history consideration, 151–54learning due to exporting, 147–50technology accessed through, 5–6technology transfer and exports, 37–42
Ffactor inputs, 71, 79, 234Feenstra, Robert, 77, 292Finland, 319foreign direct investment (FDI)
Czech Republic productivity and,172–74, 211
deficiencies in case studies’ analyses of, 44–45
domestic productivity impacted by (see back-ward linkages)
innovation impacted by, 310–13joint ventures vs. wholly owned subsidiaries
(see entry mode and FDI)labor turnover and, 53–55linkages effected by (see linkages due to FDI)Lithuanian linkages study (see Lithuania)multinational firms’ impact on local
economies, 52–53procompetitive actions and, 9–11as a source of knowledge, 6–9, 31spillover research (see spillovers from FDI)technology diffusion facilitation through, 2technology transfer policies and, 14–16
Freund, Caronline, 161, 207
GGeneral Agreement on Tariffs and Trade
(GATT), 187Ghana, 37Görg, Holger, 6, 55, 207Greenaway, David, 110greenfield, 187, 211–12Griliches, Zvi, 100, 223Grossman, Gene, 256
HHanson, Gordon, 62, 327Harrigan, James, 67Harrison, Ann, 59, 60, 61, 62, 161, 162, 165,
208, 211, 229, 242, 283Hausmann, Ricardo, 17, 53Helpman, Elhanan, 3, 4, 81, 100, 102, 103, 105,
106, 107, 109, 110, 114, 256, 311Herfindahl index, 221, 232, 294Hitachi, 43Hoekman, Bernard, 1, 161, 281horizontal spillovers. See also linkages due to
FDI; vertical spilloversCzech Republic linkages study,
162–75, 211described, 7–9, 21export- vs. import-substitution FDI, 62industry productivity and, 61Lithuanian linkages study (see Lithuania)net benefit to host countries, 62plant-level studies findings, 60self-selection problem in studies, 59–60wage changes due to, 60
human capital, 3, 5, 9, 15, 16, 19, 115,165, 314, 324, 325, 326. See alsointellectual property rights; labormobility
Hungary, 118, 187. See also machinery importsand TFP
Hyundai, 41, 42
Iimport penetration, 69, 73, 75, 283–84, 295,
296, 298, 299, 301imports and economic performance
FDI’s impact on innovation, 311–12innovation in Mexico and, 311–12new equipment as technology transfer
impetus, 30–31pricing and competition and, 68–71technology accessed through, 4–5
import substitution, 51, 60, 62India, 33, 34, 315, 316Indonesia, 61infant industry, 13, 17innovation and economic growth
FDI’s impact on, 310–13intellectual property rights and, 2, 18–19,
308, 329labor mobility and, 329–30in Mexico (see Mexico and innovation)patents and, 18–19, 308–10, 319–21
Index 341

Innovative Revealed Comparative Advantage(IRCA), 322, 323f, 324
intangible assets, 52, 161, 179–82, 185, 186, 243.See also intellectual property rights
Intel, 58intellectual property rights, 2, 18–19, 308, 329.
See also patentsinter-firm technology transfer. See vertical spilloversintermediate goods sector, 14, 20, 55, 77, 80, 81,
89, 221, 311, 312Ireland, 55Israel, 118. See also machinery imports and TFP
JJavorcik, Beata Smarzynska, 1, 7, 8, 11f, 14, 52,
58, 179, 207Jensen, Bradford, 6, 80, 84, 140joint ventures, 2, 3, 8, 14, 31, 77, 162–63, 165,
166–69, 211, 244. See also entry modeand FDI
KKeller, Wolfgang, 5, 100, 101, 102, 105, 110, 114,
207, 208, 241, 311, 312Kenya, 37Kirshna, Pravin, 71, 207knowledge diffusion through trade
as a byproduct of market transactions, 31–32characteristics as an economic input, 99–100impact on quality and efficiency (see product
quality and firm efficiency)innovation’s impact on economic growth (see
Mexico and innovation)knowledge acquired due to FDI, 6–9, 31knowledge content of machines (see machin-
ery imports and TFP)knowledge viewed as a public good, 99–100learning due to exporting, 147–50limitations of current studies, 241–43mechanisms of trade-related diffusion, 100North-North trade analysis, 102–5North-South trade analysis, 106–9R&D intensity related to entry mode of FDI,
183–87through market transactions, 31trade-related technology and (see machinery
imports and TFP)transfer study in Czech Republic (see Czech
Republic)Korea. See Republic of KoreaKortum, Samuel, 119, 311Kraay, Aart, 139, 241
Llabor mobility
deficiencies in case studies’ analyses, 46innovation and, 329–30turnover and FDI, 53–55wage changes due to spillovers, 60
labor productivity, 41in Czech firms, 164, 167firm efficiency and, 284, 285firm growth and, 313firm performance and (see exports and eco-
nomic performance)Lach, Saul, 6, 44, 80, 140, 242, 298, 312Latin American countries, 33, 34
efficiency of knowledge generation, 319innovation in Mexico (see Mexico and
innovation)linkages due to FDI, 55–56ratio of R&D to GDP, 315
Latvia, 10, 11t, 211learning. See knowledge diffusion through tradeLederman, Daniel, 305Levinsohn, James, 71, 241, 247, 284, 291, 292liberalization. See trade policy and technology
transferlinkages due to FDI
automobile industry example, 57–58backward linkages evidence, 58–59, 211backward linkages in Lithuania (see
Lithuania)horizontal spillovers, 59–62intermediate goods sector and, 56plant-level data about, 55–56spillover channels, 53–59welfare improvements due to, 56–57
Lipsey, Robert, 60, 179, 191, 193, 198Lithuania
evidence related to horizontal and verticalspillovers, 229
FDI overview, 212–13, 214–15tfull vs. partial foreign ownership related to
linkages, 229–30, 231t
Mmachinery imports and TFP
choice of technology and, 124, 126timported vs. locally obtained, 30–31productivity case studies (see case studies
of technology transfer)technological complexity measurement,
119–20TFP change measurement, 130
342 Index
TFP determinants, 124, 125tunit value indexes trends, 120–21
Malaysia, 58Maloney, William F., 305maquiladora sector, Mexico, 8, 57market discipline and corporate efficiency.
See competition related to firmperformance
market share. See product quality and firm effi-ciency; trade theories
market transactions, 31–33. See also exportsand economic performance; importsand economic performance; linkagesdue to FDI
Markusen, James, 55, 77, 185Melitz, Marc, 73, 76, 79, 85, 241Mexico and innovation
credit and labor markets, 329–30firm-firm links, 324–25horizontal spillovers from FDI, 60knowledge diffusion analysis (see product
quality and firm efficiency)linkages due to FDI, 57national learning capacity and
importance to productivity growth,313–14
knowledge generation efficiency, 319–21market failures occurring, 317–19R&D and licensing and, 314–16spending on innovation and, 316–17structural change in trade and, 321–22,
323f, 324patents granted as a measure, 308–9, 310tpublic research centers, 325scientific publications as a measure,
309, 310tstate-owned enterprises, 326TFP growth rate as a measure, 306–8trade and FDI’s impact on TFP
exports and, 312–13imports of capital or intermediate goods,
311–12lack of strong causality between FDI and
growth, 313trade and investment variables and,
310–11universities and, 326–29
Moran, Theodore, 58, 61, 62Morocco
horizontal spillovers from FDI, 60knowledge diffusion analysis (see product
quality and firm efficiency)
NNAFTA, 305, 310, 311. See also Mexico and
innovationNational Commission for the Evaluation of
Research Activity (CNEAI), Spain, 331newly industrialized countries, 31, 317, 324nontariff barriers, 68, 74North-North trade, 4, 102–6North-South trade, 3, 4
knowledge diffusion due to, 106–10machines and technology diffusion and (see
machinery imports and TFP)Norway, 308
OOlarreaga, Marcelo, 99, 100, 101, 106, 107, 109,
114, 207Olley-Pakes method of estimation, 223–25,
226–27topenness to trade, 3, 4, 5, 9–10, 86. See also
knowledge diffusion through tradeOrganisation for Economic Cooperation and
Development (OECD), 17, 34, 100outsourcing, 243, 246ownership, foreign. See foreign direct
investment
PPack, Howard, 29patents, 18–19, 308–10, 319–21Pavcnik, Nina, 76, 79, 207PEDEVESA, Venezuela, 326PEMEX, Mexico, 319, 326plant-level studies in select countries. See
product quality and firm efficiencyPoland, 118, 187. See also machinery imports
and TFPpolicy, trade. See trade policy and technology
transferprice-cost markups, 13pricing and trade theories
conclusions and limitations, 70, 71mark-ups linked to import competition, 68–71theory explanation, 68
productivity, 5absorptive capacity as a determinant of, 29competition’s impact on firm efficiency (see
competition related to firm performance)efficiencies and quality impacted by technol-
ogy diffusion (see product quality andfirm efficiency)
exports related to, 42–44
Index 343

productivity (continued)FDI impact study, 44–45firm size and
share and productivity effects, 75–76size distributions and trade effects, 73–74theory explanation, 71–73trade-induced adjustments effects, 74–75
impact of FDI in Czech Republic (see CzechRepublic)
impact of imported-technology on (seemachinery imports and TFP)
intrafirm gainscommercial policy linkages to efficiency
gains, 76–77import discipline effects, 78–79product variety and productivity effects,
77–78trade and technology diffusion effects, 79–81
policy influences, 32–33product quality and firm efficiency
advantages to studying plant-level data, 243firm performance parameters, 252–53firm performance related to international
activity, 257–58, 260–65tindustrial evolution model, 244–46international activity determinants, 257–58,
272–77tmarginal costs related to international
activity, 254–56, 260–65tproduct quality related to international
activity, 253–54, 260–65tunit production cost and product attractive-
ness measurement, 246–51protectionism. See trade policy and technology
transfer
Qquality. See product quality and firm efficiencyquotas in Bulgaria, 17
RR&D (research and development)
innovation and (see Mexico and innovation)
knowledge and trade’s impact on, 102–10national learning capacity and, 306, 314–16North-North trade, 102–6North-South trade, 106–10R&D-intensive industries, 5, 110, 182, 196ratio to GDP in selected countries, 315related to entry mode and FDI, 183–87, 193,
194–96t, 198, 202
subsidies, general and sector-specific, 16–18technology transfer and, 44
regulatory policy. See trade policy and technol-ogy transfer
República Bolivariana de Venezuelacenter for innovation, 326horizontal spillovers from FDI, 60
Republic of Koreacase studies on technology transfer, 39–42efficiency of knowledge generation, 319intrafirm productivity gains studies, 77–78IRCA index of innovation, 322, 323fratio of R&D to GDP, 315
Roberts, Mark, 6, 74, 75, 80, 83, 84, 86, 241, 284,298, 314
Rodriguez-Clare, Andres, 17, 55, 56, 58, 316Rodrik, Dani, 17, 53, 54, 207
SSaggi, Kamal, 51Samsung, 42–43Schiff, Maurice, 99, 113self-selection of firms, 6, 52, 59, 60, 61, 140SEMATECH, US, 324SIMCAS, Mexico, 329Singer Sewing Machine Comp., 45Slaughter, Matthew, 61, 207, 208, 222Soloaga, Isidro, 113, 241Soviet Union, 187, 285spillovers from FDI
automobile industry example, 57–58backward linkages and, 58–59, 210–12competition related to firm performance
and, 210–11Czech Republic study, 172–74, 211demonstration effects, 53effectiveness as a technology transfer
channel, 163–65horizontal (see horizontal spillovers)intermediate goods sector and, 56labor turnover and, 53–55Lithuanian study (see Lithuania)plant-level data about linkages, 55–56study approach, 209–10technology transfer and (see machinery
imports and TFP)through backward linkages (see backward
linkages)vertical linkages, 55–59 (see also vertical
spillovers)welfare improvements due to
linkages, 56–57
344 Index

Srinivasan, T.N., 179start-up costs, 85, 151, 257state-owned enterprises, 142, 143, 146, 154, 287,
294, 301, 324sunk costs, 12, 70, 82, 83, 84, 86, 245supplier development program, 15
Ttariffs, 13–14. See also trade policy and
technology transferTarr, David, 113technology diffusion
channels for, 2countries studied, 3plant-level study of Morocco, Columbia, and
Mexico (see product quality and firmefficiency)
research results, 19–21through FDI (see foreign direct investment)through linkages (see linkages due to FDI)through trade (see trade and technology
diffusion)technology transfer
analysis of (see case studies of technologytransfer)
in export-oriented countries, 37–39in export-oriented economies, 39–42government policies and (see trade policy
and technology transfer)innovation and (see Mexico and innovation)intellectual property and, 18–19machine import’s impact on (see machinery
imports and TFP)modes of, 30–32patents and (see patents)R&D and, 44total factor productivity and, 32–33, 42
total factor productivity (TFP), 3analysis of knowledge contributions to (see
knowledge diffusion through trade)in Czech Republic (see Czech Republic)determinants of in manufacturing firms,
36–37, 42impact of openness on, 4in Lithuania (see Lithuania)machine import’s impact on (see machinery
imports and TFP)as a measure of innovation, 306 (see also
Mexico and innovation)productivity related to competition, 283–85technology transfer and, 32–33, 42, 163–65trade and investment variables and, 310–11
trade and technology diffusioncase studies in (see case studies of technology
transfer)cross-country experiences (see Colombia
knowledge diffusion analysis; Mexicoand innovation; Morocco)
procompetitive actions, 9–11role of trade (see trade theories)technology accessed through exports, 5–6technology accessed through imports, 4–5trade in goods and services and, 2
trade policy and technology transferasymmetric information and, 11–12domestic subsidy policies, 16–18externalities and, 12–13industrial responses to reforms, 82–85intellectual property rights and, 18–19knowledge viewed as a public good, 99–100market failures causes, 11–12market power and, 12policy-relevant research need, 21–22pricing behavior influenced by protection-
ism, 68–71productivity changes due to, 73–77R&D subsidies, general and sector-specific,
16–18subsidy policies and backward linkages, 62trade liberalization’s impact on firm compet-
itiveness (see competition related tofirm performance)
trade-related investment favoring technology,13–14
trade-related investment measures (TRIMs),13–14
trade-related technology spillovers study. Seemachinery imports and TFP
trade theoriesfirm size and productivity
market share and productivity effects, 75–76size distributions and trade effects, 73–74trade-induced adjustments effects, 74–75
during industrial evolution, 85–88industrial responses to policy reforms, 82–85intrafirm productivity gains
commercial policy linkages to efficiencygains, 76–77
import discipline effects, 78–79product variety and productivity effects,
77–78trade and technology diffusion effects,
79–81pricing due to policies, 68–71
Index 345

transportation costs, 45Trefler, Daniel, 76, 311, 313, 315TRIMs (trade-related investment measures),
13–14Turkey, 118. See also machinery imports
and TFPTybout, James, 5, 6, 9, 12, 44, 67, 72, 74, 75,
76, 78, 80, 83, 84, 86, 87, 88, 113,139, 140, 161, 207, 241, 242, 247,284, 298, 312
UUnión Nacional Avícola, 324United Kingdom, 61universities and innovation, Mexico, 326–29
Vvan Pottelsberghe de la Potterie, Bruno, 110Venables, Anthony, 55, 113, 283Venezuela. See República Bolivariana de Venezuelavertical spillovers. See also horizontal spillovers
described, 7–9, 21linkages and (see linkages due to FDI)Lithuanian linkages study (see Lithuania)
WWang, Yanling, 99Westphal, Larry, 242wholly owned subsidiaries, 14, 180, 189, 230World Bank, 3, 7, 81, 312World Investment Report, 55
346 Index


CENTRE FOR ECONOMICPOLICY RESEARCH ISBN 0-8213-6125-2
“The importance of acquiring and adapting advanced foreigntechnologies for employment opportunities and economic growth in developing countries can scarcely be overstated. For 10 years thetrade research group at the World Bank has undertaken outstandingand innovative empirical studies of the processes under whichtechnology transfer occurs and its impacts on local economies.
This volume brings together the fruits of this endeavor and offers awealth of perspectives and timely information on this central issue for development. It should find a home on the bookshelves of allinternational development economists and technology specialists.”
Keith E. MaskusStanford Calderwood Professor of Economics
University of Colorado at Boulder
“For developing countries, access to technologies innovatedelsewhere, and their adoption and adaptation, are more importantthan innovation. This volume explores the channels through whichexisting knowledge is transferred across countries, the magnitude ofsuch transfers, and their impact. Its meticulous empirical workstudiously avoids confusing association with causation.
This book is a ‘must read’ for scholars of development and policymakers in governments and multilateral institutions who deal withtrade, investment, and development.”
T.N. SrinivasanSamuel C. Park, Jr. Professor of Economics
Yale University