Global in scope and regionally rich: an IndiSeas workshop helps shape the future of marine ecosystem...
11
POINT-OF-VIEW Global in scope and regionally rich: an IndiSeas workshop helps shape the future of marine ecosystem indicators Yunne-Jai Shin • Alida Bundy • Lynne J. Shannon • Julia L. Blanchard • Ratana Chuenpagdee • Marta Coll • Ben Knight • Christopher Lynam • Gerjan Piet • Anthony J. Richardson • the IndiSeas Working Group Received: 29 December 2011 / Accepted: 6 January 2012 / Published online: 19 January 2012 Ó The Author(s) 2012. This article is published with open access at Springerlink.com Abstract This report summarizes the outcomes of an IndiSeas workshop aimed at using ecosystem indicators to evaluate the status of the world’s exploited marine ecosystems in support of an ecosys- tem approach to fisheries, and global policy drivers such as the 2020 targets of the Convention on Biological Diversity. Key issues covered relate to the selection and integration of multi-disciplinary indicators, including climate, biodiversity and human dimension indicators, and to the development of data- and model-based methods to test the performance of ecosystem indicators in providing support for fisheries management. To enhance the robustness of our cross- system comparison, unprecedented effort was put in gathering regional experts from developed and devel- oping countries, working together on multi-institu- tional survey datasets, and using the most up-to-date ecosystem models. Keywords Indicator Á Ecosystem approach to fisheries Á Ecosystem model Á Fisheries management Á Global comparison Please refer the ‘‘Appendix’’ section for the ‘‘IndiSeas Working Group’’ authors. Y.-J. Shin (&) Centre de Recherche Halieutique Me ´diterrane ´enne et Tropicale, UMR EME 212, IRD Institut de Recherche pour le De ´veloppement, Avenue Jean Monnet, BP 171, 34203 Se `te cedex, France e-mail: [email protected] Y.-J. Shin Á L. J. Shannon Ma-Re Institute and Department of Zoology, UCT University of Cape Town, Rondebosch 7701, Cape Town, South Africa A. Bundy Bedford Institute of Oceanography, Fisheries and Oceans Canada, PO Box 1006, Dartmouth, NS B2Y 4A2, Canada J. L. Blanchard Department of Animal and Plant Sciences, University of Sheffield, Alfred Denny Building, Western Bank, Sheffield S10 2TN, UK R. Chuenpagdee Department of Geography, Memorial University of Newfoundland, St. John’s, NL A1B 3X9, Canada M. Coll Institute of Marine Science ICM-CSIC, Passeig Maritim de la Barceloneta no. 37-49, 08003 Barcelona, Spain B. Knight Cawthron Institute, Coastal and Freshwater Resources, Private Bag 2, Nelson 7042, New Zealand C. Lynam Lowestoft Laboratory, CEFAS, Lowestoft NR33 0HT, UK 123 Rev Fish Biol Fisheries (2012) 22:835–845 DOI 10.1007/s11160-012-9252-z
Transcript of Global in scope and regionally rich: an IndiSeas workshop helps shape the future of marine ecosystem...
POINT-OF-VIEW
Global in scope and regionally rich: an IndiSeas workshophelps shape the future of marine ecosystem indicators
Yunne-Jai Shin • Alida Bundy • Lynne J. Shannon • Julia L. Blanchard •
Ratana Chuenpagdee • Marta Coll • Ben Knight • Christopher Lynam •
Gerjan Piet • Anthony J. Richardson • the IndiSeas Working Group
Received: 29 December 2011 / Accepted: 6 January 2012 / Published online: 19 January 2012
� The Author(s) 2012. This article is published with open access at Springerlink.com
Abstract This report summarizes the outcomes of
an IndiSeas workshop aimed at using ecosystem
indicators to evaluate the status of the world’s
exploited marine ecosystems in support of an ecosys-
tem approach to fisheries, and global policy drivers
such as the 2020 targets of the Convention on
Biological Diversity. Key issues covered relate to
the selection and integration of multi-disciplinary
indicators, including climate, biodiversity and human
dimension indicators, and to the development of data-
and model-based methods to test the performance of
ecosystem indicators in providing support for fisheries
management. To enhance the robustness of our cross-
system comparison, unprecedented effort was put in
gathering regional experts from developed and devel-
oping countries, working together on multi-institu-
tional survey datasets, and using the most up-to-date
ecosystem models.
Keywords Indicator � Ecosystem approach to
fisheries � Ecosystem model � Fisheries management �Global comparison
Please refer the ‘‘Appendix’’ section for the ‘‘IndiSeas Working
Group’’ authors.
Y.-J. Shin (&)
Centre de Recherche Halieutique Mediterraneenne et
Tropicale, UMR EME 212, IRD Institut de Recherche
pour le Developpement, Avenue Jean Monnet, BP 171,
34203 Sete cedex, France
e-mail: [email protected]
Y.-J. Shin � L. J. Shannon
Ma-Re Institute and Department of Zoology, UCT
University of Cape Town, Rondebosch 7701,
Cape Town, South Africa
A. Bundy
Bedford Institute of Oceanography, Fisheries and Oceans
Canada, PO Box 1006, Dartmouth, NS B2Y 4A2, Canada
J. L. Blanchard
Department of Animal and Plant Sciences, University
of Sheffield, Alfred Denny Building, Western Bank,
Sheffield S10 2TN, UK
R. Chuenpagdee
Department of Geography, Memorial University of
Newfoundland, St. John’s, NL A1B 3X9, Canada
M. Coll
Institute of Marine Science ICM-CSIC,
Passeig Maritim de la Barceloneta no. 37-49,
08003 Barcelona, Spain
B. Knight
Cawthron Institute, Coastal and Freshwater Resources,
Private Bag 2, Nelson 7042, New Zealand
C. Lynam
Lowestoft Laboratory, CEFAS, Lowestoft NR33 0HT,
UK
123
Rev Fish Biol Fisheries (2012) 22:835–845
DOI 10.1007/s11160-012-9252-z
Background
Growing global demand for fish increasingly alters
marine biodiversity and ecosystem structure, compro-
mising ecosystem services and human-well being
(Worm et al. 2006; Allison et al. 2009; Butchart
et al. 2010; Perry et al. 2011). Over the past two
decades, there has been significant progress towards
sustainable development of fisheries and integration of
effects of exploitation on the ecosystem, emphasizing
the need for implementing the ecosystem approach to
fisheries (EAF) worldwide (Garcia et al. 2003; Link
2011; Christensen and Maclean 2011). However,
despite the increasing number of frameworks and
multilateral agreements (e.g. 1999 Reykjavik Decla-
ration, 2002 World Summit on Sustainable Develop-
ment), practical implementation of an EAF is still in its
early stages and patchy. Progress on the EAF relies
heavily on the ability of scientists to provide and
communicate an assessment of past and current
ecosystem effects of fishing and an evaluation of the
effectiveness of management measures to promote
resource sustainability.
In response, IndiSeas was established in 2005 as an
international collaborative program under the auspices
of the EUROCEANS European Network of Excel-
lence and endorsed by IOC/UNESCO. IndiSeas per-
forms comparative analyses of ecosystem indicators
from many of the world’s marine ecosystems to
quantify the impact of fishing and to provide decision
support for fisheries management. A comparative
framework enables the selection of a robust suite of
indicators that are meaningful and measurable over
diverse and contrasting conditions. It provides the
basis for developing a range of reference values, under
different environmental, fishery, and human dimen-
sion conditions, against which ecosystems can be
assessed. Ultimately, it enables a broader ecosystem
perspective and allows generalizations to be drawn
about ecosystem response to multiple drivers.
The first phase of IndiSeas (IndiSeas I: 2005–2009)
culminated in the publication of nine papers (Shin
and Shannon 2010; Shin et al. 2010a) and a website
of comparative analyses (http://www.indiseas.org).
Nearly 80% of the 19 ecosystems assessed using a suite
of 8 ecological indicators were classified as deterio-
rating over the past several decades (Bundy et al.
2010). Results of IndiSeas I highlighted two major
challenges that form the basis of IndiSeas II: (1) the
need to consider multiple drivers including the human
dimension and climate forcing (Coll et al. 2010; Link
et al. 2010; Shannon et al. 2010) that interact with
ecological processes in complex ways; and (2) the need
to determine how indicators can be effectively used for
improving management and conservation. These
issues must be addressed urgently in light of policy
drivers such as the European Commission Marine
Strategy Framework Directive (MSFD) and the con-
vention on biological diversity (CBD) Aichi Targets
which call for effective ecosystem-based fisheries
management to be in place by 2020.
To address these two challenges, IndiSeas II
(2010–2013) is developing a combination of data-
driven and ecosystem modelling approaches to evaluate
the status of the world’s exploited marine ecosystems
subject to multiple drivers in support of EAF. By
contrast with other indicator initiatives aimed at a
global comparison, IndiSeas relies on research survey
data rather than commercial catch data. This has the
benefit of data being less biased and more robust, but
faces the challenge that these are national data,
generated and owned by institutions. However, IndiS-
eas has engaged partner countries from the developed
and developing world, their institutions and collabora-
tors in a collective effort to leverage their expertise of
individual systems (Fig. 1). IndiSeas thus strengthens
linkages between global and national indicator devel-
opment and reporting, in line with the CBD Nagoya
Strategic Plan for Biodiversity 2011–2020.
Here, we present outcomes of the second IndiSeas
II workshop held at UNESCO, Paris, from 15 to 18
November 2011, and attended by 41 participants from
34 research institutes. We summarize the main themes
and discussions, and highlight the way forward. We
conclude with how IndiSeas II will generate the
science that will support international stewardship
G. Piet
IMARES Institute for Marine Resources and Ecosystem
Studies, Wageningen University & Research Center,
PO Box 68, 1970 AB IJmuiden, The Netherlands
A. J. Richardson
Marine and Atmospheric Research, Ecosciences Precinct,
CSIRO, GPO Box 2583, Brisbane, QLD 4102, Australia
A. J. Richardson
Centre for Applications in Natural Resource Mathematics,
School of Mathematics and Physics, The University
of Queensland, St Lucia, QLD 4072, Australia
836 Rev Fish Biol Fisheries (2012) 22:835–845
123

efforts to manage our oceans, and how experts and
institutes can be a part of IndiSeas.
The workshop
During the workshop, four major questions were
explored:
1. Indicators. Which complementary indicators (cli-
mate, biodiversity, social and economic) should
be used to diagnose ecosystem status and to
inform fisheries decision-makers?
2. Method development. What methods are most
effective for analysis of a broad suite of multidis-
ciplinary indicators?
3. Performance testing. How well do indicators reflect
change in fishing pressure and provide support for
decision making for sustainable fisheries?
4. Synthesis. How best can the status of exploited
marine ecosystems be assessed under multiple
drivers and objectives?
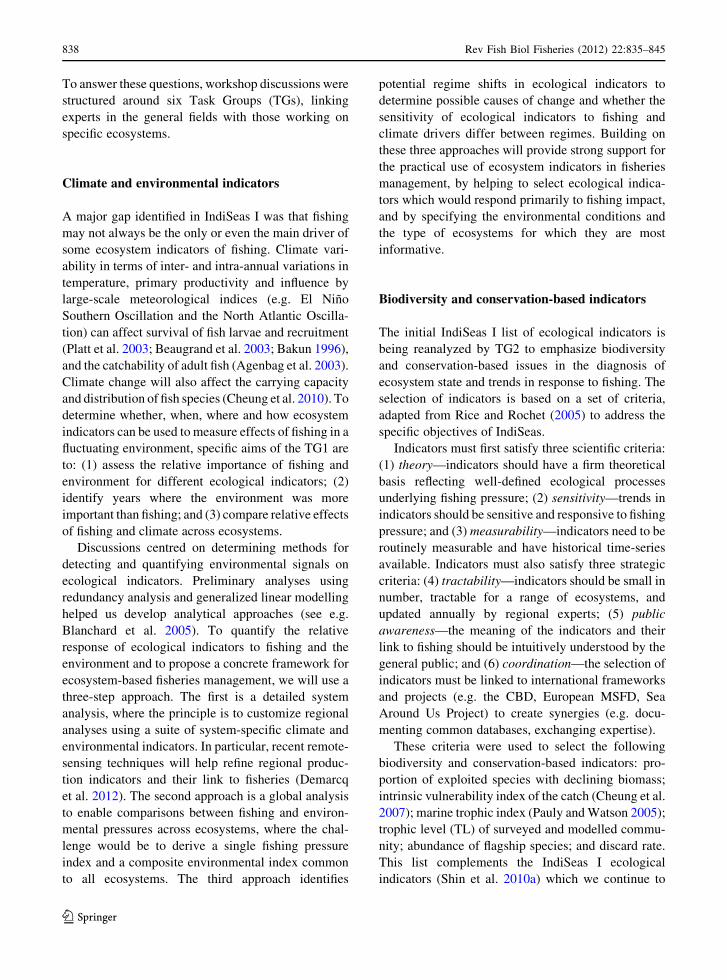
Fig. 1 Marine ecosystems considered by the IndiSeas program.
Blue, the marine ecosystem; yellow, the countries participating
in the analyses. Examples of time series of standardized
ecological indicators collated by the program. 1 total biomass
surveyed, 2 mean length of fish in the community, 3 proportion
of predatory fish, 4 mean lifespan, 5 intrinsic vulnerability index
of the catch, 6 trophic level of the landings, 7 Marine Trophic
Index, 8 trophic level of the surveys. Data source: EEC—
IFREMER, France; ESS— Maritimes Region, Fisheries and
Oceans Canada; SB—Department of Agriculture, Forestry and
Fisheries, South Africa
Rev Fish Biol Fisheries (2012) 22:835–845 837
123
To answer these questions, workshop discussions were
structured around six Task Groups (TGs), linking
experts in the general fields with those working on
specific ecosystems.
Climate and environmental indicators
A major gap identified in IndiSeas I was that fishing
may not always be the only or even the main driver of
some ecosystem indicators of fishing. Climate vari-
ability in terms of inter- and intra-annual variations in
temperature, primary productivity and influence by
large-scale meteorological indices (e.g. El Nino
Southern Oscillation and the North Atlantic Oscilla-
tion) can affect survival of fish larvae and recruitment
(Platt et al. 2003; Beaugrand et al. 2003; Bakun 1996),
and the catchability of adult fish (Agenbag et al. 2003).
Climate change will also affect the carrying capacity
and distribution of fish species (Cheung et al. 2010). To
determine whether, when, where and how ecosystem
indicators can be used to measure effects of fishing in a
fluctuating environment, specific aims of the TG1 are
to: (1) assess the relative importance of fishing and
environment for different ecological indicators; (2)
identify years where the environment was more
important than fishing; and (3) compare relative effects
of fishing and climate across ecosystems.
Discussions centred on determining methods for
detecting and quantifying environmental signals on
ecological indicators. Preliminary analyses using
redundancy analysis and generalized linear modelling
helped us develop analytical approaches (see e.g.
Blanchard et al. 2005). To quantify the relative
response of ecological indicators to fishing and the
environment and to propose a concrete framework for
ecosystem-based fisheries management, we will use a
three-step approach. The first is a detailed system
analysis, where the principle is to customize regional
analyses using a suite of system-specific climate and
environmental indicators. In particular, recent remote-
sensing techniques will help refine regional produc-
tion indicators and their link to fisheries (Demarcq
et al. 2012). The second approach is a global analysis
to enable comparisons between fishing and environ-
mental pressures across ecosystems, where the chal-
lenge would be to derive a single fishing pressure
index and a composite environmental index common
to all ecosystems. The third approach identifies
potential regime shifts in ecological indicators to
determine possible causes of change and whether the
sensitivity of ecological indicators to fishing and
climate drivers differ between regimes. Building on
these three approaches will provide strong support for
the practical use of ecosystem indicators in fisheries
management, by helping to select ecological indica-
tors which would respond primarily to fishing impact,
and by specifying the environmental conditions and
the type of ecosystems for which they are most
informative.
Biodiversity and conservation-based indicators
The initial IndiSeas I list of ecological indicators is
being reanalyzed by TG2 to emphasize biodiversity
and conservation-based issues in the diagnosis of
ecosystem state and trends in response to fishing. The
selection of indicators is based on a set of criteria,
adapted from Rice and Rochet (2005) to address the
specific objectives of IndiSeas.
Indicators must first satisfy three scientific criteria:
(1) theory—indicators should have a firm theoretical
basis reflecting well-defined ecological processes
underlying fishing pressure; (2) sensitivity—trends in
indicators should be sensitive and responsive to fishing
pressure; and (3) measurability—indicators need to be
routinely measurable and have historical time-series
available. Indicators must also satisfy three strategic
criteria: (4) tractability—indicators should be small in
number, tractable for a range of ecosystems, and
updated annually by regional experts; (5) public
awareness—the meaning of the indicators and their
link to fishing should be intuitively understood by the
general public; and (6) coordination—the selection of
indicators must be linked to international frameworks
and projects (e.g. the CBD, European MSFD, Sea
Around Us Project) to create synergies (e.g. docu-
menting common databases, exchanging expertise).
These criteria were used to select the following
biodiversity and conservation-based indicators: pro-
portion of exploited species with declining biomass;
intrinsic vulnerability index of the catch (Cheung et al.
2007); marine trophic index (Pauly and Watson 2005);
trophic level (TL) of surveyed and modelled commu-
nity; abundance of flagship species; and discard rate.
This list complements the IndiSeas I ecological
indicators (Shin et al. 2010a) which we continue to
838 Rev Fish Biol Fisheries (2012) 22:835–845
123
estimate: mean length of fish in the community; TL of
landings; proportion of under- and moderately
exploited stocks; proportion of predatory fish biomass;
mean lifespan; 1/CV of the total biomass surveyed;
and 1/(landings/biomass).
Consensus in the selection process was not always
easily reached. In particular, the group debated the
necessity to add a habitat indicator to be in line with
the European MSFD and other management frame-
works but agreed that the ‘‘area not impacted by
bottom trawling’’ indicator and other habitat indica-
tors were not sensitive enough to fishing over time and,
in addition, they could be capturing management
responses rather than reflecting biodiversity changes
due to fishing.
Once indicators have been calculated in all ecosys-
tems, the usefulness of the indicators for fisheries
management will be evaluated by testing systemati-
cally indicator sensitivity, level of redundancy, and
specificity to fishing pressure vs environmental forc-
ing. In particular we will focus on the widely used
TL-derived indicators to retain the most useful for
comparison of ecosystems’ status under multiple
drivers. Using a combination of survey and catch
data, and model output, we expect to make significant
progress on the recent debate concerning the appro-
priateness of indicators based on trophic level to track
fishing impact (Pauly et al. 1998; Pauly and Watson
2005; Branch et al. 2010).
Human dimension indicators
Although the human dimension is part of EAF (Ward
et al. 2002; FAO 2003; Garcia and Cochrane 2005), in
practice it has been a poor cousin to ecological and
biological considerations (Bundy et al. 2008). In many
respects the development of indicators of human
dimensions of exploited ecosystems is challenging due
to the breadth of the area, complexity, scale issues and
data availability. For example, we have much better
access to demographics of fish populations in many
ecosystems than we do to information about human
populations that exploit them. Further, unlike ecolog-
ical indicators, some indicators of the human dimen-
sion are not normative (i.e. there are no necessarily
‘‘good’’ or ‘‘bad’’ values), so they may simply describe
the human context of an exploited ecosystem (e.g.
value of fish export as a % of total export value) rather
than be used for scoring and ranking ecosystem
performance.
TG3 has developed a conceptual framework with
clear objectives and indicators to evaluate human
dimensions of governance, fisheries contributions to
society and human wellbeing of exploited ecosystems.
As an ultimate goal of the EAF is to achieve lasting
benefits for fisheries to society, we will evaluate the:
(1) effectiveness, efficiency and fairness of fisheries
management; (2) contribution of fisheries to the
broader society; and (3) wellbeing and resilience of
fishing communities.
We have selected a suite of indicators to evaluate
these goals. Indicators for the first goal are based on
data from an ecosystem expert survey designed to
assess the effectiveness of fisheries management. This
approach draws on the work of Pitcher et al. (2009),
but is enhanced by directly involving recognised
experts for each ecosystem. Outputs will be assess-
ment of how well a fishery is managed, and whether
ineffective management contributes to a diagnosis of
poor ecological health of a fishery.
For the second and third goals, due to data
availability challenges, we have used data available
at the macro level to estimate indicators, such as
‘‘total landed value of marine fisheries as a % of
GDP’’. Next steps include refining indicators on a
more local scale; evaluating the information from all
indicators using comparative multivariate analyses;
and comparing macro and local scale indicators so
we can evaluate whether local data change our
perception. Outputs will be the assessment of the
degree of economic and food dependency of fishing
communities and society on their fisheries, and
whether fishing communities are doing well and
have the capacity to cope with or adapt to negative
changes in the fishery. These results will be
integrated with the ecological status of ecosystems
to provide a holistic ecosystem evaluation.
Reference levels for indicators
Few reference levels for characterising unfished
situations, limits to be avoided, or optimal manage-
ment targets have been defined for ecosystem indica-
tors (Jennings and Dulvy 2005; Link 2005; Shin et al.
2010b). The objective of TG4 is to explore and
determine reference levels for ecosystem indicators so
Rev Fish Biol Fisheries (2012) 22:835–845 839
123
as to: (1) standardise indicators to compare the status
of exploited marine ecosystems; and (2) propose a
control rule framework for EAF. Although these two
applications are complementary, the fundamental
requirement for each type of reference level is
different. The first application of reference levels is
related to intrinsic ecosystem properties such as
productivity at pristine or any reference state. The
second use directly serves management purposes, with
reference levels acting as predetermined benchmarks
that when reached, should trigger particular manage-
ment actions (Hall and Mainprize 2004).
These objectives will be addressed using model-
ling and time series analyses. Using published
ecosystem models that have been fitted to time-series,
we will standardise indicators across ecosystems by
reconstructing the multispecies yield to fishing mor-
tality curve for each ecosystem. We will identify
multispecies maximal sustainable yield (MMSY—
Worm et al. 2009; Smith et al. 2011) and correspond-
ing reference values for ecosystem indicators under
current climate and fishing patterns. Then, the relative
difference of the current indicator value from its
reference level can be considered a measure of the
distance of the ecosystem from its potential-MMSY,
given current climate conditions and structure of the
fishing fleet. Indicators can thus be scaled relative to
their potential level and can be directly compared
across ecosystems. Outcomes from the modelling
approach could also be useful to management if a
range of MMSY values and corresponding ecosystem
indicators values could be derived by testing different
fishing strategies. It was noted that to make compar-
isons consistent, it was necessary to agree on how we
should define the ‘‘current period’’ for projecting
catch curves, and we decided that structural change
time-series analysis was appropriate here (Zeileis
et al. 2003; Andersen et al. 2008). The use of time
series analyses was also discussed as an alternative
approach for setting indicator reference levels. Where
there are significant regression relationships between
ecosystem indicators and fishing pressure indicators,
the intersection between the regression line and some
selected pressure reference levels (e.g. FMMSY, FPA
for a flagship species) can be used to provide
estimates of corresponding reference levels for eco-
system indicators. This approach requires long time-
series that span contrasting periods in the magnitude
of exploitation.
Performance of indicators and links
to management
The suite of indicators in IndiSeas I has been useful for
assessing trends and states over relatively short time
scales (10–20 years) and for cross-system compari-
sons (Shin et al. 2010b; Blanchard et al. 2010).
However, whether these indicators are sufficiently
robust to track changes resulting from specific pres-
sures and how they might be employed in management
are open questions.
Goals of TG5 are to advance understanding of how
ecosystem indicators can be used in management by:
(1) empirically testing how particular indicators might
signal deteriorations and thresholds in ecosystem state
through time, (2) developing decision rules that
account for different environmental conditions; and
(3) simulation-testing of the performance of a range of
indicator and decision rules. At the workshop, several
presentations described recent progress and future
ideas for addressing these aims.
Decision rules—or harvest control rules—are man-
agement decision systems that use indicators to signal
the status of a resource (e.g. spawning stock biomass
or catch per unit effort) and to specify what manage-
ment action is to be taken (e.g. change in fishing
mortality or total allowable catch) when deviations
from operational targets are observed. Decision rules
can be empirical and trend-based or rely on reference
levels and models (Rademeyer et al. 2007). Although
there are many different approaches for designing
decision rules, they are normally based on single-
species indicators in traditional fisheries management.
An empirical trend-based decision rule method called
the CUSUM method (Scandol 2003; Mesnil and
Petitgas 2009) was discussed as a potential way to
investigate whether using ecosystem indicators would
result in different retrospective signals and decisions
in comparison to single species indicators. The
development of environment-based decision rules
similar to the environmental harvest control rules
(eHCRs) developed for single-species by Brunel et al.
(2010) was deemed important as the productivity of
fish and whole ecosystems vary across different
environmental regimes, and hence appropriate refer-
ence levels and management targets should be condi-
tional on the environment.
Simulation modelling provides a means for testing
the performance of indicators in signalling change and
840 Rev Fish Biol Fisheries (2012) 22:835–845
123

supporting decision rules (Fulton et al. 2004). IndiSeas
indicators respond differentially to fishing pressure
(Blanchard et al. 2010), suggesting that some indica-
tors, if used to detect a change in status, could have a
higher incidence of triggering false alarms. The
application of a suite of ecosystem models in IndiSeas
II is seen as a valuable approach for exploring trade-
offs in conflicting management objectives across a
range of ecosystems, management scenarios, and
decision rules. This will help to assess how well
ecosystem indicators perform in management, in the
face of multiple sources of uncertainty and environ-
mental change.
Integration of indicators
To compare and evaluate ecosystem status for an EAF,
we must integrate information across multiple and
multi-disciplinary indicators. We reviewed existing
methods to combine multiple indicators, discussed
their pros and cons, and identified three categories of
approaches: (1) a scoring approach aggregating indi-
cators into a single composite indicator, (2) a multi-
dimensional approach, and (3) multi-criteria decision
analysis. The scoring approach is the most common
and relies on a simple combination of indicators such
as the sum, arithmetic mean, hierarchical mean,
weighted mean, median, product (Halpern et al.
2008; Allison et al. 2009; Alder et al. 2010; Butchart
et al. 2010; Ojaveer and Eero 2011; Coll et al. 2010).
Although the method is simple, it is sensitive to the
aggregation formula chosen (Allison et al. 2009;
Ojaveer and Eero 2011), indicator weights (Alder et al.
2010), and initial indicator selection. The second
approach encompasses multi-dimensional methods. In
their evaluation of the level of compliance of 53
countries with the UN Code of Conduct for Respon-
sible Fisheries, Pitcher et al. (2009) ranked nations’
performances using a non-parametric multidimen-
sional scaling of standardized indicators scores with
fixed anchors representing ‘‘good’’ and ‘‘bad’’ situa-
tions. Compared to the simple scoring approach, the
method is less sensitive to correlation between indi-
cators and seems robust to the definition of anchors,
but interpretation is less intuitive as information on
individual indicators in each ecosystem is lost. The
last approach is multicriteria decision analysis, which
has a wide application in fisheries for integration of
multiple indicators (Jarre et al. 2008). We particularly
discussed a type of multicriteria decision analysis
known as decision tree analysis, which has been used
in recent studies for categorizing the status of fisheries
and marine ecosystems (Rochet et al. 2005; Paterson
et al. 2007; Bundy et al. 2010). The method is
transparent and intuitive, but is sensitive to decision
rules. It raises a variety of general issues, from
definitions of ecosystem health and ecological and
human well-being to more specific issues about the
way decisions are computed (boolean rule-based or
fuzzy logic) and the hierarchical structure of the
decision tree.
We will produce three types of outputs to compare
exploited marine ecosystems, which will involve
increasing levels of complexity in the analyses and
interpretation of results: (1) general trends in ecosys-
tem effects of fishing; (2) the ranking of the relative
status of marine ecosystems; and (3) categorising or
diagnosing their exploitation status. To provide levels
of confidence and robustness of our results, systematic
sensitivity analyses will be conducted on the different
steps involved in the process of integrating indicators:
selection of indicators, standardisation, combination,
evaluation, and representation.
Priorities and future opportunities
The workshop has highlighted the way forward for the
IndiSeas program and more generally, the steps that
the scientific community as a whole need to take to
make EAF a reality:
1. Combining and integrating multi-disciplinary
indicators. These include indicators of climate,
ecological and human dimensions that represent
different facets of the EAF. Integration should be
quantitative to compare, classify and rank the
status of exploited marine ecosystems. It should
also be graphical so we can communicate eco-
system status to a broad spectrum of stakeholders
including managers, decision-makers and the
public.
2. Developing a synergy between model- and data-
based approaches. This will allow the testing of
the sensitivity and specificity of ecological indi-
cators to fishing versus climate, the perfor-
mance of indicators for decision support, and the
Rev Fish Biol Fisheries (2012) 22:835–845 841
123

identification of reference levels and tipping
points of ecosystems submitted to different driv-
ers. Owing to the expertise gathered in IndiSeas II,
we will use state-of-the-art ecosystem models
including EwE (Christensen and Walters 2004),
OSMOSE (Shin and Cury 2004; Travers et al.
2009), Atlantis (Fulton et al. 2004, 2011) and
simpler size-based and multispecies models
(Blanchard et al. 2009, 2011; Hartvig et al.
2011) as test laboratories. Some ecosystems of
IndiSeas II will also benefit from ongoing devel-
opment of ‘‘end-to-end modelling’’ (Travers et al.
2007; Rose et al. 2010; Shin et al. 2010c; Barange
et al. 2011), involving coupling ecosystem models
that focus on higher trophic levels with hydrody-
namic, biogeochemical and economic models.
This important step allows models to handle
explicitly multiple drivers, their impacts, and
expected feedbacks in marine ecosystems. It will
therefore enable ecosystem indicators to be tested
in a fully integrated way under various scenarios
of global change and fisheries management.
3. Using research survey data. Global comparisons
of states of marine exploited ecosystems have
previously relied almost exclusively on commer-
cial catch data. Catch data have advantages of
easy access through FAO and Sea Around Us
Project (http://www.seaaroundus.org) databases,
extensive geographical coverage, and existence of
long time series, but have biases associated with
sampling by commercial vessels. It is striking
that the CBD Strategic Plan for Biodiversity
2011–2020 only lists indicators based on com-
mercial catch data for monitoring marine eco-
system status (Strategic goal B, Target 6; Butchart
et al. 2010). Again, this reflects the lack of
accessibility to scientific observations. The
structure of IndiSeas II, based on a multi-institu-
tional effort to contribute datasets from scientific
surveys fills this gap.
4. Being global in scope and regionally rich. Our
aim is to be truly global in scope, with a rich and
extensive mix of ecosystems from tropical to
polar and from upwelling to oligotrophic. The full
participation of regional experts in every step of
the project will ensure robust and meaningful
global comparisons of marine ecosystems. This
long but rewarding process has meant that by the
end of 2011, IndiSeas II includes 35 marine
ecosystems and researchers from 32 countries and
44 research institutes. We have also put consid-
erable effort into the inclusion of scientists from
developing countries, women, and early career
researchers, leading to local capacity building for
effective national action towards EAF, coopera-
tion and technology transfer among institutes and
nations.
We continue to look for partners interested in our
approach and who have time series of survey data from
ecosystems not currently included in IndiSeas II. We
invite expressions of interest to join; please contact the
corresponding author. We believe that only through an
inclusive approach can we fill gaps in geographical
coverage, enhance the rigour of the comparative
approach, and ensure that our results are meaningful
and applicable.
Acknowledgments This workshop was funded by the
European collaborative project MEECE—Marine Ecosystem
Evolution in a Changing Environment—(FP7, contract no.
212085) and was hosted by IOC-UNESCO which has
incorporated IndiSeas for the biennium 2012–2013 as part of
its High Level Objective ‘Mitigation of the impacts and
adaptation to climate change and variability’, under the
activity ‘Increase the understanding of the impacts of climate
change and variability on marine ecosystems and their living
resources’. YJS was partly funded by the project EMIBIOS
(FRB, contract no. APP-SCEN-2010-II). We would like to
thank Jason Link, Edward Allison, Jake Rice, Larry Hutchings,
Steve Mackinson, Henn Ojaveer, Philippe Cury, Jennifer Boldt,
Ibrahima Diallo, Leigh Gurney, Didier Jouffre, Frida Lasram,
Jesus Morales, Djiga Thiao, Konstantinos Tsagarakis, Gro Van
der Meeren who contributed remotely to the group discussions.
We are very grateful to Pierre Lopez who drew the world map of
IndiSeas ecosystems.
Open Access This article is distributed under the terms of the
Creative Commons Attribution Noncommercial License which
permits any noncommercial use, distribution, and reproduction
in any medium, provided the original author(s) and source are
credited.
Appendix
Workshop attendees: D. Banaru, Universite de la
Mediterranee, COM, LMGEM, UMR CNRS 6117,
Marseille, France. M.F. Borges, IPIMAR, INRB,
Lisboa, Portugal. K.J. Brooks, KAL Analysis Pty &
ANU Research School of Social Sciences, Canberra,
Australia. P. Cauquil, IRD, UMR EME 212, Sete,
842 Rev Fish Biol Fisheries (2012) 22:835–845
123
France. H. Demarcq, IRD, UMR EME 212, Sete,
France. N. Dias, INIP, Maputo, Mozambique. C. Fu,
Fisheries and Oceans Canada, Pacific Biological
Station, Nanaimo BC, Canada. M.A. Gasalla, Uni-
versity of Sao Paulo, Instituto Oceanografico, FEL,
Sao Paulo, Brazil. T. Hattab, INAT, UR03AGRO1,
Tunis, Tunisia. J.J. Heymans, SAMS, Scottish Marine
Institute, Oban, Scotland. N. Hoepffner, JRC, IES,
Ispra, Italy. J. Houle, School of Biological Sciences,
Queen’s University, Belfast, UK. A. Jarre, UCT, Ma-
Re, Zoology Dpt, Cape Town, South Africa. S.I.
Large, NMFS-NFSC, Woods Hole, USA. H. Masski,
INRH, Casablanca, Morocco. J.O. Manyala, Chepkoi-
lel University College, Dpt of Fisheries and Aquatic
Sciences, Eldoret, Kenya. P.P. Matiku, TAFIRI, Dar
Es Salaam, Tanzania. H. Mendes, IPIMAR, INRB,
Lisboa, Portugal. G. Merino, PML, Plymouth, UK.
H. Onganda, KMFRI, Mombasa, Kenya. C. Piroddi,
JRC, IES, Rural Water and Ecosystem Resources
Unit, Ispra, Italy. H. Razafindrainibe, SAGE, Antan-
anarivo, Madagascar. K.J. Sainsbury, University of
Tasmania, Institute of Marine and Antarctic studies;
Hobart, Australia. J. Tam, IMARPE, Callao, Peru.
M. Thiaw, CRODT, ISRA, Dakar, Senegal. M. Tra-
vers, IFREMER, LRH, Boulogne-sur-Mer, France.
J.L. Valdes Santurio, IOC, UNESCO, Paris, France.
C.S. White, University of East Anglia, DEV, Nor-
wich, UK. D. Yemane, DAFF, Fisheries Branch, Cape
Town, South Africa.
References
Agenbag J, Richardson A, Demarcq H, Freon P, Weeks S,
Shillington F (2003) Estimating environmental preferences
of South African pelagic fish species using catch size-and
remote sensing data. Prog Oceanogr 59(2–3):275–300
Alder J, Cullis-Suzuki S, Karpouzi V, Kaschner K, Mondoux S,
Swartz W, Trujillo P, Watson R, Pauly D (2010) Aggregate
performance in managing marine ecosystems of 53 mari-
time countries. Mar Pol 34:468–476
Allison EH, Perry AL, Badjeck MC, Neil Adger W, Brown K,
Conway D, Halls AS, Pilling GM, Reynolds JD, Andrew NL
(2009) Vulnerability of national economies to the impacts of
climate change on fisheries. Fish Fish 10(2):173–196
Andersen T, Carstensen J, Harnandex-Garcia E, Duarte CM
(2008) Ecological thresholds and regime shifts: approaches
to identification. Trends Ecol Evol 24:49–57
Bakun A (1996) Patterns in the ocean: oceans processes and
marine population dynamics. California Sea Grant College
system, La Jolla, CA
Barange M, Allen I, Allison E, Badjeck MC, Blanchard JL,
Drakeford B, Dulvy NK, Harle J, Holmes R Holt J, Jen-
nings S, Lowe J, Merino G, Mullon C, Pilling G, Tompkins
E, Werner F (2011) Predicting the impacts and socio-
economic consequences of climate change on global
marine ecosystems and fisheries: The QUEST_Fish
Framework, In: Ommer RE, Perry RI, Cochrane K, Cury P
(eds) World fisheries: a social-ecological analysis, Wiley-
Blackwell, Oxford, pp 29–59. doi:10.1002/97814443
92241
Beaugrand G, Brander KM, Lindley JA, Souissi S, Reid PC
(2003) Plankton effect on cod recruitment in the North Sea.
Nature 426(6967):661–664
Blanchard JL, Dulvy NK, Jennings S, Ellis JR, Pinnegar JK,
Tidd A, Kell LT (2005) Do climate and fishing influence
size-based indicators of Celtic Sea fish community struc-
ture? ICES J Mar Sci 62(3):405–411
Blanchard JL, Jennings S, Law R, Castle MD, McCloghrie P,
Rochet MJ, Benoıt E (2009) How does abundance scale
with body size in coupled size-structured food webs?
J Anim Ecol 78:270–280
Blanchard JL, Coll M, Trenkel VM, Vergnon Rm, Yemane D,
Jouffre D, Link JS, Shin Y-J (2010) Trend analysis of
indicators: a comparison of recent changes in the status of
marine ecosystems around the world. ICES J Mar Sci
67(4):732–744
Blanchard JL, Law R, Castle MD, Jennings S (2011) Coupled
energy pathways and the resilience of size-structured food
webs. Theor Ecol 4(3):289–300
Branch TA, Watson R, Fulton EA, Jennings S, McGilliard CR,
Pablico GT, Ricard D, Tracey SR (2010) The trophic fin-
gerprint of marine fisheries. Nature 468(7322):431–435
Brunel T, Piet GJ, van Hal R, Rockmann C (2010) Performance
of harvest control rules in a variable environment. ICES J
Mar Sci 67(5):1051–1062
Bundy A, Chuenpagdee R, Jentoft S, Mahon R (2008) If science
is not the answer, what is? an alternative governance model
for reversing the dismal state of the world’s fisheries
resources. Front Ecol Environ 6(3):152–155
Bundy A, Shannon LJ, Rochet M-J, Neira S, Shin Y-J, Hill L,
Aydin K (2010) The good(ish), the bad and the ugly: a
tripartite classification of ecosystem trends. ICES J Mar Sci
67:745–768
Butchart SHM, Walpole M, Collen B, van Strien A, Scharle-
mann JPW, Almond REA, Baillie JEM, Bomhard B,
Brown C, Bruno J (2010) Global biodiversity: indicators of
recent declines. Science 328:1164
Cheung WL, Watson R, Morato T, Pitcher TJ, Pauly D (2007)
Intrinsic vulnerability in the global fish catch. Mar Ecol
Prog Ser 333:1–12
Cheung WWL, Lam VWY, Sarmiento JL, Kearney K, Watson
R, Zeller D, Pauly D (2010) Large scale redistribution of
maximum fisheries catch potential in the global ocean
under climate change. Glob Change Biol 16(1):24–35
Christensen V, Maclean J (2011) Ecosystem approaches to
fisheries: a global perspective. Cambridge University
Press, Cambridge
Christensen V, Walters C (2004) Ecopath with Ecosim: meth-
ods, capabilities and limitations. Ecol Model 72:109–139
Coll M, Shannon LJ, Yemane D, Link JS, Ojaveer H, Neira S,
Jouffre D, Labrosse P, Heymans JJ, Fulton ES, Shin Y-J
Rev Fish Biol Fisheries (2012) 22:835–845 843
123
(2010) Ranking the ecological relative status of exploited
marine ecosystems. ICES J Mar Sci 67:769–786
Demarcq H, Reygondeau G, Alvain S, Vantrepotte V (2012)
Monitoring marine phytoplankton seasonality from space
Remote Sensing of Environment 117:211–222
FAO (2003) Fisheries management. The ecosystem approach to
fisheries. FAO technical guidelines for responsible fisher-
ies, 4 (Suppl 2). Roma
Fulton EA, Fuller M, Smith ADM, Punt AE (2004) Ecological
indicators of the ecosystem effects of fishing: final report.
Australian Fisheries Management Authority Report, R99/
1546
Fulton EA, Link J, Kaplan IC, Johnson P, Savina-Rolland M,
Ainsworth C, Horne P, Gorton R, Gamble RJ, Smith T,
Smith D (2011) Lessons in modelling and management of
marine ecosystems: the Atlantis experience. Fish Fish
12:171–188
Garcia SM, Cochrane KL (2005) Ecosystem approach to fish-
eries: a review of implementation guidelines. ICES J Mar
Sci 62(3):311–318
Garcia SM, Zerbi A, Aliaume C, Do Chi T, Lasserre G (2003)
The ecosystem approach to fisheries Issues, terminology,
principles, institutional foundations, implementation and
outlook. FAO Fisheries Technical Paper No 443 Rome
Hall SJ, Mainprize B (2004) Towards ecosystem-based fisheries
management. Fish Fish 5:1–10
Halpern BS, Walbridge S, Selkoe KA, Kappel CV, Micheli F,
D’Agrosa C, Bruno JF, Casey KS, Ebert C, Fox HE, Fujita
R, Heinemann D, Lenihan HS, Madin EMP, Perry MT,
Selig ER, Spalding M, Steneck R, Watson R (2008) A
global map of human impact on marine ecosystems. Sci-
ence 319:948–952
Hartvig M, Andersen KH, Beyer JE (2011) Food web frame-
work for size-structured populations. J Theor Biol 272:
113–122
Jarre A, Paterson B, Moloney CL, Miller DGM, Field JG,
Starfield A (2008) Knowledge-based systems as decision
support tools in an ecosystem approach to fisheries: com-
paring a fuzzy logic and a rule-based approach. Prog
Oceanogr 79:390–400
Jennings S, Dulvy NK (2005) Reference points and reference
directions for size-based indicators of community struc-
ture. ICES J Mar Sci 62:397–404
Link JS (2005) Translating ecosystem indicators into decision
criteria. ICES J Mar Sci 62:569–576
LinkJ (2011) Ecosystem-based fisheries management: confronting
tradeoffs Cambridge University Press, Cambridge
Link JS, Yemane D, Shannon LJ, Coll M, Shin Y-J, Hill L,
Borges MF (2010) Relating marine ecosystem indicators to
fishing and environmental drivers: an elucidation of con-
trasting responses. ICES J Mar Sci 67:787–795
Mesnil B, Petitgas P (2009) Detection of changes in time-series
of indicators using CUSUM control charts. Aquat Living
Resour 22(2):187–192
Ojaveer H, Eero M (2011) Methodological challenges in
assessing the environmental status of a marine ecosystem:
case study of the baltic Sea. PloS ONE 6(4):1–10
Paterson B, Jarre A, Moloney CL, Fairweather TP, van der
Lingen CD, Shannon LJ, Field JG (2007) A fuzzy-logic
tool for multi-criteria decision making in fisheries: the case
of the South African pelagic fishery. Mar Freshw Res
58:1056–1068
Pauly D, Watson R (2005) Background and interpretation of the
‘Marine Trophic Index’ as a measure of biodiversity. Phi-
los T Roy Soc B 360:415
Pauly D, Christensen V, Dalsgaard J, Froese R, Torres F (1998)
Fishing down marine food webs. Science 279:860–863
Perry RI, Ommer RE, Barange M, Jentoft S, Neis B, Sumaila UR
(2011) Marine social–ecological responses to environ-
mental change and the impacts of globalization. Fish Fish
12:427–450
Pitcher T, Kalikoski D, Pramod G, Short K (2009) Not hon-
ouring the code. Nature 457:658–659
Platt T, Fuentes-Yaco C, Frank K (2003) Marine ecology: spring
algal bloom and larval fish survival. Nature 423(6938):
398–399
Rademeyer RA, Plaganyi EE, Butterworth DS (2007) Tips and
tricks in designing management procedures. ICES J Mar
Sci 64:618–625
Rice JC, Rochet M-J (2005) A framework for selecting a suite of
indicators for fisheries management. ICES J Mar Sci
62:516–527
Rochet M-J, Trenkel VM, Bellail R, Coppin F, Le Pape O, Mahe
J-C, Morin J et al (2005) Combining indicator trends to
assess ongoing changes in exploited fish communities:
diagnostic of communities off the coasts of France. ICES J
Mar Sci 62:1647–1664
Rose KA, Allen JI, Artioli Y, Barange M, Blackford J, Carlotti
F, Cropp R, Daewel U, Edwards K, Flynn K, Hill S, Hil-
leRisLambers R, Huse G, Mackinson S, Megrey B, Moll A,
Rivkin R, Salihoglu B, Schrum C, Shannon LJ, Shin Y-J,
Smith SL, Smith C, Solidoro C, St John M, Zhou M (2010)
End-to-end models for the analysis of marine ecosystems:
challenges, issues, and next steps. Mar Coast Fish Dyn
Manag Ecosyst Sci 2:115–130
Scandol JP (2003) Use of cumulative sum (CUSUM) control
charts of landed catch in the management of fisheries. Fish
Res 64(1):19–36
Shannon LJ, Coll M, Yemane D, Jouffre D, Neira S, Bertrand A,
Diaz E, Shin Y-J (2010) Comparing data-based indicators
across upwelling and comparable systems for communicat-
ing ecosystem states and trends. ICES J Mar Sci 67:807–832
Shin Y-J, Cury P (2004) Using an individual-based model of fish
assemblages to study the response of size spectra to
changes in fishing. Can J Fish Aquat Sci 61:414–431
Shin Y-J, Shannon LJ (2010) Using indicators for evaluating,
comparing and communicating the ecological status of
exploited marine ecosystems 1 The IndiSeas project. ICES
J Mar Sci 67:686–691
Shin Y-J, Shannon LJ, Bundy A, Coll M, Aydin K, Bez N,
Blanchard JL, Borges MF, Diallo I, Diaz E, Heymans JJ,
Hill L, Johannesen E, Jouffre D, Kifani S, Labrosse P, Link
JS, Mackinson S, Masski H, Mollmann C, Neira S, Ojaveer
H, Ould Mohammed Abdallahi K, Perry I, Thiao D, Ye-
mane D, Cury PM (2010a) Using indicators for evaluating,
comparing and communicating the ecological status of
exploited marine ecosystems Part 2: setting the scene.
ICES J Mar Sci 67:692–716
Shin Y-J, Bundy A, Shannon LJ, Simier M, Coll M, Fulton EA,
Link JS et al (2010b) Can simple be useful and reliable?
844 Rev Fish Biol Fisheries (2012) 22:835–845
123

using ecological indicators to represent and compare the
states of marine ecosystems. ICES J Mar Sci 67:717–731
Shin Y-J, Travers M, Maury O (2010c) Coupling models low
and high trophic levels models: towards a pathways-ori-
entated approach for end-to-end models. Prog Oceanogr
84:105–112
Smith ADM, Brown CJ, Bulman CM, Fulton EA, Johnson P,
Kaplan IC, Lozano-Montes H, Mackinson S, Marzloff M,
Shannon LJ, Shin Y-J, Tam J (2011) Impacts of low-tro-
phic level species on marine ecosystems. Science 333:
1147–1150
Travers M, Shin Y-J, Jennings S, Cury P (2007) Towards end-to-
end models for investigating trophic controls and large
changes induced by climate and fishing in marine ecosys-
tems. Prog Oceanogr 75:751–770
Travers M, Shin Y-J, Jennings S, Machu E, Huggett JA, Field J,
Cury P (2009) Two-way coupling versus one-way forcing
of plankton and fish models to predict ecosystem changes
in the Benguela. Ecol Mod 220:3089–3099
Ward T, Tarte D, Hegerl E, Short K (2002) Ecosystem-based
management of marine capture fisheries. World Wide Fund
for Nature, Australia, p 80
Worm B, Barbier EB, Beaumont N, Duffy JE, Folke C, Halpern
BS, Jackson JBC, Lotze HK, Micheli F, Palumbi SR, Sala
E, Selkoe KA, Stachowicz JJ, Watson R (2006) Impacts of
biodiversity loss on ocean ecosystem services. Science
314:787–790
Worm B, Hilborn R, Baum JK, Branch TA, Collie JS, Costello
C, Fogarty MJ, Fulton EA, Hutchings JA, Jennings S,
Jensen OP, Lotze HK, Mace PM, McClanahan TR, Minto
C, Palumbi SR, Parma AM, Ricard D, Rosenberg AA,
Watson R, Zeller D (2009) Rebuilding global fisheries.
Science 325:578–585
Zeileis A, Kleiber C, Kraemer W, Hornik K (2003) Testing and
dating of structural changes in practice. Comput Stat Data
Anal 44:109–123
Rev Fish Biol Fisheries (2012) 22:835–845 845
123